Differential phosphoproteomics for the study of olfactory ...
182
Differential Phosphoproteomics for the Study of Olfactory Receptor-mediated Signaling Processes Dissertation zur Erlangung des Grades eines Doktors der Naturwissenschaften der Fakultät für Biologie und Biotechnologie an der Internationalen Graduiertenschule Biowissenschaften der Ruhr-Universität Bochum angefertigt im Medizinischen Proteom-Center in der Arbeitsgruppe Cellular Proteomics vorgelegt von Heike Piechura aus Bochum Bochum Oktober 2010
-
Upload
khangminh22 -
Category
Documents
-
view
3 -
download
0
Transcript of Differential phosphoproteomics for the study of olfactory ...

Differential Phosphoproteomics for the
Study of Olfactory Receptor-mediated
Signaling Processes
Dissertation zur Erlangung des Grades
eines Doktors der Naturwissenschaften
der Fakultät für Biologie und Biotechnologie
an der Internationalen Graduiertenschule Biowissenschaften
der Ruhr-Universität Bochum
angefertigt im
Medizinischen Proteom-Center
in der Arbeitsgruppe
Cellular Proteomics
vorgelegt von
Heike Piechura
aus
Bochum
Bochum
Oktober 2010

Differentielle Phosphoproteomics zur Studie
von Geruchsrezeptor-vermittelten
Signalwegen
Dissertation zur Erlangung des Grades
eines Doktors der Naturwissenschaften
der Fakultät für Biologie und Biotechnologie
an der Internationalen Graduiertenschule Biowissenschaften
der Ruhr-Universität Bochum
angefertigt im
Medizinischen Proteom-Center
in der Arbeitsgruppe
Cellular Proteomics
vorgelegt von
Heike Piechura
aus
Bochum
Bochum
Oktober 2010

1. Gutachter: Prof. Dr. Bettina Warscheid
2. Gutachter: Prof. Dr. Dr. Dr. Hanns Hatt

Für mein Familie In liebevoller Erinnerung an Oma Lena, Oma Else und Opa Alfred

Danksagung
Promovieren kann man nicht alleine. Deshalb möchte ich mich ganz herzlich bedanken bei:
Meiner Doktormutter Prof. Dr. Warscheid
Für die Vergabe dieser interessanten und fordernden Doktorarbeit. Danke für die Möglichkeiten zu
lernen und mich weiter zu entwickeln, das mir entgegen gebrachte Vertrauen und die vielen
Freiheiten, die ich hatte. Besonders möchte ich mich bedanken für die sorgfältige Korrektur meiner
Arbeit, trotz der widrigen Umstände.
Meinem Zweitgutachter Prof. Dr. Dr. Dr. Hatt
Für die Begutachtung dieser Arbeit, fürs Zeit nehmen und Zuhören, sowie für die gute
Zusammenarbeit mit seinem Lehrstuhl.
Prof. Dr. Meyer
Für das MPC an sich und die exzellenten und einmaligen Arbeitsbedingungen dort.
Prof. Dr. Neuhaus
Für die gute Zusammenarbeit mit ihr und ihrer Arbeitsgruppe, für gute Ideen und genug Geduld, sich
auch noch die nächste Tabelle anzusehen.
Dr. Silke Oeljeklaus
Für die Korrektur dieser Arbeit, für die stets offenen Ohren, für etliche Edwards-Kaffees und noch
mehr Kilometer.
Dr. Katja Kuhlmann
Für die Zusammenarbeit beim Schreiben des Manuskripts, die Korrekturen dieser Arbeit und den
gemeinsamen Kampf mit der HCT.
Dr. Lian Gelis und Markus Osterloh
Für die Hilfe und fruchtbare Zusammenarbeit. Für die gelungenen Messungen, aufmunternde
Gespräche, Last-Minute Emails und produktive Mittagessen.
Christian Bunse
Für… wo soll ich anfangen? Für dein unerschöpfliches Wissen über alle am MPC befindlichen MS und
HPLCs, für deine Bereitschaft, dieses Wissen weiter zu geben und dich für die exzellente Performance
dieser Geräte einzusetzen und so exzellentes Arbeiten überhaupt zu ermöglichen. Vielen Dank für
tröstende Worte, lustige Briefe, Feierabendrätsel und die unzähligen Mittagspausen. Vielen Dank für
meinen ersten Spitznamen.
Nadine Stoepel, Magdalena Pawlas, Nadine Palacios und Jenny Dworschak – den Mädels
Für die Hilfe in Labor und Büro.Nadine und Magdalena, euch danke ich besonders für die Betreuung
der Orbitrap.
Besonders bedanken möchte ich mich bei euch für unsere Mädelsabende mit so vielen Stunden
quatschen, weinen, schimpfen, zuhören und vor allem lachen. Für die stetige Begleitung in allen
Lebenslagen, die mich dazu veranlasst hat, mich auf jeden einzelnen Arbeitstag zu freuen.

Heiner Falkenberg
Für die Wiederherstellung meines Glaubens an Studenten und dafür, dass ich mindestens genauso viel
von dir gelernt habe, wie du von mir.
Allen Mitgliedern der Bioinformatikgruppe des MPCs
Dafür, dass ihr durch euren unermüdlichen Einsatz an der CPU-Front meine Arbeit erst möglich
gemacht habt. Dafür, dass ich alles fragen konnte, auf alles eine Antwort bekommen habe und dass ihr
trotzdem immer wieder ans Telefon gegangen seid, wenn ich angerufen habe.
Speziell bedanken möchte ich mich bei Dr. Martin Eisenacher, Dr. Michael Kohl und Dr. Christian
Stephan für die viele Hilfe während all der Jahre und für die gute Zusammenarbeit.
Eva Hawranke, Anna Lendzian und Christiane Schary
Für viel Hilfe im Labor und eure Freundschaft. Vielen Dank für einfach unglaubliche Treks, von denen
ich noch meinen Kindern erzählen werde.
Allen anderen Mitgliedern der AG Cellular Proteomics und des ganzen MPCs
Für das unglaublich gute Arbeitsklima und die allgegenwärtige Hilfsbereitschaft
Dr. Andrea Blöchl
Für Erleuchtungen, Ideen und alles, was du mir beigebracht hast. Für dein andauerndes Interesse und
dass du nie aufgehört hast mich zu betreuen.
Nicht zuletzt möchte ich mich bei den Menschen bedanken, die mich immer und unerschütterlich in
allen Lebenslagen begleiten und tragen und die mich besonders in diesem Jahr viel unterstützt
haben. Ohne euch wäre das alles nicht möglich gewesen:
Mama und Papa, danke für die den Rückhalt, für Hilfe, wenn ich sie brauche und für die Kraft, die ihr
mir gebt, weil ihr an mich glaubt. Danke für ein zu Hause und eine Familie, ohne die ich nicht wäre,
was ich bin.
Tobias, Anja und Sabine, danke für unendlich viele schöne Erinnerungen. Danke für gemeinsames
Lachen und Weinen, für das voneinander Lernen und Wachsen, für gemeinsames Arbeiten und
ausgelassenes Feiern. Danke für eure Freundschaft und dass ihr immer für mich da seid.
Opa Walter, danke für alles was ich von dir gelernt habe. Schön dass du da bist.
Christiane und Daniel, danke für eure Freundschaft und Unterstützung und dass ihr nun dazu gehört.
Manfred, Anita, Ulla, Martin, Maya und Julian, vielen Dank für eure stetige Unterstützung, für die
aufmunternden Worte und ein neu entdecktes Universum sportlicher Möglichkeiten. Ich fühle mich
sehr wohl bei euch.
Sebastian, vielen Dank für dein Durchhaltevermögen und die viele Hilfe im Zusammenhang mit dieser
Arbeit. Vielen Dank für deine Fürsorge, deine Geduld und deine Liebe. Vielen Dank für die
Geborgenheit, die mir die Kraft gegeben hat durchzuhalten. Ich bin so froh, dass ich dich habe!

- Gutta cavat lapidem -
Ovid

1 Content
2 Summary.......................................................................................................................................... 1
3 Zusammenfassung ........................................................................................................................... 3
4 Objectives ........................................................................................................................................ 6
5 Introduction ..................................................................................................................................... 7
5.1 Olfaction .................................................................................................................................. 7
5.1.1 Odor perception .............................................................................................................. 7
5.1.2 Olfactory receptor protein mediated signaling ............................................................... 7
5.1.3 Plasticity in the olfactory epithelium............................................................................... 8
5.2 Prostate specific G-protein coupled receptor ......................................................................... 9
5.3 Prostate cancer ........................................................................................................................ 9
5.4 Proteomics ............................................................................................................................. 10
5.4.1 Principles of mass spectrometric protein identification ............................................... 10
5.4.2 Ion trap mass spectrometer .......................................................................................... 12
5.4.3 The LTQ-Orbitrap mass spectrometer ........................................................................... 14
5.5 Phosphoproteomics .............................................................................................................. 16
5.5.1 Gel-based phosphoproteomics ..................................................................................... 17
5.5.2 Gel-free phosphoproteomics ........................................................................................ 17
5.5.3 Alternative fragmentation techniques .......................................................................... 18
5.5.4 Bioinformatics ............................................................................................................... 19
5.5.5 Quantitative techniques ................................................................................................ 20
6 Materials and Methods ................................................................................................................. 23

6.1 Reagents and Consumables .................................................................................................. 23
6.2 Animal preparation ............................................................................................................... 26
6.3 Gel electrophoresis................................................................................................................ 26
6.4 Staining procedures ............................................................................................................... 28
6.5 Chromatography.................................................................................................................... 30
6.6 Mass spectrometry ................................................................................................................ 31
6.7 Cell culture ............................................................................................................................. 34
6.8 Cell migration assays ............................................................................................................. 34
6.9 Phosphoproteomics sample preparation .............................................................................. 35
6.10 Titanium dioxide affinity purification .................................................................................... 36
6.11 Bioinformatics ....................................................................................................................... 36
7 Results ........................................................................................................................................... 42
7.1 Pro-Q® Diamond Phosphoprotein Gel Stain .......................................................................... 42
7.2 Establishment of a gel free phosphoproteomics workflow .................................................. 49
7.2.1 Ortho-vanadate treatment of LNCaP cells .................................................................... 50
7.2.2 Cell lysis and tryptic digestion ....................................................................................... 50
7.2.3 Desalting and preparation for SCX ................................................................................ 51
7.2.4 SCX chromatography ..................................................................................................... 53
7.2.5 Titanium dioxide affinity enrichment ............................................................................ 55
7.2.6 Mass spectrometric analysis ......................................................................................... 56
7.2.7 Bioinformatics analysis .................................................................................................. 58
7.3 Global phosphoproteomic analysis of orthovanadate treated LNCaP cells .......................... 62

7.3.1 Strategy for the phosphoproteome analysis of LNCaP cells ......................................... 62
7.3.2 MS-based analysis of LNCaP cell lysates without phosphopeptide enrichment ........... 64
7.3.3 MS-based anaylsis of LNCaP cell with phosphopeptide enrichment ............................ 65
7.3.4 Comparison of mass spectrometric and bioinformatic analysis platforms ................... 67
7.4 Quantitative time-resolved phosphoproteomics to study receptor-mediated signaling
pathways in LNCaP cells .................................................................................................................... 70
7.4.1 SILAC labeling of LNCaP cells ......................................................................................... 70
7.4.2 Quantitative time-resolved phosphoproteomic strategy ............................................. 71
7.4.3 Phosphoproteome data of β-ionone-treated LNCaP cells ............................................ 74
8 Discussion ...................................................................................................................................... 85
8.1 Phosphoproteomics applied to the mouse olfactory epithelium ......................................... 85
8.2 Establishment of a global phosphoproteomics strategy to study olfactory receptor-
mediated signaling events in LNCaP cells.......................................................................................... 88
8.2.1 Establisment and refinement of the phosphoproteomics strategy .............................. 88
8.2.2 Global phosphoproteomics analysis of orthovanadate-treated LNCaP cells ................ 91
8.2.3 Concluding remarks ....................................................................................................... 95
8.3 Quantitative and time-resolved phosphoproteomic study of β-ionone-treated LNCaP cells
97
8.3.1 SILAC labeling ................................................................................................................ 97
8.3.2 Time resolved and quantitative β-ionone treatment experiment ................................ 98
8.3.3 Recapitulation of phospho-protein regulation in β-ionone-stimulated LNCaP cells .. 140
9 Conclusion ................................................................................................................................... 143
10 Outlook .................................................................................................................................... 145

11 Literature ................................................................................................................................. 147
12 Supplementary Tables ............................................................................................................. 167
13 Publications ............................................................................................................................. 168
Curriculum Vitae .................................................................................................................................. 169
Erklärung ............................................................................................................................................. 171

Summary
1
2 Summary
While the mechanisms of olfactory habituation have long been studied in the olfactory bulb and
higher brain region, less is known about the underlying mechanisms in the periphery, i.e. the
olfactory sensory neurons. To gain new insights into the molecular events leading to habituation, the
effects of long-term odorant treatment on the protein composition of the olfactory epithelium of
mice have recently been investigated employing a gel-based quantitative proteomics approach
(Barbour et al. 2008). In a continuative study, a differential phosphoproteomics analysis of dynamic
changes in the phosphorylation level of proteins present in the olfactory epithelium of mice following
receptor activation upon odorant binding was conducted in the first part of this work. Following the
strategy of Barbour et al., a gel-based method using 2-dimensional gel electrophoresis in
combination with phosphospecific fluorescent ProQ®Diamond (Pro-Q) staining and subsequent
protein identification by mass spectrometry was employed. Although this approach allowed the
detection of odorant-induced changes in the Pro-Q stained spot pattern, its applicability to a global
differential phosphoproteomics study of odorant treated murine OE was limited by an insufficient
ability to identifiy Pro-Q stained phosphoproteins and phosphosites by mass spectrometry.
In the second part of this work, olfactory receptor-mediated signaling was studied in non-olfactory
tissue using LNCaP cells as model system. LNCaP is a human prostate carcinoma cell line, which
endogenously expresses the prostate-specific G-Protein coupled receptor (PSGR), which is a member
of the olfactory receptor family that is specifically expressed in the prostate and that has been
implicated in prostate cancer development and progression. To study the phosphoproteome and, in
particular, dynamic changes in protein phosphorylation levels induced by PSGR activation in LNCaP
cells, an advanced phosphoproteomics strategy needed to be established to allow for the
comprehensive identification and accurate quantification of thousands of phosphopeptides in a
single experiment. For this purpose, a phosphoproteomics strategy was established and thoroughly
refined that comprised multidimensional separation and titanium dioxide-based phosphopeptide
enrichment as well as two different state-of-the-art LC/MS instrumentational setups (LTQ-
Orbitrap XL and HCT Ultra PTM) employing electron transfer dissociation (ETD) and multistage
activation (MSA) for phosphospecific fragmentation experiments in combination with refined
bioinformatic analyses.
This approach was first utilized for the global analysis of the phosphoproteome of orthovanadate-
treated LNCaP cells. This experiment was conducted in two biologically independent replicates using
as little as 200 µg of starting material per experiment. Following the workflow employing the HCT
Ultra ion trap mass spectrometer in combination with neutral loss-triggered ETD, 891 unique
phosphopeptides were identified. Using the LTQ-Orbitrap XL mass spectrometer in combination with

Summary
2
MSA, 1310 unique phosphopeptides were identified. These two approaches provided highly
complementary data sets, resulting in the identification of a total of 2569 unique phosphorylation
sites in 2095 phosphopeptides originating from 726 different phosphoproteins. Amongst these, 164
hitherto unknown phosphorylation sites were reported in this work for the first time. Several of the
newly identified phosphorylation sites stem from proteins, which are highly relevant in the context of
prostate cancer, including androgen receptor-related proteins, tumor proteins and kinases. These
proteins are novel candidate proteins for follow-up studies on prostate cancer which may eventually
lead to a better understanding of molecular processes involved in the development and proliferation
of prostate cancer.
In addition to the so far most comprehensive characterization of the phosphoproteome of LNCaP
cells, dynamic changes in protein phosphorylation induced by PSGR activation were studied using
quantitative phosphoproteomics methods. To this end, triple stable isotope labeling by amino acids
in cell culture (SILAC) was established for LNCaP cells and a differential, time-resolved
phosphoproteomics analysis of LNCaP cells treated with the known PSGR agonist β-ionone for 2 min
and 10 min was conducted. This study was performed in triplicate using 200 µg of starting material
per experiment and resulted in the identification of 1154 unique phosphopeptides. Of these, 99
phosphopeptides from 73 proteins were found to be differentially up- or downregulated upon
β-ionone treatment. Regulated phosphopeptides of low abundance were typically quantified in one
of three experiments only using the MaxQuant software. To improve the quantification for these
target peptides, an in-house developed Microsoft Excel-based VBA script was developed and
successfully employed in this work for the first time. As a result, higher accuracy in the determination
of regulation factors was obtained and a very high reproducibility of regulation factors between
replicates was demonstrated.
Based on proteins identified as being regulated upon β-ionone treatment, initial signaling events
after PSGR activation located at the plasma membrane were hypothesized. In addition, dynamic
phosphorylation was determined for several proteins, which are involved in the formation of
junctions and cell-cell contacts as well as in cytoskeletal dynamics, implicating a role for
PSGR-mediated signaling in migration. In a first migration assay, it was further demonstrated, that
β-ionone treatment efficiently inhibits serum-directed migration of LNCaP cells. Furthermore,
proteins involved in processes such as transcription, translation and cell cycle progression were
found to be differentially phosphorylated upon PSGR activation. These proteins may provide new
targets, which play an important role in mediating the previously reported antiproliferatory effects of
PSGR stimulation and are therefore of special interest in the context of prostate cancer and drug
development.

Zusammenfassung
3
3 Zusammenfassung
Während die Mechanismen der Geruchsgewöhnung auf der Ebene des Riechkolbens und höherer
Gehirnregionen bereits seit längerer Zeit untersucht werden, ist deutlich weniger über die zugrunde
liegenden Mechanismen in der Peripherie, dem olfaktorischen Epithel, bekannt. Um neue Einblicke in
die zur Geruchsgewöhnung führenden molekularen Ereignisse zu erhalten, wurde kürzlich unter
Anwendung einer Gel-basierten quantitativen proteomischen Strategie untersucht, welchen Einfluss
Langzeitbehandlungen mit einem Duftstoff auf die Proteinkomposition des olfaktorischen Epithels
haben (Barbour et al. 2008). In einer weiterführenden Studie wurde dann im ersten Teil der
vorliegenden Arbeit eine differentielle Phosphoproteomstudie durchgeführt, um dynamische
Veränderungen im Phosphorylierungslevel der Proteine im olfaktorischen Epithel nach
Duftstoffaktivierung des Rezeptors zu analysieren. In Anlehnung an die Studie von Barbour et al.
wurde ein Gel-basierter Ansatz gewählt, in dem zweidimensionale Gelelektrophorese mit
phosphospezifischer Fluoreszenzfärbung mit ProQ® (Pro-Q) Diamond kombiniert wurde. Mit diesem
Ansatz konnten Duftstoff-induzierte Veränderungen im Pro-Q gefärbten Proteinmuster detektiert
werden. Wie jedoch in dieser Arbeit gezeigt wurde, ist die limitierte Nachweisbarkeit von
Phosphorylierungstellen in Pro-Q gefärbten Proteinspots ein großer Nachteil für die Anwendbarkeit
dieser Methode auf eine globale Phosphoproteomstudie des OEs.
Im zweiten Teil dieser Arbeit wurde die Geruchsrezeptor vermittelte Signalweiterleitung in nicht
olfaktorischen Geweben studiert. Dafür wurde die LNCaP Zelllinie als Modelsystem verwendet. Diese
Zelllinie ist eine humane Prostatakarzinom-Zelllinie, die den Prostate-specific G-Protein coupled
Receptor (PSGR) endogen exprimiert. Dieser Rezeptor ist ein Mitglied der Familie der olfaktorischen
Rezeptoren und wird spezifisch in der Prostata und in Prostatakrebszellen exprimiert wird. Um das
Phosphoproteom und insbesondere die Duftstoff-induzierten dynamischen Veränderungen im
Protein-Phosphorylierungslevel in LNCaP Zellen zu analysieren, war es erforderlich, einen
leistungsfähigen phosphoproteomischen Ansatz zu etabieren, der eine umfassende Charakterisierung
und akkurate Quantifizierung von tausenden von Phosphopeptiden in einem einzigen Ansatz
ermöglicht. Zu diesem Zweck wurde ein Phosphoproteomansatz etabliert und optimiert, der
multidimensionale Peptidauftrennung und Titandioxid-basierte Phosphopeptidanreicherung mit
Messungen an „state-of-the-art“ LC/MS Systemen (LTQ-Orbitrap XL und HCT Ultra PTM) unter
Verwendung von Electron Transfer Dissociation (ETD) und Multistage Activation (MSA)
Fragmentierung und adäquater bioinformatischer Datenanalyse vereint.
Dieser Ansatz wurde zunächst für die globale Analyse des Phosphoproteoms von Orthovanadat-
behandelten LNCaP-Zellen verwendet. Dieses Experiment wurde in zwei unabhängigen biologischen
Replikaten durchgeführt, für die jeweils nur 200 µg Ausgangsmaterial verwendet wurde. Mittels der

Zusammenfassung
4
Messungen auf dem HCT Ultra Ionenfallenmassenspektrometer unter Anwendung der Neutralverlust
induzierten ETD Fragmentierung wurden 891 Phosphopeptide identifiziert. Unter Verwendung eines
LTQ-Orbitrap Massenspektrometers mit MSA Fragmentierung konnten insgesamt 1310
Phosphopeptide identifiziert werden. Diese beiden Datensätze waren hochgradig komplementär.
Insgesamt wurden 2095 nicht-redundante Phosphopeptide aus 726 verschiedenen
Phosphoproteinen identifiziert. In den identifizierten Phosphopeptiden konnten insgesamt 2569
einzelne Phosphorylierungsstellen identifiziert werden, von denen 164 bislang unbekannt waren, und
die in dieser Arbeit erstmalig nachgewiesen wurden. Einige der neu entdeckten
Phosphorylierungsstellen kommen in Proteinen vor, die im Kontext von Prostatakrebs von großem
Interesse sein könnten, wie z.B. Androgenrezeptor-assoziierte Proteine, Tumorproteine und sieben
Kinasen. Diese Proteine stellen neue Kandidatenproteine für weiterführende Studien an
Prostatakrebs dar, die im Folgenden zu einem besseren Verständnis der molekularen Prozesse führen
könnten, die zur Entstehung und Entwicklung von Prostatakrebs führen. Die Ergebnisse dieser Studie
stellen die bislang umfassenste Charakterisierung des Phosphoproteoms von LNCaP Zellen dar.
Für die Beobachtung von Geruchsstoff-induzierten dynamischen Veränderungen im
Phosphorylierungslevel von Proteinen wurde die Dreifachmarkierung mit Stable Isotope Labeling by
Amino Acids in Cell Culture für LNCaP-Zellen etabliert und eine zeitaufgelöste und quantitative
Phosphoproteomstudie an LNCaP-Zellen, die für jeweils 2 und 10 Minuten mit dem PSGR-Liganden β-
Jonon stimuliert wurden, durchgeführt. Diese Studie wurde in drei Replikaten unter Verwendung von
jeweils 200 µg Startmaterial durchgeführt und resultierte in der Identifizierung von insgesamt 1154
individuellen Phosphopeptiden. 99 dieser Phosphopeptide aus 73 verschiedenen Proteinen wurden
als differentiell durch β-Jonon Behandlung hoch- und runter-reguliert identifiziert. Niedrig abundante
Phosphopeptide wurden typischerweise in einem von drei Replikaten indentifiziert, wenn
ausschließlich MaxQuant als Auswertesoftware verwendet wurde. Um die Quantifizierung dieser
Peptide zu verbessern, wurde ein Microsoft Excel-basiertes VBA Skript entwickelt, das in dieser
Arbeit erfolgreich zum ersten Mal angewendet wurde. Durch die Verwendung dieses Skripts konnte
die akkurate Quantifizierung von Peptiden verbessert und eine hohe Reproduzierbarkeit für die
ermittelten Regulationsfaktoren gezeigt werden.
Auf Basis der differentiell phosphorylierten Proteine konnte eine Hypothese über die initialen
Signalereignisse an der Plasmamembran aufgestellt werden. Desweiteren wurden regulierte
Phosphorylierungsstellen in einer Reihe von Proteinen identifiziert, die mit der Ausbildung von
Junctions und Zell-Zell Kontakten sowie der dynamischen Regulierung des Zytoskeletts in Verbindung
gebracht werden, was auf einen Einfluss PSGR-vermittelter Signalwegen auf das Migrationsverhalten
der Zellen hinweist. In einem ersten Migrationstest konnte gezeigt werden, dass die Behandlung mit
β-Jonon die Migration von LNCaP-Zellen auf einen Serumstimulus hin verhindern kann. Darüber

Zusammenfassung
5
hinaus wurden Proteine als differentiell phosphoryliert gefunden, die mit Transkription, Translation
und Zell-Zykluskontrolle assoziiert werden. Diese Proteine könnten eine wichtige Rolle für die bereits
vorher beschriebene antiprolfieratorische Wirkung von β-Jonon-Stimulation des PSGR spielen und
stellen interessante neue Kandidatenproteine für weiterführende Studien dar, da diese
wachstumshemmende Wirkung gerade im Zusammenhang mit Prostatakrebs und der Entwicklung
von neuen Medikamenten von großer Bedeutung sein könnten.

Objectives
6
4 Objectives
The aim of this work is to study ligand-induced olfactory receptor- (OR-) mediated signaling cascades.
Olfactory receptors comprise the largest family of G-protein coupled receptors (GPCRs) encoded in
the mammalian genome. GPCRs of this family are expressed in olfactory sensory neurons in the
olfactory epithelium but also in other tissue such as skin, pancreas and prostate. As receptor-
triggered signaling is largely mediated by phosphorylation and dephosphorylation of signaling
proteins, dynamic changes in the phosphoproteome of OR-expressing tissue or cells upon receptor
activation should be investigated. For this purpose, adequate methodologies for quantitative and
time-resolved phosphoproteomics analyses need to be established.
For the analysis of olfactory epithelia of mice exposed to the odorant octanal, a gel-based approach
using 2-dimensional gel-electrophoresis in combination with a phosphospecific fluorescent dye is
implemented. The comparison between octanal treated and non-treated control samples is done
densitometric image analysis of the resulting spot patterns. Proteins from differentially stained
spots are subsequently identified using nano-HPLC in comination with tandem mass spectrometry
(MS) and subsequent database searches.
In further studies, signaling networks activated by the prostate specific G-protein coupled receptor
(PSGR) are investigated. This receptor is expressed in the prostate and has been implicated in
prostate cancer development and progression. The signaling events triggered by the activation of
PSGR are largely unknown to date. Ligands of this receptor, namely androstenone derivateves and
the odorant β-ionone, have recently been reported (Neuhaus et al. 2009), which renders the PSGR
and its signaling network amenable to concerted studies. Therefore, a gel-free phosphoproteomics
workflow is established and refined that include prefractionation by strong cation exchange
chromatography and titanium dioxide-based phosphopeptide enrichment in combination with
alternative phosphospecific MS methods regarding different mass spectrometric instruments and
subsequent bioinformatics analysis. Using this MS-based phosphoproteomics workflow, cells from a
prostate carcinoma cell line (LNCaP) treated with either ortho-vanadate or β-ionone for different
intervals are analyzed. In these analyses the global phosphoproteome of LNCaP cells is analyzed as
well as dynamic changes in protein phosphorylation levels upon PSGR activation. The results could
provide interesting new candidate proteins both in the context of prostate cancer development and
progression and for PSGR mediated signaling processes.

Introduction
7
5 Introduction
5.1 Olfaction
The mammalian olfactory system is able to detect and distinguish between an enormous variety of
volatile chemicals and plays an important role in the choice of food (Elsaesser and Paysan 2007) as
well as in detecting social cues (Spehr et al. 2006). For example, rats smell the state of health of
individuals of their species and avoid adults, when they are ill, but not juveniles (Arakawa et al.
2009).
5.1.1 Odor perception
Odor perception is mediated by two distinct systems located in the nasal cavity: the main olfactory
epithelium (OE) and the vomeronasal organ (VNO), where pheromones are detected (Keller et al.
2009). The initial event of odor sensation is the binding of odorant molecules to olfactory receptor
(OR) proteins, which are located in the membrane of cilia protruding from the olfactory knob at the
apical end of olfactory sensory neurons (OSN). Upon detection of an odorant, action potentials are
triggered, which are conducted along the axons of OSNs to the olfactory bulb (OB). OSNs expressing
the same olfactory receptor project to the same glomeruli in the OB and odors are recognized by the
specific pattern of activated glomeruli (Mombaerts et al. 1996; Firestein 2004).
5.1.2 Olfactory receptor protein mediated signaling
OR proteins are 7-transmembrane proteins, which have been identified by Buck and Axel (Buck and
Axel 1991) as a superfamily of G-protein coupled receptors (GPCRs), comprising about 1000
members in mice (Zhang et al. 2004) and about 400 members in human (Armbruster and Roth 2005).
Each OR type can bind a set of structurally related odorants, which can function as either agonists or
antagonists (Hatt 2004). The immediate effect of OR agonist binding is the activation of the Golf –
protein which in turn mediates the activation of adenylate cyclase III and the production of cyclic
adenosine monophosphate (cAMP). The increase in the intracellular cAMP level leads to the opening
of cyclic nucleotide-gated (CNG) channels and thus, to an influx of Ca2+ and Na+ ions. The entering
Ca2+ ions additionally open a chloride channel to allow efflux of Cl- ions. Thereby, the depolarization
is further increased eventually leading to the generation of an action potential, which is conducted
along the axon into the olfactory bulb (Firestein 2001; Hatt 2004). Besides these events responsible

Introduction
8
for the generation of an action potential, also other signaling events take place upon receptor
activation. For example, the accelerated intracellular cAMP level also activates the cAMP-dependent
protein kinase (PKA), which is then able to phosphorylate various proteins and especially voltage-
gated sodium and calcium channels, which may contribute to the adaptation process in odorant
perception (Wetzel et al. 2001). Furthermore, some odorants are known to induce phospholipase C
(PLC) and to mediate cellular response via the second messengers inositol triphosphate (IP3) and
diacylglycerol (DAG) rather than via cAMP (Zufall and Munger 2001). Blocking of the
phosphatidylinositol 3-kinase (PI3K) was shown to elevate odorant-induced increases in intracellular
calcium levels, thereby implicating a role of this pathway in the inhibition of odorant response (Spehr
et al. 2002).
5.1.3 Plasticity in the olfactory epithelium
The olfactory system has to detect dynamic changes in odorant cues in the individual’s environment.
Hence, to increase its sensitivity, the olfactory system has to filter for background odorants through
desensitation or even habitutation towards these continuously present odorants. On the one hand,
sensitivity of olfactory perception can be modulated at higher brain regions through the plasticity in
the OB and the olfactory cortex (Davis 2004; Wilson et al. 2004). On the other hand, adaptation can
be mediated on the level of olfactory sensory neurons (OSNs). While short-term adaptation has
already been studied extensively (Zufall and Leinders-Zufall 2000), long-term changes in the OE
induced by continuous odorant exposure are still poorly understood. To gain new insights into the
effects of long-term odorant exposure on the protein composition of the OE, Barbour et al.
performed a quantitative proteomics study of OE of mice treated with either continuous or pulsed
exposure to the odorant octanal for 20 days (Barbour et al. 2008). Mice exposed to the pulsed
treatment regime showed slight desensitization towards octanal, whereas contiuously treated mice
showed actual octanal habituation. The OE protein composition from differentially treated mice was
quantitatively compared using differential in-gel electrophoresis and regulated proteins were
subsequently identified using mass spectrometry (MS). Proteins determined as differentially
regulated were functionally classified in three groups: calcium-binding proteins, cytoskeletal proteins
and lipocalins (odorant-binding proteins, OBPs), with proteins from the lipocalin group being
regulated to the greatest extent. While the role of OBPs in the regulation of adaptation is still
unknown, a calcium-binding protein, namely calcium calmodulin, has recently been reported to
mediate sensory adaptation in the VNO (Spehr et al. 2009).

Introduction
9
5.2 Prostate specific G-protein coupled receptor
Several members of the OR family have been found to be expressed in other tissues than the OE
(Feldmesser et al. 2006; Zhang et al. 2007). However, their functions in these tissues are largely
unknown. One such receptor is the prostate specific G-protein coupled receptor (PSGR). It was first
described by Xu et al. (Xu, L. L. et al. 2000) as a member of the OR family and was found to be
specifically expressed in the prostate with elevated expression levels in prostate cancer. Its
expression levels were found to be especially increased in early prostate cancer stages, suggesting its
role in early prostate cancer development and progression (Weng et al. 2005b). Later on, the PSGR
was proposed as a biomarker for prostate cancer (Wang et al. 2006). While PSGR expression was
reported to be regulated by interleukin-6 via two different promoters (Weng et al. 2005a), its actual
function and the signaling events triggered by its activation are still largely unknown. Noteworthy,
the ligands of this receptor have recently been identified (Neuhaus et al. 2009). Neuhaus and
coworkers were able to demonstrate, that PSGR activation by androstenone derivatives mediates
rapid, non-genomic steroid actions in LNCaP cells, strengthening a potential role of PSGR in
cancerogenesis. Beyond that, the odorant β-ionone, having a characteristic odor of violet, was
identified as ligand. It is an isoprenoid, which is widely found in plants (Sacchettini and Poulter 1997).
Plant isoprenoids in general and specifically β-ionone and geraniol have been shown to inhibit cancer
cell growth (Elson et al. 1999; Duncan et al. 2004). Neuhaus et al. demonstrated that β-ionone
inhibits cancer cell proliferation via activation of the PSGR, suggesting that PSGR-triggered events
mediate the anti-tumorigenic effects of isoprenoids. In addition, activated PSGR was shown to lead
to enhanced phosphorylation of the mitogen-activated protein kinases p38 and stress-activated
protein kinase/c-Jun NH2-terminal kinase (Neuhaus et al. 2009). Nonetheless, the exact mechanisms
underlying these processes still remain elusive.
5.3 Prostate cancer
In developed countries, prostate cancer (PCa) is the second most frequently diagnosed cancer in
men, with an estimated 192,000 new cases and 27,000 deaths in Northern America in 2009 (Damber
and Aus 2008; Jemal et al. 2010). Although long-term survival rates are generally high, PCa remains a
lethal disease with poor treatment options when it has developed to a hormone-independent state
(Bonkhoff and Berges 2010; Ferlay et al. 2010).
Many signaling pathways have been found to be involved in prostate carcinogenesis. The most
prominent pathway is androgen receptor (AR) signaling, which is involved in development and

Introduction
10
progression of PCa cells from an early disease state to an hormone-independent and hitherto
incurable state. But also other pathways such as abnormal growth factor receptor signaling are
involved in the progression of normal to malignant prostate cells (Kung and Evans 2009; Ramsay and
Leung 2009; Traish and Morgentaler 2009; Bonkhoff and Berges 2010). These pathways are not linear
but interact with each other in the context of a network. In order to learn more about prostate
carcinogenesis, it is therefore essential to dissect the underlying signaling networks.
A widely used model system to study PCa is the LNCaP cell line. This cell line was established from a
metastatic lesion of human prostatic adenocarcinoma from the left supraclavicular lymph node from
a 50-year-old Caucasian male (Horoszewicz et al. 1980; Horoszewicz et al. 1983). The cell line is
androgene-sensitive (Horoszewicz et al. 1983), has relatively low tumorigenic potential (Witkowski et
al. 1993) and exhibits a low intrinsic migratory capacity, requiring a stimulus for migration (Slack et
al. 2001). Hence, it represents relatively early stages in prostate cancerogenesis. LNCaP cells, which
endogeneously express PSGR, were used by Neuhaus and coworkers to study PSGR-mediated effects
(Neuhaus et al. 2009).
5.4 Proteomics
As the sequencing of genomes proceeded from the first sequenced genome of the phage φ-X174
(Sanger et al. 1977) to the completion of the human genome (Science issue, 11th of April 2003 and
Nature issue, 24th of April 2003), the basis was provided for the study of the resulting proteomes.
From each gene, several different protein entities can be expressed through alternative splicing.
These proteins can further be modified by diverse post-translational modifications such as
phosphorylation, glycosylation or methylation. Which gene is translated, which protein is expressed
from a given gene and how the resulting protein is modified depends on several macroscopic and
molecular prerequisites such as age, tissue, cell type, environmental conditions or cell cycle state.
The composition of this highly dynamic universe of expressed protein species at a given time, under
specified conditions and in a specific organell, cell or tissue is termed proteome (Wilkins, Siena
meeting 1994). A powerful tool in proteomics is the identification of proteins by MS.
5.4.1 Principles of mass spectrometric protein identification
MS-based protein identification has become the method of choice to analyze complex biological
samples. The access to genome databases of various model organisms, significant improvements of

Introduction
11
"soft" ionization methods (Nobel Prize in chemistry 2002) and MS instrumentation for the efficient
analysis of biomolecules as well as dramatic advancement in computional technology during the last
decade nowadays allow the identification of thousands of proteins within a single study (Walther and
Mann 2010).
A standard proteomics workflow is depicted in Figure 1. Protein populations isolated from cells or
tissue (Figure 1A) are separated by one-dimensional gel electrophoresis and the resulting protein
bands are proteolytically digested, typically using trypsin as enzyme (Figure 1B). Another approach is
the direct in-solution digestion of the protein mixture with subsequent fractionation of the resulting
peptide mixture by chromatographic methods (Figure 1C). In both cases, gaseous peptide ions can
subsequently be formed from the liquid phase by electrospray (ES) for further MS analysis. ES
ionization (ESI) is often used in combination with high performance liquid chromatography (HPLC)
and fast tandem MS instrumentation (LC-MS/MS) (Figure 1D) in order to enable the efficient analysis
of complex samples (Aebersold and Mann 2003).
Fig. 1: General proteomics workflow. Proteins are extracted from any kind of biological samples derived from
tissue, animal or cell culture using adequate protocols (A). Complex protein mixtures are then separated by
one-dimensional gel electrophoresis (B) and respective protein bands are excised and proteolytically digested
to generate peptide samples. Alternatively, protein samples are directly digested in-solution (C) and the
resulting complex peptide mixtures are fractionized by chromatographic means (e.g. strong cation-exchange
chromatography) in the first dimension. Subsequently, peptide fractions are further separated by high
performance liquid chromatography directly coupled with electrospray tandem mass spectrometry.
During this process, peptides are separated by HPLC and continuously transferred to the ES source
followed by mass-to-charge (m/z) analysis in the high vacuum region of the MS instrument. In order
to perform peptide sequencing, the most intense precursor ions detected in the MS survey scan are
Introduction
12
sequentially isolated for further fragmentation (MS/MS) analysis. To induce fragmentation, analyte
ions are accelerated in an electric field and collide with inert gas molecules, typically helium or
nitrogen. The collisional energy is converted into internal vibration energy and distributed over the
molecule, thereby disrupting bonds and causing the peptide ion to fragment. Peptide ions are
fragmented predominantly at the amide bonds along the peptide backbone, giving rise to b- and y-
ion series (Roepstorff and Fohlman 1984). This process is called collision-induced dissociation (CID).
Peptide fragmentation spectra generated by CID can be subsequently compared to theoretical
fragmentation spectra by database searching in order to eventually identify the amino acid sequence
of the respective peptides in an automated process. Based on the identified peptide sequences,
proteins are assembled and a final list of all the proteins identified in the sample is compiled.
In the work presented here a three-dimensional (3-D) ion trap instrument (HCT Ultra PTM, Bruker
Daltonic) and the LTQ-Orbitrap XL (Thermo Scientific), a hybrid MS instrument comprised of a linear
ion trap and an orbitrap mass analyzer were employed. Both are state-of-the-art MS instruments for
proteomics analysis.
5.4.2 Ion trap mass spectrometer
The first quadrupole ion trap was developed by Wolfgang Paul in the 1950s (Paul and Steinwedel
1953). He later shared the 1989 Nobel Prize for Physics with the inventer of the Penning trap Hans
Georg Dehmelt. Quadrupole ion traps or Paul ion traps exist in both linear and 3-D configurations. In
such a trap, ions can be stored by the application of constant DC fields and AC electric fields
oscillating with radio frequency.
As schematically shown in Figure 2, a 3-D ion trap consists of a hyperbolic ring electrode and two
hyperbolic end cap electrodes. The application of DC and AC voltages create a 3-D quadrupole
electric field in which ions can be stored at the center between the three electrodes. According to
Mathieu´s equations, the stability of ions is dependent on their m/z-ratio (March 1997). Variations in
the AC frequency lead to mass selective instability (Stafford et al. 1984), enabeling the use of an ion
trap as mass analyzer.

Introduction
13
Fig. 2: Schematic scetch of a 3-D ion trap. A 3-D ion trap consists of a hyperbolic ring electrode and two
hyperbolic end cap electrodes. Analyte ions can enter the trap through one end cap and can be stored in the
center between the three electrodes by applying a quadrupole field. The stored ions can be sequentially
ejected through the second end cap electrode according to their mass-to-charge ratio (Figure provided by
Bruker Daltonics).
One of the MS instruments mainly used in this work, is the HCT Ultra PTM from Bruker Daltonik
(Bremen, Germany). The schematic composition of the ion trap instrument is shown in Figure 3.
Analytes are ionized at atmospheric pressure in the ES source. Gaseous ions are then transferred
through a heated glass capillary and via dual octopole ion optics into the 3-D trap. Here, ions are
stored and sequentially ejected. The ejected ions are subsequently detected by a detector comprised
of a conversion dynode and a secondary electron multiplier. Survey scans as well as fragmentation
experiments are performed in the ion trap with helium as damping and collision gas. In the HCT Ultra
PTM instrument, a chemical ionization source (nCI module) is implemented, providing the possibility
to additionally introduce other chemical ions to allow for alternative fragmentation experiments
within the ion trap.

Introduction
14
Fig. 3: Schematic composition of the HCT Ultra PTM MS instrument. The HCT Ultra PTM ion trap instrument is
equipped with an atmospheric pressure electrospray ion source and gaseous ions are subsequently transferred
into the high vacuum compartments of the mass spectrometer. To enhance desolvatization, a heated drying
gas flow is applied and a skimmer further ensures that only charged particles are transferred into the ion trap.
In the high vacuum region, analyte ions are focused and transferred by dual octopole optics to the ion trap, in
which both MS and MS/MS experiments are conducted. Ions sequentially ejected from the trap are then
detected and translated to intensity over m/z mass spectra (Figure provided by Bruker Daltonics).
5.4.3 The LTQ-Orbitrap mass spectrometer
The Orbitrap mass analyzer is in principal an optimized Kingdon ion trap (Kingdon 1923). It was first
published in the year 2000 (Makarov 2000) and introduced as the core component of a commercially
available mass spectrometer in 2005 (Hu et al. 2005). Since then, these mass spectrometers have
been combined with diverse liquid chromatographic systems (Makarov and Scigelova 2010). As
depicted in Figure 4, an Orbitrap consists of an outer barrel-shaped electrode and an inner spindle-
shaped electrode. Ions injected into the Orbitrap oscillate in ring-like orbits around the center rod
and simultaneously move in axial direction up and down the center rod in harmonic oscillations.
While the frequency of the oscillation around the inner electrode is independent of the respective
m/z-value, the frequency of the axial oscillation depends on the m/z-ratio of the respective ions and
can be monitored at the outer electrodes of the Orbitrap. This so called image current is amplified
and transformed to a mass spectrum by fast Fourier transformation.

Introduction
15
Fig. 4: Cutaway of the Orbitrap mass analyzer. Ions are injected into the Orbitrap with a velocity perpendicular
to the axis of the center electrode and start to oscillate in the static electric field in rings around and along the
axis of the center electrode (Figure from www.thermo.com, modified).
The LTQ-Orbitrap XL instrument is a hybrid instrument combining a linar ion trap (LIT) and an
Orbitrap mass analyzer. The schematic construction of the LTQ-Orbitrap XL is depicted in Fig. 5.
Gaseous ions are generated in an atmospheric pressure ion source via electrospray and transferred
to the LIT via several desolvatization steps and ion optics. In the LIT, ions can be stored and either
transferred further via the C-trap to the Orbitrap analyzer or directly scanned out and detected with
the two detectors. Fragmenation experiments are typically performed in the LIT and the resulting
fragment ions can likewise be sequentially scanned out and detected via the two LIT detectors or can
be transferred to the Orbitrap analyzer for high resolution mass analyses. Alternatively, ions can be
fragmented by Higher Energy Collision (HCD) in an octopole termed HCD cell. Fragment ions resulting
from HCD, can solely be detected in the Orbitrap analyzer.
Ion detection in the LIT section is fast but provides limited resolution of about 2,000. The resolution
of the Orbitrap depends on the time taken to record the image current. Although a resolution of up
to 150,000 is theoretically possible, the resolution is usually set between 30,000 and 60,000 to keep
duty cycle times short. However, since the LIT and the Orbitrap analyzer can be used independently,
MS/MS experiments are typically conducted in the LIT while high resolution survey scans of
precursor ions are conducted in the Orbitrap. Thereby no actual delay is caused through high
resolution scans.

Introduction
16
Fig. 5: Schematic overview of the LTQ-Orbitrap XL mass spectrometer. Analytes are ionized at atmospheric
pressure (AP) and subsequently transferred into the high vacuum region of the instrument via a heated
capillary and ion optics. Ions are accumulated in the linear ion trap (LIT) and can either be transferred into the
Orbitrap mass analyzer via the C-trap or detected directly in the LIT. Fragmentation is accomplished in the LIT
and resulting fragment ions can be detected in the LIT or in the Orbitrap analyzer. In addition, fragmentation
can be conducted in the higher energy collision dissociation (HCD) cell. Fragments generated in the HCD cell
have to be detected in the Orbitrap mass analyzer (Figure from www.thermo.com, modified).
5.5 Phosphoproteomics
The function of proteins can be dynamically regulated by post-translational modifications (PTMs).
One of the most comprehensively studied PTM is protein phosphorlyation. Specific protein function
alterations as well as signal transduction are mainly mediated by phosphorylation and
dephosphorylation events via specific kinases and phosphatases. It is therefore crucial not only to
study changes in protein abundance, which typically occur on a longer time scale, but also to reveal
immediately triggered changes in the phosphorylation status of proteins to understand complex
biological signaling processes such as receptor activation and its effects on disease progression. Due
to their low abundance, substoichiometric presence and poor detectability in mass spectrometric
measurements, phosphorylated proteins have been notoriously difficult to analyze in global
approaches. In recent years, the proteomic techniques to characterize the phosphorylation status
and, beyond that, the dynamic changes in protein phosphorylation in a given system have improved
significantly (Grimsrud et al. 2010). Currently, there are two major approaches to
phosphoproteomics, namely gel-based and gel-free methods.
Ion Optics HCD Cell C-Trap Linear Ion Trap AP Ion Source
Orbitrap

Introduction
17
5.5.1 Gel-based phosphoproteomics
One recent approach to study dynamic changes in protein phosphorylation is the combination of gel
electorphoresis with a phosphospecific fluorescence dye. Thereby staining patterns can be compared
between different samples to detect differentially phosphorylated proteins. Proteins from
differentially stained spots are then subsequently identified using mass spectrometry. In most cases,
2-D gel electrophoresis is employed to provide maximal protein resolution and the only phospho
specific dye, which is commercially available at the moment, is the Pro-Q® Diamond (Pro-Q) stain.
This combination of 2-D PAGE and Pro-Q staining has successfully been employed in diverse
phosphoproteomics studies using plants (Agrawal and Thelen 2006; Chitteti and Peng 2007),
microorganisms (Dimina et al. 2009), mammalian cells and tissue (Gannon et al. 2008), bodyfluids
(You et al. 2010) and for kinase target screens (Orsatti et al. 2009). A main advantage of this and any
2-D gel-based technique is that protein isoforms and in particular different protein phosphorylation
isoforms are separated in the gel and thus, can be quantified independently. Nevertheless, gel-based
techniques are increasingly replaced by gel-free methods in large-scale studies, as only about 1,000
of the most abundant proteins are routinely visualized on a 2-D gel and potentially interesting
candidate (phospho)proteins are often of low abundance and thus, often evade detection (Rabilloud
et al. 2010).
5.5.2 Gel-free phosphoproteomics
Major challenges of the analysis of phosphorylated proteins from very complex mixtures stem from
the fact that often proteins become phosphorylated which are already present at low concentration
and in addition, protein phosphorylation typically occurs at substoichiometric level. Hence, the
concentration of non-phosphorylated proteins typically exceeds by far the concentration of
phosphoproteins in any given sample. Furthermore, the ionization efficiency of phosphopeptides
compared to their unphosphorylated counterparts is generally lower (Craig et al. 1994; Hunter and
Games 1994), hampering their routine detection in MS analysis. To facilitate the successful analysis
of hundreds to thousands of phosphopeptides from very complex mixtures (e.g. whole cell lysates),
both reduction of the sample complexity and the efficient enrichment of phosphopeptides prior to
MS analysis is a must (Dunn et al. 2010).
To reduce the sample complexity, different prefractionation techniques like gel electrophoresis
(Black et al. 2007), isoelectric focusing (Beranova-Giorgianni et al. 2006) or ion exchange
chromatography (Gruhler et al. 2005; Trinidad et al. 2006) have been applied in phosphoproteomics
studies. The most frequently employed techniques to enrich for phosphopeptides are metal affinity-

Introduction
18
based enrichment approaches, which exploit the affinity of different metal ions or oxides to the
oxygen atoms of the phosphate group. The first such method was immobilized Fe(III)-metal affinity
chromatography (IMAC, (Porath et al. 1975)). Although this method has already been known since
1975, first applications to phosphoproteins and -peptides were reported not before the 1990s (Scanff
et al. 1991; Muszynska et al. 1992). In recent years, other ions like Ga(III), Zr(IV) and Al(III) have been
investigated for application in IMAC enrichment (Nuhse et al. 2003). Metal oxide affinity
chromatography (MOAC) was introduced as a further efficient method for phosphopeptide
enrichment (Pinkse et al. 2004). Since then, the applicability of different metal oxides like TiO2, ZrO2,
Al2O3 and Nb2O5 to phosphopeptide enrichment has been shown, while TiO2 is today the most
commonly used resin in MOAC (Gerrits and Bodenmiller 2010).
Enabled by the use of a combination of efficient prefractionation and phosphopeptide enrichment
techniques, a vast number of phosphopeptides and newly identified phosphorylation sites have
increasingly been reported (Lemeer and Heck 2009). For example, Olsen et al. recently reported the
identification of over 20,000 phosphopeptides (Olsen et al. 2010). While such gel-free MS-based
approaches do often not allow for distinguishing between distinct protein isoforms, they provide the
capability of obtaining intriguing new insights into complex signaling processes in various biological
systems.
5.5.3 Alternative fragmentation techniques
Low-energy CID is the most commonly used peptide fragmentation technique in proteomics.
However, in serine- and threonine-phosphorylated peptides the phosphoryl bond is more labile than
the protonated peptide bond. Therefore, disscociation at this bond competes with backbone
fragmentation, resulting in dominant losses of phosphoric acid. Due to this lability of the phosphate
moiety, application of conventional low-energy CID for phosphopeptide analysis is often limited, as
the resulting spectra are dominated by neutral loss fragments and contain little or no sequence
information (Boersema et al. 2009). Alternative fragmentation techniques have therefore been
sought for phosphoproteomics applications. A recently reported technique well applicable to
phosphopeptide fragmentation is multi-stage activation (MSA) (Schroeder et al. 2004; Palumbo et al.
2008). With MSA, sequence-informative fragementation spectra of phosphopeptides are achieved by
low-energy CID followed by a further activation step. In this method, first generation CID ions
produced by one or multiple neutral losses are further activated at adequate fragementation
energies, eventually resulting in peptide backbone fragmenation. In contrast to a MS3 experiment,
the second activation is carried out without emptying the ion trap first, resulting in a pseudo-MS3
spectrum, which contains both MS2 and MS3 fragments (Boersema et al. 2009). By using this

Introduction
19
technique, the identification of phosphopeptides is significantly enhanced through enhanced
backbone fragmentation and thus, the generation of more sequence-determining fragment ions.
Another alternative (phospho)peptide fragmentation technique is termed electron transfer
dissociation (ETD) (Syka et al. 2004). This technique is based on a completely different fragmentation
mechanism. Here, peptide ion fragmentation is induced by the transmission of an electron from a
transfer reagent to the peptide to yield a peptide radical cation. This increases the basicity of the
amide carbonyl oxygen, which abstracts a proton from another amino acid in the peptide sequence.
Thereby the N-Cα bond is significantly weakend and peptide ions dissociate at this bond giving rise to
c- and z-ion series (Boersema et al. 2009). Through application of this technique, modifications like
phosphorylation and glycosylation remain intact at the respective amino acid. Hence, spectra contain
only sequence-specific fragment ions. Furthermore, as the phosphorylation site remains at the
specific amino acid, it can therefore directly be assigned to the correct position in the peptide.
5.5.4 Bioinformatics
In proteomics, peptide and protein identification is done by database searches employing specialized
algorithm such as Mascot (Perkins et al. 1999). For that purpose, a database of all potentially existing
proteins in the sample (e.g. a database restricted to a specific organism) is theoretically digested into
peptides and the theoretical MS/MS spectrum for each peptide is calculated. By comparing
measured fragmentation spectra to theoretical MS/MS spectra, peptides can be identified with a
certain probability and subsequently assembled to proteins. In order to give a measure for the
number of false positive hits in the protein list, a decoy database strategy is employed (Kall et al.
2008). In this strategy, the protein database in use is randomly shuffled to give nonsense sequences.
These sequences are added to the actual database and likewise theoretically digested in order to
generate artificial peptide sequences of which theoretical spectra are eventually calculated. If a
resulting protein list contains 1 % of decoy hits, the content of unknown false positive hits identified
from the original database is likewise expected to be 1 %.
For the characterization of phosphorylated proteins, it is essential not only to identify the respective
phosphopeptides, but also to determine the exact position of the phosphate moiety. Common search
engines used for automated protein identification generally enable to identify phosphopeptides with
quite high confidence, but no measure is given for the correctness of the phosphorylation site
localization (Boersema et al. 2009). To overcome this limitation, scoring algorithms have recently
been developed (Beausoleil et al. 2006; Cox and Mann 2008; Ruttenberg et al. 2008; Wan et al. 2008;
Bailey et al. 2009), which provide a score for the probability for the correct assignment of the
respective phosphorylation site in a given protein. However, these algorithms are generally not

Introduction
20
applicable to all kind of phosphoproteomic data sets but rather limited to data acquired with certain
fragmentation techniques, instrument types, data file formats or search engines.
5.5.5 Quantitative techniques
For effectively addressing biological questions by proteomics methodology, it is often essential to
obtain quantitative information on tausends of proteins in the same experiment. Relative
quantification of proteins in 2D gel-based approaches is generally performed via densitometry. In gel-
free approaches, protein quantification is performed based on signal intensities observed in MS
survey or MS/MS spectra. When samples to be quantitatively compared are jointly analyzed by MS,
signals derived from the different conditions have to be distinguishable. This is achieved by
introducing mass-coded labels (i.e. an internal reference). Otherwise, the samples need to be
separately processed and analyzed with subsequent comparison. As depicted in Figure 6 (Bantscheff
et al. 2007), there are different ways of introducing isotopic labels, namely metabolically, chemically
or enzymatically and alternatively as external standard components. By metabolic labeling, isotopic
labels are introduced in animals, cells or plants by supplying isotopically labeled nutrients. In plants,
this can be done by the application of normal and 15N-labeled inorganic salts (e.g. NO3). Plants
subsequently incorporate “light” or “heavy” nitrogen in all proteins (Oeljeklaus et al. 2009), resulting
in a mass shift of 15N-containing proteins. In cells or animals, labels can be introduced by providing
different isotopically labeled amino acids as nutrients. These are likewise incorporated in the
proteins, resulting in differentially labeled protein populations. This methodology was termed stable
isotope labeling by amino acids in cell culture (SILAC) (Ong et al. 2002; Mann 2006). The advantage of
metabolic labeling is illustrated in Figure 6. By this method, the label is introduced at the earliest
possible time point in the quantification workflow and allows joint sample processing, thereby
minimizing variances introduced by different sample handling. This methodology however, is
generally not applicable for tissue samples. Alternatively, isotopic labeles are therefore introduced
chemically. This can be performed either at the protein or at the peptide level, as shown in Figure 6.
Following labeling, samples are be combined, jointly processed and subsequently relatively
quantified via MS. The two most common protein labeling techniques are termed isotope-coded
affininty tag (ICAT) (Smolka et al. 2001) and isotope-coded protein label (ICPL) (Schmidt et al. 2005).
The use of both labeling methods results in differentially labeled peptides, which are therefore
relatively quantified on the basis MS survey scans. The two most common reagents used for isotopic
peptide labeling are iTRAQ® (Ross et al. 2004) and TMT® (Dayon et al. 2008). The use of these
reagents results in isobaric peptides, which are indistinguishable in MS survey scans. As a result of
peptide fragmentation however, reporter ions with different low molecular weight masses are

Introduction
21
generated. Therefore, relative quantification is here conducted on the basis of the respective
fragmentation spectra. It is of further note that ion trap instruments are typically not applicable due
to a lwo molecular mass cut-off in CID ion trap mass spectra. The advantage of such chemical
labeling, is the potential for multiplexing. iTRAQ®, for example, is commercially available for 4-, 6-
and 8-plexing approaches and, hence, allows for the simultaneous quantification of up to eight
different samples in the same experiment.
In addition, isotopic labels can be introduced enzymatically, for example, by proteolytic digestion in
“heavy” water, leading to the incorporation of one 18O per peptide (Fenselau and Yao 2009).
Resulting “heavy” and “light” peptides are then compared and relatively quantified on the basis of
MS spectra.
Beyond the methods used for relative quantification, protein concentrations can be absolutely
determined by the addition of labeled, external standard peptides of known quantity, as depicted in
Figure 6. This method is termed absolute quantification assay (AQUA) (Gerber et al. 2003).
Costs for quantification methods based on the introduction of isotopic labels are comparably high. In
conctrast, label-free quantification based on signal intensities or spectral counts of separately
processed samples (Figure 6), is far more cost efficient. However, this method bears the risk of
introducing artificial differences to the samples by sample handling errors (Bantscheff et al. 2007)
Fig. 6: Different quantitative proteomics workflows. There are different techniques to introduce isotopic
labels in order to quantify proteins and peptides by mass spectrometry. Coloured boxes indicate different
experimental conditions and horizontal lines indicate the time point, when samples are combined. Metabolic
labeling provides distinguishable sample populations from the beginning of the experiment, whereas chemical
labels can be introduced at the protein level or after digestion at the peptide level. At this level also standard
components can be spiked in. If different sample populations should be compared lable-free, samples can only
be combined at data analysis stage (Figure from Bantscheff et al. 2007).

Introduction
22
For quantitative phosphoproteomics, stable isotope labeling by amino acids in cell culture (SILAC)
(Ong et al. 2002) has been established as method of choice. SILAC in combination with modern MS
has successfully been applied to the study of different signal transduction pathways (Gruhler et al.
2005; Kruger et al. 2008; Pan et al. 2009; Christensen et al. 2010). In this metabolic labeling
approach, certain amino acids are replaced in the cell culture media by their heavy isotopically
labeled counterparts. “Light” and “heavy” amino acids are then incorporated in proteins during the
growth and division of cells. In proteomics experiments, arginine and lysine are typically employed as
“heavy” amino acids when trypsin is used as proteolytic enzyme. Since trypsin cleaves C-terminally
after arginine and lysine residues, each peptide except for the C-terminal peptide of a given protein
contains at least one labeled amino acid (Mann 2006). To ensure the virtually complete incorporation
of labeled amino acids into proteins, cell culture conditions have to be optimized thoroughly. For
example, a typical problem encountered in such experiments is that labeled amino acids are
metabolically converted to other amino acids. In eukaryotes, mostly arginine is converted to proline
(Ong et al. 2003). This conversion has to be prevented in order to achieve easily interpretable and
quantifyable isotopic patterns in MS experiments.
SILAC can be performed using either two or three different labeling regimes. With the establishment
of triple labeling SILAC experiments, the relative quantitative comparison of proteins from multiple
conditions became possible and furthermore, quantitative changes over time could be accurately
monitored. Such time-resolved SILAC experiments in combination with phospho-specific sample
preparation and high-resolution MS analyses provide an effective quantitative proteomics approach
to gain new insight(s) into established signaling cascades as well as for the analysis of so far unknown
signaling events (Mann 2006).

Materials and Methods
23
6 Materials and Methods
6.1 Reagents and Consumables
Reagents
Acetic acid Normapur/VWR
Acetonitrile (ACN) BioSolve
Acrylamide (electrophoresis grade) BioRad
Acrylamide solution (37.5 : 1) Serva
Agarose (low melt, preparative grade) Merck
Amberlite (ion exchanger) Serva
Ammonium bicarbonate Fluka/Sigma-Aldrich
Ammonium dihydrogen phosphate Fluka/Sigma-Aldrich
Ammonium hydroxide (30 %) J.T.Baker
Ammonium persulfate (APS) BioRad
Ammonium sulfate J.T.Baker
Ampholine Amersham
Arginine Sigma-Aldrich
Arginine (13C6 and 13C615N4 labeled) euriso-top
BisTris AppliChem
Bradford staining solution BioRad
Bromphenol blue Serva
Dihydroxybenzoic acid (DHB) Fluka/Sigma-Aldrich
Dithiothreitol (DTT) AppliChem
ESI tuning mix Agilent Technologies
ProteoMass ESI positive mode calibration mix Sigma-Aldrich
Ethylendiamine Merck
Ethylendiamine tetraacetat (EDTA) Merck
Fetal bovine serum (FBS) Gibco/Invitrogen
Fetal bovine serum dialysed (dFBS) Gibco/Invitrogen
Formic acid (FA) Normapur/VWR
Glycerine Baker
β-Glycerophosphate Merck
Glycin Applichem
Heptafluorobutyric acid (HFBA) Fluka/Sigma-Aldrich
β-Ionone

Materials and Methods
24
L-Glutamine Invitrogen
Lysine Sigma
Lysine (4D and 13C615N2 labeled) euriso-top
Marker, Mark12™ Invitrogen
β-Mercaptoethanol
Methanol J.T.Baker
3-(N-morpholino)propanesulfonic acid
Nitrogen (5.0) Linde Gas
Octansulfonic acid (OSA) MP Biomedicals
Penicillinium/Streptavidin (Pen/Strep)
Pharmalyt (5-8) Amersham
Pharmalyt (4-6.5) Amersham
Phosphoric acid J.T.Baker
Piperazine – diacrylamid (PDA) BioRad
Potassium chloride Normapur/VWR
Potassium dihydrogen phosphate Normapur/VWR
Proline Sigma
ProQ staining solution Molecular Probes/Invitrogen
Reserpine solution Agilent Technologies
RPMI 1640 medium GIBCO® Invitrogen
RPMI SILAC medium PAN Biotech GmbH
Sephadex G- 75 Amersham
Servalyte Serva
Servalyte (6 – 9) Serva
Sodium acetate J.T.Baker
Sodium dodecylsulfate (SDS) Applichem
Sodium fluoride Fluka/Sigma-Aldrich
Sodium orthovanadate (OV) Fluka/Sigma-Aldrich
Sodium pyrophosphate Fluka/Sigma-Aldrich
Thiourea J.T.Baker
Trifluoracetic acid (TFA) Merck
Tris-base Sigma
Tris-HCl AppliChem
Trypsin (sequence grade) Promega
N,N,N,N-Trimethylethylenediamine (TEMED) BioRad
Urea BioRad or J.T.Baker

Materials and Methods
25
Table 1: Standard proteins and peptides used in this work are listed. Bold S and Y indicate phospho-serine
and phospho-tyrosine respectively.
Peptide/Protein Description Source
Glucose oxidase from Aspergillus niger
Sigma Aldrich Albumin Bovine, 99 %
α-Casein (S1 and S2) from bovine milk, 70 %
Myoglobin From equine skeletal muscle 95-100 %
1211 APPDNLPSPGGSR
Donated by Karl Mechtler
1212 APPDNLPSPGGSR
1448 ENIMRSENSESQLTSK
1449 QLGEPEKSQDSSPVLSELK
1451 KFLSLASNPELLNLPSSVIK
1461 SVSDYEGK
1462 THILLFLPKSVSDYEGK
GluFib EGVNDNEEGFFSAR
1463 YEEIQ
1464 DYVPML
1467 YYYEI
1142 PQEFSSVERGR
1145 SSTRSHEYGRK
1544 KAVYNFATM
1895 GGGGKFAGAQLEDGR
Consumables
C8 discs for plugs 3M, Neuss, Germany
Cell culture plastics Techno Plastic Products AG
Distal coated silica tips (FS360-20-10-D) New Objective, Woburn, USA
Gel cassettes (1.0 and 1.5 mm) Invitrogen
Oasis® HLB cartridge Waters Corporation, Milford, USA
Titansphere column TiO (5 µm) GL Science Inc.

Materials and Methods
26
6.2 Animal preparation
All procedures were in accordance with the German animal welfare act (1998). CD6 mice were held
in standard rat cages with a 12-hour light/dark cycle. Water and food was given ad libidum. Mice
were either exposed to octanal or no odorant for 10 min. Directly after exposure, mice were
sacrificed and the olfactory epithelium (OE) was prepared essentially as previously described (Spehr
et al. 2002). Briefly, the OE was dissected form the septal bone and immediately placed in ice-cooled
ringers buffer (140 mM NaCl, 5 mM KCl, 1mM MgCl, 2 mM CaCl, 10 mM Hepes, 10 mM glucose)
supplemented with protease (Roche Complete® protease inhibitor cocktail) and phosphatases
inhibitors (10 mM Glycerophosphate, 1 mM Na-orthovanadate, 9.5 mM NaF and 10 mM Na-
pyrophosphate). Dissected OE were frozen in liquid nitrogen and stored at -80 °C.
6.3 Gel electrophoresis
1D-PAGE: Bis-Tris gels (NuPAGE)
Polyacrylamid gel: 5x sample buffer:
Solution Volume
Acrylamid (37.5 : 1) 3.33 ml
7x Bis-Tris buffer (2.5 M BisTris, pH 6.5) 1.42 ml
Ammonium persulfate (APS); 40 % 12 µl
TEMED 3 µl
Water (puriss.) 3.38 ml
Gels were casted in ready-to-use plastic gel cassettes and 10 well combs were applied to the gels.
Samples were diluted with 5x sample buffer to a final volume of maximal 15 µl. Gel electrophoresis
was conducted using 400 mA and 150 V for approximately 60 min in 1x running buffer.
20x running buffer
Solution Volume
β-Mercaptoethanol 12,5 ml
SDS 5 g
Bromphenolblau 0,5 g
Glycerin 25 ml
Tris- HCl (pH 6.8; 2.5 M) 5 ml
ad. 50 ml
Solution Volume
MOPS 104.6 g
Tris-HCl 60.6 g
SDS 10 g
EDTA 3 g
Water (puriss.) ad. 500 ml

Materials and Methods
27
2D-PAGE: isoelectric focusing (IEF) according to Klose
Ampholine stock solution: Acrylamide solution SepGels and CapGels: Solution Volume
Ampholine 8 ml
Servalyte 8 ml
Pharmalyt (4 – 6.5) 24 ml
Pharmalyt (5 – 8) 16 ml
For ampholine complete solution, 7 ml of ampholine stock solution were mixed with 1 ml Servalyte
(6 – 9).
CapGel working solution: SepGel working solution:
11.88 g Urea
3.85 g Glycerin solution (28.6 % (w/v))
4.4 g AA solution CapGels
12.9 µl TEMED
2.19 g Water (puriss.)
2.2 g Ampholine complete solution
IEF gels were casted in 8 cm glass tubes with an inner diameter of 1.5 mm. SepGel and CapGel
working solutions were degassed prior to use. Sep- and CapGel solutions were mixed with 45 µl and
13 µl APS (1.2 % (w/v)), respectively. A 7 cm separation gel followed by a 2 mm capping gel was
casted in the glass tubes.
Anode buffer (top): Cathode buffer (bottom):
Gel containing glass tubes were inserted into the gel chamber (CapGel down). The gels were covered
with 2 mm of Sephadex solution (40µl swelled Sephadex, 25 µl DTT, 25 µl ampholine complete
solution, 310 mg thiourea). Urea, DTT (21.6 % (w/w)) and Ampholine solution were added to the
sample to final proportions of 50, 5 and 5 % (v/v), respectively. The sample was stacked onto the
Sephadex cushion and covered with protective solution (7.6 ml of 30 % urea/5 % glycerin (w/v) plus
0.4 ml Servalyt 2-4). Focusing was started according to the following time scheme:
Incubation solution:
Solution Volume
Acrylamide (s) 4.375 g
PDA 0.375
Water (puriss.) ad. 25 g
deionize with Amberlite
27 g Urea
8.75 g Glycerin solution (28.6 % (w/v))
10 g AA solution SepGels
29.3 µl TEMED
4.97 g Water (puriss.)
5 g Ampholine complete solution
126 g Urea
35 ml Phosphoric acid (85 %)
ad 700 ml Water (puriss.)
270 g Urea
25 g Glycerin
25 ml Ethylene diamin
ad 500 ml Water (puriss.)
Scheme for 7 cm tube gel:
100 V 75 min
200 V 75 min
400 V 75 min
600 V 75 min
800 V 10 min
1000 V 5 min
125 mM Tris-base (pH 8.6)
40 % (v/v) Glycerin
65 mM DTT
104 mM SDS
ad. 500 g Water (puriss.)

Materials and Methods
28
After the isoelectric focusing, the tube gels were outpaced from the glass tubes and covered with
incubation solution for 30 min. Finally the tube gel was washed twice with SDS gel running buffer.
2D-PAGE: second dimension SDS – PAGE
SDS gel buffer SDS gel running buffer
138 g Tris base
56.75 g Tris-HCl
1200 µl TEMED
4 g SDS
ad 2000 ml Water (puriss.)
The ready-to-use acrylamide solution was mixed 1:1 with SDS gel buffer. 72 ml of this solution and
144 µl of 40 % (w/w) APS were mixed and filled into ready-to-use plastic gel cassettes (1.5 mm) up to
1 cm below the maximum fill level. The gel was immediately covered with butanol (saturated with
water) to produce an even rim. After polymerization over night, the butanol was removed by
washing twice with 1x running buffer. The washed first dimension tube gel was placed void-free upon
the second dimension SDS gel and the cassette was filled with warm 1% agarose (in running buffer,
supplemented with bromphenol blue). Electrophoresis was carried out using the stated buffers at
400 mA and 150 V for approximately 60 min.
6.4 Staining procedures
Colloidal Coomassie staining
Protocol for Colloidal Coomassie staining
step buffers time
fixation 50 % methanol
2% phosphoric acid over night
wash water puriss.) 3 x 30 min
(3 x 10 min for minigels)
incubation
34 % methanol 2 % phosphoric acid
17 % ammonium sulfate
1 h (30 min for minigels)
staining Add a small amount of
coomassie 250 G
over night or up to 3 days (for
minigels 2 h sufficient)
destaining Water (puriss) Until desired destaining
720 g Glycin
151.4 g Tris base
50 g SDS
ad. 5000 ml Water (puriss.)

Materials and Methods
29
- For incubation and staining buffers add phosphoric acid and some water first. Then add
ammonium sulfate and mix thoroughly. Make sure the ammonium sulfate is completely
dissolved before adding methanol. Add water to the final volume.
ProQ staining
step buffers time
fixation 50 % methanol 10 %
acetic acid Change solution after 30 min,
second fixation over night
wash water (puriss.) 5 x 15 min (10 min for minigels)
staining ProQ stain 1.5 – 2 h, in the dark
destaining 20 % acetonitrile, 50 mM sodium acetate, pH 4.0
3 x 30 min
wash water (puriss.) 4 x 10 min
(if high background staining is observed, 20 - 30 min extra)
- Carry out all steps with slight agitation.
- Adhere strictly to the times specified in the protocol
- Use high density plastic containers.
- Use containers dedicated exclusively for ProQ staining.
- Clean containers thoroughly with ethanol before use.
To visualize proteins stained with the fluorescent Pro-Q® dye, gels were scanned on a Typhoon Trio
scanner (GE Healthcare, Munich, Germany) with an excitation wavelength of 532 nm (max. excitation
wave length Pro-Q® stain: 555 nm). Following staining with the Pro-Q® dye, all proteins in Pro-Q
stained gels, irrespective of their phosphorylation status, were observed to emit minor amounts of
light when scanned at an excitation wave length of 633 nm. This phenomenon was utilized to
visualize the total protein content as a loading control.

Materials and Methods
30
6.5 Chromatography
Reversed-phase separation: Ultimate classic system
Online reversed-phase capillary HPLC separations for mass spectrometric measurement using the Q-
Star XL (Applied Biosystems), Q-Trap 4000 (Applied Biosystems), LCQ XP (Thermo Fisher) and HCT
plus (Bruker Daltonik) instruments were performed using the Dionex LC Packings HPLC systems
(Dionex LC Packings, Idstein, Germany) as described previously (Schaefer et al. 2004). Briefly, the
HPLC system was composed of the components Famos (autosampler), Switchos (loading pump and
switching valves), and Ultimate (gradient pump and UV-detector). Peptides were loaded online and
preconcentrated on a C18 precolumn (0.3 mm i.d. × 5 mm, 5 μm; Dionex LC Packings) with 0.1 % TFA
at a flow rate of 30 μL/min for 6 min. Thereafter, the precolumn was switched in line with a Pep-Map
column (75 μm i.d. × 250 mm, 5 μm, Pep-Map; Dionex LC Packings) for reversed-phase (RP)
separation. A solvent system consisting of solvent A (0.1% (v/v) formic acid (FA)) and solvent B (0.1%
(v/v) formic acid; 84% (v/v) acetonitrile (ACN)) was used and flow rates were adjusted to 250 nL/min.
A gradient of 5 - 50% solution B in 35 min was carried out using the Ultimate system. The column was
washed for 5 min with 95 % solvent B and subsequently reequilibrated for 20 min with 95 % solvent
A. During separation, the second precolumn was washed with 50 % (v/v) ACN/0.1 % (v/v)
trifluoroacetic acid (TFA) for 20 min and 84 % (v/v) ACN/0.1 % (v/v) TFA for 10 min using the isocratic
loading pump. RP separations were carried out at room temperature.
Reversed-phase separation: U 3000 system
All samples from strong cation exchange (SCX) fractions and TiO2 affinity chromatography were
separated by nano HPLC-using the UltiMateTM 3000 HPLC system (Dionex LC Packings, Idstein,
Germany) online coupled to an LTQ Orbitrap XL instrument (Thermo Fisher Scientific, Bremen,
Germany) or to a HCT Ultra PTM instrument (Bruker Daltonics, Bremen, Germany). RP capillary HPLC
separations were performed as described previously (Schaefer et al. 2004) with slight modifications.
In brief, peptide mixtures were loaded onto one of the two C18 precolumns (0.3 mm inner diameter
x 5 mm; PepMap, Dionex LC Packings) equilibrated with 0.1 % (v/v) TFA, washed and
preconcentrated for either 20 min (SCX fractions) or 40 min (eluates from TiO2 affininty
chromatography) with the same solvent at a flow rate of 30 µl/min using the loading pump. The
precolumn was then switched in line with a C18 RP nano LC column (75 µm inner diameter x 150
mm; PepMap, 3µm, Dionex LC Packings). For peptide separations, a binary solvent system consisting
of 0.1% (v/v) FA (solvent A) and 0.1% (v/v) FA/84% (v/v) ACN (solvent B) was applied. For SCX

Materials and Methods
31
fractions and TiO2 eluates a gradient of 5 - 50% solvent B in 65 min and 45 min respectively, was used
at a flow rate of 300 nl/min. In both cases the gradient was continued as follows: 50 - 95% solvent B
in 2 min; the nano LC column was washed for 5 min with 95 % solvent B and equilibration of the
column with 5 % solvent B was carried out for 20 min.
Simultaneous with the peptide separation, the precolumn not in line with the nano LC column was
washed using a linear gradient of 0.1 % (v/v) TFA to 0.1% (v/v) TFA/84 % (v/v) ACN in 20 min. The
solvent composition was kept at 0.1 % TFA/84 % ACN for 10 min before reequilibration of the
precolumn with 0.1 % TFA. RP separation was carried out at 25 °C.
Strong Cation Exchange (SCX) Chromatography
200 µg of lyophilized tryptic peptides were redissolved in SCX buffer A (5 mM potassium dihydrogen
phosphate, 25% ACN (v/v), pH 2.7) and entirely loaded onto a Polysulfoethyl-Asp column (i.d. 1 mm,
15 cm, 5 µm, 300 Å, Dionex/LC Packings, Amsterdam, Netherlands) equilibrated with SCX buffer A
using a Dionex LC Packings Ultimate classic HPLC system (see page 26) without flow splitter and a
CMA 470 fraction collector (CMA Microdialysis AB, Solna, Sweden). The peptides were eluted from
the column with a flow rate of 50 µl/min using a linear gradient of 0 – 50 % SCX buffer B (5 mM
potassium dihydrogen phosphate, 25% ACN (v/v), 500 mM KCl, pH 2.7) in 70 min, followed by a
gradient of 50 – 100 % solvent B in 10 min. The column was washed with 100 % B for 10 min and re-
equilibrated with buffer A for 30 min. 32 peptide fractions of 4 min each were collected throughout
the gradient. 15 µl of each fraction were pipetted in a glass vial, dried in vacuo and stored at – 80 °C.
The remainder of the fractions (185 µl) was subjected to TiO2 chromatography for enrichment of
phosphopeptides.
6.6 Mass spectrometry
In the work presented here, a great variety of mass spectrometric instruments was used.
Phosphoproteomic analyses were generally conducted on the LTQ Orbitrap and the HCT Ultra PTM
instrument. Thus, mass spectrometric techniques performed on these thwo instruments are
described in detail, whereas for the other mass spectrometers the relevant parameters are stated
briefly. All mass spectrometers were equipped with the respective nano-electrospray ionization (ESI)
source and distal coated SilicaTips.

Materials and Methods
32
Q-Star XL (Applied Biosystems, Foster City, CA)
External calibration was routinely performed on a daily basis using reserpine (m/z 609.280) and two
of its fragments (m/z 174.100 and 195.065). The general parameters were as follows: ion spray
voltage: 1,800-2,000 V; curtain gas: 10-14 l/min; gas 1.0; declustering potential: 50 V; focusing
potential: 220 V; declustering potential 2: 15 V; Software for acquisition: Analyst QS 1.1; survey scan:
m/z 400 – 1,200; top 3 enhanced product ion scan: m/z 100 – 2,000; exclude singly charged ions;
rolling collision energy: on; collision gas: nitrogen (purity 5.0); dynamic exclusion for 16 s; peaklists
were generated using the Analyst QS 1.1 software with default parameters.
Q-Trap 4000 (Applied Biosystems, Foster City, CA)
Needle voltage: 2,400 – 3,200 V; interface heated to 150 °C; curtain and collision gas: nitrogen (purity
5.0). Scan cycle: one MS survey scan (EMS, m/z 400-1,400 at 4,000 amu/s) plus enhanced resolution
scan (ER) of the three most intense ions (at a scan rate of 250 amu/s), up to three MS/MS scans (EPI,
m/z 100-1,750 at 4000 amu/s); Peaklists were generated using Analyst v.1.4 with default parameter
settings.
LCQ DECA XP (Thermo Fisher Scientific, Bremen, Germany)
Capillary temperature: 250 °C; spray voltage 2.0 – 2.2 kV; capillary voltage: 42 V; lense offset: 30 V;
maximal fill-time: 200 ms; automatic gain control: 107; MS scan range: m/z 500 – 2,000, MS/MS scan
range: m/z 200 – 2000; dynamic exclusion for 3 min.
HCT plus (Bruker Daltonik, Bremen, Germany)
The instrument was externally calibrated with standard compounds (ESI Tuning Mix, Agilent
Technologies). The general mass spectrometric parameters were as follows: capillary voltage:
1,400 V; plate offset: 500 V; dry gas flow: 10.0 l/min; dry gas temperature: 160 °C; aimed ion charge
control (ICC) 150000; maximal fill-time 500 ms; software: Compass 1.2; fragmentation amplitude
0.6 V; MS spectra were a sum of seven individual scans ranging from m/z 300-1,500 with a scanning
speed of 8,100 (m/z)/s; and (ii) MS2 spectra were a sum of four scans ranging from m/z 100 – 2,200
at a scan rate of 26,000 (m/z)/s.

Materials and Methods
33
LTQ – Orbitrap XL (Thermo Fisher Scientific)
The LTQ-Orbitrap XL was externally calibrated using standard compounts. To provide very high mass
accuracy, lock masses (derived from a set of distinctive air contaminants) were routinely used for
internal calibration of each MS spectrum acquired. The general mass spectrometric parameters were
as follows: spray voltage: 1.7 - 2.0 kV; capillary voltage: 45 V; capillary temperature: 200 °C; tube lens
voltage: 100 V. For data-dependent MS2 analyses, the software Bioworks 3.3.1 SR 1 (Thermo Fisher
Scientific, Bremen, Germany) was used. MS spectra ranging from m/z 300 to 1,500 were acquired in
the Orbitrap at a resolution of 30,000 (at m/z 400). Automatic gain control (AGC) was set to 5 x 10⁵
ions and a maximum fill time of 750 ms. After a brief survey scan, the four most intense multiply
charged ions were selected for low energy CID in the linear ion trap concomitant with the completion
of the MS scan in the Orbitrap. The AGC of the LTQ was set to 10,000 ions and a maximum fill time of
100 ms. Fragmentation was carried out at a normalized collision energy of 35% with an activation q
of 0.25, an activation time of 30 ms and with the multistage activation option for neutral losses of 98
Da (+2, loss of two H3PO4), 49 (+2, loss of one H3PO4) and 32.3 (+3, loss of one H3PO4). The
fragmentation of previously selected precursor ions was dynamically excluded for the following 45
sec.
HCT Ultra PTM (Bruker Daltonik, Bremen, Germany)
The HCT Ultra PTM Discovery SystemTM (Bruker Daltonics, Bremen Germany) was externally
calibrated using standard compounds. The general mass spectrometric parameters were as follows:
capillary voltage: 1400 V, plate offset: 500 V; dry gas flow: 8.0 l/min; dry gas temperature: 160 °C;
aimed ion charge current (ICC): 200000, maximum fill time: 500 ms. The instrument was operated
using the EsquireControl 6.2 (Bruker Daltonics) software. The three most intense multiply charged
peptide ions were chosen for fragmentation by CID. Exclusion limits were automatically placed on
previously selected m/z ratios for 1.2 min. The precursor masses of peptide ions with a detected
neutral loss of phosphoric acid (m/z 49.0 for doubly charged ions and m/z 32.7 for triply charged
ions) were automatically selected for fragmentation by electron transfer dissociation (ETD).
Parameters for low energy CID and ETD were as follows: scan averaging: 5; scan speed for MS:
26,000 m/z per sec; MS scan range: m/z 300 – 1,500; scan speed for MS/MS: m/z 8,100; scan range
for MS/MS: m/z 100 – 2,800; fragmentation amplitude: 0.5 V; ICC target for ETD reactant: 600,000;
max. accumulation time of ETD reactant: 200 ms; reaction time: 100 ms; smart decomposition for
z = 2.

Materials and Methods
34
6.7 Cell culture
LNCaP cells were cultured in RPMI 1640 medium (supplemented with 10 % FBS, 1 % Pen/Strep) in 75
cm2 flasks at 37 °C and with 5% carbon dioxide. Cells were passaged once a week and cell culture
medium was changed an additional time during the week. For global phosphoproteomic
experiments, cells were seeded in conventional RPMI medium on 87 mm dishes (Techno Plastic
Products AG, Trasadingen, Switzerland) to a confluency of ~ 90 %. For SILAC experiments, cells were
seeded in 75 cm2 flasks in the respective RPMI-SILAC medium (supplemented with 10 % dialyzed FBS,
1 % Pen/Strep, 1 % glutamine, 800 mg/l proline, 120 mg/l arginine and 120 mg/l lysine). In light SILAC
medium non labeled amino acids were used. For medium SILAC labeling 13C6-arginine and D4-lysine
and for heavy SILAC labeling 13C615N4-arginine and 13C6
15N2-lysine were used. Cells were cultured in
the respective SILAC medium for at least two weeks to ensure complete labeling with medium or
heavy SILAC amino acids. 5 – 6 days before the actual stimulation experiment was performed, cells
were seeded in one 87 mm and one 30 mm dish per SILAC state. Cells were cultured up to ~ 90 %
confluency for the 87 mm dishes and up to ~ 60 % confluency for the 30 mm dishes. The latter were
used for calcium imaging experiments.
6.8 Cell migration assays
Migration assays were performed at the Department of Cell Physiology at the Ruhr-University
Bochum essentially as stated in (Gelis 2009). Briefly, 5 x 10³ LNCaP cells were seeded in 200 µl RPMI
medium without FBS on top of non-coated polyethylene terephtalate (PET) membranes of transwell
culture inserts, 8 µm pore size (BD Biosciences, Heidelberg, Germany). The cells were incubated for
24 h under standard conditions. Then, the bottom chamber was filled with either the same medium
as was used in the upper chamber as a negative control or RPMI medium containing 20 % FBS as a
positive control. Furthermore, to test the influence of β-ionone on cell motility, four treatment
regimes were executed (Table 2).
Table 2: Treatment regimes of LNCaP cells for migration assays.
1 2 3 4
Upper chamber 500 mM β-ionone - - 500 mM β-ionone
Bottom chamber
20 % FBS 500 mM β-ionone
+ 20 % FBS 500 mM β-ionone -
Experiment Positive control Positive control +
β-ionone Negative control
Negative control + β-ionone

Materials and Methods
35
After 24 h cultivation, the cells were fixed in 4 % paraformaldehyde in PBS, stained for 5 min with
Sytox Green (Invitrogen), and washed three times with 2 ml of tap water for 15 min, respectively.
Cells that had remained on top of the membrane were wiped away. Cells that had migrated to the
bottom side of the membrane were visualized under the microscope and quantified by counting the
number of cells in three randomly chosen visual fields. The assay was performed in quadruplicate per
condition and in two independent replicates.
6.9 Phosphoproteomics sample preparation
All steps in phosphoproteomics sample preparation have to be performed swiftly and at 4 °C,
especially before (phospho)proteins are digested
For global phosphoproteomics experiments, cells were treated with 3 mM activated ortho-vanadate
for 10 min to accumulate phosphorylated proteins in the cell and thus, to produce a highly
phosphorylated sample. In order to analyze the effects of prostate-specific G-protein coupled
receptor (PSGR) activation, cells were treated for 0, 2 and 10 min with its known ligand β-ionone
diluted in cell culture medium to a final ration of 1:10000 (v/v). To determine the treatment and
arrest the stimulation effect, cells were placed on ice and washed twice with ice cold PBS. 500µl ice
cold lysis buffer (7 M urea, 2 M thiourea, 1 mM sodium orthovanadate, 10 mM β-glycerophosphate,
9.5 mM sodium fluoride, 10 mM sodium pyrophosphate) were added, cells were scraped from the
dish and further disrupted using a Dounce glass homogenizer. Insoluble material was removed by
centrifugation for 15 min at 13.000 rpm and 4 °C. The protein concentration was estimated using the
Bradford assay (BioRad, Munich, Germany). A lysate volume corresponding to 1 mg of protein was
diluted 1 : 4 with 10 mM ammonium bicarbonate solution and digested with 20 µg of sequencing
grade trypsin (Promega, Mannheim, Germany) for 3 h at 42 °C. The resulting peptide sample was put
on ice for 5 min and acidified with TFA to a final concentration of 1 %. An Oasis® HLB cartridge was
conditioned by applying 2x 2 ml of elution buffer (5 % FA, 90 % ACN) and 2x 2 ml water (puriss.). The
tryptic digest was loaded slowly onto the cartridge and the flow through was loaded onto the
cartridge once more. Bound peptides were washed using 1x 3 ml washing buffer (0.1 % TFA) and 2x
2 ml water (puriss.). Peptides were eluted from the cartridge with 2 ml elution buffer. The eluates
were divided into aliquots, lyophilized and stored at -80 °C. The exact peptide concentration was
most accurately determined by amino acid analysis using the Waters Alliance 2695 HPLC/
Millenium32 software and AccQ-Fluor™ reagent for labeling (Waters Gmbh, Eschborn, Germany)
according to the manufacturer’s protocol.

Materials and Methods
36
6.10 Titanium dioxide affinity purification
Enrichment of phosphorylated peptides from complex samples was performed essentially as
described before (Mazanek et al. 2007; Schmidt et al. 2008) with slight modifications. Briefly, TiO2
material from a Titansphere column (TiO, 5µm, GL Science Inc., Tokyo, Japan) was resuspended in
equal volumes of ACN and 30µl of the suspension were placed in a 1.5 ml Eppendorf vial. TiO2
material was pelleted by centrifugation for 1 min at 13,000 rpm and the supernatant was discarded.
All centrifugation steps during the enrichment were carried out at 4 °C. The TiO2 material was then
washed twice with 200 µl washing buffer (80 % ACN, 0,1 % TFA) and once with 50 µl of loading buffer
(20 % acetic acid (v/v), 20 mg/ml dihydroxybenzoic acid (DHB), 420 mM octansulfonic acid (OSA),
0.1 % HFBA (v/v)). Peptide fractions from SCX chromatography were mixed 1:1 (v/v) with 2x loading
buffer, added to the prepared titanium dioxide material, vortexed and incubated for 20 min at 4 °C
with slight agitation. Samples were washed twice with 50 µl washing buffer. Subsequently, 50 µl
elution buffer (50 mM ammonium dihydrogen phosphate adjusted to pH 10.5 with ammonium
hydroxid solution) were added to each sample followed by incubation for 10 min. After adding 50 µl
ACN to the samples, the resulting suspensions were loaded onto a 200 µl pipette tip supplied with a
C8 plug (3M, Neuss, Germany) and peptides were eluted by applying pressure with a syringe. Eluates
were put on ice, acidified with 8 µl TFA and solvent was removed in vacuo.
6.11 Bioinformatics
Analyses of MS data derived from protein and peptide standards and from proteins of the
mouse olfactory epithelium.
For MS/MS data accuired on the Q-Star, Q-Trap or the HCT Plus mass instrument, the respective peak
lists were uploaded to ProteinScape 1.3. Protein identification was performed using two search
engines: Mascot v.2.0.04 ((Perkins et al. 1999); www.matrixscience.com) and SEQUEST
(TurboSEQUEST - PVM Slave v.27 (rev. 12),(Eng et al. 1994)). Peaklists were correlated with the IPI
mouse database v.3.15 (68,236 protein entries) for mouse olfactory epithelium samples and the NCBI
database (version 2006) for standard proteins. In general, proteins were considered as being
confidently identified, if at least two peptides were identified by both search engines and with
protein MASCOT scores higher than 90 or Sequest scores higher than 10.

Materials and Methods
37
Peak lists of standard peptide were searched using Mascot in combination with a small database
containing only the sequences of the available standard peptides. The relative intensities of the
standard peptides identified in each sample were determined using the XCalibur software v1.4.
Qualitative phosphoproteomics data analysis
Protein identification was performed by correlating peaklists to an IPI_human_decoy database using
the Mascot search engine v.2.2. The IPI_human_decoy database (shuffled) was generated from the
IPI human database v.3.61 (82,631 proteins) using an in-house built software (Reidegeld et al. 2008).
Peaks lists from low resolution MS measurements on the HCT instrument were generated using the
Data Analysis 4.0 (Built 234) software (Bruker Daltonics, Bremen Germany) with default settings,
thereby producing separate peaklist files (.mgf format) for CID and ETD spectra. Peaklists were
uploaded to the ProteinScape 1.3 platform (Bruker Daltonics, Bremen Germany) and database
searches were performed using the following settings: tryptic specificity with max. 2 missed
cleavages; variable modifications: oxidized methionine and phosphorylation on serine, threonine and
tyrosine; precursor mass tolerance of 1.2 Da and fragment mass tolerance of 0.3 Da. Searches for
ETD and CID data were performed separately with the specific fragmentation technique marked in
the search parameters. Subsequently proteins were assembled based on peptide sequence
information retrieved from CID and ETD spectra using the Protein Extractor tool within ProteinScape
1.3. For protein identification, only peptides with a Mascot score of 20 or higher were considered.
The resulting protein lists were cropped to give a false discovery rate (FDR) of 5%. In order to provide
a measure for the correctness of phosphorylation site assignment, the SLoMo tool was employed
(Bailey et al. 2009). Mascot result files were exported in pepxml format and all entries with Mascot
Scores smaller than 20 were marked as not identified for further analyses using an in-house modified
export routine. Pepxml files were processed with SLoMo allowing a mass tolerance of 300 ppm.
Simple phosphorylation site assignments were generally classified as confident sites. Phosphorylation
site assignment in peptides with multiple possible localizations was only classified as confident with a
SLoMo Score of at least 19. Both, protein and peptide identification results and results of
phosphorylation site assignment using SLoMo were submitted to the PRIDE database (Vizcaino et al.
2009); Pride accession number 13396-13397).
Peaklists from high resolution measurements on an LTQ-Orbitrap instrument were generated using
the Bioworks software v.3.3.1 for .dta file creation, which were subsequently merged to a single .mgf
file by a pearl script (merge.pl, www.matrixscience.com/help/instruments_xcalibur.html). The
resulting .mgf files were uploaded to ProteinScape 1.3 and searched using Mascot applying with the
same parameters as described abouve for low resolution data, but with a precursor mass tolerance
of 4 ppm and a fragment mass tolerance of 0.4 Da. A FDR of 5 % was applied to resulting protein lists.

Materials and Methods
38
For the global study of phosphoproteomces, high resolution LTQ-Orbitrap data was evaluated using
the software MaxQuant 1.0.13.8 (Cox and Mann 2008). Data analysis was performed with default
settings unless otherwise stated. For database searches the following settings were applied:
precursor mass tolerance: 4 ppm; fragment mass tolerance: 0.4 Da; tryptic specificity with max. 2
missed cleavages; variable modifications: oxidized methionine and phosphorylation on serine,
threonine and tyrosine. A FDR of 1% was applied at the modified peptide, peptide and protein level
and the “keep low scoring peptides” option was discarded. Only phosphorylated peptides with a PEP
value <0.1 were considered as being confidently identified and the site of phosphorylation was
classified correct, if the Localisation Probability Score was at least 0.75.
Quantitative phosphoproteomics analysis: MaxQuant and XICs
Data evaluation was done using the software MaxQuant 1.0.13.13 , generally with the same settings
as before (this page) , but with slight modifications concerning the quantification of SILAC triplets: In
the Quant module SILAC label was set to “Triplets” and up to 3 labeled amino acids were permitted.
In the Identify module the “use least modified peptide” option was selected for site quantification.
The phosphopeptides, identified and quantified by MaxQuant were classified according to both their
Pep values and regulation factors. Peptides exhibiting a pep value lower than 0.01 and a regulation
factor (M/L and H/L) greater or smaller than the cut-off values determined by Box-plot analysis (see
Chapter 5.4.3) were chosen as candidate peptides.
The MS spectra of phosphopeptides, not been quantified by MaxQuant were checked manually. Non
C-terminal peptides, which seemed to be regulated, were included in the candidate list. Each
regulated phosphopeptides was at least identified in one experiment. The exact monoisotopic mass-
to-charge (m/z) ratios of different charge states observed in this replicate were noted for each light
labled peptide, together with the observed retention time in liquid chromatography and the SCX
fraction in which it was identified.
For all considered m/z values, the exctracted ion chromatograms (XICs) of the first three isotopic
peaks of each SILAc state were calculated with a mass accuracy of m/z 0.05. This was done in the raw
files of up to 5 TiO2 eluates corresponding to the respective SCX fractions for the replicates in which it
has not been identified. If the exact m/z value and an overlay of all nine XICs were observed in a 4
min time window around the formerly observed retention time, the corresponding MS spectrum was
manually inspected to ensure that the picked m/z was indeed the monoisotopic peak of the light
SILAC signal, that the charge state of the cluster was correct and that the distances between the
three SILAC clusters corresponded to the number of arginines and lysines present in the
corresponding peptide. If these criteria were fulfilled, the observed SILAC triplet was considered as

Materials and Methods
39
being present in the respective raw file, even without MS/MS identification. For these SILAC triplets
quantification was performed by integrating the calculated XICs and adding the values for the three
XICs belonging to the same SILAC state.
For positive hits, XICs were integrated and the area under the curve was summed up for the three
XICs belonging to the same SILAC state. From this, both the medium to light (M/L) and the heavy to
light (H/L) ratios were calculated. To correct for mixing errors, a correction factor was calculated
according to equations (1)-(4):
Exemplary calculation of correction factor for M/L ratios
Assumption: µ =
∑
(1)
The observed average ratio µ for correct 1:1 mixing would be µ = 0. As this is not the case, a
correction factor x was calculated as follows:
0 =
∑
(2)
0 = lnx + µ (3)
x = (4)
µ = average ratio n = number of intensity values available for given experiment M = intensity value for medium labeled peak L = intensity value for light labeled peak x = correction factor
The average M/L and H/L ratio for all three experiments was calculated using the intensities for all
labeling states given in the evidence.txt table generated by MaxQuant (Supplementary table SP 24).
These average ratios (µ) were used to calculate correction factors x and accordingly, to calculate the
normalized XIC ratios. If more than one XIC ratio was determined for one peptide (e.g. for different
charge states), a weighted average was calculated (equation 5 - 7).
wj =
(5)
S = M1 + L1 + M2 + L2 + …. + Mj + Lj (6)
ř = ∑ (7)
wj = weighting factor j = number of XIC values calculated for one peptide r = normalized ratio ř = weighted average ratio S = sum of all M and L XIC values available for one peptide
Materials and Methods
40
K-means clustering
Normalized XIC profiles were partitioned into k clusters of similar shape using K-means clustering
within the Statistica 9.0 software package (StatSoft Inc., Tulsa, USA). Profiles comprising “missing
values” were excluded from clustering. K as the number of clusters to calculate was set to 9. The
initial cluster centers were distributed equally across all profiles after sorting according to profile
distances. Each profile was assigned to the cluster with smallest distance between itself and the
cluster centre. In subsequent iteration steps, cluster centers were moved according to the previously
assigned cluster members, leading to new assignments of cluster members. Convergence was
reached if cluster membership and thus cluster centers did not change anymore. However,
convergence may not have been reached for all clusters. In this case a maximum number of 20
iterations were allowed.
Kinase motif prediction
For peptides with confidently identified phosphorylation sites, kinase motif prediction was
performed using the freely available tools NetPhosK (http://www.cbs.dtu.dk/services/NetPhosK/;
(Blom et al. 2004)) and KinasePhos (http://kinasephos.mbc.nctu.edu.tw/;(Huang et al. 2005)).
NetPhosK was executed using default parameters. The prediction with the highest score above the
threshold of 0.5 was assigned as kinase motif prediction. KinasePhos was also used with default
settings and the best hit for the respective phosphorylation site with a positive Bit Score was
accepted.
IPA analysis
The IPI accession numbers of regulated phosphoproteins have been imported to IPA Pathway
analysis (Ingenuity Systems Inc., Redwood City, CA, USA; http://www.ingenuity.com) and a core
analysis was performed. By that, the imported proteins were classified into five protein networks. For
these networks, the major functions were given by IPA according to literature information.
PhosphoSite database search
All phosphorylation sites identified confidently in the global phosphoproteomics experiment were
listed in a .csv file in the format: XXXXXXS/T/YXXXXXX together with the species used (human). Then
these sequences were subjected to a bulk sequence search using the PhosphoSitePlus (PSP) database
(http://www.phosphosite.org). This search was performed at the 20th of May. All phosphorylation
motifs declared as unknown by this search, were, together with the protein information available for
the respective peptide, doublechecked against the UniProt database (http://www.uniprot.org). If

Results
41
both databases contained no entry for the respective phosphorylation site it was considered
unknown.

Results
42
7 Results
7.1 Pro-Q® Diamond Phosphoprotein Gel Stain
The effects of octanal treatment on the protein composition of the olfactory epithelium (OE) have
been quantitatively studied by two dimensional differential gel electrophoresis (2-D DIGE) (Barbour
et al. 2008). To understand how the observed long term changes in protein abundance are procured
by the activation of olfactory receptor proteins, it is necessary to observe the early events after
receptor activation. Receptor activated signaling cascades are mostly mediated by protein
phosphorylation or dephosphorylation events (Alberts 2002). In this work, 2-D gel electrophoresis
(GE) was employed in combination with a phosphorylation specific fluorescent dye, the Pro-Q®
Diamond (Pro-Q) stain, in order to differentially detect changes in protein phosphorylation upon
olfacory receptor (OR) activation using octanal. To this end, the applicability of the Pro-Q stain was
tested using standard proteins.
Fig. 7: Pro-Q® Diamond stain. 30 µg of each standard protein were separated by 1-D gel electrophoresis and
stained with colloidal Coomassie (A) or Pro-Q® Diamond (B, C). Following Pro-Q staining, the gel was scanned
for phosphospecific fluorescence at a wavelength of 532 nm using the CY3 channel (B) and for total protein
visualization at a wavelength of 633 nm using the CY5 channel (C).
A B C
55 kDa
200 kDa
116 kDa
97 kDa
66 kDa
36 kDa
31 kDa
21 kDa
14 kDa
Glu
co
se
ox
idas
e
My
og
lob
in
Alb
um
in
α-C
as
ein
Ma
rke
r
Glu
co
se
ox
idas
e
My
og
lob
in
Alb
um
in
α-C
as
ein
Ma
rke
r
Glu
co
se
ox
idas
e
My
og
lob
in
Alb
um
in
α-C
as
ein
Ma
rke
r

Results
43
In order to investigate the applicability of the Pro-Q®Diamond stain to the specific detection of
phosphorylated proteins, the four standard proteins glucose oxidase, myoglobin, albumin and α-
casein were separated by 1-D GE and stained either with colloidal Coomassie or with Pro-Q®Diamond
(Figure 7). Pro-Q stained gels were scanned at an excitation wave length of 532 nm (CY3 channel,
Typhoon Trio Scanner, GE Healthcare, Munich, Germany). The Pro-Q®Diamond stain showed very
high specificity for α-casein, representing an highly phosphorylated standard protein, whereas no
significant fluorescence was observed for the non-phosphorylated proteins glucose oxidase,
myoglobin, and albumin (Figure 7 B). As a control, the standard proteins were additionally visualized
by colloidal Coomassie and the Pro-Q stain at a wavelength of 633 nm (CY5 channel). All proteins
were well separated and detected on the 1-D gel.
After visualization with colloidal Coomassie or Pro-Q staining, the protein bands were excised,
digested in the gel matrix using trypsin, and the resulting peptides were analyzed by nano-HPLC/ESI-
MS/MS.
Table 3: Identification of standard proteins. The standard proteins glucose oxidase, myoglobin, albumin and α-
casein were separated by 1-D gel electrophoresis and stained either with colloidal Coomassie or with Pro-Q®.
The individual protein bands were then excised, digested in the gel matrix using trypsin, and the resulting
peptides were analyzed by nano-HPLC/ESI-MS/MS using an ion trap (HCTplus), triple quadrupole (4000 QTRAP),
and quadruple time-of-flight (QSTAR XL) instrument. Protein identification was performed by database
searches using the Mascot and Sequest algorithm.
Mass spec Seq.
Coverage Peptide count
Mascot Score
Sequest Metascore
Glucose oxidase
ProQ HCT 35.7 16 911.1 104.2
Coomassie HCT 39.8 23 1213 155.2
ProQ QTRAP 19.7 11 569.5 100.2
Coomassie QTRAP 35 20 916.4 163.7
ProQ QSTAR 16.5 6 163.2 15.8
Coomassie QSTAR 39.8 17 1213 155.2
Myoglobin
ProQ HCT 45.8 9 370.8 45.6
Coomassie HCT 66 11 614 70.8
ProQ QTRAP 23.4 2 72.8 13.9
Coomassie QTRAP 33.3 5 252.8 49.8
ProQ QSTAR 20.6 2 77.7 7.8
Coomassie QSTAR 17 2 69.1 8
Albumin
ProQ HCT 21.6 16 715.1 64.1
Coomassie HCT 36.4 29 1234.1 139.2
ProQ QTRAP 18.6 12 518.9 86.1
Coomassie QTRAP 6.2 3 102.9 16.2
ProQ QSTAR 9.4 6 134.7 12
Coomassie QSTAR 23.2 20 622.5 147.1

Results
44
Mass spec Seq.
Coverage Peptide count
Mascot Score
Sequest Metascore
S1 alpha casein
ProQ HCT 54.7 13 552.4 63
Coomassie HCT 60.7 23 769.8 114.1
ProQ QTRAP 22.9 4 169.7 46
Coomassie QTRAP 56.1 13 497.8 125.3
ProQ QSTAR 11.3 --- --- ---
Coomassie QSTAR 42.5 9 296.6 54.3
S2 alpha casein
ProQ HCT 27.5 10 265.1 25
Coomassie HCT 22.5 9 231.5 26.7
ProQ QTRAP 9.2 3 83.9 8.4
Coomassie QTRAP 9.2 4 112.4 12.4
ProQ QSTAR 11.2 3 81.6 3.1
Coomassie QSTAR 3.6 1 30.7 ---
Samples were measured on three different mass spectrometers, namely HCT plus, QSTAR and
QTRAP, to compensate for mass spectrometer type specific differences. In general, Coomassie
staining resulted in better identification rates for all proteins for each mass spectrometer (Table 3). In
particular, the identification of phosphorylated peptides by all three instrument types was hampered
by ProQ staining in comparison to Coomassie stainging (Table 4).
Table 4: Identified peptides of -casein. -Casein was separated by 1-D gel electrophoresis followed by
protein staining with colloidal Coomassie or Pro-Q®Diamond. The individual protein bands were then excised,
digested in the gel matrix using trypsin, and the resulting peptides were analyzed by nano-HPLC/ESI-MS/MS
using an ion trap (HCTplus), triple quadrupole (4000 QTRAP), and quadruple time-of-flight (QSTAR XL)
instrument. Phosphorylated peptides are highlighted in blue.
Peptide (-Casein) Position z Mascot Score
Peptide (-Casein) Position z Mascot Score
Colloidal Coomassie stain (HCTplus) Pro-Q®Diamond stain (HCTplus) HQGLPQEVLNENLLR 23-37 2 37.7 FFVAPFPEVFGK 38-49 2 23.2
FFVAPFPEVFGK 38-49 2 63.7 FFVAPFPEVFGKEK 38-51 2 49.2
FFVAPFPEVFGKEK 38-51 2 39.7 YLGYLEQLLR 106-115 2 53.6
DIGSHPO3ESHPO3TEDQAMOxEKIK 58-73 2 42.8 EPMIGVNQELAYFYPELFR 148-166 2 43.6
DIGSHPO3ESHPO3TEDQAMEKIK 58-73 2 45.9
DIGSHPO3ESTEDQAMOxEKIK 58-73 2 45
HIQKEDVPSER 95-105 2 60
EDVPSER 99-105 2 29.3
YLGYLEQLLR 106-115 2 63
YKVPQLEIVPNSAEER 119-134 2 50.6
VPQLEIVPNSAEER 121-134 2 43.4
EGIHAQQK 140-147 2 37
Colloidal Coomassie stain (Q-Trap) Pro-Q®Diamond stain (Q-Trap) HQGLPQEVLNENLLR 23-37 2 37.7 FFVAPFPEVFGK 38-49 2 23.2
FFVAPFPEVFGK 38-49 2 63.7 FFVAPFPEVFGKEK 38-51 2 49.2
FFVAPFPEVFGKEK 38-51 2 39.7 YLGYLEQLLR 106-115 2 53.6

Results
45
Peptide (-Casein) Position z Mascot Score
Peptide (-Casein) Position z Mascot Score
DIGSHPO3ESHPO3TEDQAMOxEDIK 58-73 2 42.8 EPMIGVNQELAYFYPELFR 148-166 2 43.6
DIGSHPO3ESHPO3TEDQAMEDIK 58-73 2 45.9
DIGSHPO3ESTEDQAMOxEDIK 58-73 2 45
HIQKEDVPSER 95-105 2 60
EDVPSER 99-105 2 29.3
YLGYLEQLLR 106-115 2 63
YKVPQLEIVPNSAEER 119-134 2 50.6
VPQLEIVPNSAEER 121-134 2 43.4
EGIHAQQIK 140-147 2 29.1
EPMOxIGVNQELAYFYPELFR 148-166 2 37
Colloidal Coomassie stain (Q-Star) Pro-Q®Diamond stain (Q-Star) FFVAPFPEVFGK 38-49 2 42.7 FALPQYLK 189-196 2 31.1
DIGSHPO3ESTEDQAMOxEDIK 58-73 2 36 AMKPWIQPK 204-212 2 18.8
EDVPSER 99-105 2 25.2 TKVIPYVR 213-220 2 31.8
YLGYLEQLLR 106-115 2 61
EGIHAQQIK 140-147 2 24.2
Subsequent to the analysis of standard proteins, lysates of mouse OE after the treatment with
octanal or without treatment (control) were analyzed by 2-D PAGE and Pro-Q®Diamond staining. For
this purpose, 2-D gels with the dimensions 9 cm x 6 cm and a capacity of 40 µg protein were used as
described in Materials and Methods (Figure 8).
Fig. 8: Comparative analysis of protein lysates of mouse olfactory epithelium (OE) after treatment
with the odorant octanal or without treatment (control). 40 µg of protein lysates from OE of a control
mouse and a mouse treated with octanal for 10 min were separated by 2-D PAGE and subsequently visualized
with the Pro-Q®Diamond phosphospecific stain. By comparing the staining patterns, octanal-induced changes
in the abundance of some proteins could be observed, presumably indicating protein phosphorylation (C) and
dephosphorylation events (B), whereas other protein spots remained unchanged.
(A)
(B)
(C)

Results
46
Application of 2-D PAGE combined with the Pro-Q phosphospecifc stain allowed the detection of
changes in (phospho)protein spot pattern of control and octanal-treated OE. While comparison of
spot pattern revealed no differences in intensities for the majority of protein spots (Figure 8 A), a
small set of proteins spots, however, showed significantly more intense (Figure 8 C) or weaker
(Figure 8 B) staining after octanal treatment. The experiment was repeated and 28 differentially
stained spots were excised followed by MS analysis for protein identification (Figure 9).
2 pI 11 2 pI 11
Fig. 9: Comparative 2-D gel analysis of proteins from octanal-treated mouse olfactory epithelium (OE) and
control OE. 40 µg of protein lysates from octanal-treated (10 min) and control OE were separated by 2-D PAGE
and subsequently visualized with the Pro-Q®Diamond phosphospecific stain. Subsequently, 28 differentially
stained protein spots were excised and prepared for mass spectrometric analysis.
Protein spots 1 - 20 and 21 – 28 were analyzed by nano-HPLC/ESI-MS/MS on a Q-Trap 4000 and a
HCT plus ion trap instrument, respectively. The protein identification results are summarized in
Table 5, detailed information can be found in Supplemental Table SP 25. Use of the HCTplus ion trap
instrument generally allowed peptide analyses of higher sensitivity, resulting in improved protein
identification rates with both higher Mascot and Sequest scores. In total, 18 protein spots (64 %)
were successfully identified. Amongst these, vimentin (spots 22 and 23) and mortalin (spot 16) were
previously reported in a quantitative 2-D DIGE study of mouse OE treated with octanal on a longer
time scheme (Barbour et al. 2008). In addition, heat shock (spot 2 and 8) and cytoskeletal (spots 11,
19, 20, 24) proteins were found to be differentially stained by the Pro-Q dye, which belong to protein
groups regulated by long term octanal treatment (Barbour et al. 2008). However, no phosphorylation
site could be identified in any of the identified proteins.
1
2 3 4 5
6
7 8
9 10
16 17
12 13 14
11
15 18
19 20 21
25 26
27 28
SDS
- P
AG
E
24
24
21 22
(A) (B)

Results
47
Table 5: Identification results from Pro-Q stained minigels. Identification results of spots excised form Pro-Q
stained 2-D gels are listed in this table. Protein names and NCBI accession numbers are specified as well as
protein scores from Sequest and Mascot database searches.
# Spot NCBI Accession Number
Protein Name Sequest Score
Mascot Score
1 n.i. n.i. - -
2 gi|40556608 heat shock protein 1, beta 21.9 290.2
3 n.i. n.i. - -
4 n.i. n.i. - -
5 gi|63101587 aconitase 2, mitochondrial 29.6 241.3
6 n.i. n.i. - -
7 n.i. n.i. - -
8 gi|32822907 pcx protein 3.7 97
9 gi|20810077 matrin 3 11.6 87.9
10 gi|6678499 UDP-glucose dehydrogenase 25.7 219.3
11 gi|16303309 type II keratin 5 26.6 230.6
12 n.i. n.i. - -
13 n.i. n.i. - -
14 n.i. n.i. - -
15 n.i. n.i. - -
16 gi|14917005 stress-70 protein, mitochondrial precursor (mortalin) 40.9 340.7
17 gi|42542422 heat shock protein 8 39.6 336.4
18 gi|293689 lamin B 7.9 214.5
19 gi|114145561 keratin type 2, cytoskeletal 8 87.4 736
20 gi|114145561 keratin type 2, cytoskeletal 8 51.1 539.4
21 gi|23272966 Atp5b protein 74 1283.9
22 gi|2078001 vimentin 88.2 1012.3
23 gi|2078001 vimentin 101.9 1158.6
24 gi|532610 cytokeratin 96.9 1239.7
25 gi|34395632 long palate, lung and nasal epithelium carcinoma associated protein 3 precursor
36.7 367.8
26 gi|56237988 sec14-like 3 41.4 428.8
27 n.i. n.i. - -
28 gi|6671569 acidic ribosomal phosphoprotein P0 35.8 346.5
n.i.; not identified
Although 2-D PAGE combined with Pro-Q staining appeared to facilitate the specific detection of
phosphoproteins for differential analysis, subsequent MS/MS-based identification of the respective
phosphorylated peptide species was significantly hampered. Moreover, specific information about
the localization of phosphorylation sites could not be obtained. A further major drawback of the
phosphoproteomics approach reported here was the limited reproducibility in terms of spot
intensities and the overall quality of the stain within biological replicates as exemplified in Figure 10.
Such staining variability could not be prevented, although at all times staining was carried out strictly
according to the same protocol.

Results
48
Fig. 10: Reproducibility of Pro-Q diamond staining. Pro-Q staining of OE lysates separated by 2D
electrophoresis was not reproducible. The intensity of visualized spots (A and B) varied in biological replicates
as well as the quality of the staining itself (C).
As the quantification of changes in protein phosphorylation level using the Pro-Q stain is done on the
basis of staining intensity via image analysis, low background staining and reproducible staining
quality is essential to ensure reproducible detection and quantification. Furthermore, protein spots
with observed changes in staining intensity have to be identified by MS to confirm the identity of the
given protein. Moreover, the changes at particular phosphorylation sites within the protein have to
be identified by MS in order to analyse the underlying signaling processes. However, neither the
staining quality of the Pro-Q stain was sufficient to ensure reproducible quantification nor the MS
anaylsis of phosphopeptides from differentially stained proteins spots was possible. Thus, the Pro-Q
staining appeared not to be applicable for a phosphoproteomics study of octanal treated mouse OE.
In addition, some 2-D gels of biological replicates from OE of octanal treated mice, which showed
good quality Pro-Q staining, revealed significant differences in overall staining intensity. Total protein
staining of biological replicates of OE from treated mice however, revealed similar spot patterns
(Supplementary Figure SP 1). Therefore, the sample preparation itself might not have been
reproducible on the phosphorylation level.
A B C

Results
49
7.2 Establishment of a gel free phosphoproteomics workflow
As an alternative phosphoproteomics workflow, a gel-free MS-based strategy, employing strong
cation exhchange (SCX) chromatography and titanium dioxide (TiO2) enrichment, was chosen. In
order to establish this gel-free phosphoproteomics workflow, lysates of LNCaP cells were used as a
complex standard protein mixture. Thereby, the biological system, which is designated for the final
study of signaling pathways following the activation of PSGR, was likewise used for method
establishment. For method development, LNCaP cells were stimulated using sodium orthovanadate
(OV). As OV is a potent tyrosine phosphatase inhibitor, such a treatment leads to continuous
activation of several signaling cascades and to an accumulation of phosphorylated proteins in the cell
(Samet and Tal 2010). Hence, a highly phosphorylated protein sample was provided.
The entire gel-free phosphoproteomics workflow is depicted in Figure 11. In this strategy, lysates of
OV treated LNCaP cells are prepared and proteins are directly digested using trypsin as proteolytic
agent. Following the removal of salts, the complex protein mixture is separated by SCX
chromatography. Subsequently, phosphopeptides are further enriched from SCX fractions applying
TiO2 affinity chromatography and then characterized by LC/MS/MS combined with bioinformatics
analysis.
Fig. 11: Planned gel free phosphoproteomics workflow. LNCaP cells were treated with orthovanadate and
proteins were prepared. Resulting protein mixtures were tryptically digested in solution and desalted.
Generated peptide samples were separated using SCX chromatography with subsequent affinity enrichment for
phosphopeptides. TiO2 eluates were analyzed using mass spectrometry and adequate bioinformatics.
Orthovanadate treatment of LNCaP cells
Cell lysis and tryptic digestion
Desalting and preparation for SCX
SCX chromatography
Titanium dioxide affinity enrichment
Mass spectrometric measurements
Bioinformatic analysis

Results
50
Initial experiment using published protocols for SCX chromatography (Ballif et al. 2004) and TiO2
enrichment (Mazanek et al. 2007) only lead to the identification of 8 phosphopeptides from the first
5 SCX fractions (Supplementary Table SP6). However, none of the steps in the designed
phosphoproteomics workflow was hitherto properly established and thus, had to be thoroughly
optimized prior to addressing biological questions by application of this strategy.
7.2.1 Ortho-vanadate treatment of LNCaP cells
Orthovanadate treatment is commonly used to accumulate protein
phosphorylation in cultured cells including LNCaP cells
(Giorgianni et al. 2007; Chen, L. et al. 2010) for phosphoproteomics analysis. The accumulation of
phosphorylated proteins is generally counter regulated to restore homeostasis (Samet and Tal 2010).
Accordingly, the amount of protein phosphorylation is likely to decrease after a certain time of
activation. Thus, stimulation was carried out using 3 mM orthovanadate and a treatment duration of
10 min, as was determined to result in maximum phosphorylation (Tschapek 2008).
7.2.2 Cell lysis and tryptic digestion
For cell lysis, a 9 M urea buffer was used, containing the tyrosine
phosphatase inhibitor sodium orthovanadate, the serine and threonine
phosphatase inhibitor sodium fluoride and two competitive phosphatase
inhibitors, namely β-glycerophosphate and pyrophosphate. One the one hand, this buffer contains
no detergents, which would be difficult to remove and potentially interfere with subsequent
chromatographic or mass spectrometric analyses. On the other hand, 9 M urea has a sufficiently
denaturing effect to promote unfolding of proteins and thus, inhibition of kinases and phosphatases
in addition to the inhibitors used. To allow efficient protein digestion using trypsin, the urea buffer is
diluted 1:4. Protein digestion with trypsin is typically carried out using protein to trypsin ratios of
1:50 – 1:100, with digestion over night at 37 °C and pH 7-8. In order to preserve as many of the labile
phosphorylation sites in proteins as possible, a shorter digestion protocol would be preferable.
According to Finehout et al. (Finehout et al. 2005), the temperature optimum for trypsin activity is in
the range of 50 to 55 °C. At that temperature, however, the autolysis activity of trypsin is likewise
high. Therefore, the authors recommended to tryptically digest proteins at a temperature below
Ortho-vanadate treatment of LNCaP cells
Cell lysis and typtic digestion

Results
51
48 °C. In this work, protein digestion using trypsin was performed at 42 °C for different durations
ranging from 0.5 h to 5 h.
In Figure 12, a colloidal Coomassie stained gel is depicted, on which a lysate before digestion, after 3
hours of digestion at 42 °C and after digestion over night at 37 °C was separated. After three hours of
digestion at 42 °C no distinct protein bands are visible anymore. Therefore, this digestion regime was
chosen for further experiments.
7.2.3 Desalting and preparation for SCX
After protein digestion, the resulting tryptic peptides resided in a 2.2 M
urea buffer. Thus, peptides had to be desalted before separation by SCX
chromatography. For that purpose, an Oasis HLB Cartridge, which was
used in similar studies before (Gruhler et al. 2005; Boja et al. 2009), was employed according to the
manufacturer´s protocol. 1 mg of cell lysate was digested with trypsin for 3 h at 42 °C and
subsequently desalted. Each step of the desalting procedure was monitored by taking 1/100 of the
sample amount for amino acid analysis (ASA) and another 1/100 of the sample for HPLC analysis. The
samples collected from the desalting procedure carried out according to the manufacturer´s protocol
were analyzed using nano-HPLC. The intensity of the UV trace of the complete digest before
desalting was high, confirming high peptide content in the digest (Figure 13 A, black UV trace). Some
peptides were eluted from the cartridge during washing steps (Figure 13 A, red UV trace), but nearly
no peptides were detectable in the UV trace after elution (Figure 13 A, blue UV trace), demonstrating
immense sample loss during the desalting procedure. In addition, in the original protocol, methanol
was used as organic solvent for the elution of the peptides from the cartridge. However, since
methanol is difficult to remove in vacuo leading to prolonged desiccation of the sample and thus, loss
of labile phosphorylation sites in proteins, alternative solvents were tested.
M L 3h M ON
Fig. 12: Efficiency of the short digestion protocol. To
the lanes from left to right, the following was applied:
M = protein marker, L = 10µg of an LNCaP lysate, 3h
tryptic digest of LNCaP cells carried out for 3 hours,
M = protein marker, ON = tryptic digest of LNCaP
lysate, which was carried out over night. The 1D PAGE
gel was stained with colloidal Coomassie staining.
116 kDa 97 kDa 66 kDa
55 kDa
36 kDa
31 kDa
21 kDa
14 kDa
Desalting and preparation for SCX

Results
52
Fig. 13: Optimization of the desalting protocol prior to SCX chromatography. Samples were
collected throughout the desalting procedure, using the protocol suggested by the manufacturer (A) and
the refined protocol (B) and analyzed by nano-HPLC. Using the manufacturer´s protocol, high UV absorbance
and thereby peptide content could only be detected in complete digests before desalting (black trace) and to
some extend in the washing step, but not in the eluates. Using the refined protocol, peptide intensities
detected before (blue trace) and after (red trace) desalting were nearly the same and no peptide signals could
be detected in wash and flow-through.
The refined desalting protocol using acetonitrile (ACN) instead of methanole and trifluoroacetic acid
(TFA) instead of formic acid (FA) in washing buffers was also inspected using nano-HPLC (Figure 13 B).
Here flow-through and wash fractions showed no detectable peptide content, whereas the elution
sample showed similar UV intensities (Figure 13 B, red trace) than the complete digest before
desalting (Figure 13 B, blue trace), indicating nearly complete recovery after desalting.
The use of TFA instead of FA in all but the elution solution prevented sample loss during loading and
washing. Methanol was replaced by acetonitrile which resulted in much better recovery (Figure 13 B)
and shorter desiccation duration. The total recovery by the optimized protocol according to ASA
measurements was 60-70 %. In addition, the refinement of digestion and desalting steps lead to an
increase in phosphopeptides, which could be detected by MS after sample preparation
(Supplementary Table SP 7).
A B

Results
53
7.2.4 SCX chromatography
For the identification of a high number of phosphorylated peptides,
efficient prefractionation of complex peptide samples is required.
To this end, SCX chromatography was employed prior to further phosphopeptide enrichment
followed by mass spectrometric analysis. First experiments with a two solvent system (solvent A: 10
mM KH2PO4, pH 2.7; solvent B: 10 mM KH2PO4, 1 M KCl, pH 2.7) running a linear gradient from 0-100
% B, showed inefficient separation, as most peptides eluted in the first half of the gradient. On this
account, 0.5 M KCl was used in solvent B in combination with a two step gradient (0-50 % in 60 min,
50-100 % in 10 min) for further experiments. As a result, resolution was significantly improved.
Beyond that, other buffer systems using ammonium acetate, for example, were tested. Nevertheless,
the phosphate buffer system with 0.5 M KCl in solvent system B was found to provide highest
resolution of SCX chromatography for peptide separation. For identification results and peptide
distribution in SCX chromatography for 1 M and 0.5 M KCl in solvent B, please refer to
Supplementary Tables SP 12 and SP 13, respectively. Tryptic peptides generated from an LNCaP cell
lysate were typically loaded at isocratic conditions for 20 min prior to the gradient. This allowed
isochratic separation of the flow-through and thus, separation of a high number of phosphopeptide
species present in the flow-through. The gradient was then followed by a reequilibration step of at
least 30 min in order to provide high performance of SCX separation in the next run. Furthermore, in
order to prevent memory effects, a blank was run between two samples (Supplementary Figure SP
2).
Next, phosphopeptide separation characteristics of the gradient were tested. For that purpose, a
mixture of standard peptides, consisting of phosphorylated and non-phosphorylated peptides
(Table 1, Chapter 4), were separated by SCX chromatography and 20 fractions a 6 min were collected
during the gradient. Each fraction was then analyzed by LC/MS/MS on an LCQ deca XP ion trap
instrument. The relative intensities of phosphorylated and non-phosphorylated peptides as
determined by MS analysis were summed for each fraction. As depicted in Figure 14, highest
intensity of phosphorylated standard peptides was observed in the first fractions (fraction 2-7;
gradient time 6 – 42 min) except for the histidine-containing peptide SSRTpSHEYGRK. This is in
accordance with the fact that peptides with additional basic residues elute in later fractions due to
their higher net charge state. In contrast, the summed relative intensities of non-phosphorylated
peptides measured in MS survey scans were highest in later fractions (fraction 10 -13, gradient time
SCX chromatography

Results
54
60 – 78 min). These data confirmed an overall good separation between phosphorylated and non-
phosphorylated peptide species in the gradient. 5
Fig. 14: SCX separation of standard peptides. 20x 6 min fractions of a SCX separation of standard peptides
were analyzed on the LCQ deca XP. The summed intensity of phosphorylated (dark blue) and non-
phosphorylated peptides (light blue) in each fraction is shown here. The separation of phosphorylated and non-
phosphorylated standard peptides by the optimized SCX conditions showed the expected distribution with
phosphorylated peptides eluting predominantly in early fractions (2 – 7). The histidine containing
phosphopeptide SSTRpSHEYGRK eluted with high intensities in later fractions due to its higher net charge state.
The distribution of non-phosphorylated peptides was focused on later fractions (10 - 13).
In addition, 100 µg of tryptic peptides derived from an LNCaP lysate were separated via SCX
chromatography. 20 fractions a 6 min were collected throughout the gradient (120 min with
subsequent 30 min reequilibration) and the resulting peptide fractions were analyzed by LC/MS/MS
employing CID for peptide fragmentation on an HCT Ultra PTM ion trap instrument. In Figure 15, the
number of peptides identified in a single fraction as well as in two and three individual fractions is
shown. Since most peptides were only identified in a single fraction, good resolution of the optimized
SCX gradient was demonstrated.
Fig. 15.: Separation performance of SCX chromatography. 20 fractions of a SCX run were analyzed using
the HCT Ultra PTM mass spectrometer. Most peptides were only identified in a single fraction, therefore a
sufficient resolution of the SCX setup can be assumed.
0
50
100
one fraction two fractions three fractions
# o
f p
epti
des
fraction number

Results
55
7.2.5 Titanium dioxide affinity enrichment
To further improve the detection and identification of phosphorylated
Peptides by mass spectrometry, SCX fractions were subsequently enriched
for phosphopeptides using titanium dioxide (TiO2) affinity chromatography.
Initially, TiO2-based enrichment of phosphopeptides was carried out according to the protocol
published by Mazanec et al. (Mazanek et al. 2007) and tested with a standard mixture of
phosphorylated and non-phosphorylated peptides (Table 1, Chapter 4). Samples were taken from the
flow-trough, wash steps and eluates and analyzed by LC/MS/MS on an LCQ XP ion trap instrument.
From this relatively simple mixture, phosphopeptides could be selectively enriched and subsequently
detected, even when using minute sample amounts of 0.1 fmol per peptide (Table 6). However, the
enrichment of phosphopeptides from SCX fractions of tryptic digests of LNCaP cell lysates resulted in
the identification of only 34 phosphopeptides (Supplementary Table SP 8). Presumably, the
phosphate buffer used in SCX chromatography interfered with TiO2 affinity chromatography for
phosphopeptide enrichment.
Table 6: Peptide idenfied in samples for different steps of the TiO2 enrichment procedure. TiO2 affinity
enrichment was conducted for different concentrations of a standard peptide mixture and samples were taken
from the flow-through, wash and eluate steps. Phosphopeptides (red) could be selectively enriched and
subsequently detected by LC/MS/MS for all concentrations down to 0.1 fmol per peptide.
Thus, different commercially available desalting 10 µl pipette tips were tested: PerfectPure-C18
(Eppendorf, Hamburg, Germany), C18 ZipTip® (Millipore, Billerica, MA, USA) and Omix® (Varian, Inc.
Santa Clara, CA, USA) the peptide recovery was determined using amino acid analysis (Aminosäure
Analyse (ASA)). Due to low reproducibility of peptide recovery after sample desalting using
commercially available pipette tips with C18-material, the published TiO2 protocol (Mazanek et al.
Peptide concentration
Peptides identified in Eluates
Peptides identified in wash step
Peptides identified in Flow-through
40 fmol 1212, 1461, 1462 1544 1211
20 fmol 1212, 1544, 1464, 1461,
1462, 1448 1544 1211
10 fmol 1212, 1544, 1464, 1461,
1462 1544, 1211 ---
5 fmol 1212,1544, 1461, 1462 --- ---
1 fmol 1212 --- ---
0.1 fmol 1212, 1461, 1462 --- ---
Titanium dioxide affinity enrichment

Results
56
2007) was refined to allow for efficient enrichment of phosphopeptides from SCX fractions. In the
refined method reported in this work, SCX fractions were diluted 1:1 with doubly concentrated
loading buffer, thereby decreasing phosphate concentration to 2.5 mM, nearly a tenth of the
concentration used before. Beyond that, a batch protocol was established and tested, in which the
TiO2 material was separated from the solutions by pelleting the material by centrifugation rather
than using self packed TiO2 coulmns as in the original protocol. For the refined batch protocol, a
refined loading solution composition (Schmidt et al. 2008) was used. When this protocol was used for
the phosphopeptide enrichment from 5 SCX fractions, 93 unique phosphopeptides were identified
(Supplementary Table SP 9). Thus, with the refined protocol over 10-times more phosphopeptide
could be identified than with the initial protocol.
7.2.6 Mass spectrometric analysis
Application of conventional CID techniques for fragmentation of
phosphorylated peptides provides MS/MS spectra, which typically
contain many fragment ions from neutral losses and only a small
number of sequence-informative fragment ions ((Boersema et al. 2009), chapter 2.5.3). Therefore,
for efficient MS-based phosphopeptide analysis, alternative fragmentation techniques were
established in this work. To this end, electron transfer dissociation (ETD) of (phospho)peptides on the
HCT Ultra PTM ion trap instrument was used.
Fig. 16: CID versus ETD fragmentation. SCX fractions of an LNCaP peptide separation were measured using the
HCT Ultra instrument with CID and neutral loss triggered ETD fragmentation. The CID spectrum of the
phosphorylated peptides (ASHSESPSLQSK) x HPO3 (A) showed dominant neutral loss fragments and little
fragments with sequence information. Furthermore, the phosphorylation site could not be determined. ETD
fragmentation of the same peptide (B) resulted in far more complete fragmentation allowing for sequence
determination and correct localization of the phosphorylation site.
Mass spectrometric analysis
(A) (B) [ ]HPO3

Results
57
In order to evaluate CID and ETD fragmentation of phosphopeptides, one half of the first 5 SCX
fractions of a separation of 200 µg of peptides from LNCaP lysate were analyzed using the HCT Ultra
instrument with CID and neutral loss triggered ETD fragmentation (Supplementary Table SP16).
Peptides which resulted in dominant neutral losses in CID fragmentation were therefore triggered for
ETD fragmentation, which resulted in better identified by ETD through more complete sequence
coverage as exemplified in Figure 16. However, as ETD fragmentation works best for highly charged
long peptides (Wiesner et al. 2008), smaller doubly charged peptides resulted mainly in poor ETD
fragmentation spectra. In these cases, CID fragmentation spectra still resulted in better identification
results.
The other alternative fragmentation technique is multistage activation (MSA) on a LTQ Orbitrap
instrument. To evaluate MSA fragmentation, the other half of SCX fractions was analyzed using MSA
fragmentation on a LTQ Orbitrap instrument. The resulting spectra were compared to CID spectra
from the same peptide measured previously on the HCT Ultra instrument.
Fig. 17: CID versus MSA fragmentation. The second half of the previously used SCX fractions was analyzed
using the LTQ Orbitrap instrument with MSA fragmentation. Resulting spectra were compared to CID spectra of
the same peptide measured using the HCT Ultra (A). Peptides, which provided CID spectra with dominant
neural losses and little sequence information (A), resulted in MSA spectra, which show complete fragmentation
and which allowed for the exact determination of phosphorylation site localization (B).
MSA fragmentation also led to more complete fragmentation of phosphopeptides, whose CID
spectra were dominated by neutral loss peaks, thereby leading to more confident identification of
the peptide and the phosphorylation site within the peptide Figure 17. With the MSA technique, the
neutral loss fragments resulting from the first CID fragmentation are once more activated to facilitate
further fragmentation. However, not all possible neutral losses should be considered for MSA, as the
application of a high number of neutral loss mass selected for MSA, results in the fragmentation of
sequence containing fragments as well (Supplementary Figure SP 3). For that reason, a measurement
strategy was used on the LTQ Orbitrap, which employed MSA fragmentation using neutral loss
masses of 98, 49 and 32.6 m/z, resembling the loss of one and two times phosphoric acid for doubly
charged and the loss of one time phosphoric acid for triply charged precursors.
(A) (B) [ ]HPO3

Results
58
When the phosphopeptides identified from the two mass spectrometric anaylsis regimes were
compared, the overall number of identified phosphopeptides was in the same range for both
methods (Figure 18). For further details on identification results please refer to Supplementary Table
SP 16.
Fig. 18: Comparison of the combination of CID with neutral loss triggered ETD using the HCT Ultra PTM versus
MSA fragmentation on the LTQ Orbitrap. Both analysis regimes identify a similar amount of peptides but with
surprisingly low overlap, demonstrating that these techniques are highly complementary.
The overlap between the identified phosphopeptides however, was very small with only 7
phosphopeptides, which were identified by both methods. This demonstrated that both
fragmentation techniques are highly complementary.
7.2.7 Bioinformatics analysis
In order to not only identify a high number of phosphorylated
peptides but also to accurately determine phosphorylation sites
in proteins, bioinformatic tools specifically tailored to the analysis of large-scale MS/MS datasets
have to be applied. Employing the multistep MS-based phosphoproteomic strategy reported in this
work, large MS/MS data sets from two different instruments with complementary fragmentation
techniques (i.e. NL-triggered ETD and MSA) are produced. At the same time, no suitable
bioinformatics strategy was available to allow both reliable phosphopeptide identification and
accurate phosphorylation site localization from such datasets. To address this shortcoming, two
different software platforms were adopted. For the analysis of LTQ-Orbitrap-MSA data, the
MaxQuant software (Cox and Mann 2008) was applied, while for HCT Ultra CID/ETD data,
ProteinScape 1.3 was used. Using the MaxQuant software, (phospho)peptides were automatically
identified based on database searches using the Mascot algorithm, which eventually enables protein
identification. In addition, Stable Isotope Labeling by Amino acids in Cell culture SILAC-labeled
proteins can readily be quantified using this software package. A further unique feature is the
Bioinformatics analysis

Results
59
calculation of a phosphosite-specific score, which provides a quantitative measure for the accuracy of
phosphorylation site localization in proteins. For the HCT data set comprising low resolution CID and
ETD spectra, no such advanced software solution providing a phosphosite-specific score was
available. Generally, sequence-specific information from CID and ETD spectra is highly
complementary, likely resulting in higher peptide identification rates. However, using common
search engines, CID and ETD spectra cannot be searched against a database in a single run. In this
work, peptide identification results from CID and ETD spectra were therefore combined using the
Labour and Information Management System (LIMS) ProteinScape 1.3. Furthermore, a MASCOT cut-
off score of 20 was set for peptide identifications based on low-resolution CID and ETD spectra. As a
result, the accuracy of peptide and thus, protein identification was increased.
To evaluate the correlation between the Mascot score and the quality of the acquired fragmentation
spectra, 14 fractions of an SCX separation of 200µg of LNCaP cells were analyzed on the HCT Ultra ion
trap instrument alternately subjecting each precursor to CID and ETD experiments. Subsequently,
both data sets were searched against the IPI_human database (v 3.61) using Mascot (for
identification results see Supplementary Table SP 11). As shown in Figure 19, the obtained Mascot
scores increased with peptide length. This effect was even more pronounced for ETD than for CID
spectra. Furthermore, Mascot scores were usually lower for ETD than for CID spectra, although the
quality of spectra was comparable. At this point, it has to be pointed out that both precursor ions
and the respective charge-reduced precursor species are highly abundant in ETD spectra and thus,
largely account for the total intensity of the spectrum. As the Mascot score is partially dependent on
how much of the overall intensity can be explained by assigned fragment ions (while precursor
species are disregarded), the intensity coverage for ETD spectra is typically lower than for CID
spectra, providing a likely explanation for the lower scores assigned.

Results
60
Fig. 19: Mascot Scores of CID and ETD spectra. Peptides from a LNCaP cell lysates were separated using SCX
chromatography. 14 fractions were analyzed on the HCT Ultra mass spectrometer using alternating CID and
ETD fragmentation. After database searching, MASCOT Scores of CID and corresponding ETD spectra were
plotted against the number of amino acids in the respective peptide. Scores tend to be higher for CID than of
for ETD spectra, although this effect levels out with increasing peptide length. In general, scores for ETD spectra
were observed to be lower than that of corresponding CID spectra.
Using ProteinScape 1.3, only one cut-off score could be set for a given protein list. As the individual
cut-off score typically differed for CID and ETD spectra, the score applied in this work was carefully
evaluated. For that purpose the dataset produced for CID and ETD MASCOT score evaluation was
subjected to protein assembly via the ProteinExtraktor tool in ProteinScape 1.3 with different cut-off
scores (Supplementary Tables SP 2 - SP 5) and a false discovery rate (fdr) of 5 % was applied. In
Table 7, the number of identified proteins and phosphopeptides for different score cut-off values is
listed. A low cut-off score limit of 15 resulted in a low number of identified proteins, which increased,
when the score cut-off was set to higher values. However, the number of identified phosphopeptides
as well as the percentage of phosphopeptides identified via ETD spectra is decreasing, when higher
score cut-off values are applied. Therefore, a global score cut-off of 20 was used in further
experiments for both CID and ETD data to ensure a high identification rate for proteins as well as
phosphopeptides. In addition, the percentage of phosphopeptides identified via ETD spectra and
therefore potential high quality spectra was highest.

Results
61
Table 7: Consequence of different ProteinExtraktor cut-off scores. The dataset of CID and ETD spectra
produced for the MASCOT score evaluation was subjected to protein assembly using the ProteinExtractor tool
in ProteinScape 1.3. For that purpose different score cut-off values were tested. The number of subsequently
identified proteins (5 % fdr) and phosphopeptides is listed as well as the percentage of phosphopeptides, which
were identified via ETD spectra.
ProteinExtraktor score cut-off
# of proteins identified (5 % fdr)
# of phosphopeptides within protein list
% of phosphopeptides identified via ETD spectra
15 476 90 19 %
20 555 36 24 %
25 623 22 7 %
30 655 11 9 %
To evaluate the assignment of phosphorylation sites in proteins, low resolution NL-triggered ETD
data acquired on the HCT Ultra PTM ion trap instrument was further analyzed using the algorithm
SLoMo (Bailey et al. 2009).This algorithm is a refinement of the AScore algorithm (Beausoleil et al.
2006) applicable to the evaluation of low resolution CID and ETD spectra. Application of a SLoMo cut-
off score higher 19 is reported to allow for phosphorylation site localization with a FDR of 5% (Bailey
et al. 2009). In this work, also a cut-off of score of 19 was applied.

Results
62
7.3 Global phosphoproteomic analysis of orthovanadate treated
LNCaP cells
The phosphoproteomics strategy established in this work was next applied to the analysis of LNCaP
cell lysates in two independent replicates. To this end, LNCaP cells were treated in vivo with
orthovanadate, providing a highly phosphorylated protein sample. In addition to the evaluation of
the established workflow for global phosphoproteomics analysis, this study aimed at improving our
current knowledge of the phosphoproteome of the human prostate carcinoma cell line LNCaP by
identifying new phosphorylations sites in protein and thus, new targets for follow-up studies.
7.3.1 Strategy for the phosphoproteome analysis of LNCaP cells
Figure 19 depicts the entire workflow for the MS-based analysis of the phosphoproteome of LNCaP
cells. At first, cells were treated with 3 mM orthovanadate for 10 min in order to inhibit tyrosine
phosphatases and therefore, to accumulate protein phosphorylation (Samet and Tal 2010).
Subsequently, cells were lysed, proteins were in-solution digested using trypsin and the resulting
peptide mixtures desalted with C18-cartridges. For each sample, the total peptide concentration was
determind using ASA and 200 µg were subjected to SCX chromatography. In total, 32 fractions à 4
min (200 ml each) were collected throughout the gradient. Of these, 15 µl were directly analyzed
either on the LTQ-Orbitrap system using MSA or the HCT Ultra PTM system with CID and NL-triggered
ETD. The remaining 185 µl of the sample were subjected to TiO2 affinity enrichment employing the
batch protocol established in this work. From the resulting TiO2 eluates, one third was then analysed
by LC/MS/MS on an LTQ-Orbitrap instrument with MSA, while the remaining two-thirds were
analysed on a HCT Ultra PTM system using both CID and NL-triggered ETD for peptide fragmentation.
High resolution data acquired with the LTQ-Orbitrap instrument were examined using the MaxQuant
software. With MaxQuant, separate false discovery rates (fdr) of 1% were applied on the protein-,
peptide- and modified peptide level to report peptide and protein identification data of high
accuracy. For phosphopeptides, a probability score was calculated, providing a quantitative measure
for the accuracy of the phosphorylation site assignment. In the work reported here, phosphorylation
sites with a score better than 0.75 were deemed confident.

Results
63
Fig. 20: Workflow used for the global phosphoproteomics study: LNCaP cells were treated with 3 mM
orthovanadate for 10 min, lysed, digested with trypsin and desalted. 200µg of tryptic peptides were separated
via SCX chromatography. 32 fractions (4min) were collected throughout the gradient. 15 µl were taken from
each fraction and measured either with the HCT Ultra PTM (Experiment 1) using CID and NL-triggered ETD
fragmentation or the LTQ-Orbitrap instrument with MSA (Experiment 2). Residual fractions were further
enriched for phosphopeptides by TiO2 enrichment and eluates were splitted: two thirds of each fraction were
measured with the HCT Ultra PTM employing CID and NL-triggered ETD and one third was measured with the
LTQ-Orbitrap instrument with MSA. High resolution data was analysed using the MaxQuant algorithm whereas
for low resolution data protein identification was achieved via ProteinScape with subsequent phosphorylation
site evaluation using the SLoMo algorithm.
For low resolution ETD data, ProteinScape 1.3 and the ProteinExtractor Tool implemented in
ProteinScape 1.3 were used to generate non-redundant protein lists, to which a FDR of 5% was
applied. In order to evaluate the correctness of phosphorylation site localization, the data was
reevaluated using the SLoMo algorithm (Bailey et al. 2009). Phosphorylation sites to which a SLoMo
score of at least 19 was assigned were deemed confident and accordingly, reported in this work.

Results
64
7.3.2 MS-based analysis of LNCaP cell lysates without phosphopeptide
enrichment
As previously described, 200 µg of tryptic digest from orthovanadate-treated LNCaP cells were
separated by SCX chromatography in two independent replicates. UV traces from SCX
chromatography are shown in Supplementary Figure 4. Due to higher backpressure, the UV trace of
experiment 2 is slightly shifted. In general, UV traces of both experiments showed a similar course
and intensity.
In the first experiment, 15 µl of each SCX fraction were then analyzed using CID and NL-triggered ETD
on the ion trap instrument, resulting in the identification of 3185 unmodified peptides and 177
(5.3 %) phosphopeptides. Based on peptide identifications, 579 proteins including 121
phosphoproteins (21 %) were assembled (Table 8, Supplementary Table SP 17). The respective
aliquots of SCX fractions from the second replicate were analysed using MSA on the LTQ-Orbitrap
instrument. As a result, 5330 unmodified peptides and 181 (3.3 %) phosphopeptides were identified,
enabling the assembly of 1709 proteins including 202 phosphoproteins (12 %) (Table 8,
Supplementary Tables SP 19 and SP 20).
Table 8: Number of identified proteins and peptides in SCX fractions
all proteins phosphoproteins all peptides phosphopeptides
Experiment 1 (HCT Ultra PTM)
579 121 (21%) 3335 177 (5.3%)
Experiment 2 (LTQ-Orbitrap)
1709 202 (12%) 5511 181 (3.3%)
While the LTQ-Orbitrap instrument using MSA as fragmentation technique generally provided
superior sensitivity in peptide and protein identification, both experimental approaches resulted in a
relatively low number of phosphopeptide identifications. Since the percentage of identified
phosphopeptides was approx. 10 % higher for the HCT ultra PTM instrument, CID and NL-triggered
ETD are presumably more effective for the identification of phosphorylated peptides from complex
samples, as this method selectively triggers additional ETD fragmentation for low quality CID spectra.
In order to evaluate the SCX performace, the charge state distribution as well as phosphopepitde
distribution was analyzed. The general SCX separation exhibited good performance in terms of
separation of different peptide charge states (Figure 20), with predominantly doubly charged
peptides in early fractions (1-8) and higher charged peptides late in the gradient (14-24).

Results
65
0
50
100
150
200
250
300
1 2 3 4 5 6 7 8 9 10 11 12 13 14 15 16 17 18 19 20 21 22 23 24 25 26 27 28 29 30 31 32
nu
mb
er o
f p
epti
des
fractions
doubly charged
triply charged
higher charged ( >3)
Fig. 21: Distribution of different charge states over SCX fractions. For all peptides identified in experiment 1
and 2, the charge state was determined. The number of peptides observed as doubly, triply or higher charged
species are depicted for each fraction. In fractions 1-7 proportionally more doubly charged peptides are
observed, whereas the proportion of higher charged peptides increases in later fractions (14-24).
At this point, it has to be noted, that charge states shown in Figure 20 are based on observations in
MS spectra and do not necessarily reflect peptide charge state in SCX chromatography. However, as
both SCX and HPLC buffers have pH values below 3.0, namely 2.7 and 2.0 respectively, all basic
aminoacids as well as the N-terminal amino acid are protonated resulting in the same positive charge
state for each peptide in both buffers. Therefore, observations from mass spectrometry data may be
a good approximation.
Although peptides were shown to be well separated according to their charge state, both separation
of phosphopeptides according to the number of phosphorylation sites and enrichment of
phosphopeptides in definite SCX fractions was barely observed (Supplementary Figure SP 5).
Nevertheless, since more than 73 % of the identified phosphopeptides were only found in one or two
adjacent fractions (Supplementary Table SP 14), SCX chromatography was deemed reasonably
effective for prefractionation of such complex (phospho)peptide mixtures.
7.3.3 MS-based anaylsis of LNCaP cell with phosphopeptide enrichment
To enrich for phosphopeptides, 185 µl of each SCX fraction from the two replicates were subjected to
TiO2 affinity chromatography. Of the resulting eluates, one third each were analysed with MSA (LTQ-
Orbitrap) and two-thirds each were analysed with CID and NL-triggered ETD (HCT Ultra PTM). The

Results
66
results are summarize in Table 9. All together, CID in combination with NL-triggered ETD
fragmentation on an ion trap led to the identification of 959 non-phosphorylated and 891
phosphorylated peptides and thereby to the identification of 633 unique proteins containing 335
phosphoproteins. The overlap between both experiments was here low with only 15 % for
non-phosphorylated and 21 % for phosphorylated peptides. With MSA on an LTQ- Orbitrap
instrument 3071 non-phosphorylated and 1310 phosphorylated peptides were identified leading to
the identification of 2084 proteins containing 726 phosphoproteins. Therefore, the MS analysis
regime employing the LTQ-Orbitrap with MSA fragmentation identified approximately twice as many
phosphopeptides and resulting phosphoproteins as the analysis regime using the HCT Ultra PTM with
CID and NL-triggered ETD. However, the overlap of the phosphopeptide sets identified by both
approaches is only 33 %, reflecting again that both methods are highly complementary. For detailed
information on identification results, please refer to Supplementary Tables SP 17 – SP 20.
Table 9: Number of proteins and peptides identified in titanium dioxide eluates. In this table the numbers of
identified non-phosphorylated peptides, phosphopeptides and the resulting numbers of identified
phosphoproteins and proteins are listed for each fragmentation technique and experiment separately as well
as the respective overlaps.
CID ETD unique in CID/ETD MSA unique all
non-phosphorylated
peptides
Experiment 1 331 47 351 1549 1830
Experiment 2 729 114 752 2104 2645
unique (overlap)
921 (15%)
151 (7%)
959 (15%)
3071 (19%)
3349 (34%)
phospho peptides
Experiment 1 384 206 488 1119 1461
Experiment 2 486 224 590 862 1320
unique (overlap)
742 (17%)
346 (24%)
891 (21%)
1310 (51%)
2095 (33%)
all proteins
Experiment 1 564 1194 1350
Experiment 2 417 1095 1105
unique (overlap)
633 (55%)
1464 (56%)
2084 (18%)
phosphoproteins
Experiment 1 173 585 648
Experiment 2 217 432 398
unique (overlap)
335 (16%)
667 (52%)
726 (44%)

Results
67
7.3.4 Comparison of mass spectrometric and bioinformatic analysis
platforms
The performance of the two different measurement regimes and the subsequent bioinformatic
analysis strategies were evaluated based on the number of the reported phosphopeptide
identifications in the two replicates (Figure 22). In experiment 1, 1119 unique phosphopeptides have
been identified using MSA on the LTQ-Orbitrap instrument and 488 with the HCT Ultra setup using
CID and NL-triggered ETD. The overlap between the sets of phosphopeptides identified by the data
derived form the two different MS analysis platforms small with only 147 phosphopeptides, which
were identified by both approaches. Within the data set generated using the HCT Ultra instrument
more phosphopeptides were identified using CID (384) fragmentation. By ETD fragmentation 206
phosphopeptides were identified, including 101 phosphopeptides have been identified by both
fragmentation techniques. In the second experiment, a similar number of phosphopeptides was
identified by the different fragmentation techniques showed and the observed overlap was in the
same range.
Fig. 22: Overlap of phosphopeptides identified by application of different fragmentation techniques in two
independent experiments. In both experiments, a large proportion of phosphopeptides was identified by MSA
on an LTQ-Orbitrap instrument. The use of CID in combination with NL-triggered ETD on an HCT Ultra ion trap
enabled the identifcation of a significantly smaller but complementary set of phosphopeptides.
,
These results again demonstrated high complementarity between all three fragmentation techniques
used in this work. In addition the analysis regime employing the LTQ-Orbitrap instrument in

Results
68
combination with MSA fragmentation provided significantly higher identification rates, than the HCT
Ultra instrument using NL-triggered ETD.
The differences between the three fragmentation techniques became more evident by examining
not the number of peptides but the number of confirmed and unconfirmed phosphorylation sites
(Figure 23). By the MSA/Orbitrap/MaxQuant workflow far more confident (1248) than unconfirmed
(320) site assignments were identified. In contrast, the workflow using CID and ETD on the HCT Ultra
instrument in combination with ProteinScape and SLoMo resulted in similar numbers of confident
and unconfirmed phosphorylation site assignments. Thus, the MSA/Orbitrap/MaxQuant
measurement and analysis workflow turned out to provide, in addition to higher identification rates,
more confident phosphorylation site assignment.
Fig. 23: Identification rates of confident versus unconfirmed phosphorylation sites for different
fragmentation techniques. By MSA fragmentation 1248 unique phosphorylation sites could be indentified. By
CID in combination with NL-triggered ETD altogether 616 confident sites could be identified (A), resembling
approximatedly half of the number identified by MSA. The distribution for the unconfirmed sites was
significantly differend (B), with 676 unconfirmed sites identified by CID/NL-triggered ETD and with only 320
unconfirmed sites found with MSA fragmentation.
In the presented dataset 164 unique hitherto unknown phosphorylation sites could be confidently
identified in 101 different proteins. To determine, if a site is known, the PhosphoSite database
(http://www.phosphosite.org) was searched for previously reported phosphorylation sites on the
peptide level on the 20th of May 2010. 58 of these new phosphorylation sites were uniquely found
with the MSA and 93 with the HCT Ultra workflow, demonstrating the complemantarity of both
approaches (Supplementary Table SP 1). New phosphorylation sites were identified for different

Results
69
proteins with diverse functions, including kinases, transcription factors and members of the
proteasome. The distribution of proteins with newly identified phosphorylation sites into functional
categories is depicted in Figure 24.
Fig. 24: Functional categories of proteins, for which new phosphorylation sites could be identified. In the
global phosphoproteomics anaylsis of LNCaP cells, 164 hitherto unknown phosphorylation sites could be
identified in protein of diverse functions. The number of sites identified for certain functional protein
categories is depicted in this diagramm.
8
11
10
19
6 11 4
16
79
Proteasome
Ribosome
RNA-processing
Transcription/Nucleus
Protein synthesis
Kinase/Signaling
Cancer related
Cytoskeleton-associated
others

Results
70
7.4 Quantitative time-resolved phosphoproteomics to study
receptor-mediated signaling pathways in LNCaP cells
The elaborated phosphoproteomic strategy enabled the global analysis of the phosphoproteome of
LNCaP cells following treatment with orthovandate. In the part of the work presented here, a
quantitative strategy was designed in order to allow for the time-resolved study of signaling
pathways in LNCaP cells upon the activation of PSGR with β-ionon, which is a known ligand of the
PSGR (Neuhaus et al. 2009). To this end, SILAC labeling of LNCaP cells was employed followed by MS-
based phosphoproteomic analysis using the LTQ-Orbitrap system in combination with the MaxQuant
algorithm for quantitative data analysis.
7.4.1 SILAC labeling of LNCaP cells
For SILAC labeling of the proteome of LNCaP cells, the amino acids arginine and lysine were replaced
in the cell culture medium by isotopically labeled counterparts. As trypsin cleaves C-terminally after
arginine and lysine, all tryptic peptides generated from SILAC labeled proteins comprised one labeled
amino acid, except for the respective C-terminal peptide of a given protein. In this work, triple SILAC
labeling of LNCaP cells was performed using arginine and lysine in the "light" (no heavy isotopes), the
"medium" (13C6-arginine, D4-lysine) or "heavy" (13C615N4-arginine, 13C6
15N2-lysine) form. For SILAC
labeling experiments, LNCaP cells were generally passaged two times, which corresponds to two
weeks of cell culturing or approximately 8 cell doublings.
In human cell lines, arginine-to-proline conversion has been reported as predominant side reaction,
which eventually hampers accurate peptide quantification (Ong et al. 2003).
To address this issue, titration experiments using different concentrations of labeled amino acids and
unlabeled proline were performed. In Figure 24, the course of titration experiments is illustrated
taking the tryptic peptides LAVNMVPFPR (A-C) and AAVPSGASTGIYEALELR (D) from a culture labeled
with 13C6-arginine and D4-lysine as an example. Complete incorporation of the heavy labeled amino
acid in proteins was achieved at concentrations from 240 to 60 mg/l 13C6-arginine (Figure 24, A-C).
13C6-arginine is converted to 13C5-proline, resulting in satellite peaks, which are in this case m/z 2.5
appart from the doubly charged peptide peak as indicated by red arrows. Although the concentration
of labeled amino acids was reduced 4-fold in such experiments, arginine-to-proline conversion could
not be abolished.

Results
71
Fig. 25: Medium optimization to eliminate arginine to proline conversion. Reduction of arginine concentration
(A-C) lead to a decrease in heavy proline peaks. Arginine to proline conversion could, however, not be
eliminated completely. In contrast, the addition of a high concentration of proline (D) eliminated 13
C6 arginine
to 13
C5 proline conversion (D).
Therefore and due to a reduced proliferation rate of LNCaP cells observed at 60 mg/l arginine and
lysine concentration, SILAC labeling of LNCaP cells was eventually performed with an arginine and
lysine concentration of 120 mg/l and an high excess of unlabeled proline of 800 mg/l in the cell
culture medium. As a result, complete incorporation of heavy amino acids into proteins was
obtained, while omitting arginine-to-proline conversion during growth and proliferation of LNCaP
cells (Figure 24 D).
7.4.2 Quantitative time-resolved phosphoproteomic strategy
For the quantitative time-resolved phosphoproteomic study as outlined in Figure 25, triple SILAC-
labeled LNCaP cells were differentially treated with β-ionone (dilution 1:10000). To provide an
adequate control (i.e. no treatment with β-ionone; 0 min), cells labeled with "light" SILAC were mock
treated with culture medium in the incubator for 10 min. In contrast, cells labeled with "medium"
and "heavy" SILAC were treated for 2 min and 10 min with β-ionone in the incubator, respectively. To
end the treatment, cells were placed on ice and immediately washed twice with ice cold PBS buffer.
Cells were then lysed and the respective protein samples were mixed in equal ratios (1:1:1) according
(A) (B)
(C) (D)

Results
72
to protein concentration. Finally, 1 mg of total protein was in-solution digested using trypsin and 200
µg of the resulting peptide mixtures were subjected to the SCX-TiO2 workflow for phosphopeptide
enrichment established in this work followed by MSA scans on the LTQ-Orbitrap instrument and
MaxQuant data analysis. The entire experiment was independently performed three times. Prior to
quantitative phosphoproteomic experiments, the differentially labeled cells were subjected to
calcium imaging in order to ensure that such cells responded comparably to β-ionone treatment.
Fig. 26: Workflow for quantitative time resolved phosphoproteomics analysis of β-ionone treated LNCaP
cells. To study PSGR-mediated signaling, triple SILAC labelling was used to label LNCaP cells, which were then
treated for 0, 2 and 10 min with β-ionone (1:10000). Cell lysates were digested in solution using trypsin. Tryptic
peptides were separated via SCX and enriched for phosphopeptides with TiO2 affinity enrichment. Eluates were
analyzed using the Orbitrap/MaxQuant workflow. In order to ensure the responsiveness of the LNCaP cells to
β-ionone, cells of each condition were subjected to calcium imaging in every replicate.
Prior to phosphoproteomic analyses, the responsiveness of SILAC-labeled LNCaP cells to β-ionone
was confirmed by calcium imaging experiments performed by M. Osterloh at the Department for Cell
Physiology (Head Prof. Hatt; Ruhr-Universität Bochum). In Figure 26 the results of the calcium
imaging experiments are shown. In Figure 26 A a representative fluorescence trace of one singe
LNCaP cell is show. The fluorescence of cells was first recorded for 2 min. Then the cells were
stimulated with 500mM β-ionone. The magnitude of the response was measured as amplitude
between the mean fluorescence of the first 2 min and the mean fluorescence between 2.5 – 10 min.
For each replicate all SILAC states were tested prior to phosphoproteomics experiments. In
Figure 26 B, the fluorescence amplitudes for all SILAC states in all replicates are shown.

Results
73
Fig. 27: Calcium imaging results for the three replicates. In the upper panel (A), a representative fluorescence
trace for one single LNCaP cell is shown. Fluorescence was recorded for 2 min, before cells were stimulated
with 500 mM β-ionone. Stimulation start is indicated by an arrow. The response of the cell is determined by
calculating the amplitude between fluorescence before and after stimulation. In the lower panel (B), the
amplitudes of fluorescence response for all SILAC states in all three replicates are shown. Error bars indicated
the standard deviation and the number of recorded cells is stated in the respective column.
A
B
f34
0/f
38
0
f34
0/f
38
0st
imu
late
d -
f3
40
/f3
80
co
ntr
ol

Results
74
7.4.3 Phosphoproteome data of β-ionone-treated LNCaP cells
Following the completion of the treatment regime using β-ionone, LNCaP cells were processed for
the relative quantitative study of the respective phosphoproteomes applying the established
SCX/TiO2 method combined with high resolution MS using MSA scans followed by MaxQuant data
analysis. In all the three replicates, approx. 1900 proteins were identified on average, while the total
number of unique protein identifications was 3054 as summarized in Table 10. For a complete list of
data comprising detailed information on protein identification please refer to Supplementary Table
SP 21. In contrast, the number of identified phosphopeptides was about two-fold higher in replicate
3 (1062) than in the other two replicates (568 and 654).
Table 10: Overview of proteins and phosphopeptides identified in all three replicates
Replicate 1 Replicate 2 Replicate 3 Total
Protein 2051 1922 1805 3054
Phosphopeptides 568 654 1062 1154
To eventually determine significantly regulated phosphopeptides with high accuracy, the calculated
peptide intensity ratios were normalized to an average ration of one. This procedure allows
compensating for inevitable errors during mixing of the three differentially SILAC-labeled samples.
Peptide ratios and normalized peptide ratios were given by MaxQuant. In general, the normalization
procedure within the MaxQuant software is applied to each LC-MS run separately by distinguishing
between lysine- and arginine-containing peptides and using intensity bins for calculating different
normalization factors depending on peptide abundance (Cox et al. 2009). For the normalization over
all peptide ratios, the assumption is made, that the majority of peptides does not change in
abundance during treatment. Therefore, the ratio distribution for both "medium"-to-"light" (M/L)
and "heavy"-to-"light" (H/L) should center around 1. Following normalization, the data was shifted
such that the ratio distribution of M/L and H/L centered around 1 as is exemplarily shown for M/L
rations of replicate 2 in Figure 27.

Results
75
Fig. 28: Phosphopeptide ratios from experiment 2 show systematic over representation of light peptides.
Non normalized M/L ratios show an overrepresentation of light peptides, resulting in maximum in ratio
distribution at a value smaller than 1. Normalization produced led to a ratio distribution, which centered
around 1.
As expected for the treatment of LNCaP cells with β-ionone, the majority of phosphopeptides did not
change in abundance as illustrated in a binary logarithm (log2) plot (Figure 28, A). To determine the
cut-off values of intensity ratios for classifying phosphopeptides as significantly regulated, outlier
analysis using box plots was performed based on the normalized log2 ratios. The M/L ratios,
resembling the regulation of peptides after 2 min of treatment with β-ionone, were slightly less
scattered, than the H/L ratios (10 min treatment). Accordingly, ratio values were defined as outliers
by box plot analysis for values >1.54 and <0.66 for M/L ratios and >1.69 and <0.59 for H/L ratios
(Figure 28, B).
Fig. 29: Log2 ratio distribution of phosphopeptides (A) and outlier analysis using box plots (B). Ratio cut-off
values for significantly regulated phosphopeptides were determined using box plot analysis of the normalized
log2 intensity ratios (B).
0
50
100
150
200
# o
f ra
tio
s in
re
spe
ctiv
e
inte
rval
Ration M/L Rep 1
Rep 2
Rep 3
Rep 1 normalized
Rep 2 normalized
Rep 3 normalized
(A) (B)
log 2
of
rati
os
phosphopeptides

Results
76
Peptides with regulation factors above or below these cut-off scores and with a posterior error
probability (PEP) value <0.05 were considered as being both confidently identified and significantly
regulated. In addition to these 97 phosphopeptides (see Table 11), 206 phosphopeptides were
identified but not quantified by MaxQuant. Of these, 24 were C-terminal peptides comprising neither
lysine nor arginine in their sequence and thus, rendering them not quantifiable. MS spectra of the
remaining 182 phosphopeptides were manually inspected and for several of these, overlapping
isotopic peak patterns or low peak intensities was observed, thereby impeding quantification.
However, based on manual inspection of MS spectra, evidence for the presence of further
phosphopeptides with changes in abundance was obtained. These phosphopeptides likely evaded
quantification using MaxQuant due to their low abundance or coeluting peptides of similar m/z.
It has to be pointed out here that only three regulated phosphopeptides were identified and
quantified in all the three biological replicates. The majority of the remaining 94 phosphopetides
with significant changes in abundance was identified and quantified in a single replicate only.
Possible explanations for this observation could be the absence of such peptides in the respective
replicates or the absence of MS/MS data, e.g. due to the low abundance of these peptides. To
address this issue, an MS Excel-based VBA script was developed enabling to automatically search MS
raw data of all the three replicates for the accurate masses of those peptides which exhibit missing
values. In this reevaluation process, different charge states and potential missed cleavages were
considered for each peptide as well as the retention time of the given peptide as observed in the
replicate it was identified in. The extracted ion chromatograms (XICs) of each peptide were
calculated based on the first three isotopes of each of the three SILAC states applying a mass
accuracy of m/z 0.01. The presence of a peptide was confirmed, if (1) an overlay of all the nine XICs
was observed, (2) the retention time was in the range of ±2 min of the previously observed retention
time and (3) the observed and expected isotopic clusters were congruent. Confirmed peptide species
were then quantified based on the integration of the XICs. As a result, the number of peptides, which
could be quantified in all three replicates, could be increased significantly. In Figure 29 the number of
significantly regulated phosphopeptides, which could be quantified in 1, 2 or 3 replicates by
MaxQuant is depicted in dark blue. With the XIC script, a higher number of phosphopeptides could
be quantified in two or three replicates, raising the number of three times quantified
phosphopeptides from 3 to 30. For detailed information please refer to Supplementary Table SP 23,
in which all determined XIC ratios as well as all ratios calculated by MaxQuant are stated for the
regulated phosphopeptides.

Results
77
Fig. 30: Replicate quantification of peptides by MaxQuant and after XIC evaluation. Through the use of the
XIC evaluation the number of peptides, which have been quantified in all three replicates could be elevated
from 3 to 30.
In addition, the peptides suggested to be regulated by manual inspection were quantified. Thereby,
all but two peptides were eliminated from the list as not being considerably regulated. Finally 99
regulated phosphopeptides from 73 proteins were identified as being significantly regulated. All
these peptides are listed in Table 11. For each peptide the phosphopeptide ID (refers to MaxQuant
table PhosphoSTY (STY sites), Supplementary Table SP 22), the protein group ID (refers to MaxQuant
table proteinGroups, Supplementary Table SP 21) and the protein name as well as the normalized
MaxQuant and XIC-based ration for both time points are listed.
Table 11.: Significantly regulated phosphopeptides. All phosphopetides, which were found to be significantly
regulated are listed in this table. MaxQuant IDs for each phosphopeptide and the dedicated protein are listed
as well as MaxQuant and XIC-based ratios for both time points. Furthemore, the number of the cluster is given,
in which the respective peptide was sorted using K-means clustering. Additional phosphopeptides, which were
found for a given protein, but are not significantly regulated, are marked in yellow. Peptides, which have not
been quantified at all by MaxQuant but were found to be regulated by XIC analysis, are marked in blue.
Phosphopeptides, for which the protein was found to be regulated rather than the phosphorylation sites, are
marked in pink.
Phospho Peptide ID
Protein Group
Protein Names ø MQ Ratio
2 min
ø XIC ratio 2 min
ø MQ Ratio 10 min
ø XIC ratio
10 min
Cluster
14, 15 42 Uncharacterized protein KIAA1522 0.7269 0.729 0.36864 0.335 6
58 144 Gamma-adducin 0.49226 0.395
0.596 8
70 171 Ephrin-B2 0.43235 0.399 0.60178 0.764 8
83 average
192 NDRG family member 3 1.3234 1.296 1.8098 1.119 3
108 271 Cordon-bleu protein-like 1 1.63 1.425 1.4734 1.438 3
122 332 ATP-dependent helicase 1 0.8905 0.800 0.5495 0.685 2
1454 353 Ribosomal L1 domain-containing protein 1 0.56322 0.780 1.0401 0.932 1
0
20
40
60
80
100
1 2 3
Nu
mb
er
of
pe
pti
de
s
Number of replicates the peptide was quantified in
MaxQuant results
XIC evaluation

Results
78
Phospho Peptide ID
Protein Group
Protein Names ø MQ Ratio
2 min
ø XIC ratio 2 min
ø MQ Ratio 10 min
ø XIC ratio
10 min Cluster
155
358 Microtubule-associated protein 1B
0.49318 0.538 0.67488 0.827 8
151 0.53762 0.526 0.62866 0.799 8
156 other z
0.347
0.663 8
193 average
479 Ribonucleoside-diphosphate reductase
subunit M2 1.7198 1.484 1.8272 1.984 3
198, 199, 200
505 Elongation factor 2 kinase 0.85323 0.839 0.1762 0.299 6
230, 231 556 Growth factor receptor-bound protein 10 0.628 0.766 0.23898 0.196 6
247, 248, 249
594 Restin 1.6032 1.392 0.98818 0.973 2
266, 268 626 Desmoplakin 0.70428 0.752 0.53907 0.572 5
283, 284
674 Protein Shroom2
0.25502 0.924 0.37892 0.304 6
285 0.81926
0.8153
288 0.86763
0.92183
291 680 Formin-binding protein 1-like 1.5433 1.923 1.3621 1.970 3
1485 694 Eukaryotic translation initiation factor 4
gamma, 2 0.96347 1.008 0.53267 0.760 1
308 average
733 Solute carrier family 4 member 4
2.5718 2.975 1.961 2.086 7
310, 311, 1489
3.38 3.780 1.8668 13.512 7
312, 1490 3.7378 5.313 6.0838 10.992 7
322 751 Splicing factor 3 subunit 1 1.0296 0.762 0.30501 0.633 2
337
854 Sodium/hydrogen exchanger 1
0.9766
0.98518
335, 336, 1494
1.377 1.258 4.8495 4.654 7
351 887 Sodium bicarbonate cotransporter 3
1.296 1.630 3.6885 4.970 7
352, 353 1.9614
7.4879
-
376 924 Desmoyokin 0.70065 0.978 0.54608 0.846 1
385, 1499
937 Protein NDRG1
0.30428 0.374 0.52055 0.670 8
382, 383, 1498
0.49816 0.562 0.86751 0.797 8
397 954 Homeobox protein cut-like 2 0.072919
10.941
2
405, 406 971 Microfibrillar-associated protein 1 0.86546 0.968 0.54639 0.711 2
1509 1070 Oxysterol-binding protein 1 0.99574 1.061 1.6298 0.500 2
434, 435, 436, 1510
1093 Microtubule-associated protein tau 1.7823 1.420 1.4405 1.335 3
458
1216 Specifically androgen-regulated gene
protein
0.75082 0.714 0.45613 0.510 5
457 average
0.84778 0.760 0.43814 0.560 5
456 0.86254 0.705 0.41692 0.429 5
523 1378 Oxysterol-binding protein-related protein
11 2.4142 2.559 3.7158 3.920 7

Results
79
Phospho Peptide ID
Protein Group
Protein Names ø MQ Ratio
2 min
ø XIC ratio 2 min
ø MQ Ratio 10 min
ø XIC ratio
10 min Cluster
599 1575 Protein Shroom3 1.9723 1.624 0.75722 0.983 3
606 1591 DNA repair protein complementing XP-C
cells 0.61455 0.989 0.96208 0.967 1
619 1607 Oxysterol-binding protein-related protein 8 0.72935 0.795 0.59206 0.546 5
623, 1559 average
1611 mRNA-decapping enzyme 1A 0.60635 0.728 0.82668 0.792 1
650 1646 Echinoderm microtubule-associated
protein-like 3 0.46296 0.790 0.19637 0.741 1
663 1681 NFATC2-interacting protein 0.60598 0.510 0.56536 0.484 5
683 1717 E3 ubiquitin-protein ligase HUWE1 1.5682 1.054 1.4328 1.280 3
684, 1570
1718 Insulin receptor tyrosine kinase substrate
0.75009 1.041 0.33179 0.680 2
685 average
0.81894 1.009 0.54054 0.478 2
714 1767 La-related protein 1 0.82226 1.115 0.53477 1.245 3
752 1821 Serine/threonine-protein phosphatase 4
regulatory subunit 3A 0.63043 1.314 0.86224 1.023 3
811 1988 E3 SUMO-protein ligase RanBP2 0.57606 1.020 0.54521 0.909 1
821, 1609 1997 Uncharacterized protein C9orf25 0.8935 1.053 0.55104 0.528 2
823 2005 Neprilysin
1.6189 1.574 1.2163 1.344 3
824 2.4429 1.337 1.4294 1.393 3
825 2008 E3 ubiquitin-protein ligase BRE1A 0.24792 0.503 0.56697 0.6230
71 8
894 2188 Serine/threonine-protein phosphatase 1
regulatory subunit 10 0.62514 0.757 0.94695 1.013 1
895 2200 Stromal interaction molecule 1
0.76106 0.714 0.35868 0.406 5
896, 897 0.98022
0.99922
913 2242 Trimethyllysine dioxygenase, mitochondrial 234.48
-
1648 2253 Liprin-beta-2 0.70637 0.472 0.27994 0.182 6
950 2254 Uncharacterized protein C3orf20 4.503
0.91871
-
1651 2264 AT-rich interactive domain-containing
protein 4B 0.89109 0.911 0.57142 0.833 1
973, 1653 2297 Nucleoporin-like protein RIP 0.76733 0.705 0.33271 0.264 6
983 2315 Scavenger receptor class F member 2
0.4186 0.666 0.47497 0.604 5
985 0.68778
0.80021
993
2327 Pyruvate dehydrogenase E1 component
subunit alpha, testis-specific form, mitochondrial
0.80001 0.974 0.47291 0.610 2
994, 1786 average
0.82302 0.877 0.36881 0.449 5
1011 2354 Zinc finger CCCH domain-containing
protein 11A 0.903
1.465 3
1021 2383 Choline-phosphate cytidylyltransferase A 0.3329 0.625 0.42215 0.574 5
1031 2426 Tight junction protein ZO-1 0.63017 0.621 0.43347 0.748 8
1037, 1038
2433 Tetratricopeptide repeat protein 7B 0.59678 0.647 0.56616 0.586 5
1071 2497 Sperm-specific antigen 2 0.47826 0.584 0.44768 0.444 5

Results
80
Phospho Peptide ID
Protein Group
Protein Names ø MQ Ratio
2 min
ø XIC ratio 2 min
ø MQ Ratio 10 min
ø XIC ratio
10 min Cluster
1103 2565 Fibrous sheath-interacting protein 2 7.8342 358.703
0.398 4
1135, 1136, 1137
2628 Cleavage and polyadenylation specificity
factor subunit 2 1.0137 0.994 0.54333 0.672 2
1172 average 2708 Myocyte nuclear factor
0.89936 1.067 2.9563 1.099 3
1170 1.1171 0.961 1.3167 1.170
1190
2772 Stathmin
0.2546 6.377 1.5502 1.508 7
1192 1.0663
1.217
1191 1.3043
1.2142
1203 average
2804 Rho guanine nucleotide exchange factor 16 1.4136 1.739 1.6786 1.416 3
1698 2825 Nuclear factor with BRCT domains 1 1.599 1.129 1.571 1.043 3
1237, 1238, 1239, 1707
average
2870 Bcl-2-associated athanogene 3 0.93734 0.982 0.43142 0.768 1
1258 2927 Nucleoprotein TPR 1.1564 1.137 1.7757 2.135 3
1720 average
2953 Serine/arginine repetitive matrix protein 2
0.1856 1.091 0.93931 1.049 3
1791 0.8267
0.80681
1272 0.86135
0.80147
1276 0.91799
0.88166
1307 0.92361
0.77127
1721 0.94366
1299 0.97494
0.9428
1284 0.97505
0.69208
1291 0.98411
0.80845
1311 1.0061
1.0029
1302 1.0334
1.0302
1285 1.0555
0.9425
1308 1.0708
0.93442
1286 1.0735
0.92703
1281 1.091
0.86751
1292 1.0997
1714 1.1023
0.99185
1280 1.1297
1298 1.1952
1.0356
1722 1.1997
1.1414
1289 1.2544
1.1269
1301 1.2705
0.95957
1346, 1347, 1348
2996 25 kDa protein 14.234
-

Results
81
Phospho Peptide ID
Protein Group
Protein Names ø MQ Ratio
2 min
ø XIC ratio 2 min
ø MQ Ratio 10 min
ø XIC ratio
10 min Cluster
1349 2997 Cytoplasmic linker-associated protein 2 0.76266 0.783 0.54823 0.564 5
1733 3021 Prune homolog 2 (Drosophila) 0.60562 0.814 0.80224 0.864 1
1734, 1735, 1736 3037 TBC1 domain family member 10B
0.68777 0.687 0.39897 0.374 5
1375 1.3216
1.2657
1379 3056 cDNA FLJ51169 0.25724
5.1751
-
1751 3067 cDNA FLJ53530 0.18618 0.028 0.062739 0.052 8
1524 1274;1801;2986
Lamina-associated polypeptide 2 1.5352 1.049 1.5746 0.832 1
490 1.569 1.340 1.7811 1.121 3
1672
2523;3038
Microtubule-associated protein 4
0.75454 0.850 0.47926 0.654 2
1673 0.90128
0.96096
1082 0.95377
0.83942
1671 1.0548
1.3068
1086 2528 RNA-binding protein MEX3C
1.052
0.590 2
765, 766 1844 Probable G-protein coupled receptor 126 2.6047 2.814 0.79713 0.967
148, 149
358 Microtubule-associated protein 1B
0.30781 0.404 0.54825 0.567
142, 144 0.32032 0.326 0.52971 0.562
157, 158, 1458
0.37659 0.379 0.70171 0.653
156 0.38342 0.328 0.5904 0.605
153, 154 0.39001 0.342 0.52132 0.500
141, 140 0.401 0.436 0.63584 0.704
145 0.40927 0.303 0.51695 0.493
1456 0.43918 0.377 0.50824 0.554
146 0.44361 0.403 0.50465 0.403
147 0.46908 0.378 0.64051 0.602
150, 1455 0.47963 0.389 0.49219 0.488
40, 42, 1434
119 Microtubule-associated protein 2
2.5178 2.777 1.9314 1.785
39, 41 2.9963 3.360 1.7499 1.889
1432, 1433
3.5302 3.884 0.41175 3.000
7.4.3.1 K-means clustering
In order to classify phosphopeptides with significant changes in abundance (i.e. peptides marked in
green and blue in Table 11) K-means clustering was performed, while phosphopeptides originating
from regulated proteins (marked in red in Table 11) were generally excluded. For cluster analysis,
normalized XIC ratios were log2 transformed in order to achieve a symmetrical distribution of ratios

Results
82
around zero. For the "control", ratio values were set to zero. In order to optimize clustering
efficiency, different K values were tested. A K value of nine was eventually applied as higher K values
did not result in the formation of new principle clusters and lower K values failed to efficiently
distinguish between peptide profiles. The application of a K value of nine however, also did not lead
to a separation of peptides into cluster showing a distinct trend like for example early responding
peptides and late responding peptides. In addition, the peptides of the same protein are sometimes
associated to different cluster and no functional group of proteins is dominating a certain cluster.
The respective cluster distribution of all the regulated phosphopeptides identified in this work
applying a K value of nine is shown in Supplementary Figure 6.
7.4.3.2 Kinase motif prediction
For all confidently identified phosphorylation sites in regulated phosphopeptides, a kinase motif
prediction was conducted in order to evaluate which kinases might be involved in mediating β-
ionone stimulation effects. In addition to the prediction tool of the MaxQuant software, two further
prediction tools, namely NetPhosK (http://www.cbs.dtu.dk/services/NetPhosK/) and KinasePhos
(http://kinasephos.mbc.nctu.edu.tw/), were employed. Interestingly, the three approaches resulted
in rather inconsistent data (e.g. for only three peptides the same kinase was predicted),
demonstrating that these prediction tool merely give a hint as to which kinase might be involved, but
predictions cannot be considered as proof for the involvement of a predicted kinase. In Table 12, the
numbers of motifs predicted for each kinase by the three tools are listed.
Table 12: Number of kinase motifs predicted for regulated phosphorylation sites identified in this work by
use of three different algorithms.
Kinase MaxQuant NetPhosK KinasePhos CK1 23 3 1
PKA 11 15 4
CK2 7 7 4
AKT/PKB 6 5 1
GSK3 5 5
CDK1 5
13 CDK2 4
cdk5
18
CHK1 4
WW GroupIV 3
CAMK2 3
2
NEK6 3
Polo box 2
FHA1 Rad53p 2
ERK/MAPK/p38 MAPK 2 5 1
Polo box 2
PKD 2

Results
83
Kinase MaxQuant NetPhosK KinasePhos PKC 1 10 4
FHA KAPP 1
NIMA 1
CHK2 1
RSK
3
ATM
1 1
DNAPK
1
cdc2
1 1
other_1
5
other_4
1
In order to learn more about the potential signaling mechanism and effects triggered by β-ionone,
the 73 regulated phosphoproteins identified in this work were imported into Ingenuity Pathway
Analysis software (INGENUITY Systems, Inc, Redwood City, CA, USA). This software predicts networks
and interconnections between proteins on the basis of known protein-protein interactions.
Regulated phosphoproteins were automatically assigned by the software in four functional networks
leaving only 8 proteins without a classification (See networks in Supplementary Figures SP 8 – SP 11).
The majority of proteins could be assigned to one of the four following categories:
(1) Cancer, Cellular Growth and Proliferation;
(2) Infection Mechanisms, Dermatological Diseases and Conditions;
(3) Cell Morphology and Molecular Transport and
(4) Cellular Assembly, Organization and Tissue Development
The remaining 8 proteins were grouped into the category "Others".
Protein classification further revealed that many of the regulated phosphoproteins are involved in
processes like cell morphology changes, outgrowth, polarization and cytoskeleton dynamics (e.g.
protein IDs 1171, 119, 2927, 358, 2772, 594, 854, and 2997). All these processes are involved in the
migration of cells (Ridley et al. 2003). Therefore, a migration assay was established by Dr. Gelis at the
Department of Cell Physiology (Head: Prof. Hatt; Ruhr-Universität Bochum) and the potential
influence of β-ionone on the migration behavior of LNCaP cells was investigated (Figure 30).
Using the migration assay, it was tested how many cells migrate from the upper chamber of a
Boyden chamber apparatus through a membrane when different stimuli were applied on both sides
of the membrane. When the same conditions are implemented on both sides of the membrane
(negative control, Figure 30 A), a rather low number of cells migrated through the membrane. By
adding 20 % FBS to the lower chamber, this migration rate was significantly increased (positive
control, Figure 30 B). This effect is abolished, when β- ionone was added simultaneously to the upper
chamber (Figure 30 C). Addition of both β- ionone and 20% FBS led to enhanced migration in
comparison with the control (D). When β- ionone was solely added to the lower (E) or upper

Results
84
chamber (F), no significant changes in cell migration were observed. Therefore, β-ionone did not
function as a chemoattractive or repellent cue in this migration assay, but instead was able to
effectively inhibited serum-directed migration.
Fig. 31: Results of Boyden chamber migration assay. LNCaP cells are seeded in the upper chamber of a
Boyden chamber apparatus. Different stimuli are applied to the upper (stated above bars) or lower chamber
(stated below bars). Bars inciate the number of cells migrated from the upper chamber through the membrane
per field of view. As a negative control, no stimulus was applied (A) to either of the chamber, resulting in a low
number of migrating cells. As a positive control 20 % FBS was applied to the lower chamber (B), which
increased the number of cells, which migrated through the membrane significantly. β-ionone neither appeared
to have attractive nor repellent function when applied alone ore in one chamber with FBS (D-F), but it
decreased significantly the FBS (lower chamber) induced migration when applied simultaneously to the upper
chamber (C).
(A) (B) (C) (D) (E) (F)

Discussion
85
8 Discussion
8.1 Phosphoproteomics applied to the mouse olfactory epithelium
The olfactory system is able to distinguish a vast variety of odorants. In order to be able to respond
to vital odorant cues emanating from, for example, food or mating partners, the olfactory system has
to filter for redundant background stimuli. This process is called habituation. The mechanisms
underlying this habituation have extensively been studied in the olfactory bulb, the olfactory cortex
and in higher brain regions (Sanchez-Andrade et al. 2005; Wilson 2009). About effects of short- and
long-term odorant exposure on the olfactory epithelium (OE), however, little is known to date. To
gain new insights into the molecular events triggered in the OE by continuous or pulsed odorant
exposure, Barbour et al. (Barbour et al. 2008) conducted a quantitative proteomics study of OEs from
mice exposed to the odorant octanal following two different long-term treatment regimes. Resulting
differences in protein expression levels were subsequently analyzed using the differential in gel
electrophoresis (DIGE) technology in combination with two-dimensional (2D) gel electrophoresis and
mass spectrometry (MS) for protein identification.
The initial events leading to the formation of the observed long-term changes in protein abundance
are signal transduction cascades triggered by the activation of G-protein coupled receptors upon
odorant binding, which also lead to the activation of transcription of certain target genes. Since
signaling cascades are largely mediated by phosphorylation and dephosphorylation of signaling
proteins, it is of high importance to study these events in detail. Such studies may eventually result in
a better understanding of the mechanisms by which the observed long-term changes in protein
abundance were induced by odorant treatment. Analogous to the 2D DIGE study performed by
Barbour et al., 2D gel electrophoresis in combination with the fluorescent phosphospecific dye Pro-
Q®Diamond (Pro-Q) was employed in this work to study phosphorylation events occurring in the
mouse OE upon short-term odorant treatment. The use of the commercially available Pro-Q stain in
gel-based quantitative phosphoproteomics was first published in 2003 (Steinberg et al. 2003). As it is
specific for serine and threonine as well as tyrosine phosphorylation and since, according to the
manufacturer, it is supposed to have a dynamic range of three orders of magnitude, this stain
promised to be a valuable tool for comparative, quantitative phosphoproteomics. In fact, this dye has
successfully been employed in diverse phosphoproteomics studies using plants (Agrawal and Thelen
2006; Chitteti and Peng 2007), microorganisms (e.g. Dimina et al. 2009), mammalian cells and tissue
(Gannon et al. 2008), body fluids (You et al. 2010) and for kinase target screens (Orsatti et al. 2009).

Discussion
86
In this work, the applicability of the Pro-Q stain was first assessed using standard proteins. These
experiments showed that phosphorylated standard proteins were specifically stained with the dye
while non-phosphorylated standard proteins were not (Fig. 7, Chapter 5.1). However, MS/MS
analyses of tryptic peptides generated from Pro-Q- in comparison to Coomassie-stained standard
proteins showed severe limitations in the reliable identification of proteins following Pro-Q-staining
(Table 3, Chapter 5.1). To compensate for potential bias of different MS instruments towards either
of the stains, three different types of instruments were employed, namely an ion trap (HCT plus), a
triple quadrupole (Q-Trap 4000) and a quadrupole-TOF-MS (Q-Star XL). The results were similar for
all the three instruments, thus pointing to its limited applicability to MS-based phosphoprotein
analysis. In fact, both phosphorylated and non-phosphorylated proteins were generally identified
with significantly lower scores as well as lower sequence coverage following Pro-Q staining.
Therefore, it can be assumed that the Pro-Q stain itself or the staining procedure interfered with
subsequent sample preparation steps (e.g. tryptic in-gel digestion, peptide extraction from the gel
matrix) or efficient ionization and MS(/MS)-based peptide analysis. The latter may be caused by
unknown modifications added to the proteins during the staining procedure and thus, preventing
their identification by database searches. However, reevaluation of the MS/MS data using PTM
Explorer, a tool implicated in ProteinScape 1.3 which allows screening for unknown modifications,
did not reveal any unknown modification or mass difference frequently occurring in the data set.
Thus, a low efficiency in tryptic digestion or the extraction of tryptic peptides generated from Pro-Q-
stained proteins is assumed.
The ability to mass spectrometrically identify phosphorylation sites in proteins was further examined.
Evaluation of the results achieved for S1-casein upon staining with Pro-Q revealed that only four
peptides and not a single phosphorylated peptide were identified. In contrast, a significantly higher
number of peptides (10) including also a phosphopeptide in two different phosphorylation states
were identified in Coomassie-stained S1-casein (Table 4, Chapter 5.1). These results underscore the
limited applicability of the Pro-Q stain to the identification of phosphorylation sites in proteins by
MS.
The Pro-Q stain was further tested for the phosphospecific staining of 2D gels of OE lysates. This
allowed the staining of potentially phosphorylated proteins and the visualization of differences
between odorant-treated versus non-treated ("control") mouse OE. However, in agreement with
results obtained for standard proteins described in this work, MS analyses of differentially stained gel
spots resulted in low identification rates and no phosphorylation sites were detected (Figure 9 and
Table 5, Chapter 5.1, for further details, refer to Supplementary Table SP 25).
In addition to the impaired detectability of tryptic (phospho)peptides from Pro-Q-stained proteins by
MS, two reproducibility issues emerged (Figure 10, Chapter 5.1):
Discussion
87
The quality of the Pro-Q staining itself was found to be not reproducible. Although it was
carried out strictly according to the protocol, in some cases, the staining revealed distinct
spot patterns, in other cases, it resulted in high background staining, was blurry, and no spot
pattern was visible.
If gels exhibited low background and clearly discernible spots, the observed spot patterns
varied in intensity as well as in the pattern itself between replicates suggesting poor
reproducibility of sample preparation.
With regard to the latter issue, the variability in spot patterns was most likely due to the variable
duration of the OE sample preparation. Mice were exposed to the odorant, dissected and the OE was
subsequently prepared from the septal bone and turbinates before it was placed in Ringer´s buffer
containing phosphatase and protease inhibitors. This procedure was time-consuming, varied in
length (5-15 min) and efforts to develop a more reproducible protocol did not lead to an
improvement. In summary, limited reproducibility of the Pro-Q staining as well as the length of time
needed for the multi-step preparation of mouse OE prohibited comparative phosphoproteomic
analysis of such biological samples and thus, alternative approaches had to be sought. A further
major drawback of this approach was the observed interference of the Pro-Q stain with the MS-
based identification of (phospho)proteins, rendering it inapplicable to phosphoprotein analyses on a
larger scale.

Discussion
88
8.2 Establishment of a global phosphoproteomics strategy to study
olfactory receptor-mediated signaling events in LNCaP cells
8.2.1 Establisment and refinement of the phosphoproteomics strategy
Based on the results of the initial work on mouse OE applying 2-D gel methodology combined with
Pro-Q staining, a new concept for the study of olfactory receptor (OR)-mediated signaling events was
designed. Major aspects of this new concept were the use of a biological system which allowed for a
sample preparation under easier to control conditions as well as the establishment of a gel-free
phosphoproteomics strategy comprising modern phosphopeptide enrichment and MS/MS
technologies combined with adequate bioinformatics methods for the efficient identification and
relative quantification of several hundreds of phosphoproteins including the reliable determination
of their phosphorylation sites.
To this end, the use of cell culture systems is favorable as cells can be grown and treated at well-
controlled conditions and protein samples can reproducibly be prepared. Thus, the issues of
technical and biological variability are attenuated in cell culture systems. Olfactory receptor neurons
(ORN) however, can only be cultivated as primary culture, for which many animals are required
(Ronnett et al. 1991). In addition, although expression of olfactory receptors (ORs) in heterologous
cell culture systems has been shown (Neuhaus et al. 2009), it is mostly not possible to express ORs in
heterologous mammalian cell culture systems as they exhibit poor trafficking to the plasma
membrane because of retention in the endoplasmatic reticulum (McClintock and Sammeta 2003;
Bush and Hall 2008). Most interestingly, a member of the olfactory receptor family, the prostate
specific G-protein coupled receptor (PSGR), is endogeneously expressed in the prostate and
especially in prostate cancer cells (Xu, L. L. et al. 2000). Furthermore, the ligands activating this
receptor were recently identified using the prostate carcinoma cell line LNCaP (Neuhaus et al. 2009).
As the function of the PSGR in prostate and LNCaP cells still remains largely elusive, it was of great
interest to study PSGR-mediated signaling cascades via quantitative phosphoproteomics in this work.
Although signaling of the PSGR cannot be conveyed to signaling of olfactory receptors in the OE, it is
expected to provide valuable new insight into the mechanisms underlying the development of
prostate cancer.

Discussion
89
Phosphopeptide sample preparation
Major challenges of global phosphoproteomics studies are, on the one hand, based on the fact that
protein phosphorylation usually occurs in low amounts and at substoechiometric level (Aebersold
and Goodlett 2001) and, on the other hand, that phosphorylated peptides typically exhibit lower
ionization efficiencies than their unphosphorylated counterparts (Craig et al. 1994; Hunter and
Games 1994). In this work, strong cation exchange chromatography (SCX) for prefractionation in
combination with titanium dioxide (TiO2) affinity capture for the efficient enrichment of
phosphorylated peptides from complex samples was used. This methodological setup was reported
to be applicable to the MS-based analysis of phosphoproteins on a larger scale (Gruhler et al. 2005;
Wu et al. 2007; Thingholm and Larsen 2009).
To refine and evaluate distinct steps of this multidimensional strategy, a highly phosphorylated
protein sample was generated by treatment of LNCaP cells with the typrosine phosphatases inhibitor
sodium orthovanadate (OV). OV treatment of cells leads to accumulation of phosphorylation in
general (Samet and Tal 2010). Since initial experiments according to published protocols (Ballif et al.
2004; Mazanek et al. 2007) resulted in the identification of only a few phosphopeptides
(Supplementary Table 6, Figure 32) each step of the entire workflow was reevaluated and refined
(see Figure 11 in Chapter 5.2). The optimization of digestion, desalting, SCX chromatography and TiO2
buffers lead to an approx. 4-fold higher number of identified phosphopeptide. A further approx. 3-
fold increase in phosphopeptide identification rates was achieved by the development of a TiO2 batch
process (Figure 32). By applying a refined NL-triggered ETD method and improved bioinformatic
parameters, the number of identified phosphopeptides was further increased more than 1.5-fold.
Thus, by thorough refinement of this multistep strategy, phosphopeptide identification rates were
increased 18-fold.

Discussion
90
Fig. 32: Number of unique phosphopeptides identified in five SCX fractions during method development and
refinement. For method development, the entire workflow was independently repeated using lysates of OV-
treated LNCaP cells. In order to compare the phosphopeptide enrichment efficiancies, eluates from the first
five SCX fractions of the respective experiment were analyzed using the HCT instrument. In the initial
experiment, only eight phosphopeptides were identified. The number of identified phosphopeptides was
increased through subsequent optimization of each step in the workflow to 145 (18-fold).
MS analysis of phosphorylated peptides
For the analysis of phosphopeptide-enriched samples from LNCaP cell lysates, two different MS
analysis regimes combined with appropriate bioinformatics tools for data interpretation were
established and evaluated. In this work, two alternative fragmentation techniques using two types of
MS instruments were employed for phosphopeptide analysis: (1) electron transfer dissociation (ETD)
on a HCT Ultra ion trap instrument and (2) multistage activation (MSA) on an LTQ-Orbitrap
instrument. Data generated by both instruments differ in the accuracy of precursor mass
determination and, as both instruments are from different manufacturers, in different raw data
formats. A bioinformatics platform allowing for the combined analysis of both kinds of raw data is
not available yet. Accordingly, an individual bioinformatics workflow had to be implemented for each
set of MS data. Data generated by the LTQ-Orbitrap system were processed with MaxQuant (Cox and
Mann 2008), an algorithm specifically developed for high resolution MS data which includes peptide
and protein identification as well as phosphorylation site assignment. For data derived from the HCT
instrument, a software solution which combines identification and PTM site determination was not
available. Therefore, the analysis workflow using two subsequent processing steps, namely the
identification via ProteinScape 1.3 with Mascot 2.2 and site determination using the SLoMo
algorithm, was established. As a result of data analyses, different optimum parameter sets were
8 21
93
34
145 #
iden
tifi
ed p
ho
sph
op
epti
des

Discussion
91
determined for CID and ETD spectra (Figure 19, Chapter 5.2.7). However, since only one distinct set
of parameters can be set in ProteinScape for a respective data set, the parameters used in this work
resemble a compromise. This underscores the need for the development of new algorithms enabling
to apply distinct parameter settings for CID and ETD data within ProteinScape.
Application of the two distinct MS analysis strategies resulted in the identification of a similar
number of phosphopeptides, while both data sets were highly complementary (Figure 18, Chapter
5.2.6). This result emphazises the need for the application of different MS analysis strategies for
improved coverage of the phosphoproteome. Hence, both strategies were subesequently employed
for the study of the phosphoproteome of OV-treated LNCaP cells.
8.2.2 Global phosphoproteomics analysis of orthovanadate-treated
LNCaP cells
Following the refinement and the establishment of the MS-based phosphoproteomics strategy in this
work, the phosphoproteome of OV-treated LNCaP cells was studied in detail. To this end, each
strategic track was conducted in two independent experiments (for workflow see Figure 20, Chapter
5.3.1). Overall, more than 2000 unique phosphopeptides containing 2569 unique phosphorylations
sites were identified using only 200 µg starting material per experiment. The localization of 1639
phosphorylations sites were confirmed. Therefore, these results present the most comprehensive
phosphoproteomic study reported for LNCaP cells to date (Giorgianni et al. 2007; Chen, L. et al.
2010). Regarding the number of identified phosphopeptides and determined phosphorylation sites,
the data reported here are in agreement with the recent literature (Table 13).
Table 13.: Number of phosphopeptides identified in state-of-the-art phosphoproteomics studies. In addition,
the principal method and sample amount used in the respective work are listed.
Publication Method Sample amount # Identified
phosphopeptides
Mäusbacher et al. (Mausbacher et al.
2010)
Lectin affinity purification, 1D gel or in solution digestion followed by
TiO2 enrichment 6 x 4 mg 1700
Nakagami et al. (Nakagami et al. 2010)
Ti/Zr metal oxide affininty purification, Fe-IMAC
0.2 g wet cell weight
6919
Ye et al.(Ye et al. 2010) IMAC/IMAC 20/50 µg 1000
Nie et al. (Nie et al. 2010)
SCX and SAX followed by TiO2 enrichment
500 µg 2705
Olsen et al. (Olsen et al. 2010)
1D Gel followed by TiO2 enrichment, SCX followed by TiO2 enrichment
and direct TiO2 enrichment
10-15 mg per condition
∑50-75 mg 20443

Discussion
92
Phosphopeptides identified from SCX fractions
In both strategic tracks, a small aliquot of each SCX fraction was analyzed without further
phosphopeptide enrichment. In experiment 1, SCX fractions were analyzed by NL-triggered ETD
measurements using the HCT Ultra instrument, whereas in experiment 2, samples were analyzed on
the LTQ-Orbitrap instrument. Both analysis setups provided similar rates of identified
phosphopeptides from SCX fractions. However, applying the LTQ-Orbitrap/MaxQuant platform, far
more peptides and proteins were identified, demonstrating the enhanced sensititvity of this track. It
is of interest to note, however, that the number of identified phosphopeptides was similar for both
tracks employing different MS technologies. This suggests, that NL-triggered ETD analysis using the
HCT ion trap instrument is generally suited for the identification of phosphopeptides from complex
samples. Nevertheless, the overall number of identified phosphopeptides was far lower than what
could be expected regarding current literature. Hence, further enrichment for phosphopeptides was
necessary.
By comparing the number of phosphopeptides identified before and after TiO2 enrichment, a median
enrichment factor of about 10-fold was determined (Tables 8 and 9, Chapters 5.3.2 and 5.3.3). This
factor cannot be compared to other studies, as to the best of the author's knowlegde no statement is
given on enrichment factors in the literature. However, since the number of phosphorylated peptides
identified in this work was at the level of current high quality research publications, similiar
phosphopeptide enrichment efficiencies are assumed.
Performance of different analysis platforms
When evaluating data generated from TiO2-enriched SCX fractions, the phosphoproteomics platform
comprising the LTQ-Orbitrap-MSA setup combined with automated data processing employing the
MaxQuant software performed best in respect to the number of identified phosphorylation sites
(1568 sites for Orbitrap/MaxQuant, 1284 sites for HCT/ProteinScape/SLoMo, Figure 23, Chapter
5.3.4) and particularly to the number of confirmed sites (1248 for Orbitrap/MaxQuant, 612 sites for
HCT/ProteinScape/SLoMo, Figure 23, Chapter 5.3.4). Although the second platform composed of the
HCT Ultra PTM system with CID and NL-triggered ETD followed by ProteinScape/SLoMo data
evaluation resulted in a lower number of both phosphorylation sites and confirmed sites, the
obtained phosphoproteomic data set was highly complementary (see Figures 22 and 23, Chapter
5.3.4). Thus, combination of both data sets resulted in an higher coverage of the phosphoproteome
of OV-trated LNCaP cells.
The reasons for this disparate performance of the two different analysis platforms are likely to be
manifold. The fact, that both techniques are highly complementary indicates that only a part of the

Discussion
93
phosphoproteome has been covered. The LTQ-Oribtrap system providing shorter duty cycle times
and therefore, more fragment spectra was shown to led to the identification of a higher number of
(phospho)peptides and (phospho)proteins. Beyond that, the high peptide mass accuracy of 3 ppm
Orbitrap data has been shown to significantly improve phosphopeptide identification rates (Olsen
and Macek 2009; Timm et al. 2010).
The Orbitrap/MaxQuant workflow also performed best regarding the number of confirmed
phosphorlyation sites. This result was unexpected, as ETD fragmentation should allow for confident
site assignments, as the phosphate moiety remains at the respective amino acid residue. Whether
the gain in site localization accuracy in the Orbitrap/MaxQuant workflow is due to the mass accuracy
and sensitifity of the instrument, the fragmentation technique employed or the bioinformatic
methods applied can not be exhaustively answered in this work and needs to be further investigated.
A main reason is likely to be the use of the MaxQuant software, an established software specifically
developed to analyze LTQ/Orbitrap-MS/MS data. The observed inferiority of the
HCT/ProteinScape/SLoMo platform may be due to limited applicability of ProteinScape for the
concerted analysis of CID and ETD MS/MS data since no separate parameter sets for CID and ETD
spectra could be set. Furthermore, with the applied methods on the HCT ion trap, the precursor mass
could only be determined with a mass accuracy of about 300 ppm. This might be an additional factor
contributing to inferior identification results.
When comparing the reprocucibility of both fragmentation techniques in experiment 1 and 2 (Table
9, Chapter 5.3.3), datasets derived from CID/NL-triggered ETD scans on the HCT instrument showed a
significantly smaller overlap (7 - 24 %) than the respective data sets obtained by MSA on the LTQ-
Orbitrap instrument (19 - 51 %). As the HCT is supposed to have a 2 - 5 times lower sensitivity
(empirical value) than the Orbitrap instrument, mainly abundant proteins should be identified and
therefore, an higher overlap in data was expected. However, the NL-triggered ETD measurement
regime applied in this work was attended by rather long duty cylce times. For three CID scans
followed by three subsequent ETD scans, duty cycle times were in the range of six to eight seconds,
depending on the abundance of precursor ions. In contrast, the four MSA scans required a duty cycle
time of only two seconds. One can therefore hypothesize that the comparably small overlap between
CID/NL-triggered ETD data sets was based on considerable undersampling rather than sensitivity
issues.
Identified Phosphoproteins and new phosphorylation sites
In addition to the establishment and evaluation of an effective MS-based phosphoproteomics
strategy, this work aimed at extending our current knowledge of the phosphoproteome of the
human prostate carcinoma cell line LNCaP. As a result of this effort, 164 new phosphorylation sites in
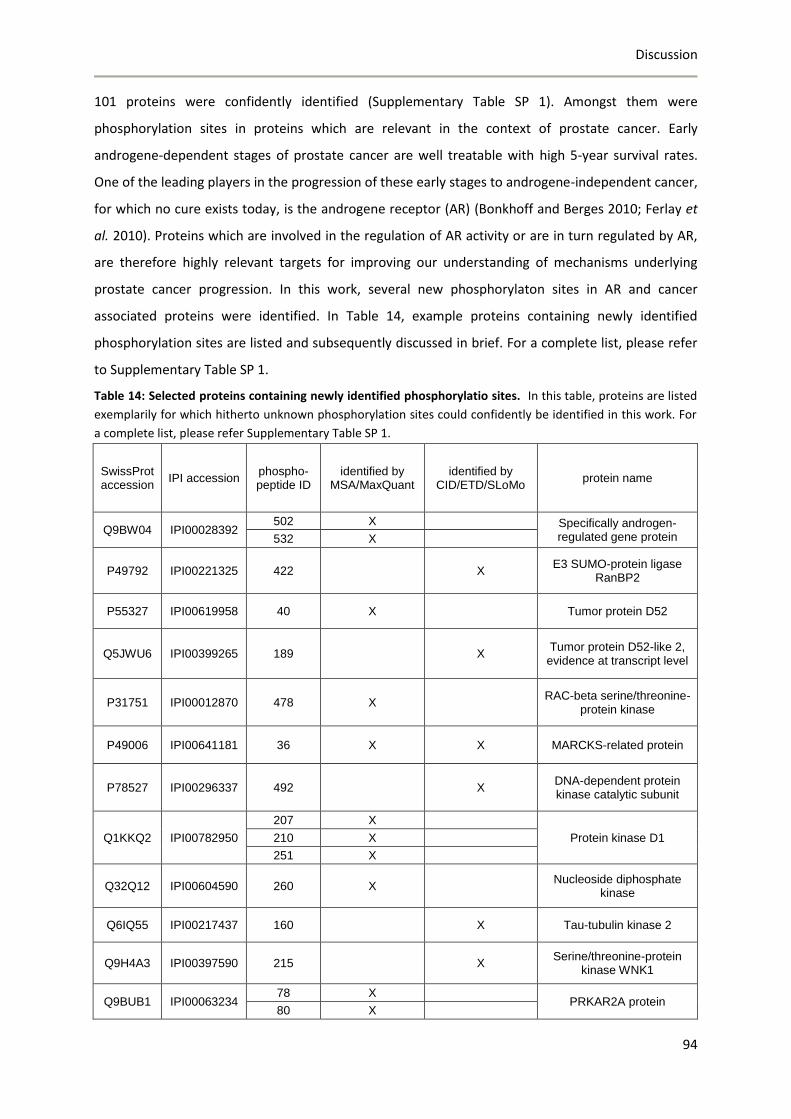
Discussion
94
101 proteins were confidently identified (Supplementary Table SP 1). Amongst them were
phosphorylation sites in proteins which are relevant in the context of prostate cancer. Early
androgene-dependent stages of prostate cancer are well treatable with high 5-year survival rates.
One of the leading players in the progression of these early stages to androgene-independent cancer,
for which no cure exists today, is the androgene receptor (AR) (Bonkhoff and Berges 2010; Ferlay et
al. 2010). Proteins which are involved in the regulation of AR activity or are in turn regulated by AR,
are therefore highly relevant targets for improving our understanding of mechanisms underlying
prostate cancer progression. In this work, several new phosphorylaton sites in AR and cancer
associated proteins were identified. In Table 14, example proteins containing newly identified
phosphorylation sites are listed and subsequently discussed in brief. For a complete list, please refer
to Supplementary Table SP 1.
Table 14: Selected proteins containing newly identified phosphorylatio sites. In this table, proteins are listed
exemplarily for which hitherto unknown phosphorylation sites could confidently be identified in this work. For
a complete list, please refer Supplementary Table SP 1.
SwissProt accession
IPI accession phospho-peptide ID
identified by MSA/MaxQuant
identified by CID/ETD/SLoMo
protein name
Q9BW04 IPI00028392 502 X
Specifically androgen-regulated gene protein 532 X
P49792 IPI00221325 422
X E3 SUMO-protein ligase
RanBP2
P55327 IPI00619958 40 X
Tumor protein D52
Q5JWU6 IPI00399265 189
X Tumor protein D52-like 2,
evidence at transcript level
P31751 IPI00012870 478 X
RAC-beta serine/threonine-protein kinase
P49006 IPI00641181 36 X X MARCKS-related protein
P78527 IPI00296337 492
X DNA-dependent protein kinase catalytic subunit
Q1KKQ2 IPI00782950
207 X
Protein kinase D1 210 X
251 X
Q32Q12 IPI00604590 260 X
Nucleoside diphosphate kinase
Q6IQ55 IPI00217437 160
X Tau-tubulin kinase 2
Q9H4A3 IPI00397590 215
X Serine/threonine-protein
kinase WNK1
Q9BUB1 IPI00063234 78 X
PRKAR2A protein 80 X

Discussion
95
Two newly identified phosphorylation sites were found in the specifically androgene
regulates gene protein (SARG, Supplementary Table SP 20). This protein is upregulated by
androgen receptor activation and has recently been reported to be a putative androgen
receptor itself (Lin et al. 2000; Steketee et al. 2004). The role of this potential androgene
receptor however, is completely unknown to date.
Activation of the AR is mediated by phosphorylation (Guo et al. 2006), ubiquitination (Xu et
al. 2009) and sumoylation status (Poukka et al. 2000). Sumoylation has also been implicated
in several diseases including prostate cancer (Wu and Mo 2007). In this work, a hitherto
unknown phosphorylation site for a E3 SUMO protein ligase has been identified
(Supplementary Tables SP 17 and 18).
10 new phosphorylations sites in 7 different protein kinases could be detected
(Supplemental Tables SP 17, 18 and 20). Kinases play a critical role in cell signaling and have
emerged as the protein family implicated most in cancer (Manning 2009; Lopez-Otin and
Hunter 2010). For the Protein Kinase D1 (PKD1) no phosphorylation site has been known so
far, but in this work three new phosphorylation sites for this kinase have been confidently
identified (Supplementary Table SP 20). PKD1 has been reported to be associated with a
transcriptional complex containing the AR and the promotor sequence of the Prostate
Specific Antigen (PSA). In addition PKD has also been reported to influence AR function (Mak
et al. 2008).
Amongst many other interesting proteins, for which we identified new phosphorylation sites,
two members of the tumor protein D52 family (TPD52 and TPD52L2) might be additionally
noteworthy (Supplementary Tables SP 17, 18 and 20). Gene expression of TPD52
(alternatively PrLZ4) is reported to be regulated by androgene. TPD52 is involved in
migration, progression and survival of protate cancer cells (Rubin et al. 2004; Ummanni et al.
2008; Li et al. 2009; Wang, R. et al. 2009). TPD52L2 has not been as extensively studied as
TPD52, but recently its relative expression level has been found to be useful in the prediction
of prostate cancer progression after radical prostatectomy (Zhao et al. 2010).
8.2.3 Concluding remarks
In this work, a phosphoproteomics analysis workflow was established, which allows for the efficient
enrichment of phosphopeptides from LNCaP cells. Thereby 2569 unique phosphorylation sites, from
2095 phosphopeptides and 726 phosphoproteins could be identified from orthovanadate treated
LNCaP cell lysates. This work therefore presents the most comprehensive phosphoproteomics study

Discussion
96
in LNCaP cells so far (Giorgianni et al. 2007: 137 phosphorylation sites; Chen et al. 2010: 600
phosphorylation sites). Amonst the identified phosphorylation sites 164 hitherto unknown sites could
be identified providing new target proteins for further studies on prostate cancer.
Beyond that, the refined phosphopeptide sample preparation and bioinformatic analysis established
in this work provide the basis for a quantitative phosphoproteomics study in order to elucidate PSGR
mediated signaling networks.

Discussion
97
8.3 Quantitative and time-resolved phosphoproteomic study of
β-ionone-treated LNCaP cells
In order to not only find random new sites, but to elucidate new PSGR mediated signaling pathways,
the successfully established phosphoproteomics workflow was combined with quantitative
approaches in the following experiments. Due to the remaining problems with bioinformatic analysis
and the low mass accuracy of HCT ion trap data, only the Orbitrap/MaxQuant workflow was
employed for quantitative experiments.
8.3.1 SILAC labeling
For the quantitative and time-resolved study of PSGR-mediated signaling networks, stable isotope
labeling by amino acids in cell culture (SILAC) was employed (Ong et al. 2002; Ong et al. 2003). LNCaP
cells were metabolically labeled with heavy isotope-containing arginine and lysine using three
different combinations of labeled amino acids. Non-labeled arginine and lysine were used for control
samples (light state) and cells labeled with D4-lysine and 13C6-arginine constituted the medium state
with mass differences of 4 Da and 6 Da, respectively. For heavy labeling, 13C615N2-lysine (mass
difference: 8 Da) and 13C615N4-arginine (mass difference of 10 Da) were incorporated. Thereby, three
distinguishable cell populations were generated, which could be treated differently. Resulting
samples were mixed in a 1:1:1 ratio, with respect to total protein concentration, directly after lysis
and subsequently processed together. This is an immense advantage, as multiple processing steps
would introduce escalating variance in protein abundance. By mixing the samples not after but prior
to further processing, protein ratios originating from the biological experiment are preserved and
artificial differences introduced by handling errors are prevented.
One problem when using SILAC labeling is the conversion of isotopically labeled arginine to other
amino acids, in mammalian cells predominantly to proline (Ong et al. 2003). Additional isotopic peaks
significantly hamper the quantification of SILAC isotopic clusters, especially when not only two but
three different labeling states are implied, as it was in this study. To eliminate arginine to proline
conversion in advance, the composition of labeling media has generally to be optimized.
By reducing the concentration of added arginine in SILAC media to 120 mg/l (conventional RPMI
medium contains 240 mg/l) and by adding an excess of proline (800 mg/l), conversion of arginine to
proline could be reduced to a great extend. Therefore, optimum media conditions were determined,
which were further used for the biological experiment.
Discussion
98
8.3.2 Time resolved and quantitative β-ionone treatment experiment
The PSGR-mediated signal transduction was analyzed at three different time points after stimulation
of the receptor with its specific agonist β-ionone. In a previous study (Neuhaus et al. 2009), the
effects of stimulation of the PSGR receptor with β-ionone in LNCaP cells were monitored with
calcium imaging. Stimulation led to a slow increase in fluorescence over 3-4 min and subsequent high
stationary fluorescence for several more minutes. Therefore, for phosphoproteomic experiments on
PSGR mediated signaling, therefore, samples were collected 2 min and 10 min after stimulation,
resembling time points during ongoing intracellular calcium release and in the stationary
fluorescence phase, respectively.
The combination with triple SILAC labeling allows for the relative quantification of each labeled
peptide. Thereby, changes in the abundance of phosphorylated peptides can be monitored. For
phosphopeptides containing more than one phosphorylation site however, only the abundance
change of the respective phosphopeptide, but not of each single phosphorylation sites can be
monitored by this method.
8.3.2.1 The data set
LNCaP cells with incorporated light amino acids were mock-treated with medium and used as 0 min
treated reference time point. Medium SILAC-labeled cells were treated for 2 min and heavy labeled
cells were treated for 10 min. This experiment was repeated in three independent biological
replicates, resulting in a total identification of 3054 unique proteins and 1154 unique
phosphopeptides. This number of identified phosphopeptides is slightly lower than the number of
phosphopeptides identified in orthovanadate-treated LNCaP cells by the Orbitrap/MaxQuant
workflow, especially as β-ionone treatment experiments were conducted in three rather than in two
replicates. However, as a specific biological stimulus was employed here, rather than an unspecific
maximum accumulation of phosphorlyation in the cell by orthovanadate treatment, this lower
number was to be expected.
8.3.2.2 Reproducibility of observed regulation factors
947 of the identified phosphorylated peptides could be quantified in at least one replicate. Of these,
only high abundant and predominantly not regulated phosphopeptides were quantified in all three

Discussion
99
replicates. But in order to ensure that observed changes in phosphorylation are indeed caused by the
biological stimulus, a triplicate quantification especially of regulated phosphopeptides is desirable.
In search of the reasons why 207 identified phosphopeptides could not be quantified in any replicate
and why candidate peptides were quantified in only one or two replicates, the spectra of these
peptides were inspected manually. Thereby different reasons for the missing values could be
exposed. On the one hand, MaxQuant only quantifys peaks which are baseline-separated (Cox et al.
2009). That means that the intensity has to return to zero between two peaks. Many peptides did
coelute with other peptide species of similar mass, which resulted in overlapping isotopic clusters
and thereby peptides were, in parts, not baseline-separated. Consequently, these peptides were not
quantified by MaxQaunt, although they were present in the sample. On the other hand, MaxQuant
only quantifies peptides for a given replicate, when they are identified by database searches in this
replicate. But low abundant peptides were in some cases not selected for fragmentation and
therefore no fragment spectrum was available for database searching. In these cases, peptides are
also not quantified, although they might be present in the sample. Moreover, for some peptides no
obvious reason could be observed for the missing quantification. If these not quantified peptides
seemed to be regulated judged by the manually inspected spectra, they were considered for further
validation.
Of the quantified phosphopeptides, 99 were found to be significantly up- or down- regulated by β-
ionone stimulation according to box plot analysis of the normalized average ratios. Only three
phosphopeptides in the resulting candidate list were identified and quantified in all three replicate
experiments. These three phosphopeptides showed a good reproducibility in all three replicates as
demonstrated in Figure 32 using the example of peptide 122.

Discussion
100
Fig. 33: Reproducibility of phosphopeptide 122 ratios in all three replicate experiments. The ratios of
peptide intensity from control and treated regimes observed after stimulation for 2 and 10 min showed the
same tendency in all three replicate experiments.
Nevertheless, replicated quantification was required for the other candidate peptides in order to
evaluate the regulation significance. For that purpose, an identification-independent method based
on the high mass accuracy and liquid chromatography retention time was established.
By the application of this method, the number of candidate phosphopeptides identified in all three
replicates, could be elevated from three to thirty unique peptides. In addition, the number of
peptides, which have been quantified in two replicates, could also be elevated. An example for the
correlation between Extracted ion chromatograms (XIC) and MaxQaunt ratios is shown in Figure 33.
The single MaxQaunt ratio (replicate 2) and the three XIC ratios calculated for peptide 199 (EEF2K)
are shown. Most of the multiply quantified phosphopeptides showed very similar regulations in all
replicates as shown in Figure 33 for peptide 199. Moreover, the ratios calculated through the XIC
method correlated well with the ratios calculated by MaxQuant, although the method for XIC value
normalization was far less sophisticated as the normalization algorithms used in MaxQuant (for
detailes please refer to Supplementary Table SP 23).

Discussion
101
Fig. 34: Correlation between MaxQuant and XIC ratios. The ratios for peptide 199 (MaxQuant ID,
Supplementary Table SP 23) are depicted. This peptide was quantified by MaxQuant in only one replicate.
Using the XIC quantification method, this peptide could be quantified in all three replicates. The trend observed
for the respective ratios was the similar both amoungst the three XIC quantified replicates as well as between
the MaxQuant ratios and the XIC ratios.
8.3.2.3 K-means clustering
As the set of average XIC values contained more replicates than the MaxQuant set of ratios including
the two manually chosen peptides, and was therefore considered more complete, this set was used
for K-means clustering of the regulation profiles of all candidate phosphopeptides. By clustering the
regulation trends of candidate peptides, a grouping was obtained. For example, there could be
different populations of peptides, like early responders with high regulation factors after 2 min and
low regulation factors after 10 min. This analysis was intended to provide a functional and time-
related grouping of peptides in order to reconstruct the course of signaling events after PSGR
stimulation. The clustering resulted in nine clusters. These clusteres, however, did not deviate
significantly. In addition, there was no correlation observable between the calculated clusters and
the functional protein grouping according to literature information. This could be due to the fact that
many of the candidate peptides were only regulated slightly, whereas some peptides showed very
high regulation factors. This and the relatively low number of candidate peptides could have
hampered a reasonable K-means clustering.

Discussion
102
8.3.2.4 Kinase motifs
According to the global phosphoproteomics data set, phosphorylation sites were considered as being
confidently localized, when the localization score was 0.75 or higher. In order to get a hint of which
kinases might be involved in the signal transduction of PSGR signaling, all confidently identified
phosphorylation sites where searched for known kinase recognition motives. One such prediction
tool is already implicated in the MaxQuant algorithm. Beyond that, two additional online prediction
tools, namely NetPhosK (Blom et al. 2004) and KinasePhos (Huang et al. 2005) were implemented.
The kinase predictions made by these two tools, however, deviated considerably from the
predictions made by the MaxQuant software with only three phosphorylation sites, for which the
same kinase was predicted by every algorithm (Supplementary Table SP 23). These varying results
may be in part due to the fact, that the two web-based prediction tools include only 17 (NetPhosK)
and 11 (KinasePhos) kinases in their predictions. On the exact algorithm underlying predictions from
MaxQuant, no information could be found. The observed discrepancies between motif predictions,
diminish the significance of the predictions reported by the respective tools. However, the most
frequently occuring kinases (Table 12, Chapter 5.4.3) also appeared in interaction networks of
candidate proteins assigned by the IPA software. Therefore, one might speculate, that these three
kinases, namely, CDK1/2, CK2 and PKA might be involved in the transcuction of β-ionone-triggered
PSGR signaling. The Src kinase, which has also been assigned to a network of candidate proteins by
IPA, was recently found to be involved in PSGR-mediated signaling (Spehr 2010). Peptides
phosphorylated by the Src kinase, however, are not likely to be detected in the experimental setup
employed here. Src is a tyrosine kinase whereas the experimental setup is biased to serine and
threonine phosphorylation. As TiO2 enrichment works equally well for serine, threonine and tyrosine
phosphorylated peptides, the resulting set of phosphopeptides, resembles the naturally occurring
composition of the phosphoproteome, which is approximately 1800 : 200 : 1 for serine : threonine :
tyrosine phosphorylation (Mann et al. 2002). In fact, 36 out of 1154 identified phosphopeptides
contained potentially phosphorylated tyrosine residues, of which only eight phoshorylation sites
could confidently be assigned to tyrosine. In order to monitor changes in tyrosine phosphorylation
upon β-ionone treatment, a specific enrichment for tyrosine phosphorylated peptides would be
necessary.

Discussion
103
8.3.2.5 Functional categories of regulated phosphoproteins
According to IPA, proteins determined to be significantly regulated upon β-ionone treatement
appear to be involved in different cellular functions such as proliferation, cell motility, response to
infection, cancer, cell morphology, regulation of cytoskeleton and others. The functional
classification and description of the networks generated by IPA, however, greatly overlapped.
Therefore, proteins with regulated phosphorylation sites were grouped into six distinct functional
categories based on published data: a) Signal transduction, b) Adhesion, Junctions, Cell-cell contact,
c) Cytoskeleton proteins, d) Nuclear factors, DNA repair, Cell cycle progression, e)
Protein/Biomolecule synthesis, RNA processing and f) Others. The number of candidate proteins
assigned to the respective categories is depicted in Figure 34. However, although some functional
information was available for most proteins, the function of the phosphorylation sites which were
found to be regulated in this work is unknow for almost each detected site.
Fig. 35: Functional categories of proteins exhibiting regulated phosphorylation sites. All proteins exhibiting
phosphorylation sites, found to be regulated upon β-ionone treatment were classified in six categories
according to published data. The distribution of candidate proteins to the respective categories is depicted
here as well as the concrete number of assigned proteins
8.3.2.6 Functional category: Signal transduction
In category a), proteins are grouped which are involved in the transduction of external signals to
different target loctions in the cell. In total, 12 phosphoproteins containing 16 significantly regulated
phosphopeptides were grouped in this category termed “Signal transduction” (table 15).

Discussion
104
Table 15: List of phosphoproteins containing significantly regulated phosphopeptides grouped together in
the “signal transduction” category, including gene and proteins name, protein information, phosphopeptide ID
and regulation factors. For further details please refer to Supplementary Table SP 23.
Signal transduction
gene name
protein name protein information phospho-peptide ID
regulation factor 2 min
regulation factor 10 min
GRB10 Growth factor receptor-
bound protein 10
negative regulator of insulin and Wnt signaling; negative regulator of proliferation; highly overexpressed in tumours; positive regulator of Akt downstream of PI3 kinase; found phosphorylation was shown to be necessary for 14-3-3 binding
230, 231 -1.59 -4.18
MME Neprilysin
can slow down proliferation and surpress tumorigenicity of prostate cancer cells; phosphorylation shown on S and T in N-terminus; phosphorylated by CKII, interacts with LYN-SRC related kinase and FAK
823 1.62 1.22
824 2.44 1.43
SLC9A1 Sodium/hydrogen
exchanger 1 scaffold for signaling complexes; Akt substate (pS648); binds do
Ca2+Calmodulin 335, 336,
1494 1.38 4.85
RSL1D1 Ribosomal L1 domain-containing protein 1
negatively regulates PTEN, thereby promoting cell proliferation 1454 -1.78 -0.96
SERPINF1 25 kDa protein potential splice isoform of Pigment epithelium derived factor
(PEDF) 1346, 1347,
1348 14.23 ---
BAG3 Bcl-2-associated
athanogene 3 forms complex with HSP70; anti-apoptotic; involved in
migration 1237, 1238, 1239, 1707
-1.07 -2.32
PRUNE2 Protein prune homolog 2 regulator of Rho signaling; targets RhoA/RhoC 1733 -1.65 -1.25
SMEK1 Serine/threonine-protein phosphatase 4 regulatory
subunit 3A Suppressor of MEK, involved in chemotaxis and cell polarity 752 -1.59 -1.16
IRTKS Insulin receptor tyrosine
kinase substrate
Belongs to IRSp53-like family, substrate of insulin receptor, binds to Rac; promotes actin assembly; role in filopodia
dynamics; CDC42 effector; function and binding to 14-3-3 influenced by phosphorylation at T340/360
684, 1570 -1.33 -3.01
685 average -1.22 -1.85
C1ORF116 Specifically androgen-regulated gene protein
SARG, potential androgene receptor
458 -1.33 -2.19
457 average -1.18 -2.28
456 -1.16 -2.40
STIM1 Stromal interaction
molecule 1 senses calcium depletion from intracellular stores and initiates
uptake 895 -1.31 -2.79
Growth factor receptor-bound protein 10 (GRB10)
The Growth factor receptor-bound protein 10 (GRB10) belongs to the Grb7 family of adaptor
proteins lacking intrinsic enzymatic activity. These adaptor proteins have been shown to connect
various cell surface receptors to downstream signaling pathways (Han et al. 2001). GRB10 has been
extensively studied in the context of insulin signaling and growth, e.g., in cancer (O'Connor 2003).
Apart from its binding affinity to various receptors, GRB10 binds different intracellular target
proteins. For example, it recruits Nedd4 to the insulin receptor, leading to polyubiquitination and
subsequent internalization of the receptor (Monami et al. 2008). Furthermore, it interacts with the
kinases Raf and MEK, thereby transducing external signals, which activate the insulin receptor
(Nantel et al. 1998). The functions of GRB10 as inhibitor or activator of insulin and other signaling
pathways are discussed controversially. This conflict may be due to the existence of at least four

Discussion
105
isoforms of GRB10, which might have opposing effects (Jahn et al. 2002). In addition, GRB10 is known
to be phosphorylated on multiple serine and tyrosine residues, of which only some have been
located so far. Tyrosine phosphorylation of GRB10 is mediated by Tec, Src and Fyn kinases (Mano et
al. 1998; Langlais et al. 2000), whereas the serine residues S150, S418 and S476 are phosphorylated by
p42/44 MAPK (Langlais et al. 2005). Liu and coworkers also reported as well that Grb10 is
phosphorylated on a number of further serine residues, which could not be mapped to distinct sites
in this study.
Following β-ionone treatment, S426 or S428 of GRB10 were identified as exhibiting decreasing
phosphorylation upon treatment. Both serine residues are located in the 14-3-3 protein binding
motif *RSVSEN* and, by Duyster and coworkers phosphorylation of S428 was found to be
phosphorylated in vivo and necessary for the binding of GRB10 to 14-3-3 (Urschel et al. 2005). In
addition, GRB10 was described to be associated with RAC-alpha serine/threonine-protein kinase
(Akt) activity and involved in PI3K-mediated signaling events. Figure 35 illustrates the regulatory
circuit involving phosphorylation of S428 of GRB10 proposed by Urschel et al. (2005). Phosphorylated
GRB10 binds to 14-3-3. Upon dephosphorylation, 14-3-3 dissociates from GRB10 and GRB10 is free to
bind to Akt kinase. The GRB10-Akt complex is recruited to the membrane, where Akt is
phosphorylated by PDK1/2. The phosphorylated Akt in turn phosphorylates GRB10. Thereby GRB10
again dissociates from Akt and can again be bound to 14-3-3. The observed decrease in Grb10
phosphorylation on S428 through β-ionone stimulation thus may be the consequence of reduced Akt
and/or PKD1/2 activity.
Fig. 36: Regulatory mechanism proposed by Urschel et al. (2005) involving the phosphorylation of GRB10 on
S428
. According to the proposed mechanism Grb10 phosphorylated on S428
is associates with 14-3-3 in the
cytoplasm. GRB10 can be dephosphorylated by PP2A, which leads to a release from 14-3-3. Free GRB10 binds
to Akt kinase and recruits it to the membrane. There, Akt is phosphorylated by PDK1/2 and activated Akt kinase
in turn phosphorylates Grb10. Thereby 14-3-3 can again bind to Grb10, which releases the interaction with Akt.
Adapted fromUrschel et al. 2005

Discussion
106
Membrane metalloendopeptidase (MME)
The membrane metalloendopeptidase (MME), also termed CD10, Nephrilysin or neutral
endopeptidase 24.11 (NEP), is a cell surface peptidase expressed in numerous tissues. MME
mediates its tumor suppressor effect by two ways, firstly by cleaving physiologically active peptide
ligands such as bradykinin, oxytocin, Leu- and Met-enkephalins, neurotensin, bombesin or
endothelin-1 (Checler et al. 1984; Shipp et al. 1991; Kenny 1993) and secondly by other mechanisms
mediated by the intracellular domain, which are summarized in Figure 36:
a) Recruitment of signaling proteins to the plasma membrane
b) Scaffold for the formation of larger protein complexes, it binds, for example, tyrosine protein
kinase Lyn, which binds to the p85, which binds to the p110 subunits of PI3K
c) Recruits phosphatase PTEN to the plasma membrane leading to prolonged phosphatase
activity
Fig. 37: Intracellular signaling effects mediated by MME. Apart from cleaving signaling peptides, MME alters
signal transduction events by prolonging PTEN phosphatase activity and forming MME-Lyn-p85 complexes,
which hamper p85 downstream signaling.
Loss or decrease in MME expression has been linked to several cancers including prostate cancer
(Papandreou et al. 1998). Moreover, restored expression of MME was shown to exhibit tumor
suppressor effects on androgene-independent prostate cancer cells (Dai et al. 2001). MME can be
phosphorylated by casein kinase II (CKII) on serine and threonine residues located in the N-terminal
region (Ganju et al. 1996). In the β-ionone stimulation experiment, phosphorylations on S4 and S6
have been identified. While the phosphorylation at S4 was slightly elevated, phosphorylation at S6
was upregulated 2.4 fold after 2 min of exposure to β-ionone. The specific effects of this
phosphorylation on the functionality of MME have not been investigated yet.

Discussion
107
Sodium/hydrogen exchanger 1 (SLC9A1)
The solute carrier family 9 member 1 protein is a Na+/H+ exchanger (termed SLC9A1 or NHE1) which
is essential for the regulation of intra- and extracellular pH. Its activity is required for migration,
invadopodia formation in metastasis and cell survival (Cardone et al. 2005; Schelling and Abu Jawdeh
2008). Apart from its function as Na+/H+ exchanger, it has also been described to provide a scaffold
for the assembly of signaling complexes. It binds to phosphatidylinositol 4,5-bisphosphate (PIP2)-rich
membrane regions, and in turn, binds to numerous other proteins such as Ca2+ Calmodulin (CaM),
Nck interacting kinase (NIK) and proteins of the ezrin/radixin/moesin (ERM) family. In complex with
ERM proteins, NHE1 provides a membrane-bound structural anchor for actin filaments promoting
actin bundle formation and adhesion (Baumgartner et al. 2004).
NHE1 is phosphorylated at diverse serine and threonine residues by different kinases.
Phosphorylation of S648, for example, is mediated by Akt and is involved in actin filament
reorganization upon growth factor signaling (Snabaitis et al. 2008). Phosphorylations at positions
693, 770, 771, 766, 785 and 779 of the amino acid sequence are catalyzed by ERK (Liu et al. 2004).
S785 was found to be phosphorylated in this work, too, but it was not regulated by β-ionone
treatment. The three phosphorylation sites found to be highly up-regulated after 10 min of β-ionone
treatment (S602, T603 and S605), have not been functionally characterized yet. However, they reside in a
stretch in the amino acid sequence, which is associated with NIK binding. NIK also phosphorylates
NHE1, but at a different not exactly mapped site (Yan et al. 2001). But NIK is brought in close
proximity to ERM proteins, when bound to NHE1 and phosphoylates and thereby activates the ERM
proteins and, thus, leads to F-actin stabilization.
Ribosomal L1 domain-containing protein 1 (RSL1D1)
Ribosomal L1 domain-containing protein 1 (RSL1D1) was found to be a negative regulator of PTEN.
Whether this effect is based on direct or indirect interaction, however, has not been sufficiently
studied yet (Ma et al. 2008). In human fibroblast cells, active PTEN leads to cell cycle arrest and
initiates senescence. RSL1D1 surpresses this effect (Ma et al. 2008). In accordance with this
observations, expression levels of this protein are high in young and low in senescent cells (Guo et al.
2004). Consequently, decreased levels of RSL1D1 and subsequent acticity of PTEN may be a potential
reason for senescense. In this work, four phosphorylation sites of RSL1D1 have been identified (S361,
S649, T464, T465). Of these, only S361 was regulated. It showed significant down-regulation after 10 min
of β-ionone stimulation. Although no data about phosphorylations of RSL1D1 have been reported
yet, it is tempting to speculate, that reduced phosphorylation also leads to less PTEN inhibition.

Discussion
108
25kDa Protein
For the 25 kDa Protein no information is available. However, it is very homologous to the Pigment
epithelium derived factor (PEDF) protein (also termed SERPINF1 protein) and may be an alternatively
spliced, shortened version with a different N-terminus (Figure 37). This unique N-terminal peptide of
the 25 kDa Protein (amino acid residues 3-18) was found to be differentially phosphorylated upon β-
ionone treatment on serine residues at positions 3, 6 and 8 of the amino acid sequence.
PEDF MQALVLLLCIGALLGHSSCQNPASPPEEGSPDPDSTGALVEEEDPFFKVP 50
25kDa Protein --------------------------------------------------
PEDF VNKLAAAVSNFGYDLYRVRSSMSPTTNVLLSPLSVATALSALSLGAEQRT 100
25kDa Protein --------------------------------------------------
PEDF ESIIHRALYYDLISSPDIHGTYKELLDTVTAPQKNLKSASRIVFEKKLRI 150
25kDa Protein -------------------------------------------------M 1
:
PEDF KSSFVAPLEKSYGTRPRVLTGNPRLDLQEINNWVQAQMKGKLARSTKEIP 200
25kDa Protein RSAFSFSVWRTS-------------------------------------- 13
:*:* .: ::
PEDF DEISILLLGVAHFKGQWVTKFDSRKTSLEDFYLDEERTVRVPMMSDPKAV 250
25kDa Protein ---------------RWVTKFDSRKTSLEDFYLDEERTVRVPMMSDPKAV 48
:**********************************
PEDF LRYGLDSDLSCKIAQLPLTGSMSIIFFLPLKVTQNLTLIEESLTSEFIHD 300
25kDa Protein LRYGLDSDLSCKIAQLPLTGSMSIIFFLPLKVTQNLTLIEESLTSEFIHD 98
**************************************************
PEDF IDRELKTVQAVLTVPKLKLSYEGEVTKSLQEMKLQSLFDSPDFSKITGKP 350
25kDa Protein IDRELKTVQAVLTVPKLKLSYEGEVTKSLQEMKLQSLFDSPDFSKITGKP 148
**************************************************
PEDF IKLTQVEHRAGFEWNEDGAGTTPSPGLQPAHLTFPLDYHLNQPFIFVLRD 400
25kDa Protein IKLTQVEHRAGFEWNEDGAGTTPSPGLQPAHLTFPLDYHLNQPFIFVLRD 198
**************************************************
PEDF TDTGALLFIGKILDPRGP 418
25kDa Protein TDTGALLFIGKILDPRGP 216
******************
Fig. 38: Amino acid sequence alignment of the 25kDa Protein and the human PEDF protein. Peptides
identified by database searching are colored. Peptides shared by both proteins are marked in green. Unique
peptides are highlighted in yellow. Identified phosphosites are marked in red. Both proteins have 100 %
homology in the C-terminus, whereas the the N-terminus is different.
Neither the phosphorylation sites nor their functions are known so far. For its homologue PEDF,
three phosphorylation sites are known at positions 24, 114 and 227 of the PEDF amino acid
sequence, which are essential for the determination if the protein exhibits neurotrophic or
antiangiogenic function (Maik-Rachline et al. 2005). The neurotrophic effects of PEDF are reported to
be mediated by its N-terminus (Alberdi et al. 1999; Aymerich et al. 2001). In contrast to this, PEDF
was reported to be one of the most potent antiangiogenesis factors, inhibiting endothelial cell

Discussion
109
migration and neovascularization (Dawson et al. 1999). However, the phosphorylation sites found to
be regulated upon β-ionone treatment correspond to none of the previously reported sites.
Bcl-2-associated athanogene 3 (BAG3)
BAG3 belongs to the Bag family of co-chaperones that regulate the ATPase activity of heat-shock
protein 70 chaperones. It has a general anti-apoptotic function and has been shown to be involved in
migration, adhesion and invasion in various cancer model systems (Doong et al. 2000; Iwasaki et al.
2007; McCollum et al. 2010). In cells undergoing apoptosis, BAG3 is cleaved by caspases (Wang et al.
2010). S285 and T289 were found to be down-regulated upon β-ionone treatment. Neither on the
function of these phosphorylation sites nor on the function of the domain they are located in,
information are available.
Protein prune homolog 2 (PRUNE2)
PRUNE2 is a RhoA- and RhoC-interacting protein, which is up-regulated in prostate cancer tissue and
metastases (Clarke et al. 2009). It was shown to inhibit proliferation (Soh and Low 2008), potentially
via RhoA and RhoC, which are involved in oncogenic transformation and metastasis, respectively
(Ridley 2004). The two phosphorylation sites (S595, S597), which have been found to be slightly down-
regulated upon PSGR activation, are hitherto unknown and no functional characterization has been
reported yet.
Serine/threonine-protein phosphatase 4 regulatory subunit 3A (SMEK1)
The serine/threonine-protein phosphatase 4 regulatory subunit 3A (SMEK homologue 1) is a
homologue of SMEK. SMEK is a suppressor of MEK1, which is a MAP kinase kinase acting upstream of
ERK1/2 and which is involved in the establishment and maintenance of cell polarity, chemotaxis and
cancer cell proliferation (Fremin and Meloche 2010). The phosphorylation site identified in SMEK1
(S741) was down-regulated upon β-ionone treatment.
Insulin receptor tyrosine kinase substrate (IRTKS)
IRTKS is a protein involved in actin bundling (Millard et al. 2007). It is homologous to the IRSp53
protein, which is involved in filopodia generation (Gupton and Gertler 2007). It was discovered as
insulin receptor substrate and has been described to interact with Rac1 (Miki et al. 2000) and Cdc42
(Gupton and Gertler 2007), thereby promoting cell motility and invasiveness in cancer (Funato et al.

Discussion
110
2004). In contrast to IRSp53, IRTKS only interacts with Rac1 and may be implicated in lamellopodia
rather than filopodia generation (Millard et al. 2007).
Phosphorylation of the threonine residues 340 and 360 of IRSp53 was shown to be required for
binding of IRSp53 to 14-3-3 (Robens et al. 2010). Phosphorylation sites identified in this work for
IRTKS (T257 and S266) are not in a region homologous to the 14-3-3 binding region in IRSp53. The sites
in IRTKS were found to be down-regulated upon treatment with β-ionone.
Specifically androgen-regulated gene protein (SARG)
C1ORF116 transcription is regulated by androgen and, therefore, the resulting gene product is
termed specifically androgen-regulated gene (SARG) (Cleutjens et al. 1997) which has been shown to
be implicated in prostate cancerogenesis (Lin et al. 2000). It has high expression levels in both
prostate tissue and in LNCaP-1F5 cells. In 2004, Trapman and coworkers identified SARG as potential
androgen receptor (Steketee et al. 2004). They found homology in the domain structure of SARG and
the classical AR. Of the three SARG phosphorylation sites found to be regulated in β-ionone
stimulation experiments (S502, S508, S532), two have already been found in the global
phosphoproteomics analysis (S502, S532) conducted for method evaluation previously in this work. All
three were found to be downregulated upon treatment by β-ionone. These three phosphorylation
sites have not been reported previously and nothing is known about their function. Phosphorylation
of AR occurs on the one hand on tyrosine residues by Src kinase, which is associated with prostate
cancer progression (Guo et al. 2006). Alternatively, AR can be phosphorylated by further kinases such
as Ack1, which regulates its DNA binding activity (Mahajan et al. 2007). A number of phosphorylated
serine residues in AR have been identified in large-scale phosphoproteomics experiments
(Oppermann et al. 2009). However, they have not been functionally characterized yet. In addition to
phosphorylation, AR functionality is also regulated by sumoylation (Poukka et al. 2000). Interestingly,
in the β-ionone treatment study in this work (Chapter 6.3.2.9) the SUMO ligase RANBP2 was found to
be phosphorylated on multiple sites. Further factors known to be involved in the regulation of AR
activity are coactivators such as TMF1. Phosphorylated peptides of this protein were also found to be
downregulated, but with a factor just outside the score cut-off for significant regulation (0.75/0.595).
Stromal interaction molecule 1 (STIM1)
Upon depletion of intracellular calcium stores, the endoplasmatic reticulum protein stromal
interaction molecule 1 (STIM1) associates with the ORAI protein in the plasma membrane, thereby
initiating store-operated calcium entry (SOCE). A number of other proteins like TRPCs and SERCA are
recruited to this protein complex and are involved in the intricate multistep process of SOCE (Vaca

Discussion
111
2010). Two phosphorylation sites of this protein have been identified in the β-ionone study in this
work. Phosphorylation of S618 was not regulated by β-ionone, whereas S575 phosphorylation was
significantly down-regulated upon stimulation. These distinct phosphorylation sites have not been
identified in STIM1 before. However, phosphorylation of S486 and S668 was reported to suppress SOCE
by inhibiting STIM1 localization to the plasma membrane (Smyth et al. 2010). Putney and coworkers
also suggested other phosphorylation sites in the region C-terminal to amino acid residue 482 may
be involved in this inhibition. Hence, the downregulation of S575 phosphorylation upon stimulation
may lead to an activation of SOCE.
8.3.2.7 Functional category: Adhesion, Junctions and Cell-cell contact
Nine proteins found to be regulated in this work have been described in association with different
kinds of junctions, which are involved in cell-cell contacts and adhesion. Apart from cytoskeletal
proteins (category c), junction proteins are essential for the tissue integrity, matrix adhesion and cell
polarity. Inversely, the disassembly of junctions is required for migration, motility and metastasis
(Friedl and Gilmour 2009; Friedl and Wolf 2010; Herath and Boyd 2010). Therefore, they are of
special interest in the context of prostate cancer.
Table 16: List of proteins which contain differentially regulated phosphopeptides and which are involved in
the formation of differend kinds of junctions. Proteins exhibiting altered expression levels are marked in
purple. Gene names and protein names are listed, as well as additional protein information, the
phosphopeptide ID of the regulated peptides and corresponding regulation factors. For further details refer to
Supplementary Table SP 23.
Adhesion, Junctions, Cell-cell contact gene name
protein name protein information phospho-peptide ID
regulation factor 2 min
regulation factor 10 min
GPR126 Probable G-protein
coupled receptor 126 receptor of adhesion family; essential for Schwann cell myelination 765, 766 2.60 -1.25
DSP Desmoplakin phosphorylation in C-terminal domain negatively regulates
interaction with intermediate filaments 266, 268 -1.42 -1.86
EFNB2 Ephrin-B2 Tumor angiogenesis; tissue organization 70 -2.31 -1.66
NDRG1 N-myc downstream
regulated 1
pro-apoptotic tumor suppressor; enhances recycling and stability of E-cadherin; phosphorylation does not interrupt binding to E-
cadherin/beta-catenin
385, 1499 -3.29 -1.92
382, 383, 1498
-2.01 -1.15
NDRG3 NDRG family member 3 overexpression leads to enhanced migration and tumor growth 83 1.32 1.81
TJP1 Tight junction protein ZO-
1
directly interacts with Shroom2 at tight junctions; translocates from cytoplasm to membrane to form cell-cell-contacts, forms complex with catenins; membrane associated guanylate kinase homologue
1031 -1.59 -2.31
PPFIBP2 Liprin-beta-2 Involved in cell matrix-interaction; involved in focal adhesions 1648 -1.42 -3.57

Discussion
112
gene name
protein name protein information phospho-peptide ID
regulation factor 2 min
regulation factor 10 min
SHROOM3 Protein Shroom3 recruits proteins to cell junctions; involved in changes in cell shape 599 1.97 -1.32
SCARF2 Scavenger receptor class
F member 2 SCARF homologue; role in differentiation and aggregation 983 -2.39 -2.11
SLC4A4 solute carrier family 4,
sodium bicarbonate cotransporter, member 4
phosphorylated by PKA; interacts with ATPase; involved in acid-base homeostasis; colocalizes with E-cadherins but not with ZO1,
potential role in cancer
308 average 2.57 1.96
310, 311, 1489
3.38 1.87
312, 1490 3.74 6.08
G-protein coupled receptor 126 (GPR126)
The G-protein coupled receptor 126 (also termed VIGR or DREG) is an orphan receptor and member
of the LNB-TM7 subfamily of class B GPCR (Moriguchi et al. 2004; Stehlik et al. 2004). LNB-TM7
receptors all comprise an unusually large extracellular domain; their physiological function is not well
characterized yet. The characteristics of the complex extracellular domains, though, suggest that
these proteins play a role in cell migration and adhesion. Furthermore they may possess similar
signaling properties of class B peptide hormon GPCRs (Stacey et al. 2000). GPR126 was
independently identified and characterized in 2004 by two groups. Stehlik et al. found that cell
surface expression is inducible in endothelial cells and therefore termed it vascular inducible G-
protein coupled receptor (VIGR, Stehlik et al. 2004). Moriguchi et al. found that expression of
GPR126 is developmentally regulated and that it can be proteolytically cleaved at two sites in the
extracellular N-terminus, indicating that it may have a dual role as receptor and, regarding the
proteolytic products, as ligand or signaling molecule. They coined the term “develpomentally
regulated G-protein coupled receptor“ for GPR126 (DREG, Moriguchi et al. 2004). In 2009, Monk et
al. reported that GPR126 functions as a receptor to initiate myelination of Schwann cells via transient
elevation of cAMP (Monk et al. 2009).
A GPR126 peptide comprising two phosphorylation sites, S1165 and S1168, was found to be significantly
up-regulated (2.6 fold) after 2 min. These phosphorylation sites, of which one has been identified in a
global phosphoproteomics study of mitotic phosphorylation in HeLa cells before (Dephoure et al.
2008), reside within the cytoplasmic C-terminus. So far, information about their functional
importance are not available.
A closer look at the abundance ratios of all three unique peptides assigned to GPR126 revealed a
consistent up-regulation in the same range of both phosphorylated and non-phosphorylated
peptides indicating that not only the phosphopeptide but the abundance of the entire protein was
up-reguated. This could be due to an up-regulation of total protein abundance within 2 min
(Dieterich et al. 2010). Beyond that, the reason for the higher abundance of GPR126 following
stimulation of LNCaP cells with β-ionone may be a change in subcellular location. It is conceivable

Discussion
113
that the receptor is internalized upon stimulation and is thereupon enriched in the cytosolic fraction,
which was analyzed in the phosphoproteomics study. Stimulus-induced receptor internalization via
arrestin binding is known to require the phosphorylation at the receptors cytoplasmic tail (Doherty
and McMahon 2009). Since the GPR126 was found to be phosphorylated at the cytoplasmic tail in
this work, this may indicate internalization.
In summary, the GPR126 may be an interesting candidate for further investigations to analyze a
potential involvement in PSGR-mediating signaling.
Desmoplakin (DSP)
Desmoplakin is one of the main components of desmosomes. Desmosomes are adherent junctions,
which interconnect cells, thereby preventing tissue from being damaged by mechanic stress.
Desmoplakin is an intermediate filament (IF) binding protein, which links IFs to the plasma
membrane at desmosomes (Godsel et al. 2004). In differentiated cells, it also recruits microtubili to
desmosomes via ninein (Lechler and Fuchs 2007). By linking desmosomes to the cytoskeleton,
desmoplakin contributes to the stability and adhesion in tissue. The loss of desmosomes or
desmosomal proteins results in reduced cell-cell contact as well as increased motility and
invasiveness of cancer cells (Depondt et al. 1999). Desmoplakin and other desmosomal proteins such
as plakophilin-I were recently suggested as potential biomarker for early stages and progression of
squamous cell carcinoma, since their abundance at cell-cell junctions decreases during cancer
progression (Narayana et al. 2010). A recent proteomics study found desmoplakin, amongst others,
to be down-regulated in the transition of epithelial cells with restricted migration to mesenchymal
cells with increased motility and invasiveness (Chen, Y. S. et al. 2010).
A potential PKA phosphorylation site has been described at the C-terminal S2849 of DSP. Its
phosphorylation has been shown to inhibit binding between DSP and IFs (Stappenbeck et al. 1994).
A phosphopeptide containing this serine residue was identified. However, the phosphorylation could
not confidently be assigned to a specific site and the peptide was not quantifiable. Instead, another
phosphopeptide containing phosphorylated S2820 and S2825 was found to be significantly
downregulated during β-ionone treatment. Both phosphorylation sites have been identified
previously, but only in large-scale phosphoproteomic studies without further functional
characterization.
Since S2820 and S2825 are also located as well in the C-terminus proximate to the characterized S2849 ,
one might speculate that phosphorylation of S2820 and S2825 may also be implicated in IF binding and
that the observed down-regulation could strenghten DSP to IF binding, thereby contributing to the
rigidity of the cell and inhibition of migration.

Discussion
114
Ephirn-B2 (EFNB2)
Ephrins are membrane-bound ligands of Ephrin tyrosine receptor kinases. Via the ephrin
receptor/ephrin system, cells “sense” their cell-to-cell density, resulting in repulsion, adhesion or
migration and eventually leading to self-organization of cells into tissues via complex bi-directional
phosphotyrosine-mediated signaling cascades (Xu, Q. et al. 2000; Jorgensen et al. 2009). Increased
expression of ephrins and their receptors have been observed in many types of cancer (Campbell and
Robbins 2008). The ligand ephrin-B2, which is an integral membrane protein, has been reported to
be involved in tumor growth and tumor angiogenesis (Noren et al. 2004; Hainaud et al. 2006).
Maekawa et al. (Maekawa et al. 2003) demonstrated that soluble ephrin-B2 induced migration in
endothelial cells via ephrin B receptor signaling in targeted cells. In cells expressing ephrin-B2 ligands,
its reverse signaling was shown to mediate endothelial tip cell guidance, thereby promoting tumor
angiogenesis (Sawamiphak et al. 2010). Moreover, Bochenek et al. (Bochenek et al. 2010)
demonstrated, that ephrin-B2 can also modulate endothelial cell motility in a receptor independent
way, since constituitive overexpression of ephrin-B2 alone was sufficient to induce cell morphology
changes.
Tyrosine phosphorylation in the extracellular domain of EFNB2 promotes cell migration and invasion
(Nakada et al. 2010), whereas phosphorylation at a serine residue at the C-terminus regulates AMPA
receptor trafficking (Essmann et al. 2008). The phosphorylation site S260, identified in this work, was
found to be downregulated by β-ionone treatment. Its functional relevance, however, remains to be
elucidated.
N-myc downstream regulated proteins 1 and 3 (NDRG1/NDRG3)
The N-myc downstream regulated protein family is comprised of the four proteins, namely NDRG1-4.
All members contain a conserved α/β hydrolase-fold region but lack hydrolyse enzyme function.
NDRG proteins are involved in differentiation and show increasing expression levels from birth to
adulthood. They have a tumor-suppressive function and are frequently found to be differentially
regulated in different cancers (Melotte et al. 2010). NDRG1 expression, for example, is reversely
correlated with survival in prostate cancer, since overexpression of NDRG1 leads to reduced
invasiveness. According to Kachhap et al. (Kachhap et al. 2007), NDRG1 is involved the vesicular
transport and recycling of E-cadherin in prostate cancer, thereby stabilizing E-cadherin and leading to
reduced motility. In contrast, overexpression of NDRG3 in prostate cancer leads to increased
proliferation and migration (Wang, W. et al. 2009; Melotte et al. 2010).
In 2000, Miyata and coworkers found that NDRG1 is phosphorylated and predicted at least seven
phosphorylation sites (Agarwala et al. 2000). In addition, they showed, that the phosphorylation level

Discussion
115
of NDRG1 was lowest, when PKA and CaMKII kinases were blocked, suggesting that these kinases are
involved in phosphorylating NDRG1. In a proteomics study of the interactome of NDRG1 (Tu et al.
2007), proteins of both protein synthesis and the proteasomal degradation pathways have also been
identified as interaction partners of NDRG1 in LNCaP cells. Furthermore, they also found MME (see
chapter 3.3.4.2) to interact with NDRG1, as well as the cell adhsion molecules β-catenin and E-
cadherin. In addition, they reported phosphorylation of NDRG1 at S330 and T366 , which was
prominently mediated by PKA. The phosphorylation level at these two sites did not influence the
binding of NDRG1 to β-catenin and E-cadherin. In the β-ionone study with LNCaP cells,
phosphorylation of S330 was found to be downregulated. Another peptide containing three
phosphorylation sites at S362, S364 and additional phosphorylation site in close proximity to both
serines, that could not be specified, was also found to be downregulated after β-ionone treatment.
Since T366 has already been reported to be phosphorylated by Tu et al. (2007), it may be the
unidentified phosphorylated residue in this peptide. So far, nothing is known about the functional
importance of these phosphorylation sites.
For NDRG3, phosphorylations were found to be regulated at S331 and at S334/335. For the latter
localization different peptide have been observed, which support one or the other localization. These
sites have been reported previously, but in large scale proteomics studies (Dephoure et al. 2008;
Mayya et al. 2009), without functional characterization. The phosphopeptide containing these sites
was upregulated following β-ionone treatment.
Amino acid sequence alignment of NDRG1 and NDRG3 shows that the regions in both proteins
containing the observed phosphorylation sites are highly conserved among these proteins but not
identical (Figure 38). The converse regulation in phosphorylation level of both proteins, might reflect
their opposing functions.

Discussion
116
NDRG3 -MDELQDVQLTEIKPLLND-KNGTRNFQDFDCQEHDIETTHGVVHVTIRG 48
NDRG1 MSREMQDVDLAEVKPLVEKGETITGLLQEFDVQEQDIETLHGSVHVTLCG 50
*:***:*:*:***::. :. * :*:** **:**** ** ****: *
NDRG3 LPKGNRPVILTYHDIGLNHKSCFNAFFNFEDMQEITQHFAVCHVDAPGQQ 98
NDRG1 TPKGNRPVILTYHDIGMNHKTCYNPLFNYEDMQEITQHFAVCHVDAPGQQ 100
***************:***:*:*.:**:*********************
NDRG3 EGAPSFPTGYQYPTMDELAEMLPPVLTHLSLKSIIGIGVGAGAYILSRFA 148
NDRG1 DGAASFPAGYMYPSMDQLAEMLPGVLQQFGLKSIIGMGTGAGAYILTRFA 150
:**.***:** **:**:****** ** ::.******:*.*******:***
NDRG3 LNHPELVEGLVLINVDPCAKGWIDWAASKLSGLTTNVVDIILAHHFGQEE 198
NDRG1 LNNPEMVEGLVLINVNPCAEGWMDWAASKISGWTQALPDMVVSHLFGKEE 200
**:**:*********:***:**:******:** * : *::::* **:**
NDRG3 LQANLDLIQTYRMHIAQDINQDNLQLFLNSYNGRRDLEIERPILGQNDNK 248
NDRG1 MQSNVEVVHTYRQHIVNDMNPGNLHLFINAYNSRRDLEIERPMPG---TH 247
:*:*:::::*** **.:*:* .**:**:*:**.*********: * .:
NDRG3 SKTLKCSTLLVVGDNSPAVEAVVECNSRLNPINTTLLKMADCGGLPQVVQ 298
NDRG1 TVTLQCPALLVVGDSSPAVDAVVECNSKLDPTKTTLLKMADCGGLPQISQ 297
: **:*.:******.****:*******:*:* :**************: *
NDRG3 PGKLTEAFKYFLQGMGYIPSASMTRLARSRTHSTSSSLGSGESPFSRSVT 348
NDRG1 PAKLAEAFKYFVQGMGYMPSASMTRLMRSRTAS-GSSVTSLDGTRSRSHT 346
*.**:******:*****:******** **** * .**: * :.. *** *
NDRG3 SN-------QSDGTQESCESPD--VLDRH------------QTMEVSC 375
NDRG1 SEGTRSRSHTSEGTRSRSHTSEGAHLDITPNSGAAGNSAGPKSMEVSC 394
*: *:**:. ..:.: ** ::*****
Fig. 39: Amino acid sequence alignment of the proteins NDRG1 and NDRG3 by ClustalW. Unique peptides
identified by database searching are coloured in yellow. Identified phosphosites are marked in red. For both
proteins, phosphorylated peptides have been identified and found to be regulated by β-ionone treatment.
Tight junction protein ZO- 1 (TJP1)
Tight junction protein ZO-1 (briefly ZO-1) belongs to the family of membrane-associated guanylate
kinases-like proteins. On the one hand, it has been reported to interact with different junctional
transmembrane proteins such as occludins and catenins as well as with cytoskeletal proteins like
actin filaments (Itoh et al. 1997) or Shroom2 ((Etournay et al. 2007), chapter 3.3.6), thereby cross-
linking the cytoskeleton to the membrane and stabilizing the respective junctions, which leads to a
decrease in cell motility (Bauer et al. 2010). On the other hand, ZO-1 has been shown to act as a
scaffolding protein which recruits other proteins such as signaling molecules, adapters and
transcriptional regulators to the cytoplasmic surface of different kinds of junctions. In addition, ZO-1
is able to associate with regulatory molecules and shuttles between the cytoplasm and the nucleus.
There is evidence that, apart from its role in stabilizing junctions, ZO-1 is implicated in cell signaling
and cell cycle progression. Furthermore, ZO-1 is downregulated in many cancers (Bauer et al. 2010).
PKC-mediated tyrosine phosphorylation of ZO-1 has been shown to disrupt occludin-ZO-1 and
catenin/cadherin-ZO-1 complexes, but the exact site of phosphorylation was not determined (Rao et
al. 2002). The phosphorylation of S168 was found to be involved in the targeting of ZO-1 to either
junctions or lamellae and thereby in the regulation of lung cancer cell migration (Tuomi et al. 2009).

Discussion
117
Following β-ionone treatment of LNCaP cells, the phosphorylation of S912 was gradually
downregulated. This phosphorylation site has been identified before but has not been functionally
studied yet (Cantin et al. 2008; Dephoure et al. 2008).
Protein tyrosine phosphatase receptor type f polypeptide-interacting protein-binding protein 2
(PPFIBP2)
Protein tyrosine phosphatase receptor type f polypeptide-interacting protein-binding protein 2
(PPFIBP2 or Liprin-beta 2) binds to alpha-liprins, which in turn bind to LAR family protein tyrosine
phosphatases. Liprins are proposed to be involved in the disassembly of focal adhesions and in
axonal guidance (Serra-Pages et al. 1998). Since their first characterization, liprins and especially
beta-liprins have not been further investigated. Liprin-beta 1 was found to be essential for lymphatic
vessel integrity in Xenopus species (Norrmen et al. 2010).
One phosphopeptide of liprin-beta 2 was found to be downregulated after 10 min of β-ionone
treatment. Although the phosphorylation site could not be localized confidently, it is most likely at
T510 or S512. Both sites have not been described yet; however, a phosphorylation at S512 is proposed by
similarity prediction in the uniprot database (http://www.uniprot.org/uniprot/Q8ND30).
Shroom3
Shroom3 was first described in 1999 as an actin binding protein required for neural tube
morphogenesis in mice. It was named after the “mushroom”-like phenotype, which characterizes
embryos carrying mutations in this gene (Hildebrand and Soriano 1999). In 2006, the four related
proteins Shroom, APX, APXL, and KIAA1202 were combined to a protein family and named Shroom3,
Shroom1, Shroom2 and Shroom4, respectively. All shroom proteins are involved in the
morphogenesis of epithelial cells. Shroom3 has been suggested to be required for apical constriction
and apico-basal elongation during embryo morphogenesis, regulating this process via interaction
with myosin II (Hildebrand 2005). Shroom3 physically binds Rho kinases and recruits them to apical
junctions (Nishimura and Takeichi 2008).
In the β-ionone study, two phosphorylation sites have been found in Shroom3, namely S910 and S1221.
While the S910 phosphorylation level remains constant during β-ionone treatment, phosphorylation at
S1221 was first upregulated after 2 min and then downregulated after 10 min. Although these
phosphorylation sites have been reported previously, they have not been functionally characterized
yet (Dephoure et al. 2008).

Discussion
118
Scavenger receptor class F member 2 (SCARF2)
SCARF2 is a homologue of the endothelial cells scavenger receptor (Scarf), which mediates the
binding and degradation of acetylated low density lipoprotein. Beyond its potential role in cell
aggregation (Ishii et al. 2002), nothing is known of the functions of SCARF2. In SCARF2, four
phosphorylations sites have been identified, of which two (S687, S698) were downregulated upon
treatment.
Solute carrier family 4, sodium bicarbonate cotransporter, member 4 ( SLC4A4)
The electrogenic sodium bicarbonate cotransporter 1 (SLC4A4, NCB, NCB1 or NCBE1) is co-localized
with E-cadherins in the basolateral membrane of polarized cells. It is constituitively internalized,
which is prevented by PKC inhibitors (Perry et al. 2008; Perry et al. 2009). In renal epithelia cells, the
activity of NBC1 isoform, also identified in the β-ionone study, was shown to be regulated via Src
family kinases, Ras, and the classical MAPK-pathway (Robey et al. 2001). NBC1 mediates the
transport of Na+ and HCO3- across the plasma membrane in a stoichiometry of 3:1. Phosphorylation
at S982 shifts this stoichiomietry to 2:1 (Gross and Kurtz 2002).
In this work, five phosphorylation sites of SLC4A4 have been newly identified. They all show dramatic
up-regulation following treatment with β-ionone.
8.3.2.8 Functional category: Cytoskeleton-associated proteins
The mode of cell migration is determined by cell type and their molecular as well as physical
environment. All modes of migration, however, require a certain degree of deformation of the cell.
These mechanical properties are essential for a cell´s ability to migrate and are mediated by
cytoskeletal proteins (Kumar et al. 2009b; Friedl and Wolf 2010). In addition, transport along
cytosceletal structures is involved in numerous essential cellular processes, for example the
separation of chromosomes during mitosis. Cytoskeletal proteins or proteins associated with the
cytoskeleton, which have been regulated by β-ionone are listed below in Table 17.

Discussion
119
Table 17: Cytosceleton-associated proteins, containing phosphopeptides significantly up- or down-regulated
upon treatment with β-ionone, are listed in this table. Gene and protein names are given as well as some
additional information, the respective MaxQuant ID of the regulated phosphopeptide and their regulation
factors. For detailed information on the respective peptides, please refer to Supplementary Table SP 23.
Proteins, whose abundance is regulated rather than their phosphorylation levels, are coloured in green.
Cytoskeleton-associated Proteins
gene name
protein name protein identification phospho-peptide ID
regulation factor 2 min
regulation factor 10 min
MAP1B Microtubule-associated
protein 1B
Map1B light chain negatively regulates TP53; it is phosphorylated in phase 1 by GSK3 and CDK5 and in phase 2 by CKII; it is required for netrin signaling; the interaction of Map1B light chain and Pes1
induces a cytoplasmic sequestration of Pes1, which results in a reduction of cell proliferation; Map1B light chain binds to
serotonin typ 3 receptors and accelerates receptor desensitization and reduce steady-state receptor density at the cell membrane.
148, 149 -3.25 -1.82
MAP2 Microtubule-associated
protein 2
links PKA to microtubules; MAP2 stabilizes microtubuli, thereby leading to cell cycle arrest and growth inhibition, microtubuli
binding activity decreases after differentiation, phosphorylation by MAPK and cdc2 weakens tubulin interaction
40, 42, 1434 2.52 1.93
39, 41 3.00 1.75
1432, 1433 3.53 -2.43
151 -1.86 -1.59
MAPT Microtubule-associated
protein tau neurodegeneration; phosphorylation isoforms found in prostate
cancer are similar to alzheimer forms 434, 435, 436, 1510
1.78 1.44
MAP4 Microtubule-associated
protein 4
mitotic machinery, receptor recycling/trafficking, opposing effects to stathmin, phosphorylated by MAP kinase, involved in M-phase
microtubule dynamic 1672 -1.33 -2.09
STMN1 Stathmin phosphorylation mediate entry and exit of mitosis; growth
suppression; accumulation in G2/M phase 1190 -3.93 1.55
CLASP2 Cytoplasmic linker-
associated protein 2
phosphorylated by PKC and GSK3, phosphorylation controls activity, involved in migration through Golgi trafficking and
microtubule dynamics, interacts with actin 1349 -1.31 -1.82
CLIP1 CAP-GLY domain containing linker
protein 1
essential for normal cell cycle progression; holds centrosomes together; microtubule interaction
247, 248, 249
1.60 -1.01
ADD3 Gamma-adducin mediates association of spectrin and actin, is phosporylated by
PKC, increased phosphorylation leads to tumor progression, regulated by Calmodulin
56, 57, 58 -2.03 ----
EML3 Echinoderm
microtubule-associated protein-like 3
required for correct alignment of chromosomes in metaphase 650 -2.16 -5.09
FNBP1L Formin-binding protein
1-like involved in actin organization and migration; interaction with N-
WASP-WIP complex, regulate cell polarity, metastasis 291 1.54 -5.09
SSFA2 Sperm-specific antigen
2 promotes cell adhesion and tumorigenity, cytoskeleton associated
(actin), involved in structural integrity and signal transduction 1071 -2.09 -2.23
AHNAK Desmoyokin cell migration and Ca2+ entry, phosphorylated by PKA 376 -1.43 -1.83
SHROOM2 Protein Shroom2 role in morphogenesis, directly binds to ZO-1, myosin and actin 283, 284 -3.92 -2.64
Microtubule-associated proteins: variants MAP 2, MAP 1B, MAP 4 and MAPT
Microtubules provide a dynamic network, which is essential for chromosome segregation during
mitosis and for the establishment of cell polarity (Zhai et al. 1996). These processes are regulated
and mediated by motorproteins and microtubule- (MT-) associated proteins (MAPs) (Bhat and
Setaluri 2007). All MAPs bind to MTs and promote MT stabilization.

Discussion
120
Microtubule-associated protein 1B (MAP 1B)
MAP 1B is a phosphorylated microtubule-binding protein, which is required, amongst others, for cell
shape determination and axonal transport. It is a phosphoprotein that has extensively been studied
in neuronal cells, where it is down-regulated during devolopment with its expression remaining high
only in dynamic areas of the brain. In neuronal cells, phosphorylated MAP 1B is of highest abundance
in growth cones. Its subcellular localization varies. It has been detected at the plasma membrane or
as soluble protein (Riederer 2007). Its involvement in migration is represented by its participation in
netrin signaling. Netrin structurally resembles laminin and functions as growth factor as well as
attractive or repulsive chemotactic cue (Del Rio et al. 2004). In addition, Map 1B light chain binds to
serotonin type 3 receptors, accelerates receptor desensitization, and reduces steady-state receptor
density at the cell membrane (Sun et al. 2008). Furthermore, MAP 1B is involved in several processes
in the context of cell proliferation and growth. It has been shown to negatively regulate the tumor
suppressor protein TP53 (Lee, S. Y. et al. 2008). Furthermore, the interaction of Map 1B light chain
and Pes1 induces a cytoplasmic sequestration of otherwise nuclear Pes1, which results in a reduction
of cell proliferation (Lerch-Gaggl et al. 2007). Map 1B phosphorylation is involved in modulating its
binding to microfilaments and MT dynamics. MAP1B is phosphorylated in two phases: in phase 1, it is
phosphorlyated by GSK3, PKD and CDK5 and in phase 2 by CKII. Phase 1 phosphorlyation is
development-related and is reduced in adulthood, whereas mode 2 phosphorylation can occur
throughout life time.
After β-ionone stimulation, numerous phosphorylation sites have been identified to be considerably
downreguated. However, the corresponding non-phosphorylated peptides, of MAP 1B appeared to
be regulated with approximately the same factor, indicating that the actual phosphorylation level of
the respcective peptides have not been downregulated, but the abundance of the entire protein in
the cytoplasmic fraction.
Microtubule-associated protein 2 (MAP 2)
The microtubule-associated protein 2 is another member of the MAP family. MAP 2 initiates tubulin
bundling in neuronal and non-neuronal cells (Kalcheva et al. 1998). Differential expression of MAP 2
has been described in several cancer types. It was shown to stabilize MTs, leading to cell cycle arrest
and growth inhibition. Therefore, induction of MAP 2 expression in metastatic cancer is thought to
be a promising approach for treatment of such cancers (Bhat and Setaluri 2007). Furthermore, MAP 2
binds to myosine VIIA, a motor protein involved in the transport of cargo along cytoskeletal
structures. This suggests an additional role for MAP 2 in intracellular transport (Todorov et al. 2001).

Discussion
121
Apart from its functions in cytosceletal stability and cargo transport, it has also been shown to act as
MT anchor for regulatory proteins such as PKA to microtubuli (Leterrier et al. 2009).
MAP 2 is highly phoshorylated (up to 46 times; (Sanchez et al. 2000)) and its phosphorlyation is
developmentally regulated. Among others, MAP 2 phosphorylation regulates its binding to
cytoskeletal components. The phosphorylation level of MAP2 is regulated by a variety of different
kinases such as MAPK, CDC2 (Goldenring et al. 1985), CaMKII, PDKs, GSK3 and PKA (Sanchez et al.
2000). The cAMP-dependent phosphorylation of MAP 2 by PKA reduces the ability of MAP 2 to form
MT networks (Leterrier et al. 2009).
In this work, seven phosphorylation sites were identified in MAP 2 and four of these could be
mapped to distinct amino acid residues. Following β-ionone treatment, the average phosphorylation
level of MAP 2 appeared to be up-regulated approximately 3-fold after 2 min. However, as already
shown for the protein MAP 1B, the elevated level of phosphorylation rather reflected increased
abundance of MAP 2 in the cytoplasmic fraction, since both phosphorylated and non-phosphorylated
peptides generally showed similar regulation factors. The peptide AGKSGTSTPTTPGSTAITPGTPPSYSSR
was identified to be phosphorylated at three amino acid residues. This peptide was significantly
down-regulated after 10 min of β-ionone treatment, especially when considered in relation to the
overall protein abundance. However, the MS/MS data did not allow for assigning these
phosphorylations to a specific amino acid residue. This may be due to the fact that seven
phosphorylation sites are predicted in this region (http://www.uniprot.org/uniprot/P11137),
potentially resulting in coeluting isobaric phospho-isoforms and “mixed” MS/MS spectra that are
difficult to interprete.
Microtubule-associated protein tau (MAPT)
Of all MAPs, MAPT is the most extensively studied protein. It was described as a MT binding
phosphoprotein in 1984 (Lindwall and Cole 1984) and is found predominantly in neurons.
Hyperphosphorylated tau is associated with neurodegenerative diseases such as Alzheimer
(reviewed in Buee et al. 2000). The phosphorylation at the identified sites in tau in this work (T548,
S552 both unaltered; S713, S717, S721 up-regulated) is mediated by GS3K and have also been found
paired helical filaments of Alzheimer patients (Avila 2009). However, in hyperphosphorylated tau up
to 40 sites were reported with high stoechiometry (Avila 2009) and therefore, if tau was
hyperphophosphorylated in LNCaP cells, more phosphopeptide should have been observed (Cripps
et al. 2006). Hyperphosphorylation disrupts the binding of tau to MT, but tau in its physiological
condition is phosphorlyated as well and its phosphorlyation level is developmentally regulated
(Johnson and Stoothoff 2004). There is evidence that in vivo phosphorylation in neuronal cells is
regulated by GSK3β, a kinase also binding to MTs, Cdk5, PKA and MARK. In addition, other

Discussion
122
overexpressed kinases are also able to phosphorylate tau in non-neuronal cell models (Johnson and
Stoothoff 2004). Physiological phosphorylation of the KXGS motifs in the MT-binding repeats of tau
decreases its binding to MTs. None of the sites found to be regulated by β-ionone treatment,
however, are located in those repeats.
In neurons tau and MAP 1B are essential for normal migration, axonogenesis and axonal transport. It
has been reproted, that modulation of tau phosphorylation is required for these processes (Jamal et
al. 2009). However, none of the phosphorylation sites known to be involved in these processes have
been indentified with significant regulation factors in LNCaP cells treated with β-ionone.
In neuronal and ovarian cells, tau phoshorylation was shown to be cell cycle-dependent and
predominatly located at SP and TP motifs (Illenberger et al. 1998). Four of the five phosphorylation
sites detected in the β-ionone experiment are as well serine and threonine residues immediately
followed by a proline residue. To the best of my knowledge, the phosphorylation sites found for tau
in the β-ionone treatment experiments of LNCaP cells have in fact also been identified in large scale
phosphoproteomics studies (Beausoleil et al. 2004; DeGiorgis et al. 2005; Molina et al. 2007; Cantin
et al. 2008; Gauci et al. 2009; Mayya et al. 2009) but have not been functionally characterized yet.
Microtubule-associated protein 4 (MAP 4)
MAP 4 is another protein of the MAP family. The rate of MT binding of MAP 4 can be regulated by
binding of other proteins like septins to MAP 4 (Kremer et al. 2005). Different MT-dependent
processes are regulated by MAP 4. On the one hand, MT-bound MAP 4 was shown to slow down
GPCR recycling and reapearence of GPCRs at the cell surface after internalization (Cheng et al. 2002).
2002). On the other hand, MAP 4 was implicated in cell cycle progression. It binds to cyclin B, thereby
targeting CDC2 to MTs and regulating MT dynamics (Ookata et al. 1995).
This process is mediated by the MAP 4 phosphorylation level which is regulated during cell cycle with
increased phosphorylation at the G2/M transition (Vandre et al. 1991). Phosphorylation at S696 and
S787 is mediated by cyclin B/cdc2 and was shown to lead to cell arrest in G2 phase or slow down
G2/M progression (Chang et al. 2001). Of the seven phosphorylation sites detected for MAP 4 in
LNCaP cells, one was found to be downregulated (Table 17). This phosphorylation site, again, is not
functionally characterized.
Stathmin (STMN1)
Stathmin, also referred to as oncoprotein 18, is an important protein in mitosis and was reported to
have tubulin-depolymerizing activity and, therefore, opposing functions to MAP 4 (Holmfeldt et al.
2007). Stathmin was shown to be critically involved in proliferation and cell cycle progression. It is

Discussion
123
upregulated in proliferating cells like cancer cells or cells induced to proliferate. Overexpression or
inhibition of stathmin both results in growth suppression and accumulation of cells in G2/M phase
(Rubin and Atweh 2004).
By phosphorlyation of stathmin at the onset of mitosis, it is “switched off” enabling the assembly of
the mitotic spindle. In order to exit mitosis, stathmin has to be dephosphorylated again (Rubin and
Atweh 2004). In the β-ionone study, stathmin has been found to be phosphorylated at S16, S25 and
S38, but only phosphorylation of S16 was differentially regulated by β-ionone treatment. This
phosphorylation site was first dramatically downregulated nearly four-fold after 2 min and slightly
upregulated after 10 min compared to control cells. Phosphorylation at the other two sites was
slightly but not significantly higher than in control cells. These three phosphorylation sites are known
to be involved in the regulation of cell cycle progression (Brattsand et al. 1993). Single
phosphorylation of S16 or S63 were shown to decrease or abolish the MT-destabilizing activity of
stathmin. In contrast, double phosphorylation at S25 and S38 did not influence MT-binding capabilities
(Manna et al. 2009). Therefore, it is tempting to speculate that downregulation of S16
phosphorylation leads to increased stathmin activity shortly after starting β-ionone treatment start,
which is again decreased after 10 min by reestablished and slightly increase S16 phosphorylation.
Cytoplasmic linker-associated protein 2 (CLASP2)
MT not only function as mechanic stabilizers, scaffolding matrix for proteins or transport matrix for
proteins and chromosomes, entire organelles are organized and transported along MTs. Mediated by
the MT plus-end-binding CLASP proteins (Cytoplasmic linker-associated proteins), the Golgi network
is organized through MT structures and the polarity of post-Golgi vesicular trafficking is enabled. This
is especially important in migrating cells (Liu et al. 2007; Miller et al. 2009). Phosphorylation by
GSK3β at serine residues 533 and 537 was shown to destabilize the binding of CLASP2 to MT and to
the protein IQGAP1, which in turn is accociated with actin. Downregulation of CLASP2 inhibited
serum-stimulated migration of COS7 cells in a Boyden chamber assay. The authors concluded that
phosphorylation of CLASP2 at S533 and S537 hinders migration by disrupting MT and actin interaction
via CLASP2 and IQGAP1 (Kumar et al. 2009a; Watanabe et al. 2009).
For CLASP2, S604 and S129 could be identified as novel phosphorylation sites of CLASP2 in LNCaP cells.
While the phosphorylation level of S604 remained unaltered, S129 was found to be downregulated
upon β-ionone treatment. These phosphorylation sites, however, are far away from the functionally
described phosphorylation sites S533 and S537, their relevance remains elusive.

Discussion
124
CAP-GLY domain containing linker protein 1 (CLIP1)
The CAP-GLY domain-containing linker protein 1 (CLIP1, CLIP-170 or Restin) has been reported to pull
centrosomes together in association with dynein and LIS1, and thereby antagonizing EG5, which pulls
centrosomes in opposite directions (Tanenbaum et al. 2008). CLIP1 is furthermore reported to be
localized at tips of MTs, where it also interacts with IQGAP1. The interaction of CLIP1 with IQGAP1
results in the dissociation of CLIP1 from MT (Fukata et al. 2002). The downregulation of CLIP1 in
cancer cells resulted in growth inhibition (Ho et al. 2003). The phosphorylation sites at S200 and S204
were found to be slightly upregulated after 2 min of β-ionone treatment. After 10 min, the previous
basal phosphorylation level was restored. The functional relevance of these phosphorylations,
however, is not know to date.
Gamma Adducin (ADD3)
ADD3 is a membrane-skeletal protein, which caps the fast growing ends of actin filaments and
recruits spectrin to the fast growing actin ends. It is phosphorylated by PKC and Rho-associated
kinases suggesting a role for ADD3 in calcium and Rho-dependent cell motility (Matsuoka et al.
2000).
Phosphorylation of ADD3 at S660 by PKC was shown to be increased during cancer cell development.
This phosphorylation results in a loss of differential targeting of ADD3, which is usually located to the
basal membrane, leading to localization to the lateral membrane (Fowler et al. 1998). However, this
phosphorylation site cannot be assigned to a site in the sequence of ADD3 in the latest version of the
UniProt database, as no sequence stretch is given in the paper (Fowler et al. 1998) and residue 660 in
ADD3 isoform 1 is a proline, whereas it is an isoleucine in isoform 2 (http://www.uniprot.org/
uniprot/Q9UEY8).
Following β-ionone treatment, a doubly phosphorylated peptide (663-684 in isoform 2 of ADD3) was
found to be downregulated in LNCaP cells. MS/MS spectra of this peptide contain ambigous
information regarding the exact localization of the phosphorylation sites. In some spectra S679 and
S681 are clearly identfied as being phosphorylated. In other spectra S683 and another not amino acid
seems to be phosphorylated. According to the UniProt database, predictions of phosphorylation at
S683 is labeled as predicted to be a PKC phosphorylation site. This may be the phosphorlyation site
reported previously with increased levels of phosphorylation during cancer development.
Echinoderm microtubule-associated protein-like 3 (EML3)
Only little information is available about the function of echinoderm microtubule-associated protein-
like 3 (EML3). It has been described to be a nuclear MT-binding protein, which localizes to the spindle

Discussion
125
and is required for the correct alignment of chromosomes during metaphase (Tegha-Dunghu et al.
2008). The phosphoserine S176, which was found to be regulated following β-ionone stimulation, has
been reported previously in large-scale phosphoproteomics experiments (Beausoleil et al. 2006;
Dephoure et al. 2008; Mayya et al. 2009) but has not been functionally characterized yet.
Formin-binding protein 1-like (FNBP1L)
Formin-binding protein 1-like (FNBP1L or Toca1) forms a complex with the N-WASP protein. This
complex is an essential cofactor for Cdc42-mediated actin remodeling. Both proteins are necessary
for filopodia formation and endocytosis (Bu et al. 2009). Within the complex, FNBP1L is required for
WASP activation via Cdc42 (Ho et al. 2004).
FNBP1L is phosphorylated at several serine and threonine residues (Dephoure et al. 2008; Gauci et al.
2009; Mayya et al. 2009). Amongst these, S488, which was found to be slightly upregulated by β-
ionone treatment in this work, has been reported, but its functional relevance has not been
investigated (Dephoure et al. 2008).
Sperm-specific antigen 2 (SSFA2)
The sperm-specific antigen 2 (SSFA2, CS1 or KRAP) is a cell surface glycoprotein, highly expressed in
myeloma. It has been suggested to mediate homophilic interaction, cell adhesion, and tumorigenity
in myeloma via c-maf transactivation (Tai et al. 2010). In addition, high expression of SSFA2 was
observed in colon cancer cells and was found here to be associated to actin filaments potentially
mediating signals from outside the cell directly to the cytoskeleton (Inokuchi et al. 2004).
In SSFA2, one phosphorylation site was found to be downregulated upon β-ionone treatment,
namely S737. This site has also been described in large-scale studies performed by Dephoure et al.
(2008) and Oppermann et al. (2009) but lacks functional characterization.
Neuroblast differentiation-associated protein AHNAK
The neuroblast differentiation-associated protein AHNAK (also referred to as Desmoyokin) is a giant
phosphoprotein and signaling molecule of 629 kDa, which binds and bundles actin and provides a
scaffold for other enzymes such as PKC and PLCγ. It activates PKC, which in turn leads to c-Raf, MEK
and Erk phosphorylation (Lee, I. H. et al. 2008). It also binds to Ca2+ L-type channel subunit β2 and
regulates Ca2+ entry in the cell. AHNAK inhibits subunit β2 by sequestration. This inhibitory effect is
released by PKA phosphorylation of T5236 (Haase 2007). Phosphorylation of S5335 leads to membrane
targeting of AHNAK.

Discussion
126
Although there are 54 phosphorylation sites known for AHNAK to date, the two described above are
the only ones which have thoroughly been characterized. The AHNAK phosphopeptides identified in
this work were all slightly downregulated. Two of the identified phosphorylation sites have not been
described before, namely S212 and S5746. In total, six phosphorylation sites in five different peptides
have been identified in this work. Interestingly, only the doubly phosphorylated peptide 376
(MaxQuant ID) was significantly downregulated after 10 min, whereas its singly phosphorylated
counterpart was slightly but not significantly upregulated (1.24-fold).
Shroom2
The protein formerly known as APXL (apical protein Xenophobus-like) belongs to the Shroom protein
family (Hagens et al. 2006). Unlike Shroom3, which is localized to the apical junctional complex (AJC)
of epithelial cells, Shroom2 is found in association with cortical actin where it colocalizes with non-
muscle myosin II and functions in the regulation of dynamic actin organization (Dietz et al. 2006). In
addition, it binds to myosin VIIa, F-actin and to ZO-1 at mature tight junctions and may have a role in
linking the junctional membrane to the cytoskeleton, thereby stabilizing the junctions (Etournay et al.
2007).
Of the six phosphorylation sites found after β-ionone treatment (S921, S922, S413, S425, S1171, S1173) none
has been identified before. The peptide containing the serine residues 413 and 425 was significantly
downregulated after stimulation. Neither these sites, nor the other sites identified, lie within a
known protein-protein interaction region. Therefore no conclusions about the potential function of
these sites can be drawn.
8.3.2.9 Functional category: Nuclear factors, DNA repair and cell cycle progression
A distinct feature of cancer cells is their uncontrolled proliferation. In order to grow and devide, cells
need to progress through the cell cycle. The cell cycle is a highly ordered and tightly controlled
process beginning with DNA replication in S phase followed by G2 phase, in which the cell synthesizes
proteins and other biomolecules and reassembles the cytoskleton in preparation for cell division in
mitosis. In mitosis (M phase), daughter chromosomes are segregated followed by another G phase
(G1) of preparation for another S phase. Along the cell cycle, multiple checkpoints are implemented,
where the cell cycle can be stopped or delayed to allow for response to DNA damage, incorrect
replication or segregation as well as to environmental cues such as growth factors or nutrient
disposability. Defects in proteins, which are involved in the complex signaling cascades controling
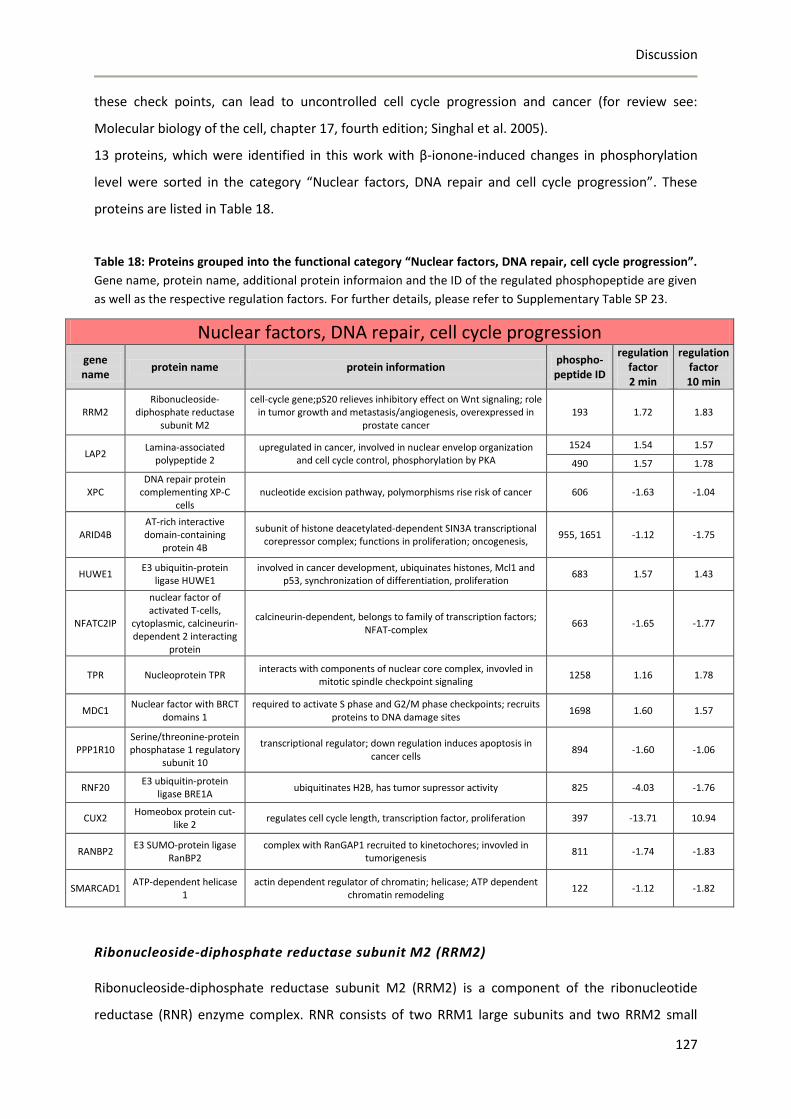
Discussion
127
these check points, can lead to uncontrolled cell cycle progression and cancer (for review see:
Molecular biology of the cell, chapter 17, fourth edition; Singhal et al. 2005).
13 proteins, which were identified in this work with β-ionone-induced changes in phosphorylation
level were sorted in the category “Nuclear factors, DNA repair and cell cycle progression”. These
proteins are listed in Table 18.
Table 18: Proteins grouped into the functional category “Nuclear factors, DNA repair, cell cycle progression”.
Gene name, protein name, additional protein informaion and the ID of the regulated phosphopeptide are given
as well as the respective regulation factors. For further details, please refer to Supplementary Table SP 23.
Nuclear factors, DNA repair, cell cycle progression
gene name
protein name protein information phospho-peptide ID
regulation factor 2 min
regulation factor 10 min
RRM2 Ribonucleoside-
diphosphate reductase subunit M2
cell-cycle gene;pS20 relieves inhibitory effect on Wnt signaling; role in tumor growth and metastasis/angiogenesis, overexpressed in
prostate cancer 193 1.72 1.83
LAP2 Lamina-associated
polypeptide 2 upregulated in cancer, involved in nuclear envelop organization
and cell cycle control, phosphorylation by PKA
1524 1.54 1.57
490 1.57 1.78
XPC DNA repair protein
complementing XP-C cells
nucleotide excision pathway, polymorphisms rise risk of cancer 606 -1.63 -1.04
ARID4B AT-rich interactive domain-containing
protein 4B
subunit of histone deacetylated-dependent SIN3A transcriptional corepressor complex; functions in proliferation; oncogenesis,
955, 1651 -1.12 -1.75
HUWE1 E3 ubiquitin-protein
ligase HUWE1 involved in cancer development, ubiquinates histones, Mcl1 and
p53, synchronization of differentiation, proliferation 683 1.57 1.43
NFATC2IP
nuclear factor of activated T-cells,
cytoplasmic, calcineurin-dependent 2 interacting
protein
calcineurin-dependent, belongs to family of transcription factors; NFAT-complex
663 -1.65 -1.77
TPR Nucleoprotein TPR interacts with components of nuclear core complex, invovled in
mitotic spindle checkpoint signaling 1258 1.16 1.78
MDC1 Nuclear factor with BRCT
domains 1 required to activate S phase and G2/M phase checkpoints; recruits
proteins to DNA damage sites 1698 1.60 1.57
PPP1R10 Serine/threonine-protein phosphatase 1 regulatory
subunit 10
transcriptional regulator; down regulation induces apoptosis in cancer cells
894 -1.60 -1.06
RNF20 E3 ubiquitin-protein
ligase BRE1A ubiquitinates H2B, has tumor supressor activity 825 -4.03 -1.76
CUX2 Homeobox protein cut-
like 2 regulates cell cycle length, transcription factor, proliferation 397 -13.71 10.94
RANBP2 E3 SUMO-protein ligase
RanBP2 complex with RanGAP1 recruited to kinetochores; invovled in
tumorigenesis 811 -1.74 -1.83
SMARCAD1 ATP-dependent helicase
1 actin dependent regulator of chromatin; helicase; ATP dependent
chromatin remodeling 122 -1.12 -1.82
Ribonucleoside-diphosphate reductase subunit M2 (RRM2)
Ribonucleoside-diphosphate reductase subunit M2 (RRM2) is a component of the ribonucleotide
reductase (RNR) enzyme complex. RNR consists of two RRM1 large subunits and two RRM2 small

Discussion
128
subunits and catalyzes the reduction of ribonucleoside diphosphates to deoxyribonucleoside
diphosphates (dNTPs) for DNA synthesis. A deregulation of the dNTP pool leads to cell death or
genetic abnormalities (Nordlund and Reichard 2006). While the expression level of RRM1 remains
relatively constant throughout the cell cycle, RRM2 is expressed during late G1 and early S phase and
downregulated in late S phase, thereby regulating the activity of the RNR complex (Engstrom et al.
1985). Upregulation of RRM2 is observed in many cancer types and contributes to cancer progression
(Furuta et al. 2010). Besides its effects on DNA synthesis and repair, RRM2 overexpression reduces
expression of TSP-1, which is an anti-angiogenic factor. It simultaneously induces expression of the
pro-angiogenic factor VEGF leading to a tumor type with higher angiogenic potential (Zhang et al.
2009).
RRM2 was shown to function downstream of beta-catenin as an inhibitor of Wnt signaling.
Phosphorylation at S20 of RRM2 counteracted its inhibitory effect (Tang et al. 2007). Whether the
phosphorylation of S80, which was found to be elevated after β-ionone treatment, is of significant
importance for the function of RRM2, remains to be elucidated.
Lamina-associated polypeptide 2 (LAP2)
Lamina-associated polypeptide 2 (formerly known as thymopoietin (TMPO)) is expressed in mammals
in six different splice variants. While LAP2β is an integral protein of the inner nuclear membrane,
where it binds to lamin B and chromatin, LAP2α is a non-membrane protein associated with the
nucleoskeleton. LAP2 proteins are involved in the disassembly and reassembly of the nucleus during
cell cycle (Dechat et al. 2000).
Phosphorylation of LAP2 leads to disruption of its binding to lamin and chromosomes (Foisner and
Gerace 1993; Dechat et al. 1998). In addition, phosphorylation influences the binding of LAP2 to
other interaction partners. The LAP2-HA95 complex, for example, which is implicated in DNA
replication initiation, dissociates via cAMP/PKA signaling mediated phosphorylation (Martins et al.
2003). The actual sites of phosphorylation, which are responsible for these effects, have not been
identified.
For LAP2, nine phosphorylation sites were identified in the β-ionone study, three of which are newly
identified, namely S158, S180 and Y183. Two peptides were found to be upregulated upon treatment.
One containing two phosphorylation sites, of which only one could be confidently localized (S156), was
upregulated 1.7 fold. Interestingly, the other regulated phosphopeptide was present in two isoforms.
The peptide was not regulated when S66 and S67 were phosphorylated. If this peptide was
phosphorylated at T74, however, it was upregulated 1.5 fold. These observations suggest highly
specific functions of the respective phosphorylation sites.
Discussion
129
DNA repair protein complementing XP-C cells (XPC)
DNA repair protein complementing XP-C cells (XPC) is a DNA damage recognition factor that is
required for global genomic nucleotide excision repair. It detects disrupted DNA base pairs in a
complex with RAD23B by directly binding to the damaged sites (Sengupta and Harris 2005). The gene
encoding the XPC protein belongs to the genes frequently mutated in xeroderma pigmentosum, an
autosomal recessive genetic disorder, in which the DNA excision repair is impaired. Patients develop
skin cancer and lesions at early age and later on, if still alive, internal malignancies (exemplary case
study described by Halpern et al. (Halpern et al. 2008)). Functional XPC however, leads to enhanced
cell survival in the bone marrow of mice upon DNA damage by carboplatin (Fischer et al. 2009).
After β-ionone stimulation a phosphopeptide (amino acid sequence 869-898) was identified
containing two phosphorylation sites, which could not be confidently assigned to a specific residue.
This phosphopeptide was slighty downregulated after 2 min of treatment. Four phospho-serine
modifications have been described for this stretch in the amino acid sequence in other large-scale
studies (Beausoleil et al. 2004; Giorgianni et al. 2007; Matsuoka et al. 2007; Han et al. 2008; Mayya et
al. 2009). However, the functions of the phosphorylation at these sites still remain unknown.
AT-rich interactive domain-containing protein 4B (ARID4B)
AT-rich interactive domain-containing protein 4B (ARID4B, BRCAA1, RBBP1L1, RBP1L1 or SAP180)
was found to be a molecular marker associated with many cancers (Cao et al. 2001). It is a member
of the AT-rich interaction domain gene family (Wilsker et al. 2005). It acts as transcriptional repressor
via its role in the assembly and/or enzymatic activity of the Sin3A corepressor complex (Fleischer et
al. 2003). Mice with defects in ARID4A and B as well as an additional myelodysplastic
/myeloproliferative disorder develop multiple malignancies, suggesting a role of ARID4 A and B as
tumor suppressor.
For this protein, too, many phosphorylation sites have been identified in large-scale
phosphoproteomics studies without characterizing their function. Phosphorylation at S790 and T793,
which are known phosphorylation sites of ARID4B (Dephoure et al. 2009; Gauci et al. 2009; Mayya et
al. 2009), were slightly downregulated after β-ionone stimulation of LNCaP cells.
E3 ubiquitin-protein ligase HUWE1 (HUWE1)
E3 ubiquitin-protein ligase HUWE1 (also referred to as UREB1) is a ubiquitin ligase of the HECT family,
which was shown to be involved in the ubiquitination of histones (Liu et al. 2005). In general, the
function of HUWE1 is controversially discussed. It was reported to be involved in ubiquitin-mediated
degradation of the anti-apoptotic protein Mcl1 and the pro-apoptotic protein p53, resulting in

Discussion
130
completely different phenotypes in the same cell line (U2OS cells). In some studies, it was reported
to support gene activation by c-Myc, whereas in others, it was reported to target c-Myc for
degradation by ubiquitination. In spite of this controversy, HUWE1 is of relevance in the context of
cancer, as it was reported to be upregulated in many different cancer types (Bernassola et al. 2008).
In neuronal cells, HUWE1 was reported to destabilize N-Myc, thereby inhibiting proliferation and
promoting differentiation (Zhao et al. 2008; Zhao et al. 2009). In addition, HUWE1 was reported to be
involved in the synchronization of neuron and glia development (D'Arca et al. 2010).
Following β-ionone treatment, the phosphorylation at S3555 was found to be upregulated, whereas
phosphorylation at S1907 remained unaffected. Interestingly, S1907 has already been reported to be
phosphorylated in large-scale studies, while the regulated site at S3555 is hitherto unknown.
Accordingly, no functional information is available of this site as well as of any other known site for
this protein.
Nuclear factor of activated T-cell, cytoplasmic, calcineurin-dependent 2 interacting
protein (NFATC2IP)
The nuclear factor of activated T-cells (NFAT), cytoplasmic, calcineurin-dependent 2 interacting
protein (NFATC2IP or Nip45) is a transcription cofactor, which recruits the PRMT1 protein (Mowen et
al. 2004) to the NFAT complex. NFATC2IP is methylated by PRMT1, which potentially leads to
enhanced activity of the NFAT complex. It contains a ubiquitin- like domain and was shown to bind to
a sumoylation enzyme (Ubc9) instead of SUMO in mice, thereby preventing further sumoylation
(Sekiyama et al. 2010).
In the β-ionone study, S198 and S204 were identified as being phosphorylated. Two different phospho-
isoforms of one peptides were detected, a monophosphorylated peptide (S204) and one doubly
phosphorylated peptide (S198 and S204). Interestingly, only the doubly phosphorylated peptide was
found to be downregulated, whereas the monophosphorylated peptide remained constant. Both
sites have been identified previously (Olsen et al. 2006; Dephoure et al. 2008; Mayya et al. 2009), but
again no functional information are available for the identified phosphorylation sites.
Nucleoprotein TPR (TPR)
Nucleoprotein (TPR) binds to the Mad1/Mad2 complex, which is responsible for the cell cycle arrest
upon perturbation of mitotic spindle essembly. Interaction of TPR with the Mad - complex seems to
be important for controling of mitotic spindle checkpoint (Lee, S. H. et al. 2008). The Drosophila
orthologue of TPR was shown to co-localize with spindle matrix proteins and to be involved in the
nucleation of the spindle complex by providing the structural basis for spindle matrix formation (Qi et

Discussion
131
al. 2004). After mitosis, TPR is localized at the cytoplasmic surface of the reassembled nuclear pore
complex (Byrd et al. 1994).
The phosphoserine residue (S2155), which was found to be upregulated after 10 min of β-ionone
treatment, had been identified previously in large-scale studies (Olsen et al. 2006; Molina et al. 2007;
Yu et al. 2007; Cantin et al. 2008; Dephoure et al. 2008; Mayya et al. 2009). Functional data are not
yet available.
Nuclear factor with BRCT domains (MDC1)
Nuclear factor with BRCT domains (MDC1 or NFBD1) is a protein involved in DNA damage response
(DDR). Upon DNA damage, the histone H2AX is phosphorylated. MDC1 binds to this phosphorylated
H2AX and induces the amplification of the DNA damage signal. MDC1 serves as scaffold for recruiting
different DDR complexes, including the breast cancer-associated suppressor BRA1, to sites of double
strand breaks to mediate DNA repair (Yan and Jetten 2008). MDC1 also mediates intra-S phase
checkpoint control via its interaction with NBS1 (Wu et al. 2008).
MDC1 is phosphorylated upon DNA damage and during mitosis. Downregulation of MDC1 leads to
defects in cell cylce checkpoint function and eventually apoptosis (Stucki and Jackson 2004; Stucki
and Jackson 2006). Aprataxin is another protein, to which MDC1 binds in a phosphorylation-
dependent manner. The interaction is mediated by SDTD-motifs doubly phosphorylated by CKII
(Becherel et al. 2010). A phosphopeptide with such a doubly phosphorylated motif has been found to
be slightly upregulated after 2 min of β-ionone exposure (regulation factor 1.52). However, with a
regulation factor of 1.52, it was just below the cut-off at 1.54. Another phosphopeptide of MDC1 was
found to be significantly upregulated. This peptide (amino acid residues 455-467) contains two
phosphorylation sites, which could not be confidently assigned to a distinct site. For this peptide,
three phosphorylation sites have been reported previously in large scale studies (Dephoure et al.
2008; Mayya et al. 2009), but no functional properties are known.
Serine/threonine-protein phosphatase 1 regulatory subunit 10 (PPP1R10)
The serine/threonine-protein phosphatase 1 regulatory subunit 10 (PPP1R10, synonymes: CAT53,
FB19, PNUTS) is an inhibitor of the phosphatases PPP1CA and PPP1CC (Kreivi et al. 1997). When
bound to PPP1R10, PPP1CA is targeted to the nucleus (Grana 2008). Inhibition of PPP1CA by binding
to PPP1R10 is reduced by PKA-mediated phosphorylation of PPP1R10 in the PPP1CA binding domain
(Kim et al. 2003). Knock-down of PPP1R10 leads to apoptosis (De Leon et al. 2008), and association of
PPP1R10 with, for example, LCP1 is potentially involved in transcriptional regulation which was
determined in a heterologous transcription system (Lee et al. 2009).

Discussion
132
The phosphorylation at S313 was downregulated after 2 min of β-ionone treatment and restored to
base level after 10 min. This residue lies N-terminal to the domains which are involved in PPP1CA and
PPP1CC binding and inhibition and was identified in large-scale studies before (Olsen et al. 2006; Yu
et al. 2007; Dephoure et al. 2008). The functional relevance of this site has not been characterized
yet.
E3 ubiquitin-protein ligase BRE1A (RNF20)
E3 ubiquitin-protein ligase BRE1A (RNF20) is a histone 2B specific ubiquitin ligase that mediates
monoubiquitination of Lys120 of histone 2B (Kim et al. 2005), thereby regulating the expression rates
of certain growth-related genes like the p53 tumor suppressor protein and acting as tumor
suppressor (Shema et al. 2008).
RNF20 was found to be phosphorylated at S136 and S138 in two different monophosphorylated
peptides, which have been identified previously (Dephoure et al. 2008, Gauci et al. 2009). Only S136
phosphorylation was downregulated upon β-ionone treatment.
Homeobox protein cut-like 2 (CUX2)
Homeobox protein cut-like 2 (CUX2 or CUTL2) is a transcription factor, which regulates cell cycle
progression and development of neuronal progenitor cells (Iulianella et al. 2008). The transcription of
CUX2 has been shown to be regulated down-stream of Notch signaling in the formation of
interneurons during spinal cord formation (Iulianella et al. 2009). CUX2 is also implicated in a variety
of morphogenic changes in the brain such as dendritic branching (Cubelos et al. 2010). Only little is
known about CUX2 function in non-neuronal cell. It is higher expressed in the liver of female rats
than in the liver of male rats, where it is involved in the suppression of male specific genes (Laz et al.
2007).
The phosphorylation site identified in CUX2 upon β-ionone treatment (S90) has been indentified for
the first time in this work. It showed dramatic down-regulation after 2 min but was up-regulated
after 10 min of β-ionone exposure. is dramatically downregulated after 2 min and likewise
dramatically upreguated after 10 min.
E3 SUMO-protein ligase RanBP2 (RanBP2)
E3 SUMO-protein ligase RanBP2 is a nuclear pore protein (Reverter and Lima 2005). The
RanGAP1/RanBP2 complex, which resides at the cytosolic surface of nuclear pore complexes in the
interphase, was found to localize to kinetochores during mitosis and has been shown to be involved
in connecting kinetochores to spindle poles (Arnaoutov and Dasso 2005). During mitosis, RanBP2

Discussion
133
binds and sumoylates topoisomerase IIα and contributes to the correct resolution of sister
centromers. Mice with low levels of RanBP2 are prone to chromosome instability and cancerogene-
induced tumorigenesis, whereas knock-out of RanBP2 is lethal (Dawlaty et al. 2008).
In RanBP2, four phosphorlyation sites were identified after β-ionone stimulation, namely S781, S955,
T1396 and S1400. Of these, only S955 was regulated (downregulated after 2 and 10 min). S955 has been
identified before (Dephoure et al. 2008, Mayya et al. 2009), however, functional characterization is
still missing.
SWI/SNF-related matrix-associated actin-dependent regulator of chromatin subfamily A
containing DEAD/H box 1 (SMARCAD1)
SWI/SNF-related matrix-associated actin-dependent regulator of chromatin subfamily A containing
DEAD/H box 1 (SMARCAD1) is a potential ATP-dependent helicase (Adra et al. 2000). The gene coding
for SMARCAD1 lies in a chromosomal region, frequently mutated in head and neck cancer (Cetin et
al. 2008)(Cetin et al. 2008).
Two doubly phosphorylated peptides with four phosphorylation sites were found, namely S211 and
either S212, S213 or S214 and, in another peptide, S124 and S127. Only the peptide containing S212 was
downregulated upon β-ionone treatment. These sites have also been identified in large scale studies
(Olsen et al. 2006; Matsuoka et al. 2007; Dephoure et al. 2008; Gauci et al. 2009; Mayya et al. 2009).
8.3.2.10 Functional category: Protein and Biomolecule synthesis and RNA
processing
During cell cylcle, not only the DNA has to be replicated, but also new proteins and organelles have
to be produced. These processes mainly occur during G1 and G2 phase and require increased
synthesis of proteins as well as other biomolecules such as lipids (Alberts 2002; Singhal et al. 2005).
The molecular processes involved in these synthesis events, influence cell cylce progression and
proliferation just as much as processes involved in DNA processing (Caraglia et al. 2000). In total, 10
proteins involved in protein and biomolecule synthesis as well as in RNA processing were found to be
regulated with respect to their phosphorylation level upon stimulation of LNCaP cells by β-ionone.

Discussion
134
Table 19: 10 proteins are listed in this table, which are involved in protein or biomolecule synthesis and RNA
processing. In addition, some further information are given as well as the ID of regulated phosphopeptides and
their respective regulation factors. For furhter details, please refer to Supplementary Table SP 23.
Protein/Biomolecule Synthesis, RNA processing
gene name
protein name protein information phospho-peptide ID
regulation factor 2
min
regulation factor 10
min
EEF2K Elongation factor 2 kinase Control of protein synthesis; is upregulated in cancers;
downregulation lead to stop of protein synthesis and induction of apoptosis
198, 199, 200
-1.17 -5.68
EIF4G2 Eukaryotic translation
initiation factor 4 gamma, 2 Control of protein synthesis; member of eIF4F complex,
essential for translation initiation 1485 -1.04 -1.88
MFAP1 Microfibrillar-associated
protein 1 mutations in gene rise breast cancer risk, involved in pre-mRNA
processing, reduced level lead to slow proliferation 405, 406 -1.16 -1.83
PCYT1A Choline-phosphate
cytidylyltransferase A Plays role in every process which requires membrane
biosynthesis; binds upon calcium elevation to 14-3-3 zeta 1018, 1019,
1021 -3.00 -2.37
LARP1 La ribonucleoprotein domain
family, member 1 RNA binding protein, regulates cell division and migration,
eIF4E interaction 714 -1.22 -1.87
DCP1A mRNA-decapping enzyme 1A
forms complex with DCP2 to decap mRNA prior to decomposition; TGF-beta signaling; hyperphosphorylated
during development,differentiation and cell stress; transcriptional coactivator
623, 1559 -1.65 -1.21
SRRM2 Serine/arginine repetitive
matrix protein suggested to be involved in spliceosomes/splicing factor, RNA
binding 1720 -5.39 -1.06
AGFG1 Nucleoporin-like protein RIP mediate nucleocytoplasmic transport, involved in clathrin
dependent endocytosis, partner of EPS15, Rev Cofactor, RNA export from nucleus to cytoplasm
973, 1653 -1.30 -3.01
CPSF2 Cleavage and polyadenylation
specificity factor subunit 2 involved in mRNA maturation; endocytosis
1135, 1136, 1137
1.01 -1.84
SF3A1 Splicing factor 3 subunit 1 subunit of spliceosome 3a complex, essential for pre-mRNA
splicing 322 1.03 -3.28
Elongation factor 2 kinase (eEF2K)
Elongation factor 2 kinase (eEF2K) is a Ca2+/calmodulin-dependent kinase, which controls the rate of
peptide chain elongation. This effect is mediated by elongation factor 2 (eEF2), which is the specific
substrate of eEF2K and promotes the translocation step of peptide chain elongation. When eEF2 is
phosphorylated by eEF2K, its interaction with the ribosome is disrupted and its activity is impaired
(Hait et al. 2006; Wang and Proud 2006).
eEF2K activity is regulated in a cell cycle-dependent manner by Cdc2 kinase through phoshorylation
at S359. Phosphorylation at this site inhibits EEF2K activity, thereby preventing phosphorylation of
eEF2, which in turn leads to increased and accelerated elongation of polypeptide chains (Figure 39)
(Smith and Proud 2008). Furthermore, phosphorylation of S78 has also been shown to have an
inhibitory effect on EEF2 activity. This phosphorylation site lies within the calmodulin-binding domain
of EEF2K and potentially inhibits the binding of Ca2+-Calmodulin binding to eEF2K (Wang and Proud
2006).

Discussion
135
Following β-ionone stimulation, a phosphopeptide with two phosphorylation sites has been found to
be strongly downregulated after 10 min of treatment. These two phosphorylation sites were
assigned to S72 and S74, which have not been reported to be phosphorylated before. However, the
localization could not be confidently confirmed by the obtained data. Since both sites lie in close
proximity to S78 it is conceivable that they also exhibit an inhibitory effect on Ca2+-Calmodulin binding
to eEF2K. This would activate eEF2K, thereby enhancing the phosphorylation of eEF2, which in turn
would result in the dissociation of eEF2 from the ribosome and decreased mRNA translation.
Fig. 40: Hypothetic model for the regulation of protein translation by eEF2K based on the mechanism
reviewed in Wang and Proud 2006. Decrease in eEF2K phosphorylation within the Ca2+
-Calmodulin (CaM)-
binding domain as determined in this work results in binding of CaM to eEF2K and its subsequent activation (1).
eEF2K phosphorylates its specific substrate eEF2, leading to dissociation of eEF2 from the ribosome (2).
Thereby polypeptide chain elongation is stopped (3).
Eukaryotic translation initiation factor 4 gamma, 2 (eIF4G2)
Eukaryotic translation initiation factor 4 gamma, 2 (eIF4G2; synonymes DAP5, p97, NAT1) is part of
the eIF4F complex, which consists of eIF4E, eIF4A and eIF4G. This complex bridges the cap structure
at the 5´end of mRNAs to ribosomes. There are two homologues of eIF4G in humans, eIF4G1 and
eIF4G2. eIF4G2 is hyperphosphorylated during mitosis. This leads to the disassembly of the eIF4F
complex (Pyronnet et al. 2001). It also binds to the eIF4E-specific kinases MNK1 and 2, serving as a
scaffold to bring kinase and substrate together (Fukunaga and Hunter 1997). Knock-down of eIF4G2
induces M phase-specific caspase-dependent apoptosis. Furthermore, eIF4G2 is involved in Bcl2 and
CDK1 translation during mitosis, potentially by a cap-independent process (Marash et al. 2008).
The phosphopeptide found to be downregulated after 10 min of β-ionone treatment contained one
phosphorylation site. Most likely, T468 was phosphorylated, although the localization score was below
= phosphorylation site
1
2
3

Discussion
136
the score cut off (0.63). No phosphorylation site has been reported in this peptide so far and,
accordingly, no functional information is available.
Microfibrillar-associated protein 1 (MFAP1)
So far, little is known about the Microfibrillar-associated protein 1 (MFAP1). The drosophila
homologue of MFAP1 has been shown to be required for pre-mRNA processing and G2 to M phase
progression. Drosophila cells with reduced levels of Drosophila MFAP proliferate slowly and are
prone to apoptosis (Andersen and Tapon 2008). The human gene encoding MFAP1 is frequently
found to be mutated in breast tumors (Olson et al. 2010).
The phosphorylation sites S132 and S133 were downregulated after 10 min of β-ionone treatment.
These sites have been reported previously in large-scale studies (Beausoleil et al. 2004; Olsen et al.
2006; Dephoure et al. 2008; Mayya et al. 2009) but have not been functionally characterized yet.
Choline-phosphate cytidylyltransferase A (PCYT1A)
Choline-phosphate cytidylyltransferase A (PCYT1A or CTPCT, PCYT1) is involved in the synthesis of the
major membrane component phosphatidylcholine. PCYT1A is differentially expressed (Jackowski and
Fagone 2005) and phosphorylated (Jackowski 1994; Fagone and Jackowski 2009) during cell cycle
progression. An increase in phosphorylation has been shown to be associated with a decrease in
activity during the exit from G0/G1 phase. Active membrane-bound PCYT1A is released from the
membrane and dephosphorylated. However, whether the phosphorylation is the cause for
membrane release or a consequence could not be answered in the study (Fagone and Jackowski
2009). Recently, an interaction of PCYT1A with 14-3-3 zeta was reported, which is required for
nuclear import of PCYT1A for nuclear membrane growth. This calcium mediated interaction occurs
via a domain of PCYT1A with multiple phosphorylatable serines from positions 328-342 in the amino
acid sequence. The phosphopeptide, which was found to be downregulated upon β-ionone
treatment, lays just N-terminal of this position (S315, S319, S323) and might be implicated in nuclear
transport.
La ribonucleoprotein domain family, member 1 (LARP1)
La ribonucleoprotein domain family, member 1 (LARP1) is an RNA-binding protein, which was first
described in drosophila, where it is required for spermatogenesis, embryogenesis and cell cycle
progression (Ichihara et al. 2007; Blagden et al. 2009). Burrows et al. demonstrated in 2010, that, in
HeLa cells, LARP1 exists in complex with EIF4E, where it is required for ordered mitosis, cell survival
and migration (Burrows et al. 2010).

Discussion
137
Many phosphorylation sites have been found for LARP1 in large-scale phosphoproteomics studies.
However, none was functionally characterized yet. In this work, S766 was found to be downregulated
after β-ionone treatment of LNCaP cells.
mRNA-decapping enzyme 1A (DCP1A)
mRNA-decapping enzyme 1A (DCP1A or SMIF) is a member of the human mRNA-decapping complex,
which catalyzes the removal of the 5´mRNA structure prior to mRNA degradation (van Dijk et al.
2002; Fenger-Gron et al. 2005). Blumenthal et al. showed that DCP1A is phosphorylated at S315, S319
and T321 during neuronal development and arsenate-induced cellular stress (Blumenthal et al. 2009).
In addition, DCP1A is a Smad-interacting transcriptional co-activator, which can be activated by TGFβ-
signaling.
The phosphopeptide, which was found to be downregulated after 10 min of β-ionone stimulation,
contained two phosphorylation sites. It was fragmented multiple times and in the different spectra
three confirmed phosphorylation sites were identified (S523, S525, T531) suggesting different
phosphoisoforms of this doubly phosphorylated peptide. These phosphorylation sites, too, have
been reported previously in large-scale studies without functional characterization (Beausoleil et al.
2004; Cantin et al. 2008; Dephoure et al. 2008; Imami et al. 2008; Gauci et al. 2009; Mayya et al.
2009).
Serine/arginine repetitive matrix protein (SRRM2) Serine/arginine repetitive matrix protein (SRRM2) is a 300 kDa protein, which is a non-essential part
of the active spliceosome (Blencowe et al. 2000) with a potential contribution to the catalytic center
of the spliceosome (Grainger et al. 2009). Interestingly, SRRM2 depletion in ErbB2-overexpressing
ovarian cancer cells reduces the migration rate.
SRRM2 is a highly phosphorylated protein and a large number of phosphorylation sites have been
identified in large-scale phosphoproteomics studies. None of these sites have been functionally
characterized yet. Results of the β-ionone study also revealed the occurrence of many
phosphorylation sites, but only one of them, S288, was found to be regulated. It was down-regulated
approximately 5.4-fold after 2 min of β-ionone exposure.
Arf-GAP domain and FG repeats-containing protein 1 (AGFG1)
Arf-GAP domain and FG repeats-containing protein 1 (AGFG1 or Nucleoporin-like protein RIP) binds
in the nucleus to the Rev RNA export factor and significantly enhances its activity when

Discussion
138
overexpressed (Bogerd et al. 1995). Cytoplasmic AGFG1 associates with Eps15 and VAMP7 and is
involved in clathrin-dependent endocytosis (Doria et al. 1999; Chaineau et al. 2008).
After 10 min of β-ionone stimulation, the phosphorylation at T177 and S179 was down-regulated
threefold. The phosphorylation at T177 has been reported previously (Olsen et al. 2006; Dephoure et
al. 2008; Zahedi et al. 2008; Mayya et al. 2009), but the S179 phosphorylation was hitherto unknown.
For these sites, too, no functional information are available.
Cleavage and polyadenylation specificity factor subunit 2 (CPSF2)
Cleavage and polyadenylation specificity factor subunit 2 (CPSF2 or CPSF100), together with CPSF73,
forms the cleavage and polyadenylation specificity factor (CPSF), required for 3´cleavage of RNA
transcripts and its subsequent polyadenylation (Jenny et al. 1994; Kolev et al. 2008).
A phosphopeptide of CPSF2 was found to be two-fold downregulated after 10 min of β-ionone
treatment. This peptide was phosphorylated at serine residues 419, 420 and 423. These sites have
also been found in large-scale studies (Olsen et al. 2006; Dephoure et al. 2008; Gauci et al. 2009;
Mayya et al. 2009), but were not functionally characterized up to now.
Splicing factor 3 subunit 1 (SF3A1)
Splicing factor 3 subunit 1 (SF3A1) is one of three components of the splicing factor 3A. This complex
is essential for functional 17S U2 snRNP and pre-spliceosome assembly (Das et al. 2000; Tanackovic
and Kramer 2005).
Phosphorylation of S329 was observed to be downregulated after 10 min of β-ionone treatment. This
phosphorylation site has already been described in a number of phosphoproteomics studies (Olsen
et al. 2006; Molina et al. 2007; Dephoure et al. 2008; Han et al. 2008; Gauci et al. 2009; Mayya et al.
2009). As for many other phosphorylation sites detected in this work, functional information are not
available.

Discussion
139
8.3.2.11 Functional category: Others
Remaining proteins, which could not be classified in one of the first five categories because they
fulfill other cellular functions than the proteins described in categories a) - e) or for which no
literature information was available, were grouped into category f) “Others” (Table 20).
Table 20: List of proteins, which exhibited phosphopeptides significantly regulated upon β-ionone treatment
and could not be classified to one of the first five categories. For each peptide, the dedicated protein is listed
in the table as well as the MaxQaunt regulation factors and the MaxQaunt phosphopeptide ID. For further
details, please refer to Supplementary Table SP 23 (N/A, no literature available).
others
gene name protein name protein information phospho-peptide ID
regulation factor 2 min
regulation factor 10 min
IPI00328306 Zinc finger CCCH domain-containing
protein 11A N/A 1011 -1.47 1.02
IPI00878236 Fibrous sheath-interacting protein 2 sperm tail protein 1103 7.83 ---
C3ORF20 chromosome 3 open reading frame
20 N/A 950 4.50 -1.09
CCDC150 coiled-coil domain containing 150 N/A 1379 -3.89 5.18
COBLL1 COBL-like 1 used for prediction of cancer therapy outcome;
exact function unknown 108 1.63 1.47
LOC100290370 hypothetical protein LOC100290370 N/A 1751 -5.37 -15.94
TMLHE trimethyllysine hydroxylase, epsilon First step in carnitin biosynthesis; carnitin is
important for the transport of activated fatty acids across the inner mitochondiral membrane
913 234.48 ---
TTC7B tetratricopeptide repeat domain 7B no literature information 1037, 1038 -1.68 -1.77
PDHA1 (includes EG:5160)
pyruvate dehydrogenase (lipoamide) alpha 1
mitochondrial complex; links glycolysis and TCA cycle
993 -1.25 -2.22
994, 1786 average
-1.22 -4.28
SLC4A7 solute carrier family 4, sodium
bicarbonate cotransporter, member 7
associated with tumor development/breast cancer development, involved in chronic
metabolic acidosis, pH regulation
351 1.30 3.69
352, 353 1.96 7.49
OSBPL11 oxysterol binding protein-like 11 intracellular lipid receptor, potentially involved
in cholesterol and glucose metabolsim 523 2.41 3.72
KIAA0415 KIAA0415 putative helicase 1172 -1.11 2.96
TBC1D10B TBC1 domain family, member 10B other family members are invovled in cancerogenesis and insulin signaling
1734, 1735, 1736
-1.45 -2.51
OSBPL8 oxysterol binding protein-like 8
regulated by runx2 transcription factor; intracellular lipid receptor, other members of
the family of ORPs involved in lipid metabolism and cell signaling
619 -1.37 -1.69
KIAA1522 KIAA1522 N/A 14, 15 -1.38 -2.71
C9ORF25 chromosome 9 open reading frame
25 N/A 812, 1609 -1.12 -1.81
Candidate proteins in this category are involved in diverse cellular and metabolic processes or have
unknow functions. The potential link of these proteins to processes triggered by β-ionone treatment
did not become clear by what is know so far about these proteins. However, they may play important
roles in the entire process from receptor binding to cellular processes since they predominantly
exhibit very high regulation factors. Despite their unknown role - or indeed because of it - these
proteins might provide eminently interesting candidate proteins for follow-up studies.

Discussion
140
8.3.3 Recapitulation of phospho-protein regulation in β-ionone-
stimulated LNCaP cells
The aim of this work was to unravel the signaling network triggered by the PSGR receptor upon
stimulation with β-ionone. Numerous phosphorylation sites in a total of 73 proteins were found to be
up- or down-regulated after β-ionone treatment. However, a complete PSGR signaling network could
not be constructed from the respective phospho-proteins. On the one hand, it is very likely that more
than 73 proteins are involved in the transduction of PSGR-mediated signaling. Therefore, probably
only a fraction of the entire signaling network was monitored in this work. On the other hand,
interpretation of the phospho-proteins and, in particular, interpretation of the functional relevance
of regulated phosphorylation sites is extremely difficult, since, in many cases, only little is known or
no information are available in the literature and databases. In addition, several new
phosphorylation sites have been identified in this work, which present new candidate sites, which
have to be further investigated in follow-up studies.
With the information available however, a working hypothesis for the PSGR mediated signaling could
be proposed as depicted in Figure 40. Firstly, the PSGR receptor might potentially be associated with
the GPR126 and might be internalized upon β-ionone treatment, as the abundance of the GPR126 in
the cytosolic fractions more than doubles upon 2 min of β-ionone treatment. Secondly, ignaling of
the activated PSGR or PSGR/GPR126 complex triggeres signaling processes at the plasma membrane,
which lead to reduced Akt and PI3K activity and subsequently, by so far unknown intermediate
proteins, to the inhibition of translation and to a decrease in proliferation and migration in general.
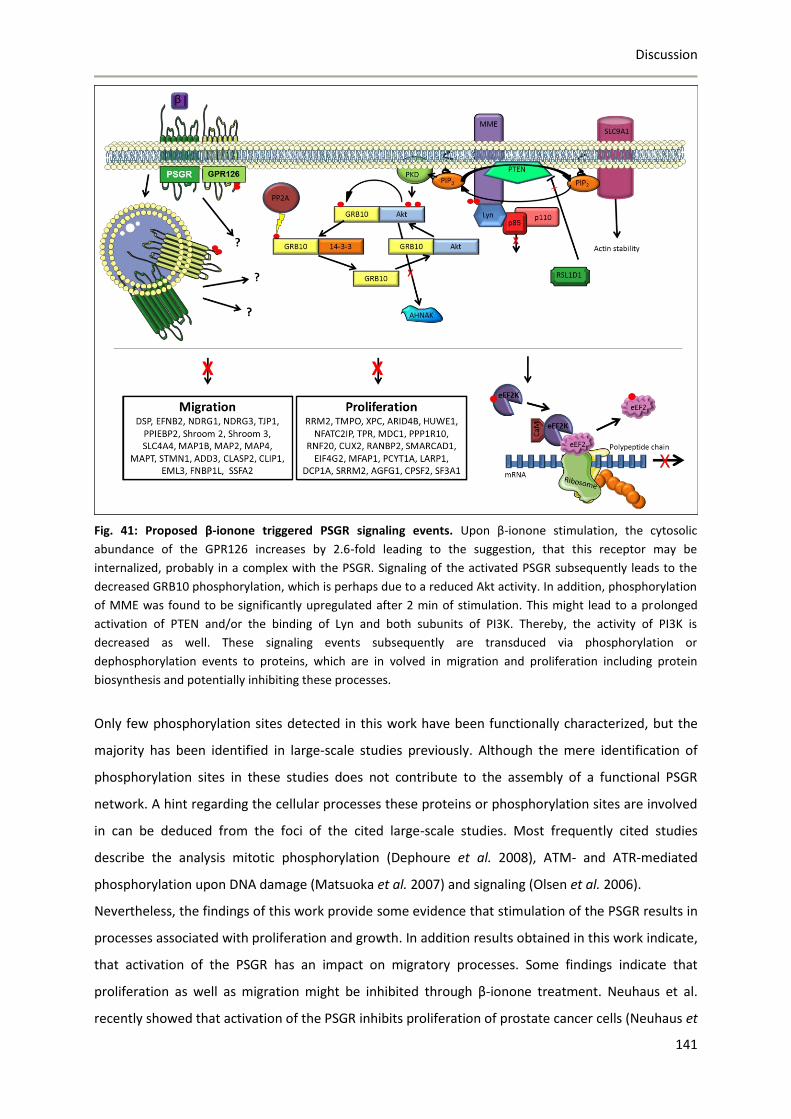
Discussion
141
Fig. 41: Proposed β-ionone triggered PSGR signaling events. Upon β-ionone stimulation, the cytosolic
abundance of the GPR126 increases by 2.6-fold leading to the suggestion, that this receptor may be
internalized, probably in a complex with the PSGR. Signaling of the activated PSGR subsequently leads to the
decreased GRB10 phosphorylation, which is perhaps due to a reduced Akt activity. In addition, phosphorylation
of MME was found to be significantly upregulated after 2 min of stimulation. This might lead to a prolonged
activation of PTEN and/or the binding of Lyn and both subunits of PI3K. Thereby, the activity of PI3K is
decreased as well. These signaling events subsequently are transduced via phosphorylation or
dephosphorylation events to proteins, which are in volved in migration and proliferation including protein
biosynthesis and potentially inhibiting these processes.
Only few phosphorylation sites detected in this work have been functionally characterized, but the
majority has been identified in large-scale studies previously. Although the mere identification of
phosphorylation sites in these studies does not contribute to the assembly of a functional PSGR
network. A hint regarding the cellular processes these proteins or phosphorylation sites are involved
in can be deduced from the foci of the cited large-scale studies. Most frequently cited studies
describe the analysis mitotic phosphorylation (Dephoure et al. 2008), ATM- and ATR-mediated
phosphorylation upon DNA damage (Matsuoka et al. 2007) and signaling (Olsen et al. 2006).
Nevertheless, the findings of this work provide some evidence that stimulation of the PSGR results in
processes associated with proliferation and growth. In addition results obtained in this work indicate,
that activation of the PSGR has an impact on migratory processes. Some findings indicate that
proliferation as well as migration might be inhibited through β-ionone treatment. Neuhaus et al.
recently showed that activation of the PSGR inhibits proliferation of prostate cancer cells (Neuhaus et
X
X

Discussion
142
al. 2009). The β-ionone study conducted in this work provides a list of candidate proteins, possibly
mediating this anti-proliferative effect of PSGR activation.
As to address the effect of PSGR stimulation with β-ionone on the migratory behavior of LNCaP cells,
a Boyden chamber assay was performed. This assay revealed, that β-ionone neither acts as attractive
nor a repellent chemotactic cue. However, β-ionone stimulation of LNCaP cells significantly inhibited
serum-directed migration.
In summary, this study provides a range of candidate proteins, by which these effects on migratory
and proliferative processes may be mediated. Furthermore, the inhibition of proliferation and
migration of prostate cancer cells is of high interest, since the PSGR receptor and proteins, found to
be regulated in this study, may be promising targets for anti-cancer drug development.

Conclusion
143
9 Conclusion
Initial approaches to study phosphorylation mediated signaling of olfactory receptors in the murine
OE by a gel-based phosphoproteomics approach, could not be established due to irreproducible
staining results using the ProQ®Diamond stain, which is the only available phospho-specific stain to
date. In addition, problems with the reproducible phosphoprotein sample preparation from treated
olfactory epithelia (OE) of mice emerged. However, this sample preparation could not be optimized,
as no suitable method was available to control the level of phosphorylation in preparted samples.
Therefore, a phosphoproteomics methodology should be established, which allows for the
reproducible and differential analysis of a great number of phosphorylated proteins. For that
purpose a gel-free phosphoproteomics approach was established, refined and tested in a global
phosphoproteomics study of lysates of orthovanadate treated LNCaP cells. This study demonstrated,
that the established workflow is indeed efficient and, in respect to the number of identified
phosphorylation sites, comparable to recently published studies. Overall, 2095 phosphopeptides
from 726 different proteins have been identified in two replicate analyses of 200 µg of peptides. In
this study, two different phosphopeptide analysis platforms were compared, using the LTQ-Orbitrap
XL instrument with MSA fragmentation and subsequent analysis via the MaxQaunt algorithm and the
HCTUltra PTM with CID and NL-triggered ETD and the bioinformatic analysis via ProteinScape and the
SLoMo algorithm. The approach using the LTQ-Orbitrap with subsequent MaxQuant analysis
provided better results both in the number of identified phosphopeptides and in the number of
confidently assigned phosphorylation sites. Still, both approaches identified a highly complementary
set of phosphopeptides, thereby contributing equally to the identification of new phosphorylation
sites. In addition, the analysis resulted in the identification of 164 hitherto unknown phosphorylation
sites. This global phosphoproteomics analysis resembles the most comprehensive
phosphoproteomics study in LNCaP cells so far.
For the analysis of PSGR mediated signaling, LNCaP cells expressing the PSGR were treated with the
known PSGR ligand β-ionone. The previously established phosphoproteomics workflow using the
LTQ-Orbitrap analysis platform was combined with SILAC labeling for the differential and time
resolved phosphoproteomics analysis of β-ionone stimulated LNCaP cells. This resulted in a total of
1154 identified phosphopeptides of which 99 phosphopeptides from 73 proteins were differentially
up- or downregulated upon β-ionone treatment. Almost nothing is known about the actual function
of the phosphorylation sites, which were identified to be regulated by β-ionone treatment. Many of
the respective proteins however, are involved in proliferation and migration processes. Whether the
observed changes in the phosphorylation level lead to the activation or deactivation of the particular
proteins however, remains elusive. However, the little information available on the proteins suggest

Conclusion
144
that proliferation as well as migration might be decreases. Indeed it was previously demonstrated,
that β-ionone has an antiproliferatory effect, which is mediated by the PSGR (Neuhaus et al. 2009). In
addition, a migration assay was performed, in which β-ionone appeard to inhibit serum directed
migration. In summary, the 73 phosphoproteins, which were identified to be differentially regulated
by β-ionone treatment provide new candidate proteins which may mediate PSGR signaling. In
addition, the results suggest that β-ionone stimulation of the PSGR receptor may have
antiproliferatory and antimigratory effects, which naturally is highly relevant in in the context of
prostate cancer. To confirm the actual role of PSGR signaling and the functions of the involved
proteins as well as the relevance of the identified phosphorylation sites, extensive further studies are
needed.

Outlook
145
10 Outlook
In this work, the virtually unknown PSGR signaling network was analyzed. The results present the
basis for the future elucidation of PSGR function in the prostate and its relevance for prostate cancer.
However, to intimately characterize PSGR mediated signaling, many more of its aspects have to be
investigated. For instance, almost all of the proteins found to be differentially phosphorylated upon
β-ionone stimulation, are known to be phosphorylated on tyrosine residues. Nevertheless, these
sites have not been identified via the workflow employed in this work. This was due to the
methodological approach, which is inherently biased towards serine and threonine phosphorylation.
Therefore, it a phosphotyrosine specific proteomics approach would provide subsidiary insights into
PSGR mediated signaling. For that purpose, immunoprecipitation with phosphotyrosine specific
antibodys could be performed prior to MS-analysis. In addition, the continuative analysis of
differentially regulated serine and threonine phosphoryation sites already identified in the study,
would add to the knowledge about the PSGR mediated signaling. For instance, the phosphorylation
level of phosphopeptides from candidate proteins could be monitored for more time points including
very short and longer treatment. For that purpose, a targeted and sensitive MS-based screening
approach termed multiple reaction monitoring (MRM) could be employed. By this method, selected
peptides can be quantified in multiple samples, thereby providing an opportunity for the rapid
quantification of peptides from candidate proteins in samples treated with β-ionone for multiple
time points. Furthermore, the candidate protein list contained proportionally many membrane
proteins, indicating strong participation of processes located at the plasma membrane. Thus, it might
contribute to the elucidation of PSGR mediated signaling to enrich for plasma membranes and to
specifically analyze phosphorylation events occurring in close proximity to the PSGR. In addition to
the verification of β-ionone triggered signaling, androstenone derivatives, which were also
demonstrated to be PSGR ligands (Neuhaus et al. 2009), could be used for stimulation experiments.
The resulting effects on the phosphorylation level could be analyzed and compared to the effects of
β-ionone treatment. As androstenone derivatives are more likely to be the physiological ligands of
the PSGR in prostate, it would be interesting, whether the effects observed by β-ionone and
androstenone derivative stimulation would be the same.
Beyond the additional proteomics approaches, complementary biological experiments have to be
performed to confirm the relevance of the identified candidate proteins and the respective
phosphorylation sites in mediating β-ionone induced signaling. For example, the three candidate
proteins, which change in protein abundance rather than in the actual phosphorylation level, could
be analyzed by immunofluorescence staining to analyze, whether the observed effect is due to a
change in subcellular location. One of these three proteins is the only G-protein coupled receptor

Outlook
146
identified in this work. For this protein it might be additionally of interest, to test for potential
colocalization with the PSGR. The relevance for other candidate proteins concerning the discussed
processes migration and proliferation could be further studied by knock-down experiments or
overexpression for the respective proteins. Beyond that, the actual function of the involved
phosphorylation sites has to be determined. For that purpose, the respective amino acid could be
mutated to analyze the effects of hindered phosphorylation at that point. In summary, the study
presented here provides a number of candidate proteins, which are likely to be involved in the
transduction of the observed antimigratory and antiproliferatorive effects and which now have to be
further examined.
Finally, an efficient gel-free phosphoproteomics approach was established successfully in this work.
Therefore, an application of this workflow to the analysis of phosphorylation events triggered by
odorant binding to olfactory receptors in the murine olfactory epithelium might be possible in the
future.

Literature
147
11 Literature
Adra, C. N., J. L. Donato, R. Badovinac, F. Syed, R. Kheraj, H. Cai, C. Moran, M. T. Kolker, H. Turner, S. Weremowicz, T. Shirakawa, C. C. Morton, L. E. Schnipper and R. Drews (2000). "SMARCAD1, a novel human helicase family-defining member associated with genetic instability: cloning, expression, and mapping to 4q22-q23, a band rich in breakpoints and deletion mutants involved in several human diseases." Genomics 69(2): 162-173. Aebersold, R. and D. R. Goodlett (2001). "Mass spectrometry in proteomics." Chem Rev 101(2): 269-295. Aebersold, R. and M. Mann (2003). "Mass spectrometry-based proteomics." Nature 422(6928): 198-207. Agarwala, K. L., K. Kokame, H. Kato and T. Miyata (2000). "Phosphorylation of RTP, an ER stress-responsive cytoplasmic protein." Biochem Biophys Res Commun 272(3): 641-647. Agrawal, G. K. and J. J. Thelen (2006). "Large scale identification and quantitative profiling of phosphoproteins expressed during seed filling in oilseed rape." Mol Cell Proteomics 5(11): 2044-2059. Alberdi, E., M. S. Aymerich and S. P. Becerra (1999). "Binding of pigment epithelium-derived factor (PEDF) to retinoblastoma cells and cerebellar granule neurons. Evidence for a PEDF receptor." J Biol Chem 274(44): 31605-31612. Alberts, B. (2002). Molecular biology of the cell. New York, Garland Science. Andersen, D. S. and N. Tapon (2008). "Drosophila MFAP1 is required for pre-mRNA processing and G2/M progression." J Biol Chem 283(45): 31256-31267. Arakawa, H., K. Arakawa and T. Deak (2009). "Acute illness induces the release of aversive odor cues from adult, but not prepubertal, male rats and suppresses social investigation by conspecifics." Behav Neurosci 123(5): 964-978. Armbruster, B. N. and B. L. Roth (2005). "Mining the receptorome." J Biol Chem 280(7): 5129-5132. Arnaoutov, A. and M. Dasso (2005). "Ran-GTP regulates kinetochore attachment in somatic cells." Cell Cycle 4(9): 1161-1165. Avila, J. (2009). "The tau code." Front Aging Neurosci 1: 1. Aymerich, M. S., E. M. Alberdi, A. Martinez and S. P. Becerra (2001). "Evidence for pigment epithelium-derived factor receptors in the neural retina." Invest Ophthalmol Vis Sci 42(13): 3287-3293. Bailey, C. M., S. M. Sweet, D. L. Cunningham, M. Zeller, J. K. Heath and H. J. Cooper (2009). "SLoMo: automated site localization of modifications from ETD/ECD mass spectra." J Proteome Res 8(4): 1965-1971. Ballif, B. A., J. Villen, S. A. Beausoleil, D. Schwartz and S. P. Gygi (2004). "Phosphoproteomic analysis of the developing mouse brain." Mol Cell Proteomics 3(11): 1093-1101. Bantscheff, M., M. Schirle, G. Sweetman, J. Rick and B. Kuster (2007). "Quantitative mass spectrometry in proteomics: a critical review." Anal Bioanal Chem 389(4): 1017-1031. Barbour, J., E. M. Neuhaus, H. Piechura, N. Stoepel, A. Mashukova, D. Brunert, B. Sitek, K. Stuhler, H. E. Meyer, H. Hatt and B. Warscheid (2008). "New insight into stimulus-induced plasticity of the olfactory epithelium in Mus musculus by quantitative proteomics." J Proteome Res 7(4): 1594-1605. Bauer, H., J. Zweimueller-Mayer, P. Steinbacher, A. Lametschwandtner and H. C. Bauer (2010). "The dual role of zonula occludens (ZO) proteins." J Biomed Biotechnol 2010: 402593. Baumgartner, M., H. Patel and D. L. Barber (2004). "Na(+)/H(+) exchanger NHE1 as plasma membrane scaffold in the assembly of signaling complexes." Am J Physiol Cell Physiol 287(4): C844-850.
Literature
148
Beausoleil, S. A., M. Jedrychowski, D. Schwartz, J. E. Elias, J. Villen, J. Li, M. A. Cohn, L. C. Cantley and S. P. Gygi (2004). "Large-scale characterization of HeLa cell nuclear phosphoproteins." Proc Natl Acad Sci U S A 101(33): 12130-12135. Beausoleil, S. A., J. Villen, S. A. Gerber, J. Rush and S. P. Gygi (2006). "A probability-based approach for high-throughput protein phosphorylation analysis and site localization." Nat Biotechnol 24(10): 1285-1292. Becherel, O. J., B. Jakob, A. L. Cherry, N. Gueven, M. Fusser, A. W. Kijas, C. Peng, S. Katyal, P. J. McKinnon, J. Chen, B. Epe, S. J. Smerdon, G. Taucher-Scholz and M. F. Lavin (2010). "CK2 phosphorylation-dependent interaction between aprataxin and MDC1 in the DNA damage response." Nucleic Acids Res 38(5): 1489-1503. Beranova-Giorgianni, S., Y. Zhao, D. M. Desiderio and F. Giorgianni (2006). "Phosphoproteomic analysis of the human pituitary." Pituitary 9(2): 109-120. Bernassola, F., M. Karin, A. Ciechanover and G. Melino (2008). "The HECT family of E3 ubiquitin ligases: multiple players in cancer development." Cancer Cell 14(1): 10-21. Bhat, K. M. and V. Setaluri (2007). "Microtubule-associated proteins as targets in cancer chemotherapy." Clin Cancer Res 13(10): 2849-2854. Black, T. M., C. L. Andrews, G. Kilili, M. Ivan, P. N. Tsichlis and P. Vouros (2007). "Characterization of phosphorylation sites on Tpl2 using IMAC enrichment and a linear ion trap mass spectrometer." J Proteome Res 6(6): 2269-2276. Blagden, S. P., M. K. Gatt, V. Archambault, K. Lada, K. Ichihara, K. S. Lilley, Y. H. Inoue and D. M. Glover (2009). "Drosophila Larp associates with poly(A)-binding protein and is required for male fertility and syncytial embryo development." Dev Biol 334(1): 186-197. Blencowe, B. J., G. Bauren, A. G. Eldridge, R. Issner, J. A. Nickerson, E. Rosonina and P. A. Sharp (2000). "The SRm160/300 splicing coactivator subunits." RNA 6(1): 111-120. Blom, N., T. Sicheritz-Ponten, R. Gupta, S. Gammeltoft and S. Brunak (2004). "Prediction of post-translational glycosylation and phosphorylation of proteins from the amino acid sequence." Proteomics 4(6): 1633-1649. Blumenthal, J., L. Behar, E. Elliott and I. Ginzburg (2009). "Dcp1a phosphorylation along neuronal development and stress." FEBS Lett 583(1): 197-201. Bochenek, M. L., S. Dickinson, J. W. Astin, R. H. Adams and C. D. Nobes (2010). "Ephrin-B2 regulates endothelial cell morphology and motility independently of Eph-receptor binding." J Cell Sci 123(Pt 8): 1235-1246. Boersema, P. J., S. Mohammed and A. J. Heck (2009). "Phosphopeptide fragmentation and analysis by mass spectrometry." J Mass Spectrom 44(6): 861-878. Bogerd, H. P., R. A. Fridell, S. Madore and B. R. Cullen (1995). "Identification of a novel cellular cofactor for the Rev/Rex class of retroviral regulatory proteins." Cell 82(3): 485-494. Boja, E. S., D. Phillips, S. A. French, R. A. Harris and R. S. Balaban (2009). "Quantitative mitochondrial phosphoproteomics using iTRAQ on an LTQ-Orbitrap with high energy collision dissociation." J Proteome Res 8(10): 4665-4675. Bonkhoff, H. and R. Berges (2010). "From pathogenesis to prevention of castration resistant prostate cancer." Prostate 70(1): 100-112. Brattsand, G., G. Roos, U. Marklund, H. Ueda, G. Landberg, E. Nanberg, P. Sideras and M. Gullberg (1993). "Quantitative analysis of the expression and regulation of an activation-regulated phosphoprotein (oncoprotein 18) in normal and neoplastic cells." Leukemia 7(4): 569-579. Bu, W., A. M. Chou, K. B. Lim, T. Sudhaharan and S. Ahmed (2009). "The Toca-1-N-WASP complex links filopodial formation to endocytosis." J Biol Chem 284(17): 11622-11636. Buck, L. and R. Axel (1991). "A novel multigene family may encode odorant receptors: a molecular basis for odor recognition." Cell 65(1): 175-187.

Literature
149
Burrows, C., N. Abd Latip, S. J. Lam, L. Carpenter, K. Sawicka, G. Tzolovsky, H. Gabra, M. Bushell, D. M. Glover, A. E. Willis and S. P. Blagden (2010). "The RNA binding protein Larp1 regulates cell division, apoptosis and cell migration." Nucleic Acids Res 38(16): 5542-5553. Bush, C. F. and R. A. Hall (2008). "Olfactory receptor trafficking to the plasma membrane." Cell Mol Life Sci 65(15): 2289-2295. Byrd, D. A., D. J. Sweet, N. Pante, K. N. Konstantinov, T. Guan, A. C. Saphire, P. J. Mitchell, C. S. Cooper, U. Aebi and L. Gerace (1994). "Tpr, a large coiled coil protein whose amino terminus is involved in activation of oncogenic kinases, is localized to the cytoplasmic surface of the nuclear pore complex." J Cell Biol 127(6 Pt 1): 1515-1526. Campbell, T. N. and S. M. Robbins (2008). "The Eph receptor/ephrin system: an emerging player in the invasion game." Curr Issues Mol Biol 10(1-2): 61-66. Cantin, G. T., W. Yi, B. Lu, S. K. Park, T. Xu, J. D. Lee and J. R. Yates, 3rd (2008). "Combining protein-based IMAC, peptide-based IMAC, and MudPIT for efficient phosphoproteomic analysis." J Proteome Res 7(3): 1346-1351. Cao, J., T. Gao, E. J. Stanbridge and R. Irie (2001). "RBP1L1, a retinoblastoma-binding protein-related gene encoding an antigenic epitope abundantly expressed in human carcinomas and normal testis." J Natl Cancer Inst 93(15): 1159-1165. Caraglia, M., A. Budillon, G. Vitale, G. Lupoli, P. Tagliaferri and A. Abbruzzese (2000). "Modulation of molecular mechanisms involved in protein synthesis machinery as a new tool for the control of cell proliferation." Eur J Biochem 267(13): 3919-3936. Cardone, R. A., V. Casavola and S. J. Reshkin (2005). "The role of disturbed pH dynamics and the Na+/H+ exchanger in metastasis." Nat Rev Cancer 5(10): 786-795. Cetin, E., B. Cengiz, E. Gunduz, M. Gunduz, H. Nagatsuka, L. Bekir-Beder, K. Fukushima, D. Pehlivan, M. O. N, K. Nishizaki, K. Shimizu and N. Nagai (2008). "Deletion mapping of chromosome 4q22-35 and identification of four frequently deleted regions in head and neck cancers." Neoplasma 55(4): 299-304. Chaineau, M., L. Danglot, V. Proux-Gillardeaux and T. Galli (2008). "Role of HRB in clathrin-dependent endocytosis." J Biol Chem 283(49): 34365-34373. Chang, W., D. Gruber, S. Chari, H. Kitazawa, Y. Hamazumi, S. Hisanaga and J. C. Bulinski (2001). "Phosphorylation of MAP4 affects microtubule properties and cell cycle progression." J Cell Sci 114(Pt 15): 2879-2887. Checler, F., P. C. Emson, J. P. Vincent and P. Kitabgi (1984). "Inactivation of neurotensin by rat brain synaptic membranes. Cleavage at the Pro10-Tyr11 bond by endopeptidase 24.11 (enkephalinase) and a peptidase different from proline-endopeptidase." J Neurochem 43(5): 1295-1301. Chen, L., F. Giorgianni and S. Beranova-Giorgianni (2010). "Characterization of the phosphoproteome in LNCaP prostate cancer cells by in-gel isoelectric focusing and tandem mass spectrometry." J Proteome Res 9(1): 174-178. Chen, Y. S., R. A. Mathias, S. Mathivanan, E. A. Kapp, R. L. Moritz, H. J. Zhu and R. J. Simpson (2010). "Proteomic profiling of MDCK plasma membranes reveals Wnt-5a involvement during oncogenic H-Ras/TGF-{beta}-mediated epithelial-mesenchymal transition." Mol Cell Proteomics. Cheng, G., Y. Iijima, Y. Ishibashi, D. Kuppuswamy and G. t. Cooper (2002). "Inhibition of G protein-coupled receptor trafficking in neuroblastoma cells by MAP 4 decoration of microtubules." Am J Physiol Heart Circ Physiol 283(6): H2379-2388. Chitteti, B. R. and Z. Peng (2007). "Proteome and phosphoproteome differential expression under salinity stress in rice (Oryza sativa) roots." J Proteome Res 6(5): 1718-1727. Christensen, G. L., C. D. Kelstrup, C. Lyngso, U. Sarwar, R. Bogebo, S. P. Sheikh, S. Gammeltoft, J. V. Olsen and J. L. Hansen (2010). "Quantitative phosphoproteomics dissection of seven-transmembrane receptor signaling using full and biased agonists." Mol Cell Proteomics 9(7): 1540-1553.

Literature
150
Clarke, R. A., Z. Zhao, A. Y. Guo, K. Roper, L. Teng, Z. M. Fang, H. Samaratunga, M. F. Lavin and R. A. Gardiner (2009). "New genomic structure for prostate cancer specific gene PCA3 within BMCC1: implications for prostate cancer detection and progression." PLoS One 4(3): e4995. Cleutjens, C. B., K. Steketee, C. C. van Eekelen, J. A. van der Korput, A. O. Brinkmann and J. Trapman (1997). "Both androgen receptor and glucocorticoid receptor are able to induce prostate-specific antigen expression, but differ in their growth-stimulating properties of LNCaP cells." Endocrinology 138(12): 5293-5300. Cox, J. and M. Mann (2008). "MaxQuant enables high peptide identification rates, individualized p.p.b.-range mass accuracies and proteome-wide protein quantification." Nat Biotechnol 26(12): 1367-1372. Cox, J., I. Matic, M. Hilger, N. Nagaraj, M. Selbach, J. V. Olsen and M. Mann (2009). "A practical guide to the MaxQuant computational platform for SILAC-based quantitative proteomics." Nat Protoc 4(5): 698-705. Craig, A. G., C. A. Hoeger, C. L. Miller, T. Goedken, J. E. Rivier and W. H. Fischer (1994). "Monitoring protein kinase and phosphatase reactions with matrix-assisted laser desorption/ionization mass spectrometry and capillary zone electrophoresis: comparison of the detection efficiency of peptide-phosphopeptide mixtures." Biol Mass Spectrom 23(8): 519-528. Cripps, D., S. N. Thomas, Y. Jeng, F. Yang, P. Davies and A. J. Yang (2006). "Alzheimer disease-specific conformation of hyperphosphorylated paired helical filament-Tau is polyubiquitinated through Lys-48, Lys-11, and Lys-6 ubiquitin conjugation." J Biol Chem 281(16): 10825-10838. Cubelos, B., A. Sebastian-Serrano, L. Beccari, M. E. Calcagnotto, E. Cisneros, S. Kim, A. Dopazo, M. Alvarez-Dolado, J. M. Redondo, P. Bovolenta, C. A. Walsh and M. Nieto (2010). "Cux1 and Cux2 regulate dendritic branching, spine morphology, and synapses of the upper layer neurons of the cortex." Neuron 66(4): 523-535. D'Arca, D., X. Zhao, W. Xu, N. C. Ramirez-Martinez, A. Iavarone and A. Lasorella (2010). "Huwe1 ubiquitin ligase is essential to synchronize neuronal and glial differentiation in the developing cerebellum." Proc Natl Acad Sci U S A 107(13): 5875-5880. Dai, J., R. Shen, M. Sumitomo, J. S. Goldberg, Y. Geng, D. Navarro, S. Xu, J. A. Koutcher, M. Garzotto, C. T. Powell and D. M. Nanus (2001). "Tumor-suppressive effects of neutral endopeptidase in androgen-independent prostate cancer cells." Clin Cancer Res 7(5): 1370-1377. Damber, J. E. and G. Aus (2008). "Prostate cancer." Lancet 371(9625): 1710-1721. Das, R., Z. Zhou and R. Reed (2000). "Functional association of U2 snRNP with the ATP-independent spliceosomal complex E." Mol Cell 5(5): 779-787. Davis, R. L. (2004). "Olfactory learning." Neuron 44(1): 31-48. Dawlaty, M. M., L. Malureanu, K. B. Jeganathan, E. Kao, C. Sustmann, S. Tahk, K. Shuai, R. Grosschedl and J. M. van Deursen (2008). "Resolution of sister centromeres requires RanBP2-mediated SUMOylation of topoisomerase IIalpha." Cell 133(1): 103-115. Dawson, D. W., O. V. Volpert, P. Gillis, S. E. Crawford, H. Xu, W. Benedict and N. P. Bouck (1999). "Pigment epithelium-derived factor: a potent inhibitor of angiogenesis." Science 285(5425): 245-248. Dayon, L., A. Hainard, V. Licker, N. Turck, K. Kuhn, D. F. Hochstrasser, P. R. Burkhard and J. C. Sanchez (2008). "Relative quantification of proteins in human cerebrospinal fluids by MS/MS using 6-plex isobaric tags." Anal Chem 80(8): 2921-2931. De Leon, G., T. C. Sherry and N. A. Krucher (2008). "Reduced expression of PNUTS leads to activation of Rb-phosphatase and caspase-mediated apoptosis." Cancer Biol Ther 7(6): 833-841. Dechat, T., J. Gotzmann, A. Stockinger, C. A. Harris, M. A. Talle, J. J. Siekierka and R. Foisner (1998). "Detergent-salt resistance of LAP2alpha in interphase nuclei and phosphorylation-dependent association with chromosomes early in nuclear assembly implies functions in nuclear structure dynamics." EMBO J 17(16): 4887-4902.

Literature
151
Dechat, T., S. Vlcek and R. Foisner (2000). "Review: lamina-associated polypeptide 2 isoforms and related proteins in cell cycle-dependent nuclear structure dynamics." J Struct Biol 129(2-3): 335-345. DeGiorgis, J. A., H. Jaffe, J. E. Moreira, C. G. Carlotti, Jr., J. P. Leite, H. C. Pant and A. Dosemeci (2005). "Phosphoproteomic analysis of synaptosomes from human cerebral cortex." J Proteome Res 4(2): 306-315. Del Rio, J. A., C. Gonzalez-Billault, J. M. Urena, E. M. Jimenez, M. J. Barallobre, M. Pascual, L. Pujadas, S. Simo, A. La Torre, F. Wandosell, J. Avila and E. Soriano (2004). "MAP1B is required for Netrin 1 signaling in neuronal migration and axonal guidance." Curr Biol 14(10): 840-850. Dephoure, N., C. Zhou, J. Villen, S. A. Beausoleil, C. E. Bakalarski, S. J. Elledge and S. P. Gygi (2008). "A quantitative atlas of mitotic phosphorylation." Proc Natl Acad Sci U S A 105(31): 10762-10767. Depondt, J., A. H. Shabana, S. Florescu-Zorila, P. Gehanno and N. Forest (1999). "Down-regulation of desmosomal molecules in oral and pharyngeal squamous cell carcinomas as a marker for tumour growth and distant metastasis." Eur J Oral Sci 107(3): 183-193. Dieterich, D. C., J. J. Hodas, G. Gouzer, I. Y. Shadrin, J. T. Ngo, A. Triller, D. A. Tirrell and E. M. Schuman (2010). "In situ visualization and dynamics of newly synthesized proteins in rat hippocampal neurons." Nat Neurosci 13(7): 897-905. Dietz, M. L., T. M. Bernaciak, F. Vendetti, J. M. Kielec and J. D. Hildebrand (2006). "Differential actin-dependent localization modulates the evolutionarily conserved activity of Shroom family proteins." J Biol Chem 281(29): 20542-20554. Dimina, E., M. Kula, U. Caune, D. Vigante, M. Liepins, L. Zeidaka, O. Nikitina, D. Kurina, A. Mironovska and U. Dumpis (2009). "Repeated prevalence studies on antibiotic use in Latvia, 2003-2007." Euro Surveill 14(33). Doherty, G. J. and H. T. McMahon (2009). "Mechanisms of endocytosis." Annu Rev Biochem 78: 857-902. Doong, H., J. Price, Y. S. Kim, C. Gasbarre, J. Probst, L. A. Liotta, J. Blanchette, K. Rizzo and E. Kohn (2000). "CAIR-1/BAG-3 forms an EGF-regulated ternary complex with phospholipase C-gamma and Hsp70/Hsc70." Oncogene 19(38): 4385-4395. Doria, M., A. E. Salcini, E. Colombo, T. G. Parslow, P. G. Pelicci and P. P. Di Fiore (1999). "The eps15 homology (EH) domain-based interaction between eps15 and hrb connects the molecular machinery of endocytosis to that of nucleocytosolic transport." J Cell Biol 147(7): 1379-1384. Duncan, R. E., D. Lau, A. El-Sohemy and M. C. Archer (2004). "Geraniol and beta-ionone inhibit proliferation, cell cycle progression, and cyclin-dependent kinase 2 activity in MCF-7 breast cancer cells independent of effects on HMG-CoA reductase activity." Biochem Pharmacol 68(9): 1739-1747. Dunn, J. D., G. E. Reid and M. L. Bruening (2010). "Techniques for phosphopeptide enrichment prior to analysis by mass spectrometry." Mass Spectrom Rev 29(1): 29-54. Elsaesser, R. and J. Paysan (2007). "The sense of smell, its signalling pathways, and the dichotomy of cilia and microvilli in olfactory sensory cells." BMC Neurosci 8 Suppl 3: S1. Elson, C. E., D. M. Peffley, P. Hentosh and H. Mo (1999). "Isoprenoid-mediated inhibition of mevalonate synthesis: potential application to cancer." Proc Soc Exp Biol Med 221(4): 294-311. Eng, J. K., A. L. McCormack and J. R. Yates (1994). "An Approach to Correlate Tandem Mass Spectral Data of Peptides with Amino Acid Sequences in a Protein Database." J Am Soc Mass Spectrom 5(11): 976-989 Engstrom, Y., S. Eriksson, I. Jildevik, S. Skog, L. Thelander and B. Tribukait (1985). "Cell cycle-dependent expression of mammalian ribonucleotide reductase. Differential regulation of the two subunits." J Biol Chem 260(16): 9114-9116. Essmann, C. L., E. Martinez, J. C. Geiger, M. Zimmer, M. H. Traut, V. Stein, R. Klein and A. Acker-Palmer (2008). "Serine phosphorylation of ephrinB2 regulates trafficking of synaptic AMPA receptors." Nat Neurosci 11(9): 1035-1043. Etournay, R., I. Zwaenepoel, I. Perfettini, P. Legrain, C. Petit and A. El-Amraoui (2007). "Shroom2, a myosin-VIIa- and actin-binding protein, directly interacts with ZO-1 at tight junctions." J Cell Sci 120(Pt 16): 2838-2850.

Literature
152
Fagone, P. and S. Jackowski (2009). "Membrane phospholipid synthesis and endoplasmic reticulum function." J Lipid Res 50 Suppl: S311-316. Feldmesser, E., T. Olender, M. Khen, I. Yanai, R. Ophir and D. Lancet (2006). "Widespread ectopic expression of olfactory receptor genes." BMC Genomics 7: 121. Fenger-Gron, M., C. Fillman, B. Norrild and J. Lykke-Andersen (2005). "Multiple processing body factors and the ARE binding protein TTP activate mRNA decapping." Mol Cell 20(6): 905-915. Fenselau, C. and X. Yao (2009). "18O2-labeling in quantitative proteomic strategies: a status report." J Proteome Res 8(5): 2140-2143. Ferlay, J., D. M. Parkin and E. Steliarova-Foucher (2010). "Estimates of cancer incidence and mortality in Europe in 2008." Eur J Cancer 46(4): 765-781. Finehout, E. J., J. R. Cantor and K. H. Lee (2005). "Kinetic characterization of sequencing grade modified trypsin." Proteomics 5(9): 2319-2321. Firestein, S. (2001). "How the olfactory system makes sense of scents." Nature 413(6852): 211-218. Firestein, S. (2004). "A code in the nose." Sci STKE 2004(227): pe15. Fischer, J. L., M. A. Kumar, T. W. Day, T. M. Hardy, S. Hamilton, C. Besch-Williford, A. R. Safa, K. E. Pollok and M. L. Smith (2009). "The Xpc gene markedly affects cell survival in mouse bone marrow." Mutagenesis 24(4): 309-316. Fleischer, T. C., U. J. Yun and D. E. Ayer (2003). "Identification and characterization of three new components of the mSin3A corepressor complex." Mol Cell Biol 23(10): 3456-3467. Foisner, R. and L. Gerace (1993). "Integral membrane proteins of the nuclear envelope interact with lamins and chromosomes, and binding is modulated by mitotic phosphorylation." Cell 73(7): 1267-1279. Fowler, L., J. Everitt, J. L. Stevens and S. Jaken (1998). "Redistribution and enhanced protein kinase C-mediated phosphorylation of alpha- and gamma-adducin during renal tumor progression." Cell Growth Differ 9(5): 405-413. Fremin, C. and S. Meloche (2010). "From basic research to clinical development of MEK1/2 inhibitors for cancer therapy." J Hematol Oncol 3: 8. Friedl, P. and D. Gilmour (2009). "Collective cell migration in morphogenesis, regeneration and cancer." Nat Rev Mol Cell Biol 10(7): 445-457. Friedl, P. and K. Wolf (2010). "Plasticity of cell migration: a multiscale tuning model." J Cell Biol 188(1): 11-19. Fukata, M., T. Watanabe, J. Noritake, M. Nakagawa, M. Yamaga, S. Kuroda, Y. Matsuura, A. Iwamatsu, F. Perez and K. Kaibuchi (2002). "Rac1 and Cdc42 capture microtubules through IQGAP1 and CLIP-170." Cell 109(7): 873-885. Fukunaga, R. and T. Hunter (1997). "MNK1, a new MAP kinase-activated protein kinase, isolated by a novel expression screening method for identifying protein kinase substrates." EMBO J 16(8): 1921-1933. Funato, Y., T. Terabayashi, N. Suenaga, M. Seiki, T. Takenawa and H. Miki (2004). "IRSp53/Eps8 complex is important for positive regulation of Rac and cancer cell motility/invasiveness." Cancer Res 64(15): 5237-5244. Furuta, E., H. Okuda, A. Kobayashi and K. Watabe (2010). "Metabolic genes in cancer: their roles in tumor progression and clinical implications." Biochim Biophys Acta 1805(2): 141-152. Ganju, R. K., R. G. Shpektor, D. G. Brenner and M. A. Shipp (1996). "CD10/neutral endopeptidase 24.11 is phosphorylated by casein kinase II and coassociates with other phosphoproteins including the lyn src-related kinase." Blood 88(11): 4159-4165. Gannon, J., L. Staunton, K. O'Connell, P. Doran and K. Ohlendieck (2008). "Phosphoproteomic analysis of aged skeletal muscle." Int J Mol Med 22(1): 33-42.

Literature
153
Gauci, S., A. O. Helbig, M. Slijper, J. Krijgsveld, A. J. Heck and S. Mohammed (2009). "Lys-N and trypsin cover complementary parts of the phosphoproteome in a refined SCX-based approach." Anal Chem 81(11): 4493-4501. Gelis, L. (2009) Function of odorant receptors in non-neuronal human cells; Department for Cell Physiology; Ruhr-Universität Bochum Gerber, S. A., J. Rush, O. Stemman, M. W. Kirschner and S. P. Gygi (2003). "Absolute quantification of proteins and phosphoproteins from cell lysates by tandem MS." Proc Natl Acad Sci U S A 100(12): 6940-6945. Gerrits, B. and B. Bodenmiller (2010). "Mapping of phosphorylation sites by LC-MS/MS." Methods Mol Biol 658: 127-136. Giorgianni, F., Y. Zhao, D. M. Desiderio and S. Beranova-Giorgianni (2007). "Toward a global characterization of the phosphoproteome in prostate cancer cells: identification of phosphoproteins in the LNCaP cell line." Electrophoresis 28(12): 2027-2034. Godsel, L. M., S. Getsios, A. C. Huen and K. J. Green (2004). "The molecular composition and function of desmosomes." Handb Exp Pharmacol(165): 137-193. Goldenring, J. R., M. L. Vallano and R. J. DeLorenzo (1985). "Phosphorylation of microtubule-associated protein 2 at distinct sites by calmodulin-dependent and cyclic-AMP-dependent kinases." J Neurochem 45(3): 900-905. Grainger, R. J., J. D. Barrass, A. Jacquier, J. C. Rain and J. D. Beggs (2009). "Physical and genetic interactions of yeast Cwc21p, an ortholog of human SRm300/SRRM2, suggest a role at the catalytic center of the spliceosome." RNA 15(12): 2161-2173. Grana, X. (2008). "Downregulation of the phosphatase nuclear targeting subunit (PNUTS) triggers pRB dephosphorylation and apoptosis in pRB positive tumor cell lines." Cancer Biol Ther 7(6): 842-844. Grimsrud, P. A., D. L. Swaney, C. D. Wenger, N. A. Beauchene and J. J. Coon (2010). "Phosphoproteomics for the masses." ACS Chem Biol 5(1): 105-119. Gross, E. and I. Kurtz (2002). "Structural determinants and significance of regulation of electrogenic Na(+)-HCO(3)(-) cotransporter stoichiometry." Am J Physiol Renal Physiol 283(5): F876-887. Gruhler, A., J. V. Olsen, S. Mohammed, P. Mortensen, N. J. Faergeman, M. Mann and O. N. Jensen (2005). "Quantitative phosphoproteomics applied to the yeast pheromone signaling pathway." Mol Cell Proteomics 4(3): 310-327. Guo, S., Z. Zhang and T. Tong (2004). "Cloning and characterization of cellular senescence-associated genes in human fibroblasts by suppression subtractive hybridization." Exp Cell Res 298(2): 465-472. Guo, Z., B. Dai, T. Jiang, K. Xu, Y. Xie, O. Kim, I. Nesheiwat, X. Kong, J. Melamed, V. D. Handratta, V. C. Njar, A. M. Brodie, L. R. Yu, T. D. Veenstra, H. Chen and Y. Qiu (2006). "Regulation of androgen receptor activity by tyrosine phosphorylation." Cancer Cell 10(4): 309-319. Gupton, S. L. and F. B. Gertler (2007). "Filopodia: the fingers that do the walking." Sci STKE 2007(400): re5. Haase, H. (2007). "Ahnak, a new player in beta-adrenergic regulation of the cardiac L-type Ca2+ channel." Cardiovasc Res 73(1): 19-25. Hagens, O., A. Ballabio, V. Kalscheuer, J. P. Kraehenbuhl, M. V. Schiaffino, P. Smith, O. Staub, J. Hildebrand and J. B. Wallingford (2006). "A new standard nomenclature for proteins related to Apx and Shroom." BMC Cell Biol 7: 18. Hainaud, P., J. O. Contreres, A. Villemain, L. X. Liu, J. Plouet, G. Tobelem and E. Dupuy (2006). "The role of the vascular endothelial growth factor-Delta-like 4 ligand/Notch4-ephrin B2 cascade in tumor vessel remodeling and endothelial cell functions." Cancer Res 66(17): 8501-8510. Hait, W. N., H. Wu, S. Jin and J. M. Yang (2006). "Elongation factor-2 kinase: its role in protein synthesis and autophagy." Autophagy 2(4): 294-296.

Literature
154
Halpern, J., B. Hopping and J. M. Brostoff (2008). "Photosensitivity, corneal scarring and developmental delay: Xeroderma Pigmentosum in a tropical country." Cases J 1(1): 254. Han, D. C., T. L. Shen and J. L. Guan (2001). "The Grb7 family proteins: structure, interactions with other signaling molecules and potential cellular functions." Oncogene 20(44): 6315-6321. Han, G., M. Ye, H. Zhou, X. Jiang, S. Feng, R. Tian, D. Wan, H. Zou and J. Gu (2008). "Large-scale phosphoproteome analysis of human liver tissue by enrichment and fractionation of phosphopeptides with strong anion exchange chromatography." Proteomics 8(7): 1346-1361. Hatt, H. (2004). "Molecular and cellular basis of human olfaction." Chem Biodivers 1(12): 1857-1869. Herath, N. I. and A. W. Boyd (2010). "The role of Eph receptors and ephrin ligands in colorectal cancer." Int J Cancer 126(9): 2003-2011. Hildebrand, J. D. (2005). "Shroom regulates epithelial cell shape via the apical positioning of an actomyosin network." J Cell Sci 118(Pt 22): 5191-5203. Hildebrand, J. D. and P. Soriano (1999). "Shroom, a PDZ domain-containing actin-binding protein, is required for neural tube morphogenesis in mice." Cell 99(5): 485-497. Ho, H. Y. H., R. Rohatgi, A. M. Lebensohn, L. Ma, J. X. Li, S. P. Gygi and M. W. Kirschner (2004). "Toca-1 mediates Cdc42-dependent actin nucleation by activating the N-WASP-WIP complex." Cell 118(2): 203-216. Ho, S. M., K. M. Lau, S. C. Mok and V. Syed (2003). "Profiling follicle stimulating hormone-induced gene expression changes in normal and malignant human ovarian surface epithelial cells." Oncogene 22(27): 4243-4256. Holmfeldt, P., S. Stenmark and M. Gullberg (2007). "Interphase-specific phosphorylation-mediated regulation of tubulin dimer partitioning in human cells." Mol Biol Cell 18(5): 1909-1917. Horoszewicz, J. S., S. S. Leong, T. M. Chu, Z. L. Wajsman, M. Friedman, L. Papsidero, U. Kim, L. S. Chai, S. Kakati, S. K. Arya and A. A. Sandberg (1980). "The LNCaP cell line--a new model for studies on human prostatic carcinoma." Prog Clin Biol Res 37: 115-132. Horoszewicz, J. S., S. S. Leong, E. Kawinski, J. P. Karr, H. Rosenthal, T. M. Chu, E. A. Mirand and G. P. Murphy (1983). "LNCaP model of human prostatic carcinoma." Cancer Res 43(4): 1809-1818. Hu, Q., R. J. Noll, H. Li, A. Makarov, M. Hardman and R. Graham Cooks (2005). "The Orbitrap: a new mass spectrometer." J Mass Spectrom 40(4): 430-443. Huang, H. D., T. Y. Lee, S. W. Tzeng and J. T. Horng (2005). "KinasePhos: a web tool for identifying protein kinase-specific phosphorylation sites." Nucleic Acids Res 33(Web Server issue): W226-229. Hunter, A. P. and D. E. Games (1994). "Chromatographic and mass spectrometric methods for the identification of phosphorylation sites in phosphoproteins." Rapid Commun Mass Spectrom 8(7): 559-570. Ichihara, K., H. Shimizu, O. Taguchi, M. Yamaguchi and Y. H. Inoue (2007). "A Drosophila orthologue of larp protein family is required for multiple processes in male meiosis." Cell Struct Funct 32(2): 89-100. Illenberger, S., Q. Zheng-Fischhofer, U. Preuss, K. Stamer, K. Baumann, B. Trinczek, J. Biernat, R. Godemann, E. M. Mandelkow and E. Mandelkow (1998). "The endogenous and cell cycle-dependent phosphorylation of tau protein in living cells: implications for Alzheimer's disease." Mol Biol Cell 9(6): 1495-1512. Imami, K., N. Sugiyama, Y. Kyono, M. Tomita and Y. Ishihama (2008). "Automated phosphoproteome analysis for cultured cancer cells by two-dimensional nanoLC-MS using a calcined titania/C18 biphasic column." Anal Sci 24(1): 161-166. Inokuchi, J., M. Komiya, I. Baba, S. Naito, T. Sasazuki and S. Shirasawa (2004). "Deregulated expression of KRAP, a novel gene encoding actin-interacting protein, in human colon cancer cells." J Hum Genet 49(1): 46-52.

Literature
155
Ishii, J., H. Adachi, J. Aoki, H. Koizumi, S. Tomita, T. Suzuki, M. Tsujimoto, K. Inoue and H. Arai (2002). "SREC-II, a new member of the scavenger receptor type F family, trans-interacts with SREC-I through its extracellular domain." J Biol Chem 277(42): 39696-39702. Itoh, M., A. Nagafuchi, S. Moroi and S. Tsukita (1997). "Involvement of ZO-1 in cadherin-based cell adhesion through its direct binding to alpha catenin and actin filaments." J Cell Biol 138(1): 181-192. Iulianella, A., M. Sharma, M. Durnin, G. B. Vanden Heuvel and P. A. Trainor (2008). "Cux2 (Cutl2) integrates neural progenitor development with cell-cycle progression during spinal cord neurogenesis." Development 135(4): 729-741. Iulianella, A., M. Sharma, G. B. Vanden Heuvel and P. A. Trainor (2009). "Cux2 functions downstream of Notch signaling to regulate dorsal interneuron formation in the spinal cord." Development 136(14): 2329-2334. Iwasaki, M., S. Homma, A. Hishiya, S. J. Dolezal, J. C. Reed and S. Takayama (2007). "BAG3 regulates motility and adhesion of epithelial cancer cells." Cancer Res 67(21): 10252-10259. Jackowski, S. (1994). "Coordination of membrane phospholipid synthesis with the cell cycle." J Biol Chem 269(5): 3858-3867. Jackowski, S. and P. Fagone (2005). "CTP: Phosphocholine cytidylyltransferase: paving the way from gene to membrane." J Biol Chem 280(2): 853-856. Jahn, T., P. Seipel, S. Urschel, C. Peschel and J. Duyster (2002). "Role for the adaptor protein Grb10 in the activation of Akt." Mol Cell Biol 22(4): 979-991. Jamal, B. T., M. Nita-Lazar, Z. Gao, B. Amin, J. Walker and M. A. Kukuruzinska (2009). "N-glycosylation status of E-cadherin controls cytoskeletal dynamics through the organization of distinct beta-catenin- and gamma-catenin-containing AJs." Cell Health Cytoskelet 2009(1): 67-80. Jemal, A., E. Ward and M. Thun (2010). "Declining death rates reflect progress against cancer." PLoS One 5(3): e9584. Jenny, A., H. P. Hauri and W. Keller (1994). "Characterization of cleavage and polyadenylation specificity factor and cloning of its 100-kilodalton subunit." Mol Cell Biol 14(12): 8183-8190. Johnson, G. V. and W. H. Stoothoff (2004). "Tau phosphorylation in neuronal cell function and dysfunction." J Cell Sci 117(Pt 24): 5721-5729. Jorgensen, C., A. Sherman, G. I. Chen, A. Pasculescu, A. Poliakov, M. Hsiung, B. Larsen, D. G. Wilkinson, R. Linding and T. Pawson (2009). "Cell-specific information processing in segregating populations of Eph receptor ephrin-expressing cells." Science 326(5959): 1502-1509. Kachhap, S. K., D. Faith, D. Z. Qian, S. Shabbeer, N. L. Galloway, R. Pili, S. R. Denmeade, A. M. DeMarzo and M. A. Carducci (2007). "The N-Myc down regulated Gene1 (NDRG1) Is a Rab4a effector involved in vesicular recycling of E-cadherin." PLoS One 2(9): e844. Kalcheva, N., J. M. Rockwood, Y. Kress, A. Steiner and B. Shafit-Zagardo (1998). "Molecular and functional characteristics of MAP-2a: ability of MAP-2a versus MAP-2b to induce stable microtubules in COS cells." Cell Motil Cytoskeleton 40(3): 272-285. Kall, L., J. D. Storey, M. J. MacCoss and W. S. Noble (2008). "Assigning significance to peptides identified by tandem mass spectrometry using decoy databases." J Proteome Res 7(1): 29-34. Keller, M., M. J. Baum, O. Brock, P. A. Brennan and J. Bakker (2009). "The main and the accessory olfactory systems interact in the control of mate recognition and sexual behavior." Behav Brain Res 200(2): 268-276. Kenny, J. (1993). "Endopeptidase-24.11: putative substrates and possible roles." Biochem Soc Trans 21 ( Pt 3)(3): 663-668. Kim, J., S. B. Hake and R. G. Roeder (2005). "The human homolog of yeast BRE1 functions as a transcriptional coactivator through direct activator interactions." Mol Cell 20(5): 759-770.

Literature
156
Kim, Y. M., T. Watanabe, P. B. Allen, S. J. Lee, P. Greengard, A. C. Nairn and Y. G. Kwon (2003). "PNUTS, a protein phosphatase 1 (PP1) nuclear targeting subunit. Characterization of its PP1- and RNA-binding domains and regulation by phosphorylation." J Biol Chem 278(16): 13819-13828. Kingdon, K. H. (1923). "A Method for the Neutralization of Electron Space Charge by Positive Ionization at Very Low Gas Pressures." Phys. Rev. 21(4): 408–418. Kolev, N. G., T. A. Yario, E. Benson and J. A. Steitz (2008). "Conserved motifs in both CPSF73 and CPSF100 are required to assemble the active endonuclease for histone mRNA 3'-end maturation." EMBO Rep 9(10): 1013-1018. Kreivi, J. P., L. Trinkle-Mulcahy, C. E. Lyon, N. A. Morrice, P. Cohen and A. I. Lamond (1997). "Purification and characterisation of p99, a nuclear modulator of protein phosphatase 1 activity." FEBS Lett 420(1): 57-62. Kremer, B. E., T. Haystead and I. G. Macara (2005). "Mammalian septins regulate microtubule stability through interaction with the microtubule-binding protein MAP4." Mol Biol Cell 16(10): 4648-4659. Kruger, M., I. Kratchmarova, B. Blagoev, Y. H. Tseng, C. R. Kahn and M. Mann (2008). "Dissection of the insulin signaling pathway via quantitative phosphoproteomics." Proc Natl Acad Sci U S A 105(7): 2451-2456. Kumar, P., K. S. Lyle, S. Gierke, A. Matov, G. Danuser and T. Wittmann (2009a). "GSK3beta phosphorylation modulates CLASP-microtubule association and lamella microtubule attachment." J Cell Biol 184(6): 895-908. Kumar, P., Q. Shen, C. D. Pivetti, E. S. Lee, M. H. Wu and S. Y. Yuan (2009b). "Molecular mechanisms of endothelial hyperpermeability: implications in inflammation." Expert Rev Mol Med 11: e19. Kung, H. J. and C. P. Evans (2009). "Oncogenic activation of androgen receptor." Urol Oncol 27(1): 48-52. Langlais, P., L. Q. Dong, D. Hu and F. Liu (2000). "Identification of Grb10 as a direct substrate for members of the Src tyrosine kinase family." Oncogene 19(25): 2895-2903. Langlais, P., C. Wang, L. Q. Dong, C. A. Carroll, S. T. Weintraub and F. Liu (2005). "Phosphorylation of Grb10 by mitogen-activated protein kinase: identification of Ser150 and Ser476 of human Grb10zeta as major phosphorylation sites." Biochemistry 44(24): 8890-8897. Laz, E. V., M. G. Holloway, C. S. Chen and D. J. Waxman (2007). "Characterization of three growth hormone-responsive transcription factors preferentially expressed in adult female liver." Endocrinology 148(7): 3327-3337. Lechler, T. and E. Fuchs (2007). "Desmoplakin: an unexpected regulator of microtubule organization in the epidermis." J Cell Biol 176(2): 147-154. Lee, I. H., H. J. Lim, S. Yoon, J. K. Seong, D. S. Bae, S. G. Rhee and Y. S. Bae (2008). "Ahnak protein activates protein kinase C (PKC) through dissociation of the PKC-protein phosphatase 2A complex." J Biol Chem 283(10): 6312-6320. Lee, S. H., H. Sterling, A. Burlingame and F. McCormick (2008). "Tpr directly binds to Mad1 and Mad2 and is important for the Mad1-Mad2-mediated mitotic spindle checkpoint." Genes Dev 22(21): 2926-2931. Lee, S. J., J. K. Lee, Y. S. Maeng, Y. M. Kim and Y. G. Kwon (2009). "Langerhans cell protein 1 (LCP1) binds to PNUTS in the nucleus: implications for this complex in transcriptional regulation." Exp Mol Med 41(3): 189-200. Lee, S. Y., J. W. Kim, M. H. Jeong, J. H. An, S. M. Jang, K. H. Song and K. H. Choi (2008). "Microtubule-associated protein 1B light chain (MAP1B-LC1) negatively regulates the activity of tumor suppressor p53 in neuroblastoma cells." FEBS Lett 582(19): 2826-2832. Lemeer, S. and A. J. Heck (2009). "The phosphoproteomics data explosion." Curr Opin Chem Biol 13(4): 414-420. Lerch-Gaggl, A. F., K. Sun and S. A. Duncan (2007). "Light chain 1 of microtubule-associated protein 1B can negatively regulate the action of Pes1." J Biol Chem 282(15): 11308-11316. Leterrier, J. F., M. Kurachi, T. Tashiro and P. A. Janmey (2009). "MAP2-mediated in vitro interactions of brain microtubules and their modulation by cAMP." Eur Biophys J 38(4): 381-393.

Literature
157
Li, L., D. Zhang, L. Zhang, G. Zhu, Y. Sun, K. Wu, X. Wang and D. He (2009). "PrLZ expression is associated with the progression of prostate cancer LNCaP cells." Mol Carcinog 48(5): 432-440. Lin, B., J. T. White, C. Ferguson, R. Bumgarner, C. Friedman, B. Trask, W. Ellis, P. Lange, L. Hood and P. S. Nelson (2000). "PART-1: a novel human prostate-specific, androgen-regulated gene that maps to chromosome 5q12." Cancer Res 60(4): 858-863. Lindwall, G. and R. D. Cole (1984). "Phosphorylation affects the ability of tau protein to promote microtubule assembly." J Biol Chem 259(8): 5301-5305. Liu, H., J. Stupak, J. Zheng, B. O. Keller, B. J. Brix, L. Fliegel and L. Li (2004). "Open tubular immobilized metal ion affinity chromatography combined with MALDI MS and MS/MS for identification of protein phosphorylation sites." Anal Chem 76(14): 4223-4232. Liu, Z., R. Oughtred and S. S. Wing (2005). "Characterization of E3Histone, a novel testis ubiquitin protein ligase which ubiquitinates histones." Mol Cell Biol 25(7): 2819-2831. Liu, Z., Q. P. Vong and Y. Zheng (2007). "CLASPing microtubules at the trans-Golgi network." Dev Cell 12(6): 839-840. Lopez-Otin, C. and T. Hunter (2010). "The regulatory crosstalk between kinases and proteases in cancer." Nat Rev Cancer 10(4): 278-292. Ma, L., N. Chang, S. Guo, Q. Li, Z. Zhang, W. Wang and T. Tong (2008). "CSIG inhibits PTEN translation in replicative senescence." Mol Cell Biol 28(20): 6290-6301. Maekawa, H., Y. Oike, S. Kanda, Y. Ito, Y. Yamada, H. Kurihara, R. Nagai and T. Suda (2003). "Ephrin-B2 induces migration of endothelial cells through the phosphatidylinositol-3 kinase pathway and promotes angiogenesis in adult vasculature." Arterioscler Thromb Vasc Biol 23(11): 2008-2014. Mahajan, N. P., Y. Liu, S. Majumder, M. R. Warren, C. E. Parker, J. L. Mohler, H. S. Earp and Y. E. Whang (2007). "Activated Cdc42-associated kinase Ack1 promotes prostate cancer progression via androgen receptor tyrosine phosphorylation." Proc Natl Acad Sci U S A 104(20): 8438-8443. Maik-Rachline, G., S. Shaltiel and R. Seger (2005). "Extracellular phosphorylation converts pigment epithelium-derived factor from a neurotrophic to an antiangiogenic factor." Blood 105(2): 670-678. Mak, P., M. Jaggi, V. Syed, S. C. Chauhan, S. Hassan, H. Biswas and K. C. Balaji (2008). "Protein kinase D1 (PKD1) influences androgen receptor (AR) function in prostate cancer cells." Biochem Biophys Res Commun 373(4): 618-623. Makarov, A. (2000). "Electrostatic axially harmonic orbital trapping: a high-performance technique of mass analysis." Anal Chem 72(6): 1156-1162. Makarov, A. and M. Scigelova (2010). "Coupling liquid chromatography to Orbitrap mass spectrometry." J Chromatogr A 1217(25): 3938-3945. Mann, M. (2006). "Functional and quantitative proteomics using SILAC." Nat Rev Mol Cell Biol 7(12): 952-958. Mann, M., S. E. Ong, M. Gronborg, H. Steen, O. N. Jensen and A. Pandey (2002). "Analysis of protein phosphorylation using mass spectrometry: deciphering the phosphoproteome." Trends Biotechnol 20(6): 261-268. Manna, T., D. A. Thrower, S. Honnappa, M. O. Steinmetz and L. Wilson (2009). "Regulation of microtubule dynamic instability in vitro by differentially phosphorylated stathmin." J Biol Chem 284(23): 15640-15649. Manning, B. D. (2009). "Challenges and opportunities in defining the essential cancer kinome." Sci Signal 2(63): pe15. Mano, H., K. Ohya, A. Miyazato, Y. Yamashita, W. Ogawa, J. Inazawa, U. Ikeda, K. Shimada, K. Hatake, M. Kasuga, K. Ozawa and S. Kajigaya (1998). "Grb10/GrbIR as an in vivo substrate of Tec tyrosine kinase." Genes Cells 3(7): 431-441.

Literature
158
Marash, L., N. Liberman, S. Henis-Korenblit, G. Sivan, E. Reem, O. Elroy-Stein and A. Kimchi (2008). "DAP5 promotes cap-independent translation of Bcl-2 and CDK1 to facilitate cell survival during mitosis." Mol Cell 30(4): 447-459. March, R. E. (1997). "An introduction to quadrupole ion trap mass spectrometry." Journal of Mass Spectrometry 32(4): 351-369. Martins, S., S. Eikvar, K. Furukawa and P. Collas (2003). "HA95 and LAP2 beta mediate a novel chromatin-nuclear envelope interaction implicated in initiation of DNA replication." J Cell Biol 160(2): 177-188. Matsuoka, S., B. A. Ballif, A. Smogorzewska, E. R. McDonald, 3rd, K. E. Hurov, J. Luo, C. E. Bakalarski, Z. Zhao, N. Solimini, Y. Lerenthal, Y. Shiloh, S. P. Gygi and S. J. Elledge (2007). "ATM and ATR substrate analysis reveals extensive protein networks responsive to DNA damage." Science 316(5828): 1160-1166. Matsuoka, Y., X. Li and V. Bennett (2000). "Adducin: structure, function and regulation." Cell Mol Life Sci 57(6): 884-895. Mausbacher, N., T. B. Schreiber and H. Daub (2010). "Glycoprotein capture and quantitative phosphoproteomics indicate coordinated regulation of cell migration upon lysophosphatidic acid stimulation." Mol Cell Proteomics. Mayya, V., D. H. Lundgren, S. I. Hwang, K. Rezaul, L. Wu, J. K. Eng, V. Rodionov and D. K. Han (2009). "Quantitative phosphoproteomic analysis of T cell receptor signaling reveals system-wide modulation of protein-protein interactions." Sci Signal 2(84): ra46. Mazanek, M., G. Mituloviae, F. Herzog, C. Stingl, J. R. Hutchins, J. M. Peters and K. Mechtler (2007). "Titanium dioxide as a chemo-affinity solid phase in offline phosphopeptide chromatography prior to HPLC-MS/MS analysis." Nat Protoc 2(5): 1059-1069. McClintock, T. S. and N. Sammeta (2003). "Trafficking prerogatives of olfactory receptors." Neuroreport 14(12): 1547-1552. McCollum, A. K., G. Casagrande and E. C. Kohn (2010). "Caught in the middle: the role of Bag3 in disease." Biochem J 425(1): e1-3. Melotte, V., X. Qu, M. Ongenaert, W. van Criekinge, A. P. de Bruine, H. S. Baldwin and M. van Engeland (2010). "The N-myc downstream regulated gene (NDRG) family: diverse functions, multiple applications." FASEB J. Miki, H., H. Yamaguchi, S. Suetsugu and T. Takenawa (2000). "IRSp53 is an essential intermediate between Rac and WAVE in the regulation of membrane ruffling." Nature 408(6813): 732-735. Millard, T. H., J. Dawson and L. M. Machesky (2007). "Characterisation of IRTKS, a novel IRSp53/MIM family actin regulator with distinct filament bundling properties." J Cell Sci 120(Pt 9): 1663-1672. Miller, P. M., A. W. Folkmann, A. R. Maia, N. Efimova, A. Efimov and I. Kaverina (2009). "Golgi-derived CLASP-dependent microtubules control Golgi organization and polarized trafficking in motile cells." Nat Cell Biol 11(9): 1069-1080. Molina, H., D. M. Horn, N. Tang, S. Mathivanan and A. Pandey (2007). "Global proteomic profiling of phosphopeptides using electron transfer dissociation tandem mass spectrometry." Proc Natl Acad Sci U S A 104(7): 2199-2204. Mombaerts, P., F. Wang, C. Dulac, R. Vassar, S. K. Chao, A. Nemes, M. Mendelsohn, J. Edmondson and R. Axel (1996). "The molecular biology of olfactory perception." Cold Spring Harb Symp Quant Biol 61: 135-145. Monami, G., V. Emiliozzi and A. Morrione (2008). "Grb10/Nedd4-mediated multiubiquitination of the insulin-like growth factor receptor regulates receptor internalization." J Cell Physiol 216(2): 426-437. Monk, K. R., S. G. Naylor, T. D. Glenn, S. Mercurio, J. R. Perlin, C. Dominguez, C. B. Moens and W. S. Talbot (2009). "A G protein-coupled receptor is essential for Schwann cells to initiate myelination." Science 325(5946): 1402-1405. Moriguchi, T., K. Haraguchi, N. Ueda, M. Okada, T. Furuya and T. Akiyama (2004). "DREG, a developmentally regulated G protein-coupled receptor containing two conserved proteolytic cleavage sites." Genes Cells 9(6): 549-560. Mowen, K. A., B. T. Schurter, J. W. Fathman, M. David and L. H. Glimcher (2004). "Arginine methylation of NIP45 modulates cytokine gene expression in effector T lymphocytes." Mol Cell 15(4): 559-571.

Literature
159
Muszynska, G., G. Dobrowolska, A. Medin, P. Ekman and J. O. Porath (1992). "Model studies on iron(III) ion affinity chromatography. II. Interaction of immobilized iron(III) ions with phosphorylated amino acids, peptides and proteins." J Chromatogr 604(1): 19-28. Nakada, M., E. M. Anderson, T. Demuth, S. Nakada, L. B. Reavie, K. L. Drake, D. B. Hoelzinger and M. E. Berens (2010). "The phosphorylation of ephrin-B2 ligand promotes glioma cell migration and invasion." Int J Cancer 126(5): 1155-1165. Nakagami, H., N. Sugiyama, K. Mochida, A. Daudi, Y. Yoshida, T. Toyoda, M. Tomita, Y. Ishihama and K. Shirasu (2010). "Large-scale comparative phosphoproteomics identifies conserved phosphorylation sites in plants." Plant Physiol 153(3): 1161-1174. Nantel, A., K. Mohammad-Ali, J. Sherk, B. I. Posner and D. Y. Thomas (1998). "Interaction of the Grb10 adapter protein with the Raf1 and MEK1 kinases." J Biol Chem 273(17): 10475-10484. Narayana, N., J. Gist, T. Smith, D. Tylka, G. Trogdon and J. K. Wahl (2010). "Desmosomal component expression in normal, dysplastic, and oral squamous cell carcinoma." Dermatol Res Pract 2010: 649731. Neuhaus, E. M., W. Zhang, L. Gelis, Y. Deng, J. Noldus and H. Hatt (2009). "Activation of an olfactory receptor inhibits proliferation of prostate cancer cells." J Biol Chem 284(24): 16218-16225. Nie, S., J. Dai, Z. B. Ning, X. J. Cao, Q. H. Sheng and R. Zeng (2010). "Comprehensive profiling of phosphopeptides based on anion exchange followed by flow-through enrichment with titanium dioxide (AFET)." J Proteome Res 9(9): 4585-4594. Nishimura, T. and M. Takeichi (2008). "Shroom3-mediated recruitment of Rho kinases to the apical cell junctions regulates epithelial and neuroepithelial planar remodeling." Development 135(8): 1493-1502. Nordlund, P. and P. Reichard (2006). "Ribonucleotide reductases." Annu Rev Biochem 75: 681-706. Noren, N. K., M. Lu, A. L. Freeman, M. Koolpe and E. B. Pasquale (2004). "Interplay between EphB4 on tumor cells and vascular ephrin-B2 regulates tumor growth." Proc Natl Acad Sci U S A 101(15): 5583-5588. Norrmen, C., W. Vandevelde, A. Ny, P. Saharinen, M. Gentile, G. Haraldsen, P. Puolakkainen, E. Lukanidin, M. Dewerchin, K. Alitalo and T. V. Petrova (2010). "Liprin (beta)1 is highly expressed in lymphatic vasculature and is important for lymphatic vessel integrity." Blood 115(4): 906-909. Nuhse, T. S., A. Stensballe, O. N. Jensen and S. C. Peck (2003). "Large-scale analysis of in vivo phosphorylated membrane proteins by immobilized metal ion affinity chromatography and mass spectrometry." Mol Cell Proteomics 2(11): 1234-1243. O'Connor, R. (2003). "Regulation of IGF-I receptor signaling in tumor cells." Horm Metab Res 35(11-12): 771-777. Oeljeklaus, S., H. E. Meyer and B. Warscheid (2009). "Advancements in plant proteomics using quantitative mass spectrometry." J Proteomics 72(3): 545-554. Olsen, J. V., B. Blagoev, F. Gnad, B. Macek, C. Kumar, P. Mortensen and M. Mann (2006). "Global, in vivo, and site-specific phosphorylation dynamics in signaling networks." Cell 127(3): 635-648. Olsen, J. V. and B. Macek (2009). "High accuracy mass spectrometry in large-scale analysis of protein phosphorylation." Methods Mol Biol 492: 131-142. Olsen, J. V., M. Vermeulen, A. Santamaria, C. Kumar, M. L. Miller, L. J. Jensen, F. Gnad, J. Cox, T. S. Jensen, E. A. Nigg, S. Brunak and M. Mann (2010). "Quantitative phosphoproteomics reveals widespread full phosphorylation site occupancy during mitosis." Sci Signal 3(104): ra3. Olson, J. E., X. Wang, E. L. Goode, V. S. Pankratz, Z. S. Fredericksen, R. A. Vierkant, P. D. Pharoah, J. R. Cerhan and F. J. Couch (2010). "Variation in genes required for normal mitosis and risk of breast cancer." Breast Cancer Res Treat 119(2): 423-430.

Literature
160
Ong, S. E., B. Blagoev, I. Kratchmarova, D. B. Kristensen, H. Steen, A. Pandey and M. Mann (2002). "Stable isotope labeling by amino acids in cell culture, SILAC, as a simple and accurate approach to expression proteomics." Mol Cell Proteomics 1(5): 376-386. Ong, S. E., L. J. Foster and M. Mann (2003). "Mass spectrometric-based approaches in quantitative proteomics." Methods 29(2): 124-130. Ookata, K., S. Hisanaga, J. C. Bulinski, H. Murofushi, H. Aizawa, T. J. Itoh, H. Hotani, E. Okumura, K. Tachibana and T. Kishimoto (1995). "Cyclin B interaction with microtubule-associated protein 4 (MAP4) targets p34cdc2 kinase to microtubules and is a potential regulator of M-phase microtubule dynamics." J Cell Biol 128(5): 849-862. Oppermann, F. S., F. Gnad, J. V. Olsen, R. Hornberger, Z. Greff, G. Keri, M. Mann and H. Daub (2009). "Large-scale proteomics analysis of the human kinome." Mol Cell Proteomics 8(7): 1751-1764. Orsatti, L., E. Forte, L. Tomei, M. Caterino, A. Pessi and F. Talamo (2009). "2-D Difference in gel electrophoresis combined with Pro-Q Diamond staining: a successful approach for the identification of kinase/phosphatase targets." Electrophoresis 30(14): 2469-2476. Palumbo, A. M., J. J. Tepe and G. E. Reid (2008). "Mechanistic insights into the multistage gas-phase fragmentation behavior of phosphoserine- and phosphothreonine-containing peptides." J Proteome Res 7(2): 771-779. Pan, C., J. V. Olsen, H. Daub and M. Mann (2009). "Global effects of kinase inhibitors on signaling networks revealed by quantitative phosphoproteomics." Mol Cell Proteomics 8(12): 2796-2808. Papandreou, C. N., B. Usmani, Y. Geng, T. Bogenrieder, R. Freeman, S. Wilk, C. L. Finstad, V. E. Reuter, C. T. Powell, D. Scheinberg, C. Magill, H. I. Scher, A. P. Albino and D. M. Nanus (1998). "Neutral endopeptidase 24.11 loss in metastatic human prostate cancer contributes to androgen-independent progression." Nat Med 4(1): 50-57. Paul, W. and H. Steinwedel (1953). "Ein neues Massenspektrometer ohne Magnetfeld." Zeitschrift für Naturforschung A 8(7): 448-450. Perkins, D. N., D. J. Pappin, D. M. Creasy and J. S. Cottrell (1999). "Probability-based protein identification by searching sequence databases using mass spectrometry data." Electrophoresis 20(18): 3551-3567. Perry, C., O. J. Baker, M. E. Reyland and Grichtchenko, II (2009). "PKC{alpha}{beta}{gamma}- and PKC{delta}-dependent endocytosis of NBCe1-A and NBCe1-B in salivary parotid acinar cells." Am J Physiol Cell Physiol 297(6): C1409-1423. Perry, C., D. O. Quissell, M. E. Reyland and Grichtchenko, II (2008). "Electrogenic NBCe1 (SLC4A4), but not electroneutral NBCn1 (SLC4A7), cotransporter undergoes cholinergic-stimulated endocytosis in salivary ParC5 cells." Am J Physiol Cell Physiol 295(5): C1385-1398. Pinkse, M. W., P. M. Uitto, M. J. Hilhorst, B. Ooms and A. J. Heck (2004). "Selective isolation at the femtomole level of phosphopeptides from proteolytic digests using 2D-NanoLC-ESI-MS/MS and titanium oxide precolumns." Anal Chem 76(14): 3935-3943. Porath, J., J. Carlsson, I. Olsson and G. Belfrage (1975). "Metal chelate affinity chromatography, a new approach to protein fractionation." Nature 258(5536): 598-599. Poukka, H., U. Karvonen, O. A. Janne and J. J. Palvimo (2000). "Covalent modification of the androgen receptor by small ubiquitin-like modifier 1 (SUMO-1)." Proc Natl Acad Sci U S A 97(26): 14145-14150. Pyronnet, S., J. Dostie and N. Sonenberg (2001). "Suppression of cap-dependent translation in mitosis." Genes Dev 15(16): 2083-2093. Qi, H., U. Rath, D. Wang, Y. Z. Xu, Y. Ding, W. Zhang, M. J. Blacketer, M. R. Paddy, J. Girton, J. Johansen and K. M. Johansen (2004). "Megator, an essential coiled-coil protein that localizes to the putative spindle matrix during mitosis in Drosophila." Mol Biol Cell 15(11): 4854-4865. Rabilloud, T., M. Chevallet, S. Luche and C. Lelong (2010). "Two-dimensional gel electrophoresis in proteomics: past, present and future." J Proteomics.

Literature
161
Ramsay, A. K. and H. Y. Leung (2009). "Signalling pathways in prostate carcinogenesis: potentials for molecular-targeted therapy." Clin Sci (Lond) 117(6): 209-228. Rao, R. K., S. Basuroy, V. U. Rao, K. J. Karnaky Jr and A. Gupta (2002). "Tyrosine phosphorylation and dissociation of occludin-ZO-1 and E-cadherin-beta-catenin complexes from the cytoskeleton by oxidative stress." Biochem J 368(Pt 2): 471-481. Reidegeld, K. A., M. Eisenacher, M. Kohl, D. Chamrad, G. Korting, M. Bluggel, H. E. Meyer and C. Stephan (2008). "An easy-to-use Decoy Database Builder software tool, implementing different decoy strategies for false discovery rate calculation in automated MS/MS protein identifications." Proteomics 8(6): 1129-1137. Reverter, D. and C. D. Lima (2005). "Insights into E3 ligase activity revealed by a SUMO-RanGAP1-Ubc9-Nup358 complex." Nature 435(7042): 687-692. Ridley, A. J. (2004). "Rho proteins and cancer." Breast Cancer Res Treat 84(1): 13-19. Ridley, A. J., M. A. Schwartz, K. Burridge, R. A. Firtel, M. H. Ginsberg, G. Borisy, J. T. Parsons and A. R. Horwitz (2003). "Cell migration: integrating signals from front to back." Science 302(5651): 1704-1709. Riederer, B. M. (2007). "Microtubule-associated protein 1B, a growth-associated and phosphorylated scaffold protein." Brain Res Bull 71(6): 541-558. Robens, J. M., L. Yeow-Fong, E. Ng, C. Hall and E. Manser (2010). "Regulation of IRSp53-dependent filopodial dynamics by antagonism between 14-3-3 binding and SH3-mediated localization." Mol Cell Biol 30(3): 829-844. Robey, R. B., O. S. Ruiz, J. Baniqued, D. Mahmud, D. J. Espiritu, A. A. Bernardo and J. A. Arruda (2001). "SFKs, Ras, and the classic MAPK pathway couple muscarinic receptor activation to increased Na-HCO(3) cotransport activity in renal epithelial cells." Am J Physiol Renal Physiol 280(5): F844-850. Roepstorff, P. and J. Fohlman (1984). "Proposal for a common nomenclature for sequence ions in mass spectra of peptides." Biomed Mass Spectrom 11(11): 601. Ronnett, G. V., L. D. Hester and S. H. Snyder (1991). "Primary culture of neonatal rat olfactory neurons." J Neurosci 11(5): 1243-1255. Ross, P. L., Y. N. Huang, J. N. Marchese, B. Williamson, K. Parker, S. Hattan, N. Khainovski, S. Pillai, S. Dey, S. Daniels, S. Purkayastha, P. Juhasz, S. Martin, M. Bartlet-Jones, F. He, A. Jacobson and D. J. Pappin (2004). "Multiplexed protein quantitation in Saccharomyces cerevisiae using amine-reactive isobaric tagging reagents." Mol Cell Proteomics 3(12): 1154-1169. Rubin, C. I. and G. F. Atweh (2004). "The role of stathmin in the regulation of the cell cycle." J Cell Biochem 93(2): 242-250. Rubin, M. A., S. Varambally, R. Beroukhim, S. A. Tomlins, D. R. Rhodes, P. L. Paris, M. D. Hofer, M. Storz-Schweizer, R. Kuefer, J. A. Fletcher, B. L. Hsi, J. A. Byrne, K. J. Pienta, C. Collins, W. R. Sellers and A. M. Chinnaiyan (2004). "Overexpression, amplification, and androgen regulation of TPD52 in prostate cancer." Cancer Res 64(11): 3814-3822. Ruttenberg, B. E., T. Pisitkun, M. A. Knepper and J. D. Hoffert (2008). "PhosphoScore: an open-source phosphorylation site assignment tool for MSn data." J Proteome Res 7(7): 3054-3059. Sacchettini, J. C. and C. D. Poulter (1997). "Creating isoprenoid diversity." Science 277(5333): 1788-1789. Samet, J. M. and T. L. Tal (2010). "Toxicological disruption of signaling homeostasis: tyrosine phosphatases as targets." Annu Rev Pharmacol Toxicol 50: 215-235. Sanchez-Andrade, G., B. M. James and K. M. Kendrick (2005). "Neural encoding of olfactory recognition memory." J Reprod Dev 51(5): 547-558. Sanchez, C., J. Diaz-Nido and J. Avila (2000). "Phosphorylation of microtubule-associated protein 2 (MAP2) and its relevance for the regulation of the neuronal cytoskeleton function." Prog Neurobiol 61(2): 133-168.

Literature
162
Sanger, F., G. M. Air, B. G. Barrell, N. L. Brown, A. R. Coulson, C. A. Fiddes, C. A. Hutchison, P. M. Slocombe and M. Smith (1977). "Nucleotide sequence of bacteriophage phi X174 DNA." Nature 265(5596): 687-695. Sawamiphak, S., S. Seidel, C. L. Essmann, G. A. Wilkinson, M. E. Pitulescu, T. Acker and A. Acker-Palmer (2010). "Ephrin-B2 regulates VEGFR2 function in developmental and tumour angiogenesis." Nature 465(7297): 487-491. Scanff, P., M. Yvon and J. P. Pelissier (1991). "Immobilized Fe3+ affinity chromatographic isolation of phosphopeptides." J Chromatogr 539(2): 425-432. Schaefer, H., J. P. Chervet, C. Bunse, C. Joppich, H. E. Meyer and K. Marcus (2004). "A peptide preconcentration approach for nano-high-performance liquid chromatography to diminish memory effects." Proteomics 4(9): 2541-2544. Schelling, J. R. and B. G. Abu Jawdeh (2008). "Regulation of cell survival by Na+/H+ exchanger-1." Am J Physiol Renal Physiol 295(3): F625-632. Schmidt, A., E. Csaszar, G. Ammerer and K. Mechtler (2008). "Enhanced detection and identification of multiply phosphorylated peptides using TiO2 enrichment in combination with MALDI TOF/TOF MS." Proteomics 8(21): 4577-4592. Schmidt, A., J. Kellermann and F. Lottspeich (2005). "A novel strategy for quantitative proteomics using isotope-coded protein labels." Proteomics 5(1): 4-15. Schroeder, M. J., J. Shabanowitz, J. C. Schwartz, D. F. Hunt and J. J. Coon (2004). "A neutral loss activation method for improved phosphopeptide sequence analysis by quadrupole ion trap mass spectrometry." Anal Chem 76(13): 3590-3598. Sekiyama, N., K. Arita, Y. Ikeda, K. Hashiguchi, M. Ariyoshi, H. Tochio, H. Saitoh and M. Shirakawa (2010). "Structural basis for regulation of poly-SUMO chain by a SUMO-like domain of Nip45." Proteins 78(6): 1491-1502. Sengupta, S. and C. C. Harris (2005). "p53: traffic cop at the crossroads of DNA repair and recombination." Nat Rev Mol Cell Biol 6(1): 44-55. Serra-Pages, C., Q. G. Medley, M. Tang, A. Hart and M. Streuli (1998). "Liprins, a family of LAR transmembrane protein-tyrosine phosphatase-interacting proteins." J Biol Chem 273(25): 15611-15620. Shema, E., I. Tirosh, Y. Aylon, J. Huang, C. Ye, N. Moskovits, N. Raver-Shapira, N. Minsky, J. Pirngruber, G. Tarcic, P. Hublarova, L. Moyal, M. Gana-Weisz, Y. Shiloh, Y. Yarden, S. A. Johnsen, B. Vojtesek, S. L. Berger and M. Oren (2008). "The histone H2B-specific ubiquitin ligase RNF20/hBRE1 acts as a putative tumor suppressor through selective regulation of gene expression." Genes Dev 22(19): 2664-2676. Shipp, M. A., G. E. Tarr, C. Y. Chen, S. N. Switzer, L. B. Hersh, H. Stein, M. E. Sunday and E. L. Reinherz (1991). "CD10/neutral endopeptidase 24.11 hydrolyzes bombesin-like peptides and regulates the growth of small cell carcinomas of the lung." Proc Natl Acad Sci U S A 88(23): 10662-10666. Singhal, S., A. Vachani, D. Antin-Ozerkis, L. R. Kaiser and S. M. Albelda (2005). "Prognostic implications of cell cycle, apoptosis, and angiogenesis biomarkers in non-small cell lung cancer: a review." Clin Cancer Res 11(11): 3974-3986. Slack, J. K., R. B. Adams, J. D. Rovin, E. A. Bissonette, C. E. Stoker and J. T. Parsons (2001). "Alterations in the focal adhesion kinase/Src signal transduction pathway correlate with increased migratory capacity of prostate carcinoma cells." Oncogene 20(10): 1152-1163. Smith, E. M. and C. G. Proud (2008). "cdc2-cyclin B regulates eEF2 kinase activity in a cell cycle- and amino acid-dependent manner." EMBO J 27(7): 1005-1016. Smolka, M. B., H. Zhou, S. Purkayastha and R. Aebersold (2001). "Optimization of the isotope-coded affinity tag-labeling procedure for quantitative proteome analysis." Anal Biochem 297(1): 25-31. Smyth, J. T., S. Y. Hwang, T. Tomita, W. I. Dehaven, J. C. Mercer and J. W. Putney (2010). "Activation and regulation of store-operated calcium entry." J Cell Mol Med.

Literature
163
Snabaitis, A. K., F. Cuello and M. Avkiran (2008). "Protein kinase B/Akt phosphorylates and inhibits the cardiac Na+/H+ exchanger NHE1." Circ Res 103(8): 881-890. Soh, U. J. and B. C. Low (2008). "BNIP2 extra long inhibits RhoA and cellular transformation by Lbc RhoGEF via its BCH domain." J Cell Sci 121(Pt 10): 1739-1749. Spehr, J., Gelis, L. , Osterloh, M., Spehr, M. , Hatt, H., Neuhaus, E.M. (2010). G-PROTEIN-COUPLED RECEPTOR SIGNALING VIA SRC-KINASE INDUCES ENDOGENOUS HUMAN TRPV6 CHANNEL ACTIVATION.
Spehr, J., S. Hagendorf, J. Weiss, M. Spehr, T. Leinders-Zufall and F. Zufall (2009). "Ca2+ -calmodulin feedback mediates sensory adaptation and inhibits pheromone-sensitive ion channels in the vomeronasal organ." J Neurosci 29(7): 2125-2135. Spehr, M., J. Spehr, K. Ukhanov, K. R. Kelliher, T. Leinders-Zufall and F. Zufall (2006). "Parallel processing of social signals by the mammalian main and accessory olfactory systems." Cell Mol Life Sci 63(13): 1476-1484. Spehr, M., C. H. Wetzel, H. Hatt and B. W. Ache (2002). "3-phosphoinositides modulate cyclic nucleotide signaling in olfactory receptor neurons." Neuron 33(5): 731-739. Stacey, M., H. H. Lin, S. Gordon and A. J. McKnight (2000). "LNB-TM7, a group of seven-transmembrane proteins related to family-B G-protein-coupled receptors." Trends Biochem Sci 25(6): 284-289. Stafford, G. C., Jr., P. E. Kelley, J. E. P. Syka, W. E. Reynolds and J. F. J. Todd (1984). "Recent improvements in and analytical applications of advanced ion trap technology " International Journal of Mass Spectrometry and Ion Processes 60(1): 85-98. Stappenbeck, T. S., J. A. Lamb, C. M. Corcoran and K. J. Green (1994). "Phosphorylation of the desmoplakin COOH terminus negatively regulates its interaction with keratin intermediate filament networks." J Biol Chem 269(47): 29351-29354. Stehlik, C., R. Kroismayr, A. Dorfleutner, B. R. Binder and J. Lipp (2004). "VIGR--a novel inducible adhesion family G-protein coupled receptor in endothelial cells." FEBS Lett 569(1-3): 149-155. Steinberg, T. H., B. J. Agnew, K. R. Gee, W. Y. Leung, T. Goodman, B. Schulenberg, J. Hendrickson, J. M. Beechem, R. P. Haugland and W. F. Patton (2003). "Global quantitative phosphoprotein analysis using Multiplexed Proteomics technology." Proteomics 3(7): 1128-1144. Steketee, K., A. C. Ziel-van der Made, H. A. van der Korput, A. B. Houtsmuller and J. Trapman (2004). "A bioinformatics-based functional analysis shows that the specifically androgen-regulated gene SARG contains an active direct repeat androgen response element in the first intron." J Mol Endocrinol 33(2): 477-491. Stucki, M. and S. P. Jackson (2004). "MDC1/NFBD1: a key regulator of the DNA damage response in higher eukaryotes." DNA Repair (Amst) 3(8-9): 953-957. Stucki, M. and S. P. Jackson (2006). "gammaH2AX and MDC1: anchoring the DNA-damage-response machinery to broken chromosomes." DNA Repair (Amst) 5(5): 534-543. Sun, H., X. Q. Hu, M. B. Emerit, J. C. Schoenebeck, C. E. Kimmel, R. W. Peoples, A. Miko and L. Zhang (2008). "Modulation of 5-HT3 receptor desensitization by the light chain of microtubule-associated protein 1B expressed in HEK 293 cells." J Physiol 586(3): 751-762. Syka, J. E., J. J. Coon, M. J. Schroeder, J. Shabanowitz and D. F. Hunt (2004). "Peptide and protein sequence analysis by electron transfer dissociation mass spectrometry." Proc Natl Acad Sci U S A 101(26): 9528-9533. Tai, Y. T., E. Soydan, W. Song, M. Fulciniti, K. Kim, F. Hong, X. F. Li, P. Burger, M. J. Rumizen, S. Nahar, K. Podar, T. Hideshima, N. C. Munshi, G. Tonon, R. D. Carrasco, D. E. H. Afar and K. C. Anderson (2010). "CS1 promotes multiple myeloma cell adhesion, clonogenic growth, and tumorigenicity via c-maf-mediated interactions with bone marrow stromal cells. (Retraction of vol 113, pg 4309, 2009)." Blood 115(14): 2983-2983. Tanackovic, G. and A. Kramer (2005). "Human splicing factor SF3a, but not SF1, is essential for pre-mRNA splicing in vivo." Mol Biol Cell 16(3): 1366-1377.

Literature
164
Tanenbaum, M. E., L. Macurek, N. Galjart and R. H. Medema (2008). "Dynein, Lis1 and CLIP-170 counteract Eg5-dependent centrosome separation during bipolar spindle assembly." EMBO J 27(24): 3235-3245. Tang, L. Y., N. Deng, L. S. Wang, J. Dai, Z. L. Wang, X. S. Jiang, S. J. Li, L. Li, Q. H. Sheng, D. Q. Wu and R. Zeng (2007). "Quantitative phosphoproteome profiling of Wnt3a-mediated signaling network: indicating the involvement of ribonucleoside-diphosphate reductase M2 subunit phosphorylation at residue serine 20 in canonical Wnt signal transduction." Mol Cell Proteomics 6(11): 1952-1967. Tegha-Dunghu, J., B. Neumann, S. Reber, R. Krause, H. Erfle, T. Walter, M. Held, P. Rogers, K. Hupfeld, T. Ruppert, J. Ellenberg and O. J. Gruss (2008). "EML3 is a nuclear microtubule-binding protein required for the correct alignment of chromosomes in metaphase." J Cell Sci 121(Pt 10): 1718-1726. Thingholm, T. E. and M. R. Larsen (2009). "The use of titanium dioxide micro-columns to selectively isolate phosphopeptides from proteolytic digests." Methods Mol Biol 527: 57-66, xi. Timm, W., N. Ozlu, J. J. Steen and H. Steen (2010). "Effect of high-accuracy precursor masses on phosphopeptide identification from MS3 spectra." Anal Chem 82(10): 3977-3980. Todorov, P. T., R. E. Hardisty and S. D. Brown (2001). "Myosin VIIA is specifically associated with calmodulin and microtubule-associated protein-2B (MAP-2B)." Biochem J 354(Pt 2): 267-274. Traish, A. M. and A. Morgentaler (2009). "Epidermal growth factor receptor expression escapes androgen regulation in prostate cancer: a potential molecular switch for tumour growth." Br J Cancer 101(12): 1949-1956. Trinidad, A. G., M. L. de la Puerta, N. Fernandez, Y. Bayon, M. S. Crespo and A. Alonso (2006). "Coupling of C3bi to IgG inhibits the tyrosine phosphorylation signaling cascade downstream Syk and reduces cytokine induction in monocytes." J Leukoc Biol 79(5): 1073-1082. Tschapek, A. (2008) Anreicherung und proteomische Analyse der Plasmamembran von LNCaP Zellen; Chemistry Department; Ruhr-Universität Bochum Tu, L. C., X. Yan, L. Hood and B. Lin (2007). "Proteomics analysis of the interactome of N-myc downstream regulated gene 1 and its interactions with the androgen response program in prostate cancer cells." Mol Cell Proteomics 6(4): 575-588. Tuomi, S., A. Mai, J. Nevo, J. O. Laine, V. Vilkki, T. J. Ohman, C. G. Gahmberg, P. J. Parker and J. Ivaska (2009). "PKCepsilon regulation of an alpha5 integrin-ZO-1 complex controls lamellae formation in migrating cancer cells." Sci Signal 2(77): ra32. Ummanni, R., S. Teller, H. Junker, U. Zimmermann, S. Venz, C. Scharf, J. Giebel and R. Walther (2008). "Altered expression of tumor protein D52 regulates apoptosis and migration of prostate cancer cells." FEBS J 275(22): 5703-5713. Urschel, S., F. Bassermann, R. Y. Bai, S. Munch, C. Peschel and J. Duyster (2005). "Phosphorylation of grb10 regulates its interaction with 14-3-3." J Biol Chem 280(17): 16987-16993. Vaca, L. (2010). "SOCIC: the store-operated calcium influx complex." Cell Calcium 47(3): 199-209. van Dijk, E., N. Cougot, S. Meyer, S. Babajko, E. Wahle and B. Seraphin (2002). "Human Dcp2: a catalytically active mRNA decapping enzyme located in specific cytoplasmic structures." EMBO J 21(24): 6915-6924. Vandre, D. D., V. E. Centonze, J. Peloquin, R. M. Tombes and G. G. Borisy (1991). "Proteins of the mammalian mitotic spindle: phosphorylation/dephosphorylation of MAP-4 during mitosis." J Cell Sci 98 ( Pt 4): 577-588. Vizcaino, J. A., R. Cote, F. Reisinger, J. M. Foster, M. Mueller, J. Rameseder, H. Hermjakob and L. Martens (2009). "A guide to the Proteomics Identifications Database proteomics data repository." Proteomics 9(18): 4276-4283. Walther, T. C. and M. Mann (2010). "Mass spectrometry-based proteomics in cell biology." J Cell Biol 190(4): 491-500. Wan, Y., D. Cripps, S. Thomas, P. Campbell, N. Ambulos, T. Chen and A. Yang (2008). "PhosphoScan: a probability-based method for phosphorylation site prediction using MS2/MS3 pair information." J Proteome Res 7(7): 2803-2811.

Literature
165
Wang, H. Q., X. Meng, Y. Y. Gao, B. Q. Liu, X. F. Niu, H. Y. Zhang and Z. X. Du (2010). "Characterization of BAG3 cleavage during apoptosis of pancreatic cancer cells." J Cell Physiol 224(1): 94-100. Wang, J., J. Weng, Y. Cai, R. Penland, M. Liu and M. Ittmann (2006). "The prostate-specific G-protein coupled receptors PSGR and PSGR2 are prostate cancer biomarkers that are complementary to alpha-methylacyl-CoA racemase." Prostate 66(8): 847-857. Wang, R., H. He, X. Sun, J. Xu, F. F. Marshall, H. Zhau, L. W. Chung, H. Fu and D. He (2009). "Transcription variants of the prostate-specific PrLZ gene and their interaction with 14-3-3 proteins." Biochem Biophys Res Commun 389(3): 455-460. Wang, W., Y. Li, A. Hong, J. Wang, B. Lin and R. Li (2009). "NDRG3 is an androgen regulated and prostate enriched gene that promotes in vitro and in vivo prostate cancer cell growth." Int J Cancer 124(3): 521-530. Wang, X. and C. G. Proud (2006). "The mTOR pathway in the control of protein synthesis." Physiology (Bethesda) 21: 362-369. Watanabe, T., J. Noritake, M. Kakeno, T. Matsui, T. Harada, S. Wang, N. Itoh, K. Sato, K. Matsuzawa, A. Iwamatsu, N. Galjart and K. Kaibuchi (2009). "Phosphorylation of CLASP2 by GSK-3beta regulates its interaction with IQGAP1, EB1 and microtubules." J Cell Sci 122(Pt 16): 2969-2979. Weng, J., W. Ma, D. Mitchell, J. Zhang and M. Liu (2005a). "Regulation of human prostate-specific G-protein coupled receptor, PSGR, by two distinct promoters and growth factors." J Cell Biochem 96(5): 1034-1048. Weng, J., J. Wang, Y. Cai, L. J. Stafford, D. Mitchell, M. Ittmann and M. Liu (2005b). "Increased expression of prostate-specific G-protein-coupled receptor in human prostate intraepithelial neoplasia and prostate cancers." Int J Cancer 113(5): 811-818. Wetzel, C. H., M. Spehr and H. Hatt (2001). "Phosphorylation of voltage-gated ion channels in rat olfactory receptor neurons." Eur J Neurosci 14(7): 1056-1064. Wiesner, J., T. Premsler and A. Sickmann (2008). "Application of electron transfer dissociation (ETD) for the analysis of posttranslational modifications." Proteomics 8(21): 4466-4483. Wilsker, D., L. Probst, H. M. Wain, L. Maltais, P. W. Tucker and E. Moran (2005). "Nomenclature of the ARID family of DNA-binding proteins." Genomics 86(2): 242-251. Wilson, D. A. (2009). "Olfaction as a model system for the neurobiology of mammalian short-term habituation." Neurobiol Learn Mem 92(2): 199-205. Wilson, D. A., A. R. Best and R. M. Sullivan (2004). "Plasticity in the olfactory system: lessons for the neurobiology of memory." Neuroscientist 10(6): 513-524. Witkowski, C. M., I. Rabinovitz, R. B. Nagle, K. S. Affinito and A. E. Cress (1993). "Characterization of integrin subunits, cellular adhesion and tumorgenicity of four human prostate cell lines." J Cancer Res Clin Oncol 119(11): 637-644. Wu, F. and Y. Y. Mo (2007). "Ubiquitin-like protein modifications in prostate and breast cancer." Front Biosci 12: 700-711. Wu, J., Q. Shakey, W. Liu, A. Schuller and M. T. Follettie (2007). "Global profiling of phosphopeptides by titania affinity enrichment." J Proteome Res 6(12): 4684-4689. Wu, L., K. Luo, Z. Lou and J. Chen (2008). "MDC1 regulates intra-S-phase checkpoint by targeting NBS1 to DNA double-strand breaks." Proc Natl Acad Sci U S A 105(32): 11200-11205. Xu, K., H. Shimelis, D. E. Linn, R. Jiang, X. Yang, F. Sun, Z. Guo, H. Chen, W. Li, X. Kong, J. Melamed, S. Fang, Z. Xiao, T. D. Veenstra and Y. Qiu (2009). "Regulation of androgen receptor transcriptional activity and specificity by RNF6-induced ubiquitination." Cancer Cell 15(4): 270-282. Xu, L. L., B. G. Stackhouse, K. Florence, W. Zhang, N. Shanmugam, I. A. Sesterhenn, Z. Zou, V. Srikantan, M. Augustus, V. Roschke, K. Carter, D. G. McLeod, J. W. Moul, D. Soppett and S. Srivastava (2000). "PSGR, a novel prostate-specific gene with homology to a G protein-coupled receptor, is overexpressed in prostate cancer." Cancer Res 60(23): 6568-6572.

Literature
166
Xu, Q., G. Mellitzer and D. G. Wilkinson (2000). "Roles of Eph receptors and ephrins in segmental patterning." Philos Trans R Soc Lond B Biol Sci 355(1399): 993-1002. Yan, J. and A. M. Jetten (2008). "RAP80 and RNF8, key players in the recruitment of repair proteins to DNA damage sites." Cancer Lett 271(2): 179-190. Yan, W., K. Nehrke, J. Choi and D. L. Barber (2001). "The Nck-interacting kinase (NIK) phosphorylates the Na+-H+ exchanger NHE1 and regulates NHE1 activation by platelet-derived growth factor." J Biol Chem 276(33): 31349-31356. Ye, J., X. Zhang, C. Young, X. Zhao, Q. Hao, L. Cheng and O. N. Jensen (2010). "Optimized IMAC-IMAC protocol for phosphopeptide recovery from complex biological samples." J Proteome Res 9(7): 3561-3573. You, J., A. Fitzgerald, P. J. Cozzi, Z. Zhao, P. Graham, P. J. Russell, B. J. Walsh, M. Willcox, L. Zhong, V. Wasinger and Y. Li (2010). "Post-translation modification of proteins in tears." Electrophoresis 31(11): 1853-1861. Yu, L. R., Z. Zhu, K. C. Chan, H. J. Issaq, D. S. Dimitrov and T. D. Veenstra (2007). "Improved titanium dioxide enrichment of phosphopeptides from HeLa cells and high confident phosphopeptide identification by cross-validation of MS/MS and MS/MS/MS spectra." J Proteome Res 6(11): 4150-4162. Zahedi, R. P., U. Lewandrowski, J. Wiesner, S. Wortelkamp, J. Moebius, C. Schutz, U. Walter, S. Gambaryan and A. Sickmann (2008). "Phosphoproteome of resting human platelets." J Proteome Res 7(2): 526-534. Zhai, Y., P. J. Kronebusch, P. M. Simon and G. G. Borisy (1996). "Microtubule dynamics at the G2/M transition: abrupt breakdown of cytoplasmic microtubules at nuclear envelope breakdown and implications for spindle morphogenesis." J Cell Biol 135(1): 201-214. Zhang, K., S. Hu, J. Wu, L. Chen, J. Lu, X. Wang, X. Liu, B. Zhou and Y. Yen (2009). "Overexpression of RRM2 decreases thrombspondin-1 and increases VEGF production in human cancer cells in vitro and in vivo: implication of RRM2 in angiogenesis." Mol Cancer 8: 11. Zhang, X., O. De la Cruz, J. M. Pinto, D. Nicolae, S. Firestein and Y. Gilad (2007). "Characterizing the expression of the human olfactory receptor gene family using a novel DNA microarray." Genome Biol 8(5): R86. Zhang, X., M. Rogers, H. Tian, D. J. Zou, J. Liu, M. Ma, G. M. Shepherd and S. J. Firestein (2004). "High-throughput microarray detection of olfactory receptor gene expression in the mouse." Proc Natl Acad Sci U S A 101(39): 14168-14173. Zhao, H., C. J. Logothetis and I. P. Gorlov (2010). "Usefulness of the top-scoring pairs of genes for prediction of prostate cancer progression." Prostate Cancer Prostatic Dis 13(3): 252-259. Zhao, X., D. A. D, W. K. Lim, M. Brahmachary, M. S. Carro, T. Ludwig, C. C. Cardo, F. Guillemot, K. Aldape, A. Califano, A. Iavarone and A. Lasorella (2009). "The N-Myc-DLL3 cascade is suppressed by the ubiquitin ligase Huwe1 to inhibit proliferation and promote neurogenesis in the developing brain." Dev Cell 17(2): 210-221. Zhao, X., J. I. Heng, D. Guardavaccaro, R. Jiang, M. Pagano, F. Guillemot, A. Iavarone and A. Lasorella (2008). "The HECT-domain ubiquitin ligase Huwe1 controls neural differentiation and proliferation by destabilizing the N-Myc oncoprotein." Nat Cell Biol 10(6): 643-653. Zufall, F. and T. Leinders-Zufall (2000). "The cellular and molecular basis of odor adaptation." Chem Senses 25(4): 473-481. Zufall, F. and S. D. Munger (2001). "From odor and pheromone transduction to the organization of the sense of smell." Trends Neurosci 24(4): 191-193.

Supplementary Tables
167
12 Supplementary Tables
Due to their length and limited use in a printed format, all supplementary tables can be found on the
accompanying CD

Publications
168
13 Publications
Characterization of a Peptide that Specifically Blocks the Ras Binding Domain of p75
Egert S, Piechura H, Hambruch N, Feigel M, Blöchl A.
International Journal of Peptide Research and Therapeutics. 2007; 13 (3):413-421.
Towards multidimensional liquid chromatography separation of proteins using fluorescence and
isotope-coded protein labelling for quantitative proteomics.
Tribl F, Lohaus C, Dombert T, Langenfeld E, Piechura H, Warscheid B, Meyer HE, Marcus K.
Proteomics. 2008 Mar;8(6):1204-11.
New insight into stimulus-induced plasticity of the olfactory epithelium in Mus musculus by
quantitative proteomics.
Barbour J, Neuhaus EM, Piechura H, Stoepel N, Mashukova A, Brunert D, Sitek B, Stühler K, Meyer
HE, Hatt H, Warscheid B.
Journal of Proteome Research. 2008 Apr;7(4):1594-605.
Members of the E2D (UbcH5) family mediate the ubiquitination of the conserved cysteine of
Pex5p, the peroxisomal import receptor.
Grou CP, Carvalho AF, Pinto MP, Wiese S, Piechura H, Meyer HE, Warscheid B, Sá-Miranda C,
Azevedo JE.
Journal of Biological Chemistry. 2008 May 23;283(21):14190-7.
Coa3 and Cox14 are essential for negative feedback regulation of COX1 translation in
mitochondria.
Mick DU, Vukotic M, Piechura H, Meyer HE, Warscheid B, Deckers M, Rehling P.
Journal of Cell Biology. 2010 Oct 4;191(1):141-54.
A salivary serine protease of the haematophagous reduviid Panstrongylus megistus: sequence
characterization, expression pattern and characterization of proteolytic activity.
Meiser CK, Piechura H, Meyer HE, Warscheid B, Schaub GA, Balczun C.
Insect Molecular Biology. 2010 Mar 24.
Kazal-type inhibitors in the stomach of Panstrongylus megistus (Triatominae, Reduviidae).
Meiser CK, Piechura H, Werner T, Dittmeyer-Schäfer S, Meyer HE, Warscheid B, Schaub GA, Balczun
C.
Insect Biochemistry and Molecular Biology. 2010 Apr;40(4):345-53.

Curriculum Vitae
169
Curriculum Vitae
Persönliches
Name: Heike Piechura
Anschrift: Schulstraße 34
79235 Vogtsburg-Oberbergen
Familienstand: Ledig
Promotion
Oktober 2010 Abgabe der Dissertationsschrift
seit 1. Juni 2005 Promotion am Medizinischen Proteom-Center unter Betreuung durch
Frau Prof. Dr. Bettina Warscheid und Prof. Dr. Dr. Hanns Hatt zum
Thema „Differential phosphoproteomics of olfactory receptor
mediated signaling“
Studium
Mai 2005 Erlangung des Akademischen Grades „Diplom-Chemiker“
November 2004 -
Mai 2005 Anfertigung der Diplomarbeit am Lehrstuhl für molekulare
Neurobiochemie unter Betreuung von PD Dr. Andrea Blöchl mit dem
Thema: „Intrazelluläre Inhibition der p75-Signaltransduktion“
Oktober 2003 -
März 2004 Auslandssemester an der University of Sussex, Brighton, UK und
Praktikum in der Arbeitsgruppe von Mark Paget am Lehrstuhl
Biochemistry and Biomedical Science
Oktober 2000 -
Mai 2005 Studium der Chemie an der Ruhr-Universität Bochum
Schullaufbahn
Mai 2000 Erlangung der Allgemeinen Hochschulreife
August 1990-
21. Mai 1999 Besuch der Schiller-Schule in Bochum

Curriculum Vitae
170
September 1989
Jui 1991 Besuch der Gemeinschaftsgrundschule Brenschede in Bochum
September 1987
Jui 1989 Besuch der Grundschule Osterwald

Erklärung
171
Erklärung
Hiermit erkläre ich, dass ich die Arbeit selbstständig verfasst und bei keiner anderen Fakultät
eingereicht und dass ich keine anderen als die angegebenen Hilfsmittel verwendet habe. Es handelt
sich bei der heute von mir eingereichten Dissertation um sechs in Wort und Bild völlig
übereinstimmende Exemplare.
Weiterhin erkläre ich, dass digitale Abbildungen nur die originalen Daten enthalten und in keinem
Fall inhaltsverändernde Bildbearbeitung vorgenommen wurde.
Bochum, den 15. Oktober 2010
________________________________
Dipl.-Chem. Heike Piechura