
Stereoselective construction of quaternary centres under ...
Upload
desdeelharemCategory
view
0download
0
LETTERdoi:10.1038/nature09868
Distinct representations of olfactory information indifferent cortical centresDara L. Sosulski1, Maria Lissitsyna Bloom1{, Tyler Cutforth1{, Richard Axel1 & Sandeep Robert Datta1{
Sensory information is transmitted to the brain where it must beprocessed to translate stimulus features into appropriate beha-vioural output. In the olfactory system, distributed neural activityin the nose is converted into a segregated map in the olfactorybulb1–3. Here we investigate how this ordered representation istransformed in higher olfactory centres in mice. We havedeveloped a tracing strategy to define the neural circuits thatconvey information from individual glomeruli in the olfactorybulb to the piriform cortex and the cortical amygdala. The spatialorder in the bulb is discarded in the piriform cortex; axons fromindividual glomeruli project diffusely to the piriform withoutapparent spatial preference. In the cortical amygdala, we observebroad patches of projections that are spatially stereotyped for indi-vidual glomeruli. These projections to the amygdala are overlap-ping and afford the opportunity for spatially localized integrationof information from multiple glomeruli. The identification of adistributive pattern of projections to the piriform and stereotypedprojections to the amygdala provides an anatomical context for thegeneration of learned and innate behaviours.
In vision and touch, information central to perception is ordered inspace in the external world and this order is maintained from the peri-pheral sense organs to the cortex. Olfactory information, however, doesnot exhibit a discernible spatial order in the physical world and thisposes the question of how odours are represented in the brain. In mam-mals, olfactory perception is initiated by the recognition of odorantmolecules by a large repertoire of receptors in the olfactory sensoryepithelium4. Individual olfactory sensory neurons express one ofapproximately 1,000 receptors5–7, and each receptor interacts with mul-tiple odorants. Neurons expressing a given receptor, although randomlydistributed within zones of the olfactory epithelium, project with pre-cision to two spatially invariant glomeruli in the olfactory bulb1–3. Thus,the randomly distributed population of neurons activated by an odorantin the olfactory epithelium is consolidated into a discrete stereotypedmap of glomerular activity in the olfactory bulb8,9.
This highly ordered map of spatially invariant glomeruli must then betransformed in higher olfactory centres. The projection neurons of theolfactory bulb, mitral and tufted cells, extend an apical dendrite into asingle glomerulus and send axons to several telencephalic areas, includ-ing a significant input to the piriform cortex and cortical amygdala10–15.Electrophysiological studies and optical imaging reveal that individualodorants activate subpopulations of neurons distributed across the piri-form without spatial preference16,17. The piriform therefore discards thespatial segregation of the bulb and returns to a highly dispersed organ-ization in which different odorants activate unique ensembles of corticalneurons. However, the patterns of neural activity do not allow us todiscern whether mitral and tufted cell projections from a given glom-erulus to cortical neurons are segregated or distributed, and whether theyare random or determined. Distinguishing between these possibilities isimportant for understanding odour perception because a random rep-resentation of odour identity could accommodate learned olfactory
behaviours, but is unlikely to specify innate behaviours. Rather, innateolfactory behaviours are likely to result from the activation of geneticallydetermined, stereotyped neural circuits. We have therefore developed astrategy to trace the projections from identified glomeruli in the olfactorybulb to higher olfactory cortical centres.
Mitral and tufted cells that innervate a single glomerulus werelabelled by electroporation of tetramethylrhodamine (TMR)-dextranunder the guidance of a two-photon microscope. This technique labelsmitral and tufted cells that innervate a single glomerulus and is suffi-ciently robust to allow the identification of axon termini within mul-tiple higher order olfactory centres (Figs 1a–c, 2 and SupplementaryFigs 1–4). Labelling of glomeruli in the olfactory bulbs of mice thatexpress GFP under the control of specific odorant receptor promoterspermits us to examine potential stereotypy of projections from identicalglomeruli (MOR28–IRES–GFP (n 5 8), MOR1-3–IRES–GFP (n 5 13),and MOR174-9–IRES–GFP (n 5 10))18. Labelling of random uniden-tified glomeruli was performed in mice expressing synapto-pHluorin(OMP–IRES–spH), a fluorescent marker that allows us to visualizeindividual glomeruli9. This permits us to sample the projection patternsfrom multiple different glomeruli (Fig. 1c).
Electroporation of a single glomerulus results in the labelling of6–17 neurons in the mitral cell layer (mean 5 9.2 6 0.8; Fig. 1e and
1Department of Neuroscience and the Howard Hughes Medical Institute, College of Physicians and Surgeons, Columbia University, New York, New York 10032, USA. {Present addresses: Department ofNeurobiology, Harvard Medical School, Boston, Massachusetts 02115, USA (M.L.B., S.R.D.); Department of Molecular, Cell and Developmental Biology, University of California, Santa Cruz, California 95064,USA (T.C.).
f
a cb
d e
Num
ber
of m
itral
/tu
fted
cel
l bod
ies
TMR+
10
0FITC+ TMR+/
FITC+
Figure 1 | Targeted electroporation of TMR-dextran labels cells thatinnervate a single glomerulus in the olfactory bulb. a, b, A mouse olfactorybulb in which the MOR174-9 glomerulus is labelled with GFP, before (a) andafter (b) electroporation with TMR-dextran. Scale bar, 40mm. c, Image similarto a where electroporation was performed in a mouse in which spH is expressedin all glomeruli (OMP–IRES–spH, green); note that labelling (red) is confinedto a single glomerulus. Scale bar, 85mm. d, Control experiment in an OMP–IRES–spH mouse in which neighbouring glomeruli were electroporated withTMR-dextran (red, left) and FITC-dextran (green, right). Scale bar, 45mm.e, Labelling of mitral cells (red, green) as a result of the experiment ind. f, Quantification of the overlap in mitral cell labelling in experiments similarto d (error bars represent s.e.m.; n 5 4).
1 4 A P R I L 2 0 1 1 | V O L 4 7 2 | N A T U R E | 2 1 3
Macmillan Publishers Limited. All rights reserved©2011
Supplementary Figs 1c, 2; see Methods). We have demonstrated thatall mitral and tufted cells labelled in this manner innervate a singleglomerulus by electroporating TMR-dextran into one glomerulus andfluorescein isothiocyanate (FITC)-conjugated dextran into a neigh-bouring glomerulus (Fig. 1d). Examination of the mitral and tuftedcells after this two-colour electroporation reveals either red or greenmitral and tufted cells with only a rare cell labelled simultaneously withthe two dyes (1/60 cells, n 5 4) (Fig. 1e, f). This labelling strategytherefore restricts incorporation of tracer to mitral and tufted cellsinnervating only one glomerulus.
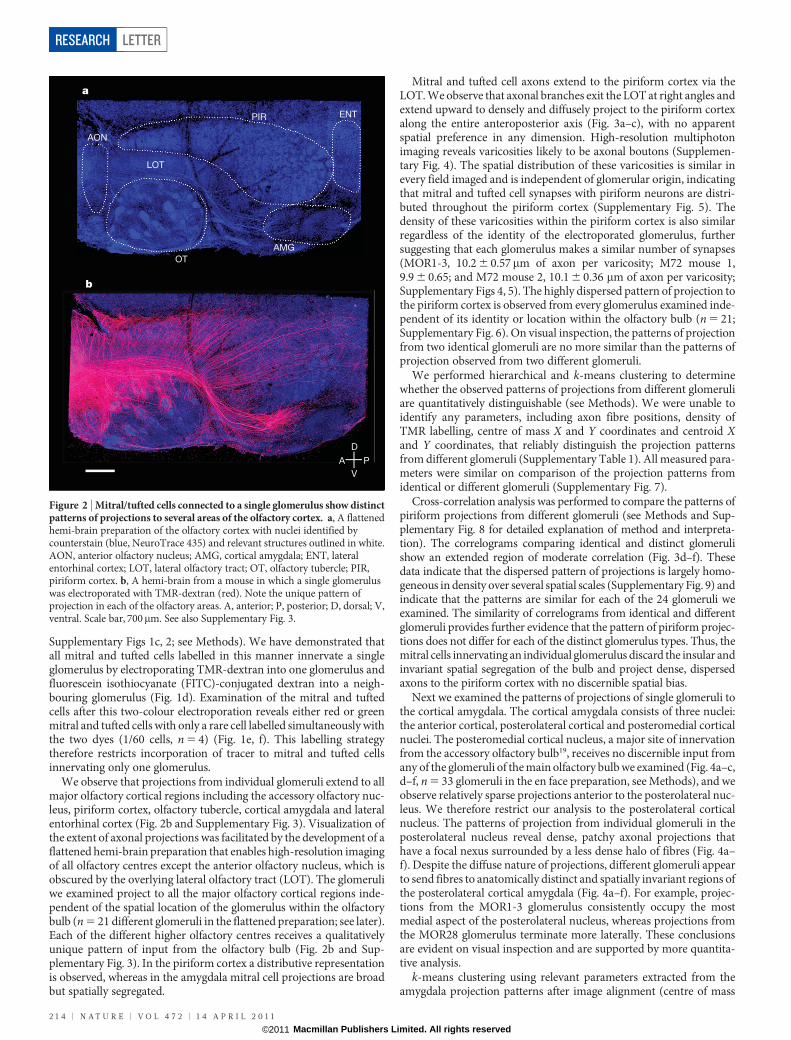
We observe that projections from individual glomeruli extend to allmajor olfactory cortical regions including the accessory olfactory nuc-leus, piriform cortex, olfactory tubercle, cortical amygdala and lateralentorhinal cortex (Fig. 2b and Supplementary Fig. 3). Visualization ofthe extent of axonal projections was facilitated by the development of aflattened hemi-brain preparation that enables high-resolution imagingof all olfactory centres except the anterior olfactory nucleus, which isobscured by the overlying lateral olfactory tract (LOT). The glomeruliwe examined project to all the major olfactory cortical regions inde-pendent of the spatial location of the glomerulus within the olfactorybulb (n 5 21 different glomeruli in the flattened preparation; see later).Each of the different higher olfactory centres receives a qualitativelyunique pattern of input from the olfactory bulb (Fig. 2b and Sup-plementary Fig. 3). In the piriform cortex a distributive representationis observed, whereas in the amygdala mitral cell projections are broadbut spatially segregated.
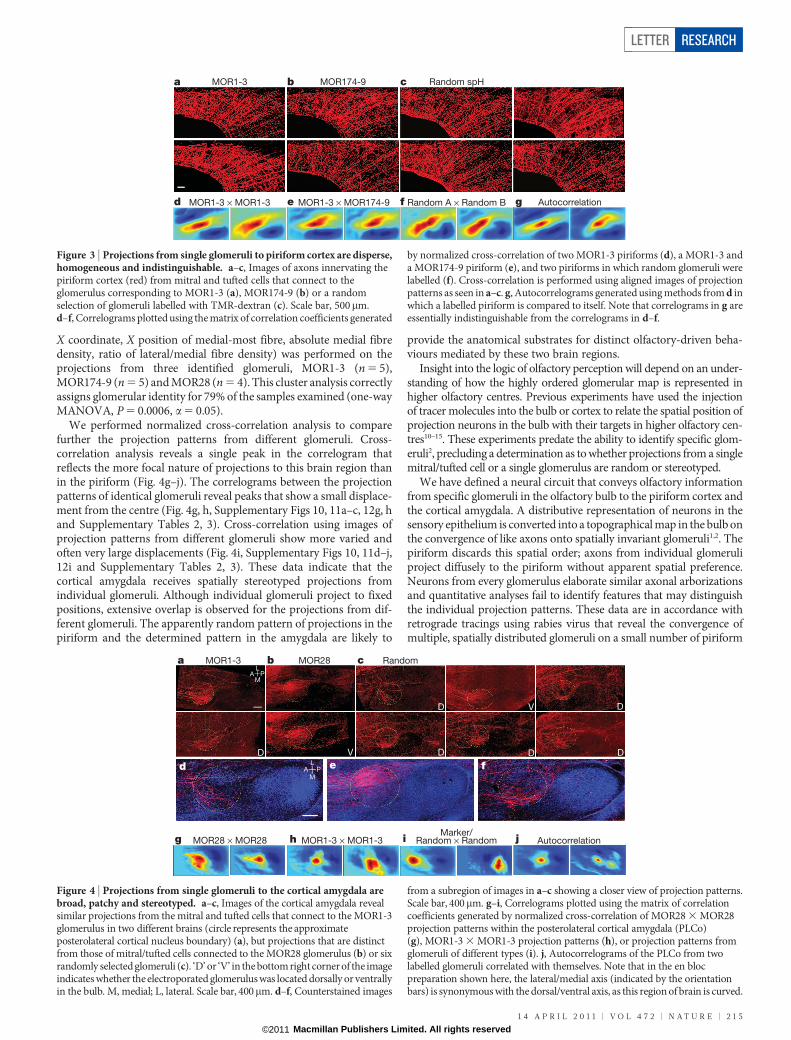
Mitral and tufted cell axons extend to the piriform cortex via theLOT. We observe that axonal branches exit the LOT at right angles andextend upward to densely and diffusely project to the piriform cortexalong the entire anteroposterior axis (Fig. 3a–c), with no apparentspatial preference in any dimension. High-resolution multiphotonimaging reveals varicosities likely to be axonal boutons (Supplemen-tary Fig. 4). The spatial distribution of these varicosities is similar inevery field imaged and is independent of glomerular origin, indicatingthat mitral and tufted cell synapses with piriform neurons are distri-buted throughout the piriform cortex (Supplementary Fig. 5). Thedensity of these varicosities within the piriform cortex is also similarregardless of the identity of the electroporated glomerulus, furthersuggesting that each glomerulus makes a similar number of synapses(MOR1-3, 10.2 6 0.57mm of axon per varicosity; M72 mouse 1,9.9 6 0.65; and M72 mouse 2, 10.1 6 0.36 mm of axon per varicosity;Supplementary Figs 4, 5). The highly dispersed pattern of projection tothe piriform cortex is observed from every glomerulus examined inde-pendent of its identity or location within the olfactory bulb (n 5 21;Supplementary Fig. 6). On visual inspection, the patterns of projectionfrom two identical glomeruli are no more similar than the patterns ofprojection observed from two different glomeruli.
We performed hierarchical and k-means clustering to determinewhether the observed patterns of projections from different glomeruliare quantitatively distinguishable (see Methods). We were unable toidentify any parameters, including axon fibre positions, density ofTMR labelling, centre of mass X and Y coordinates and centroid Xand Y coordinates, that reliably distinguish the projection patternsfrom different glomeruli (Supplementary Table 1). All measured para-meters were similar on comparison of the projection patterns fromidentical or different glomeruli (Supplementary Fig. 7).
Cross-correlation analysis was performed to compare the patterns ofpiriform projections from different glomeruli (see Methods and Sup-plementary Fig. 8 for detailed explanation of method and interpreta-tion). The correlograms comparing identical and distinct glomerulishow an extended region of moderate correlation (Fig. 3d–f). Thesedata indicate that the dispersed pattern of projections is largely homo-geneous in density over several spatial scales (Supplementary Fig. 9) andindicate that the patterns are similar for each of the 24 glomeruli weexamined. The similarity of correlograms from identical and differentglomeruli provides further evidence that the pattern of piriform projec-tions does not differ for each of the distinct glomerulus types. Thus, themitral cells innervating an individual glomerulus discard the insular andinvariant spatial segregation of the bulb and project dense, dispersedaxons to the piriform cortex with no discernible spatial bias.
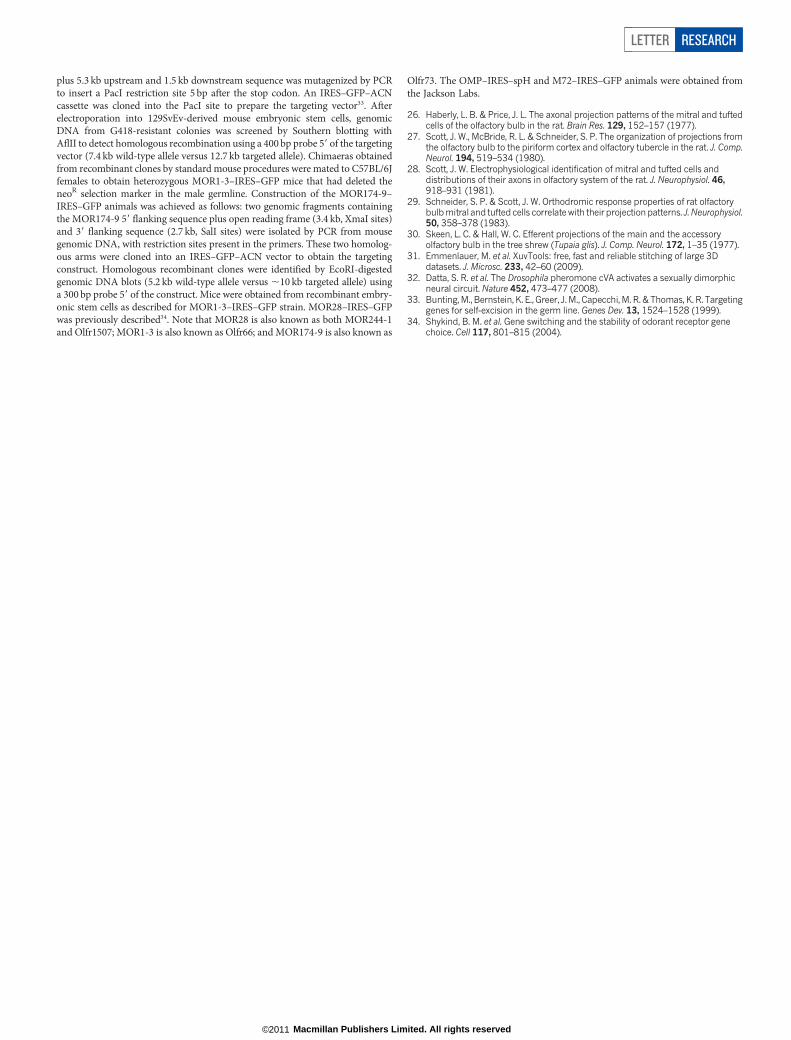
Next we examined the patterns of projections of single glomeruli tothe cortical amygdala. The cortical amygdala consists of three nuclei:the anterior cortical, posterolateral cortical and posteromedial corticalnuclei. The posteromedial cortical nucleus, a major site of innervationfrom the accessory olfactory bulb19, receives no discernible input fromany of the glomeruli of the main olfactory bulb we examined (Fig. 4a–c,d–f, n 5 33 glomeruli in the en face preparation, see Methods), and weobserve relatively sparse projections anterior to the posterolateral nuc-leus. We therefore restrict our analysis to the posterolateral corticalnucleus. The patterns of projection from individual glomeruli in theposterolateral nucleus reveal dense, patchy axonal projections thathave a focal nexus surrounded by a less dense halo of fibres (Fig. 4a–f). Despite the diffuse nature of projections, different glomeruli appearto send fibres to anatomically distinct and spatially invariant regions ofthe posterolateral cortical amygdala (Fig. 4a–f). For example, projec-tions from the MOR1-3 glomerulus consistently occupy the mostmedial aspect of the posterolateral nucleus, whereas projections fromthe MOR28 glomerulus terminate more laterally. These conclusionsare evident on visual inspection and are supported by more quantita-tive analysis.
k-means clustering using relevant parameters extracted from theamygdala projection patterns after image alignment (centre of mass
AON
ENT
LOT
OTAMG
PIR
a
b
D
VA P
Figure 2 | Mitral/tufted cells connected to a single glomerulus show distinctpatterns of projections to several areas of the olfactory cortex. a, A flattenedhemi-brain preparation of the olfactory cortex with nuclei identified bycounterstain (blue, NeuroTrace 435) and relevant structures outlined in white.AON, anterior olfactory nucleus; AMG, cortical amygdala; ENT, lateralentorhinal cortex; LOT, lateral olfactory tract; OT, olfactory tubercle; PIR,piriform cortex. b, A hemi-brain from a mouse in which a single glomeruluswas electroporated with TMR-dextran (red). Note the unique pattern ofprojection in each of the olfactory areas. A, anterior; P, posterior; D, dorsal; V,ventral. Scale bar, 700mm. See also Supplementary Fig. 3.
RESEARCH LETTER
2 1 4 | N A T U R E | V O L 4 7 2 | 1 4 A P R I L 2 0 1 1
Macmillan Publishers Limited. All rights reserved©2011
X coordinate, X position of medial-most fibre, absolute medial fibredensity, ratio of lateral/medial fibre density) was performed on theprojections from three identified glomeruli, MOR1-3 (n 5 5),MOR174-9 (n 5 5) and MOR28 (n 5 4). This cluster analysis correctlyassigns glomerular identity for 79% of the samples examined (one-wayMANOVA, P 5 0.0006, a 5 0.05).
We performed normalized cross-correlation analysis to comparefurther the projection patterns from different glomeruli. Cross-correlation analysis reveals a single peak in the correlogram thatreflects the more focal nature of projections to this brain region thanin the piriform (Fig. 4g–j). The correlograms between the projectionpatterns of identical glomeruli reveal peaks that show a small displace-ment from the centre (Fig. 4g, h, Supplementary Figs 10, 11a–c, 12g, hand Supplementary Tables 2, 3). Cross-correlation using images ofprojection patterns from different glomeruli show more varied andoften very large displacements (Fig. 4i, Supplementary Figs 10, 11d–j,12i and Supplementary Tables 2, 3). These data indicate that thecortical amygdala receives spatially stereotyped projections fromindividual glomeruli. Although individual glomeruli project to fixedpositions, extensive overlap is observed for the projections from dif-ferent glomeruli. The apparently random pattern of projections in thepiriform and the determined pattern in the amygdala are likely to
provide the anatomical substrates for distinct olfactory-driven beha-viours mediated by these two brain regions.
Insight into the logic of olfactory perception will depend on an under-standing of how the highly ordered glomerular map is represented inhigher olfactory centres. Previous experiments have used the injectionof tracer molecules into the bulb or cortex to relate the spatial position ofprojection neurons in the bulb with their targets in higher olfactory cen-tres10–15. These experiments predate the ability to identify specific glom-eruli2, precluding a determination as to whether projections from a singlemitral/tufted cell or a single glomerulus are random or stereotyped.
We have defined a neural circuit that conveys olfactory informationfrom specific glomeruli in the olfactory bulb to the piriform cortex andthe cortical amygdala. A distributive representation of neurons in thesensory epithelium is converted into a topographical map in the bulb onthe convergence of like axons onto spatially invariant glomeruli1,2. Thepiriform discards this spatial order; axons from individual glomeruliproject diffusely to the piriform without apparent spatial preference.Neurons from every glomerulus elaborate similar axonal arborizationsand quantitative analyses fail to identify features that may distinguishthe individual projection patterns. These data are in accordance withretrograde tracings using rabies virus that reveal the convergence ofmultiple, spatially distributed glomeruli on a small number of piriform
d MOR1-3 × MOR1-3
a MOR1-3 b c Random spHMOR174-9
e f Random A × Random B g AutocorrelationMOR1-3 × MOR174-9
Figure 3 | Projections from single glomeruli to piriform cortex are disperse,homogeneous and indistinguishable. a–c, Images of axons innervating thepiriform cortex (red) from mitral and tufted cells that connect to theglomerulus corresponding to MOR1-3 (a), MOR174-9 (b) or a randomselection of glomeruli labelled with TMR-dextran (c). Scale bar, 500mm.d–f, Correlograms plotted using the matrix of correlation coefficients generated
by normalized cross-correlation of two MOR1-3 piriforms (d), a MOR1-3 anda MOR174-9 piriform (e), and two piriforms in which random glomeruli werelabelled (f). Cross-correlation is performed using aligned images of projectionpatterns as seen in a–c. g, Autocorrelograms generated using methods from d inwhich a labelled piriform is compared to itself. Note that correlograms in g areessentially indistinguishable from the correlograms in d–f.
a b cL
D V
D
D
V
D
D
D
MA P
d e fLP
MA
g h i jMOR28 × MOR28 MOR1-3 × MOR1-3
MOR1-3 MOR28 Random
Marker/Random × Random Autocorrelation
Figure 4 | Projections from single glomeruli to the cortical amygdala arebroad, patchy and stereotyped. a–c, Images of the cortical amygdala revealsimilar projections from the mitral and tufted cells that connect to the MOR1-3glomerulus in two different brains (circle represents the approximateposterolateral cortical nucleus boundary) (a), but projections that are distinctfrom those of mitral/tufted cells connected to the MOR28 glomerulus (b) or sixrandomly selected glomeruli (c). ‘D’ or ‘V’ in the bottom right corner of the imageindicates whether the electroporated glomerulus was located dorsally or ventrallyin the bulb. M, medial; L, lateral. Scale bar, 400mm. d–f, Counterstained images
from a subregion of images in a–c showing a closer view of projection patterns.Scale bar, 400mm. g–i, Correlograms plotted using the matrix of correlationcoefficients generated by normalized cross-correlation of MOR28 3 MOR28projection patterns within the posterolateral cortical amygdala (PLCo)(g), MOR1-3 3 MOR1-3 projection patterns (h), or projection patterns fromglomeruli of different types (i). j, Autocorrelograms of the PLCo from twolabelled glomeruli correlated with themselves. Note that in the en blocpreparation shown here, the lateral/medial axis (indicated by the orientationbars) is synonymous with the dorsal/ventral axis, as this region of brain is curved.
LETTER RESEARCH
1 4 A P R I L 2 0 1 1 | V O L 4 7 2 | N A T U R E | 2 1 5
Macmillan Publishers Limited. All rights reserved©2011

neurons20. A distributive representation of glomerular projections inthe piriform is also observed on anterograde tracing of individual mitralcells after Sindbis virus infection21.
Optical imaging and electrophysiological studies of neural responsesto odours reflect these anatomical transformations. Distributed neuralactivity in the sensory epithelium of the nose is transformed in the bulb,with each odour eliciting distinct spatial patterns of glomerular activity8,9.A second transformation is apparent in the piriform cortex where indi-vidual odorants activate unique ensembles of neurons that are distri-buted without discernible spatial order16,17. These neurons also exhibitdiscontinuous receptive fields; neurons within an ensemble responsive toa given odour respond to multiple, structurally dissimilar odours16,22. Thedispersed projections to the piriform provide an anatomical substrate forthe generation of these patterns of neural activity.
One model consistent with both the anatomy and physiologyinvokes the random convergence of excitatory inputs from mitral cellsonto piriform neurons such that each piriform neuron would sample arandom combination of glomerular inputs. If the connections frombulb to cortex are indeed random, then the representation of the qualityof an odorant or its valence in the piriform must be imposed by experi-ence. Odorants, however, can elicit innate behavioural responses, indi-cating that a second area of the brain must receive determined inputsfrom the olfactory bulb. The pattern of projections to the posterolateralamygdala implicates this structure in the generation of innate olfactory-driven behaviours. This suggestion is in accordance with the findingthat disruption of the amygdala abrogates innate, odour-driven beha-viours but leaves learned olfactory responses intact23,24.
The olfactory circuits we describe in the mouse are reminiscent ofthe architecture of the olfactory system in Drosophila25, despite the sixhundred million years of evolution that separate the two organisms. InDrosophila, neurons expressing a given odorant receptor are distri-buted throughout the antenna and converge on spatially invariantglomeruli in the antennal lobe. Information from the antennal lobebifurcates, with one branch exhibiting spatially invariant projections tothe lateral horn, a brain region mediating innate olfactory behaviours.A second branch projects to the mushroom body, a structure requiredfor learned olfactory responses. This anatomical and functionalbifurcation provides a context in which to consider the generation ofthe various forms of olfactory-driven behaviour in both flies and mice.Our data indicate that innate olfactory behaviours derive from deter-mined neural circuits selected over evolutionary time, whereas learnedbehaviours may be mediated by the selection and reinforcement ofrandom ensembles of neurons over the life of an organism.
METHODS SUMMARYSingle glomeruli and their associated mitral and tufted cells were labelled in adultmice via electroporation of 3 kD TMR-dextran (Invitrogen) under a two-photonmicroscope (Prairie Technologies). Glass electrodes were backfilled with dye andguided to a glomerulus centre, and current was applied to the back of the pipette(50 V, 30-ms pulses, 2Hz, 7–10 min, repeated 2–4 times, Grass Technologies).Afterwards, mice were allowed to recover for 5 days before being killed. Excisedbrains were prepared for imaging either by flattening the cortex of the righthemisphere or surgical excision of the cortical amygdala. TMR-dextran signalwas amplified by antibody staining (Jackson Immunoresearch), and samples werecounterstained (NeuroTrace 435, Invitrogen). Images were acquired using multi-photon excitation on a Zeiss 710 or a Prairie in vivo microscope. Image z-stacks ofthe piriform cortex or cortical amygdala were aligned using SPM8 and Photoshop,and then quantified using ImageJ and custom-written Matlab code (Mathworks).
Full Methods and any associated references are available in the online version ofthe paper at www.nature.com/nature.
Received 2 November 2010; accepted 25 January 2011.
Published online 30 March 2011.
1. Ressler, K. J., Sullivan, S. L. & Buck, L. B. Information coding in the olfactory system:evidence for a stereotypedand highly organized epitope map in theolfactorybulb.Cell 79, 1245–1255 (1994).
2. Mombaerts, P. et al. Visualizing an olfactory sensory map. Cell 87, 675–686(1996).
3. Vassar, R. et al. Topographic organization of sensory projections to the olfactorybulb. Cell 79, 981–991 (1994).
4. Buck, L. & Axel, R. A novel multigene family may encode odorant receptors: amolecular basis for odor recognition. Cell 65, 175–187 (1991).
5. Malnic, B., Hirono, J., Sato, T. & Buck, L. B. Combinatorial receptor codes for odors.Cell 96, 713–723 (1999).
6. Chess, A., Simon, I., Cedar, H. & Axel, R. Allelic inactivation regulates olfactoryreceptor gene expression. Cell 78, 823–834 (1994).
7. Niimura, Y. & Nei, M. Evolutionary changes of the number of olfactory receptorgenes in the human and mouse lineages. Gene 346, 23–28 (2005).
8. Rubin, B. D. & Katz, L. C. Optical imaging of odorant representations in themammalian olfactory bulb. Neuron 23, 499–511 (1999).
9. Bozza, T., McGann, J. P., Mombaerts, P. & Wachowiak, M. In vivo imaging ofneuronal activity by targeted expression of a genetically encoded probe in themouse. Neuron 42, 9–21 (2004).
10. Haberly, L. B. & Price, J. L. The axonal projection patterns of the mitral and tuftedcells of the olfactory bulb in the rat. Brain Res. 129, 152–157 (1977).
11. Scott, J. W., McBride, R. L. & Schneider, S. P. The organization of projections fromthe olfactory bulb to the piriform cortex and olfactory tubercle in the rat. J. Comp.Neurol. 194, 519–534 (1980).
12. Price, J. L. An autoradiographic study of complementary laminar patterns oftermination of afferent fibers to the olfactory cortex. J. Comp. Neurol. 150, 87–108(1973).
13. Luskin, M. B. & Price, J. L. The distribution of axon collaterals from the olfactorybulb and the nucleus of the horizontal limb of the diagonal band to the olfactorycortex, demonstrated by double retrograde labeling techniques. J. Comp. Neurol.209, 249–263 (1982).
14. Buonviso, N., Revial, M. F. & Jourdan, F. The projections of mitral cells from smalllocal regions of the olfactory bulb: an anterograde tracing study using PHA-L(Phaseolus vulgaris Leucoagglutinin). Eur. J. Neurosci. 3, 493–500 (1991).
15. Ojima, H., Mori, K. & Kishi, K. The trajectory of mitral cell axons in the rabbitolfactory cortex revealed by intracellular HRP injection. J. Comp. Neurol. 230,77–87 (1984).
16. Stettler, D. D. & Axel, R. Representations of odor in the piriform cortex. Neuron 63,854–864 (2009).
17. Rennaker, R. L., Chen, C. F., Ruyle, A. M., Sloan, A. M. & Wilson, D. A. Spatial andtemporal distribution of odorant-evoked activity in the piriform cortex. J. Neurosci.27, 1534–1542 (2007).
18. Shykind, B. M. et al. Gene switching and the stability of odorant receptor genechoice. Cell 117, 801–815 (2004).
19. de Olmos, J., Hardy, H. & Heimer, L. The afferent connections of the main and theaccessory olfactory bulb formations in the rat: an experimental HRP-study. J.Comp. Neurol. 181, 213–244 (1978).
20. Miyamichi, K. et al. Cortical representations of olfactory input by trans-synaptictracings. Nature advance online publication, doi:10.1038/nature09714 (22December 2010).
21. Ghosh, S. et al. Sensory maps in the olfactory cortex defined by long-range viraltracing of single neurons. Nature advance online publication doi:10.1038/nature09945 (30 March 2011).
22. Poo, C. & Isaacson, J. S. Odor representations in olfactory cortex: ‘‘sparse’’ coding,global inhibition, and oscillations. Neuron 62, 850–861 (2009).
23. Blanchard, D. C. & Blanchard, R. J. Innate and conditioned reactions to threat inrats with amygdaloid lesions. J. Comp. Physiol. Psychol. 81, 281–290 (1972).
24. Slotnick, B. M. Olfactory discrimination in rats with anterior amygdala lesions.Behav. Neurosci. 99, 956–963 (1985).
25. Vosshall, L. B. & Stocker, R. F. Molecular architecture of smell and taste inDrosophila. Annu. Rev. Neurosci. 30, 505–533 (2007).
Supplementary Information is linked to the online version of the paper atwww.nature.com/nature.
Acknowledgements We thank members of the R.A. and S.R.D. laboratories forcomments and advice, B. Shykind for mice with GFP-labelled olfactory receptorneurons, S. X. Luo for image alignment advice, D. M. Bear for cross-correlation analysisadvice, D. Padfield for Matlab code, R. Wilson for comments on the manuscript andP. Kisloff for manuscript preparation assistance. Financial support was provided by aHelen Hay Whitney Foundation Fellowship, a Career Award in the Medical Sciencesgrant from the Burroughs Wellcome Fund, and funding from the National Institutes ofHealth through the NIH Director’s New Innovator Award Program (DP2-OD-007109)(S.R.D.), a Ruth L. Kirschstein National Research Service Award predoctoral fellowshipfrom the National Institutes ofHealth (D.L.S.), and theHowardHughes Medical Instituteand a grant from the Foundation for the National Institutes ofHealth through theGrandChallenges in Global Health initiative (R.A.).
Author Contributions S.R.D., D.L.S. and R.A conceived the project, participated in itsdevelopment and wrote the manuscript. S.R.D. and D.L.S. developed methods andperformed all experiments and data analysis. T.C. generated the MOR1-3 andMOR174-9–IRES–GFP mice. M.L.B. performed mouse husbandry andimmunostaining.
Author Information Reprints and permissions information is available atwww.nature.com/reprints. The authors declare no competing financial interests.Readers are welcome to comment on the online version of this article atwww.nature.com/nature. Correspondence and requests for materials should beaddressed to R.A. ([email protected]).
RESEARCH LETTER
2 1 6 | N A T U R E | V O L 4 7 2 | 1 4 A P R I L 2 0 1 1
Macmillan Publishers Limited. All rights reserved©2011

METHODSSurgery. Mice were anaesthetized with ketamine/xylazine (100 mg kg21 or 10 mgkg21, respectively; Sigma-Aldrich), and temperature was maintained at 37 uC on afeedback-controlled heating pad (Fine Science Tools). The scalp was removed, andmembrane overlying the skull was cleared using a microblade (Roboz). An alu-minium headpost cut from square bar (Small Parts) was attached to the skull usingRelyX luting cement (Henry Schein). The borders of the exposure were coveredwith silicone sealant (VWR). For dorsal glomeruli, the skull overlying the olfactorybulb was thinned using a dental drill (KaVo) and removed with forceps, and thedura was peeled back using fine forceps (Roboz). For lateral glomeruli, the skinoverlying the cheek and zygomatic bone was removed, and vessels were cauterized(Fine Science Tools). The muscle attached to the zygomatic was peeled away, andthe bone was removed with microscissors (Roboz). The eye and surrounding tissuewas removed with microscissors; bleeding was stopped using gelfoam (HenrySchein), and mice were administered 0.7 ml Ringer’s solution (Henry Schein).The skull overlying the bulb was thinned and removed, and the dura peeled away.After electroporation, the bulb was coverslipped and covered in 2% agarose(Sigma-Aldrich), the exposure was covered in lidocaine jelly (Henry Schein)and then silicone sealant. Buprenorphine (0.05 mg kg21, Henry Schein) was admi-nistered after the mouse could right itself. Mice recovered for 5 days after electro-poration, and were then deeply anaesthetized with ketamine/xylazine and killed byparaformaldehyde perfusion.Electroporation. Mice were placed under a two-photon microscope (Ultima,Prairie Technologies), and a 316 objective was used to focus on a single glom-erulus (.8NA, Nikon). A Ti-Sapphire laser (Coherent) was tuned to 880 nm forexperiments. Pulled glass pipets (Sutter, 5–6mm tip) were backfilled with eitherlysine-fixable TMR-dextran (3 kDa, 12.5 mg ml21 in PBS) with biotin or lysine-fixable FITC-dextran (3,000 MW, 12.5 mg ml21 in PBS) with biotin (Invitrogen),and filled halfway with 0.9% w/v NaCl. The pipette was mounted on an electrodeholder (WPI)/manipulator (Luigs and Neumann), and its tip was directed to thethree-dimensional centre of a glomerulus under two-photon guidance. Currentwas applied to the pipette using a stimulator (50 V, 30-ms pulses, at 2 Hz, repeated2–4 times, Grass SD-9 stimulator). The black lead of the stimulator was connectedto the animal via an alligator clip on the foot. Note that although we observedrobust and reliable long-range diffusion/transport of TMR-dextran from labelledmitral and tufted cells to the olfactory cortex under these electroporation condi-tions, FITC-dextran showed substantively less diffusion/transport (for example,few or no labelled fibres in the LOT), which precluded the use of FITC-dextran toexplore axonal projections from the bulb to the cortex. Mice in which the glom-eruli were not clearly labelled, the labelling was non-specific (an exceedingly rareoccurance) or in which labelled mitral cells in the mitral cell layer could not beidentified during the course of the experiment were excluded from subsequentanalysis.Histological processing. Mice were killed by transcardial perfusion with 13 mlPBS, followed by 10 ml 1% paraformaldehyde. Brains were extracted and pro-cessed differentially depending on the region to be imaged. For imaging of thewhole olfactory cortex, the left hemisphere was discarded and the subcorticalmatter of the right hemisphere was removed using forceps. Cortical tissue abovethe rhinal sulcus was dissected away, and guide cuts were made with a needle blade(Fine Science Tools). The ventral hemisphere (which includes all of the structuresin the olfactory cortex) was then flattened between two slides separated by a600-mm spacer constructed of #1.5 coverslips. The sample was placed in 4%paraformaldehyde overnight, and then stored in PBS until antibody staining.For imaging of the amygdala, the brain was dissected as previously described,and a needle blade was used to cut along the LOT to excise the olfactory tubercle;an additional cut was made above the cortical nuclei of the amygdala to excise theolfactory amygdala. We use this en bloc preparation of the amygdala to avoiddistortions that occur at the ventral edge of the flattened hemi-preparation, wherethe cortical amygdala resides. This distortion is minimal in the centre of theflattened preparation where the piriform cortex is located. The amygdala was fixedin 4% paraformaldehyde overnight, and then stored in PBS until antibody staining.Before application of antibody, samples were soaked in glycine (1.87 g per 500 mlPBS, Sigma-Aldrich) for 2 h, followed by 1 h in PBS, 30 min in sodium borohy-dride (0.4 g per 400 ml PBS, Sigma-Aldrich) and 1 h in PBS to quench autofluor-escence. The following series of antibodies and washes were then used: primaryantibody for 3 days (1:500 rabbit anti-TMR, Invitrogen) in block (2% TritonX-100, 1% bovine serum albumin in PBS), wash 1 day (2% Triton X-100/PBS),secondary antibody for 2 days (1:250 goat anti-rabbit in block, JacksonImmunoresearch), wash 1 day, and tertiary antibody (1:250 TMR-conjugateddonkey anti-goat in block, Jackson Immunoresearch) and counterstain (1:150NeuroTrace 435 in block, Invitrogen) for 2 days, followed by 1 day of wash.Samples were mounted in Vectashield (Vector Labs) on a slide with the shallowend of a Lab-Tek chambered coverglass as a coverslip (NUNC).
Quantification of cellular labelling. Two different methods were used to quantifythe efficiency of our labelling method. First, after electroporation, we acquiredz-stacks from the surface of the olfactory bulb through the mitral cell layer ofthe bulb (see Supplementary Movie 1), and used these z-stacks to count the num-ber of cell bodies labelled in the mitral cell layer of the olfactory bulb post hoc. Wewere unable to quantify the number of tufted cells labelled for technical reasons: thebrightness and number of cells labelled superior to the mitral cell layer, as well asthe brightness of the glomerulus, made it difficult to quantify cell bodies(Supplementary Fig. 1), and the diversity in morphology and location of tuftedcells made it difficult to identify them based on visual and depth criteria. Second,previous work has indicated that mitral cell axons travel superior to tufted cellaxons in a segregated manner in the LOT and, unlike tufted cell axons, project toareas posterior to the anterior piriform cortex and olfactory tubercle26–30. Weobserved that near the most posterior aspect of the olfactory tubercle, the axonsof presumed mitral cells form a distinct bundle that continues to travel past thetubercle towards the posterior piriform cortex and amygdala (Supplementary Fig.2a). Therefore, we counted axons corresponding to presumed mitral cells in theposterior aspect of the LOT using a confocal microscope (see Supplementary Fig.2). We did not quantify the number of presumed tufted cells with this methodowing to technical constraints: these individual axons were difficult to opticallyresolve due to the large number of cells labelled, the high intensity of labelling, theirsmaller diameter, and the more three-dimensional structure of the presumedtufted cell axon band in the LOT.Image acquisition. Images were acquired on a Zeiss 710 confocal microscope(Zeiss) using a 310 water immersion objective (Zeiss 0.45NA) or a Prairie in vivomicroscope using a 310 water immersion objective (Olympus 0.6NA). In bothcases images were acquired in multiphoton mode using a Coherent laser tuned to810 nm. Zen software with a custom-written macro was used for acquisition andtiling of images online; LSM 510 software was used for tiling in the event that itneeded to be performed post-hoc (Zeiss). Images were also tiled using XUVTools31
(Albert-Ludwigs-Universitat Freiburg). Images in which clearly labelled mitral cellfibres were not apparent in the LOT adjacent to the posterior piriform cortex wereexcluded from further study; in all such cases samples showed other signs of poorlabelling (that is, poorly filled axonal arborizations).Image alignment. During all image processing the operator was blind to theglomerular identity of the particular image stack. z-stacks of images of en blocpreparations of the cortical amygdala were aligned using an intensity-based, two-step linear–nonlinear protocol. Image alignment was carried out in StatisticalParametric Mapping 8 (SPM8) (available at http://www.fil.ion.ucl.ac.uk/spm),an open-source software package widely used in fMRI research. SPM is validatedfor a variety of registration tasks, including analysis of the axonal projectionpatterns of olfactory projection neurons in Drosophila32. The linear registrationalgorithm used a standard 12-parameter algorithm with Gauss-Newton optimiza-tion. The nonlinear registration modelled the spatial transformation with a set ofbasis functions, the discrete sine transformation (DST) and the discrete cosinetransformation (DCT), of various spatial frequencies. Typically only a small num-ber of nonlinear iterations were carried out (often less than 100) and the nonlinearregularization value was held relatively high (typically at 100, never below 1),which maximized the relative contribution of the linear alignment to the template.We generated a standardized template brain stack of the cortical amygdala bymorphing four individual stacks onto a single high-quality image stack and thenaveraging the intensity of the resultant five individual stacks. This standardizedreference stack was then used to warp all cortical amygdala stacks used in thisstudy. Warping parameters were optimized for each image stack and the quality ofwarping was assessed by the overlap between the warped brain and the templateimage in the counterstained image channel only. The major landmarks in thispreparation are the posterolateral cortical amygdala, the posteromedical corticalamygdala and the ventral edge of the posterior piriform cortex, all of which wereused to judge alignment quality. Images that failed to align based on the counter-stain were excluded from the data set. After warp parameters were defined basedupon the counterstained channel, the channel containing the TMR-dextran stain-ing was warped using identical parameters. Because after warping most of the datawas contained in superficial planes, all analysis was performed on a maximumintensity projection of the warped volume. Alignment of maximal intensity pro-jections of image stacks of the piriform cortex (which were highly anisotropic—thatis, 20,0003 10,000 3 40—precluding accurate volumetric alignment by SPM8) wasperformed in Photoshop using affine commands (such as zoom and rotate) as wellas the ‘‘Warp’’ command, using only the counterstain as a guide to position.Statistics. All error bars are 6 standard error of the mean (s.e.m.). One-wayMANOVA was used to test whether multivariate means of variables for differentglomerulus types are different at the 0.05 significance level.Image processing and cluster analysis. During all image processing the operatorwas blind to the glomerular identity of the particular image stack. Images were
LETTER RESEARCH
Macmillan Publishers Limited. All rights reserved©2011

processed by using a semi-supervised algorithm to filament trace the raw warpedimage stacks using the Imaris software package (Bitplane), slightly dilating thefilaments, and then using those slightly dilated filaments to mask the original rawdata. Before extraction of parameters, piriform and posterolateral nucleus projec-tion patterns were aligned using the image alignment procedure previouslydescribed. Samples that were unable to be aligned due to poor counterstain orextreme physical distortion were excluded from k-means analysis. The data werethen maximally contrasted so that differences in label intensity were normalized. Anumber of parameters characterizing the features of the axonal projection patternsto the piriform cortex (X and Y centre of mass coordinates, X and Y centroidcoordinates, X coordinate of most anterior fibre, Y coordinate of most posteriorfibre at LOT, number of TMR-positive pixels) and amygdala (X and Y centre ofmass coordinates, X and Y centroid coordinates, X coordinate of medial-mostfibre, absolute fibre density within the lateral and medial hemispheres of PLCo,ratio of lateral/medial fibre density to total fibre density within the PLCo) wereextracted from the aligned and processed images of samples using ImageJ (NIH)and Matlab (Mathworks). No combination of parameters led to correct classifica-tion by glomerular type for piriform images, but the following parameters could beused in various combinations with nearly equal measures of success to classifyamygdala samples: X coordinate of centre of mass, X coordinate of medial-mostfibre, absolute fibre density within the medial hemisphere of PLCo, and the ratiosof fibre density within the medial or lateral hemispheres to the total fibre densitywithin the PLCo. The standardized Euclidean distance between pairs of objects inan M-by-N data matrix X, where rows of X correspond to the values of variablesextracted from a single amygdala image and columns correspond to differentvariables, was then calculated using the ‘‘pdist’’ function in Matlab. The ‘‘linkage’’function was then used to create a hierarchical cluster tree using the furthestdistance between the clusters from the standardized Euclidean distance matrixcalculated using ‘‘pdist’’. k-means clustering was performed using the ‘‘kmeans’’function in Matlab, which partitions the points in the data matrix X into N clusters(for example, N 5 3 for 3 glomeruli) by minimizing the sum, over all clusters, ofthe within-cluster sums of point-to-cluster centroid distances (squared Euclideandistance). The accuracy of this clustering is assessed by counting how manysamples are correctly grouped together by glomerulus type. Calculation of thedensity of fibres was performed by generating a Z projection of the warped andprocessed images, and using the contour surface function of Imaris (Bitplane) tocalculate the pixel density within the lateral and medial halves of the posterolateralcortical amygdala. The boundary between the lateral and medial halves of thepoesterolateral nucleus was defined by the line extending straight horizontallythrough the semi-major axis of the posteromedial nucleus (which appears as anellipse in the warped template brain; see Fig. 4d).Normalized cross-correlation. Images of piriform cortex and posterolateral cor-tical amygdala projection patterns were blurred using a Gaussian filter (piriformcortex s 5 200mm; amygdala s 5 ,70mm), cropped to exclude areas outside theregion of interest, resized (piriform 5 500 3 250 pixels; amygdala 5 200 3 224pixels), thresholded in Photoshop (Adobe) to binarize pixel values, and convertedto grayscale in Matlab. The ‘‘normxcorr2’’ function in Matlab was then used tocompute the normalized cross-correlation between the pixel values of two images(for example, MOR1-3 piriform 1 3 MOR1-3 piriform 2) (Supplementary Fig.8a). This function returns a matrix of Pearson correlation coefficients calculatedusing the following equation:
c(u,v)~
Px,y½f (x,y){f u,v�½t(x{u,y{v){t�
fP
x,y½f (x,y){f u,v�2P
x,y½t(x{u,y{v){t�2g0:5
where e is the image, t is the mean of the template, and f u,v is the mean of f (x,y)
in the region under the template.By default, non-overlapping pixels in this analysis are assigned a padding value
of zero; note that because the means of the template and the source image aresubtracted from the pixel values, non-overlapping pixels can still potentially con-tribute to the correlation coefficient. This matrix of correlation coefficients is thenplotted using the ‘‘surf’’ function in Matlab to generate correlograms (Supplemen-tary Fig. 8c), where warmer colours represent high correlation values (close to 1)and cooler colours represent anticorrelation values (close to 21). The cross-correlation between pixel values in two images was calculated when the imageswere directly superimposed, and calculated again as one image was shifted relativeto the other until no more overlap is possible in all directions (Supplementary Fig.8b). The result of these calculations is a matrix of correlation coefficients thatreflects the degree of correlation between the pixel values in two images acrossthe entire range of shifts (until the images are completely non-overlapping), andthis matrix can be plotted as a correlogram (Supplementary Fig. 8c). If there issimilarity in the spatial patterning in two images, there will be a peak (red colour)in the correlogram that reflects correlation coefficients greater than zero. The
location of this peak in the correlogram is a direct reflection of the similaritybetween the spatial patterning in two images. Images with similar spatial pattern-ing will have the highest correlation in pixel values when they are directly super-imposed, and the result of this is a peak at the centre of the correlogram—theimages do not need to be significantly shifted relative to each other for the spatialpatterning to overlap. Images with dissimilar spatial patterning will have the highestdegree of correlation in pixel values when one is shifted relative to the other (that is,shifting one image relative to the other gets the patterning in the images to overlap),resulting in a peak in the correlogram that is displaced from the centre. The amountthe correlogram peak is spatially offset from the centre of the correlogram can bequantified, and used as a measure of the similarity of the spatial patterning in twoimages (Supplementary Figs 10, 11). Finally, the shape of the peak in the correlo-gram is related to the nature of the patterning; focal patterning will generate a morefocal (circular) peak, whereas more distributed patterning will generate a moreelongated peak (that is, there is overlap in the two patterns over a larger range ofspatial shifts). For both piriform and amygdala, normalized cross-correlation wasperformed for all pairwise combinations, in both possible configurations (forexample, MOR1-3 A 3 MOR28 A, and MOR28 A 3 MOR1-3 A). The locationof the maximum correlation coefficient in correlograms was determined by trans-forming the matrix of correlation values into a linear array and using the ‘‘max’’function to find the maximum value in the array, followed by the data cursor featureto find the X and Y coordinates of the maximum correlation coefficient in eachcorrelogram. For each pairwise comparison, the location of the maximum correla-tion coefficient for the configuration where the distance between the location of themaximum correlation coefficient and the centre of the correlogram was the smallestwas used to generate scatterplots.
Because non-overlapping pixels can potentially be assigned a real number value(due to subtracting of the means) in the calculation of the Pearson correlationcoefficient, artefacts can be introduced in the correlogram at the edges, whichrepresent correlation coefficients calculated under conditions where few pixelsare overlapping between the template and the source images. We therefore alsoperformed normalized cross-correlation analysis using an alternative data pad-ding method to control for the possibility that the edge artefacts cause changes inthe spatial position of the correlogram coefficient maximum. Template imagestiled as a 333 array (Supplementary Fig. 8d) were generated for all individualimages, and the normalized cross-correlation was then calculated for all pairwisecombinations of single and tiled images, as previously described. Running thenormXcorr2 algorithm using the tiled templates returns a correlogram that resem-bles a 333 grid with additional data points at the edges, but in which the block inthe centre has been subject to analysis without the source image ever sliding offinto a region that has no overlap. Because the template image is tiled, the region ofoverlap between the sliding image and the template will always contain the sameset of pixel values, though the spatial order of these pixels will be offset. The result isthat, for computing the centre block of the 333 cross-correlogram, the meanimage pixel value and the standard deviation of image pixel values used to calculatethe Pearson coefficient are constant as this region of the tiled image slides acrossthe template; this effectively avoids the introduction of the edge artefacts describedearlier. The resulting matrices of correlation coefficients were plotted using the‘‘surf’’ function. These matrices were either left uncropped (and therefore includethe correlations between all nine panels plus the edges), were cropped to theequivalent spatial displacements as were generated in the initial analysis with zeropadding (and which therefore contain offset peaks that are directly comparablebetween the two methods), or were cropped such that the source image only wasallowed to slide for 50% of its length on any axis across the template image. Thisfinal crop limits all of the values in the correlation matrix to those in which half ormore of the values in the correlation matrix arise from correlations between theimage and the centre tile (rather than the adjacent tiles in the template). The X, Ycoordinates of the maximum correlation coefficient were extracted from the‘‘equivalent’’ correlograms using the ‘‘max’’ and ‘‘find’’ functions on a submatrixrepresenting the correlation coefficient values within and surrounding the centrepeak of the correlogram (for example, the peak closest to the centre of the correlo-gram, not the peaks near the edge of the correlogram in the equivalent view). Onceagain, for each pairwise comparison, the location of the maximum correlationcoefficient for the configuration where the distance between the location of themaximum correlation coefficient and the centre of the correlogram was the smal-lest was used to generate scatterplots. The scatterplots generated using the twodifferent methods are qualitatively and quantitatively similar (Supplementary Figs10, 11 and Supplementary Tables 2, 3), and the correlograms generated by the twomethods are qualitatively similar as well (Supplementary Fig. 12), suggesting thatour analyses are robust to possible correlation artefacts caused by differences in thedegree of pixel overlap between the two methods.Genetics. Construction of MOR1-3–IRES–GFP animals was achieved as follows:a 7.8-kb genomic clone containing the complete MOR1-3 open reading frame
RESEARCH LETTER
Macmillan Publishers Limited. All rights reserved©2011
plus 5.3 kb upstream and 1.5 kb downstream sequence was mutagenized by PCRto insert a PacI restriction site 5 bp after the stop codon. An IRES–GFP–ACNcassette was cloned into the PacI site to prepare the targeting vector33. Afterelectroporation into 129SvEv-derived mouse embryonic stem cells, genomicDNA from G418-resistant colonies was screened by Southern blotting withAflII to detect homologous recombination using a 400 bp probe 59 of the targetingvector (7.4 kb wild-type allele versus 12.7 kb targeted allele). Chimaeras obtainedfrom recombinant clones by standard mouse procedures were mated to C57BL/6Jfemales to obtain heterozygous MOR1-3–IRES–GFP mice that had deleted theneoR selection marker in the male germline. Construction of the MOR174-9–IRES–GFP animals was achieved as follows: two genomic fragments containingthe MOR174-9 59 flanking sequence plus open reading frame (3.4 kb, XmaI sites)and 39 flanking sequence (2.7 kb, SalI sites) were isolated by PCR from mousegenomic DNA, with restriction sites present in the primers. These two homolog-ous arms were cloned into an IRES–GFP–ACN vector to obtain the targetingconstruct. Homologous recombinant clones were identified by EcoRI-digestedgenomic DNA blots (5.2 kb wild-type allele versus ,10 kb targeted allele) usinga 300 bp probe 59 of the construct. Mice were obtained from recombinant embry-onic stem cells as described for MOR1-3–IRES–GFP strain. MOR28–IRES–GFPwas previously described34. Note that MOR28 is also known as both MOR244-1and Olfr1507; MOR1-3 is also known as Olfr66; and MOR174-9 is also known as
Olfr73. The OMP–IRES–spH and M72–IRES–GFP animals were obtained fromthe Jackson Labs.
26. Haberly, L. B. & Price, J. L. The axonal projection patterns of the mitral and tuftedcells of the olfactory bulb in the rat. Brain Res. 129, 152–157 (1977).
27. Scott, J. W., McBride, R. L. & Schneider, S. P. The organization of projections fromthe olfactory bulb to the piriform cortex and olfactory tubercle in the rat. J. Comp.Neurol. 194, 519–534 (1980).
28. Scott, J. W. Electrophysiological identification of mitral and tufted cells anddistributions of their axons in olfactory system of the rat. J. Neurophysiol. 46,918–931 (1981).
29. Schneider, S. P. & Scott, J. W. Orthodromic response properties of rat olfactorybulb mitral and tufted cells correlate with their projection patterns. J. Neurophysiol.50, 358–378 (1983).
30. Skeen, L. C. & Hall, W. C. Efferent projections of the main and the accessoryolfactory bulb in the tree shrew (Tupaia glis). J. Comp. Neurol. 172, 1–35 (1977).
31. Emmenlauer, M. et al. XuvTools: free, fast and reliable stitching of large 3Ddatasets. J. Microsc. 233, 42–60 (2009).
32. Datta, S. R. et al. The Drosophila pheromone cVA activates a sexually dimorphicneural circuit. Nature 452, 473–477 (2008).
33. Bunting, M., Bernstein, K. E., Greer, J. M., Capecchi, M. R. & Thomas, K. R. Targetinggenes for self-excision in the germ line. Genes Dev. 13, 1524–1528 (1999).
34. Shykind, B. M. et al. Gene switching and the stability of odorant receptor genechoice. Cell 117, 801–815 (2004).
LETTER RESEARCH
Macmillan Publishers Limited. All rights reserved©2011
Copyright © 2022 FDOKUMEN