Cultural bequest values for ecosystem service flows among indigenous fishers: A discrete choice...
13
Analysis Cultural bequest values for ecosystem service flows among indigenous fishers: A discrete choice experiment validated with mixed methods Kirsten L.L. Oleson a,b, ⁎, Michele Barnes b,c , Luke M. Brander d , Thomas A. Oliver a,c,e , Ingrid van Beek f , Bienvenue Zafindrasilivonona a , Pieter van Beukering d a Blue Ventures Conservation, Lot VC 73 Ambatonakanga, Antananarivo 101, Madagascar b Department of Natural Resources and Environmental Management, University of Hawaii Manoa, 1910 East–west Rd., Sherman 101, Honolulu, HI 96822, United States c Joint Institute for Marine and Atmospheric Research, University of Hawaii at Manoa, United States d Department of Environmental Economics, Institute for Environmental Studies, Vrije Universiteit Amsterdam, De Boelelaan 1087, 1081 HV Amsterdam, The Netherlands e Department of Biology, University of Hawaii at Manoa, 2538 McCarthy Mall, Edmondson Hall 216, Honolulu, HI 96822, United States f Institute for Marine Resources and Ecosystem Studies, Wageningen University and Research Centre, Droevendaalsesteeg 4, 6708 PB Wageningen, The Netherlands abstract article info Article history: Received 8 January 2014 Received in revised form 21 February 2015 Accepted 23 February 2015 Available online xxxx Keywords: Cultural ecosystem services Bequest value Discrete choice experiment Discount rate Economic valuation Madagascar Perhaps the most understudied ecosystem services are related to socio-cultural values tied to non-material ben- efits arising from human–ecosystem relationships. Bequest values linked to natural ecosystems can be particular- ly significant for indigenous communities whose livelihoods and cultures are tied to ecosystems. Here we apply a discrete choice experiment (DCE) to determine indigenous fishers' preferences and willingness-to-pay for bequest gains from management actions in a locally managed marine area in Madagascar, and use our results to estimate an implicit discount rate. We validate our results using a unique rating and ranking game and other mixed methods. We find that bequest is highly valued and important; respondents were willing to pay a substantial portion of their income to protect ecosystems for future generations. Through all of our inquiries, bequest emerged as the highest priority, even when respondents were forced to make trade-offs among other livelihood-supporting ecosystem services. This study is among a relative few to quantify bequest values and apply a DCE to model trade-offs, value ecosystem service flows, and estimate discount rates in a developing country. Our results directly inform coastal management in Madagascar and elsewhere by providing information on the socio-cultural value of bequest in comparison to other ecosystem service benefits. © 2015 Elsevier B.V. All rights reserved. 1. Introduction Perhaps the most understudied ecosystem services are related to socio-cultural values tied to non-material benefits arising from human–ecosystem relationships (Chan et al., 2011). Cultural ecosystem services are defined by the Millennium Ecosystem Assessment (MEA, 2005, p. 894) as “the non-material benefits people obtain from ecosys- tems through spiritual enrichment, cognitive development, reflection, recreation and aesthetic experience, including, e.g., knowledge systems, social relations and aesthetic values.” Cultural ecosystem services provide benefits to society, yet can be intangible and subjective, and do not transmit clear demand signals, making quantification difficult (MEA, 2005). Innovative approaches, such as participatory and GIS modeling and mapping, contingent valuation, and the extrapolation of secondary market data, have facilitated assessments of some cultural ecosystem ser- vices (Hernández-Morcillo et al., 2013 and the references therein). Yet economic valuations have largely focused on recreational and aesthetic benefits (e.g. Bergstrom et al., 1990; Cisneros-Montemayor et al., 2013; Cisneros-Montemayor and Sumaila, 2010; Grêt-Regamey et al., 2008; van Beukering and Cesar, 2004), while other aspects, such as be- quest, remain elusive (Hernández-Morcillo et al., 2013). Bequest value is a non-use value representing the importance peo- ple place on preserving or maintaining ecosystems for future genera- tions (Chan et al., 2012b; Krutilla, 1967). Non-use values accrue independently of a person's own use of a resource, and they are often associated with irreplaceable resources (O'Garra, 2009). The perception that valued ecosystems are irreplaceable is often deeply tied to local socio-cultural values, and may persist despite the availability of physical substitutes (Crowards, 1995; O'Garra, 2009). Communities often de- velop unique relationships with ecosystems through rich histories of human–environment interaction and the continuity of culture, and place a high value on their endowment to future generations (Garibaldi and Turner, 2004). Bequest values of ecosystem service Ecological Economics 114 (2015) 104–116 ⁎ Corresponding author at: Department of Natural Resources and Environmental Management, University of Hawaii Manoa, 1910 East West Rd., Sherman 101, Honolulu, HI 96822, United States. E-mail addresses: [email protected] (K.L.L. Oleson), [email protected] (M. Barnes), [email protected] (L.M. Brander), [email protected] (T.A. Oliver), [email protected] (I. van Beek), [email protected] (B. Zafindrasilivonona), [email protected] (P. van Beukering). http://dx.doi.org/10.1016/j.ecolecon.2015.02.028 0921-8009/© 2015 Elsevier B.V. All rights reserved. Contents lists available at ScienceDirect Ecological Economics journal homepage: www.elsevier.com/locate/ecolecon
-
Upload
manoa-hawaii -
Category
Documents
-
view
3 -
download
0
Transcript of Cultural bequest values for ecosystem service flows among indigenous fishers: A discrete choice...
Ecological Economics 114 (2015) 104–116
Contents lists available at ScienceDirect
Ecological Economics
j ourna l homepage: www.e lsev ie r .com/ locate /eco lecon
Analysis
Cultural bequest values for ecosystem service flows among indigenousfishers: A discrete choice experiment validated with mixed methods
Kirsten L.L. Oleson a,b,⁎, Michele Barnes b,c, Luke M. Brander d, Thomas A. Oliver a,c,e, Ingrid van Beek f,Bienvenue Zafindrasilivonona a, Pieter van Beukering d
a Blue Ventures Conservation, Lot VC 73 Ambatonakanga, Antananarivo 101, Madagascarb Department of Natural Resources and Environmental Management, University of Hawaii Manoa, 1910 East–west Rd., Sherman 101, Honolulu, HI 96822, United Statesc Joint Institute for Marine and Atmospheric Research, University of Hawaii at Manoa, United Statesd Department of Environmental Economics, Institute for Environmental Studies, Vrije Universiteit Amsterdam, De Boelelaan 1087, 1081 HV Amsterdam, The Netherlandse Department of Biology, University of Hawaii at Manoa, 2538 McCarthy Mall, Edmondson Hall 216, Honolulu, HI 96822, United Statesf Institute for Marine Resources and Ecosystem Studies, Wageningen University and Research Centre, Droevendaalsesteeg 4, 6708 PB Wageningen, The Netherlands
⁎ Corresponding author at: Department of NaturalManagement, University of Hawaii Manoa, 1910 East WeHI 96822, United States.
E-mail addresses: [email protected] (K.L.L. Oleson),(M. Barnes), [email protected] (L.M. Brander), tom(T.A. Oliver), [email protected] (I. van Beek), bienve(B. Zafindrasilivonona), [email protected] (P. va
http://dx.doi.org/10.1016/j.ecolecon.2015.02.0280921-8009/© 2015 Elsevier B.V. All rights reserved.
a b s t r a c t
a r t i c l e i n f oArticle history:Received 8 January 2014Received in revised form 21 February 2015Accepted 23 February 2015Available online xxxx
Keywords:Cultural ecosystem servicesBequest valueDiscrete choice experimentDiscount rateEconomic valuationMadagascar
Perhaps the most understudied ecosystem services are related to socio-cultural values tied to non-material ben-efits arising fromhuman–ecosystem relationships. Bequest values linked to natural ecosystems can be particular-ly significant for indigenous communitieswhose livelihoods and cultures are tied to ecosystems. Herewe apply adiscrete choice experiment (DCE) to determine indigenous fishers' preferences and willingness-to-pay forbequest gains from management actions in a locally managed marine area in Madagascar, and use our resultsto estimate an implicit discount rate. We validate our results using a unique rating and ranking game andother mixed methods. We find that bequest is highly valued and important; respondents were willing to pay asubstantial portion of their income to protect ecosystems for future generations. Through all of our inquiries,bequest emerged as the highest priority, even when respondents were forced to make trade-offs among otherlivelihood-supporting ecosystem services. This study is among a relative few to quantify bequest values andapply a DCE to model trade-offs, value ecosystem service flows, and estimate discount rates in a developingcountry. Our results directly inform coastal management inMadagascar and elsewhere by providing informationon the socio-cultural value of bequest in comparison to other ecosystem service benefits.
© 2015 Elsevier B.V. All rights reserved.
1. Introduction
Perhaps the most understudied ecosystem services are relatedto socio-cultural values tied to non-material benefits arising fromhuman–ecosystem relationships (Chan et al., 2011). Cultural ecosystemservices are defined by the Millennium Ecosystem Assessment (MEA,2005, p. 894) as “the non-material benefits people obtain from ecosys-tems through spiritual enrichment, cognitive development, reflection,recreation and aesthetic experience, including, e.g., knowledge systems,social relations and aesthetic values.” Cultural ecosystem servicesprovide benefits to society, yet can be intangible and subjective, and donot transmit clear demand signals, making quantification difficult (MEA,2005). Innovative approaches, such as participatory and GIS modeling
Resources and Environmentalst Rd., Sherman 101, Honolulu,
[email protected]@[email protected] Beukering).
and mapping, contingent valuation, and the extrapolation of secondarymarket data, have facilitated assessments of some cultural ecosystem ser-vices (Hernández-Morcillo et al., 2013 and the references therein). Yeteconomic valuations have largely focused on recreational and aestheticbenefits (e.g. Bergstrom et al., 1990; Cisneros-Montemayor et al.,2013; Cisneros-Montemayor and Sumaila, 2010; Grêt-Regamey et al.,2008; van Beukering and Cesar, 2004), while other aspects, such as be-quest, remain elusive (Hernández-Morcillo et al., 2013).
Bequest value is a non-use value representing the importance peo-ple place on preserving or maintaining ecosystems for future genera-tions (Chan et al., 2012b; Krutilla, 1967). Non-use values accrueindependently of a person's own use of a resource, and they are oftenassociated with irreplaceable resources (O'Garra, 2009). The perceptionthat valued ecosystems are irreplaceable is often deeply tied to localsocio-cultural values, andmay persist despite the availability of physicalsubstitutes (Crowards, 1995; O'Garra, 2009). Communities often de-velop unique relationships with ecosystems through rich historiesof human–environment interaction and the continuity of culture,and place a high value on their endowment to future generations(Garibaldi and Turner, 2004). Bequest values of ecosystem service

105K.L.L. Oleson et al. / Ecological Economics 114 (2015) 104–116
benefits therefore comprise an important component of total eco-nomic value.
Bequest values linked to natural ecosystems can be particularly sig-nificant for indigenous communities (O'Garra, 2009),whose productionmethods and livelihoods are often reliant on ecological structures andfunctions (Casey et al., 2008; Pearce andWarford, 1993). Moreover, in-digenous communities often have deep attachments with particularecosystem services that play a unique role in shaping their culturalidentity, embedding them in traditions and narratives, ceremonies,and discourse (Garibaldi and Turner, 2004). Many communities stew-ard important ecosystems because these services are crucial forsupporting the continued existence and ability formaintaining integrityof cultural practices.
In this study we apply a discrete choice experiment (DCE) to deter-mine indigenous fishers' preferences and willingness-to-pay (WTP) forbequest gains from management actions in a locally managed marinearea (LMMA) in Madagascar. We design our DCE in a way that allowsfor the estimation of an implicit discount rate, reflecting the time prefer-ence of the local community. We validate our results by employing aunique rating and ranking game and other mixed methods.
We expect this study to make an important contribution to the fieldof environmental valuation. Cultural ecosystem service valuations arescarce, and little information exists on bequest values, particularly inlow income indigenous communities (but see O'Garra, 2009). Thisstudy is also among a small number to apply a DCE to model trade-offs and value ecosystem service flows in a developing country context(Bennet and Birol, 2010b).1 Our results can also directly inform marineand coastal management in Madagascar and elsewhere by providingcrucial information on the often-overlooked socio-cultural value of be-quest, and by providing information on the time horizon of indigenousfishers.
The remainder of our paper is structured as follows:we beginwith adiscussion of the DCE approach for cultural ecosystem service valuation,with a particular focus on applying it in developing countries and indig-enous communities. We then proceed with a description of our studysite. Nextwe present our study design andmethods, followed by our re-sults. We then concludewith a discussion of our results and their impli-cations for environmental decision-making and valuationmore broadly.
2. DCEs for Cultural Ecosystem Service Valuation
DCEs, originally developed by Louviere and Hensher (1982) andLouviere and Woodworth (1983), are increasingly being used by econ-omists to elicit preferences and values for non-market ecosystemservices (e.g. Adamowicz et al., 1994; Boxall et al., 1996; Hanley et al.,1998; Hoyos, 2010; Walsh et al., 1984). Based on a well-tested theoryof choice behavior (Thurstone, 1927), DCEs can be used to model com-plex hypothetical scenarios involving trade-offs between several attri-butes that model real-world decision making. The flexibility of theapproach allows for the attributes to be comprised of diverse ecosystemservices, whichmay interact in complexways. Given that a payment ve-hicle is also included as an attribute, preferences for estimated part-worth utilities, or the WTP for incremental changes in ecosystem ser-vices, can be estimated and compared based on respondents' choices.
Due to their flexibility, DCEs are perhaps themost appropriate avail-able method for eliciting values in complex situations involving trade-offs between multiple ecosystem services, particularly those linked tosocio-cultural values (Adamowicz et al., 2008; Noonan, 2003; Rolfeet al., 2000). Land and seascapes simultaneously provide provisioning,regulating, cultural, and supporting ecosystem services that are interre-lated in complex ways, and decisions to maximize one or fewmay haveto be made at the expense of others (Bennett et al., 2009; Rodríguezet al., 2006). In indigenous communities where local livelihoods and
1 Other comparisonmethods, however, such as thedamage schedule approach, have al-so been used to value environmental changes (Chuenpagdee et al., 2001).
culture are inextricably tied to the natural environment, strengtheningthe rules governing natural resource use can help to ensure notonly long-term ecological sustainability, but also socio-cultural sus-tainability. Yet the success of such management scenarios dependson the willingness of local resource users to give up short-term eco-nomic gains from resource extraction to achieve long-term ecologi-cal and economic results. The DCE approach is useful for modelingthese trade-offs, and can uncover the importance of the less tangible,intrinsic cultural values for achieving successful, sustainable man-agement (Hicks et al., 2009).
2.1. DCE Empirical Model
The choicemodeling technique is based on the idea that any good orenvironmental scenario can be described in terms of its characteristics,called attributes, and the levels (representing changes in quality orquantity) of these attributes. In a DCE, respondents are asked to choosebetweendifferent bundles of goods (in this case ecosystem services) de-scribed in terms of their attributes and attribute levels, at least one ofwhich is typically some form of payment (Hanley et al., 1998). The anal-ysis of choices is based on the characteristics theory of value (Lancaster,1966) and random utility theory (McFadden, 1974; Thurstone, 1927),which describe discrete choices in a utility maximizing framework. Ifan individual's utility function is assumed to be dependent on a vectorV of environmental attributes Z and socioeconomic characteristics S,and assuming the utility function can be partitioned into two compo-nents, one deterministic, observable component (Vin) and one randomand unobservable component (εin), it can be formulated as (Hanleyet al., 1998):
Uin ¼ V Zn; Sið Þ þ ε Zn; Sið Þ ð1Þ
where:
Uin total utility (U) individual i derived from alternative nVin observable utility (V) individual i derived from alternative nεin unobservable utility (ε) for individual i from alternative nZn particular attributes of ecosystem service Z in choice nSi attributes of the individual i.
The incorporation of the random component allows us to makeprobabilistic statements about individual behavior, where the probabil-ity of individual i choosing alternative n rather thanm in a given choiceset C is the probability that the random utility of alternative n is greaterthan the random utility of alternative m. The probability of choosingalternative n is then (Boxall et al., 1996; Hanley et al., 1998):
P njCið Þ ¼ Prob Vin þ εin NVim þ εimð Þ∀n≠m∈ C: ð2Þ
Employing amultinomial logitmodel for estimating choice probabil-ities, we assume that the random error εin is identically and indepen-dently distributed following a type I extreme (Gumbel) distributionwith scale parameter μ, in which the true parameters are confounded(Hanley et al., 1998; McFadden, 1974). The probability of choosing al-ternative n is then:
Pin ¼ exp μVinð ÞXnexp μVimð Þ: ð3Þ
As the scale parameter, μ, is confounded with the coefficients wewould like to estimate (i.e., Vn, Vm), and μ is not directly identifiablefrom the data, we are unable to generate absolute estimates of the coef-ficients independent of our multinomial model. However, because thescale parameter is constant within an estimated model, it is valid tocompare the relative sizes of coefficients within the same model
106 K.L.L. Oleson et al. / Ecological Economics 114 (2015) 104–116
(Alpizar et al., 2003). Also, as the scale parameter is inversely related tothe variance in the error term, given by δ2 =Π2/6μ2, it is valid to makesuch comparisons amongmodels, given appropriate controls on the re-spective scale parameter ratios (Alpizar et al., 2003; Hanley et al., 1998).
Since themodel estimation derives from random utility theory, wel-fare estimates of changes in attribute levels can be estimated and com-pared similar to the method applied in contingent valuation models(Hanemann, 1984). The marginal value of an attribute change couldbe given by the ratio of the coefficients of the attribute in questionand that of the payment attribute, holding all else equal. This can beconceptualized as the part-worth or marginal WTP for the attribute,calculated as:
WTPattribute ¼−βattribute
βpaymentð4Þ
where WTP represents the marginal rate of substitution between thepayment attribute and the attribute in question, and β refers to the pa-rameter estimates of the attribute levels.
DCEs have also been used to compute implicit discount ratesreflecting individual time preferences for utility in cases where twomonetary attributes are included that represent short-term costs andlong-term benefits (e.g., Hausman, 1979; Min et al., 2014). The implicitdiscount rate r can be computed from the formula:
β2 ¼ β1r 1þ rð Þt1þ rð Þt−1
ð5Þ
where β1 and β2 represent the estimated coefficients on short-term andlong-term income respectively, and t is the time period in which futureincome accrues (Min et al., 2014).
2.2. DCE Challenges in Developing Countries and Indigenous Communities
Careful study design can help address a number of known method-ological and practical challenges to applying DCEs in developing coun-tries and indigenous communities. To guide ecosystem management,important attributes with realistic levels should be tied to the local con-text and relevant to the local policy process (Alpizar et al., 2003; Bennetand Blamey, 2001). Equally as important, the payment vehicle needs tobe an appropriate and reliable measure of wealth (Bennet and Birol,2010b; Christie et al., 2012). Researchers also need to bear in mind po-tential issues of literacy, low scientific understanding and education,low local research capacity, spiritual and cultural nuanceswhich outsideresearchers may have difficulty understanding, and potential issuesgaining access to marginal groups (Bennet and Birol, 2010b; Christieet al., 2012). Guidelines for overcoming these challenges are summa-rized by Bennet and Birol (2010b).
3. Study Site
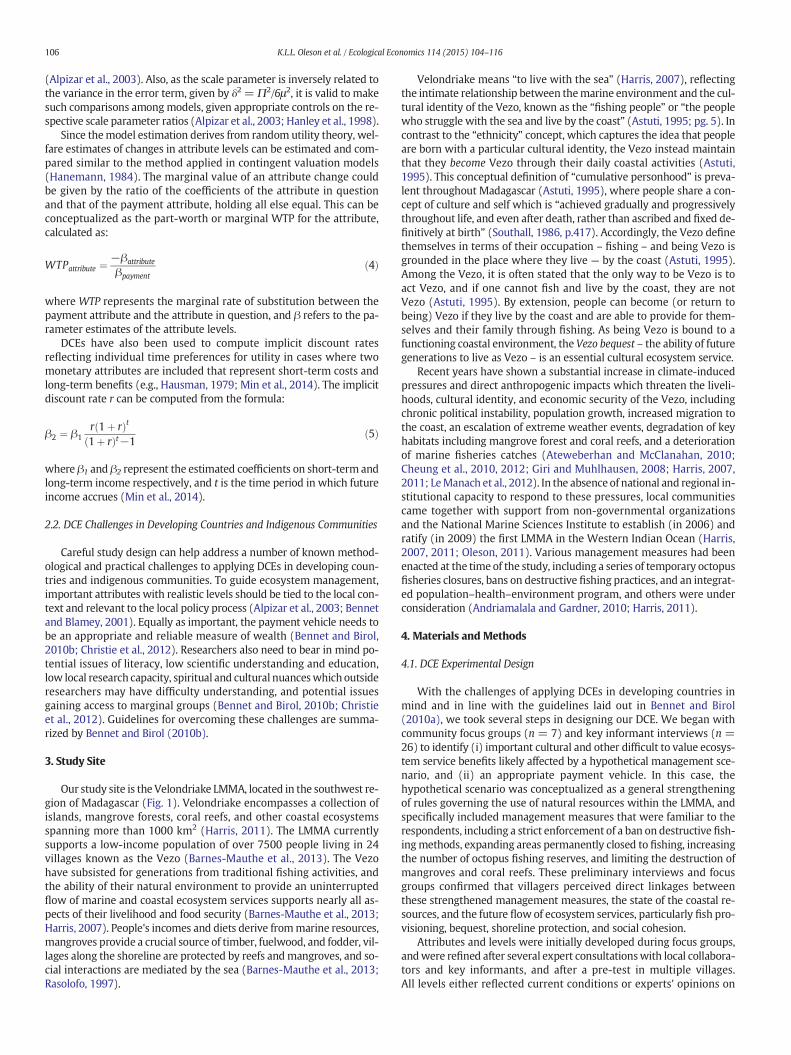
Our study site is the Velondriake LMMA, located in the southwest re-gion of Madagascar (Fig. 1). Velondriake encompasses a collection ofislands, mangrove forests, coral reefs, and other coastal ecosystemsspanning more than 1000 km2 (Harris, 2011). The LMMA currentlysupports a low-income population of over 7500 people living in 24villages known as the Vezo (Barnes-Mauthe et al., 2013). The Vezohave subsisted for generations from traditional fishing activities, andthe ability of their natural environment to provide an uninterruptedflow of marine and coastal ecosystem services supports nearly all as-pects of their livelihood and food security (Barnes-Mauthe et al., 2013;Harris, 2007). People's incomes and diets derive frommarine resources,mangroves provide a crucial source of timber, fuelwood, and fodder, vil-lages along the shoreline are protected by reefs andmangroves, and so-cial interactions are mediated by the sea (Barnes-Mauthe et al., 2013;Rasolofo, 1997).
Velondriake means “to live with the sea” (Harris, 2007), reflectingthe intimate relationship between themarine environment and the cul-tural identity of the Vezo, known as the “fishing people” or “the peoplewho struggle with the sea and live by the coast” (Astuti, 1995; pg. 5). Incontrast to the “ethnicity” concept, which captures the idea that peopleare born with a particular cultural identity, the Vezo instead maintainthat they become Vezo through their daily coastal activities (Astuti,1995). This conceptual definition of “cumulative personhood” is preva-lent throughout Madagascar (Astuti, 1995), where people share a con-cept of culture and self which is “achieved gradually and progressivelythroughout life, and even after death, rather than ascribed and fixed de-finitively at birth” (Southall, 1986, p.417). Accordingly, the Vezo definethemselves in terms of their occupation – fishing – and being Vezo isgrounded in the place where they live — by the coast (Astuti, 1995).Among the Vezo, it is often stated that the only way to be Vezo is toact Vezo, and if one cannot fish and live by the coast, they are notVezo (Astuti, 1995). By extension, people can become (or return tobeing) Vezo if they live by the coast and are able to provide for them-selves and their family through fishing. As being Vezo is bound to afunctioning coastal environment, the Vezo bequest – the ability of futuregenerations to live as Vezo – is an essential cultural ecosystem service.
Recent years have shown a substantial increase in climate-inducedpressures and direct anthropogenic impacts which threaten the liveli-hoods, cultural identity, and economic security of the Vezo, includingchronic political instability, population growth, increased migration tothe coast, an escalation of extreme weather events, degradation of keyhabitats including mangrove forest and coral reefs, and a deteriorationof marine fisheries catches (Ateweberhan and McClanahan, 2010;Cheung et al., 2010, 2012; Giri and Muhlhausen, 2008; Harris, 2007,2011; LeManach et al., 2012). In the absence of national and regional in-stitutional capacity to respond to these pressures, local communitiescame together with support from non-governmental organizationsand the National Marine Sciences Institute to establish (in 2006) andratify (in 2009) the first LMMA in the Western Indian Ocean (Harris,2007, 2011; Oleson, 2011). Various management measures had beenenacted at the time of the study, including a series of temporary octopusfisheries closures, bans on destructive fishing practices, and an integrat-ed population–health–environment program, and others were underconsideration (Andriamalala and Gardner, 2010; Harris, 2011).
4. Materials and Methods
4.1. DCE Experimental Design
With the challenges of applying DCEs in developing countries inmind and in line with the guidelines laid out in Bennet and Birol(2010a), we took several steps in designing our DCE. We began withcommunity focus groups (n = 7) and key informant interviews (n =26) to identify (i) important cultural and other difficult to value ecosys-tem service benefits likely affected by a hypothetical management sce-nario, and (ii) an appropriate payment vehicle. In this case, thehypothetical scenario was conceptualized as a general strengtheningof rules governing the use of natural resources within the LMMA, andspecifically included management measures that were familiar to therespondents, including a strict enforcement of a ban on destructive fish-ingmethods, expanding areas permanently closed to fishing, increasingthe number of octopus fishing reserves, and limiting the destruction ofmangroves and coral reefs. These preliminary interviews and focusgroups confirmed that villagers perceived direct linkages betweenthese strengthened management measures, the state of the coastal re-sources, and the future flow of ecosystem services, particularly fish pro-visioning, bequest, shoreline protection, and social cohesion.
Attributes and levels were initially developed during focus groups,andwere refined after several expert consultationswith local collabora-tors and key informants, and after a pre-test in multiple villages.All levels either reflected current conditions or experts' opinions on
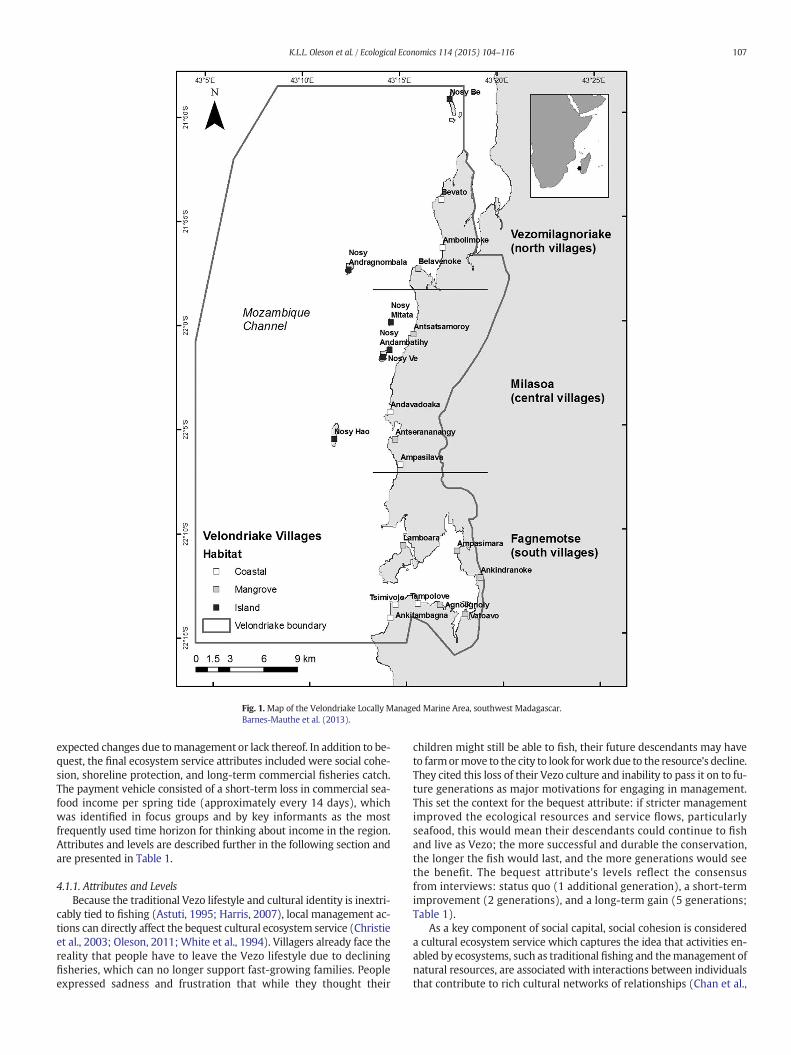
Fig. 1. Map of the Velondriake Locally Managed Marine Area, southwest Madagascar.Barnes-Mauthe et al. (2013).
107K.L.L. Oleson et al. / Ecological Economics 114 (2015) 104–116
expected changes due tomanagement or lack thereof. In addition to be-quest, the final ecosystem service attributes included were social cohe-sion, shoreline protection, and long-term commercial fisheries catch.The payment vehicle consisted of a short-term loss in commercial sea-food income per spring tide (approximately every 14 days), whichwas identified in focus groups and by key informants as the mostfrequently used time horizon for thinking about income in the region.Attributes and levels are described further in the following section andare presented in Table 1.
4.1.1. Attributes and LevelsBecause the traditional Vezo lifestyle and cultural identity is inextri-
cably tied to fishing (Astuti, 1995; Harris, 2007), local management ac-tions can directly affect the bequest cultural ecosystem service (Christieet al., 2003; Oleson, 2011; White et al., 1994). Villagers already face thereality that people have to leave the Vezo lifestyle due to decliningfisheries, which can no longer support fast-growing families. Peopleexpressed sadness and frustration that while they thought their
children might still be able to fish, their future descendants may haveto farmormove to the city to look forwork due to the resource's decline.They cited this loss of their Vezo culture and inability to pass it on to fu-ture generations as major motivations for engaging in management.This set the context for the bequest attribute: if stricter managementimproved the ecological resources and service flows, particularlyseafood, this would mean their descendants could continue to fishand live as Vezo; the more successful and durable the conservation,the longer the fish would last, and the more generations would seethe benefit. The bequest attribute's levels reflect the consensusfrom interviews: status quo (1 additional generation), a short-termimprovement (2 generations), and a long-term gain (5 generations;Table 1).
As a key component of social capital, social cohesion is considereda cultural ecosystem service which captures the idea that activities en-abled by ecosystems, such as traditional fishing and themanagement ofnatural resources, are associated with interactions between individualsthat contribute to rich cultural networks of relationships (Chan et al.,

Table 1Description of attributes and their levels. Currency is 2010 Malagasy Ariary (MGA).
Attribute Description Levelsa
Bequest Bequest of the Vezo fishing culture and lifestyle, captured as the number of future generationsable to live as Vezo
Low (status quo): 1 generationMedium: 2 generationsHigh: 5 generations
Social cohesion Inter-village collaboration, measured as the number of people from each village attendinginter-village meetings to participate in the management of the LMMA
Low (status quo): 2 people per villageMedium: 4 people per villageHigh: 6 people per village
Shoreline protection The ability of coral reefs and mangroves to act as storm barriers, captured as the frequency withwhich respondents need to repair their house due to storm damage
Low protection (status quo): 1× every 3 yearsMedium protection: 1× every 4 yearsHigh protection: 1× every 5 years
Commercial fisheries The prospective long-term gain in commercial seafood income, captured as the value of seafoodthat a household sells per spring tide from year 2 through year 10 after implementation of thehypothetical scenario
Status quo: MGA 30 k per tideb
Low gain: MGA 60 k per tideMedium gain: MGA 70 k per tideHigh gain: MGA 80 k per tide
Short-term income(payment vehicle)
The payment vehicle is represented by a short-term loss in commercial seafood income,captured as the value of seafood that a household sells per spring tide in the first year afterimplementation of the hypothetical scenario
Status quo: MGA 50 k per tideb
Low loss: MGA 25 k per tideMedium loss: MGA 15 k per tideHigh loss: MGA 5 k per tide
a The currency exchange rate in 2010 was USD 1 = MGA 2090.b These were not included as options in the experimental design because fisheries catch was expected to decline in the short-termwhether or not management action was taken (the
status quo catch was not sustainable), and catch was expected to increase by some degree in the long-term as a result of all management scenarios. Thus the status quo is presented herefor comparison purposes only.
2 Implementation of management measures was expected to negatively affect short-term seafood sales and positively affect long-term seafood sales. Since at least one man-agement measure would be implemented with certainty, the status quo for both short-term and long-term seafood sales was omitted from our experimental design; i.e., the at-tribute levels representing the status quo were not used to describe the management op-tions. Also note that subsistence fishing was not affected in our hypothetical scenario.
108 K.L.L. Oleson et al. / Ecological Economics 114 (2015) 104–116
2012a;MEA, 2005). These networks can contribute to successful collab-orative management of ecosystems by facilitating cooperation andcollaboration among stakeholders (Plummer and FitzGibbon, 2006;Pretty, 2003), yet can also potentially be augmented or eroded bymanagement initiatives (Barnes-Mauthe et al., 2014; Burke, 2010). InVelondriake, collaborative inter-village meetings are held periodicallyto discuss and agree on management measures and actions for theLMMA. Focus group discussants and key informants felt that thenumber of people from each village attending these meetings was agood reflection of social cohesion. They also expected social cohesionto be enhanced by improved management, with the justification thatdiscussing, agreeing on, implementing, and enforcing managementmeasureswould increase participation in inter-villagemeetings. Partic-ipation in community events, meetings, or organizations is indeed awell-established indicator of social cohesion (Berger-Schmitt, 2000;Chan et al., 2006; Rajulton et al., 2007). Thus, inter-village collaboration,measured as the number of people from each village attending inter-village meetings [low (status quo) = 2, medium = 4 or high = 6,Table 1] was selected to represent social cohesion. Focus group discus-sants, key informants, and local experts agreed that the levels werewithin the range for which constructive decision-making would stillbe possible.
Velondriake lies on the southwest coast of Madagascar, which isprone to frequent cyclones and tropical storms. Mangrove forests andcoral reefs comprise a large portion of Velondriake's coastal andmarinehabitat, acting as an important barrier to hazardous storm surge, yetthese ecosystems are increasingly threatened by overexploitation anddestructive extraction methods (Giri and Muhlhausen, 2008; Harris,2007, 2011). Improved management measures, such as enforcementof a ban on destructive fishing practices that damage the reef's structureand function and restrictions on dune and mangrove destruction, willincrease shoreline protection, a regulating ecosystem service, by im-proving the natural habitats' ability to dissipate wave and wind energy(Arkema et al., 2013). Vezo homes are constructed of reeds lashed tosmall poles lightly driven into sandy substrate, and are typically locatedjust above the high tide mark. In consultation with focus group discus-sants and key informants, shoreline protection was captured in ourDCE by the frequency with which respondents needed to repair theirhomes due to storm damage, which at the time of data collection wasabout once every three years. Thus, in the DCE a decrease in frequencyfrom the status quo represents an increase in shoreline protection[low (status quo) = once every three years, medium = once every4 years, and high=once every 5 years; Table 1], a range thatwas vetted
in focus groups.While no local data exist to directly link home damagesto the quality of the near shore environment, anecdotal evidence sug-gests that reefs, mangroves, and dunes provide important protection,and elsewhere linkages between coastal habitat and home damagehas been studied in detail (Badola and Hussain, 2005).
Commercial fisheries provide a key provisioning ecosystem servicewith important economic value (Barnes-Mauthe et al., 2013). Enhancedresource management rules have improved commercial fisheries out-comes in Velondriake and in other collaboratively managed marineareas (Christie et al., 2003; Cinner et al., 2006; Oleson, 2011; Oliveret al., 2015), which is the expectation in our hypothetical scenario aswell. In the DCE, commercial fisheries were captured by a prospectivelong-term gain in commercial seafood income, represented as thevalue of seafood that a household sells per spring tide [low = MGA60 k, medium = MGA 70 k and high = MGA 80 k; Table 1; MGA2090 = USD 1 in 2010] from year 2 through year 10 after implementa-tion of the hypothetical scenario.
Stricter management will require trading off short-term returns,which we represented by the willingness to forego some income overthe coming year to achieve future returns. While one year is likely tooshort to accrue ecological returns, we chose a short period to ensure itfit with local time horizons, which may be quite high (Astuti, 1995;Tucker, 2012). This attribute is captured as the value of seafood perspring tide that a household sells during the first year of implementa-tion of the hypothetical scenario, where a higher loss in income is repre-sented by a lower value per spring tide [low = MGA 25 k, medium =MGA 15 k, and high = MGA 5 k; Table 1].2
Choice experiments testing willingness to incur short-term costs forlong-term gains, often where both are expressed in monetary terms,have a long history in the energy and health literatures (Hausman,1979; Ida and Goto, 2009; Min et al., 2014). In this literature, long-term gains and short-term losses are treated as separate and indepen-dent attributes. We follow this approach and treat short-term lossesand long-term gains in commercial fisheries as independent attributesin both the indirect utility function and the statistical design underlyingthe DCE. This approach is supported by the results of our focus groups,
3 The DCEwas conducted in conjunction with a household survey as a part of a broaderinitiative, i.e., every household that participated in the household survey detailed inBarnes-Mauthe et al. (2013) also participated in the DCE.
4 77% of the total 258 respondents stated that they believed the DCE was either clear orvery clear, while 22% felt that it was somewhat clear and the remaining 1% did not believethat it was clear. Only responses from those that believed it was clear or very clear wereincluded in our analysis.
109K.L.L. Oleson et al. / Ecological Economics 114 (2015) 104–116
which indicated that the Vezo conceptualize incomes from future catchbeyond a year (the long-term gain) as distinct from the tangible reduc-tion in income over the coming year (the short-term cost), and had notrouble making trade-offs between the two. For these reasons, we con-sidered it appropriate to use the short-term loss in commercial fisheriesincome as a payment vehicle. The inclusion of separate and indepen-dent attributes for short-term and long-term incomes measured inmonetary terms allow us to compute an implicit discount rate for thesample population.
4.1.2. Discount RateA discount rate reflects the time preference of society or the rate at
which current and future income would be exchanged. Understandingdiscount rates can be critical for policy development in situationswhere stakeholders may be expected to give up short-term benefits forlong-term gains, and high discount rates among fishers have been citedas a key source of overexploitation (Sumaila and Walters, 2005; Tehet al., 2014; Teh, 2011). However, empirical evidence to estimate alocal discount rate is generally unavailable, undermining economic anal-yses and project appraisals. Estimating an implicit discount rate througha DCE therefore represents a novel way of obtaining this information,and has been employed to understand time preferences for decision-making in health (Ida and Goto, 2009; Louviere and Lancsar, 2009) andenergy (Hausman, 1979; Min et al., 2014), although we believe ours isthefirst to use it for ecosystem services.We estimate an implicit discountrate from the choice experiment results by computing the ratio of mar-ginal utilities for short-term and long-term incomes (see Eq. (5)).
4.1.3. DCE Statistical DesignThe DCE statistical design includes five attributes with three levels
each. A complete factorial design including all possible combinationsof attributes and levels would use 243 (3 ∗ 3 ∗ 3 ∗ 3 ∗ 3 = 243) choicetasks. From the 243 possible combinations, 36 optimal choice taskswith two alternative combinations of attributes and one fixed statusquo were generated in a series of six different choice set versions (sixchoice tasks per version) in SSIWeb 6.0 Sawtooth Software. To generateoptimal choice sets, the software employs an orthogonalmethod,whichdevelops fractional designs by selecting profiles that balance indepen-dent influences of all the attribute effects. A fixed choice task was in-cluded in all six versions to familiarize respondents with relativelysimple trade-offs, which gave us a total of 37 choice tasks. We testedthe statistical design using simulated data and found it to be efficientfor estimating statistically significant main effects for our sample size.Respondents were therefore asked to complete six consecutive choicetasks with three alternatives (options) including a status quo. Becauseliteracywas a concern in the LMMA, choice taskswere artistically repre-sented as pictograms developed in consultation with communitymem-bers (see Fig. 2). Pre-testing of the DCE resulted in adjustments in theordering of attributes on the choice cards due to a detected bias. Anexample of a final choice task can be found in Fig. 2.
4.1.4. Logistic Regression ModelBased on the model in Section 2, we tested a conditional logit re-
gression on the main effects to estimate attribute coefficients basedon the maximum likelihood procedures using Nlogit 4.0. The effectswere dummy coded to enable identification of non-linear effects,and omitted categories were the lowest levels for each attribute, gen-erally representing the status quo. We tested for interactions with per-sonal characteristics, attitudes and perceptions, and ecosystem servicecluster. We also tested for preference heterogeneity and the presenceof subgroups by employing random effects and latent class models.
4.2. DCE Validation
To validate our DCE results we employed a variety of mixedmethods.DCE participants were first asked to state their level of understanding of
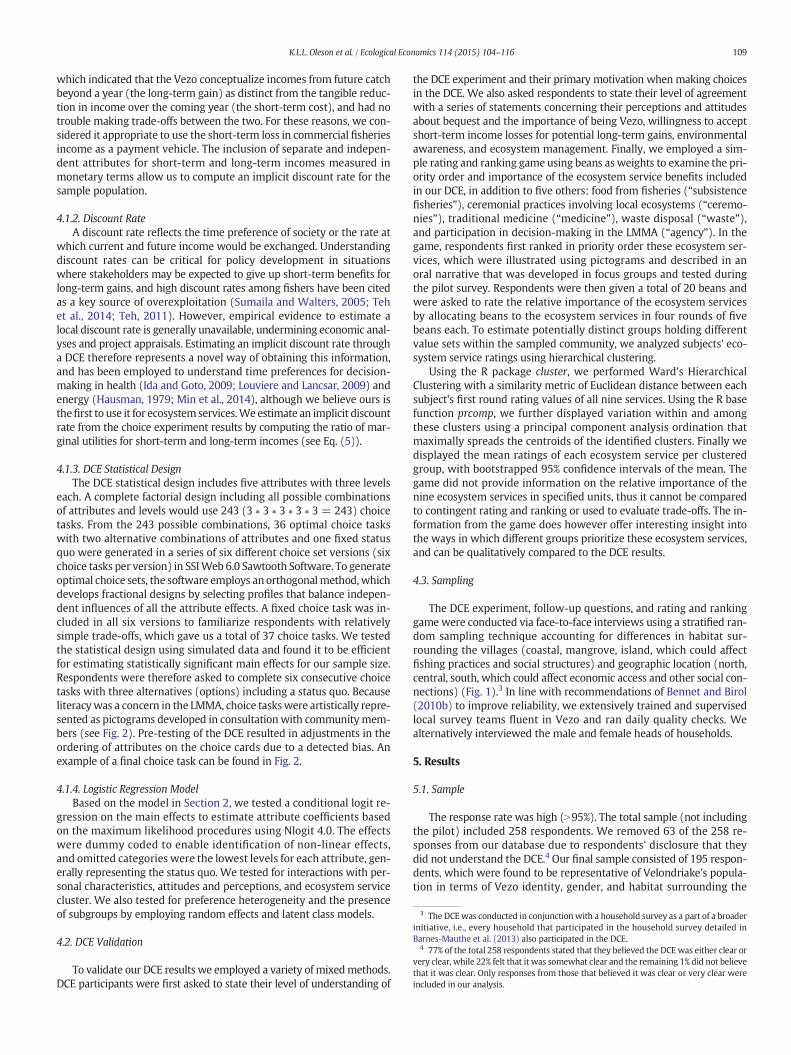
the DCE experiment and their primary motivation when making choicesin the DCE. We also asked respondents to state their level of agreementwith a series of statements concerning their perceptions and attitudesabout bequest and the importance of being Vezo, willingness to acceptshort-term income losses for potential long-term gains, environmentalawareness, and ecosystem management. Finally, we employed a sim-ple rating and ranking game using beans as weights to examine the pri-ority order and importance of the ecosystem service benefits includedin our DCE, in addition to five others: food from fisheries (“subsistencefisheries”), ceremonial practices involving local ecosystems (“ceremo-nies”), traditional medicine (“medicine”), waste disposal (“waste”),and participation in decision-making in the LMMA (“agency”). In thegame, respondents first ranked in priority order these ecosystem ser-vices, which were illustrated using pictograms and described in anoral narrative that was developed in focus groups and tested duringthe pilot survey. Respondents were then given a total of 20 beans andwere asked to rate the relative importance of the ecosystem servicesby allocating beans to the ecosystem services in four rounds of fivebeans each. To estimate potentially distinct groups holding differentvalue sets within the sampled community, we analyzed subjects' eco-system service ratings using hierarchical clustering.
Using the R package cluster, we performed Ward's HierarchicalClustering with a similarity metric of Euclidean distance between eachsubject's first round rating values of all nine services. Using the R basefunction prcomp, we further displayed variation within and amongthese clusters using a principal component analysis ordination thatmaximally spreads the centroids of the identified clusters. Finally wedisplayed the mean ratings of each ecosystem service per clusteredgroup, with bootstrapped 95% confidence intervals of the mean. Thegame did not provide information on the relative importance of thenine ecosystem services in specified units, thus it cannot be comparedto contingent rating and ranking or used to evaluate trade-offs. The in-formation from the game does however offer interesting insight intothe ways in which different groups prioritize these ecosystem services,and can be qualitatively compared to the DCE results.
4.3. Sampling
The DCE experiment, follow-up questions, and rating and rankinggame were conducted via face-to-face interviews using a stratified ran-dom sampling technique accounting for differences in habitat sur-rounding the villages (coastal, mangrove, island, which could affectfishing practices and social structures) and geographic location (north,central, south, which could affect economic access and other social con-nections) (Fig. 1).3 In line with recommendations of Bennet and Birol(2010b) to improve reliability, we extensively trained and supervisedlocal survey teams fluent in Vezo and ran daily quality checks. Wealternatively interviewed the male and female heads of households.
5. Results
5.1. Sample
The response rate was high (N95%). The total sample (not includingthe pilot) included 258 respondents. We removed 63 of the 258 re-sponses from our database due to respondents' disclosure that theydid not understand the DCE.4 Our final sample consisted of 195 respon-dents, which were found to be representative of Velondriake's popula-tion in terms of Vezo identity, gender, and habitat surrounding the

Fig. 2. Sample of choice task. The first row represents the short-term loss in income (and is the payment vehicle). The subsequent rows are social cohesion, shoreline protection, commer-cial fisheries (represented as long-term commercial fisheries income), and finally, bequest.
110 K.L.L. Oleson et al. / Ecological Economics 114 (2015) 104–116
villages (Table 2). Nearly all (97%) of the respondents, and respondents'ancestors, were Vezo. Respondents were 31 ± 12 years old on average,93% were fishers, and they had an average of 4 ± 3 dependents.
Table 2Sample statistics.
n % of sample % of populationa
Total sample 195 – –
DemographicsFemale 100 51% 52%Male 95 49% 48%Vezo 192 98% 97%
HabitatMangrove 82 42% 37%Coastal 58 30% 45%Island 55 28% 18%
a Population statistics are based on information in Barnes-Mauthe et al. (2013) and Oliveret al. (2015).
5.2. Model Estimation
The results of the conditional logit regression on themain effects arepresented in Table 3. Themodel fits the datawell, with a pseudo adjust-ed R2 of 0.32, which is within the acceptable range of 0.20–0.40 for dis-crete choice models (Hoyos, 2010; McFadden, 1974).5
The estimated coefficients on both bequest medium (2 generationsable to live as Vezo) and bequest high (5 generations able to live asVezo) are positive and statistically significant at the b1% level. In otherwords, there is a statistically significant, positive difference in preferencesbetween the omitted base-level bequest category (1 generation able tolive as Vezo) and bequest medium and high. Preferences for each addi-tional generation of Vezo suggest decreasing marginal utility (Table 3).Both commercial fisheries categories are statistically significant at the
5 Pseudo R2 values do not have the direct interpretation of linear regression R2 in termsof explained variance, but as a rule of thumb a pseudo R2 can be interpreted as roughlyequivalent to a linear regression R2 of double its value.
6 A more detailed analysis of social capital as an ecosystem service is provided byBarnes-Mauthe et al. (2014).
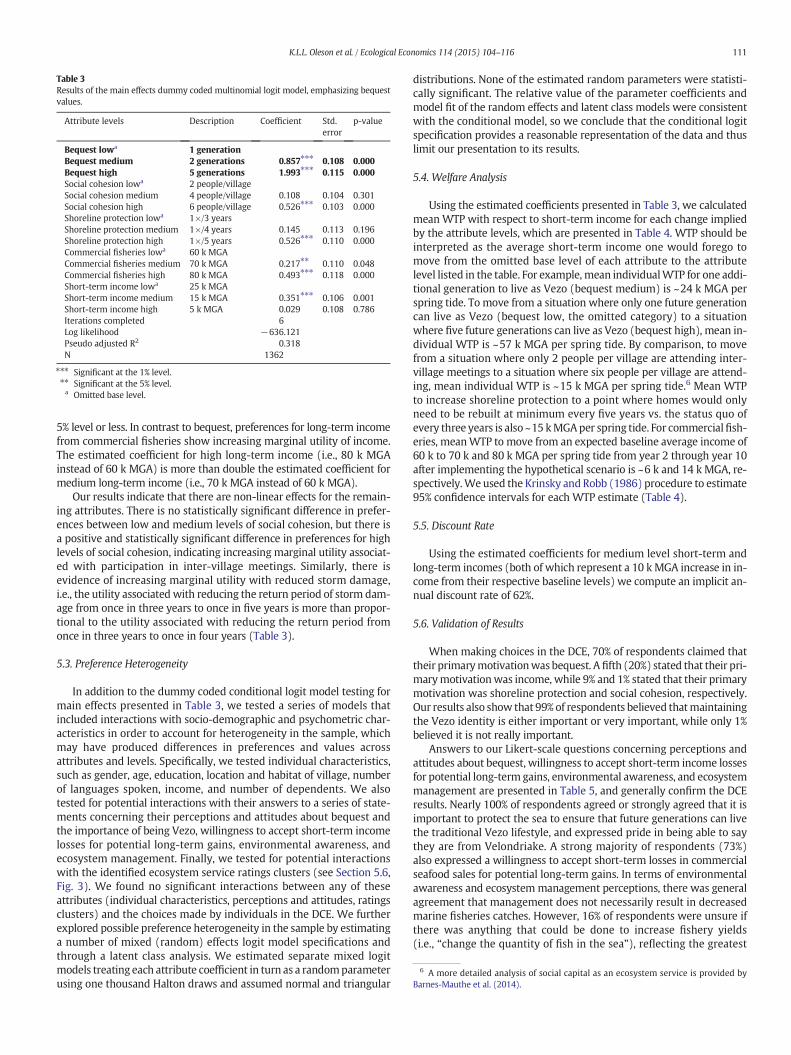
Table 3Results of the main effects dummy coded multinomial logit model, emphasizing bequestvalues.
Attribute levels Description Coefficient Std.error
p-value
Bequest lowa 1 generationBequest medium 2 generations 0.857⁎⁎⁎ 0.108 0.000Bequest high 5 generations 1.993⁎⁎⁎ 0.115 0.000Social cohesion lowa 2 people/villageSocial cohesion medium 4 people/village 0.108 0.104 0.301Social cohesion high 6 people/village 0.526⁎⁎⁎ 0.103 0.000Shoreline protection lowa 1×/3 yearsShoreline protection medium 1×/4 years 0.145 0.113 0.196Shoreline protection high 1×/5 years 0.526⁎⁎⁎ 0.110 0.000Commercial fisheries lowa 60 k MGACommercial fisheries medium 70 k MGA 0.217⁎⁎ 0.110 0.048Commercial fisheries high 80 k MGA 0.493⁎⁎⁎ 0.118 0.000Short-term income lowa 25 k MGAShort-term income medium 15 k MGA 0.351⁎⁎⁎ 0.106 0.001Short-term income high 5 k MGA 0.029 0.108 0.786Iterations completed 6Log likelihood −636.121Pseudo adjusted R2 0.318N 1362
⁎⁎⁎ Significant at the 1% level.⁎⁎ Significant at the 5% level.a Omitted base level.
111K.L.L. Oleson et al. / Ecological Economics 114 (2015) 104–116
5% level or less. In contrast to bequest, preferences for long-term incomefrom commercial fisheries show increasing marginal utility of income.The estimated coefficient for high long-term income (i.e., 80 k MGAinstead of 60 k MGA) is more than double the estimated coefficient formedium long-term income (i.e., 70 k MGA instead of 60 k MGA).
Our results indicate that there are non-linear effects for the remain-ing attributes. There is no statistically significant difference in prefer-ences between low and medium levels of social cohesion, but there isa positive and statistically significant difference in preferences for highlevels of social cohesion, indicating increasing marginal utility associat-ed with participation in inter-village meetings. Similarly, there isevidence of increasing marginal utility with reduced storm damage,i.e., the utility associated with reducing the return period of storm dam-age from once in three years to once in five years is more than propor-tional to the utility associated with reducing the return period fromonce in three years to once in four years (Table 3).
5.3. Preference Heterogeneity
In addition to the dummy coded conditional logit model testing formain effects presented in Table 3, we tested a series of models thatincluded interactions with socio-demographic and psychometric char-acteristics in order to account for heterogeneity in the sample, whichmay have produced differences in preferences and values acrossattributes and levels. Specifically, we tested individual characteristics,such as gender, age, education, location and habitat of village, numberof languages spoken, income, and number of dependents. We alsotested for potential interactions with their answers to a series of state-ments concerning their perceptions and attitudes about bequest andthe importance of being Vezo, willingness to accept short-term incomelosses for potential long-term gains, environmental awareness, andecosystem management. Finally, we tested for potential interactionswith the identified ecosystem service ratings clusters (see Section 5.6,Fig. 3). We found no significant interactions between any of theseattributes (individual characteristics, perceptions and attitudes, ratingsclusters) and the choices made by individuals in the DCE. We furtherexplored possible preference heterogeneity in the sample by estimatinga number of mixed (random) effects logit model specifications andthrough a latent class analysis. We estimated separate mixed logitmodels treating each attribute coefficient in turn as a randomparameterusing one thousand Halton draws and assumed normal and triangular
distributions. None of the estimated random parameters were statisti-cally significant. The relative value of the parameter coefficients andmodel fit of the random effects and latent class models were consistentwith the conditional model, so we conclude that the conditional logitspecification provides a reasonable representation of the data and thuslimit our presentation to its results.
5.4. Welfare Analysis
Using the estimated coefficients presented in Table 3, we calculatedmean WTP with respect to short-term income for each change impliedby the attribute levels, which are presented in Table 4. WTP should beinterpreted as the average short-term income one would forego tomove from the omitted base level of each attribute to the attributelevel listed in the table. For example, mean individualWTP for one addi-tional generation to live as Vezo (bequest medium) is ~24 k MGA perspring tide. To move from a situation where only one future generationcan live as Vezo (bequest low, the omitted category) to a situationwhere five future generations can live as Vezo (bequest high), mean in-dividual WTP is ~57 k MGA per spring tide. By comparison, to movefrom a situation where only 2 people per village are attending inter-village meetings to a situation where six people per village are attend-ing, mean individual WTP is ~15 k MGA per spring tide.6 Mean WTPto increase shoreline protection to a point where homes would onlyneed to be rebuilt at minimum every five years vs. the status quo ofevery three years is also ~15 kMGAper spring tide. For commercialfish-eries, meanWTP to move from an expected baseline average income of60 k to 70 k and 80 k MGA per spring tide from year 2 through year 10after implementing the hypothetical scenario is ~6 k and 14 k MGA, re-spectively.We used the Krinsky and Robb (1986) procedure to estimate95% confidence intervals for each WTP estimate (Table 4).
5.5. Discount Rate
Using the estimated coefficients for medium level short-term andlong-term incomes (both of which represent a 10 k MGA increase in in-come from their respective baseline levels) we compute an implicit an-nual discount rate of 62%.
5.6. Validation of Results
When making choices in the DCE, 70% of respondents claimed thattheir primarymotivationwasbequest. A fifth (20%) stated that their pri-marymotivationwas income, while 9% and 1% stated that their primarymotivation was shoreline protection and social cohesion, respectively.Our results also show that 99% of respondents believed thatmaintainingthe Vezo identity is either important or very important, while only 1%believed it is not really important.
Answers to our Likert-scale questions concerning perceptions andattitudes about bequest, willingness to accept short-term income lossesfor potential long-term gains, environmental awareness, and ecosystemmanagement are presented in Table 5, and generally confirm the DCEresults. Nearly 100% of respondents agreed or strongly agreed that it isimportant to protect the sea to ensure that future generations can livethe traditional Vezo lifestyle, and expressed pride in being able to saythey are from Velondriake. A strong majority of respondents (73%)also expressed a willingness to accept short-term losses in commercialseafood sales for potential long-term gains. In terms of environmentalawareness and ecosystem management perceptions, there was generalagreement that management does not necessarily result in decreasedmarine fisheries catches. However, 16% of respondents were unsure ifthere was anything that could be done to increase fishery yields(i.e., “change the quantity of fish in the sea”), reflecting the greatest
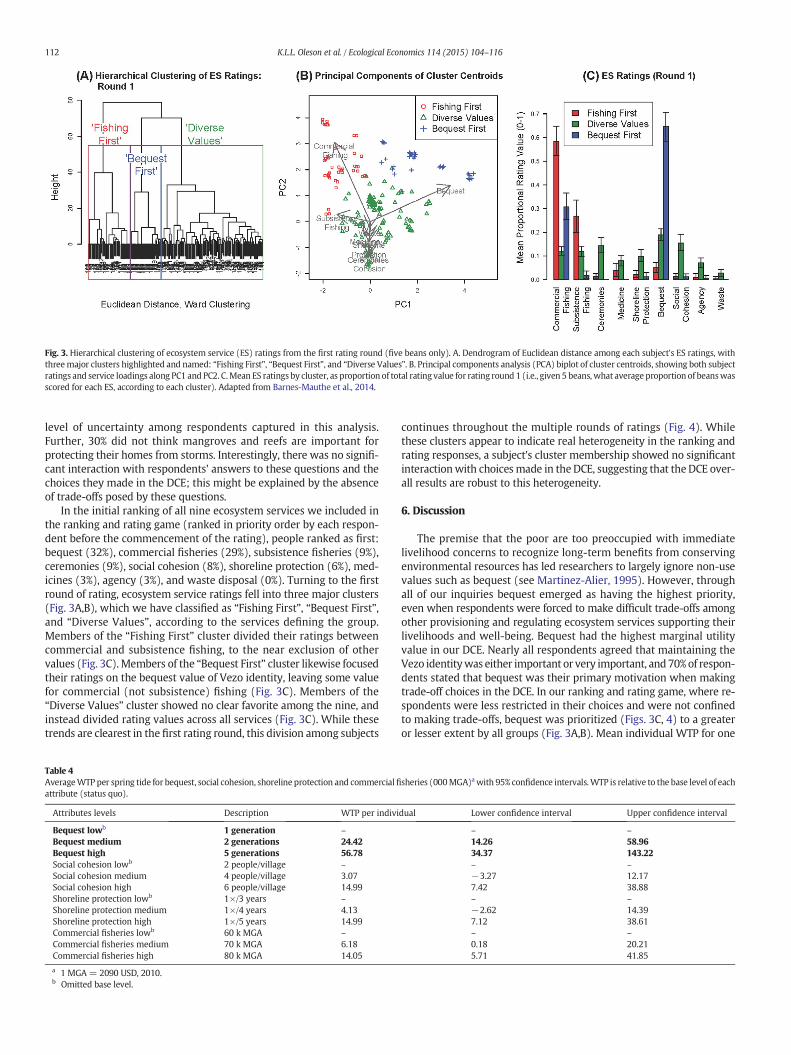
Fig. 3. Hierarchical clustering of ecosystem service (ES) ratings from the first rating round (five beans only). A. Dendrogram of Euclidean distance among each subject's ES ratings, withthreemajor clusters highlighted and named: “Fishing First”, “Bequest First”, and “Diverse Values”. B. Principal components analysis (PCA) biplot of cluster centroids, showing both subjectratings and service loadings along PC1 and PC2. C.Mean ES ratings by cluster, as proportion of total rating value for rating round 1 (i.e., given 5 beans,what average proportion of beanswasscored for each ES, according to each cluster). Adapted from Barnes-Mauthe et al., 2014.
112 K.L.L. Oleson et al. / Ecological Economics 114 (2015) 104–116
level of uncertainty among respondents captured in this analysis.Further, 30% did not think mangroves and reefs are important forprotecting their homes from storms. Interestingly, there was no signifi-cant interaction with respondents' answers to these questions and thechoices they made in the DCE; this might be explained by the absenceof trade-offs posed by these questions.
In the initial ranking of all nine ecosystem services we included inthe ranking and rating game (ranked in priority order by each respon-dent before the commencement of the rating), people ranked as first:bequest (32%), commercial fisheries (29%), subsistence fisheries (9%),ceremonies (9%), social cohesion (8%), shoreline protection (6%), med-icines (3%), agency (3%), and waste disposal (0%). Turning to the firstround of rating, ecosystem service ratings fell into three major clusters(Fig. 3A,B), which we have classified as “Fishing First”, “Bequest First”,and “Diverse Values”, according to the services defining the group.Members of the “Fishing First” cluster divided their ratings betweencommercial and subsistence fishing, to the near exclusion of othervalues (Fig. 3C).Members of the “Bequest First” cluster likewise focusedtheir ratings on the bequest value of Vezo identity, leaving some valuefor commercial (not subsistence) fishing (Fig. 3C). Members of the“Diverse Values” cluster showed no clear favorite among the nine, andinstead divided rating values across all services (Fig. 3C). While thesetrends are clearest in the first rating round, this division among subjects
Table 4AverageWTP per spring tide for bequest, social cohesion, shoreline protection and commercialfiattribute (status quo).
Attributes levels Description WTP per indivi
Bequest lowb 1 generation –
Bequest medium 2 generations 24.42Bequest high 5 generations 56.78Social cohesion lowb 2 people/village –
Social cohesion medium 4 people/village 3.07Social cohesion high 6 people/village 14.99Shoreline protection lowb 1×/3 years –
Shoreline protection medium 1×/4 years 4.13Shoreline protection high 1×/5 years 14.99Commercial fisheries lowb 60 k MGA –
Commercial fisheries medium 70 k MGA 6.18Commercial fisheries high 80 k MGA 14.05
a 1 MGA = 2090 USD, 2010.b Omitted base level.
continues throughout the multiple rounds of ratings (Fig. 4). Whilethese clusters appear to indicate real heterogeneity in the ranking andrating responses, a subject's cluster membership showed no significantinteractionwith choicesmade in the DCE, suggesting that the DCE over-all results are robust to this heterogeneity.
6. Discussion
The premise that the poor are too preoccupied with immediatelivelihood concerns to recognize long-term benefits from conservingenvironmental resources has led researchers to largely ignore non-usevalues such as bequest (see Martinez-Alier, 1995). However, throughall of our inquiries bequest emerged as having the highest priority,even when respondents were forced to make difficult trade-offs amongother provisioning and regulating ecosystem services supporting theirlivelihoods and well-being. Bequest had the highest marginal utilityvalue in our DCE. Nearly all respondents agreed that maintaining theVezo identitywas either important or very important, and70%of respon-dents stated that bequest was their primary motivation when makingtrade-off choices in the DCE. In our ranking and rating game, where re-spondents were less restricted in their choices and were not confinedto making trade-offs, bequest was prioritized (Figs. 3C, 4) to a greateror lesser extent by all groups (Fig. 3A,B). Mean individual WTP for one
sheries (000MGA)awith 95% confidence intervals.WTP is relative to the base level of each
dual Lower confidence interval Upper confidence interval
– –
14.26 58.9634.37 143.22– –
−3.27 12.177.42 38.88– –
−2.62 14.397.12 38.61– –
0.18 20.215.71 41.85
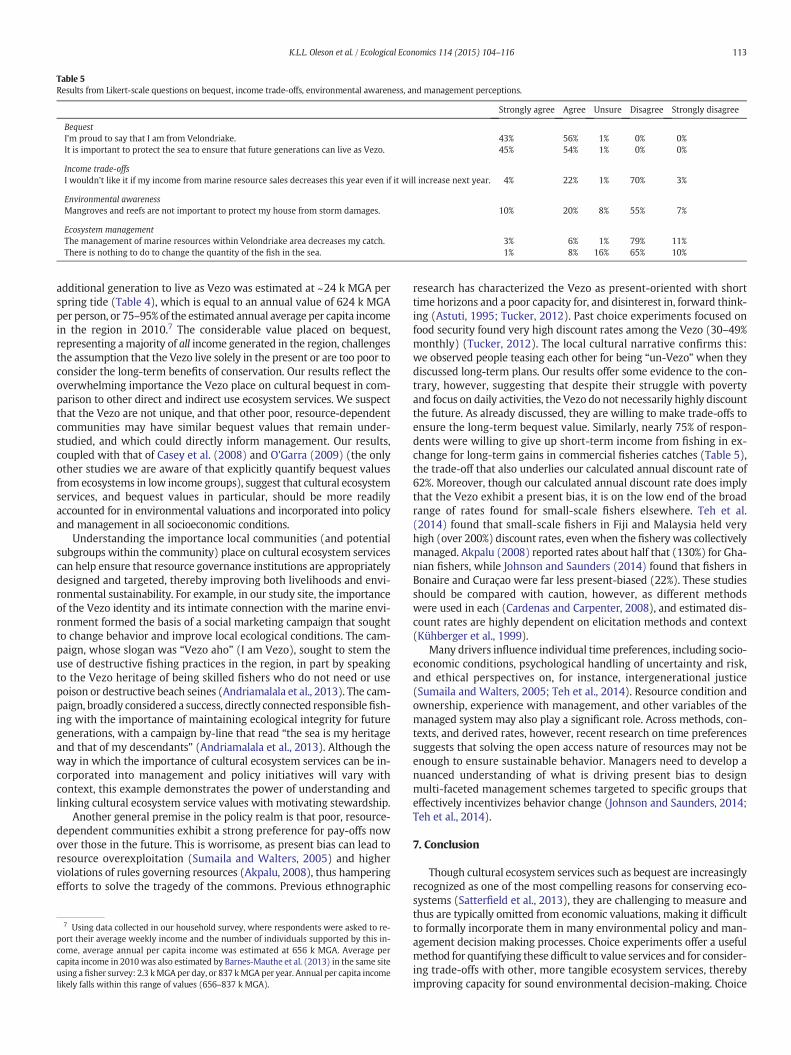
Table 5Results from Likert-scale questions on bequest, income trade-offs, environmental awareness, and management perceptions.
Strongly agree Agree Unsure Disagree Strongly disagree
BequestI'm proud to say that I am from Velondriake. 43% 56% 1% 0% 0%It is important to protect the sea to ensure that future generations can live as Vezo. 45% 54% 1% 0% 0%
Income trade-offsI wouldn't like it if my income from marine resource sales decreases this year even if it will increase next year. 4% 22% 1% 70% 3%
Environmental awarenessMangroves and reefs are not important to protect my house from storm damages. 10% 20% 8% 55% 7%
Ecosystem managementThe management of marine resources within Velondriake area decreases my catch. 3% 6% 1% 79% 11%There is nothing to do to change the quantity of the fish in the sea. 1% 8% 16% 65% 10%
113K.L.L. Oleson et al. / Ecological Economics 114 (2015) 104–116
additional generation to live as Vezo was estimated at ~24 k MGA perspring tide (Table 4), which is equal to an annual value of 624 k MGAper person, or 75–95% of the estimated annual average per capita incomein the region in 2010.7 The considerable value placed on bequest,representing amajority of all income generated in the region, challengesthe assumption that the Vezo live solely in the present or are too poor toconsider the long-term benefits of conservation. Our results reflect theoverwhelming importance the Vezo place on cultural bequest in com-parison to other direct and indirect use ecosystem services. We suspectthat the Vezo are not unique, and that other poor, resource-dependentcommunities may have similar bequest values that remain under-studied, and which could directly inform management. Our results,coupled with that of Casey et al. (2008) and O'Garra (2009) (the onlyother studies we are aware of that explicitly quantify bequest valuesfrom ecosystems in low income groups), suggest that cultural ecosystemservices, and bequest values in particular, should be more readilyaccounted for in environmental valuations and incorporated into policyand management in all socioeconomic conditions.
Understanding the importance local communities (and potentialsubgroups within the community) place on cultural ecosystem servicescan help ensure that resource governance institutions are appropriatelydesigned and targeted, thereby improving both livelihoods and envi-ronmental sustainability. For example, in our study site, the importanceof the Vezo identity and its intimate connection with the marine envi-ronment formed the basis of a social marketing campaign that soughtto change behavior and improve local ecological conditions. The cam-paign, whose slogan was “Vezo aho” (I am Vezo), sought to stem theuse of destructive fishing practices in the region, in part by speakingto the Vezo heritage of being skilled fishers who do not need or usepoison or destructive beach seines (Andriamalala et al., 2013). The cam-paign, broadly considered a success, directly connected responsiblefish-ing with the importance of maintaining ecological integrity for futuregenerations, with a campaign by-line that read “the sea is my heritageand that of my descendants” (Andriamalala et al., 2013). Although theway in which the importance of cultural ecosystem services can be in-corporated into management and policy initiatives will vary withcontext, this example demonstrates the power of understanding andlinking cultural ecosystem service values with motivating stewardship.
Another general premise in the policy realm is that poor, resource-dependent communities exhibit a strong preference for pay-offs nowover those in the future. This is worrisome, as present bias can lead toresource overexploitation (Sumaila and Walters, 2005) and higherviolations of rules governing resources (Akpalu, 2008), thus hamperingefforts to solve the tragedy of the commons. Previous ethnographic
7 Using data collected in our household survey, where respondents were asked to re-port their average weekly income and the number of individuals supported by this in-come, average annual per capita income was estimated at 656 k MGA. Average percapita income in 2010 was also estimated by Barnes-Mauthe et al. (2013) in the same siteusing a fisher survey: 2.3 kMGAper day, or 837 kMGA per year. Annual per capita incomelikely falls within this range of values (656–837 k MGA).
research has characterized the Vezo as present-oriented with shorttime horizons and a poor capacity for, and disinterest in, forward think-ing (Astuti, 1995; Tucker, 2012). Past choice experiments focused onfood security found very high discount rates among the Vezo (30–49%monthly) (Tucker, 2012). The local cultural narrative confirms this:we observed people teasing each other for being “un-Vezo” when theydiscussed long-term plans. Our results offer some evidence to the con-trary, however, suggesting that despite their struggle with povertyand focus on daily activities, the Vezo do not necessarily highly discountthe future. As already discussed, they are willing to make trade-offs toensure the long-term bequest value. Similarly, nearly 75% of respon-dents were willing to give up short-term income from fishing in ex-change for long-term gains in commercial fisheries catches (Table 5),the trade-off that also underlies our calculated annual discount rate of62%. Moreover, though our calculated annual discount rate does implythat the Vezo exhibit a present bias, it is on the low end of the broadrange of rates found for small-scale fishers elsewhere. Teh et al.(2014) found that small-scale fishers in Fiji and Malaysia held veryhigh (over 200%) discount rates, even when the fishery was collectivelymanaged. Akpalu (2008) reported rates about half that (130%) for Gha-nian fishers, while Johnson and Saunders (2014) found that fishers inBonaire and Curaçao were far less present-biased (22%). These studiesshould be compared with caution, however, as different methodswere used in each (Cardenas and Carpenter, 2008), and estimated dis-count rates are highly dependent on elicitation methods and context(Kühberger et al., 1999).
Many drivers influence individual time preferences, including socio-economic conditions, psychological handling of uncertainty and risk,and ethical perspectives on, for instance, intergenerational justice(Sumaila and Walters, 2005; Teh et al., 2014). Resource condition andownership, experience with management, and other variables of themanaged system may also play a significant role. Across methods, con-texts, and derived rates, however, recent research on time preferencessuggests that solving the open access nature of resources may not beenough to ensure sustainable behavior. Managers need to develop anuanced understanding of what is driving present bias to designmulti-faceted management schemes targeted to specific groups thateffectively incentivizes behavior change (Johnson and Saunders, 2014;Teh et al., 2014).
7. Conclusion
Though cultural ecosystem services such as bequest are increasinglyrecognized as one of the most compelling reasons for conserving eco-systems (Satterfield et al., 2013), they are challenging to measure andthus are typically omitted from economic valuations, making it difficultto formally incorporate them in many environmental policy and man-agement decision making processes. Choice experiments offer a usefulmethod for quantifying these difficult to value services and for consider-ing trade-offs with other, more tangible ecosystem services, therebyimproving capacity for sound environmental decision-making. Choice
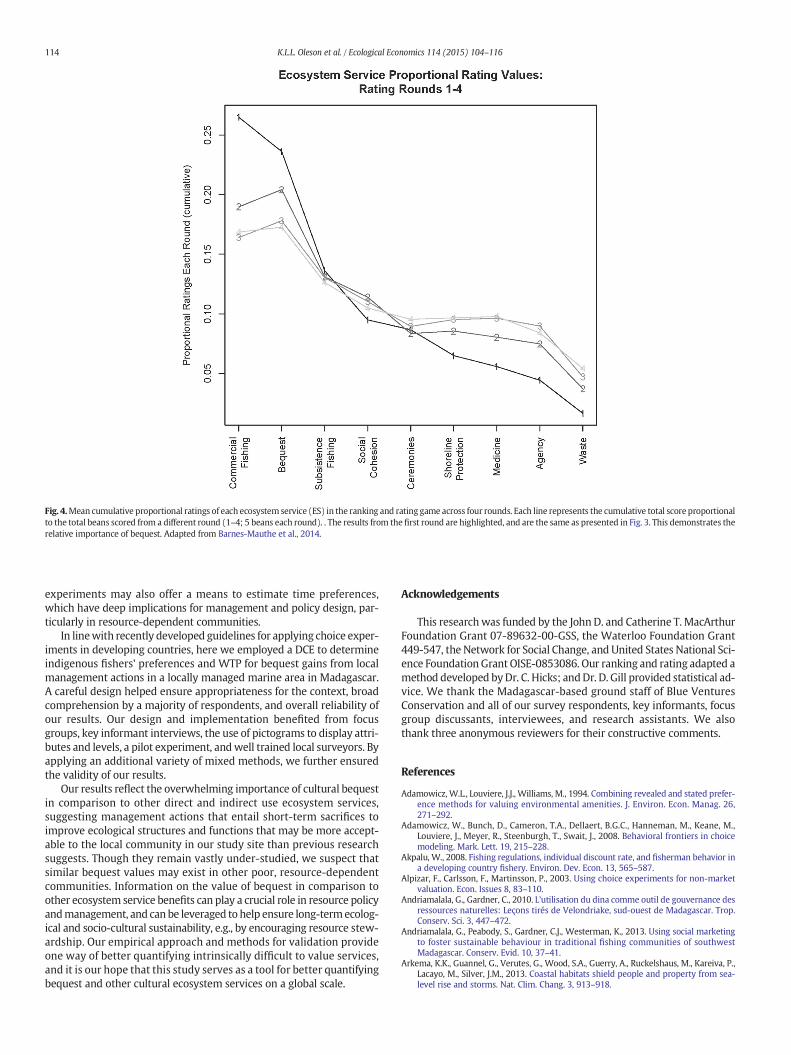
Fig. 4.Mean cumulative proportional ratings of each ecosystem service (ES) in the ranking and rating game across four rounds. Each line represents the cumulative total score proportionalto the total beans scored from a different round (1–4; 5 beans each round). . The results from thefirst round are highlighted, and are the same as presented in Fig. 3. This demonstrates therelative importance of bequest. Adapted from Barnes-Mauthe et al., 2014.
114 K.L.L. Oleson et al. / Ecological Economics 114 (2015) 104–116
experiments may also offer a means to estimate time preferences,which have deep implications for management and policy design, par-ticularly in resource-dependent communities.
In linewith recently developed guidelines for applying choice exper-iments in developing countries, here we employed a DCE to determineindigenous fishers' preferences and WTP for bequest gains from localmanagement actions in a locally managed marine area in Madagascar.A careful design helped ensure appropriateness for the context, broadcomprehension by a majority of respondents, and overall reliability ofour results. Our design and implementation benefited from focusgroups, key informant interviews, the use of pictograms to display attri-butes and levels, a pilot experiment, andwell trained local surveyors. Byapplying an additional variety of mixed methods, we further ensuredthe validity of our results.
Our results reflect the overwhelming importance of cultural bequestin comparison to other direct and indirect use ecosystem services,suggesting management actions that entail short-term sacrifices toimprove ecological structures and functions that may be more accept-able to the local community in our study site than previous researchsuggests. Though they remain vastly under-studied, we suspect thatsimilar bequest values may exist in other poor, resource-dependentcommunities. Information on the value of bequest in comparison toother ecosystem service benefits can play a crucial role in resource policyandmanagement, and can be leveraged to help ensure long-termecolog-ical and socio-cultural sustainability, e.g., by encouraging resource stew-ardship. Our empirical approach and methods for validation provideone way of better quantifying intrinsically difficult to value services,and it is our hope that this study serves as a tool for better quantifyingbequest and other cultural ecosystem services on a global scale.
Acknowledgements
This researchwas funded by the John D. and Catherine T. MacArthurFoundation Grant 07-89632-00-GSS, the Waterloo Foundation Grant449-547, the Network for Social Change, and United States National Sci-ence Foundation Grant OISE-0853086. Our ranking and rating adapted amethod developed byDr. C. Hicks; andDr. D. Gill provided statistical ad-vice. We thank the Madagascar-based ground staff of Blue VenturesConservation and all of our survey respondents, key informants, focusgroup discussants, interviewees, and research assistants. We alsothank three anonymous reviewers for their constructive comments.
References
Adamowicz, W.L., Louviere, J.J., Williams, M., 1994. Combining revealed and stated prefer-ence methods for valuing environmental amenities. J. Environ. Econ. Manag. 26,271–292.
Adamowicz, W., Bunch, D., Cameron, T.A., Dellaert, B.G.C., Hanneman, M., Keane, M.,Louviere, J., Meyer, R., Steenburgh, T., Swait, J., 2008. Behavioral frontiers in choicemodeling. Mark. Lett. 19, 215–228.
Akpalu, W., 2008. Fishing regulations, individual discount rate, and fisherman behavior ina developing country fishery. Environ. Dev. Econ. 13, 565–587.
Alpizar, F., Carlsson, F., Martinsson, P., 2003. Using choice experiments for non-marketvaluation. Econ. Issues 8, 83–110.
Andriamalala, G., Gardner, C., 2010. L'utilisation du dina comme outil de gouvernance desressources naturelles: Leçons tirés de Velondriake, sud-ouest de Madagascar. Trop.Conserv. Sci. 3, 447–472.
Andriamalala, G., Peabody, S., Gardner, C.J., Westerman, K., 2013. Using social marketingto foster sustainable behaviour in traditional fishing communities of southwestMadagascar. Conserv. Evid. 10, 37–41.
Arkema, K.K., Guannel, G., Verutes, G., Wood, S.A., Guerry, A., Ruckelshaus, M., Kareiva, P.,Lacayo, M., Silver, J.M., 2013. Coastal habitats shield people and property from sea-level rise and storms. Nat. Clim. Chang. 3, 913–918.

115K.L.L. Oleson et al. / Ecological Economics 114 (2015) 104–116
Astuti, R., 1995. “The Vezo are not a kind of people”: identity, difference, and “ethnicity”among fishing people of western Madagascar. Am. Ethnol. 22, 464–482.
Ateweberhan, M., McClanahan, T.R., 2010. Relationship between historical sea-surfacetemperature variability and climate change-induced coral mortality in the westernIndian Ocean. Mar. Pollut. Bull. 60, 964–970.
Badola, R., Hussain, S., 2005. Valuing ecosystem functions: an empirical study on thestorm protection function of Bhitarkanika mangrove ecosystem, India. Environ.Conserv. 32, 85–92.
Barnes-Mauthe, M., Oleson, K.L.L., Zafindrasilivonona, B., 2013. The total economic valueof small-scale fisheries with a characterization of post-landing trends: an applicationin Madagascar with global relevance. Fish. Res. 147, 175–185.
Barnes-Mauthe, M., Oleson, K.L., Brander, L.M., Zafindrasilivonona, B., Oliver, T.A., vanBeukering, P., 2014. Social capital as an ecosystem service: evidence from a locallymanaged marine area. Ecosyst. Serv. 147, 175–185.
Bennet, J., Birol, E., 2010a. Choice Experiments in Developing Countries: Implementation,Challenges and Policy Implications. Edward Elgar Publishing, Cheltenham, UK.
Bennet, J., Birol, E., 2010b. Concluding remarks and recommendations for implementingchoice experiments in developing countries. In: Bennet, J., Birol, E. (Eds.), ChoiceExperiments in Developing Countries; Implementation, Challenges and Policy Impli-cations. Edward Elgar Publishing, Cheltenham, UK, pp. 297–306.
Bennet, J., Blamey, R., 2001. The Choice Modeling Approach to Environmental Valuation,New Horizons in Environmental Economics. Edward Elgar Publishing Limited,Cheltenham, UK.
Bennett, E.M., Peterson, G.D., Gordon, L.J., 2009. Understanding relationships among mul-tiple ecosystem services. Ecol. Lett. 12, 1394–1404.
Berger-Schmitt, R., 2000. Social cohesion as an aspect of the quality of societies: conceptand measurement. ZUMA.
Bergstrom, J.C., Stoll, J.R., Titre, J.P., Wright, V.L., 1990. Economic value of wetlands-basedrecreation. Ecol. Econ. 2, 129–147.
Boxall, P.C., Adamowicz, W.L., Swait, J., Williams, M., Louviere, J.J., 1996. A comparison ofstated preference methods for environmental valuation. Ecol. Econ. 18, 243–253.
Burke, C.L., 2010. When the fishing's gone: understanding how fisheries managementaffects the informal economy and social capital in the Nuxalk Nation, ResourceManagement and Environmental Studies. University of British Columbia, Vancouver,BC, Canada, p. 208.
Cardenas, J.C., Carpenter, J., 2008. Behavioural development economics: lessons from fieldlabs in the developing world. J. Dev. Stud. 44, 311–338.
Casey, J.F., Kahn, J.R., Rivas, A.A., 2008. Willingness to accept compensation for the envi-ronmental risks of oil transport on the Amazon: a choice modeling experiment.Ecol. Econ. 67, 552–559.
Chan, J., To, H.-P., Chan, E., 2006. Reconsidering social cohesion: developing a definitionand analytical framework for empirical research. Soc. Indic. Res. 75, 273–302.
Chan, K.M.A., Goldstein, J., Satterfield, T., Hannahs, N., Kikiloi, K., Naidoo, R., Vadeboncoeur,N., Woodside, U., 2011. Cultural services and non-use values. In: Kareiva, P., Tallis, H.,Ricketts, T.H., Daily, G.C., Polasky, S. (Eds.), Natural Capital: Theory and Practice ofMapping Ecosystem Services. Oxford University Press, Oxford, UK, pp. 206–228.
Chan, K.M.A., Guerry, A.D., Balvanera, P., Klain, S., Satterfield, T., Basurto, X., Bostrom, A.,Chuenpagdee, R., Gould, R., Halpern, B.S., Levine, J., Norton, B., Ruckelshaus, M.,Russell, R., Tam, J., 2012a. Where are cultural and social in ecosystem services? Aframework for constructive engagement. Bioscience 62, 744–756.
Chan, K.M.A., Satterfield, T., Goldstein, J., 2012b. Rethinking ecosystem services to betteraddress and navigate cultural values. Ecol. Econ. 74, 8–18.
Cheung, W.W.L., Lam, V.W.Y., Sarmiento, J.L., Kearney, K., Watson, R., Zeller, D., Pauly, D.,2010. Large-scale redistribution of maximum fisheries catch potential in the globalocean under climate change. Glob. Chang. Biol. 16, 24–35.
Cheung, W.W.L., Sarmiento, J.L., Dunne, J., Frölicher, T.L., Lam, V.W.Y., Deng Palomares,M.L., Watson, R., Pauly, D., 2012. Shrinking of fishes exacerbates impacts of globalocean changes on marine ecosystems. Nat. Clim. Chang. 3, 254–258.
Christie, P., Buhat, D., Garces, L.R., White, A.T., 2003. The challenges and rewards ofcommunity-based coastal resources management: San Salvador Island, Philippines.In: Brechin, S.R., Wilshusen, P.R., Frotwangler, C.L., West, P.C. (Eds.), ContestedNature — Promoting International Biodiversity Conservation with Social Justice inthe Twenty-first Century. SUNY Press, Albany, NY, USA, pp. 231–249.
Christie, M., Fazey, I., Cooper, R., Hyde, T., Kenter, J.O., 2012. An evaluation ofmonetary andnon-monetary techniques for assessing the importance of biodiversity and ecosystemservices to people in countries with developing economies. Ecol. Econ. 83, 69–80.
Chuenpagdee, R., Knetsch, J.L., Brown, T.C., 2001. Coastal management using public judg-ments, importance scales, and predetermined schedule. Coast. Manag. 29, 253–270.
Cinner, J., Marnane, M.J., Mcclanahan, T.R., Almany, G.R., 2006. Periodic closures as adap-tive coral reef management in the Indo-Pacific. Ecol. Soc. 11, 31.
Cisneros-Montemayor, A.M., Sumaila, U.R., 2010. A global estimate of benefits fromecosystem-based marine recreation: potential impacts and implications for manage-ment. J. Bioecon. 12, 245–268.
Cisneros-Montemayor, A.M., Barnes-Mauthe, M., Al-Abdulrazzak, D., Navarro-Holm, E.,Sumaila, U.R., 2013. Global economic value of shark ecotourism: implications for con-servation. Oryx 47, 381–388.
Crowards, T., 1995. Nonuse values and economic valuation of the environment: a review.CSERGE Working Paper GEC 95–26. Centre for Social and Economic Research on theGlobal Environment, University of East Anglia and University College London,London, UK, p. 49.
Garibaldi, A., Turner, N., 2004. Cultural keystone species: implications for ecologicalconservation and restoration. Ecol. Soc. 9, 1.
Giri, C., Muhlhausen, J., 2008. Mangrove forest distributions and dynamics in Madagascar(1975–2005). Sensors 8, 2104–2117.
Grêt-Regamey, A., Bebi, P., Bishop, I.D., Schmid, W.A., 2008. Linking GIS-based models tovalue ecosystem services in an Alpine region. J. Environ. Manag. 89, 197–208.
Hanemann, W.M., 1984. Welfare evaluations in contingent valuation experiments withdiscrete responses. Am. J. Agric. Econ. 66, 332–341.
Hanley, N., Wright, R.E., Adamowicz, V.I.C., 1998. Using choice experiments to value theenvironment. Environ. Resour. Econ. 11, 413–428.
Harris, A.R., 2007. “To live with the sea”. Development of the Velondriake community-managed protected area network, southwest Madagascar. Madagascar Conserv.Dev. 2, 43–49.
Harris, A.R., 2011. Out of sight but no longer out of mind: a climate of change for marineconservation in Madagascar. Madagascar Conserv. Dev. 6, 7–14.
Hausman, J.A., 1979. Individual discount rates and the purchase and utilization of energy-using durables. Bell J. Econ. 10, 33–54.
Hernández-Morcillo, M., Plieninger, T., Bieling, C., 2013. An empirical review of culturalecosystem service indicators. Ecol. Indic. 29, 434–444.
Hicks, C.C., Mcclanahan, T.R., Cinner, J.E., Hills, J.M., 2009. Trade-offs in values assigned toecological goods and services associated with different coral reef managementstrategies. Ecol. Soc. 14, 10.
Hoyos, D., 2010. The state of the art of environmental valuation with discrete choiceexperiments. Ecol. Econ. 69, 1595–1603.
Ida, T., Goto, R., 2009. Interdependency among addictive behaviours and time/risk prefer-ences: discrete choice model analysis of smoking, drinking, and gambling. J. Econ.Psychol. 30, 608–621.
Johnson, A.E., Saunders, D.K., 2014. Time preferences and the management of coral reeffisheries. Ecol. Econ. 100, 130–139.
Krinsky, I., Robb, L.A., 1986. On approximating the statistical properties of elasticities. Rev.Econ. Stat. 68, 715–719.
Krutilla, J.V., 1967. Conservation reconsidered. Am. Econ. Rev. 57, 777–786.Kühberger, A., Schulte-Mecklenbeck, M., Perner, J., 1999. The effects of framing, reflection,
probability, and payoff on risk preference in choice tasks. Organ. Behav. Hum. Decis.Process. 78, 204–231.
Lancaster, K.J., 1966. A new approach to consumer theory. J. Polit. Econ. 74, 132–157.Le Manach, F., Gough, C., Harris, A.R., Humber, F., Harper, S., Zeller, D., 2012. Unreported
fishing, hungry people and political turmoil: the recipe for a food security crisis inMadagascar? Mar. Policy 36, 218–225.
Louviere, J.J., Hensher, D.A., 1982. On the design and analysis of simulated choice or allo-cation experiments in travel choice modelling. Transp. Res. Rec. 890, 11–17.
Louviere, J.J., Lancsar, E., 2009. Choice experiments in health: the good, the bad, the uglyand toward a brighter future. Health Econ. Policy Law 4, 527–546.
Louviere, J.J., Woodworth, G., 1983. Design and analysis of simulated consumer choice orallocation experiments: an approach based on aggregate data. J. Mark. Res. 20,350–367.
Martinez-Alier, J., 1995. The environment as a luxury good or “too poor to be green”? Ecol.Econ. 13, 1–10.
McFadden, D., 1974. Conditional logit analysis of qualitative choice behavior. In:Zarembka, P. (Ed.), Frontiers in Econometrics. Academic Press, New York, NY, USA,pp. 105–142.
MEA, 2005. Ecosystems and Human Well-Being: Current State and Trends. Island Press,Washington, D.C., USA.
Min, J., Azevedo, I.L., Michalek, J., de Bruin, W.B., 2014. Labeling energy cost on light bulbslowers implicit discount rates. Ecol. Econ. 97, 42–50.
Noonan, D.S., 2003. Contingent valuation and cultural resources: a meta-analytic reviewof the literature. J. Cult. Econ. 27, 159–176.
O'Garra, T., 2009. Bequest values for marine resources: how important for indigenouscommunities in less-developed economies? Environ. Resour. Econ. 44, 179–202.
Oleson, K.L.L., 2011. TEEB Case: Taking an Ecosystem Service Perspective in VelondriakeLocally Managed Marine Area. The Economics of Ecosystems and Biodiversity,Cambridge, UK.
Oliver, T.A., Oleson, K.L.L., Ratsimbazafy, H., Raberinary, S.B., Harris, A.R., 2015. Positivecatch & economic benefits of periodic octopus fishery closures: do effective, narrowlytargeted actions ‘catalyze’ broader management?, in review. PLoS One.
Pearce, D.W., Warford, J.J., 1993. World Without End: Economics, Environment andSustainable Development. Oxford University Press for the World Bank, WashingtonD.C., USA.
Plummer, R., FitzGibbon, J., 2006. People matter: the importance of social capital in the co-management of natural resources. Nat. Res. Forum 30, 51–62.
Pretty, J., 2003. Social capital and the collective management of resources. Science 302,1912–1914.
Rajulton, F., Ravanera, Z.R., Beaujot, R., 2007. Measuring social cohesion: an experimentusing the Canadian national survey of giving, volunteering, and participating. Soc.Indic. Res. 80, 461–492.
Rasolofo, M.V., 1997. Use of mangroves by traditional fishermen in Madagascar. Man-grove Salt Marshes 1, 243–253.
Rodríguez, J.P., Beard Jr., T.D., Bennett, E.M., Cumming, G.S., Cork, S., Agard, J., Dobson, A.P.,Peterson, G.D., 2006. Trade-offs across space, time, and ecosystem services. Ecol. Soc.11, 28.
Rolfe, J., Bennett, J., Louviere, J., 2000. Choice modelling and its potential application totropical rainforest preservation. Ecol. Econ. 35, 289–302.
Satterfield, T., Gregory, R., Klain, S., Roberts, M., Chan, K.M., 2013. Culture, intangibles andmetrics in environmental management. J. Environ. Manag. 117, 103–114.
Southall, A., 1986. Common themes in Malagasy culture. In: Kottak, P., Rakotoarisoa, J.-A.,Southall, A., Verin, P. (Eds.), Madagascar. Society and History. Carolina AcademicPress, Durham, NC, USA, pp. 411–426.
Sumaila, U.R., Walters, C., 2005. Intergenerational discounting: a new intuitive approach.Ecol. Econ. 52, 135–142.
Teh, L.S.L., 2011. Discount rates, small-scale fisheries, and sustainability. Resource Man-agement and Environmental Studies. The University of British Columbia, Vancouver,B.C., Canada.

116 K.L.L. Oleson et al. / Ecological Economics 114 (2015) 104–116
Teh, L.S., Teh, L.C., Rashid Sumaila, U., 2014. Time preference of small-scale fishers in openaccess and traditionally managed reef fisheries. Mar. Policy 44, 222–231.
Thurstone, L.L., 1927. A law of comparative judgement. Psychol. Rev. 34, 273–286.Tucker, B., 2012. Do risk and time experimental choices represent individual strategies for
coping with poverty or conformity to social norms? Curr. Anthropol. 53, 149–180.van Beukering, P.J.H., Cesar, H.S.J., 2004. Ecological economicmodeling of coral reefs: eval-
uating tourist overuse at Hanauma Bay and algae blooms at the Kihei coast, Hawai'i.Pac. Sci. 58, 243–260.
Walsh, R.G., Loomis, J.B., Gillman, R.A., 1984. Valuing option, existence, and bequest forwilderness demands. Land Econ. 60, 14–29.
White, A.T., Zeitlyn, H.L., Yves, R., Lafcadio, C., 1994. Collaborative and Community-BasedManagement of Coral Reefs: Lessons from Experience. Kumarian Press Library ofManagement for Development, West Hartford, CT, USA.