Cross-species hybridisation of human and bovine orthologous genes on high density cDNA microarrays
12
BioMed Central Page 1 of 12 (page number not for citation purposes) BMC Genomics Open Access Research article Cross-species hybridisation of human and bovine orthologous genes on high density cDNA microarrays James Adjaye* 1 , Ralf Herwig 1 , Doris Herrmann 2 , Wasco Wruck 1 , Alia BenKahla 1 , Thore C Brink 1 , Monika Nowak 2 , Joseph W Carnwath 2 , Claus Hultschig 1 , Heiner Niemann 2 and Hans Lehrach 1 Address: 1 Max Planck Institute for Molecular Genetics, (Department of Vertebrate Genomics), Ihnestrasse 73, D-14195, Berlin, Germany and 2 Institute for Animal Science, (Department of Biotechnology), Mariensee, 31535 Neustadt, Germany Email: James Adjaye* - [email protected]; Ralf Herwig - [email protected]; Doris Herrmann - [email protected]; Wasco Wruck - [email protected]; Alia BenKahla - [email protected]; Thore C Brink - [email protected]; Monika Nowak - [email protected]; Joseph W Carnwath - [email protected]; Claus Hultschig - [email protected]; Heiner Niemann - [email protected]; Hans Lehrach - [email protected] * Corresponding author Abstract Background: Cross-species gene-expression comparison is a powerful tool for the discovery of evolutionarily conserved mechanisms and pathways of expression control. The usefulness of cDNA microarrays in this context is that broad areas of homology are compared and hybridization probes are sufficiently large that small inter-species differences in nucleotide sequence would not affect the analytical results. This comparative genomics approach would allow a common set of genes within a specific developmental, metabolic, or disease-related gene pathway to be evaluated in experimental models of human diseases. The objective of this study was to investigate the feasibility and reproducibility of cross-species analysis employing a human cDNA microarray as probe. Results: As a proof of principle, total RNA derived from human and bovine fetal brains was used as a source of labelled targets for hybridisation onto a human cDNA microarray composed of 349 characterised genes. Each gene was spotted 20 times representing 6,980 data points thus enabling highly reproducible spot quantification. Employing high stringency hybridisation and washing conditions, followed by data analysis, revealed slight differences in the expression levels and reproducibility of the signals between the two species. We also assigned each of the genes into three expression level categories- i.e. high, medium and low. The correlation co-efficient of cross hybridisation between the orthologous genes was 0.94. Verification of the array data by semi- quantitative RT-PCR using common primer sequences enabled co-amplification of both human and bovine transcripts. Finally, we were able to assign gene names to previously uncharacterised bovine ESTs. Conclusions: Results of our study demonstrate the harnessing and utilisation power of comparative genomics and prove the feasibility of using human microarrays to facilitate the identification of co-expressed orthologous genes in common tissues derived from different species. Published: 28 October 2004 BMC Genomics 2004, 5:83 doi:10.1186/1471-2164-5-83 Received: 23 June 2004 Accepted: 28 October 2004 This article is available from: http://www.biomedcentral.com/1471-2164/5/83 © 2004 Adjaye et al; licensee BioMed Central Ltd. This is an Open Access article distributed under the terms of the Creative Commons Attribution License (http://creativecommons.org/licenses/by/2.0 ), which permits unrestricted use, distribution, and reproduction in any medium, provided the original work is properly cited.
-
Upload
independent -
Category
Documents
-
view
3 -
download
0
Transcript of Cross-species hybridisation of human and bovine orthologous genes on high density cDNA microarrays

BioMed CentralBMC Genomics
ss
Open AcceResearch articleCross-species hybridisation of human and bovine orthologous genes on high density cDNA microarraysJames Adjaye*1, Ralf Herwig1, Doris Herrmann2, Wasco Wruck1, Alia BenKahla1, Thore C Brink1, Monika Nowak2, Joseph W Carnwath2, Claus Hultschig1, Heiner Niemann2 and Hans Lehrach1Address: 1Max Planck Institute for Molecular Genetics, (Department of Vertebrate Genomics), Ihnestrasse 73, D-14195, Berlin, Germany and 2Institute for Animal Science, (Department of Biotechnology), Mariensee, 31535 Neustadt, Germany
Email: James Adjaye* - [email protected]; Ralf Herwig - [email protected]; Doris Herrmann - [email protected]; Wasco Wruck - [email protected]; Alia BenKahla - [email protected]; Thore C Brink - [email protected]; Monika Nowak - [email protected]; Joseph W Carnwath - [email protected]; Claus Hultschig - [email protected]; Heiner Niemann - [email protected]; Hans Lehrach - [email protected]
* Corresponding author
AbstractBackground: Cross-species gene-expression comparison is a powerful tool for the discovery ofevolutionarily conserved mechanisms and pathways of expression control. The usefulness of cDNAmicroarrays in this context is that broad areas of homology are compared and hybridization probesare sufficiently large that small inter-species differences in nucleotide sequence would not affect theanalytical results. This comparative genomics approach would allow a common set of genes withina specific developmental, metabolic, or disease-related gene pathway to be evaluated inexperimental models of human diseases. The objective of this study was to investigate the feasibilityand reproducibility of cross-species analysis employing a human cDNA microarray as probe.
Results: As a proof of principle, total RNA derived from human and bovine fetal brains was usedas a source of labelled targets for hybridisation onto a human cDNA microarray composed of 349characterised genes. Each gene was spotted 20 times representing 6,980 data points thus enablinghighly reproducible spot quantification. Employing high stringency hybridisation and washingconditions, followed by data analysis, revealed slight differences in the expression levels andreproducibility of the signals between the two species. We also assigned each of the genes intothree expression level categories- i.e. high, medium and low. The correlation co-efficient of crosshybridisation between the orthologous genes was 0.94. Verification of the array data by semi-quantitative RT-PCR using common primer sequences enabled co-amplification of both human andbovine transcripts. Finally, we were able to assign gene names to previously uncharacterised bovineESTs.
Conclusions: Results of our study demonstrate the harnessing and utilisation power ofcomparative genomics and prove the feasibility of using human microarrays to facilitate theidentification of co-expressed orthologous genes in common tissues derived from different species.
Published: 28 October 2004
BMC Genomics 2004, 5:83 doi:10.1186/1471-2164-5-83
Received: 23 June 2004Accepted: 28 October 2004
This article is available from: http://www.biomedcentral.com/1471-2164/5/83
© 2004 Adjaye et al; licensee BioMed Central Ltd. This is an Open Access article distributed under the terms of the Creative Commons Attribution License (http://creativecommons.org/licenses/by/2.0), which permits unrestricted use, distribution, and reproduction in any medium, provided the original work is properly cited.
Page 1 of 12(page number not for citation purposes)

BMC Genomics 2004, 5:83 http://www.biomedcentral.com/1471-2164/5/83
BackgroundMicroarrays are routinely used for large scale transcrip-tome analyses and have been widely and successfullyemployed for simultaneously monitoring the expressionof a potentially unlimited number of genes in parallel,thus providing the basis for identifying genes differen-tially expressed in distinct cell-types, developmentalstages, disease states and cells subjected to exogenous rea-gents [1]. The rapid and significant improvements ofcDNA-chip technologies and the availability of multi-spe-cies gene catalogues within the various data bases havemade possible the comparison of gene expression levelswithin a single mammalian organism and across differentorganisms on a large-scale.
The advantages of cross-species hybridisation are two-fold. First, cross-species gene-expression comparison is apowerful tool for the discovery of evolutionarily con-served mechanisms and pathways of expression control.The advantage of cDNA microarrays in this context is thatbroad areas of homology are compared and hybridizationprobes are sufficiently large so that small inter-species dif-ferences in nucleotide sequence would not affect the ana-lytical results. This comparative genomics approachwould allow a common set of genes within a specificdevelopmental, metabolic, or disease-related gene path-way to be evaluated in experimental models of humandiseases. Second, the use of microarrays in studies inmammalian species other than human and rodents, forexample nonhuman primates, bovine, sheep and porcinemay advance our understanding of human health and dis-ease, for example the use of animal models in drug targetvalidation. However, the inavailability of adequatesequence data and commercial cDNA and oligonucle-otide microarrays keeps this technology beyond the reachof investigators working on economically and scientifi-cally important large domestic species such as cattle, pigsand sheep. A potential solution to this problem is the useof cross-species hybridisations, i.e, human sequence-based arrays as tools for undertaking comparative genomeexpression studies. Such analyses have been performedusing ape brain RNA as target on a human oligonucle-otide array [2] and pig, mouse and Atlantic salmon RNAon human nylon arrays- [3-7]. These types of studies rep-resent critical areas of research directly related to theunderstanding of human diseases because nonhuman pri-mates, bovine, sheep and porcine play a crucial role inbiomedicine, such as, organ transplantation, vaccinedevelopment, viral pathogenesis, gene therapy and a hostof other human health-related technologies.
A crucial step employing domestic animals in biomedi-cine is genetic modification which requires extensiveembryo and embryo-related technologies, such as in vitroproduction of embryos for stem cell derivation and
somatic nuclear transfer cloning. Employing the bovinemodel and sensitive RT-PCR assays, it has been shownthat the majority of embryos derived from such sourcesdisplay distinct mRNA expression patterns in a variety ofdevelopmentally important genes compared to their invivo derived counterparts [8]. Some of these aberrationslead to "Large offspring syndrome", a complex of multiplepathologies observed in offspring derived from in vitroproduction and/or nuclear transfer of which significantoversize is a predominant feature [9]. Analysis of mRNAexpression patterns in early embryos via cDNA microarraytechnology would provide insights into the function ofgene regulatory networks and would thus be a major stepforward in unravelling molecular mechanisms underlyingdevelopmental abnormalities. The technology to amplifythe minute amounts of mRNA in early embryos withoutsignificantly altering the ratio of the various mRNAs in theoriginal cell has recently been described [10,11] and aprototype mouse cDNA-macroarray enriched in embry-onic sequences has been developed [11].
Important criteria for evaluating any microarray systeminclude the reproducibility of the data generated, the spe-cificity of detection of the targeted gene, and the validityof the results that identify and establish differential geneexpression. The experiments described here show the sys-tematic validation of cross-species microarray analysis,with emphasis on the reproducibility and statistical anal-ysis of generated data using standard microarray dataanalysis tools.
Specifically, we investigated the feasibility and reproduci-bility of cross-species hybridisation of orthologous geneswithin a defined developmental and metabolic pathwayusing as a test case and the first description of its kind,human and bovine fetal brain RNA as Cy-dye labelled tar-gets on a human cDNA microarray. The microarray iscomposed of 349 genes each spotted 20 times to ensurereproducible validation by independent technologiessuch as semi-quantitative RT-PCR as carried out in thisstudy, or alternatively, Real-Time PCR and Northern blotanalysis.
ResultsArray fabrication and gene annotationThe human cDNA microarray used in this study consistedof 349 fully sequenced and annotated cDNAs as describedin the Supplemental Table 1. Thirty-five spots containingonly spotting solution (3x SSC / 1.5 M betaine) served asnegative controls. In addition, in a separate control plate,the housekeeping genes HPRT and β-ACTIN (made up ofa dilution series of 25-, 50-, 100-, 150- and 200 ng/µl)were employed as endogenous guide dots to enable accu-rate grid placement prior to image analysis. These spotscan be seen as intense yellow signals at the periphery of
Page 2 of 12(page number not for citation purposes)

BMC Genomics 2004, 5:83 http://www.biomedcentral.com/1471-2164/5/83
each block as portrayed in Figure 1A. The embryonic-spe-cific gene, OCT-4 and Arabidopsis cDNAs (Cab- T97312;Cwlp- T02614; Lhb1B1- T21965; Ohp- T22679) wereincluded as negative controls to monitor hybridisation-specificity. The transcription factor OCT-4 is expressed inhuman embryonic stem cells and primordial germ cellsand is down-regulated upon differentiation [10,12,13].
Classification of the genes according to Gene Ontologyannotations (molecular function) and chromosomallocation (Figures 1B and 1C) demonstrates that theselected genes encompass a range of twelve different func-tional classes and are located on all except the Y-chromo-some. This implies that there is no obvious bias towardsbiological characteristics and the selected gene set can beviewed as representative for the current study.
Global data characteristicsOur experimental design incorporated dye-swaps andfour replicated hybridisations. Three hundred and fortynine cDNAs, each representing a unique gene were spot-ted 20 times on each microarray. Four independentexperiments were performed with human and bovine
brain, respectively. Within each experiment the 20 repli-cates were averaged to yield a reliable signal for the respec-tive probe. In the next step, the replicated signals from thedifferent experiments were averaged to compute overallcharacteristics. The overall correlation of expression of thehuman and bovine genes is shown in Figure 2A. Theregression line bears a slope close to one (1.13) thus indi-cating similar expression of human and bovine genesacross the replicated experiments with a slight increase ofexpression in the human brain. The overall correlationcoefficient is 0.94.
Additionally, we computed MA-plots [14] in order todetect artificial dependencies of the log-ratio across thesignal range. Figure 2B illustrates a typical result from aspecific hybridisation experiment. The horizontal linesmark the two-fold levels of over-expression in bovine andhuman, respectively. A clear observation is that a few ofthe 349 genes under investigation fall outside thesethresholds with the expression of 5 genes being more than2-fold over-expressed in bovine and 16 genes more than2-fold over-expressed in human. However, there is no
Table 1: Summary of primer sequences, annealing temperatures and size of amplicons. Derivation of primer sequences: H and B denote human and bovine respectively. The nucleotide positions of the primer sequences are in parenthesis. Nucleotides highlighted in bold denote differences in the orthologous gene sequences.
Genes Primer sequences (5' – 3') Annealing temperature (°C) Fragment size (bp) Accession numbers
CDC27 (1226–1250) HTATTACATCTCCCCCAAACGCACTG
54 311 NM_001256 HCB170694 B
(1512–1536) HCCATTTCACGAAGAAGGCTCATCAA
CDC6 (89–113) BTCCCAAGCGGGTTGGTGTTATTCAC
54 208 NM_001254 HBF600055 B
(272–296) BGCGACAGACTGTACTGTAGGCTTCA
PCNA (195–217) BGAGGCGCTTAAGGATCTCATCAA
54 382 AF527838 HCB531519 B
(554–576) BATTCACCAGAAGGCATCTTTACT
SLC11A3 (38–61) BACCCCTGGAGGGAACTCATCTAAT
57 276 AF215636.1 HBG689712 B
(290–313) BGCTGATGCTCCCATCAAAATACTG
VDAC2 (652–675) BCCTCGGTTGTGATGTTGACTTTGA
57 448 NM_003375.1 HTC152811 B
(1076–1099) BGTGGCCTCCAGCATTAATGCTCTT
CALNEXIN (1054–1078): HGCTGGTTAGATGATGAGCCTGAGTA
56 237 NM_001746.1 HBM431118 B
(1266–1290): HTCCTGGGTTTCCAGATTCCCTGGTA
β-ACTIN 441–461) HGTTGCTATCCAGGCTGTGCT
60 469 NM_001101 HNM_173979 B
(890–910) HCGGATGTCCACGTCACACTT
Page 3 of 12(page number not for citation purposes)

BMC Genomics 2004, 5:83 http://www.biomedcentral.com/1471-2164/5/83
increase or decrease in fold-change for the vast majority ofgenes and this is fairly stable across the signal range.
In order to measure whether a given gene was significantlyexpressed, we compared its cDNA's signal to a signal dis-tribution derived from negative controls represented byapprox. 2,500 empty spot positions on the array. Afterquantification of each array a low non-zero intensity isassigned to each of these empty spots reflecting theamount of background signal on the array. Since thesepositions are spread uniformly over the array, the distri-bution of these signals reflects the distribution for signalnoise and is an indicator whether signals are at the back-ground level or reflect reliable expression levels. For eachcDNA we counted the relative proportion of empty posi-tions on the array that are smaller than the actualobserved intensity (BG-tag). BG-tags from replicatedexperiments for the same cDNA were averaged. Thus, high
values (close to one) indicate that the cDNA is expressedin the respective tissue whereas low values reflect noise.
Array fabrication and gene annotationFigure 1Array fabrication and gene annotation (A) False-colour image generated from a bovine-Cy5, human-Cy3 hybridisa-tion. False colour images were generated using the pro-gramme ScanAlyze, version 2.44 http://www.rana.lbl.gov/EisenSoftware.htm. The full array (24 × 25 spotting pattern) consists of 16 blocks with each gene spotted 5 times per block therefore 80 potential data points present for expres-sion analysis per gene. A blow-up of 4 blocks illustrating the Chip design is presented. The ACTIN cDNAs acting as guide-dots can be seen as intense yellow spots demarcating each block. In addition, the majority of spots appear yellow due to similar expression levels of the orthologous genes. (B) Func-tional annotation of the 349 genes as set out by the Gene Ontology Consortium http://rana.lbl.gov/EisenSoft ware.htm.The proportion of these genes within each func-tional / biological annotation is represented on the Y-axis and the annotation on the X-axis. (C) Chromosomal distribution of the 349 genes. The number of genes within each chromo-some is represented on the Y-axis and the chromosome numbers on the X-axis.
Global data characteristicsFigure 2Global data characteristics (A) Global correlation of bovine (X-axis) and human (Y-axis) experiments. The plot shows a log-log (base 2) plot of the mean signal intensities from the four independent experiments for each gene. The red line shows the regression line, the box displays the parameters of the regression line (intercept, slope) and the overall correla-tion. Four genes that are significantly differentially expressed as judged by using the Wilcoxon's rank-sum test are denoted by black diamond shapes. (B) MA-plot of a single experiment. The X-axis show the log (base 2) of the squared product of Cy5-red and Cy3-green intensities of each gene in the same experiment. Y-axis shows the log-ratio (base 2) of red and green intensity. The horizontal lines mark the two-fold over-expressed genes (Top line; bovine over-expression and bot-tom line; human over-expression). (C). Classification of detection levels of the 349 genes. The genes were sub-divided into three classes of expression levels. Class 1 (BG-tag < 0.8) – low (not detected). Class 2 (BG-tag between 0.8 and 0.9) – medium (boarderline detection) and Class 3 (BG-tag > 0.9) – high expression (readily detectable) The number of genes (X-axis) within each class (Y-axis) is also shown in the figure (black = bovine, white = human).
Page 4 of 12(page number not for citation purposes)
BMC Genomics 2004, 5:83 http://www.biomedcentral.com/1471-2164/5/83
The limit of visual detection of a spot corresponds to a BG-tag level of 0.9, however there is a grey zone around thisvalue. Comparison with RT-PCR analyses showed [15]that this level is consistent with the limit of detection atthe 25th cycle of a standard PCR reaction. cDNAs wereconsidered as "detected" when their average BG-tag wasabove 0.9.
We grouped the 349 genes into three classes of expressionlevels with respect to their intensity values above back-ground levels (i.e, BG-tag) with class 1 as low (not-detected), class 2 as medium (possibly detected) and class3 as high level of expression (detected), respectively.Within class 1, are 19 bovine and 17 human genes. Class2, comprises 26 bovine and 17 human genes and finallyclass 3 has 304 bovine and 315 human genes, respectively.The genes within expression class 1 have signal intensitiesbelow the detection level of our microarray analysis plat-form and as such these genes can be designated as"Absent" (See Figure 2C for a graphical illustration). A listof all the intensity values is given (see Additional file 1).
Data reproducibility and species variabilityAn essential criterion for the applicability of cross-speciesexperiments is the data reproducibility. For example, ifhuman probes hybridise to bovine mRNA with far lessreproducibility than to human mRNA high changes inexpression of bovine tissues can be observed that aresolely due to technical variability. In order to test whetherthe variability in gene expression levels is conservedwithin both species or in contrast, is higher in the bovinethan in the human hybridisations, we calculated the coef-ficient of variation (CV) across the replicated experiments.Histograms are shown in Figure 3A. We then defined fourclasses of CVs for the genes (highly reproducible signals –CV < 0.25, good reproducibility – 0.25 < CV < 0.5,medium reproducibility – 0.5 < CV < 0.75 and poor repro-ducibility CV > 0.75). Note that a CV of 1.0 indicates thatthe signal standard deviation is in the order of the signal
Data reproducibility and species variabilityFigure 3Data reproducibility and species variability (A) Histo-grams of CVs for human and bovine hybridisations. (B) Clas-sification of signal variability in measured gene expression intensities. Human (white), bovine (grey) and mixed samples (black). CVs (co-efficient of variation) were calculated for repeated signal intensities of the four independent hybridisa-tions and then sub-divided into four classes: Class 1 – CV < 0.25 high reproducibility, Class 2 – CV [0.25 – 0.5] good reproducibility, Class 3 – CV [0.5 – 0.75] medium reproduci-bility Class 4 – CV > 0.75 poor reproducibility. Nucleotide sequence alignments of bovine and human transcriptsFigure 4
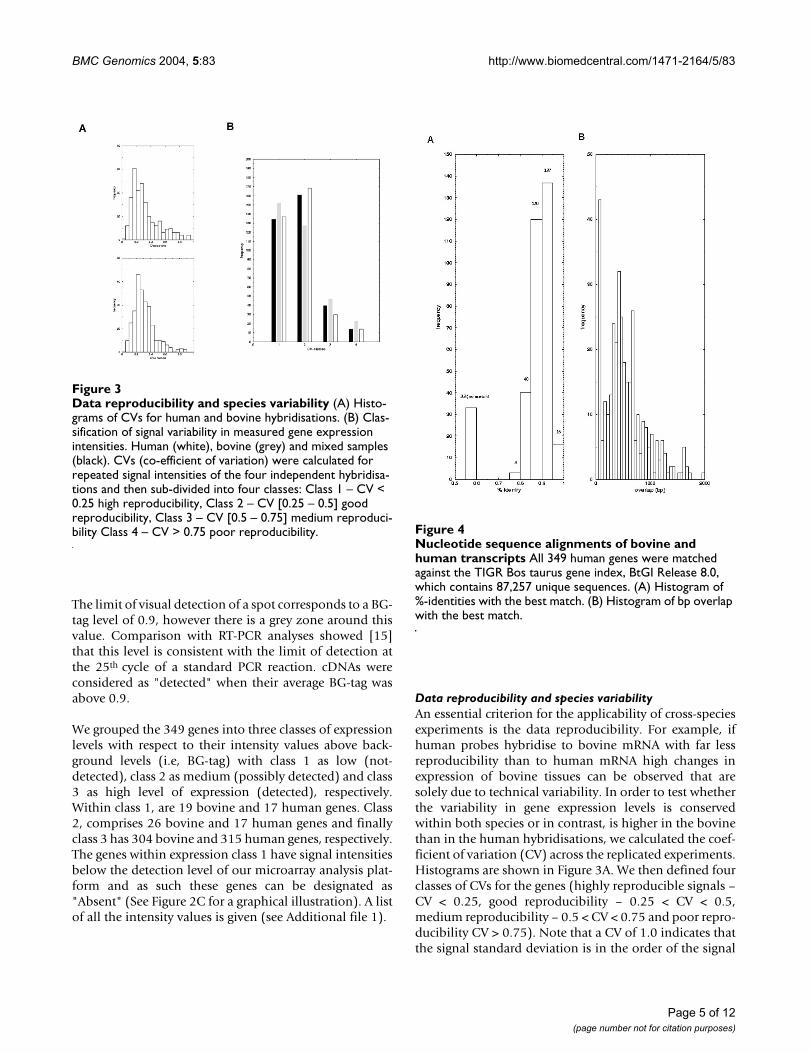
Nucleotide sequence alignments of bovine and human transcripts All 349 human genes were matched against the TIGR Bos taurus gene index, BtGI Release 8.0, which contains 87,257 unique sequences. (A) Histogram of %-identities with the best match. (B) Histogram of bp overlap with the best match.
Page 5 of 12(page number not for citation purposes)

BMC Genomics 2004, 5:83 http://www.biomedcentral.com/1471-2164/5/83
itself and therefore no meaningful statement on the meas-urement can be made.
Figure 3B depicts the number of genes that fall within therespective CV-classes when analysing all experiments(human and bovine- black), human only (white) andbovine only (grey). There is a 10% decrease in the numberof reproducible genes when comparing human andbovine but the overall effect is similar. Approximately 305genes show a CV<0.5 with human brain (87%) comparedto 280 with bovine brain (80%). Only 15 genes (4%)show high variability across the experiments for humanbrain compared to 20 genes (5.7%) for bovine brain. Fig-ure 3B illustrates that there is a slight but not dramatic
increase in variability when performing cross-specieshybridisation (the number of variable genes (class 3 and4) increase by a factor of 1.5). However, for the vastmajority of the genes the reproducibility is similar. Theobserved effect is not due to exact cutoff values set for thedifferent CV-classes since a slight shifting of the class bor-ders leads to the similar results. For example, shifting theborders about a slight factor of ϑ = ± 0.05 to the left/rightrespectively gives approximately the same factor ofincrease for variable bovine to variable human genes.
Independent verification of array results by semi-quantitative RT-PCRFigure 5Independent verification of array results by semi-quantitative RT-PCR (A) Ethidium bromide stained gel illustrating independent verification of differential gene expression by semi-quantitative RT-PCR. PCR reactions were carried out in 50 µl volumes, loaded in the order H- (human), B- (bovine) and VE- (water as negative control) then resolved on a 2 % agarose gel as described in Materials and Methods. Each panel consist of genes of the same functional category – listed on the left hand side. A 100 bp ladder (Invitrogen) was used to confirm the sizes (Table 1) of the PCR products. (B) A graphical illustration of the comparison of the expression levels of the orthologous genes as deduced by the microarray analysis and semiquantitative RT-PCR.
Page 6 of 12(page number not for citation purposes)

BMC Genomics 2004, 5:83 http://www.biomedcentral.com/1471-2164/5/83
Differential gene expression in bovine and human fetal brainThree statistical tests that judge the significance of differ-ences in the levels of gene expression in human andbovine fetal brains were employed (Student's t-test,Welch-test and, Wilcoxon's rank-sum test) as describedpreviously [16]. Tests were carried out with the four inde-pendent experiments in bovine and human brain, respec-tively. Note that with independent experiments we meanthe independent technical replicates since we do notemploy different biological replicates in our study. Mes-senger RNA levels of seven genes were significantly (p <0.05 with Student's t-test and Welch test) differentbetween the two species, whilst four genes were found tobe differentially expressed only with the Wilcoxon test (p< 0.05). This emphasizes that the Wilcoxon test is moreconservative than the parametric tests. In contrast to thetwo parametric tests that assume a specific parametric sig-nal distribution (Gaussian distribution) for the underly-ing signal series, the Wilcoxon test is non-parametric.Thus, P-values calculated by this test are valid in a moregeneral set-up, i.e. for larger classes of probabilitydistributions, than with the other tests. Furthermore, sincethe Wilcoxon test is based on ranks rather than on theunderlying signals it is a more robust procedure in thesense that it is less sensitive against outliers from themodel assumptions. These four genes are, ZNF278,APOARGC, KIAA1609 and MGC12904 – highlighted asdiamond shapes in Figure 2A. The expression levels of thevast majority (98%) of the genes remained unchanged.
Furthermore, taking into account corrections for multipletesting, no gene is differentially expressed at the globalexperiment significance level of 0.05. For example, thelowest P-value of the Welch test is 1.98e-03, (APOARGC).Thus, Holm's setp-wise correction would start with anadjusted experiment level P-value of p = 0.05/349 = 1.43e-04. Similarly, measuring the false discovery rate by qval-ues [17] results in no significant differential gene expres-sion. Thus, we conclude that the level of expression of theindividual 349 genes under investigation within humanand bovine brain is roughly the same.
Nucleotide sequence alignments of bovine and human transcriptsIn order to characterise some of the vast number ofunknown bovine ESTs within the various databases wescreened for orthologs to the human genes [18]. The 349known human genes were screened against the TIGR BosTaurus gene index (BtGI Release 8.0). Using high-qualitymatches (>85% identity, >100 bp overlap, E-value < 1.0e-15) we were able to ascertain the expression of 316 orthol-ogous genes (see Additional file 1). Figure 4 shows thequality of the matches. Of these genes, 16 had sequenceidentities of greater than 95%, 137 genes with identities
between 90% and 95%, 120 genes with identities of 85%to 90%. The remaining genes did not meet the criterionfor the assignment as orthologs [18]. Forty genes hadidentities of 80% to 85%, 3 genes had identities between75% and 80% and finally 33 genes did not have a signifi-cant BLAST hit. These matches are considered to be insig-nificant and therefore implying that these 33 humangenes (assigned values (0) in Additional file 1) do not asyet have their bovine homologs present in the currentbovine databases.
Employing a comparative genomics approach we havefunctionally annotated previously uncharacterised bovineESTs. These genes are depicted in the Supplemental Tableas bovine ESTs lacking a gene name or description in theTIGR Bos Taurus gene index. As an example, the geneSLC11A3 which encodes a protein which functions as asolute carrier has 92% nucleotide sequence identity withan overlap of 500 bp with its bovine orthologue. Addi-tionally, we have demonstrated co-amplification of thistranscript in both human and bovine fetal brain RNAusing primers derived from the bovine sequence – Figure5A and Table 1.
Verification of expression levels of cross-hybridised orthologous genes by semi-quantitative RT-PCRSemi-quantitative RT-PCR was used to confirm thededuced expression data generated by the high stringencycross-species hybridisation. We selected a set of genesbelonging to distinct families based on their publishedfunctional annotation, for example, cell cycle (CDC27,CDC6 and PCNA), solute transport- (SLC11A3), proteinassembly- (CALNEXIN), anion channel- (VDAC2) and asan endogenous reference, the housekeeping gene, β-ACTIN. Primer sequences were designed to co-amplify theorthologous genes (Table 1).
The RT-PCR analyses (Figure 5A) using a common set ofgene-specific primers clearly demonstrate co-amplifcationof the orthologous transcripts and, in addition, differ-ences in expression levels between genes within the samespecies are discernable. For example, the house keepinggene β-ACTIN and CALNEXIN which is involved in pro-tein assembly are more abundant than for examples genesinvolved in cell cycle control. Most importantly, thetrends in the deduced ratios (see Additional file 1 andFigure 5B) of expression levels of orthologous genes fromthe hybridisation analysis are confirmed by the RT-PCRassay.
Discrepancies in the bovine-human ratio with array dataand the semi-quantitative RT-PCR data are also observa-ble. Furthermore, some of the genes (for example CDC6and VDAC2) are expressed at a low level (expression class1, compare Figure 2C). Here, microarray measurements
Page 7 of 12(page number not for citation purposes)

BMC Genomics 2004, 5:83 http://www.biomedcentral.com/1471-2164/5/83
are less reliable than PCR-based measurements and onecomes close to the borderline of the detection limit ofmicroarrays.
DiscussionCustomised and focussed microarrays containing orthol-ogous genes related to function, tissue, or pathways arebecoming widely adopted for studying mRNA expressionpatterns. In addition, the level of cross hybridisationbetween genes with high sequence identity is also ofinterest because arrays are not always available for mam-malian species other than human and rodents so cross-species hybridisations are often carried out [19,20]. Inview of this, it is crucial to know whether the hybridisa-tion conditions (i.e. the stringency used for the hybridisa-tion and subsequent washes) would enable identificationof altered gene expression across species. Here we havedemonstrated cross-hybridisation of orthologous tran-scripts by adopting a high stringency hybridisation andwash protocol.
The overall correlation co-efficient of gene expression inthe fetal brains of human and bovine was 0.94, with theregression line at a slope of 1.13 (Figure 2A). This suggeststhat the 349 genes under investigation have rather similarexpression levels as judged by the intensity values of thehuman and bovine genes across the replicated experi-ments. The use of replicate experiments is clearly essentialin order to ascertain true expression change. For example,judging single experiments we find a couple of genesescaping the 2-fold bounds. The MA-plot [14] shown inFigure 2B suggests that of the 349 genes, 5 are over-expressed more than 2-fold in bovine and 16 are morethan 2-fold over-expressed in human. However, most ofthe changes are due to experimental variability of this spe-cific experiment.
An extremely important aspect of cross-species hybridisa-tions is data reproducibility. A poor hybridisation experi-ment would lead to a high variability in the respectivereplicate experiments in human and bovine. With regardsto this aspect, we identified fifteen genes (4%) in humanand twenty genes (5.7%) in bovine with variability inexpression levels in the four hybridisation experiments. Inaddition, approximately 305 genes have a CV of less than0.5 with human brain (87%) compared to 280 withbovine brain (80%). However, this level of variability islow and can be expected due to the fact that the probe setused are of human origin. Moreover, the slight decrease inreproducibility due to species and nucleotide sequencedifferences can be compensated for by increasing thenumber of independent repetitions (biological andtechnical replicates) of the experiments. The unexpectedlylow level of variability in gene expression levels betweenhuman and bovine fetal brain can also be attributed to the
80 data points examined per gene and the four replicatehybridisations (technical replicates) carried out for eachspecies. Our finding further emphasises the need for suffi-cient technical and biological replicates in all microarrayexperiments.
In assessing differential gene expression in bovine andhuman fetal brain, we observed that the expression levelsof the individual orthologous genes were roughly in thesame broad range. For example, if one considers genesinvolved in pathways of cell cycle control, the microarraydeduced ratios (bovine:human) were for CDC27: 0.95,CDC6: 1.36, PCNA: 1.07, respectively, whereas thededuced ratios derived from the semi-quantitative RT-PCR assay were 0.59 for CDC27, 0.35 for CDC6 and 0.87for PCNA, respectively.
Similarly the comparative ratios for SLC11A3 and CAL-NEXIN are 0.65 vs. 0.98 and 0.88 vs. 0.97. An illustrationof co-amplification with common primers and also theconfirmation of the array data for a selection of genes canbe seen in Figures 5A and 5B. The expression ratios of allthe other genes under investigation are given (see Addi-tional file 1). Though co-amplification is possible bysemi-quantitative RT-PCR, there is amplification biasrelated to primer mismatch (See Table 1). This effect wasfurther highlighted when primer efficiencies were calcu-lated using comparative Real-Time PCR (data notincluded). An important difference between the two tech-niques is that cDNA array hybridisation is less sensitive tominor mismatches than PCR primer annealing. The biasin amplification specificity is not a drawback in this studyand species specific primers would obviously be used tocompare gene expression levels in an experiment in whicha developmental/metabolic pathway or disease model isinvestigated.
The similar expression ratio of the orthologous genesimplicated in cell cycle control and initiation of eukaryo-tic genome replication which is conserved in all eukaryo-tes highlights the feasibility and importance of our studyin examining conserved pathways operative within thefetal brains of human and bovine and of course acrossother species using human cDNA microarrays. A similarfinding has also been confirmed when comparing yeastco-regulated genes against the archaeal and bacterial oper-ons. This implies that the components of the proteintranslation process are conserved across organisms at theexpression level with minor specific differences [21].
We also identified four significantly differentiallyexpressed genes as judged by the Wilcoxon test. The Wil-coxon test is known to be more conservative than the Stu-dent's t-test and the Welch-test, however, we have moreconfidence in this test since it is distribution-free, in par-
Page 8 of 12(page number not for citation purposes)

BMC Genomics 2004, 5:83 http://www.biomedcentral.com/1471-2164/5/83
ticular it does not depend on the partly unrealisticassumption of an underlying Gaussian distribution.
The genes ZNF278 and APOARGC were 1.45 – and 1.66 -fold over-expressed in human whereas KIAA1609 andMGC12904 were 1.60 – and 1.37-fold over-expressed inbovine. ZNF278 encodes a zinc finger-containing tran-scription factor that acts as a transcriptional repressor andalso implicated in small round cell tumours [22]. Thegene APOARGC encodes a protein with hydrolase activity.MGC12904 and KIAA1609 are uncharacterised ESTs socomments cannot be made with regard to their function.
Orthologous genes between human and mouse andbetween human and rat both have a mean of approxi-mately 85% sequence identity [18,23]. In two independ-ent and unrelated studies carried out on cDNA and 50-mer oligonucleotide microarrays, cross-hybridisation wasonly observed with genes with 70%-80% and 50%-75%overall sequence identity, respectively [24,25]. Withrespect to these studies, our data unequivocally confirmthe feasibility and reproducibility of cross-species hybrid-isation of orthologous genes within defined developmen-tal and metabolic pathway(s) operative in human andbovine fetal brains. In addition, we have been able toassign gene names to previously uncharacterised bovineESTs, thus, highlighting the importance of comparativegenomics in identifying orthologous genes across species.
Furthermore, using this protocol of cross-species hybridi-sation, we have compared gene expression in bovineunfertilised oocytes and blastocyst using a larger microar-ray (The Human Ensembl Chip) comprising 15,500 fullysequenced and annotated genes and ESTs. The correlationco-efficient between the RNA samples is 0.26, thus reflect-ing the diversity between oocyte derived maternaltranscripts and embryonic transcripts derived from theblastocyst (Adjaye et al., unpublished).
ConclusionsIn summary, this study highlights the significance and uti-lisation power of comparative genomics and also demon-strates the feasibility of using human cDNA microarraysto facilitate the identification of differentially expressedgenes in human and bovine fetal brain. Our results indi-cate that cross-species hybridisation is not only a usefulshort-term solution for studying species for which genemaps, cDNA or oligo microarrays are not yet available,but also possesses tremendous power in enabling theunravelling of common evolutionary evolved mecha-nisms in different species.
MethodsMicroarray fabricationFor the generation of probes for spotting, cDNA insertsfrom a single 384-well plate of non-redundant, fullysequenced, annotated human cDNA collection (HumanEnsembl set RZPD1.1) were employed- (BenKahla et al.,unpublished) and a second partial plate consisting of con-trol genes and empty wells to be used for data normalisa-tion were amplified by PCR in a 384-well format. Bacterialclones were transferred to the PCR plates using 384-wellreplicators (Genetix Ltd, New Hampshire, UK). PCRamplifications were carried out in a total volume of 25 µlconsisting of 1x PCR buffer, 1.5 M Betaine (Sigma, Ger-many), 1U Taq polymerase, 200 mM of each dNTP(Invitek, Germany), 25 pmoles of M13-forward(5'GTAAAACGACGGCCA3') and M13-reverse(5'CAGGAAACAGCTATGAC3') primers respectively.Cycling parameters typically consisted of an initial dena-turation step at 95°C for 5 min followed by 35 cycles ofdenaturation at 95°C for 1 min, annealing at 55°C for 1min, elongation at 72°C for 1 min, then a final elongationstep at 72°C for 10 min. All amplified products were ana-lysed by agarose gel electrophoresis and in all cases singlebands were obtained per gene.
Purification was carried out using isopropanol precipita-tions. In brief, 24 µl of the PCR product was transferredinto 384-well Genetix plates (Genetix Ltd, New Hamp-shire, UK) previously filled with 18 µl of isopropanol perwell. The samples were mixed by gentle vortexing aftersealing the plates with transparent tape. After precipita-tion overnight at -20°C, the plates were spun at 3,500 rpmfor 2 hrs at 21°C, the isopropanol decanted off and theplates dried briefly in a SpeedVac without heating. Thepellets were resuspended in 6 µl of spotting solution (3xSSC /1.5 M Betaine (N, N, N-trimethylglycine; Sigma, Ger-many)). Random sampling of cDNAs revealed concentra-tions ranging between 200 to 300 ng/µl. Finally thesamples in each well were spotted twenty times (for signalaveraging) with four slit pins arranged in a 2x 2y print-head (Chipmaker 2 pins, Telechem, Sunnyvale, CA, USA).Prior to every spotting run the performance of all compo-nents of the robot is carefully tested – in particular the per-formance of the washing station in test runs designed todetect possible sample carry over. A modified Genetix Q-array (Genetix Ltd, New Hampshire, UK), controlled by anovel in-house software was used for the arraying of thesamples on SuperAmine™ aminosilane-coatedmicroscope slides (Telechem, Sunnyvale, Ca, USA). Post-processing of the arrays was performed using 1,2-dichlo-roethane and the acylating catalyst N-methylimidazolefollowing protocols described previously [26].
Page 9 of 12(page number not for citation purposes)

BMC Genomics 2004, 5:83 http://www.biomedcentral.com/1471-2164/5/83
Isolation of total RNAHuman brain RNA was isolated from a medically termi-nated fetus at 10 weeks gestation. This was provided bythe MRC-funded Human Embryonic Tissue Bank main-tained at the Institute of Child Health and University Col-lege London, England. Bovine fetal brain was obtainedfrom a 3–4 months old bovine fetus at a local abattoirnear Mariensee, Germany. Immediately after slaughter ofthe pregnant female, the tissue was plunged into liquidnitrogen and transported to the laboratory. Brain tissueswere homogenised using a Dounce homogeniser, totalRNA isolated using TRIzol reagent (Invitrogen) and fur-ther purified using phenol/chloroform extractions andprecipitation with ethanol after DNase 1 (Promega) treat-ment. All procedures were as described by themanufacturers. RNA Purity, integrity and concentrationswere evaluated on the Agilent 2100 Bioanalyzer. Highquality RNAs with A260/A280 ratio over 1.8 with intactribosomal 28S and 18S RNA bands were utilised for sub-sequent labelling reactions.
Direct labelling of RNA and hybridisationsFour independent labelling (including dye-swaps) reac-tions per species were carried out using 25 µg total RNAfrom both human and bovine per labelling reaction.Direct incorporation of Cy3 and Cy5 during reverse tran-scription was carried out in a 20 µl reaction volume using1 µg of anchored oligo-dT primer. The RNA/primer mixwas incubated at 70°C for 5 min., left at room temperaturefor 10 min and then cooled on ice for 2 min. The follow-ing reagents were then added: 4 µl first-strand buffer, 2 µl0.1 M DTT, 0.5 µl dNTP mix (25 mM each of dATP, dGTP,dCTP and 10 mM dTTP), 1 µl of 1.0 mM Cy5- or Cy3-dUTP (Amersham Pharmacia) and 1 µl (200 U/µl) Super-script II (Invitrogen). The labelling reaction was carriedout at 42°C for 1.5 hrs. The reaction was stopped with 4 µlof 0.5 M EDTA. The input RNA was hydrolysed by theaddition of 2 µl of 2.5 M NaOH and incubated at 37°C for15 mins. followed by neutralization with 10 µl HEPESfree acid (2 M, pH 5.5). Labelled cDNAs (four replicatesper species which included dye-swaps) were purified fromunincorporated Cy-dyes using Microcon YM-30 purifica-tion columns (Millipore). All labelled cDNAs were rou-tinely analysed on a Fuji scanner (FL8-8000) and byethidium bromide staining to ascertain dye incorporationand size-range of synthesized cDNAs. After concentratingcDNAs by evaporation in a SpeedVac, labelled targetswere resuspended in 20 µl of hybridisation buffer (10 µgpolydA and 20 µg Human Cot1 DNA,-Invitrogen; DIG-Easy Hybridisation mix -Roche). After thorough resuspen-sion, the cDNA was denatured by heating at 95°C for 5mins followed by 20 mins. at 42°C to enable annealing ofthe blocking reagents to repetitive sequences within thetarget cDNAs. The hybridisation mixture consisting ofCy3-labelled bovine and Cy5-labelled human RNA and
vice versa was placed on the blocked array under a 24 × 40mm coverslip (Menzel-Glaser, Germany). To maintainhumidity inside the chamber, 20 µl of 3x SSC was addedto the reservoir wells. The chamber was then tightly sealedand slides incubated at 42°C for 18 hrs in a waterbath.Slides were washed twice in 0.2x SSC / 0.1% SDS and thentwice in 0.2x SSC. Washes were carried out at room tem-perature with 10 min durations per wash. Finally, theslides were dried by centrifugation at 1100 rpm for 10min.
Image acquisition and data analysisFluorescence images were captured using an Affymetrix428 scanner (Affymetrix, Santa Clara, CA) with appropri-ate gains on the photomultiplier tube (PMT) to obtain thehighest intensity without saturation. A 16 bit TIFF imagewas generated for each channel for subsequent imageanalyses. Image analysis was carried out by placing thecentre of each spot manually (grid-finding step) using thesoftware AIDA (Raytest-Germany) and then by quantify-ing in a pre-defined neighbourhood around this spotcentre using a two-dimensional Gaussian distribution(quantification step).
Data analysis comprised two distinct parts. In the firstpart, data were normalised to eliminate extrinsic influenc-ing factors and artefacts not attributable to the probe-tar-get interaction. For each tissue (human and bovine brain)under analysis the whole batch of experimental replicateswas normalized simultaneously. Normalisation shouldeliminate multiplicative technical bias between the differ-ent experiments and result in the same median signal levelfor each experiment. In a first step, the local backgroundof each spot was subtracted from the spot's signal inten-sity. Then, for each experiment j the median signal, medj,was computed and a multiplicative factor was calculatedaccording to medref/medj, where medref is the globalderived from the average intensity values of the cDNAsacross the full batch of experiments. The multiplicativefactor was used to adjust the signal of the ith cDNA in thejth experiment, xij, by xij * medref/medj.
In the second part, a number of numerical characteristicswere calculated in order to quantify the cross-species com-parison. These characteristics were signal detection value,signal reproducibility and statistical significance of differ-ential expression. Signal detection was judged by anumber of empty positions that were spread across thearray. For each experiment, the proportion of signals ofempty positions lower than the actual spot signal wascalculated. Then across all repetitions, the average propor-tion was kept as the signal detection value. Employing thisprocedure, a signal strength was quantified for eachcDNA. Signal reproducibility was judged by calculating
Page 10 of 12(page number not for citation purposes)

BMC Genomics 2004, 5:83 http://www.biomedcentral.com/1471-2164/5/83
the co-efficient of variation (CV) for each cDNA across allexperiments.
In order to judge differential expression of a gene inhuman and bovine brain we calculated three statisticaltests: Student's t-test, Welch-test and Wilcoxon's rank sumtest for each cDNA based on the signal series derived fromhuman and bovine experimental repetitions. The threetests make different assumptions on the signal series.Whereas the first two assume that the series are Gaussiandistributed, the Wilcoxon test is distribution-free. Low P-values calculated by these tests indicate significant differ-ences in signal intensity within the human and bovinesamples [15].
Semi-quantitative RT-PCR analysisThe list of primers, annealing temperatures and genesunder investigation is shown in Table 1.
For primer annealing and reverse transcription, 1.0 µl(2.5µg/µl) of DNase1 treated human and bovine totalRNA was added to 2.0 µl (50 µM) Oligo-dT primer plus9.0 µl of RNAse free water. The mixture was spun brieflyand heated to 70°C for 5 mins and cooled on ice. Thereaf-ter, the following components were added sequentially,4.0 µl of 5x RT. Buffer (Invitrogen), 2.0 µl of 0.1 M DTT(Invitrogen) 1.0 µl of (10 mM) dNTP (Amersham) and1.0 µl (200 U/µl) Superscript II (Invitrogen). After pulsespinning, incubation was carried out at 42°C for 1.5 hrs.
Gene-specific PCR amplifications were carried out in atotal volume of 50 µl consisting of 5 µl of 10x PCR buffer,0.2 µl (5 U/µl) Taq Polymerase, 1.0 µl (10 mM) dNTP, 2.5µl of each (20 µM) primer, 1.5 µl (50 mM) MgCl2, 2.0 µlof the first strand cDNA (equivalent to 125 ng of inputRNA) and distilled water to 50 µl. All reagents were pur-chased from Invitrogen. Cycling parameters consisted ofan initial denaturation step at 95°C for 5 min followed by30 cycles of denaturation at 95°C for 30 sec, annealing for30 sec, elongation at 72°C for 30 sec, then a final elonga-tion step at 72°C for 5 min. Primer sequences, annealingtemperatures and predicted size of cDNA products areshown in Table 1. The amplification reaction was carriedout in a PTC 200 PCR machine (MJ Research). After PCRamplification, 50 µl of the reaction products wereresolved on 2.0 percent agarose gel containing 0.2 µg/mlethidium bromide. The gel was placed on a U.V. transillu-minator (UVP Model TFM-20, Ultra-Violet Products Ltd.,Cambridge, U.K.) with 25-watt UV tubes for high fluores-cence and high sensitivity on stained gels), and imagedwith a Photometrics Quantix 1401E, 12-bit cooled CCDcamera (Roper Scientific GmbH, Ottobrunn, Germany).Densitometric analysis of the digitized image was per-formed with the IPLab-Gel program from Scanalytics(Fairfax, VA, U.S.A.). The semi-quantitative RT-PCR assay
provides sensitive and reliable results, (26). The linearrange of amplification was determined by product quan-tification after different cycle numbers. Identical amountsof bovine and human mRNA were amplified with thesame number of PCR cycles and were always placed nextto each other on the gel. Each RT-PCR was repeated at leastthree times for each gene. The housekeeping gene β-ACTIN was used as endogenous control.
Authors' contributionJ.A. conceived the study's idea, designed and optimisedthe protocols, carried out the hybridisations and was piv-otal in developing the analysis plan and writing themanuscript.
R.H. developed the analysis plan, analysed the data andwas pivotal in writing the manuscript.
D.H and M.N designed the cross-species primers and car-ried out the semi-quantitative RT-PCR.
W.W. performed the initial image analysis.
A.BK. selected the clones used as probes for creating theChip and carried out the assignment of orthologousgenes.
T.B. assisted in the semi-quantitative RT-PCR analysis
J.W.C. was involved in the conceptualisation and writing
C.H. was instrumental in the Chip design and production.
H.N. is the Head of the Department of Biotechnology atthe Institute for Animal Science and was involved in theconceptualisation and writing.
H.L. is the Head of the Department of Vertebrate Genom-ics at the Max Planck Institute for Molecular Genetics.
Additional material
Additional File 1
Page 11 of 12(page number not for citation purposes)

BMC Genomics 2004, 5:83 http://www.biomedcentral.com/1471-2164/5/83
AcknowledgementsWe are greatful to Dr Marie-Laure Yaspo for reading the manuscript and providing valuable comments and suggestions, the microarray support staff and the RZPD for clone picking and sequencing. This work was funded by the German Ministry for Education and Research (BMBF) as part of the National Genome Research Network (NGFN).
References1. Schena M, Shalon D, Davis RW, Brown PO: Quantitative monitor-
ing of gene expression patterns with a complementary DNAmicroarray. Science 1995, 270:467-70.
2. Chismar JD, Mondala T, Fox HS, Roberts E, Langford D, Masliah E,Salomon DR, Head SR: Analysis of result variability from high-density oligonucleotide arrays comparing same-species andcross-species hybridisations. BioTechniques 2002, 33:516-524.
3. Fisslthaler B, Popp R, Kiss L, Potente M, Harder DR, Fleming I, BusseR: Cytochrome P450 2C is an EDHF synthase in coronaryarteries. Nature 1999, 401:493-497.
4. Moody DE, Zou Z, McIntyre L: Cross-species hybridisation of pigRNA to human nylon microarrays. BMC Genomics 2002, 3:27.
5. Medhora M, Bousamra M, Zhu D, Somberg L, Jacobs ER: Upregula-tion of collagens detected by gene array in a model of flow-induced pulmonary vascular remodeling. Am J Physiol Heart CircPhysiol 2002, 282:H414-22.
6. Huang GS, Yang SM, Hong MY, Yang PC, Liu YC: Differential geneexpression of livers from ApoE deficient mice. Life Sciences2000, 68:19-28.
7. Tsoi SC, Cale JM, Bird IM, Ewart V, Brown LL, Douglas S: Use ofhuman cDNA microarrays for identification of differentiallyexpressed genes in Atlantic Salmon liver during Aeromonassalmonicida infection. Mar Biotechnol (NY) 2003, 5:545-54.
8. Niemann H, Wrenzycki C: Alterations of expression of develop-mentally important genes in preimplantation bovineembryos by in vitro culture conditions: Implications for sub-sequent development. Theriogenology 2000, 53:21-34.
9. Lazzari L, Wrenzycki C, Herrmann D, Duchi R, Kruip T, Niemann H,Galli C: Cellular and molecular deviations in bovine in vitro
produce embryos are related to the Large OffspringSyndrome. Biol Reprod 2002, 67:767-775.
10. Adjaye J, Bolton V, Monk M: Developmental expression of spe-cific genes detected in high quality cDNA libraries from sin-gle human preimplantation embryos. Gene 1999, 237:373-383.
11. Brambrink T, Wabnitz P, Halter R, Klocke R, Carnwath J, Kues W,Wrenzycki C, Paul D, Niemann D: Application of cDNA arrays tomonitor mRNA profiles in single preimplantation mouseembryos. Biotechniques 2002, 33:376-385.
12. Goto T, Adjaye J, Rodeck C, Monk M: Identification of human pri-mordial germ cell specific transcribed genes by differentialdisplay. Molecular Human Reproduction 1999, 5(9):851-860.
13. Pan GJ, Chang ZY, Schöler H, Duanqing PE: Stem cell pluripotencyand transcription factor Oct4. Cell Research 2002, 12(5–6):321-329.
14. Yang YH, Dudoit S, Luu P, Lin DM, Peng V, Ngai J, Speed TP: Nor-malization for cDNA microarray data: A robust compositemethod addressing single and multiple slide systematicvariation. Nucleic Acids Res 2002, 30(4):e15.
15. Kahlem P, Sultan M, Herwig R, Steinfath M, Balzereit D, Eppens B,Saran NG, Pletcher MT, South ST, Stetten G, Lehrach H, Reeves RH,Yaspo ML: Transcript level alterations reflect gene dosageeffects across several tissues in a mouse model of DownSyndrome. Genome Res 2004, 14:1258-1267.
16. Herwig R, Aanstad P, Clark M, Lehrach H: Statistical evaluation ofdifferential expression on cDNA nylon arrays with replicatedexperiments. Nucleic Acids Res 2001, 29(23):e117.
17. Storey JD, Tibshirani R: Statistical significance for genomewidestudies. Proc Natl Acad Sci USA 2003, 100:9440-9445.
18. Frazer KA, Elnitski L, Church DM, Dubchak I, Hardison RC: Cross-species sequence comparison: A review of methods andavailable resources. Genome Res 2003, 13(1):1-12.
19. Evertsz EM, Au-Young J, Ruvolo MV, Lim AC, Reynolds MA: Hybrid-ization cross-reactivity within orthologous gene families onglass microarrays. BioTechniques 2001, 31:1182-1192.
20. Miller NA, Gong Q, Bryan R, Ruvolo M, Turner LA, LaBrie ST: Cross-hybridization of closely related genes on high-densitymacroarrays. BioTechniques 2002, 32:620-625.
21. Jimenez JL, Mitchell MJ, Sgouros JG: Microarray analysis of orthol-ogous genes:conservation of the translational machineryacross species at the sequence and expression level. GenomeBiology 2002, 4:R4.
22. Mastrangelo T, Modena P, Tornielli S, Bullrich F, Testi MA, MezzelaniA, Radice P, Azzarelli A, Pilotti S, Croce CM, Pierotti MA, Sozzi G: Anovel zinc finger gene is fused to EWS in small round celltumor. Oncogene 2000, 19(33):3799-3804.
23. Makalowski W, Zhang WJ, Boguski M: Comparative analysis of1196 orthologous mouse and human full-length mRNA andprotein sequences. Genome Res 1996, 6:846-857.
24. Girke T, Todd J, Ruuska S, White J, Benning C, Ohlrogge J: Microar-ray analysis of developing Arabidopsis seeds. Plant Physiol 2000,124:1570-1581.
25. Kane MD, Jatkoe TA, Stumpf CR, Lu J, Thomas JD, Madore SJ: Ass-esment of the sensitivity and specificity of oligonucleotide(50 mer) microarrays. Nucleic Acids Res 2000, 28:4552-4557.
26. Diehl F, Beckmann B, Kellner N, Hauser NC, Diehl S, Hoheisel JD:Manufacturing DNA microarrays from unpurified PCRproducts. Nucleic Acids Res 2002, 30:e79.
27. Knijn HM, Wrenzycki C, Hendriksen PJM, Vos PLAM, Herrmann D,van der Weijden GC, Niemann H, Dieleman SJ: Effects of oocytematuration regimen on the relative abundance of gene tran-scripts in bovine blastocysts derived in vitro or in vivo. Repro-duction 2002, 124:365-375.
Summary of the expression data and the corresponding gene annota-tions. The terms used under each column are explained viz;IMAGE ID: Gene specific identifier assigned by the IMAGE consortiumGene: HUGO gene nameChromosome: Chromosomal location of geneDescription: Gene descriptionMolecular Function: Assigned function by the Gene Ontology ConsortiumBG-tag-bovine: Signal detection probability in the bovine sam-plesBG-tag-human: Signal detection probability in the human samp-lesCV-bovine: Co-efficient of variation between replicate signal intensitiesCV-human: Co-efficient of variation between replicate signal intensitiesMean-bovine: Mean signal across all hybridisation experiments using bovine RNAlog-Mean-bovine: Logarithm (base 2) of the mean val-ueMean-human: Mean signal across all hybridisation experiments using human RNAlog-Mean-human: Logarithm (base 2) of the mean valueR-atio(bovine vs human): Ratio of the mean valueslog2(Ratio): Log-ratio (base 2) of the mean valuesP-value-Student's-t-test: P-value of Student's t-test using the replicate experimentsP-value-Welch-test: P-value of the Welch test using the replicate experimentsP-value-Wilcoxon-test: P-value of Wilcoxon's test using the replicate experimentsMatch: A BLAST hit with E-value < 1.0e-15 was found (1) or not (0)Homology: Classification of sequence homology between human gene sequence and bovine ESTs. "ortholog" = best match in both directions, "paralog" = bovine EST has its best match with another human sequence.TIGR-BTGI0-51503- Matches: Best results of the BLAST matches using the Ensembl- annotated gene sequence with the TIGR- databaseIdentity: %-identity of best matchOver-lap: Overlap in base pairsClick here for file[http://www.biomedcentral.com/content/supplementary/1471-2164-5-83-S1.xls]
Page 12 of 12(page number not for citation purposes)
http://www.ncbi.nlm.nih.gov/entrez/query.fcgi?cmd=Retrieve&db=PubMed&dopt=Abstract&list_uids=7569999
http://www.ncbi.nlm.nih.gov/entrez/query.fcgi?cmd=Retrieve&db=PubMed&dopt=Abstract&list_uids=7569999
http://www.ncbi.nlm.nih.gov/entrez/query.fcgi?cmd=Retrieve&db=PubMed&dopt=Abstract&list_uids=7569999
http://www.ncbi.nlm.nih.gov/entrez/query.fcgi?cmd=Retrieve&db=PubMed&dopt=Abstract&list_uids=8889551
http://www.ncbi.nlm.nih.gov/entrez/query.fcgi?cmd=Retrieve&db=PubMed&dopt=Abstract&list_uids=8889551