Cost Based Value Stream Mapping as a Sustainable ... - MDPI
20
sustainability Article Cost Based Value Stream Mapping as a Sustainable Construction Tool for Underground Pipeline Construction Projects Murat Gunduz * and Ayman Fahmi Naser ID Department of Civil Engineering, Qatar University, P.O. Box: 2713 Doha, Qatar; [email protected] * Correspondence: [email protected] Received: 9 November 2017; Accepted: 23 November 2017; Published: 27 November 2017 Abstract: This paper deals with application of Value Stream Mapping (VSM) as a sustainable construction tool on a real construction project of installation of underground pipelines. VSM was adapted to reduce the high percentage of non-value-added activities and time wastes during each construction stage and the paper searched for an effective way to consider the cost for studied construction of underground pipeline. This paper is unique in its way that it adopts cost implementation of VSM to improve the productivity in underground pipeline projects. The data was observed and collected from site during construction, indicating the cycle time, value added and non-value added of each construction stage. The current state was built based on these details. This was an eye-opening exercise and a process management tool as a trigger for improvement. After the current state assessment, a future state is attempted by Value Stream Mapping tool balancing the resources using a Line of Balance (LOB) technique. Moreover, a sustainable cost estimation model was developed during current state and future state to calculate the cost of underground pipeline construction. The result shows a cost reduction of 20.8% between current and future states. This reflects the importance of the cost based Value Stream Mapping in construction as a sustainable measurement tool. This new tool could be utilized in construction industry to add the sustainability and effective cost management. Keywords: Value Stream Mapping (VSM); Line of Balance (LOB); sustainable construction; underground pipeline project 1. Introduction The construction industry is increasingly moving towards the adoption of sustainable strategies and increased efficiency targets [1]. Value Stream Mapping (VSM) is a new phrase that originates from Toyota’s material and information flow diagrams and was designed to help Toyota’s suppliers learn the Toyota Production System [2]. VSM is a lean management system to assess the current state and a designed future state for the series of activities from beginning to hand-over. VSM is not just only a tool and limited to identify wastes in a system, but it is used to analyze and assist in designing processes, tracing material flow, and documenting information flow of a given product family. VSM adapts symbols to represent a clear and visual process from the customer’s requirements to the final accomplishment. Despite the efforts for sustainability studies in building and infrastructure construction, the sustainability issues in industrial construction remain understudied [3]. The application of VSM in real construction industry has not received enough attention by researchers due to the difficulty in implementation of VSM in a real construction activity. In this paper, construction of an underground pipeline project was practically assessed by VSM as a sustainable construction method. In this context, cost based Value Stream Mapping is developed as a measurement tool to build an optimized future Sustainability 2017, 9, 2184; doi:10.3390/su9122184 www.mdpi.com/journal/sustainability
-
Upload
khangminh22 -
Category
Documents
-
view
3 -
download
0
Transcript of Cost Based Value Stream Mapping as a Sustainable ... - MDPI

sustainability
Article
Cost Based Value Stream Mapping as a SustainableConstruction Tool for Underground PipelineConstruction Projects
Murat Gunduz * and Ayman Fahmi Naser ID
Department of Civil Engineering, Qatar University, P.O. Box: 2713 Doha, Qatar; [email protected]* Correspondence: [email protected]
Received: 9 November 2017; Accepted: 23 November 2017; Published: 27 November 2017
Abstract: This paper deals with application of Value Stream Mapping (VSM) as a sustainableconstruction tool on a real construction project of installation of underground pipelines. VSM wasadapted to reduce the high percentage of non-value-added activities and time wastes duringeach construction stage and the paper searched for an effective way to consider the cost forstudied construction of underground pipeline. This paper is unique in its way that it adopts costimplementation of VSM to improve the productivity in underground pipeline projects. The datawas observed and collected from site during construction, indicating the cycle time, value addedand non-value added of each construction stage. The current state was built based on these details.This was an eye-opening exercise and a process management tool as a trigger for improvement.After the current state assessment, a future state is attempted by Value Stream Mapping tool balancingthe resources using a Line of Balance (LOB) technique. Moreover, a sustainable cost estimationmodel was developed during current state and future state to calculate the cost of undergroundpipeline construction. The result shows a cost reduction of 20.8% between current and future states.This reflects the importance of the cost based Value Stream Mapping in construction as a sustainablemeasurement tool. This new tool could be utilized in construction industry to add the sustainabilityand effective cost management.
Keywords: Value Stream Mapping (VSM); Line of Balance (LOB); sustainable construction;underground pipeline project
1. Introduction
The construction industry is increasingly moving towards the adoption of sustainable strategiesand increased efficiency targets [1]. Value Stream Mapping (VSM) is a new phrase that originatesfrom Toyota’s material and information flow diagrams and was designed to help Toyota’s supplierslearn the Toyota Production System [2]. VSM is a lean management system to assess the currentstate and a designed future state for the series of activities from beginning to hand-over. VSM isnot just only a tool and limited to identify wastes in a system, but it is used to analyze and assist indesigning processes, tracing material flow, and documenting information flow of a given productfamily. VSM adapts symbols to represent a clear and visual process from the customer’s requirementsto the final accomplishment.
Despite the efforts for sustainability studies in building and infrastructure construction,the sustainability issues in industrial construction remain understudied [3]. The application of VSM inreal construction industry has not received enough attention by researchers due to the difficulty inimplementation of VSM in a real construction activity. In this paper, construction of an undergroundpipeline project was practically assessed by VSM as a sustainable construction method. In this context,cost based Value Stream Mapping is developed as a measurement tool to build an optimized future
Sustainability 2017, 9, 2184; doi:10.3390/su9122184 www.mdpi.com/journal/sustainability

Sustainability 2017, 9, 2184 2 of 20
state with less cost. Cost based Value Stream Mapping considers the customer value as the guide whichbasically eliminates the time wastes to get more production with high quality. Thus, the integrationof VSM and cost methods were used together to develop a systematic framework. The contributionof this paper to existing knowledge can be stated as introduction of a cost based VSM methodologyin underground pipeline projects. The cost based VSM technique was utilized on a real case studyto evaluate the difference between traditional cost and VSM improved cost. This paper attempts toidentify, develop and apply a concept of cost based VSM in construction sector, which can serve as anew way forward for future cost estimation.
2. Literature Review
2.1. Value Stream Mapping Principle
Value Stream Mapping (VSM) technique was introduced in second half of twentieth century byToyota Motor Company which became one of the important lean management methods. Value StreamMapping (VSM) has become a popular method for lean thinking and implementation in recent years [4].Basically, it is graphically presentation production processes starting by using a raw material as aninput to deliver the customer’s product as an output. Martin et al. [5] defined VSM as “the sequence ofactivities an organization undertakes to deliver on a customer request”.
The VSM is strictly divided into three types of operations that are undertaken: (1) Non-valueadding; (2) Necessary but non-value adding; and (3) Value-adding. The first is pure waste withunnecessary actions that should be completely eliminated. The second one involves actions that arenecessary but might be wasteful. VSM was not limited only to identifying waste in a system, but couldalso be used to analyze and assist in designing processes, tracing material flow, and documentinginformation flow of a given product or product family [2]. Wastes originates mostly from scheduledeviation and can be generated in stationary or nonstationary productions, Figure 1 illustrates the typeof wastes and provides example in each case.
VSM uses symbols to represent a clear and visual process from the customer’s requirement to thefinal accomplishment. Drawing a value stream map is the result of implementing a VSM tool.
In summary, VSM provides a visual, full-cycle macro view of how work progresses froma customer request to the final fulfilment of that request. The mapping process deepens theunderstanding of work systems that deliver value to customers and reflect the work flow from acustomer’s perspective. As a result, the process of Value Stream Mapping provides effective ways toestablish strategic directions for better decision making and work design.
Sustainability 2017, 9, 2184 2 of 20
context, cost based Value Stream Mapping is developed as a measurement tool to build an optimized future state with less cost. Cost based Value Stream Mapping considers the customer value as the guide which basically eliminates the time wastes to get more production with high quality. Thus, the integration of VSM and cost methods were used together to develop a systematic framework. The contribution of this paper to existing knowledge can be stated as introduction of a cost based VSM methodology in underground pipeline projects. The cost based VSM technique was utilized on a real case study to evaluate the difference between traditional cost and VSM improved cost. This paper attempts to identify, develop and apply a concept of cost based VSM in construction sector, which can serve as a new way forward for future cost estimation.
2. Literature Review
2.1. Value Stream Mapping Principle
Value Stream Mapping (VSM) technique was introduced in second half of twentieth century by Toyota Motor Company which became one of the important lean management methods. Value Stream Mapping (VSM) has become a popular method for lean thinking and implementation in recent years [4]. Basically, it is graphically presentation production processes starting by using a raw material as an input to deliver the customer’s product as an output. Martin et al. [5] defined VSM as “the sequence of activities an organization undertakes to deliver on a customer request”.
The VSM is strictly divided into three types of operations that are undertaken: (1) Non-value adding; (2) Necessary but non-value adding; and (3) Value-adding. The first is pure waste with unnecessary actions that should be completely eliminated. The second one involves actions that are necessary but might be wasteful. VSM was not limited only to identifying waste in a system, but could also be used to analyze and assist in designing processes, tracing material flow, and documenting information flow of a given product or product family [2]. Wastes originates mostly from schedule deviation and can be generated in stationary or nonstationary productions, Figure 1 illustrates the type of wastes and provides example in each case.
VSM uses symbols to represent a clear and visual process from the customer’s requirement to the final accomplishment. Drawing a value stream map is the result of implementing a VSM tool.
In summary, VSM provides a visual, full-cycle macro view of how work progresses from a customer request to the final fulfilment of that request. The mapping process deepens the understanding of work systems that deliver value to customers and reflect the work flow from a customer’s perspective. As a result, the process of Value Stream Mapping provides effective ways to establish strategic directions for better decision making and work design.
Figure 1. Classification of wastes in stationary and non-stationary productions. Figure 1. Classification of wastes in stationary and non-stationary productions.
Sustainability 2017, 9, 2184 3 of 20
Schmidtke et al. [6] developed an enhanced VSM method, which utilizes discrete event simulation(DES). The method featured a feasibility and trade-off analysis which is incorporated into the VSMprocedure. Sabaghi et al. [7] focused on three lean manufacturing techniques, which are Kanbanproduction system, setup time reduction, and total productive maintenance (TPM) in a plasticfabrication industry. Suarez-Barraza et al. [8] describe the implementation of a tool called SupplyChain Value Stream Mapping (SCVSM) in order to thoroughly understand competitive priorities ofvolume and delivery (On-time Delivery (OTD)) for any supply chain in organizations. Throughout thecase study by Yuvamitra et al. [9], implementing changes in both the information flow system and thematerial flow system would save an estimated 75% for the manufacturing time of the rope.
2.2. Value Stream Mapping and Sustainability in Construction
Value Stream Mapping has been used in many industries. Tyagi et al. [10] used ValueStream Mapping (VSM) to explore the wastes, inefficiencies, non-valued added steps in a single,definable process out of complete product development process. Wang et al. [11] proposed a supplierselection framework tailored to effective information integration for supply chain management.Jeong et al. [12] examined critical factors affecting productivity at the operational level, and thenforecast the productivity dynamics. By integrating BIM with construction operation simulations,they were able to develop reliable construction plans that adapted to project changes. Lee et al. [13]developed a hybrid estimation model to predict the quantity and cost of waste in the early stage ofconstruction. Jia et al. [14] proposed a Therblig-embedded Value Stream Mapping (TVSM) method toimprove the energy wastes.
Construction projects are complex systems that inherently contain complex interface problems [15].In spite of being successfully applied into different industries, the application of Value Stream Mappingin construction is limited. There are only few studies on VSM in construction, and they refer more toconstruction supplies rather than to the process itself. Pasqualini et al. [16] described the modifiedapplication of VSM in a Brazilian construction company; some adaptations were made in each stage ofVSM. Another example is a case study of housing construction. Yu et al. [17] worked on a case studyof the standard wood platform-frame structure, the case of 400 houses construction was regardedas repetitive works. These two cases demonstrate that VSM is a tool used to identify the sources ofenvironmental and production waste, quantify them, and suggest reduction strategies.
Shou et al. [18] presented a literature review of the Critical Success Factors in the implementationof VSM across five different sectors: manufacturing, healthcare, construction, product development,and service. The review covers the peer-reviewed journal articles on VSM in Scopus from 1999 to 2015.The findings of this study provide a good basis for industry practitioners to effectively implementVSM in construction industry.
Pasqualini et al. [19] presented a methodology for modeling multi-product manufacturingsystems with dynamic material, energy and information flows with the aim to generate economicand environmental value stream maps (E2VSM). The proposed methodology is validated with anindustrial case not in construction industries.
Dinesh et al. [20] described in a case study a production of a heavy-duty electrical transformerwith some approximations and simplifications with a VSM application.
Rosenbaum et al. [21] utilized a case study of the VSM application as a green-lean approach inthe construction of a hospital in order to improve its environmental and production performanceduring the structural concrete work stage. The paper presented the implementation process of thevalue stream for future state by aggregate tools to enhance productivity improvement.
Mok et al. [22] showed that VSM and simulation tools when combined together form astrong integration tool for improving the work productivity. This paper deals and covers complexenvironments of projects such as introduction of pipe spools (pipe with elbows or tees or flanges,etc.), which was not covered in Reference [22]. Moreover, this paper differs from this study byevaluating the effectiveness of integration of VSM, Line of Balance (LOB) and cost based VSM as a
Sustainability 2017, 9, 2184 4 of 20
tool to improve the value added. After the assessment of the current state, the future state of VSM isattempted by using LOB for resource levelling which has a major contribution in the cost reduction.The application of LOB technique and cost based VSM are totally new contribution to the literature inthese types of projects. In this paper, the application of VSM tools in the complex environment concludethat the micro-concepts, takt time, supermarket to facilitate pull, continuous flow and space makerwas properly utilized to facilitate VSM applications, one often requires adjustments, averaging andapproximation in terms data collection, linearity in flow and timings. These new tools are contributionto current body of knowledge. This paper developed a better understanding of VSM and how itcan be modified, with LOB method and how the manpower aspect is considered in this research.In the contrary, the manpower aspect was not considered in Reference [22]. Moreover, it introduced adeveloped concept to calculate the cost of Value Stream Mapping on a weekly basis. This techniquecan be utilized to understand the construction progress status and the future expectation. Moreover,it can be used to calculate the cost of similar projects for tendering purposes.
The above thorough literature in construction shows the importance of implementation of VSMand sustainability in construction as a lean management tool to reduce the time wastes and increasethe value added in the processes. As currently understood, VSM needs to be linked with the cost to abetter optimal production rate. This study will focus on this perspective.
2.3. Line of Balance in Lean Construction
The literature reviewed papers emphasize on VSM philosophy, identifying activities that developvalue and in line with concept of reduction of time waste. Therefore, LOB is studied in order toidentify its potential relationship as a resource levelling tool to the principles of VSM in construction.According to Pinheiro et al. (2009), repeating units of work might cause learning effects, what leadsto the reduction in activities duration. The smaller the repeating unit, the greater the learning effect,what reduces also global lead time.
This study utilized LOB tool as a planning device that gives support to the VSM concept byproper utilizing the resources to calculate the cost based VSM.
3. Methodology
There is limited research that utilized a VSM to calculate the cost for current and future states inthe construction industry. Such studies were concentrated and focused on manufacturing domain only.In this study, the concept of cost reduction was addressed in construction by using a Value StreamMapping. More specifically, the Value Stream Mapping was applied on a real underground pipelineproject. The construction processes were optimized based on the cost according to Value StreamMapping technique. This was achieved by comparing a cost of current state with a cost of future state,which attempts to evaluate the objective of Value Stream Mapping in construction. The same can beset as a model for proper utilization and estimation to similar repetitive projects in future. Cost itemsinclude labor cost, materials cost, production support cost, equipment cost, operation support cost,facilities and maintenance cost, all other value stream cost, as shown in Figure 2.
The very first step in this study is to form a comprehensive current state for the constructionprocess. This is a vital step as it lays the ground for a full understanding the processes in constructionand find out the time wastes. By the Value Stream Mapping concept, the wastes were measuredand identified in the current state. Then, the future state was formulated accordingly to improve theproductivity and reduce the time wastes. Work plan and required manpower was set according tofeedback from current state to optimize the process and ensure wastes are minimized in combinationwith Line of Balance technique (LOB).

Sustainability 2017, 9, 2184 5 of 20Sustainability 2017, 9, 2184 5 of 20
Figure 2. The elements for cost based Value Stream Mapping (VSM).
The basic concepts of LOB have been applied in the construction industry as a resource driven scheduling method. Line of Balance (LOB) is a method of showing the repetitive work that may exist in a project as a single line on a graph. Recently LOB has been associated with lean construction applications, especially as a tool for tactical planning of works. In this study, LOB will be introduced along with the VSM to reduce the lead time. The smaller the repeating unit, the greater the learning effect, what reduces also global lead time as shown in Figure 3.
Figure 3. Improvement of the total lead time for repetitive work.
The cost based of Value Stream Mapping is calculated weekly and it takes into account of all costs related to value stream. The cost calculation was done for current and future states and then a comparison between them has been evaluated for estimation and bidding purpose for similar future projects.
4. Data Characteristics
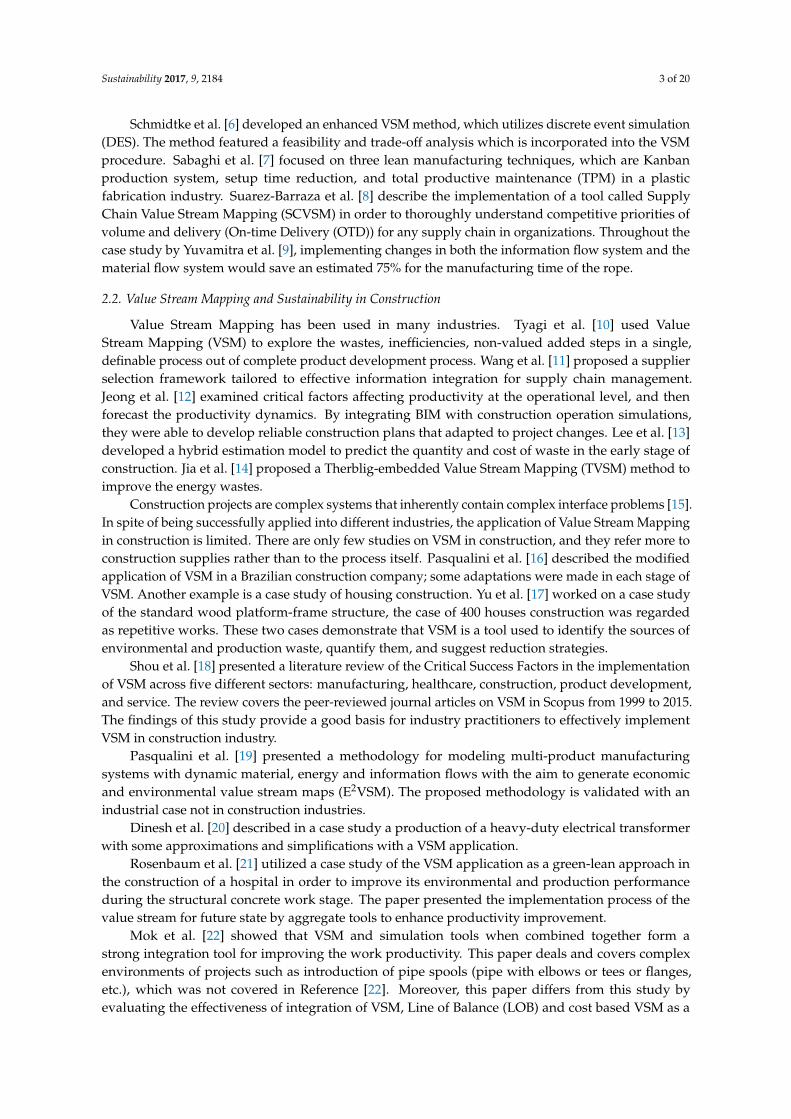
In this study, an underground pipeline project was selected to apply VSM. The main purpose of selection is the effectiveness in data collection and repetitiveness of the activities. As per project contract, the scope of work was construction of a pipeline (36-inch diameter) with a network of 36.5 km. The first step in the Value Stream Mapping technique is to develop a process flow diagram to provide a clear picture about every stage for the construction of underground pipeline. Figure 4 shows the work flow diagram for the Value Stream Mapping.
Figure 2. The elements for cost based Value Stream Mapping (VSM).
The basic concepts of LOB have been applied in the construction industry as a resource drivenscheduling method. Line of Balance (LOB) is a method of showing the repetitive work that may existin a project as a single line on a graph. Recently LOB has been associated with lean constructionapplications, especially as a tool for tactical planning of works. In this study, LOB will be introducedalong with the VSM to reduce the lead time. The smaller the repeating unit, the greater the learningeffect, what reduces also global lead time as shown in Figure 3.
Sustainability 2017, 9, 2184 5 of 20
Figure 2. The elements for cost based Value Stream Mapping (VSM).
The basic concepts of LOB have been applied in the construction industry as a resource driven scheduling method. Line of Balance (LOB) is a method of showing the repetitive work that may exist in a project as a single line on a graph. Recently LOB has been associated with lean construction applications, especially as a tool for tactical planning of works. In this study, LOB will be introduced along with the VSM to reduce the lead time. The smaller the repeating unit, the greater the learning effect, what reduces also global lead time as shown in Figure 3.
Figure 3. Improvement of the total lead time for repetitive work.
The cost based of Value Stream Mapping is calculated weekly and it takes into account of all costs related to value stream. The cost calculation was done for current and future states and then a comparison between them has been evaluated for estimation and bidding purpose for similar future projects.
4. Data Characteristics
In this study, an underground pipeline project was selected to apply VSM. The main purpose of selection is the effectiveness in data collection and repetitiveness of the activities. As per project contract, the scope of work was construction of a pipeline (36-inch diameter) with a network of 36.5 km. The first step in the Value Stream Mapping technique is to develop a process flow diagram to provide a clear picture about every stage for the construction of underground pipeline. Figure 4 shows the work flow diagram for the Value Stream Mapping.
Figure 3. Improvement of the total lead time for repetitive work.
The cost based of Value Stream Mapping is calculated weekly and it takes into account of allcosts related to value stream. The cost calculation was done for current and future states and thena comparison between them has been evaluated for estimation and bidding purpose for similarfuture projects.
4. Data Characteristics
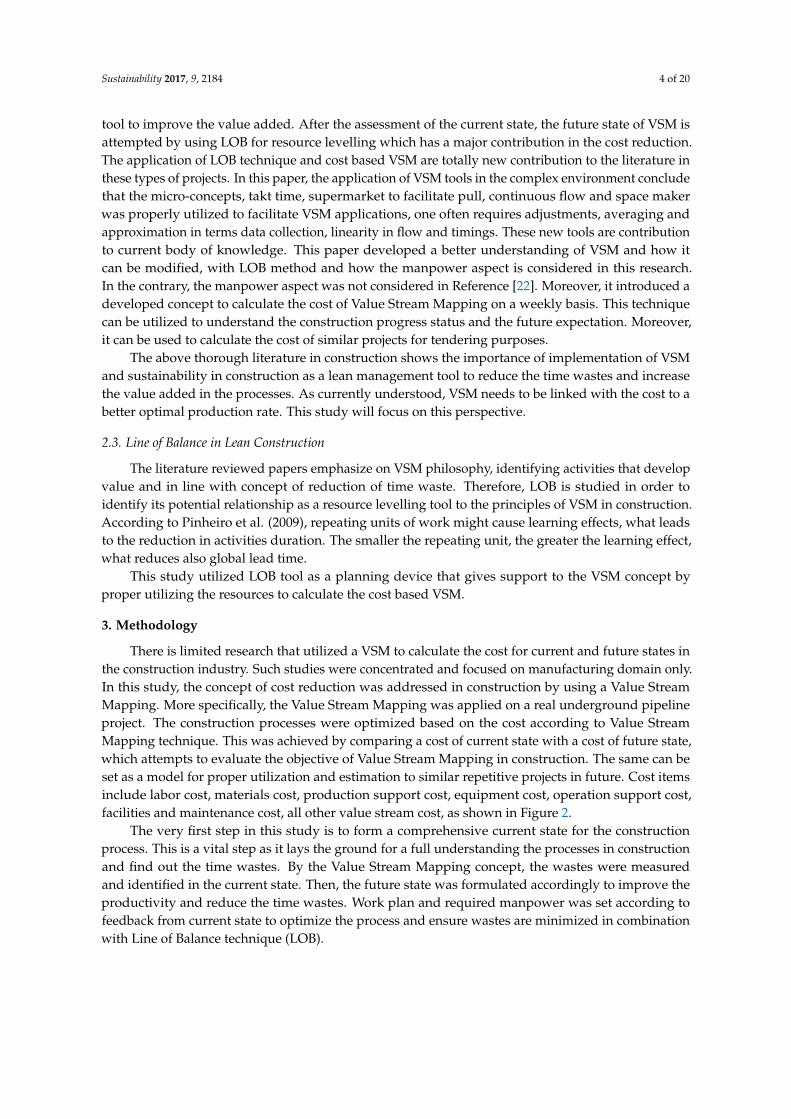
In this study, an underground pipeline project was selected to apply VSM. The main purposeof selection is the effectiveness in data collection and repetitiveness of the activities. As per projectcontract, the scope of work was construction of a pipeline (36-inch diameter) with a network of 36.5 km.The first step in the Value Stream Mapping technique is to develop a process flow diagram to providea clear picture about every stage for the construction of underground pipeline. Figure 4 shows thework flow diagram for the Value Stream Mapping.
Sustainability 2017, 9, 2184 6 of 20Sustainability 2017, 9, 2184 6 of 20
Figure 4. Work flow diagram.
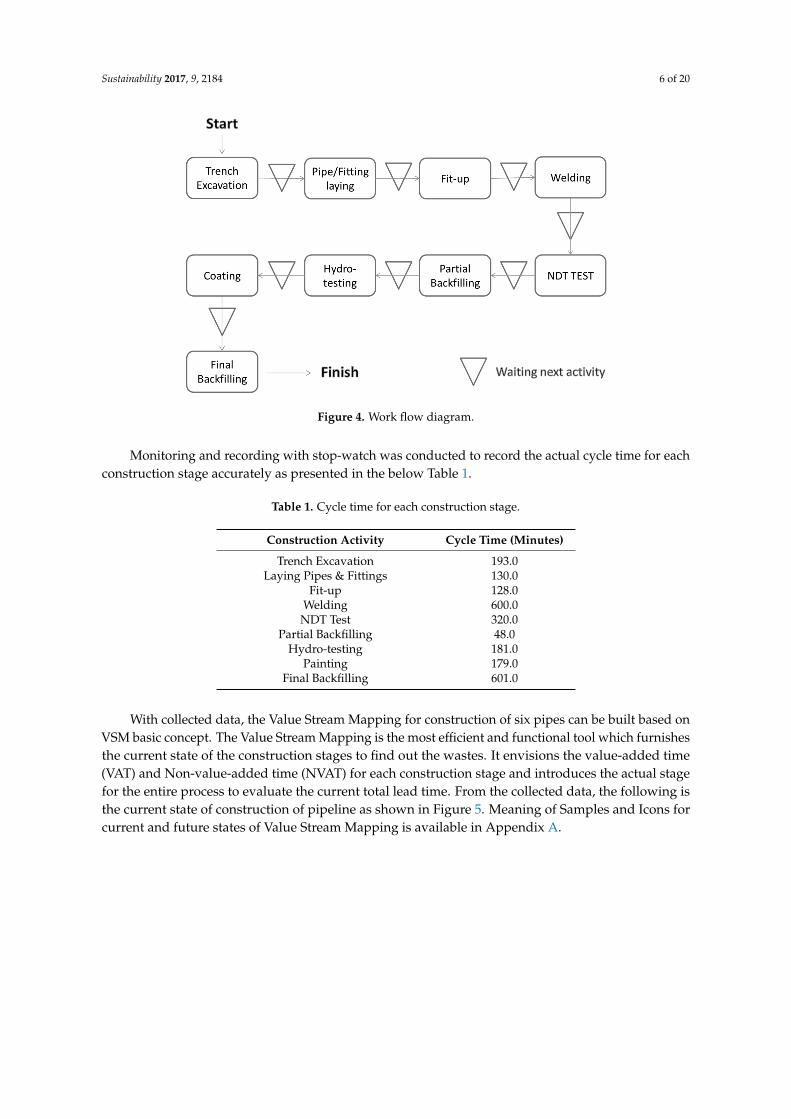
Monitoring and recording with stop-watch was conducted to record the actual cycle time for each construction stage accurately as presented in the below Table 1.
Table 1. Cycle time for each construction stage.
Construction Activity Cycle Time (Minutes) Trench Excavation 193.0
Laying Pipes & Fittings 130.0 Fit-up 128.0
Welding 600.0 NDT Test 320.0
Partial Backfilling 48.0 Hydro-testing 181.0
Painting 179.0 Final Backfilling 601.0
With collected data, the Value Stream Mapping for construction of six pipes can be built based on VSM basic concept. The Value Stream Mapping is the most efficient and functional tool which furnishes the current state of the construction stages to find out the wastes. It envisions the value-added time (VAT) and Non-value-added time (NVAT) for each construction stage and introduces the actual stage for the entire process to evaluate the current total lead time. From the collected data, the following is the current state of construction of pipeline as shown in Figure 5. Meaning of Samples and Icons for current and future states of Value Stream Mapping is available in Appendix A.
Figure 4. Work flow diagram.
Monitoring and recording with stop-watch was conducted to record the actual cycle time for eachconstruction stage accurately as presented in the below Table 1.
Table 1. Cycle time for each construction stage.
Construction Activity Cycle Time (Minutes)
Trench Excavation 193.0Laying Pipes & Fittings 130.0
Fit-up 128.0Welding 600.0NDT Test 320.0
Partial Backfilling 48.0Hydro-testing 181.0
Painting 179.0Final Backfilling 601.0
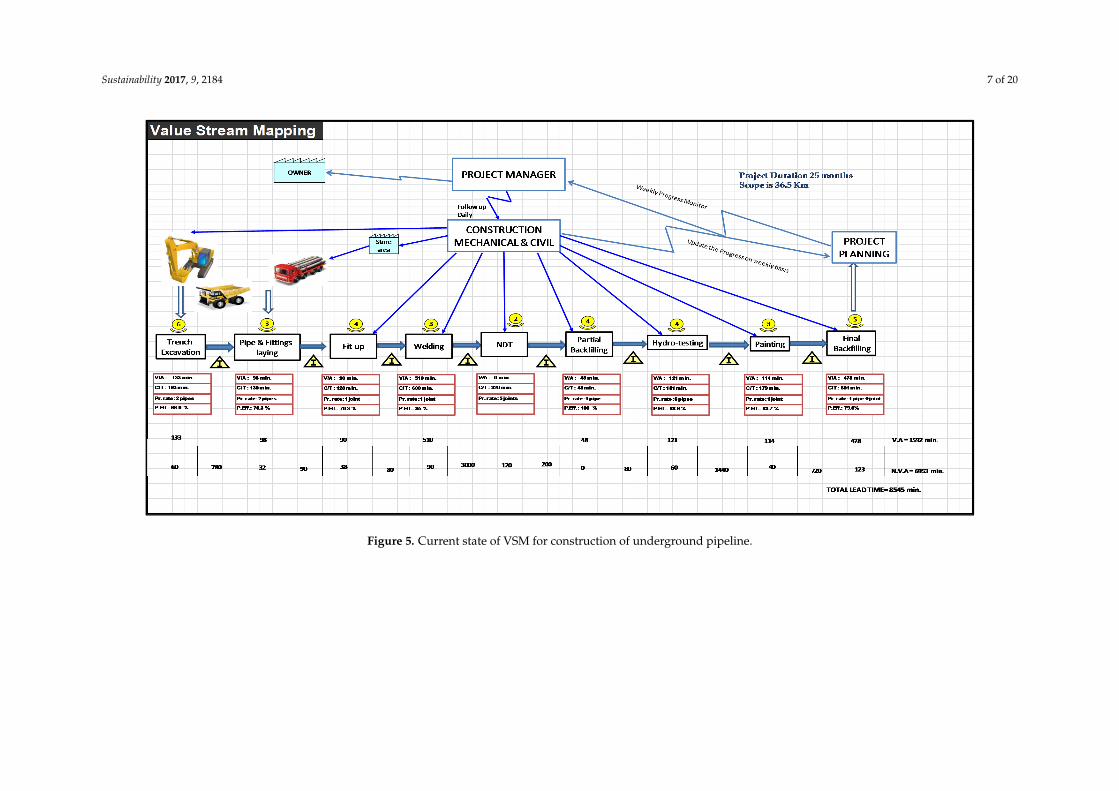
With collected data, the Value Stream Mapping for construction of six pipes can be built based onVSM basic concept. The Value Stream Mapping is the most efficient and functional tool which furnishesthe current state of the construction stages to find out the wastes. It envisions the value-added time(VAT) and Non-value-added time (NVAT) for each construction stage and introduces the actual stagefor the entire process to evaluate the current total lead time. From the collected data, the following isthe current state of construction of pipeline as shown in Figure 5. Meaning of Samples and Icons forcurrent and future states of Value Stream Mapping is available in Appendix A.
Sustainability 2017, 9, 2184 7 of 20Sustainability 2017, 9, 2184 7 of 18
Sustainability 2017, 9, 2184; doi:10.3390/su9122184 www.mdpi.com/journal/sustainability
Figure 5. Current state of VSM for construction of underground pipeline.
Figure 5. Current state of VSM for construction of underground pipeline.
Sustainability 2017, 9, 2184 8 of 20
5. Data Analysis for Current State of VSM
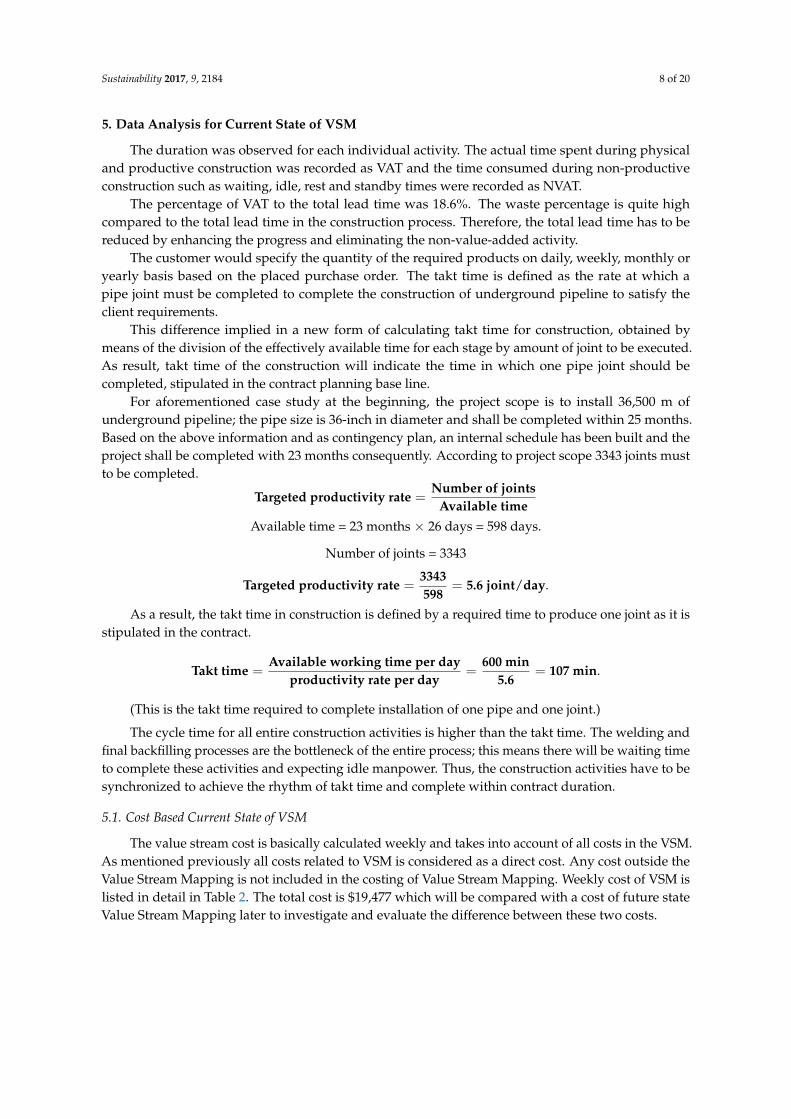
The duration was observed for each individual activity. The actual time spent during physicaland productive construction was recorded as VAT and the time consumed during non-productiveconstruction such as waiting, idle, rest and standby times were recorded as NVAT.
The percentage of VAT to the total lead time was 18.6%. The waste percentage is quite highcompared to the total lead time in the construction process. Therefore, the total lead time has to bereduced by enhancing the progress and eliminating the non-value-added activity.
The customer would specify the quantity of the required products on daily, weekly, monthly oryearly basis based on the placed purchase order. The takt time is defined as the rate at which apipe joint must be completed to complete the construction of underground pipeline to satisfy theclient requirements.
This difference implied in a new form of calculating takt time for construction, obtained bymeans of the division of the effectively available time for each stage by amount of joint to be executed.As result, takt time of the construction will indicate the time in which one pipe joint should becompleted, stipulated in the contract planning base line.
For aforementioned case study at the beginning, the project scope is to install 36,500 m ofunderground pipeline; the pipe size is 36-inch in diameter and shall be completed within 25 months.Based on the above information and as contingency plan, an internal schedule has been built and theproject shall be completed with 23 months consequently. According to project scope 3343 joints mustto be completed.
Targeted productivity rate =Number of joints
Available timeAvailable time = 23 months × 26 days = 598 days.
Number of joints = 3343
Targeted productivity rate =3343598
= 5.6 joint/day.
As a result, the takt time in construction is defined by a required time to produce one joint as it isstipulated in the contract.
Takt time =Available working time per day
productivity rate per day=
600 min5.6
= 107 min.
(This is the takt time required to complete installation of one pipe and one joint.)
The cycle time for all entire construction activities is higher than the takt time. The welding andfinal backfilling processes are the bottleneck of the entire process; this means there will be waiting timeto complete these activities and expecting idle manpower. Thus, the construction activities have to besynchronized to achieve the rhythm of takt time and complete within contract duration.
5.1. Cost Based Current State of VSM
The value stream cost is basically calculated weekly and takes into account of all costs in the VSM.As mentioned previously all costs related to VSM is considered as a direct cost. Any cost outside theValue Stream Mapping is not included in the costing of Value Stream Mapping. Weekly cost of VSM islisted in detail in Table 2. The total cost is $19,477 which will be compared with a cost of future stateValue Stream Mapping later to investigate and evaluate the difference between these two costs.

Sustainability 2017, 9, 2184 9 of 20
Table 2. Cost of current state activities.
Current State of VSM Employee Cost ($) ProductionSupport Cost ($)
MaintenanceCost ($)
Machine/EquipmentCost ($)
Other Costs($)
TotalCost ($)
Trench Excavation 1306 250 550 1096 3202Pipe & fittings laying 583 286 389 603 1861
Fit-up 755 250 1005Welding 617 500 150 274 300 1841
NDT 20 350 370Partial Backfilling 1062 150 822 2034
Hydro-testing 754 145 130 250 1279Painting 617 250 95 962
Final Backfilling 822 250 255 1096 24234500 (Construction Managers and Site Engineers) 4500
Total 19,477
Note: Employee cost: is the basic salary including the employee benefit. Production support cost: Expenses not directly associated with construction activities such as design, engineering,and procurement. Maintenance cost: Cost to keep equipment or machine in good working condition. Machine/Equipment cost: In this research, rental and operating cost.
Sustainability 2017, 9, 2184 10 of 20
5.2. Suggested Improvement and Future State of VSM
The following suggested improvements were developed according to the construction status inguidance with the implementation of the modified basic concept of Value Stream Mapping.
(a) Pull system and synchronize first-in/first-out flow:
Trench excavation, partial and final backfilling: the process cycle time for each activity is higherthan takt time. The required improvement is to reduce the non-value added especially the waitingtime which is required to prepare the trench, bedding and inspection prior to place and laying thepipes. The excavation is the first construction activity; thus, it would be better to assign an excavationteam to start the excavation activity one hour in advance which would provide enough time for thenext activity to start earlier. Moreover, it was proposed to introduce a continuous flow and developan open work front by eliminating the partial backfilling activity. The agreement between the maincontractor and consultant was developed to proceed with painting and coating after completion ofNDT (Non-destructive test). Then, the pipeline will be backfilled finally to be ready for final testing.In Value Stream Mapping, it is called first-in/first-out or pull system, where a downstream pulls theupstream activity to improve the work flow and improve the utilization of manpower and equipment.Thus, 24 hours was given to backfilling team to complete the final backfilling after completion offive joints. The application of continuous flow, the non-value-added time for trench excavation,partial backfilling and final backfilling has been reduced.
(b) Combined and restructured the work activities (fit-up and welding activities):
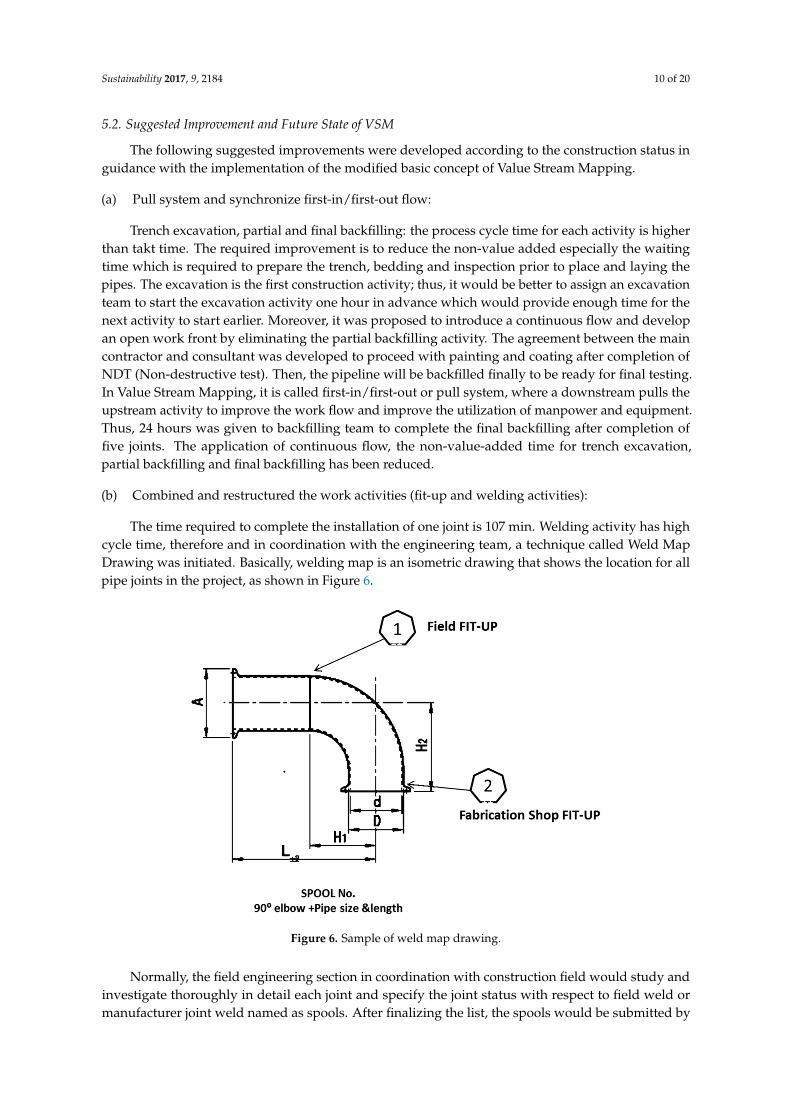
The time required to complete the installation of one joint is 107 min. Welding activity has highcycle time, therefore and in coordination with the engineering team, a technique called Weld MapDrawing was initiated. Basically, welding map is an isometric drawing that shows the location for allpipe joints in the project, as shown in Figure 6.
Sustainability 2017, 9, 2184 10 of 18
Sustainability 2017, 9, 2184; doi:10.3390/su9122184 www.mdpi.com/journal/sustainability
5.2. Suggested Improvement and Future State of VSM
The following suggested improvements were developed according to the construction status in guidance with the implementation of the modified basic concept of Value Stream Mapping.
(a) Pull system and synchronize first-in/first-out flow:
Trench excavation, partial and final backfilling: the process cycle time for each activity is higher than takt time. The required improvement is to reduce the non-value added especially the waiting time which is required to prepare the trench, bedding and inspection prior to place and laying the pipes. The excavation is the first construction activity; thus, it would be better to assign an excavation team to start the excavation activity one hour in advance which would provide enough time for the next activity to start earlier. Moreover, it was proposed to introduce a continuous flow and develop an open work front by eliminating the partial backfilling activity. The agreement between the main contractor and consultant was developed to proceed with painting and coating after completion of NDT (Non-destructive test). Then, the pipeline will be backfilled finally to be ready for final testing. In Value Stream Mapping, it is called first-in/first-out or pull system, where a downstream pulls the upstream activity to improve the work flow and improve the utilization of manpower and equipment. Thus, 24 hours was given to backfilling team to complete the final backfilling after completion of five joints. The application of continuous flow, the non-value-added time for trench excavation, partial backfilling and final backfilling has been reduced.
(b) Combined and restructured the work activities (fit-up and welding activities):
The time required to complete the installation of one joint is 107 min. Welding activity has high cycle time, therefore and in coordination with the engineering team, a technique called Weld Map Drawing was initiated. Basically, welding map is an isometric drawing that shows the location for all pipe joints in the project, as shown in Figure 6.
Figure 6. Sample of weld map drawing.
Normally, the field engineering section in coordination with construction field would study and investigate thoroughly in detail each joint and specify the joint status with respect to field weld or manufacturer joint weld named as spools. After finalizing the list, the spools would be submitted by construction team to manufacturer, this would allow construction and spool manufacturer to track and expedite the spool fabrication till completion date. By weld map drawing and spool concept, the
Figure 6. Sample of weld map drawing.
Normally, the field engineering section in coordination with construction field would study andinvestigate thoroughly in detail each joint and specify the joint status with respect to field weld ormanufacturer joint weld named as spools. After finalizing the list, the spools would be submitted by

Sustainability 2017, 9, 2184 11 of 20
construction team to manufacturer, this would allow construction and spool manufacturer to trackand expedite the spool fabrication till completion date. By weld map drawing and spool concept,the welding cycle and lead times will be reduced accordingly. To speed up the welding process,the construction team may ask the engineering to generate a list of tack welding spools.
In this study, the joints that can be fabricated in the shop by manufacturer are 1171 joints and theconstruction team suggested to reduce the idle time of the workers by merging the group of fit-upand welding teams for identical tasks. The pipefitters were subject to tack welding training for twoweeks period which enhanced the productivity of welding process. The implication for the abovestrategy was significant. The observation for welding activity cycle time is reduced and total lead timeis reduced as well.
(c) Production leveling by pacemaker/supermarket:
Welding and NDT activities: The concept of Supermarket Pull System between welding processand NDT process was introduced. Basically, the supermarket pull system is a controlled inventory ofjoints that is subject to testing schedule in due course according to site situation. Therefore, the jointswere accumulated to perform NDT test in one shot. Moreover, the NDT was schedule to be during thenight to perform more tests without any interruption. According to project baseline.
Schedule, the takt time was schedule to produce 5 joints per day to meet the project completiondate. The completion date was scheduled two months ahead, as a safety factor. The proposal wasintroduced to prepare 5 joints for test which facilitate an open front for other activities and optimizethe resources effectively.
The concept of pacemaker loop encompasses the flow of information and material between themainly construction and testing. The downstream loop is impacted by the upstream loop and thiscan’t be done without proper scheduling and continuous development.
(d) Work restructuring to improve the construction reliability:
Hydro-testing was scheduled after completing the NDT test, painting and final backfilling,which was in coordination and approval of project resident engineer. To ensure a proper stabilityand anchorage for the network integrity, the final backfilling has taken place prior to proceed withhydro-test. This was suggested to apply the concept of Supermarket Pull system and to ensure acontinuous flow. This can be achieved by batch of Kanban (It is a Japanese term that gives authorizationand instructions for the production or withdrawal conveyance of items in a pull system) by preparinga minimum of 5 completed welded joints for NDT test and build a ready pipeline for hydro-testaccording to site condition. By this improvement hydro-testing activity were improved significantly.
(e) Painting:
The cycle time of the painting process is higher than takt time, thus, the wastes and waitingtime has to be minimized. Due to the super market concept which was introduced and developedbetween welding and NDT activities, the continuous flow is generated to catch-up the quantity ofjoints generated after hydro-testing.
(f) Manpower leveling and LOB (Line of Balance):
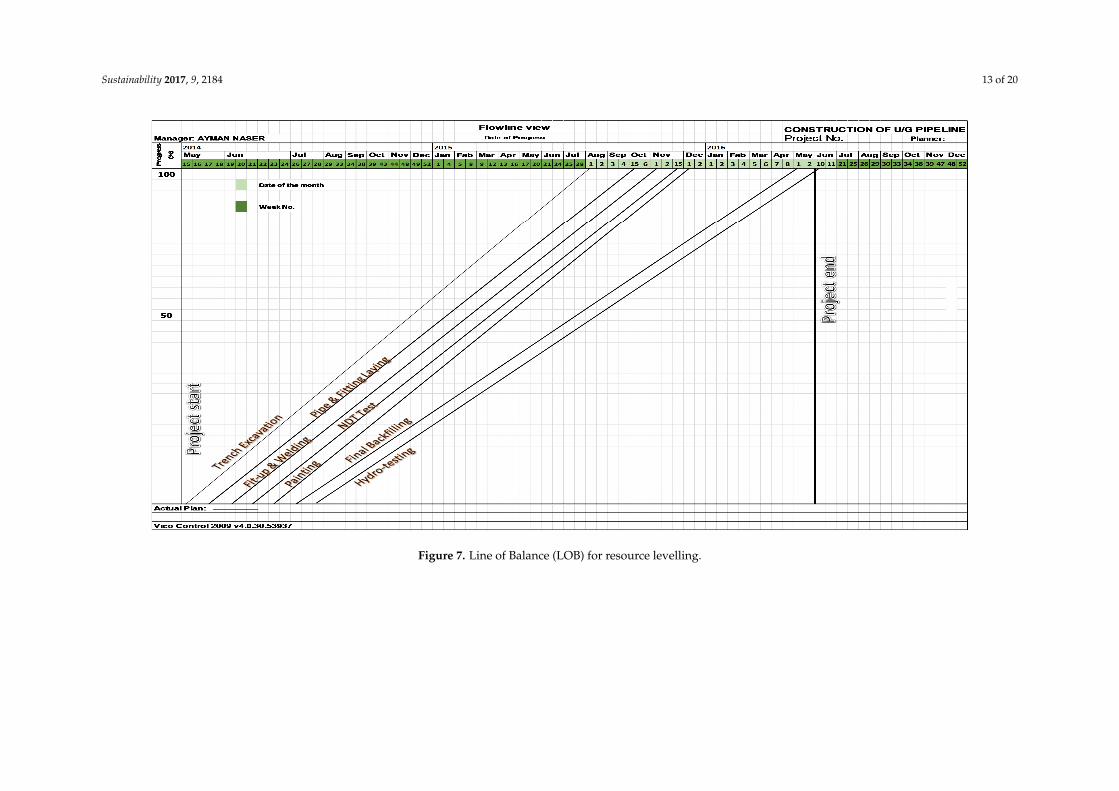
Integration of LOB with VSM played a vital role to level the required manpower. In this study,the resource leveling was achieved by identifying the number of crews required to complete the projecton the time. The study used velocity rating diagram to find required resources for each stage so eachwork stage can be done by synchronized crew and continue without interruption. According to LOBtechnique, the following information was applied:
- Vertical axis plots cumulative progress of number of joints completed in the project.Horizontal axis plots time and sloping lines represent rate of production i.e., number of jointsper day.
Sustainability 2017, 9, 2184 12 of 20
- To complete the project and minimize the waste and lead time, the crews are distributedas following:
(1) Two crews for excavation and final backfilling. Each crew consists three civil workersunder one supervisor.
(2) One crew for pipes and fittings laying (three pipe fitters)(3) One crew for fit-up and welding (four welders and three helpers)(4) One crew for NDT testing (two NDT technicians)(5) One crew for painting (three painters)(6) One crew for hydro-testing (four mechanical/pipe fitters).
The repetitive activities are distributed uniformly to ensure a proper utilization of manpower andtools, as in Figure 7.
5.3. Proposed Future State of VSM
The previously mentioned improvements were implemented in the current state to achieve thefuture state as illustrated below in the Figure 8.
Sustainability 2017, 9, 2184 13 of 20Sustainability 2017, 9, 2184 13 of 18
Sustainability 2017, 9, 2184; doi:10.3390/su9122184 www.mdpi.com/journal/sustainability
Figure 7. Line of Balance (LOB) for resource levelling. Figure 7. Line of Balance (LOB) for resource levelling.

Sustainability 2017, 9, 2184 14 of 20Sustainability 2017, 9, 2184 14 of 20
Figure 8. Future state of VSM for construction of underground pipeline.
Figure 8. Future state of VSM for construction of underground pipeline.

Sustainability 2017, 9, 2184 15 of 20
Future state of VSM shows a significant improvement in the construction process. It has beenobserved with a reduction of total lead time, reduction in the time wastes (NVA) and increase in valueadded time (VA). Table 3 shows the achieved improvements:
- The lead time was calculated in current state 8545 min based on construction of one joint. While,the total lead time in the future state is 5922 min. There is an improvement of 30.7%.
- The value-added time in current state is 1592 min, and it is improved by 43.3% as 903 min.- With application of VSM, the non-value-added time is reduced by 27.8%. The NVA was reduced
from 5019 min to 6953 min.- The comparison of production capacity for current and future states is based on one joint and
one pipe for current and future states of VSM.
Table 3. Production capacity comparison between current and future states of VSM.
Construction Activity Current State Future State Improvement
Lead Time (min) 8545 5922 30.7%Value Added (min) 1592 903 43.3%
Non-Value added (min) 6953 5019 27.8%Production capacity 1 joint/1 pipe 1 joint/1 pipe
As a result, future state map has to be validated on continuous improvement basis. Takt time forthe construction can be calculated based on the customer’s requirement and according to signedcontract between the parties. Thus, each process possesses different takt time to be executedand calculated accordingly. Therefore, takt time shall be developed by establishing a pull system,introduce a levelling system, and establish a pacemaker loop for the future state of VSM. The takt timefor supply and pacemaker loops was developed to meet the contract completion date. The time forsupply loop is 2307 min and the required time to complete the pacemaker loop is 4700 min with acontrol inventory of supermarket time of 3000 min. The construction capacity was adjusted to constructfive joints and six pipes. Thus, the takt time for each process loop was balanced to meet the projectcompletion date accordingly.
5.4. Cost Based Future State of VSM
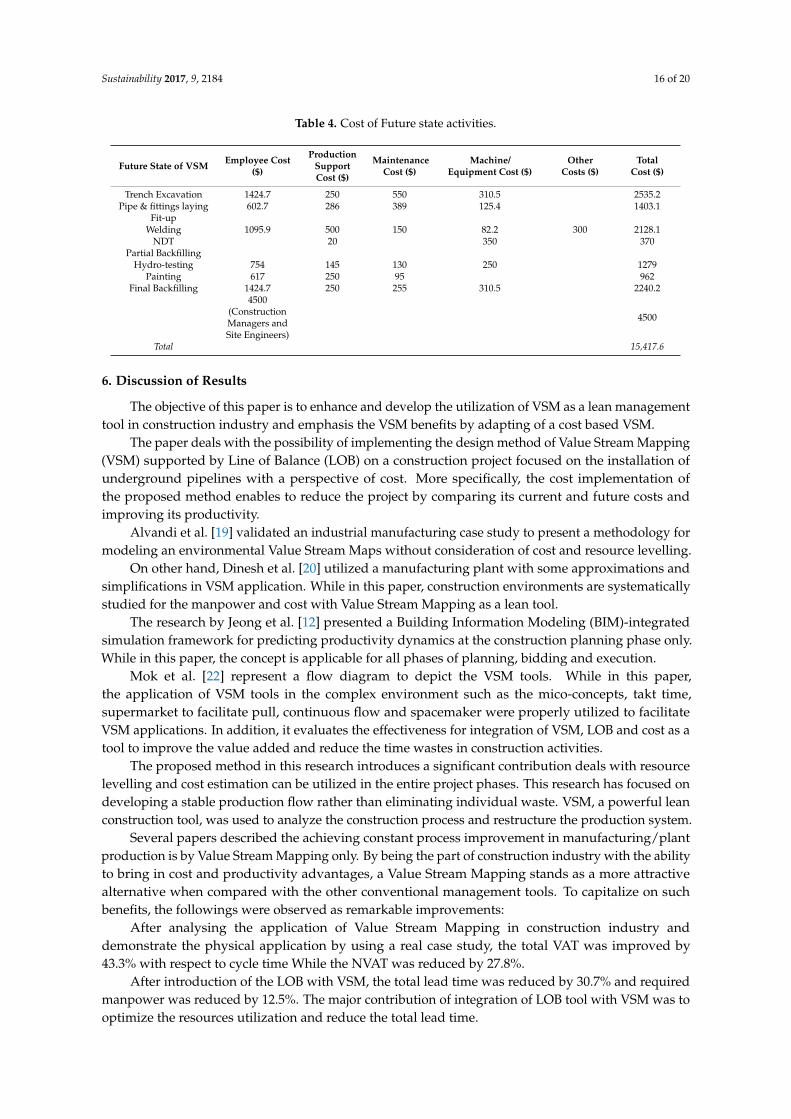
Cost of future state was calculated to evaluate the importance of total cost reduction by ValueStream Mapping. After suggestion improvements and the formulation of future state of Value StreamMapping, the cost has been calculated and summarized in Table 4 of the weekly period as previouslyimplemented in the current state.
In comparison between the cost based for current and future states of Value Stream Mapping,the reduction in cost is 20.8%. It shows the importance of utilizing the Value Stream Mapping inconstruction as a management tool. Moreover, this technique provides an accurate cost calculationmethod that can be used for tendering purposes.
Sustainability 2017, 9, 2184 16 of 20
Table 4. Cost of Future state activities.
Future State of VSM Employee Cost($)
ProductionSupportCost ($)
MaintenanceCost ($)
Machine/Equipment Cost ($)
OtherCosts ($)
TotalCost ($)
Trench Excavation 1424.7 250 550 310.5 2535.2Pipe & fittings laying 602.7 286 389 125.4 1403.1
Fit-upWelding 1095.9 500 150 82.2 300 2128.1
NDT 20 350 370Partial Backfilling
Hydro-testing 754 145 130 250 1279Painting 617 250 95 962
Final Backfilling 1424.7 250 255 310.5 2240.24500
(ConstructionManagers andSite Engineers)
4500
Total 15,417.6
6. Discussion of Results
The objective of this paper is to enhance and develop the utilization of VSM as a lean managementtool in construction industry and emphasis the VSM benefits by adapting of a cost based VSM.
The paper deals with the possibility of implementing the design method of Value Stream Mapping(VSM) supported by Line of Balance (LOB) on a construction project focused on the installation ofunderground pipelines with a perspective of cost. More specifically, the cost implementation ofthe proposed method enables to reduce the project by comparing its current and future costs andimproving its productivity.
Alvandi et al. [19] validated an industrial manufacturing case study to present a methodology formodeling an environmental Value Stream Maps without consideration of cost and resource levelling.
On other hand, Dinesh et al. [20] utilized a manufacturing plant with some approximations andsimplifications in VSM application. While in this paper, construction environments are systematicallystudied for the manpower and cost with Value Stream Mapping as a lean tool.
The research by Jeong et al. [12] presented a Building Information Modeling (BIM)-integratedsimulation framework for predicting productivity dynamics at the construction planning phase only.While in this paper, the concept is applicable for all phases of planning, bidding and execution.
Mok et al. [22] represent a flow diagram to depict the VSM tools. While in this paper,the application of VSM tools in the complex environment such as the mico-concepts, takt time,supermarket to facilitate pull, continuous flow and spacemaker were properly utilized to facilitateVSM applications. In addition, it evaluates the effectiveness for integration of VSM, LOB and cost as atool to improve the value added and reduce the time wastes in construction activities.
The proposed method in this research introduces a significant contribution deals with resourcelevelling and cost estimation can be utilized in the entire project phases. This research has focused ondeveloping a stable production flow rather than eliminating individual waste. VSM, a powerful leanconstruction tool, was used to analyze the construction process and restructure the production system.
Several papers described the achieving constant process improvement in manufacturing/plantproduction is by Value Stream Mapping only. By being the part of construction industry with the abilityto bring in cost and productivity advantages, a Value Stream Mapping stands as a more attractivealternative when compared with the other conventional management tools. To capitalize on suchbenefits, the followings were observed as remarkable improvements:
After analysing the application of Value Stream Mapping in construction industry anddemonstrate the physical application by using a real case study, the total VAT was improved by43.3% with respect to cycle time While the NVAT was reduced by 27.8%.
After introduction of the LOB with VSM, the total lead time was reduced by 30.7% and requiredmanpower was reduced by 12.5%. The major contribution of integration of LOB tool with VSM was tooptimize the resources utilization and reduce the total lead time.
Sustainability 2017, 9, 2184 17 of 20
The cost is reduced by 20.8% in comparison between two VSM states.
7. Conclusions and Recommendations
This paper developed a better understanding of VSM and how it can be modified, with LOB to beapplied in the construction industry. Moreover, it is introduced a developed concept to calculate thecost of Value Stream Mapping on a weekly basis. This technique can be utilized to understand theconstruction progress status and the future expectation. Moreover, it can be used to calculate the costof similar projects for tendering purposes.
This paper attempts to address the application of Value Stream Mapping to a real-life problemof an underground pipeline project. It analyzed the improvement of VAT and reduction of NVATcompared with the cycle time. It studied the reduction opportunity in total lead time. LOB tool withVSM as a new tool provided a powerful attempt for proper resources utilization and monitoring toimprove the VAT and decrease the total lead time.
Although several papers addressed using VSM as a lean tool to reduce waste and add valueduring the construction process, no detailed and unified VSM instructions exist concerning how toimplement it in construction to evaluate the improvements and calculate the cost reduction. This papertried to cover this gap. Suggested improvements will result in achieving the production and capacitydemand to meet project completion deadline. Future research can be extended and focused further onthe following: Applying Value Stream Mapping for other repetitive and non-repetitive constructionactivities; integrating and combining VSM with other tactics and lean management tools to improvethe benefits of Value Stream Mapping in the construction industry; incorporating and evaluating thecost based VSM for bidding and estimation purpose; introduction of a simulation based VSM softwarethat can be used to study the construction time and cost in advance for future construction.
This study has some limitations as it deals with a specific construction company and differentenvironments, such as—but not limited to—a project, owner, project specifications, main contractor,operations and other environment-based constraints.
Another limitation is the process of integration the cost-based of Value Stream Mapping concept inthe budget and estimation calculation as a vital tool in the construction companies for biding purpose.This can be developed for future studies.
Moreover, no simulation modeling was used to develop different scenario requirements tocompare current state with different scenarios for future state and optimize the cost. This can beexpanded for future research.
To extend the body of knowledge, the paper findings can be attempted for other areas such asconstruction of high-rise building. Similarly, the construction challenges for green building can alsoattended under the umbrella of Value Stream Mapping.
Author Contributions: Both authors were involved in the development of this paper. Murat Gunduz and AymanFahmi Naser organized the paper together. Both authors worked together during the development of graduatestudy outputs of Ayman Fahmi Naser into this paper.
Conflicts of Interest: The authors declare no conflict of interest.
Sustainability 2017, 9, 2184 18 of 20
Appendix A
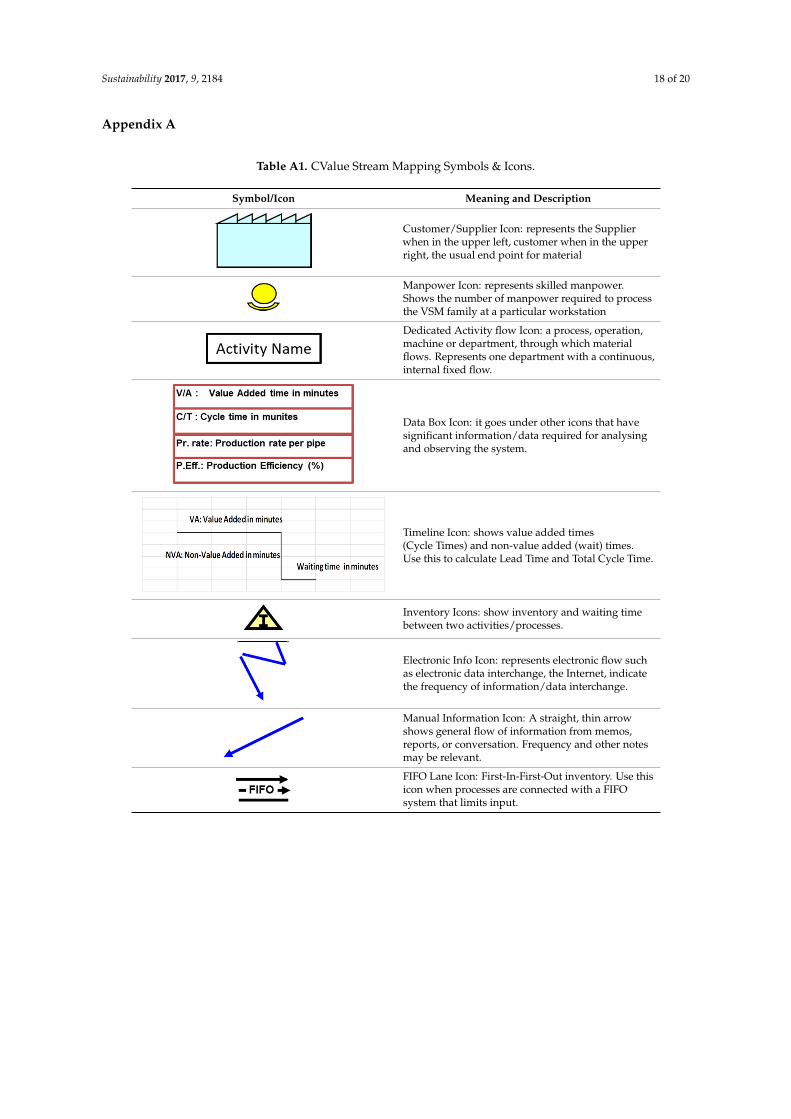
Table A1. CValue Stream Mapping Symbols & Icons.
Symbol/Icon Meaning and Description
Sustainability 2017, 9, 2184 17 of 20
7. Conclusions and Recommendations
This paper developed a better understanding of VSM and how it can be modified, with LOB to be applied in the construction industry. Moreover, it is introduced a developed concept to calculate the cost of Value Stream Mapping on a weekly basis. This technique can be utilized to understand the construction progress status and the future expectation. Moreover, it can be used to calculate the cost of similar projects for tendering purposes.
This paper attempts to address the application of Value Stream Mapping to a real-life problem of an underground pipeline project. It analyzed the improvement of VAT and reduction of NVAT compared with the cycle time. It studied the reduction opportunity in total lead time. LOB tool with VSM as a new tool provided a powerful attempt for proper resources utilization and monitoring to improve the VAT and decrease the total lead time.
Although several papers addressed using VSM as a lean tool to reduce waste and add value during the construction process, no detailed and unified VSM instructions exist concerning how to implement it in construction to evaluate the improvements and calculate the cost reduction. This paper tried to cover this gap. Suggested improvements will result in achieving the production and capacity demand to meet project completion deadline. Future research can be extended and focused further on the following: Applying Value Stream Mapping for other repetitive and non-repetitive construction activities; integrating and combining VSM with other tactics and lean management tools to improve the benefits of Value Stream Mapping in the construction industry; incorporating and evaluating the cost based VSM for bidding and estimation purpose; introduction of a simulation based VSM software that can be used to study the construction time and cost in advance for future construction.
This study has some limitations as it deals with a specific construction company and different environments, such as—but not limited to—a project, owner, project specifications, main contractor, operations and other environment-based constraints.
Another limitation is the process of integration the cost-based of Value Stream Mapping concept in the budget and estimation calculation as a vital tool in the construction companies for biding purpose. This can be developed for future studies.
Moreover, no simulation modeling was used to develop different scenario requirements to compare current state with different scenarios for future state and optimize the cost. This can be expanded for future research.
To extend the body of knowledge, the paper findings can be attempted for other areas such as construction of high-rise building. Similarly, the construction challenges for green building can also attended under the umbrella of Value Stream Mapping.
Author Contributions: Both authors were involved in the development of this paper. Murat Gunduz and Ayman Fahmi Naser organized the paper together. Both authors worked together during the development of graduate study outputs of Ayman Fahmi Naser into this paper.
Conflicts of Interest: The authors declare no conflict of interest.
Appendix A
Table A1. CValue Stream Mapping Symbols & Icons.
Symbol/Icon Meaning and Description
Customer/Supplier Icon: represents the Supplier when in the upper left, customer when in the upper right, the usual end point for material
Manpower Icon: represents skilled manpower. Shows the number of manpower required to process the VSM family at a particular workstation
Customer/Supplier Icon: represents the Supplierwhen in the upper left, customer when in the upperright, the usual end point for material
Sustainability 2017, 9, 2184 17 of 20
7. Conclusions and Recommendations
This paper developed a better understanding of VSM and how it can be modified, with LOB to be applied in the construction industry. Moreover, it is introduced a developed concept to calculate the cost of Value Stream Mapping on a weekly basis. This technique can be utilized to understand the construction progress status and the future expectation. Moreover, it can be used to calculate the cost of similar projects for tendering purposes.
This paper attempts to address the application of Value Stream Mapping to a real-life problem of an underground pipeline project. It analyzed the improvement of VAT and reduction of NVAT compared with the cycle time. It studied the reduction opportunity in total lead time. LOB tool with VSM as a new tool provided a powerful attempt for proper resources utilization and monitoring to improve the VAT and decrease the total lead time.
Although several papers addressed using VSM as a lean tool to reduce waste and add value during the construction process, no detailed and unified VSM instructions exist concerning how to implement it in construction to evaluate the improvements and calculate the cost reduction. This paper tried to cover this gap. Suggested improvements will result in achieving the production and capacity demand to meet project completion deadline. Future research can be extended and focused further on the following: Applying Value Stream Mapping for other repetitive and non-repetitive construction activities; integrating and combining VSM with other tactics and lean management tools to improve the benefits of Value Stream Mapping in the construction industry; incorporating and evaluating the cost based VSM for bidding and estimation purpose; introduction of a simulation based VSM software that can be used to study the construction time and cost in advance for future construction.
This study has some limitations as it deals with a specific construction company and different environments, such as—but not limited to—a project, owner, project specifications, main contractor, operations and other environment-based constraints.
Another limitation is the process of integration the cost-based of Value Stream Mapping concept in the budget and estimation calculation as a vital tool in the construction companies for biding purpose. This can be developed for future studies.
Moreover, no simulation modeling was used to develop different scenario requirements to compare current state with different scenarios for future state and optimize the cost. This can be expanded for future research.
To extend the body of knowledge, the paper findings can be attempted for other areas such as construction of high-rise building. Similarly, the construction challenges for green building can also attended under the umbrella of Value Stream Mapping.
Author Contributions: Both authors were involved in the development of this paper. Murat Gunduz and Ayman Fahmi Naser organized the paper together. Both authors worked together during the development of graduate study outputs of Ayman Fahmi Naser into this paper.
Conflicts of Interest: The authors declare no conflict of interest.
Appendix A
Table A1. CValue Stream Mapping Symbols & Icons.
Symbol/Icon Meaning and Description
Customer/Supplier Icon: represents the Supplier when in the upper left, customer when in the upper right, the usual end point for material
Manpower Icon: represents skilled manpower. Shows the number of manpower required to process the VSM family at a particular workstation
Manpower Icon: represents skilled manpower.Shows the number of manpower required to processthe VSM family at a particular workstation
Sustainability 2017, 9, 2184 18 of 20
Dedicated Activity flow Icon: a process, operation, machine or department, through which material flows. Represents one department with a continuous, internal fixed flow.
Data Box Icon: it goes under other icons that have significant information/data required for analysing and observing the system.
Timeline Icon: shows value added times (Cycle Times) and non-value added (wait) times. Use this to calculate Lead Time and Total Cycle Time.
Inventory Icons: show inventory and waiting time between two activities/processes.
Electronic Info Icon: represents electronic flow such as electronic data interchange, the Internet, indicate the frequency of information/data interchange.
Manual Information Icon: A straight, thin arrow shows general flow of information from memos, reports, or conversation. Frequency and other notes may be relevant.
FIFO Lane Icon: First-In-First-Out inventory. Use this icon when processes are connected with a FIFO system that limits input.
Push Arrow Icon: represents the “pushing” of material from one activity to the next activity.
Kaizen Burst Icon: used to highlight improvement needs and plan kaizen workshops at specific activities that are critical to achieving the Future State Map of the value stream.
Kanban Post Icon: a location where kanban signals reside for pickup. Often used by a central production scheduling or control production department.
Withdrawal Kanban Icon: represents a device that instructs a material handler to transfer parts from a supermarket to the receiving process. He goes to the supermarket and withdraws the necessary items.
Supermarket Icon: an inventory “supermarket” (kanban stockpoint) with a"Pull" icon that indicates physical removal.
Dedicated Activity flow Icon: a process, operation,machine or department, through which materialflows. Represents one department with a continuous,internal fixed flow.
Sustainability 2017, 9, 2184 18 of 20
Dedicated Activity flow Icon: a process, operation, machine or department, through which material flows. Represents one department with a continuous, internal fixed flow.
Data Box Icon: it goes under other icons that have significant information/data required for analysing and observing the system.
Timeline Icon: shows value added times (Cycle Times) and non-value added (wait) times. Use this to calculate Lead Time and Total Cycle Time.
Inventory Icons: show inventory and waiting time between two activities/processes.
Electronic Info Icon: represents electronic flow such as electronic data interchange, the Internet, indicate the frequency of information/data interchange.
Manual Information Icon: A straight, thin arrow shows general flow of information from memos, reports, or conversation. Frequency and other notes may be relevant.
FIFO Lane Icon: First-In-First-Out inventory. Use this icon when processes are connected with a FIFO system that limits input.
Push Arrow Icon: represents the “pushing” of material from one activity to the next activity.
Kaizen Burst Icon: used to highlight improvement needs and plan kaizen workshops at specific activities that are critical to achieving the Future State Map of the value stream.
Kanban Post Icon: a location where kanban signals reside for pickup. Often used by a central production scheduling or control production department.
Withdrawal Kanban Icon: represents a device that instructs a material handler to transfer parts from a supermarket to the receiving process. He goes to the supermarket and withdraws the necessary items.
Supermarket Icon: an inventory “supermarket” (kanban stockpoint) with a"Pull" icon that indicates physical removal.
Data Box Icon: it goes under other icons that havesignificant information/data required for analysingand observing the system.
Sustainability 2017, 9, 2184 18 of 20
Dedicated Activity flow Icon: a process, operation, machine or department, through which material flows. Represents one department with a continuous, internal fixed flow.
Data Box Icon: it goes under other icons that have significant information/data required for analysing and observing the system.
Timeline Icon: shows value added times (Cycle Times) and non-value added (wait) times. Use this to calculate Lead Time and Total Cycle Time.
Inventory Icons: show inventory and waiting time between two activities/processes.
Electronic Info Icon: represents electronic flow such as electronic data interchange, the Internet, indicate the frequency of information/data interchange.
Manual Information Icon: A straight, thin arrow shows general flow of information from memos, reports, or conversation. Frequency and other notes may be relevant.
FIFO Lane Icon: First-In-First-Out inventory. Use this icon when processes are connected with a FIFO system that limits input.
Push Arrow Icon: represents the “pushing” of material from one activity to the next activity.
Kaizen Burst Icon: used to highlight improvement needs and plan kaizen workshops at specific activities that are critical to achieving the Future State Map of the value stream.
Kanban Post Icon: a location where kanban signals reside for pickup. Often used by a central production scheduling or control production department.
Withdrawal Kanban Icon: represents a device that instructs a material handler to transfer parts from a supermarket to the receiving process. He goes to the supermarket and withdraws the necessary items.
Supermarket Icon: an inventory “supermarket” (kanban stockpoint) with a"Pull" icon that indicates physical removal.
Timeline Icon: shows value added times(Cycle Times) and non-value added (wait) times.Use this to calculate Lead Time and Total Cycle Time.
Sustainability 2017, 9, 2184 18 of 20
Dedicated Activity flow Icon: a process, operation, machine or department, through which material flows. Represents one department with a continuous, internal fixed flow.
Data Box Icon: it goes under other icons that have significant information/data required for analysing and observing the system.
Timeline Icon: shows value added times (Cycle Times) and non-value added (wait) times. Use this to calculate Lead Time and Total Cycle Time.
Inventory Icons: show inventory and waiting time between two activities/processes.
Electronic Info Icon: represents electronic flow such as electronic data interchange, the Internet, indicate the frequency of information/data interchange.
Manual Information Icon: A straight, thin arrow shows general flow of information from memos, reports, or conversation. Frequency and other notes may be relevant.
FIFO Lane Icon: First-In-First-Out inventory. Use this icon when processes are connected with a FIFO system that limits input.
Push Arrow Icon: represents the “pushing” of material from one activity to the next activity.
Kaizen Burst Icon: used to highlight improvement needs and plan kaizen workshops at specific activities that are critical to achieving the Future State Map of the value stream.
Kanban Post Icon: a location where kanban signals reside for pickup. Often used by a central production scheduling or control production department.
Withdrawal Kanban Icon: represents a device that instructs a material handler to transfer parts from a supermarket to the receiving process. He goes to the supermarket and withdraws the necessary items.
Supermarket Icon: an inventory “supermarket” (kanban stockpoint) with a"Pull" icon that indicates physical removal.
Inventory Icons: show inventory and waiting timebetween two activities/processes.
Sustainability 2017, 9, 2184 18 of 20
Dedicated Activity flow Icon: a process, operation, machine or department, through which material flows. Represents one department with a continuous, internal fixed flow.
Data Box Icon: it goes under other icons that have significant information/data required for analysing and observing the system.
Timeline Icon: shows value added times (Cycle Times) and non-value added (wait) times. Use this to calculate Lead Time and Total Cycle Time.
Inventory Icons: show inventory and waiting time between two activities/processes.
Electronic Info Icon: represents electronic flow such as electronic data interchange, the Internet, indicate the frequency of information/data interchange.
Manual Information Icon: A straight, thin arrow shows general flow of information from memos, reports, or conversation. Frequency and other notes may be relevant.
FIFO Lane Icon: First-In-First-Out inventory. Use this icon when processes are connected with a FIFO system that limits input.
Push Arrow Icon: represents the “pushing” of material from one activity to the next activity.
Kaizen Burst Icon: used to highlight improvement needs and plan kaizen workshops at specific activities that are critical to achieving the Future State Map of the value stream.
Kanban Post Icon: a location where kanban signals reside for pickup. Often used by a central production scheduling or control production department.
Withdrawal Kanban Icon: represents a device that instructs a material handler to transfer parts from a supermarket to the receiving process. He goes to the supermarket and withdraws the necessary items.
Supermarket Icon: an inventory “supermarket” (kanban stockpoint) with a"Pull" icon that indicates physical removal.
Electronic Info Icon: represents electronic flow suchas electronic data interchange, the Internet, indicatethe frequency of information/data interchange.
Sustainability 2017, 9, 2184 18 of 20
Dedicated Activity flow Icon: a process, operation, machine or department, through which material flows. Represents one department with a continuous, internal fixed flow.
Data Box Icon: it goes under other icons that have significant information/data required for analysing and observing the system.
Timeline Icon: shows value added times (Cycle Times) and non-value added (wait) times. Use this to calculate Lead Time and Total Cycle Time.
Inventory Icons: show inventory and waiting time between two activities/processes.
Electronic Info Icon: represents electronic flow such as electronic data interchange, the Internet, indicate the frequency of information/data interchange.
Manual Information Icon: A straight, thin arrow shows general flow of information from memos, reports, or conversation. Frequency and other notes may be relevant.
FIFO Lane Icon: First-In-First-Out inventory. Use this icon when processes are connected with a FIFO system that limits input.
Push Arrow Icon: represents the “pushing” of material from one activity to the next activity.
Kaizen Burst Icon: used to highlight improvement needs and plan kaizen workshops at specific activities that are critical to achieving the Future State Map of the value stream.
Kanban Post Icon: a location where kanban signals reside for pickup. Often used by a central production scheduling or control production department.
Withdrawal Kanban Icon: represents a device that instructs a material handler to transfer parts from a supermarket to the receiving process. He goes to the supermarket and withdraws the necessary items.
Supermarket Icon: an inventory “supermarket” (kanban stockpoint) with a"Pull" icon that indicates physical removal.
Manual Information Icon: A straight, thin arrowshows general flow of information from memos,reports, or conversation. Frequency and other notesmay be relevant.
Sustainability 2017, 9, 2184 18 of 20
Dedicated Activity flow Icon: a process, operation, machine or department, through which material flows. Represents one department with a continuous, internal fixed flow.
Data Box Icon: it goes under other icons that have significant information/data required for analysing and observing the system.
Timeline Icon: shows value added times (Cycle Times) and non-value added (wait) times. Use this to calculate Lead Time and Total Cycle Time.
Inventory Icons: show inventory and waiting time between two activities/processes.
Electronic Info Icon: represents electronic flow such as electronic data interchange, the Internet, indicate the frequency of information/data interchange.
Manual Information Icon: A straight, thin arrow shows general flow of information from memos, reports, or conversation. Frequency and other notes may be relevant.
FIFO Lane Icon: First-In-First-Out inventory. Use this icon when processes are connected with a FIFO system that limits input.
Push Arrow Icon: represents the “pushing” of material from one activity to the next activity.
Kaizen Burst Icon: used to highlight improvement needs and plan kaizen workshops at specific activities that are critical to achieving the Future State Map of the value stream.
Kanban Post Icon: a location where kanban signals reside for pickup. Often used by a central production scheduling or control production department.
Withdrawal Kanban Icon: represents a device that instructs a material handler to transfer parts from a supermarket to the receiving process. He goes to the supermarket and withdraws the necessary items.
Supermarket Icon: an inventory “supermarket” (kanban stockpoint) with a"Pull" icon that indicates physical removal.
FIFO Lane Icon: First-In-First-Out inventory. Use thisicon when processes are connected with a FIFOsystem that limits input.

Sustainability 2017, 9, 2184 19 of 20
Table A1. Cont.
Symbol/Icon Meaning and Description
Sustainability 2017, 9, 2184 18 of 20
Dedicated Activity flow Icon: a process, operation, machine or department, through which material flows. Represents one department with a continuous, internal fixed flow.
Data Box Icon: it goes under other icons that have significant information/data required for analysing and observing the system.
Timeline Icon: shows value added times (Cycle Times) and non-value added (wait) times. Use this to calculate Lead Time and Total Cycle Time.
Inventory Icons: show inventory and waiting time between two activities/processes.
Electronic Info Icon: represents electronic flow such as electronic data interchange, the Internet, indicate the frequency of information/data interchange.
Manual Information Icon: A straight, thin arrow shows general flow of information from memos, reports, or conversation. Frequency and other notes may be relevant.
FIFO Lane Icon: First-In-First-Out inventory. Use this icon when processes are connected with a FIFO system that limits input.
Push Arrow Icon: represents the “pushing” of material from one activity to the next activity.
Kaizen Burst Icon: used to highlight improvement needs and plan kaizen workshops at specific activities that are critical to achieving the Future State Map of the value stream.
Kanban Post Icon: a location where kanban signals reside for pickup. Often used by a central production scheduling or control production department.
Withdrawal Kanban Icon: represents a device that instructs a material handler to transfer parts from a supermarket to the receiving process. He goes to the supermarket and withdraws the necessary items.
Supermarket Icon: an inventory “supermarket” (kanban stockpoint) with a"Pull" icon that indicates physical removal.
Push Arrow Icon: represents the “pushing” ofmaterial from one activity to the next activity.
Sustainability 2017, 9, 2184 18 of 20
Dedicated Activity flow Icon: a process, operation, machine or department, through which material flows. Represents one department with a continuous, internal fixed flow.
Data Box Icon: it goes under other icons that have significant information/data required for analysing and observing the system.
Timeline Icon: shows value added times (Cycle Times) and non-value added (wait) times. Use this to calculate Lead Time and Total Cycle Time.
Inventory Icons: show inventory and waiting time between two activities/processes.
Electronic Info Icon: represents electronic flow such as electronic data interchange, the Internet, indicate the frequency of information/data interchange.
Manual Information Icon: A straight, thin arrow shows general flow of information from memos, reports, or conversation. Frequency and other notes may be relevant.
FIFO Lane Icon: First-In-First-Out inventory. Use this icon when processes are connected with a FIFO system that limits input.
Push Arrow Icon: represents the “pushing” of material from one activity to the next activity.
Kaizen Burst Icon: used to highlight improvement needs and plan kaizen workshops at specific activities that are critical to achieving the Future State Map of the value stream.
Kanban Post Icon: a location where kanban signals reside for pickup. Often used by a central production scheduling or control production department.
Withdrawal Kanban Icon: represents a device that instructs a material handler to transfer parts from a supermarket to the receiving process. He goes to the supermarket and withdraws the necessary items.
Supermarket Icon: an inventory “supermarket” (kanban stockpoint) with a"Pull" icon that indicates physical removal.
Kaizen Burst Icon: used to highlight improvementneeds and plan kaizen workshops at specificactivities that are critical to achieving the Future StateMap of the value stream.
Sustainability 2017, 9, 2184 18 of 20
Dedicated Activity flow Icon: a process, operation, machine or department, through which material flows. Represents one department with a continuous, internal fixed flow.
Data Box Icon: it goes under other icons that have significant information/data required for analysing and observing the system.
Timeline Icon: shows value added times (Cycle Times) and non-value added (wait) times. Use this to calculate Lead Time and Total Cycle Time.
Inventory Icons: show inventory and waiting time between two activities/processes.
Electronic Info Icon: represents electronic flow such as electronic data interchange, the Internet, indicate the frequency of information/data interchange.
Manual Information Icon: A straight, thin arrow shows general flow of information from memos, reports, or conversation. Frequency and other notes may be relevant.
FIFO Lane Icon: First-In-First-Out inventory. Use this icon when processes are connected with a FIFO system that limits input.
Push Arrow Icon: represents the “pushing” of material from one activity to the next activity.
Kaizen Burst Icon: used to highlight improvement needs and plan kaizen workshops at specific activities that are critical to achieving the Future State Map of the value stream.
Kanban Post Icon: a location where kanban signals reside for pickup. Often used by a central production scheduling or control production department.
Withdrawal Kanban Icon: represents a device that instructs a material handler to transfer parts from a supermarket to the receiving process. He goes to the supermarket and withdraws the necessary items.
Supermarket Icon: an inventory “supermarket” (kanban stockpoint) with a"Pull" icon that indicates physical removal.
Kanban Post Icon: a location where kanban signalsreside for pickup. Often used by a central productionscheduling or control production department.
Sustainability 2017, 9, 2184 18 of 20
Dedicated Activity flow Icon: a process, operation, machine or department, through which material flows. Represents one department with a continuous, internal fixed flow.
Data Box Icon: it goes under other icons that have significant information/data required for analysing and observing the system.
Timeline Icon: shows value added times (Cycle Times) and non-value added (wait) times. Use this to calculate Lead Time and Total Cycle Time.
Inventory Icons: show inventory and waiting time between two activities/processes.
Electronic Info Icon: represents electronic flow such as electronic data interchange, the Internet, indicate the frequency of information/data interchange.
Manual Information Icon: A straight, thin arrow shows general flow of information from memos, reports, or conversation. Frequency and other notes may be relevant.
FIFO Lane Icon: First-In-First-Out inventory. Use this icon when processes are connected with a FIFO system that limits input.
Push Arrow Icon: represents the “pushing” of material from one activity to the next activity.
Kaizen Burst Icon: used to highlight improvement needs and plan kaizen workshops at specific activities that are critical to achieving the Future State Map of the value stream.
Kanban Post Icon: a location where kanban signals reside for pickup. Often used by a central production scheduling or control production department.
Withdrawal Kanban Icon: represents a device that instructs a material handler to transfer parts from a supermarket to the receiving process. He goes to the supermarket and withdraws the necessary items.
Supermarket Icon: an inventory “supermarket” (kanban stockpoint) with a"Pull" icon that indicates physical removal.
Withdrawal Kanban Icon: represents a device thatinstructs a material handler to transfer parts from asupermarket to the receiving process. He goes to thesupermarket and withdraws the necessary items.
Sustainability 2017, 9, 2184 18 of 20
Dedicated Activity flow Icon: a process, operation, machine or department, through which material flows. Represents one department with a continuous, internal fixed flow.
Data Box Icon: it goes under other icons that have significant information/data required for analysing and observing the system.
Timeline Icon: shows value added times (Cycle Times) and non-value added (wait) times. Use this to calculate Lead Time and Total Cycle Time.
Inventory Icons: show inventory and waiting time between two activities/processes.
Electronic Info Icon: represents electronic flow such as electronic data interchange, the Internet, indicate the frequency of information/data interchange.
Manual Information Icon: A straight, thin arrow shows general flow of information from memos, reports, or conversation. Frequency and other notes may be relevant.
FIFO Lane Icon: First-In-First-Out inventory. Use this icon when processes are connected with a FIFO system that limits input.
Push Arrow Icon: represents the “pushing” of material from one activity to the next activity.
Kaizen Burst Icon: used to highlight improvement needs and plan kaizen workshops at specific activities that are critical to achieving the Future State Map of the value stream.
Kanban Post Icon: a location where kanban signals reside for pickup. Often used by a central production scheduling or control production department.
Withdrawal Kanban Icon: represents a device that instructs a material handler to transfer parts from a supermarket to the receiving process. He goes to the supermarket and withdraws the necessary items.
Supermarket Icon: an inventory “supermarket” (kanban stockpoint) with a"Pull" icon that indicates physical removal.
Supermarket Icon: an inventory “supermarket”(kanban stockpoint) with a"Pull" icon that indicatesphysical removal.Sustainability 2017, 9, 2184 19 of 20
Production Kanban Icon: triggers production of a predefined number of parts. Signals a supplying process to provide parts to a downstream process.
Load Leveling Icon: a tool to batch kanbans in order to level the production volume and mix over a period of time.
References
1. Carvalho, A.C.V.; Granja, A.D.; Silva, V.G. A Systematic Literature Review on Integrative Lean and Sustainability Synergies over a Building’s Lifecycle. Sustainability 2017, 9, 1156, doi:10.3390/su9071156.
2. Rother, M.; Shook, J.; Womack, J.; Jones, D. Learning to See: Value Stream Mapping to Add Value and Eliminate MUDA, 3rd ed.; Lean Enterprise Institute: Cambridge, MA, USA, 2003.
3. Yun, S.; Jung, W. Benchmarking Sustainability Practices Use throughout Industrial Construction Project Delivery. Sustainability 2017, 9, 1007, doi:10.3390/su9061007.
4. Wenchi, S.; Jun, W.; Peng, W.; Xiangyu, W.; Heap-Yih, C. A cross-sector review on the use of Value Stream Mapping. Int. J. Prod. Res. 2017, 55, doi:10.1080/00207543.2017.1311031.
5. Martin, K.; Osterling, M. Value Stream Mapping: How to Visualize Work and Align Leadership for Organizational Transformation; McGraw-Hill: New York, NY, USA, 2013.
6. Schmidtke, D.; Heiser, U.; Hinrichsen, O. A Simulation-enhanced Value Stream Mapping Approach for Optimisation of Complex Production Environments. Int. J. Prod. Res. 2014, 52, 6146–6160.
7. Sabaghi, M.; Rostamzadeh, R.; Mascle, C. Kanban and value stream mapping analysis in lean manufacturing philosophy via simulation: A plastic fabrication (case study). Int. J. Serv. Oper. Manag. 2015, 20, 118–140, doi;10.1504/IJSOM.2015.065977.
8. Suarez-Barraza, M.F.; Miguel-Davila, J.; Vasquez-García, C.F. Supply chain value stream mapping: A new tool of operation management. Int. J. Q. Reliab. Manag. 2016, 33, 518–534, doi: 10.1108/IJQRM-11-2014-0171.
9. Yuvamitra, K.; Lee, J.; Dong, K. Value Stream Mapping of Rope Manufacturing: A Case Study. Int. J. Sustain. Eng. 2017, 2017, doi:10.1155/2017/8674187.
10. Tyagi, S.; Choudhary, A.; Cai, X.; Yang, K. Value Stream Mapping to reduce the lead-time of a product development process. Int. J. Prod. Econ. 2015, 160, 202–212, doi:10.1016/j.ijpe.2014.11.002.
11. Wang, T.; Zhang, Q.; Chong, H.; Wang, X. Integrated Supplier Selection Framework in a Resilient Construction Supply Chain: An Approach via Analytic Hierarchy Process (AHP) and Grey Relational Analysis (GRA). Sustainability 2017, 9, 289, doi:10.3390/su9020289.
12. Jeong, W.; Chang, S.; Son, J.; Yi, J. BIM-Integrated Construction Operation Simulation for Just-In-Time Production Management. Sustainability 2016, 8, 1106, doi:10.3390/su8111106.
13. Lee, D.; Kim, S.; Kim, S. Development of Hybrid Model for Estimating Construction Waste for Multifamily Residential Buildings Using Artificial Neural Networks and Ant Colony Optimization. Sustainability 2016, 8, 870, doi:10.3390/su8090870.
14. Jia, S.; Yuan, Q.; Lv, J.; Liu, Y.; Ren, D.; Zhang, Z. Therblig-embedded Value Stream Mapping method for lean energy machining. Energy 2017, 138, 1081–1098, doi:10.1016/j.energy.2017.07.120.
15. Chien-Liang, L.; Chen-Huu, J. Exploring Interface Problems in Taiwan’s Construction Projects Using Structural Equation Modeling. Sustainability 2017, 9, 822, doi:10.3390/su9050822.
16. Pasqualini, F.; Zawislak, P.A. Value Stream Mapping in construction: A case study in a Brazilian construction company. In Proceedings of the 13th Annual Conference of the International Group for Lean Construction, Sydney, Australia, 19–21 July 2005; pp. 117–125.
17. Yu, H.; Tweed, T.; Al-Hussein, M.; Nasseri, R. Development of lean model for house construction using Value Stream Mapping. J. Constr. Eng. Manag. 2009, 135, 782–790.
18. Shou, W.; Wang, J.; Chong, H.Y.; Wang, X. Examining the Critical Success Factors in the Adoption of Value Stream Mapping. In Proceedings of the 24th Annual Conference of the International Group for Lean Construction (IGLC), Boston, MA, USA, 20–22 July 2016; pp. 93–102.
19. Alvandi, S.; Li, W.; Schönemann, M.; Kara, S.; Herrmann, C. Economic and Environmental Value Stream Map (E2VSM) Simulation for Multiproduct Manufacturing Systems. Int. J. Sustain. Eng. 2016, 9, 354–362.
Production Kanban Icon: triggers production of apredefined number of parts. Signals a supplyingprocess to provide parts to a downstream process.
Sustainability 2017, 9, 2184 19 of 20
Production Kanban Icon: triggers production of a predefined number of parts. Signals a supplying process to provide parts to a downstream process.
Load Leveling Icon: a tool to batch kanbans in order to level the production volume and mix over a period of time.
References
1. Carvalho, A.C.V.; Granja, A.D.; Silva, V.G. A Systematic Literature Review on Integrative Lean and Sustainability Synergies over a Building’s Lifecycle. Sustainability 2017, 9, 1156, doi:10.3390/su9071156.
2. Rother, M.; Shook, J.; Womack, J.; Jones, D. Learning to See: Value Stream Mapping to Add Value and Eliminate MUDA, 3rd ed.; Lean Enterprise Institute: Cambridge, MA, USA, 2003.
3. Yun, S.; Jung, W. Benchmarking Sustainability Practices Use throughout Industrial Construction Project Delivery. Sustainability 2017, 9, 1007, doi:10.3390/su9061007.
4. Wenchi, S.; Jun, W.; Peng, W.; Xiangyu, W.; Heap-Yih, C. A cross-sector review on the use of Value Stream Mapping. Int. J. Prod. Res. 2017, 55, doi:10.1080/00207543.2017.1311031.
5. Martin, K.; Osterling, M. Value Stream Mapping: How to Visualize Work and Align Leadership for Organizational Transformation; McGraw-Hill: New York, NY, USA, 2013.
6. Schmidtke, D.; Heiser, U.; Hinrichsen, O. A Simulation-enhanced Value Stream Mapping Approach for Optimisation of Complex Production Environments. Int. J. Prod. Res. 2014, 52, 6146–6160.
7. Sabaghi, M.; Rostamzadeh, R.; Mascle, C. Kanban and value stream mapping analysis in lean manufacturing philosophy via simulation: A plastic fabrication (case study). Int. J. Serv. Oper. Manag. 2015, 20, 118–140, doi;10.1504/IJSOM.2015.065977.
8. Suarez-Barraza, M.F.; Miguel-Davila, J.; Vasquez-García, C.F. Supply chain value stream mapping: A new tool of operation management. Int. J. Q. Reliab. Manag. 2016, 33, 518–534, doi: 10.1108/IJQRM-11-2014-0171.
9. Yuvamitra, K.; Lee, J.; Dong, K. Value Stream Mapping of Rope Manufacturing: A Case Study. Int. J. Sustain. Eng. 2017, 2017, doi:10.1155/2017/8674187.
10. Tyagi, S.; Choudhary, A.; Cai, X.; Yang, K. Value Stream Mapping to reduce the lead-time of a product development process. Int. J. Prod. Econ. 2015, 160, 202–212, doi:10.1016/j.ijpe.2014.11.002.
11. Wang, T.; Zhang, Q.; Chong, H.; Wang, X. Integrated Supplier Selection Framework in a Resilient Construction Supply Chain: An Approach via Analytic Hierarchy Process (AHP) and Grey Relational Analysis (GRA). Sustainability 2017, 9, 289, doi:10.3390/su9020289.
12. Jeong, W.; Chang, S.; Son, J.; Yi, J. BIM-Integrated Construction Operation Simulation for Just-In-Time Production Management. Sustainability 2016, 8, 1106, doi:10.3390/su8111106.
13. Lee, D.; Kim, S.; Kim, S. Development of Hybrid Model for Estimating Construction Waste for Multifamily Residential Buildings Using Artificial Neural Networks and Ant Colony Optimization. Sustainability 2016, 8, 870, doi:10.3390/su8090870.
14. Jia, S.; Yuan, Q.; Lv, J.; Liu, Y.; Ren, D.; Zhang, Z. Therblig-embedded Value Stream Mapping method for lean energy machining. Energy 2017, 138, 1081–1098, doi:10.1016/j.energy.2017.07.120.
15. Chien-Liang, L.; Chen-Huu, J. Exploring Interface Problems in Taiwan’s Construction Projects Using Structural Equation Modeling. Sustainability 2017, 9, 822, doi:10.3390/su9050822.
16. Pasqualini, F.; Zawislak, P.A. Value Stream Mapping in construction: A case study in a Brazilian construction company. In Proceedings of the 13th Annual Conference of the International Group for Lean Construction, Sydney, Australia, 19–21 July 2005; pp. 117–125.
17. Yu, H.; Tweed, T.; Al-Hussein, M.; Nasseri, R. Development of lean model for house construction using Value Stream Mapping. J. Constr. Eng. Manag. 2009, 135, 782–790.
18. Shou, W.; Wang, J.; Chong, H.Y.; Wang, X. Examining the Critical Success Factors in the Adoption of Value Stream Mapping. In Proceedings of the 24th Annual Conference of the International Group for Lean Construction (IGLC), Boston, MA, USA, 20–22 July 2016; pp. 93–102.
19. Alvandi, S.; Li, W.; Schönemann, M.; Kara, S.; Herrmann, C. Economic and Environmental Value Stream Map (E2VSM) Simulation for Multiproduct Manufacturing Systems. Int. J. Sustain. Eng. 2016, 9, 354–362.
Load Leveling Icon: a tool to batch kanbans in orderto level the production volume and mix over a periodof time.
References
1. Carvalho, A.C.V.; Granja, A.D.; Silva, V.G. A Systematic Literature Review on Integrative Lean andSustainability Synergies over a Building’s Lifecycle. Sustainability 2017, 9, 1156. [CrossRef]
2. Rother, M.; Shook, J.; Womack, J.; Jones, D. Learning to See: Value Stream Mapping to Add Value and EliminateMUDA, 3rd ed.; Lean Enterprise Institute: Cambridge, MA, USA, 2003.
3. Yun, S.; Jung, W. Benchmarking Sustainability Practices Use throughout Industrial Construction ProjectDelivery. Sustainability 2017, 9, 1007. [CrossRef]
4. Wenchi, S.; Jun, W.; Peng, W.; Xiangyu, W.; Heap-Yih, C. A cross-sector review on the use of Value StreamMapping. Int. J. Prod. Res. 2017, 55. [CrossRef]
5. Martin, K.; Osterling, M. Value Stream Mapping: How to Visualize Work and Align Leadership for OrganizationalTransformation; McGraw-Hill: New York, NY, USA, 2013.
6. Schmidtke, D.; Heiser, U.; Hinrichsen, O. A Simulation-enhanced Value Stream Mapping Approach forOptimisation of Complex Production Environments. Int. J. Prod. Res. 2014, 52, 6146–6160. [CrossRef]
7. Sabaghi, M.; Rostamzadeh, R.; Mascle, C. Kanban and value stream mapping analysis in lean manufacturingphilosophy via simulation: A plastic fabrication (case study). Int. J. Serv. Oper. Manag. 2015, 20, 118–140.[CrossRef]
8. Suarez-Barraza, M.F.; Miguel-Davila, J.; Vasquez-García, C.F. Supply chain value stream mapping: A newtool of operation management. Int. J. Q. Reliab. Manag. 2016, 33, 518–534. [CrossRef]
9. Yuvamitra, K.; Lee, J.; Dong, K. Value Stream Mapping of Rope Manufacturing: A Case Study. Int. J.Sustain. Eng. 2017, 2017. [CrossRef]
10. Tyagi, S.; Choudhary, A.; Cai, X.; Yang, K. Value Stream Mapping to reduce the lead-time of a productdevelopment process. Int. J. Prod. Econ. 2015, 160, 202–212. [CrossRef]

Sustainability 2017, 9, 2184 20 of 20
11. Wang, T.; Zhang, Q.; Chong, H.; Wang, X. Integrated Supplier Selection Framework in a ResilientConstruction Supply Chain: An Approach via Analytic Hierarchy Process (AHP) and Grey RelationalAnalysis (GRA). Sustainability 2017, 9, 289. [CrossRef]
12. Jeong, W.; Chang, S.; Son, J.; Yi, J. BIM-Integrated Construction Operation Simulation for Just-In-TimeProduction Management. Sustainability 2016, 8, 1106. [CrossRef]
13. Lee, D.; Kim, S.; Kim, S. Development of Hybrid Model for Estimating Construction Waste for MultifamilyResidential Buildings Using Artificial Neural Networks and Ant Colony Optimization. Sustainability 2016, 8, 870.[CrossRef]
14. Jia, S.; Yuan, Q.; Lv, J.; Liu, Y.; Ren, D.; Zhang, Z. Therblig-embedded Value Stream Mapping method forlean energy machining. Energy 2017, 138, 1081–1098. [CrossRef]
15. Chien-Liang, L.; Chen-Huu, J. Exploring Interface Problems in Taiwan’s Construction Projects UsingStructural Equation Modeling. Sustainability 2017, 9, 822. [CrossRef]
16. Pasqualini, F.; Zawislak, P.A. Value Stream Mapping in construction: A case study in a Brazilian constructioncompany. In Proceedings of the 13th Annual Conference of the International Group for Lean Construction,Sydney, Australia, 19–21 July 2005; pp. 117–125.
17. Yu, H.; Tweed, T.; Al-Hussein, M.; Nasseri, R. Development of lean model for house construction usingValue Stream Mapping. J. Constr. Eng. Manag. 2009, 135, 782–790. [CrossRef]
18. Shou, W.; Wang, J.; Chong, H.Y.; Wang, X. Examining the Critical Success Factors in the Adoption ofValue Stream Mapping. In Proceedings of the 24th Annual Conference of the International Group for LeanConstruction (IGLC), Boston, MA, USA, 20–22 July 2016; pp. 93–102.
19. Alvandi, S.; Li, W.; Schönemann, M.; Kara, S.; Herrmann, C. Economic and Environmental Value StreamMap (E2VSM) Simulation for Multiproduct Manufacturing Systems. Int. J. Sustain. Eng. 2016, 9, 354–362.[CrossRef]
20. Dinesh, S.; Nitin, S.; Pratik, D. Application of Value Stream Mapping (VSM) for lean and cycle time reductionin complex production environments: A case study. Prod. Plan. Control 2017, 28, 398–419. [CrossRef]
21. Rosenbaum, S.; Toledo, M.; González, V. Improving environmental and production performance inconstruction projects using Value-Stream Mapping: Case study. J. Constr. Manag. 2014, 140. [CrossRef]
22. Mok, K.L.; Sin, E.; Han, S.H.; Jang, W. Value stream mapping and simulation as integrated lean approachtool for improving productivity in the installation of natural gas pipes. In Proceedings of the Construction,Building and Real Estate Research Conference of the Royal Institution of Chartered Surveyors (COBRA 2010),Paris, France, 2–3 September 2010.
© 2017 by the authors. Licensee MDPI, Basel, Switzerland. This article is an open accessarticle distributed under the terms and conditions of the Creative Commons Attribution(CC BY) license (http://creativecommons.org/licenses/by/4.0/).