Application of lean manufacturing using value stream mapping in an auto‐parts manufacturing unit
21
Application of lean manufacturing using value stream mapping in an auto-parts manufacturing unit Harwinder Singh Department of Mechanical Engineering, and Guru Nanak Dev Engineering College, Ludhiana, Punjab, India Amandeep Singh Department of Mechanical Engineering, Guru Nanak Dev Engineering College, Ludhiana, Punjab, India Abstract Purpose - This paper addresses the application of lean manufacturing using value stream mapping (VSM) concepts in an auto-parts manufacturing organization. Using value stream concepts, both current and future states maps of the organization’s shop floor scenarios have been discussed to identify sources of waste between the existing state and the proposed state of the selected organization for improving its competitiveness. Design/methodology/approach - VSM process symbols have been used to discuss lean implementation stages in the auto-parts manufacturing unit. Current states of the selected manufacturing unit have been prepared with the help of VSM symbols and improvement areas have been identified. Few modifications in current state have been made and with these modifications, a future state map is suggested. Findings - After comparison of the current and future states of the selected manufacturing unit, it has been found that 69.41% reduction in cycle time, 18.26% reduction in work in- process inventory and 24.56% reduction in production lead times for Replacement Ball product. While for Weldon Ball End product, 51.87% reduction in cycle time, 21.51% reduction in work in-process inventory, 25.88% reduction in lead time has been noted. Research limitations/implications - The findings of this case study are valid due to limited selection of products only. Originality/value - This paper depicts the true picture of implementation of lean manufacturing tools in an organization. Keywords: Lean manufacturing, Value stream mapping, Production lead time, In-process inventory, Cycle time. Paper type Case study 1. Introduction In recent times, many organizations have attempted to implement or have already implemented lean manufacturing (LM). Some companies have implemented a few tools/techniques/practices/procedures (i.e. “elements” in short) of LM, while others have implemented a whole spectrum of LM elements (Gurumurthy and Kodali, 2009). The concept lean manufacturing was originated in Japan after the Second World War when it was realized that they could not afford to invest much now. The objective of lean manufacturing is to reduce waste in every part (such as human effort, inventory, time to market and
-
Upload
independent -
Category
Documents
-
view
0 -
download
0
Transcript of Application of lean manufacturing using value stream mapping in an auto‐parts manufacturing unit

Application of lean manufacturing using value stream mapping in an auto-parts
manufacturing unit
Harwinder Singh
Department of Mechanical Engineering and
Guru Nanak Dev Engineering College Ludhiana Punjab India
Amandeep Singh
Department of Mechanical Engineering
Guru Nanak Dev Engineering College Ludhiana Punjab India
Abstract
Purpose - This paper addresses the application of lean manufacturing using value stream
mapping (VSM) concepts in an auto-parts manufacturing organization Using value stream
concepts both current and future states maps of the organizationrsquos shop floor scenarios have
been discussed to identify sources of waste between the existing state and the proposed state
of the selected organization for improving its competitiveness
Designmethodologyapproach - VSM process symbols have been used to discuss lean
implementation stages in the auto-parts manufacturing unit Current states of the selected
manufacturing unit have been prepared with the help of VSM symbols and improvement
areas have been identified Few modifications in current state have been made and with these
modifications a future state map is suggested
Findings - After comparison of the current and future states of the selected manufacturing
unit it has been found that 6941 reduction in cycle time 1826 reduction in work in-
process inventory and 2456 reduction in production lead times for Replacement Ball
product While for Weldon Ball End product 5187 reduction in cycle time 2151
reduction in work in-process inventory 2588 reduction in lead time has been noted
Research limitationsimplications - The findings of this case study are valid due to limited
selection of products only
Originalityvalue - This paper depicts the true picture of implementation of lean
manufacturing tools in an organization
Keywords Lean manufacturing Value stream mapping Production lead time In-process
inventory Cycle time
Paper type Case study
1 Introduction
In recent times many organizations have attempted to implement or have already
implemented lean manufacturing (LM) Some companies have implemented a few
toolstechniquespracticesprocedures (ie ldquoelementsrdquo in short) of LM while others have
implemented a whole spectrum of LM elements (Gurumurthy and Kodali 2009) The concept
lean manufacturing was originated in Japan after the Second World War when it was realized
that they could not afford to invest much now The objective of lean manufacturing is to
reduce waste in every part (such as human effort inventory time to market and
manufacturing space) to become more responsive to customer demand while producing
quality products in the most efficient and economical manner (Womack et al 1990)
Lean manufacturing encompasses many different strategies and activities that are familiar to
almost all industrial engineers (Braglia et al 2006 Chitturi et al 2007 Mahapatra and
Mohanty 2007) In many such cases firms have reported some benefits by applying lean
principles however it is apparent that there is a need to understand the entire system in order
to gain maximum benefits (Singh et al 2010) Value stream mapping (VSM) acts as one of
enterprise improvement tool in lean manufacturing to assist in visualizing the entire
production process representing both material and information flow The goal is to identify
all types of waste in the value stream and to take necessary steps to eliminate them (Rother
and Shook 1999 Sahoo et al 2008 Seth et al 2008) VSM aids in the development of a
ldquocurrent state maprdquo which shows a visual representation of how the company is currently
operating it records process information and information flow which can be used to identify
key wastes problems and opportunities Once the current state map has been analyzed the
future state map can then be produced to show how the company could operate more
effectively (Pavnaskar et al 2003) According to the lean system Lasa et al (2008) showed
that VSM is a valuable tool for redesigning of the productive systems and found that there are
some key points for the establishing teams that have to take into account for designing of
suitable information systems
One of the major challenges for manufacturing industry is to manufacture variety products
with a minimum lead time reduced inventory and world class quality There is a need to help
the manufacturing companies to improve their competitiveness Vinodh et al (2012) applied
the analytic hierarchy process (AHP) typical multi-criterion decision-making method in a
manufacturing organization for improving the leanness of the company Many managers and
researchers such as Hines et al (1998) Hines (1999) Abdulmalek and Rajgopal (2007)
Serrano et al (2008) and Singh et al (2009) applied VSM for identification and elimination
of waste in production industry In this paper an attempt has been made to discuss lean
implementation principles using VSM in ABC auto-parts manufacturing unit located near
Ludhiana Punjab India There are ten different categories of products Out of which only
two products named Weldon Ball End and Replacement Ball is selected on the basis of lead
time problem Current and future state maps of both the products have been made using VSM
techniques Rest of the paper is as follows-
Section 2 reports the concept of VSM Section 3 explains the case study of an organization
Finally Section 4 concludes by narrating the contributions of the present research
2 Value stream mapping
Value stream mapping is a significant tool of lean manufacturing VSM can serve as a good
starting point for any enterprise that wants to be lean VSM was initially developed in 1995
with an underlying rationale for the collection and use of the suite of tools as being ldquoto help
researchers or practitioners to identify waste in individual value streams and hence find an
appropriate route to its removalrdquo (Hines and Rich 1997)
Jones and Womack (2000) defined VSM as the process of visually mapping the flow of
information and material for preparing a future state map with better methods and
performance The value stream map includes two flows One is the flow of resources from
supplier to customer The other is communications flow from customer back to supplier
Taylor (2005) stated ldquoValue Stream Maps are a very effective method for summarizing
presenting and communicating the key features of a process within an organizationrdquo Lean
manufacturing is most frequently associated with the elimination of seven important wastes
to ameliorate the effects of variability in supply processing time or demand (Shah and Ward
2007) Liker and Wu (2000) defined it as a philosophy of manufacturing that focuses on
delivering the highest quality product on time and at the lowest cost Worley (2004) defined it
as the systematic removal of waste by all members of the organization from all areas of the
value stream Briefly it is called lean as it uses less or the minimum of everything required
to produce a product or perform a service (Lian and Van Landeghem 2007)
Grewal (2008) used VSM techniques as lean implementation initiatives in small bicycle
manufacturing company and claimed 3318 reduction in cycle time 815 percent
reduction in changeover time 814 percent reduction in lead time and 141 percent
reduction in value-added time
Singh and Sharma (2009) implemented VSM approach in an Indian manufacturing
organization and witnessed 9258 reduction in lead time 217 reduction in processing
time 971 reduction in WIP and 2608 reduction in manpower requirement Chowdary
and George (2011) conducted a case study in a pharmaceutical company using VSM
approach The methodology assisted the case company in reducing lead times cycle times
and WIP inventory in the manufacturing process The organization was able to reduce the
storage area and production staff by 38 per cent 50 respectively
Gurumurthy and Kodali (2011) presented an application of VSM with simulation during the
design of lean manufacturing systems (LMS) using a case study of an organisation
Simulation studies were carried out for different scenarios such as ldquobefore LMrdquo (current state
VSM) and ldquoafter LMrdquo (future state VSM) It was found that the case organisation can achieve
significant improvement in performance and can meet the increasing demand without any
additional resources
Majority of researchers have done the research on implementation of lean manufacturing
tools in large organizations But in most of the nations small and medium enterprises (SMEs)
are the lifeblood of modern economies Almost 90 SMEs in most countries are the driving
forces behind a large number of innovations to the growth of national economy The need for
organizations to remain competitive and produce high quality products is important not only
at organizational level but also at globe level Hence there is a need to implement such latest
tools in SMEs to improve its competitiveness In a nutshell lean manufacturing can be best
defined as an approach to deliver the up-most value to the customer by eliminating waste
through process and human design elements (Wong et al 2009)
3 Case study
A case study has been carried in a leading auto-parts manufacturing unit located near
Ludhiana Punjab India using VSM having annual turnover approximately Rs 15 million ($
033million) This organization was started in 1999 and is an ISO certified company The
company employs 300 personnel including workers supervisors engineers and also top
management The company was using traditional manufacturing concepts before applying
lean concepts The following procedure is adopted for this case study
Selection of critical product family
Preparation of current state map
Documentation of customer information
Establish process flow
Data collection (cycle time available time in-process inventory etc)
Documentation of supplier information
Establish information flow
Quantify production lead time and processing time
Analysis of current state map
Preparation of future state map
Implementation of few new processes
Calculate TAKT time
Develop continuous flow wherever possible
Analysis of the results
The company is manufacturing ten different categories of products in the shop Data has been
collected for all the product families and the most critical product families ie Weldon Ball
End and Replacement Ball were selected on the basis of (i) the lead time of both the products
was very much as compared to other products (ii) quantity to be produced were high and (iii
in-process inventory was also high to meet customerrsquos demands and delivery schedule as
shown in figure 1
[Insert Figure 1]
Because of traditional manufacturing set up in-process inventory was very high The other
reason for selection of both these products is the reduction of manufacturing days by the
customer Previously the manufacturing days were 10 and shipping days were 35 (by sea) ie
products reached at the customerrsquos end within 45 days after receiving the order In case of
failure in meeting the delivery date either the manufacturing organization will deliver the
products by air instead of delivering by sea or otherwise the order will be treated as
cancelled
31 Preparation of value stream map
Current state map is prepared by taking the data from shop floor of the selected shop and also
by consulting the foremen operators etc The marketing department receives the information
from customer and forecasts the exact demand Marketing department sends this information
to the production planning and control (PPC) department which further sends it to material
requirement planning (MRP) department and supervisors so that they can plan their GANTT
charts accordingly Value stream mapping is different than conventional recording
approaches as it helps in visualization station cycle times inventory buffers at intermediate
stations uptime or utilization of resources and the information flow in the given area It
captures the entire transformation from raw material to the reach of finished goods This
takes care of both value added and non-value added activities This is purely a pencil and
paper work using icons for various agencies to visualize the flow of material and information
as a product advances Before mapping one should be very clear about the lean management
principles which form the backbone of VSM These principles are define value from your
customerrsquos perspective identify the value stream eliminate the seven deadly wastes make
the work flow pull the work rather than push it and pursue to perfection level (Rother and
Shook 1999 Seth and Gupta 2005) The major steps involved in mapping are as follows
An A3 size (or 11x17inch) ledger size paper is taken and icons are drawn representing
customer supplier and production control with sufficient space in between them
Entries are made to prepare a data box below the icons to capture the monthlydaily
requirements of each product along with no of containers and KANBAN required in
unit time
Shipping and receiving data are entered along with the icons for the truck using
direction arrows for the movement
Then manufacturingassembly operations are drawn along the bottom of the map with
the most upstream process on the left and most downstream process on the right
This follows the entry of process attributes like uptime changeover etc in proper
units It is essential to capture information flow both electronic and manual For this
communication arrows are drawn between the parties concerned
Next inventory icons are drawn along with the quantities in places where the
inventory is stored between processes
If a process is producing to a schedule independent of the downstream process this indicates
that push is being practiced In this way the mechanism serves as a starting point to help
management engineers suppliers and customers to recognize waste and its sources Taking a
value stream perspective means working on the big picture and improving the whole not just
individual processes Concepts of value stream provide both a picture of the current state of
affairs as well as a guide about the gap areas Thus it helps in visualizing how things would
work when some improvements or changes are incorporated
32 Current state map of Replacement Ball
Replacement ball is a tractor linkage part which is used mostly in linkage assembly it is
mounted on the rare side of the tractor and used to link the various parts Its length can be
adjustable from 230mm to 930mm The demand per month of replacement ball is 15000
pieces effective numbers of working days are 25 per month Number of shifts per day is 2
and working hours per shift are 12 Available working time per day in minutes is 1440
TAKT time comes out to be is 144 seconds
TAKT time = Available work time per shiftCustomer demand per shift
= 12x60x60300 = 144 seconds
The demand comes from the customers (overseas mostly from European countries) to
marketing department through some electronic media then marketing department send this
requirement to production planning and control department Then PPC department analyses
the products and make the material requirement planning and send the material requirement
to suppliers by manually or by some electronic media In present case the suppliers take 10
days to deliver the material then material moves from raw material cutting department to
finish product through number of processes like cutting forging drilling computer numerical
control (CNC) machining etc Details regarding inventory cycle time lead time up time and
number of shifts are shown in value stream map Current state map is shown in figure2
[Insert Figure 2]
After studying the current state map it has been obtained that the maximum demand per
month of replacement ball is 15000 pieces Actual cycle time of the replacement ball is 922
seconds total in-process inventory is 1150 pieces and maximum in-process inventory 750
pieces is at heat treatment process alone And the lead time of the product is 289 hrs
Secondly mostly the contractual labor is working in the organization Thirdly numbers of
simultaneous families of products are in-process Since the contractual labor is working
their labour rates are set by the management according to the type of the operation and
quantity of the product to be manufactured If the quantity of the product is more then the
price of its operation will be less and if the quantity is less then the price will be more ie
number of units of product they operate in a day So the operator is not worried about the
type of the product Thatrsquos why the cycle time work in-process inventory and production
lead time are very high
33 Future state map of Replacement Ball
After analyzing the current state map of replacement ball it has been found out that material
arrangement is wasting much time than other processes Almost 10 days are required for the
procurement of raw material only and after that time is being wasted at the processes for
cutting and forging It has been observed that the forging of this product is readily available
in the market because there are many vendors who are producing same goods for other tractor
linkage part industries So first step is to remove the cutting and forging operations by
procuring directly the forging of these products Second step is to remove the CNC boring
operation by broaching operation Also double heating furnace should be used to reduce the
inventory of 750units at heat treatment operations because that the demand is continuous
Withdrawal KANBAN should also flow from planning department to dispatch department
The KANBAN system brought the necessary schedule and delivery discipline It has been
observed that these products are readily available in the market as soon as the demand raises
the forging procurement takes less than two days to provide that material to the machines
Thus it will help in reducing raw material inventory and also remove time consuming
processes to decrease the cycle time It also helped in making whole supply chain very lean
and flexible as shown in figure as shown in figure 3
[Insert Figure 3]
Comparison of cycle times with the TAKT time of both current and future states of
replacement ball has been shown in figure 4
[Insert Figure 4]
Great changes were found after implementing the proposed changes Like in-process
inventory was reduced from 1150 to 210 The lead time was reduced from 289hours to
71hours and cycle time was reduced from 922 seconds to 640 seconds Table 1 show that
CNC boring is 160 seconds and it has been replaced with broaching operation ie cycle time
reduced to 30 seconds
[Insert Table 1]
34 Current state map of Weldon Ball end
Weldon Ball End is also a tractor linkage part which is used in linkage assembly as explained
earlier Linkage assemblies are of two typersquos ie top link assembly and lower link assembly
Lower link assembly is mounted on the rare side of the tractor with Weldon Ball Ends welded
on both sides of the strip Mostly both the Weldon Ends welded on the strip are of same size
but sometimes these may be different according to the requirement of the next linkage part
which is yet to link with the lower link assembly Two lower link assemblies are mounted on
the rare side of the tractor it means four Weldon Ball Ends are required on one tractor These
are used to link the drawbar with the tractor on one side and on the other side these are linked
with linkage pins
The demand of Weldon ball end per month is 15000 pieces effective numbers of working
days are 25 per month number of shifts per day is 2 and working hours per shift are 12
Available working time per day in minutes is 1440 TAKT time comes out to be is 144
seconds Current state map is shown in figure 5 Similar procedure has been used for this
product also as explained above in the current state map of replacement ball After receiving
the order from the PPC department MRP department orders the raw material to various
suppliers The time taken to supply the material to company after which production
department starts the scheduled operations ie converting raw material to finished goods is 10
days Details regarding inventory cycle time lead time up time and number of shifts are
shown in value stream map
[Insert Figure 5]
After studying the current state map it has been observed that the maximum demand per
month demand of Weldon Ball end is 15000 pieces per month After studying it was found
out that cycle time of Weldon ball end is 1066seconds total in-process inventory is 1720
pieces maximum in-process inventory ie 1000 pieces at stress relieving process and the
production lead time comes out be is 282 hours Comparison of TAKT time with station
cycle time is shown in figure 6
[Insert Figure 6]
35 Future state map of Weldon Ball end
Lean production system has been implemented ie nothing is to be produced until it is
needed After procuring the goods single minute exchange die (SMED) method has been
initiated in coining and ball clamping process After analyzing the cycle times of various
operations (like rough and final boring) were quite high as compared with that of TAKT time
The rough boring and final boring operations has been done on the simple lathes which were
having copy turning attachments So these operations were replaced by drilling and CNC
boring respectively Moreover on lathe machines the tool wear was very high and surface
finish was also not very fine Work instruction sheets have been introduced daily production
and rejection reports have been checked by the concerned engineer to ensure its daily
production run Thus it will help in reducing raw material inventory and also eliminating time
consuming processes to assist in decreasing the cycle time as shown in figure 7
[Insert Figure 7]
After implementing VSM the cycle time has been reduced to 553 seconds instead of 1066
seconds in-process inventory was reduced to 370 units from 1720 units and production lead
time now is 73 hours Earlier it was 282 hours Replacement of rough boring operation with
CNC boring has reduced cycle times from 300 seconds to 117 seconds as depicted in Table 2
[Insert Table 2]
4 Conclusions
Most of the organisations are very keen to adopt latest techniques viz VSM It is a very
powerful tool to highlight the process inefficiencies and improvement areas In this case
study it has been illustrated with the help of VSM technique Current state map and future
state map have been prepared and analyzed to highlight the benefits of a lean system in a
small company In replacement ball there is 6941 reduction in cycle time 1826
reduction in work in process inventory and 2456 reduction in production lead times In
Weldon ball end there is 5187 reduction in cycle time 2151 reduction in work in
process inventory 2588 reduction in lead time after future state map application
Acknowledgement
The authors would like to thank Executive Editor of the Journal and Reviewers for improving
the contents of the paper
References
Abdulmalek FA and Rajgopal J (2007) ldquoApplication of VSM to process industryrdquo
International Journal of Production Economics Vol 107 No 1 pp 223-36
Braglia M Carmignani G and Zammori F (2006) ldquoA new value stream mapping
approach for complex production systemsrdquo International Journal of Production Research
Vol 44 No 18 pp 3929-52
Chitturi RM Glew DJ and Paulls A (2007) ldquoValue stream mapping in a jobshoprdquo
International Conference on Agile Manufacturing Durham University Durham 9-11 July
pp 142-47
Chowdary B V and George D (2011) ldquoImprovement of manufacturing operations at a
pharmaceutical company A lean manufacturing approachrdquo Journal of Manufacturing
Technology Management Vol 23 No 1 pp 56-75
Grewal CS (2008) ldquoAn initiative to implement lean manufacturing using value stream
mapping in a small companyrdquo International Journal of Manufacturing Technology and
Management Vol 15 Nos 34 pp 404-17
Gurumurthy A and Kodali R (2009) ldquoApplication of benchmarking for assessing the lean
manufacturing implementationrdquo Benchmarking An International Journal Vol 16 No 2 pp
274-08
Gurumurthy A and Kodali R (2011) ldquoDesign of lean manufacturing systems using value
stream mapping with simulation A case study Journal of Manufacturing Technology
Management Vol 22 No 4 pp 444-73
Gurumurthy A and Kodali R (2007) ldquoPerformance value analysis for the justification of
lean manufacturing systemsrdquo Proceedings of International Conference on Industrial
Engineering and Engineering Management Vol 1 No1 pp 377-81
Hines P and Rich N (1997) ldquoThe seven value stream mapping toolsrdquo International
Journal of Operations and Production Management Vol 17 No 1 pp 46-64
Hines P (1999) ldquoValue stream management next frontier in supply chainrdquo Logistics Focus
Vol 1 No 3 pp 36-9
Hines P Rich N Bicheno J Brunt D Taylor D Butterworth C and Sullivan J
(1998) ldquoValue stream managementrdquo The International Journal of Logistics Management
Vol 9 No 1 pp 25-42
Jones D and Womack J (2000) Seeing the Whole Mapping the Extended Value Stream
Lean Enterprise Institute
Lasa IS Laburu CO and de Castro VR (2008) ldquoAn evaluation of the value stream
mapping toolrdquo Business Process Management Journal Vol 14 No 1 pp 39-52
Lian YH and Van Landeghem H (2007) ldquoAnalyzing the effects of lean manufacturing
using a value stream mapping-based simulation generatorrdquo International Journal of
Production Research Vol 45 No 13 pp 3037-58
Liker JK and Wu YC 2000 ldquoJapanese automakers US suppliers and supply-chain
superiorityrdquo Sloan Management Review Vol 42 No1 pp 81-93
Mahapatra SS and Mohanty SR (2007) ldquoLean manufacturing in continuous process
industry An empirical studyrdquo Journal of Scientific and Industrial Research Vol 66 No1
pp 19-27
Pavnaskar SJ Gershenson JK and Jambekar AB (2003) ldquoClassification scheme for lean
manufacturing toolsrdquo International Journal of Production Research Vol 41 No13 pp
3075-90
Rother M and Shook J (1999) Learning to See Value Stream Mapping to Create Value
and Eliminate Muda Lean Enterprise Institute Cambridge MA
Sahoo AK Singh NK Shankar R and Tiwari MK (2008) ldquoLean philosophy
implementation in a forging companyrdquo International Journal of Advanced Manufacturing
Technology Vol 36 Nos 56 pp 451-62
Seth D and Gupta V (2005) ldquoApplication of value stream mapping for lean operations and
cycle time reduction an Indian case studyrdquo Production Planning and Control Vol 16 No 1
pp 44-59
Seth D Seth N and Goel D (2008) ldquoApplication of value stream mapping (VSM) for
minimization of wastes in the processing side of supply chain of cottonseed oil industry in
Indian contextrdquo Journal of Manufacturing Technology Management Vol 19 No 4 pp 529-
50
Serrano I Ochoa C and de Castro R (2008) ldquoEvaluation of value stream mapping in
manufacturing system redesignrdquo International Journal of Production Research Vol 46 No
16 pp 4409-30
Shah R and Ward PT (2007) ldquoDefining and developing measures of lean productionrdquo
Journal of Operations Management Vol 25 No4 pp 785-805
Singh B and Sharma SK (2009) ldquoValue stream mapping a versatile tool for lean
implementation an Indian case study of a manufacturing industryrdquo Journal of Measuring
Business Excellence Vol 13 No 3 pp 58-68
Singh B Garg SK and Sharma SK (2009) ldquoLean can be a survival strategy during
recessionary timesrdquo International Journal of Productivity and Performance Measurement
Vol 58 No 8 pp 803-8
Singh B Garg SK Sharma SK and Grewal C (2010) ldquoLean implementation and its
benefits to production industryrdquo International Journal of Lean Six Sigma Vol 1 No 2 pp
157-68
Taylor DH (2005) ldquoValue chain analysis an approach to supply chain improvements in
agri-food chainsrdquo International Journal of Physical Distribution and Logistics Management
Vol 35 No 10 pp 744-61
Womack J Jones DT and Roos D (1990) The machine that changed the world
Macmillan New York NY
Wong CY Wong YK and Ali A (2009) ldquoA study on Lean Manufacturing
implementation in the Malaysian electrical and electronics industryrdquo European Journal of
Scientific Research Vol 38 No 4 pp 521-35
Vinodh S Shivraman KR and Viswesh S (2011) ldquoAHP-based lean concept selection in a
manufacturing organizationrdquo Journal of Manufacturing Technology Management Vol 23
No 1 pp124-36
Figure 1 Comparison of lead time of various products
Supplies Customers
MRP
Monthly
Schedule
Daily
Req
PPC
Dept
240 hrs
Cutting Forging Packing
Weekly
Req
Zero 100 35 Zero 75 75 750 65 Zero 50 Zero
Drilling Face CNC TurningCNC Boring HT Shot Blast Buffing Plating
Production
Lead Time
289 hrs
Processing
Time
922 Sec
20
Sec117
Sec
89
Sec30
Sec
160
Sec
60
Sec
127
Sec
60
Sec
45
Sec
103
Sec
96
Sec
CT=20 Sec
2-Shifts
Uptime=
100
CT=117Sec
2-Shifts
Uptime=
100
CT=89 Sec
2-Shifts
Uptime=
100
CT=30 Sec
2-Shifts
Uptime=
100
CT=160Sec
2-Shifts
Uptime=
100
CT=60 Sec
2-Shifts
Uptime=
100
CT=127Sec
2-Shifts
Uptime=
100
CT=60 Sec
2-Shifts
Uptime=
90
CT=45Sec
2-Shifts
Uptime=
100
CT=103Sec
2-Shifts
Uptime=
100
CT=96Sec
20Shifts
Uptime=
100
Monthly
Req
Marketing
Department
Annual
Forecast
1 hr 3 hrs 5 hrs 2 hrs 0 hrs 10 hrs 10hrs 4 hrs 2 hrs10hrs 2 hrs
Figure 2 Current state map of Replacement Ball
Supplies
Annual
Forecast
Customers
MRP
Monthly
Schedule
Daily
Req
PPC
DeptWeekly
Req
Production
LeadTime
63 hrs
Processing
Time
640 sec
89
Sec
30
Sec30
Sec60
Sec127
Sec
60
Sec30
Sec
103
Sec
96
Sec
35
Drilling Face Broaching
Zero Zero 60 Zero 65 Zero 50 Zero
CNCTurning HT Shot Blast Buffing Plating Packing
Despatch
KanbanKanban
CT=89 Sec
2-Shifts
Uptime=
100
CT=30 Sec
2-Shifts
Uptime=
100
CT=60Sec
2-Shifts
Uptime=
95
CT=60 Sec
2-Shifts
Uptime=
95
CT=127Sec
2-Shifts
Uptime=
95
CT=1 min
2-Shifts
Uptime=
100
CT=30 Sec
2-Shifts
Uptime=
95
CT=103Sec
2-Shifts
Uptime=
100
CT=96 Sec
2-Shifts
Uptime=
100
Monthly
Req
Marketing
Department
0 hr 2 hrs 0 hr 1 hr 2 hrs 10 hrs 4 hrs 2 hrs 2 hrs
48 hours
Figure 3 Future state map of Replacement Ball
Figure 4 Comparison of cycle time of current and future states for Replacement Ball
Supplies
Marketing
Department Customers
MRP
Monthly
Schedule
Daily
Req
20
Sec
PPC
Dept
Production
Lead Time
282 hrs
Proceesing
Time
1066 sec
180
sec
40
sec20
sec
300
sec230
sec
30
sec
30
sec1 min 1 min
96
sec
240 hrs
Cutting
200 1000
Forging StressRelieving
20 100 130 Zero Zero100 70 100
Coining RoughBoring FinalBoring Face ShotBlast Ball Clamping PackingChamfer
Weekly
Req
CT=20 Sec
2-Shifts
Uptime=
95
CT=3 min
2-Shifts
Uptime=
100
CT=40 Sec
2-Shifts
Uptime=
100
CT=20 Sec
2-Shifts
Uptime=
95
CT=300Sec
2-Shifts
Uptime=
95
CT=230Sec
2-Shifts
Uptime=
100
CT=30 Sec
2-Shifts
Uptime=
100
CT=30 Sec
2-Shifts
Uptime=
95
CT=1 min
2-Shifts
Uptime=
100
CT=1 min
2-Shifts
Uptime=
95
CT=96 Sec
2-Shifts
Uptime=
100
Annual
Forecast
Monthly
Req
1 hr 5 hrs 12 hrs 3 hrs 4 hrs 0 hr 2 hrs 0 hr 5 hrs 5 hrs 5 hrs
Figure 5 Current state map of Weldon Ball End
Figure 6 Comparison of cycle time of current and future states for Weldon Ball End
Supplies
Marketing
Department
Annual
Forecast
Customers
Despatch48
Hours
Coining Drilling Final Boring Face Chamfer Shot Blast Ball Clamping Packing
MRP
Kanban Kanban
Monthly
Schedule
Daily
Req
20 10 70 Zero Zero 100 70 50
Daily
Req
PPC
Dept
Processing
Lead Time
73 hrs
Processing
Time
553 Sec
CT=20 Sec
2-Shifts
Uptime=
95
CT=117Sec
2-Shifts
Uptime=
100
CT=140Sec
2-Shifts
Uptime=
95
CT=30 Sec
2-Shifts
Uptime=
100
CT=30Sec
2-Shits
Uptime=
100
CT=1 min
2-Shifts
Uptime=
95
CT=1 min
2-Shifts
Uptime=
100
CT=96 Sec
2-Shifts
Uptime=
100
20 Sec 117 Sec 140 Sec 30 Sec30 Sec 1 min 1 min 96 Sec
Monthly
Req
10hrs 1 hr 2 hrs 2 hrs 5 hrs 5 hrs 0 hrs0 hrs
Figure 7 Future state map of Weldon Ball End
Table 1 Current and future states of Replacement Ball
Processes Cycle Time
(In sec)
In-Process
Inventory (No)
Production Lead
Time (In Hrs)
Current Future Current Future Current Future
Material Arrangement 0 240
Forging Arrangement 0 0 0 48
Cutting 20 0 0 1
Forging 117 0 100 3
Drilling 89 89 35 35 10 2
Face 30 30 0 0 5 0
Broaching 30 0
CNC Boring 160 75 0 2
CNC Turning 75 75 75 60 0 1
Heat Treatment 127 127 750 0 10 2
Shot Blast 60 60 65 65 10 10
Buffing 45 30 0 0 4 4
Plating 103 103 50 50 2 2
Packing 96 96 0 0 2 2
Total 922 640 1150 210 289 71
Percentage Reduction 6941 1826 2457
Table 2 Current and future state of Weldon Ball End
Processes Cycle Time
(In sec)
In-Process
Inventory (No)
Production
Lead Time
(In Hrs)
Current Future Current Future Current Future
Material Arrangement 0 240
Forging Arrangement 0 48
Cutting 20 0 1
Forging 180 200 5
Stress relieving in acid 40 1000 12
Coining 20 20 20 20 3 10
Drilling 117 10 1
Rough Boring 300 100 4
Final Boring 230 140 130 70 0 2
Face 30 30 0 0 2 2
Chamfer 30 30 0 0 0 0
Shot Blast 60 60 100 100 5 5
Ball Clamping 60 60 70 70 5 5
Packing 96 96 100 100 5 0
Total 1066 553 1720 370 282 73
Percentage Reduction 5188 2151 2589
Biographical notes Harwinder Singh holds a Bachelors Degree in Mechanical Engineering
Masters Degree of Business Administration Masters Degree in Production Engineering and
PhD in Mechanical Engineering Currently he is working as Associate Professor in the
Department of Mechanical Engineering at Guru Nanak Dev Engineering College Ludhiana
Punjab India He has contributed a number of research papers at the international level His
present area of interest includes optimization techniques and management of production
systems Harwinder Singh is the corresponding author and can be contacted at
harwin75rediffmailcom
Amandeep Singh holds a Bachelors Degree in Production Engineering and MTech Degree in
Production Engineering from Guru Nanak Dev Engineering College Ludhiana Punjab
India He has contributed around five research papers in different conferences

Supplies
Annual
Forecast
Customers
MRP
Monthly
Schedule
Daily
Req
PPC
DeptWeekly
Req
Production
LeadTime
63 hrs
Processing
Time
640 sec
89
Sec
30
Sec30
Sec60
Sec127
Sec
60
Sec30
Sec
103
Sec
96
Sec
35
Drilling Face Broaching
Zero Zero 60 Zero 65 Zero 50 Zero
CNCTurning HT Shot Blast Buffing Plating Packing
Despatch
KanbanKanban
CT=89 Sec
2-Shifts
Uptime=
100
CT=30 Sec
2-Shifts
Uptime=
100
CT=60Sec
2-Shifts
Uptime=
95
CT=60 Sec
2-Shifts
Uptime=
95
CT=127Sec
2-Shifts
Uptime=
95
CT=1 min
2-Shifts
Uptime=
100
CT=30 Sec
2-Shifts
Uptime=
95
CT=103Sec
2-Shifts
Uptime=
100
CT=96 Sec
2-Shifts
Uptime=
100
Monthly
Req
Marketing
Department
0 hr 2 hrs 0 hr 1 hr 2 hrs 10 hrs 4 hrs 2 hrs 2 hrs
48 hours
Figure 3 Future state map of Replacement Ball
Figure 4 Comparison of cycle time of current and future states for Replacement Ball
Supplies
Marketing
Department Customers
MRP
Monthly
Schedule
Daily
Req
20
Sec
PPC
Dept
Production
Lead Time
282 hrs
Proceesing
Time
1066 sec
180
sec
40
sec20
sec
300
sec230
sec
30
sec
30
sec1 min 1 min
96
sec
240 hrs
Cutting
200 1000
Forging StressRelieving
20 100 130 Zero Zero100 70 100
Coining RoughBoring FinalBoring Face ShotBlast Ball Clamping PackingChamfer
Weekly
Req
CT=20 Sec
2-Shifts
Uptime=
95
CT=3 min
2-Shifts
Uptime=
100
CT=40 Sec
2-Shifts
Uptime=
100
CT=20 Sec
2-Shifts
Uptime=
95
CT=300Sec
2-Shifts
Uptime=
95
CT=230Sec
2-Shifts
Uptime=
100
CT=30 Sec
2-Shifts
Uptime=
100
CT=30 Sec
2-Shifts
Uptime=
95
CT=1 min
2-Shifts
Uptime=
100
CT=1 min
2-Shifts
Uptime=
95
CT=96 Sec
2-Shifts
Uptime=
100
Annual
Forecast
Monthly
Req
1 hr 5 hrs 12 hrs 3 hrs 4 hrs 0 hr 2 hrs 0 hr 5 hrs 5 hrs 5 hrs
Figure 5 Current state map of Weldon Ball End
Figure 6 Comparison of cycle time of current and future states for Weldon Ball End
Supplies
Marketing
Department
Annual
Forecast
Customers
Despatch48
Hours
Coining Drilling Final Boring Face Chamfer Shot Blast Ball Clamping Packing
MRP
Kanban Kanban
Monthly
Schedule
Daily
Req
20 10 70 Zero Zero 100 70 50
Daily
Req
PPC
Dept
Processing
Lead Time
73 hrs
Processing
Time
553 Sec
CT=20 Sec
2-Shifts
Uptime=
95
CT=117Sec
2-Shifts
Uptime=
100
CT=140Sec
2-Shifts
Uptime=
95
CT=30 Sec
2-Shifts
Uptime=
100
CT=30Sec
2-Shits
Uptime=
100
CT=1 min
2-Shifts
Uptime=
95
CT=1 min
2-Shifts
Uptime=
100
CT=96 Sec
2-Shifts
Uptime=
100
20 Sec 117 Sec 140 Sec 30 Sec30 Sec 1 min 1 min 96 Sec
Monthly
Req
10hrs 1 hr 2 hrs 2 hrs 5 hrs 5 hrs 0 hrs0 hrs
Figure 7 Future state map of Weldon Ball End
Table 1 Current and future states of Replacement Ball
Processes Cycle Time
(In sec)
In-Process
Inventory (No)
Production Lead
Time (In Hrs)
Current Future Current Future Current Future
Material Arrangement 0 240
Forging Arrangement 0 0 0 48
Cutting 20 0 0 1
Forging 117 0 100 3
Drilling 89 89 35 35 10 2
Face 30 30 0 0 5 0
Broaching 30 0
CNC Boring 160 75 0 2
CNC Turning 75 75 75 60 0 1
Heat Treatment 127 127 750 0 10 2
Shot Blast 60 60 65 65 10 10
Buffing 45 30 0 0 4 4
Plating 103 103 50 50 2 2
Packing 96 96 0 0 2 2
Total 922 640 1150 210 289 71
Percentage Reduction 6941 1826 2457
Table 2 Current and future state of Weldon Ball End
Processes Cycle Time
(In sec)
In-Process
Inventory (No)
Production
Lead Time
(In Hrs)
Current Future Current Future Current Future
Material Arrangement 0 240
Forging Arrangement 0 48
Cutting 20 0 1
Forging 180 200 5
Stress relieving in acid 40 1000 12
Coining 20 20 20 20 3 10
Drilling 117 10 1
Rough Boring 300 100 4
Final Boring 230 140 130 70 0 2
Face 30 30 0 0 2 2
Chamfer 30 30 0 0 0 0
Shot Blast 60 60 100 100 5 5
Ball Clamping 60 60 70 70 5 5
Packing 96 96 100 100 5 0
Total 1066 553 1720 370 282 73
Percentage Reduction 5188 2151 2589
Biographical notes Harwinder Singh holds a Bachelors Degree in Mechanical Engineering
Masters Degree of Business Administration Masters Degree in Production Engineering and
PhD in Mechanical Engineering Currently he is working as Associate Professor in the
Department of Mechanical Engineering at Guru Nanak Dev Engineering College Ludhiana
Punjab India He has contributed a number of research papers at the international level His
present area of interest includes optimization techniques and management of production
systems Harwinder Singh is the corresponding author and can be contacted at
harwin75rediffmailcom
Amandeep Singh holds a Bachelors Degree in Production Engineering and MTech Degree in
Production Engineering from Guru Nanak Dev Engineering College Ludhiana Punjab
India He has contributed around five research papers in different conferences
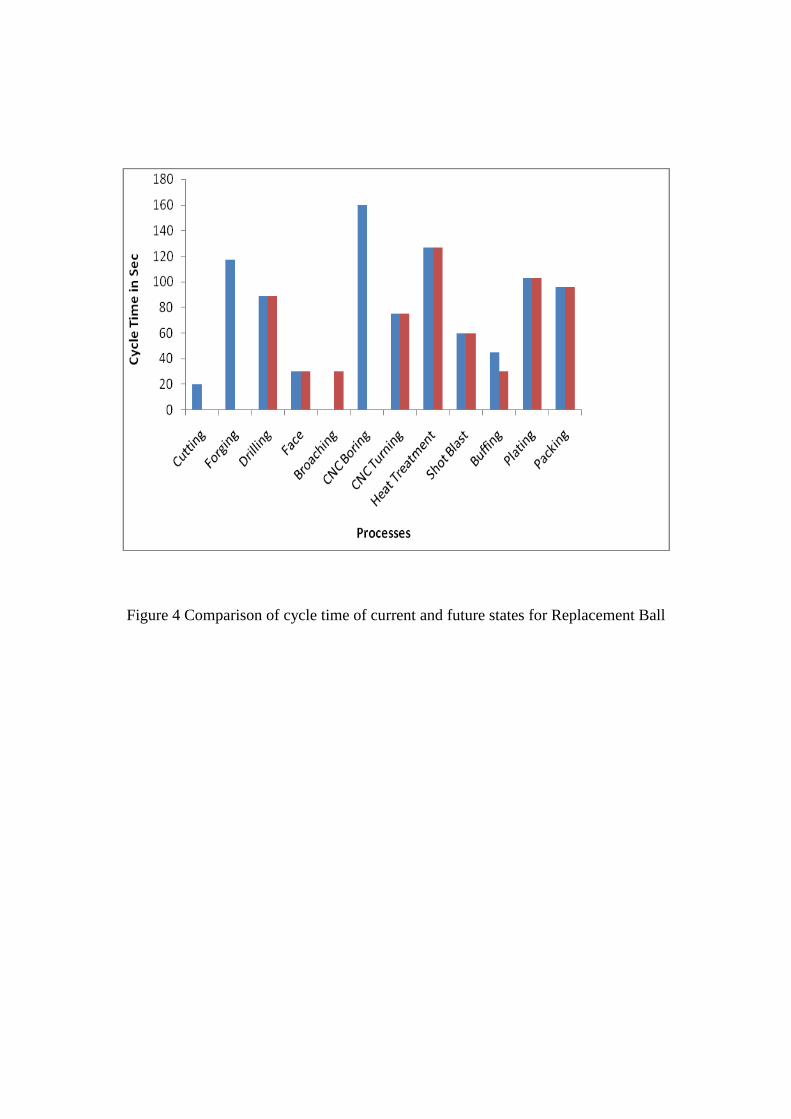

Supplies
Marketing
Department Customers
MRP
Monthly
Schedule
Daily
Req
20
Sec
PPC
Dept
Production
Lead Time
282 hrs
Proceesing
Time
1066 sec
180
sec
40
sec20
sec
300
sec230
sec
30
sec
30
sec1 min 1 min
96
sec
240 hrs
Cutting
200 1000
Forging StressRelieving
20 100 130 Zero Zero100 70 100
Coining RoughBoring FinalBoring Face ShotBlast Ball Clamping PackingChamfer
Weekly
Req
CT=20 Sec
2-Shifts
Uptime=
95
CT=3 min
2-Shifts
Uptime=
100
CT=40 Sec
2-Shifts
Uptime=
100
CT=20 Sec
2-Shifts
Uptime=
95
CT=300Sec
2-Shifts
Uptime=
95
CT=230Sec
2-Shifts
Uptime=
100
CT=30 Sec
2-Shifts
Uptime=
100
CT=30 Sec
2-Shifts
Uptime=
95
CT=1 min
2-Shifts
Uptime=
100
CT=1 min
2-Shifts
Uptime=
95
CT=96 Sec
2-Shifts
Uptime=
100
Annual
Forecast
Monthly
Req
1 hr 5 hrs 12 hrs 3 hrs 4 hrs 0 hr 2 hrs 0 hr 5 hrs 5 hrs 5 hrs
Figure 5 Current state map of Weldon Ball End
Figure 6 Comparison of cycle time of current and future states for Weldon Ball End
Supplies
Marketing
Department
Annual
Forecast
Customers
Despatch48
Hours
Coining Drilling Final Boring Face Chamfer Shot Blast Ball Clamping Packing
MRP
Kanban Kanban
Monthly
Schedule
Daily
Req
20 10 70 Zero Zero 100 70 50
Daily
Req
PPC
Dept
Processing
Lead Time
73 hrs
Processing
Time
553 Sec
CT=20 Sec
2-Shifts
Uptime=
95
CT=117Sec
2-Shifts
Uptime=
100
CT=140Sec
2-Shifts
Uptime=
95
CT=30 Sec
2-Shifts
Uptime=
100
CT=30Sec
2-Shits
Uptime=
100
CT=1 min
2-Shifts
Uptime=
95
CT=1 min
2-Shifts
Uptime=
100
CT=96 Sec
2-Shifts
Uptime=
100
20 Sec 117 Sec 140 Sec 30 Sec30 Sec 1 min 1 min 96 Sec
Monthly
Req
10hrs 1 hr 2 hrs 2 hrs 5 hrs 5 hrs 0 hrs0 hrs
Figure 7 Future state map of Weldon Ball End
Table 1 Current and future states of Replacement Ball
Processes Cycle Time
(In sec)
In-Process
Inventory (No)
Production Lead
Time (In Hrs)
Current Future Current Future Current Future
Material Arrangement 0 240
Forging Arrangement 0 0 0 48
Cutting 20 0 0 1
Forging 117 0 100 3
Drilling 89 89 35 35 10 2
Face 30 30 0 0 5 0
Broaching 30 0
CNC Boring 160 75 0 2
CNC Turning 75 75 75 60 0 1
Heat Treatment 127 127 750 0 10 2
Shot Blast 60 60 65 65 10 10
Buffing 45 30 0 0 4 4
Plating 103 103 50 50 2 2
Packing 96 96 0 0 2 2
Total 922 640 1150 210 289 71
Percentage Reduction 6941 1826 2457
Table 2 Current and future state of Weldon Ball End
Processes Cycle Time
(In sec)
In-Process
Inventory (No)
Production
Lead Time
(In Hrs)
Current Future Current Future Current Future
Material Arrangement 0 240
Forging Arrangement 0 48
Cutting 20 0 1
Forging 180 200 5
Stress relieving in acid 40 1000 12
Coining 20 20 20 20 3 10
Drilling 117 10 1
Rough Boring 300 100 4
Final Boring 230 140 130 70 0 2
Face 30 30 0 0 2 2
Chamfer 30 30 0 0 0 0
Shot Blast 60 60 100 100 5 5
Ball Clamping 60 60 70 70 5 5
Packing 96 96 100 100 5 0
Total 1066 553 1720 370 282 73
Percentage Reduction 5188 2151 2589
Biographical notes Harwinder Singh holds a Bachelors Degree in Mechanical Engineering
Masters Degree of Business Administration Masters Degree in Production Engineering and
PhD in Mechanical Engineering Currently he is working as Associate Professor in the
Department of Mechanical Engineering at Guru Nanak Dev Engineering College Ludhiana
Punjab India He has contributed a number of research papers at the international level His
present area of interest includes optimization techniques and management of production
systems Harwinder Singh is the corresponding author and can be contacted at
harwin75rediffmailcom
Amandeep Singh holds a Bachelors Degree in Production Engineering and MTech Degree in
Production Engineering from Guru Nanak Dev Engineering College Ludhiana Punjab
India He has contributed around five research papers in different conferences