Seven wastes elimination targeted by lean manufacturing ...
13
International Journal of Economics, Finance and Management Sciences 2013; 1(2): 68-80 Published online April 2, 2013 (http://www.sciencepublishinggroup.com/j/ijefm) doi: 10.11648/j.ijefm.20130102.12 Seven wastes elimination targeted by lean manufacturing case study “gaza strip manufacturing firms’’ Khalil A. El-Namrouty, Mohammed S. AbuShaaban Dep’t of Economics and political Science, Al-Oma Univesity, Islamic University- Gaza, Palestinian National Authority Email address: [email protected] (K. A. El-Namrouty), [email protected] (M. S. AbuShaaban) To cite this article: Khalil A. El-Namrouty, Mohammed S. AbuShaaban. Seven Wastes Elimination Targeted by Lean Manufacturing Case Study “Gaza Strip Manufacturing Firms’’, International Journal of Economics, Finance and Management Sciences. Vol. 1, No. 2, 2013, pp. 68-80. doi: 10.11648/j.ijefm.20130102.12 Abstract: The research paper aims to investigate and analyze the current situation of wastes elimination of the manufac- turing firms in Gaza Strip and its important role for reducing the production cost; in addition it aims to promote lean thinking through studying the seven wastes that are targeted by the lean manufacturing philosophy. Wastes Relations Matrix (WRM) was implemented to analyze the effect of each waste on the other six wastes. The main findings are that lean manufacturing (wastes elimination) affects positively on reducing the production cost for the manufacturing business in Gaza strip. Keywords: Lean Manufacturing, Managers, Production Cost, Gaza Strip 1. Introduction A new vocabulary has developed in the past decade that stems from the Toyota Production System. Lean manufac- turing is a concept whereby all production employees work together to eliminate waste (Meyers and Stewart, 2002). Manufacturers throughout industries are moving to a different system of production called Lean Manufacturing. It is not talking about adding some new techniques onto how to build products, but actually changing the way of thinking about manufacturing (Abdullah, 2003). The seven wastes that are targeted by the Lean Manufacturing Philosophy are: Overproduction, Inventory, Over-processing, Motion, Waiting, Defects, and Transportation (Poppendieck, 2002). Palestinian companies that are seeking the ability of an effective competition in the local as well as the global marketplace should be in superiority of producing their products within the least possible costs to achieve excellence in price and quality. There are 33933 working establish- ments in Gaza Strip including 3529 manufacturing firms. In reality, the manufacturing activities in Gaza Strip represent 10.4% of the total economy in Gaza Strip (PCBS, 2008). Table 1. No. of the Manufacturing Firms Operating in Gaza Strip and their Distribution by the Employment Group Size. The Employment Group Size Total Economic Activity 100+ 50-99 20-49 10-19 5-9 1-4 5 5 36 158 442 2883 3529 Manufacturing "Source: PCBS, (2008). Population, Housing and Establishment Census (2007), The Economic Establishments, The Final Results, Ramal- lah-Palestine". 2. History of Lean After World War II, Japanese manufacturers were faced with the dilemma of vast shortages of material, financial, and human resources. These conditions resulted in the birth of lean manufacturing concept. Toyota motor company, led by its president (Toyota), recognized that American auto- makers of the era were out-producing their Japanese coun- terparts; in the mid 1940’s American companies were out- performing their Japanese counterparts by a factor of ten. In order to make a move toward improvement early, Japanese leaders, such as, Shigeo Shingo and Taiichi Ohno, devised a new, disciplined, process-oriented system, which is known today as “Toyota Production System” or “Lean Manufac- turing” (Abdullah, 2003). Taiichi Ohno, who was given the task of developing a system that would enhance productivity at Toyota, is gen- erally considered to be the primary force behind its system.
-
Upload
khangminh22 -
Category
Documents
-
view
3 -
download
0
Transcript of Seven wastes elimination targeted by lean manufacturing ...

International Journal of Economics, Finance and Management Sciences 2013; 1(2): 68-80
Published online April 2, 2013 (http://www.sciencepublishinggroup.com/j/ijefm)
doi: 10.11648/j.ijefm.20130102.12
Seven wastes elimination targeted by lean manufacturing case study “gaza strip manufacturing firms’’
Khalil A. El-Namrouty, Mohammed S. AbuShaaban
Dep’t of Economics and political Science, Al-Oma Univesity, Islamic University- Gaza, Palestinian National Authority
Email address: [email protected] (K. A. El-Namrouty), [email protected] (M. S. AbuShaaban)
To cite this article: Khalil A. El-Namrouty, Mohammed S. AbuShaaban. Seven Wastes Elimination Targeted by Lean Manufacturing Case Study “Gaza Strip
Manufacturing Firms’’, International Journal of Economics, Finance and Management Sciences. Vol. 1, No. 2, 2013, pp. 68-80.
doi: 10.11648/j.ijefm.20130102.12
Abstract: The research paper aims to investigate and analyze the current situation of wastes elimination of the manufac-
turing firms in Gaza Strip and its important role for reducing the production cost; in addition it aims to promote lean thinking
through studying the seven wastes that are targeted by the lean manufacturing philosophy. Wastes Relations Matrix (WRM)
was implemented to analyze the effect of each waste on the other six wastes. The main findings are that lean manufacturing
(wastes elimination) affects positively on reducing the production cost for the manufacturing business in Gaza strip.
Keywords: Lean Manufacturing, Managers, Production Cost, Gaza Strip
1. Introduction
A new vocabulary has developed in the past decade that
stems from the Toyota Production System. Lean manufac-
turing is a concept whereby all production employees work
together to eliminate waste (Meyers and Stewart, 2002).
Manufacturers throughout industries are moving to a
different system of production called Lean Manufacturing. It
is not talking about adding some new techniques onto how to
build products, but actually changing the way of thinking
about manufacturing (Abdullah, 2003). The seven wastes
that are targeted by the Lean Manufacturing Philosophy are:
Overproduction, Inventory, Over-processing, Motion,
Waiting, Defects, and Transportation (Poppendieck, 2002).
Palestinian companies that are seeking the ability of an
effective competition in the local as well as the global
marketplace should be in superiority of producing their
products within the least possible costs to achieve excellence
in price and quality. There are 33933 working establish-
ments in Gaza Strip including 3529 manufacturing firms. In
reality, the manufacturing activities in Gaza Strip represent
10.4% of the total economy in Gaza Strip (PCBS, 2008).
Table 1. No. of the Manufacturing Firms Operating in Gaza Strip and their
Distribution by the Employment Group Size.
The Employment Group Size Total
Economic
Activity 100+ 50-99 20-49 10-19 5-9 1-4
5 5 36 158 442 2883 3529 Manufacturing
"Source: PCBS, (2008). Population, Housing and Establishment Census
(2007), The Economic Establishments, The Final Results, Ramal-
lah-Palestine".
2. History of Lean
After World War II, Japanese manufacturers were faced
with the dilemma of vast shortages of material, financial,
and human resources. These conditions resulted in the birth
of lean manufacturing concept. Toyota motor company, led
by its president (Toyota), recognized that American auto-
makers of the era were out-producing their Japanese coun-
terparts; in the mid 1940’s American companies were out-
performing their Japanese counterparts by a factor of ten. In
order to make a move toward improvement early, Japanese
leaders, such as, Shigeo Shingo and Taiichi Ohno, devised a
new, disciplined, process-oriented system, which is known
today as “Toyota Production System” or “Lean Manufac-
turing” (Abdullah, 2003).
Taiichi Ohno, who was given the task of developing a
system that would enhance productivity at Toyota, is gen-
erally considered to be the primary force behind its system.

International Journal of Economics, Finance and Management Sciences 2013, 1(2) : 68-80 69
After some experimentation, the Toyota production system
was developed and refined between 1945 and 1970, and is
still growing today all over the world.(Liker, 2004). In 1980s,
products were being brought to the market with higher
quality and lower price. Consumers came to expect higher
quality and lower prices as a requisite for purchase. Some
manufacturers faded away while others began to look dili-
gently for better ways to compete (Hobbs, 2004).
In order to compete in today’s fiercely competitive market,
US manufacturers have come to realize that the traditional
mass production concept has to be adapted to the new ideas
of lean manufacturing because the Japanese companies
developed, produced and distributed products with half or
less human effort, capital investment, floor space, tools,
materials, time, and overall expense (Khatri, et.al, 2011).
3. Literature Review
The effect of lean manufacturing on cost of production
has been addressed by a number of researchers. Saleh (2011)
found that the five studied Iraqi manufacturing firms possi-
bilities of establishing the lean foundations are different
according to the availability of thinking capital and there is a
positive relationship between the thinking capital and lean
foundations for all of the studied firms. Badran (2010) con-
cluded that managing the production processes is very im-
portant for all kinds of organizations in Syria (General and
private organizations, manufacturing and service organiza-
tions). Forrester, et.al. (2010) stated that managers of the
agricultural machinery sector in Brazil have supported a
transition towards the adoption of lean manufacturing prac-
tices and they have shown a significant improvement in their
business performance including the production cost.
El-Kourd (2009) concluded that using lean construction in
Gaza Strip reduced the number of steps in the whole project
by 57%, the non-value added decreased from 81% to 14% in
the project duration, and the total cycle time of the project
was reduced by 75%. Enaghani, et.al. (2009) illustrated that
lean is a culture for quality improvement starting with re-
volutionizing the minds of employees while TPM is a me-
thod in Ireland and Sweden. Hallgren and Olhager (2009)
found that lean manufacturing has a significant impact on
cost performance for the studied plants in 7 countries,
whereas agile manufacturing has not, and agile manufac-
turing has a stronger relationship with volume than does lean
manufacturing. Rathi (2009) concluded that unneeded
processing, transportation of materials and WIP inventory
wastes are significant in job type PI and raw material in-
ventory was the most prevalent waste for the process in-
dustry sector. AlDabbagh and Hassan (2008) stated that the
studied company in Iraq has an accepTable (knowledge
concerning lean manufacturing, and the basic requirements
to apply lean manufacturing are available in this company.
Piercy and Rich (2008) illustrated that services call centers
for the studied 3 financial services companies in the UK can
serve the traditionally competing priorities both of opera-
tional cost reduction and increased customer service quality.
Czabke (2007) concluded that all plants became more effi-
cient and hence more cost effective and profiTable (after
implementing lean manufacturing in the US and Germany.
McGrath (2007) found that both Irish companies have made
some great improvements in terms of the value streams of
their respective plants and also in the reduction of waste and
inventory. Another result has been reached that lean manu-
facturing is a considered as a strategic tool to improve the
competitive position of the organization. Berg and Ohlsson
(2005) stated that overproduction is the most serious waste
because it contributes to the other six wastes where produc-
tion costs money and there is no reason to produce items that
are not demanded. Koh, et.al. (2004) has reached to the
conclusion that lower production costs can be achieved
when lean production manufacturing practices, such as,
TQM and JIT, are used. Stephen (2004) showed that the
slow rate of corporate improvement is not due to lack of
knowledge of six-sigma or lean. Rather, the fault lies in
making the transition from theory to implementation. Ya-
mashita (2004) concluded that higher quality products with
less resources and capital are achieved by implementing lean
manufacturing and lean manufacturing leads to reductions in
scrap, rework, returns, and waste. Abdullah (2003) con-
cluded that the driving force behind implementing lean in
the US was the cost reduction for the steel companies
(among others). Kilpatrick (1997) concluded that inventory
increasing lead to ever increasing costs in the form of in-
vested capital, damaged finished goods, scrapped product,
and costly inventory control system. Also, eliminating all
defects is crucial to minimize lead time was another con-
clusion. Joing (1995) concluded that on-time delivery and
customer satisfaction improved while lead times and in-
ventories dropped significantly.
4. Problem and Hypothesis
Managers of the manufacturing firms in Gaza Strip are
focusing on the manufacturing processes or the value-added
activities in order to improve their business profitability. On
the other hand, they neglect the importance and effects of the
non-value added activities (wastes) which are usually not
explicitly visible. Therefore, the research main question is:
What is the effect of lean manufacturing on the production
cost for the manufacturing firms in Gaza Strip?
The research paper tested the study problem by using the
following hypotheses:
There is a significant statistical effect for the seven wastes
elimination targeted by lean manufacturing (overproduction,
inventory, over-processing, motion, waiting, defects and
transportation) on the production cost for the manufacturing
firms in Gaza Strip.
5. Objectives
The main goal of the present research work is to investi-
gate the current situation of wastes elimination in the man-
ufacturing firms in Gaza Strip and its important role for
70 Khalil A. El-Namrouty et al.: Seven wastes elimination targeted by lean manufacturing case study
“gaza strip manufacturing firms’’
reducing the production cost. Also, it aims to promote Lean
thinking in Gaza Strip manufacturing firms, also, the re-
search seeks to provide a comprehensive picture of the re-
ality of the wastes elimination management and its multiple
dimensions in the manufacturing firms and paving the way
for officials to make steps and to develop policies to ensure
the competition of the Palestinian industry.
6. Lean Manufacturing Definition
Lean manufacturing is defined as "A philosophy, based on
Toyota Production System, and other Japanese management
practices that strives to shorten the time line between the
customer order and the shipment of the final product, by
consistent elimination of waste". All types of companies,
manufacturing, process, distribution, software development
or financial services can benefit from adopting lean phi-
losophy. As long as a company can identify a value stream,
from when the customers order product to when they receive
it, lean principles can be applied and waste removed (Singh,
1999). Also, lean manufacturing is: "Adding value by eli-
minating waste, being responsive to change, focusing on
quality, and enhancing the effectiveness of work force"
(Liker, 2004). Another definition for lean manufacturing: "it
is a systematic approach to identify and eliminate waste
(non-value added activities) through continuous improve-
ment by following the product at the pull of the customer in
pursuit of perfection" (Czarnecki and Loyd, 1998).
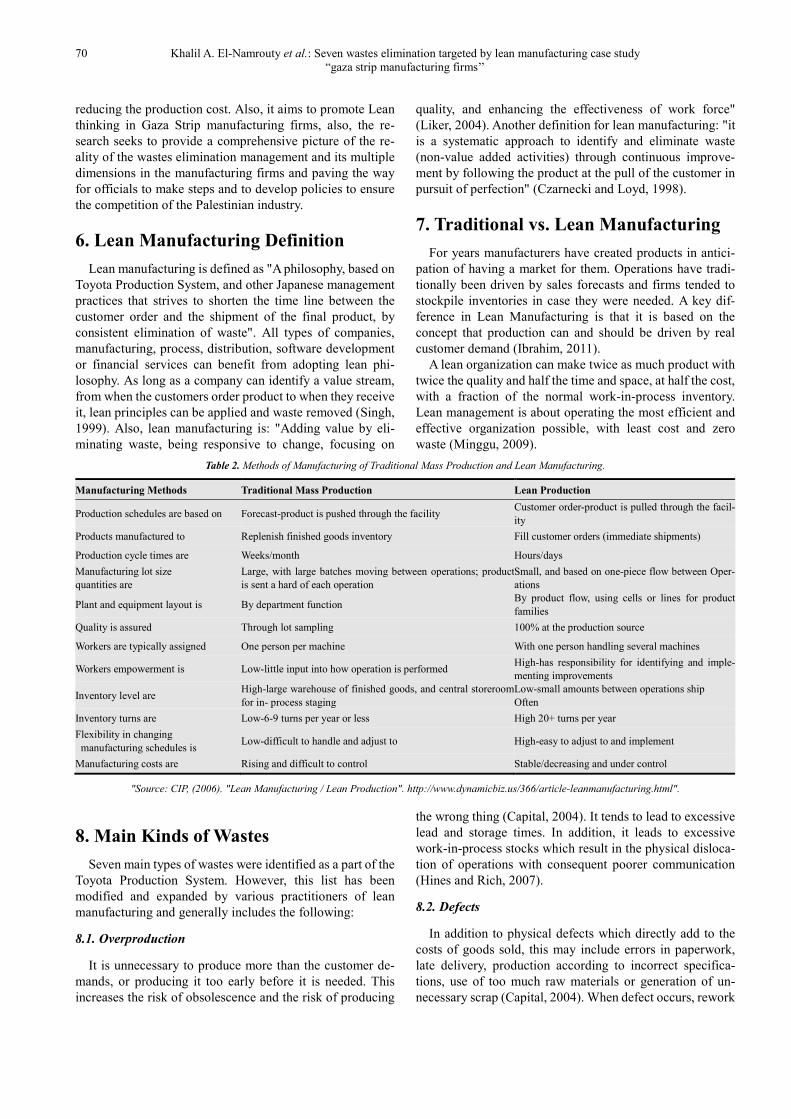
7. Traditional vs. Lean Manufacturing
For years manufacturers have created products in antici-
pation of having a market for them. Operations have tradi-
tionally been driven by sales forecasts and firms tended to
stockpile inventories in case they were needed. A key dif-
ference in Lean Manufacturing is that it is based on the
concept that production can and should be driven by real
customer demand (Ibrahim, 2011).
A lean organization can make twice as much product with
twice the quality and half the time and space, at half the cost,
with a fraction of the normal work-in-process inventory.
Lean management is about operating the most efficient and
effective organization possible, with least cost and zero
waste (Minggu, 2009).
Table 2. Methods of Manufacturing of Traditional Mass Production and Lean Manufacturing.
Manufacturing Methods Traditional Mass Production Lean Production
Production schedules are based on Forecast-product is pushed through the facility Customer order-product is pulled through the facil-
ity
Products manufactured to Replenish finished goods inventory Fill customer orders (immediate shipments)
Production cycle times are Weeks/month Hours/days
Manufacturing lot size
quantities are
Large, with large batches moving between operations; product
is sent a hard of each operation
Small, and based on one-piece flow between Oper-
ations
Plant and equipment layout is By department function By product flow, using cells or lines for product
families
Quality is assured Through lot sampling 100% at the production source
Workers are typically assigned One person per machine With one person handling several machines
Workers empowerment is Low-little input into how operation is performed High-has responsibility for identifying and imple-
menting improvements
Inventory level are High-large warehouse of finished goods, and central storeroom
for in- process staging
Low-small amounts between operations ship
Often
Inventory turns are Low-6-9 turns per year or less High 20+ turns per year
Flexibility in changing
manufacturing schedules is Low-difficult to handle and adjust to High-easy to adjust to and implement
Manufacturing costs are Rising and difficult to control Stable/decreasing and under control
"Source: CIP, (2006). "Lean Manufacturing / Lean Production". http://www.dynamicbiz.us/366/article-leanmanufacturing.html".
8. Main Kinds of Wastes
Seven main types of wastes were identified as a part of the
Toyota Production System. However, this list has been
modified and expanded by various practitioners of lean
manufacturing and generally includes the following:
8.1. Overproduction
It is unnecessary to produce more than the customer de-
mands, or producing it too early before it is needed. This
increases the risk of obsolescence and the risk of producing
the wrong thing (Capital, 2004). It tends to lead to excessive
lead and storage times. In addition, it leads to excessive
work-in-process stocks which result in the physical disloca-
tion of operations with consequent poorer communication
(Hines and Rich, 2007).
8.2. Defects
In addition to physical defects which directly add to the
costs of goods sold, this may include errors in paperwork,
late delivery, production according to incorrect specifica-
tions, use of too much raw materials or generation of un-
necessary scrap (Capital, 2004). When defect occurs, rework

International Journal of Economics, Finance and Management Sciences 2013, 1(2) : 68-80 71
may be required; otherwise the product will be scrapped.
Generation of defects will not only waste material and labor
resources, but it will also create material shortages, hinder
meeting schedules, create idle time at subsequent worksta-
tions and extend the manufacturing lead time (Rawabdeh,
2005).
8.3. Inventory
It means having unnecessarily high levels of raw mate-
rials, works-in-process and finished products. Extra inven-
tory leads to higher inventory financing costs, higher storage
costs and higher defect rates. (Capital, 2004). It tends to
increase lead time, prevents rapid identification of problems
and increase space requirements. In order to conduct effec-
tive purchasing, it is especially necessary to eliminate in-
ventory due to incorrect lead times (Rawabdeh, 2005).
8.4. Transportation
It includes any movement of materials that does not add
any value to the product, such as moving materials between
workstations. Transportation between processing stages
results in prolonging production cycle times, the inefficient
use of labor and space (Capital, 2004). Any movement in the
firms could be viewed as waste. Double handling and ex-
cessive movements are likely to cause damage and deteri-
oration with the distance of communication between
processes (Hines and Rich, 2007).
8.5. Waiting
It is idle time for workers or machines due to bottlenecks
or inefficient production flow on the factory floor. It in-
cludes small delays between processing of units (Capital,
2004).When time is being used ineffectively, then the waste
of waiting occurs. This waste occurs whenever goods are not
moving or being worked on. This waste affects both goods
and workers, each spending time waiting. Waiting time for
workers may be used for training or maintenance activities
and should not result in overproduction (Hines and Rich,
2007).
8.6. Motion
It includes any unnecessary physical motions or walking
by workers which divert them from actual processing work.
This might include walking around the factory floor to look
for a tool, or even unnecessary or difficult physical move-
ments, due to poorly designed ergonomics, which slow
down the workers (Capital, 2004). It involves poor ergo-
nomics of production, where operators have to stretch, bend
and pick up when such actions could be avoided (Rawabdeh,
2005).
8.7. Over-processing
It is unintentionally doing more processing work than the
customer requires in terms of product quality or features-
such as polishing or applying finishing in some areas of
product that will not be seen by the customer (Capital, 2004).
Over-processing occurs in situations where overly complex
solutions are found to simple procedures. The
over-complexity discourages ownership and encourages
employees to overproduce to recover the large investment in
the complex machines (Hines and Rich, 2007).
9. Palestinian Manufacturing Sector
The development of the Palestinian manufacturing sector
significantly led to a significant increase in its contribution
to the GDP in Palestine that arrived the proportion of (8%)
during the Israeli occupation in the period from 1967 to 1991,
and (16%) before Al-Aqsa Intifada of September,2000
(Nofal, 2001).
However, the manufacturing sector still suffers from de-
pendence on the Israeli industry which affects its develop-
ment. In addition, the Palestinian industrial sector has fallen
substantially as a result for the Israeli actions since Al-Aqsa
Intifada till now because of the closure and siege on the
Palestinian areas in West Bank and Gaza Strip (PCBS,
2008).
Production had been decreased in all of the Palestinian
industries in the West Bank and Gaza Strip. The industrial
sector problems were not only due to the Israeli actions, but
also the inability of the Palestinian Authority to develop an
industrial strategy was a main cause. In addition, there were
many obstacles that have prevented the self-development of
this sector and its development, such as lack of raw materials,
quality problems, lack of experience, the absence of regula-
tion, the scarcity of natural materials, the problems of labor,
and authority corruption (PCBS, 2008).
The shortage of raw materials led to the deterioration of
the private sector and the closure of economic establish-
ments. The proportion of establishments operating in the
manufacturing sector stopped on a temporary basis was 70%,
while the number of establishments operating in part was
approximately 50% (IDS, 2010). Damages of economic
activities led to a rise in unemployment to 39.7% during the
first quarter of the year 2010, and the siege has led to the
high cost of living index, the average prices during the first
quarter of 2010 is about 131.34 points, i.e., the index rose by
51.4% compared to 2009 (IDS, 2010).
Table 3. Percentage Contribution to GDP by Manufacturing in Gaza Strip for the Years (From 1999 to 2009) 2004 is the base year.
2009 2008 2007 2006 2005 2004 2003 2002 2001 2000 1999 Economic Activity
7.9 10.6 7.0 9.7 12.4 13.2 14.8 16.5 13.8 6.0 12.8 Manufacturing
"Source: PCBS, (2010). The Annual Statistics of Palestine, 11th Edition".
72 Khalil A. El-Namrouty et al.: Seven wastes elimination targeted by lean manufacturing case study
“gaza strip manufacturing firms’’
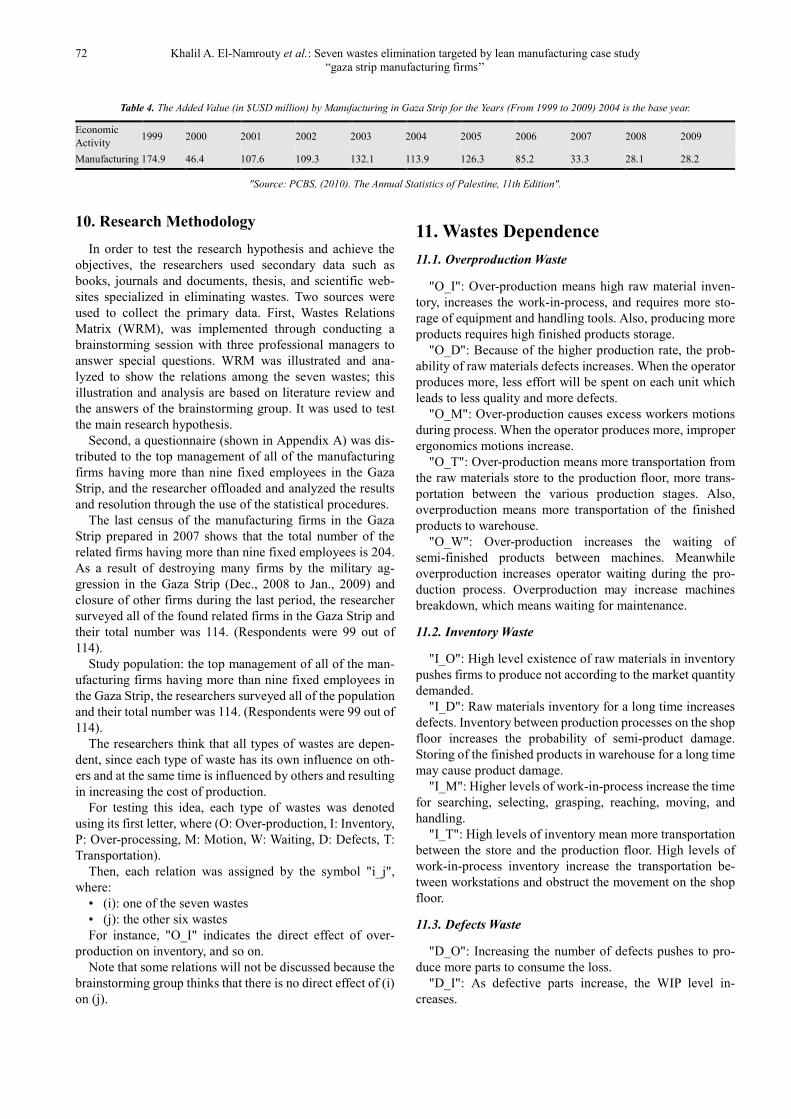
Table 4. The Added Value (in $USD million) by Manufacturing in Gaza Strip for the Years (From 1999 to 2009) 2004 is the base year.
2009 2008 2007 2006 2005 2004 2003 2002 2001 2000 1999 Economic
Activity
28.2 28.1 33.3 85.2 126.3 113.9 132.1 109.3 107.6 46.4 174.9 Manufacturing
"Source: PCBS, (2010). The Annual Statistics of Palestine, 11th Edition".
10. Research Methodology
In order to test the research hypothesis and achieve the
objectives, the researchers used secondary data such as
books, journals and documents, thesis, and scientific web-
sites specialized in eliminating wastes. Two sources were
used to collect the primary data. First, Wastes Relations
Matrix (WRM), was implemented through conducting a
brainstorming session with three professional managers to
answer special questions. WRM was illustrated and ana-
lyzed to show the relations among the seven wastes; this
illustration and analysis are based on literature review and
the answers of the brainstorming group. It was used to test
the main research hypothesis.
Second, a questionnaire (shown in Appendix A) was dis-
tributed to the top management of all of the manufacturing
firms having more than nine fixed employees in the Gaza
Strip, and the researcher offloaded and analyzed the results
and resolution through the use of the statistical procedures.
The last census of the manufacturing firms in the Gaza
Strip prepared in 2007 shows that the total number of the
related firms having more than nine fixed employees is 204.
As a result of destroying many firms by the military ag-
gression in the Gaza Strip (Dec., 2008 to Jan., 2009) and
closure of other firms during the last period, the researcher
surveyed all of the found related firms in the Gaza Strip and
their total number was 114. (Respondents were 99 out of
114).
Study population: the top management of all of the man-
ufacturing firms having more than nine fixed employees in
the Gaza Strip, the researchers surveyed all of the population
and their total number was 114. (Respondents were 99 out of
114).
The researchers think that all types of wastes are depen-
dent, since each type of waste has its own influence on oth-
ers and at the same time is influenced by others and resulting
in increasing the cost of production.
For testing this idea, each type of wastes was denoted
using its first letter, where (O: Over-production, I: Inventory,
P: Over-processing, M: Motion, W: Waiting, D: Defects, T:
Transportation).
Then, each relation was assigned by the symbol "i_j",
where:
• (i): one of the seven wastes
• (j): the other six wastes
For instance, "O_I" indicates the direct effect of over-
production on inventory, and so on.
Note that some relations will not be discussed because the
brainstorming group thinks that there is no direct effect of (i)
on (j).
11. Wastes Dependence
11.1. Overproduction Waste
"O_I": Over-production means high raw material inven-
tory, increases the work-in-process, and requires more sto-
rage of equipment and handling tools. Also, producing more
products requires high finished products storage.
"O_D": Because of the higher production rate, the prob-
ability of raw materials defects increases. When the operator
produces more, less effort will be spent on each unit which
leads to less quality and more defects.
"O_M": Over-production causes excess workers motions
during process. When the operator produces more, improper
ergonomics motions increase.
"O_T": Over-production means more transportation from
the raw materials store to the production floor, more trans-
portation between the various production stages. Also,
overproduction means more transportation of the finished
products to warehouse.
"O_W": Over-production increases the waiting of
semi-finished products between machines. Meanwhile
overproduction increases operator waiting during the pro-
duction process. Overproduction may increase machines
breakdown, which means waiting for maintenance.
11.2. Inventory Waste
"I_O": High level existence of raw materials in inventory
pushes firms to produce not according to the market quantity
demanded.
"I_D": Raw materials inventory for a long time increases
defects. Inventory between production processes on the shop
floor increases the probability of semi-product damage.
Storing of the finished products in warehouse for a long time
may cause product damage.
"I_M": Higher levels of work-in-process increase the time
for searching, selecting, grasping, reaching, moving, and
handling.
"I_T": High levels of inventory mean more transportation
between the store and the production floor. High levels of
work-in-process inventory increase the transportation be-
tween workstations and obstruct the movement on the shop
floor.
11.3. Defects Waste
"D_O": Increasing the number of defects pushes to pro-
duce more parts to consume the loss.
"D_I": As defective parts increase, the WIP level in-
creases.

International Journal of Economics, Finance and Management Sciences 2013, 1(2) : 68-80 73
"D_M": Defective parts require a repairing process for
them which requires workers motion.
"D_T": Repairing defective parts increases transportation
efforts.
"D_W": Producing defective parts requires to explore the
causes of errors and to take corrective actions therefore,
other parts will wait to be processed.
11.4. Motion Waste
"M_I": Insufficient workers motions cause accumulating
work-in-process.
"M_D": Insufficient workers motions during production
increase numbers of defect parts . Unskilled and untrained
proper motions workers increase defects.
"M_P": When jobs are non-standardized, there will be an
opportunity of over-processing. Process waste will also be
increased due to lack understanding, the available technol-
ogy capacity.
"M_W": When there are no standard motions of the
workers during production process, the required time to
processed next part increases.
11.5. Transportation Waste
"T_O": Items are produced more than needed to fill ma-
terials handling equipment in order to reduce the transport-
ing cost per unit and to minimize the number of transports.
"T_I": If there are no sufficient methods and number of
equipments for transportation, work-in-process inventory
increases.
"T_D": Insufficient transportation methods and unsafe
transportation equipments increase the probability of pro-
duction defects, also improper handling of the products may
cause parts damage.
"T_M": insufficient and non-standardized transportation
methods increase the workers motions by double handling
and searching.
"T_W": When the transportation is not on time or inef-
fective, waiting time for parts to be transported increases.
11.6. Overprocessing Waste
"P_O": An important aspect of process waste in order to
reduce operation cost per machine time, machines are
pushed to operate full time shift which finally results in
overproduction.
"P_I": Combining operations in one cell will decrease
WIP amounts because of eliminating buffers.
"P_D": Insufficient and improper processes lead to pro-
duce defects.
"P_M": Non-standardized process requires more worker
motions
"P_W": UnsuiTable (technology used, by means of high
setup times and adjustments or repetitive downtimes, leads
to higher waiting times.
11.7. Waiting Waste
"W_O" When a machine is waiting because its supplier is
serving another customer, the machine is forced to produce
more just to keep running.
"W_I" Waiting of parts between workstations increases
work-in-process. Also, waiting of the finished items in
warehouse increases inventory.
"W_D": Waiting of parts in work-in-process inventory
may cause defects due to the surrounding conditions.
"W_M": Waiting of parts in work-in-process inventory
may cause unnecessary motion of workers and machines.
12. Strength of Waste Relations
The numerous types of relations and each type nature
suggests that, all of these relations are not equal weights.
The need to assign weights relations, is justified by knowing
which type of waste contributes more to the wasteful activ-
ities in the shop floor. Criterion was set to measure strength
of waste relations.
13. Measurement Criterion Develop-
ment
The Criterion consists of six developed questions; each
answer has a certain weight from one to five as follows:
Note: "i" stand for any type of waste affects on "j", which
is the other type of waste.
Question Weight
1- Does i produce j?
a. Always
b. Sometimes
c. Rarely
2- What is the type of the relation between i and j?
a. As i increases, j increases
b. As i increases, j reaches a constant level
c. Random relation according to condi-
tions
3- The effect of j due to i:
a. Appears directly and clearly.
b. Often appears, but needs time to do
c. Rarely appears with along time
4- Eliminating the effect of i on j is achieved by:
a. Engineering and complex methods
b. Simple and direct
c. Only by an instruction
5- The effect of j due to i, mainly influences on:
a. Quality of products only
b. Productivity of Resources only
c. Lead time only
d. Quality and productivity
e. Productivity and lead time
f. Quality and lead time
g. Quality, productivity and lead time
6- In which degree does the effect of i on j increas-
es Manufacturing Lead time?
a. High degree
b. Medium degree
c. Low degree
5
3
1
5
3
1
5
3
1
5
3
1
1
1
1
3
3
3
5
5
3
1

74 Khalil A. El-Namrouty et al.: Seven wastes elimination targeted by lean manufacturing case study
“gaza strip manufacturing firms’’
14. Measurement Criterion Analysis
and Results
The criterion was applied on all of the relations and the
analyses were carried out using the following steps:
Step (1): Answering each question with respect to each
discussed relation.
The answer of questions (1-6), with respect to overpro-
duction and inventory (O_I), where “b” for question (1), “b”
for question (2) and so on.
Question 1 2 3 4 5 6 Scor
e
Rela-
tion Rela-
tions
Ans
.
Wt
.
Ans
.
W
t
Ans
.
Wt
.
Ans
.
Wt
.
Ans
.
Wt
.
Ans
.
Wt
.
O_I B B B a E c
O_D C C C a C c
Step (2): each answer was assigned its own weight men-
tioned in the measurement criterion. Each number besides
each character represents the weight of the answer. All
numbers were separated in single columns representing
weights.
Question 1 2 3 4 5 6 Scor
e
Rela-
tion Rela-
tions
Ans
.
Wt
.
Ans
.
W
t
Ans
.
Wt
.
Ans
.
Wt
.
Ans
.
Wt
.
Ans
.
Wt
.
O_I B 3 B 3 B 3 a 5 E 3 c 1
O_D C C 1 C 1 C a 5 C 1 c 1
Step (3): the weighting of all answers of each relation
were added together, resulting to the overall summations.
Question 1 2 3 4 5 6 Scor
e
Rela-
tion Rela-
tions
Ans
.
Wt
.
Ans
.
W
t
Ans
.
Wt
.
Ans
.
Wt
.
Ans
.
Wt
.
Ans
.
Wt
.
O_I B 3 B 3 B 3 a 5 E 3 c 1 18
O_D C C 1 C 1 C a 5 C 1 c 1 10
Step (4): the score indicates the strength of each relation.
In order to distinguish among the different relations, it was
noticed that the higher score represent stronger relation and
vice versa.
Table 5. The Range Divisions of Strength of Direct Relations.
Range Type of Relation Symbol
26 To 30 Absolutely Necessary A
21 To 25 Especially Important E
16 To 20 Important I
11 To 15 Ordinary Closeness O
6 To 10 Unimportant U
Step (5): the scores were translated into symbols
representing the different relations. Table (6) shows the
Measurement Criterion Question’s Answers (done by
brainstorming):
Table 6. The Measurement Criterion Question’s Answers.
Question 1 2 3 4 5 6 Scor
e
Rela-
tion Rela-
tions
Ans
.
Wt
.
Ans
.
Wt
.
Ans
.
Wt
.
Ans
.
Wt
.
Ans
.
Wt
.
Ans
.
Wt
.
O_I b 3 b 3 B 3 a 5 e 3 c 1 18 I
O_D c 1 c 1 C 1 a 5 c 1 c 1 10 U
O_M b 3 a 5 A 5 a 5 a 1 c 1 20 I
O_T b 3 c 1 C 1 a 5 g 5 b 3 18 I
O_W b 3 a 5 B 3 a 5 e 3 b 3 22 E
I_O c 1 c 1 C 1 c 1 b 1 c 1 6 U
I_D b 3 c 1 B 3 b 3 b 1 c 1 12 O
I_M a 5 a 5 A 5 a 5 g 5 a 5 30 A
I_T b 3 b 3 B 3 b 3 a 1 c 1 14 O
D_I a 5 a 5 A 5 a 5 g 5 a 5 30 A
D_O b 3 c 1 B 3 b 3 e 3 b 3 16 I
D_M a 5 a 5 A 5 c 1 e 3 b 3 22 E
D_T a 5 a 5 A 5 b 3 e 3 b 3 24 E
D_W a 5 a 5 B 3 b 3 e 3 a 5 24 E
M_I c 1 a 5 B 3 c 1 e 3 c 1 16 I
M_D b 3 b 3 B 3 a 5 g 5 a 5 24 E
M_W a 5 a 5 A 5 a 5 e 3 a 5 28 A
M_P b 3 b 3 A 5 c 1 d 3 b 3 18 I
T_O b 3 c 1 C 1 b 3 e 3 c 1 12 O
T_I b 3 b 3 B 3 b 3 e 3 b 3 18 I
T_D b 3 c 1 A 5 b 3 e 3 b 3 18 I
T_M a 5 b 3 A 5 b 3 c 1 b 3 20 I
T_W b 3 a 5 B 3 b 3 e 3 b 3 20 I
P_O c 1 c 1 B 3 b 3 c 1 b 3 12 O
P_I c 1 b 3 B 3 b 3 f 3 c 1 14 O
P_D b 3 c 1 B 3 b 3 f 3 b 3 16 I
P_M b 3 c 1 C 1 c 1 e 3 c 1 10 U
P_W b 3 c 1 A 5 b 3 e 3 b 3 18 I
W_O b 3 a 5 B 3 a 5 g 5 b 3 24 E
W_I a 5 a 5 A 5 c 1 e 3 b 3 22 E
W_D a 5 a 5 A 5 a 5 e 3 b 3 26 A
W_M c 1 c 1 C 1 c 1 b 1 c 1 6 U
15. Hypothesis Testing by Applying

International Journal of Economics, Finance and Management Sciences 2013, 1(2) : 68-80 75
WRM
15.1. WRM Scores
WRM organizes what was obtained through the criterion.
Table 7. Waste Relation Matrix.
F/T O I D M T P W
O I U I I X E
I U O A O X X
D I A E E X E
M X I E X I A
T O I I I X I
P O O I U X I
W E E A U X X
Note: The symbol "X" indicates that there is no direct effect of (i) on (j).
Each row shows the effect of a certain waste on the other
six wastes; similarly each column shows to what degree a
certain type of waste is affected by others.
15.2. Matrix Value
The waste matrix represents real relationships among
wastes. It may be used in several decision-making processes
aiming toward waste allocation in the manufacturing firms,
to prove this, weights were assigned to the relations. Fur-
thermore, similar relations were assigned a new score out of
10; these scores are shown in Table (8).
Table 8. Matrix Value.
Type of relation Weight
A 10
E 8
I 6
O 4
U 2
X 0
The weights of each row and column were added to obtain
the score, and then the percentages were calculated by di-
viding each score by the total score. These percentages
represent the probability that a certain type of waste will
affect others or be affected by others. Table (9) summarizes
the previous analysis:
Table 9. Weights of Direct Waste Relations.
F/T O I D M T P W Score %
O 6 2 6 6 0 8 28 14.3
I 2 4 10 4 0 0 20 10.2
D 6 10 8 8 0 8 40 20.4
M 0 6 8 0 6 10 30 15.3
T 4 6 6 6 0 6 28 14.3
P 4 4 6 2 0 6 22 11.2
W 8 8 10 2 0 0 28 14.3
Score 22 40 36 34 20 6 38 196 100
% 11.2 20.4 18.4 17.3 10.2 3.1 19.4 100
15.3. WRM Results
Table (9) confirms that there is a significant effect for all
of the seven mentioned wastes on the production cost for the
manufacturing firms in Gaza Strip.
Table 10. The Ranking of the Wastes that Affect on the Other Wastes.
The
Primary Source 1st Waste 2nd Waste 3rd Waste 4th Waste 5th Waste 6th Waste 7th Waste
WRM Defects Motion Each of: Waiting+ Transportation+ Over-production Processing Inventory
Table 11. The Ranking of the Wastes Affected by the Other Wastes.
The
Primary
Source
1st Waste 2nd Waste 3rd Waste 4th Waste 5th Waste 6th Waste 7th Waste
WRM Inventory Waiting Defects Motion Over-production Transportation Processing
16. Results and Conclusions Using
Questionnaire
The researchers used quantitative data analysis methods.
The Data analysis will be made utilizing (SPSS 18). The
researcher would utilize the following statistical tools:
1. Alpha Cronbach's and Split-Half Methods for Relia
bility Statistics.
2. Spearman Rank correlation for Validity.
3. Frequency and Descriptive analysis.
4. Nonparametric Tests (Sign test, and Kruskal-Wallis
test).
5. Sign test is used to determine if the mean of a para-
graph is significantly different from a hypothesized
value.
3 (Middle value of Likert scale). If the P-value (Sig.) is
smaller than or equal to the level of significance, 0 .0 5α = ,

76 Khalil A. El-Namrouty et al.: Seven wastes elimination targeted by lean manufacturing case study
“gaza strip manufacturing firms’’
then the mean of a paragraph is significantly different from a
hypothesized value 3. The sign of the Test value indicates
whether the mean is significantly greater or smaller than
hypothesized value 3. On the other hand, if the P-value (Sig.)
is greater than the level of significance, 0.05α = , then the
mean a paragraph is insignificantly different from a hy-
pothesized value 3.
• Kruskal-Wallis test is used to examine if there is a
statistical significant difference between several
means among the respondents toward Lean Manu-
facturing attributed to (age, Specialization, Scien-
tific qualification, and Position).
Hypothesis H1: There is a significant statistical effect
of lean manufacturing on the production cost.
Table (12 shows the mean of all paragraphs of the ques-
tionnaire equals 4.07 (81.32%), Test-value = 9.08, and
P-value=0.000 which is smaller than the level of signific-
ance 0 .0 5α = . The sign of the test is positive, so the mean
of all paragraphs of the questionnaire is significantly greater
than the hypothesized value 3.
Table 12. shows: The Ranking of the Wastes that Affect on the Other Wastes.
Primary Source 1st Waste 2nd Waste 3rd Waste 4th Waste 5th Waste 6th Waste 7th Waste
Wastes
Relationships Matrix Defects Motion Each of: Waiting+ Transportation+ Over-production Processing Inventory
This finding agrees with Forrester, et.al. (2010) who in-
vestigated the relationship between the adoption of lean
manufacturing, market share, and value creation of compa-
nies in the agricultural machinery and implements sector in
Brazil and reached to the conclusion that Brazilian firms and
managers in this sector that have supported a transition
towards the adoption of lean manufacturing practices have
shown a significant improvement in their business perfor-
mance including the production cost.
Moreover, this finding agrees with Hallgren and Olhager
(2009) who investigated internal and external factors that
drive the choice of lean and agile operation capabilities and
their impact on operational performance. In this research,
the impact on quality, delivery, cost, and flexibility perfor-
mance was analyzed using equations modeling for a total of
211 plants from 3 industries and 7 countries. In this research,
the researcher has reached to the conclusion that lean man-
ufacturing has a significant impact on cost performance.
Also, this result agrees with Czabke (2007) who identified
the common and individual pitfalls and difficulties during
lean implementation for two lean leader companies from US
and another two lean leader companies from Germany,
where personal interviews -with the same questions- of high
level management were the main source of information. The
researcher found that all plants became more efficient and
hence more cost effective and profiTable (by implementing
lean manufacturing techniques.
This result is consistent with McGrath (2007) who de-
termined the extent to which the main principles of lean
manufacturing have been and/or still being carried out on
two medical device companies based in the South of Ireland.
Interviews were carried out there, and the respondents were
chosen for their experience and expertise in lean manufac-
turing and production areas, and the researcher reached to
the conclusion that both companies have made some great
improvements in terms of the value streams of their respec-
tive plants and also in the reduction of wastes.
Also, This result is supported with Rawabdeh (2005) who
investigated the waste in a job shop environment and pro-
poses an assessment method aimed at helping companies to
identify root causes of waste, and the researcher has devel-
oped a model that serves as a guideline for simplifying the
search of wastes problems and identifies opportunities for
waste elimination to improve the job shop performance.
Moreover, this finding agrees with Koh, et.al. (2004) who
re-examined if lean production manufacturing practices
interact with the compensation system and information
system to reduce production costs, and reached to the con-
clusion that lower production costs can be achieved when
lean production manufacturing practices, such as, TQM and
JIT, are used.
Also, this result is consistent with Yamashita (2004) who
determined how the consultant of (SAMA) is implementing
the lean manufacturing process based on the company and
focused on behaviors that organizations must exhibit to
correctly implement and sustain lean manufacturing prac-
tices in Minneapolis area. The researcher found that higher
quality products with less recourses and capital are achieved
by implementing lean manufacturing which also leads to
reductions in scrap, rework, returns, and waste.
Also, this result is consistent with Abdullah (2003) who
investigated how lean manufacturing tools can be adapted
from the discrete to the continuous manufacturing envi-
ronment on a large steel manufacturing company. This re-
search concluded that for the steel companies (as with oth-
ers), the driving force behind implementing lean was cost
reduction.
So, it is so clear now that lean manufacturing, which is a
systematic approach to identify and eliminate waste
(non-value added activities) through continuous improve-
ment by following the product at the pull of the customer in
pursuit of perfection, results in a significant cost. In the Gaza
Strip, the researcher thinks that following the mentioned
tools and techniques in chapter2 would also lead to high
improvements in lead time, productivity, work-in-process
inventory, quality, space utilization, processing errors,
staffing demands, opportunities for new marketing cam-
paigns, scrap, cross-trained employees, self-directed work
teams, fast market response, longer machine life, customer
communication, flexibility in reacting to changes, and stra-
tegic management focus.

International Journal of Economics, Finance and Management Sciences 2013, 1(2) : 68-80 77
Field Mean
Proportional
mean
(%)
Test value P-value
(Sig.)
Over-production 4.09 81.79 8.96 0.000*
Inventory 3.98 79.57 8.30 0.000*
Over-processing 4.02 80.33 8.44 0.000*
Motion 4.15 83.01 9.02 0.000*
Waiting 4.11 82.10 8.86 0.000*
Defects 4.18 83.56 8.97 0.000*
Transportation 4.10 81.94 8.50 0.000*
All paragraphs of the
questionnaire 4.07 81.32 9.08 0.000*
Table (12; Means of all paragraphs of the questionnaire
As a result of this research, the role of lean manufacturing
in developing the manufacturing business was emphasized,
and evidence was provided to support the conceptual model
to link between wastes elimination and reducing production.
Table 13. shows: The Ranking of the Wastes Affected by the Other Wastes.
The
Primary-
Source
1st
Waste
2nd
Wast
e
3rd
Wast
e
4th
Waste 5th Waste 6th Waste
7th
Waste
WRM Inven-
tory
Wait-
ing
De-
fects
Mo-
tion
Over-product
ion
Transporta-
tion
Processi
ng
1. It is hoped that this research will provide the manu-
facturing managers within the suiTable (tools and techniques
of eliminating wastes, such as, 5S's system, VSM, TPM, and
JIT. Also, it is so necessary for them to implement these
techniques which lead to huge improvement in their pro-
duction.
2. Managers should train all of their employees in all of
the managerial levels about applying lean manufacturing
tools and techniques.
3. All of the wastes in the manufacturing firm have to be
studied and analyzed separately to be able to apply lean
manufacturing tools and techniques to reduce the production
cost.
4. The manufacturing firms should develop their general
plans and schedules according to the nature of their produc-
tion to be able to reduce production costs.
5. The production cost management must be included into
the tasks of a department in the manufacturing firm. Some-
times, it is needed to be a special department.
References
[1] Jeffrey K. Liker, (2004). The Toyota Way, Published by Tata McGraw-Hill, ISBN 0-07-139231-9.
[2] Meyers, F., and Stewart, J., (2002). Motion and time study for lean manufacturing, 3rd Edition.
[3] The Palestinian Central Bureau of Statistics, (2010). The Annual Statistics of Palestine, 11th Edition.
[4] Capital, M., (2004). Introduction to Lean Manufacturing for Vietnam, Published Article by Mekong Capital Ltd.
[5] Czarnecki, H. and Loyd, N.,( 2004). Simulation of Lean Assembly Line for High Volume Manufacturing, Research Paper Published by University of Alabama in Huntsville.
[6] Dennis P. Hobbs, (2004). Lean Manufacturing Implementa-tion: A complete execution manual for any size manufacturer, Published by J. Ross.
[7] Dimple Khatri, Pardeep Dhull, Rajender Kumar, and Vinod Dhull, (2011). Reduce the Work in Progress by Using Value Stream Mapping, Research Paper Published by International Journal of Mechanical Engineering Applications Research, Vol.2.
[8] Forrester, P., Shimizu, U., Meier, H., Reyes, J., and Basso, L., (2010). Lean Production, Market Share, and Value Creation in the Agricultural Machinery Sector in Brazil, Research Paper Published by Journal of Manufacturing Technology Management, Vol.21, No.7, pp.853-871.
[9] Hian Chye Koh, Khim Ling Sim, and Larry N. Killough (2004). The Interaction Effects of Lean Production Manu-facuring Practices, Compensation, and Information Systems on Production Costs, Research Paper Published by Journal of Advances in Management Accounting, Vol.12, pp.115-135.
[10] Ibrahim Rawabdeh, (2005). A Model for the assessment of Waste in Job Shop Environments, Research Paper Published by International Journal of Operations and Production Management, Vol.25, No.8, pp.800-822..
[11] Jorge Leon, (1999). Toyota Production System and Lean Manufacturing, Published by Texas A&M University.
[12] Mary Poppendieck, (2002). Principles of Lean Thinking, Published by Poppendieck.LLC.
[13] Mattias Hallgren and Jan Olhager, (2009). Lean and Agile Manufacturing: External and Internal Drivers and Perfor-mance Outcomes, Research Paper Published by International Journal of Operations and Production Management, Vol.29, No.10, pp.976-999.
[14] Mohammed AlDabbagh and Safwan Hassan, (2008). The Requirements of Implementing Lean Manufacturing for the Iraqi Industries, Published by University of Mosul.
[15] Niall Piercy and Nick Rich, (2008). High Quality and Low Cost: The Lean Service Centre, Research Paper Published by European Journal of Marketing, Vol.43, No.11/12, pp.1477-1497.
[16] Osama Nofal, (2001). The Palestinian Industrial Sector: Analysis of the Industrial Indications (from 1994 to 2000), Journal of the Palestinian Planning, The 1st Issue.
[17] Palestinian Central Bureau of Statistics, (2008). Population, Housing and Establishment Census (2007), The Economic Establishments, The Final Results, Ramallah-Palestine.
[18] Peter Hines and Nick Rich, (1997). The Seven Value Stream Mapping Tools, Published by International Journal of Oper-ations and Production Management.
[19] Singh, R., (1999). Lean Manufacturing: Changing Paradigms in Product Manufacturing, the third International Conference on Quality Management, Delhi, India.
[20] Andreas Berg and Fredrik Ohlsson, (2005). Lean Manufac-turing at Volvo Truck Production, Master Thesis, Lulea University of Technology.

78 Khalil A. El-Namrouty et al.: Seven wastes elimination targeted by lean manufacturing case study
“gaza strip manufacturing firms’’
[21] Abdullah, F., (2003). Lean Manufacturing Tools and Tech-niques in the Process industry with a focus on Steel, PhD thesis, University of Pittsburgh.
[22] Jochen Czabke, (2007). Lean Thinking in the Secondary Wood Products Industry: Challenges and Benefits, Master Thesis, Oregon State University.
[23] Kazuhiro Yamashita, (2004). Implementation of Lean Man-ufacturing Process to XYZ Company in Minneapolis Area, Master Thesis, University of Wisconsin-Stout.
[24] Layla Badran, (2010). The Lean Manufacturing Philosophy for the Manufacturing and Service Organizations, Master thesis, Damascus University.
[25] M. Enaghani, M. Arashpour, and M. Karimi., (2009). The Relationship between Lean and TPM, Master Thesis, Uni-versity of Boras.
[26] Moutasem Saleh, (2011). The Role of Thinking Capital in the Possibility of Establishing Lean Manufacturing Foundations, Master Thesis, University of Mosul.
[27] Naveen Rathi, (2009). A Framework for the Implementation of Lean Techniques in Process Industries, Master thesis, Texas Tech University.
[28] Philip Stephen, (2004). Application of DMAIC to integrate Lean Manufacturing and Six Sigma, Master thesis, The Vir-ginia Polytechnic Institute and State University.
[29] Ramadane M. El-Kourd, (2009). A Study of Lean Construc-tion in Gaza Strip, Master thesis, The Islamic University of Gaza.
[30] William McGrath, (2007). Impact Analysis of Large Scale Lean Manufacturing Initiatives Upon Manufacturing Process Innovation In Irish Companies, Master thesis, Waterford In-stitute of Technology.
[31] Contiuous Improvement Professionals, (2006). "Lean Man-ufacturing / Lean Production". http://www.dynamicbiz.us/366/article-leanmanufacturing.html.
[32] Ibrahim, M., (2011). "Lean Production Vs. Traditional Pro-duction".
[33] http://www.scribd.com/doc/49200950/lean-vs-traditional-assignment.
[34] Minggu, (2009). "A Brief History of Lean Manufacturing".
[35] http://accubekas.blogspot.com/2009_02_01_archive.html.
Means and Test Values for “Overproduction”.
No Field Mean Proportional
mean (%)
Test
value
P-value
(Sig.) Rank
1 Minimizing overproduction in your company leads to preventing accumulation of units within the store. 4.26 85.11 8.69 0.000* 1
2 Minimizing overproduction in your company leads to reducing defects in your products. 4.01 80.21 7.34 0.000* 5
3 Minimizing overproduction in your company allows more space within the work that can be exploited 4.17 83.40 8.21 0.000* 2
4 Minimizing overproduction in your company reduces the staff and machines waiting in the other units. 4.08 81.68 8.18 0.000* 4
5 Minimizing overproduction in your company leads to better exploiting of the available human and
material resources. 4.15 82.98 8.62 0.000* 3
6 By the nature of your work, minimizing overproduction in your company reduces transport of materials
between work stations and machines. 3.92 78.49 7.62 0.000* 7
7 According to your experience, minimizing overproduction in your company reduces the need for
re-manufacturing of the product. 3.99 79.78 7.29 0.000* 6
8 All paragraphs of the field " Overproduction" 4.09 81.79 8.96 0.000*
* The mean is significantly different from 3.
Means and Test Values for “Inventory”.
No Field Mean Proportional
mean(%)
Test
value
P-value
(Sig.) Rank
1 Excess inventory minimization balances the flow of materials through the stages of production so as to
ensure there is no idle capacity. 4.00 80.00 7.72 0.000* 3
2 When you minimize the excess inventory through working, your production defective units are less. 3.91 78.30 7.29 0.000* 6
3 Policy of minimizing the excess inventory leads to lower following-up and conditioning costs of pro-
duction units. 4.12 82.34 7.81 0.000* 1
4 When you minimize the excess inventory through working, you are better exploiting areas of the
workplace. 3.93 78.51 7.04 0.000* 5
5 Excess inventory minimization reduces the number of workers needed in your production. 4.02 80.43 7.16 0.000* 2
6 By the nature of your work, excess inventory minimization reduces the materials transport between
work stations and machines 3.91 78.30 6.75 0.000* 6
7 According to your experience in your work, excess inventory minimization reduces the
re-manufacturing of the product. 3.96 79.14 7.07 0.000* 4
8 All paragraphs of the field
" Inventory" 3.98 79.57 8.30 0.000*
* The mean is significantly different from 3.
Means and Test Values for “Over-processing”.

International Journal of Economics, Finance and Management Sciences 2013, 1(2) : 68-80 79
No Field Mean Proportional
mean(%)
Test
value
P-value
(Sig.) Rank
1 Over-processing minimization leads to a better use of time and efforts. 4.03 80.64 7.68 0.000* 4
2 Over-processing minimization helps in reducing the movement barriers of people and materials during
the work. 4.04 80.85 7.94 0.000* 3
3 Over-processing minimization balances the flow of materials through the stages of production so as to
ensure there is no idle capacity. 4.01 80.21 7.94 0.000* 6
4 Over-processing minimization in your company can reduce the workers useless movements. 4.15 82.95 7.75 0.000* 2
5 Over-processing minimization reduces the materials used in your product line. 4.18 83.64 7.84 0.000* 1
6 By the nature of your work, over-processing minimization reduces the materials transport between
work stations and machines. 4.02 80.42 7.59 0.000* 5
7 According to your experience in your work, over-processing minimization reduces the workers stress. 3.96 79.15 7.50 0.000* 7
All paragraphs of the field
" Over-processing" 4.02 80.33 8.44 0.000*
* The mean is significantly different from 3.
Means and Test Values for “Motion”.
No Field Mean Proportional
mean(%)
Test
value
P-value
(Sig.) Rank
1-
Workers motion minimization facilitates the task of management in controlling the work. 4.13 82.53 8.09 0.000* 5
2- Workers motion minimization in your company reduces the waiting machines and leads to greater
exploitation of the potential. 4.16 83.26 8.73 0.000* 4
3- Workers motion minimization reduces the injuries at work. 4.18 83.66 8.46 0.000* 3
4- Workers motion minimization in your company reduces the energy wasted. 4.24 84.83 8.55 0.000* 1
5- Workers motion minimization leads to better exploiting of the areas. 4.22 84.49 8.33 0.000* 2
6- By the nature of your work, workers motion minimization reduces the production of defective units. 4.08 81.57 8.04 0.000* 7
7- According to your experience in your work, workers motion minimization reduces the
re-manufacturing of the product. 4.11 82.27 7.75 0.000* 6
All paragraphs of the field " Motion" 4.15 83.01 9.02 0.000*
* The mean is significantly different from 3.
Means and Test Values for “Waiting”.
No Field Mean Proportional
mean(%)
Test
value
P-value
(Sig.) Rank
1-
Workers and machines waiting minimization help in greater exploitation of the potential of working. 4.16 83.23 8.24 0.000* 2
2- Workers and machines waiting minimization during your production reduce the work injury. 4.10 81.91 8.03 0.000* 4
3- Workers and machines waiting minimization improve the skills of communication between depart-
ments, and thus reduce errors during the production process. 4.06 81.29 8.34 0.000* 6
4- Workers and machines waiting minimization facilitate the task of management in the control of hu-
man resources. 4.14 82.77 8.67 0.000* 3
5- Workers and machines waiting minimization facilitate the monitoring of product quality. 4.18 83.62 8.60 0.000* 1
6- By the nature of your work, workers and machines waiting minimization reduces the materials
transport between work stations and machines. 4.08 81.51 8.06 0.000* 5
7- According to your experience, workers and machines waiting minimization reduces the product
re-manufacturing. 4.03 80.64 7.81 0.000* 7
All paragraphs of the field "Waiting" 4.11 82.10 8.86 0.000*
* The mean is significantly different from 3.
Means and Test Values for “Defects”.
No Field Mean Proportional
mean(%)
Test
value
P-value
(Sig.) Rank
1- Defects minimization leads to better reputation with customers and increasing the marketing of the
product. 4.57 91.40 9.17 0.000* 1
2- Defects minimization reduces the bottlenecks that impede the movement of workers and materials
during the work. 4.29 85.87 8.95 0.000* 2
3- Defects minimization reduces re-manufacturing the same products. 4.09 81.74 8.10 0.000* 5

80 Khalil A. El-Namrouty et al.: Seven wastes elimination targeted by lean manufacturing case study
“gaza strip manufacturing firms’’
4- Defects minimization reduces the excess movement of workers. 4.12 82.34 8.22 0.000* 3
5- Defects minimization leads to the optimal use materials and human resources. 4.06 81.14 6.98 0.000* 6
6- By the nature of your work, defects minimization reduces the materials transport between work sta-
tions and machines. 4.03 80.65 7.59 0.000* 7
7- According to your experience in your work, defects minimization reduces the re-manufacturing of
the product. 4.11 82.15 7.81 0.000* 4
All paragraphs of the filed " Defects" 4.18 83.56 8.97 0.000*
* The mean is significantly different from 3.
Means and Test Values for “Transportation”.
No Field Mean
Proportional
mean
(%)
Test
value
P-value
(Sig.) Rank
1-
Materials and products transportation minimization reduces the necessary energy, such as, number
of workers and electricity. 4.16 83.19 8.36 0.000* 3
2- Materials and products transportation minimization reduces the bottlenecks that impede the
movement of people and materials during the work. 3.99 79.79 7.13 0.000* 7
3- Materials and products transportation minimization in your company reduces the risk of damaged
units or defects. 4.03 80.64 7.78 0.000* 6
4- Materials and products transportation minimization reduces the waiting workers and machines. 4.11 82.15 8.33 0.000* 4
5- Materials and products transportation minimization leads to better exploiting of the areas. 4.17 83.44 8.62 0.000* 1
6- By the nature of your work, materials and products transportation minimization facilitates the
control of materials and human resources. 4.17 83.40 8.21 0.000* 2
7- According to your experience in your work, materials and products transportation minimization
reduces the re-manufacturing of the product. 4.11 82.11 7.44 0.000* 5
All paragraphs of the filed " Transportation" 4.10 81.94 8.50 0.000*
* The mean is significantly different from 3.