Measuring Lean Construction - NTNU Open
157
Measuring Lean Construction A Performance Measurement model supporting the implementation of Lean practices in the Norwegian construction industry David Herranz Limon Project Management Supervisor: Bjørn Andersen, IPK Co-supervisor: Anandasivakumar Ekambaram, SINTEF Department of Production and Quality Engineering Submission date: June 2015 Norwegian University of Science and Technology
-
Upload
khangminh22 -
Category
Documents
-
view
1 -
download
0
Transcript of Measuring Lean Construction - NTNU Open
Measuring Lean ConstructionA Performance Measurement model
supporting the implementation of Lean
practices in the Norwegian construction
industry
David Herranz Limon
Project Management
Supervisor: Bjørn Andersen, IPKCo-supervisor: Anandasivakumar Ekambaram, SINTEF
Department of Production and Quality Engineering
Submission date: June 2015
Norwegian University of Science and Technology


iii
Abstract
The thesis examines the current performance improvement attempts in the construction
industry and how their effects could be measured to sustain their implementation. The
practices utilized in the industry under Lean Construction principles are the Last Planner,
Pull Scheduling, Concurrent Engineering and Virtual Design Construction (VDC).
Construction companies in Norway have been implementing a number of practices
intended for improving performance during the last decade. Although they have achieved
relative success and perceived some benefits, companies find difficult to assess to what
extent the benefits obtained are the consequence of implementing these practices. In
addition, companies have recently shown interest in performance measurement systems
as the way to know how is the actual performance of projects. The literature review shows
a trend in the development of performance measurement towards industry- and purpose-
specific frameworks. Other generic frameworks like the Balanced Scorecard, the EFQM
Excellence Model, KPIs and Lean Six-Sigma have been reviewed during the study.
By using qualitative research the thesis aims to identify the practices implemented and
measure their effects on project performance. It considers a stakeholder analysis
perspective and the success factors in the implementation. The result is a performance
measurement model supporting the implementation of Lean Construction. The model also
establish the relationship between the practices used and the expected effects, and
purposes an evaluation worksheet to facilitate the internal benchmarking of projects. The
logic of these three elements together is described in the implementation roadmap.
The originality of the work is bringing together performance measurement and Lean
Construction, the stakeholders’ perspective on the needs for the implementation of Lean
practices and the explicit inclusion of external factors in the project evaluation. However,
there are also some limitations about the data collection as the lack of measurement
culture and project metrics being collected, and the interrelation among the effects
observed, which could be studied in the future. Further research also include the further
application of aggregation methods for the indicators included in the evaluation.
Keywords: Lean Construction, Performance Measurement, Effects, Project evaluation

iv

v
To my parents, Arsenio and María Jesús for their unconditional support
To my family and friends, for feeling so close though living so far
To Idun, for sharing and enriching my life
To all the people in Trondheim that have made me feel warm and welcomed

vi
vii
Table of Contents
Abstract ............................................................................................................................................. iii
List of Figures ................................................................................................................................... ix
List of Tables .................................................................................................................................... ix
Acknowledgements ............................................................................................................................x
Chapter 1: Introduction ................................................................................................................. 11
Background ............................................................................................................................. 11
Research objectives ................................................................................................................. 13
Research scope ........................................................................................................................ 14
Why do organizations measure? ............................................................................................. 15
Why the need of new ways of Performance Measurement? ................................................. 16
Structure of the thesis ............................................................................................................. 17
Chapter 2: Lean Construction ....................................................................................................... 19
The roots of Lean..................................................................................................................... 19
Lean Project Delivery System in Construction ........................................................................ 21
The Last Planner ...................................................................................................................... 23
Pull Scheduling ........................................................................................................................ 24
Concurrent Engineering .......................................................................................................... 25
Virtual Design Construction (VDC) .......................................................................................... 27
Summary of the chapter ......................................................................................................... 28
Chapter 3: Performance Measurement Frameworks ................................................................. 29
The Balanced Scorecard .......................................................................................................... 29
Key Performance Indicators, KPI ............................................................................................. 36
EFQM Excellence Model .......................................................................................................... 46
Lean Six-Sigma ......................................................................................................................... 52
Summary of the chapter ......................................................................................................... 54
Chapter 4: Performance Measurement Research and Organizational Change ...................... 55
Performance Measurement Research .................................................................................... 56
Success Factors in Projects ...................................................................................................... 61
Organizational change ............................................................................................................. 67
Summary of the chapter ......................................................................................................... 71
Chapter 5: Methodology ................................................................................................................ 73
Purpose of the project ............................................................................................................ 73
viii
Exploring and defining the topic ............................................................................................. 74
Research questions and classification ..................................................................................... 75
Qualitative methodology and methods .................................................................................. 77
Validity and limitations ........................................................................................................... 81
Summary of the chapter ......................................................................................................... 83
Chapter 6: Lean Construction in the Norwegian Industry ....................................................... 85
Data collection ........................................................................................................................ 86
Lean practices .......................................................................................................................... 86
The Lean model in construction .............................................................................................. 87
Implementation of Lean .......................................................................................................... 88
Actors’ involvement and training ............................................................................................ 89
Stakeholders’ analysis ............................................................................................................. 90
Effects of using Lean................................................................................................................ 95
Barriers and Success Factors implementing Lean ................................................................... 98
Performance Measurement in Projects ................................................................................ 103
Characteristics of the Performance Measurement System .................................................. 104
Summary of the chapter ....................................................................................................... 105
Chapter 7: A Performance Measurement Model for Lean Construction ............................. 107
Stakeholders’ needs model ................................................................................................... 108
Performance Measurement Model ...................................................................................... 110
Associating Lean Practices with Performance Effects ........................................................... 117
Considerations for Developing Sound Indicators .................................................................. 119
Evaluation Worksheet ........................................................................................................... 122
The Roadmap of Performance Measurement in Lean implementation ............................... 127
Chapter 8: Conclusions and Further Research ......................................................................... 131
Conclusions ........................................................................................................................... 131
Limitations and further work ................................................................................................ 137
References ...................................................................................................................................... 139
Appendix A: Evaluation Worksheet .......................................................................................... 147
Appendix B: Example of Use of the Evaluation Worksheet ................................................. 149
Appendix C: Interview Guide ..................................................................................................... 153
ix
List of Figures
Figure 1: Study framework of the thesis .................................................................................... 14
Figure 2: Different levels of the new production philosophy (Koskela, 1997) .......................... 21
Figure 3: Lean Project Delivery System (G. Ballard, 2008) ...................................................... 22
Figure 4: Last Planner system of production control (adapted from G. Ballard and Howell
(2003)) ......................................................................................................................................... 24
Figure 5: Focus and validity horizon of measures (adapted from Andersen & Fagerhaug, 2002)
..................................................................................................................................................... 40
Figure 6: The EFQM Excellence Model .................................................................................... 47
Figure 7: The Ladder of Inference mental model (Senge, 2014, p. 243) ................................... 70
Figure 8: The Lean Construction Model .................................................................................... 88
Figure 9: Stakeholders’ needs model in the Lean implementation process ............................. 110
Figure 10: Performance Measurement Model for implementing Lean Construction .............. 111
Figure 11: Practices Associated to Effects in the Performance Measurement Model ............. 118
List of Tables
Table 1: A 12 Step Model for Developing and Using KPIs (Parmenter, 2010) ......................... 42
Table 2: Seven pitfalls that lead to counter-productive metrics (adapted fromJ. Hauser & Katz,
1998) ........................................................................................................................................... 59
Table 3: Overview of performance indicators ............................................................................ 62
Table 4: Evolution of projects' success factors in the literature ................................................. 65
Table 5: Anonymized presentation of the interviewees ............................................................. 78
x
Acknowledgements
I would like to thank all those who have contributed during the development of the thesis.
First, I want to mention all people participating in the SpeedUp project at Sinef in which
context the thesis has been written. I thank to Agnar Johanssen for his invitation to
participate in the project and his thorough and helpful inquiries, and Bjørn Andersen for
providing guidance in the initial phase. I also thank to Nils Olsson and all the professors
and project members participating in the following up sessions, who have provided very
valuable insights. And I also want to give a special mention to Siva Ekambaram for his
meaningful contribution during the supervision of the thesis, always open to help and
discuss any issue, helping to find new perspectives, providing contacts with relevant
actors and carefully reviewing the thesis.
A very important contribution has made possible the data collection of the thesis. I want
to acknowledge the entire network that has made possible reaching the relevant actors,
and particularly thank to the interviewees for their patience and effort in providing
comprehensive description of their experience.
Another important contribution to the thesis has come from the group of students who
have been writing the thesis at the same department. The insights from their topics and
experiences, and the constant exchange of ideas has broadened the outlook of the work
and made it more enjoyable. Finally, I want to acknowledge Idun for providing support
with the illustrations and formatting, and her feedback reading the work done.
David Herranz Limón
Trondheim, 2nd June 2015
Chapter 1:
Introduction
This chapter presents the framework of the study that represents the pathway of the thesis
and delimits the scope of the work establishing the fundamental boundaries. It starts with
a basic theoretical background and follows presenting the research objectives and scope.
It also introduces the topics that are further developed along the thesis by answering
questions about the relevance of measuring performance. Finally, it provides an overview
of the thesis’ structure.
The elaboration of this thesis is part of the research project SpeedUp at Sintef, a Prosjekt
Norge initiative. Several organizations from both the industry and the academia
participate in the project. The main objective is to develop strategic, tactical and
operational measures in order to reduce overall execution time in complex construction
projects by 30-50%. The thesis focuses on the contribution of Lean to this goal and the
performance measurement systems as tools supporting its implementation.
Background
After two decades from the first concepts of a new philosophy related to Lean applied in
the construction industry, there have been a clear progress in its implementation. The
development of the Lean Construction literature has been significant and practitioners
Measuring Lean Construction
12
have shown increasing interest in new methodologies. The change of paradigm
announced by Koskela (1992) continue taking place nowadays.
Since Lean practices arose in the manufacturing industry, its implementation in the
construction industry has not been straightforward and has required a long process to
adapt Lean to the distinguishing characteristics of the construction business: the one-of-
a-kind type of project, site production and temporary creation of multi-organization
(Koskela, 1997). Some of these practices at the origin of Lean Construction are the Last
Planner System, Pull Scheduling and Just-in-Time delivery (G. Ballard & Howell, 2003).
Other practices, such as Concurrent Engineering were developed in parallel to Lean
although they are often found integrated under Lean principles (Koskela, 1997). More
recently, Concurrent Engineering together with other practices such as Virtual Design
Construction and Set Based Design contribute to extend Lean practices over the project
life cycle (G. Ballard, 2008).
Once covered the difficulty of creating specific practices in order to apply Lean principles
in the project-based construction industry (Powell, Strandhagen, Tommelein, Ballard, &
Rossi, 2014), the challenge was to drive the organizational change towards the new
methodologies. Organizational culture factors in construction needed to be addressed for
a successful implementation of practices (Cheung, Wong, & Wu, 2011). From the
experience implementing Lean in manufacturing industries, it was already realized the
challenges in the implementation process (Dombrowski & Mielke, 2014). The
establishment of a performance evaluation system is among the critical success factors
for implementing Lean in manufacturing industries (Bakås, Govaert, & Van Landeghem,
2011).
The idea of applying performance evaluation systems on Lean implementation can be
extended to project-based industries without having added negative effects (H. A.
Bassioni, Price, & Hassan, 2005). However, even though these systems have proved to
help driving change, they also account for implementation barriers that should be
considered together with the Lean-specific factors. In addition, the study of success factor
in construction projects can also contribute to the development of an effective evaluation
system. All these elements creating the boundaries of the thesis are exposed in Figure 1
showing the framework of this study.

Introduction
13
Research objectives
The key objective of this thesis is to study of performance improvement practices in the
construction industry and how performance measurements systems could be used to
support the successful implementation of these practices. This objective is described in
greater detail through the four research questions identified. The first question aims to
find the current practices used by organizations to improve their performance, whereas
the second question focuses on the effects of these practices. The third question address
the implementation challenges from a stakeholder perspective by trying to identify their
needs. The last and main question of the thesis is how the mentioned effects can be
measured. These questions guide the research from the current status of Lean practices
and stakeholders’ needs towards the methods for measuring the effects realized over the
first steps of the implementation. Following are the research questions, although further
details are presented in Chapter 5.
1. What performance improvement attempts are construction companies carrying
on?
2. What are the effects of these practices in project performance?
3. What are the stakeholders’ needs in the implementation process?
4. How can these effects be measured (in order to support the fully implementation
of those practices)?
Given the recent interest of the targeted industry in performance measurement, it was not
possible to obtain direct data from organizations and therefore the data collection required
different sources for the issues involved. On one side, qualitative research is used to
describe current practices in Lean Construction. On the other, extensive literature review
on performance measurement supports the exploratory research for creating a purpose-
specific measurement model, including the description of the most relevant generic
frameworks and the presentation of other derived frameworks designed for specific
purposes.

Measuring Lean Construction
14
Research scope
The scope of the thesis is graphically described in Figure 1. The basic boundaries are
defined by the construction industry in Norway. On one hand, the frequent presence of
programmes for the implementation of Lean practices within Norwegian construction
companies allows settling the focus on the segment of the organizations using these
practices. On the other hand, the lack of measurement culture within construction projects
makes appropriate to take the perspective of measurement systems as tools for improving
the implementation of Lean practices. Furthermore, the figure recognizes the presence of
both concepts further the construction industry.
Figure 1: Study framework of the thesis
When bringing the mentioned concepts together there are also other issues that are
necessary to address. Firstly, the implementation of new methodologies necessarily
involve a certain degree of organizational change that needs to be managed, such as
resistance to change, adaptation of work methods, using new systems, learning process
and not less important the adoption of a new culture within the industry. Secondly, there
has been a continuous search of success factors in construction projects that are wise to
be considered, as well as success factors in the implementation of Lean and Performance

Introduction
15
Measurement systems. For this reason, both organizational change and success factors
appear as horizontal elements.
Finally, construction projects involve a significant number of stakeholders with different
and often contradictory interests. Consequently, a thorough stakeholders’ analysis is
necessary to acknowledge and understand their specific needs and expectations in the
implementation process of new methodologies. The successful implementation of the
practices considered requires the involvement of the different actors and hierarchy levels
of the project.
The scope of the thesis is limited to primary effects realized during the implementation
process of Lean practices, which excludes aspects like political issues, organizational
governance, portfolio selection or adoption of new technology. Although implementation
issues are reviewed, a detailed step-by-step guide for the actual implementation of the
model is out of the scope of the thesis. For example, reporting methods and explicit review
procedures are not specified as part of the model. With the contemplation of all the
elements included in the study framework, the reader is ready to initiate the journey
throughout this thesis.
Why do organizations measure?
Performance Measurements Systems are often used as a strategy implementation tool
(Niven, 2002) or should at least be connected to the strategy to drive change towards
success (Johnson, 2002). On the other hand, managers measure for two basic reasons
included in the mentioned strategic control: to identify areas for improvement and to
influence people’s behaviour (Beatham, Anumba, Thorpe, & Hedges, 2004; Robinson,
Anumba, Carrillo, & Al-Ghassani, 2005). Using a performance evaluation system,
independently of the core purpose, will affect actions and decisions (J. Hauser & Katz,
1998). In words of A. Neely, Adam, and Kennerley (2002, p. 9), ‘measures send people
messages about what matters and how they should behave’.
In construction organizations, the use of performance measurement systems is aligned
with strategic control purposes (Bassioni et al., 2004c). More specifically, excellence
models have been used to provide an overview of the business performance. On the other

Measuring Lean Construction
16
hand, the Balanced Scorecard is used in the strategic management to evaluate such
objectives. Construction companies need both type of performance assessment to
measure strategic performance while knowing where they have to improve and guide
employees’ behaviour (H. A. Bassioni et al., 2005).
Melnyk, Bititci, Platts, Tobias, and Andersen (2014) discussed the role of performance
measurement and management systems. The claimed that the foremost cause of failure in
the use of these systems is that measures and metrics were not being revised or they were
incorrectly revised periodically although they were used in turbulent environments. In
dynamic environments, co-creation of strategy and performance measurement would
produce a more resilient system. Bourne, Mills, Wilcox, Neely, and Platts (2000) also
concluded the need of specific processes to continuously align the performance
measurement system with the strategy.
Why the need of new ways of Performance Measurement?
Financial measures are present in every business and they have been the centre of
management practices for decades. Even today it is not difficult to find examples of
companies relying almost solely on financial results (Andersen, Olsson, Onsøyen, &
Spjelkavik, 2011). Financial measures have been criticized from the origins of the
creation of new evaluation methods because of their lack of strategic focus and
responsiveness in contemporary business realities, encourage local optimization and
short-term results, giving information only about past performance and they fail
promoting continuous improvement (Kagioglou, Cooper, & Aouad, 2001). New
performance measurement systems need to be effective measuring performance, consider
the increasingly important intangible assets and overcome the implementation challenges
(Niven, 2002).
The appearance of generic models of performance measurement intended to overcome
the mentioned dysfunctionalities of financial-based measurement systems as mentioned
previously with the use of excellence models and balance scorecard. However, Andy
Neely, Gregory, and Platts (2005) revealed the need of adaptation of performance
measurement frameworks to the construction industry. The foundation for this statement

Introduction
17
is that every measurement system requires adaptation when they are implemented within
the organization, questioning the actual existence of ‘generic’ frameworks (Andy Neely
et al., 2005). Several authors have developed, often based in these generic frameworks,
performance measurement models to deal with specific needs depending on the phase of
the project (Kristensen, Andersen, & Torp, 2013) or relevant aspects of projects such as
the supply chain (Wegelius-Lehtonen, 2001). Despite of the extensive coverage of Lean
Construction and Performance Measurement in the literature, the review carried out for
this thesis did not revealed a prior measurement system attending the challenging
implementation of Lean in the construction industry. The increased attention of
performance measurement (Langlo, Bakken, Karud, Landet, & Andersen, 2015) and the
frequent existence of Lean implementation attempts in the Norwegian construction
industry have motivated the detailed study of these practices in conjunction.
Structure of the thesis
Following is a brief description of the content of the thesis chapter by chapter. Additional
summaries with the key findings can be found at the end of each chapter.
Chapter 1 presents the topic and describes the study framework that define the scope of
the thesis. As well it describes the foundations about the relevance of the study and the
research objectives.
Chapter 2 includes relevant theory of Lean, from its origin and principles until its
development as Lean Project Delivery System. The most common Lean practices are
presented, including Last Planner, Pull Scheduling, Concurrent Engineering and Virtual
Design Construction.
Chapter 3 provides a detailed description of the most popular and extended Performance
Measurement frameworks, namely Balance Scorecard, Key Performance Indicators,
EFQM Excellence Model ad Lean Six-Sigma.
Chapter 4 extends the Performance Measurement literature to specific frameworks and
provides an extensive literature review on the search of indicators for the construction
industry and its success factors.
Measuring Lean Construction
18
Chapter 5 describes the process followed during this thesis from the definition of the
project until the research methodology used for attaining the obtained results. It also
includes the research questions, the validity assessment and limitations.
Chapter 6 presents the data collected from the interviews after a first analysis
transforming the data in information usable for the creation of results through discussion
and comparison. It describes the use of Lean practices, implementation status and
challenges, stakeholders’ analysis and use of project metrics.
Chapter 7 shows the results created by the author in form of several models based on the
information collected. First, I created a model of stakeholders’ needs for the correct
understanding of the challenges concerning the implementation of Lean practices. Then,
I developed the Performance Measurement framework as well as the specific tools,
explaining the implementation process as an expression of the linkages between the
different elements of the model.
Chapter 8 describes the conclusions of the present work along with specifying its
limitations and suggesting directions for future research.

Chapter 2:
Lean Construction
This chapter aims to explain the basics of Lean practices applied in the construction
industry in order to provide a ground understanding of Lean. After a brief presentation of
Lean principles and core values, the adaptation to Lean Project Delivery System will be
described. Then, the most relevant practices used currently in the industry are introduced.
Since the origin of Lean practices is in the manufacturing industry, it is important to
define and explain how Lean is adapted to the construction industry in order to understand
what can be expected in the description of practices used by construction companies.
The roots of Lean
Lean was born as an attempt to improve the production performance in a context of
intense competition and demanding customers in Japan. The result was a new
methodology created by Toyota engineers translated into a production system. The
complete managerial system was described by Womack, Jones, and Roos (1990) and it
became popularized among the western industries. Although developed more than 50
years ago, Lean continues being a recognized and respected theory having an influence
even further than production industries (Vahos, 2014).

Measuring Lean Construction
20
As defined in Vahos (2014), systems’ theory can explain the underlying mind-set of Lean
by focusing the improvement efforts not only in individual areas, but adopting the view
of the system as a whole and focusing on the relations between parts. Rother (2010) lists
a number of practices that shape Lean and claims that the core objective of the production
system should be to deliver value to the end customer. To achieve this it is necessary to
break down and understand the processes as well as their interrelations. The improvement
is facilitated by trial and error experiments from people mastering the process. In addition,
there should be established specific targets to guide and stimulate employees in the
improvement process.
The Lean principles
I will present the Lean principles as described by Womack et al. (1990). First, it should
be defined the customers’ requirements and expectations as the way they interpret value.
Second, identifying the value-stream and eliminating the activities that does not add value
is required for the transformation of the process. In this way, the production process is
replaced by a continuous flow from the design to the delivery of the product to the
customer. Another basic principle is to adapt the production operations to the rate demand
of the customer switching from push to pull approach. The last principle is the continuous
improvement of the whole process by encouraging employees to seek the perfection in
the process.
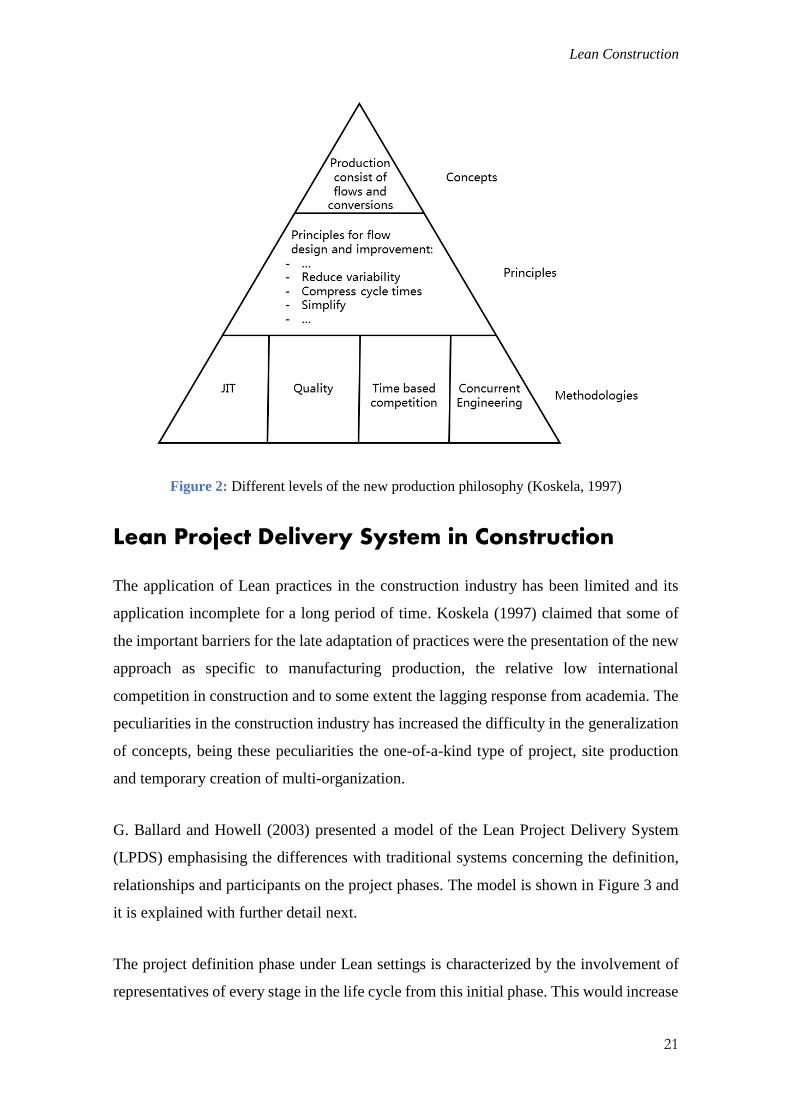
The new philosophy has been developed through three stages as it can be seen in Figure
2, the fundamental concept of production as flows and conversions, the basic principles
already mentioned and a number of methodologies.
Although Lean was created and mostly developed in production settings, it has been
several attempts to adapt these principles to other industries such as services or
information systems development (Koskela, 1997). Following there is a description of
the attempt to adapt Lean principles into a project setting.
Lean Construction
21
Figure 2: Different levels of the new production philosophy (Koskela, 1997)
Lean Project Delivery System in Construction
The application of Lean practices in the construction industry has been limited and its
application incomplete for a long period of time. Koskela (1997) claimed that some of
the important barriers for the late adaptation of practices were the presentation of the new
approach as specific to manufacturing production, the relative low international
competition in construction and to some extent the lagging response from academia. The
peculiarities in the construction industry has increased the difficulty in the generalization
of concepts, being these peculiarities the one-of-a-kind type of project, site production
and temporary creation of multi-organization.
G. Ballard and Howell (2003) presented a model of the Lean Project Delivery System
(LPDS) emphasising the differences with traditional systems concerning the definition,
relationships and participants on the project phases. The model is shown in Figure 3 and
it is explained with further detail next.
The project definition phase under Lean settings is characterized by the involvement of
representatives of every stage in the life cycle from this initial phase. This would increase

Measuring Lean Construction
22
the understanding of the project and aligning values, concepts and criteria. During the
design phase, the practice of selecting options and executing design as soon as possible
is switched for deferring decisions until the last responsible moment allowing the
exploration of different alternatives. The limit for deferring the decisions is determined
by the lead time to realize alternatives discussed. In the next stage, Lean Supply requires
the design of the processes that allows the system knowing what to fabricate and when to
deliver the components. Lean Supply also intends to reduce the lead time for both
information and materials, especially in engineer-to-order products. Finally, Lean
Assembly begins after delivery of materials and information and is completed when the
client can use the product.
Figure 3: Lean Project Delivery System (G. Ballard, 2008)
The Lean Project Delivery System is adopted in practice in the construction industry
through a number of tools and methodologies containing Lean principles. Following there
is a description of the practices that are commonly found in Lean oriented organizations
within the Norwegian construction industry. These are the Last Planner system (involving
planning), Pull Scheduling, Concurrent Engineering and Virtual Design Construction
(VDC), also often found as BIM.
Lean Construction
23
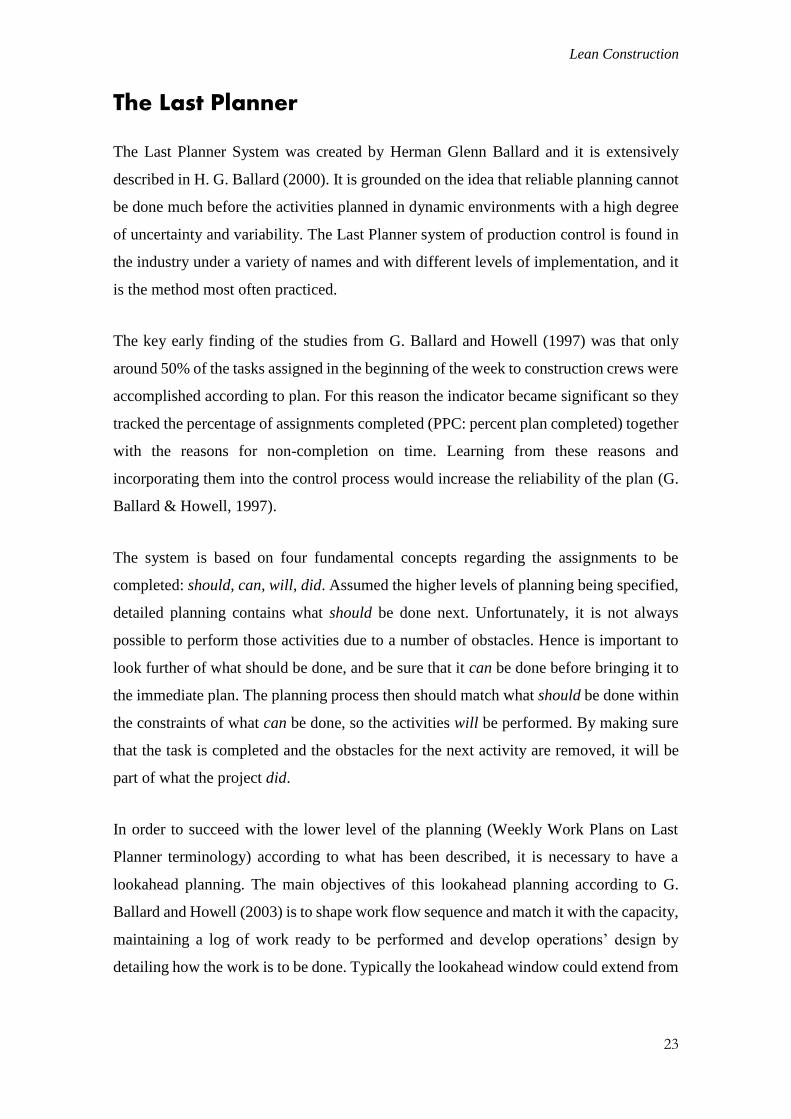
The Last Planner
The Last Planner System was created by Herman Glenn Ballard and it is extensively
described in H. G. Ballard (2000). It is grounded on the idea that reliable planning cannot
be done much before the activities planned in dynamic environments with a high degree
of uncertainty and variability. The Last Planner system of production control is found in
the industry under a variety of names and with different levels of implementation, and it
is the method most often practiced.
The key early finding of the studies from G. Ballard and Howell (1997) was that only
around 50% of the tasks assigned in the beginning of the week to construction crews were
accomplished according to plan. For this reason the indicator became significant so they
tracked the percentage of assignments completed (PPC: percent plan completed) together
with the reasons for non-completion on time. Learning from these reasons and
incorporating them into the control process would increase the reliability of the plan (G.
Ballard & Howell, 1997).
The system is based on four fundamental concepts regarding the assignments to be
completed: should, can, will, did. Assumed the higher levels of planning being specified,
detailed planning contains what should be done next. Unfortunately, it is not always
possible to perform those activities due to a number of obstacles. Hence is important to
look further of what should be done, and be sure that it can be done before bringing it to
the immediate plan. The planning process then should match what should be done within
the constraints of what can be done, so the activities will be performed. By making sure
that the task is completed and the obstacles for the next activity are removed, it will be
part of what the project did.
In order to succeed with the lower level of the planning (Weekly Work Plans on Last
Planner terminology) according to what has been described, it is necessary to have a
lookahead planning. The main objectives of this lookahead planning according to G.
Ballard and Howell (2003) is to shape work flow sequence and match it with the capacity,
maintaining a log of work ready to be performed and develop operations’ design by
detailing how the work is to be done. Typically the lookahead window could extend from

Measuring Lean Construction
24
3 to 12 weeks in the future depending on the complexity of the project and the need of
several steps in the plan hierarchy (H. G. Ballard, 2000).
Figure 4: Last Planner system of production control (adapted from G. Ballard and Howell
(2003))
The Last Planner system is therefore a set of three specific tools: the PPC indicator and
its root reasons, should-can-will-did thinking and lookahead planning. In practice, the
level of implementation of each tool varies and companies sometimes find substitutive
tools to achieve the same goals. Then different organizations give different names having
the same mind-set behind, so it is easier to find Last Planner methodologies under other
designations such as involving planning or similar concepts. Although the degree of
implementation varies, even partial implementations has shown substantial
improvements and waste reduction in projects (G. Ballard & Howell, 2003).
Pull Scheduling
The purpose of Pull Scheduling is to produce a plan that maximizes value generation (G.
Ballard & Howell, 2003). In a production context, Bell (2005) emphasises the need for a
careful planning in a Lean environment in order to anticipate and smooth variations,
allowing flexibility and responsiveness. In G. Ballard and Howell (2003, p. 70) words, a

Lean Construction
25
pull technique ‘causes tasks to be defined and sequenced so that their completion releases
work’, eliminating the waste of overproduction.
The process of generating a plan based on pull scheduling is described in G. Ballard and
Howell (2003) and it starts by defining the work to be included in the phase and
determining the completion date according to the master plan or defined milestones.
Then, representatives of those with work packages in the phase meet to do the plan on
teamwork basis. First, they should develop a network of the activities required for
completing the phase and then start from the completion date and add the activities to the
plan backwards incorporating intermediate milestones. Once the sequence of all the
activities is established for the first time, the duration of each activity should be applied
without considering contingencies in the estimates. After several loops reviewing the
logic of the plan in order to try shortening the duration, the earliest practical start date is
defined and it can be decided what activities to buffer with additional time according to
their degree of uncertainty.
On the execution phase, ‘Lean synchronizes release of work to actual demand in real time
when requested by a pull signal’ (Bell, 2005, p. 119). In a project environment, the pull
signals can be produced by the updated status of activities and its communication to
managers and impacted teams so they can react accordingly. An example of these pull
signals is the use of boards with the activities to be performed listed in order where
workers would annotate the status of the activity and whether is finished.
The use of this practice is less extended than the Last Planner system although it is
commonly explained as part of it. The reason for not applying pull scheduling in Last
Planner environments can be the need of involving more actors in the planning process,
while in practice the planning is done by only one person and then supervised by the
manager, or by a reduced number of people.
Concurrent Engineering
A generic definition of Concurrent Engineering (CE) can be extracted from the aerospace
industry, where this practice is largely extended.
Measuring Lean Construction
26
‘Concurrent Engineering is a systematic approach to integrated product
development that emphasises the response to customer expectations. It embodies
team values of cooperation, trust and sharing in such a manner that decision
making is by consensus, involving all perspectives in parallel, from the beginning
of the product life-cycle.’ (Bandecchi, Melton, & Ongaro, 1999, p. 34)
In the construction context, Jaafari (1997) derived the concept of Concurrent Engineering
to be applied specifically in the construction industry defining ‘Concurrent Construction’,
described as ‘an integrated approach to the planning and execution of all project
activities, from the conceptualization state through to the handover of the facility’.
(Jaafari, 1997, p. 427). According to this approach, concurrent construction is based on
the integration of all project phases with the simultaneous inclusion of relevant
information from the different specialization areas by the formation of composite teams,
and the division of work into separable parts using proactive management and inter-team
communication to integrate information from the teams through the life cycle. This
description corresponds to the concept of Concurrent Engineering considered in the
thesis, although I have preferred to maintain the denomination of Concurrent Engineering
to avoid confusion with Lean Construction and to be coherent with the term used currently
in the industry.
Concurrent Engineering is also a widely extended practice although is not often realized
by organizations, with the exception of those especially focused in this practice. On one
hand, those companies emphasizing the use of concurrent engineering usually centred its
implementation in the design phase, although it is used throughout the life cycle of
construction. On the other hand, companies using concurrency without specifying the
name usually use it in the execution phase as a problem-solving tool.
In the framework of describing the new philosophy applied in construction, concurrent
engineering is defined as ‘an improved design process characterized by rigorous upfront
requirements analysis, incorporating the constraints of subsequent phases into the
conceptual phase, and tightening of change control towards the end of the design process’
(Koskela, 1992, p. 8). Based on this definition it can be recognized the link with the root
ideas of Lean methodologies. Aligned with the objectives of Lean, concurrent
engineering intends to compress the design time and to reduce the number of change
orders by increasing the number of design iterations. The iterative design process allows
Lean Construction
27
overlapping of activities and information transfer between specialization areas, which
leads to early finding of problems that can be solved over the iterative loops increasing
the design’s level of detail. This results in globally shortened design phases with increased
quality on the product design (Limon, 2014).
The relevance of the design phase in the value delivery process to the customer is
emphasized in the update of the Last Planner system presented by G. Ballard (2008). For
this reason, concurrent engineering is a methodology to be considered in future Lean
Construction implementation.
In practice, Concurrent Engineering makes use of IT tools to facilitate the exchange and
distribution of information between teams and along the project life cycle. An important
part of these tools is grouped under the name of Virtual Design Construction (VDC).
However, the implementation of CE does not necessarily imply the use VDC and vice
versa, thus they are presented separately.
Virtual Design Construction (VDC)
VDC comprises a set of tools that supports the accomplishment of Lean Project Delivery
System ideals (Khanzode, Fischer, Reed, & Ballard, 2006). The objectives of these tools
include a more effective communication, coordination of various disciplines,
constructability analysis, evaluation of logistic plans and creating estimations.
Some of the tools part of VDC are product visualization (3D modelling), process
modelling and visualization (4D visualization), and online collaboration tools. VDC
allows building virtual models of the product, organization and process in the early phases
of the project, before a large commitment of resources is done. This enables the
simulation of complexities of the product and understanding pitfalls. Furthermore, it can
provide a framework for the integration of data, which allows a fast and iterative
collaboration between the different stakeholders involved in the project with the use of
concurrent design facilities. Khanzode et al. (2006) provide specific guidelines on the use
of VDC tools over the project phases and show some practical examples.
The interaction between the practices presented has been documented over their
description. It should be recognized the fact that each practice can be implemented in

Measuring Lean Construction
28
different degrees and in combination with other tools, resulting in a wide range of
possibilities when describing the practices implemented by organizations. For example,
companies implementing Last Planner could use Pull Scheduling or still maintain the
traditional method of planning. At the same time of using Last Planner, the organization
can use Concurrent Engineering for specific phases of the project or apply it through the
whole project life-cycle. Additionally, VDC can support CE practices or otherwise been
used independently. This creates a heterogeneity in the use of Lean practices that requires
a high degree of flexibility to the frameworks concerning them in order to be applicable
throughout the industry.
Summary of the chapter
The roots of Lean are found in the systems’ theory, which adopts the view of the system
as a whole focusing on the relationships between elements. After its creation in a
production context with intense competence and demanding customers, it defines the core
objective in delivering value to the end customer. This is achieved through the Lean
principles that aim to define customers’ expectations, identify the value stream and
eliminate those activities not adding value.
The philosophy of Lean was adapted to project-based context as the Lean Project Delivery
System, whose main archetype is the Last Planner system. It consist on involving the
people who will actually do the work in the planning and ensuring that is possible to do
it before bring it to the plan, following a should-can-will-did approach. Pull Scheduling,
often part of Last Planner, is based on the idea of sequencing tasks so their completion
releases work. Concurrent Engineering, considered under the Lean principles, intends to
compress the design time and to reduce the number of change orders by increasing the
number of design iterations as well as overlapping activities and information transfer. The
last tool presented is Virtual Design Construction, which includes process modelling and
visualization besides online collaboration tools. VDC enables effective communication
and coordination in addition of analytical and estimation capabilities.

Chapter 3:
Performance Measurement
Frameworks
This chapter is the first part of the literature review of performance measurement
frameworks, which is divided in generic models and purpose-specific frameworks. The
present chapter collects the most extended and referenced performance measurement
frameworks. These models correspond to general measurement systems applied in a
variety of industries and they are used as references in the literature, which are the main
reasons for their selection. The importance of having a detailed understanding of these
frameworks as well as the way they are implemented is explained because they are used
as references for developing purpose-specific models, including the one that I will present
as the result of this thesis.
The Balanced Scorecard
Kaplan and Norton developed the Balanced Scorecard (BSC) in the early ‘90s with the
aim of exploring new methods of performance measurement (R. S. Kaplan & Norton,
1992). The study resulted in a selected set of measures derived from the strategy of the
organization, representing a tool for the communication and implementation of that
strategy. The importance of this method is rooted in its ability to bridge short-term
leadership action with long-term strategy, and measurement system to strategy through
the Strategy Map.

Measuring Lean Construction
30
The translation of the strategy into measures is accomplished by using a set of objectives
describing what needs to be done in order to implement the strategy. The definition of
these objectives is what comprises Strategy Maps. Strategy Maps are the reason for
Balance Scorecard to be considered a communication tool, indicating to all the relevant
stakeholders what they must do well to achieve the company’s ultimate goals.
Measures are derived from the Strategy Map once this has been developed, providing
accountability to the system. In this way, performance measures act as a monitoring
system to observe the implementation of the strategy. With this purpose and being aware
of the importance of intangible assets, R. S. Kaplan and Norton (1992) proposed four
perspectives of performance: financial, customer, internal processes, and employee
learning and growth. Under these perspectives financial measurement is still a base for
assessing business’ performance, however it is balanced with other measures that show
how financial results could be maximized.
Establishing a Balanced Scorecard
According to Niven (2002), the development of the Balance Scorecard should start by
developing a guiding rationale that explains the need of such system. This will make
easier to engage management and employees in the process. Secondly, the organization
need to choose where to implement the BSC. The criteria for the selection of the
appropriate organizational unit are having a coherent strategy, executive sponsorship and
key managers’ support, clear objectives, acceptance of culture of measurement and ability
to collect data, organizational scope and sufficient resources (Niven, 2002).
Given the need of developing a new performance measurement system and once made
the decision of adopting the Balanced Scorecard framework, the first step is the creation
of a team in order to develop the system. Choosing the right people will greatly contribute
to the successful implementation of BSC. The amount of people needed in the team will
depend on the different areas of the organization, since they all should have
representation. There are also some specific roles that are recommended, as an executive
sponsor to guarantee the support from the top management, the Balanced Scorecard
expert that coordinates the meetings and facilitates the development of the team, and an
organizational change expert to mitigate failure risks in the implementation (Niven,
2002). The executive sponsorship is of special relevance to provide deep understanding

Performance Measurement Frameworks
31
of organization’s strategy, decision rights to determine priorities and commitment to the
strategy. Furthermore, training of the BSC development team should be provided to
ensure that all the participants are aware of the process.
Strategy Map
The ability to communicate strategy in a clear manner to all stakeholders is one of most
relevant contributions from Balance Scorecard. As the first companies adopting BSC
faced some challenges translating strategy into measures, they introduced the definition
of objectives answering ‘What must we do well in each of the perspectives in order to
execute the strategy?’ (Niven, 2002, p. 98). By clearly articulating objectives from the
strategy, the task of making the selection of metrics can be facilitated. The Strategy Map
is a graphical representation of the mentioned ‘what you must do well’ which also may
reveal important interdependencies among objectives.
In order to develop the Strategy Map, each of the perspectives proposed in the model
should be explored in order to develop the objectives rooted in the strategy. The financial
perspective is considered as a great ‘rearview mirror’ and not consistent with intangible
assets environment. Despite of this fact, it should be included in the BSC as many
practitioners recognize this as of higher importance (Niven, 2002). In my opinion, relying
only in financial measures provides few opportunities for improvement but they are still
a good indicator to confirm the effectiveness of the actions taken and therefore they
should not be completely eliminated from the performance measurement system.
Developing the objectives for the customer perspective might seem difficult to express.
Narrowing the answer, this step requires to answer two basic questions according to
Niven (2002). First question is ‘Who are our target customers?’ and the answer should
determine which group of customers is the best for the company’s products. Second,
‘What is the value proposition?’, which should describe how the company differentiate
itself in the market. There are a number of models for market differentiation (Porter, 1979;
Treacy & Wiersema, 1997), however, detailed description of these models are out of the
scope of this report.
After determining what the company’s value proposition is, the internal process
perspective would address how to fulfil it. Niven (2002) claims that this perspective
Measuring Lean Construction
32
spawns the largest volume of measures. Therefore the challenge is limiting the measures
to those processes that drive value for the customers. Robert S Kaplan and Norton (2004)
grouped internal processes in four clusters.
Operations management processes are ‘the day-to-day processes by which companies
produce their existing products and services and deliver them to customers’ (Robert S
Kaplan & Norton, 2004, p. 43). Customer management processes are related to how to
maintain and develop relationships with targeted customers. This includes selection,
acquisition, retain and grow business with the selected customers. Innovation processes
are linked to new product, process and service development. The company should identify
opportunities to penetrate into new markets managing a portfolio of research and
development programmes, and discern how to bring new products and services to the
market. Finally, regulatory and social processes help the company to interact and adapt
to the environment where they operate. This includes safety and health practices,
employees’ engagement and community investment (Robert S Kaplan & Norton, 2004).
Sometimes employee learning and growth is not considered as the highest priority (Niven,
2002). Conversely, this perspective is an enabler of the other perspectives and therefore
their objectives should be carefully considered. Motivated employees with the right skills
drives the improvement process for meeting customer expectations that often leads to
financial returns, therefore acting as the foundations for everything else in the
organization. Some possible objectives within this perspective are having the right skills
in strategic positions, recruitment talent and adequate training for employees. Within this
perspective, information technology systems and aligned organizational culture may play
a vital role in the development of employee learning and growth (Niven, 2002).
Performance Measures in BSC
Performance measures in BSC, as in any other framework, communicate to stakeholders
value creation and drive their actions. Furthermore, BSC should contain a mix of both
leading and lagging measures to show key improvements and their impact on customer
satisfaction and financial results. The review of measures will be explained according to
the four perspectives that conform the BSC framework: financial, customer, internal
processes and learning and grow. In this case, the chosen measures should be a direct
translation of the objectives described in the Strategy Map.

Performance Measurement Frameworks
33
Suggestions for measuring the financial perspective brought by Niven (2002), account
for not overcomplicating measurements and not relying exclusively on measures of
growth and profitability. According to the author, although looking for new and missing
measures is valuable, often the first measure that come to mind is the most appropriate.
As an example, ‘improve performance’ requires achievement of success over time while
often ‘monitoring performance’ would suffice for the purpose of the objective. It is also
important to reflect in the measures that growth is not enough if does not create value.
Economic value added (EVA) is suggested as tool for evaluating the opportunity costs
and assess the value creation against growth. Other aspects often considered as part of the
financial metrics are indicators of risk management, share price and market valuation to
reflect the value of the organization’s intellectual assets. The key aspect of these metrics
is that they are aligned to the company’s strategy.
When developing measures for the customer perspective, Niven (2002) suggest using the
three value propositions of operational excellence, product leadership and customer
intimacy as a framework. Operational excellence focus on particular aspects to offer value
to the customer. Some examples of these measures could be ‘total cost of ownership’ or
‘price compared to key competitors’ in case of operational excellence it is focused on
price; ‘defect rates’ may be monitored in case the focus is on zero defects policy. Other
areas to focus are growth, selection or convenience for the customer. Product leadership
succeed in providing customers with new and innovative products, whose measures
would be related to brand perception or functionality of the product. Customer intimacy
provides superior services and therefore it could be measured in terms of ‘access to key
customer information’, ‘reputation index’ or ‘customer retention’. Other measures out of
this framework can be found, such as customer information based on information shared
through Internet or other type of interaction with the customer. However, the most
devoted measure in this perspective is ‘customer satisfaction’. Although very popular, it
can be difficult to actually measure and there is a number of companies where the way of
measuring this indicator has led to incoherencies with sales results (Niven, 2002).
Following the framework exposed in the Strategy Map for the internal process
perspective, some measures will be explored next. Operations management measures
refers to routine processes and it can be assessed in terms of ‘cycle time’ or ‘internal lead
time’. Customer management can be measured as ‘marketing effectiveness’, ‘number of

Measuring Lean Construction
34
customer profiles’ or their ‘retention’. Innovation metrics related to internal processes are
displayed according to budget, ‘number of new products develop’ or ‘introduced’ or ‘time
to market for new products’. Finally, regulatory and social issues can be monitored to
show adherence to environmental or social standards and to show actions taken in support
of these issues. Measuring this aspect can involve ‘number of audit findings’ or
‘employee volunteer hours’ among others. The challenge in this perspective is to identify
the processes driving the customer value proposition to define specific measures that
enables the correct assessing of its performance. These internal process measures are
usually the most tailored indicators, and often new processes are found necessary to
achieve the strategic goals (Niven, 2002).
As mentioned in the Strategy Map, employee learning and growth is a key aspect of the
BSC that will enable the expected performance in the rest of the areas. Employees are a
core capital of the organization, and they should be considered as such in the measurement
system. The company should identify the competences that needs to be fulfilled in order
to achieve the strategy. Thus, the coverage of these competences could be used as measure
of employees’ skills development. Another common practice is to have personal
development planning for every employee, which may allow measuring the extent to
which employees are adhered to their planning or the coherence with the competences
needed. In the same line, metrics about employee training can give an idea of the
development of competences when measured the results of the training rather than the
training itself.
Other forms to measure employee learning and growth is the access to relevant
information according to the position of the employee. Therefore monitoring ‘capital
information accessibility’ requires first to determine what information should be available
for every stakeholder. At an organizational level, ‘employee satisfaction’ can give an idea
of their motivation. This is a key measurement of personnel engagement, which is a basic
condition for achieving their goals. Measuring employees’ wealth can be also relevant,
since aspects like a healthy lifestyle can have an impact on safety. This could be
considered as an example of leading indicator in contrast with injury frequency rates,
given that a significant percentage of mortality is related to lifestyle choices (Niven,
2002).

Performance Measurement Frameworks
35
Final notes on Balanced Scorecard
One of the questions that raises when selecting the performance measures is the amount
of measures needed. Although is not possible to give a specific answer to this question,
the system should contain all the measures necessary to describe the strategy adequately.
At the same time, if you can describe your system with fewer measures than you have,
then you should stick to the minimum. These criteria will facilitate getting information
from the system and make it cheaper to maintain.
Given that the selection of measures is performed, it is helpful to develop a ‘data
dictionary’ to distribute the system with the executive team and the rest of the
organization. This will be a reference to provide the necessary background for everyone
in the company to understand the logic of the system, enabling the engagement to the
initiative and its correct deployment.
The definition of measures should be followed by setting targets in order to evaluate
performance against a goal. Niven (2002) describes three types of targets. Long-term
goals are often described as BHAGs (Big Hairy Audacious Goals) and they represent a
monumental challenge that is used by the organization to stimulate progress. Midrange
targets normally apply to a wider variety of activities and do not represent discontinuous
operations. Nevertheless they establish a remarkable goal providing a powerful stretch
target for the organization. Finally, incremental targets are set on the short term (about
one year), and they give a quantitative goal for the decided measures and act as an early
warning in case there is a deviation from the future expected performance.
The Balanced Scorecard developed in the first term should be cascaded to lower levels of
the organization. This will create an aligned version of the BSC for each business area,
departments, projects and teams. Lower level Scorecards will often include issues related
to their specific challenges and opportunities within the area. For this reason is important
to involve employees from the areas that BSC relate to. The strategy should come from
the upper level of the BSC, but the adaptation should consider insights from the
employees. To achieve satisfactory results, an extensive communication programme is
needed to ensure employees fully understand the Balance Scorecard creation process and
the strategy defined in the Strategy Map (Niven, 2002).
Measuring Lean Construction
36
The lowest level where the Scorecard should be applied depends on the culture of the
company. Reaching personal measurement may have some drawbacks as the misuse of
the system as punishment base (Andersen & Fagerhaug, 2002). On the contrary, it may
help to define personal objectives for the career development of employees according to
their capacities.
Key Performance Indicators, KPI
A number of organizations have worked on elaborating a common set of Key
Performance Indicators within the construction industry (Beatham et al., 2004). However,
the first aspect to mention about the KPI is that they need to be part of a system. If the
results obtained do not lead to actions taken, it would make no sense to measure (Bourne
et al., 2000). The Egan report, Construction Best Practice Programme (CBPP), the ACE
consultants or the Construction Industry Research and Information Association (CIRIA)
have developed their own set of indicators, although their most significant problem is that
they do not offer the opportunity to drive actions (Beatham et al., 2004).
In this thesis, the model presented by Parmenter (2010) is taken as reference to explain
what Key Performance Indicators are and how they can be implemented. In order to
provide a common understanding of concepts, a set of definitions will be given first
followed by further discussion of concepts regarding the characterization of indicators.
Finally, the foundations and steps of the implementation process of KPIs will be
explained.
Definitions
Before explaining the details of Key Performance Indicators it is worth defining the basic
concepts that will appear to establish clearly the differences between the terms. This is
not a trivial question since different authors may use significantly different meanings for
similar concepts and this can lead to confusion. In this thesis, the reference that will be
used is the model from Parmenter (2010). Furthermore, the definitions will also try to
explain the relations of these terms to the ones used in other models also present in this
study.

Performance Measurement Frameworks
37
Key Performance Indicators, KPI
According to Parmenter (2010, p. 4), ‘KPIs represent a set of measures focusing on those
aspects of organizational performance that are the most critical for the current and future
success of the organization’. Some of their main characteristics from this definition are
that are non-financial measures, are frequently measured (monitored) and they encourage
appropriate action.
On the contrary of Parmenter, the definition provided by Radujkovic, Vukomanovic, and
Dunovic (2010) on the EFQM Model, KPIs are defined according to their ability to
change the outcome, separating measures in leading and lagging. Thus, they equate KPIs
to leading measures. This characterization will be further discussed in the next chapter.
Key Result Indicators, KRI
Often mistaken for KPIs, KRIs are measures from the outcomes of many actions
providing information about whether the company is going in the right direction. These
measures usually cover longer periods of time than KPI and are reviewed with less
frequency. The main difference between KRI and KPI is that Key Result Indicators
should be directed to take governance decisions, while management decisions should be
grounded in a mix of KPI, RI and PIs (Parmenter, 2010).
This definition is aligned with the Key Performance Outcomes (KPO) from the EFQM
Excellence Model, although this model does not consider a lower scale of Result
Indicators. At EFQM Model, KPO indicate only that are measures not able to affect the
outcome (Radujkovic et al., 2010).
Performance and Result Indicators, PI and RI
Performance and result indicators are those measures that while important, are not key to
business success. Rather they help teams to be aligned with the organization’s strategy
(Parmenter, 2010).
The question about the appropriate amount of indicators is complex and every author has
his own opinion. Parmenter (2010) collects the suggestion from Kaplan and Norton

Measuring Lean Construction
38
recommending no more than 20 KPIs, or Hope and Fraser suggesting fewer than 10. He
propose the 10/80/10 rule, meaning up to 10 KRIs, 80 RIs and PIs, and 10 KPIs. From
the 10 KPIs, Parmenter (2010) suggest continuous monitoring of 1 or 2 KPIs by
management.
Critical Success Factors
These are the main aspects of organizational performance that determine the ongoing
health of the company (Parmenter, 2010). This definition could be linked with the process
measures from Andersen and Fagerhaug (2002) model, which determines two types of
measures, result and process. Result measures focus on measuring achievements, while
process measures ‘describe certain important characteristics of a process and are
assumed to have an effect on the desired result’ (Andersen & Fagerhaug, 2002, p. 93).
The authors mention this separation as illustrating the difference between Western and
Japanese thinking. Western management culture typically emphasizes measurement
focused on achievements, while Japanese attitudes focus on improving the performance
of the process as the way to obtain the desired results.
Categorization of Indicators
One of the first question raised when introducing the concept of KPI is the categorization
of indicators. This categorization is usually made based on the ability of indicators to
provide direction for decision-makers. There has been identified three different
categorizations of indicators. The most common, adopted by many authors is the
definition of lagging and leading indicators (EFQM, 2012).
The EFQM Excellence Model, which will be explained later on, divides the indicators in
three types of measures. KPI, which indicates performance of associated processes and
can serve as an early warning, being identified as leading indicator because it provides an
opportunity to take corrective action. Key Performance Outcomes (KPOs) do not offer
opportunity to change since they are the result of a completed process. They are connected
with lagging measures given that the results from KPOs could only be used to change
how the next processes are carried out (Beatham et al., 2004). Finally, perception
measures can be leading or lagging depending on when the measure is taken. For
example, if customer satisfaction is measured at the completion of the project, it will be
Performance Measurement Frameworks
39
considered a KPO and thus a lagging measure. On the other hand, when customer
satisfaction is measured periodically along the development of the project, it would allow
corrective action and therefore being a leading KPI.
According to Parmenter (2010, p. 10), ‘lead and lag labels are not a useful way of defining
KPIs’ because is very often complicated to define whether an indicator is leading or
lagging. The same indicator can be seen as any of the perspectives depending on who is
assessing the indicator since it can actually be both of them. He propose to label the
indicators as past-, current-, or future focused measures. Current-focused measures are
those ones monitored continually, as for example current amount of delays in the
transport. Future-focused measures account for aspects where the action has not taken
place yet. An example of future-focused measures can be meeting programmed or date
for the next product launch. Past-focused measures refer to actions in the past.
Andersen and Fagerhaug (2002) proposed another classification according to the purpose
of the measures. They divided the measures in result, diagnostic and competence. Result
measures show what the company is achieving without specifying how it was achieved.
Diagnostic measures indicate future results, and they are indicators of success factors and
often show to some extent where to improve. Finally, competence measures define the
organizational position to meet future challenges. This classification also indicates a
validity horizon for the different measures, and it can fit together with Parmenters’
classification as illustrated in Figure 5, which combines both perspectives.
From my personal experience providing feedback to highly motivated students about their
creatively developed indicators in the performance oriented management subject, the
amount of indicators that can be discussed as leading or lagging depending on when they
are measured makes me consider that the Parmenter’s perspective is the one that can
provide the most clear difference among indicators. This perspective can be combined
with Andersen and Fagerhaug’s classification to provide full categorization of the
different measures.
Foundation Stones of KPI
This section collects the key aspects of implementing KPIs, including partnership with
key stakeholders, transfer of power to the front line, measuring only what matters and
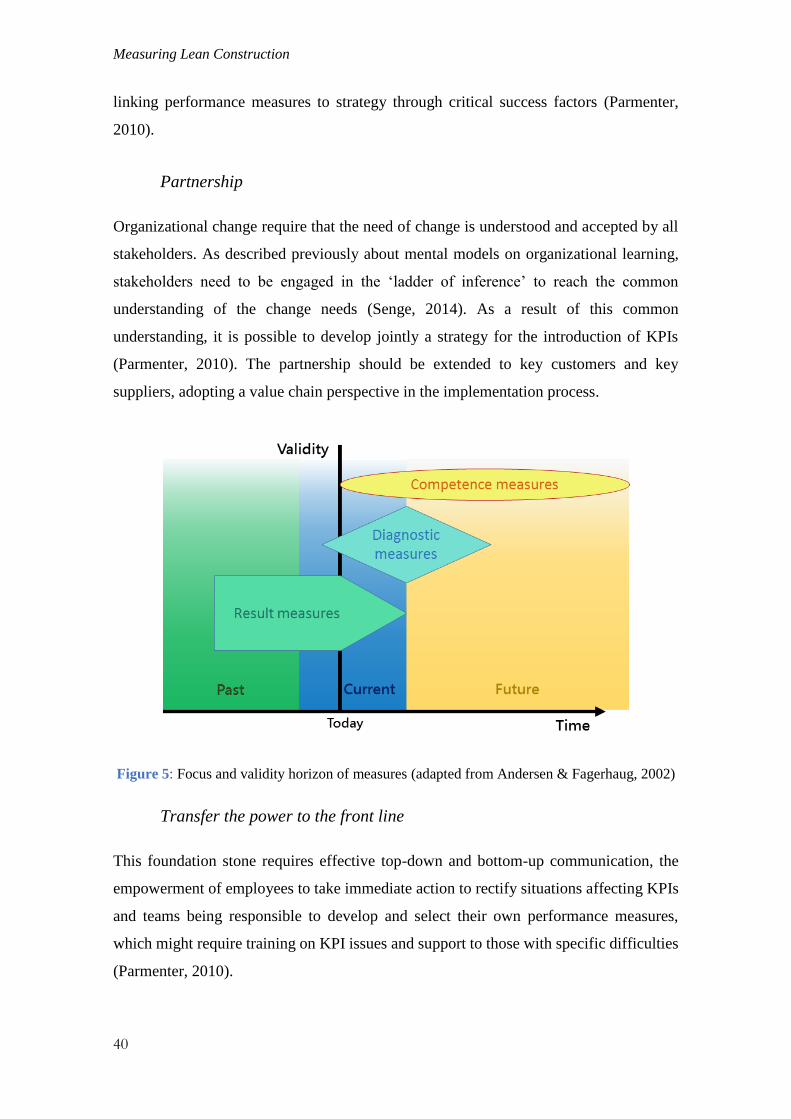
Measuring Lean Construction
40
linking performance measures to strategy through critical success factors (Parmenter,
2010).
Partnership
Organizational change require that the need of change is understood and accepted by all
stakeholders. As described previously about mental models on organizational learning,
stakeholders need to be engaged in the ‘ladder of inference’ to reach the common
understanding of the change needs (Senge, 2014). As a result of this common
understanding, it is possible to develop jointly a strategy for the introduction of KPIs
(Parmenter, 2010). The partnership should be extended to key customers and key
suppliers, adopting a value chain perspective in the implementation process.
Figure 5: Focus and validity horizon of measures (adapted from Andersen & Fagerhaug, 2002)
Transfer the power to the front line
This foundation stone requires effective top-down and bottom-up communication, the
empowerment of employees to take immediate action to rectify situations affecting KPIs
and teams being responsible to develop and select their own performance measures,
which might require training on KPI issues and support to those with specific difficulties
(Parmenter, 2010).
Performance Measurement Frameworks
41
Measuring only what matters
As mentioned before, a performance measurement system that does not lead to any action
is meaningless. ‘The performance should be measured in a way that results in action’
(Parmenter, 2010, p. 33). This implies that every report should be connected to a success
factor and it is measured only what is needed. If the amount of reporting is reduced it is
easier that the results of what is reported lead to an action. Therefore the reporting activity
should be adequate to the organization’s ability to take action on those reports.
Linking performance measures to strategy
Following the foundation of the Balanced Scorecard, Parmenter (2010) claims that the
KPIs should be linked to organization’s strategic objectives through its organizational
success factors, which should be at the same time linked to the balance scorecard
perspectives (including employee satisfaction and community and environment, as will
be explained next). Given the limited ability of an organization to handle a certain amount
of strategies at a time, there should be not more than eight critical success factors. As
presented by Andersen and Fagerhaug (2002), the house of quality can be a relevant
method to find the most appropriate success factors to focus based on the organization’s
strategy.
KPI Model
Parmenter (2010) makes use of the Balanced Scorecard model as the first reference, and
to the formulated perspectives (Financial, Customer, Internal Processes, and Learning and
Growth) he adds two more, Environment and Community, and Employee Satisfaction.
Environment and Community refers to the support of local businesses, future employment
and community leadership, while Employee Satisfaction is linked with positive company
culture, retention of staff and recognition as employer. The foundation for adding these
measures is that the community should be seen as the main source of future employees
and possibly partners and customers (Parmenter, 2010). Based on these perspectives,
Parmenter (2010) describes a 12 step model for the implementation of KPI, although
some of them can be merged. Table 1 shows the steps of the model, which will be
summarized next.

Measuring Lean Construction
42
Table 1: A 12 Step Model for Developing and Using KPIs (Parmenter, 2010)
Developing and Using KPIs
1. Senior Management Team commitment
2. Establishing a KPI Project Team
3. Establishing a ‘Just do it’ culture
4. Setting up a holistic KPI development strategy
5. Marketing the KPI system to all employees
6. Identifying organization-wide Critical Success Factors
7. Recording Performance measures in a database
8. Selecting team-level performance measures
9. Selecting organizational winning KPIs
10. Developing the reporting framework at all levels
11. Facilitating the use of KPIs
12. Refining KPIs to maintain their relevance
Step 1: Senior Management commitment. They need to create a sound environment in the
company for the implementation of KPIs, for which is necessary first to get them
convinced of the importance of monitoring KPIs. This means that they should be ready
to provide feedback on critical success factors and ensure support to build the report
systems. According to Parmenter (2010), it is especially important to involve the CEO
personally being a central driver. Moreover, this project requires a public relations
function behind to sell the implementation company-wide as a positive experience that
will improve working life. It is proposed to have a workshop with the Senior Management
Team to help the constitution of a KPI project that will cover the main institutional
barriers.
Step 2: Establishing a KPI project team. A small, well-trained project team formed from
two to four people reporting directly to the CEO should be established. The team should
be balanced and have linkages with the different business processes of the organization.
This team should receive appropriate training and be supported by the senior
management.
Performance Measurement Frameworks
43
Step 3: Establishing a ‘Just do it’ culture. The project team should adopt a culture in
which decisions are taken to avoid delaying the process. It should be assumed that the
system will not be perfect from the first time and will require certain adjustment. The
presence of an external facilitator can help to keep the decision-making process ongoing
while maintaining the process in-house.
Step 4: Setting up a holistic KPI development strategy. This means to draw an overall
strategy for organizational change to guide the implementation process, which will be
influence by organization’s size, diversity of business units and resources available. In
this step is necessary to be aware of the existing measurement culture and plan a phased
implementation that contributes to organizational change. Through this step, a coherent
approach should be achieved to get the commitment from all the stakeholders.
Step 5: Marketing the KPI system to all employees. The purpose of this step is to convince
employees about the need of change and attract their interest to participate reducing their
resistance. It is important to address at this time the employee’s concerns about the
system, as it could be used to allocate blame, and show the future benefits of the system,
as making work more rewarding and increased autonomy.
Step 6: Identifying organization-wide Critical Success Factors. Parmenter (2010)
suggests to first interview the senior management to collect all the success factors, to later
on dedicate a two-days workshop with part of the management and experienced staff to
decide the critical success factors and its relevant KPIs. Once a reduced set from five to
eight success factors has been identified, they would brainstorm to find the KPIs. After
wide consultation, these critical success factors will be explained to the employees. ‘If
staff are told what is important, they can align their daily activities to maximize their
contribution’ (Parmenter, 2010, p. 212).
Other models, such as the one described by Andersen and Fagerhaug (2002) have a
slightly different approach to find the KPI that is worth to mention. Their approach build
up KPIs from the business processes that better support the achievement of the strategy.
Therefore, it is necessary first to identify and map the processes and the expectations from
the different stakeholders defining the performance requirements. This results in a list of
business processes ranked by its relative importance regarding performance requirements.

Measuring Lean Construction
44
In this way, the process of defining key success factors is more structured although the
process of finding KPIs remain in both cases as an exercise of creativity. For this reason,
brainstorming is used in both cases for finding the KPIs.
Step 7: Recording performance measures in a database. This database should be made
available to all employees so the teams select the success factors relevant to them and
allowing input of new measures. Training to the teams about how to use the database and
refine performance measures should be provided. It is important that the database is
constantly updated with the attributes measured and it contains all the performance
measures connected to the success factors.
Step 8: Selecting team-level performance measures. The KPI project team should provide
information to all teams on how to select their own performance measures aligned with
organization’s critical success factors. It should be encourages to use a mix of past-,
current-, and future-looking measures. It will be necessary to categorize the selected
measures according to the time horizon and result or performance indicators. When these
indicators are related to several scorecard perspectives and are common to a number of
teams, they can be considered as KPI or KRI. Teams should be allowed to evolve the
measures agreed, as it will often take some refinement to achieve the perfect set of
performance measures. This step can help to clarify team’s objectives and feel the
ownership of the performance measures.
Step 9: Selecting organizational winning KPIs. After the selection of indicators have had
certain progress, is time to start developing organizational KPIs. This is an iterative
process in which findings are communicated up and down to ensure the cascading
relationship of measures. This approach is a clear example of empowering the front line
of the organization. Critical success factors found in step 6 should also influence the
definition of KPIs. Once KPIs are defined, they should be tested to ensure that they
produce the expected behavioural outcomes, resulting in an effective set of balanced KPI,
KRI, PI and RI.
Step 10: Developing the reporting framework at all levels. The reporting framework
should support the timely decision-making, for which a hierarchy of reports and
empowerment of staff is required to take action when issues affect the KPIs. The

Performance Measurement Frameworks
45
frequency of measurements’ reviews is critical in this aspect, and should not rely
completely on regular meetings because it would not allow taking immediate corrective
action. Parmenter (2010) emphasizes the role of the CEO when there is a deviation in the
KPI that are being monitored and he claims that the CEO should ask for information about
the causes of the deviation to encourage the corrective actions.
Step 11: Facilitating the use of KPIs. Once adopted the KPIs, it is important that they are
incorporated into organization’s culture to avoid its failure when key personnel move on.
The company should dedicate resources to communicate the system and educate in the
measurement culture. Measures should allow comparing against other organizations, thus
some measures relative to competitors are encouraged. Another aspect of the use of KPIs
is the need of establishing certain targets for the measures. However, it is more beneficial
to establish an acceptable range rather than a specific target, since the range can be more
tolerant with changes in the environment.
Step 12: Refining KPIs to maintain their relevance. The improvement process will need
to change priorities areas as previous focus areas are mastered. Some KPIs will be always
maintained due to their relevance to success factors. At the same time, critical success
factors should be reviews periodically especially in changing environments. This process
will enable continuous improvement and will ensure that the KPIs are always aligned to
organization’s strategy and its environment.
Final notes on the KPI Model
As it is being explicit, KPIs are not a model in itself and looking for these measures
without certain preparation and being part of an analytical process will not lead to
performance improvement. Furthermore, creating a set of KPI is not a trivial question and
will need an iterative process to find a balanced set of indicators. As important as finding
these indicators is the implementation process. The team ownership of measures and the
communication of critical success factors is essential for aligning employees’ behaviour.
Moreover, the measures should allow taking action at operational level while being
reported to management in case of KPIs for following up performance with the required
frequency. Finally, the periodic update of the system and its integration in the
organization’s culture is a ‘must’ to ensure the future relevance of the system.
Measuring Lean Construction
46
EFQM Excellence Model
EFQM stands for European Foundation for Quality Management and it is an initiative
born in 1991. The purpose was to provide a model for self-assessment of organizations
based on Total Quality Management principles to achieve continuous improvement of
practices. It is a general model intended for all kind of organizations, business and
governments (Gasparík, Gasparíková, & Ellingerová, 2014). The EFQM can be compared
with similar initiatives such as the Baldrige Performance Excellence Program from USA,
and the Japan Quality Award Council.
Fundamental concepts
There are a number of concepts defining the basic attributes of an excellent organization,
which are described on EFQM (2012). This means that these attributes contribute to
achieve outstanding levels of performance according to stakeholders’ expectations.
Among the stakeholders, customers should have a privilege position when analysing their
needs since they are the objective of most of adding value activities in the organization.
Creativity and innovation are basic steps for increasing value and performance, which
requires engaging other stakeholders throughout the value chain.
Excellent organizations should increase their capabilities while being sustainable in terms
of economy, environment and social conditions. This requires a leadership founded in
long-term vision, integrity and responding effectively to opportunities and threats.
Creating a culture of empowerment is key for achieving both organizational and personal
goals, which at the same time will contribute to sustain the outstanding results in
organization’s operational environment (EFQM, 2012).
EFQM Model
Vukomanovic, Radujkovic, and Nahod (2014) claim that the main purpose of the model
is to assess company’s excellence by identifying deviations from best practice according
to nine criteria. These are divided into enablers and results. Enablers indicate what the
organization does and how it does it, while results cover the organization’s achievements.
Each criteria is weighted for a final score. Some authors suggest that these weights would
need to be adapted in the construction industry (Vukomanovic et al., 2014). However,

Performance Measurement Frameworks
47
this would eliminate the possibility of benchmarking between industries, missing one of
the main benefits of the model.
Figure 6: The EFQM Excellence Model
Enablers
Starting by the enablers, leaders of excellence organizations establish a clear vision of the
organization in its context and they instil the values and the culture. As well they should
act as role models of integrity, social responsibility and ethical behaviour. Their core tasks
is the communication of vision, mission, values and culture effectively and they also act
as agent of change promoting and driving the change.
‘Having decided on its policy and strategy and ensured that its people, resources and
partnerships are capable of supporting them, it then defines its processes which will
deliver its customer results and its own key performance results. In delivering these
results it also affects the employees (people results), and also the society in which sits
(society results).’ (Beatham et al., 2004, p. 100)
Through the strategy is defined the future direction of the company, which need to be
communicated throughout the organization while making it relevant to the people by
cascading down to reach specific objectives related to teams and individual tasks. The
EFQM Excellence Model provides a specific sheet for the assessment of the strategy and
suggest a number of tools for stakeholder identification and communication of strategy.

Measuring Lean Construction
48
The affirmation that people is often the most important resource that an organization has
is used in the model to inspire the need of planning, managing and improving people’s
knowledge and competence within the company. This should be done according to what
the organization wants to achieve, which is described in the strategy. Other aspects are
the need of choosing the right people considering not only their qualifications but also
their attitude, and develop the competence through training, self-learning or mentoring
programmes. Empowering people through team building and expanding people’s
horizons can bring more flexibility and robustness to the organization against unexpected
events (EFQM, 2012).
If this is applied to external partners can be an effective way to support the organization’s
strategy. These relationships should be built based on mutual trust, respect and openness.
By attracting the appropriate partnerships, additional added value can be provided to the
organization by reducing time-to-market, facilitate innovation and technology use or
reducing costs.
Process, product and services enabler is based on the idea that the organization’s business
model is defined in terms of core capabilities, processes, partners and value proposition.
Identifying stakeholders’ needs helps to define the key processes, which should be
mapped in a model. This will help to identify the critical success factors and establish
adequate measurement to monitor and improve the overall performance. The model
provide some clues for this process, although more detailed description of tools for
process mapping can be found in (Andersen & Fagerhaug, 2002).
Results
The first element when analysing the results is the customer, which is the one that assess
the quality of the product or service. Excellence organizations invest resources in
understanding customer requirements, which should be delivered by establishing
adequate processes. Customer results are the reported outcome of these processes.
The EFQM model provides a classification of indicators dividing them into leading and
lagging, and it separates Customer Results according to this categorization, containing
customers’ perception of the organization the majority of lagging indicators.

Performance Measurement Frameworks
49
Performance indicators are internal measures used to monitor, understand and predict
performance for the organizations’ external customers. The measures of customer results
should cover a wide extent of organization’s functions, locations and products without
neglecting important aspects of its offerings. The EFQM model mention that effective
organizations establish specific targets to specific indicators and analyse trends to ensure
sustainability rather than short-term results. The use of benchmarking under an
appropriate methodology may have a significant effect on the improvement of customer
related processes (EFQM, 2012).
Based on the previously mentioned importance of the people as a major resource for the
organization, it can be argued that people without job satisfaction in terms of motivation
and commitment cannot provide the customers with expected service. For this reason, the
company has to make available the facilities, tools and techniques to do their job properly
as well as to satisfy the employees’ concerns both in the short-term and in their career
development.
The model includes two type of measures about their employees according to EFQM
(2012). First, perception measures seek to find out how people in the organization feel
about themselves, their job and the organization. The assessment can be based in factors
like motivation and satisfaction, being necessary to understand the importance of the
issues measured. Second, performance measures on the employees are categorized into
five sections including engagement, competency, leadership, career development and
internal communication. Nevertheless, the most important fact about measuring people
results is to provide them feedback, which can be used as a basic tool for getting them
involved in organization’s goals.
The EFQM model extends the definition of excellence to conduct the business ethically
and having a positive impact with the different groups of the society. Social and
environmental issues are increasingly considered from the customer and are able to bring
real value to shareholders.
Society results start by developing a strategy that includes the management of
organization’s relationship with the different actors in the society. Making the approach
to society and environment explicit, gives already a strong message to stakeholders.
Measuring Lean Construction
50
Similarly as in previous results measurement, the perception of the organization and the
performance indicators are the two basic elements. These measures are used to quantify
the degree of deployment of policies and assess the improvement efforts among
organizations (EFQM, 2012).
The business performance results make use of Pareto principle, also known as 80/20 rule,
in order to reach the highest impact with the appropriate effort and resources. This should
be applied in the first term to what should be measured delivering the Key Performance
Results, emphasizing that the business outcomes go further than merely financial results.
The EFQM model suggest that the perspectives from the Balanced Scorecard more linked
to business results are internal processes and learning. The previous results are collected
in a rigorous scoring framework named RADAR scoring matrix, which will be explained
next.
The RADAR logic
The previous criteria described are the areas where the organization have to perform in
order to reach excellence. The question comes on how to evaluate those criteria, and it is
answered with RADAR logic. It states the need of the organization to determine the
Results that are aiming to achieve according to its strategy. It also needs to plan and
develop the required Approaches to deliver those results, and Deploy them in a systematic
way. Finally, the organization needs to Assess and Refine the approaches by monitoring
and analysing the results (EFQM, 2012).
Enablers are assessed according to the approaches that have been adopted and how they
were deployed throughout the organization. Then, the organization should assess the
efficiency and effectiveness of these approaches and refine them in case of improvement
is needed. On the other hand, results are evaluated based on their relevance to the
organization’s strategy and to what extent they reflect the progress of the key objectives.
Moreover, the actual performance of these results should be assessed in terms of trends,
targets, comparisons and causes. Finally, the RADAR logic is a cyclical model that serves
as platform for continuous improvement processes and the way to develop capabilities
and sustain excellence (EFQM, 2012).
Performance Measurement Frameworks
51
Final notes on the EFQM Excellence Model
The EFQM Excellence Model is a very extensive framework that comprises a very
structured sequence to find the most relevant KPI for each organization in every industry.
The model includes a set of five different approaches to self-assessment depending on the
level of maturity of the excellence model within the organization (Beatham et al., 2004).
The benefits obtained from the model are mentioned by Vukomanovic et al. (2014), being
the first one that companies found EFQM easier to use than other models. Its immediate
benefits are benchmarking opportunities, continuous improvement and employees’
engagement. It has also a component of marketing strategy, internal regarding a common
approach to improvement across the company, and external having a positive impact on
how the organization is perceived. Long-term benefits account for reducing costs, balance
short- and long-term investments and develops a holistic approach to quality issues.
Gasparík et al. (2014) describes the problems found in the application of the model after
studying the implementation process in the construction industry. The main criticism of
the model is that although it seems simple to understand, its application is a complex,
time-consuming process, often needing the use of qualified external consultants. At the
lower levels of the model, the EFQM contains a series of sub-criteria requiring a very
detailed description of the functioning of the organization, and they are often
misunderstood by the management. Other criticism is that the whole process is too
bureaucratic, which makes organizations fail to record the results despite of being
sufficiently accomplished. Furthermore, the incorrect definition of processes and results
in the report delivered to EFQM professionals may result in a low score, whilst might be
an otherwise successful organization. Vukomanovic et al. (2014) also mention among its
criticism the inability to connect with organization’s strategy and weak relationship
between causes and consequences in business processes.
The involvement of Norwegian companies as EFQM members is very low, with only one
representative and the construction industry in general has also a unique representative,
although consultants groups are very widely represented and they could have direct
involvement in the construction industry.
Measuring Lean Construction
52
Summing up, the EFQM Excellence Model brings the possibility of benchmarking among
all kind of industries and sectors, which is not a trivial question. It is also a very solid
framework, developed by experts in close cooperation with different partners in the
European industry. Hence it worth to be considered as a reference for developing other
purpose-specific measurement frameworks considering its benefits and limitations.
Lean Six-Sigma
The last framework that will be considered is named Lean Six-Sigma. As a difference
from the previous frameworks, this is not focused on the elaboration of indicators to drive
the continuous improvement. Lean Six-Sigma is rather centred on the detailed analysis of
processes and customer needs to identify the waste and allocate the possibility of
improvement. Moreover, current experiences with Lean Six-Sigma have been on
manufacturing industries, retail and services. For this reason, the achievements on
reducing cycle times are often associated to cost reductions, which is very significant after
a threshold of cycle time (M. O. George, 2010). In order to achieve those benefits, it is
necessary a careful prioritization and selection of projects in the application of Lean Six-
Sigma. The advantage of LSS is that provides the ability to cost reduction without
decreasing the ability to meet customer needs (M. O. George, 2010).
In order to better understand how Lean Six-Sigma works, the value proposition of the
model will be explained, including the reasons for mixing these methods together. Once
these aspects are understood will be possible to reach a conclusion about the hypothetical
use of Lean Six-Sigma in construction.
The Lean Six-Sigma value proposition
The Lean Six-Sigma principle can be described as follows:
‘The activities that cause the customer’s Critical to Quality issues and create the
longest Time Delays in any process offer the greatest opportunity for improvement
in Cost, Quality, Capital and Lean Time’. (M. L. George, Rowlands, & Kastle,
2006, p. 2)
Based on this principle, LSS is able to provide answers about the priorities for improving
processes, and to what extent can these processes be improved according to the biggest
Performance Measurement Frameworks
53
opportunities for enhancement. LSS is also able to link improvements in quality, process
speed and lead time with shareholder value, making easier decisions of capital
investments on LSS projects (M. L. George et al., 2006).
If Lean is considered on its own, it will be possible to achieve better cycle efficiency by
removing ‘waste’ in Lean terminology. ‘Lean means speed’ (M. L. George et al., 2006,
p. 39). However, by using only Lean is not possible the statistical control of processes.
Six-Sigma is a management system based on measuring process capabilities in order to
achieve top performance that benefits business’ customers and shareholders. Nonetheless,
Six-Sigma alone does not allow dramatic improvement of process speed. By setting
together Lean and Sig-Sigma, LSS provides a ‘methodology that maximizes shareholder
value by achieving the fastest rate of improvement in customer satisfaction, cost, quality,
process speed and invested capital’ (M. L. George et al., 2006, p. 6).
Use of Lean Six-Sigma
When a new methodology is presented it exists the risk that organizations do not spend
time considering the purpose of its implementation, and it is possible that these methods
are not suitable to all type of problems in all situations (M. O. George, 2010). LSS is not
designed to answer strategic questions and requires a specific problem to be addressed.
M. O. George (2010) presents some situations where LSS is not recommended for several
reasons. It requires an important amount of resources in training and analysis of problems,
and it is only solve problems related to improvement of processes. When a reasonable
potential solution is found, it is recommended to establish a project to implement that
solution and verify its effectiveness. In contrast, M. O. George (2010) claims the validity
of LSS under unclear problem’s reasons or challenging goals linked to business priorities.
Although Lean Six-Sigma has been tested in different industries such as manufacturing,
retail and services (M. O. George, 2010), its application on the construction industry is
scarce (Raid, 2012). Its use for improving production planning in residential construction
is an example (Beary & Abdelhamid, 2005). Although LSS implementation has an impact
on speed, production planning and control receive the greatest benefits (Drohomeretski,
Da Costa, De Lima, & Garbuio, 2014). Since the problem in these areas in construction
have been sufficiently addressed by practices such as Last Planner, it is preferable to avoid
greater use of resources. Also, its impact can be limited due to the project based context.
Measuring Lean Construction
54
Summary of the chapter
Four different frameworks are selected based on their relevance both in the industry and
in the literature, and because they are used to develop the model resulting from the thesis.
The Balanced Scorecard was introduced by Kaplan and Norton with the aim to facilitate
the implementation of the strategy in organizations through a performance measurement
system. The key contribution from this model is the ability to communicate the strategy
through the organization articulating the clear objectives from the strategy (Strategy
Map). Then, the indicators are defined according to four perspectives: financial,
customer, internal processes and learning and grow.
Key Performance Indicators focus on the generation of meaningful indicators for the
organization. The framework defines and differentiates between concepts such as key
performance indicators, key result indicators or performance and result indicators. Then,
they are categorized according to their time horizon (past-, present- and future-focused
indicators). The model explains the steps for developing and using the KPIs. Its limitation
is that it is not linked to other parts of the organization and neither defines a framework
for benchmarking. However, it can be of great utility when generating the indicators.
The EFQM Excellence Model is a self-assessment tool based on TQM principles. It
contains two branches, enablers (providing the context to introduce core values and
culture) and results (analysing the outcomes and their impact on customers, people,
society and business results). The RADAR logic provides an evaluation framework to
deliver the continuous improvement. The benefit of using the EFQM model is that
provides a base for inter-sectorial benchmarking.
Lean Six-Sigma is centred on the analysis of processes and customer needs to identify the
waste and allocate the possibility of improvement. Its implementation is often limited to
manufacturing because of the use of statistical methods for assessing the process that has
been more restricted in other industries due to the great amount of resources required.
However, this model brings some important concepts as the association Lean-speed and
Six-Sigma-statistical control as well as a powerful tool for identifying improvement gaps.

Chapter 4:
Performance Measurement
Research and
Organizational Change
This chapter is divided in two parts. The first part presents the performance measurement
frameworks developed by the academia for specific purposes, which are often derived
from the previously presented generic models. They are important for the development
of this thesis because they point out what aspects are central in the construction industry
and they present a number of indicators that could be used in the resulting model of the
thesis. This section covers the detailed literature review on purpose-specific measurement
frameworks and KPIs for the construction industry, which I chose to present in a table
format for ease comparison. In order to show the evolution of project success factors
towards construction-specific factors, I will present a chronological overview of these
success factors, which can help finding appropriate project metrics.
The second part of the chapter includes organizational factors related to the
implementation of new methodologies within companies. Although the complete
implementation is out of the scope of the thesis, it may have a large impact in the design
of the measurement model. The challenges in the implementation of Lean and
measurement systems are documented and a mental model is described as an explanation
of how individuals can change their attitudes, which will be a relevant argument in the
discussion.
Measuring Lean Construction
56
Performance Measurement Research
The most common performance measurement and management frameworks have been
presented in the previous chapter. These are the most popular and more often founded in
the organizations. On the other hand, every framework require certain adaptation during
the implementation process to fit the organizational needs and it could even be argued
whether ‘generic’ frameworks actually exist (Andy Neely et al., 2005). In the following
pages a thorough review of the literature will show some of the alternative frameworks
and key performance indicators outlined by the academia attending specific needs
depending on the industry, environment, stakeholder position or project phases focus.
Frameworks
The academia has developed a number of performance measurement frameworks in a
variety of forms. Although some of them are derived from the Balanced Scorecard or the
EFQM Excellence Model, there are some frameworks that are independent of these
models. Another difference can be made between generic and industry specific
frameworks, being the latest more common. This can be an attempt from the academia to
make general frameworks easier to understand or attending specific needs. The extension
of the frameworks it also fluctuates, acknowledging the challenge of developing specific
key performance indicators valid for a wide range of organizations, unless the purpose of
the framework is narrowed. Following are presented some of the frameworks found in
the literature, making special emphasis on those related to the construction industry.
Kagioglou et al. (2001) presented a generic measurement framework based on the
Balanced Scorecard adding two perspectives, project and supplier. This framework is
represented by the input (the strategy), process (the deployment of the strategy according
to the BSC perspective plus project and supplier) and output (the metric or result of the
measurement) of the performance management process.
Other relevant framework is the performance prism created by A. Neely et al. (2002). It
is a generic framework integrated by five perspectives comprising stakeholder
satisfaction, stakeholder contribution, strategies, processes and capabilities. The system
consider four fundamental processes for its deployment: design (concerned with what and

Performance Measurement Research and Organizational Change
57
how to measure), plan and build, implement and operate, and refresh to remain relevant
for the organization.
Beatham, Chimay, Tony, and Ian (2005) explain the implementation process of an
integrated business improvement system. The authors deploy an implementation
framework making use of the most common frameworks presented in the previous
chapter and KPIs developed by leading organizations. The conclusions drawn emphasizes
the use of the EFQM Excellence Model while pointing specific issues to ensure the
successful implementation.
H. Bassioni, Price, and Hassan (2004) created a measurement framework for internal
management purposes. They identified a number of gaps from previous models including
the interaction between new performance measurement frameworks and existing systems
and the difficulties adopting target- and standard-settings of measures. Limited research
was found on validity of aggregation methods and change management as part of the
implementation process. Moreover, obsolete measures are rarely detected due to static
performance measurements systems and it was also identified the need of transforming
the measurement system into management system.
Additionally, the construction industry would need to face specific gaps such as the
limited research on learning from previous implementation processes and the
measurement of soft issues. They also claimed that the design of measures specific to
construction industry had not been well addressed and further research was also needed
on measuring the strategy deployment. With the objective to address these gaps, a
theoretical framework is presented and tested in H. A. Bassioni et al. (2005). Similarly to
the EFQM Model, the management of driving factors and the achievement of
performance results are the two main processes underlying the framework. Specific
criteria for this Construction Excellence Model can be found in H. Bassioni, Hassan, and
Price (2008) as will be presented below.
Cheung, Suen, and Cheung (2004) considered a framework based on eight critical
categories of performance including people, cost, time, quality, safety and health,
environment, client satisfaction and communication. They emphasized the use of web
tools to develop a database system facilitating the data collection and access to

Measuring Lean Construction
58
information processes. For this framework they considered a number of KPIs based on
consultancy and official reports on construction KPIs. Similarly, Yeung, Chan, and Chan
(2009) developed a computerized performance measurement system, although they
focused on benchmarking projects based on seven weighted KPIs.
Other authors have developed specific frameworks to attend relevant aspect of the
construction industry. Wegelius-Lehtonen (2001) introduced a two-dimensional
framework for measuring construction logistics. The measures were grouped in
improvement measures, which aimed to find out the present logistical performance level,
and monitoring measures, used to screen and control the operations. The framework
classify the measures based on two factors: the use of the measure according to the
mentioned improvement or monitoring purpose; and the focus of measure at different
levels of the organization distinguishing between company or project level and specific
subcontract or material.
Other developed frameworks were focused on the design process. Kristensen et al. (2013)
created a complete framework for measuring performance in the design phase of
construction projects. This framework include specific indicators to be used, explaining
the importance of the measure and how and when should be measured, and a proposal for
the reporting method using scoreboards.
These frameworks address the question of how the key performance indicators should be
elaborated, or which areas should focus on. However, not all of them include a set of
specific indicators to measure. This aspect will be covered next to provide a complete
overview of the performance measurement literature.
Indicators
Several authors have developed frameworks and methodologies in order to define suitable
indicators in several industries (Andy Neely, Richards, Mills, Platts, & Bourne, 1997;
Thor, 2008; Vernadat, Shah, Etienne, & Siadat, 2013) while others have preferred not to
focus in any particular industry creating generic frameworks (A. Neely et al., 2002; Andy
Neely, Adams, & Crowe, 2001). Although some of the models presented previously do
not include the KPIs to be used, it can be found in the literature many other authors that
have cover this issue trying to look for appropriate indicators in the construction industry.
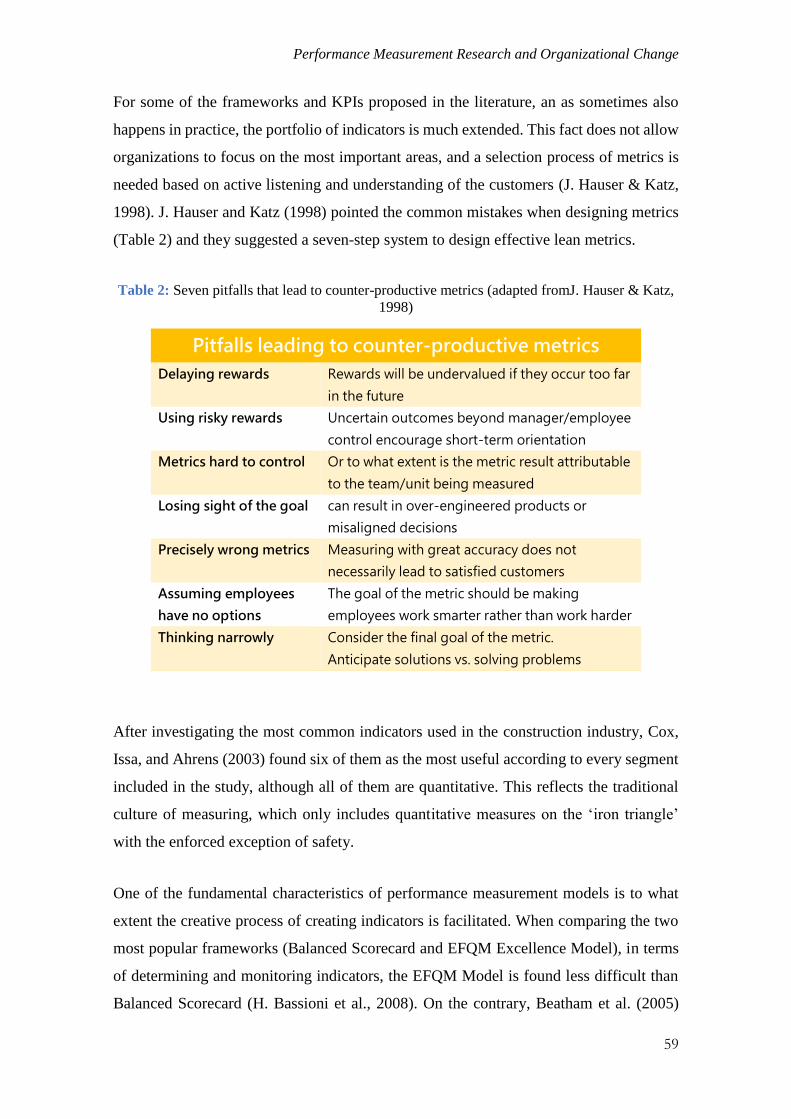
Performance Measurement Research and Organizational Change
59
For some of the frameworks and KPIs proposed in the literature, an as sometimes also
happens in practice, the portfolio of indicators is much extended. This fact does not allow
organizations to focus on the most important areas, and a selection process of metrics is
needed based on active listening and understanding of the customers (J. Hauser & Katz,
1998). J. Hauser and Katz (1998) pointed the common mistakes when designing metrics
(Table 2) and they suggested a seven-step system to design effective lean metrics.
Table 2: Seven pitfalls that lead to counter-productive metrics (adapted fromJ. Hauser & Katz,
1998)
Pitfalls leading to counter-productive metrics
Delaying rewards Rewards will be undervalued if they occur too far
in the future
Using risky rewards Uncertain outcomes beyond manager/employee
control encourage short-term orientation
Metrics hard to control Or to what extent is the metric result attributable
to the team/unit being measured
Losing sight of the goal can result in over-engineered products or
misaligned decisions
Precisely wrong metrics Measuring with great accuracy does not
necessarily lead to satisfied customers
Assuming employees
have no options
The goal of the metric should be making
employees work smarter rather than work harder
Thinking narrowly Consider the final goal of the metric.
Anticipate solutions vs. solving problems
After investigating the most common indicators used in the construction industry, Cox,
Issa, and Ahrens (2003) found six of them as the most useful according to every segment
included in the study, although all of them are quantitative. This reflects the traditional
culture of measuring, which only includes quantitative measures on the ‘iron triangle’
with the enforced exception of safety.
One of the fundamental characteristics of performance measurement models is to what
extent the creative process of creating indicators is facilitated. When comparing the two
most popular frameworks (Balanced Scorecard and EFQM Excellence Model), in terms
of determining and monitoring indicators, the EFQM Model is found less difficult than
Balanced Scorecard (H. Bassioni et al., 2008). On the contrary, Beatham et al. (2005)

Measuring Lean Construction
60
claim that all business management teams in their study were familiar with the Balanced
Scorecard, and they expressed that less understanding was required to use BSC
effectively compared to the Excellence Model. This contradiction emphasized the
uniqueness of organizational needs, hence the purpose-specific requirements of
performance indicators.
Beatham et al. (2004) performed an excellent review of KPIs used in the construction
industry collecting information from the most relevant organizations in the UK, as for
example the Construction Best Practices Program (CBPP), the Association of Consulting
Engineers (ACE) or the Construction Industry Research and Information Association
(CIRIA) among many others. Also in the construction industry, H. Bassioni et al. (2008)
evaluates the criteria and sub-criteria of a Construction Excellence Model based on
EFQM and concludes with a set of weighted criteria.
Chan and Chan (2004) reviewed the success factors in construction projects and
concluded with a set of KPIs for assessing success. They divided the measures between
objective, including those related to time, cost or safety and environment rates, and
subjective, such as quality, functionality or different stakeholders’ satisfaction.
Other attempts of finding the right KPIs in construction provide specific tools to collect
data and reporting possibilities by using computerized systems. Among them, Yeung et
al. (2009) and Cheung et al. (2004) developed different systems including a specific set
of indicators to monitor, control and benchmark construction projects.
In some cases, there has been identified the need of developing measurement models for
specific purposes or focused in certain phases of the project. Some examples can be found
in Wegelius-Lehtonen (2001), who focused on supply chain performance in construction
projects, or Kristensen et al. (2013), whose performance system is centred on the design
phase.
In order to facilitate the comparison among the frameworks proposed by the academia, I
have developed a table where the different attributes of models are presented (see Table
3). I have classified the overview based on the authors and the framework in which they
are based (indicating ‘other’ when they have developed their own framework), the

Performance Measurement Research and Organizational Change
61
industry where they are focused on, and whether they are addressing any particular
purpose. In the table I describe what it can be found in their frameworks, differentiating
if they specify perspectives to cover when finding the indicators, criteria to be taken into
account or providing the indicators to be used.
One of issues that I have detected is the large amount of indicators that comprises some
of the frameworks reviewed. In this regard, there have been also some attempts in finding
an appropriate method for aggregating indicators (Lauras, Marques, & Gourc, 2010). This
kind of initiatives follows the direction pointed by other authors, who had claimed that
more research was needed in this area (H. Bassioni et al., 2004).
As it can be observed from the number of indicators proposed, developing the right
indicators is not an easy task. Although the ones showed in this section can serve as
inspiration, unless the framework is very specific in its purpose cannot provide a complete
set of indicators appropriate for every organization. Another source for developing sound
indicators are the project’s success factors.
Success Factors in Projects
In the way to look for the most appropriate indicators to anticipate the success of a project
in the construction industry, it worth to look at the literature that has been discussing
projects’ success factors for more than three decades. My aim is to review the evolution
of the success perspectives over time that could provide trends over time and reveal what
aspects are the most relevant in current construction projects.
In Table 4 I show a complete review of the main concepts developed in the success
factors’ literature. By elaborating this table, I have identified the main trends during the
last decades in the search of project success factors from the academia. The findings can
help to evaluate the significance of implementing a purpose-specific performance
measurement system and support the generation of relevant indicators.

Measuring Lean Construction
62
Table 3: Overview of performance indicators
Authors
Neely et al.
(2001)
CBPP, The Egan
report (targets)
Association of
Construction
Engineers (ACE)
Respect for
People
Construction
Industry Research
and Information
Association
(CIRIA)
MCG
Benchmarking Club
Design Quality
Indicator (DQI)
Framework Performance
Prism
KPI KPI KPI KPI KPI KPI
Industry Generic Construction Construction Construction Construction Construction Construction
Orientation Stakeholders Generic Generic Employees Design Generic Product value
Type Perspectives Indicators Perspectives Indicators Criteria KPIs Perspectives
Criteria/
Indicators
Stakeholder
satisfaction
Stakeholder
contribution
Strategies
Processes
Capabilities
Headline:
Client satisfaction
- product
- service
Defects
Predictability
- cost
- time
Profitability
Productivity
Safety
Construction cost
Construction time
Operational and
diagnostic
indicators can be
found in (DETR,
2000)
Client satisfaction -
product
- service
Defects
Predictability
- cost
- time
Profitability
Productivity
Safety
Construction cost
Construction time
Client satisfaction
- overall perf
Value for money
Quality
Time delivery
Health and safety
awareness
Training
Productivity
Profitability
Employee
satisfaction
Staff turnover
Sickness absence
Safety
Investors in
people
Working hours
Pay
Training
Diversity
Travelling time
Understanding
client needs
Design process
Integration of
design with SC
Internal cost/time
management
Risk
Re-use of design
experience
Innovation
Client/user
satisfaction
Mobilisation period
Extension of time
index
Predictability
- start on site
- construction time
- time
- practical completion
- construction costs
Final account index
Certificate of making
good defects
Change orders
- co value/weeks to
date
- co value/contract
cost
No. snags at practical
completion
No. defects during
defects liability
period
Accident frequent
ratio
Build quality
Functionality
Impact

Performance Measurement Research and Organizational Change
63
Table 3 (cont.): Overview of performance indicators Authors
H. Bassioni,
Hassan, and Price
(2008)
Cheung, Suen,
and Cheung
(2004)
Yeung, Chan, and
Chan (2009)
Kristensen et al.
(2013)
Chan and Chan
(2004)
Cox, Issa, and
Ahrens (2003)
Wegelius-
Lehtonen (2001)
Framework EFQM Other Other Other KPI KPI Other
Industry Construction Construction Construction Construction Construction Construction Construction
Orientation Contractors Web-based Web-based Design Generic Generic Supply Chain
Type Criteria
Perspectives +
indicators KPIs
Indicators +
measure + report KPIs KPIs Criteria
Criteria/
Indicators
Leadership
Customer focus
Other stakeholder
focus
Information and
analysis
Strategic mngmt.
Intellectual capital
management
People mngmt
Partnership and
supplier mngmt
Resource mngmt
Risk mngmt
Process mngmt
Work culture
Project perf
Organizational
performance
Internal
stakeholder
performance
External
stakeholder
performance
People
Cost
Time
Quality
Safety and health
Environment
Client satisfaction
Communication
Specific indicators
can be found in
(Cheung et al.,
2004)
Time performance
Cost performance
Management
commitment
Quality
performance
Trust and respect
Effective
communication
Innovation and
improvement
Punctuality
participation
PPC
RFI (request for
information)
Proofing
Time consumption
Successful
alternatives
Changes in brief
Completeness and
conformity
Total cost
Client satisfaction
Collaboration
Environment
management
How to measure
and report
suggestions can be
found in
(Kristensen et al.,
2013)
Construction time
Speed of
construction
Time variation
Unit cost
Percentage net
variation over
final cost
Net present value
Accident rate
Environment
Impact
Assessment
(EIA) scores
Quality
Functionality
End-user's
satisfaction
Client's
satisfaction
Design team's
satisfaction
Construction
team's
satisfaction
Units/MH –
number of
completed units
per individual
man-hour of
work
$/Unit –
dollar value
associated with
each completed
unit
Safety
Total cost
On-time
completion
Quality
control/rework
Activity and cost
analysis (ABA)
Accuracy and
delivery time
analysis (TBA)

Measuring Lean Construction
64
The first attempts looking for the projects’ success factors prior to and during the ‘80s
were, with some exceptions, vague and lacked extensive data collection although their
approach was to find success factors applicable to all projects (Baker, Fisher, & Murphy,
1974; Pinto & Covin, 1989). Their main findings consisted on a complete set of success
factors and their evolution along the project phases.
A group of researchers developed during the ‘90s a multidimensional model to assess
project success. During this period, they switched from looking for universal to project-
specific success factors (Dvir, Lipovetsky, Shenhar, & Tishler, 1998; A. Shenhar, Levy,
& Dvir, 1997). The dimensions considered were efficiency, impact on the customer,
business success and prepare for the future, having a list of success factors within each
dimension. These elements were popularized under ‘one size does not fit all’ approach
(Aaron J. Shenhar, 2001) and other frameworks assessing success as a function of the
technological uncertainty and complexity of the project (Aaron J. Shenhar, Dvir, Levy,
& Maltz, 2001).
From the 2000s increased the emphasis on the projects’ influence on business success and
how they contribute to adapt to a changing environment (Abraham & Chinowsky, 2003;
Udechukwu, Johansen, & Greenwood, 2008). At this time were introduced industry-
specific frameworks attending the call for project-specific approaches. Chan, Scott, and
Chan (2004) included external environment factors in the framework for the construction
industry, and other authors researched success factors of specific stakeholders such
contractors of subcontractors (Al-Tmeemy, Abdul-Rahman, & Harun, 2011; Ng, Tang,
& Palaneeswaran, 2009; Schaufelberger, 2003).
In recent years, the focus has been in the human factors affecting the success of the
projects, keeping the focus on specific industries when developing success models
(Elattar, 2009; Tabish & Jha, 2012). The current trend emphasizes the importance of the
project participants’ experience and the interrelation among the success factors for the
different stakeholders (Alzahrani & Emsley, 2013; Gudiene, Banaitis, & Banaitiene,
2013; Inayat, Melhem, & Esmaeily, 2015).
The review of these success factors does not provide any group of indicators that should
be applied in construction projects but it does point three areas of reference when finding

Performance Measurement Research and Organizational Change
65
these indicators. The first area is related to human factors in project success, which
include groups such management and employees. The second area of interest is how
projects contribute to business success and the market perspective on project success,
which includes a strategic point of view. Finally, the inclusion of external factors to
project success and therefore pointing the need of measuring these aspects.
Table 4: Evolution of projects' success factors in the literature
Author Year Findings/Conclusions
(Baker et al.) 1974 Holistic approach to project success containing
numerous variables. Include external factors where little
or no control from management is possible, affecting
success through the environment.
(Pinto & Covin) 1989 There are some basic similarities (academic perspective)
and characteristic differences (practitioners’ perspective)
between SF.
The importance of the SF change dramatically at
different stages of the project.
(A. Shenhar et al.) 1997 Multidimensional universal framework to assess project
success.
Efficiency, impact on customer, business success,
prepare for the future are the four dimensions of SF.
(Dvir et al.) 1998 Project SF are not universal for all projects.
Multidimensional perspective.
Managers should identify CSF to their specific projects.
Design considerations are found generally relevant.
(Aaron J. Shenhar et
al.)
2001 Multidimensional strategic framework considering
different timeframes. Relative importance of success
dimensions according to project type (technological
uncertainty).
(Aaron J. Shenhar) 2001 One size does not fit all approach to project success.
Different project should be managed differently.
SF depend on technological uncertainty and complexity
(scope).
(Aaron J Shenhar,
Tishler, Dvir,
Lipovetsky, & Lechler)
2002 Project success influenced by a wide spectrum of
variables.
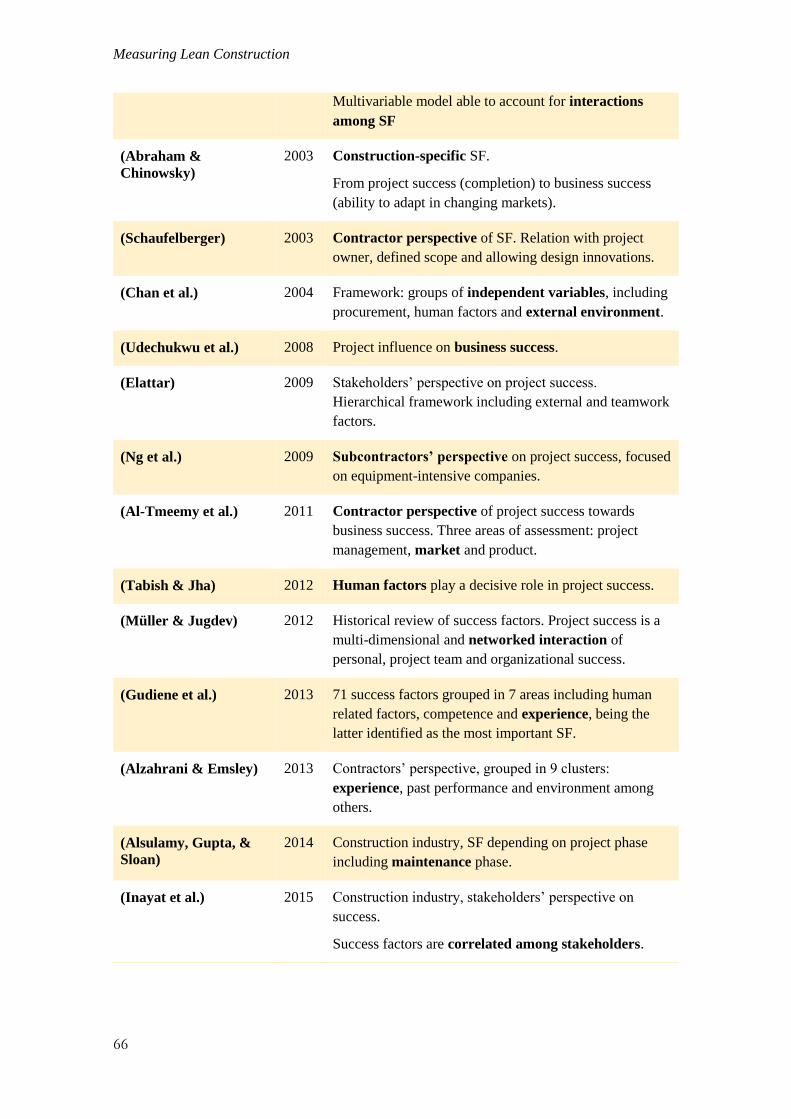
Measuring Lean Construction
66
Multivariable model able to account for interactions
among SF
(Abraham &
Chinowsky)
2003 Construction-specific SF.
From project success (completion) to business success
(ability to adapt in changing markets).
(Schaufelberger) 2003 Contractor perspective of SF. Relation with project
owner, defined scope and allowing design innovations.
(Chan et al.) 2004 Framework: groups of independent variables, including
procurement, human factors and external environment.
(Udechukwu et al.) 2008 Project influence on business success.
(Elattar) 2009 Stakeholders’ perspective on project success.
Hierarchical framework including external and teamwork
factors.
(Ng et al.) 2009 Subcontractors’ perspective on project success, focused
on equipment-intensive companies.
(Al-Tmeemy et al.) 2011 Contractor perspective of project success towards
business success. Three areas of assessment: project
management, market and product.
(Tabish & Jha) 2012 Human factors play a decisive role in project success.
(Müller & Jugdev) 2012 Historical review of success factors. Project success is a
multi-dimensional and networked interaction of
personal, project team and organizational success.
(Gudiene et al.) 2013 71 success factors grouped in 7 areas including human
related factors, competence and experience, being the
latter identified as the most important SF.
(Alzahrani & Emsley) 2013 Contractors’ perspective, grouped in 9 clusters:
experience, past performance and environment among
others.
(Alsulamy, Gupta, &
Sloan)
2014 Construction industry, SF depending on project phase
including maintenance phase.
(Inayat et al.) 2015 Construction industry, stakeholders’ perspective on
success.
Success factors are correlated among stakeholders.

Performance Measurement Research and Organizational Change
67
Organizational change
The last part of the literature review is dedicated to organizational change processes as
part of the implementation of new methodologies. It is especially relevant to cover this
issue given that this thesis concerns two aspects with significant implementation
challenges, performance measurement and Lean construction.
Both performance measurement systems and lean construction point to the failure to
initiate change as one of the causes for unsuccessful implementation (G. Ballard, Kim,
Jang, & Liu, 2007; Beatham et al., 2004). The change process of practices within the
organization should be should be managed accordingly to avoid internal resistance
leading to failure of the new methodologies before being implemented. As Robinson et
al. (2005, p. 17) claimed, ‘people and organisations often find change difficult and there
is sometimes resistance to adopting new ways of doing business.’ Acknowledging the
current culture in the construction environment can contribute to a smoother change
process (Cheung et al., 2011)
Implementation process
The implementation process of performance measurements systems have some different
factors compared with Lean construction despite of some commonalities. One of the
biggest threats for a performance measurement system is to be perceived by employees
as a blame allocation tool. Employees feeling the measures as a way of controlling who
is doing his/her work from management is the first step to failure (Andersen & Fagerhaug,
2002; Beatham et al., 2005). Another important barrier in the implementation of
measurement systems is the required ability to determine and monitor indicators
(Robinson et al., 2005) with the additional need of having the appropriate infrastructure
to capture and distribute the results (Beatham et al., 2005). Linked to the infrastructure is
the lack of data and the resources needed to develop the system in terms of time and costs
(Robinson et al., 2005). The last barrier identified is the actual use of the system and
whether it support the decision making process or the measures do not have any effect in
the organization (Beatham et al., 2005).
Managing change to overcome the resistance within the organization and the role of
knowledge management are some of the key considerations in the implementation
Measuring Lean Construction
68
process. Other aspects supporting the successful implementation are choosing SMART
measures (Specific, Measurable, Attainable, Relevant, Timely), understanding the
purpose of measurement and the system reflecting the way organization operates
(Robinson et al., 2005).
Establishing a performance evaluation system can be part of the strategy for the success
implementation of Lean practices (Bakås et al., 2011). The challenges in the Lean
construction implementation do not come only from the adaptation of Lean to a project
based setting, but implementing Lean has some challenges itself.
The sustainable implementation of Lean should reach four levels according to
Dombrowski and Mielke (2014). The first level is Lean as a philosophy, adopting a long-
term thinking of these practices. The second level is Lean processes, which is commonly
defined as eliminating waste. The third level refers to people and partners, who should be
respected and challenged in order to encourage their growth. The last level is problem
solving, explained as a learning process from failures and breakdowns.
Other authors highlight the success factors of implementing Lean under specific groups
in the industries, which can be also relevant to the construction industry. Powell et al.
(2014) established a new set of principles for engineer-to-order production systems,
which can be directly related to the construction industry, and Bakås et al. (2011) named
six critical success factors for the Lean implementation of small and medium companies
as most of the subcontractors in the construction industry.
There are in the literature a number of authors addressing the challenges in Lean
Construction implementation. The most extended description of this process is probably
given in G. Ballard et al. (2007). There are two aspects of organizational change
mentioned in the report that can be highlighted. First, the ‘learn by doing’ approach to
explain that change in practice can change thinking. This encourages the use of
demonstration projects and celebrating early wins to maintain momentum. The second
conclusion to highlight is the way to change the company culture by changing
management practice. This can be done through structured evaluations and rewards,
encouraging thoughtful experimentation and challenging previous best practices. Other
aspects stressed in the literature is the need of a bottom-up approach for a successful
Performance Measurement Research and Organizational Change
69
change management (Arayici et al., 2011) and the joyful learning process which should
include practice-focused training and involve subcontractors (Kim & Park, 2006; Salem,
Solomon, Genaidy, & Minkarah, 2006).
The common factors found in the implementation process of Lean and performance
measurement systems are the commitment and support from the management and the
involvement of employees, either when creating indicators or developing Lean practices
through their participation (Andersen & Fagerhaug, 2002; Bakås et al., 2011; G. Ballard
et al., 2007; Beatham et al., 2005; Robinson et al., 2005).
The analysis of barriers and success factors in the implementation process of both
methodologies is relevant when designing a new model. It is difficult to find the utility of
a model that will hardly be implemented, thus implementation issues should be carefully
considered.
The Ladder of Inference
It has been already mentioned the critical role of knowledge management when
implementing new methodologies. For this reason, it is relevant to not only mention its
importance but also include a model that can explain in a simple and clear way what it
does involve.
Senge (2014) built in systems thinking theory a mental model to explain how people
rationale their behaviour changes. Figure 7 shows this model, which explains the process
of change based on observable ‘data’ and experiences. This can refer to previous work or
practical training in case of new work methods. From the data observed and experiences,
the individual selects a certain part of it that will be further processed. The next step in
the ladder is to add meaning to the data selected based on cultural and personal
background. Individuals with work experience from different fields would have different
understanding on the same information provided, for example if explaining Lean
principles to a construction site manager and a production plant manager.
As individuals add meaning, they also make assumptions based on their understanding of
the information and draw their own conclusions. Based on these conclusions, they adopt
beliefs about the world that will also influence the data selection from what they observe.
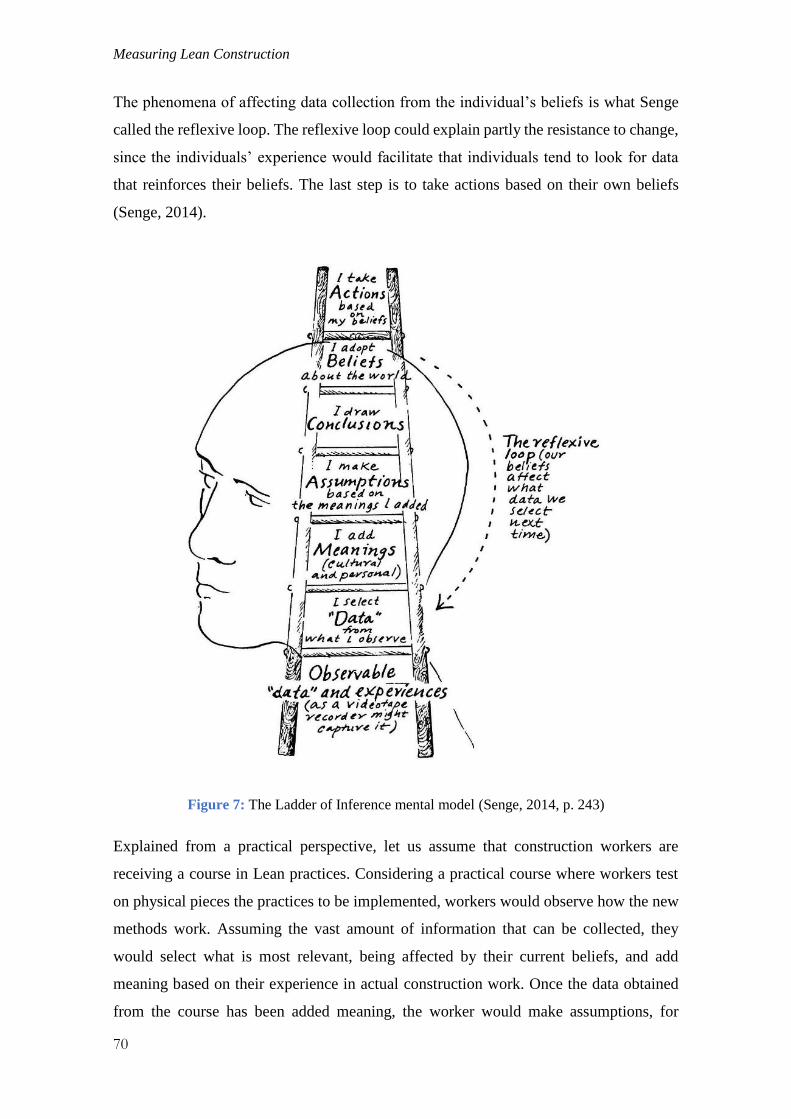
Measuring Lean Construction
70
The phenomena of affecting data collection from the individual’s beliefs is what Senge
called the reflexive loop. The reflexive loop could explain partly the resistance to change,
since the individuals’ experience would facilitate that individuals tend to look for data
that reinforces their beliefs. The last step is to take actions based on their own beliefs
(Senge, 2014).
Figure 7: The Ladder of Inference mental model (Senge, 2014, p. 243)
Explained from a practical perspective, let us assume that construction workers are
receiving a course in Lean practices. Considering a practical course where workers test
on physical pieces the practices to be implemented, workers would observe how the new
methods work. Assuming the vast amount of information that can be collected, they
would select what is most relevant, being affected by their current beliefs, and add
meaning based on their experience in actual construction work. Once the data obtained
from the course has been added meaning, the worker would make assumptions, for

Performance Measurement Research and Organizational Change
71
example assessing requirements for the applicability of the practices, and then draw some
conclusions about practices’ effectiveness. If the worker has concluded positively about
the use of new practices, s/he will adopt beliefs and take action accordingly.
The present model is just an example of how organizational change can be facilitated
from individuals’ perspective. This kind of models can also help to associate some of the
concepts emerging the implementation literature such as workers motivation,
competence, construction industry culture and learning processes.
Summary of the chapter
A literature review on frameworks and indicators presented by the academia is examined
in the first part of the chapter. It has been found from generic frameworks that take
Balanced Scorecard or EFQM as a reference to then adapt them into specific context.
Other authors create independent frameworks to address identified needs, and often are
adapted to settings such as the construction industry, environment, stakeholder position
or project phases. I developed a detailed overview of indicators in Table 3 classifying the
frameworks developed by the academia according to their industry focus, specific
orientation within the system and the basic classification of indicators.
Additionally, the overview of indicators is strengthen with the study of projects’ success
factors. The literature review on this topic that I developed in Table 4 through a
chronological overview shows a clear evolution from holistic approaches towards ‘one
size does not fit all’ approaches. Furthermore, construction and stakeholders-specific
success factors studies emphasize their interrelation and the importance of human factors.
This reinforces the creation of purpose-specific frameworks and the inclusion of a variety
of effects affecting the success of projects.
Finally, the challenges of organizational change are covered by having a closer look at
the implementation process. Some challenges in the implementation of performance
measurement systems is to handle the measurement culture so it is not perceived as a
blame allocation tool, the ability to create a monitor the indicators and the lack of
adequate infrastructure to capture and distribute the results in order to serve as a decision
making tool. On the Lean construction side, its implementation requires an organizational
Measuring Lean Construction
72
learning effort that should encourage practice as learning method and the use of structured
evaluations and rewards. The Ladder of Inference is purposed as a model for illustrating
the culture and organizational change through the reflexive loop supported by practical
training.
Chapter 5:
Methodology
The purpose of this chapter is to provide a detailed description of the process followed
along the thesis, from choosing the topic to analysis of results, and indicate the research
theories that support the methodology followed. The steps that lead to the findings will
be outlined according to relevant research literature. In this regard, I will describe the
choices taken during the development of the thesis and explain how they affect the results
obtained.
Purpose of the project
The first step in the development of this report was to define the purpose of the project
by being aware of the overall purpose and the specific learning outcomes, as well as
establishing the basic boundaries that frame the project (Polonsky, 2001). This study
conforms the Master Thesis required for completing the Master in Project Management
under the specialization of Production and Quality Engineering at NTNU. The thesis is
simultaneously carried out under the SpeedUp project at SINTEF, whose main objective
is to develop strategic, tactical and operational measures in order to reduce overall
execution time in complex construction projects by 30-50%. This context delimit the
boundaries of the project, establishing a time frame of 20 weeks for its completion.

Measuring Lean Construction
74
Exploring and defining the topic
Once the purpose of the project was acknowledged, I explored a number of topics that
could be relevant for the project. After previous studies comparing performance
improvement practices in different industries (Limon, 2014), this was clearly one of my
areas of interest. On the other hand, performance measurement was also a topic in which
I was interested from subjects during my education, and conversations with academic
members of the project revealed some current initiatives from the industry in this topic
(Langlo et al., 2015). As a result of these aspects, the topic that I proposed was to relate
performance measurement to improvement practices in order to facilitate their use from
the industry.
After some time exploring these topics with other members of the project, professors at
the University, reviewing academic journals and other references I had an overall
perception of the relevance of the topic. Polonsky (2001) cited some issues that need to
be considered in this regard. As mentioned, my own and the thesis stakeholders’ interest
was checked and I also found the topic appropriate for the purpose. The major problem
that I experienced at this stage was that because of being a topic with very recent interest,
I had some difficulties finding a great amount of literature that address the conjunction of
both topics. However, given that both topics were well covered separately I took it as a
challenge to overcome in the thesis. The decision of covering both topics forced me to
focus on the advances of the topics in the context of construction industry, limiting the
their extension in other areas and industries. Despite of later small adjustments on the
topic would arrive, the main idea of the thesis was defined after the first meeting of the
project. At this meeting, every participant shared what would be their focus areas and
possible projects for data collection.
The final definition and perspective of the topic would come after further discussion with
other researchers at SINTEF with expertise both in Lean and performance measurement
and some contacts with the industry trying to find sources of relevant data. During this
stage I had some difficulties in getting data from projects about performance
measurement and improvement practices due to the scarce measurement culture. As a
result, I decided to adopt a perspective in which performance improvement practices at
the industry was the start point, adding extensive measurement literature review to

Methodology
75
produce the results. From the discussion with the researchers I also learnt that would be
more interesting to focus on the effects of implementing Lean rather than the
implementation itself. With this decision I limited the approach to be taken for each topic,
avoiding extensive literature review on Lean Construction practices. Although a
limitation, obtaining data about Lean mostly from the industry could reflect the exact
situation of the context without being influenced by external conditions in different
contexts. As well, I limited the scope of the topic to benefits and drawbacks observed
when implementing Lean and maintaining out of the scope the detailed step-by-step
process of implementing Lean.
As a result of these limitations, I adopted two different approaches in the literature review
depending on the areas covered. While Lean literature presents an overview of the
principles and practices as a foundation for the data observed in practice, performance
measurement required a deeper insight into the literature in order to build the results. The
literature review of performance measurement frameworks is completed in two steps.
First, I provide a detailed overview of the most common models, for which I preferred
the use of books explaining the concepts, implementation and use in practice. Second, I
performed a thorough scrutiny of articles and conference proceedings to examine specific
adaptations of models, use of indicators, success factors and implementation issues. I
reflect this difference in the creation of two different theory chapters about performance
measurement.
Research questions and classification
Based on the decisions made during the exploration of the topic and given the limitations
that I have established previously, I defined a set of specific research questions to frame
the study. Although the main research question is the last one, I decided to elaborate three
introductory questions to guide the logic of the study, serving as fundamental inputs for
the final goal of the thesis. These are the research questions:
1. What performance improvement attempts are construction companies carrying
on?
2. What are the effects of these practices in project performance?
Measuring Lean Construction
76
3. What are the stakeholders’ needs in the implementation process?
4. How can these effects be measured (in order to support the fully implementation
of those practices)?
The application of the present research is intended to produce an improved understanding
of the effects of implementing performance improvement practices and the possible
application of performance measurement systems in this context. According to Kumar
(2005), this would lead to classify the study as applied research attending to the
application perspective.
Research can be classified from the perspective of its objectives as descriptive,
correlational, explanatory or exploratory (Kumar, 2005). According to these questions,
the objectives of the research can be divided in two steps. Questions 1 to 3 are attempts
to describe the phenomenon of implementing performance improvement practices in the
Norwegian construction industry, so they are classified as descriptive research. However,
the last question is trying to investigate possibilities connecting two concepts that have
not been often covered together before (performance improvement practices and
performance measurement). For this reason, question 4 is classified as exploratory
research.
The last possible classification described by Kumar (2005) is from the perspective of the
inquiry mode. The unstructured approach is claimed as more appropriate to explore the
nature of the phenomenon rather than determining its extent, which would correspond to
a more structured approach (Kumar, 2005). The purpose of the study is to describe the
implementation of performance improvement practices and establish the variation
through its effects without quantifying them, which is identified as qualitative research.
Besides Kumar’s classification of research, I have differentiated between two possible
paradigms to define my approach in this thesis. These paradigms are described in
Ekambaram (2008). The positivist paradigm considers that there is one single reality, and
that the reality is objective. This imply that the researcher can study a phenomenon
without having influence on it and his/her opinion will not affect the observation. Derived
from this paradigm, post-positivism maintain the view of only one objective reality

Methodology
77
although it assumes that the reality is so complex that it is not possible to be completely
understood. Quantitative research is usually the methodology used under this paradigm.
The second paradigm described in Ekambaram (2008) is the interpretive paradigm. This
paradigm is characterized by the belief of multiple, constructed realities in which the
observer’s opinion influences the study of the phenomenon. Therefore this paradigm uses
methods aimed to understand the phenomenon with an emphasis on contextual elements
such as human and organizational behaviours. Interpretivism accepts the difficulty in
creating an objective understanding due to the possibilities for alteration in the iterative
process.
From the two paradigms, I have chosen the interpretive paradigm for this thesis. Hence I
will look at how respondents comprehend their experiences in the implementation process
of performance improvement practices. Based on this decision, the methodology
indicated for this paradigm is qualitative research.
Qualitative methodology and methods
From the methodologies outlined by Petty, Thomson, and Stew (2012) within the
qualitative research, the present study is inspired in the grounded theory although it can
be found traces from phenomenology and other methodologies. This methodology consist
of generating a theory that explains a social process constructed from the participants who
have experienced the phenomenon.
This methodology can adopt two approaches: emergence of concepts from the data or the
theory being constructed by the researcher. In this case both approaches might be
observed. On one side, descriptive research can be associated with the emergence of
concepts from the data, while exploratory research is aligned with the idea of a theory
being constructed by the author.
I selected the participants in the study according to theoretical sampling method, although
it cannot be denied certain degree of purposive, convenience or snowball methods (Petty
et al., 2012). It may be argued that the sample was selected on basis of analytical insights,
since interviewees were directly involved in the early phases of implementing
performance improvement practices at their respective companies. However, it must be
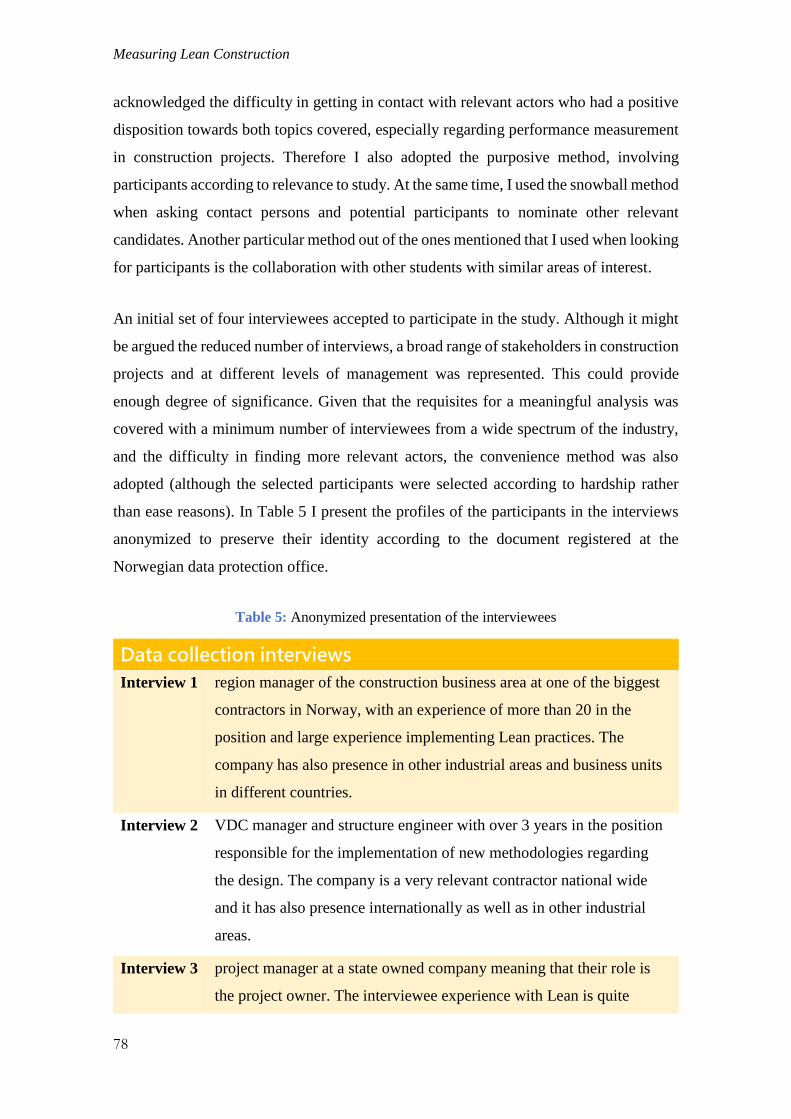
Measuring Lean Construction
78
acknowledged the difficulty in getting in contact with relevant actors who had a positive
disposition towards both topics covered, especially regarding performance measurement
in construction projects. Therefore I also adopted the purposive method, involving
participants according to relevance to study. At the same time, I used the snowball method
when asking contact persons and potential participants to nominate other relevant
candidates. Another particular method out of the ones mentioned that I used when looking
for participants is the collaboration with other students with similar areas of interest.
An initial set of four interviewees accepted to participate in the study. Although it might
be argued the reduced number of interviews, a broad range of stakeholders in construction
projects and at different levels of management was represented. This could provide
enough degree of significance. Given that the requisites for a meaningful analysis was
covered with a minimum number of interviewees from a wide spectrum of the industry,
and the difficulty in finding more relevant actors, the convenience method was also
adopted (although the selected participants were selected according to hardship rather
than ease reasons). In Table 5 I present the profiles of the participants in the interviews
anonymized to preserve their identity according to the document registered at the
Norwegian data protection office.
Table 5: Anonymized presentation of the interviewees
Data collection interviews
Interview 1 region manager of the construction business area at one of the biggest
contractors in Norway, with an experience of more than 20 in the
position and large experience implementing Lean practices. The
company has also presence in other industrial areas and business units
in different countries.
Interview 2 VDC manager and structure engineer with over 3 years in the position
responsible for the implementation of new methodologies regarding
the design. The company is a very relevant contractor national wide
and it has also presence internationally as well as in other industrial
areas.
Interview 3 project manager at a state owned company meaning that their role is
the project owner. The interviewee experience with Lean is quite
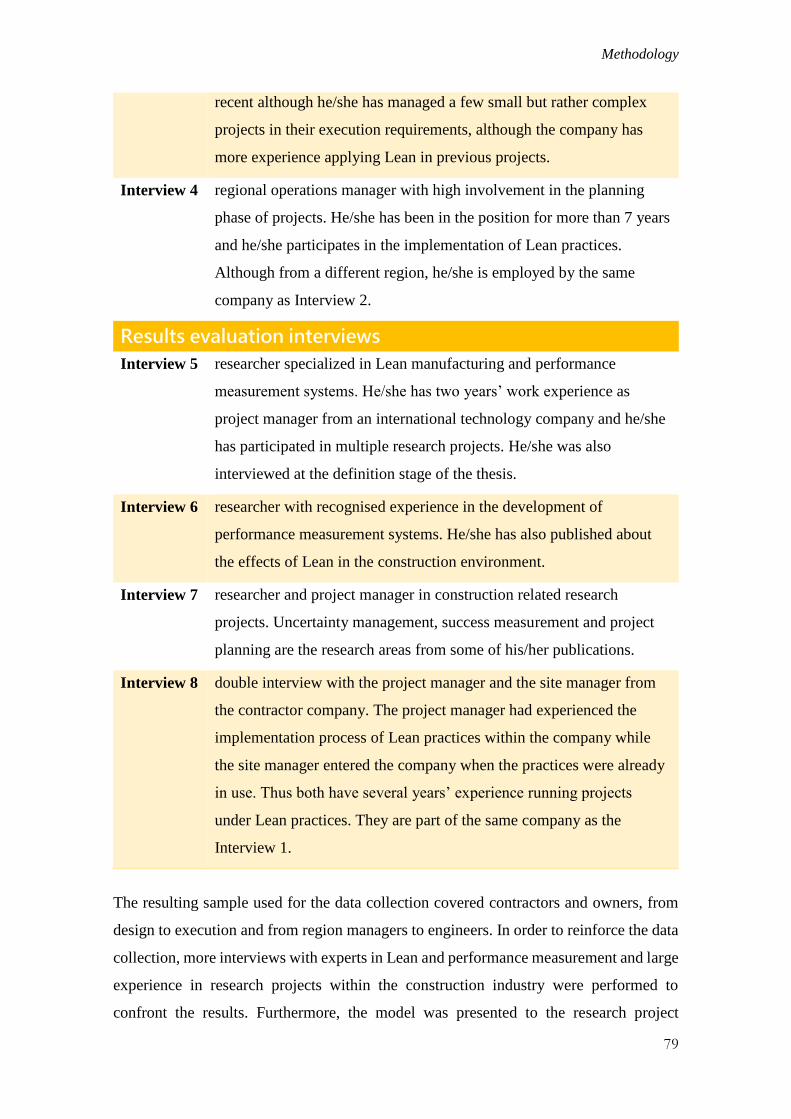
Methodology
79
recent although he/she has managed a few small but rather complex
projects in their execution requirements, although the company has
more experience applying Lean in previous projects.
Interview 4 regional operations manager with high involvement in the planning
phase of projects. He/she has been in the position for more than 7 years
and he/she participates in the implementation of Lean practices.
Although from a different region, he/she is employed by the same
company as Interview 2.
Results evaluation interviews
Interview 5 researcher specialized in Lean manufacturing and performance
measurement systems. He/she has two years’ work experience as
project manager from an international technology company and he/she
has participated in multiple research projects. He/she was also
interviewed at the definition stage of the thesis.
Interview 6 researcher with recognised experience in the development of
performance measurement systems. He/she has also published about
the effects of Lean in the construction environment.
Interview 7 researcher and project manager in construction related research
projects. Uncertainty management, success measurement and project
planning are the research areas from some of his/her publications.
Interview 8 double interview with the project manager and the site manager from
the contractor company. The project manager had experienced the
implementation process of Lean practices within the company while
the site manager entered the company when the practices were already
in use. Thus both have several years’ experience running projects
under Lean practices. They are part of the same company as the
Interview 1.
The resulting sample used for the data collection covered contractors and owners, from
design to execution and from region managers to engineers. In order to reinforce the data
collection, more interviews with experts in Lean and performance measurement and large
experience in research projects within the construction industry were performed to
confront the results. Furthermore, the model was presented to the research project
Measuring Lean Construction
80
manager and to practitioners in a final interview with a project manager and a site
manager to assess its validity, utility and reliability. This settles the final set of interviews
in eight, four for the data collection and another four for evaluating results.
The data collection was based on a number of semi-structured interviews. They involved
pre-determined areas of interest for the case. The first part of the interview covered
general aspects presenting the profile and experience of the interviewees and their role
within the company. Then interviewees were inquired about their experience with
performance improvement practices and their development process in the company,
including a stakeholder perspective table. The third area covered was the benefits
obtained from implementing these practices, followed by the barriers and success factors
experienced. The next step was asking about current project performance metrics and
evaluation methods. Finally, interviewees had to rank their preferences about the
characteristics of a hypothetical measurement system. The interview guide used to
structure the interviews can be consulted in the Appendix C.
Although several examples were provided along the interviews, the interview guide did
not considered specific projects or type of projects. This allowed having a general
perspective necessary for the development of a model aimed for the whole industry. On
the other hand, it must be recognized the weakness of the result since is not able to
consider specific barriers or benefits that can be particular to some type of projects. Given
the innovation of the topic and that previous performance measurement models specific
to Lean context were not found, it was preferred to adopt a general overview of the
industry to build the model. In this regard, it is worth to mention the extension of the data
collection interviews with an average duration over 90 minutes and carried out face-to-
face, by phone and via internet, indicating the thorough review of the topic with
practitioners. Most of the interviews were done in English, with the consent of all the
participants, with the exception of the interview presenting the results to practitioners that
was completed in Norwegian language attending their requests. All the interviews with
practitioners were done in partnership with other student interested in the object of study,
although each of us had the opportunity to ask questions related to our specific topics.
Petty et al. (2012) claims that grounded theory methodology involves coding data such
as interview transcripts, which are used by the researcher to abstract them into broader

Methodology
81
concepts and categories to capture the complexities. This method is based on continuous
collection and comparison of the data set in an iterative process called comparative
method of analysis. This is carried out until there is a theoretical sufficiency where
‘relationships between abstracted codes are identified to create an explanatory model’
(Petty et al., 2012, p. 379).
In practice, the code of data was made grouping the answers according to the different
topics explored due to the high degree of freedom in the structure of the interviews. This
was necessary in order to facilitate the iterative comparison process in the analysis to
build the results. The analysis process is showed to a great extent in Chapter 6, where the
outcomes of the comparison are described and the concepts from the data emerge.
Likewise, Chapter 7 provides a description of the models constructed by the author.
Validity and limitations
The research is assessed according to four criteria established by Petty et al. (2012):
confirmability, dependability, credibility and transferability.
Confirmability refers to ‘the extent to which the findings reflect the focus of the inquiry
and not the bias of the researcher’ (Petty et al., 2012, p. 381). The author has experience
from other industries where some performance improvement practices are already
established, which may show a positive predisposition towards these methodologies. The
lack of experience within the construction industry can be a limitation about the
knowledge of the internal culture, but also an advantage for reducing bias. The limitation
of lack of experience in the industry is compensated by the high degree of involvement
of experience researchers and practitioners in the process through interviews and periodic
presentations.
As a qualitative study, the data analysis accepts its dependability on the context, the
people involved and the creative activity from the researcher (Petty et al., 2012). In this
case, the context is the Norwegian construction industry, the environment of SpeedUp
project at SINTEF, and the professors at NTNU involved. An audit trail of the process
followed in the form of public presentation within the SpeedUp project was carried out
periodically to ensure consistency. Despite of some authors consider dependability in
Measuring Lean Construction
82
qualitative research as an expression of reliability (Golafshani, 2003), I will discuss this
concept with greater detail later on.
The credibility of the findings is tested through peer debriefing with a researcher outside
the SpeedUp project context and collecting data from different perspectives
(triangulation). This includes obtaining data from different organizations, at different
perspectives of the project and in a range of positions. Furthermore, the study also seeks
to verify the findings with participants after completion of the report.
The extent to which findings can be applied in other contexts is assessed by its
transferability. It has been already mentioned that the context of the present thesis is the
Norwegian construction industry, which includes its own practices and culture. With a
complete set of four interviews for the data collection with four additional interviews
presenting the results, the result cannot be directly transferred to neither the rest of
Norwegian construction industry nor any other field. Although other authors have found
similar results about specific areas of the results, such as success factors in the
implementation of Lean described by Bakås et al. (2011) in small and medium
manufacture companies in Europe, it is responsibility of those who might apply the
findings into their own setting to determine the transferability (Lincoln and Guba, 1985;
Sandelowski, 1986; mentioned in Petty et al., 2012).
The contemporary search of reliability in qualitative research is connected with
specifying the relevant context of observation (Kirk & Miller, 1986). The definition of
reliability in qualitative has been largely discussed, showing opposite approaches that go
from discarding relevance in qualitative research to claiming the need of being judged by
its own paradigm’s terms (Golafshani, 2003). Other authors link together the verification
of validity and reliability assessing methodological coherence, appropriate sample,
collecting and analysing data concurrently, verifying new ideas with data already
collected and moving theoretical development from the perspective of data to a
conceptual understanding (Morse, Barrett, Mayan, Olson, & Spiers, 2008). Most of the
assessing elements under this perspective are already explained as the methodological
coherence, the sampling methods, verification of new ideas and the theory development.
The concurrent process of collecting and analysing data can be proven by the
development of variables prior to the development of interview guide, which are included

Methodology
83
in the document provided in Appendix C. According to Morse et al. (2008), this would
ensure the reliability of the study.
Based on Golafshani (2003) understanding from the qualitative research perspective, the
way of testing validity and reliability is eliminating bias and increasing the researcher’s
truthfulness of a proposition about some social phenomenon using triangulation.
Moreover, ‘triangulation may include multiple methods of data collection and data
analysis, but does not suggest a fix method for all the researches’ (Golafshani, 2003, p.
604). I have considered triangulation through interviewing different stakeholders, peer-
to-peer discussion with my partner on the interviews and other students involved in
relevant areas of the topic, presentation of results to researchers and practitioners and
comparing results from previous studies. From my point of view, this creates a reasonable
foundation for accepting the reliability of the data collection and analysis.
Although the number of interviews could be considered as a limitation, the four
interviews for the data collection can provide an understanding of patterns of work and
behaviour in the project context. This understanding would contribute to know the
characteristics of the connection between performance measurement and implementing
Lean in projects. Other limitation is the generalization of the model, which could need
adaptation according to the type of projects aimed to be measured. Further limitation is
the capability of considering a limited amount of frameworks and theories, which might
also limit the result. The criteria for the selection of frameworks was to consider those
more often mentioned in performance measurement literature. Consequently, some
relevant but less popular frameworks could be missed, although the timeframe of the
thesis also limits the ability to cover a wider extent of literature.
Summary of the chapter
This report is written within the boundaries of the thesis for the Master in Project
Management at NTNU and the SpeedUp project at Sintef. The topic was defined and
found relevant after discussion with researchers, professors, PhD candidates and other
staff, and the research questions were defined accordingly. The data collection is based
on theoretical sampling methods comprising four interviews with practitioners from
different stakeholders and at different levels of management, complemented with four

Measuring Lean Construction
84
more interviews with researchers and practitioners to assess the results. This defines the
thesis as qualitative research, combining emergence of concepts from data for evaluating
the current use and effects of Lean construction and theory being constructed by the
researcher for the generation of the performance measurement model. The validity of the
study is satisfactorily evaluated under criteria of confirmability, dependability and
credibility, whereas transferability should be assessed by those applying the results.
Triangulation also confirms the reliability of the analysis. Other limitations are the time
constraints, the capability of considering a restricted number of performance
measurement frameworks and the data collection possibilities reduced to four interviews.

Chapter 6:
Lean Construction in the
Norwegian Industry
In this chapter the data obtained will be presented and analysed. Through this analysis,
the basic ideas of how improvement performance practices are being implemented in the
Norwegian construction industry will be highlighted. I will describe the analysis in three
stages according to the following structure.
First, I will explain the part of the analysis related to perception of Lean from the
practitioners, introducing the data collection process, the practices observed and their
view of Lean that I have reflected in a Lean Construction model. This stage also contains
the implementation process of Lean as described from the interviewees and the
stakeholder analysis for this process.
Secondly, I will present the part of the analysis focused on the effects of Lean and the
success factors for the implementation of these practices. This is a key step to develop the
performance measurement model that I will reveal in the next chapter.
Finally, the analysis from the data obtained regarding performance measurement in
projects will be outlined. These aspects are important because reflect the current
measurement culture within the construction industry and provides an insight on their
point of view of the desired measurement system. By considering these aspects, I will be

Measuring Lean Construction
86
able to develop a model better adapted to their expectations connecting Lean practices
and performance measurement frameworks.
Data collection
The data was obtained through a number of interviews with representatives from some of
the most relevant companies in the construction sector in Norway. Previous to the
interviews with the practitioners, the interview guide was evaluated with an expert from
the academia in Lean and Performance Measurement to have the most adequate and
fruitful perspective on the report.
The total amount of interview for the data collection was four. This includes
representatives from three different companies covering a wide range of stakeholders in
the industry. Project owner and contractor as well as the design side and the construction
side were represented. At the same time, different levels of management were included,
from the principal responsible for design practices and operational manager to owner’s
project manager and region manager participated in the interviews. The wide range of
stakeholders and level of management provided a set of data that even though is not very
extensive, is able to represent the different perspectives minimizing the possibility of
biased results.
The experience of interviewees with Lean vary depending on what practices have been
used in their respective companies. Since the efforts for implementing improvement
performance practices have been quite recent in most of the cases, interviewees
experience is mostly in the attempt of implementing Lean. Only the company that has
implemented Lean for a longer period of time has above 10 years’ experience in the
process. Far from being a weakness, this profile of participants strongly supports the
purpose of this study, which is focused on the implementation process.
Lean practices
The practices that have been found more often applied are Last Planner (referred
commonly by the companies as involving planning), Virtual Design Construction (VDC
or BIM) and Pull Scheduling (backward planning). It is certain that these ‘practices’ are
not practices as such, rather tools. Nevertheless, their use serve the purpose of Lean
Lean Construction in the Norwegian Industry
87
principles like reducing waste in the process. The difference between practices and tools
according to the Oxford Dictionary that practices are ‘the customary or expected
procedure of doing something’, while tools are the ‘things used to help perform a job’
(Oxford, 2015). Since these tools are main contributors to create the practice, they all will
be considered as Lean practices.
Following this argument, Concurrent Engineering (CE) is also considered as practice
following Lean principles. According to the interviewee working in design where is
applied, ‘concurrent engineering has the purpose of cutting off the waste in meetings, as
Lean is about’ (Interview 2). Although the use of CE was not rooted directly from the
implementation of Lean, it follows Lean principles and therefore is included as Lean
practice. This argument is also validated by the expert in Lean consulted, who claimed:
‘CE is particularly relevant shortening the product development timeframe’ (Interview
5). Koskela (1997) includes concurrent engineering at methodology level of ‘the new
production philosophy’ named Lean.
The Lean model in construction
The basic understanding about the definition of Lean Construction is common among the
interviewees. All of them mentioned the reduction of waste in one way or another.
Reducing use of material, useless hours at the working place, lack of quality, lack of
communication, improved planning or having effective meetings are some examples of
the Lean characteristics cited. Other aspects of Lean mentioned were the importance of
being proactive to sort issues earlier, the team spirit of building together and the trust in
workers on their inputs (duration of activities).
Besides all these ideas about Lean, the model that can best describe Lean Construction
was disclosed during the interviews and it is represented in Figure 8. As opposite as in
manufacturing, construction industry has not the ability to move the product through the
different assembly stages until is completed. Instead, are the workers who should move
in a coordinated way through the construction site to perform the different activities on
the product until this is completed. Similarly as in manufacturing, is important that these
movements are coordinated to get the same pace along the project, which will allow adjust
activities and reduce waste. In this way, the construction process is compared with the

Measuring Lean Construction
88
movement of a train, so workers moves over the construction site completing the required
activities. The key idea is that is not possible to move only one coach independently, but
all of them should move together. Of course this model does not pretend to gather all the
complexities of Lean theory, rather providing a fundamental model easy to understand by
practitioners.
Figure 8: The Lean Construction Model
Implementation of Lean
The level of implementation varies greatly among companies. Only one of the companies
have implemented Lean as the company’s strategy, enforcing its implementation in every
project. For them, Lean ‘is not only a new method, but also a new culture that everyone
in the company need to understand’ (Interview 1). Specific practices such as involving
planning is often company wise implemented, while pull scheduling and concurrent
engineering application has been found to be more often project-specific. In some cases,
Lean practices are applied to specific parts of the project, not even to the whole project.
This fact brings the question about how far is Lean implemented. Although

Lean Construction in the Norwegian Industry
89
manufacturing academia has developed several models to assess the leanness of the
production system (Vimal & Vinodh, 2012; Vinodh & Balaji, 2011; Wan & Frank Chen,
2008), this study is focused on the effects of Lean as a consequence of its implementation
rather than assessing the level of leanness of companies.
The motivation for implementing Lean has often had workers at the origin. In some cases
they claimed improved planning creating a bottom-up approach of the implementation. It
has been also reported initiatives from management to reduce absence rate in projects.
From the two approaches, the bottom-up approach has shown much more difficulties
towards the change, and top-down approach has been recommended from this experience.
Academia is usually involved in the implementation process, especially when the scope
for its implementation was wider than a few trial projects. The results from the research
on reducing absence rate in construction was to involve workers in the weekly planning
improving predictability, and providing room for a better assessment of the worker about
whether he/she could perform the planned tasks. This leads to one of the effects of Lean
that will be further analysed below.
Actors’ involvement and training
One of the critical aspects to be considered during the implementation of Lean is which
actors should be involved and to what extent. Generally, all managers, workers and
subcontractors must be involved to get the expected results, especially when using
practices applied on site. Moreover, this issue have particular challenges when
implementing Concurrent Engineering in the design phase. A project manager mentioned
the importance of involving even workers from other countries participating in the project
and that did not speak the local language fluently, giving an idea of the dimension of
actors’ involvement issues. This can be understood since they are probably the ones
requiring greater adaptation from their work culture. Involvement of subcontractors also
depends on their culture and this may comprise additional resistance to change. For
example, some of them are more prepared to adopt the new methodology while others are
not interested in improving processes.
The training provided at the beginning of the implementation process vary greatly from
one company to another. However this is not surprising, since state owned companies

Measuring Lean Construction
90
share the mission and responsibility of improving practices at the industry and had more
ease to partly finance training to all the personnel involved in the project. Private
companies did not have the resources to provide training to all the employees and
subcontractors. The highly positive result from experiences where training was provided
to a full extent, invite to extend this practice by creating training programs for
subcontractors focused on the application of practices. This is aligned with results found
by Kim and Park (2006), who suggest to focus on ‘how to’ implement Lean in practice
rather than merely explaining Lean theories.
The practices reported in the interviews consisted in 3 days course using construction
with Lego® to show the effectiveness of using Lean. In this way, managers, employees
and subcontractors experienced the benefits of Lean in fiction before applying it in the
actual project. This resulted in everyone being convinced of the use of Lean practices and
aware of how to apply it. Other benefits from the training prior to the project was the team
building considerations which also affected in reducing conflicts during the project.
Summarizing, training is of course an important investment but it brings important
benefits and it can be expected that the need of this training is reduced as the industry
adopt Lean practices wider.
Stakeholders’ analysis
The stakeholders’ analysis is intended to give a broad idea of what is the level of
involvement in the implementation of Lean from the different actors, and analyse their
needs to improve their involvement.
Top management
Interviewees were asked to give their point of view about the level of involvement of the
different stakeholders in the implementation of performance improvement practices. Top
management was usually rated with high involvement indicating great support in its
implementation. On the other hand, they were also criticized in some cases for having
many ideas and supporting initiatives financially, but lacking strategic decisions and
follow up of these initiatives.

Lean Construction in the Norwegian Industry
91
Aligned with previous statement about the adequacy of implementing Lean in a top-down
approach and with almost every author that has study the implementation process of Lean,
top management support and leadership is essential for the success of these practices
(Bakås et al., 2011; G. Ballard et al., 2007; Cassell, Worley, & Doolen, 2006).
Project Management
At project management level the involvement depends on individual convincement about
Lean practices, varying their attitude from reluctant to actively involved. On one hand,
actively involved managers are who actually implement the practices. On the other hand,
reluctant individuals need to see the results in advance to take part of the change,
otherwise they will try to persist on previous practices. Thus, project managers need a
deep understanding of the process to have the capacity to lead the Lean implementation.
Furthermore, they would benefit from specific goals to adhere to during the project to
keep pushing the implementation when the difficulties arrives and to know that they are
in the correct path. As mentioned in the interviews, ‘if there is no following up of the
implementation process, the attempt disappear in the project work’ (Interview 2).
Depending on the culture of the company, sometimes managers are the ones who need to
have the personal initiative to get the practices implemented. This is illustrated by one of
the interviewees who claimed ‘you have to do it yourself and get the other people working
with you’ (Interview 2), regarding the involvement of managers in performance
improvement practices.
Employees
Very motivated and involved managers does not lead to the implementation of Lean itself.
Managers need a group of motivated employees to reach their goals. In this report,
employees refer to the group of workers from the main contractor that are under the
management level. The level of motivation is similar to the project management group,
with some of them decided to implement practices while others are still reluctant towards
new methodologies and are only following what is mandated in the project. The ground
difference between the two groups is that managers have the ability and often the tools to
enforce the use of new practices in their projects.
Measuring Lean Construction
92
As mentioned before, workers are often in the origin of the implementation of new
methodologies and they show high levels of satisfaction with these practices once they
are involved. Even more, when they are asked at the evaluation of the project whether
they would like to work under Lean methodologies in future projects they answer
positively. Workers who had participated in small demonstration projects reported that
they could use these methodologies in larger projects as long as all the personnel involved
in the project also do.
All the experiences reported in this study confront one of the biggest critics of Lean.
Berggren (1993) strongly criticized Lean for being endogenous to Japanese socio-cultural
context with an aggressively achievement-oriented workforce leading to distressing
working conditions. The interviews reported that projects with highly critical schedule
had workdays of 12 hours in specific points of the project, divided in several workers,
and working hours during the weekends. However, this project should be counted as the
exception due to the strong needs and requirements from the owner. Effectively, the limits
was on the legislation and it was workers choice to commit to the planning. Although this
was a short project (13 days), workers mentioned in the evaluation that they would not
accept these exceptional situations for a long period of time.
Nevertheless, the cause of these situations is not the implementation of Lean, but the
owner’s need to have the shortest possible completion time. The freely commitment from
workers made possible to achieve both objectives, short completion times and high
satisfaction level of workers.
Subcontractors
This group of stakeholders is usually ranked lower than employees, though their
involvement for the success implementation of Lean is equally important. The size of the
subcontractors, often much smaller than contractors, make that they lack capacity and
competence to reach the same level of involvement. Subcontractors at organizational
level are often formed for a foreman and a number of workers. This means that they do
not have the organizational capacity to think forward about how to improve, and they are
mostly focused on the assigned tasks.

Lean Construction in the Norwegian Industry
93
Similarly to employees, management in projects can enforce the implementation of
certain practices. However, they might find that the enforcement is not straightforward
since what they are often facing is the resistance from culture change. In this case is not
only organizational culture that needs to be changed, but also the culture of the whole
industry, which is a major endeavour.
Those companies with larger practice using Lean have had the chance to look closer at
this issue. From their experience with subcontractors, they acknowledge that
subcontractors works better using Lean and that is cheaper for them as themselves
recognize. However, they still show some resistance to work under this methodology as
part of the cultural change. Given the cost advantage for the subcontractors using Lean,
owner and contractors mentioned their expectations of subcontractors reducing their
prices when bidding for a project under Lean practices, although the time when this
actually happens has not yet arrived.
These potential costs reductions would justify the investment in training for this
stakeholder, but the question is from whom budget would this training be covered.
Training programs should be developed for the effective implementation of Lean
practices among subcontractors (Kim & Park, 2006). Particularly in Norway, there is a
range of platforms that could serve as the mechanisms for the deployment of these
programs. Lean groups, subcontractors associations, research projects and certain
sponsorship from the government organizations should collaborate to leverage the full
implementation of Lean practices.
Customer or project owner
When it comes to the owner of the project, there is a consensus about their involvement.
Interviewees differentiate between public and private stakeholders, giving the highest
level of involvement to public owners and the lowest to private ones showing the radically
different perspectives.
Public owner perspective is based on the compromise of having a positive impact in the
society further than the project itself. First, they can decide to include the use of Lean in
the specifications of the project, enforcing its use by contract. Second, they are open to
finance the training although it would require also an effort from the contractor. For this

Measuring Lean Construction
94
reason is the special relevance that the financial coverage of the training is well specified
in the contract. Finally, the training provided should not be oriented towards a specific
project, rather intended to provide competence for future works as well. Although this
perspective follows the logic of a public company’s mission, the decision about the scope
of the training, actors involved, etc. holds in the project manager, who may have a
narrower perspective in some aspects.
On the private owner side, interviewees agreed on that they were only focused on price.
In the best case, they are interested in safety, quality issues or tidiness of construction
site. However, it is very common that they want the minimum involvement in the project.
From this position, the only way to get private owners involved is to demonstrate that the
use of Lean leads to cost savings. This approach would provide them the foundation to
ask for the use of these practices in their projects.
Construction Industry in Norway
Considering all the previous stakeholders, interviewees were asked as well about their
point of view of the interest of the industry as whole in these new methodologies.
Although the interviews were performed to a variety of stakeholders, it cannot serve as a
solid foundation for assessing the whole industry. Nevertheless, it can be useful to grasp
the general feeling.
On one side, interviewees highlighted the portfolio of research projects in which
companies are involved among other initiatives. It is also interesting to mention the
relevance of the academia in this process, since often happens that they are closely
involved in the beginning of the application of these practices. In contrast, it has been also
mentioned that in some cases companies take part of these initiatives more with marketing
purposes than with an actual convincement of the implementation of practices.
Summing up, there is a wide variety in the level of involvement when analysing the main
actors. It has been seen that the success of the initiatives depends greatly on the motivation
of the people involved. Specific needs that should be addressed in order to increase the
involvement of the different actors will be further analysed in Chapter 7, where a model
is proposed to explain these needs and the interaction among the stakeholders.

Lean Construction in the Norwegian Industry
95
Effects of using Lean
In the attempt of implementing Lean, it is important to focus on what can be expected to
measure effectively the results of its implementation. Following are the key aspects where
companies realized the most significant benefits. This will serve as a base for the
development of a measurement system that aims to support the implementation of Lean
practices.
The biggest issue raised when asking for the effects of using Lean was the difficulty of
measuring whether the improvement came from the implementation of Lean or from other
external causes. For this reason, interviewees based the information provided in their
personal experience rather than hard data. The purpose of this study is not to demonstrate
quantitative improvements achieved by Lean, but serve as a foundation for future
measurement. The following statements about the effects of Lean should be reviewed in
this context.
Time
If there is any characteristic that deserves a special mention when talking about the effects
of implementing Lean is the possibility of achieving a reduction in project’s completion
time. This is achieved through improved planning and the strong commitment to the plan.
The numbers to demonstrate this fact holds first on the reduction of the planned
completion time, which was mentioned in all the interviews with practitioners, and
secondly on the increased ability to reach project completion according to the planned
schedule.
Quality
Effects on quality applying Lean have been reported regarding the number of mistakes
and contingencies during the construction, and the list of pending work after completion.
This can be seen as a result from improved planning and better cooperation. One example
that supports this statement is the pending work list in one of the projects consisted of
three bullet points, while in the interviewee experience this usually covered half a page
(Interview 3).
Measuring Lean Construction
96
Costs
In this aspect there has been very few improvements compared to regular practice. The
project manager from the owner company did the simulation of costs for two of the
projects using Lean. The findings from this simulation was that both projects would have
used almost the same amount of resources independently if they were using Lean or not.
There are several reasons for this: it has been noticed that the time spent on planning has
been considerably larger when using Lean, requiring more resources. Secondly, all the
personnel participating in the project received a three days training on Lean practices,
whose expenses were covered by the budget of the project except for the time of the
external participants. Third, the use of consultants specialized in Lean was also a
significant part of the budget. Under these circumstances, it is reasonable to think that
important cost savings can be achieved in the long term when the need for extensive
training and consultancy services is reduced. In contrast to what it was reported in the
interviews, cost saving is one of the most reported effects in the Lean Construction
literature (Andersen, Belay, & Seim, 2012).
Predictability
One of the reasons to start implementing Lean practices for one of the companies was to
reduce workers absence rate. The objective was to let workers know what would they do
during the week, so they could better assess whether or not they can do that job in case of
small injuries. In this sense, the work got very predictable for workers and they got to
reduce significantly the absence rate. Moreover, given that the degree of adherence to the
plan is higher than when not using Lean, the project became more predictable for the
project owner as well.
Defined responsibilities
The use of Lean practices allows all the personnel having a clear idea of who is
responsible for each activity and every aspect of the project. As a result, decisions are
made without unnecessary delay and in case of defects is easier to find the cause and the
solution. It has been reported workers doing their job in a more independent manner, since
it is sure that predecessor activities are completed and resulting in less people working at
the same time in the area. This has been named ‘micro-management’ by one of the
Lean Construction in the Norwegian Industry
97
interviewees (Interview 2), and by the description given, it refers to the communication
of responsibilities so each person knows precisely to what issues should provide answers.
This applies not only to practices at the construction site, but also during the design phase
when using concurrent engineering. However, in the design phases happens that micro-
management is a success factor rather than an effect. This perspective will be further
explained in the next section.
Cooperation
Practices like involving planning provide spaces for communication such as the morning
meetings, concurrent meetings, etc. These spaces facilitate effective communication
among actors in a structured fashion. Workers learn to adapt to each other and the bad
feelings when it comes to changes are reduced. This adaptation is probably the clearest
picture of what it was expressed on the Lean Construction model (Figure 8 in page 88).
At the same time, the team building effect increases the proudness of the workers when
achieving their own objectives. In this way, the traditional individualistic perspective
from workers acknowledged during the interviews is transformed towards a project team
perspective.
Happier people at work
This effect can be seen as highly subjective, however it is one of the effects that has been
actually measured in a number of projects through worker satisfaction indicators and
reported as of great importance. This was made by monthly surveys in which workers
could evaluate safety conditions, tidiness, collaboration or their perception on
predictability among others aspects in the project. This practice was being developed in
the company with wider experience using Lean, and workers’ satisfaction reached a score
of 6.1 over 7. The target for every aspect measured was set above 6 in a rank from 1 to 7.
Once the manager obtained the results, the project would focus the improvement in the
indicator with less score.
Another effect is that there are fewer conflicts as a result of improved planning and the
team spirit created before the planning. Having a positive team spirit could enable the
alignment of interests towards the project objectives. In this regard, Tabish and Jha (2012,
p. 1137) found that ‘human factors play a decisive role in making a project successful’.

Measuring Lean Construction
98
More specifically, absence of conflicts and satisfaction are mentioned by Elattar (2009)
as success factors in construction projects, and teamwork is one of the factors included in
his framework. Li, Lu, and Peng (2011) place ‘keeping and promoting good relationships’
in the first level of their success factors framework in construction organizations. Other
authors rely on managers’ competence and experience to provide coordination and
conflict resolution (Gudiene et al., 2013). On the contrary, Lean methodologies give the
opportunity to workers to add value to the project and these coordination and conflict
resolution abilities are transferred to the project team.
Learning
The last effect that has been mentioned is learning. It is obvious that nobody can expect
to implement Lean with any difficulty and obtaining the best possible results from the
very first project. The implementation process is at the same a learning process. Some
companies decided to try out some practices without any particular training program or
consultants support. Even those projects that had the training still realized some key
learnings during the first projects. Organizational learning tools should be used to obtain
greater benefits from these experiences and facilitate the implementation of practices in
future projects based on the lessons learned.
Lean practices have provided also tools to enhance learning during the project. In some
of the projects, there was a list with mistakes made along the project in the room where
they had the morning meetings. In this way, they could avoid repeating the same mistake
during the project and make effective the learning process.
Some of the effects presented are part of the initial goals of implementing Lean while
others are spontaneous benefits of using these methodologies. Although they cannot be
quantified at this point, it can be expected that this is done in the future to provide more
solid fundamentals. Despite of this, the observed benefits using Lean justify further use
of these practices.
Barriers and Success Factors implementing Lean
In the previous section, the benefits obtained from using Lean were explained. However,
it should be recognized that during the implementation process companies had to

Lean Construction in the Norwegian Industry
99
overcome a number of difficulties. These barriers are presented together with those
factors that had the ability to leverage the implementation process. The factors presented
should be considered as well in the measurement system to obtain the desired results.
Motivated people
The first experiences with Lean may have a huge impact in its implementation, since they
will serve as examples for what can be achieved. If the results from the first experiences
are positive, will be much easier to convince other teams. While if the results are worse
than using prior methodologies, it will be difficult to support further these initiatives. For
these reason, motivated people towards new methodologies and positive to change should
be involved in the first projects to make them success. Top management knows who these
people are within their companies, and one important way to support new practices is
prioritizing motivated personnel to these projects. Training to provide basic knowledge
and following up their progress is the fundamental support needed from the top
management.
The right people are those ones that are convinced that the new practices will work.
Implementing new practices is a challenge itself, so culture change barriers should be
avoided to the possible extent. If part of team, workers or management is not convinced,
it will hardly be implemented successfully due to the internal resistance. For this reason,
finding the right people is the first barrier to be considered.
Involve all the actors
And when it is said all, it is meant all. During the interviews was mentioned in several
occasions the common fact in Norway that a good part of the work force are foreigners
that in some cases do not even know the language. Furthermore, they often have a quite
different culture and for example, they would not speak up if there were something wrong,
they would not speak towards the leaders and they would not say if they do not understand
something. The solution to overcome this situation is not more isolation, but teaching
them the Norwegian culture. Sometimes they do not have more motivation for their job
than getting the work done. The results obtained in projects where really everyone was
involved, both in training and in practices, indicate that it worth to involve them all as
early as possible to get into the mind-set of the project.
Measuring Lean Construction
100
One of the effects mentioned in the previous section was micro-management of
responsibilities and tasks, making that workers know what they have to do and when
exactly. At decision-making level, and especially during the design phase using
concurrent engineering, it is important that decisions are made to keep the work on.
Experiences with concurrent facilities from the airspace industry shows the importance
the decision-making process. Bandecchi et al. (1999) highlight that team members
participating should be ready to provide answers in real-time so the work does not stop,
putting more pressure on engineers. For this reason and because of the need of being
motivated who participate in these initiatives, Smith (1998) recommended that taking part
of these meetings remains voluntary.
Plan, plan, plan
It has been necessary in the projects to use more resources on planning. This seems logical
since there is more people spending more time doing the planning. The result is more
accurate project plan, with greater commitment to that plan from the workers. Moreover,
the project plan, procurement plan and production plan should depend on each other and
fit together. The idea of Lean as a continuous flow is well represented in this success
factor as well as the ‘train model’ of Lean (Figure 8). The smooth operation is not
achieved naturally or by chance, rather is the outcome of precise planning of all the
processes involved in the construction.
Competence
Recent studies has shown that Norwegian companies rate very high the work experience
when performing planning activities (Hoseini, 2015). This can be understood when
considering traditional methodologies. However, in the implementation of new practices
just experience may not suffice and the development of appropriate competence is
required. If managers with extensive experience in planning would need training, it is
obvious that workers who will become involved in the planning would need also the
training.
Furthermore, the training could serve as a tool to overcome the culture change resistance.
It would be very difficult to force employees at any level to use a certain method when
doing their job, but you can force them to apply these methods during the training with
Lean Construction in the Norwegian Industry
101
no resistance. The training from one of the companies consisted in a practical course
where all the people involved in the project could test the methodologies to be used during
the actual construction work and compare the results with the traditional methods. Once
they could see the results in practice, it was no longer necessary to convince them about
the benefits of the new methodology while building team spirit at the same time.
Another aspect related, is that the previous stakeholders’ analysis performed showed that
subcontractors lack the competence to apply Lean practices. It can be assumed that the
involvement of actors is only effective when they have the necessary competence. In
conclusion, the benefits of providing extensive training are too significant to dismiss this
practice without thorough consideration.
Top-management support
From the manufacturing experience in implementing Lean, Cassell et al. (2006)
concluded management support plays a strong role in this process and pointed as one of
the reasons for failure not providing a consistent education effort accessible to all
employees in the organization. G. Ballard et al. (2007) described the Lean preparation
process prior to its full implementation. This process included the need to have strong
commitment from top-management, which could be gained after two successful pilot
projects. Other elements were a Lean task force team, external consultants, training to the
managers and engineers involved in the pilot projects.
Interviewees mentioned explicitly that Lean should be introduced in a top-down manner,
making employees understand the importance of adopting the new system, and from
project owner to subcontractors. The ability to influence the practices from the owner and
the hierarchy in policies between the organizations participating in the project can support
this argument. During the interview held with the engineer responsible for new
methodologies in design, it was mentioned the importance of top-management providing
direction though strategic decisions and the need of following up the initiatives, which
also suggest a top-down approach.
On the contrary, Arayici et al. (2011) found that technology adoption for Lean
architectural practice should be done in bottom-up approach in order to engage the people
in the adoption and reduce resistance to change. It is unreasonable to think that an easy

Measuring Lean Construction
102
answer can be found regarding organizational change, but what it might be a compromise
solution is to take the top-down approach while keeping voluntary the participation in
these projects. However, the data collected does not allow reaching a solid conclusion on
the ideal approach and further research is advised.
Inaccuracy of drawings
Another issue that is often linked to Lean practices as it has been observed in the literature
review is quality in the production process. Lack of quality in the process may have a
potential impact not only in the product, but also in the planning or costs. Inaccuracy of
drawings has been reported as one important barrier during the implementation of Lean.
The reason is that these issues lead to ‘ad hoc’ work, meaning improvised solutions,
possible rework and interruption of the planned tasks, which can be identified as waste in
the context of Lean. The use of a technical office to solve these problems may help to
solve the problems at the construction but does not avoid that the mistakes are repeated.
Detailed investigation on the causes for the inaccuracy of drawings is out of the scope of
this study. However, this subject can be object of further study. It worth to insist at this
point that Lean is not a set of practices and tools, rather a new paradigm or mind-set for
the continuous improvement of processes (Koskela, 1992). There are specific
methodologies linked to Lean that could be used for the improvement of processes, such
as the House of Quality (J. R. Hauser & Clausing, 1988). The objective should be to
improve the process so the failures are not repeated instead of looking for patches to solve
the issues every time they happen, emphasizing the holistic approach of Lean practices.
Measure improvement
Every barrier, success factor and effect described before have a common obstacle to be
applied in process’ improvement: currently is not possible to measure where the
improvement come from or to what extent new practices improve performance. This fact
has been mentioned during the interviews as a main barrier for Lean implementation as
some previous examples have already indicated. Looking at the situation in Norway,
Langlo et al. (2015, p. 4, own translation) claim that ‘the fact is that we do not know how
productivity is developed in the construction industry as a whole’ as a result of lacking

Lean Construction in the Norwegian Industry
103
tools for its measurement. This shows the need for prioritizing the establishment of
performance indicators and measuring results.
Performance Measurement in Projects
The first point to highlight regarding the measurement of performance in projects is the
perception of employees on these measures. A common answer during the interviews and
even during previous phases of this study when asking for the interviews is that they do
not measure in projects. Even without further questions, it is not difficult to think that the
answer is not completely true. In every construction project, there will always be some
costs that are measured and a schedule to be followed. Not to mention HSE issues
enforced by law. Consequently, there is always some measures in projects. What makes
the difference is whether or not they are used to generate improvements.
Further inquiries with the interviewees showed that they actually brag about having
excellent HSE systems to measure and ensure adequate performance. Interviewees also
commented that they measure based on the plan and using man-hours as basic metric. At
this point, they also realized the difference in measuring between Lean projects and
others. While the measure of the advance of the planning was traditionally done in a
meeting with managers and personnel responsible of the different areas every two weeks
with common inaccuracies on the status of the tasks, Lean projects kept continuous
measurement of works being the workers who pointed when the tasks were finished. One
of the benefits realized is improved information transfer towards decision makers, which
is a key factor in the effective use of early warnings in projects (Haji-kazemi & Norges
teknisk-naturvitenskapelige universitet Institutt for produksjons- og, 2015).
Another aspect of measuring performance in projects is how projects are evaluated within
the organization. In fact, this measurement may have a great impact in employees
behaviour since shows how the organization measure success. In some of the companies,
interviewees admitted that the evaluation of projects was based exclusively on costs,
having the schedule as second metric with much less importance. This is aligned with the
findings from Andersen et al. (2011, p. 321), who claimed that ‘projects are measured by
whether they complete on time and on budget’. As detailed previously, other companies
Measuring Lean Construction
104
with higher degree of Lean implementation used workers’ satisfaction as part of the
project’s evaluation.
Characteristics of the Performance Measurement System
Finally, interviewees were inquired about the characteristics of a hypothetical
measurement system in their organizations. Based on performance measurement
frameworks studied and the insights from the report ‘Prestasjonsmåling i norsk BAE-
næring’ [Performance measurement in the Norwegian construction industry] (Langlo et
al., 2015), interviewees were asked to rank the characteristics of this system resulting in
the following attributes.
There is a number of articles in the literature comparing the generic frameworks discussed
in Chapter 3, and one basic differentiation among them is their ability to implement the
corporate strategy against the ability of benchmarking projects (Vukomanovic &
Radujkovic, 2013). Interviewees showed a clear position in favour of benchmarking
projects. This can be understood given the need of finding out whether the improvement
comes from the implementation of new methodologies or other circumstances. On the
contrary, the performance measurement system could benefit from having the ability to
implement strategy as part of the guiding managers’ decisions and following up
implementation of new methodologies. This aspect appeared in the second characteristic,
where interviewees’ opinions were divided between measuring specific initiatives or
general project’s performance. Even those inclined towards general performance
mentioned that specific initiatives would have effect on the global project performance.
All of the interviewees also expressed the importance of having the focus on the value
chain performance, from subcontractors to society, rather than being limited to internal
organization’s performance. However, it was also acknowledged the magnitude of this
endeavour and they showed appreciation for internal measurement in an effort of being
realistic at first.
They judged the measurement system to be centred on decision makings, meaning that it
should serve managers to make decisions to run the project smoothly and be able to adapt.

Lean Construction in the Norwegian Industry
105
Other opinion in this regard was being centred at operational level, given that is at this
level where the improvement is obtained. Regarding at what level should be measured,
interviewees agreed on not measuring personal performance but keeping the feedback at
project’s team level. This is reasonable in order to avoid personal judgement on weak
team performance. From these couple of questions, can be concluded that is important to
provide feedback at team level on how to improve performance, but the system should be
centred at project management level to give the possibility to drive the project to success.
When asking for the possibility of providing information during the project or just at the
closure, they were inclined towards the first option. For the same reason as the previous
conclusion, is important to have the ability to take action during the development of the
project. At the same time, this option covers the possibility of providing information at
the end of the project by aggregating the data collected.
Finally, although all the companies have in place an information system, they were unsure
that the new measurement system could fit into their current system. It is important to use
as much as possible the current systems to avoid adaptation to new technology being a
barrier for the system users. On the other hand, new features within the same system or
possibly a new system able to meet the expectations may be required. In any case, this
particular aspect will be decision of each company depending on their current systems
and its ability to support new features.
Summary of the chapter
The basic constraint of the data collection is related to the lack of measurement culture in
the industry although it could be reached a variety of stakeholders resulting in fruitful
data collection. From the interviews, four practices were found as the most used in the
Norwegian construction industry: Last Planner, Pull Scheduling, Concurrent Engineering
and Virtual Design Construction (VDC). The fundamental concept of Lean from
practitioners’ perspective is revealed in Figure 8: The Lean Construction Model,
represented as a ‘construction train’ in which all the activities should be coordinated and
stakeholders involved over the project lifecycle for the success of the project.
Measuring Lean Construction
106
Next, the most relevant aspects in the implementation of Lean practices were highlighted
including a stakeholders’ analysis. Top management is usually supporting the
implementation of practices, although strategic guidelines and following up of initiatives
are often insufficient. This is required by project managers to drive the project under the
new methodologies. In addition, project participants both internal and from
subcontractors require the competence for applying the new methods and the
convincement that they work better than previous practices. Project owners should be key
actors of the implementation process as they can ask contractually for using these
practices, although costs reductions need to be proved for its implementation out of the
public and bigger owners.
The primary effects in the use of Lean are described as well as the most significant
barriers. The effects found refer to completion time, quality issues, costs, predictability
of project activities for workers and project owner, better defined responsibilities,
increased cooperation, more satisfied workers and facilitated learning. Motivation,
involvement of actors, top-management support and measuring improvement are among
the success factors found in the implementation.
The current use of project metrics is mostly limited to cost and schedule especially at the
evaluation, though companies have declared expertise in HSE issues. Finally, aspects
related to the desired characteristics of a measurement system are described, emphasizing
the need to provide feedback at team level while providing direction at decision-making
level, and to compare projects through benchmarking tools.

Chapter 7:
A Performance Measurement
Model for Lean Construction
This chapter presents the models that I have developed based on the data analysis
previously presented. First, a model on stakeholders’ needs will be discussed based on
the prior stakeholders’ analysis. This model aims to make explicit what the requirements
are for the different stakeholders in order to achieve a successful implementation of Lean
practices.
Second, I will present the Performance Measurement model for the implementation of
Lean Construction together with some tools for its successful implementation. This model
responds to the main research question about how the effects of Lean can be measured.
In the first place, the performance measurement model shows the basic elements required
to implement Lean according to the success factors described in the previous chapter and
the effects that could be found during the implementation process. In the second part of
the model I linked the possible effects with specific Lean practices to guide the creation
of indicators and support the decision making process on what practices the organization
should implement. These connections are made based on the effects exposed by the
interviewees according to the practices implemented in their projects, and other relations
found in Lean theory.

Measuring Lean Construction
108
In the last part of the chapter, I will purpose some guidelines for the actual measurement
of the expected effects. Although the model does not comprise a specific set of indicators
to be included, I will explain the characteristics that indicators should fulfil to be sound
measures. Then, I suggest a project evaluation framework according to the desired
characteristics expressed by interviewees and gathered in the previous chapter.
Finally, I expose the logic of the whole system through a step-by-step roadmap for the
implementation of the model within the boundaries of the thesis’ limitations.
Stakeholders’ needs model
In the previous chapter I have explained the details about the current status of Lean
practices within construction companies, their understanding of the topic and the analysis
of the stakeholders’ involvement during the implementation of Lean. This analysis can
be summed up into the stakeholders model that I have created reflecting the requirements
from each group for the successful implementation of Lean practices.
The first step for creating a model supporting the implementation of practices requires
looking closely at the situation of every stakeholder involved in the process. If
organizations are currently facing some difficulties when implementing Lean can be
assumed that is because there are certain uncovered needs. It is the vital importance for
the future success to reveal the needs of the stakeholders, so the model could provide
solutions about how to address those needs.
Figure 9 shows the different stakeholders divided into external or internal based on a main
contractor perspective. Three specific needs are identified from the stakeholder analysis
in the discussion and the model use coloured arrows to indicate whether the stakeholders
have each need (arrows from needs to stakeholders and coloured differentiating between
orange for internal and blue for external stakeholders) or they have the ability to cover
those needs (green arrows, from stakeholders to needs).
The first need identified is to have strategic decisions that guide the decision making
process and have a follow up from the management. Project managers are the main actors
claiming for this as mentioned in the stakeholders’ analysis. Whereas top-management at
A Performance Measurement Model for Lean Construction
109
organizational level and project owner, both private and public, can provide these
strategic decision at project level.
The second need identified is the ability to measure results, and this seems a greater
challenges since are many actors requiring this need but few able to provide it. This
challenge is also identified in the literature (Andersen et al., 2012). It has been often
mentioned during the interviews the difficulty on measuring the effects of using Lean
being sure that is not circumstantial improvements. Contractor’s top-management and
public owners have some initiatives for implementing Lean and they need to prove that
the results delivered come from Lean implementation to extend further these practices.
On the private owner side, they would need proof that using Lean methods lead to cheaper
project in order to enforce their use by contract and provide the previously mentioned
strategic decisions.
The improvement can only be measured at project level, and therefore is the project
manager who could deliver those measures. However, the project manager would need to
make use of some tools for measurement and improve the practices in their practices.
Therefore is indicated a dual relationship between project manager and the need of
measuring results. This need suggests at the same time that a performance measurement
system attending the effects of Lean could be a very relevant tool in the Lean
implementation process. As seen in the implementation process literature, this statement
is aligned with findings from other authors which mention the establishment of a
performance evaluation system as a critical success factor (Bakås et al., 2011).
The third need identified is training, which aims to cover two underlying needs:
motivation and competence. Stakeholders requiring this need are project managers,
contractor employees, subcontractors and in general, everyone involved in the use of Lean
practices. This has been mentioned in the interviews and reflected in the previous chapter
as the need of everyone been convinced about this practices to make it work and increase
competence at subcontractor level to increase their involvement. This would produce
alignment of personnel behaviour with project practices. For this reason, these will be
presented as well as enablers in the performance measurement model, and making use of
Senge (2014) mental models to explain how to drive the change in the construction
culture.

Measuring Lean Construction
110
Figure 9: Stakeholders’ needs model in the Lean implementation process
These needs are basic foundations for the performance measurement model and they are
clear candidates to take part of the enablers in the implementation process. Although these
needs have been reflected before in the literature, their relation to the project’s stakeholder
can provide an additional insight on how to satisfy those needs.
Performance Measurement Model
The stakeholders’ needs model presented give some first clues about important aspects in
the implementation of Lean that should be addressed. Along Chapter 6 other relevant
aspects as the enablers or most of the effects of the model have been also mentioned.
Furthermore, it is important to notice the interrelation of the different effects, barriers and
success factors as often discussed during the analysis of the data. However, the correlation
among the different elements of the model is not possible to be evaluated with the data
collected and it represents a limitation of the model.
In order to enhance the effectivity of the model, several of the most successful
performance measurement frameworks have been reviewed in the literature. The
references that have been used to explain the models do not only focus on the model itself,
but mainly in their implementation in organizations. The purpose of the model presented

A Performance Measurement Model for Lean Construction
111
is not only to serve as a theoretical reference, but intends to facilitate the implementation
of Lean in practice.
Figure 10: Performance Measurement Model for implementing Lean Construction
Some of the characteristics that have been pursued when designing the model are
connected with the virtues of the generic performance measurement frameworks, the
expressed desires of the practitioners and simplicity for ease understanding and
application. The result is revealed in Figure 10 and explained in detail next according to
the different levels of the model: strategy, goals, enablers and effects.
Lean strategy
The first look at the model suggests a strong relation with the Balanced Scorecard
(presented in page 29) given the importance of the strategy as a first step of the model.
Effectively, the implementation have been seen more effective when the management
was directly involved in the initiative, and several interviewees have mentioned the need
of a top-down approach.

Measuring Lean Construction
112
Since the model is particularly focused on the implementation of Lean, it is important to
include in the strategy some elements that lead to implementing Lean. The
implementation of Lean should not be the goal, but just the mean to achieve greater
performance. At this point was very helpful the insight from the Lean Six-Sigma model.
In the aim of assembling together Lean and Six-Sigma practices, the literature revealed
the key contributions from each model. As defined by M. L. George et al. (2006, p. 39),
‘Lean means speed’. For this reason, the model indicates that part of organization’s
strategy should contain a reference to speed up processes, which in the construction
context could be translated in the ability of completing projects in less time.
Goals
The Balance Scorecard model defines the strategy map as ‘What must we do well in each
of the perspectives in order to execute the strategy?’ (Niven, 2002, p. 98). In this case,
the model does not consider the perspectives proposed on the Balanced Scorecard model,
but this step should include the necessary goals to achieve the strategy. Given the
narrower perspective of this model compared with BSC, is possible to define those goals
to achieve the speed up of projects.
Three goals have been found necessary to reach the upper strategy. First, having a reliable
design that is able to produce drawings describing the reality and anticipating problems
on site. This should not be incompatible with flexibility, and practices from other
industries using concurrent engineering have shown the possibility of achieving both
purposes, reliability and flexibility (Limon, 2014). Second, having a reliable plan is
crucial as a basic measurement of schedule in projects. It is not possible to reach shorter
completion times if the project is not able to meet the plan. The ability to produce a plan
shortening the schedule needs to be supported by practices able to follow the plan or even
contributing to the objective.
Finally, it is necessary to reduce waste as indicated by Lean principles. In this regard, the
analytical focus of Lean Six-Sigma is also useful specifying the type of waste and making
more explicit the basics of Lean. M. O. George (2010) provide a detailed explanation of
the seven common faces of waste summarized in the acronym TIMWOOD. According to
this, waste can be reduced first from transportation, which can be the result of
inappropriate layout on site or lack of flow between process steps. Waste can also come

A Performance Measurement Model for Lean Construction
113
from inventory, which can be recognize as Work in Progress in manufacturing
terminology, and in construction can be translated as mismatches between supply and
demand throughout the supply chain or current work being performed as seen in Andersen
et al. (2012). Motion can be also a waste when is not necessary, and this situation can be
as simple as workers forgetting their tools. Next waste is waiting, and the best tool for
this can be a well-communicated plan in combination with pull scheduling as experienced
in some of the projects related during the interviews. Overproduction, most typical in
manufacturing but often experienced in construction through overpurchasing, for
example when ordering more materials than necessary because of unit-price based
decisions (Vrijhoef & Koskela, 2000). The second O stands for overprocessing and it is
produced when delivering more value than needed from the customer. Finally, and
probably the most obvious waste are defects. Rework, repair and customer escapes are
part of this category. Focusing on reducing defects in high cost areas could have a great
impact saving costs, but probably also timesaving.
Three main goals have been explained as explicitly as possible to understand the link
between the strategy and effects. The goals described might be quite generic and the
intention is not that a company is focusing in each of the elements of these goals. The
broad description of these goals can actually give room to companies to focus on certain
areas while keeping the validity of the model. Optionally, each company can narrow the
exact meaning of the goals by giving a more explicit definition, which would help to
understand the logic of the system and produce more accurate indicators in the following
steps.
Enablers
It might be surprising for the reader to find at this point the enablers before the effects.
Well, this is completely intentional and it is indicated by the blue and yellow arrows in
the model. The inclusion of enablers is a clear influence from the EFQM Excellence
Model (presented earlier in page 46) and an attempt to explain the need of a bottom-up
approach. However, this approach should be facilitated by certain elements mostly
addressed in the stakeholders’ needs model.
The first enabler is top-management support, and as described before, this must consist
not only in a defined budget but also through establishing a clear strategy (as pointed in
Measuring Lean Construction
114
the top-down approach of this model) and following up the implementation process.
These two aspects go hand by hand, since it is much easier that top-management follow
up the implementation when is part of organization’s strategy.
The second enabler is motivation. As explained in the discussion, the construction
industry has a very strong culture that represents significant resistance to change. Some
of the interviewees claimed that many of the workers are not interested in new
methodologies and they just want to get the job done. This attitude is mainly found in
subcontractors. Within the contractor, arguments against new methodologies are more
focused on bringing more problems than benefits and some workers at all levels prefer to
do the work as usual. In order to address this challenge is useful to mention the mental
models described in Chapter 4 from Senge (2014).
The Ladder of Inference (Senge, 2014) shows how people take actions based their beliefs
after a process stating in observable data and experiences. For this reason, the
stakeholders’ needs model presented previously links motivation with competence, the
third enabler. Motivation and competence are tight together in this mental model and it
can be facilitated by providing training at all levels of the project organization.
As it was mentioned during the interviews, it is difficult to force workers to adopt specific
practices while they are doing their job, but it is possible to force them during the training.
In this way, ‘observable data and experiences’ are provided to the employees by
participating in practice-focused training. They will select the data from what they
observe and add meaning. It is expected that after seeing how Lean works with some
practical examples, for example using Lego® constructions, employees will make
assumptions based on the meaning added to the data observed, so they are able to draw
their own conclusions. From these conclusions, they adopt beliefs that will allow them to
take actions accordingly. When walking the same path regarding their actual work, the
reflexive loop make that current beliefs affect what data is selected next time, helping to
have a positive attitude towards Lean practices in the real job.
This explanation also provides foundation for the last enabler, involvement of actors. It
may happen that only part of the project’s crew have walked the Ladder of Inference of
Lean. These employees will have very positive attitude and good energy towards the
A Performance Measurement Model for Lean Construction
115
change. However, people who is still not convinced can easily bring much greater
resistance and threaten the successful implementation of Lean practices. For this reason
is important that all the people participating in the project get involved as well in the
training.
Now that the enablers have been described and both approaches, top-down and bottom-
up, have been initiated is possible to go through the resulting effects that should have the
attention according to the performance measurement model.
Effects
The effects enounced in the model may remind the section of results from the EFQM
Excellence Model. Again, in this case the effects are intended to be more explicit given
the precise focus of the model. The objective of these effects is to provide guidance when
developing the final KPIs to be used in practice. Effects are not indicators, but they
express a range of attributes where indicators could measure performance. It is neither
the intention that one KPI should be developed for each effect. As will be explained later,
the organization should develop a set of indicators according to some specific effects that
they have identified as key for the strategy of the organization.
Most of the effects collected in the model have been extracted from direct experience of
Lean Construction pioneers in Norway. Two of them, although not being explicitly
mentioned during the interviews as primary effects of implementing Lean, their
importance is enough foundation for being included in the model. These effects are costs
and customer satisfaction.
Although the costs are not the first parameter to improve, it is certainly a very important
part of every project evaluation if not the only one. Some of the companies participating
in the interviews have performed a simulation of costs, showing approximately the same
budget needs independently of using Lean or not. However, a significant part of the
budget in Lean projects cover training of all participants and the use of Lean consultants.
It can be expected a positive evolution of costs after certain experience with Lean projects
reduce the need of consultants and all the participants have received adequate training.
The cost savings have been also found as outcomes of Lean implementation in the
literature (Andersen et al., 2012).

Measuring Lean Construction
116
Customer satisfaction is, or should be a necessary condition for accomplishing the
mission of the organization. Furthermore, Lean should bring specific benefits for them
such a better understanding of the final product, shorter delivery, building with less
mistakes or minimized pending work after delivery. The tool that can help to a bigger
extent to achieve this effect is Virtual Design Construction (VDC) as a mean to provide
precise visual information about the product using 3D models. When the model was
reviewed with practitioners for testing its validity, they agree that ‘no one could discard
customer satisfaction as a relevant issue’ (author’s translation from the interview in
Norwegian, Interview 8).
From the effects that have been reported as direct benefits, the most relevant is the ability
to reduce completion time in projects. Furthermore is directly linked with the strategy as
well, so there should always be some indicators quantifying this effect. Lean practices
such as Pull Scheduling, Concurrent Engineering and Last Planner (involving planning)
contribute directly to reduce completion time.
During the interviews was also reported a better definition of responsibilities, which may
lead to improved flow of work and less disagreements during the development of the
project. Last Planner and Concurrent Engineering are the practices that could better
increase this effect as a result of involving actors in the decision making process for the
planning and design.
Tidiness is also one of the most common effects that are realized when using Lean. This
effect can be translated in a more structured building process, less disturb between
workers working in the same area and reduced risk of accidents for workers. Last Planner,
Pull Scheduling and Concurrent Engineering are the practices that could found direct
benefit in this effect and further development of indicators could be considered.
Practices enabling involvement of actors are connected also with allowing further
cooperation. This would increase the ability of solving problems raised during the
construction, finding an optimized design among the areas involved and the ability to
meet the plan. This effect can be directly linked to the use of VDC, Concurrent
Engineering and Last Planner.

A Performance Measurement Model for Lean Construction
117
Another important area of improvement realized by using Lean according to the findings
from the interviews is worker satisfaction. In many industries, worker satisfaction has
been used as an indicator anticipating customer satisfaction (Parmenter, 2010). In
construction, worker satisfaction could be linked with safety and a positive attitude
towards change, which can be crucial in the implementation process. Given the higher
degree of involvement of workers, Last Planner is the Lean practice that could have direct
effect on worker satisfaction. Although it could be reasonable to question how worker
satisfaction can contribute to reduce completion time in projects, practitioners
emphasized its importance in the Lean implementation when presenting the resulting
model, which could be influenced by strong correlation to other elements of the model
though this could not be tested in the present study.
The last effect to be mentioned is improved quality, which in practice is translated in less
mistakes during construction and fewer elements in the list of pending work after accepted
delivery. Furthermore, cooperation and actor’s involvement could serve as foundation for
increasing quality when using Concurrent Engineering, VDC or Last Planner. The
interview with practitioners presenting the model also revealed the inclusion in this aspect
of what it is called ‘better building’. This concept, often use in the construction language,
includes aspects like ‘less warranty claims as a result of defects in the construction, and
the higher level of energetic efficiency’ (author’s translation from the interview in
Norwegian, Interview 8).
Associating Lean Practices with Performance Effects
The effects described should serve as a guidance for developing further indicators. As has
being mentioned through their description, there are certain Lean practices that have
direct impact on some of the effects. Figure 11 shows visually these relations and may
serve as a guide for associating specific Lean practices to their most direct effects.
The relation between the effects and the specific practices has been found through the
comparison of tools used in each company and the most prominent effects reflected,
together with the insight from the literature on benefits encountered in the use of practices.
Furthermore, a deeper study of the functioning of each practice in other contexts than

Measuring Lean Construction
118
construction industry can provide useful links with the possible expected effects (Limon,
2014).
Figure 11: Practices Associated to Effects in the Performance Measurement Model
Legend to Figure 11:
Figure 11 could be read in two directions. First, considering that the organization has
already started the implementation of Lean practices and it could require the measurement
of its effects in order to sustain the implementation process. In this case, the organization
could make use of this model to know which effects are preferable to look at. On the
contrary, organizations contemplating the possibility of implementing Lean practices to
achieve their strategic goals, could use the model to assess which practices could better
support their strategy. Some authors mentioned the importance of focusing in the

A Performance Measurement Model for Lean Construction
119
implementation of few practices at a time to allow the organization acquiring fluency in
their use instead of implementing all practices at a time (G. Ballard et al., 2007). Thus,
the value of this model is to provide information about in what practices the organization
should be focused.
Summing up the Performance Measurement Model for the Implementation of Lean
practices, it starts by establishing a strategy aligned with Lean as it can be speeding up
project completion. The way to accomplish this strategy is through a feasible, accurate
design, reliable planning and waste reduction in processes in any of the TIMWOOD faces
of waste. The bottom-up approach should consider four enablers: top-management
providing guideline and following up through strategy, motivation, competence and
involvement of actors. Training can play an important role in the development of these
enablers. Finally, depending on what practices the company is focusing on the search of
indicators could be directed to the associated effects. And the other way around, in case
the company has not already a strong dedication in specific practices, the organization
could choose certain practices according to the effects more closely linked to their
strategy. Independently of the case, the model could guide the development of KPIs using
the effects provided and associated practices.
Following will be presented a set of indicators that could be used as an example, and most
important how to analyse those indicators to find out if they are the most appropriate for
supporting the implementation of Lean practices.
Considerations for Developing Sound Indicators
The eight primary effects formulated in the model are not defined indicators, but are
essential areas from where indicators can be developed depending on what the
organization is focusing on and what Lean tools is adopting. As described in the theory
of KPI, most of the authors agree on having less than 10 or 20 indicators (R. S. Kaplan &
Norton, 1992; Parmenter, 2010). However, these models refer to a measurement system
for the whole company. On the other side, Andersen and Fagerhaug (2002) claimed that
the maximum amount of elements that the human brain can digest visually at the same
time is seven. In general, it is a wise advice to try to reduce the number of KPI to a

Measuring Lean Construction
120
minimum because this will allow the organization concentrate better on their main
objectives.
The basic idea when defining the number of indicators could be ‘do not bite off more than
you can chew’. By focusing on few specific indicators, the organization will be able to
achieve greater results on those measures. On the contrary, having too many indicators
can difficult the realization of results in all of them. According to Parmenter (2010), it is
recommended to choose one or two indicators to monitor daily with the aim to have a
closer follow up from the top management. As will be seen next, the process for defining
the final set of indicators should be iterative in order to attain a balanced set of indicators.
More than just PPC
The indicators should be chosen accordingly to organization’s strategy focus, practices
implemented and measurement internal culture. One of the easiest indicators to come up
when implementing Lean, and specifically Last Planner is the Percentage Plan Completed
(PPC) defined by H. G. Ballard (2000). However, it has been found during the interviews
that some companies did not find this indicator as helpful as expected, and their argument
was that there could be many factors affecting this number. Conversely, this argument is
exactly the problem and the solution. If PPC is only measured as a value is true that it
does not provide much information for improving. The important part of measuring PPC
is to analyse the root causes for that value. For this reason, it is proposed that PPC is used
together with the 5-WHYs tool.
The five why’s tool is a common method for finding root causes consisting in asking up
to five times the reason for the event happening in order to find the origin reason causing
the problem. There could be a set of causes that are often mentioned and could help to
indicate where to improve. Some ideas for the root causes could be non-well defined
allocation of responsibilities, lack of actors’ involvement or any other of the TIMWOOD
faces of wasted mentioned in the theory. Furthermore, it could be interesting to apply the
Pareto principle, which claims that the 80% of the reasons for deviation would come from
a 20% of the causes allowing great improvement by focusing on few factors. This tools
and some are described in Andersen and Fagerhaug (2002).
A Performance Measurement Model for Lean Construction
121
Balanced KPIs
During the challenging process of finding the KPIs, the most important aspect about the
indicators is that they need to be balanced to correctly evaluate the current performance
and at the same time provide information to drive the change when having poor
performance. The analysis and characterization of indicators has been extensively
covered in Chapter 3 and Chapter 4, and therefore will not be a central area of the results.
However, it is relevant to sum up a number of aspects to look at when analysing
indicators.
First, whether they are past-, present-, or future-focused depending on when the action
measured take place as described in Figure 5: Focus and validity horizon of measures
(adapted from Andersen & Fagerhaug, 2002). Future-focused measures allow taking
action to correct deviations from the outcomes, however they are usually not as precise
as past-focused measures. On the contrary, past-focused measures have the ability to
evaluate whether the desired results were obtained, although they do not allow
anticipating action to correct deviations. Present-focused measures provide information
about the current performance, although actions taken based on this data can usually
impact the short-term results. As a consequence, a good set of indicators would combine
past-, present-, and future-focused measures to assess the performance while guiding
actions to achieve improved results. As described in the literature, this characterization
could also be done as leading or lagging indicators, although this manner could be more
confusing to assess.
Second, the timeframe when the indicators are reviewed should also be consistent with
their ability of driving future change. For example, if a certain measure is present-focused
but reviewed monthly, it completely missed its purpose. Therefore, when creating the set
of indicators it should be defined together the frequency of the data collection and the
period when they are reviewed to allow taking action effectively and serve the intended
purpose. An example can be extracted from the current practices of some interviewed
companies who reported measuring workers’ satisfaction once a month using surveys
where they could evaluate from 7 to 9 aspects of their work conditions. The frequency of
the measures and the period when they were reviewed allowed projects to improve their
performance during their development.

Measuring Lean Construction
122
The third aspect to consider is the number of effects covered by the measurement system.
The complete set of indicators should contain indicators assessing various of the effects
mentioned in model. Although the continuous monitoring is focused on one or two
indicators, it is also important to assess the performance of other effects. This can help to
identify shortcomings or collateral results influencing other areas, positive or negatively.
This aspect can observed in the evaluation worksheet that will be presented next, and it
divides the evaluation in four areas, each of them containing a number of the different
effects experienced (see Appendix A).
The final advice about the indicators is that it should be avoided the attempt to rely
exclusively in very accurate quantitative data. Sometimes, the collection of ‘soft’ data or
indirect measurement of indicators can provide very useful data that could not be
collected otherwise. For example, measuring the impact of the weather on project
performance is not an easy question but still can have a significant impact. Thus,
quantifying the number of days with bad weather or extreme bad weather according to
some pre-established parameters (i.e. <-50C, >3mm rain/snow, etc.) could be a helpful
first approach.
The most important conclusion about indicators is that they need to have meaning and
sometimes measuring a specific aspect is not a good indicator itself but applying further
analytical tools can be transformed in the KPI to be monitored. Moreover, indicators
should be balanced according to the criteria described above, for which it is required an
iterative process before the final set of indicators is agreed.
Evaluation Worksheet
One of the aspects with greater consensus about the desired characteristics of the
performance measurement system is possibility of benchmarking between projects. The
answer for this wish from the industry is proposed as an evaluation framework where
several metrics from projects are included while balancing their relative importance.
Appendix A contains a first proposal of an evaluation worksheet that could allow direct
project comparison. Appendix B shows an example of the use of the evaluation worksheet
after being presented to practitioners.

A Performance Measurement Model for Lean Construction
123
It should be emphasized that what this evaluation worksheet tries to show is not a specific
template to be used in every organization, rather an example of a method that brings
benchmarking possibilities. Therefore, what is important in the evaluation worksheet is
the idea of having a formal evaluation process that contains a set of defined project
indicators common to all projects covering a wide range of measures. Moreover, this
evaluation worksheet does not exclude the previously mentioned monitoring of indicators
along the project, with their respective frequency and review period defined.
As seen in the interviews and confirming Andersen et al. (2011) previous studies, current
project evaluation is very focused on costs as main factor, while other metrics such as
schedule accomplishment, quality or other HSE factors are less valued if at all considered
at project evaluation. According to performance measurement literature, measures
reflected in this evaluation is what actually drives the behaviour of project managers and
therefore is important to adapt this activity to strategic purposes. For example, if project
managers know that the evaluation relies only in costs, they will manage the project to be
sure of meeting the budget constraints, although this could threaten the schedule or quality
accomplishments that otherwise could have greater impact on customer’s satisfaction.
Organizations would need to spend some resources establishing the evaluation worksheet,
since it should be maintained in the long term. Changing the evaluation worksheet would
mean losing partially the ability to compare previous results. For this reason is important
to have an initial period for testing the evaluation method accepting several iterations.
Besides a specific period for the testing phase should be established beforehand to not
extend indefinitely the implementation of the measurement system, as well as the idea of
reaching a 100% perfect measurement system should be discarded. It should be
acknowledged that the system would require an update after a certain time. Having an
excessively static evaluation method is also a significant threaten to an effective
measurement system (Melnyk et al., 2014). Considering the risks on both sides, it can be
concluded that the validity horizon of the measurement system should be aligned with the
validity horizon of the strategy. Shorter evaluation sessions can be programmed although
the modification of the evaluation parameters need to be a carefully considered option.
The evaluation framework proposed here consider four areas of assessment: core project
metrics, customer metrics, workers metrics and environmental metrics. Each of these

Measuring Lean Construction
124
areas would have a determined weight in the global score according to organization’s
priorities. The worksheet contains basic elements for project identification and project
manager responsible, and scores on each areas that should be added to obtain the total
score of the project. Appendix B shows a practical example of how the worksheet should
be filled, indicating in the black colour the information that is common to all projects such
as indicators and relative importance, while the data that the project manager should fill
is indicated in blue. Moreover, the formulas used are presented showing an aggregation
method that would result in a score of 100 when all the expectations and predictions are
satisfied, a giving above 100 when expectations are overachieved according to the
balancing values (importance column). This enables internal benchmarking, although
external comparison of projects is limited.
Furthermore, the values from metrics in each area should be used as a percentage or
increment in order to have dimensionless magnitudes that allow comparison between
projects of different sizes. For this reason, each metric has a column for the dimensionless
value (rate), another column to define the relative importance of that metric over the
whole assessment (import.), and the last column for the final score of the metric (value).
Other aggregation methods for indicators have been used before in project evaluation
methods (Berrah & Clivillé, 2007; Marques, Gourc, & Lauras, 2011) and applying these
to the present framework constitutes an area for further research. Following are further
explained the assessment areas.
Core project metrics contains the most common aspects currently used in the evaluation
of projects such as schedule, cost, quality or HSE aspects. It would be wise to include in
this assessment area the KPI chosen as reference to be monitored. The example provided
in the Appendix A contains in this area the average PPC value together with its root
reasons and the strategic alignment of the project.
The next assessment area is customer metrics. This area is expected to be filled in the
early phases of the project and it should contain the specific expectations of the final user,
often represented by the project owner. For obvious reasons is not possible to fill this area
in advance by the organization since they most likely have a wide portfolio of customers
with different needs and strategies. The score here could be obtained from a standard
survey to measure customer satisfaction.
A Performance Measurement Model for Lean Construction
125
Worker metrics assessment have a wide range of possibilities to be measured and each
organization would need to find their best way according to their own measurement
culture. The only advice from the interviews is not measuring individuals’ performance
and keep measures at team level to avoid hanging one worker and create negative
perception towards the measurement system. The worksheet proposed reflects how it
would be in case of assessing worker satisfaction with a regular survey where they have
to evaluate different aspects from 1 to 7. The total scores in the project could be collected
in the evaluation worksheet and even weight their relevance for the final score.
Finally, environmental metrics are aimed to provide information about specific
circumstances that could affect the development of the project. These events often make
difficult to assess whether the improvement in projects come from the application of
specific practices or are the result of better external conditions. Some could criticize the
accuracy of these data and the extent to which projects are affected. However, should be
considered the difficulty of measuring the data and the actual costs that could have if at
all possible. Thus is advised to have an approach of ‘good enough’ measures to make
easier the implementation of the performance measurement system while maintaining its
validity.
An example of this type of measures is the weather, as showed in the evaluation
document. It is clear that extreme weather affect the working conditions, especially in
construction and especially in Norway. Establishing some thresholds value for
temperature, rain or snow can facilitate the inclusion of its impact on the project.
Obviously, employees still work behind those thresholds, but it is also clear that they
would need breaks more often or require more time for the same tasks. Other aspects,
such as changes should also be considered in context, since they may respond to repair
mistakes or added value for the customer. Both should be considered as having impact on
project metrics, but with opposite result in the final score. Olsson (2006) proposed a
specific framework that could be very useful when analysing flexibility issues in projects.
In this case, changes in the project are considered under a stakeholder’s perspective, being
flexibility when is the owner who is asking for these changes, and re-work when is on
project’s responsibility.

Measuring Lean Construction
126
The last aspect to be mentioned is the formatting of the evaluation worksheet. Although
this evaluation is shown in paper, this kind of evaluation would be better suited for its use
integrated in the IT system of the company. The interview with practitioners shown that
the current system of the company could admit to a large extent this type of evaluation.
The advantages of using IT systems are obvious and it would allow managing data
collection, access and security, and the reporting capabilities could generate this
document. Further discussion of the most appropriate system is out of the scope of this
thesis although is an important part to be considered when implementing the system.
Further comments received when presenting the model to research and practitioners are
mostly focused on the metrics used in the evaluation worksheet. It was appreciated the
inclusion of metrics not directly under control of the management to evaluate project
success and allow comparing projects. It was shown special interest to include not only
weather issues, but also nature-related aspects as unforeseen characteristics of the soil or
the appearance of groundwater. Another aspect that was considered relevant to be
included in the evaluation is to assess the quality of construction, or in words of the
building’s project manager when the construction is ‘better built’ (author’s translation
from the interview in Norwegian, Interview 8). This characteristic was defined by the
interviewees as the performance on the energy impact assessment (EIA) and the quality
in terms of warranty repairs. As mentioned before, the evaluation worksheet presented
does not pretend to provide a defined set of indicators to be used, rather a guideline on a
wide perspective in evaluation methods. For this reason, only Appendix B shows the
adaptation of the indicators mentioned.
Summarizing, the key aspect of this framework is extending the scope of the evaluation
of projects further than just cost or time. Evaluation of projects is the way organizations
have to tell project managers in what aspects they should focus, and it is of course a
performance measurement system even if it is not being considered as such. When this
fact is acknowledged, the evaluation can be utilized in the direction to help the company
to achieve its goals.
A Performance Measurement Model for Lean Construction
127
The Roadmap of Performance Measurement in Lean implementation
Now that all the elements of the performance measurement model has been described in
detail, this section will try to give a general overview of the process linking the different
elements of the system. Hence, the aim is not to provide a full description of the Lean
Performance Measurement implementation process, but showing the link between the
different elements of the system. This will be shown in a number of steps following the
logic of the model.
Step 1: Speed Up projects as part of the strategy
Independently if the company has carried out already some attempts in implementing
Lean, the first question to address is whether the organization’s strategy would require
the implementation of Lean. The situation when the implementation of Lean would be
highly recommended is if the company’s strategy contains elements indicating an effort
in reducing the completion time of projects. This state is the initial reference for the
model.
It has been found a common practice from the interviews (Interview 2), and also reported
in G. Ballard et al. (2007), the use of some demonstration projects after basic training is
provided in order to learn how to apply Lean principles. These pilot projects could provide
valuable information about which effect the organization want to focus on in the future,
and they serve as a tool to gain the engagement of the top-management.
Step 2: Map the objectives that will allow achieving the strategy
Once the organization have in place the strategy related to speed up projects, some
specific goals must be identified as part of the top-down approach. These goals should
describe how to achieve the strategy, similarly to the Strategy Map from the Balanced
Scorecard described in page 31. The model purposes three goals as the means to achieve
the speed up of projects. The first goal is to have a design that is possible to be built on
site and efficient in the construction process. The second goal is to have a plan that the
project is able to follow and that will lead the speed up accomplishment. And the third
goal is to avoid waste in the process in any of its faces (TIMWOOD, as previously

Measuring Lean Construction
128
explained in this chapter). The goals here described are basic elements for achieving the
strategy, although each organization could include more aspects from their
organizational-specific perspective.
Step 3: Facilitate the identified enablers
When the objectives structure is in place, it should start the bottom-up approach, requiring
facilitating the enablers mentioned in the model. From the top-down approach, the first
enabler would only need following up of the implementation from top-management level,
which is mostly ensured once it is part of business’s strategy. The next enablers,
motivation and competence should be provided to the whole project team. Practical
training showing how Lean practices would work has been reported as a very positive
experience for this purpose. Involvement of actors has been identified as the last enabler,
which would include the participation of everyone involved in Lean practices in the
process of acquiring motivation and competence, as well as deploying the practices.
Additionally, identifying organizational-specific barriers and eliminating these obstacles,
especially those exposed in the previous chapter, can be an important part of the
facilitation process.
Step 4: Identify the effects to pursue
At this point all the basic elements for implementing Lean have been covered and it starts
the actual process of adopting practices. Figure 11 (previously presented in page 118)
shows the relation between the most common Lean practices and the direct effects that
can be expected. There are two possible perspectives: having already implemented some
Lean practices so the need is to measure effects, or having some effects as objectives and
Lean practices need to be selected. In any case, at the end of this stage it should be clear
for the organization what practices to apply and which effects are prioritized.
Step 5: Generate a balanced set of KPIs
Given the effects that the organization pursue to improve, a balanced set of KPIs should
be selected together with the frequency of measurement and period for reviewing
performance according to their purpose. Following is a group of characteristics that could
be used as a checklist for the definition of key performance indicators.

A Performance Measurement Model for Lean Construction
129
Each indicator serve a specific purpose or purposes linked to the effects pursued
Well distributed presence of past-, present-, and future-focused indicators
(lagging vs. leading indicators)
Monitoring frequency of data collection and reviews period according to its
purpose
All the effects pursued are represented in the KPIs
Presence of both soft and hard measures
Step 6: Generate the Evaluation Worksheet
These KPIs should be translated to an evaluation worksheet, which could be built up
within the IT systems of the company as part of the project evaluation process. It should
be distinguished two parts in the performance measurement system. On one side, the
continuous monitoring of the projects which allows corrective action. The information
systems of the company should provide the tools for the collection, analysis and
distribution of data according to the defined needs from the KPIs. On the other side, the
evaluation worksheet collects the final results of the indicators monitored along the
project and additional specific measures for its evaluation.
Using a specific framework for project evaluation have a number of benefits. First, it
makes wider the scope of project evaluation, promoting better practices among project
managers according to organization’s strategy. The evaluation worksheet could serve as
a tool for the standardization of processes in the ‘Lean Journey’ (G. Ballard et al., 2007).
Second, it provides a base for assessing the impact of Lean practices in projects, as well
as circumstantial factors. Finally, it allows benchmarking of projects, which can provide
direction for improvement and further development of strategy.
Step 7: Further work
The scope of the thesis is limited to the study of how the effects of Lean practices can be
measured, and therefore the actual implementation within organizations has not been
covered. However, there are some aspects that should be acknowledged.
Measuring Lean Construction
130
The purpose of the performance measurement system presented is to support the
implementation process of Lean practices. Andersen and Fagerhaug (2002) described the
implementation process of a performance measurement system, which includes in the last
steps the design of reporting and presenting formats (covered to a certain extent in the
current thesis), testing and adjusting the system and the actual implementation for its use
within the organization. This includes the need of evolving the system once an acceptable
level of implementation is achieved or reviewing it in case new challenges are identified.
Further references about the implementation process can be found in the literature
presented in Chapter 4 (see page 67).
The presented roadmap collects the most significant elements of the performance
measurement model created for supporting the implementation of Lean practices in the
construction industry. In addition, as a purpose-specific framework it might be deployed
together with other KPIs for different aspects of the global strategy of the organization.
The model presented is a first attempt to cover certain needs identified in the industry,
although further work is needed to test the model in practice and adapt the possible
deficiencies.
Chapter 8:
Conclusions and
Further Research
This chapter includes the conclusion notes of the present thesis by pointing at the key
findings and contributions according to the original purpose, as well as recognizing their
limitations and purposing paths for future research in the areas covered.
Conclusions
The construction industry in Norway has carried out during the last decade a number of
efforts in the implementation of Lean practices. The practices in which the organizations
are focused vary as well as the level of implementation and results obtained, but with the
exception of certain companies the implementation is still limited and so the results
obtained.
The use of performance measurement systems to drive the improvement of processes and
the recent interest from the industry in these tools provide a sound foundation for the use
of these frameworks in conjunction with Lean practices. The general trend among
performance measurement frameworks presented in the literature during the last years, as
well as the evolution of success factors in construction projects, indicate that purpose-
specific measurement models can be a meaningful solution for supporting the
implementation of Lean.

Measuring Lean Construction
132
The purpose of the thesis has been to gain insight into how Lean practices are applied in
the construction industry and examine the performance measurement systems that could
contribute to their successful implementation. Several research questions were defined to
frame the study.
1. What performance improvement attempts are construction companies carrying
on?
Among the Lean practices, the one that have been found more often in the companies is
the Last Planner, which adoption within the companies take different names, usually
referring to involving planning. Although it is not being implemented to a full extent
according to the original theory by G. Ballard et al. (2007), companies have realized some
improvements by adapting the practices to their needs. The use of Pull Scheduling, often
part of the Last Planner system, is less extended and traditional methods for the planning
are still predominant. However, those projects who have used this practice acknowledge
its potential for reducing the project’s completion time and its use is further encouraged.
The key factor for the implementation in practice was having received specific training
on those practices to make project participants confident in their use.
Another practice that has a strong presence is Concurrent Engineering, although similarly
to other practices is often not implemented to a full extent. According to the literature and
the practitioners’ perspective, Concurrent Engineering can be considered under the
principles of Lean. Nevertheless, its implementation could be focused on maximizing
concurrency rather than a general Lean approach. The use of Concurrent Engineering in
practice is often associated with the use of Virtual Design Construction tools and more
specifically having concurrent meetings although these are focused on the execution
phase as a problem-solving tool.
When assessing the extent to which these practices were being implemented, the result is
widespread. While some companies have adopted a strategic perspective in the use of
Lean encouraging its implementation in every project, other companies lack of such
experience and adopt these practices only in the cases where is strictly needed due to time
constraints. This makes necessarily a difference in terms of organizational learning about
the use of Lean, although this can be considered only as a consequence of the
implementation stage of Lean. Hence it could be expected that the use of Lean practices

Conclusions and Further Research
133
is extended in the future once companies realize the benefits obtained both internally and
throughout the subcontractors.
Together with the practices itself, other aspects have been discussed in order to have a
wider perspective of the current situation. It has been found that the workers played a
fundamental role in the deployment of Lean practices, either because of the company is
willing to improve their labour conditions, because they were claiming improvements in
the planning process or because it was employees’ initiative to use certain practices.
Although this is a significant fact, practitioners agreed on the need of having a top-down
approach for the successful implementation of practices. In other cases, time constraints
in projects motivated the use of Lean practices.
Another aspect that has been considered analysing the use of Lean practices in the
construction industry has been the practitioners’ perspective on Lean. This resulted in a
Lean model (Figure 8) based on the figurative idea of a train with each coach representing
the activities required for the construction, so the train moves simultaneously through the
construction site until the building is completed. Furthermore, it emphasizes the need of
extensive involvement of actors and provide the required training. The practices described
together with the other use-related issues and the model expressing the practitioner’s
perspective of the Lean practices represents a clear picture of the performance
improvement attempts in the construction industry.
2. What are the effects of these practices in project performance?
Further analysis was focused on the actual benefits that the companies were obtaining in
Lean projects and the difficulties found over the implementation process. The aim was to
find which areas have obtained greater benefits derived from the use of Lean practices as
well as the success factors for achieving those benefits.
The first result to be mentioned is the reduction of projects’ completion time, which has
been mentioned for every project during the interviews with severe reductions in some
cases. The improvement of quality has been commonly mentioned, especially referring
to building with less mistakes and having less items in the pending work list after delivery
of the product. The interviews for assessing the model indicated also improvement in the
warranty costs and better results in the energy impact assessment. Completing the iron

Measuring Lean Construction
134
triangle, costs are usually not one of the first characteristics to improve due to the need of
training and consultancy which costs were allocated within the budget of the projects.
Thus it can be expected greater improvement in costs when the amount of training and
consultants are reduced as a consequence of the learning curve.
The aspect that probably has achieved greater improvement after completion time is
predictability. This is translated in project owner’s ability to determine precisely the
termination date and optimize the management of their facilities. At the same time,
workers’ improved their ability to assess whether they will be able to perform their tasks
considering minor injuries, which reduces the absence rate.
The impact of Lean practices in workers satisfaction is the third key improvement
experienced. This aspect is related to other collateral issues, such as improved
cooperation, better defined responsibilities, less fights during the projects, greater
commitment to the plan, among others. Even though some projects required working
overtime, the freely commitment from the workers made that still the satisfaction at the
completion of the project was very positive as they would accept working using those
methods over longer periods of time obviously excepting the use of overtime.
These effects can be validated from Lean literature as demonstrated in Andersen et al.
(2012) and Salem et al. (2006).
3. What are the stakeholders’ needs in the implementation process?
In addition to the Lean practices and its effects in projects, a stakeholder analysis was
performed in order to further analyse the participation of the stakeholders in the
implementation and their needs for increasing their involvement to the expected level.
The result of this analysis is the stakeholders’ needs model presented in Figure 9.
The stakeholders’ needs model indicate three basic needs for the implementation process
of Lean, which are in accordance with the findings from Bakås et al. (2011). Additionally,
the model links the specified needs to the different stakeholders in the construction
industry revealing who has the need and which stakeholder could provide the sufficient
coverage.

Conclusions and Further Research
135
The first basic need is strategic decisions from top management and owners in order to
provide guidance to project managers in the decision making process. Second, employees
participating in the projects, from managers to subcontractors, would need to acquire the
competence necessary to know how to apply the practices, and the motivation from the
convincement of its benefits for the effective use of those practices. Based on the metal
models from Senge (2014) and aligned with the findings from Kim and Park (2006), it
can be argued that providing practical training could enable both competence and
motivation. Finally, the ability to measure results could facilitate making strategic
decisions towards the implementation of Lean practices and it would allow project
managers driving the projects successfully while applying these practices.
From the expressed need of measuring results is rooted the motivation for creating a
performance evaluation system specific for its use in the context of implementing Lean
in construction companies, which could leverage the accomplishment of the expected
benefits.
4. How can these effects be measured (in order to support the fully implementation
of those practices)?
The proposal for measuring the effects derived from the use of Lean practices is defined
in the performance measurement model expressed in Figure 10. As explained in The
Roadmap of Performance Measurement in Lean implementation (page 127), the model
contains two approaches.
The top-down approach starts with the creating of a strategy towards reducing the
completion time of projects, being further developed through three goals. The first goal
is having a reliable design that can be built with fidelity in the construction site. Second,
having a reliable plan that the workers are able to meet and that brings the time
accomplishments, and thirdly reducing waste through any of the possible faces (transport,
inventory, motion, waiting, over-processing, overproduction and defects).
Following is the bottom-up approach, which is shaped by the enablers extracted from the
stakeholders’ needs model. These enablers include the support from top-management in
form of guidance and following up of the implementation process, motivation and
competence from project’s participants and involvement of all relevant actors.
Measuring Lean Construction
136
The model then facilitate the identification of effects that each company could pursue
according to their status in the implementation process, and then a balanced set of key
performance indicators should be generated according to their purpose, time-focus,
frequency and reviewing period of the measure and the use of both hard and soft
measures. Extensive literature review of indicators used in the construction industry as
well as success factors in projects aims to support the generation process of KPIs (Table
3, Table 4).
Additionally to the generation of KPIs for supporting the implementation of Lean
practices, the model purposes an Evaluation Worksheet which is intended for enabling
benchmarking between projects. This tool should adapted by the organization according
to their priorities, serving as a framework for an extended project evaluation. The
organization should decide internally in what metrics they should base the evaluation of
projects and the relative importance of each metric in the final score. Four general areas
are purposed to be included. General project metrics around the iron triangle (cost, time
and quality), customer metrics, worker metrics (related to HSE), and environmental
metrics including factors out of the control of the management that could impact the
project outcomes.
The main contribution of the evaluation worksheet further than allowing project
benchmarking is the inclusion of the external factors in the evaluation. This enables to
assess whether the improvement in the performance came from the implemented practices
or was the coincidence of other factors, which was one of the main claims from
practitioners.
Although the study of the latter implementation of this model is out of the scope of the thesis,
the criticality of this aspect in the success of the performance measurement systems enforces
the literature review of these issues (
Organizational change, page 67).
All in all, the thesis provides a general overview of the use of Lean practices in the
construction industry and accounts for the benefits obtained as a result of their
implementation. Furthermore, it looks at the needs for improving the implementation
under a stakeholders’ perspective and provides a framework for the effective
implementation of Lean practices as well as enables the measurements of its results.
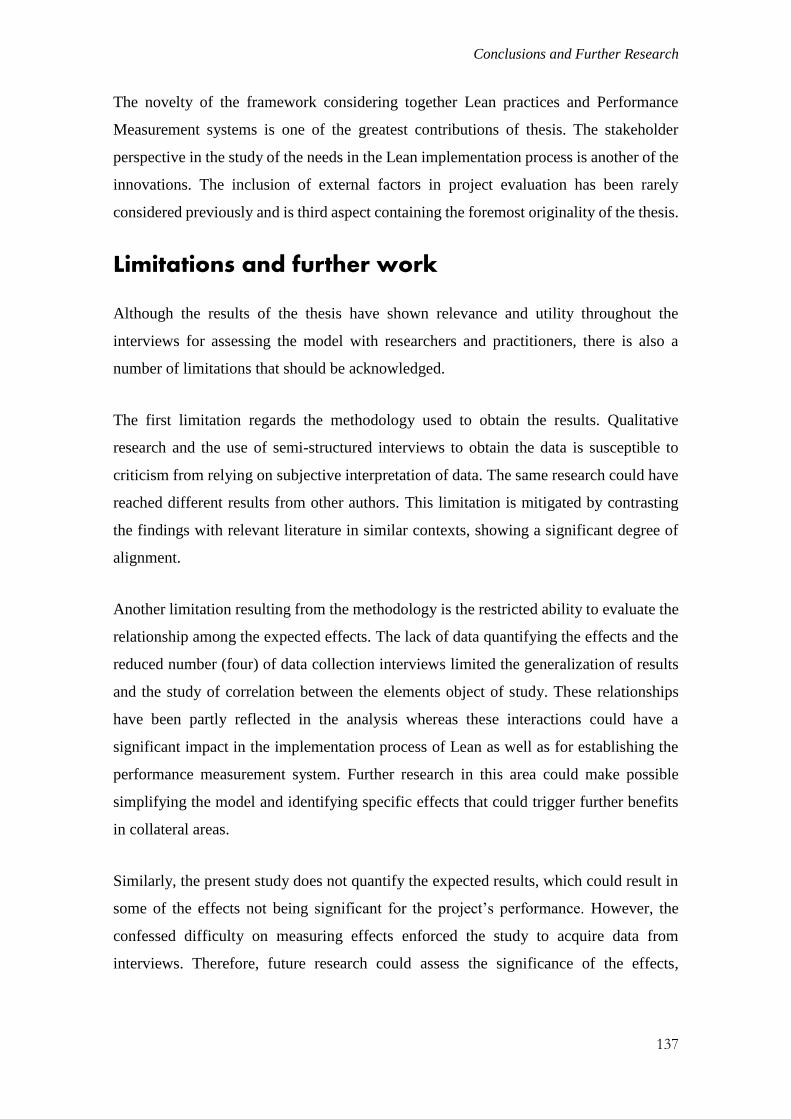
Conclusions and Further Research
137
The novelty of the framework considering together Lean practices and Performance
Measurement systems is one of the greatest contributions of thesis. The stakeholder
perspective in the study of the needs in the Lean implementation process is another of the
innovations. The inclusion of external factors in project evaluation has been rarely
considered previously and is third aspect containing the foremost originality of the thesis.
Limitations and further work
Although the results of the thesis have shown relevance and utility throughout the
interviews for assessing the model with researchers and practitioners, there is also a
number of limitations that should be acknowledged.
The first limitation regards the methodology used to obtain the results. Qualitative
research and the use of semi-structured interviews to obtain the data is susceptible to
criticism from relying on subjective interpretation of data. The same research could have
reached different results from other authors. This limitation is mitigated by contrasting
the findings with relevant literature in similar contexts, showing a significant degree of
alignment.
Another limitation resulting from the methodology is the restricted ability to evaluate the
relationship among the expected effects. The lack of data quantifying the effects and the
reduced number (four) of data collection interviews limited the generalization of results
and the study of correlation between the elements object of study. These relationships
have been partly reflected in the analysis whereas these interactions could have a
significant impact in the implementation process of Lean as well as for establishing the
performance measurement system. Further research in this area could make possible
simplifying the model and identifying specific effects that could trigger further benefits
in collateral areas.
Similarly, the present study does not quantify the expected results, which could result in
some of the effects not being significant for the project’s performance. However, the
confessed difficulty on measuring effects enforced the study to acquire data from
interviews. Therefore, future research could assess the significance of the effects,

Measuring Lean Construction
138
although it might be necessary to implement first the measurement model in order to
generate the necessary data.
The companies participating in the interviews belong to a specific context that is the
construction industry in Norway. The applicability of the model to other contexts should
be examined to ensure its validity, and it represents an area for further research. Moreover,
the study has not been limited to a specific type of projects although there can be
significant differences depending on the type of construction. Extending the study
including a set of different type of projects could improve the assessment of the
applicability of the model.
Further research could also include the development of specific key performance
indicators to be used according to the type of project, the generation of an implementation
process including guidelines about how to test, adjust and review the measurement system
and even the practical implementation of the measurement model in projects.
Additionally, aggregation methods for balancing the importance of indicators could be
applied to the evaluation system.
Other perspectives from Lean implementation could add significant insight on the success
factors. For example, focusing on organizational behaviour could examine in more detail
the motivation of people adopting Lean practices. Moreover, studying the role of
performance measurement systems in dealing with uncertainty management can have a
significant impact when measuring and implementing Lean, especially in case of
considering the degree of projects’ complexity.
References
Abraham, G. L., & Chinowsky, P. (2003). Critical success factors for the construction industry.
Paper presented at the Proceedings of Construction Research Congress, March.
Al-Tmeemy, S. M. H. M., Abdul-Rahman, H., & Harun, Z. (2011). Future criteria for success of
building projects in Malaysia. International Journal of Project Management, 29(3),
337-348. doi: 10.1016/j.ijproman.2010.03.003
Alsulamy, S., Gupta, N., & Sloan, B. (2014). Factors influencing municipal construction project
performance. Proceedings of the Institution of Civil Engineers-Municipal Engineer,
167(2), 108-117. doi: 10.1680/muen.13.00029
Alzahrani, J. I., & Emsley, M. W. (2013). The impact of contractors' attributes on construction
project success: A post construction evaluation. International Journal of Project
Management, 31(2), 313-322. doi: 10.1016/j.ijproman.2012.06.006
Andersen, B., Belay, A. M., & Seim, E. A. (2012). Lean Construction Practices and its Effects:
A Case Study at St Olav’s Integrated Hospital, Norway. Lean Construction Journal,
2012, 122-149.
Andersen, B., & Fagerhaug, T. (2002). Performance Measurement Explained: designing and
implementing your state-of-the-art system: Asq Press.
Andersen, B., Olsson, N. O., Onsøyen, L. E., & Spjelkavik, I. (2011). Post-project changes:
occurrence, causes, and countermeasures. International Journal of Managing Projects
in Business, 4(2), 308-328.
Arayici, Y., Coates, P., Koskela, L., Kagioglou, M., Usher, C., & O'reilly, K. (2011).
Technology adoption in the BIM implementation for lean architectural practice.
Automation in Construction, 20(2), 189-195.
Bakås, O., Govaert, T., & Van Landeghem, H. (2011). Challenges and success factors for
implementation of lean manufacturing in european SMES. Paper presented at the 13th
International conference on the Modern Information Technology in the Innovation
Processes of the Industrial Enterprise (MITIP 2011).

Measuring Lean Construction
140
Baker, B. N., Fisher, D., & Murphy, D. C. (1974). Determinants of project success - NASA-CR-
139407.
Ballard, G. (2008). The lean project delivery system: An update. Lean Construction Journal,
2008, 1-19.
Ballard, G., & Howell, G. (1997). Implementing lean construction: improving downstream
performance. Lean Construction, 111-125.
Ballard, G., & Howell, G. (2003). Lean project management. Building Research & Information,
31(2), 119-133.
Ballard, G., Kim, Y., Jang, J., & Liu, M. (2007). Roadmap for lean implementation at the
project level. The Construction Industry Institute.
Ballard, H. G. (2000). The last planner system of production control. The University of
Birmingham.
Bandecchi, M., Melton, B., & Ongaro, F. (1999). Concurrent engineering applied to space
mission assessment and design. ESA bulletin, 99, 34-40.
Bassioni, H., Hassan, T., & Price, A. (2008). Evaluation and analysis of criteria and sub-criteria
of a construction excellence model. Engineering, Construction and Architectural
Management, 15(1), 21-41.
Bassioni, H., Price, A., & Hassan, T. (2004). Performance measurement in construction.
Journal of Management in Engineering, 20(2), 42-50.
Bassioni, H. A., Price, A. D. F., & Hassan, T. M. (2005). Building a conceptual framework for
measuring business performance in construction: an empirical evaluation. Construction
Management and Economics, 23(5), 495-507. doi: 10.1080/0144619042000301401
Beary, T. M., & Abdelhamid, T. S. (2005). Production planning process in residential
construction using Lean Construction and six sigma principles (pp. 153-162).
Beatham, S., Anumba, C., Thorpe, T., & Hedges, I. (2004). KPIs: a critical appraisal of their use
in construction. Benchmarking: an international journal, 11(1), 93-117.
Beatham, S., Chimay, A., Tony, T., & Ian, H. (2005). An integrated business improvement
system (IBIS) for construction. Measuring Business Excellence, 9(2), 42-55. doi:
10.1108/13683040510602876
Bell, S. (2005). Lean Planning and Execution. Chichester, UK: Chichester, UK: John Wiley &
Sons, Ltd.
Berggren, C. (1993). Lean production—the end of history? Work, Employment & Society, 7(2),
163-188.
Berrah, L., & Clivillé, V. (2007). Towards an aggregation performance measurement system
model in a supply chain context. Computers in Industry, 58(7), 709-719. doi:
http://dx.doi.org/10.1016/j.compind.2007.05.012
Bourne, M., Mills, J., Wilcox, M., Neely, A., & Platts, K. (2000). Designing, implementing and
updating performance measurement systems. International Journal of Operations &
Production Management, 20(7), 754-771.
Cassell, C., Worley, J., & Doolen, T. (2006). The role of communication and management
support in a lean manufacturing implementation. Management Decision, 44(2), 228-
245.
Cox, R. F., Issa, R. R., & Ahrens, D. (2003). Management's perception of key performance
indicators for construction. Journal of construction engineering and management,
129(2), 142-151.

References
141
Chan, A. P., & Chan, A. P. (2004). Key performance indicators for measuring construction
success. Benchmarking: an international journal, 11(2), 203-221.
Chan, A. P., Scott, D., & Chan, A. P. (2004). Factors affecting the success of a construction
project. Journal of construction engineering and management, 130(1), 153-155.
Cheung, S. O., Suen, H. C. H., & Cheung, K. K. W. (2004). PPMS: a Web-based construction
Project Performance Monitoring System. Automation in Construction, 13(3), 361-376.
doi: http://dx.doi.org/10.1016/j.autcon.2003.12.001
Cheung, S. O., Wong, P. S. P., & Wu, A. W. Y. (2011). Towards an organizational culture
framework in construction. International Journal of Project Management, 29(1), 33-44.
doi: http://dx.doi.org/10.1016/j.ijproman.2010.01.014
DETR. (2000). KPI Report for The Minister of Construction: DETR, Department of the
Environment, Transport and Regions.
Dombrowski, U., & Mielke, T. (2014). Lean Leadership – 15 Rules for a Sustainable Lean
Implementation. Procedia CIRP, 17(0), 565-570. doi:
http://dx.doi.org/10.1016/j.procir.2014.01.146
Drohomeretski, E., Da Costa, S. E. G., De Lima, E. P., & Garbuio, P. A. D. R. (2014). Lean, Six
Sigma and Lean Six Sigma: an analysis based on operations strategy. International
Journal of Production Research, 52(3), 804-824. doi: 10.1080/00207543.2013.842015
Dvir, D., Lipovetsky, S., Shenhar, A., & Tishler, A. (1998). In search of project classification: a
non-universal approach to project success factors. Res. Policy, 27(9), 915-935.
EFQM. (2012). The EFQM Excellence Model. Retrieved 3 May 2015, from
http://www.efqm.org/the-efqm-excellence-model
Ekambaram, A. (2008). The role of knowledge transfer in reducing reinvention of the wheel in
project organizations. (2008:146), Norwegian University of Science and Technology,
Faculty of Social Sciences and Technology Management, Department of Industrial
Economics and Technology Management, Trondheim.
Elattar, S. M. S. (2009). Towards developing an improved methodology for evaluating
performance and achieving success in construction projects. Scientific Research and
Essays, 4(6), 549-554.
Gasparík, J., Gasparíková, V., & Ellingerová, H. (2014). Improvement Of Quality Management
Level In Construction Company Using EFQM Model. Organization, Technology &
Management in Construction, 6(1), n/a.
George, M. L., Rowlands, D., & Kastle, B. (2006). Lean six sigma: Springer-Verlag.
George, M. O. (2010). The lean six sigma guide to doing more with less: cut costs, reduce
waste, and lower your overhead. Hoboken, N.J.: J. Wiley & Sons.
Golafshani, N. (2003). Understanding reliability and validity in qualitative research. The
qualitative report, 8(4), 597-606.
Gudiene, N., Banaitis, A., & Banaitiene, N. (2013). Evaluation of critical success factors for
construction projects - an empirical study in Lithuania. International Journal of
Strategic Property Management, 17(1), 21-31. doi: 10.3846/1648715x.2013.787128
Haji-kazemi, S., & Norges teknisk-naturvitenskapelige universitet Institutt for produksjons- og,
k. (2015). The early warning procedure in projects : foundations, approaches and
challenges. (2015:52), Norwegian University of Science and Technology, Faculty of
Engineering Science and Technology, Department of Production and Quality
Engineering, Trondheim.
Hauser, J., & Katz, G. (1998). Metrics: you are what you measure! European Management
Journal, 16(5), 517-528.

Measuring Lean Construction
142
Hauser, J. R., & Clausing, D. (1988). The house of quality.
Hoseini, E. (2015). Project planning in the Norwegian construction industry. (Master in Project
Management), Norges Teknisk-Naturvitenskapelige Universitet, NTNU, Trondheim.
Inayat, A., Melhem, H., & Esmaeily, A. (2015). Critical Success Factors in an Agency
Construction Management Environment. Journal of construction engineering and
management, 141(1). doi: 10.1061/(asce)co.1943-7862.0000921
Jaafari, A. (1997). Concurrent construction and life cycle project management. Journal of
construction engineering and management, 123(4), 427-436.
Johnson, K. (2002). Measuring up: do you have a scorecard? In P. Wilderer, G. Amy, E. Arvin,
L. Blackwell, M. F. Hamoda, P. S. Mikkelsen, T. Mino, E. Morgenroth, R. Otterpohl,
M. N. Pons, W. Rauch, T. Stephenson, Z. Ujang, & Z. Jianrong (Eds.), 2nd World
Water Congress: Water Distribution and Water Services Management (Vol. 2, pp. 181-
187).
Kagioglou, M., Cooper, R., & Aouad, G. (2001). Performance management in construction: a
conceptual framework. Construction Management and Economics, 19(1), 85-95.
Kaplan, R. S., & Norton, D. P. (1992). The Balanced Scorecard - measures that drive
performance. Harvard Business Review, 70(1), 71-79.
Kaplan, R. S., & Norton, D. P. (2004). Strategy maps: Converting intangible assets into
tangible outcomes: Harvard Business Press.
Khanzode, A., Fischer, M., Reed, D., & Ballard, G. (2006). A guide to applying the principles
of virtual design & construction (VDC) to the lean project delivery process. CIFE,
Stanford University, Palo Alto, CA.
Kim, D., & Park, H.-S. (2006). Innovative construction management method: Assessment of
lean construction implementation. KSCE journal of Civil Engineering, 10(6), 381-388.
Kirk, J., & Miller, M. L. (1986). THE PROBLEM OF RELIABILITY. Reliability and Validity in
Qualitative Research. SAGE Publications, Inc. Newbury Park, CA: SAGE Publications,
Inc.
Koskela, L. (1992). Application of the new production philosophy to construction: Stanford
University (Technical Report No. 72, Center for Integrated Facility Engineering,
Department of Civil Engineering). Stanford, CA.
Koskela, L. (1997). Lean production in construction. Lean Construction, 1-9.
Kristensen, K. H., Andersen, B., & Torp, O. (2013). Performance measurement in the building
design process: a tool for building design managers. Journal of Design Research, 11(2),
148-167.
Kumar, R. (2005). Research Methodology: a step-by-step guide for beginners (Second edition
ed.). London: SAGE.
Langlo, J. A., Bakken, S., Karud, O. J., Landet, R. R., & Andersen, B. (2015) Prestasjonsmåling
i norsk BAE-næring. SINTEF Teknologi og Samfunn.
Lauras, M., Marques, G., & Gourc, D. (2010). Towards a multi-dimensional project
Performance Measurement System. Decision Support Systems, 48(2), 342-353. doi:
http://dx.doi.org/10.1016/j.dss.2009.09.002
Li, Y., Lu, Y., & Peng, Y. (2011). Hierarchical structuring success factors of project stakeholder
management in the construction organization. African Journal of Business
Management, 5(22), 9705-9713.
Limon, D. H. (2014). Comparative Analysis of Practices in Airspace and Construction
Industries. Norges Teknisk-Naturvitenskapelige Universitet, NTNU, Trondheim.

References
143
Marques, G., Gourc, D., & Lauras, M. (2011). Multi-criteria performance analysis for decision
making in project management. International Journal of Project Management, 29(8),
1057-1069. doi: http://dx.doi.org/10.1016/j.ijproman.2010.10.002
Melnyk, S. A., Bititci, U., Platts, K., Tobias, J., & Andersen, B. (2014). Is performance
measurement and management fit for the future? Management Accounting Research,
25(2), 173-186. doi: http://dx.doi.org/10.1016/j.mar.2013.07.007
Morse, J. M., Barrett, M., Mayan, M., Olson, K., & Spiers, J. (2008). Verification strategies for
establishing reliability and validity in qualitative research. International journal of
qualitative methods, 1(2), 13-22.
Müller, R., & Jugdev, K. (2012). Critical success factors in projects; Pinto, Slevin, and Prescott
– the elucidation of project success. International Journal of Managing Projects in
Business, 5(4), 757-775. doi: 10.1108/17538371211269040
Neely, A., Adam, C., & Kennerley, M. (2002). The Performance Prism: The ScoreCard for
Measuring and Managing Business Success (Vol. null).
Neely, A., Adams, C., & Crowe, P. (2001). The performance prism in practice. Measuring
Business Excellence, 5(2), 6-13. doi: 10.1108/13683040110385142
Neely, A., Gregory, M., & Platts, K. (2005). Performance measurement system design: A
literature review and research agenda. International Journal of Operations &
Production Management, 25(12), 1228-1263.
Neely, A., Richards, H., Mills, J., Platts, K., & Bourne, M. (1997). Designing performance
measures: a structured approach. International Journal of Operations & Production
Management, 17(11), 1131-1152.
Ng, S. T., Tang, Z., & Palaneeswaran, E. (2009). Factors contributing to the success of
equipment-intensive subcontractors in construction. International Journal of Project
Management, 27(7), 736-744. doi: 10.1016/j.ijproman.2008.09.006
Niven, P. R. (2002). Balanced scorecard step-by-step: maximizing performance and
maintaining results: John Wiley & Sons.
Olsson, N. (2006). Project flexibility in large engineering projects. Norwegian University of
Science and Technology.
Oxford, O. U. P. (Ed.) (2015) Online Disctionary.
Parmenter, D. (2010). Key performance indicators (KPI): developing, implementing, and using
winning KPIs: John Wiley & Sons.
Petty, N. J., Thomson, O. P., & Stew, G. (2012). Ready for a paradigm shift? Part 2: Introducing
qualitative research methodologies and methods. Manual therapy, 17(5), 378-384.
Pinto, J. K., & Covin, J. G. (1989). Critical factors in project implementation: a comparison of
construction and R&D projects. Technovation, 9(1), 49-62. doi: 10.1016/0166-
4972(89)90040-0
Polonsky, M. J. (2001). Strategic Bridging within Firm-Environmental Group Alliances:
Opportunities and Pitfalls. Journal of Marketing Theory and Practice, 9(1), 38-47.
Porter, M. E. (1979). How competitive forces shape strategy.
Powell, D., Strandhagen, J. O., Tommelein, I., Ballard, G., & Rossi, M. (2014). A New Set of
Principles for Pursuing the Lean Ideal in Engineer-to-order Manufacturers. Procedia
CIRP, 17(0), 571-576. doi: http://dx.doi.org/10.1016/j.procir.2014.01.137
Radujkovic, M., Vukomanovic, M., & Dunovic, I. B. (2010). Application of key performance
indicators in South-Eastern European construction. Journal of Civil Engineering and
Management, 16(4), 521-530. doi: 10.3846/jcem.2010.58

Measuring Lean Construction
144
Raid, A.-A. (2012). A lean construction framework with Six Sigma rating. International
Journal of Lean Six Sigma, 3(4), 299-314. doi: 10.1108/20401461211284761
Robinson, H. S., Anumba, C. J., Carrillo, P. M., & Al-Ghassani, A. M. (2005). Business
performance measurement practices in construction engineering organisations.
Measuring Business Excellence, 9(1), 13-22.
Rother, M. (2010). Toyota kata : managing people for improvement, adaptiveness, and superior
results. New York: McGraw Hill.
Salem, O., Solomon, J., Genaidy, A., & Minkarah, I. (2006). Lean construction: from theory to
implementation. Journal of Management in Engineering, 22(4), 168-175.
Schaufelberger, J. E. (2003). Success factors for design-build contracting. Bridges, 10(40671),
89.
Senge, P. M. (2014). The fifth discipline fieldbook: Strategies and tools for building a learning
organization: Crown Business.
Shenhar, A., Levy, O., & Dvir, D. (1997). Mapping the dimensions of project success. Project
management journal, 28(2), 5-13.
Shenhar, A. J. (2001). One Size does not Fit All Projects: Exploring Classical Contingency
Domains. Management Science, 47(3), 394-414.
Shenhar, A. J., Dvir, D., Levy, O., & Maltz, A. C. (2001). Project Success: A Multidimensional
Strategic Concept. Long Range Planning, 34(6), 699-725. doi: 10.1016/S0024-
6301(01)00097-8
Shenhar, A. J., Tishler, A., Dvir, D., Lipovetsky, S., & Lechler, T. (2002). Refining the search
for project success factors: a multivariate, typological approach. R&d Management,
32(2), 111-126.
Smith, J. L. (1998). Concurrent engineering in the jet propulsion laboratory project design
center: SAE Technical Paper.
Tabish, S. Z. S., & Jha, K. N. (2012). Success Traits for a Construction Project. Journal of
Construction Engineering and Management-Asce, 138(10), 1131-1138. doi:
10.1061/(asce)co.1943-7862.0000538
Thor, C. G. (2008, May/Jun). Lean metrics in the public sector. Cost Management, 22, 28-32.
Treacy, M., & Wiersema, F. (1997). The discipline of market leaders: Choose your customers,
narrow your focus, dominate your market: Basic Books.
Udechukwu, O., Johansen, E., & Greenwood, D. (2008). A qualitative re-construction of project
measurement criteria. Industrial Management + Data Systems, 108(3), 405-417. doi:
http://dx.doi.org/10.1108/02635570810858796
Vahos, J. D. (2014). Lean Project Management. (MSc Project Management Specialization
Project), Norges Teknisk-Naturvitenskapelige Universitet, NTNU, Trondheim.
Vernadat, F., Shah, L., Etienne, A., & Siadat, A. (2013). VR-PMS: a new approach for
performance measurement and management of industrial systems. International Journal
of Production Research, 51(23-24), 7420-7438. doi: 10.1080/00207543.2012.752593
Vimal, K., & Vinodh, S. (2012). Leanness evaluation using IF–THEN rules. The International
Journal of Advanced Manufacturing Technology, 63(1-4), 407-413.
Vinodh, S., & Balaji, S. (2011). Fuzzy logic based leanness assessment and its decision support
system. International Journal of Production Research, 49(13), 4027-4041.
Vrijhoef, R., & Koskela, L. (2000). The four roles of supply chain management in construction.
European Journal of Purchasing & Supply Management, 6(3–4), 169-178. doi:
http://dx.doi.org/10.1016/S0969-7012(00)00013-7

References
145
Vukomanovic, M., & Radujkovic, M. (2013). The Balanced Scorecard and EFQM working
together in a performance management framework in construction industry. Journal of
Civil Engineering and Management, 19(5), 683-695. doi:
10.3846/13923730.2013.799090
Vukomanovic, M., Radujkovic, M., & Nahod, M. M. (2014). EFQM Excellence Model as the
TQM model of the construction industry of South-Eastern Europe. Journal of Civil
Engineering and Management, 20(1), 70-81. doi: 10.3846/13923730.2013.843582
Wan, H.-d., & Frank Chen, F. (2008). A leanness measure of manufacturing systems for
quantifying impacts of lean initiatives. International Journal of Production Research,
46(23), 6567-6584.
Wegelius-Lehtonen, T. (2001). Performance measurement in construction logistics.
International Journal of Production Economics, 69(1), 107-116.
Womack, J. P., Jones, D. T., & Roos, D. (1990). The machine that changed the world. New
York: Rawson Associates.
Yeung, J. F. Y., Chan, A. P. C., & Chan, D. W. M. (2009). A computerized model for
measuring and benchmarking the partnering performance of construction projects.
Automation in Construction, 18(8), 1099-1113. doi: 10.1016/j.autcon.2009.07.003

146

Appendix A:
Evaluation Worksheet
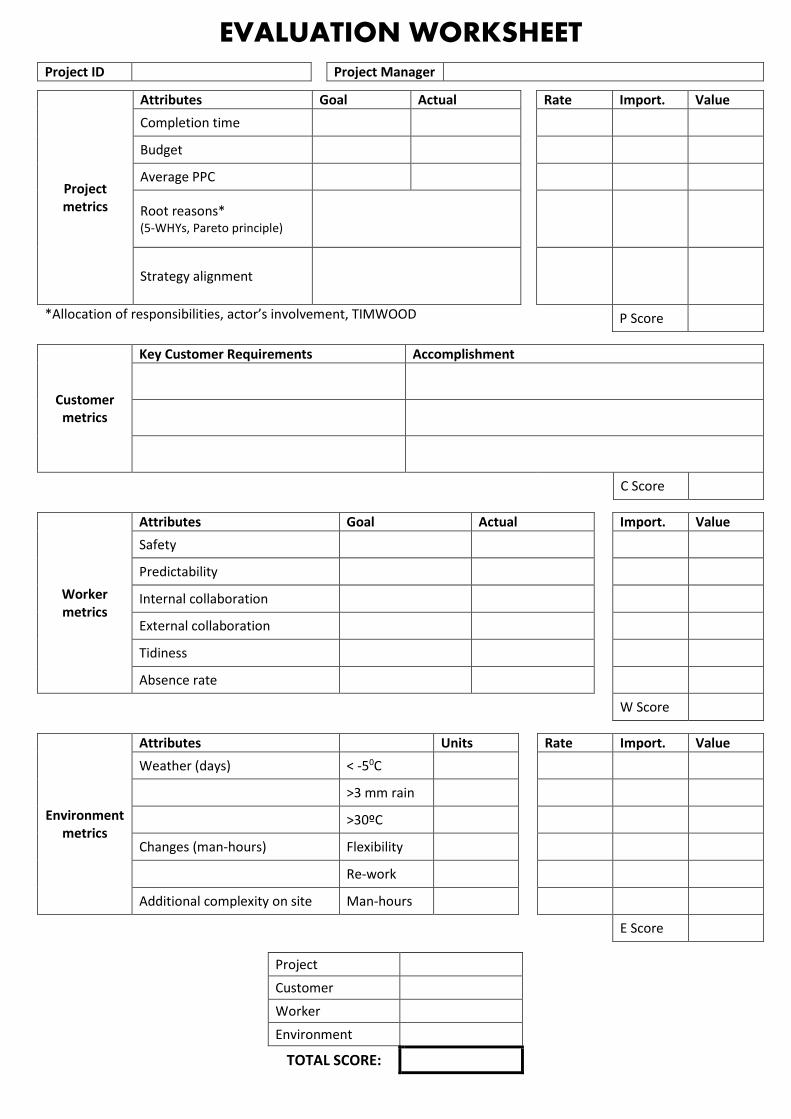
EVALUATION WORKSHEET Project ID Project Manager
Project metrics
Attributes Goal Actual Rate Import. Value
Completion time
Budget
Average PPC
Root reasons* (5-WHYs, Pareto principle)
Strategy alignment
*Allocation of responsibilities, actor’s involvement, TIMWOOD P Score
Customer metrics
Key Customer Requirements Accomplishment
C Score
Worker metrics
Attributes Goal Actual Import. Value
Safety
Predictability
Internal collaboration
External collaboration
Tidiness
Absence rate
W Score
Environment metrics
Attributes Units Rate Import. Value
Weather (days) < -50C
>3 mm rain
>30ºC
Changes (man-hours) Flexibility
Re-work
Additional complexity on site Man-hours
E Score
Project
Customer
Worker
Environment
TOTAL SCORE:

Appendix B:
Example of Use of the
Evaluation Worksheet

EVALUATION WORKSHEET Project ID B1-1987-11-13-N Project Manager Kari Nordman
Project metrics
Attributes Goal Actual Rate Import. Value
Completion time 36 months 32.5 months 1.0972 20 21.94
Budget 980 M NOK 1030 M NOK 0.9490 15 14.23
Average PPC 0.85 0.89 0.9529 10 9.52
Root reasons* (5-WHYs, Pareto principle)
- Not communicated schedule - Moving heavy tools
Warranty cost per m2 100 NOK/m2 108 NOK/m2 0.9200 5 4.6
*Allocation of responsibilities, actor’s involvement, TIMWOOD P Score 50.31
Customer metrics
Key Customer Requirements Reached expectations Result* Import. Value
Predictable completion time 10 (Overachieved) 1.2 6 7.2
Predictable results (product) 8 (Achieved) 1 6 6
Low energy consumption in use 7 (Acceptable) 0.9 6 5.4
*This can be a tabulated value from the results of a survey. C Score 18.6
HSE metrics
Attributes Goal Actual Rate Import. Value
Safety 6 6.0 1 8 8
Predictability 6 5.9 1.0667 1 1.02
Internal collaboration 6 6.2 0.9667 1 0.97
External collaboration 6 5.6 1.0667 1 1.07
Tidiness 6 6.1 0.9833 1 0.98
Absence rate 0.04 0.054 0.65 4 2.6
EIA B B 1 6 6
W Score 20.63
Environment metrics
Attributes Units Rate Import. Value
Weather (days) < -50C 32 1.2* 1 1.2
>3 mm rain 25 1.1* 1 1.1
>30ºC 2 1* 1 1
Changes (% man-hours) Flexibility 1.34 1.26 4 5.36
Re-work 1.08
Additional complexity on site % Man-hours 1.03 1.03 3 3.09
*This can be a tabulated value according to statistics E Score 11.65
Project 50.31
Customer 18.6
HSE 20.63
Environment 11.65
TOTAL SCORE: 101.2

EVALUATION WORKSHEET Project ID B1-1987-11-13-N Project Manager Kari Nordman
Project metrics
Attributes Goal Actual Rate Import. Value
Completion time 36 months 32.5 months = 1 + 𝐺 − 𝐴
𝐺 20 = 𝑅 ∗ 𝐼
Budget 980 M NOK 1030 M NOK = 1 + 𝐺 − 𝐴
𝐺 15 = 𝑅 ∗ 𝐼
Average PPC 0.85 0.89 = 1 + 𝐺 − 𝐴
𝐺 10 = 𝑅 ∗ 𝐼
Root reasons* (5-WHYs, Pareto principle)
- Not communicated schedule - Moving heavy tools
Warranty cost per m2 100 NOK/m2 108 NOK/m2 = 1 + 𝐺 − 𝐴
𝐺 5 = 𝑅 ∗ 𝐼
*Allocation of responsibilities, actor’s involvement, TIMWOOD P Score = ∑ 𝑉
Customer metrics
Key Customer Requirements Reached expectations Result* Import. Value
Predictable completion time 10 (Overachieved) # 6 = 𝑅 ∗ 𝐼
Predictable results (product) 8 (Achieved) # 6 = 𝑅 ∗ 𝐼
Low energy consumption in use 7 (Acceptable) # 6 = 𝑅 ∗ 𝐼
*This can be a tabulated value from the results of a survey. C Score = ∑ 𝑉
HSE metrics
Attributes Goal Actual Rate Import. Value
Safety 6/7 6.0 = 1 + 𝐺 − 𝐴
𝐺 8 = 𝑅 ∗ 𝐼
Predictability 6/7 5.9 = 1 + 𝐺 − 𝐴
𝐺 1 = 𝑅 ∗ 𝐼
Internal collaboration 6/7 6.2 = 1 + 𝐺 − 𝐴
𝐺 1 = 𝑅 ∗ 𝐼
External collaboration 6/7 5.6 = 1 + 𝐺 − 𝐴
𝐺 1 = 𝑅 ∗ 𝐼
Tidiness 6/7 6.1 = 1 + 𝐺 − 𝐴
𝐺 1 = 𝑅 ∗ 𝐼
Absence rate 0.04 0.054 = 1 + 𝐺 − 𝐴
𝐺 4 = 𝑅 ∗ 𝐼
EIA B B #* 6 = 𝑅 ∗ 𝐼
*Tabulated value according to results from EIA W Score = ∑ 𝑉
Environment metrics
Attributes Units Rate Import. Value
Weather (days) < -50C 32 #* 1 = 𝑅 ∗ 𝐼
>3 mm rain 25 #* 1 = 𝑅 ∗ 𝐼
>30ºC 2 #* 1 = 𝑅 ∗ 𝐼
Changes (% man-hours) Flexibility 1.34 = 𝑈𝑓𝑙𝑒𝑥− 𝑈𝑟𝑒𝑤𝑜𝑟𝑘
4 = 𝑅 ∗ 𝐼 Re-work 1.08
Additional complexity on site % Man-hours 1.03 = 𝑈 3 = 𝑅 ∗ 𝐼
*This can be a tabulated value according to statistics E Score = ∑ 𝑉
Project # P Score
Customer # C Score
HSE # W Score
Environment # E Score
TOTAL SCORE: = ∑ 𝑆𝑐𝑜𝑟𝑒𝑠

152

Appendix C:
Interview Guide
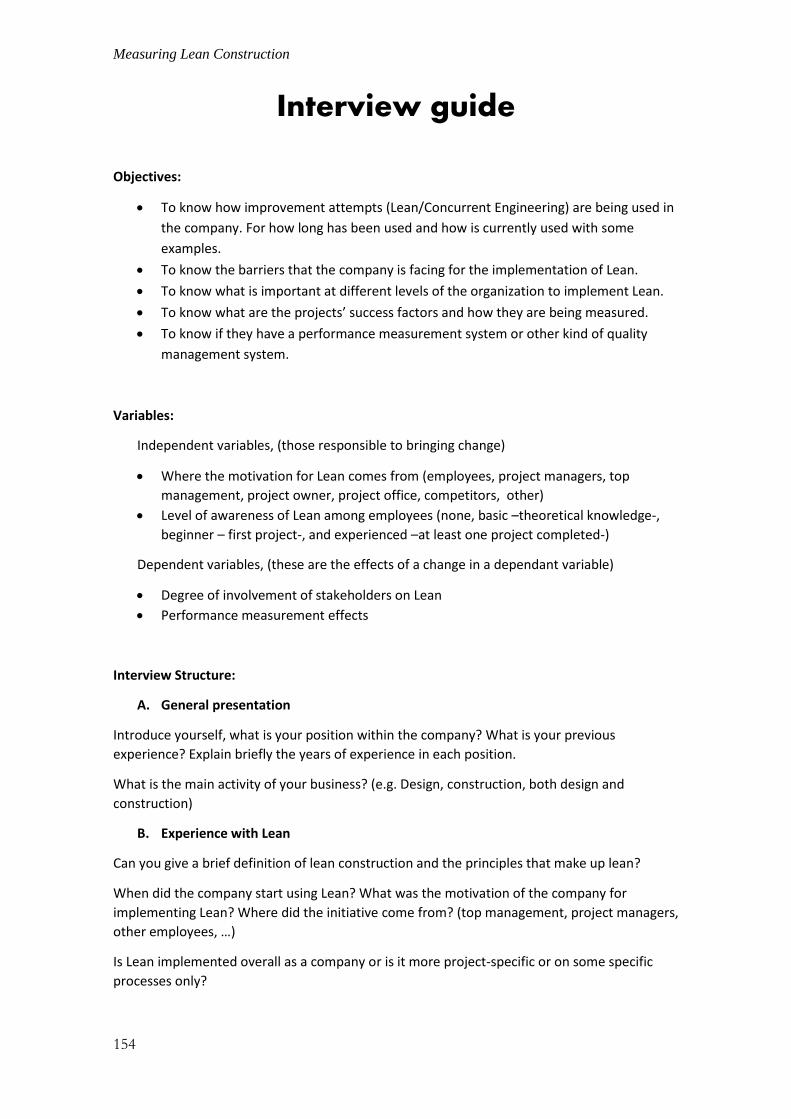
Measuring Lean Construction
154
Interview guide
Objectives:
To know how improvement attempts (Lean/Concurrent Engineering) are being used in
the company. For how long has been used and how is currently used with some
examples.
To know the barriers that the company is facing for the implementation of Lean.
To know what is important at different levels of the organization to implement Lean.
To know what are the projects’ success factors and how they are being measured.
To know if they have a performance measurement system or other kind of quality
management system.
Variables:
Independent variables, (those responsible to bringing change)
Where the motivation for Lean comes from (employees, project managers, top
management, project owner, project office, competitors, other)
Level of awareness of Lean among employees (none, basic –theoretical knowledge-,
beginner – first project-, and experienced –at least one project completed-)
Dependent variables, (these are the effects of a change in a dependant variable)
Degree of involvement of stakeholders on Lean
Performance measurement effects
Interview Structure:
A. General presentation
Introduce yourself, what is your position within the company? What is your previous
experience? Explain briefly the years of experience in each position.
What is the main activity of your business? (e.g. Design, construction, both design and
construction)
B. Experience with Lean
Can you give a brief definition of lean construction and the principles that make up lean?
When did the company start using Lean? What was the motivation of the company for
implementing Lean? Where did the initiative come from? (top management, project managers,
other employees, …)
Is Lean implemented overall as a company or is it more project-specific or on some specific
processes only?
Appendix C: Interview Guide
155
0.1 If project Specific, How you choose the project for lean implementation (based on
size, cost, contractual requirement)?
0.2 If company wise, to which processes you have implemented lean? (e.g. designing,
logistics, constructing)
Who is involved in the deployment of Lean? (Both internal and external actors)
To what extent do these actors apply Lean? How do they apply Lean? Give some examples.
Did the company provided training about Lean? What does the training consist of and what
people were involved?
Did the company use any parallel tool when implementing Lean? (Just in Time, Last Planner,
Concurrent Engineering, BIM, etc.)
How long did it take to implement lean construction?
C. Benefits from Lean Implementation
Does the company have any target for improving performance when introducing Lean? What
is the target? Has the company met the expectations regarding Lean?
What are the key improvements that the company has achieved with Lean?
What impact have the implementation of Lean on factors like time, cost and quality?
Please identify the social, economic and the environmental benefits of the lean approach in
your organization if any
D. Barriers and Success Factors for Implementation of Lean
What are the difficulties that the company is facing to meet expectations?
What are the barriers that the company has already overcome?
What aspects is the company focusing on to continue the improvement?
What was the success factors encountered?
How would you advice a potential company wishing to implement lean construction?
E. Project Performance
What are the success factors in projects?
Do you measure performance?
What are the metrics in projects? (time, cost, safety…)
How do you measure performance? When do you measure?
Is there any difference in the measurement between a project using Lean and other not doing
so?
How are projects evaluated after completion?
Does the company has a quality system for assessing performance? (KPIs, etc.)

The following table is aimed to give stakeholder’s perspective on Lean practices. We kindly ask you fill the table according to the different levels described.
(for second column, 1 means no interested, 2 interested but not actively involved, 3 reluctant with low active participation, 4 active involvement, 5 active
involvement inviting more actors to participate.)
Stakeholder level Level of involvement in Lean (1-5)
What do they do towards Lean? How are they involved? (f.ex. in what initiatives are they involved)
What do they need to improve involvement? (what would leverage their participation in initiatives)
Industry as a whole in Norway
Top management
Project level
Employees
Subcontractors
Users (or on their behalf -owner-)

Appendix C: Interview Guide
157
F. Measurement system
Rank the following aspects of a hypothetical measurement system:
- Ability to implement strategy
- Possibility of comparing projects (benchmarking)
- Ability to measure specific initiatives
- Ability to measure general project performance
- Focus on internal performance
- Focus on value chain performance
- Centred on management
- Centred on users
- Centred on employees and subcontractors
- Ability to provide performance of each employee (personal goals)
- Ability to provide feedback on team’s performance
- Ability to provide feedback on project performance
- Ability to provide information during the development of the project
- Ability to provide information at the closure of the project
- Integrated in the current company’s information system.
- Include new features better suited to show performance measurement
- If any (respondent suggestions)
G. What question would you ask yourself? Missing key points.