Lean project management
15
Lean project management Glenn Ballard 1,2 and Gregory A. Howell 1 1 Lean Construction Institute and 2 University of California at Berkeley, Berkeley, CA, USA E-mail: [email protected] Projects are temporary production systems. When those systems are structured to deliver the product while maximizing value and minimizing waste, they are said to be ‘lean’ projects. Lean project management differs from traditional project management not only in the goals it pursues, but also in the structure of its phases, the relationship between phases and the participants in each phase. This paper presents a model of lean project management and contrasts lean and traditional approaches. Four tools or interventions are presented as illustrations of lean concepts in action. Keywords: construction management, lean project delivery system, lean project management, project management, value, waste Les projets sont des syste ` mes de production temporaires. Lorsque ces syste ` mes sont organise ´s pour fournir le produit tout en optimisant la valeur et en minimisant les gaspillages, on dit qu’il s’agit de projets au plus juste. La gestion de ce type de projet diffe ` re de celle des projets classiques non seulement au niveau des objectifs vise ´s mais aussi a ` celui de la structure des phases, des relations entre les phases et des participants a ` chaque phase. Cet article propose un mode ` le de gestion de projet au plus juste et oppose les deux approches. Quatre outils ou interventions sont pre ´sente ´s pour illustrer l’application des concepts au plus juste. Mots cle ´s : gestion de la construction, syste ` me de fourniture de projet au plus juste, gestion de projet au plus juste, gestion de projet, valeur, gaspillages Introduction Thinking about production has been shaped by the challenges of repetitive manufacturing. This has had two unfortunate consequences: ‘making’ has eclipsed ‘designing’ and project has been conceived as a peripheral, oddball form of production Adherents of lean project management advance an alternative perspective. Production is defined as designing and making things. Designing and making something for the first time is done through a project, which is, for that reason, arguably the fundamental form of production system. Projects are temporary production systems. When those sys- tems are structured to deliver the product while maximizing value and minimizing waste, they are said to be ‘lean’ projects. Lean project management differs from traditional project management not only in the goals it pursues, but also in the structure of its phases, the relationship between phases and the participants in each phase. Construction is one among many types of project-based pro- duction systems. Others include shipbuilding, movie-making, software engineering, product development and all forms of work-order systems such as plant and facilities maintenance. Theory, rules and tools must be developed for project-based production systems and their management. The Lean Project Delivery System 1 (LPDS) is a contribution to that objective. The LPDS has emerged from a fusion of theoretical insights, methods from other industries and participative action research (see Ballard and Howell 1998 for a detailed explana- tion of the development of the production control component of the LPDS). i:/t&f/rbri/RBRI100199.3d Printed: 12/12/02 page(s) 1^15 BUILDING RESEARCH &INFORMATION (2003) 31(1), 1–15 Building Research & Information ISSN 0961-3218 print /ISSN 1466-4321 online # 2003 Taylor & Francis Ltd http: / /www.tandf.co.uk /journals DOI: 10.1080 /00000000000000000
-
Upload
independent -
Category
Documents
-
view
0 -
download
0
Transcript of Lean project management

Lean project management
Glenn Ballard1,2 and Gregory A. Howell1
1Lean Construction Institute and
2University of California at Berkeley, Berkeley,CA,USAE-mail: [email protected]
Projects are temporary production systems. When those systems are structured to deliver the product while maximizing
value and minimizing waste, they are said to be ‘lean’ projects. Lean project management differs from traditional project
management not only in the goals it pursues, but also in the structure of its phases, the relationship between phases and
the participants in each phase. This paper presents a model of lean project management and contrasts lean and
traditional approaches. Four tools or interventions are presented as illustrations of lean concepts in action.
Keywords: construction management, lean project delivery system, lean project management, project management,
value, waste
Les projets sont des systemes de production temporaires. Lorsque ces systemes sont organises pour fournir le produit tout
en optimisant la valeur et en minimisant les gaspillages, on dit qu’il s’agit de projets �au plus juste�. La gestion de ce
type de projet differe de celle des projets classiques non seulement au niveau des objectifs vises mais aussi a celui de la
structure des phases, des relations entre les phases et des participants a chaque phase. Cet article propose un modele de
gestion de projet au plus juste et oppose les deux approches. Quatre outils ou interventions sont presentes pour illustrer
l’application des concepts �au plus juste�.
Mots cles : gestion de la construction, systeme de fourniture de projet �au plus juste�, gestion de projet au plus juste,
gestion de projet, valeur, gaspillages
IntroductionThinking about production has been shaped by the challenges
of repetitive manufacturing. This has had two unfortunate
consequences:
� ‘making’ has eclipsed ‘designing’ and
� project has been conceived as a peripheral, oddball form
of production
Adherents of lean project management advance an alternative
perspective. Production is defined as designing and making
things. Designing and making something for the first time is
done through a project, which is, for that reason, arguably
the fundamental form of production system.
Projects are temporary production systems. When those sys-
tems are structured to deliver the product while maximizing
value and minimizing waste, they are said to be ‘lean’
projects. Lean project management differs from traditional
project management not only in the goals it pursues, but also
in the structure of its phases, the relationship between phases
and the participants in each phase.
Construction is one among many types of project-based pro-
duction systems. Others include shipbuilding, movie-making,
software engineering, product development and all forms of
work-order systems such as plant and facilities maintenance.
Theory, rules and tools must be developed for project-based
production systems and their management. The Lean
Project Delivery System1 (LPDS) is a contribution to that
objective.
The LPDS has emerged from a fusion of theoretical insights,
methods from other industries and participative action
research (see Ballard and Howell 1998 for a detailed explana-
tion of the development of the production control component
of the LPDS).
i:/t&f/rbri/RBRI100199.3d
Printed:
12/12/02
page(s)1^15
BUILDING RESEARCH & INFORMATION (2003) 31(1), 1–15
Building Research & Information ISSN 0961-3218 print ⁄ISSN 1466-4321 online # 2003 Taylor & Francis Ltdhttp: ⁄ ⁄www.tandf.co.uk ⁄journals
DOI: 10.1080 ⁄00000000000000000

In the following, brief historical and theoretical backgrounds
are provided, then the LPDS model is presented and
explained, followed by four illustrations of its application
and an invitation to join the effort to develop lean project
management.
Historical backgroundThe phrase ‘lean production’ was coined by a member of the
research team studying the international automobile industry;
the report of which was published in The Machine That
Changed the World (Womack et al., 1990). ‘Lean’ was used
to name a third form of production system, one capable of
producing more and better vehicles in less time, in less space
and when using fewer labour hours than the mass or craft
production systems that preceded it. New concepts and tech-
niques were identified, including Just-in-Time (JIT) deliveries,
Pull (versus Push) mechanisms for advancing work through a
production system, making batch size reduction economical
by reducing set-up times, and increasing transparency of the
production system so everyone could help manage it.
Lauri Koskela first alerted the construction industry to the
revolution in manufacturing, challenging it to explore and
adopt these new concepts and techniques (Koskela, 1992).
He hosted the first conference of the International Group for
Lean Construction (www.vtt.fi/rte.lean) at VTT in Espoo,
Finland, in August 1993. That small group of researchers
decided to adopt the name ‘lean construction’.2 The IGLC,
now grown considerably since its founding, is dedicated to
the development of a theory of production and production
management, with the project as the most fundamental sys-
tem for designing and making things.
But to conclude this brief history – the IGLC has grown each
year, operating through annual conferences rotating through
Europe, Asia, South America, North America, etc. The pro-
ceedings of the first three conferences have been published
together in Alarcon (1997). The proceedings of the remaining
conferences were published separately and are also available
at the IGLC website.
National organizations, mostly oriented also to advancing
practice as well as theory, have begun to emerge. The Lean
Construction Institute (www.leanconstruction.org) was
formed in the USA in 1997. Similar organizations exist in
Chile and Denmark and others are in process of formation.
The UK’s most recent report on the construction industry.
Rethinking Construction (Construction Task Force, 1997),
promoted lean manufacturing as a model to be emulated.
The researchers active in IGLC have brought lean concepts
and techniques into the construction industries of the USA,
UK, Finland, Denmark. Singapore, Korea, Australia, Brazil,
Chile, Peru, Ecuador and Venezuela. University courses in
construction and project management are beginning to incor-
porate lean construction material. To mention but a few, the
University of California at Berkeley has been a leader in the
USA, as has the Catholic University of Chile in Chile and the
University of Rio Grande do Sul in Brazil.
Theoretical backgroundWe understand projects to be temporary production systems
linked to multiple, enduring production systems from which
the project is supplied materials, information and resources.
Every production system integrates designing and making a
product. Production (and hence project) management is
understood in terms of designing, operating and improving
production systems (Koskela, 2001).
Production systems are designed to achieve three fundamen-
tal goals (Koskela, 2000):
� Deliver the product
� Maximize value
� Minimize waste
By way of example, principles for production system design
include (Ballard et al., 2001):
� Structure work for value generation
� Understand, critique and expand customer purposes
� Increase system control (ability to realize purposes)
Operating is conceived in terms of planning, controlling and
correcting. In this context, to plan is to set specific goals for
the system. To control is to advance towards those goals.
To correct is to change the means being used or the goals
being pursued.
Figure 1 Production system management
Ballard et al.
2

Lean Project Delivery System (LPDS) ModelProjects have long been understood in terms of phases, e.g.
predesign, design, procurement and installation. Some of the
key differences between traditional and lean project delivery
concerns the definition of phases, the relationship between
phases and the participants in each phase.
Project de¢nitionThe model in Figure 2 represents a series of phases in overlap-
ping triangles, the first of which is ‘Project Definition’, which
includes customer and stakeholder purposes and values,
design concepts, and design criteria.
Each of these elements may influence the other, so a conver-
sation is necessary among the various stakeholders. Typically
– like a good conversation – everyone leaves with a different
and better understanding than they brought with them.
Representatives of every stage in the life cycle of the facility
are involved in this initial phase, including members of the
production team which is to design and build the product.
Lean designThe gate between Project Definition and Lean Design is align-
ment of values, concepts and criteria. Lean Design also pro-
ceeds through conversation, this time dedicated to
developing and aligning product and process design at the
level of functional systems. The project may revert to
Project Definition if the ongoing search for value reveals
opportunities that are consistent with customer and stake-
holder constraints, e.g. if there is time and money enough.
Lean Design differs from traditional practice in systematically
deferring decisions until the last responsible moment in order
to allow more time for developing and exploring alternatives.
The traditional practice of selecting options and execution of
design tasks as soon as possible causes rework and disruption
when a design decision made by one specialist conflicts with the
decisions of another. The ‘set-based’ strategy employed in Lean
Design allows interdependent specialists to move forward
within the limits of the set of alternatives currently under consid-
eration. Decisions must be made within the lead time for realiz-
ing alternatives, hence the importance in Lean Construction of
redesigning supply networks to reduce their lead time.
Lean supplyLean Supply consists of detailed engineering, fabrication, and
delivery, which require as prerequisite product and process
design so that the system knows what to detail and fabricate,
and when to deliver those components. Lean Supply also
includes such initiatives as reducing the lead time for informa-
tion and materials, especially those involved in the supply of
engineered-to-order products, which typically determine the
pace and timing of project delivery.
Lean assemblyLean assembly begins with the delivery of materials and the
relevant information for their installation. Assembly com-
pletes when the client has beneficial use of the facility, which
typically occurs after commissioning and start-up.
The management of production throughout the project is
indicated by the horizontal bars labelled Production
Control and Work Structuring. The systematic use of
feedback loops between supplier and customer processes is
symbolized by the inclusion of Post Occupancy Evaluations
between projects.
Figure 2 Triads of the Lean Project Delivery System (LPDS)
Lean project management
3
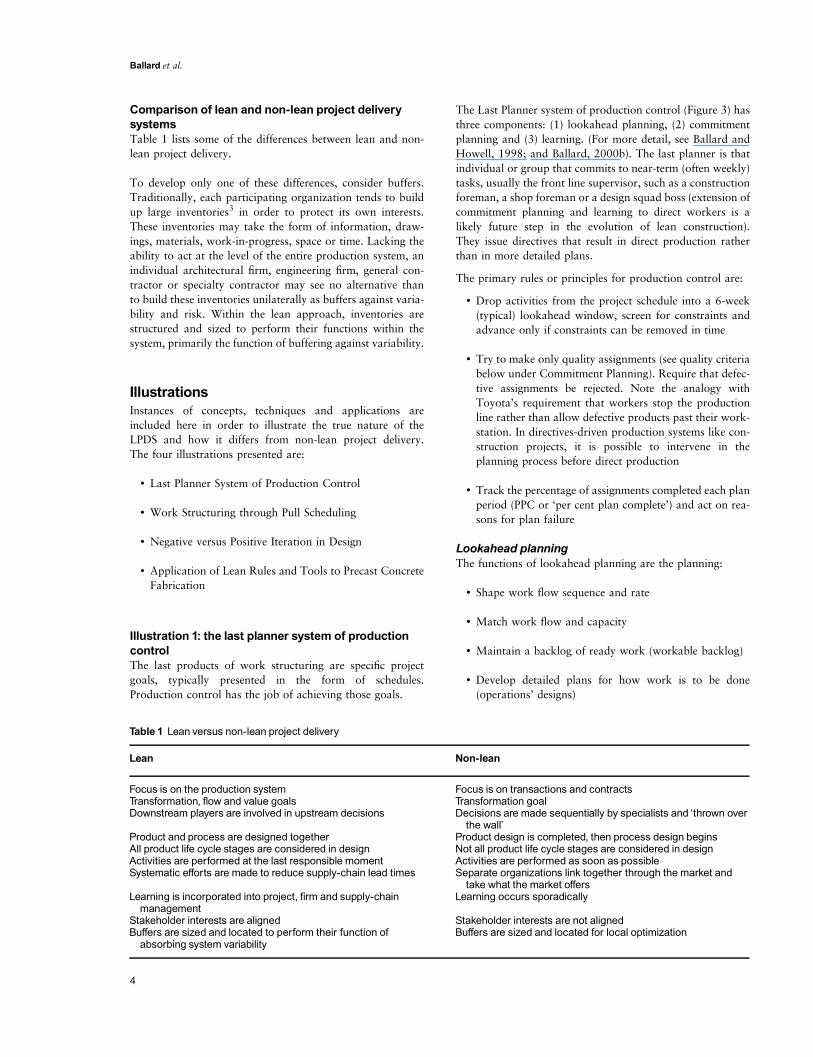
Comparison of lean and non-lean project deliverysystemsTable 1 lists some of the differences between lean and non-
lean project delivery.
To develop only one of these differences, consider buffers.
Traditionally, each participating organization tends to build
up large inventories3 in order to protect its own interests.
These inventories may take the form of information, draw-
ings, materials, work-in-progress, space or time. Lacking the
ability to act at the level of the entire production system, an
individual architectural firm, engineering firm, general con-
tractor or specialty contractor may see no alternative than
to build these inventories unilaterally as buffers against varia-
bility and risk. Within the lean approach, inventories are
structured and sized to perform their functions within the
system, primarily the function of buffering against variability.
IllustrationsInstances of concepts, techniques and applications are
included here in order to illustrate the true nature of the
LPDS and how it differs from non-lean project delivery.
The four illustrations presented are:
� Last Planner System of Production Control
� Work Structuring through Pull Scheduling
� Negative versus Positive Iteration in Design
� Application of Lean Rules and Tools to Precast Concrete
Fabrication
Illustration 1: the last planner system of productioncontrolThe last products of work structuring are specific project
goals, typically presented in the form of schedules.
Production control has the job of achieving those goals.
The Last Planner system of production control (Figure 3) has
three components: (1) lookahead planning, (2) commitment
planning and (3) learning. (For more detail, see Ballard and
Howell, 1998; and Ballard, 2000b). The last planner is that
individual or group that commits to near-term (often weekly)
tasks, usually the front line supervisor, such as a construction
foreman, a shop foreman or a design squad boss (extension of
commitment planning and learning to direct workers is a
likely future step in the evolution of lean construction).
They issue directives that result in direct production rather
than in more detailed plans.
The primary rules or principles for production control are:
� Drop activities from the project schedule into a 6-week
(typical) lookahead window, screen for constraints and
advance only if constraints can be removed in time
� Try to make only quality assignments (see quality criteria
below under Commitment Planning). Require that defec-
tive assignments be rejected. Note the analogy with
Toyota’s requirement that workers stop the production
line rather than allow defective products past their work-
station. In directives-driven production systems like con-
struction projects, it is possible to intervene in the
planning process before direct production
� Track the percentage of assignments completed each plan
period (PPC or ‘per cent plan complete’) and act on rea-
sons for plan failure
Lookahead planningThe functions of lookahead planning are the planning:
� Shape work flow sequence and rate
� Match work flow and capacity
� Maintain a backlog of ready work (workable backlog)
� Develop detailed plans for how work is to be done
(operations’ designs)
Table 1 Lean versus non-lean project delivery
Lean Non-lean
Focus is on the production system Focus is on transactions and contractsTransformation, £ow and value goals Transformation goalDownstream players are involved in upstream decisions Decisions are made sequentially by specialists and ‘thrown over
the wall’Product and process are designed together Product design is completed, then process design beginsAll product life cycle stages are considered in design Not all product life cycle stages are considered in designActivities are performed at the last responsible moment Activities are performed as soon as possibleSystematic e¡orts are made to reduce supply-chain lead times Separate organizations link together through the market and
take what the market o¡ersLearning is incorporated into project, ¢rm and supply-chainmanagement
Learning occurs sporadically
Stakeholder interests are aligned Stakeholder interests are not alignedBu¡ers are sized and located to perform their function ofabsorbing system variability
Bu¡ers are sized and located for local optimization
Ballard et al.
4

Tools and techniques include constraints analysis, the activity
definition model and prototyping of products or processes,
also known as first-run studies. Constraints analysis is done
by examining each activity that is scheduled to start within the
period chosen as the project lookahead window.4 The con-
straints that prevent the activity from being a sound assign-
ment are identified and actions are taken to remove those
constraints. As shown in Table 2, the activity of designing a
slab is constrained by lack of a soils report. Acquiring the soils
report removes that constraint. Note that the addition of such
‘make ready’ tasks is one way in which the level of detail
increases as scheduled activities enter the lookahead window.
The rule governing constraints analysis is that no activity is
allowed to retain its scheduled date unless the planners are
confident that constraints can be removed in time. Following
this rule assures that problems will be surfaced earlier and that
problems that cannot be resolved in the lookahead process will
not be imposed on the production level of the project, whether
that be design, fabrication or construction.
The Activity Definition Model (ADM: Figure 4) provides the
primary categories of constraints: directives, prerequisite
work and resources. Directives provide guidance according
to which output is to be produced or assessed. Examples are
assignments, design criteria and specifications. Prerequisite
work is the substrate on which work is done or to which
work is added. Examples include materials, whether ‘raw’
or work-in-progress, information input to a calculation or
decision, etc. Resources are either labour, instruments of
labour or conditions in which labour is exercised.
Resources can bear load and have finite capacities.
Consequently, labour, tools, equipment and space are
resources, but materials and information are not.
ADM is a tool for exploding phase schedule activities into
greater detail. Explosion occurs through specification of con-
straints and through further detailing of processes.
Commitment planningThe Last Planner presents a methodology to define criteria for
making quality assignments (Ballard and Howell, 1994). The
quality criteria proposed are:
� Definition
� Soundness
Figure 3 Last planner system of production control
Lean project management
5

Tabl
e2Illustrationofconstraintsanalysis
Pro
ject
:Meg
aB
uild
ing
Rep
ort
dat
e:3
Nov
ember
Con
stra
ints
Act
ivity
Res
pon
sibl
epa
rty
Sch
edul
eddur
atio
nD
irec
ives
Pre
requi
site
sR
esour
ces
Com
men
tsR
eady
?
Designslab
Structural
engineer
15^27Novem
ber
Code98
Finish?
Levelness?
soilsreport
10hlabour,1h
plotter
no
Get
info
rmat
ion
fro
mcl
ien
tab
ou
tfl
oo
rfi
nis
han
dle
vel
Stru
ctu
ral
engi
nee
r’s
gofe
r3^9Novem
ber
OK
OK
OK
yes
Get
soils
rep
ort
fro
mC
ivil
Stru
ctu
ral
engi
nee
rby9Novem
ber
OK
OK
OK
yes
Layoutfortool
install
Mechanical
engineer
15^27Novem
ber
OK
toolcon¢gurations
from
manufactures
OK
mayneed
tocoordinatewith
HVAC
no
Ballard et al.
6

� Sequence
� Size
� Learning (not strictly speaking a criterion for assign-
ments, but rather for the design and functioning of the
entire system)
The Last Planner considers those quality criteria in advance
of committing workers to doing work in order to shield them
from uncertainty. The plan’s success at reliably forecasting
what work will get accomplished by the end of the week is
measured in terms of PPC (Figure 5).
Increasing PPC leads to increased performance, not only of
the production unit that executes the Weekly Work Plan
(Table 3), but also of production units downstream as they
can plan better when work is reliably released to them.
Moreover, when a production unit gets better at determining
its upcoming resource needs, it can pull those resources from
its upstream supply so they will be available when needed.
Consequently, it is not surprising that implementation of the
Last Planner system has produced more reliable flow and
higher throughput of the production system (Ballard and
Howell, 1998; Ballard, 2000b; Koskela, 2000; Ballard et al.,
2002a,b).
Learning (also known as reasons analysisand action)Each week, last week’s weekly work plan is reviewed to
determine what assignments (commitments) were completed.
If a commitment has not been kept, then a reason is provided
(Figure 6). Reasons are periodically analysed to root causes
and action taken to prevent repetition. Obviously, failure to
remove constraints can result in lack of materials or prerequi-
site work or clear directives. Such causes of failure direct us
Figure 4 Activity De¢nition Model (ADM)
Figure 5 PPC chart electrical contractor (Ballard et al.,1996)
Lean project management
7

Tabl
e3Constructionweeklyworkplan
Pro
ject
:Pilo
tFO
REM
AN
:Phi
llip
AC
TIV
ITY
1W
eek
plan
DATE
:20/
9/96
Est
imat
edA
ctua
lM
onda
yTu
esda
yW
ednes
day
Thur
sday
Frid
aySat
urd
aySun
day
PPC
Rea
son
for
varian
ces
Gas/P.Ohangers
0/14‘K’(48
hangers)
XXX
XXX Sylvano,Mario,Terry
No
ownerstopped
work
(changing
elevations)
Gas/P.O.hangers
XXX
XXX
XXX
XXX
No
sameasabove^
0/14‘K’(3risers)
Sylvano,Mario,Terry
workedon
backlogandboiler
breakdown
3600cond
water‘K’420
XXX
XXX
XXX
Yes
2^45deg1^90
deg
Charlie,Rick,Ben
Chillerrisers
XXX
XXX
XXX
No
(2chillersperweek)
Charlie,Rick,Ben
HangH/W
O/H‘J’
XXX
XXX
XXX
XXX
XXX
XXX
Yes
(240
0 ^14
00)
MarkM,Mike
Coolingtower10
00XXX
XXX
XXX
XXX
XXX
XXX
Yes
tieins(steel)(2
towersperday)
Steve,Chris,MarkW,
WeldoutCHWpump
XXX
XXX
XXX
XXX
XXX
XXX
Yes
headers‘J’mezz.
(18)
Lake
Weldoutcooling
XXX
XXX
XXX
XXX
XXX
XXX
No
eyeinjury,lost2
towers
Je¡
days’welding
time
F.R.P.tie-in
toE.T.
XXX
XXX
XXX
XXX
XXX
XXX
Yes
(9towers)50%
Pal,Jacky,Tom
WORKABLE
BACKLOGBoiler
blowdown^
basements^rupture
disks
Ballard et al.
8

back to the lookahead process to seek improvements in our
control system.
Some failures may result from the last planner not under-
standing the language and procedures of making commit-
ments or from poor judgment in assessment of capacity or
risk. In these cases, the individual planner is the focus of
improvement. Plan failures may also result from more funda-
mental problems – in management philosophy, policy, con-
flicting signals, etc.
Whatever the cause, continued monitoring of reasons for
plan failure will measure the effectiveness of remedial actions.
If action has been taken to eradicate the root causes of mate-
rials-related failures, yet materials continue to be identified as
the reason for failing to complete assignments on Weekly
Work Plans, then different action is required.
Illustration 2: work structuring throughpull schedulingWork Structuring is a term developed by the Lean
Construction Institute (Ballard, 1999a) to indicate process
design. The last products of work structuring are schedules.
Pull techniques and team planning are used to develop sche-
dules for each phase of work, from design through handover
(Ballard, 2000a). The phase schedules thus produced are
based on targets and milestones from the master project sche-
dule and are the source of scheduled activities that enter the
project’s lookahead window.
A Pull technique is based on working from a target comple-
tion date backwards, which causes tasks to be defined and
sequenced so that their completion releases work. A rule of
‘pulling’ is only to do work that releases work to someone
else. Following that rule eliminates the waste of overproduc-
tion, one of Ohno’s seven types of waste (Ohno, 1988; also
Shingo, 1992). Working backwards from a target completion
date eliminates work that has customarily been done but does
not add value.
Team planning involves representatives of all organizations
that do work within the phase. Typically, team members
write on sheets of paper brief descriptions of tasks they must
perform in order to release work to others or tasks that must
be completed by others to release work to them. They tape or
stick those sheets on a wall in their expected sequence of per-
formance. Planning usually breaks out in the room as people
begin developing new methods and negotiating sequence and
batch size when they see the results of their activities on
others.
The first step of formalizing the planning and the phase sche-
dule is to develop a logic network by moving and adjusting
the sheets. The next step is to determine durations and see
if there is any time left between the calculated start date and
the possible start date. It is critical that durations not be
padded to allow for variability in performing the work. We
first want to produce an ‘ideal’ schedule.
It is standard practice to try to build as much float as possible
into the duration of tasks for which you are responsible. This
results from lacking a mechanism for coordination. The Last
Planner system will eventually create confidence both that
interests will be protected and that work flow will be mana-
ged. Consequently, designer and builder specialists can pro-
vide unpadded durations for their assigned tasks, confident
that uncertainties will be buffered and that unfair burdens
will be rectified.
Figure 6 Reasons for plan failure
Lean project management
9

The team is next invited to re-examine the schedule for logic
and intensity (application of resources and methods) in order
to generate a bigger gap and more float. Then they decide
how to spend that time:
� Assign to the most uncertain and potentially variable task
durations
� Delay start in order to invest more time in prior work or
to allow the latest information to emerge or
� Accelerate the phase completion date
If the gap cannot be made sufficiently positive to absorb
variability, the phase completion date must slip out, and
attention turns to making up that time in later phases. The
key point is deliberately and publicly to generate, quantify
and allocate schedule contingency.
Once the team has agreed on the phase schedule, the schedule
and the activities represented on it can only be changed under
three conditions:
� Prime contract changes
� Activities on the schedule cannot be performed without
violation of Last Planner rules (allow scheduled tasks to
advance in the lookahead window only if you are confi-
dent they can be made ready when scheduled. Allow
assignments into weekly work plans only if you are con-
fident they will be completed as scheduled) or
� Someone comes up with a better idea and all team mem-
bers can be persuaded to agree
This may involve a transfer of money or at least promises of
future money transfers across organizational boundaries as
changes in the phase schedule will not likely benefit all parties
equally.
Purpose ⁄participants ⁄processThe purpose of Pull scheduling is to produce a plan for com-
pleting a phase of work that maximizes value generation and
one that everyone involved understands and supports; to pro-
duce a plan from which scheduled activities are drawn into
the lookahead process to be exploded into operational detail
and made ready for assignment in weekly work plans.
Representatives of those with work to do in the phase parti-
cipate in the production of phase schedules. For example, a
team working to schedule a construction phase typically
involves the general contractor and subcontractors, and per-
haps stakeholders such as designers, client and regulatory
agencies. Participants should bring relevant schedules and
drawings including the master schedule and perhaps even the
contract. The process involves the following steps:
� Define the work to be included in the phase, e.g. founda-
tions, building skin, etc., and the phase deliverables
� Determine the completion date for the phase plus any
major interim releases from prior phases or to subsequent
phases
� Using team scheduling and stickies on a wall, develop the
network of activities required to complete the phase,
working backwards from the completion date, and incor-
porating any interim milestones
� Apply durations to each activity, with no contingency or
float in the duration estimates
� Re-examine logic, resource intensities and work methods
to try to shorten the duration
� Determine the earliest practical start date for the phase
� If there is time left over after comparing the time between
start and completion with the duration of the activities on
the wall, decide what activities to buffer or pad with
additional time:
� Which activity durations are most fragile?
� Rank order the fragile activities by degree of uncertainty
� Allocate available time to the fragile activities in rank
order
Illustration 3: negative versus positive iterationin designAssuming that design is by its nature an iterative and genera-
tive process (Ballard, 1998), how should we understand
waste in design? Waste reduction has been characterized by
Koskela (2000) in terms of minimizing what is unnecessary
for task completion and value generation. Consequently, that
iteration is wasteful, which can be eliminated without loss of
value or causing failure to complete the project. Precisely
what iteration can be thus eliminated is a matter for empirical
research. Informal surveys of design teams have revealed esti-
mates as high as 50% of design time spent on needless (nega-
tive) iteration. An additional research goal is to learn how to
identify negative iteration before suffering its consequences.
There are certainly other types of waste in design than nega-
tive iteration. One example is design errors. Reinertsen
(1997, p. 78) characterizes design outputs as defective when
they fail because something previously known was forgotten
or neglected. By contrast, design outputs can be failures but
not errors if they fail because of lack of knowledge not pre-
viously possessed.
Beam penetration caseLottaz et al. (1999) tell a story illustrating negative (needless)
iteration. Holes for a refrigeration conduit were required in a
Ballard et al.
10

beam (Figure 7). Primary dimensions were: d (the diameter of
a hole), e (the distance between holes), x (the distance from
the first hole to the column) and h (the depth of the beam).
The architect first specified values for the four dimensions
then sent an annotated drawing to the steel fabricator, who
changed the values for e and x and sent it on to the engineer.
The engineer reduced the diameter of the hole (d) and sent the
document back to the architect. Perhaps in a fit of pique, the
architect reduced the value of x from 1100 to 1000 mm and
finally involved the HVAC subcontractor, who made further
changes and the cycle of changes and transmissions contin-
ued. The erection contractor was running out of time, so the
contractor fixed values for the dimensions and had the beam
fabricated. Unfortunately, he was then unable to persuade the
team to accept his solution. The result was considerable time
and money lost on the project.
There are many contributors to the negative iteration in the
beam penetration case. We might first question the sequence
of design tasks. Was the architect the best person to establish
initial values, then the fabricator, then the engineer, etc? The
Design Structure Matrix (DSM) is a device for eliminating or
reducing iterative loops by resequencing design tasks (Austin
et al., 1998). DSM is appropriate when a specific design
direction has been established or for the exploration of
alternative design sequences. Once iterative loops have been
minimized, we propose that selection be made from among
the strategies presented below in order to manage each of
those loops.
Another major contributor to negative iteration in the Lottaz
et al. case is sequential processing, which not only adds to the
time expended on the problem, but also actively hinders reso-
lution. The architect (or anyone else) could have called a
meeting to decide as a group on the values for the relevant
dimensions. If the various contributors to the decision had
been together in one place, at minimum there could have been
an acceleration of the iterative looping. At best, there could
have been genuine team problem-solving. Using cross-
functional teams and team problem-solving to produce design
is a staple of contemporary product development processes.
Many other concepts and techniques of advanced design
management are relevant to the reduction of negative itera-
tion. Suppose the participants had been willing to share the
Figure 7 Beam penetration case. Source: Lottaz et al. (1999)
Table 4 Techniques for reducing negativeiteration
Design structure matrixTeam problem-solvingCross-functional teamsShared range of acceptable solutions (values)Share incomplete informationReduced batch sizesTeam pull schedulingConcurrent designDeferred commitmentLeast commitmentSet-based versus point-based designOverdesign
Lean project management
11

range of values acceptable to each. In that case, it would
have been a simple matter to determine first if the problem
as stated was solvable, i.e. if there were values for each
dimension acceptable to all. They might have been unwilling
to share that knowledge even if they were brought together
face-to-face in hopes that the final solution better favoured
themselves as opposed to others. Indeed, it appears to
this author to be a routine of current design practice that
supposedly collaborating specialists effectively compete for
the priority of the values or criteria associated with their
specialties (Ballard, 1999b). Willingness to share incomplete
information has long been identified as a necessity for
concurrency in design (Clark and Fujimoto, 1991). This can
perhaps be best understood in terms of the lean production
practice of reducing batch sizes, which belongs with DSM
as a technique for restructuring the design process.
Sequential processing results in part from the implicit rule
that only completed design work is advanced to others. In
terms of the beam penetration case, suppose the design team
members agreed up front on work sequence, which would
start by Team Member A providing just that information
needed for Team Member B to perform his calculation. B
would in turn release that information to C, allowing C to
do work, etc.
Deferred commitment is a strategy for avoiding premature
decisions and for generating greater value in design. It can
reduce negative iteration by simply not initiating the iterative
loop. A related but more extreme strategy is that of least com-
mitment, i.e. to defer decisions systematically until the point
at which failing to make the decision eliminates an alterna-
tive. Knowledge of the lead times required for realizing design
alternatives is necessary in order to determine last responsible
moments. Such knowledge now tends to be partial or lacking.
When task sequence cannot be structured to avoid iterative
looping, and when it is necessary to make a decision quickly,
and when team problem-solving is not feasible as a means of
accelerating iteration, design redundancy may be the best
strategy. An example: structural loads are not known pre-
cisely, but an interval estimate can be reliably produced. In
that case, it might be decided to design for maximum load
rather than to wait for more precise quantification.
Posing alternative design solutions as sets rather than as point
solutions is the strategy at the heart of the method of Set-
Based Design (SBD). The beam penetration case is described
by Lottaz et al. (1999) in order to present a technique and
software for specifying ranges of values for continuous vari-
ables and modelling the solution space resulting from the
intersection of alternative ranges. This approach has two
roots, one theoretical and one from practice. The Lottaz
et al. paper emerged from the domain of artificial intelligence
and the attempt to develop concepts and techniques for sol-
ving problems involving multiple constraints, exploration of
which is beyond the scope of this paper. The other root is
Toyota’s method of managing product development
processes (Sobek and Ward, 1996; Sobek et al., 1999;
Ward et al., 1995).
Illustration 4: application of lean rules and tools toprecast concrete fabricationApplication of the Last Planner system of production control
on projects has been demonstrated to increase plan reliability
(Ballard, 2000), which is measured by PPC: the percentage of
weekly or daily releases of work from ‘supplier’ to ‘customer’
compared with what was planned. How far in advance
releases (work flow) can be accurately predicted from plans
establishes a window of reliability within which the supplier’s
production can function effectively. With regard to engi-
neered-to-order products such as precast concrete, it is impor-
tant that lead times, the advance notice of need for delivery
provided by a construction site, fall within that window of
reliability. For example, suppose a construction site achieves
80% PPC looking 1 week ahead, but the precast supplier’s
lead time is 2 weeks. PPC 2 weeks in advance might only
be 60%, assuring that perhaps 40% of requested precast ele-
ments will not be able to be installed, thus building up
unneeded inventory at site. If lead times do not fall within the
window of reliability of the ‘customer’ process, then pulling
materials from suppliers will inevitably build up unneeded
inventory. On the other hand, if Pull mechanisms can be used
effectively, site inventories can be reduced and the production
system’s robustness vastly increased. A shorter lead time
increases system robustness because it allows less wasteful
and more rapid recovery from upsets. In other words, if
something goes wrong, it can be fixed quickly with minimal
disruption to factory operations and to other orders.
In February 2001 experiments were performed in two pro-
duction cells at Malling Precast Products Ltd,5 Shear Walls
and Nap T’s, to demonstrate the feasibility and benefits of
lean production concepts, including one piece flow and pull,
with the objective of improving throughput or production
rate (which amounts to an improvement in productivity if
resources are not increased) and of reducing manufacturing
lead time (Ballard et al., 2002a,b) Production had previously
been organized around functional departments: supply, weld-
ing, reinforcement steel cutting and bending, concrete, etc.
Schedules were used to ‘push’ work through the various pro-
cess steps required to manufacture and deliver a precast ele-
ment. In deterministic systems with no variation in
duration, quality or sequence, scheduling can be effective.
However, no production system is without variation.
Consequently, Push mechanisms tend to build up inventories
between process steps as synchronization fails. Work-in-pro-
gress inventories were very evident at Malling before its lean
transformation.
A process flow chart6 for the Shear Walls production cell
(Figure 8) reveals the new flow-oriented design of that pro-
duction system, which then served as a model for other cells.
Redesign began by structuring for that output rate demanded
by the client project, which needed to have nine shear walls
delivered each day for an extended period. Three two-person
teams placed rebar mats in moulds. Steelfixers (reinforcing
ironworkers) kept three mats tied and ready for placement.
When a mat was taken, they tied another. This pull mechan-
ism (for more on pull; Hopp and Spearman, 2000) prevented
Ballard et al.
12
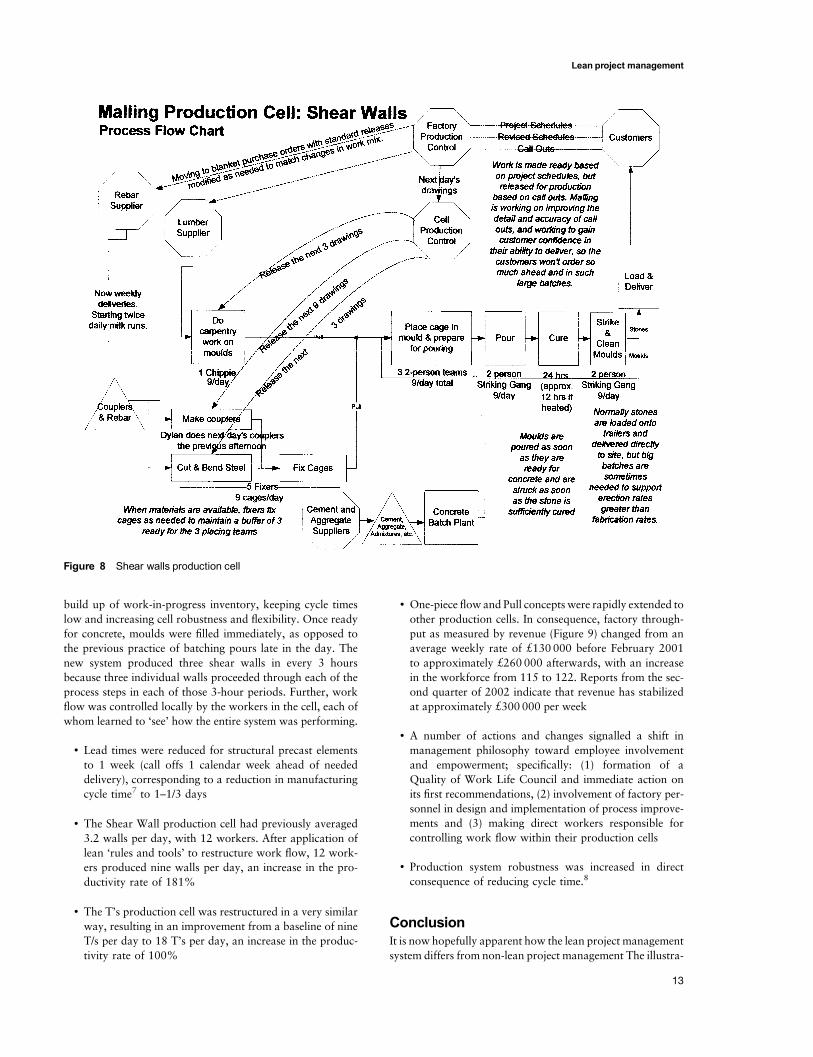
build up of work-in-progress inventory, keeping cycle times
low and increasing cell robustness and flexibility. Once ready
for concrete, moulds were filled immediately, as opposed to
the previous practice of batching pours late in the day. The
new system produced three shear walls in every 3 hours
because three individual walls proceeded through each of the
process steps in each of those 3-hour periods. Further, work
flow was controlled locally by the workers in the cell, each of
whom learned to ‘see’ how the entire system was performing.
� Lead times were reduced for structural precast elements
to 1 week (call offs 1 calendar week ahead of needed
delivery), corresponding to a reduction in manufacturing
cycle time7 to 1–1/3 days
� The Shear Wall production cell had previously averaged
3.2 walls per day, with 12 workers. After application of
lean ‘rules and tools’ to restructure work flow, 12 work-
ers produced nine walls per day, an increase in the pro-
ductivity rate of 181%
� The T’s production cell was restructured in a very similar
way, resulting in an improvement from a baseline of nine
T/s per day to 18 T’s per day, an increase in the produc-
tivity rate of 100%
� One-piece flow and Pull concepts were rapidly extended to
other production cells. In consequence, factory through-
put as measured by revenue (Figure 9) changed from an
average weekly rate of £130 000 before February 2001
to approximately £260 000 afterwards, with an increase
in the workforce from 115 to 122. Reports from the sec-
ond quarter of 2002 indicate that revenue has stabilized
at approximately £300 000 per week
� A number of actions and changes signalled a shift in
management philosophy toward employee involvement
and empowerment; specifically: (1) formation of a
Quality of Work Life Council and immediate action on
its first recommendations, (2) involvement of factory per-
sonnel in design and implementation of process improve-
ments and (3) making direct workers responsible for
controlling work flow within their production cells
� Production system robustness was increased in direct
consequence of reducing cycle time.8
ConclusionIt is now hopefully apparent how the lean project management
system differs from non-lean project management The illustra-
Figure 8 Shear walls production cell
Lean project management
13

tions and reports of implementation suggest that the LPDS is
also a superior management system. Even partial implementa-
tions have yielded substantial improvements in the value gen-
erated for clients, users and producers, and also a reduction in
waste, including waiting time for resources, process cycle
times, inventories, defects and errors, and accidents.9
The LPDS is far from a completed work. Much remains to be
done in the development of lean principles and techniques for
the design, operation and improvement of project-based pro-
duction systems. Further, implementation issues have only
begun to be examined systematically. Structuring organiza-
tions for value generation and waste reduction offer many
challenges for future research and practice.
The Toyota Production System was fundamentally a concep-
tual innovation, a new way of thinking about production and
production management. Applying that new way of thinking
to project management appears to offer opportunity for per-
formance improvement comparable with those achieved with
the change from mass to lean forms of manufacturing.
Researchers and practitioners are invited to join the Lean
community and its efforts to improve construction industry
performance.
ReferencesAlarcon, L. (ed.) (1997) Lean Construction, A.A. Balkema,
Rotterdam.Austin, S., Baldwin, A., Li, B. and Waskett, P. (1998) Analytical
design planning technique (ADePT): a dependency stucture
matrix tool to schedule the building design process.Construction Management and Economics, December.
Ballard, G. (1998) Positive vs negative iteration in design, inProceedings of the 8th Annual Conference of the Interna-tional Group for Lean Construction, Brighton, UK, July,1998.
Ballard, G. (1999a) Work Structuring. White Paper #5, LeanConstruction Institute, Las Vegas, NV [www.leanconstruc-tion.org].
Ballard, G. (1999b) Can pull techniques be used in design?, inProceedings of the Conference on Concurrent Engineering inConstruction, Espoo, Finland, August, 1999.
Ballard, G. (2000a) Phase Scheduling White Paper #7, LeanConstruction Institute, Las Vegas, NV [www.leanconstruc-tion.org].
Ballard, G. (2000b) The last planner system of productioncontrol. PhD dissertation, Civil Engineering, University ofBirmingham, Birmingham.
Ballard, G., Harper, N. and Zabelle, T. (2002a) Learning to seework flow. Engineering, Construction and ArchitecturalManagement, (in press).
Ballard, G., Harper, N. and Zabelle, T. (2002b) An application oflean concepts and techniques to precast concrete fabrication,in Formoso, C. and Ballard, G. (eds): Proceedings of the 10thAnnual Conference of the International Group for LeanConstruction, Gramado, Brazil, August 2002, pp. 225–236.
Ballard, G. an Howell, G. (1994) Implementing lean construc-tion: stabilizing work flow, in Proceedings of the 2nd AnnualConference of the International Group for Lean Construc-tion, Santiago, Chile, 1994; Dept. Alarcon (1997).
Ballard, G. and Howell, G. (1998) Shielding production: Essentialstep in production control. Journal of Construction Manage-ment and Engineering, 124(1), 11–17.
Ballard, G., Howell, G. and Castern, M. (1996) PARC: a casestudy, in Proceedings of the 4th Annual conference of theInternational Group for Lean Construction, University ofBirmingham, Birmingham, UK.
Figure 9 Change in malling revenue for 17 April 1999 to 26 August 2001
Ballard et al.
14

Ballard, G., Koskela, L., Howell, G. and Zabelle, T. (2001)Production system design in construction, in Proceedings ofthe 9th Annual Conference of the International Group forLean Construction, National University of Singapore,Singapore, August 2001.
Best, R. and de Valence, G. (eds) (2002) Design and Construc-tion: Building in Value, Butterworth-Heinemann, Oxford.
Clark, K.B. and Fujimoto, T. (1991) Product DevelopmentPerformance, Harvard Business Press, Cambridge, MA.
Construction Task Force (1997) Rethinking Construction [Re-port of the Construction Task Force to the Deputy PrimeMinister, John Prescott, on the scope for improving thequality and efficiency of UK construction].
Formoso, C. and Ballard, G. (eds) (2002) Proceedings of the 10thAnnual Conference of the International Group for LeanConstruction, Gramado, Brazil, August 2002.
Hopp, W. and Spearman, M. (2000) Factory Physics: Founda-tions of Manufacturing Management, 2nd Edn, IrwinMcGraw-Hill, Boston.
Koskela, L. (1992) Application of the New Production Philoso-phy to Construction. Technical Report 72, CIFE, StanfordUniversity, Stanford, CA.
Koskea, L. (2000) An Exploration Towards a Production Theoryand its Application to Construction, VTT Publications, 408,VTT Building Technology, Espoo [http://www.inf.vtt.fi/pdf/publications/2000 P408.pdf]
Koskela, L. (2001) New footnotes to Shingo, in Proceedings ofthe 9th Annual Conference of the International Group forLean Construction, National University of Singapore,Singapore.
Lottaz, C., Clement, D.E., Faltings, B.V. and Smith, L.F.C. (1999)Constraint-based support for collabortion in design andconstruction. Journal of Computing in Civil Engineering,23–35.
Ohno, T. (1988) The Toyota Production System: Beyond LargeScale Production, author with Setsuo Mito, trans. Joseph P.Schmelzis, Productivity Press, Cambridge, MA.
Reinertsen, D.G. (1997) Managing the Design Factory, FreePress, New York.
Rother, M. and Shook, J. (1998) Learning to See: Value StreamMapping to Add Value and Eliminate Muda, V.1.1, TheLean Enterprise Institute, Brookline, MA.
Shingo, S. (1992) The Shingo Production Management System:Improving Process Functions, Productivity Press, Cam-bridge, MA.
Sobek, D. K., II and Ward, A.C. (1996) Principles from Toyota’sset-based concurrent engineering process, in Proceedings ofASME Design Engineering Technical Conferences andComputers in Engineering Conference, 18–22 August,Mechanical Engineering, Irvine, CA, July 1996, 118(7),78–81.
Sobek, D.K., II, Ward, A.C. and Liker, J.K. (1999) Toyota’sprinciples of set-based concurrent engineering, Sloan Man-agement Review, Winter.
Taguchi, G., Chowdhury, S. and Taguchi, S. (2000) RobustEngineering, McGraw-Hill, New York.
Ward, A.C., Liker, J.K., Cristiano, J.J. and Sobek, D.K., II (1995)The second Toyota paradox: how delaying decisions canmake better cars faster. Sloan Management Review, Spring,43–61.
Womack, J.P., Jones, D.T. and Ross, D. (1990) The MachineThat Changed the World, Rawson Associates, New York.
Endnotes1The expression ‘Lean Project Delivery System’ has beenpreviously used (Best and De Valence, Ch. 15) to name the leanproject management approach, with the intention of denotinghow a product is produced and delivered, from customer order tohandover. No connection is suggested to a particular contractualstructure or method of procurement such as design–construct ordesign–bid–build. While some contractual structures facilitatespecific aspects of lean project management, none guaranteethem, and many lean techniques can be applied in all deliverysystems.
2Some have interpreted lean construction as an imitation ofmanufacturing, an error that might have been avoided if adifferent name had been chosen.
3Note the difference between ‘inventory’ as an accountingconcept and as a production concept. In accounting, inventoryis an asset to be increased. In production, inventory is waste to bereduced to a minimum.
4Six weeks is typical, but lookahead windows may be shorter orlonger, depending on the rapidity of the project and the lead timesfor information, one materials and services. On the one hand,since long lead items are items that cannot be pulled to a projectwithin the lookahead window, extending that window offers thepossibility of greater control over work flow. On the other hand,attempting to pull too far in advance can run foul of one’s abilityto control work flow on site. Consequently, sizing of thelookahead window is a matter of local conditions and judgment.
5Malling is a subsidiary of the O’Rourke Group, located inGrays, Essex, UK.
6The flow chart is modelled after Toyota’s materials andinformation flow diagrams. For details, see Rother and Shook(1998), who use the term ‘value stream maps’.
7Manufacturing cycle time is the time it takes for a product to betransformed from raw material to finished product. In this case,the starting point is release of an element to the factory forproduction. Lead time is that amount of time in advance ofdelivery that ‘orders’ must be sent to the supplier.
8A production system is said to be more robust if it can functioneffectively under a wider range of conditions and is lessvulnerable to upset or disruption (Taguchi et al., 2000).
9See LCI’s Congress papers [at www.leanconstruction.org] forreports by industry practioners of lean implementations.
Lean project management
15