Lean Construction versus Project Management in road projects
253
Page | i Lean Construction versus Project Management in road projects: Scheduling comparison Doctoral thesis performed by: Ahmed Abdelbasset Elkherbawy Directors: Prof. Dr. Jose Turmo Coderque Prof. Dr. Gonzalo Ramos Schneider Prof. Dr. Jose-Antonio Lozano Galant Doctoral program: Construction engineering Barcelona, Spain June 2019
-
Upload
khangminh22 -
Category
Documents
-
view
1 -
download
0
Transcript of Lean Construction versus Project Management in road projects

P a g e | i
Lean Construction versus Project Management in road projects: Scheduling comparison
Doctoral thesis performed by: Ahmed Abdelbasset Elkherbawy Directors: Prof. Dr. Jose Turmo Coderque Prof. Dr. Gonzalo Ramos Schneider
Prof. Dr. Jose-Antonio Lozano Galant
Doctoral program: Construction engineering Barcelona, Spain June 2019

P a g e | ii
Table of Contents
TABLE OF CONTENTS .............................................................................................................. II LIST OF FIGURES .....................................................................................................................V LIST OF TABLES .................................................................................................................. VIII DEDICATION ........................................................................................................................ XII ACKNOWLEDGEMENT ......................................................................................................... XIII ABSTRACT .......................................................................................................................... XIV RESUMEN ............................................................................................................................. XV CHAPTER 1 INTRODUCTION ........................................................................................... 1
1.1 Justification of Research and the Research Problem ............................................. 1 1.2 Objectives .............................................................................................................. 2
1.2.1 General objectives .......................................................................................... 2 1.2.2 Specific objectives ......................................................................................... 3
1.3 Research process .................................................................................................... 4 1.4 Research hypothesis ............................................................................................... 5 1.5 Research methodology ........................................................................................... 5 1.6 Document structure ................................................................................................ 6
CHAPTER 2 PROJECT MANAGEMENT (PM) APPROACH ............................................ 8 2.1 Introduction ............................................................................................................ 8 2.2 Project Management approach concept ................................................................. 8 2.3 The main knowledge areas ................................................................................... 12
2.3.1 Project Time Management Concept............................................................. 13 2.3.2 Project Risk Management Concept .............................................................. 17 2.3.3 Project Stakeholder Management Concept .................................................. 20
2.4 Project Management approach studies................................................................. 22 2.4.1 Studies analysis ............................................................................................ 35
2.5 Application of Project Management (PM) approach on road and infrastructure projects ......................................................................................................................... 38
2.5.1 Studies analysis ............................................................................................ 40 2.6 Conclusion ........................................................................................................... 43
CHAPTER 3 LEAN CONSTRUCTION (LC) ..................................................................... 46 3.1 Introduction .......................................................................................................... 46 3.2 Lean concept history ............................................................................................ 46 3.3 Lean Construction activities ................................................................................ 47 3.4 Lean Construction principles ............................................................................... 49 3.5 Comparison between Lean Construction and Project Management approach .... 55 3.6 Lean Construction tools ....................................................................................... 56
3.6.1 Last Planner System (LPS) .......................................................................... 59 3.6.2 Integrated Project Delivery system (IPD) .................................................... 63
3.7 Lean Construction benefits and barriers .............................................................. 66 3.8 Lean Construction studies .................................................................................... 69
3.8.1 Studies analysis .......................................................................................... 100 3.9 Application of Lean Construction on road project ............................................ 104
3.9.1 Studies analysis .......................................................................................... 107 3.10 Conclusion ......................................................................................................... 110
CHAPTER 4 CASE STUDY ............................................................................................. 112 4.1 Introduction ........................................................................................................ 112 4.2 Project definition ................................................................................................ 112

P a g e | iii
4.3 Field observation and data gathering ................................................................. 115 4.3.1 Main activities of the project ..................................................................... 115
Sub-base layer works ................................................................................. 115 1st aggregate layer works ........................................................................... 116 2nd aggregate layer works........................................................................... 116 1st Asphalt layer works............................................................................... 116
2nd Asphalt layer works .............................................................................. 116 4.3.2 Equipment information .............................................................................. 116 4.3.3 Obstacles on site and recommendations .................................................... 120
4.4 Simulations explanation ..................................................................................... 125 4.5 Assumptions:...................................................................................................... 126 4.6 Definition of parameters: ................................................................................... 128 4.7 Simulations input data........................................................................................ 131 4.8 Process for each waste elimination .................................................................... 132 4.9 Duration Inputs .................................................................................................. 134
4.9.1 Simulation PM-EW .................................................................................... 134 4.9.2 Simulation PM-OW ................................................................................... 139 4.9.3 Simulation LC ............................................................................................ 143
4.10 Conclusion ......................................................................................................... 144 CHAPTER 5 ANALYSIS RESULTS ................................................................................ 146
Introduction ........................................................................................................ 146 5.2 Results ................................................................................................................ 146
5.2.1 Sub-base Layers ......................................................................................... 150 Sub-base Layers filling with excavation material ...................................... 150 Sub-base Layers filling with material not from the site ............................. 152
5.2.2 First and Second Aggregate Layers ........................................................... 154 First Aggregate Layers ............................................................................... 154 Second Aggregate Layer ............................................................................ 156
5.2.3 MC sprinkle and First asphalt paving ........................................................ 158 MC sprinkle ............................................................................................... 158 First asphalt paving .................................................................................... 159
5.2.4 RC sprinkle and Second asphalt paving ..................................................... 161 RC sprinkle ................................................................................................ 161 Second asphalt paving................................................................................ 163
5.3 Analysis.............................................................................................................. 165 5.4 Conclusion: Implications and Significance of the Findings .............................. 166
CHAPTER 6 CONCLUSION ............................................................................................ 168 6.1 Introduction ........................................................................................................ 168
Summary of research findings ........................................................................... 168 6.3 Contribution and future recommendations ........................................................ 171 6.4 Research limitations ........................................................................................... 172 6.5 Conclusion ......................................................................................................... 172
BIBLIOGRAPHY ................................................................................................................... 174 APPENDIX A-1 ................................................................................................................. 205 APPENDIX A-2 ................................................................................................................. 217 APPENDIX A-3 ................................................................................................................. 230 APPENDIX B-1 ................................................................................................................. 234 APPENDIX B-2 ................................................................................................................. 236 APPENDIX B-3 ................................................................................................................. 237

P a g e | iv

P a g e | v
List of Figures
FIGURE 1- 1: PHD THESIS STRUCTURE ......................................................................................... 5
FIGURE 2- 1: DESIGN CHANGES REASONS [115] ........................................................................ 12 FIGURE 2- 2: PRECEDENCE DIAGRAMMING METHOD (PDM) CONCEPT [233] ........................... 14 FIGURE 2- 3: CRITICAL PATH METHOD (CPM) APPLICATION [233] .......................................... 16 FIGURE 2- 4: CONCEPTS OF DESIGN BUILD (DB) AND DESIGN BID BUILD (DBB) [90] ............. 16 FIGURE 2- 5: EXAMPLE OF THE CRITICAL CHAIN METHOD (CCM) APPLICATION [233] ............ 17 FIGURE 2- 6: APPLICATION OF POWER AND INTEREST DIAGRAM FOR STAKEHOLDERS [233] ..... 21 FIGURE 2- 7: COUNTRY ANALYSIS USED PROJECT MANAGEMENT (PM) APPROACH ................. 37 FIGURE 2- 8: PROJECT SECTOR ANALYSIS USED PROJECT MANAGEMENT (PM) APPROACH ....... 37 FIGURE 2- 9: METHODOLOGY ANALYSIS USED PROJECT MANAGEMENT (PM) APPROACH ........ 38 FIGURE 2- 10: COUNTRY ANALYSIS USED PROJECT MANAGEMENT APPROACH ON ROAD AND
INFRASTRUCTURE PROJECTS .............................................................................................. 41 FIGURE 2- 11: PROJECT SECTOR USED PROJECT MANAGEMENT APPROACH ON ROAD AND
INFRASTRUCTURE PROJECTS .............................................................................................. 42 FIGURE 2- 12: METHODOLOGY USED PROJECT MANAGEMENT APPROACH ON ROAD AND
INFRASTRUCTURE PROJECTS .............................................................................................. 43
FIGURE 3- 1: COMPARISON BETWEEN MANUFACTURE AND CONSTRUCTION INDUSTRIES
REGARDS PRODUCTION AND WASTE PERCENTAGE [40] ..................................................... 47 FIGURE 3- 2: LEAN CONCEPT STRUCTURE [147] ........................................................................ 47 FIGURE 3- 3: LEAN CONCEPT PRINCIPLES [230] ......................................................................... 50 FIGURE 3- 4: THE SEVEN FLOWS NEEDED FOR A CONSTRUCTION ACTIVITY [131] ...................... 53 FIGURE 3- 5: LEAN PROJECT DELIVERY SYSTEM (LPDS) [223] ............................................... 55 FIGURE 3- 6: LOOK-AHEAD PLANNING IN LPS [105] ................................................................ 61 FIGURE 3- 7: LAST PLANNER SYSTEM (LPS) [217] ................................................................... 62 FIGURE 3- 8: LAST PLANNER SYSTEM (LPS) CONCEPT [251] .................................................... 63 FIGURE 3- 9: COLLABORATIONS IN TRADITIONAL PROJECT DELIVERY AND IPD [186] .............. 65 FIGURE 3- 10: COMPARISON BETWEEN DESIGN-BID-BUILD (DBB), DESIGN-BUILD (DB) AND
INTEGRATED PROJECT DELIVERY (IPD) SYSTEM [81] ....................................................... 65 FIGURE 3- 11: COUNTRY ANALYSIS USED LEAN CONSTRUCTION (LC) ................................... 102 FIGURE 3- 12: PROJECT SECTOR ANALYSIS USED LEAN CONSTRUCTION (LC) ........................ 102 FIGURE 3- 13: STUDIED LEAN TOOL ANALYSIS ........................................................................ 103 FIGURE 3- 14: METHODOLOGY ANALYSIS USED LEAN CONSTRUCTION (LC) .......................... 104 FIGURE 3- 15: COUNTRY ANALYSIS USED LEAN CONSTRUCTION (LC) ON ROAD AND
INFRASTRUCTURE PROJECTS ............................................................................................ 108 FIGURE 3- 16: PROJECT SECTOR ANALYSIS USED LEAN CONSTRUCTION (LC) ON ROAD AND
INFRASTRUCTURE PROJECTS ............................................................................................ 109 FIGURE 3- 17: LEAN TOOL ANALYSIS ...................................................................................... 110 FIGURE 3- 18: METHODOLOGY ANALYSIS USED LEAN CONSTRUCTION (LC) .......................... 110
FIGURE 4- 1: LAYOUT OF THE PROJECT ................................................................................... 113

P a g e | vi
FIGURE 4- 2: ELEVATION SHEET FOR 10.225 KM ..................................................................... 114 FIGURE 4- 3: GANTT DIAGRAM (SITE DATA) .......................................................................... 114 FIGURE 4- 4: CRACKS OF THE OLD ROAD ................................................................................. 115 FIGURE 4- 5: ROAD PROJECT MACHINES: (A) GRADER, (B) WATER SPRINKLER, (C) PAVING
FINISHER AND (D) DOUBLE DRUM ROLLER ..................................................................... 117 FIGURE 4- 6: GRADER ............................................................................................................. 117 FIGURE 4- 7: WATER SPRINKLE ............................................................................................... 118 FIGURE 4- 8: SINGLE DRUM ROLLERS ...................................................................................... 118 FIGURE 4- 9: MC & RC SPRINKLE MACHINE ........................................................................... 118 FIGURE 4- 10: PAVING FINISHER ............................................................................................. 119 FIGURE 4- 11: DOUBLE DRUM ROLLERS .................................................................................. 119 FIGURE 4- 12: WAITING FOR INSPECTING THE FINISHED ACTIVITY .......................................... 122 FIGURE 4- 13: PAVING FINISHER WAITING THE ASPHALT TRUCKS ........................................... 123 FIGURE 4- 14: WAITING FOR MECHANICAL PROBLEMS ............................................................ 123 FIGURE 4- 15: DOUBLE DRUM ROLLERS FILLING WITH WATER ................................................ 124 FIGURE 4- 16: SIMIO SOFTWARE.............................................................................................. 126
FIGURE 5- 1: THE FOUR SCENARIOS USED IN THE SIMULATIONS FOR UNLOADING SUB-ACTIVITY
........................................................................................................................................ 147 FIGURE 5- 2: PPC FOR THE SUB-BASE LAYER FILLING WITH EXCAVATION MATERIAL ............. 151 FIGURE 5- 3: ANALYZED PPC RATIO FOR SUB-BASE LAYERS FILLING WITH EXCAVATION
MATERIAL ....................................................................................................................... 151 FIGURE 5- 4: PAW FOR SUB-BASE LAYERS FILLING WITH EXCAVATION MATERIAL ................ 151 FIGURE 5- 5: ANALYZED PAW RATIO FOR SUB-BASE LAYERS FILLING WITH EXCAVATION
MATERIAL ....................................................................................................................... 152 FIGURE 5- 6: PPC FOR SUB-BASE LAYERS FILLING WITH MATERIAL NOT FROM THE SITE ........ 152 FIGURE 5- 7: ANALYZED PPC RATIO FOR SUB-BASE LAYERS FILLING WITH MATERIAL NOT FROM
THE SITE .......................................................................................................................... 153 FIGURE 5- 8: PAW FOR SUB-BASE LAYERS FILLING WITH MATERIAL NOT FROM THE SITE ...... 153 FIGURE 5- 9: ANALYZED PAW RATIO FOR SUB-BASE LAYERS FILLING WITH MATERIAL NOT
FROM THE SITE ................................................................................................................ 153 FIGURE 5- 10: PPC FOR 1ST AGGREGATE LAYERS ................................................................... 155 FIGURE 5- 11: ANALYZED PPC RATIO FOR 1ST AGGREGATE LAYERS ...................................... 155 FIGURE 5- 12: PAW FOR 1ST AGGREGATE LAYERS ................................................................. 155 FIGURE 5- 13: ANALYZED PAW RATIO FOR 1ST AGGREGATE LAYERS .................................... 155 FIGURE 5- 14: PPC FOR 2ND AGGREGATE LAYER .................................................................... 156 FIGURE 5- 15: ANALYZED PPC RATIO FOR 2ND AGGREGATE LAYER ....................................... 156 FIGURE 5- 16: PAW FOR 2ND AGGREGATE LAYER .................................................................. 157 FIGURE 5- 17: ANALYZED PAW RATIO FOR 2ND AGGREGATE LAYER ..................................... 157 FIGURE 5- 18: PPC FOR MC SPRINKLE .................................................................................... 158 FIGURE 5- 19: ANALYZED PPC RATIO FOR MC SPRINKLE ....................................................... 159 FIGURE 5- 20: PAW FOR MC SPRINKLE .................................................................................. 159 FIGURE 5- 21: ANALYZED PAW RATIO FOR MC SPRINKLE ..................................................... 159 FIGURE 5- 22: PPC FOR 1ST ASPHALT PAVING ........................................................................ 160 FIGURE 5- 23: ANALYZED PPC RATIO FOR 1ST ASPHALT PAVING ........................................... 160 FIGURE 5- 24: PAW FOR 1ST ASPHALT PAVING ....................................................................... 160

P a g e | vii
FIGURE 5- 25: ANALYZED PAW RATIO FOR 1ST ASPHALT PAVING .......................................... 161 FIGURE 5- 26: PPC FOR RC SPRINKLE ..................................................................................... 162 FIGURE 5- 27: ANALYZED PPC RATIO FOR RC SPRINKLE ........................................................ 162 FIGURE 5- 28: PAW FOR RC SPRINKLE ................................................................................... 162 FIGURE 5- 29: ANALYZED PAW RATIO FOR RC SPRINKLE ...................................................... 163 FIGURE 5- 30: PPC FOR 2ND ASPHALT PAVING ........................................................................ 163 FIGURE 5- 31: ANALYZED PPC RATIO FOR 2ND ASPHALT PAVING .......................................... 163 FIGURE 5- 32: PAW FOR 2ND ASPHALT PAVING ...................................................................... 164 FIGURE 5- 33: ANALYZED PAW RATIO FOR 2ND ASPHALT PAVING ......................................... 164

P a g e | viii
List of Tables
TABLE 2- 1: MATRIX OF PROBABILITY AND IMPACT OF THE RISKS [233] .................................. 19 TABLE 2- 2: INFORMATION OF PROJECT MANAGEMENT (PM) APPROACH STUDIES ................... 22 TABLE 2- 3: INFORMATION OF PROJECT MANAGEMENT (PM) APPROACH STUDIES ................... 23 TABLE 2- 4: INFORMATION OF PROJECT MANAGEMENT (PM) APPROACH STUDIES ................... 24 TABLE 2- 5: INFORMATION OF PROJECT MANAGEMENT (PM) APPROACH STUDIES ................... 25 TABLE 2- 6: INFORMATION OF PROJECT MANAGEMENT (PM) APPROACH STUDIES ................... 26 TABLE 2- 7: INFORMATION OF PROJECT MANAGEMENT (PM) APPROACH STUDIES ................... 28 TABLE 2- 8: INFORMATION OF PROJECT MANAGEMENT (PM) APPROACH STUDIES ................... 28 TABLE 2- 9: INFORMATION OF PROJECT MANAGEMENT (PM) APPROACH STUDIES ................... 29 TABLE 2- 10: INFORMATION OF PROJECT MANAGEMENT (PM) APPROACH STUDIES ................. 30 TABLE 2- 11: INFORMATION OF PROJECT MANAGEMENT (PM) APPROACH STUDIES ................. 31 TABLE 2- 12: INFORMATION OF PROJECT MANAGEMENT (PM) APPROACH STUDIES ................. 32 TABLE 2- 13: INFORMATION OF PROJECT MANAGEMENT (PM) APPROACH STUDIES ................. 33 TABLE 2- 14: INFORMATION OF PROJECT MANAGEMENT (PM) APPROACH STUDIES ................. 34 TABLE 2- 15: COUNTRY ANALYSIS USED PROJECT MANAGEMENT (PM) APPROACH ................. 35 TABLE 2- 16: PROJECT SECTOR ANALYSIS USED PROJECT MANAGEMENT (PM) APPROACH ...... 37 TABLE 2- 17: METHODOLOGY ANALYSIS USED PROJECT MANAGEMENT (PM) APPROACH ....... 37 TABLE 2- 18: INFORMATION OF PROJECT MANAGEMENT (PM) APPROACH ON ROAD AND
INFRASTRUCTURE PROJECTS .............................................................................................. 38 TABLE 2- 19: INFORMATION OF PROJECT MANAGEMENT (PM) APPROACH ON ROAD AND
INFRASTRUCTURE PROJECTS .............................................................................................. 40 TABLE 2- 20: COUNTRY ANALYSIS USED PROJECT MANAGEMENT APPROACH ON ROAD AND
INFRASTRUCTURE PROJECTS .............................................................................................. 41 TABLE 2- 21: PROJECT SECTOR USED PROJECT MANAGEMENT APPROACH ON ROAD AND
INFRASTRUCTURE PROJECTS .............................................................................................. 41 TABLE 2- 22: METHODOLOGY USED PROJECT MANAGEMENT APPROACH ON ROAD AND
INFRASTRUCTURE PROJECTS .............................................................................................. 42
TABLE 3- 1: LEAN CONCEPT WASTES [245] ............................................................................... 49 TABLE 3- 2: TRANSFORMATION, FLOW AND VALUE (TFV) BENEFITS [223] ............................. 52 TABLE 3- 3: TRANSFORMATION, FLOW AND VALUE (TFV) CONCEPT, PRINCIPLE AND
CONTRIBUTION [40] .......................................................................................................... 53 TABLE 3- 4: COMPARISON BETWEEN PROJECT MANAGEMENT (PM) APPROACH AND LEAN
CONSTRUCTION (LC) [223] .............................................................................................. 56 TABLE 3- 5: INFORMATION OF LEAN CONSTRUCTION (LC) STUDIES ......................................... 70 TABLE 3- 6: INFORMATION OF LEAN CONSTRUCTION (LC) STUDIES ......................................... 70 TABLE 3- 7: INFORMATION OF LEAN CONSTRUCTION (LC) STUDIES ......................................... 71 TABLE 3- 8: INFORMATION OF LEAN CONSTRUCTION (LC) STUDIES ......................................... 72 TABLE 3- 9: INFORMATION OF LEAN CONSTRUCTION (LC) STUDIES ......................................... 73 TABLE 3- 10: INFORMATION OF LEAN CONSTRUCTION (LC) STUDIES ....................................... 74 TABLE 3- 11: INFORMATION OF LEAN CONSTRUCTION (LC) STUDIES ....................................... 76 TABLE 3- 12: INFORMATION OF LEAN CONSTRUCTION (LC) STUDIES ....................................... 76 TABLE 3- 13: INFORMATION OF LEAN CONSTRUCTION (LC) STUDIES ....................................... 77

P a g e | ix
TABLE 3- 14: INFORMATION OF LEAN CONSTRUCTION (LC) STUDIES ....................................... 78 TABLE 3- 15: INFORMATION OF LEAN CONSTRUCTION (LC) STUDIES ....................................... 79 TABLE 3- 16: INFORMATION OF LEAN CONSTRUCTION (LC) STUDIES ....................................... 80 TABLE 3- 17: INFORMATION OF LEAN CONSTRUCTION (LC) STUDIES ....................................... 81 TABLE 3- 18: INFORMATION OF LEAN CONSTRUCTION (LC) STUDIES ....................................... 82 TABLE 3- 19: INFORMATION OF LEAN CONSTRUCTION (LC) STUDIES ....................................... 83 TABLE 3- 20: INFORMATION OF LEAN CONSTRUCTION (LC) STUDIES ....................................... 84 TABLE 3- 21: INFORMATION OF LEAN CONSTRUCTION (LC) STUDIES ....................................... 85 TABLE 3- 22: INFORMATION OF LEAN CONSTRUCTION (LC) STUDIES ....................................... 86 TABLE 3- 23: INFORMATION OF LEAN CONSTRUCTION (LC) STUDIES ....................................... 87 TABLE 3- 24: INFORMATION OF LEAN CONSTRUCTION (LC) STUDIES ....................................... 88 TABLE 3- 25: INFORMATION OF LEAN CONSTRUCTION (LC) STUDIES ....................................... 89 TABLE 3- 26: INFORMATION OF LEAN CONSTRUCTION (LC) STUDIES ....................................... 90 TABLE 3- 27: INFORMATION OF LEAN CONSTRUCTION (LC) STUDIES ....................................... 91 TABLE 3- 28: INFORMATION OF LEAN CONSTRUCTION (LC) STUDIES ....................................... 92 TABLE 3- 29: INFORMATION OF LEAN CONSTRUCTION (LC) STUDIES ....................................... 93 TABLE 3- 30: INFORMATION OF LEAN CONSTRUCTION (LC) STUDIES ....................................... 94 TABLE 3- 31: INFORMATION OF LEAN CONSTRUCTION (LC) STUDIES ....................................... 95 TABLE 3- 32: INFORMATION OF LEAN CONSTRUCTION (LC) STUDIES ....................................... 96 TABLE 3- 33: INFORMATION OF LEAN CONSTRUCTION (LC) STUDIES ....................................... 97 TABLE 3- 34: INFORMATION OF LEAN CONSTRUCTION (LC) STUDIES ....................................... 98 TABLE 3- 35: INFORMATION OF LEAN CONSTRUCTION (LC) STUDIES ....................................... 99 TABLE 3- 36: COUNTRY ANALYSIS USED LEAN CONSTRUCTION (LC)..................................... 101 TABLE 3- 37: PROJECT SECTOR ANALYSIS USED LEAN CONSTRUCTION (LC) .......................... 102 TABLE 3- 38: STUDIED LEAN TOOL ANALYSIS ......................................................................... 102 TABLE 3- 39: METHODOLOGY ANALYSIS USED LEAN CONSTRUCTION (LC) ........................... 103 TABLE 3- 40: INFORMATION OF LEAN CONSTRUCTION (LC) STUDIES ON ROAD AND
INFRASTRUCTURE PROJECTS ............................................................................................ 104 TABLE 3- 41: INFORMATION OF LEAN CONSTRUCTION (LC) STUDIES ON ROAD AND
INFRASTRUCTURE PROJECTS ............................................................................................ 105 TABLE 3- 42: INFORMATION OF LEAN CONSTRUCTION (LC) STUDIES ON ROAD AND
INFRASTRUCTURE PROJECTS ............................................................................................ 107 TABLE 3- 43: COUNTRY ANALYSIS USED LEAN CONSTRUCTION (LC) ON ROAD AND
INFRASTRUCTURE PROJECTS ............................................................................................ 108 TABLE 3- 44: PROJECT SECTOR ANALYSIS USED LEAN CONSTRUCTION (LC) ON ROAD AND
INFRASTRUCTURE PROJECTS ............................................................................................ 108 TABLE 3- 45: LEAN TOOL ANALYSIS ....................................................................................... 109 TABLE 3- 46: METHODOLOGY ANALYSIS USED LEAN CONSTRUCTION (LC) ........................... 110
TABLE 4- 1: EQUIPMENT USED AND THEIR UTILIZATION.......................................................... 119 TABLE 4- 2: RESOURCE FOR EACH SUB-ACTIVITY ................................................................... 120 TABLE 4- 3: WASTES EXPLANATIONS ..................................................................................... 124 TABLE 4- 4: GENERAL ASSUMPTIONS FOR ALL SIMULATIONS .................................................. 127 TABLE 4- 5: SPECIFIC ASSUMPTIONS FOR EACH SIMULATION .................................................. 127 TABLE 4- 6: BREAKDOWN OF THE STUDIED ROAD PROJECT ..................................................... 131

P a g e | x
TABLE 4- 7: WASTES OCCURRENCE DURING EVERY SUB-ACTIVITY (OBSERVED AND ASSUMED)........................................................................................................................................ 131
TABLE 4- 8: WASTES TIMES OBSERVED AND MAXIMUM OCCURRENCE PERCENTAGE .............. 132 TABLE 4- 9: WASTES SIMILARITIES ON PREVIOUS STUDIES...................................................... 133 TABLE 4- 10: WASTES MODIFIED BASED ON PREVIOUS STUDIES (BY USING LEAN TOOLS) ...... 134 TABLE 4- 11: TIME AND WASTES DURATION SIMULATION PM-EW (SUB-BASE 1ST AND 2ND
LAYERS FILLING WITH EXCAVATION MATERIAL) ............................................................ 135 TABLE 4- 12: TIME AND WASTES DURATION SIMULATION PM-EW (SUB-BASE 3RD AND 4TH
LAYERS FILLING WITH EXCAVATION MATERIAL) ............................................................ 135 TABLE 4- 13: TIME AND WASTES DURATION SIMULATION PM-EW (SUB-BASE 1ST AND 2ND
LAYERS FILLING WITH OUTSIDE MATERIAL) .................................................................... 136 TABLE 4- 14: TIME AND WASTES DURATION SIMULATION PM-EW (SUB-BASE 3RD AND 4TH
LAYERS FILLING WITH OUTSIDE MATERIAL) .................................................................... 137 TABLE 4- 15: TIME AND WASTES DURATION SIMULATION PM-EW (1ST AGGREGATE FOR THE
TWO LAYERS) ................................................................................................................. 137 TABLE 4- 16: TIME AND WASTES DURATION SIMULATION PM-EW (2ND AGGREGATE AND MC
ACTIVITIES) ..................................................................................................................... 138 TABLE 4- 17: TIME AND WASTES DURATION SIMULATION PM-EW (1ST ASPHALT LAYER AND
RC ACTIVITIES) ............................................................................................................... 138 TABLE 4- 18: TIME AND WASTES DURATION SIMULATION PM-EW (2ND ASPHALT LAYER) ... 138 TABLE 4- 19: TIME AND WASTES DURATION SIMULATION PM-OW (SUB-BASE 1ST AND 2ND
LAYERS FILLING WITH EXCAVATION MATERIAL) ............................................................ 139 TABLE 4- 20: TIME AND WASTES DURATION SIMULATION PM-OW (SUB-BASE 3RD AND 4TH
LAYERS FILLING WITH EXCAVATION MATERIAL) ............................................................ 140 TABLE 4- 21: TIME AND WASTES DURATION SIMULATION PM-OW (SUB-BASE 1ST AND 2ND
LAYERS FILLING WITH OUTSIDE MATERIAL) .................................................................... 140 TABLE 4- 22: TIME AND WASTES DURATION SIMULATION PM-OW (SUB-BASE 3RD AND 4TH
LAYERS FILLING WITH OUTSIDE MATERIAL) .................................................................... 141 TABLE 4- 23: TIME AND WASTES DURATION SIMULATION PM-OW (1ST AGGREGATE FOR THE
TWO LAYERS) .................................................................................................................. 141 TABLE 4- 24: TIME AND WASTES DURATION SIMULATION PM-OW (2ND AGGREGATE LAYER
AND MC ACTIVITIES) ...................................................................................................... 142 TABLE 4- 25: TIME AND WASTES DURATION SIMULATION PM-OW (1ST ASPHALT LAYER, RC
ACTIVITIES AND 2ND ASPHALT LAYER ACTIVITIES) .......................................................... 142 TABLE 4- 26: TIME AND WASTES DURATION SIMULATION LC (SUB-BASE FOR THE FOUR LAYERS
FILLING WITH EXCAVATION MATERIAL) .......................................................................... 143 TABLE 4- 27: TIME AND WASTES DURATION SIMULATION LC (SUB-BASE FOR THE FOUR LAYERS
FILLING WITH OUTSIDE MATERIAL) ................................................................................. 143 TABLE 4- 28: TIME AND WASTES DURATION SIMULATION LC (1ST AGGREGATE TWO LAYERS,
2ND AGGREGATE AND MC ACTIVITIES) .......................................................................... 144 TABLE 4- 29: TIME AND WASTES DURATION SIMULATION LC (1ST ASPHALT, RC AND 2ND
ASPHALT ACTIVITIES) ..................................................................................................... 144
TABLE 5- 1: ANALYSED EQUATION FOR PPC RATIOS .............................................................. 149 TABLE 5- 2: SUB-BASE FIRST LAYER (FILLING WITH EXCAVATION MATERIAL) EXAMPLE FOR
ANALYZED PPC RATIOS .................................................................................................. 149

P a g e | xi
TABLE 5- 3: PPC AND PAW FOR SUB-BASE LAYERS FILLING WITH EXCAVATION MATERIAL [%]........................................................................................................................................ 150
TABLE 5- 4: PPC AND PAW FOR SUB-BASE LAYERS FILLING WITH MATERIAL NOT FROM THE
SITE [%] .......................................................................................................................... 152 TABLE 5- 5: PPC AND PAW FOR 1ST AGGREGATE LAYERS [%] .............................................. 154 TABLE 5- 6: PPC AND PAW FOR 2ND AGGREGATE LAYER [%] ............................................... 156 TABLE 5- 7: PPC AND PAW FOR MC SPRINKLE [%] ............................................................... 158 TABLE 5- 8: PPC AND PAW FOR 1ST ASPHALT PAVING [%].................................................... 159 TABLE 5- 9: PPC AND PAW FOR RC SPRINKLE [%] ................................................................ 161 TABLE 5- 10: PPC AND PAW FOR 2ND ASPHALT PAVING [%] ................................................. 163

P a g e | xii
Dedication
This thesis is dedicated, with deepest love and endless respect, to my parents, wife and sons.
Without your prayers, support and trust in me, I could not have done it.

P a g e | xiii
Acknowledgement
I would like to express my sincere gratitude to Prof. Dr. Jose Turmo Coderque, Prof. Dr. Gonzalo Ramos Schneider and Prof. Dr. Jose-Antonio Lozano Galant for their continuous guidance and motivation throughout my thesis. Their availability and support were definitely of great help to me. I could have not imagined having better directors, advisors and mentors for my doctoral thesis. Your encouragement for me has always pushed me to work harder.
The author is indebted to the Spanish Ministry of Economy and Competitiveness for the funding provided through the research projects BIA2013-47290-R and BIA 2017-86811-C2.
I would also like to thank Dña. Rosa Maria Olea from the School of Civil Engineering, PhD Area at Polytechnic University of Catalonia (UPC) for being helpful and supportive all the time.
My profound gratitude goes to my beloved mother Professor Dr. Nehal Elwan, and my precious father Engineer Nashaat Elkherbawy for providing me with care and inspiration. Your countless contributions and support throughout my life is what brought me to where I am today. No matter what I say, it will never express my love and gratitude to you. Your sacrifices are countless.
I deeply thank my beloved dear wife Sally Samy Tayie for her continuous support and sacrifices. You always have faith in me, which motivated me to accomplish my thesis. I would not have done it without you. I also would like to thank my two little angels Yassin and Selim for their patience and sufferings because of my being busy taking away from their time to accomplish my work.
Besides, I extend my thanks to my siblings Mohamed Elkherbawy and Hadeel Elkherbawy for supporting and believing in me. May God bless both of you dear ones.
I would like to thank my in laws, my father in law Prof. Dr. Samy Tayie for his fatherly advices, his encouragement and support since the very beginning, and my mother in law Mrs. Ennas Wahba for her concern and support during the thesis.
Last but not least, I would like to extend my gratitude to Engineer Abdelrahman Fahmy who facilitated my field work and supported me during my investigation, besides Engineer Amr Eltanbouly and Engineer Moustafa who were generous enough to provide me with the necessary site information to help me conduct my case study.

P a g e | xiv
Abstract
Lean Construction is regarded as an innovative approach of management for various types of
projects in the field of construction. As much as it is currently applied in some countries, its
expansion is inevitable, for better overall results are obtained and the projects’ objectives are
met more precisely. Despite the fact that Lean Construction offers solutions to many problems
occurring under the traditional management approach known as the Project Management (PM),
the scope of its application is not as promising. Countries where Lean Construction is
minimally applied include the United States of America and the United Kingdom besides other
countries in Europe and Latin America. However, it is still not applied to a more exhaustive
extent in these countries and is completely missing in many others around the world.
This study primarily focuses on the application of Lean Construction to Infrastructure,
specifically road projects; investigating Lean Construction solutions to the time wastes.
Through conducting a case study research, this work focuses on investigating the impact of
applying Last Planner System as a Lean Construction tool on the elimination of Non-Value
Added (NVA) activities, that is, wastes in a highway project in Cairo, Egypt. This study
includes a State of Art on both Project Management approach and Lean Construction.
The study applies a comparative approach between the application of Project Management
approach and Lean Construction in road projects. Hence, the researcher conducted different
simulations of the studied road project, taking into account the two approaches (Project
Management and Lean Construction), then obtaining the simulations results. Two parameters
are used as comparison criteria: Percentage Plan Complete (PPC) and Percentage Activity
Waste (PAW). The later (PAW) is a new parameter introduced by the researcher to investigate
its results before/after applying the Lean Construction tools.
Findings of the study support the research hypothesis that the application of Lean Construction
approach to road projects enhances productivity through eliminating time-related wastes and
decreasing the project duration. This research supports the argument that road projects can
benefit greatly from the application of Lean Construction instead of the traditional approach.

P a g e | xv
Resumen
Lean Construction es considerado como un enfoque innovador para la gestión de diversos tipos
de proyectos en el campo de la construcción. Por más que se aplique actualmente en algunos
países, su expansión es inevitable, ya que se obtienen mejores resultados generales y los
objetivos de los proyectos se cumplen con mayor precisión. A pesar del hecho de que Lean
Construction ofrece soluciones a muchos problemas que ocurren bajo el enfoque de
administración tradicional conocido como Gestión de Proyectos (Project Management, PM),
el alcance de su aplicación no es tan prometedor. Los países en los que se aplica mínimamente
el Lean Construction son los Estados Unidos de América y el Reino Unido, además de otros
países de Europa y América Latina. Sin embargo, todavía no se aplica de manera más
exhaustiva en estos países y está completamente ausente en muchos otros en todo el mundo.
Este estudio se centra principalmente en la aplicación de el Lean Construction a Infraestructura,
específicamente en proyectos viales; Investigando soluciones de Lean Construction para los
desperdicios del tiempo. A través de la realización de una investigación de estudio de caso, este
trabajo se enfoca en investigar el impacto de la aplicación del Sistema Last Planner como una
herramienta Lean Construction en la eliminación de actividades sin valor agregado (NVA), es
decir, desechos en un proyecto vial en El Cairo, Egipto. Este estudio incluye un estado del arte
tanto en el enfoque de gestión tradicional de proyectos Project Management como en Lean
Construction.
El estudio se aplica a un enfoque comparativo entre la aplicación del enfoque de el Project
Management y el Lean Construction en proyectos viales. Por lo tanto, el investigador realizó
diferentes simulaciones del proyecto de carretera estudiado, teniendo en cuenta los dos
enfoques (Project Management y Lean Construction), y luego obtuvo los resultados de las
simulaciones. Se utilizan dos parámetros como criterios de comparación: Plan de porcentaje
completado (PPC) y Porcentaje de residuos de actividad (PAW). El último (PAW) es un nuevo
parámetro introducido por el investigador para investigar sus resultados antes / después de
aplicar las herramientas de el Lean Construction.
Los hallazgos del estudio apoyan la hipótesis de la investigación de que la aplicación del
enfoque de Lean Construction a los proyectos viales aumenta la productividad al eliminar los
desechos relacionados con el tiempo y disminuir la duración del proyecto. Esta investigación
apoya el argumento de que los proyectos viales pueden mejorarse en gran medida con la
aplicación de el Lean Construction en lugar del enfoque tradicional el Project Management.

P a g e | 1
CHAPTER 1 INTRODUCTION
1.1 Justification of Research and the Research Problem
Lean Construction is regarded as an innovative approach of management for various types of
projects in the field of construction. As much as it is currently applied in some countries, its
expansion is inevitable, for better overall results are obtained and the projects’ objectives are
met more precisely. Countries where Lean Construction is minimally applied include the
United States of America and the United Kingdom besides other countries in Europe and Latin
America [245], [35]. However, it is still not applied to a more exhaustive extent in these
countries and is completely missing in many others around the world. It is worth mentioning
that including the Lean approach in the construction field is relatively recent, as it began in the
90s providing opportunities for improvements in projects’ management. Despite the fact that
Lean Construction offers solutions to many problems in the traditional management approach
known as the Project Management (PM), the scope of its application is not as promising [139].
Having been applied in some instances and not in many others, it is interesting to investigate
the reasons behind the lack of its spread. Scholars found that there are challenges that stand in
the way of applying Lean Construction. Lack of awareness about the existence of this approach
as well as lack of knowledge of how to properly apply it come at the top of the list of obstacles
that hinder the application of Lean Construction. One reason that causes lack of awareness is
the non-existent interest to change; owners, contractors and decision makers in construction
projects reject the application of new approaches for fear of taking risks by trying innovative
solutions [35].
This study primarily focuses on the application of Lean Construction to Infrastructure,
specifically road projects. The reason for choosing to focus on road projects goes back to their
sensitive nature. That is, road projects are regarded as the foundation on which cities are
constructed, which makes it a crucial category to start with when applying the Lean approach.
According to scholars [111], [223] using the traditional Project Management approach in road
projects results in many wastes, most importantly time and cost related wastes. Hence, the
study investigates Lean Construction solutions to the time wastes. Because of the significance
of road projects and the advantages provided by Lean Construction, the study endeavours to
support the argument that road projects can benefit greatly from the application of Lean
Construction instead of the traditional approach.

P a g e | 2
Delays in the scheduled durations of road projects were found to be common when applying
the traditional management approach [223]. Based on personal observation of a road project,
applying the traditional Project Management approach resulted in time wastes that can be
grouped in three categories. These categories are: inspection delays that are caused by factors
such as absent or occupied consultants, lack of materials when needed due to not delivering on
time, and lack of machinery maintenance which in many instances lead to the breakdown of
the equipment on site.
Having observed such problems, the application of Lean Construction to road projects becomes
inevitable to face time related wastes. Elimination of wastes is a concept that lies in the core of
the Lean Construction by providing various tools to get rid of the different wastes categories.
Addressing the aforementioned wastes, Lean Construction provides three tools: Last Planner
System (LPS), Just In Time (JIT) and Total Productive Maintenance (TPM), which are
discussed in details later [51], [209], [57].
1.2 Objectives
1.2.1 General objectives
As previously mentioned, the main objective of the proposed research is to investigate the
application of Lean Construction approach to infrastructure projects with a specific focus on
road projects.
The majority of road projects in the world in general and in Egypt in specific are developed
using the Project Management concept as the default approach. As noted in the above-
mentioned section, the downsides of this approach affect the overall quality and delivery of the
projects because of the wastes produced during the process. Hence, Lean Construction, with
the advantageous tools it provides, is put forward as a preferable approach to apply to road
projects.
Through conducting case study research, this study focuses on investigating the impact of
applying Last Planner System as a Lean Construction tool on the elimination of Non-Value
Added (NVA) activities, that is, wastes in a highway project in Cairo, Egypt. Non-Value
Added (NVA) activities mainly refer to the aforementioned three categories of wastes:
inspection delays (such as absent or occupied consultants), lack of materials when needed (due
to not delivering on time for example), and lack of machinery maintenance (causing problems
such as the breakdown of the equipment on site). During the period from 16th of July until 15th

P a g e | 3
of August 2016, the PhD candidate studied a highway project in Egypt -Dahshour's Connection
Highway- aiming at investigating how road projects work under the traditional Project
Management approach.
1.2.2 Specific objectives
1) Applying Project Management (PM) into the simulation modelling of the case study:
a) Making a conceptual model for Work Breakdown Structure (WBS); one of the most
important tools for Project Management (PM) approach. This tool is used to
decompose the milestones of the project to activities.
b) Making numerical simulations to determine the impact of the percentage of time
wasted during the project activities on the productivity percentage and activities
duration. The percentage of time wasted refers to time wastes percentage during
each activity divided by the total time of this activity (without the wasted time). The
productivity percentage refers to percentage of the actual productivity during a
week divided by the productivity planned for the same week. The main idea of using
the percentage of time wasted is to demonstrate how the existence of wasted time
while applying the Project Management approach negatively affects the
productivity percentage and activities duration. Accordingly, the calculations in this
simulation reflect the actual observations on site as recorded from the case study of
the highway.
2) Applying Lean Construction (LC) into the simulation modelling of the case study:
a) Making a conceptual model for Weekly Work Planning (WWP). Weekly Work
Planning (WWP) is used to determine the percentage of time wasted for the
activities that took place in the week before. It is also named “Commitment
planning”; engineers have to respond to the question of what will be done next. This
is considered short-term planning (weekly planning). Last Planner System (LPS),
the Lean tool under which Weekly Work Planning (WWP) falls, aims to protect
projects from variabilities. Last Planner System (LPS) is also used to determine the
reason behind the failure to execute the required activities. Weekly Work Planning
(WWP) is specifically used to determine the breakdown of the activities and
identify their wastes.
c) Making numerical simulations to determine the impact of the percentage of time
wasted on productivity percentage and activities duration when these parameters’
values change (by eliminating wastes as explained below) and measuring the results

P a g e | 4
of these variables. The percentage of time wasted refers to the percentage of wasted
time during each activity divided by the total time of this activity (without the
wasted time). The productivity percentage refers to percentage of the actual
productivity during a week divided by the productivity planned for the same week.
The main idea of using the percentage of time wasted is to demonstrate how the
elimination of wasted time while applying the Lean Construction (LC) positively
affects the productivity percentage and total project duration.
3) Analysing the results.
1.3 Research process
The PhD thesis is divided into four parts as shown in Figure 1-1. The first part is the case study
conducted: includes studying and observing a road project. From the site observation the
problems are observed and identified. The second part includes reviewing previous studies on
the two approaches - Project Management and Lean Construction - in general and how they
are applied to road projects in specific. The third part is mainly concerned with conducting
different simulations of the studied road project, taking into account the two approaches
(Project Management and Lean Construction), then obtaining the simulations results. The last
part includes the comparative analysis between the application of Project Management and
Lean Construction to road projects, and putting forward recommendations for the industry and
suggestions for future researches.

P a g e | 5
Figure 1- 1: PhD thesis structure
1.4 Research hypothesis
Based on the reviewed literature, this study hypothesizes that the application of Lean
Construction approach to road projects enhances productivity through eliminating time-related
wastes and decreasing the project duration. Accordingly and in light of the aforementioned
objectives, this research targets investigating the following research hypothesis:
- RH: The application of Lean Construction approach to road projects enhances
productivity through eliminating time-related wastes and decreasing the project
duration.
1.5 Research methodology
The study’s empirical work is done through conducting case study research through observing
and studying a highway project in Cairo, Egypt. The main aim is to explore the main focus of
the study; the impact of applying last planner system as a Lean Construction tool on the
elimination of Non-Value Added (NVA) activities, that is, wastes in a highway project in Cairo,
Egypt. In that sense the case study serves as a demonstration of the weaknesses of applying the
Project Management approach in road projects.
Accordingly, during the period from the 16th of July until the 15th of August 2016, the PhD
candidate studied a highway project in Egypt -Dahshour's Connection Highway- aiming at
investigating how road projects work under the traditional Project Management approach.
Exploring the downsides and their potential impact on road projects was the main aim guiding
the case study, in order to emphasize and investigate the degree of importance of Lean
Construction (LC) application in road projects.
Numerical simulations are carried out using the software Simio. The main aim of applying
these simulations is conducting a comparative analysis between using Project Management
(PM) and Lean Construction (LC) approaches in road projects. Hence, three simulations were
conducted as follows:
- Simulation PM-EW (Project Management Expected Wastes): Inserting the maximum
number of assumed wastes for each sub-activity in the studied project using random
functions (personal assumption based on site observations).
- Simulation PM-OW (Project Management Observed Wastes): Different values for time
wastes are introduced using random functions based on observations on site.

P a g e | 6
- Simulation LC (Lean Construction): Same as the previous Simulation, different values for
time wastes using random functions based on site observations.
The three simulations are explained in details in the Methodology chapter.
1.6 Document structure
This PhD thesis proposal is divided into six chapters as follows:
Chapter 1: Introduction; as demonstrated, includes the justification of the research,
explanation of the research problem and how it is addressed. This chapter also includes
the general objectives, which focus on the application of Lean Construction in road
projects. This is followed by the specific objectives, which focus on the numerical
simulations done to demonstrate the comparison between the results when applying
Lean Construction versus Project Management approach into the simulation modelling.
Then, the study’s main research question and the explanation of the studied road project
are demonstrated by determining the project’s location, characteristics and activities.
Chapter 2: Literature review on Project Management (PM) approach; reviewing
previous studies on Project Management (PM) approach. The chapter begins by
explaining the concept of Project Management (PM) approach, listing its main
knowledge areas and the project management process groups. Additionally, the status
of the construction projects nowadays is overviewed in an attempt to demonstrate the
downsides of applying Project Management. The next section sheds light specifically
on the concept and tools of three knowledge areas relevant to the study. Lastly, previous
studies on road projects applying the Project Management (PM) approach are reviewed.
Chapter 3: Literature review on Lean Construction (LC); reviewing previous studies on
Lean Construction (LC). This chapter starts by overviewing the history of the Lean
concept and the reasons behind its invention to provide context. This is followed by
determining the principles of Lean Construction. A comparison between the two
management approaches, Lean Construction and Project Management is then
demonstrated. Then a focus on the Lean perspective on construction projects activities
is developed followed by presenting the main Lean Construction tools. Emphasis is
then done on two specific Lean Construction tools because of their relevance to this
study; Last Planner System and Integrated Project Delivery System. In order to present
an exhaustive overview, the barriers as well as benefits of Lean Construction are then

P a g e | 7
presented, followed by reviewing previous studies on road projects applying Lean
Construction.
Chapter 4: Methodology; detailed explanation of the conducted case study including
information about the simulations applied and the inputs data. At the beginning details
about the studied road project are presented in order to provide the necessary context;
the location, scheduled duration, project length, and more information related to the
project. The main activities of the project and the obstacles observed during the site
visits are demonstrated. The next section includes the information related to the
conducted simulations. Under this section, the justifications of applying the different
simulations in the study are discussed, their assumptions, the parameters used and
identification of the inputs in each simulation.
Chapter 5: Results analysis; the results of the numerical simulations for each activity of
the studied road project are presented. Then, in light of the researcher’s own
observations and the previous studies, analysis of these results is illustrated.
Chapter 6: Conclusion; responding to the study’s main research question based on the
findings analysis. Further, in this chapter the study’s limitations are presented as well
as recommendations to the construction industry and suggestions for future research.

P a g e | 8
CHAPTER 2 PROJECT MANAGEMENT (PM) APPROACH
2.1 Introduction
In this chapter, an overview of previous studies on the Project Management (PM) approach and
how it is applied in different construction projects is demonstrated. The chapter begins by
explaining the PM as the traditional approach and its main pillars in general by presenting the
PM process groups and knowledge areas. In this section, an explanation of the problems that
face the construction industry in light of the PM application is presented. Besides, subsections
that focus on explaining the knowledge areas relevant to this study and its main tools are
developed. In the section that follows, details of the Project Management (PM) approach
application on general projects sectors is analysed. Last but most important to this study is the
section where analysis of the application of PM approach in road projects is demonstrated. The
chapter is then brought to an end with the conclusion where the main highlights are emphasized.
2.2 Project Management approach concept
Any construction project can be identified as successful mainly through achieving
improvements in the main criteria; related to cost, time and quality, in addition to effectively
meeting the stakeholders’ requirements. Hence, turning material at hand into the required
output and finalizing the project with the identified benefits (reducing cost, meeting
stakeholders’ requirements, etc.) come at the top of the list to attain successful project
management. It is essential to note that the project management success is not the same as the
project success; as the first means the success of the “iron triangle” (which refers to cost, time
and quality) and the second refers to the success of delivering the final result of the project.
Corrective project planning, hiring workers with adequate skills set, and availability of
materials and equipment are identified as important factors in order to have a successful project
[171], [144], [169], [167], [255], [188], [122], [43], [279], [168], [8], [198], [90], [89], [55],
[229], [178], [254], [189], [154], [184], [237], [69], [98], [177], [141], [128], [134], [295],
[160], [246], [10], [11], [14], [61], [97], [120], [130], [135], [195], [182], [228], [231] [276].
The Project Management Institute (PMI) is a non-profit institute with a main mission to set the
requirements and procedures for managing construction projects using the PM approach. The
PMI published the Project Management Body Of Knowledge (PMBOK) guide for the Project
Management (PM) approach. The first copy was published in 1996, providing guidelines of
how to attain project and project management success. This guide defines the project as a

P a g e | 9
temporary attempt of a process to deliver a unique result of a product, as it has a specific
beginning and end. The PMBOK GUIDE defines project management as phases designed to
manage the project by using the necessary knowledge and tools to meet the project’s targets;
the project’s success criteria. There are forty-seven project management procedures
categorized under ten knowledge areas and five project management phases. The five project
management phases and knowledge areas are [169], [188], [122], [43], [279], [8], [198], [55],
[229], [178], [177], [128], [246], [233], [134], [135]:
(1) Initiating; this entails the identification and definition of the project.
(2) Planning; under this process phase occurs the planning of all the knowledge areas,
which takes place before starting the execution stage.
(3) Executing; is the execution process; the transformation of the customer’s imagination
to real.
(4) Monitoring and controlling; this phase controls the knowledge areas and tracks any
changes that occur.
(5) Closing; this is the finalizing process of the project.
While knowledge areas are:
(1) Project Integration Management; includes the track to determine how to define, execute,
manage, control and close the project.
(2) Project Scope Management; is used to include all the data to finish the project exactly
as the customer wants and expects.
(3) Project Time Management; is used to develop and control the project schedule.
(4) Project Cost Management; is used to develop and control the project budget.
(5) Project Quality Management; refers to the quality policies and objectives for the project.
(6) Project Human Resource Management; includes the identification, organization and
management of the team members, workers and human resources of the project.
(7) Project Communication Management; is used to include the information about the
communication process between the stakeholders in the project.
(8) Project Risk Management; refers to the identification, ranking, controlling the risks in
the project.
(9) Project Procurement Management; includes the procedures needed to track the
relationships with the organizations outside the project, which may include sub-

P a g e | 10
contractors, suppliers or any other organization that delivers products to the
construction project.
(10) Project Stakeholder Management; includes the identification of any stakeholder who
can affect the project directly or indirectly. It includes also the controlling process with
the stakeholders.
This study is mainly concerned with two knowledge areas: project time management and
project risk management. As a matter of fact, the two areas are correlated; where risk
management has a significant impact on time management [263], [127] [151], [23], [164],
[287]. For instance, an error in the design phases if not detected early as a part of risk
management can reflect during implementation causing postponements in time schedules and
hence impacting the ability to maintain effective time management [164]. Lean Construction
identifies projects’ risks under the category of time wastes as discussed in further details in the
chapter on Lean Construction [127].
Scholars state that construction projects face many problems and risks during the construction
phases [263], [151], [23], [164], [287]. In some cases, the planning phase in the construction
project is not realistic; that is too ambitious to be executed. This results in many problems when
the execution phase starts while striving to develop the unrealistic set plan. As a result, conflicts
between the project’s stakeholders arise. This sheds light on how collaboration between the
owner and the main contractor acts as a prerequisite for efficient performance during the
different phases of the project [263], [151], [23], [164], [287]. Being regarded as a vital
concern, collaboration between the different project partners is one of the main issues
addressed in this study. The reason is that such complications are potential reasons for having
delays in schedules, which increases the total cost of projects and leads to the reduction of
activities’ quality. In addition, incorrect risks information and poor management are also
considered reasons behind cost overrun and schedule delays. Another factor that should be
taken into account is the sub-contractor selection criteria; reputation, quality of work and ability
to deliver on time should be studied early in the selection process to avoid potential risks.
Previous studies state that the increments in projects costs and delays in schedules are common
problems in construction projects around the world [263], [151], [176], [23], [164], [287]. As
aforementioned, these problems in most instances lead to conflicts between the different project
partners which may be resolved only by resorting to international arbitration and thus causing
obstacles. One of the most common causes of cost increase and highly important to consider is
safety risks; mainly referring to workers’ injuries. Unfortunately, this problem is highly

P a g e | 11
common especially in construction projects where workers are in many instances vulnerable to
serious injuries [23]. In addition to endangering lives, these injuries can increase the project’s
cost by as much as 15% as a result of funding the treatment of the injured [23].
For the above-mentioned reasons, the construction industry has a negative reputation when it
comes to project success. Nowadays, it is a target for engineers to finish the project without
delays and within budget. Some of the reasons that cause delays in the schedule is shortage of
information related to estimating the activity resources and duration, breakdown of machines,
inefficient selection of sub-contractors and design change by the owner. Despite the fact that
researchers focus on the improvement of this issue, the situation is still not good. Generally,
changes or variations caused by one or more stakeholders are defined as a deviation from the
scope or the schedule. Significant as it is to the success of project management, this study
delves into the issue of variations through focusing on tools that could provide solutions to
avoid its consequences. The PM approach lacks such tools, and hence this is further developed
and discussed in the chapter on Lean Construction. Design changes are identified as one of the
most significant risks factors, which might occur due to poor communication and collaboration
between stakeholders. It may lead to increases in cost, low quality of the work accomplished,
delays in the schedule besides decreasing the motivation of the workers. Accordingly, design
changes increase the percentage of the activities reworked. Figure 2-1 shows some reasons of
the design changes [115]. These reasons are based on internal criteria and external criteria.
Internal criteria related to the use of new technology in the project can be followed by changing
in the design for an activity. It is also related to the errors in design and changing in the project’s
concept. Examples of external criteria include a financial crisis in the project’s country, which
in turn affects the import of needed material. Also the laws and requirements in each country
are external criteria that can cause design changes [192], [79], [71], [255], [231], [179], [21],
[169], [4], [69], [184], [283], [292], [239], [220], [271], [18], [84], [200], [183], [237], [123],
[285], [247], [160], [276], [14], [291], [19], [124], [197], [150], [122], [295], [273], [195], [43],
[264], [126], [258], [11], [115], [185], [38], [114], [267], [189], [113], [22], [10], [58], [154],
[182], [289], [17], [266], [178], [90], [30], [74], [75], [174], [44], [83], [99], [270], [168], [60],
[177], [7], [229], [290].

P a g e | 12
Figure 2- 1: Design changes reasons [115]
The author of this thesis has a professional experience as a site engineer working with the main
contractor and hence personally supervised project activities such as reinforcement of steel,
dewatering system among others in addition to finishing activities. Having worked in the
construction stage of a residential building affiliated to an embassy in Egypt, the researcher has
personally witnessed the occurrence of design change in the project leading to erroneous
consequences. After pouring concrete for five columns on the ground floor of the building, the
owner discovered that the height of the ground floor was not as high as he desired, noting that
this step was implemented based on the set design. Consequently, the work for the project
stopped completely for about three months due to negotiation meetings between the owner, the
consultant and the main contractor attempting to introduce changes to the design to meet the
owner’s expectations. This project was scheduled to finish in three years but due to many delays
and other wastes duration was delayed for three extra years. The main contractor is an
international company that ranked in the 13th place as best in the world during this period.
2.3 The main knowledge areas
In the next sections, a detailed explanation of three knowledge areas is presented, (Project Time
Management, Project Risk Management and Project Stakeholder Management). The study is
specifically concerned with these three knowledge areas since it focuses on providing
recommendations for improving the total duration of construction projects. Managing and
anticipating risks besides efficient collaboration between stakeholders are variables that relate
to time management. Hence, eliminating waste (waste is the result of risks) from the project
and emphasizing of the stakeholders responsibility in this task are deemed core issues in this
study.

P a g e | 13
2.3.1 Project Time Management Concept
According to scholars [189] time schedule is considered the most important factor of the “iron
triangle” (time, cost and quality) for identifying successful projects. It is estimated to be used
as information by the owner for the future plans. Project Time Management is the knowledge
area, which is responsible to estimate, develop and control the schedule of the construction
projects. It has seven project management processes. According to scholars [233], [55], [189]
these processes are:
(1) Plan schedule management; includes the main information lines about the procedures,
executing, managing and controlling of the project schedule.
(2) Define activities; the process of determining and identifying all the activities of the
project.
(3) Sequence activities; determines the realistic relationships between the identified
activities.
(4) Estimate activity resources; identifies all the resources required to finish each activity.
These resources include human, equipment, materials and the suppliers of these
materials.
(5) Estimate activity durations; determines the duration to finish each activity. This
estimation depends on the previously estimated resources.
(6) Develop schedule; after determining the activities, their sequences, resources and
durations. Collect the information together and make the estimated schedule.
(7) Control schedule; uses to manage any changes during the project construction and
minimizes the occurrence of the risks and take corrective/preventive actions.
Project Time Management Tools
The tools demonstrated in this section are displayed according to the order of processes in
which each tool is used. Project Time Management starts by determining the lines and
procedures for the schedule related to a project plan schedule management. Planning of the
schedule includes the identification on how the engineers plan, and execute the duration of the
project. The schedule of the project updates frequently as the changes take place during the
execution of the project. The next process in time management is to determine what the
activities are in the required project. The main tool used for the activities is the Work
Breakdown Structure (WBS), which is one of the most important tools for Project Management
(PM) approach. This tool is used to decompose the project’s milestones to activities. The third

P a g e | 14
process determines the relationship between the defined activities and their sequences. This
process uses tool Precedence Diagramming Method (PDM). The aim of this tool is determining
the detailed relationship between the activities. Figure 2-2 shows the explanation of this tool
through demonstrating two main activities in the project (A & B), and four different potential
relations between the activities: [261], [300], [233], [91], [180], [52], [32], [55]:
(1) Finish to Start; the start of the next activity is after the finish of the first one.
(2) Start to Start; the start of the next activity is after the start of the first one.
(3) Finish to Finish; the finish of the next activity is after the finish of the first one.
(4) Start to Finish; the finish of the next activity is after the start of the first one.
Figure 2- 2: Precedence Diagramming Method (PDM) concept [233]
Which relation is necessary is decided by the project planners during the planning phase
depending on the nature of each activity and how it is related to or impact the other. For
example, if Activity A is putting the asphalt layer, and Activity B is painting road signs on the
ground then the relation clearly needs to be Finish to Finish. The reason for choosing this
relation is because both activities will be done in parallel and hence saving time.
After determining the relations between the different activities on the project, an estimation of
the resources needed for each activity is developed. Based on this process the duration of each
activity is also estimated. The stakeholders develop the estimation of each activity duration and
resources. The last step in the planning process group is developing and illustrating the
schedule of the entire project based on the information collected during the previous processes.
Figure 4 shows the tool that is used while developing the schedule of the project. This tool -
the Critical Path Method (CPM) – aims at setting expectations of the longest duration some
activities may require. Morgan R. Walker and James E. Kelley Jr. developed the Critical Path
Method (CPM) during the 1950s. According to scholars [180] this tool is considered the most
popular tool used to manage construction projects. As shown in Figure 4, every activity in the
project is shown on a square. This square includes data relates to “Early Start”, “Early Finish”,

P a g e | 15
“Late Start” and “Late Finish”. The early values are calculated in forward direction, while the
late values are calculated in backward direction. The critical activities, displayed on the critical
path, affect the final project duration in case of increase in their duration. This is demonstrated
through looking at the difference in the values of the early start and late start, and those of early
finish and late finish, which in both cases is zero. This difference between both cases (early
and late) is commonly referred to as float (check Figure 2-3). Hence the critical path activities
reflect the total duration of the project since they maintain a constant time plan as explained.
According to scholars [209], [129], [50], [110], [51] there are disadvantages that emerge when
applying the CPM:
(1) CPM focuses on the logical dependencies between the activities and neglects the
workflow of the project.
(2) CPM adds time buffers between the activities to cover any constraint that can occur;
however, this can increase the number of constraints that interrupt the workflow.
Buffers are not needed, and this leads to converting the buffers to wastes.
(3) CPM does not consider the project as workflow process.
(4) CPM has no constraints expectations.
In order to decrease the project’s duration, the Critical Path Method (CPM) advices to use crash
or fast tracking concepts [261], [55]. Crash is defined as increasing the number of skilled
labours on the activities that are on the critical path. However, crashing may be the reason of
increasing both the number of risks and the project’s cost. While fast tracking is starting the
following activity before finishing the previous one. Fast tracking increases the percentage of
risks and increases the wastes relate to rework. One of the tools applying fast tracking is Design
Build (DB) tool. This tool is most popularly used in construction projects in USA despite its
failure to maintain consistent collaboration between the projects’ stakeholders, which is core
to applying the fast tracking concept with lower risks [81]. This tool makes one contract for
both the design and construction stages. This tool is the modification of another traditional tool,
which is Design Bid Build (DBB). The traditional tool makes two contracts for the design and
construction stages. Design Build (DB) and Design Bid Build (DBB) are considered project
delivery systems, two tools are shown in Figure 2-4. Design Bid Build (DBB) is the traditional
tool, which depends on making two contracts with the designer and the contractor. While
Design Build (DB) depends on making one contract which includes the project’s design and

P a g e | 16
construction process, [180], [261], [300], [171], [52], [233], [260], [187], [163], [90], [60],
[61], [7], [8], [92], [55].
Figure 2- 3: Critical Path Method (CPM) application [233]
Figure 2- 4: Concepts of Design Build (DB) and Design Bid Build (DBB) [90]
In order to manage the risk of delays in the Critical Path activities, engineers use what is known
as buffering; or in other words giving a range of time to activities that might float more than
one day. This is achieved through either Critical Chain Method (CCM) tool or Critical Chain
Buffer management as shown Figure 2-5 [233]. The aim of the CCM tool is mainly to cover
for any delay that occurs in any of the Critical Path activities using buffering. Using buffer
activities on the non-critical activities. Figure 6 shows two types of buffers (1) Feeding Buffers,
which are between the activities that are not on the Critical Path, and (2) Project Buffer, which
are before finishing the project that is on the critical path. The Project Buffer is used to manage

P a g e | 17
any delay that takes place on the critical path during any period of the project. Finally, the last
process refers to controlling the schedule. This is used to manage, control and update the
schedule due to the occurrence of the changes during the construction project, [233], [91], [92].
Figure 2- 5: Example of the Critical Chain Method (CCM) application [233]
2.3.2 Project Risk Management Concept
Risk is defined as an action that leads to impacts on the project. Risk may have negative or
positive impacts (negative impacts can be the project’s wastes result to worker injuries or
destruction of any part of entire project) [263], [55], [125], [299], [113], [269], [301], [92],
[180], [74], [225], [178], [159], [9], [252], [80]. Construction industry is considered one of the
most dangerous industries. Some scholars [233], [271] stated that each risk may have more
than one impact on the project. Examples of potential risks include exceeding the project
budget, an accident in the project and change in design during the construction phase. As
previously mentioned, despite the Critical Path Method (CPM) being a common tool used in
construction projects, it fails to consider risks. Meanwhile, there is a Lean tool (Last Planner
System) - concerned with project time management like CPM - that takes risks and time wastes
into consideration as discussed later in the chapter on Lean Construction. Many scholars [273]
stated that the construction project’s risks cannot be eliminated,
Project Risk Management is the knowledge area responsible to determine how to react with the
risks during the construction projects. This knowledge area is critical during managing any

P a g e | 18
construction project. According to literature [161], [159], [125], [299], [220], [269], [301],
[233], [92], [273], [113], [80], [267], [177], [295], [279], [55], [263] the six project
management processes are:
(1) Plan risk management; determines the procedures of the risks in the construction
project.
(2) Identify risks; lists the existing risks and know their effect on the project, because these
risks may have a negative or positive affection.
(3) Perform qualitative risk analysis; determines the priorities of the impact of each
identified risk and its occurrence percentages estimates if the risk has a positive or a
negative effect on the project.
(4) Perform quantitative risk analysis; identifies the numerical effects of each risk on the
project.
(5) Plan risk responses; determines the actions that take with the risks, by focusing on the
highest priority risks.
(6) Control risks; is used to update the cost and schedule estimation after the occurrence of
the risks.
Project Risk Management Tools
According to [233] Project Risk Management starts by planning and managing the risks’
strategies and procedures during a project. The risks can be seen as both threats and
opportunities, (risks perceived as threats have a negative effect on the project while those seen
as opportunities have a positive effect on it). The next step is identifying the risks and setting
expectations of their potential occurrence during the project construction. Stakeholders are the
ones in charge of developing risk identification. This step is followed by the following
processes: (1) developing the qualitative and (2) quantitative data for the risk analysis.
Qualitative risk analysis is used to determine the priority of each identified risk. This is carried
out by determining the probability and impact of each risk. During the project meetings, the
probability of occurrence of each risk is determined and the impact of each risk in the project
is listed. The left column in Table 2-1 - Matrix of Probability and Impact of the risks - is the
probability percentages, and the row below addresses the impact percentages. This table
includes three risks categories, the dark blue, medium blue and the light blue are used for the
highest, the smallest and the category with moderate risk categories. The highest risks category
has the highest values of both the probability and impact. The next step is developing the
quantitative risk analysis. This process in some instances is not developed as a result of the

P a g e | 19
ignorance of the project’s expert with the necessary data and information. In this case – if the
quantitative data for the risks is not developed - the reliability of the project’s results decreases.
Usually, this process is implemented for risks that are deemed significant, that is, have a strong
(negative) impact on the project. The main purpose of performing quantitative risk analysis is
decreasing uncertainty during the different phases of a construction project. The development
of this type of analysis occurs through determining the most likely - high and low - values of
the project’s estimates of cost and time [233], [271], [267], [125], [113], [161], [263], [225],
[80].
Table 2- 1: Matrix of Probability and Impact of the risks [233]
The determination of the important risks respones is a very critical process in planning risk
management, because it includes how to manage these risks during the construction project life
cycle. The last process is the controlling of the risks, which is used to manage and identify any
risk that may take place during the construction of the project. This improves the risk
efficiency. The four strategies for negative and positive risks are, as follows, [233], [159], [80],
[271], [287], [161], [267]:
(1) Avoid; this strategy proposes to eliminate the risk from the project. Unfortunately, this
elimination may be by changing the project definition, extending the schedule, or
increasing the project cost and the main problem is that rarely can be done. For example,
during the execution of the project, the prices of the necessary material resources for a
specific activity may increase and hence increase the total cost of this activity. In this
case, the planned budget fails to meet the real conditions.
(2) Transfer; is the strategy used to transfer the risk to another person or company. This
strategy does not remove the risk from the project. Collaboration can help in transfering
the risk from one project member to another.
(3) Mitigate; is the reducing the probability of the risk occurrence or reducing its impact
on the project. For example, use the skilled labours in a high sensitive project (e.g.
Nuclear projects).

P a g e | 20
(4) Accept; is the acceptance of the risk because the previous three strategies are failed to
solve it. For example, accept to construct a project in earthquake areas.
According to the four strategies for the positive risks are:
(1) Exploit; takes benefits from the positive risks, such as using a new technology in an
activity to reduce its duration.
(2) Enhance; is the increasing of the probability or impact of the project, such as using
more resources to finish an activity faster.
(3) Share; is used to make more parties taking the advantage of the risks. For example,
making joint venture contracts where risks could be shared between contractors.
(4) Accept; refers to agreeing on taking advantage of the risk since it benefits the project
execution. For example, if the prices of the necessary materials decreased during the
project it is in the benefit of all to take advantage of the situation.
2.3.3 Project Stakeholder Management Concept
A stakeholder can be defined as any entity (company or individual person) who has an affection
or can have affection on the result of a project. Examples of stakeholders are: owner, consultant,
general and sub-contractors, material suppliers, labors, etc. Project Stakeholder Management
is the knowledge area responsible to identify, manage and control the stakeholders in the
construction projects. According to scholars [94], [233], [246], [55], [43], [193], [270], [194]
the following four project management processes are the core of this knowledge area:
(1) Identify stakeholders; determining who the stakeholders of the project are. Stakeholders
can have direct or indirect effect on the project.
(2) Plan stakeholder management; determining how engage the stakeholders are during the
duration of the project.
(3) Manage stakeholder engagement; working with the stakeholders on determining how
to deliver their needs to the project. The project manager tries to boost the stakeholders’
engagement and support to the project.
(4) Control stakeholder engagement; controls the relationships with the stakeholders in the
project.
Project Stakeholder Management Tools
The first process in the stakeholder planning is to determine who the stakeholders are in the
entire project. This step is the first to be developed in the Project Initiation phase; it is vital to

P a g e | 21
determine all the project’s stakeholders before starting the planning process group. The
following step in this process is determining the power and interest of each stakeholder by
using the stakeholder analysis, shown in Figure 2-6. In this figure, there is a example of some
stakeholders, which are A,B,C,…J,K. These stakeholders have different powers and interest
on the project. Stakeholder A has high power and interest on the project, so it is important to
be managed carefully. In the next step – managing the stakeholders’ engagement - the
stakeholder engagement in the project is determined by using the analytical technique.
According to scholars [233], [267], [193], [94], [194] the engagement is based on five
categories; they are:
(1) Unaware; has no information about the project. For example, the police officer that has
the project is in his region responsibility area.
(2) Resistant; is aware of the project and against its construction. For example, the
neighbours of project that is making noise through the nights to them.
(3) Neutral; is aware of the project but he is not supportive or resistant to it. For example,
the part time skilled labour.
(4) Supportive; is aware of the project and support it. For example, the junior engineer
working in the project.
(5) Leading; is aware of the project and on it. This stakeholder is engaging in finalizing the
project. For example is the project construction manager.
Figure 2- 6: Application of power and interest diagram for stakeholders [233]
In order to better manage the stakeholders’ engagement, a project manager should work with
them to determine the best way to deliver their requirements and needs for the entire project.
This process is essential to increase the support of the stakeholders if they are resistant or

P a g e | 22
neutral to the project. Finally, the last process in this knowledge area, stakeholder planning, is
controlling the relationships with the stakeholders. The target of this step is to keep track of the
performance of stakeholders’ involvement in the project through consistent observation of their
relationship to the project [233], [194].
Despite the issue of stakeholders’ involvement being emphasized under the PM approach as
demonstrated, there still is problematic gap; lack of stakeholders’ engagement in the early
stages of the project. This matter is addressed under Lean Construction through Integrated
Project Delivery (IPD) system, as further explained in the specified chapter.
2.4 Project Management approach studies
Tables 2-2 to 2-14 summarizes the studies related to Project Management (PM) approach
according to the country where each study was applied. The main motives of each study are
determined. The studied project sector and the methodology used are listed. Finally, the results
of the study are presented.
Table 2- 2: Information of Project Management (PM) approach studies

P a g e | 23
Table 2- 3: Information of Project Management (PM) approach studies
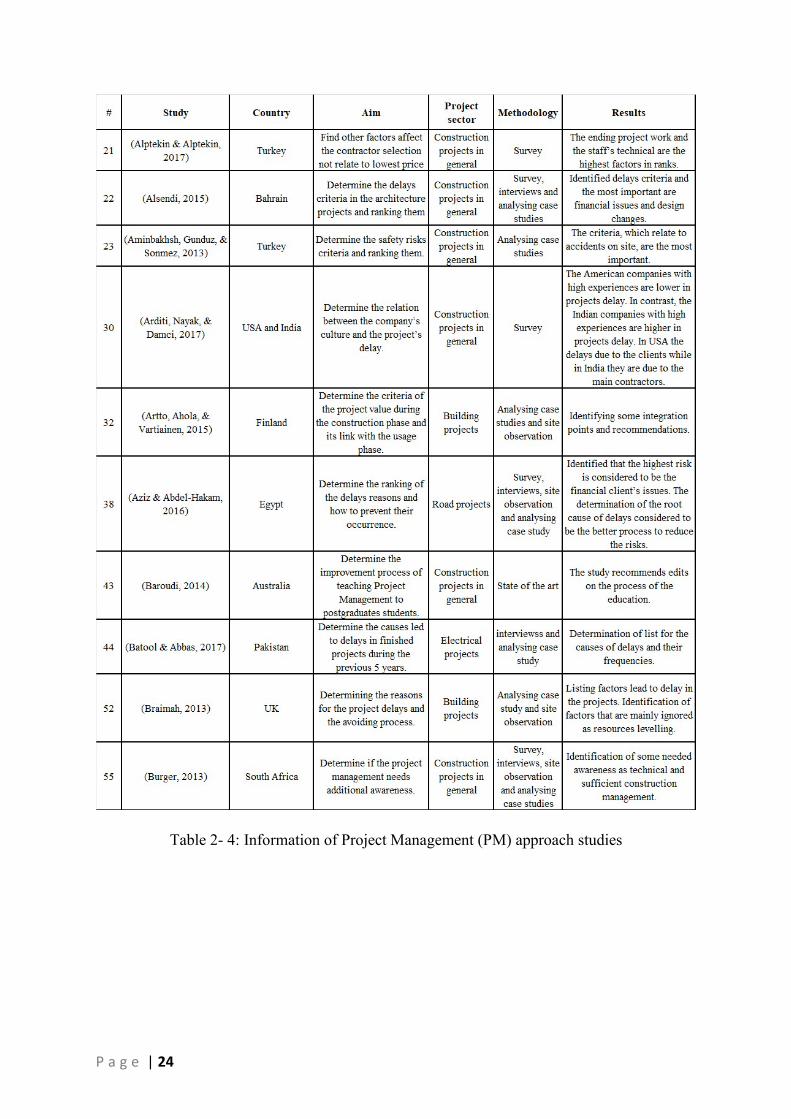
P a g e | 24
Table 2- 4: Information of Project Management (PM) approach studies

P a g e | 25
Table 2- 5: Information of Project Management (PM) approach studies

P a g e | 26
Table 2- 6: Information of Project Management (PM) approach studies

P a g e | 27

P a g e | 28
Table 2- 7: Information of Project Management (PM) approach studies
Table 2- 8: Information of Project Management (PM) approach studies

P a g e | 29
Table 2- 9: Information of Project Management (PM) approach studies

P a g e | 30
Table 2- 10: Information of Project Management (PM) approach studies

P a g e | 31
Table 2- 11: Information of Project Management (PM) approach studies

P a g e | 32
Table 2- 12: Information of Project Management (PM) approach studies

P a g e | 33
Table 2- 13: Information of Project Management (PM) approach studies

P a g e | 34
Table 2- 14: Information of Project Management (PM) approach studies

P a g e | 35
2.4.1 Studies analysis
Tables 2-15 to 2-17 and Figures 2-7 to 2-9 show the analysis of the studies reviewed; those that
apply the Project Management (PM) approach on different project sectors. Table 2-15 and
Figure 2-7 show the analysis of these studies based on the country where each study was
applied. The majority of the studies analysed were applied in different countries (dispersed
rather than concentrated in one specific country) leaving the biggest percentage (16%) under
the category “Other”. The highest concentration in one country was found to be in Malaysia;
where 11% of the studies applying the Project Management (PM) approach could be spotted.
Table 2-16 and Figure 2-8 show the analysis of the studies reviewed based on the different
project sectors. The majority of studies (51.6%) address the application of the traditional
approach in general without mentioning a specific project sector. More than fifth (22.7%) of
the studies analysed focus on the building projects sector. The application of PM in both road
and infrastructure projects was found in 11% of the studies reviewed.
Table 2-17 and Figure 2-9 show the analysis of the studies reviewed based on the methodology
of each study. The biggest majority (44.7%) of the studies reviewed use survey questionnaire.
This is followed by using projects’ data analysis (18.1%). It is important to mention that the
summations in some tables exceed the number of the studies because some studies used more
than one methodology or were applied in more than one country. For example, one study [295]
was applied in the UK, Netherlands, USA, Germany, China and Nigeria.
Table 2- 15: Country analysis used Project Management (PM) approach

P a g e | 36

P a g e | 37
Figure 2- 7: Country analysis used Project Management (PM) approach
Table 2- 16: Project sector analysis used Project Management (PM) approach
Figure 2- 8: Project sector analysis used Project Management (PM) approach
Table 2- 17: Methodology analysis used Project Management (PM) approach

P a g e | 38
Figure 2- 9: Methodology analysis used Project Management (PM) approach
2.5 Application of Project Management (PM) approach on road and infrastructure
projects
Tables 2-18 and 2-19 is summarized the studies relate to Project Management (PM) approach
on road and infrastructure projects. This summary is based on the country of each study where
it is applied. The main reasons of the study are determined. The studied project sector, which
project type in the infrastructure sectors, and the methodology used are listed. Finally, the
results of the study are presented.
Table 2- 18: Information of Project Management (PM) approach on road and infrastructure projects

P a g e | 39

P a g e | 40
Table 2- 19: Information of Project Management (PM) approach on road and infrastructure projects
2.5.1 Studies analysis
Tables 2-20 to 2-22 and Figures 2-10 to 2-12 show the analysis of the literature studies applied
by Project Management (PM) approach on road and infrastructure projects. Table 2-20 and
Figure 2-10 are shown the analysis of these studies based on the country applied these studies.
The majority of this list relate to Malaysia, UK and India they are by 14.3%. Table 2-21 and
Figure 2-11 are shown the analysis of the different project sectors. The majority is the
application of the traditional approach in road projects by 50%. The application of road projects
is followed by the application of the traditional approach in the infrastructure sector in general
by 42.9%. Table 2-22 and Figure 2-12 are shown the application of the methodology in the

P a g e | 41
studies. The majority of them is the application of questionnaire survey by 33.3%. This is
followed by the application of both site observation and conducting interviews by 20.8% per
each.
Table 2- 20: Country analysis used Project Management approach on road and infrastructure projects
Figure 2- 10: Country analysis used Project Management approach on road and infrastructure
projects
Table 2- 21: Project sector used Project Management approach on road and infrastructure projects

P a g e | 42
Figure 2- 11: Project sector used Project Management approach on road and infrastructure
projects
Table 2- 22: Methodology used Project Management approach on road and infrastructure projects

P a g e | 43
Figure 2- 12: Methodology used Project Management approach on road and infrastructure
projects
2.6 Conclusion
Project Management (PM) approach focuses on analysing the risks that can take place in the
construction projects. An example of these risks is the delay in the project duration. These risks
are not the root of the problem, while the main issue is the huge number of different time
wastes, eventually leading to the risks. The word waste is used in this study mainly to refer to
delays in activities as a result of the time wasted upon the occurrence of problems which can
be avoided with efficient management. Hence, eliminating these wastes will consequently
eliminate the risks. The Project Management approach does provide the tools to analyse
potential risks like project delay, however does not address the root causes of such risks; the
time wastes. Although, scholars [233], [271] emphasize that a project will be successful by
managing the projects' risks, still the quantitative risk analysis is rarely developed in many
construction projects. The reason behind this is that in order to conduct such analysis,
experience and data from previous projects is necessary, which is unfortunately not available
in many instances. Project Management (PM) approach focuses only on the highest risk
probability and impact, while the lower risks are neglected and ignored. These risks are ranked
based on the project stakeholders' knowledge, which can be inaccurate in some instances.
Additionally, the risks ranked lower in importance and potential occurrence can have higher
impacts on the projects when they occur. In that sense, three main arguments all related to risk
have been noted in this chapter; how the PM approaches risk analysis, time management and
stakeholders’ collaboration.

P a g e | 44
The first and most importance argument for the purpose of this study, is related to the PM not
addressing the root causes of risks in real life projects. Scholars [263], [151], [23], [164], [287]
agree that, thanks to the fact that it is nearly impossible to find two similar construction
projects, the construction industry has a higher number of risks than other industries. In
accordance, the PMBOK GUIDE explains that every project – in any industry - has different
nature and characteristics; for example, a music concert is defined as a project, and then if the
music concert failed for some reason, it is superficially blamed on the high number of risks.
However, it is important to question: is this really the case? That is, do projects fail because of
the risks posed? What about delving deeper into the roots of the problem, or in other words,
what causes such risks? Unfortunately, the PM does not address the roots of the problem; the
wastes that potentially causes the risks. In our case, this refers to the time wastes potentially
causing delays in the projects. However, it is important to mention that some studies applying
the PM approach investigate the root cause of delays [4], [11], [17], [18], [19], [22], [30], [38],
[44]. Still, the industry suffers the application of this concept in real life projects. Throughout
the chapter, it has been highlighted that risk analysis, historically, has not been properly
implemented in the construction industry. This calls for innovative tools to go beyond the
traditional risk analysis that anticipates its occurrence and impact without addressing its causes.
Lean Construction comes as a provider of pioneering solutions in that sense; through
developing tools that directly address the root causes of risks.
The second argument is concerned with the time management tool the Project Management
(PM) approach; Critical Path Method (CPM). This tool helps in managing risks through using
time buffers for the different activities on the project as explained before. It is essential to
highlight that in the planning phase risks are a possibility that might or might not occur. This
means that introducing buffers to the different activities result in time wastes in case that the
anticipated risks did not occur.
The third argument is concerned with lack of stakeholders collaboration under the PM
approach. As a result of this lack of collaboration, risk transfer is resorted to; transferring the
responsibility of risk occurrence from one stakeholder to another. One of PM’s most popular
tools in this area is Design Bid Build through which the owner makes two different contracts
for the contractor and designer. In a modified version of this tool – known as Design Build –
the owner can make one contract for both the designer and contractor attempting to transfer
risks responsibility to the contracted entity. This means that by making one contract for the
contractor to design and construct the project, any failure in the project will be solely blamed

P a g e | 45
on the contractor. But does this solve the problem? Does it achieve the aspired results at the
end of the project? Transferring risks does not reflect neither successful project management
nor does it result in successful projects. It is far more efficient to focus on the end result of
having a successful project than to direct the energy towards risks transfer. Collaboration
between project's stakeholders has essential goals in that sense, which do not include transfer
of risks.
Considering the presented details about the PM approach, the next chapter focuses on Lean
Construction while presenting tools that address the aforementioned problems in a more
efficient manner.

P a g e | 46
CHAPTER 3 LEAN CONSTRUCTION (LC)
3.1 Introduction
This chapter starts by explaining the history of the Lean concept and the reasons behind the
invention of this relatively recent approach. The main principles of this approach are then
demonstrated. After defining and generally overviewing LC, a comparison between the new
(LC) and traditional approaches (PM) is presented. The chapter then delves into how LC
defines and approaches the projects activities followed by presenting the different Lean
Construction tools. Detailed explanation of the two most relevant tools to the main purpose
of this study is demonstrated after; Last Planner System and Integrated Project Delivery
System. The benefits and barriers of Lean Construction are explained in the following section
followed by a summary of the Lean Construction application on different project sectors and
its analysis. Lastly, an overview and analysis of the Lean Construction studies specifically
focused on road and infrastructure projects are presented.
3.2 Lean concept history
Toyota Production System (TPS) invented Lean concept in Japan during 1950s after the Second
World War to apply to the production industry at that time [230], [221], [211]. TPS was facing
some challenges such as, the need to make variety of cars models while they had a limited
production space so, they needed to decrease the production time and the time between cars
with the least amount of production items. TPS invented Lean concept with two main golden
rules: minimization in total cost and regarding workers as humans not machines. The creation
of Lean concept became a perfect technique to be used in Japan because of scarcity of human
resources and the strong competition in the cars market, [216], [139], [236], [245], [25], [210],
[35], [206], [15], [16], [298], [221], [51], [268], [20], [40], [230], [39], [117], [262], [86], [211],
[172], [152].
Construction projects are considered a temporary stage in the production systems. However,
construction industry suffers from high waste percentage when compared to manufacture
industry as shown in Figure 3-1. It can be seen there that the waste – Non-Value Added
activities - in construction industry are more than half the project’s activities (53%). While in
manufacture industry the added value activities are almost 90% of the total activities. It is
essential to note that the definition of waste as addressed in this study is explained in details in
the next section (Lean Construction activities) and that one of the main aims of Lean

P a g e | 47
Construction is to eliminate such waste. Lean concept can be categorized under the following
fields; these are Lean Production (LP), Lean services and Lean Construction (LC), which
includes building and transportation industries as shown in Figure 3-2. The Lean concept is
defined as the elimination and/or reduction of time waste, delivering the material on the needed
time giving the customer the best product value. [103], [278], [139], [142], [129], [277], [236],
[111], [121], [173] and [147].
Figure 3- 1: Comparison between Manufacture and Construction industries regards
production and waste percentage [40]
Figure 3- 2: Lean concept structure [147]
3.3 Lean Construction activities
Time waste in construction industry is every Non-Value Adding (NVA) activity. Construction
projects suffer from many kind of wastes; some of these waste are unnecessary transportation,
inefficiency in using human resources and the inventories of the materials. According to [1],
Non-Value Adding (NVA) activities (which are wastes) could occupy 66% of the labours
performance. Eliminating these wastes impacts the project’s cost and duration positively.
According to scholars [272], [45], [245], [1], [65], [262], [104] and [223] considering the
construction activities as “Flow processes” rather than “Conversion process”, could improve
the wastes elimination process.

P a g e | 48
According to [40], [64], [100], [272] waste can be determined under four following categories:
(1) Defects and Controls.
(2) Utilization of resources; these two categories (1) Defects and Controls and (2)
Utilization of resources; represent 10% of the total production cost [100].
(3) Health and safety; this category represents 12% of total production cost.
(4) System and Structures; this category represents 5% of total production cost. While
it was determined that in general, wastes represent between 30% and 55% of the
total construction project’s costs [100].
In another categorization [105], wastes were identified to be under three categories:
(1) Muda; which means Non-Value Adding activities.
(2) Muri; which means overwhelm. This category of wastes refers to overloading the
workers or machines, which can lead to machine’s breakdown or bad quality in an
activity.
(3) Mura; which means variability and refers to the occurrence of variations in the
activities.
Toyota Production System (TPS) listed seven general wastes and added the eighth waste later,
as shown in Table 3-1. These wastes are: (1) Overproduction. (2) Waiting. (3) Transportation.
(4) Rework. (5) Inventory. (6) Unnecessary motion. (7) Processing and (8) Unused talented
workers. The explanation of these wastes is summarized in the table below after reviewing how
different scholars demonstrate the idea, [39], [72], [272], [248], [57], [15], [250], [59], [139],
[66], [25], [16], [245], [211], [121], [20], [51], [70], [40], [221], [201], [170], [190], [242],
[56], [152], [240], [249], [265], [119].
Construction projects activities were identified to be three main types, [33], [147], [87] and
[112]:
(1) Essential Non-Value Adding activities (ENVA); these activities do not add value to the
project and cannot be eliminated. An example is machines maintenance; despite the fact
that this activity does not add direct value to the project, it is still essential to maintain the
work flow and avoid potential delays. Accordingly, this type of activities need to be done
efficiently not to affect productivity. Back to the example of the machines maintenance,
this means carry out maintenance when the machine is not needed on site.

P a g e | 49
(2) Non-Value Adding activities (NVA); these activities also do not add value to the project,
but they should be eliminated as they are considered to be wastes. For example, this applies
in a situation such as having skilled labour waiting for the shop-drawing being modified
after introducing design changes. This results in time and cost waste and can be eliminated
by thorough planning and efficient management.
(3) Value Adding activities (VA); these activities are the only activities that add value to the
project. This mainly refers to all the activities on the project necessary to reach the aspired
final product. In road projects for instance this applies to sub-base layer excavation, filling
with aggregate, putting asphalt layer, etc.
Table 3- 1: Lean concept wastes [245]
3.4 Lean Construction principles
According to scholars [275], [131], [245], [238], [104] the main rules of the Lean concept are:
(1) Continuous improvement and (2) Respect for the workers. Lean concept applies the
continuous improvement by involving all the project members during the early stage of the
project. This continuous improvement is based on five principles (explained below) and the
challenge is to apply these principles correctly to achieve benefits in the construction project

P a g e | 50
activities'. It is regarded as a challenge because every construction project is unique and
different from other project.
The five principles are identified with the suggested actions for each principle as shown in
Figure 3-3. These principles have been repeatedly demonstrated and explained by scholars
investigating Lean Construction as follows [238], [190], [25], [248], [6], [20], [206], [142],
[210], [181], [139], [49], [221], [173], [211], [172], [236], [294], [51], [230], [46], [112], [165],
[191], [152], [70], [105], [166], [147], [5], [34], [72], [175], [223], [213], [240], [249], [265]:
(1) Value; refers to determining the need of the project. This principle should be identified
correctly in the early stage of the project. It considers an important principle because it is
the starting point.
(2) Value Stream; refers to determining the current process of the project. This principle is the
benchmark to identify the wastes and determine the ways to eliminate them.
(3) Flow; is the principle through which the wastes are eliminated. The aim of this principle is
to make sure that the information flows efficiently (in the design stage). During the
application of this principle, it is essential for those in charge to be involved to ease the
elimination of the wastes.
(4) Pull; this principle aims to deliver the material to the construction project on time [34],
[51], [70], [112], [105]. The importance of this principle lies in its tool (Just In Time JIT
which explained later), which minimizes the inventories.
(5) Perfection/Continuous improvement; is the continuous improvement of the previous four
principles during the construction stage of the project.
Figure 3- 3: Lean concept principles [230]
According to scholars [39], [268], [274], [282], [6], [211], [230], [181], [298], [117], [221],
[13], [121], [166], [5] Lean concept is based on the following twelve laws:

P a g e | 51
(1) Reducing the rework activities.
(2) Eliminating of Non-Value Adding (NVA) activities.
(3) Reducing the waiting times.
(4) Reducing the wastes resulting from materials and energy.
(5) Clearly identifying the customer’s value and the process through which this value will be
delivered.
(6) Working on the Value Adding (VA) activities smoothly without interruptions.
(7) Applying the Pull concept.
(8) Applying the continuous improvement concept.
(9) Reducing variability; unplanned changes that occur during the execution of the project such
as design changes.
(10) Increasing flexibility; smoothly moving from one activity to the following one in a steady
flow without delays.
(11) Working in teams.
(12) Improvement in transparency.
The variability is a main problem in the construction projects; mainly because variability
decreases the productivity and the motivation of the labours consequently. The variability in
construction industry differs from that in the manufacture industry. Lean Construction focuses
on preventing the occurrence of variability during the project by identifying the wastes and
finding ways to eliminate them, which improves the workflow reliability. And hence, this
fosters stakeholders’ collaborations by boosting their trust in the attainability of the project’s
results. Two factors that affect each other are the workflow and labour efficiency in
accomplishing activities. Sticking to a well-defined work plan is the key to more efficient
labour work, that is, reducing the variability in the activities labour is required to accomplish
leads to better results. This in turn reflects on the workflow in the same manner. Decreasing
the variability in these two factors reflects a more reliable plan targeting to finish the
construction project on time. [281], [262], [253].
Lean concept can be considered as a group of tools used to reduce and eliminate waste and to
increase the production efficiency. By applying Lean tools, the productivity increases, while
decreasing defects and inventories. Its principles help to reduce the defects by choosing the
best general contractor with the most adequate resources and good experience in managing
projects. The foundation of Lean concept is that every task should add value to the project. The

P a g e | 52
logic behind Lean concept is to give the client the best product they need; in this case the final
results of the project as expected.
Lean concept is not just a group of tools and techniques, it is a different "way of thinking",
[104]. All project members should understand this new approach to reach improvement in the
construction project. The fifth principle of Lean concept (which is perfection/continuous
improvement) depends on the concept Plan, Do, Check and Act (PDCA), is based on the
following steps [72], [296], [104], [298] and [140]:
(1) Plan; identification of the current situation or problem and the planning is done to solve
this situation.
(2) Do; the planed situation took place.
(3) Check; determine if this planned situation achieved the expected results.
(4) Act; determine the results and make recommendations for the next PDCA.
Table 3-2 shows some benefits that can be reached after the correct application of the three
perspectives. The Project Management (PM) approach mainly focuses on one perspective, the
Transformation, while Lean concept uses the three perspectives. The most important benefit of
Transformation is the right breakdown of the activities. While the most important benefit for
Flow is the decrease of the variability. The last perspective gives the customer what he needs
by reaching his requirements, [223].
Table 3- 2: Transformation, Flow and Value (TFV) benefits [223]
Lean Construction (LC) uses planning to determine the factors and processes necessary to
finalize the project, in addition to applying consistent continuous evaluation throughout the
implementation process to finalize the project tasks according to the expected estimations
[145]. Lean concept merges the three following perspectives; Transformation, Flow and Value,
(TFV). Table 3-3 shows the concepts, main principles and the contributions of each

P a g e | 53
perspective. According to scholars [131], [59], [242], [156], [103], [66], [162], [105], [40],
[147], [222], [215] and [257] the perspectives can be explained as follows;
(1) Transformation: refers to converting the project concept to real building through different
activities, which meets the customer’s needs. Its main goal is to do the work with more
efficiency.
(2) Flow: refers to collecting all the needed items to finish an activity while eliminating the
Non-Value Adding (NVA) activities. For example, to make the design process, gathering
all data and information is needed to finish this step. Figure 3-4 shows the seven flows
needed to finalize a construction activity. To finish an activity, this requires using the
approved design based on the customer needs with the qualified and professional workers,
who use the required equipment and materials in the construction project site. This is also
required the qualified workers and the working area for this activity. The other activities,
predecessors and successors, are important to determine their relations with this activity.
Lastly, the external factors are also needed to be observed because they can affect,
positively or negatively, the required activity.
(3) Value: determining and identifying the Value Adding activities that will take place to
finalize the activity with the best possible value.
Table 3- 3: Transformation, Flow and Value (TFV) concept, principle and contribution [40]
Figure 3- 4: The seven flows needed for a construction activity [131]

P a g e | 54
Glenn Ballard in the year 2000 was the first to introduce the concept of Lean Project Delivery
System (LPDS) for the project management [244]. Lean Project Delivery System (LPDS) is
the combination of Lean principles and Lean tools. This system is used to increase the labour
productivity, elimination of waste and improvement of the work efficiency.
Lean Project Delivery System (LPDS) is based on two questions: first what needs to be done
and second who will be responsible for every task in the project. The second question – related
to assigning responsibilities for every task - is not applied in the traditional project management
approach. According to scholars [244], [230], [59], [156], [39], [15], [16], [117], [136], [152],
[223], [265] the main characteristics of Lean Project Delivery System (LPDS) are:
(1) The managing and structuring for the project based on a value generating process.
(2) The stakeholders are participated in the early project stage.
(3) Pull technique is used with stakeholders.
The five phases can be explained as follows [244], [230], [59], [156], [39], [15], [16], [117],
[136], [152], [223], [265]:
(1) Project definition, to determine the need and the characteristics of the project.
(2) Lean design; include the detailed information about the design of the project based on its
concept.
(3) Lean supply; the information about fabrication components of materials will be delivered
based on the previous designs.
(4) Lean assembly; in this phase the detailed information about construction activities will be
determined.
(5) Lean use; includes the information about maintenance, operation and decommissioning.
During every phase, the work structuring and production control is applied. Work
structuring allows engineers to breakdown the activities into smaller sub-activities, while
production control allows them to control the plans in case any uncertainties occur.
Some scholars [223], [48], [244], [54], [12], [15] present Lean Project Delivery System (LPDS)
on 13 modules and 5 phases (which are Project definition, Lean design, Lean supply, Lean
assembly and Lean use) as shown in Figure 3-5. These modules start by stating the purpose or
the concept of the project. This follows by the design’s steps, which are the criteria of the
design and its idea until conducting the final project design. These modules fall under two
phases: project definition and lean design. Lean supply interconnects with lean design in the

P a g e | 55
product design, and then there is the detailed engineering. Lean supply interconnects with lean
assembly through the fabrication module. The next module is the installation. Lean use
interconnects with lean assembly with commissioning. The maintenance and decommissioning
are the last modules on lean use. Finally, LPDS ends with Production control and work
structure.
Figure 3- 5: Lean Project Delivery System (LPDS) [223]
3.5 Comparison between Lean Construction and Project Management approach
The differences between Lean Construction (LC) and Project Management (PM) approach can
be explained through the following points according to scholars [265], [191] and [152]:
(1) LC use the concept of pull (e.g., delivering the material on time), while PM use the concept
of push (e.g., delivering the material based on the expected duration).
(2) LC is used to reduce the projects’ variations during the early stages, while in PM variations
are not mentioned.
(3) LC is used to expect the wastes before their occurrence, while in PM the actions are taken
after the occurrence of problems.
(4) The main aim of LC is to improve the value of the whole process, while PM works on each
activity individually.
Table 3-4 shows a general comparison between Project Management (PM) approach and Lean
Construction (LC). The main difference between the two concepts is that Lean Construction

P a g e | 56
(LC) uses the three perspectives of Transformation, Flow and Value (TFV). Another important
difference is that the stakeholders are not involved in the early project stage in the traditional
approach unlike Lean Construction. In order to apply Lean Project Delivery System (LPDS) in
construction projects, there are some requirements that need to be met first. According to [223],
[131] and [298] these requirements are:
(1) The project engineers should manage and execute, as a team, the Value Adding activities
according to the quality and owner needs.
(2) Involve the stakeholders in the early stage of the project.
(3) Understand the activities to be executed.
(4) Focusing on making the workflow reliable instead of focusing on increasing the
productivity.
(5) Instead of focusing on the flow of materials and information, apply the pull concept.
(6) Maintain the feedback between stages to have organizational learning.
Table 3- 4: Comparison between Project Management (PM) approach and Lean Construction (LC) [223]
3.6 Lean Construction tools
Lean Production used some tools to achieve improvement in work; some of these tools are
suitable to be applied to the construction industry, while others are not. Lean Construction tools
improve in the project duration, productivity and total cost. The successful application of Lean
concept in construction industry cannot take place without applying and adapting these tools
together [1], [3], [24], [29], [39], [47], [131].
Some of the main Lean Construction tools are:
(1) 5S and 6S; is a housekeeping tool, which refers to five Japanese words Seiri (means
Sort), Seiso (means Straighten), Seiton (means Shine), Seiketsu (means Standardize)

P a g e | 57
and Shitsuke (means Sustain) and according to scholars [162] 5S is newly added with
the sixth “S”, which refers to Safety. This concept is applied widely in construction
projects. To have a correct application of 5S/6S, is required support from the top
management. The application of 5S/6S increase the quality, productivity and the works
finish within the expected date. This tool reduces the wastes in time [15], [25], [24],
[27], [29], [39], [40], [47], [51], [57], [59], [66], [73], [86], [88], [104], [147], [152],
[162], [173], [191], [206], [221], [223], [230], [240], [245], [250], [256], [265], [289],
[293], [297].
(2) Six Sigma; is used to improve the quality by removing the defects and reducing the
variability. The merging between Lean principle and this tool leads to waste
elimination [15], [29], [59], [68], [73], [78], [88], [149], [173], [196], [206], [230],
[240], [245], [250].
(3) Kaizen; is a Japanese word referring to the tool used to improve quality by removing
waste from the second principle, which is value stream. This tool is used to improve
the project activities' efficiency with more safety and in less time. It includes three
phases: (a) Phases 1; Lean training, illustrating a work map, identifying the areas which
need improvements and determining the best solution to be applied. (b) Phase 2;
applying the improvements in the required areas and documenting the performance of
these improvements after application. (c) Phase 3; presenting the results. This tool
maintains the application of the Lean principle Continuous Improvement [27], [51],
[59], [73], [78], [147], [149], [172], [202], [206], [221], [223], [230], [240], [245],
[250], [256], [298].
(4) Last Planner System (LPS); is used to improve the workflow for the activities and
reduce the wastes. This tools consists of five main steps, which are Master Plan, Phase
Planning, Look-Ahead Planning, Make Ready Process and Weekly Work Planning [3],
[25], [24], [27], [29], [39], [40], [47], [51], [59], [65], [66], [73], [86], [88], [127],
[131], [147], [152], [162], [172], [173], [191], [196], [199], [206], [211], [221], [223],
[230], [240], [242], [259], [265], [268], [280], [296], [297], [298].
(5) Poka-Yoke; is a Japanese word, which means Error Proofing, referring to the tool used
to detect the errors and prevent their occurrence [25], [27], [40], [51], [66], [73], [173],
[206], [221], [240], [250], [256]. Different applications for this tool include checking
material quality such as that of the asphalt making sure that the main component exists
with the necessary percentage. Not less, nor more.

P a g e | 58
(6) First Run Studies; tool which is used to redesign the critical activities with the attempt
to discover different manners in which the activity could be accomplished. This tool is
applied two weeks before the execution week [24], [27], [51], [65], [66], [73], [86],
[88], [152], [173], [191], [206], [221], [240],
(7) Total Productive Maintenance (TPM); used to carry out “preventive” maintenance to
the machines in order to improve their efficiency and put them to use according to their
maximum potential. This occurs by enabling operators to sustain their machines [15],
[57], [73], [78], [104], [173], [206], [240], [256], [298].
(8) Integrated Project Delivery (IPD) system; a new delivery system mainly concerned
with involving the project’s stakeholders in the early project stage, which improves
communication between the project’s members [24], [66], [86], [131], [152], [191],
[206], [211], [221], [223], [230], [265], .
(9) Visual Management (VM); to increase efficiency by using visual tools; use of visual
control boards in the construction projects. On these boards, the projects’ information
can be easily shared. These boards may include information about safety requirements,
schedule updates and quality information for the construction project activities [3],
[27], [33], [40], [51], [65], [66], [73], [152], [162], [173], [191], [206], [223], [245],
[265], [297], [298].
(10) 5 Whys; to improve the quality in the project by frequently asking five why questions
until the engineers have answers to remove any problem that might occur by
understanding the “root causes” and eliminate them. [27], [40], [59], [73], [206], [221],
[230], [240], .
(11) Just In Time (JIT) is a tool mainly used to apply the pull principle; it is responsible
for ensuring having the data, tasks or orders exactly when needed. In other words, the
right information becomes available in the right place, the moment it is needed. This
tool is used to reduce the inventories and handling and is one of the most important
Lean concept tools [1], [3], [15], [24], [25], [26], [34], [39], [51], [57], [59], [66], [73],
[86], [88], [104], [127], [131], [147], [152], [162], [172], [173], [191], [196], [206],
[211], [221], [230], [240], [245], [265], [268], [289], [297], [298].
(12) Value Stream Mapping (VSM); is a tool used to improve the flow of the process and
the identification of the project wastes. It mainly entails the determination of the
production chain by creating the Current State Map that includes Value Adding (VA)
and Non-Value Adding (NVA) activities, then determining and removing the wastes
and finally applying the Future State Map after introducing the improvements. By

P a g e | 59
using this tool, the Value Adding (VA) activities and Non-Value Adding (NVA)
activities are easily determined then the Non-Value Adding (NVA) activities, which
are considered wastes, are eliminated [1], [24], [25], [27], [39], [40], [47], [51], [57],
[59], [66], [73], [78], [147], [152], [191], [196], [199], [204], [206], [212], [221], [223],
[227], [230], [240], [245], [250], [259], [265], [293], [296], [297], [298].
In the next two sections, there is a detailed explanation of two Lean Construction (LC) tools,
Last Planner System (LPS) and Integrated Project Delivery (IPD) system. The application of
Lean Construction (LC) requires the right merging between different Lean tools that lead to
success of the project. Since this study focuses on decreasing the duration of construction
projects, it is considered essential to go further in depth into these two Lean tools. LPS is the
Lean tool mainly concerned with time management or schedule planning, and IPD is the tool
concerned with fostering collaboration between the stakeholders. As previously discussed, the
two variables are interdependent. In accordance, the application of LPS mainly depends on
efficient collaboration between stakeholders. Hence, by applying Last Planner System (LPS)
with Integrated Project Delivery (IPD) system, this eventually decreases the duration of the
project.
3.6.1 Last Planner System (LPS)
Ballard and Howell proposed Last Planner System (LPS) in 1992 [217], which is based on the
following five general ideas acknowledged by many scholars; [234], [5], [108], [217], [65],
[145], [222], [251], [76], [140], [240], [157]:
(1) Make sure that as the execution week of the working activity gets closer, enough
information about its details is available.
(2) Make sure that those who are doing the activity’s planning will execute it.
(3) Determine the constraints (or risks) that should be removed from the activity.
(4) Ensure that the plan developed by the engineers is reliable and accurate.
(5) Learn from the failure that occurred in the past to avoid repeating mistakes.
According to scholars [217], [85], [66], [219], [53], [284], [109], [131], [81], [116], [105], [5],
[251], [119], [265], [107], [143], [63], [76], [96], [102], [205], [2], [153], [145], [41] and [249]
Last Planner System (LPS) can be illustrated through the following six processes::

P a g e | 60
(1) Master plan or Milestone planning, which entails the milestones of the project. It is an
Initial long-term planning used to identify the milestones of the project and the general
information.
(2) Collaborative programming or Phase planning, which addresses the collaboration of
all the project’s stakeholders in the early project stage.
(3) Look-Ahead planning, which includes the breakdown of activities into more detailed
information and identifying and removing the wastes. It is a medium-term planning
and identifies the tasks of the project with more details. This process is used to
determine the availability of the different resources. It usually takes place three to six
weeks before the execution week. Two concepts are part of this process; the Screening
and Pulling concepts. The Screening concept is used to identify the constraints in the
tasks before starting to work on them. While the Pulling concept is used to eliminate
these constraints. Project Management approach (PM) introduces master plan to
determine what should be done, while Lean Construction’s tool, Last Planner System
(LPS), introduces project details until lower levels of decomposition on the required
project activities (Weekly Work Plan, WWP explained below in step 5). This step is
shown in Figure 3-6. Look-Ahead planning steps include:
a) Determining the activities, which are expected to be finished in the next few weeks.
b) Making sure that these activities will be finished in the expected duration with the
required resources.
c) Determining if there is any activity with potential delays.
d) Identifying any activity which might finish before its planned duration. In general,
Last Planner System (LPS) improves the project performance, reduces the wastes
and decreases the construction project's cost in contrast to the traditional
management approach.
(4) Make ready process, which aims to identify and remove the wastes from the activities
to prepare them for execution.
(5) Production planning and evaluation or Weekly Work Planning (WWP), is the stage in
which the Percentage of Plan Complete (PPC) of the activities which took place in the
previous week is calculated. As shown in Equation 1 below, PPC is calculated by
dividing the total number of activities completed by the total number of planned
activities [217]. WWP is also named “Commitment planning”, in the level in which
the engineers have to answer to the question of what will be done in the following

P a g e | 61
week. This level is considered short-term planning (weekly planning). WWP aims to
protect projects from variabilities and as the PPC increases; this means the reliability
increases. Weekly Work Planning (WWP) is also used to determine the reason of the
failure of non-complete activities. The PPC parameter is used to measure the rate of
non- compliance; as the percentage of PPC decreases, the project’s reliability
decreases. Some scholars [107], [217] found that there is a positive correlation between
Percentage Plan Complete (PPC) and factors such as workers productivity, involving
of Last Planner (LP) in the decision-making meetings, elimination of the reasons of
the constraints occurrence.
Equation 1: 𝑃𝑃𝐶 =
× 100%
(6) First run studies, is used to understand the construction process before starting the
execution process. It focuses on understanding the critical activities and finding ways
to improve them, as shown in Figure 14. This figure presents the explained steps of the
Last Planner System (LPS).
Figure 3- 6: Look-Ahead planning in LPS [105]
Last Planner System (LPS) helps in managing the project by using the concepts SHOULD-
CAN-WILL-DO. Figures 3-7 & 3-8 demonstrates the concept of Last Planner System (LPS)
in details. As demonstrated in the figures, the very beginning of any project is its main idea,
which is then broken down to activities that are planned for based on a specified time schedule
throughout the stages shown. LPS uses information about the main idea of the project as input
data, based on which the activities planning process is developed, resulting in the activities

P a g e | 62
schedule as the output. This output displays which activities SHOULD be done to achieve the
aspired results in the project. Having determined that, the project team then need to answer the
question: CAN the required activities be done? Responding affirmatively to that question does
not mean that the activity is wastes free, however it means that it is achievable. In other words,
the activities that should be done are turned to activities that can be done –are attainable- based
the scheduled time for each activity’s execution. The next stage is what activities WILL be
done. In order to reach this conclusion, potential wastes for each activity are estimated to put
expectations based on which the roots cause of such potential wastes are treated. Accordingly,
the possibility of wastes occurrence becomes eliminated paving the way for a more efficient
execution of the activities. Using the resources necessary, the activities are then executed.
Having done that, the finished project activities become in the ‘DID’ phase. The PPC values
are calculated for such activities in this stage to give an estimate of the efficiency of each
activity. High PPC values signifies better results in terms of efficiency. In case of low PPC
values the reasons are analysed creating a learning experience for future implementation [284],
[25], [136], [39], [48], [62], [251], [95].
Figure 3- 7: Last Planner System (LPS) [217]

P a g e | 63
Figure 3- 8: Last Planner System (LPS) concept [251]
Last Planner System (LPS) is considered as a trademark of the Lean Construction Institute
(LCI) [217]. According to scholars [209], [129], [50], [110], [51] Last Planner System (LPS)
is explained as a tool that solves some issues related to the project’s uncertainty/constraints and
also the project’s complexity, while improving the project’s reliability and expectations. This
is applied by mainly involving the project’s stakeholders in the early project phases. Last
Planner (LP) is the person/team, who is responsible to determine how to produce the output
(which is the finishing of the project).
3.6.2 Integrated Project Delivery system (IPD)
Integrated Project Delivery system (IPD) is defined as a deliver system mainly concerned with
involving the project’s stakeholders in the early project stage, which improves communication
between the project’s members. The American Institute of Architects (AIA) defines [152],
Integrated Project Delivery system (IPD) as “a project delivery approach that integrates people,
systems, business structures and practices into a process that collaboratively harnesses the
talents and insights of all participants to optimize project results, increase value to the owner,
reduce waste and minimize efficiency through all phase of design, fabrication and
construction”, [86], [232], [82], [6], [156], [224], [208], [118], [133], [101], [137], [186], [235].
According to scholars [138], [224], [155], [232], [156], [101], [118], [221], [86], [37], [235]
Integrated Project Delivery System (IPD) was identified to have some general laws:

P a g e | 64
(1) Early involvement of the stakeholders and improvement of the collaboration.
(2) Sharing the risks and the profit.
(3) Early determination of the goal early.
(4) Open communication.
(5) Multiparty contract.
(6) High respect and reliable.
(7) Agreements from different stakeholders.
(8) Early goal definition.
(9) Using advanced and updated communications and technologies.
Figure 3-9 shows a comparison between traditional project delivery and IPD. This comparison
focuses on the involvement period of different project stakeholders. Applying Integrated
Project Delivery system (IPD), the involvement of stakeholders takes place in the early stage
of the project, in contrast to the traditional project delivery.
Figure 3-10 shows the comparison between Design-Bid-Build (DBB), Design-Build (DB) and
Integrated Project Delivery (IPD) system. This comparison focuses on the percentage of the
design finished during the involvement of stakeholders. In the Design-Bid-Build (DBB), the
project's owner (client) makes the contract with the general contractor after finalizing the
design by 100% the client makes another contract with the. While in Design-Build (DB), the
client makes the contract with the general contract after 20% of the design is finished. By using
Integrated Project Delivery system (IPD), all the stakeholders are involved in all the project
stages, including before starting the design phase. Using Integrated Project Delivery system
(IPD) reduces the projects' cost and ensures having higher quality in shorter duration, [186],
[81].

P a g e | 65
Figure 3- 9: Collaborations in traditional project delivery and IPD [186]
Figure 3- 10: Comparison between Design-Bid-Build (DBB), Design-Build (DB) and
Integrated Project Delivery (IPD) system [81]
According to scholars [102], [230], [133], [143], [53], [157], [37] Integrated Project Delivery
(IPD) integrates all the project members in the construction project from the design stage until
the end of the construction stage. By the integration the communication between project
stakeholders improves, the risks are shared and the trust between project stakeholders takes
place. Moreover, it is found that the presence of collaboration problems leads to lower
productivity. Integrated Project Delivery (IPD) is a perfect Lean tool due to the involving the
project’s stakeholders in the early stages so the risks and profit are shared.
Integrated Project Delivery system (IPD) was found to decrease the changes in project designs
in comparison to the Design-Bid-Build (DBB), Design-Build (DB) [81]. By using IPD, some
general risks can be identified and reduced. By using Integrated Project Delivery system (IPD),

P a g e | 66
the total cost in construction projects is reduced. Through the application of Integrated Project
Delivery system (IPD) the schedule will be met and the owner will be satisfied by the project’s
final result [105], [158], [81].
3.7 Lean Construction benefits and barriers
Lean concept improves the performance of Value Adding activities and elimination the wastes.
Many previous studies present the benefits, which took place after the application of Lean
Construction tools. Based on previous studies [265], [31], [112], [119], [117], [108], [87] the
application of Lean Construction (LC) led to enhancements in different areas:
(1) Reducing the total cost of the project and final duration by eliminating waste.
(2) Enhancing the quality of the activities by reducing the rework activities.
(3) Positively impacting the environment by reducing CO2 emission from the machines.
Many studies explained more benefits behind the invention new Lean concept. The following
list illustrates the main targets of Lean Construction (LC), which represent its strength areas,
[146], [238], [250], [72], [242], [298], [34], [20], [147], [201], [118], [86], [265], [119], [227],
[223], [243], [15], [112], [297], [73], [40], [296], [72], [3], [77], [207], [272], [70], [170], [51],
[53], [173], [196], [172], [211], [48], [142], [221], [46], [262], [191], [166], [6], [132], [131],
[127], [274], [240], [5], [104], [28], [100], [33], [181], [35], [66], [93], [230], [36], [286], [16],
[294], [282], [206], [26], [1], [165], [121], [41], [56], [65], [148], [245], [213], [42], [268],
[289], [222], [105], [88], [249], [45], [102], [24], [214], [2]:
(1) Improves the planning of the design process.
(2) Eliminates the "muda" (means wastes in Japanese or in other words Non-Value Adding
activities) in the activities, which leads to reduction in the total cost of the project and
improvement in the efficiency of resources.
(3) Using Lean principles to eliminate the eight wastes categories after identifying them.
(4) Delivering the customer’s value (Output) with lower cost, less materials, time, space,
human resources and equipment (Inputs). The concept focus on delivering the customer’s
need without inventory.
(5) Focuses on minimizing wastes and maximizing the customer’s needs.
(6) Lean concept on switching “muda” to value adding activities on the project. Consequently,
production of the work increases.

P a g e | 67
(7) Lean concept put two main concepts for Lean. These concepts are minimization in total
cost by minimizing the Non-Value Adding activities (activities that do not add any value
to the project), while the second concept is improving the workers’ treatment and not
considering them machines.
(8) Reducing the time taken to finish the machine works and improving the quality of the
work.
(9) Minimizing the construction project wastes and reducing the causes of defects.
(10) Having improvements in the main three project's factors time, quality and cost. In general,
Lean concept focuses to improve the productivity, increase the customer’s value and
continuous improvement.
(11) Focusing to deliver the customer’s need without inventory. This aim later was changed;
Lean concept was focused to minimize wastes and maximizing the customer’s needs.
(12) Lean concept is using the Pull concept instead of Push concept, which is used by Project
Management (PM) approach.
(13) Improving in the working on the Essential Non-Value Adding activities, (ENVA).
(14) Making the construction supply chain caring about their effect on the project.
(15) Improvement of the inefficiency of the labours and materials.
(16) Improvement in customer satisfaction
(17) Inventories reduction.
(18) Employee satisfaction.
(19) Increase the construction projects' performance
(20) Increase project's transparency.
(21) Improvement of the concept project delivery method.
(22) Improvement in the reliability.
There are benefits to applying and implementing Last Planner System (LPS), [27], [251]. [286],
[116], [106], [297], [219], [107] and [108]:
(1) Variability reduction.
(2) Application of pull concept.
(3) Management of the prerequisite activities.
(4) Increase collaboration between project stakeholders.
(5) When the execution week comes closer, the activities are determined with more details.

P a g e | 68
(6) Collaboration between the engineers who will do the planning to increase the trust level
of the engineers promises.
(7) Determining and removing wastes takes place before execution week.
(8) Determining the process of removing wastes and documenting the previous failures to
maintain continuous improvement.
(9) Improvement in Look-Ahead planning process improves the Weekly Work Plan (WWP)
reliability.
(10) Perfection of Weekly Work Plan (WWP) will improve the final projects duration.
(11) Increases the construction projects' reliability and predictability.
Although, Lean Construction has a countless number of benefits, as demonstrated, it is still not
easy to apply this concept in construction projects. Lean Construction has also many barriers,
which prevent its spreading globally. Some of these barriers are [243], [148], [241], [218] and
[131], [108], [226], [103], [49], [268], [51], [245], [117], [27], [142], [298], [210], [34], [35],
[203], [67], [152], [230], [86], [173], [294], [16], [96] and [238]:
(1) Poor contracts between project members.
(2) The human culture, which resists changes.
(3) The political situation in each country.
(4) Lack of background about the Lean concept.
(5) The contractor is not received his monthly payment from the invoices on time.
(6) The interest rate is high.
(7) Lack of materials availability.
(8) Lack of trust between project members.
(9) Change in the design during the construction stage.
(10) Partial or late implementation of the Lean tools (such as Last Planner System).
(11) Confusion in the planning responsibilities.
(12) Inaccurate expectation of the wastes.
(13) Refusing to collaborate.
(14) Lack of knowledge about Lean Construction
(15) Lack of support from top management
(16) Delaying in materials delivery.
(17) Acceptance of the wastes that will be done.
(18) Conflict in government policies.
(19) Lack of interest from the client.

P a g e | 69
(20) Lack of detailed explanation of the project.
(21) Corruption.
(22) Poor communication between project members.
(23) Leadership problems.
(24) Problems between the project team members.
(25) Lack of long-term vision.
(26) Fragmentation and sub-contracting; sub-contractors sign their contracts with the
main-contractor and not with the owner, which means that the owner does not maintain
any influence over the sub-contractor. This can have an effect on the quality of the
project, for instance because it becomes less binding for the sub-contractor to apply
LC.
(27) Financial problems; to have a successful application of Lean concept, this barrier
should be overcome through having adequate salaries, conducting trainings for
workers, and also have machine maintenance done on time.
According to scholars [223], [175] some other barriers were identified during the design stage.
These barriers have a direct impact on the Value Stream principle:
(1) The information stuck from flowing due to the lack of the critical process.
(2) Information stuck from flow because it cannot be identified or contradict the
shared process.
(3) High amount of information is created which leads to difficulty in identifying
the accurate information.
(4) Wrong information is created, which leads to inaccurate results.
Another barrier for Lean Construction (LC) is “Patience”; the reason is regarded as a barrier
is the fact that LC needs more time in the early construction projects' (such as design and
planning), however, this will eliminate the project's changes. These changes can increase the
final project's duration and cost, [223] and [214]. Further, based on another study [127] some
risks are not eliminated by using Lean Construction (LC):
(1) Variations in materials costs.
(2) The contractor does not receive his payment on the required time.
(3) The design are not accurate, which leads to some errors.
(4) The delivered materials are poor in quality.
3.8 Lean Construction studies

P a g e | 70
Tables 3-5 to 3-35 summarize Lean Construction (LC) studies related to different project
sectors. This summary is based on the country where each study is applied. The main reasons
of the study are determined. The studied project sector and the Lean Construction tools used
on each study are shown. The methodology used on each study are also listed. Finally, the
results of the study are presented.
Table 3- 5: Information of Lean Construction (LC) studies
Table 3- 6: Information of Lean Construction (LC) studies

P a g e | 71
Table 3- 7: Information of Lean Construction (LC) studies

P a g e | 72
Table 3- 8: Information of Lean Construction (LC) studies

P a g e | 73
Table 3- 9: Information of Lean Construction (LC) studies

P a g e | 74
Table 3- 10: Information of Lean Construction (LC) studies

P a g e | 75

P a g e | 76
Table 3- 11: Information of Lean Construction (LC) studies
Table 3- 12: Information of Lean Construction (LC) studies

P a g e | 77
Table 3- 13: Information of Lean Construction (LC) studies

P a g e | 78
Table 3- 14: Information of Lean Construction (LC) studies

P a g e | 79
Table 3- 15: Information of Lean Construction (LC) studies

P a g e | 80
Table 3- 16: Information of Lean Construction (LC) studies

P a g e | 81
Table 3- 17: Information of Lean Construction (LC) studies

P a g e | 82
Table 3- 18: Information of Lean Construction (LC) studies

P a g e | 83
Table 3- 19: Information of Lean Construction (LC) studies

P a g e | 84
Table 3- 20: Information of Lean Construction (LC) studies

P a g e | 85
Table 3- 21: Information of Lean Construction (LC) studies

P a g e | 86
Table 3- 22: Information of Lean Construction (LC) studies

P a g e | 87
Table 3- 23: Information of Lean Construction (LC) studies

P a g e | 88
Table 3- 24: Information of Lean Construction (LC) studies

P a g e | 89
Table 3- 25: Information of Lean Construction (LC) studies

P a g e | 90
Table 3- 26: Information of Lean Construction (LC) studies

P a g e | 91
Table 3- 27: Information of Lean Construction (LC) studies

P a g e | 92
Table 3- 28: Information of Lean Construction (LC) studies

P a g e | 93
Table 3- 29: Information of Lean Construction (LC) studies

P a g e | 94
Table 3- 30: Information of Lean Construction (LC) studies
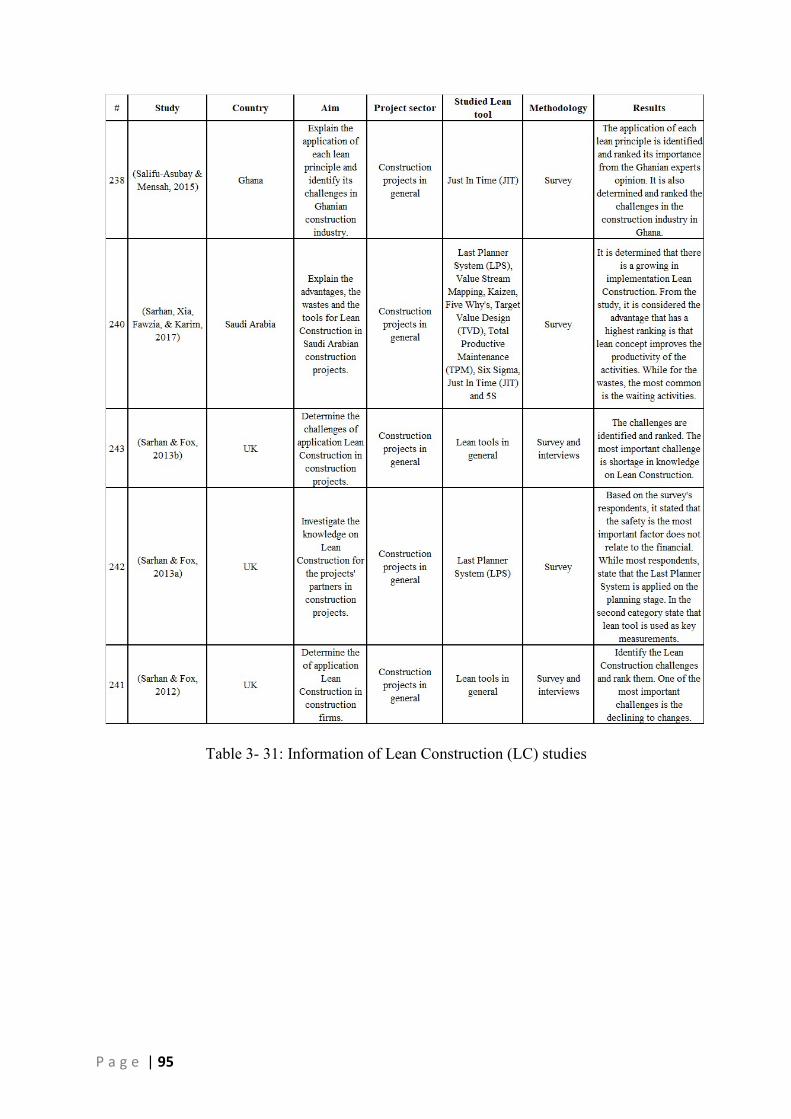
P a g e | 95
Table 3- 31: Information of Lean Construction (LC) studies

P a g e | 96
Table 3- 32: Information of Lean Construction (LC) studies

P a g e | 97
Table 3- 33: Information of Lean Construction (LC) studies

P a g e | 98
Table 3- 34: Information of Lean Construction (LC) studies

P a g e | 99
Table 3- 35: Information of Lean Construction (LC) studies

P a g e | 100
3.8.1 Studies analysis
Tables 3-36 to 3-14 and Figures 3-11 to 3-14 show the analysis of the literature studies applying
Lean Construction (LC) on different project sectors. Table 3-36 and Figure 3-11 show the
analysis of these studies based on the country where these studies were applied. The majority
of this list relate to USA (20.7%). This is followed by “Other”, which has the countries that are

P a g e | 101
applied only once (14.5%). Table 3-37 and Figure 3-12 show the analysis of the different
project sectors. The majority is the application of Lean Construction in general as there is no
specific project sector mentioned (42.3%.) This is followed by the building projects(40.2%).
The application of road projects is only 4.2% of the studies. Table 3-38 and Figure 3-13 show
the analysis of Lean Construction tools. The majority is the application of Last Planner System
(LPS) by 25.9%. Table 3-39 and Figure 3-14 show the application of the methodology in the
studies. The majority of them is the application of analysing projects’ data (28.7%).
Table 3- 36: Country analysis used Lean Construction (LC)

P a g e | 102
Figure 3- 11: Country analysis used Lean Construction (LC)
Table 3- 37: Project sector analysis used Lean Construction (LC)
Figure 3- 12: Project sector analysis used Lean Construction (LC)
Table 3- 38: Studied lean tool analysis

P a g e | 103
Figure 3- 13: Studied lean tool analysis
Table 3- 39: Methodology analysis used Lean Construction (LC)

P a g e | 104
Figure 3- 14: Methodology analysis used Lean Construction (LC)
3.9 Application of Lean Construction on road project
Tables 3-40 to 3-42 summarize the studies related to Lean Construction on road and
infrastructure projects. This summary is based on the country where each study is applied.
The main reasons of the study are determined. The studied project sector, project type and the
Lean Construction tool used are shown. Then the methodology used are listed. Finally, the
results of the study are presented.
Table 3- 40: Information of Lean Construction (LC) studies on road and infrastructure projects

P a g e | 105
Table 3- 41: Information of Lean Construction (LC) studies on road and infrastructure projects

P a g e | 106

P a g e | 107
Table 3- 42: Information of Lean Construction (LC) studies on road and infrastructure projects
3.9.1 Studies analysis
Tables 3-42 to 3-46 and Figures 3-15 to 3-18 show the analysis of the literature studies applying
Lean Construction (LC) on road and infrastructure projects. Table 3-42 and Figure 3-15 show
the analysis of these studies based on the country where these studies applied. The majority of
this list relate to USA and UK ( 23.1% each). Table 3-43 and Figure 3-16 show the analysis of
different project sectors. The majority is the application of Lean Construction in road projects
(56.3%). Table 3-44 and Figure 3-17 show the analysis of Lean Construction tools. The
majority is the application of Last Planner System (LPS) and the application of Lean
Construction without specification of the exact lean tool used (33.3% each). Table 3-44 and
Figure 3-18 show the application of the methodology in the studies. The majority of them is
the application of analysing projects’ data (29%).

P a g e | 108
Table 3- 43: Country analysis used Lean Construction (LC) on road and infrastructure projects
Figure 3- 15: Country analysis used Lean Construction (LC) on road and infrastructure
projects
Table 3- 44: Project sector analysis used Lean Construction (LC) on road and infrastructure projects

P a g e | 109
Figure 3- 16: Project sector analysis used Lean Construction (LC) on road and infrastructure projects
Table 3- 45: Lean tool analysis

P a g e | 110
Figure 3- 17: Lean tool analysis
Table 3- 46: Methodology analysis used Lean Construction (LC)
Figure 3- 18: Methodology analysis used Lean Construction (LC)
3.10 Conclusion
The invention of Lean Construction (LC) is essential because construction projects have been
facing many problems. These problems eventually lead to an increase in the project’s total cost
and final duration, accompanied by a decrease in the quality and productivity of the project

P a g e | 111
activities. Lean Construction (LC) targets to eliminate the project waste and deliver the
maximum value to the customer with the best quality. This relatively new management concept
requires the simultaneous use of Lean tools. Applying only one or two of these tools in the
project means partial application of Lean Construction and may lead to the failure of the
project. This means that if the specified Lean tools are applied to time related issues, the
relevant Lean tools should be as well applied to all the other aspects of the project, that is, cost
and quality. This study addresses the problem of exaggerated construction project duration
while seeking to propose solutions that minimize the final duration and increase the
productivity of road projects by implementing the relevant Lean tools.
If Project Management (PM) approach is considered as an eye studying the construction project
from a high point, then Lean Construction (LC) is regarded as an advanced lens that provide a
far more accurate perspective. As highlighted in the conclusion of the previous chapter on PM,
there are three essential arguments focused on in this study; risk analysis, time management
and stakeholders’ collaboration. The PM approach does address the three issues in a project
however still some problems persist to which solutions are provided through the LC approach
tools. In the first argument related to risk analysis, PM does not address the root causes of risks
in real life projects while LC targets identifying such causes to eliminate wastes or at least
reduce their effects. In accordance, in the second argument related to time management, the
Critical Path Method (CPM) under the PM uses buffers to address potential risks (time delays),
while again LC addresses the roots of the problem through its LPS tool eliminating wastes.
Finally, in the third argument related to stakeholders’ collaboration, under the PM approach
there is a clear lack of collaboration, while the LC approach shows keenness on involving
stakeholders from the early stages of the project.
These arguments are further explicated in the empirical part of the study through the case study
observed through a real life project. The methodology utilized, that is the simulation, and more
details about the case study are demonstrated in the next chapter.

P a g e | 112
CHAPTER 4 CASE STUDY
Introduction
The main purpose of this chapter is to explain the case study used in this research and the
application of the simulation used. Accordingly, the chapter begins by explaining and defining
the studied road project; its location and characteristics. This is followed by delving into the
project’s activities and sub-activities as observed and based on the data collected from the site.
In addition to that, the obstacles noted during the site visits are demonstrated acting as the
foundation based on which the different wastes are defined.
The simulation used in this study was done by Simio Simulation; a software used as a mean to
estimate the time durations. The different applications of this simulation are explained. The
main target of developing such applications is to conduct a comparative analysis between using
the PM and LC approaches in road projects with a special focus on eliminating time related
wastes. This analysis is elaborated in the next chapter; this chapter is dedicated to explicating
the fieldwork and methodology of the study.
4.2 Project definition
During the period from 16th of July until 15th of August 2016, the PhD candidate studied a
highway project in Egypt -Dahshour's Connection Highway- aiming at measuring the real site
ratios. It is located in a new city in Cairo called 6th of October city. It can be seen as a connection
between the centre of the city and the beginning of the main highway of Alexandria (another
governorate regarded as the second capital of Egypt). The length of the project is 12812 m in
each of the two directions as shown in Figures 4-1 and 4-2. The project planners, before
execution, plan the estimated duration for each activity. Based on this estimation, the project
duration is 56 weeks as shown in Figure 4-3. The main contractor is one of the biggest public
companies in Egypt called Arab Contractors. This road has existed for many years; the main
target of this project is to substitute the old one with a new road besides broadening the width
of each of its two directions and the total width of the road is/will be? 17m.
Accordingly, the main purpose of the conducted field observation, which occurred through
regular visits to the site, was to explore the application of the Project Management (PM)
approach in reality. Through such observation, the occurring and potential weaknesses were
taken into account, in order to emphasize and investigate the degree of importance of Lean
Construction (LC) in highway projects.

P a g e | 113
The estimated total cost of this project is about 9,700,000 Euro. Around 7,500,000 Euro is
dedicated to excavations, aggregate surfaces and paving surfaces, the remaining amount,
2,200,000 Euro, is divided between pavement and landscaping. The estimated total duration of
the project is eighteen months (from October 2015 to April 2017) according to data gathered
from engineers from the technical office. This data is presented in GANTT chart in excel sheet
Figure 4-3. This estimation was taken place by using the duration estimation tools as explained
in PM chapter. The most important details of the case study are presented below, which were
obtained by the PhD candidate and the main areas investigated.
Accordingly, the main target is to provide details on the case study by responding to questions
such as; What are the project's main activities? How do the engineers on site implement the
shop-drawings as shown in Figure 1? What were the machines used? Why were these machines
used in the project?
Figure 4- 1: Layout of the project

P a g e | 114
Figure 4- 2: Elevation sheet for 10.225 km
Figure 4- 3: GANTT diagram (site data)
The traffic is moving as usual on the old road during construction (the extended part that is
supposed to increase the width of the road). After paving the 1st layer of asphalt, they wait for
24 hours before starting the normal traffic movement on it, and then the new extension
substitutes the old road for traffic movement to give engineers and labour the opportunity to
close the old one. The removal is justified by the fact that the preceding road is cracked (as
shown in Figure 4-4) and they want to increase the quality of the project as a whole; taking into
consideration that there are many trucks driving on it daily.
The working hours of the project during weekdays are scheduled from 08:00 in the morning to
17:00 in the evening including one hour for lunch. It is worth mentioning that the construction
sector in Egypt takes only one day off on Saturdays.

P a g e | 115
Figure 4- 4: Cracks of the old road
4.3 Field observation and data gathering
In the following sections, the main activities of the project are demonstrated: the sequence of
execution, the definition of each activity and the equipment used for each. The main purpose
of displaying this is to provide detailed information about the real life activities and sub-
activities of the project, based on which the simulation used in this study is modeled. Through
presenting the main findings of the field observation, the main obstacles faced during execution
are put forward. These obstacles are used in the simulation as the wastes encountered in a real
life project. In addition to observing the site activities, further information about the project
planning and execution was gathered through documents provided by the engineers working
under the contractor and through verbal communication with them. Such information has been
necessary in order to have the data about each sub-activity through the oral communication
with engineers, and through documents such as the shop-drawings and the time schedule of the
project.
4.3.1 Main activities of the project
According to the oral communication with engineers and based on the field observation, this
project is divided into the following activities:
Sub-base layer works
Concerning the old road, the cracked asphalt layer, as previously explained, is first removed.
The remaining thin layer of asphalt is then removed by the loader. The sub-base layer of the
old road is used as a foundation for construction in this part of the road.
For the new extension, they start with the excavation, then they put the aggregate for the sub-
base layer with a thickness of 15cm for each of the four layers; by extending and compacting

P a g e | 116
each layer. After putting the sub-base layer of the new extension, the activities are merged in
both parts of the project (the old road and the new extension).
1st aggregate layer works
From this stage, both the thickness and the material of layers will be the same for the old and
the new extension. The same aggregate material will be used for this layer; providing a
thickness of 35cm with a total width of the road of 17m.
2nd aggregate layer works
After the previous activity the consultant inspects the levelling of the surface; if the inspection
is approved, the 2nd aggregate layer begins with a thickness of 15cm for the whole width (17m)
of the road. These activities (sub-base, 1st aggregate layer and 2nd aggregate layer) are important
because they increase the density of the aggregate and decrease the air voids within the soil.
This increases the compaction of layers resulting in better quality.
After the 2nd aggregate layer, the floor is sprinkled with a material called MC (referring to
Medium Curing). This material is composed of betomine (50%) and fuel gas (50%). On the
one hand, Betomine is used to prevent the ground water from transferring to the surface of the
road. On the other hand, gas is used to dilute it to make it a fluid so it can be placed easily.
1st Asphalt layer works
The asphalt layers begin one day after MC sprinkling by 1st asphalt layer 7cm thick. Then
another material called RC (referring to Rapid Curing) is sprinkled on top of the asphalt layer.
This material has the same components as MC but with different percentage; RC consists of
betomine (90%) and fuel gas (10%). For this composition with very high percentage, betomine
is to work as an adhesive between the two asphalt layers.
2nd Asphalt layer works
Normally, the 2nd asphalt layer activity begins after the RC sprinkle activity. It is important to
note that this activity had not begun during the observation period (which ended on August 15th
as previously mentioned). In addition, during the visit on site only the main activities (main
activities are all the previously explained activities except MC and RC activities) were studied.
The other activities (such as the removal of the old asphalt layers, MC and RC composition)
were not studied as they were done after the working hours, during late night shifts.
4.3.2 Equipment information

P a g e | 117
This section focuses on the machinery used to implement the project activities and sub-
activities. It is essential to note that this type of infrastructure projects depends mainly on the
equipment and not on skilled (or non-skilled) labours as in the case of other kinds of projects
(such as building or bridge projects). For this reason, it is necessary to demonstrate in details
the different types of machines used for different purposes as shown in Figure 4-5.
Figure 4- 5: Road project machines: (a) Grader, (b) Water sprinkler, (c) Paving finisher and
(d) Double Drum Roller
Secondly, Figure 4-6 shows the grader; the use of this machinery is similar to the next three
machines in its usage, as all of them are used for the three following activities (sub-base, 1st
aggregate layer and 2nd aggregate layer). The grader is used to spread the aggregate on the
surface of the ground after the truck piles them in a mass on the ground.
Figure 4- 6: Grader
Thirdly, the water sprinkler shown in Figure 4-7. This machine worked on the three following
activities (sub-base, 1st aggregate layer and 2nd aggregate layer). During the visit on site, the
highest temperatures (up to 45 ⁰C) of the year were reached in Cairo: This high temperature,
made the water sprinkler play an important role to assure adequate humidity in the ground. The
importance of using water sprinkler during roads construction is to decrease the air voids in the

P a g e | 118
soil by increasing the humidity of the soil. This leads to strongly compacted layers and hence
better quality.
Figure 4- 7: Water sprinkle
Figure 4-8 shows the single drum rollers, which are used to compact the aggregate surface and
to vibrate the soil. This task decrease the air voids in the soil, especially after water sprinkle,
the soil becomes well compacted.
Figure 4- 8: Single drum rollers
Figure 4-9 shows the equipment used to sprinkle the two different materials (MC and RC). MC
is sprinkled after 2nd aggregate layer while RC is sprinkled after 1st asphalt layer.
Figure 4- 9: MC & RC sprinkle machine

P a g e | 119
Figure 4-10 presents the paving finisher, which was used in two activities (1st and 2nd asphalt
layers). At the beginning, the truck drops down the asphalt on the paving finisher as shown in
the figure. For better quality, ideally, the asphalt’s temperature on the truck should be as high
as 135 ⁰C and after dropping down the material the temperature should be around 125 ⁰C.
Figure 4- 10: Paving finisher
Figure 4-11 shows the double drum rollers. This machine is used also in two activities (1st and
2nd asphalt layers) and compacts the asphalt without vibrating it.
Figure 4- 11: Double drum rollers
Table 4-1 shows the utilization of the machinery. In addition, Table 2 shows the used
equipment of each sub-activity as observed on site
Table 4- 1: Equipment used and their utilization

P a g e | 120
Table 4- 2: Resource for each sub-activity
4.3.3 Obstacles on site and recommendations

P a g e | 121
The PM approach has been used in the construction field since the beginning of the industry.
Accordingly, it is an easy to follow approach since the majority of engineers and workers are
already familiar with its techniques and steps. When it comes to time planning one of the most
important advantages of the PM approach is its tools that allow for time and risk planning;
anticipating risks is one of its strength points. Despite so, as previously discussed there are
problems that emerge while using this approach, which calls for an innovative solution; such
as that provided through LC approach as argued. As highlighted, the researcher conducted the
field observation with the main purpose of studying how the PM approach is applied in road
projects in real life. Accordingly, demonstrating the weaknesses and obstacles that negatively
affected the productivity in this project is the focus of this section. As previously mentioned,
these obstacles are defined as wastes in the simulation modelling used in this study.
To collect information about the duration of the sub-activities, site observations were done for
30 days, four hours every day (six days a week). Each sub-activity under each activity was
observed and its duration measured manually. In order to calculate the duration of each sub-
activity, the Value Adding (VA) activities durations were observed, taking into account that
each machine has a minimum, a maximum and an average speed. Value Adding (VA) activities
are the activities that add value to the project. This mainly refers to all the activities on the
project necessary to reach the aspired final product [188], [164], [189], [190]. The speed of
each machine was determined based on the observation while calculating the duration to finish
the sub-activity work in a 200 meter road section with the different machines. In case of the
Non-Value Adding (NVA) activities, three durations (minimum, maximum and average) were
also observed during the manoeuvring of the machine. Non-Value Adding (NVA) activities are
the activities that do not add value to the project, but they should be reduced as they are
considered wastes [188], [164], [189], [190]. From the VA and NVA activities duration, the
total durations were calculated for each sub-activity. The wasted time was not included in the
time durations calculated.
The first observed waste, W1 refers to the fact that working on the activity was finished but the
following activity could not start right after. The reason goes back to the delay in inspecting
the finished activities reflecting high dependency on the inspector’s comments, which affect
the flow of work. Hence, this waste mainly refers to the time unnecessarily wasted during the
inspection of an activity. For example, in several cases, after finishing one activity the work
process stopped while waiting for the consultant to inspect the finished activity. During the site
observation, this situation was detected and the consultant did not show up that day which led

P a g e | 122
to the following activity being postponed till the next day after inspection. Figure 4-12 shows
an example of delayed work; in this figure the machinery stopped waiting for the inspection.
One way to overcome this obstacle/cause of waste is by allowing the equipment to work in
another section until the finished area or improving the coordination with the inspector.
Figure 4- 12: Waiting for inspecting the finished activity
The second observed waste, W2, refers to the machinery (DDR or Paving Finisher) was waiting
the asphalt trucks arriving late. The problems behind the occurrence of this waste could be
resolved using the Just In Time (JIT) concept, as demonstrated in Figure 4-13, where the paving
finisher is shown waiting for the asphalt trucks arriving late. JIT concept is a tool mainly used
to apply the pull principle; it is responsible for ensuring having the data, tasks or orders exactly
when needed [192], [164], [157], [215]. The perfect occurrence is to deliver the material exactly
on time, neither late nor early.
The third waste, W3, refers to the machinery having shortage of its fuel gas wasting time for
it; due to lack of maintenance. However, by applying maintenance and repair this problem can
be eliminated. Despite the fact that maintenance and running out of gas are two different issues,
both fall under the responsibility of the technical department and hence can be grouped into
one category.
The fourth waste, W4, refers to the transportation of the aggregate to the working area, for a
distance farther than 5Km. This waste mainly refers to the long distance between the loading
and unloading areas. The time duration of this waste is calculated per meter; minutes wasted
per meter.

P a g e | 123
Figure 4- 13: Paving finisher waiting the asphalt trucks
The fifth waste, W5, which refers to the machinery stopped for mechanical problems. This
waste is similar to W3 because they occurred due to lack of maintenance and repair, as shown
in Figure 4-14. In this figure, the grader had mechanical problems and the mechanic had to
work to solve these problems. If there were application of Total Productive Maintenance
(TPM) by continuous maintenance of machines, the machines improve their efficiency and put
them to use according to their maximum potential. This occurs by enabling operators to
maintain their machines [146], [8], [173], [234], [169].
The sixth waste, W6, refers to double drum rollers running out of water as shown in Figure 4-
15. Double drum rollers, used to mash the surface of asphalt layers, need water on the drum
during rolling to facilitate the mashing process. The problem that the machinery ran out of
water was identified in the middle of the work activity and the water sprinkler needed to be
used to refill it. The mechanical maintenance department should regularly check on the water
in the double drum rollers to prevent this waste of time and cost.
Figure 4- 14: Waiting for mechanical problems

P a g e | 124
Figure 4- 15: Double drum rollers filling with water
The seventh waste, W7, refers to the paving finisher having to make two trips to pave the road
with asphalt because of the width of the road. The paving finisher had to make two trips to
pave the road with asphalt because of the lack of compatibility between the width of the road
and that of the paving finisher. The time wasted during the two trips contributes to the overall
delay in activities.
The eighth waste, W8, refers to the asphalt truck waiting until the paving finisher pave the
dropped down asphalt on it. The asphalt truck’s driver suddenly drops a significant amount of
asphalt leading to a time gap between the moment when the asphalt was dropped and the time
needed by the paving finisher to pave it. The time duration of this waste is calculated per meter;
minutes wasted per meter. Table 4-3 shows the explanation of the previously explained eight
wastes observed on the site visits.
Table 4- 3: Wastes Explanations

P a g e | 125
4.4 Simulations explanation
This section shows the explanation of the implementation of three simulations similar to the
observed conditions in the real life project. The used assumptions in these simulations are
demonstrated through the definition of different equations. The process of wastes elimination
is defined and the inputs of time durations, for sub-activities and wastes, are demonstrated.
The simulation was carried out by using the software Simio. This software is used to simulate
any example based on the input inserted. One of its most important advantages is that it ensures
accuracy of results by allowing a high number of replications; for example the researcher made
600 replications. It is a studying version, 10th edition. The target of applying this simulation is
to analyse the use of Project Management (PM) approach and Lean Construction (LC) in road
construction projects. In order to make it as close as possible to real life projects, the data
collected from the case study and the findings of the conducted field observation are used as
input according to which the PM simulation is modelled. As aforementioned, the date collected
from the road project studied include obstacles which are treated as wastes in this simulation.
The same simulation is modelled then to apply Last Planner System tool with the intent to
compare the application of Lean Construction to PM in the same project. It is important to note
that two PM simulations and one LC simulation are modelled as explained in more details
below. Figure 4-16 is an illustration of the simulation software.

P a g e | 126
The comparative analysis developed through the three simulations explained below aims at
highlighting how the application of LC in road projects leads to better results in terms of
productivity and efficiency of accomplishing the project’s activities through efficient time
management. The time durations, for each; the sub-activities and the wastes, are defined by
random triangular functions based on observed information (different deviation of the mean
values +-20%, +-10%, +-5% and 0%).
- Simulation PM-EW, refers to Project Management with Expected Wastes: Inserting the
maximum number assumed wastes for each sub-activity (theoretical assumption).
- Simulation PM-OW, refers to Project Management with Observed Wastes: In this analysis,
only the wastes observed on site are considered.
- Simulation LC, refers to Lean Construction: The same assumptions in the previous
simulation are considered. As in the PM-OW simulation, only the wastes observed on site
are considered. The main difference with the preceding simulation is the application of the
concept Last Planner System.
Figure 4- 16: Simio software
The next section introduces the processes done on the simulation to obtain the results. First,
the assumptions are demonstrated; introducing general and specific assumptions for each of
the three simulations. Second, the equations developed are demonstrated and explained. Then,
the input data for every simulation is listed.
4.5 Assumptions:
The general assumptions of the three simulations (PM-EW, PM-OW and LC) are shown in
Table 4-4. The studied road project in the simulations is divided into sections similar to the real
life. Each section is 200 meters length and the total number of these sections is sixty four
P a g e | 127
sections. The previously mentioned activities and sub-activities are inserted in the three
simulations. After finishing working on each sub-activity the following sub-activity starts by
sequence. There is no overlapping between any two sub-activities. For every activity, the
values of PPC and PAW are calculated. Each sub-activity needs one specific machinery to be
executed. This applies to all except the sub-activities related to pouring asphalt, which need
two machineries; paving finisher and asphalt truck. The time durations for each of the sub-
activities and the wastes are data collected during the site visits. The wastes are inserted in the
simulations as delayed times; including wastes occurring during and/or after the execution of
the sub-activities
Table 4-5 shows the difference between PM simulations, PM-EW and PM-OW, and LC
simulation. The difference between them is only the application of Last Planner System (LPS).
The time durations, for each the sub-activities and the wastes, is kept the same for the three
simulations.
Table 4- 4: General assumptions for all simulations
Table 4- 5: Specific assumptions for each simulation

P a g e | 128
4.6 Definition of parameters:
Having presented the assumptions, which represent part of the input inserted to the simulations.
It is crucial to explicate the parameters and their equations. Hence, this section is a
demonstration of how the three simulations were implemented. Besides explaining the
parameters and equations used, a sample of how the simulations work is given through
displaying one of the activities as an example.
Equation 1 is used for measuring the activity’s productivity on site. While equations 2 and 3
are related to a new variable named Percentage Plan Complete (PPC) and Percentage Activity
Waste (PAW), which are considered as outputs from the simulation for each activity. PPC is
related to the efficiency of each activity on the project. While PAW is related to the
identification of the percentage of the waste in each activity. Equation 4 is related to the process
efficiency for each waste observed in the site visit. Process efficiency is used to differentiate
between the wastes due to its times of occurrence. For illustrative purposes, an example for the
calculation of the activity’s productivity applied on the 2nd Aggregate layer is presented below:
Equation 2:
𝑃𝑟𝑜𝑑𝑢𝑐𝑡𝑖𝑣𝑖𝑡𝑦 𝑜𝑓 𝑎𝑐𝑡𝑖𝑣𝑖𝑡𝑦 𝐼 𝑝𝑒𝑟 𝑤𝑒𝑒𝑘 (𝐴𝑠 𝑜𝑏𝑠𝑒𝑟𝑣𝑒𝑑) 𝑖𝑛 𝑆𝑖𝑚𝑖𝑜 𝑠𝑖𝑚𝑢𝑙𝑎𝑡𝑒𝑜𝑛 =
[ ] [ ]#
[ ]# ∗ ( )
∗
7 ∗ 6
# Random values with triangular distribution
: PPC% =3 Equation
𝑂𝑐𝑐𝑢𝑟𝑟𝑒𝑑 𝑝𝑟𝑜𝑑𝑢𝑐𝑡𝑖𝑣𝑖𝑡𝑦 𝑜𝑛 𝑤𝑒𝑒𝑘 (𝑃𝑟𝑜𝑑𝑢𝑐𝑡𝑖𝑣𝑖𝑡𝑦 𝑝𝑒𝑟 𝑤𝑒𝑒𝑘) (𝑓𝑜𝑟 𝑒𝑎𝑐ℎ 𝑎𝑐𝑡𝑖𝑣𝑖𝑡𝑦) ∗ 100
𝑃𝑙𝑎𝑛𝑛𝑒𝑑 𝑝𝑟𝑜𝑑𝑢𝑐𝑡𝑖𝑣𝑖𝑡𝑦 𝑜𝑛 𝑤𝑒𝑒𝑘 𝑧𝑒𝑟𝑜 (𝐸𝑥𝑝𝑒𝑐𝑡𝑒𝑑 𝑝𝑟𝑜𝑑𝑢𝑐𝑡𝑖𝑣𝑖𝑡𝑦 𝑝𝑒𝑟 𝑤𝑒𝑒𝑘) (𝑓𝑜𝑟 𝑒𝑎𝑐ℎ 𝑎𝑐𝑡𝑖𝑣𝑖𝑡𝑦)

P a g e | 129
Equation 4: PAW% = ∗
Equation 5: Process efficiency =
Example of application on 2nd Aggregate layer:
- Analysed activities: ONLY the 2nd Aggregate layer. Total quantity= 120,000 m2
- Analysed road project: 64 sections of 200ml
- Thickness per layer = 15cm
- Width per layer = 17m
- Total duration of sub base layer activity: 42 weeks (project data)
o Productivity for 2nd Aggregate layer as scheduled from the project information for
all simulations (PM-EW, PM-OW and LC):
Productivity per week (As scheduled from the project information) = ,
= 2,857.14 m2/
week
o Productivity for 2nd Aggregate layer as observed in site visiting for simulation PM-
OW:
Process efficiency (PE) for W1 = ∗ 100 = 89.74%
Process efficiency (PE) for W4 = ∗ 100 = 100.00%
Process efficiency (PE) for W5 = ∗ 100 = 28.21%
Duration for unloading 2nd Aggregate layer per section (in hours) = Random triangular values
(1.821, 3.125, 4.875) OVER number of machines used
W4 during the unloading (in hours) = Random triangular values (15.150, 27.188, 43.200)
W4 is per meter the random triangular values multiply by ,
= 1,875 m2/section
W4 multiplies by its process efficiency (PE), which is 100%
Total duration for unloading 2nd Aggregate layer (in hours) = Summations of the duration
values for the 64 sections
P a g e | 130
Duration for levelling 2nd Aggregate layer per section (in hours) = Random triangular values
(0.650, 1.172, 1.875) OVER number of machines used
W5 during the levelling (in hours) = Random triangular values (0.293, 0.367, 0.440)
W5 multiplies by its process efficiency (PE), which is 28.21%
W1 after the levelling (in hours) = Random triangular values (0.347, 3.575, 8.060)
W1 multiplies by its process efficiency (PE), which is 89.74%
Total duration for levelling 2nd Aggregate layer (in hours) = Summations of the duration
values for the 64 sections
Duration for water sprinkle 2nd Aggregate layer per section (in hours) = Random triangular
values (1.750, 2.875, 4.500) OVER number of machines used
W1 after the water sprinkle (in hours) = Random triangular values (0.347, 3.575, 8.060)
W1 multiplies by its process efficiency (PE), which is 89.74%
Total duration for water sprinkle 2nd Aggregate layer (in hours) = Summations of the
duration values for the 64 sections
Duration for compact 2nd Aggregate layer per section (in hours) = Random triangular values
(2.375, 3.750, 5.625) OVER number of machines used
W1 after the compact (in hours) = Random triangular values (0.347, 3.575, 8.060)
W1 multiplies by its process efficiency (PE), which is 89.74%
Total duration for compact 2nd Aggregate layer (in hours) = Summations of the duration
values for the 64 sections
Total duration for 2nd Aggregate layer for all sections (in hours) = Summations of the total
duration values (with the wastes duration values) of all the sub-activities for the 64 sections

P a g e | 131
Productivity for 2nd Aggregate layer as observed in site visiting for simulation PM-OW
as in equation 1 (per week) =
∗ 7 ∗ 6
PPC for 2nd Aggregate layer as in equation 2 (per week) =
∗ 100
PAW for 2nd Aggregate layer as in equation 3 =
∗ ∗ ∗ ∗ ∗
∗ 100
4.7 Simulations input data
The studied road project is divided into some categories as shown in Table 4-6. The whole
project is identified as Mountain, which refers to something bulky or huge. This category is
broken-down to sections from the first to the sixty-fourth section; referring to the total number
of sections in the real life project. The sections are identified as Boulders. These sections are
broken-down further into project activities, which is referred to as Rocks. The project activities
are broken-down more into the smallest category – sub-activities, which is identified as
Pebbles. Some scholars [119] illustrate dividing projects in this manner into the mentioned
categories. Table 4-7 shows the wastes observed during the site visits and the maximum
occurrence.
Table 4- 6: Breakdown of the studied road project
Table 4- 7: Wastes occurrence during every sub-activity (Observed and Assumed)

P a g e | 132
Table 4-8 shows the observed frequency of occurrence for each waste and the maximum
number of occurrences. From this, data the percentage of occurrence of each waste was
calculated. These percentages are multiplied by the wastes duration to get the actual duration
time of each activity.
Table 4- 8: Wastes times observed and maximum occurrence percentage
4.8 Process for each waste elimination
Table 4-9 shows the eight wastes that have been observed during the site-visiting period and
their similarities in previous studies. The seventh and eighth wastes could not be found in the
analyzed previous studies, due to their specificity. Meaning, the seventh waste refers to the
paving finisher making two trips to pave the road with asphalt due to the lack of compatibility
between the width of the road and that of the paving finisher. The eighth waste refers to a time

P a g e | 133
gap between the moment when the asphalt was dropped and the time needed by the paving
finisher to pave it resulting from the driver’s rush to drop the asphalt too early.
Table 4- 9: Wastes similarities on previous studies
In the table below, Table 4-10, the tools used to eliminate the different types of wastes are
demonstrated. Reaching the conclusion about which tool is best to use for each of the wastes
is based on the reviewed literature also shown in Table 10. These tools are used to eliminate
the wastes while at the same time applying the main tool; Last Planner System (LPS). By
applying the principles of Last Planner System, which is mainly focusing on eliminating wastes
before starting the required activity, the project efficiency improves. As shown, some wastes
have been merged in the elimination process due to their similar nature that makes them fall
under the same category.
As shown in Table 10, W1, referring to wastes as a result of inspection delays, which come as
a consequence of the lack of collaboration between stakeholders. The tool used to eliminate
this type of waste is Integrated Project Delivery (IPD), as previously explained in the Literature
review. However, it is worth noting that a direct link between inspection delays and IPD could
not be found in the reviewed literature. W2 and W4 were merged because fall under the
category of material transportation related wastes, and accordingly could be addressed using

P a g e | 134
the same tool – Just in Time (JIT). W3, W5 and W6 are all related to mechanical maintenance
problems which result in machinery failure, and hence the same tool can be used to eliminate
them – Total Productive maintenance (TPM). As previously explained, W7 and W8 are too
specific and accordingly the researcher could not find the adequate tools to address them; they
were also not mentioned in previous studies.
Table 4- 10: Wastes modified based on previous studies (By using Lean tools)
4.9 Duration Inputs
In this section, it is intended to deliver the picture of how a real life project activities work in
sequence and where exactly the different types of wastes occur. As shown in the tables 11-29
below, the time average for each sub-activity and the wastes occurring in the middle of
execution (or after) are demonstrated in sequence. This is applied for each of the three
simulations as explained in section 4.3. The sections below are dedicated to explain the
aforementioned inputs in the three simulations. In the first simulation, PM-EW, the maximum
occurrence of wastes is displayed. In the second simulation, PM-OW, the observed wastes are
shown. While in the third simulation, LC, the minimum wastes are demonstrated after applying
Lean Construction tools as explained in the literature review. It is important to note that the
upcoming sections show the inputs data inserted in each simulation, while the results of each
simulation are demonstrated in details in the next chapter
4.9.1 Simulation PM-EW
Tables 4-11 to 4-18 show the time and wastes duration inserted as inputs in the simulation PM-
EW. The wastes durations are inserted where they are expected to most likely occur; within the
time duration of the activity. The inputs are based on the maximum occurrence times of wastes
as explained in section 4.3.3. These durations are represented as random triangle distributions
(ranging with a deviation from the mean value of +-20%, +-10%, +-5% and 0%). Some wastes
are inserted during the sub-activities and others are inserted after the activities depending on

P a g e | 135
where and when they occurred in the observed real life project. The reason why they are
inserted this way is to assure that the simulation reproduces the observed reality on site. The
total quantities of each activity are represented on these tables (the quantity unit is m2). For
example, W4, referring to time wasted during the transportation of the aggregate to the working
area, was observed during the unloading sub-activity. On the other hand, W1, inspection
delays, occurred after the levelling sub-activity in the observed site, and hence was placed in
the same manner in the simulation.
Table 4- 11: Time and wastes duration Simulation PM-EW (Sub-base 1st and 2nd Layers filling with excavation material)
Table 4- 12: Time and wastes duration Simulation PM-EW (Sub-base 3rd and 4th Layers filling with excavation material)

P a g e | 136
Table 4- 13: Time and wastes duration Simulation PM-EW (Sub-base 1st and 2nd Layers filling with outside material)

P a g e | 137
Table 4- 14: Time and wastes duration Simulation PM-EW (Sub-base 3rd and 4th Layers filling with outside material)
Aggregate for the two Layers) stEW (1-Simulation PM: Time and wastes duration 15 -Table 4

P a g e | 138
Table 4- 16: Time and wastes duration Simulation PM-EW (2nd Aggregate and MC activities)
Table 4- 17: Time and wastes duration Simulation PM-EW (1st Asphalt layer and RC activities)
Table 4- 18: Time and wastes duration Simulation PM-EW (2nd Asphalt Layer)

P a g e | 139
4.9.2 Simulation PM-OW
Table 4-19 to table 4-25 show the time and wastes duration inserted as inputs in the simulation
PM-OW. The wastes durations are inserted where they are observed on site visits; within the
time duration of the activity. The inputs are based on the observation time of wastes as
explained in section 4.3.3. These durations are represented as random triangle distributions
(ranging with a deviation from the mean value of +-20%, +-10%, +-5% and 0%). Some wastes
are inserted during the sub-activities and others are inserted after the activities depending on
where and when they occurred in the observed real life project. The reason why they are
inserted this way is to assure that the simulation reproduces the observed reality on site. The
total quantities of each activity are represented on these tables (the quantity unit is m2). For
example, W4, referring to time wasted during the transportation of the aggregate to the working
area, was observed during the unloading sub-activity. On the other hand, W1, inspection
delays, occurred after the levelling sub-activity in the observed site, and hence was placed in
the same manner in the simulation
Table 4- 19: Time and wastes duration Simulation PM-OW (Sub-base 1st and 2nd Layers filling with excavation material)

P a g e | 140
Table 4- 20: Time and wastes duration Simulation PM-OW (Sub-base 3rd and 4th Layers filling with excavation material)
Table 4- 21: Time and wastes duration Simulation PM-OW (Sub-base 1st and 2nd Layers filling with outside material)

P a g e | 141
Table 4- 22: Time and wastes duration Simulation PM-OW (Sub-base 3rd and 4th Layers filling with outside material)
Table 4- 23: Time and wastes duration Simulation PM-OW (1st Aggregate for the two layers)

P a g e | 142
Table 4- 24: Time and wastes duration Simulation PM-OW (2nd Aggregate layer and MC activities)
Asphalt layer, RC activities stOW (1-: Time and wastes duration Simulation PM25 -Table 4)Asphalt layer activities ndand 2

P a g e | 143
4.9.3 Simulation LC
Table 4-26 to table 4-29 show the time and wastes duration inserted as inputs in the simulation
LC. The wastes durations are inserted where they are expected to most likely occur; within the
time duration of the activity. The inputs are based on the application of Lean Construction (LC)
tools as explained in section 4.3.4. These durations are represented as random triangle
distributions (ranging with a deviation from the mean value of +-20%, +-10%, +-5% and 0%).
Table 4- 26: Time and wastes duration Simulation LC (Sub-base for the four layers filling with excavation material)
Table 4- 27: Time and wastes duration Simulation LC (Sub-base for the four layers filling with outside material)

P a g e | 144
Table 4- 28: Time and wastes duration Simulation LC (1st Aggregate two layers, 2nd Aggregate and MC activities)
Asphalt ndAsphalt, RC and 2 st: Time and wastes duration Simulation LC (129 -Table 4activities)
4.10 Conclusion
In this chapter, the data of the studied road project and its use as input in the utilized
simulation software has been explained. The simulation application stands on two main

P a g e | 145
pillars: the input data (time related input – activities and wastes durations – and materials
quantity), and parameters equations. Accordingly, three applications of the simulation were
developed in order to set base for comparative analysis between using PM and LC approaches
in road projects. Hence, two simulations feature applying the PM approach; one running
based on the expected wastes and the other based on the actual observed wastes. The third
simulation only features applying the LC approach. since there is no margin of difference
between the expected and observed wastes in case of applying LC, as a result of wastes
elimination under this approach. In light of the presented work, the following chapter
addresses the results of the simulations, the analysis and implications of such findings.

P a g e | 146
CHAPTER 5 ANALYSIS RESULTS
Introduction
In the previous chapter, the input of the three simulations were explained. This includes the
information that were entered into the simulations regarding the time duration of each sub-
activity and waste (referring to time delays) duration that occurs during each one. In this
chapter, the output that resulted from the simulations is explained, and analysed. The results
displayed include: a) Percentage Plan Complete (PPC); the value that reflects the performance
of each activity with regards to the actual productivity divided by the expected productivity
based on the data collected from the site. b) The results also include Percentage Activity Waste
(PAW); introduced by the researcher to measure the extent to which the time waste duration
affects each activity, by dividing the time waste duration for each by the Total duration of the
same activity as presented below in equations 1, 2, 3 and 4. After demonstrating the mentioned
results, analysis and discussion the implications and significance of the findings are included.
Equation 6:
𝑃𝑟𝑜𝑑𝑢𝑐𝑡𝑖𝑣𝑖𝑡𝑦 𝑜𝑓 𝑎𝑐𝑡𝑖𝑣𝑖𝑡𝑦 𝑖 𝑝𝑒𝑟 𝑤𝑒𝑒𝑘 (𝐴𝑠 𝑜𝑏𝑠𝑒𝑟𝑣𝑒𝑑) 𝑖𝑛 𝑆𝑖𝑚𝑖𝑜 𝑠𝑖𝑚𝑢𝑙𝑎𝑡𝑖𝑜𝑛 [ ] =
[ ] [ ]#
[ ]# ∗ ( )
∗
7 ∗ 6 𝑑𝑎𝑦𝑠/𝑤𝑒𝑒𝑘
# Random values with triangular distribution
: PPC% =7 Equation
( ) ( )∗
( ) ( )
Equation 8: PAW% = ∗
Equation 9: Process efficiency (PE) =
5.2 Results
The results of the road project activities analysis are presented below after applying the three
simulations (Project Management for Expected Wastes PM-EW, Project Management for
Observed Wastes PM-OW and Lean Construction LC). Every simulation is run 600 times to

P a g e | 147
increase the accuracy of the results. These results are summarized in tables 5-3 to 5-10 and
figures 5-2 to 5-33.
In order to reach the most accurate results, the researcher includes four standard deviation
scenarios in each of the three simulations. The scenarios are based on random triangular
distribution, where there is a minimum value, a maximum value and a mean [1], [112], [110],
[175], [286]. In each of these scenarios, different minimum and maximum time duration values
for the activities are introduced with the same mean value. This occurs by increasing the
minimum and maximum values with the same percentage. The last (fourth) one ‘scenario 0%’
represents the values measured on site in the studied road project during the observation period.
The other three scenarios assume gradual increases in the observed minimum and maximum
values by ±5%, ±10% and ±20% while maintaining the same mean value. By doing this, the
PhD candidate intends to be as much inclusive as possible to the potential scenarios that can
occur in real life projects by presenting this wide range of variations in the minimum and
maximum time values. This comes as a result of not being able to cover all the different
variations in values during the site visits which lasted for one month not the whole project.
Accordingly, as aforementioned scenario 0% represent the variation measured on site based on
which the other scenarios are developed. Hence, the results that are based on these scenarios
are as much accurate as possible.
Figure 5- 1: The four scenarios used in the simulations for Unloading sub-activity

P a g e | 148
The following four scenarios were applied to the duration of each activity and waste, as shown
in Figure 5-1; for each scenario the minimum, maximum and mean are displayed. For example
in scenario 5%, the minimum value is 0.751 hours, the maximum value is 1.481 hours and the
mean value is 1.085 hours; the same order of bars applies to the other scenarios. As noted the
mean value in all four scenarios is the same due to the simultaneous increase in the minimum
and maximum values. The figure demonstrates the scenarios for the unloading sub-activity
under the activity sub-base first layer (filling with excavation material).
a) Scenario ±20%; based on the actual measured values introduced in scenario 0%, the
duration values are varied by 20% for the maximum and the minimum (Highest
standard deviation).
b) Scenario ±10%; based on the actual measured values introduced in scenario 0%, the
duration values are varied by 10% for the maximum and the minimum.
c) Scenario ±5%; based on the actual measured values introduced in scenario 0%, the
duration values are varied by 5% for the maximum and the minimum.
d) Scenario 0%: Minimum and maximum time duration values for activities measured
during site visits (lowest standard deviation).
The two main parameters studied are: (i) Percentage Plan Complete (PPC) [217], [85], [66],
[219] and (ii) Percentage Activity Waste (PAW) – created by the PhD candidate. Every activity
is summarised with one table (as shown below in tables 5-3 to 5-10); showing the percentage
of the results of PPC and PAW. These parameters were analysed for each simulation (PM-EW,
PM-OW and LC) based on all four scenarios; as previously explained, the time duration of the
activities introduced in three scenarios are adjusted based on the actual information (values in
the fourth scenario - scenario 0%) and updated with a statistical approach as explained above.
The following graphs (from Figure 5-2 to Figure 5-33) are used to summarise the simulation
of the activities; four graphs for each activity. These graphs include information and their
analysis of (i) PPC and (ii) PAW.
The value of each of the two parameters is separately calculated for each scenario in the
simulation based on which the final Ratio between each scenario and scenario 0% is calculated
as shown in Table 5-1 below. Table 5-1 explains how the Ratio between PPC value for each
scenario and scenario 0% is obtained. Table 5-2 gives an example for calculating the ratio of
the analysed PPC, for the activity Sub-base first layer (filling with excavation material). This
applies to each of the three simulations for the two parameters. The results (ratio) for each

P a g e | 149
parameter (PPC and PAW) are calculated as the result of the value in each scenario over the
value of scenario 0% (of the simulation PM-EW). For example, the value of PPC in simulation
PM-OW, scenario 20% (9.2811%) is divided by the value of PPC in simulation PM-EW,
scenario 0% (9.5654%) to obtain the PPC ratio (0.9703%). Each PPC value in the different
scenarios and different simulations is divided by the same value used in the example (9.5654%)
to analyse the PPC values. The choice of this specific value to use as a denominator in the
process goes back to the fact that it is one of two possible values to occur in reality in the
studied project (the other value is PM-OW, scenario 0%). The chosen value reflects the worst
case of the two values related to the studied project since it refers to the expected wastes.
Table 5- 1: Analysed equation for PPC ratios
Table 5- 2: Sub-base first layer (filling with excavation material) example for analyzed PPC ratios
The studied project activities are eight (the activities are named a and b) under four categories,
the activities are as follows:

P a g e | 150
1. Sub-base Layer
a. Sub-base layers based on filling with excavation material.
b. Sub-base layers based on filling with external material.
2. 1st and 2nd Aggregate Layer
a. First aggregate layers.
b. Second aggregate layer.
3. MC sprinkle and 1st asphalt paving
a. Medium Curing sprinkle (MC).
b. First asphalt paving.
4. RC sprinkle and 2nd asphalt paving
a. Rapid Curing sprinkle (RC).
b. Second asphalt paving.
In the next sections, the detailed results for each of the mentioned activities and sub-activities
are demonstrated. The three parameters’ results (PPC and PAW) are presented for each activity
under each of the three simulations.
In general, the values of PPC are very low because the planned productivity (obtained based
on the site information) are optimistic compared to the actual productivity -observed on the site
visited and are calculated based on the first equation). Additionally the values of PAW (this
variable is created by PhD candidate) are high because the time wastes observed for the
activities are very close in value to the total time of these activities.
5.2.1 Sub-base Layers
Figures 5-2 to 5-9 and Tables 5-3 and 5-4 show the results for the three variables PPC and
PAW on each simulation PM-EW, PM-OW and LC. These values were for the two sub-base
layers activities (filling with excavation material and filling with material from outside).
Sub-base Layers filling with excavation material
The results for the sub-base layer filling with excavation material, concerning PPC and PAW,
are shown in Table 5-3 and Figures 5-2 to 5-5, respectively.
Table 5- 3: PPC and PAW for Sub-base layers filling with excavation material [%]

P a g e | 151
Figure 5- 2: PPC for the sub-base layer filling with excavation material
Figure 5- 3: Analyzed PPC ratio for Sub-base layers filling with excavation material
Figure 5- 4: PAW for Sub-base layers filling with excavation material
07
1421283542495663
±20% ±10% ±5% 0%
PM-EW PM-OW LC
0
20
40
60
80
100
PM-EW PM-OW LC
±20% ±10% ±5% 0%
0
20
40
60
80
100
±20% ±10% ±5% 0%
PM-EW PM-OW LC

P a g e | 152
Figure 5- 5: Analyzed PAW ratio for Sub-base layers filling with excavation material
Sub-base Layers filling with material not from the site
The results for Sub-base layers filling with material that was not available on site, concerning
PPC and PAW, are shown in Table 5-4 and Figures 5-6 to 5-9.
Table 5- 4: PPC and PAW for Sub-base layers filling with material not from the site [%]
Figure 5- 6: PPC for Sub-base layers filling with material not from the site
0.0
0.2
0.4
0.6
0.8
1.0
1.2
PM-EW PM-OW LC
±20% ±10% ±5% 0%
0
30
60
90
120
150
180
±20% ±10% ±5% 0%
PM-EW PM-OW LC

P a g e | 153
Figure 5- 7: Analyzed PPC ratio for Sub-base layers filling with material not from the site
Figure 5- 8: PAW for Sub-base layers filling with material not from the site
Figure 5- 9: Analyzed PAW ratio for Sub-base layers filling with material not from the site
For the sub-base layer activities (filling with excavation material and filling with material not
from the site) and for Simulations PM-OW and PM-EW, the values of PPC are less than 10%
for the first activity and did not reach 17% for the second activity. This is illustrated by the fact
that these two activities have high values of PAW, more than 80% for the first and more than
90% for the second. From these results, it can be seen that the second activity (sub-base layers
filling with material not from the site) has higher values of PPC, however, its PAW values are
also higher. This is due to the fact that the material quantity (166,667 m2) of the second activity
0.0
2.0
4.0
6.0
8.0
10.0
12.0
14.0
PM-EW PM-OW LC
Scen. (±20%) Scen. (±10%) Scen. (±5%) Scen. (0%)
0
15
30
45
60
75
90
105
±20% ±10% ±5% 0%
PM-EW PM-OW LC
0.0
0.2
0.4
0.6
0.8
1.0
1.2
PM-EW PM-OW LC
Scen. (±20%) Scen. (±10%) Scen. (±5%) Scen. (0%)

P a g e | 154
is only 30% of the total material quantity (50,000 m2) of the first one. Moreover, the expected
duration for the second activity is the same as the first activity, based on the planning done by
engineers working on the project. This is regarded as an unrealistic expectation due to the
different quantities of material required for each activity; here the time plan for both activities
is the same despite requiring different material quantities.
Results obtained by the PM approach (PM-OW and PM-EW) are very similar in terms of PPC
because the wastes duration values are almost the same. This can be seen in the results of PAW;
obtained by dividing time waste durations over the actual activity duration. It is essential to
note here that the two mentioned simulations (PM-OW and PM-EW) refer to observed wastes
and expected wastes respectively. The summation of the time waste duration values in these
two simulations is also highly close, which led to an almost similar PAW value for both.
By eliminating the wastes (Non-Value Adding activities, NVA) in the last simulation (LC), the
results of PPC increase and the results of PAW are zero. However, the results of PPC in the
first sub-base activity (filling with excavation material) are between 57.28% and 59.10% while
the results of PPC in the second activity (filling with material not from the site) are between
192.35% and 199.05%.
5.2.2 First and Second Aggregate Layers
Figures 5-10 to 5-17 and Tables 5-5 and 5-6 show the results for the two variables PPC and
PAW in each of the three simulations PM-EW, PM-OW and LC. These values are for the two
activities 1st and 2nd aggregate layer activities.
First Aggregate Layers
The results for 1st aggregate layers, concerning PPC and PAW, are shown in Table 5-5 and
Figures 5-10 to 5-13.
Table 5- 5: PPC and PAW for 1st aggregate layers [%]

P a g e | 155
Figure 5- 10: PPC for 1st aggregate layers
Figure 5- 11: Analyzed PPC ratio for 1st aggregate layers
Figure 5- 12: PAW for 1st aggregate layers
Figure 5- 13: Analyzed PAW ratio for 1st aggregate layers
01836547290
108126144162180198
±20% ±10% ±5% 0%
PM-EW PM-OW LC
0.0
1.0
2.0
3.0
4.0
5.0
6.0
PM-EW PM-OW LC
Scen. (±20%) Scen. (±10%) Scen. (±5%) Scen. (0%)
0
20
40
60
80
100
±20% ±10% ±5% 0%
PM-EW PM-OW LC
0.00.20.40.60.81.0
1.2
PM-EW PM-OW LC
Scen. (±20%) Scen. (±10%) Scen. (±5%) Scen. (0%)

P a g e | 156
Second Aggregate Layer
The results for 2nd aggregate layer, concerning PPC and PAW are shown in Table 5-6 and
Figures 5-14 to 5-17.
Table 5- 6: PPC and PAW for 2nd aggregate layer [%]
Figure 5- 14: PPC for 2nd aggregate layer
Figure 5- 15: Analyzed PPC ratio for 2nd aggregate layer
0255075
100125150175200225250275
±20% ±10% ±5% 0%
PM-EW PM-OW LC
0.0
1.0
2.0
3.0
4.0
5.0
PM-EW PM-OW LC
Scen. (±20%) Scen. (±10%) Scen. (±5%) Scen. (0%)

P a g e | 157
Figure 5- 16: PAW for 2nd aggregate layer
Figure 5- 17: Analyzed PAW ratio for 2nd aggregate layer
For the two aggregate layers (1st and 2nd aggregate layers) similar results were obtained for the
two activities; the values of PPC range between 34.31% and 37.28% for the first activity and
53.24% and 57.26% for the second one, in the two PM simulations. This can be explained by
the fact that these two activities have high PAW values; between 78.81% and 79.61% for first
activity and between 77.02% and 77.88% for second one. From these results, it can be seen
that the second activity (2nd aggregate layers) has higher values of PPC; despite the fact that
the results of PAW are close in the two activities. The reason behind this is that the total
material quantity of the second activity is 70% of the total quantity of the first one. Despite
this, the expected duration for the second activity is same as the first activity. This is regarded
as an unrealistic expectation due to the different quantities of material required for each
activity.
Results obtained in the PM approach (PM-OW and PM-EW) are very similar in terms of PPC
because the wastes duration values are almost the same. This can be seen in the results of PAW;
obtained by dividing time waste durations over the actual activity duration. It is essential to
07
1421283542495663707784
±20% ±10% ±5% 0%
PM-EW PM-OW LC
0.0
0.2
0.4
0.6
0.8
1.0
1.2
PM-EW PM-OW LC
Scen. (±20%) Scen. (±10%) Scen. (±5%) Scen. (0%)

P a g e | 158
note here that the two mentioned simulations (PM-OW and PM-EW) refer to observed wastes
and expected wastes respectively. By eliminating the wastes in the Lean Construction (LC)
simulation, the results of PPC increase and the results of PAW become zero. The results of
PPC is between 169.68% and 175.62% for the first activity and between 240.53% and 248.86%
for the second activity. As noted the values in the LC simulations are high due to the fact that
in the PM simulations, the percentage of wastes in these activities is high, which is not the case
in LC simulations since these wastes are eliminated. It is also worth mentioning that the value
of PAW is high in the PM simulations and is zero in the LC simulations.
5.2.3 MC sprinkle and First asphalt paving
Figures 5-18 to 5-25 and Tables 5-7 and 5-8 show the results of the two variables PPC and
PAW in each of the three simulations PM-EW, PM-OW and LC. These values are for the MC
sprinkle and 1st asphalt paving activities.
MC sprinkle
The results for MC sprinkle, concerning PPC and PAW, are shown in Table 5-7 and Figures
5-18 to 5-21.
Table 5- 7: PPC and PAW for MC sprinkle [%]
Figure 5- 18: PPC for MC sprinkle
0
40
80
120
160
200
240
280
320
±20% ±10% ±5% 0%
PM-EW PM-OW LC

P a g e | 159
Figure 5- 19: Analyzed PPC ratio for MC sprinkle
Figure 5- 20: PAW for MC sprinkle
Figure 5- 21: Analyzed PAW ratio for MC sprinkle
First asphalt paving
The results for 1st asphalt paving, concerning PPC and PAW, are shown in Table 5-8 and
Figures 5-22 to 5-25.
Table 5- 8: PPC and PAW for 1st asphalt paving [%]
0.0
0.5
1.0
1.5
PM-EW PM-OW LC
Scen. (±20%) Scen. (±10%) Scen. (±5%) Scen. (0%)
0
6
12
18
24
30
36
±20% ±10% ±5% 0%
PM-EW PM-OW LC
0.00.20.40.60.81.01.2
PM-EW PM-OW LC
Scen. (±20%) Scen. (±10%) Scen. (±5%) Scen. (0%)

P a g e | 160
Figure 5- 22: PPC for 1st asphalt paving
Figure 5- 23: Analyzed PPC ratio for 1st asphalt paving
Figure 5- 24: PAW for 1st asphalt paving
0
30
60
90
120
±20% ±10% ±5% 0%
PM-EW PM-OW LC
0.0
0.5
1.0
1.5
PM-EW PM-OW LC
Scen. (±20%) Scen. (±10%) Scen. (±5%) Scen. (0%)
0
5
10
15
20
25
30
±20% ±10% ±5% 0%
PM-EW PM-OW LC

P a g e | 161
Figure 5- 25: Analyzed PAW ratio for 1st asphalt paving
Regarding the two activities, MC sprinkle and First asphalt paving, as all other activities they
were applied in Simulations PM-OW, PM-EW and LC. The results of PPC for MC sprinkle
are very high before and after reducing the wastes. This is the case because the expected
duration for this activity is much higher than the actual duration. While for the other activity,
First asphalt paving, the PPC results are between 65.58% and 69.84% in the simulations PM-
EW, between 79.61% and 83.90% in the simulations PM-OW and between 92.94% and
97.92% in the simulations LC. For the first two simulations (PM-OW and PM-EW), the results
of PPC are between 65.58% and 83.90%, which is regarded as a high value, due to the fact that
the percentage of wastes is low. It is also worth mentioning that the value of PAW is high in
the PM simulations and is between 10.18% and 10.69% in the LC simulations. For the
simulation LC, the results of PPC for the First asphalt paving activity increased to become
between 92.94% and 97.92%. As noted the values in the LC simulations are high due to the
fact that in the PM simulations, the percentage of wastes in these activities is high, which is not
the case in LC simulations since these wastes are reduced.
5.2.4 RC sprinkle and Second asphalt paving
Figures 5-26 to 5-33 and Tables 5-9 and 5-10 show the results for the two variables PPC, PAW
and on each simulation PM-EW, PM-OW and LC. These values were for the RC sprinkle and
2nd asphalt paving activities.
RC sprinkle
The results for RC sprinkle, concerning PPC and PAW, are shown in Table 5-9 and Figures 5-
26 to 5-29.
Table 5- 9: PPC and PAW for RC sprinkle [%]
0.0
0.2
0.4
0.6
0.8
1.0
1.2
PM-EW PM-OW LC
Scen. (±20%) Scen. (±10%) Scen. (±5%) Scen. (0%)

P a g e | 162
Figure 5- 26: PPC for RC sprinkle
Figure 5- 27: Analyzed PPC ratio for RC sprinkle
Figure 5- 28: PAW for RC sprinkle
0306090
120150180210
±20% ±10% ±5% 0%
PM-EW PM-OW LC
0.0
0.5
1.0
1.5
PM-EW PM-OW LC
Scen. (±20%) Scen. (±10%) Scen. (±5%) Scen. (0%)
0369
1215182124
±20% ±10% ±5% 0%
PM-EW PM-OW LC

P a g e | 163
Figure 5- 29: Analyzed PAW ratio for RC sprinkle
Second asphalt paving
The results for 2nd asphalt paving, concerning PPC and PAW, are shown in Tables 5-10 and
Figures 5-30 to 5-33.
Table 5- 10: PPC and PAW for 2nd asphalt paving [%]
Figure 5- 30: PPC for 2nd asphalt paving
Figure 5- 31: Analyzed PPC ratio for 2nd asphalt paving
0.00.20.40.60.81.01.2
PM-EW PM-OW LC
Scen. (±20%) Scen. (±10%) Scen. (±5%) Scen. (0%)
0
10
20
30
40
50
60
±20% ±10% ±5% 0%
PM-EW PM-OW LC
0.0
0.5
1.0
1.5
PM-EW PM-OW LC
Scen. (±20%) Scen. (±10%) Scen. (±5%) Scen. (0%)

P a g e | 164
Figure 5- 32: PAW for 2nd asphalt paving
Figure 5- 33: Analyzed PAW ratio for 2nd asphalt paving
Regarding the RC sprinkle and Second asphalt paving activities, when applied in the
Simulations PM-OW, PM-EW and LC, similar results analysis emerged. The results of PPC
for RC sprinkle is very high before and after reducing the wastes. This is due to the fact that
the expected duration (duration values estimated by engineers on site) for this activity is much
higher than the actual duration. While for the other activity, Second asphalt paving, PPC results
are between 45.32% and 47.78% in the simulation PM-OW, between 39.92% and 42.37% in
the simulation PM-EW and between 49.86% and 52.39% in the simulation LC. For the first
three simulations, PM-EW, PM-OW and LC, the results of PPC are lower than 50% because
the expected duration for this activity was very low. There is not high improvement after
reducing some wastes in the Second asphalt paving; however, more improvement could be
noted after reducing the same wastes in the First asphalt paving. The reason behind this is that
the First asphalt paving’s total material quantity is lower by 60% of the Second asphalt paving’s
total quantity. However, the First asphalt paving’s expected duration is 110% more than the
Second asphalt paving’s expected duration. This is regarded as an unrealistic expectation due
to the different quantities of material required for each activity; here the time plan for the
0
5
10
15
20
25
30
±20% ±10% ±5% 0%
PM-EW PM-OW LC
0.0
0.2
0.4
0.6
0.8
1.0
1.2
PM-EW PM-OW LC
Scen. (±20%) Scen. (±10%) Scen. (±5%) Scen. (0%)

P a g e | 165
activity (First asphalt paving) with less material is higher than the activity (Second asphalt
paving) with more material.
5.3 Analysis
Scholars [284], [25], [136], [39], [48], [62], [251], [95] identified the results of Percentage Plan
Complete (PPC) explaining the schedule performance. Higher values of PPC means higher
productivity. For example, as shown in the findings, in Sub-base layers filling with material
that were not from the site the PPC values in LC simulation increased between 192.35% to
199.05%, reflecting higher values than those in the PM simulation. It was stated that [103],
[278], [139], [142], [129], [277], [236], [111], [121], [173], [147] the main aim for Lean
Construction is avoiding wastes which lead to reducing the activity duration. In the first
aggregate layers activity, after eliminating the wastes, the values of PPC increased between
169.68% to 175.62% in LC simulation. Additionally, the PAW in this activity ranges between
78.81% to 79.76% in the two PM simulations. This means, as scholars agree, that Lean
Construction (LC) improves the process of eliminating the wastes from construction projects,
which leads to increase in the productivity of each activity [103], [278], [139], [142], [129],
[277], [236], [111], [121], [173], [147]. These improvements are shown in the values of PPC
and PAW in all the studied project activities. Applied to all activities, the values of PPC in the
LC simulation are higher than the PPC values in the PM simulations as demonstrated in the
results. In contrast, the values of PAW in the LC simulation are lower than the PAW values in
the PM simulations. The elimination of the wastes from the activity increases the values of
PPC. This also results in a reduction of the final project duration. Consequently, the customer
satisfaction increases as a result of reduced costs, higher quality and shorter total duration. The
application of Lean Construction (LC) is based on the utilization of the lean tools (such as Last
Planner System (LPS), Integrated Project Delivery (IPD), Total Productive Maintenance
(TPM), etc.; the Lean Construction (LC) tools used in the study). These tools are used under
Last Planner System (LPS), which is considered as a shield saving the project duration from
the delays when used together with other tools. In other words, the reason behind the
improvements in Lean Construction (LC) is its advanced tools which lead to overall
improvements in time, cost and quality, [103], [278], [139], [142], [129], [277], [236], [111],
[121], [173], [147], [284], [25], [136], [39], [48], [62], [251], [95], [1], [191], [196], [201], [2].
The results of PPC are calculated by using the Last Planner System (LPS) in the end of every
week during the project execution. Additionally, the PhD candidate present a new variable –

P a g e | 166
PAW- which can be used in real projects to determine the time wasted in each activity. The
PAW values can be calculated with PPC values at the end of each week.
5.4 Conclusion: Implications and Significance of the Findings
The main objective of conducting this case study and applying the input to the utilized
simulation software is to highlight the merits of using the Lean Construction approach in
road projects. The research focuses on one of the iron triangle sides; time, regarded as
highly impactful on the other two; quality and cost. After running the three different
simulations, findings reveal how using Lean tools has a positive influence over time
planning in road projects. This has been demonstrated through focusing on the results of
the two parameters; PPC and PAW.
The Rationale behind reflecting the results through these two parameters is how each
relates to time planning of the different activities and sub-activities in the project.
Percentage Plan Complete (PPC), on a weekly basis, reflects the efficiency of
accomplishing each activity, productivity wise. In other words, it examines the accuracy
of a time plan and its ability to detect potential wastes and eliminate them as stipulated by
the Lean Construction approach. Percentage Activity Wastes (PAW), a parameter
introduced by the researcher, which aims at detecting the percentage of time wasted during
each activity. Through this parameter the effect of time wastes on the productivity in each
activity is revealed. Hence, based on the findings demonstrated, the results of the two
parameters support the essentiality of eliminating time wastes in order for productivity and
efficiency to improve. Lean Construction emphasises on accurate planning of a project
time schedule, mainly based on the elimination of wastes through utilizing specified Lean
tools.
Running three different simulations gave the researcher a comparative view between
Project Management and Lean Construction approaches in light of the observed road
project. The results from the simulation PM-EW is regarded as the poorest when judging
time planning. This comes as a result of the findings showing PPC at its lowest levels in
all activities, while PAW values are at their highest levels. Moderate values resulted from
the simulation PM-OW, since the wastes in this simulation are less than the wastes in PM-
EW, leading to better results when it comes to PPC (higher) and PAW (lower). Findings
show that the simulation LC achieves the best results when it comes to values of the two
parameters; PPC reaching its highest value with PAW reaching its lowest values. In light

P a g e | 167
of the wastes observed on site, and based on the reviewed literature, the researcher
highlights Lean Construction tools - IPD, JIT and TPM – each tackling different types of
wastes leading to their elimination. Hence, the findings from the simulation LC support
these results.
Findings of this study support the statement that applying Lean Construction approach to
road projects leads to tangible improvements in time planning. This is attained through
addressing the root cause of the problem, in these case delays, by eliminating time wastes.
The significance of this approach of management lies in its ability to predict the problem
and avoid it through innovative tools designed specifically to address the different types
of wastes. Applying this to the day-to-day site activities in road projects, boosting
productivity and efficiency, reflects on the final result; the total project duration.

P a g e | 168
CHAPTER 4 CONCLUSION
6.1 Introduction
During the literature review phase, the PhD candidate was not able to find any comparison
between Project Management (PM) approach and Lean Construction (LC) in an infrastructure
project in previous studies. Accordingly, it is regarded as a research gap in the field addressing
these topics. The aim of this research is exploring how different/similar PM and LC are when
specifically applied to road projects, with the attempt to contribute to filling the research gap
in this area. In this chapter the main conclusions of the research are presented through the
summary of research findings. This is followed by displaying the most important contributions
of this research to the academic body of knowledge and the construction industry. Accordingly,
recommendations for the industry and for future studies are presented. Limitations of the study
are also presented.
Summary of research findings
Highlighting the merits of applying the Lean Construction approach in road projects has been
one of the main objectives of conducting the case study in this research. Based on the reviewed
literature, the study put forward the hypothesis that the application of Lean Construction (LC)
improves the overall performance in road projects. The research focuses on one of the iron
triangle sides; time, regarded as highly impactful on the other two; quality and cost. After
running the three different simulations, findings support the research hypothesis by revealing
how using Lean tools has a positive influence over time planning in road projects. It is essential
to mention that the simulations input is based on data collected from the observed road project.
The research hypothesis was tested through focusing on results from the two parameters; PPC
and PAW.
The simulation application stands on two main pillars: the input data (time related input –
activities and wastes durations – and materials quantity), and parameters equations.
Accordingly, three applications of the simulation were developed in order to set base for
comparative analysis between using PM and LC approaches in road projects. Hence, two
simulations feature applying the PM approach; one running based on the expected wastes and
the other based on the actual observed wastes. The third simulation only features applying the
LC approach, since there is no margin of difference between the expected and observed wastes
in case of applying LC, as a result of wastes elimination under this approach.

P a g e | 169
The rationale behind reflecting the results through these two parameters is how each one relates
to time planning of the different activities and sub-activities in the project. Percentage Plan
Complete (PPC), on a weekly basis, reflects the efficiency of accomplishing each activity,
productivity wise. In other words, it examines the accuracy of a time plan and its ability to
detect potential wastes and eliminate them as stipulated by the Lean Construction approach.
Percentage Activity Wastes (PAW), a parameter introduced by the researcher, which aims at
detecting the percentage of time wasted during each activity. Through this parameter the effect
of time wastes on the productivity in each activity is revealed.
Hence, based on the findings demonstrated, the results of the PPC and the PAW support the
essentiality of eliminating time wastes in order for productivity and efficiency to improve. Lean
Construction emphasises on accurate planning of a project time schedule, mainly based on the
elimination of wastes through utilizing specified Lean tools.
Running three different simulations gave the researcher a comparative view between Project
Management and Lean Construction approaches in light of the observed road project. The
results from the simulation PM-EW are regarded as the poorest when judging time planning.
This comes as a result of the findings showing PPC at its lowest levels in all activities, while
PAW is at the highest levels. Moderate values resulted from the simulation PM-OW, since the
wastes in this simulation are less than the wastes in PM-EW, leading to better results when it
comes to PPC (higher) and PAW (lower). Findings show that the simulation LC achieves the
best results when it comes to values of the two parameters; PPC reaching its highest value with
PAW reaching its lowest values. In light of the wastes observed on site, and based on the
reviewed literature, the researcher highlights Lean Construction tools - IPD, JIT and TPM –
each tackling different types of wastes leading to their elimination. Hence, the findings from
the simulation LC support these results.
Findings of this study support the statement that applying Lean Construction approach to road
projects leads to tangible improvements in time planning. This is attained through addressing
the root cause of the problem, in this case delays, by eliminating time wastes. The significance
of this approach of management lies in its ability to predict the problem and avoid it through
innovative tools designed specifically to address the different types of wastes. Applying this to
the day to day site activities in road projects, boosting productivity and efficiency, reflects on
the final result; the total project duration.

P a g e | 170
Project Management (PM) approach focuses on analysing the risks that can take place in the
construction projects. An example of these risks is the delay in the project duration. These risks
are not the root of the problem, while the main issue is the huge number of different time
wastes, eventually leading to the risks. Hence, eliminating these wastes will consequently
eliminate the risks. The Project Management approach does provide the tools to analyse
potential risks like project delay, however it does not address the root causes of such risks; the
time wastes. Although, scholars [233], [271] emphasize that a project will be successful by
managing the projects' risks, still the quantitative risk analysis is rarely developed in many
construction projects. The reason behind this is that in order to conduct such analysis,
experience and data from previous projects is necessary, which is unfortunately not available
in many instances. Three main arguments all related to risk emerged from the PM literature
analysis; how the PM approaches risk analysis, time management and stakeholders’
collaboration.
The first and most importance argument for the purpose of this study, is related to the PM not
addressing the root causes of risks in real life projects as elaboratively explained in Chapter 2.
Scholars [263], [151], [23], [164], [287] agree that, thanks to the fact that it is nearly impossible
to find two similar construction projects, the construction industry has a higher number of risks
than other industries. The second argument is concerned with the time management tool the
Project Management (PM) approach; Critical Path Method (CPM). This tool helps in managing
risks through using time buffers for the different activities on the project as explained before.
It is essential to highlight that in the planning phase risks are a possibility that might or might
not occur. This means that introducing buffers to the different activities result in time wastes
in case that the anticipated risks did not occur. The third argument is concerned with lack of
stakeholders collaboration under the PM approach. As a result of this lack of collaboration, risk
transfer is resorted to; transferring the responsibility of risk occurrence from one stakeholder
to another as elaboratively explained in Chapter 2. These arguments are further explicated in
the empirical part of the study through the case study observed through a real life project as
presented.
On the other hand, Lean Construction (LC) is regarded as a vital addition to the field as a
potential solution to the many problems faced by construction projects. These problems
eventually lead to an increase in the project’s total cost and final duration, accompanied by a
decrease in the quality and productivity of the project activities. Lean Construction (LC) targets
to eliminate the project waste and deliver the maximum value to the customer with the best

P a g e | 171
quality. This relatively new management concept requires the simultaneous use of Lean tools.
Applying only one or two of these tools in the project means partial application of Lean
Construction and may lead to the failure of the project. As demonstrated by this study’s
findings, Lean Construction seeks to propose solutions that minimize the final duration and
increase the productivity of road projects by implementing the relevant Lean tools.
If Project Management (PM) approach is considered as an eye studying the construction project
from a high point, then Lean Construction (LC) is regarded as an advanced lens that provide a
far more accurate perspective.
6.3 Contribution and future recommendations
As aforementioned, this study is regarded as a contribution to the body of knowledge,
considering that it presents a comparison between the PM approach and LC approach when
applied to road projects. Based on the reviewed literature such comparative analysis, focusing
on road projects is missing. A new variable, Percentage Activity Waste (PAW) is introduced
in this study aiming at measuring the wastes duration in each activity in the project.
Accordingly, the study invites academics and those in the industry of construction to consider
project planning from a different perspective focusing on addressing root causes of the problem
rather than only anticipating risks. Two conference papers were presented and published from
this study (Elkherbawy, Lozano, Ramos & Turmo, 2018a1, Elkherbawy, Lozano, Ramos &
Turmo, 2018b2)
In light of the presented findings which support the positive impact of applying LC approach
on time planning, the following recommendations are put forward:
- Future studies:
This study addresses time as one of three most essential factors in any project. Due to time
limitation, the PhD candidate could not include cost and quality in the study. Accordingly,
addressing these factors in a comparison between PM and LC approach is recommended for
future research. As the case is with time, there are obstacles that stand in the way of efficiently
planning for cost and quality in construction projects under the PM approach. Hence,
investigating the impact of applying LC is important.
1 ELKHERBAWY, A., LOZANO, J. A., RAMOS, G., & TURMO, J. (2018). Comparison of project management and lean construction in a real road project. 2 ELKHERBAWY, A., LOZANO, J. A., RAMOS, G., & TURMO, J. (2018). Lean construction in road projects.

P a g e | 172
Further, the study develops the comparison between the two approaches (PM and LC) when
applied on road projects. Research investigating this comparison in other types of construction
project needs to be developed.
- Industry recommendations
As previously highlighted, among the obstacles of integrating LC to construction projects is
the fear of change and lack of knowledge. Accordingly, it is essential to:
conduct LC orientation and training programs to the policy and decision makers in order
to spread knowledge about the approach
shed light on best practices; projects that successfully applied LC to motivate the
stakeholders to adopt it
position LC as an innovative method of project planning that results in higher efficiency
and productivity
6.4 Research limitations
- As aforementioned due to time limitation, the PhD candidate could not include cost and
quality in the study. Integrating them to study requires a longer investigation period.
- Some activities in the studied project (such as MC, RC sprinkles and 2nd Asphalt layers)
were not observed. The reason for that is the fact that some activities were scheduled
for the far future (after the observation period, which lasted for 30 days), and others
were executed in times that were not convenient for the PhD candidate to attend.
- Last Planner System (LPS) tool was used only theoretically – based on literature - in
the study’s simulations due to time limitation. Results might differ with real
implementation.
6.5 Conclusion
This research supports and demonstrates that the application of lean concept on infrastructure
road projects decreases the project duration, increases productivity and decreases the
percentage of the waste duration. These improvements eventually lead to an increased
reliability between project stakeholders, resulting in customer satisfaction with the results
regarding the project duration.
Concerned with addressing the root causes of the problem, the PhD candidate introduced a new
variable as previously mentioned; Percentage Activity Waste (PAW) is introduced in this study

P a g e | 173
aiming at measuring the waste duration in each activity in the project. As demonstrated, PAW
can be used in future studies for its utility in reflecting the waste percentage by dividing the
time wasted in an activity by the Total duration of the activity, and hence extracting the wasted
time. This variable meets the main aim of lean concept; the elimination of wastes. PAW is an
effective parameter to use on a weekly basis of assess the percentage of wastes.

P a g e | 174
Bibliography
1. Abbasian-Hosseini, S., Nikakhtar, A., & Ghoddousi, P. (2014). Verification of Lean
Construction Benefits through Simulation Modeling: A Case Study of Bricklaying
Process. Civil Engineering, 18(5), 1248-1260.
2. Adamu, I., & Howell, G. (2012). Applying Last Planner in the Nigerian construction
industry. Twentieth Annual Conference of the International Group for Lean
Construction (IGLC-20), 2, 731-740. San Diego, California.
3. Adamu, S., & Adulhamid, R. (2016). Lean Construction Techniques for Transforming
Nigeria Project Delivery Process - A Case Study Report. Indian Journal of Science and
Technology, 9(48), 1-4.
4. Adekunle, O., & Ajibola, K. (2015). Factorial Causative Assesments and Effects of
Building Construction Project Delays in Osun State, Nigeria, 4(3), 1-8. Journal
Architectural Engineering Technology.
5. Adio-Moses, D., & Asaolu, O. (2016). Artificial intelligence for sustainable
development of intelligent buildings, 446-454. 9th cidb Postgraduate Conference. Cape
Town, South Africa.
6. Adio-Moses, D., & Oladiran, O. (2016). Smart City Strategy and sustainable
Development Goals for building Construction Framework in Lagos, 1(1). The 5th
International Conference on Infrastructure Development in Africa.
7. Adnan, H., Bachik, F., Supardi, A., & Marhani, M. (2012). Success Factors of Design
and Build Projects in Public Universities. Asia Pacific International Conference on
Environment-Behaviour Studies, 35, (pp. 170 – 179).
8. Adnan, H., Hashim, N., Marhani, M., & Johari, M. (2013). Project Management
Success for Contractors, 7(2), 398-402. International Journal of Economics and
Management Engineering.
9. Adnan, H., Yusuwan, N., Yusof, F., & Bachik, F. (2014). Critical Success Factors for
Contractors, 2(2), 107-113. International Journal of Engineering and Technical
Research.

P a g e | 175
10. Agyeman, S., Asare, E., & Ankomah, E. (2016). The Effects of Design Information on
Reliability of Progress and Cost Estimates of Construction Projects: The Case of Two
Civil Engineering Projects. American Journal of Civil Engineering, 4(6), 326-336.
11. Ahmed, M., Georgy, M., & Osman, H. (2014). Ontology-based Investigation of
Construction Delay Analysis Methodologies in Egypt, 1428-1437. Construction
Research Congress.
12. Ahuja, R., Sawhney, A., & Arif, M. (2016). Driving lean and green project outcomes
using BIM: A qualitative comparative analysis, (6)1, 69-80. International Journal of
Sustainable Built Environment.
13. Al Hattab, M., & Hamzeh, F. (2015). Using social network theory and simulation to
compare traditionalversus BIM–lean practice for design error management.
Automation in Construction, 52, 59–69.
14. Al Nasseri, H., & Aulin, R. (2016). Understanding Management Roles and
Organisational Behaviours in Planning and Scheduling Based on Construction Projects
in Oman. Journal of Construction in Developing Countries, 21(1), 1–18.
15. Al-Aomar, R. (2012a). A lean construction framework with Six Sigma rating.
International Journal of Lean Six Sigma, 3(4), 299 - 314.
16. Al-Aomar, R. (2012b). Analysis of lean construction practices at Abu Dhabi
construction industry, 105-121. Lean Construction Journal.
17. Alashwal, A., Abdul-Rahman, H., & Radzi, J. (2016). Knowledge Utilization Process
in Highway Construction Projects, 32(4), 05016006. Journal of Management in
Engineering.
18. Albogamy, A., Scott, D., & Dawood, N. (2013). Dilemma of Saudi Arabian
Construction Industry, 3(4), 35-40. Journal of Construction Engineering and Project
Management.
19. Albogamy, A., Scott, D., Dawood, N., & Bekr, G. (2013). Addressing crucial risk
factors in the Middle East construction industries: a comparative study of Saudi Arabia
and Jordan, 118-128. Sustainable Building Conference.

P a g e | 176
20. Almuharib, T. (2014). Service Quality Improvement Through Lean Management at
King Khalid International Airport in Saudi Arabia. PhD thesis.
21. Alptekin, O., & Alptekin, N. (2017). Analysis of Criteria Influencing Contractor
Selection Using TOPSIS Method, 245(6), 062003. IOP Conference Series: Materials
Science and Engineering.
22. Alsendi, M. (2015). Studying the effect of decision making on delayed construction
projects. Master thesis.
23. Aminbakhsh, S., Gunduz, M., & Sonmez, R. (2013). Safety risk assessment using
analytic hierarchy process (AHP) during planning and budgeting of construction
projects. Journal of Safety Research, 46, 99–105.
24. Andesen, B., Belay, A., & Seim, E. (2012). Lean construction practices and its effects:
A case study, Norway. Lean construction journal, 122-149.
25. Andreu, G. (2016). Del Lean Thinking a la Lean Construction. Estudi de la filosofia i
aplicació a un projecte constructiu. Bachelor thesis. Barcelona, Spain.
26. Anifowose, M., Ola-awo, W., & Mohammed, T. (2013). Assessment of Cost
Management Functions of Quantity Surveyors with Lean Methodology, 4(2), 67-81.
International Journal of Sustainable Construction Engineering & Technology.
27. Ankomah, E., Ayarkwa, J., & Agyekum, K. (2017). A theoretical review of lean
implementation within construction SMEs. International conference on infrastructure
development in Africa 7(1), (pp. 1675-1688). Kumasi, Ghana.
28. Ansah, R., Sorooshian, S., Mustafa, S., & Duvvuru, G. (2016a). Advancing Towards
Delay-Free Construction Project: A Review. International Conference on Industrial
Engineering and Operations Management, 744-751. Michigan, USA.
29. Ansah, R., Sorooshian, S., Mustafa, S., & Duvvuru, G. (2016b). Lean Construction
Tools. International Conference on Industrial Engineering and Operations
Management, (pp. 784-793). Michigan.
30. Arditi, D., Nayak, S., & Damci, A. (2017). Effect of organizational culture on delay in
construction. International Journal of Project Management, 35(2), 136–147.

P a g e | 177
31. Arroyo, P., & Gonzalez, V. (2016). Rethinking Waste Definition to Account for
Environmental and Social Impacts. The 24th Annual Conference of the International
Group for Lean Construction, (pp. 13-22). Boston, USA.
32. Artto, K., Ahola, T., & Vartiainen, V. (2015). From the front end of projects to the back
end of operations: Managing projects for value creation throughout the system
lifecycle, 34(2), 258-270. International Journal of Project Management.
33. Asim, M., Deep, S., & Ahmad, S. (2017). Time Impact Study of Real Estate Sector
Construction Projects Post Application of Lean Principles for Delay Resolutions.
International Journal of Civil Engineering and Technology, 8(2), (pp. 89–99).
34. Asri, M., Nawi, M., Saad, R., Osman, W., & Anuar, H. (2016). Exploring lean
construction component for Malaysian industrialized building system logistics
management—A literature review. Advanced Science Letters, 22(5/6), 1593-1596.
35. Ayalew, M., Dakhli, M., & Lafhaj, Z. (2016). The future of lean construction in
Ethiopian construction industry, 5(2), 107-113. International Journal of Engineering
Research & Technology.
36. Ayarkwa, J., Agyekum, K., Adinyira, E., & Osei-Asibey, D. (2012). Perspectives for
the implementation of Lean Construction in the Ghanaian construction industry, 2(2),
345-359. Construction Project Management and Innovation.
37. Azhar, N., Kang, Y., & Ahmad, I. (2015). Critical Look into the Relationship between
Information and Communication Technology and Integrated Project Delivery in Public
Sector Construction, 31(5), 04014091. Management in Engineering.
38. Aziz, R., & Abdel-Hakam, A. (2016). Exploring delay causes of road construction
projects in Egypt. Alexandria Engineering Journal, 55, 1515–1539.
39. Aziz, R., & Hafez, S. (2013). Applying lean thinking in construction and performance
improvement. Alexandria Engineering Journal, 52, 679–695.
40. Bajjou, M., Chafi, A., Ennadi, A., & El Hammoumi, M. (2017). The Practical
Relationships between Lean Construction Tools and Sustainable Development: A
literature review. Journal of Engineering Science and Technology, 10(4), 170-177.

P a g e | 178
41. Baladrón, C., & Alarcón, L. (2017). Assessing the Impact of Lean Methods in Mining
Development Projects. The 25th Annual Conference of the International Group, 2, (pp.
137–144). Heraklion, Greece.
42. Balashova, E., & Gromova, E. (2017). Lean construction as an effective organization
model in Arctic, 117, 00011. Theoretical Foundation of Civil Engineering.
43. Baroudi, B. (2014). Designing Postgraduate Project Management Programs for
Success. Th fifth International Conference on Engineering, Project, and Production
Management, (pp. 105-115). Port Elizabeth, South Africa.
44. Batool, A., & Abbas, F. (2017). Reasons for delay in selected hydro-power projects in
Khyber Pakhtunkhwa (KPK), Pakistan. Renewable and Sustainable Energy Reviews,
73, 196–204.
45. Becker, T., Shane, J., & Jalselskis, E. (2012). Comparative Analysis of Lean
Construction with Design-Build Using a Framework of Contractual Forms of
Agreement. Journal of architectural engineering, 18(2), 187-191.
46. Bekdik, B., Hall, D., & Aslesen, S. (2016). Off-Site Prefabrication: What Does It
Require from the Trade Contractor? 24th Ann. Conf. of the Int’l. Group for Lean
Construction, (pp. 43–52). Boston, MA, USA.
47. Berroir, F., Harbouche, L., & Boton, C. (2015). Top down vs. Bottom up approaches
regarding the implementation of lean construction through a French case study. 23rd
Ann. Conf. of the Int’l. implementation of lean construction through a French case
study. (pp. 29-31). Perth, Australia,: Research Gate.
48. Bhatla, A., & Leite, F. (2012). Integration Framework of Bim with the Last Planner
System. The 20th Annual Conference of the International Group for Lean Construction.
49. Bodkhe, A., Waghamare, A., & Patil, S. (2017). Investigation and Minimization of
Construction Wastage Using Lean Technology in Construction . International Research
Journal of Engineering and Technology (IRJET), 4(5), 2408-2412.
50. Bolzan, W., Formoso, C., & Tzortzopoulos, P. (2017). Planning and controlling design
in engineered-to-order prefabricated building systems, 25(2), 134-152. Engineering,
Construction and Architectural Management.

P a g e | 179
51. Brady, D. (2014). Using visual management to improve transparency in planning and
control in construction. PhD thesis.
52. Braimah, N. (2013). Construction delay analysis techniques—A review of application
issues and improvement needs. Building, 3, 506-531.
53. Brioso, X., & Humero, A. (2016). Incorporating Lean Construction agent into the
Building Standards: Act the Spanish case study, 8(1), 1511-1517. Organization,
Technology and Management in Construction.
54. Brioso, X., Humero, A., Murguia, D., Corrales, J., & Aranda, J. (2017). Using post-
occupancy evaluation of housing projects to generate value for municipal governments,
57(2), 885-896. Alexandria Engineering Journal.
55. Burger, M. (2013). Project management in the built environment: the need for industry
specific knowledge. PhD thesis.
56. Chedas Fàbregas, A. (2012). To Introduce the Lean Management philosophy as a way
of thinking and acting to minimize waste in planning, organization and implementation
processes, focusing in basic building constructions. Master thesis. Barcelona, Spain:
Universitat Politècnica de Catalunya.
57. Chiarini, A. (2014). Sustainable manufacturing-greening processes using specific Lean
Production tools: an empirical observation from European motorcycle component
manufacturers85, 226-233. Cleaner Production.
58. Chiu, B., & Lai, J. (2017). Project delay: key electrical construction factors in Hong
Kong, 23(7), 847-857. Journal of Civil Engineering and Management, 847–857.
59. Chowdhury, M. (2016). Simulation Of Value Stream Mapping And Discrete
Optimization Of Energy Consumption In Modular Construction. Master thesis.
60. Cristóba, J. (2014). Cost allocation between activities that have caused delays in a
project using game theory. International Conference on Project Management, 16, (pp.
1017 – 1026).
61. Cserháti, G., & Szabó, L. (2014). The relationship between success criteria and success
factors in organisational event projects. International Journal of Project Management,
32(4), 613–624.

P a g e | 180
62. Ćwik, K., & Rosłon, J. (2017). Last planner system in construction, 117, 00032.
Theoretical Foundation of Civil Engineering.
63. Daniel, E., & Pasquire, C. (2017). Last Planner System Path Clearing Approach (LPS-
PCA): an approach to guide; clients, main contractors and subcontractors in the
implementation of the LPS. Nottingham, UK: Nottingham Trent University.
64. Daniel, E., Pasquire, C., & Ameh, O. (2014). The magic of the Last Planner® System
for Nigerian construction, 605-616. The 20th Annual Conference of the International
Group on Lean Construction. Oslo, Norway.
65. Daniel, E., Pasquire, C., & Dickens, G. (2015). Exploring the implementation of the
Last Planner® System. The 20th Annual Conference of the International Group on Lean
Construction, (pp. 153-162). Perth, Australia.
66. Dave, B. (2013). Developing a construction management system based on Lean
Construction and Building Information Modelling. PhD thesis.
67. Dave, B., Hämäläinen, J.-P., & Koskela, L. (2015). Exploring the Recurrent Problems
in the Last Planner Implementation on Construction Projects. Proceedings of the Indian
Lean Construction Conference (ILCC 2015).
68. Desai, M., & Dhawale, A. (2017). Review of application of Six Sigma in the
construction industry. International Journal of Engineering Sciences & Research
Technology.
69. Dias, M., Tereso, A., Braga, A., & Fernandes, A. (2014). The Key Project Managers’
Competences for Different Types of Projects, 1, 359-368. New Perspectives in
Information Systems and Technologies.
70. Dinesh, S., Sethuraman, R., & Sivaprakasam, S. (2017). The review on Lean
Construction an effective approach in construction industry, 119-123. International
Journal of Engineering Research and Modern Education.
71. Ding, Z., Zuo, J., Wu, J., & Wang, J. (2015). Key factors for the BIM adoption by
architects: a China study, 22(6), 732-748. Engineering, Construction and Architectural
Management.

P a g e | 181
72. Dinis-Carvalho, J., & Fernandes, S. (2016). Student´ s role in the Implementation of a
Lean Teaching and Learning Model, 6, 284-293. 8th International Symposium on
Project Approaches in Engineering Education (PAEE) and 14th Active Learning in
Engineering Education Workshop (ALE). Guimarães: Project Approaches in
Engineering Education Association and Department of Production and Systems, School
of Engineering of University of Minho.
73. Dixit, S., Mandal, S., Sawhney, A., & Singh, S. (2017). Area of Linkage Between Lean
Construction and Sustainability in Indian Construction Industry, 8(8), 623-636.
International Journal of Civil Engineering and Technology (IJCIET).
74. Doloi, H. (2013). Cost Overruns and Failure in Project Management: Understanding
the Roles of Key Stakeholders in Construction Projects. Journal of Management in
Engineering, 139(3), 267-279.
75. Doloi, H., Sawhney, A., Iyer, K., & Rentala, S. (2012). Analysing factors affecting
delays in Indian construction projects. International Journal of Project Management,
30(4), 479–489.
76. Dos Santos, G., & Tokede, O. (2016). Last Planner System - from theory to
implementation, 305-318. The 10th Cost Engineering, Quantity Surveying & Project
Management World Congress. Research Gate.
77. Drevland, F., Lohne, J., & Klakegg, O. (2017). Ethical Dilemmas in Value Delivery:
Theoretical Conditions. 25th Annual Conference of the International Group for Lean
Construction (IGLC) (pp. 145–152). Heraklion, Greece: Research Gate.
78. Drohomeretski, E., Costa, S., Lima, E., & Garbuio, P. (2013). Lean, Six Sigma and
Lean Six Sigma: an analysis based on operations strategy. Production Research, 52(3),
804-824.
79. Durdyev, S., Omarov, M., & Ismail, S. (2017). Causes of delay in residential
construction projects in Cambodia, 4(1), 121117. Cogent Engineering.
80. Dziadosz, A., & Rejment, M. (2017). Risk analysis in construction project - chosen
methods. Operational Research in Sustainable Development and Civil Engineering -
meeting of EURO working group and 15th German-Lithuanian-Polish colloquium,
122, (pp. 258 – 265).

P a g e | 182
81. El Asmar, M., Hanna, A., & Loh, W.-Y. (2013). Quantifying Performance for the
Integrated Project Delivery System as Compared to Established Delivery Systems.
139(11), 04013012, Construction Engineering and Management.
82. El Asmar, M., Hanna, A., & Loh, W.-Y. (2015). Evaluating Integrated Project Delivery
Using the Project Quarterback Rating, 142(1), 04015046. Journal of Construction
Engineering and Management.
83. Elhaniash, F., & Stevovic, S. (2016). Towards factors affecting delays in construction
projects: A case of Libya. International Journal of Applied Research, 2(5), 1078-1081.
84. Emam, H., Farrell, P., & Abdelaal, M. (2015). Causes of Delay on Large Infrastructure
Projects in Qatar. 31st Annual ARCOM Conference, (pp. 773-782). Lincoln, UK.
85. Emdanat, S., & Azambuja, M. (2016). Aligning Near and Long Term Planning for LPS
Implementations: A Review of Existing and New Metrics. Lean Construction Journal,
90-101.
86. Fakhimi, A. (2017). Is IPD made adequate infrastructure for utilizing LC AND BIM?
The 1st International & 3rd National Conference of Construction & Project
Management.
87. Fullalove, L. (2013). Examples of Lean techniques and methodology applied to UK
road schemes, 1057-1066. International Group for Lean Construction (IGLC).
Fortaleza, Brazil.
88. Gade, R. (2016). A Proposed Solution to the Problem of Construction Industry
Overruns: Lean Construction Techniques and Linear Programming, 9(25). Indian
Journal of Science and Technology.
89. Gambo, N., Said, I., & Ismail, R. (2016). Influences of Cost Factors Affecting
Technical Performance of Local Government Projects in Nigeria: A Partial Least
Square-StructuralEquation Modeling (PLS-SEM) Approach. Journal of Construction
in Developing Countries, 21(1), 85–111.
90. Ghadamsi, A. (2016). Investigating the Influence of Procurement Method Selection on
Project Performance in Libya. PhD thesis.

P a g e | 183
91. Ghoddousi, P., Ansari, R., & Makui, A. (2016). An improved robust buffer allocation
method for the project scheduling problem, 49(4), 718-731. Engineering optimization.
92. Ghoddousi, P., Ansari, R., & Makui, A. (2017). A Risk-Oriented Buffer Allocation
Model Based on Critical Chain Project Management, 21(5), 1536-1548. Journal of Civil
Engineering.
93. Giuda, G., Villa, V., Giana, P., Tagliabue, L., & Ciribini, A. (2017). Lean construction
applied to a BIM process: how to control point attribution in MEAT tender process.
Technology, Engineering, Materials and Architecture, 3(1), 35-44.
94. Glenn, S. (2015). Public and private sectors preferences with regard to the briefing
process. Master thesis.
95. Gomes, D., Koskela, L., Biotto, C., Talebi, S., & Pikas, E. (2017). Shared understanding
in construction: a conceptual synthesis. 5th Workshop When Social Sciences meet Lean
and BIM.
96. Gowtham, R., & Sivakumar, A. (2017). A review on the implementation of Last Planner
System, 4(3), 88-90. International Journal of Engineering Technology Science and
Research.
97. Gudienė, N., Banaitis, A., & Banaitienė, N. (2013). Evaluation of critical success
factors for construction projects – an empirical study in Lithuania. International Journal
of Strategic Property Management, 17(1), 21-31.
98. Gudienė, N., Banaitis, A., Podvezko, V., & Banaitienė, N. (2014). Identification and
evaluation of the critical success factors for construction projects in Lithuania: AHP
approach, 20(3), 350–359. Journal of Civil Engineering and Management.
99. Guerrero, M., Villacampa, Y., & Montoyo, A. (2014). Modeling construction time in
Spanish building projects. International Journal of Project Management, 32(5), 861–
873.
100. Gustafsson, A., Vessby, J., & Rask, L.-O. (2012). Identification of potential
improvement areas in industrial housing: A case study of waste, 61-71. Lean
Construction Journal.

P a g e | 184
101. Gutierrez-Bucheli, L., Caldarón, M., Londoño-Acevedo, M., & Ponz-Tienda, J. (2016).
BIM and IPD as vehicle in the teaching and learning process of Project delivery in civil
engineering, 192-201. The 9th annual International Conference of Education, Research
and Innovation. Seville, Spain.
102. Gutierrez-Bucheli, L., Romero-Cortes, J., Calderón, M., Londoño-Acevedo, M., &
Ponz-Tienda, J. (2017). Senda matrix software as a control and planning tool for project
delivery in civil engineering, 3315-3322. INTED2017 Conference. Valencia, Spain:
ResearchGate.
103. Haarr, K., & Drevland, F. (2016). A Mandated Lean Construction Delivery System In
a Rehab Project – A Case Study. The 24th Ann. Conf. of the Int’l. Group for Lean
Construction, (pp. section 3, 3-12). Boston, MA, USA.
104. Hamdar, Y., Kassem, H., Srour, I., & Chehab, G. (2015). Performance-Based
Specifications for Sustainable Pavements: A Lean Engineering Analysis. International
Conference on Technologies and Materials for Renewable Energy, Environment and
Sustainability, TMREES15 (74, pp. 453 – 461). Elsevier Ltd.
105. Hamzeh, F. (2009). Improving Construction Workflow- The Role of Production
Planning and Control. PhD thesis. CALIFORNIA, USA: Research Gate.
106. Hamzeh, F., & Aridi, O. (2013). Modeling the Last Planner System metrics: a case
study of an aec company, 599-608. International Group for Lean Construction .
Fortaleza, Brazil.
107. Hamzeh, F., Ballard, G., & Tommelein, I. (2012). Rethinking Lookahead Planning to
Optimize Construction Workflow. Lean Construction, 15-34.
108. Hamzeh, F., Kallassy, J., Lahoud, M., & Azar, R. (2016). The First Extensive
Implementation of Lean and LPS in Lebanon: Results and Reflections. 24th Ann. Conf.
of the Int’l. Group for Lean Construction (pp. section 6, 33–42). Boston, MA, USA:
Research Gate.
109. Hamzeh, F., Morshed, F., Jalwan, H., & Saab, I. (2012). Is Improvisation Compatible
with Lookahead Planning? An Exploratory Study, 20. Annual Conference of the
International Group for Lean Construction. Research Gate.
P a g e | 185
110. Hamzeh, F., Zankoul, E., & El Sakka, F. (2016). Removing Constraints to Make Tasks
Ready in Weekly Work Planning. Creative Construction Conference, (164, pp. 68 –
74).
111. Heyl, J. (2015). Lean Simulation in Road Construction: Teaching of basic Lean
Principles. 23rd Ann. Conf. of the Int’l. Group for Lean Construction., (pp. 403-412).
Perth.
112. Hosseini, S., Nikakhtar, A., & Ghoddousi, P. (2012). Flow Production of Construction
Processes through Implementing Lean Construction Principles and Simulation, 4(4),
475-479. International Journal of Engineering and Technology.
113. Hossen, M., Kang, S., & Kim, J. (2015). Construction schedule delay risk assessment
by using combined AHP-RII methodology for an international NPP project. Nuclear
Engineering and Technology, 47, 362-379.
114. Hsu, P.-Y., Aurisicchio, M., & Angeloudis, P. (2017). Investigating Schedule Deviation
in Construction Projects through Root Cause Analysis. International Conference on
Project Management, (121, pp. 732–739). Barcelona, Spain.
115. Hui, J., Abdul-Rahman, H., & Chen, W. (2017). Design Change Dynamics in Building
Project: From Literature Review to A Conceptual Framework Formulation, 8(1), 13-
33. Journal of Surveying, Construction and Property.
116. Hussain, S., Krishna, B., & Kumar, V. (2014). Application and analysis of Last Planner
System in the construction industry. International Journal of Research in Engineering
& Technology, 2(6), 33-44.
117. Hussain, S., Nama, A., & Fatima, A. (2016). Barriers to Implement Lean Principles in
the Indian Construction Industry, 3(1), 1-6. International Journal of Innovative
Research in Advanced Engineering.
118. Ibrahim, M. (2016). Modeling, Benchmarking, and Maximizing Project Delivery
Performance. Master thesis.
119. Idiake, J. (2014). The effects ofproductivityand work flow variability on construction
jobsite labour performance in Nigeria. PhD thesis. NIGERIA.

P a g e | 186
120. Ihuah, P., Kakulu, I., & Eaton, D. (2014). A review of Critical Project Management
Success Factors (CPMSF) for sustainable social housing in Nigeria. International
Journal of Sustainable Built Environment, 3, 62–71.
121. Ingle, A., & Waghmare, A. (2015). Advances in Construction: Lean Construction for
Productivity enhancement and waste minimization, 2(11), 19-23. International Journal
of Engineering and Applied Sciences (IJEAS).
122. Iram, N., Khan, B., & Sherani, A. (2016). Critical factors influencing the project
success: an analysis of projects in manufacturing and construction in Pakistan, 6(2), 20-
24. Arabian Journal of Business and Management Review (Oman Chapter).
123. Islam, M., & Khadem, M. (2013). Productivity determinants in Oman construction
industry, 12(4), 426-448. International Journal of Productivity and Quality
Management.
124. Islam, M., & Trigunarsyah, B. (2017). Construction Delays in Developing Countries:
A Review, 7(1), 1-12. Journal of Construction Engineering and Project Management.
125. Islam, M., Nepal, M., Skitmore, M., & Attarzadeh, M. (2017). Current research trends
and application areas of fuzzy and hybrid methods to the risk assessment of construction
projects. Advanced Engineering Informatics, 33, 112–131.
126. Islam, M., Trigunarsyah, B., Hassanain, M., & Assaf, S. (2015). Causes of Delay in
Construction Projects in Bangladesh, 82-86. The 6th International Conference on
Construction Engineering and Project Management. Busan, Korea.
127. Issa, U. (2013). Implementation of lean construction techniques for minimizing the
risks effect on project construction time, 52, 697-704. Alexandria Engineering Journal.
128. Jalal, M., & Koosha, S. (2015). Identifying organizational variables affecting project
management office characteristics and analyzing their correlations in the Iranian
project-oriented organizations of the construction industry. International Journal of
Project Management, 33, 458–466.
129. Jeong, W., Chang, S., Son, J., & Yi, J.-S. (2016). BIM-Integrated Construction
Operation Simulation for Just-In-Time Production Management, 8(11), 1106.
Multidisciplinary Digital Publishing Institute (MDPI).

P a g e | 187
130. Jin, Z., Deng, F., Li, H., & Skitmore, M. (2013). Practical Framework for Measuring
Performance of International Construction Firms. Journal of Management in
Engineering, 139(9), 1154-1167.
131. Johansson, M., & Silversten, T. (2016). Collaboration between Design and
Construction. Master thesis. Gothenburg, Sweden: Chalmers university of technology.
132. Johnsen, C., & Drevland, F. (2016). Lean and sustainability: three pillar thinking in the
production process. 24th Ann. Conf. of the Int’l. Group for Lean Construction, (24, pp.
23–32). Boston, MA, USA.
133. Jones, B. (2014). Integrated project delivery (IPD) for maximizing design and
construction considerations regarding sustainability, 95, 528-538. 2nd International
Conference on Sustainable Civil Engineering Structures and Construction Materials,
(pp. 528 – 538).
134. Joseph, N. (2017). Conceptualising a multidimensional model of information
communication and technology project complexity, 19(1), 1-14. South African Journal
of Information Management.
135. Joslin, R., & Müller, R. (2015). Relationships between a project management
methodology and project success in different project governance contexts. International
Journal of Project Management, 33(6), 1377–1392.
136. Juarez, J., & Erichsen, E. (2016). A Supplier-Oriented LPS Framework. Master thesis.
137. Jung, W., Ballard, G., Kim, Y.-W., & Han, S. (2012). Understanding of Target Value
Design for Integrated Project Delivery with the Context of Game Theory, 556-563.
Construction Research Congress.
138. Kahvandi, Z., Saghatforoush, E., Alinezhad, M., & Noghli, F. (2017). Integrated
Project Delivery (IPD) Research Trends. Journal of Engineering, Project, and
Production Management, 7(2), 99-114.
139. Kaipainen, A. (2017). Developing resource-efficient aggregate stone use with lean
thinking: case study of an urban area development project. Master thesis.
140. Kalsaas, B. (2012). The Last Planner System Style of Planning: Its Basis in Learning
Theory. Engineering, Project, and Production Management, 2(2), 88-100.

P a g e | 188
141. Kalu, U., Lew, T., & Sim, A. (2013). Relationship between leadership style and project
success among IT Professionals in Nigeria: Implications to Project Management.
Australian Journal of Basic and Applied Sciences, 7(12), 74-83.
142. Kawish, S. (2017). Identifying and prioritizing barriers and overcoming strategies in
implementing Lean Construction principles and methods within transportation projects.
Master thesis.
143. Kerosuo, H., Mäki, T., Codinhoto, R., Koskela, L., & Miettinen, R. (2012). In Time at
Last – Adoption of Last Planner tools for the Design Phase of a Building Project. The
20th Annual Conference of the International Group for Lean Construction, (pp. 1031-
1041).
144. Khan, K., Turner, R., & Maqsood, T. (2013). Factors that influence the success of
public sector projects in Pakistan, 1-25. In Proceedings of IRNOP 2013 Conference.
145. Khanh, H., & Kim, S. (2016). A Survey on Production Planning System in Construction
Projects Based on Last Planner System, 20(1), 1-11. Journal of Civil Engineering.
146. Khodeir, L., & Othman, R. (2016). Examining the interaction between lean and
sustainability principles in the management process of AEC industry. Ain Shams
Engineering Journal.
147. Kivistö, G., & Ohlsson, H. (2013). Expanding Lean into Transportation Infrastructure
Construction. Master thesis. Gothenburg, Sweden.
148. Knotten, V., Svalestuen, F., Lædre, O., & Hansen, G. (2016). Improving Design
Management with Mutual Assessment. 24th Ann. Conf. of the Int’l. Group for Lean
Construction, (pp. section 4, 173-182). Boston, MA, USA.
149. Kuklare, P., & Hedaoo, M. (2017). Feasibility of Application of 5’S Methodology in
Construction Industry. International Journal of Scientific Research in Science and
Technology, 3(1), 144-147.
150. Kumar, D. (2016). Causes and Effects of Delays in Indian Construction Projects, 3(4),
1831-1837. International Research Journal of Engineering and Technology.

P a g e | 189
151. Kuo, Y.-C., & Lu, S.-T. (2013). Using fuzzy multiple criteria decision making approach
to enhance risk Using fuzzy multiple criteria decision making approach to enhance risk.
International Journal of Project Management, 31, 602–614.
152. Kyere, P. (2016). Enablers of Lean Construction Concept to Affordable Housing
Schemes in Ghana. Master thesis. Kumasi, Ghana.
153. Lagos, C., Herrera, R., & Alarcón, L. (2017). Contribution of Information Technologies
to Last Planner System Implementation. The 25th Annual Conference of the
International Group for Lean Construction (IGLC), (1, pp. 87–94). Heraklion, Greece.
154. Larsen, J., Shen, G., Lindhard, S., & Brunoe, T. (2016). Factors Affecting Schedule
Delay, Cost Overrun, and Quality Level in Public Construction Projects, 32(1),
04015032. Journal of Management in Engineering.
155. Laurent, J. (2017). Cross-functional project teams in construction: a case study. Master
thesis.
156. Lee, H. (2012). Application of Target Value Design to Energy Efficiency Investments.
PhD thesis.
157. Lee, H., Anderson, S., Kim, Y.-W., & Ballard, G. (2014). Advancing Impact of
Education, Training, and Professional Experience on Integrated Project Delivery,
19(1), 8-14. Practice Periodical on Structural Design and Construction.
158. Lee, H., Tommelein, I., & Ballard, G. (2013). Energy-Related Risk Management in
Integrated Project Delivery, 139(12), A4013001. Construction Engineering and
Management .
159. Lehtiranta, L. (2014). Risk perceptions and approaches in multi-organizations: A
research review 2000–2012. International Journal of Project Management, 32(4), 640–
653.
160. Lessing, B., Thurnell, D., & Durdyev, S. (2017). Main Factors Causing Delays in Large
Construction Projects: Evidence from New Zealand. Journal of Management,
Economics, and Industrial Organization, 1(2), 63-82.

P a g e | 190
161. Li, H., Al-Hussein, M., Lei, Z., & Ajweh, Z. (2013). Risk identification and assessment
of modular construction utilizing fuzzy analytic hierarchy process (AHP) and
simulation, 40(12), 1184-1195. Canadian Journal of Civil Engineering.
162. Li, S., Wu, X., Zhouc, Y., & Liu, X. (2017). A study on the evaluation of
implementation level of lean construction in two Chinese firms. Renewable and
Sustainable Energy Reviews, 71, 846–851.
163. Liu, J., Xie, Q., Xia, B., & Bridge, A. (2017). Impact of Design Risk on the Performance
of Design-Build Projects, 143(6), 04017010. Journal of Management in Engineering.
164. Liu, J., Zhao, X., & Yan, P. (2016). Risk Paths in International Construction Projects:
Case Study from Chinese Contractors, 142(6), 05016002. Journal of Construction
Engineering and Management.
165. Liu, R., & Chua, V. (2016). Theoretical digitalization of information flow in the
construction supply chain, 5(1), 10-27. International Journal of Management Research
and Business Strategy.
166. Locatelli, G., Mancini, M., Gastaldo, G., & Mazza, F. (2013). Improving Projects
Performance With Lean Construction: State Of The Art, Applicability And Impacts.
Organization, technology and management in construction, 5, 775 - 783.
167. Locatelli, G., Mikic, M., Brookes, N., & Kovačević, M. (2017). The Successful
Delivery of Megaprojects: A Novel Research Method, 48(5), 78-94. Project
Management Journal.
168. Ma, T., & Voo, M. (2014). A Comparative Study of Construction Joint Ventures in
Australia and Malaysia. The fifth International Conference on Engineering, Project, and
Production Management, (pp. 45-54). Port Elizabeth, South Africa.
169. Ma, T., Luong, C., & Zuo, J. (2014). A Study of the Skills of Construction Project
Managers in Australia and Their Needs for Training and Certification. The fifth
International Conference on Engineering, Project, and Production Management, (pp.
55-73). Port Elizabeth, South Africa.
170. Mandujano, M., Alarcón, L., Kunz, J., & Mourgues, C. (2016). Identifying waste in
virtual design and construction practice from a Lean Thinking perspective: A meta-

P a g e | 191
analysis of the literature. Red de Revistas Científicas de América Latina y el Caribe,
107-118.
171. Mante, J., Ndekugri, I., Ankrah, N., & Hammond, F. (2012). The influence of
procurement methods on dispute resolution mechanism choice in construction, 979-
988. 28th annual association of researchers in construction management. Edinburgh,
UK.
172. Marhani, M., Jaapar, A., & Bari, N. (2012). Lean Construction: Towards enhancing
sustainable construction in Malaysia. ASIA Pacific International Conference on
Environment-Behaviour Studies (68, pp. 87 – 98). Cairo, Egypt: Science Direct.
173. Marhani, M., Jaapar, A., Bari, N., & Zawawi, M. (2013). Sustainability through Lean
Construction Approach: A literature review. AMER International Conference on
Quality of Life, (101, pp. 90 – 99). Langkawi, Malaysia.
174. Marzouk, M., & El-Rasas, T. (2014). Analyzing delay causes in Egyptian construction
projects. Journal of Advanced Research, 5(1), 49–55.
175. Marzouk, M., Bakry, I., & El-Said, M. (2012). Assessing design process in engineering
consultancy firms using lean principles. Simulation, 88(12), 1522-1536.
176. Marzouk, M., El Kherbawy, A., & Khalifa, M. (2013). Factors influencing sub-
contractors selection in construction projects. Housing and Building National Research
Center, 9(2), 150–158.
177. Maués, L., Santana, W., Santos, P., Neves, R., & Duarte, A. (2017). Construction
delays: a case study in the Brazilian Amazon. Associação Nacional de Tecnologia do
Ambiente Construído, 17(3), 167-181.
178. Mavasa, A. (2017). The influence of unrealistic initial contract duration on time
performance of construction projects in South Africa. Master thesis.
179. McCord, J., McCord, M., Davis, P., Haran, M., & Rodgers, W. (2015). Understanding
delays in housing construction: evidence from Northern Ireland. Journal of Financial
Management of Property and Construction, 20(3), 286-319.

P a g e | 192
180. Mehlawat, M., & Gupta, P. (2016). A new fuzzy group multi-criteria decision making
method with an application to the critical path selection. The International Journal of
Advanced Manufacturing Technology, 83(5-8), 1281-1296.
181. Meiling, J., Backlund, F., & Johnsson, H. (2012). Managing for continuous
improvement in off-site construction. Engineering, Construction and Architectural
Management, 19(2), 141 - 158.
182. Memon, A. (2014). Contractor Perspective on Time Overrun Factors in Malaysian
Construction Projects. International Journal of Science, Environment and Technology,
3(3), 1184 – 1192.
183. Memon, A., Abdul Rahman, I., & Memon, I. (2014). Rule Based DSS in Controlling
Construction Waste, 11(6), 417-424. Life Science Journal.
184. Memon, A., Abdul Rahman, I., Akram, M., & Ali, N. (2014). Significant Factors
Causing Time Overrun in Construction Projects of Peninsular Malaysia, 8(4), 16-28.
Modern Applied Science.
185. Meng, X. (2012). The effect of relationship management on project performance in
construction, 30(2), 188-198. International Journal of Project Management, 188–198.
186. Mihic, M., Sertic, J., & Zavrski, I. (2014). Integrated project delivery as integration
between solution development and solution implementation. 27th IPMA World
Congress (119, pp. 557 – 565). Elsevier Ltd.
187. Minchin Jr., R., Li, X., Issa, R., & Vargas, G. (2013). Comparison of Cost and Time
Performance of Design-Build and Design-Bid-Build Delivery Systems in Florida,
139(10), 04013007. Journal of Management in Engineering.
188. Mir, F., & Pinnington, A. (2014). Exploring the value of project management: Linking
Project Management Performance and Project Success. International Journal of Project
Management, 32(2), 202-217.
189. Mirawati, N., Othman, S., & Risyawati, M. (2015). Supplier-Contractor Partnering
Impact on Construction Performance: A Study on Malaysian Construction Industry,
3(1), 29-33. Journal of Economics, Business and Management.

P a g e | 193
190. Mohamad, A. (2015). Managing the potential of modularization and standardization of
MEP systems in industrial buildings -Guidelines for improvement based on lean
principles-. PhD thesis.
191. Mohammed, D., & Khodeir, L. (2017). Examining the Role of Lean Management in
Leading Architecture Renovation Projects, 1-41. Research Gate.
192. Mohammed, E., Mohammed, S., & Hassan, A. (2017). Factors causing variation orders
in building projects in Khartoum - State Sudan, 6(11), 117-129. International Journal
of Engineering Sciences & Research Technology.
193. Mohan, V., & Paila, A. (2013). Stakeholder Management in Infrastructure/Construction
Projects: The Role Of Stakeholder Mapping And Social Network Analysis (SNA).
Weshkar research journal, 15(1), 48-61.
194. Mok, K., Shen, G., & Yang, J. (2015). Stakeholder management studies in mega
construction projects: A review and future directions. International Journal of Project
Management, 33(2), 446–457.
195. Momanyi, H. (2017). Determinants of completion of road construction projects in
Nyamira County Government, Kenya. Master thesis.
196. Montes, S. (2017). Sustainable Building Project Execution: Impact of Construction
Project Management on DGNB Sustainability Certification. Master Thesis.
197. Muhwezi, L., Acai, J., & Otim, G. (2014). An Assessment of the Factors Causing
Delays on Building Construction Projects in Uganda. International Journal of
Construction Engineering and Management, 3(1), 13-23.
198. Mukhtar, M., Amirudin, R., Sofield, T., & Mohamad, I. (2017). Critical success factors
for public housing projects in developing countries: a case study of Nigeria.
Environment, Development and Sustainability, 19(5), 2039-2067.
199. Murguía, D., Brioso, X., & Pimentel, A. (2016). Applying Lean Techniques to Improve
Performance in the Finishing Phase of a Residential Building, pp. section 2, 43-52. The
24th Annual Conference of the International Group for Lean Construction, (pp. 43–52).
Boston, USA.

P a g e | 194
200. Nadzirah, R. (2015). Mitigation measures for controlling time and cost overrun factors.
Master thesis.
201. Nahmens, I., & Ikuma, L. (2012). Effects of Lean Construction on Sustainability of
Modular Homebuilding. Journal of architectural engineering, 18(2), 155-163.
202. Nahmens, I., Ikuma, L., & Khot, D. (2012). Lean and Job Satisfaction in Industrialized
Homebuilding. Lean Construction Journal, 91-104.
203. Namadi, S., Pasquire, C., & Manu, E. (2017). Discrete Costing Versus Collaborative
Costing. The 25th Annual Conference of the International Group for Lean
Construction, (pp. 3–10). Heraklion, Greece.
204. Nath, T., Attarzadeh, M., Tiong, R., Chidambaram, C., & Yu, Z. (2015). Productivity
improvement of precast shop drawings generation through BIM-based process re-
engineering. Automation in Construction, 54, 54–68.
205. Nieto-Morote, A., & Ruz-Vila, F. (2012). Last Planner Control System Applied to a
Chemical Plant Construction. Construction Engineering and Management, 138(2), 287-
293.
206. Ogunbiyi, O. (2014). Implementation of the Lean Approach in Sustainable
Construction: A Conceptual Framework. PhD thesis.
207. Okere, G. (2017). Barriers and Enablers of Effective Knowledge Management: A Case
in the Construction Sector. The Electronic Journal of Knowledge Management, 15(2),
85-97.
208. Oliva, C., & Granja, A. (2013). An investigation into collaborative practices in social
housing projects as a precondition for target value design adoption, 429-437.
International group for lean construction. Fortaleza, Brazil.
209. Olivieri, H., Seppänen, O., & Granja, A. (2016). Integrating LBMS, LPS and CPM: A
Practical Process. The 24th Ann. Conf. of the Int’l. Group for Lean Construction, (pp.
section 6, 3-12). Boston, MA, USA.
210. OMOTAYO, T. (2017). Strategic realignment of the post-contract cost control process
in the Nigerian construction industry using kaizen. PhD thesis.

P a g e | 195
211. Onyango, A. (2016). Interaction between Lean Construction and BIM. Master thesis.
Stockholm, Sweden.
212. Orihuela, P., Orihuela, J., & Pacheco, S. (2015). Implementation of Target Value
Design (TVD) in building projects, 279-284. Creative Construction Conference.
Krakow, Poland.
213. Othman, A., Ghaly, M., & Abidin, N. (2014). Lean Principles: An Innovative Approach
for Achieving Sustainability in the Egyptian Construction Industry. Organization,
technology and management in construction, 6(1), 917 - 932.
214. Ozorhon, B., Abbott, C., & Aouad, G. (2014). Integration and Leadership as Enablers
of Innovation in Construction: Case Study. Management in Engineering, 30(2), 256-
263.
215. Pasquire, C., & Court, P. (2013). An Exploration of Knowledge and Understanding –
The Eighth Flow. The Annual Conference of the International Group for Lean
Construction. Forteleza, Brazil.
216. Pasquire, C., & Ebbs, P. (2017). Shared Understanding: the Machine Code of the Social
in a Socio-Technical System. The 25th Annual Conference of the International Group
for Lean Construction (2, pp. 365-372). Heraklion, Greece: ResearchGate.
217. Pasquire, C., Daniel, E., & Dickens, G. (2015). Scoping study to define a major research
project investigating the implementation of Last Planner System, collaborative
planning and collaborative working in the uk road transport sector including identifying
funding sources. Nottingham : Nottingham trent university.
218. Pellicer, E., & Ponz-Tienda, J. (2014). Teaching and Learning Lean Construction in
Spain: A pioneer Experience, 3, 1245-1256. International Group for Lean Construction
. Oslo, Norway.
219. Pellicer, E., Cerveró, F., Lozano, A., & Ponz-Tienda, J. (2015). The Last Planner
System of construction planning and control as a teaching and learning tool.
International Technology, 4877-4884, Education and Development Conference.
Madrid, Spain: Research Gate.

P a g e | 196
220. Perrenoud, A., Lines, B., & Sullivan, K. (2014). Measuring risk management
performance within a capital program, 12(2), 158-171. Journal of Facilities
Management.
221. Pestana, A. (2016). Multi-Criteria Risk Mapping Using Lean Tools for the
Architecture, Engineering, and Construction Industry. PhD thesis.
222. Pestana, A., Alves, T., & Barbosa, A. (2014). Application of Lean Construction
Concepts to Manage the Submittal Process in AEC Projects, 30(4), 05014006..
Management in Engineering.
223. Pettersen, M. (2017). Lean Construction in Norwegian Transport Infrastructure. Master
thesis. Norway: Norwegian university of science and technology department of civil
and transport engineering.
224. Pishdad-Bozorgi, P., Moghaddam, E., & Karasulu, Y. (2013). Advancing Target Price
and Target Value Design Process in IPD Using BIM and Risk-Sharing Approaches.
The 49th Associated Schools of Construction Annual International Conference
Proceedings.
225. Prihartanto, E., & Bakri, M. (2017). Identification the Highest Risk of Performance
Based Contract in Bojonegoro-Padangan Road Projects, 3(6), 128-132. The Third
International Conference on Civil Engineering Research. Surabaya, Indonesia.
226. Radhika, R., & Sukumar, S. (2017). An overview of the concept of Lean Construction
and the barriers in its implementation. International Journal of Engineering
Technologies and Management Research, 4(3), 13-26.
227. Rajkumar, G., Saravanakumar, S., & Gowtham, R. (2017). Applying Value Stream
Mapping For Improving Productivity in Construction Productivity in Construction,
5(3), 149-154. International Journal of Engineering Technology, Management and
Applied Sciences.
228. Ram, J., & Corkindale, D. (2014). How "critical" are the critical success factors (CSFs)?
Examining the role of CSFs for ERP. Business Process Management Journal, 20(1),
151-174.

P a g e | 197
229. Ram, J., Corkindale, D., & Wu, M.-L. (2013). Implementation critical success factors
(CSFs) for ERP: Do they contribute to implementation success and post-
implementation performance? International Journal of Production Economics, 144,
157–174.
230. Rodewohl, C. (2014). The presence of Lean Construction principles in Norways
transport infrastructure projects. Master Thesis. Norway.
231. Rodrigues, J., Costa, A., & Gestoso, C. (2014). Project planning and control: Does
national culture influence project success? International Conference on Project
Management, (16, pp. 1047 – 1056).
232. Roebuck, T., Sewalk, S., Taylor, J., & Chinowsky, P. (2016). Integrating Mechanical
Contractors into IPD: Does IPD Work for them? Engineering Project Organization
Journal.
233. Rose, K. (2013). A Guide to the Project Management Body of Knowledge (PMBOK®
Guide)—Fifth Edition, 44(3), e1-e1. Project management journal .
234. Rouhana, C., & Hamzeh, F. (2016). An ABC Approach to Modeling the Emergence of
‘New Tasks’ in Weekly Construction Planning. Lean Construction Journal, 35-56.
235. Roy, D., Malsane, S., & Samanta, P. (2017). Procedural challenges in
interorganizational collaboration for IPD adoption, C299-C307. Indian Lean
Construction Conference.
236. Rybkowski, Z., Shepley, M., & Ballard, H. (2012). Target Value Design: applications
to newborn intensive care units, 5(4), 5-23. Health environments research & design
journal.
237. Saadé, R. G., Dong, H., & Wan, J. (2015). Factors of Project Manager Success.
Interdisciplinary Journal of Information, Knowledge, and Management, 10, 63-80.
238. Salifu-Asubay, E., & Mensah, C. (2015). Improving Delivery of Construction Projects
in Ghana’s Cities: A Lean Construction Approach, 6(1), 1-15. International Journal of
Sustainable Construction Engineering & Technology.
239. Samarah, A., & Bekr, G. (2016). Causes and Effects of Delay in Public Construction
Projects in Jordan, 5(5), 87-94. American Journal of Engineering Research.

P a g e | 198
240. Sarhan, J., Xia, B., Fawzia, S., & Karim, A. (2017). Lean Construction Implementation
in the Saudi Arabian Construction Industry. Construction Economics and Building,
17(1), 46-69.
241. Sarhan, S., & Fox, A. (2012). Trends and Challenges to the Development of a Lean
Culture Among UK Construction Organisations. 20th Annual Conference of the
International Group for Lean Construction.
242. Sarhan, S., & Fox, A. (2013a). Performance measurement in the UK construction
industry and its role in supporting the application of lean construction concepts.
Australasian Journal of Construction Economics and Building, 13(1), 23-35.
243. Sarhan, S., & Fox, A. (2013b). Barriers to implementing lean construction in the UK
construction industry, 6, 1-17. The Built & Human Environment Review.
244. Schöttle, A. (2015, September). What is the Lean Project Delivery System? Retrieved
from lean Construction Blog: https://leanconstructionblog.com/What-is-the-lean-
project-delivery-system.html
245. Scoggin, J. (2017). The Interdependency of Lean Implementation and Organization
Development. PhD thesis.
246. Sebestyen, Z. (2017). Further Considerations in Project Success. Creative Construction
Conference, (196, pp. 571 – 577).
247. Seman, M., Hanafi, M., & Abdullah, S. (2013). Main Factors Lack of Workspace
Planning That Causes Workspace Conflict on Project Environment: Industrialised
Building System In Malaysia, 7(6), 408-419. Australian Journal of Basic and Applied
Sciences.
248. Sertyesilisik, B. (2016). Embending Sustainability Dynamics in the Lean Construction
Supply Chain Management, 4(1), 60-78. Journal of built environment.
249. Shabehpour, N. (2016). An investigation of the implementation of lean philosophy
within a specialty trade. Master of applied science. Canada: The University of British
Columbia.

P a g e | 199
250. Shah, J., & Deshpande, V. (2015). Lean Six Sigma: An integrative approach of Lean
and Six Sigma methodology, 5(6), 3528-3534. International Journal of Current
Engineering and Technology.
251. Shang, G., & Pheng, L. (2014). The Last Planner System in China's construction
industry — A SWOT analysis on implementation. International Journal of Project
Management, 32, 1260–1272.
252. Sharma, S., & Goyal, P. (2014). Cost Overrun Factors and Project Cost Risk
Assessment in Construction Industry - A State of the Art Review, 3(3), 139-154.
International Journal of Civil Engineering.
253. Shen, Y., Zygmunt, K., & Wandahl, S. (2017). Reducing variability of workforce as a
tool to improve plan reliability. Modern Building Materials, Structures and Techniques
(172, pp. 969 – 976). Science Direct.
254. Siddique, L., & Hussein, B. (2016). A qualitative study of success criteria in Norwegian
agile software projects from suppliers’ perspective. International Journal of Information
Systems and Project Management, 4(2), 65-79.
255. Sinesilassie, E., Tabish, S., & Jha, K. (2017). Critical factors affecting schedule
performance: A case of Ethiopian public construction projects–engineers’ perspective.
Engineering, Construction and Architectural Management, 24(5), 757-773.
256. Singh, R., Gohil, A., Shah, D., & Desai, S. (2013). Total Productive Maintenance
(TPM) Implementation in a Machine Shop: A Case Study. Chemical, Civil and
Mechanical Engineering Tracks of 3rd Nirma University International Conference on
Engineering, (51, pp. 592 – 599).
257. Small, E., Al Hamouri, K., & Al Hamouri, H. (2017). Examination of Opportunities for
Integration of Lean Principles in Construction in Dubai. Creative Construction
Conference 2017, CCC 2017 (196, pp. 616 – 621). Primosten, Croatia: Elsevier Ltd.
258. Soliman, E. (2017). Recommendations to Mitigate Delay Causes in Kuwait
Construction Projects. American Journal of Civil Engineering and Architecture, 5(6),
253-262.

P a g e | 200
259. Somani, A., & Minde, P. (2017). Lean Waste Assessment And Blue Print For
Elimination Of Waste Through Lean Digital Method. International Research Journal of
Engineering and Technology (IRJET), 4(7), 116-120.
260. Son, H., Kim, C., & Cho, Y. (2017). Automated Schedule Updates Using As-Built Data
and a 4D Building Information Model. Journal of Management in Engineering, 33(4).
261. Soto, B., Rosarius, A., Rieger, J., Chen, Q., & Adey, B. (2017). Using a Tabu-search
Algorithm and 4D Models to Improve Construction Project Schedules. Creative
Construction Conference, (196, pp. 698 – 705). Primosten, Croatia.
262. Stevens, M. (2014). Increasing Adoption of Lean Construction by Contractors, 377-
388. 22nd Annual Conference of the International Group for Lean Construction. Oslo,
Norway.
263. Subramanyan, H., Sawant, P., & Bhatt, V. (2012). Construction Project Risk
Assessment: Development of Model Based on Investigation of Opinion of Construction
Project Experts from India. Journal of Construction Engineering and Management,
138(3), 409–421.
264. Suleiman, I., & Luvara, V. (2016). Factors Influencing Change of Design of Building
Projects during Construction Stage in Dar-es- Salaam Tanzania. International Journal
of Construction Engineering and Management, 5(4), 93-101.
265. Swefie, M. (2013). Improving Project Performance Using Lean Construction in Egypt:
A Proposed Framework. Master of Science thesis. Egypt: The American Univerisity in
Cairo .
266. Sweis, G. (2013). Factors Affecting Time Overruns in Public Construction Projects:
The Case of Jordan. International Journal of Business and Management, 8(23), 120-
129.
267. Szymanski, P. (2017). Risk management in construction projects. Second International
Joint Conference on Innovative Solutions in Construction Engineering and
Management, 208(2017), 174–182.

P a g e | 201
268. Tabatabaee, S., Mahdiyar, A., Yahya, K., Marsono, A., & Sadeghifam, A. (2017). Level
Of Awareness On Lean Thinking Concept In Construction Among Higher Learning
Students. Malaysian Journal of Civil Engineering, 29(1), 94-107.
269. Tamošaitienė, J., Zavadskas, E., & Turskis, Z. (2013). Multi-criteria risk assessment of
a construction project. Procedia Computer Science, 17, 129 – 133.
270. Tanko, B., Abdullah, F., & Ramly, Z. (2017). Stakeholders Assessment of Constraints
to Project Delivery in the Nigerian Construction Industry. International journal of Built
Environment and Sustainability, 4(4), 56-62.
271. Taroun, A. (2014). Towards a better modelling and assessment of construction risk:
Insights from a literature review. International Journal of Project Management, 32(1),
101–115.
272. Tawfik, A., & Othman, A. (2013). Towards lean construction: Using quality
management as a tool to minimise waste in the Egyptian construction Industry. 6th
Annual SACQSP Research Conference on “Green Vision 20/20”, (pp. 129-144). Cape
Town, South Africa.
273. Taylan, O., Bafail, A., Abdulaal, R., & Kabli, M. (2014). Construction projects
selection and risk assessment by fuzzy AHP and fuzzy TOPSIS methodologies. Applied
Soft Computing, 17, 105–116.
274. Tezel, A., & Nielsen, Y. (2013). Lean Construction Conformance among Construction
Contractors in Turkey. Journal Of Management in Engineering, 29(3), 236-250.
275. Tezel, A., Koskela, L., & Aziz, Z. (2017). Lean Construction in Small-Medium Sized
Enterprises (SMEs): an exploration of the highways supply chain. The 25th Annual
Conference of the International Group for Lean Construction (IGLC), 2, (pp. 853 –
859). Heraklion, Greece.
276. Thorat, S., Khandare, M., & Kanase, A. (2017). Identifying the Causes and Effects of
Delay in Residential Projects. International Research Journal of Engineering and
Technology (IRJET), 4(4), 2993-2996.
277. Thuranira, M. (2016). The effect of lean supply chain management components on
operational performance among tea factories in kenya. Master thesis.

P a g e | 202
278. Tran, V. (2017). Evaluating the economics of construction and demolition waste
minimisation and zero waste in the New Zealand construction industry. PhD thesis.
279. Tsiga, Z., Emes, M., & Smith, A. (2017). Critical success factors for projects in the
petroleum industry. International Conference on Project Management, (121, pp. 224–
231).
280. Uusitalo, P., Olivieri , H., Sepp–nen, O., Pikas , E., & Peltokorpi , A. (2017). Review
Of Lean Design Management: Processes, Methods And Technologies. 25th Annual
Conference of the International Group for Lean Construction (IGLC), (pp. 571-578).
Heraklion, Greece.
281. Vaidyanathan, K., Mohanbabu, S., Sriram, P., Rahman, S., & Arunkumar, S. (2016).
Application of Lean Principles to Managing Construction of an IT Commercial Facility
– An Indian Experience. The 24th Ann. Conf. of the Int’l. Group for Lean Construction,
(pp. section 6, 183-192). Boston, MA, USA.
282. Viana, T., Salles, P., Carvalho, C., Teixeira, B., Moraes, M., & Santos, W. (2017).
Impacts of the Application of Lean Construction to Reduce the Generation of Waste
and Improve Processes in Construction. International Journal of Science and
Engineering Investigations, 6(64), 52-58.
283. Vilventhan, A., & Kalidindi, S. (2016). Interrelationships of factors causing delays in
the relocation of utilities: a cognitive mapping approach. Engineering, Construction and
Architectural Management, 23(3), 349-368.
284. Walia, B., & Suri, N. (2017). Implementation Of Last Planner System And Challenges
Encountered In An Indian Residential Construction Project. International Research
Journal of Engineering and Technology (IRJET), 4(6), 2881-2888.
285. Wang , W.-C., Lin, C.-L., Wang, S.-H., Liu, J.-J., & Lee, M.-T. (2014). Application of
importance-satisfaction analysis and influence-relations map to evaluate design delay
factors. Journal of Civil Engineering and Management, 20(4), 497–510.
286. Warcup, R., & Reeve, E. (2014). Using the Villego® Simulation to Teach the Last
Planner® System. Lean Construction Journal, 1-15.

P a g e | 203
287. Xiang, P., Zhou, J., Zhou, X., & Ye, K. (2012). Construction Project Risk Management
Based on the View of Asymmetric Information. Journal of Construction Engineering
and Management, 138(11), 1303-1311.
288. Xiong, B., Skitmore, M., Xia, B., Masrom, M., Ye, K., & Bridge, A. (2014). Examining
the influence of participant performance factors on contractor satisfaction: A structural
equation model. International Journal of Project Management, 32(3), 482–491.
289. Yan, L. (2017). Transformation Pathway of Chinese Construction Enterprises. Boletín
Técnico, 55(9), 350-356.
290. Yap, J., Abdul-Rahman, H., & Chen, W. (2017). Collaborative model: Managing
design changes with reusable project experiences through project learning and effective
communication. International Journal of Project Management, 35(7), 1253–1271.
291. Yap, J., Abdul-Rahman, H., & Wang, C. (2016). A Conceptual Framework for
Managing Design Changes in Building Construction. MATEC Web of Conferences, 66
(2016).
292. Yap, J., Low, P., & Wang, C. (2017). Rework in Malaysian building construction:
impacts, causes and potential solutions. Journal of Engineering, Design and
Technology, 15(5), 591-618.
293. Yu, H., Al-Hussein, M., Al-Jibouri, S., & Telyas, A. (2013). Lean Transformation in a
Modular Building Company: A Case for Implementation. Journal Of Management In
Engineering, 29(1), 103-111.
294. Yunus, R., Noor, S., Abdullah, A., Nagapan, S., Abdul Hamid, A., Tajudin, S., & Jusof,
S. (2017). Critical Success Factors for Lean Thinking in the Application of
Industrialised Building System (IBS), 226, 012045. International Research and
Innovation Summit.
295. Zakari Danlami, T., Emes, M., & Smith, A. (2016). Critical success factors for projects
in the space sector. Journal of Modern Project Management, 3(3), 56-63.
296. Zhang, L., & Chen, X. (2016). Role of lean tools in supporting knowledge creation and
performance in lean construction. International Conference on Sustainable Design,
Engineering and Construction, (145, pp. 1267 – 1274).

P a g e | 204
297. Zhang, X., Azhar, S., & Nadeem, A. (2015). Using Building Information Modeling to
Achieve Lean Principles by Improving Efficiency of Work Teams, 18(4), 293-300..
Eighth International Conference on Construction in the 21st Century. Thessaloniki,
Greece.
298. Zhang, Y. (2017). A Framework to Improve Modular Construction Manufacturing
Production Line Performance. Master thesis.
299. Zhao, X., Hwang, B.-G., & Phng, W. (2014). Construction Project Risk Management
in Singapore: Resources, Effectiveness, Impact, and Understanding. Journal of Civil
Engineering, 18(1), 27-36.
300. Zhou, T., Zhou, Y., & Liu, G. (2017). Comparison of critical success paths for historic
district renovation and redevelopment projects in China. Habitat International, 67, 54-
68.
301. Zou, P., & Sunindijo, R. (2013). Skills for managing safety risk, implementing safety
task, and developing positive safety climate in construction project. Automation in
Construction, 34, 92-100.

P a g e | 205
APPENDIX A-1
Simulation PM-EW sub-activities sequences data for first section (one section of 64 sections)
Simulation PM-EW sub-activities sequences data for first section (one section of 64 sections)

P a g e | 206
Simulation PM-EW sub-activities sequences data for first section (one section of 64 sections)

P a g e | 207
Simulation PM-EW sub-activities sequences data for first section (one section of 64 sections)

P a g e | 208
Simulation PM-EW sub-activities sequences data for first section (one section of 64 sections)

P a g e | 209
Simulation PM-EW sub-activities sequences data for first section (one section of 64 sections)

P a g e | 210
Simulation PM-EW sub-activities sequences data for first section (one section of 64 sections)

P a g e | 211
Simulation PM-EW sub-activities sequences data for first section (one section of 64 sections)

P a g e | 212
Simulation PM-EW sub-activities sequences data for first section (one section of 64 sections)

P a g e | 213
Simulation PM-EW sub-activities sequences data for first section (one section of 64 sections)

P a g e | 214
Simulation PM-EW sub-activities sequences data for first section (one section of 64 sections)

P a g e | 215
Simulation PM-EW sub-activities sequences data for first section (one section of 64 sections)

P a g e | 216
Simulation PM-EW sub-activities sequences data for first section (one section of 64 sections)

P a g e | 217
APPENDIX A-2
Simulation PM-OW sub-activities sequences data for first section (one section of 64 sections)

P a g e | 218
Simulation PM-OW sub-activities sequences data for first section (one section of 64 sections)

P a g e | 219
Simulation PM-OW sub-activities sequences data for first section (one section of 64 sections)

P a g e | 220
Simulation PM-OW sub-activities sequences data for first section (one section of 64 sections)
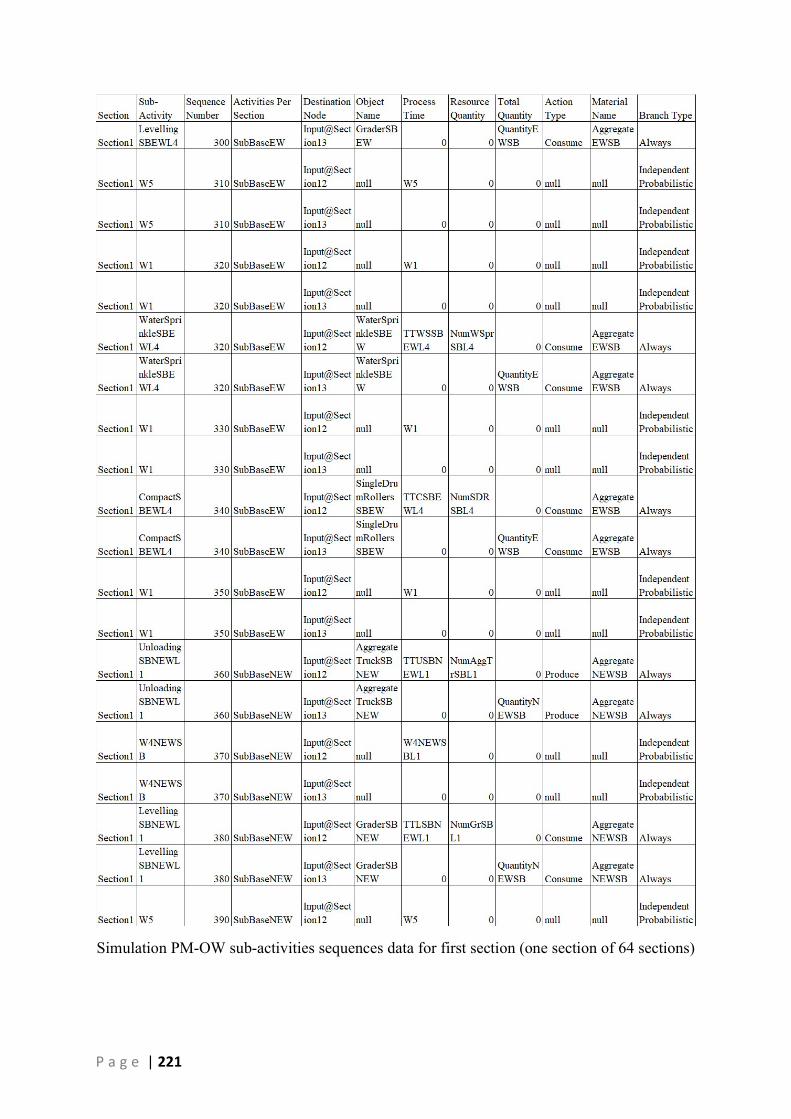
P a g e | 221
Simulation PM-OW sub-activities sequences data for first section (one section of 64 sections)

P a g e | 222
Simulation PM-OW sub-activities sequences data for first section (one section of 64 sections)

P a g e | 223
Simulation PM-OW sub-activities sequences data for first section (one section of 64 sections)

P a g e | 224
Simulation PM-OW sub-activities sequences data for first section (one section of 64 sections)

P a g e | 225
Simulation PM-OW sub-activities sequences data for first section (one section of 64 sections)

P a g e | 226
Simulation PM-OW sub-activities sequences data for first section (one section of 64 sections)

P a g e | 227
Simulation PM-OW sub-activities sequences data for first section (one section of 64 sections)

P a g e | 228
Simulation PM-OW sub-activities sequences data for first section (one section of 64 sections)

P a g e | 229

P a g e | 230
APPENDIX A-3
Simulation LC sub-activities sequences data for first section (one section of 64 sections)
Simulation LC sub-activities sequences data for first section (one section of 64 sections)

P a g e | 231
Simulation LC sub-activities sequences data for first section (one section of 64 sections)

P a g e | 232
Simulation LC sub-activities sequences data for first section (one section of 64 sections)

P a g e | 233
Simulation LC sub-activities sequences data for first section (one section of 64 sections)

P a g e | 234
APPENDIX B-1
Simulations (PM-EW, PM-OW & LC) materials data inputs

P a g e | 235

P a g e | 236
APPENDIX B-2
Simulations (PM-EW, PM-OW & LC) equations inputs

P a g e | 237
APPENDIX B-3
Simulations (PM-EW, PM-OW & LC) random triangular values and machines quantities inputs

P a g e | 238