Lean Six Sigma Glossary - GoLeanSixSigma.com.pages
30
The web is overflowing with Lean Six Sigma resources. Our glossary provides clear, straight-forward language, organized for quick access so you can easily find and understand terms that you’re searching for. For a better understanding of these terms and an overview of Lean Six Sigma, check out our Green Belt Training & Certification. P300 COPYRIGHT 2015 GOLEANSIXSIGMA.COM. ALL RIGHTS RESERVED. 1 View Online Lean Six Sigma Glossary Including Visuals & Infographics At: https://goleansixsigma.com/glossary/ Lean Six Sigma Glossary Brought To You By:
-
Upload
khangminh22 -
Category
Documents
-
view
0 -
download
0
Transcript of Lean Six Sigma Glossary - GoLeanSixSigma.com.pages

The web is overflowing with Lean Six Sigma resources. Our glossary
provides clear, straight-forward language, organized for quick
access so you can easily find and understand terms that you’re
searching for.
For a better understanding of these terms and an overview of Lean Six Sigma, check out our
Green Belt Training & Certification.
P300 COPYRIGHT 2015 GOLEANSIXSIGMA.COM. ALL RIGHTS RESERVED. 1
View Online Lean Six Sigma Glossary Including Visuals & Infographics At: https://goleansixsigma.com/glossary/
Lean Six Sigma Glossary Brought To You By:
5 Whys: 5 Whys is a simple but effective method of analyzing and solving problems by asking
“why” five times, or as many times as needed in order to move past symptoms and determine
root cause. This approach is used in tandem with Cause-and-Effect or Fishbone diagrams.
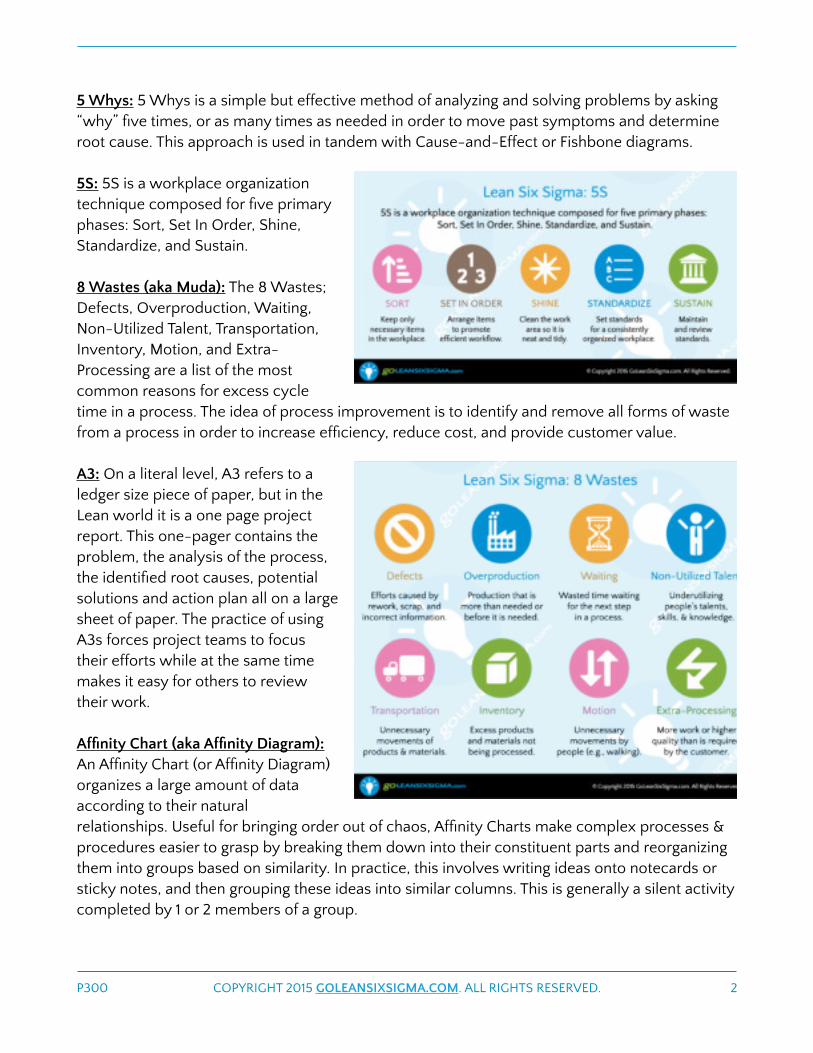
5S: 5S is a workplace organization
technique composed for five primary
phases: Sort, Set In Order, Shine,
Standardize, and Sustain.
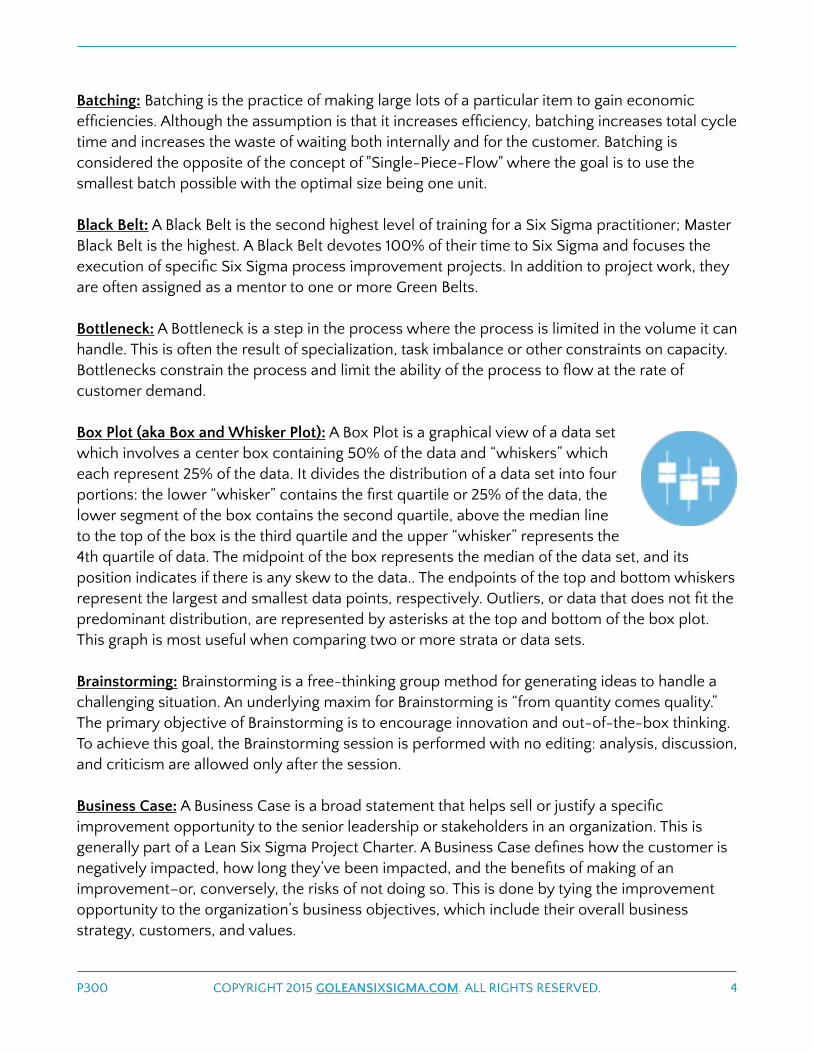
8 Wastes (aka Muda): The 8 Wastes;
Defects, Overproduction, Waiting,
Non-Utilized Talent, Transportation,
Inventory, Motion, and Extra-
Processing are a list of the most
common reasons for excess cycle
time in a process. The idea of process improvement is to identify and remove all forms of waste
from a process in order to increase efficiency, reduce cost, and provide customer value.
A3: On a literal level, A3 refers to a
ledger size piece of paper, but in the
Lean world it is a one page project
report. This one-pager contains the
problem, the analysis of the process,
the identified root causes, potential
solutions and action plan all on a large
sheet of paper. The practice of using
A3s forces project teams to focus
their efforts while at the same time
makes it easy for others to review
their work.
Affinity Chart (aka Affinity Diagram):
An Affinity Chart (or Affinity Diagram)
organizes a large amount of data
according to their natural
relationships. Useful for bringing order out of chaos, Affinity Charts make complex processes &
procedures easier to grasp by breaking them down into their constituent parts and reorganizing
them into groups based on similarity. In practice, this involves writing ideas onto notecards or
sticky notes, and then grouping these ideas into similar columns. This is generally a silent activity
completed by 1 or 2 members of a group.
P300 COPYRIGHT 2015 GOLEANSIXSIGMA.COM. ALL RIGHTS RESERVED. 2

Alternative Path: Used in process mapping, the Alternative Path method shows multiple ways of
achieving the same result. Ideal for the mapping of very large and detailed processes, alternative
paths are a process analysis tool. This is often done by assigning percentages to each path (e.g,
time/incidents) for comparison purposes.
Alternative Hypothesis: The Alternative Hypothesis, known as HA, is a form of hypothesis that
assumes there is a statistically significant difference between two or more data samples. In any
hypothesis test, if there is a less than 5% probability that the difference is due to chance, then
the Null Hypothesis is rejected and the Alternative Hypothesis can be pursued.
Analyze Phase: The Analyze Phase is the third phase of the DMAIC process, and focuses on
identifying the root cause (or causes) of a process problem. The Analyze Phase requires data and
knowledge gleaned from the previous Define and Measure phases of DMAIC. This phase focuses
on analysis of the data and the process. In terms of the data focus, statistical analysis is a
cornerstone of Analyze, ensuring that potential root causes are not only validated but significant
enough to merit attention. Methods and tools used include Process Maps, Charts and Graphs,
Hypothesis Testing, and Value-Added Analysis.
Andon: Andon is an alert system that can be visual or audible, facilitating quick response to any
problems in the process or system. This system includes a way for employees to stop the
process, physically or electronically, so that the issue can be addressed before production
continues.
ANOVA: ANOVA (Analysis of Variance) is a form of hypothesis testing that determines if there is
a significant difference in the means or averages of two populations of data.
Assumption Busting: Assumption Busting is a brainstorming and questioning technique that does
two things: it identifies and challenges conventional assumptions and eliminates them if they are
obstacles to optimal solutions.
Attribute Data (aka Discrete Data): Attribute data refers to categories or counts that can only be
described in whole numbers; i.e. you can’t have half a defect or half a customer. This type of
data is the opposite of continuous or variable data (temperature, weight, distance, etc.). Typical
Attribute Data refers to the number of defects, number passed vs. number failed as well as the
counts of different categories; i.e. number blue, number red, number yellow, etc. Attribute data
can be represented in percentages and ratios such as 2.1 guests per hotel room or a 75%
occupancy rate, but the source unit, the guest, can still not be truly divided.
Baseline Measures: Baseline measures are data collected to establish the initial capability of a
process to meet customer expectations. By collecting this data prior to making any changes to
the process it is possible to determine if solutions implemented later on have the desired
impact.
P300 COPYRIGHT 2015 GOLEANSIXSIGMA.COM. ALL RIGHTS RESERVED. 3
Batching: Batching is the practice of making large lots of a particular item to gain economic
efficiencies. Although the assumption is that it increases efficiency, batching increases total cycle
time and increases the waste of waiting both internally and for the customer. Batching is
considered the opposite of the concept of "Single-Piece-Flow" where the goal is to use the
smallest batch possible with the optimal size being one unit.
Black Belt: A Black Belt is the second highest level of training for a Six Sigma practitioner; Master
Black Belt is the highest. A Black Belt devotes 100% of their time to Six Sigma and focuses the
execution of specific Six Sigma process improvement projects. In addition to project work, they
are often assigned as a mentor to one or more Green Belts.
Bottleneck: A Bottleneck is a step in the process where the process is limited in the volume it can
handle. This is often the result of specialization, task imbalance or other constraints on capacity.
Bottlenecks constrain the process and limit the ability of the process to flow at the rate of
customer demand.
Box Plot (aka Box and Whisker Plot): A Box Plot is a graphical view of a data set
which involves a center box containing 50% of the data and “whiskers” which
each represent 25% of the data. It divides the distribution of a data set into four
portions: the lower “whisker” contains the first quartile or 25% of the data, the
lower segment of the box contains the second quartile, above the median line
to the top of the box is the third quartile and the upper “whisker” represents the
4th quartile of data. The midpoint of the box represents the median of the data set, and its
position indicates if there is any skew to the data.. The endpoints of the top and bottom whiskers
represent the largest and smallest data points, respectively. Outliers, or data that does not fit the
predominant distribution, are represented by asterisks at the top and bottom of the box plot.
This graph is most useful when comparing two or more strata or data sets.
Brainstorming: Brainstorming is a free-thinking group method for generating ideas to handle a
challenging situation. An underlying maxim for Brainstorming is “from quantity comes quality.”
The primary objective of Brainstorming is to encourage innovation and out-of-the-box thinking.
To achieve this goal, the Brainstorming session is performed with no editing: analysis, discussion,
and criticism are allowed only after the session.
Business Case: A Business Case is a broad statement that helps sell or justify a specific
improvement opportunity to the senior leadership or stakeholders in an organization. This is
generally part of a Lean Six Sigma Project Charter. A Business Case defines how the customer is
negatively impacted, how long they’ve been impacted, and the benefits of making of an
improvement–or, conversely, the risks of not doing so. This is done by tying the improvement
opportunity to the organization’s business objectives, which include their overall business
strategy, customers, and values.
P300 COPYRIGHT 2015 GOLEANSIXSIGMA.COM. ALL RIGHTS RESERVED. 4

Cause and Effect Diagram: A Cause and Effect Diagram is structured brainstorming tool designed
to assist an improvement team in listing potential causes of a specific effect. It is also known as
an Ishikawa Diagram, for its creator, or a Fishbone Diagram, for its resemblance to the bones of a
fish. Causes are often grouped into major categories, which are classically defined as the 6 Ms:
Man/Mind Power (people), Methods (processes), Machines (technology), Materials (raw
materials, information, consumables), Measurements (inspection), and Milieu/Mother Nature
(environment). An additional 2 Ms are also sometimes used: Management/Money Power and
Maintenance.
Central Tendency: Central Tendency is the “center point” of a process distribution. It can be
measured in one of three ways: Median (middle most data point in a sorted data set), Mode
(data value repeated most often), and Mean (average).
Changeover Reduction: Changeover Reduction is the practice of dramatically reducing or
eliminating the time to change from one method or unit to another. This concept is also known
as Set-up Reduction or Single Minute Exchange of Die (SMED) where the goal is to reduce the
changeover time to single digits or under 10 minutes. This was originally developed by Shigeo
Shingo in order to reduce the time spent in setting up equipment or materials since setup does
not add value.
Changeover Time: Changeover Time is the measurement of the cycle time from the moment the
last good part of the previous process is produced to the moment first good part of the
subsequent process is produced. Reducing changeover time is a key component of
implementing a pull production system which operates with as little inventory as possible.
Checksheet: A Check Sheet is a simple tally sheet used to systematically collect data on the
frequency of an occurrence (e.g., the frequency of defects). Useful for all phases of DMAIC,
Check Sheets are best used when the data can be collected by the same person or in the same
location. It is particularly effective for identifying defect frequency, patterns of events, and
possible defect causes.
Chi-Square Test: The Chi-Square Test is a hypothesis test that determines whether a statistically
significant difference (aka variance) exists between two independent groups of discrete data,
ruling out chance. It is useful for determining whether or not improvement implementations
have been successful. This test is performed on proportions from different populations. An
example would be: Assembly Line A produced 462 good parts and 265 defective parts whereas
Assembly Line B produced 538 good parts and 321 defectives and you want to determine if Line
A is truly better or the difference is just due to random chance.
P300 COPYRIGHT 2015 GOLEANSIXSIGMA.COM. ALL RIGHTS RESERVED. 5

Master Black Belt: A Master Black Belt (aka a Coach) is the highest level of training for a Six Sigma
practitioner. Master Black Belts not only guide improvement teams, but are responsible for
identifying improvement projects.
Cockpit Chart (aka Dashboard): A Cockpit Chart is a high level, at-a-glance display of key
performance indicators that are regularly monitored. Ideal for presenting to process owners,
senior leadership and stakeholders, Cockpit Charts vary in composition but typically measure
the performance of Processes, People, Innovation, and Finance.
Common Cause Variation: Common Cause Variation is a type of variation which is natural and
inherent to a process. Common Causes act randomly and independently of each other, are
difficult to eliminate, and often require changes to a process or system. The output of Common
Cause variation generally conforms to a normal distribution and is stable over the time. Contrast
this to Special Cause Variation, which often manifests as an outlier, shift, trend or some other
signal on a graph and is therefore easier to identify and fix without significant modifications to a
system.
Comparative Analysis: Comparative Analysis is a form of deductive logic that makes an item-
by-item comparison using data and facts. This method is most useful when two similar
processes yield significantly different results. Comparative analysis is a low impact, low effort
way of discovering the elements within the processes that are responsible for the difference.
Contingent Actions: Contingent Actions are pre-planned steps scheduled to go into effect when
defects or failures occur. They are designed to minimize damage and cost due to failures.
Continuous Data (aka Variable Data): Continuous Data refers to data that is measured on a
continuum. It is data that is measured on an infinitely divisible scale (e.g., time, weight, and
temperature) such that one half a unit still makes sense; half a minute, half a pound, etc. A
defining characteristic of continuous data is that it requires a gauge or meter in order to be
measured (clock, ruler, scale, thermometer, odometer, etc.). Note that Continuous/Variable Data
is the opposite of Discrete/Attribute Data, which cannot be infinitely divided and still make
sense.
Continuous Improvement: Continuous Improvement broadly describes ongoing, incremental
efforts to improve products and processes. Continuous Improvement with Lean Six Sigma
utilizes a data-driven approach and process analysis to solve problems.
Control Phase: The Control Phase is the last phase of DMAIC, and ensures that improved
processes continue to work predictably and meet the customers’ expectations. In short, Control
ensures any gains are maintained. During this phase the documentation is finalized, monitoring
plans are put into place and response plans are designed in the case that process performance
falls below acceptable levels.
P300 COPYRIGHT 2015 GOLEANSIXSIGMA.COM. ALL RIGHTS RESERVED. 6

Control Chart: Control Charts are time charts designed to display
signals or warnings of special cause variation. Special cause
variation, as distinct from common cause variation, refers to
changes in process performance due to sporadic or rare events
indicating that a process is not “in control.” The advantage of
Control Charts is that they enhance the understanding of process
variation making it easier to take action to reduce special cause variation and improve ongoing
process performance. Graphically, they feature points that represent project mean or variation,
and upper and lower Control Limits. The location of these points determines if a project is “out
of control” and under the influence of common or special causes.
Control Plan: The Control Plan is a guide to continued monitoring of the process, and the
response plan for each of the measures being monitored. These three elements have been
initiated earlier in the process, but in the Control phase, the monitoring is reduced to key input,
process and output measures that will provide critical leading and lagging indicators during the
project tracking period after implementation.
Cost/Benefit Analysis: Cost/Benefit Analysis is a decision-making tool to compare costs
(negative results) vs. benefits (positive results) of a proposed change to a process. The costs can
include labor, equipment, materials and time, and the benefits often include increased customer
satisfaction, increased revenue, cost avoidance and reduced cycle time.
Cost of Poor Quality (COPQ): Cost of Poor Quality (COPQ) quantifies the negative outcomes
(costs) due to waste, inefficiencies, and defects in a process. Cost of Poor Quality is often
represented in dollar amounts (or as a percentage of gross sales), and is composed of both
internal and external failures. The goal of any organization is to reduce COPQ to zero.
Cross Functional Flowchart (aka Deployment or Swimlane Map): A Cross-Functional Flowchart
is a process map that separates process steps by function, department or individual. This
provides a visual that displays not just the steps in a process but also which individuals, group or
department performs those steps. Each row or lane represents a different department or
individual. This type of process map is helpful in terms of understanding who is accountable for
each step and how many hand-offs there are between groups or individuals.
Cross Training: Cross Training is training different employees to perform different tasks outside of
their original role. For example, training Worker A to do Worker B’s job, and training Worker B to
do Worker A’s job. Cross Training improves the flow of the process, enables the sharing of best
practices and increases flexibility in managing the workforce.
Correlation Coefficient (aka Pearson Correlation): A Correlation Coefficient is a statistical
concept expressed as the letter “r” that measures the strength and type of the relationship
P300 COPYRIGHT 2015 GOLEANSIXSIGMA.COM. ALL RIGHTS RESERVED. 7

between two factors (‘X’ and ‘Y’). A Correlation Coefficient is a number between -1 and +1. An ‘r’
of +1 means that there is a perfect, positive correlation between X and Y and the changes in Y
can be attributable to X. Conversely, an ‘r’ of -1 means that there is a perfect negative
correlation between X and Y and the changes in Y can be attributable to X.
Customer: Broadly defined, a Customer is any person (or group of persons) that receives
products or services. In the context of Lean Six Sigma, a Customer refers to anyone who
receives the output (information, goods, services, etc.) of a process. Therefore, depending on
the process, a Customer can include persons both internal and external to the organization or
business.
Customer Focus: A Customer Focus is an emphasis on understanding the needs of a customer; in
short, a Customer Focused organization understands what customers really care about. A proper
Customer Focus results in increased satisfaction by identifying/anticipating their needs, adding
value, and eliminating defects and waste.
Customer Requirements: Customer Requirements are the needs and expectations of the
customer, discovered through a measurable, data-driven (“hard evidence”) approach.
Customer Value: Customer Value is a term that underlies the fact that the value of any given
process step or output is defined by the customer. They key is to define what is of value to the
customer and focus the process outputs and improvement efforts to provide that value.
Cycle Time: Cycle time is the measurement of the time elapsed from the beginning of a process
or a step to its end. Reduction of cycle time focuses on bringing products and services to market
faster in order to provide value to customers
Dashboard (aka Cockpit Chart): A Dashboard is high level, at-a-glance display of key
performance indicators that are regularly monitored. Ideal for presenting to process owners,
senior leadership and stakeholders, Dashboards vary in composition but typically measure the
performance of Processes, People, Innovation, and Finance.
Data Analysis: Data analysis is the practice of both determining how to display data and then the
interpretation of the resulting data displays. Typical charting and graphing tools include
Histograms, Time Charts, Pareto Charts, Control Charts, Scatter Plots as well as Bar charts and
Pie charts. This analysis of displayed data is often a key step to finding clues to process issues.
Data Collection Plan: This is a well thought out approach to data collection that includes
information around where to collect data, how to collect it, when to collect it and who is
responsible. This plan is prepared for each measure and includes helpful details such as the
operational definition of the measure as well as any sampling plans.
P300 COPYRIGHT 2015 GOLEANSIXSIGMA.COM. ALL RIGHTS RESERVED. 8

Defect: A Defect is any process output, product, or service that does not meet customer
requirements. Defects are one of the 8 Wastes.
Defect Opportunity: A Defect Opportunity is any possible defect that is important to the
customer. Defect Opportunities can be present in any type of process, product, or service, but
are restricted to those that are critical to the customer. E.g., if only 3 out of 5 total aspects of a
widget are important to a customer, then the total defect opportunities is 3. In Lean Six Sigma,
Defect Opportunities are useful in calculating DPO (Defects Per Opportunity) and DPMO
(Defects Per Million Opportunities).
Defective: Defective is the term applied to any process, product, or service with one or more
defects.
Define Phase: Define is the first phase of the DMAIC method, and involves defining the problem
or opportunity, determining the voice of the customer/customer requirements, and outlining the
project purpose/scope. This foundational phase paves the way for an improvement team to
narrow and describe exactly what is being targeted for improvement. The goal(s) set during this
phase define when a project can be considered successful.
Demand Leveling: Demand Leveling involves using external techniques to remove the variation
when there are big swings in the volume of customer demand. Classic techniques involve
bargains during off-peak hours or other incentives to effectively level demand.
Deployment Map (aka Swimlane Map or Cross-Functional Chart): A Deployment Map is a
process map that separates process steps by function, department or individual. This provides a
visual that displays not just the steps in a process but also which individuals, group or
department performs those steps. Each row or lane represents a different department or
individual. This type of process map is helpful in terms of understanding who is accountable for
each step and how many hand-offs there are between groups or individuals.
Discrete Data (aka Attribute Data): Discrete data refers to categories or counts that can only be
described in whole numbers; i.e. you can’t have half a defect or half a customer. This type of
data is the opposite of continuous or variable data (temperature, weight, distance, etc.). Typical
discrete data refers to the number of defects, number passed vs. number failed as well as the
counts of different categories; i.e. number blue, number red, number yellow, etc. Discrete data
can be represented in percentages and ratios such as 2.1 guests per hotel room or a 75%
occupancy rate, but the source unit, the guest, can still not be truly divided.
Dispersion: Dispersion is a statistical concept that describes the variation between values in a
data set. Dispersion is most commonly measured by standard deviation or variance; a large
dispersion indicates widely scattered values, while a small dispersion indicates tightly clustered
values.
P300 COPYRIGHT 2015 GOLEANSIXSIGMA.COM. ALL RIGHTS RESERVED. 9

DMAIC: DMAIC is a methodology for
improving existing processes. DMAIC
stands for Define, Measure, Analyze,
Improve, and Control.
DMADV: DMADV is a methodology
for designing new, non-existing
processes. DMADV stands for Define,
Measure, Analyze, Design, and Verify.
Documentation: Project Documentation is the deliberate preservation of process improvement
work. Key outputs such as process charters, process maps, customer requirements, and charts
and graphs are captured for multiple purposes; as a display to leadership, as educational tools
for process participants, as guides for team leaders and as a way to transfer best practices.
Downstream: Downstream refers to any processes or activities that occur after a given process.
Defects per Million Opportunities (DPMO): Defects per Million Opportunities, or DPMO, is a
metric that indicates the number of defects in a process per one million opportunities. DPMO is
calculated by the number of defects divided by (the number of units times the number of
opportunities), multiplied by one million.
Defects per Opportunity (DPO): Defects per Opportunity, or DPO, is a metric that indicates the
number of defects in a process per opportunity. DPO is calculated by the number of defects
divided by (the number of units times the number of opportunities).
Effectiveness: Effectiveness is a measurement that refers to how well a process output meets
customer requirements. It is tied closely to customer satisfaction. Effectiveness is measured
using both value-adding and non-value adding activities.
Efficiency: Efficiency measures the amount of resources used in maximizing the output of a
process.
Efficiency & Effectiveness Matrix: The Efficiency & Effectiveness Matrix is tool used to balance
the types of measurement applied to a process. The goal is to monitor data that indicates the
effectiveness of a given process or how well it meets customer expectations as well as the
efficiency of a process by monitoring the amount of resources required, materials used and time
spent producing goods and services. This matrix facilitates the listing of all proposed
measurement in order to uncover any imbalances in the Data Collection Plan. The goal is to pay
attention to both kinds of measures in order to satisfy customer needs profitably.
P300 COPYRIGHT 2015 GOLEANSIXSIGMA.COM. ALL RIGHTS RESERVED. 10

Extra-Processing: Extra Processing refers to the concept of adding more features or producing a
product or service of higher quality than required by the customer. Extra-Processing is one of
the 8 Wastes.
External Failure: An External Failure is any defective item, unit, or output that passes through an
entire process and is received by the customer. External Failures lead directly to customer
dissatisfaction. External Failures are very costly, as they must not only be fixed, but customer
perceptions must be repaired by addressing the Voice of the Customer. Non-value added
activities are usually involved, if not a cause of External Failures.
Facilitator: A Facilitator is an intermediary who helps parties involved in a process improvement
project collaborate. Facilitators can either be a third party or a team member/leader. Their
primary objectives are to: remain neutral, unbiased, and sensitive to all parties involved,
encourage the free flow of opinions, drive Lean Six Sigma projects forward towards progress.
Failure Modes & Effects Analysis (FMEA): Failure Modes & Effects Analysis (FMEA) is a risk
management tool that identifies and quantifies the influence of potential failures in a system.
FMEA analyzes potential failures using three criteria:
1. Occurrence (failure cause and frequency)
2. Severity (determine failure mode and its effect)
3. Detection (likelihood of failure detection).
Fishbone Diagram: A Fishbone Diagram is structured
brainstorming tool designed to assist an improvement team in
listing potential causes of a specific effect. It’s name derives from
its resemblance to the bones of a fish. It is also known as an
Ishikawa Diagram, for its creator. Causes are often grouped into
major categories, which are classically defined as the 6 Ms: Man/Mind Power (people), Methods
(processes), Machines (technology), Materials (raw materials, information, consumables),
Measurements (inspection), and Milieu/Mother Nature (environment). An additional 2 Ms are
also sometimes used: Management/Money Power and Maintenance.
Flow: Flow is the ideal state of processes such that units and services move through each
process step at the rate of customer demand. This means there are no bottlenecks or other
forms of waste in the process.
Focus Groups: Focus Groups are facilitated discussion sessions comprised of customers that
help an organization understand the Voice of the Customer (VOC). Typical in-person Focus
Groups are 1-3 hour sessions with no more than 20 customers.
P300 COPYRIGHT 2015 GOLEANSIXSIGMA.COM. ALL RIGHTS RESERVED. 11

Force Field Analysis: Force Field Analysis is a brainstorming method which pits
“driving” (positive) and “restraining” (negative) forces that support or oppose an idea. In its
simplest form, Force Field Analysis resembles a Pros & Cons chart, with driving forces listed on
one side, and restraining forces listed on the other. A rating system can be used to identify the
strengths of each of these forces, with the overall goal to maximize driving forces and minimize/
eliminate restraining ones.
Future State Map: The Future State Map is guide to the goal state of the process. This is generally
projected out at 4 to 8 months from the Current State Map and provides a visual of how the
process will flow when all identified forms of waste are removed and the process is streamlined.
This helps to direct and focus improvement efforts.
Gemba (aka Workplace): Gemba is a
Japanese term that translates to the
"real place" or where the work takes
place. "Going to Gemba" is a
philosophy that instructs
management to spend time where
real work occurs in order to build
profound knowledge of the process.
Gemba Walk (aka Process Walk): A Gemba Walk is an informational tour of the area where the
work is taking place. A Gemba walk is a series of structured, on-site interviews with
representative process participants with the goal of gaining a comprehensive understanding of
the process. Interviews focus on detail such as process time, wait time, defect rates, root causes
and other information that can lead to targeted improvements.
Gemba Walk Interview Sheet (aka Process Walk Interview Sheet): The Gemba Walk Interview
Sheet is a simple data collection form, designed for transactional processes. It is used to ask
pertinent questions during a Gemba or Process Walk.
Goal Statement: A Goal Statement states the desired results of a process improvement project. It
is a fundamental part of any Project Charter. Goal Statements should be clearly and precisely
written, with specific, measurable goals (e.g., Improve delivery time by 25%). Goal Statements
are focused exclusively on the goal: they should avoid mention of causes or solutions.
Green Belt: A Green Belt is Six Sigma practitioner trained in DMAIC. They assist Black Belts and
Master Black Belts in process improvement projects. Green Belts are generally not dedicated
100% to improvement projects but spend at least 20% of their time either participating on or
running project teams.
P300 COPYRIGHT 2015 GOLEANSIXSIGMA.COM. ALL RIGHTS RESERVED. 12

Handoff: A Handoff is when a product or item “changes hands” between individuals or
departments. Handoffs are prone to adding defects to a process.
Histogram: Histograms are frequency charts. In Lean Six Sigma,
they show the distribution of values produced by a process. In
other words, a histogram is a visual display of how much variation
exists in a process.
Huddle Meeting: A daily meeting that is approximately 15 minutes long with direct reports.
Hypothesis Statement: A Hypothesis Statement is an educated guess about the suspected cause
(or causes) of defects in a process.
Improve Phase: the Improve Phase is the fourth phase of the DMAIC process and focuses on
identifying opportunities for improvement based on the discoveries uncovered in the data and
the process in the Analyze Phase. Once potential solutions are identified, the are evaluated and
selected for implementation. Risk assessment, piloting and verification that the changes had the
desired impact take place prior to moving on to the Control Phase.
Impact Effort Matrix: The Impact Effort Matrix is a 2 x 2 grid that helps you assess solutions for
their relative impact given the effort required. It provides a quick way to filter out solutions that
might not be worth the effort. The best solutions are in the upper right quadrant, easy to
implement but with substantial impact.
Input: An Input is a resource (product, service, data, labor, etc.) that is added to a Process by a
Supplier. Inputs are the second step of SIPOC which is a high-level map of the process. Inputs
are often measured in terms of volume and quality to understand their impact on a process.
Input Measures: Input Measures are measures that describe an Input; they are generally related
to the quality or quantity of the Input as dictated by the Supplier.
Institutionalization: Institutionalization is the set of changes to an organization that make any
process improvement permanent. These changes not only include procedural ones, but cultural
(employee attitude and behavior) changes as well.
Inspections, Decisions, & Approvals: Inspections, Decisions and Approvals add time to the
process and, unfortunately, they are not always the best methods of insuring quality. Identifying
where Inspections, Decisions or Approvals occur in the process and assessing the value of those
steps provide streamlining opportunities.
Internal Failure: Internal Failure refers to any defects in a process that are identified and
eliminated before being delivered to the customer.
P300 COPYRIGHT 2015 GOLEANSIXSIGMA.COM. ALL RIGHTS RESERVED. 13

Inventory: Inventory is the materials, parts, or units sitting unused in a process. Excess inventory
before a process step indicates a bottleneck and maintaining more inventory than required ties
up capital and takes up valuable storage area. Inventory is one of the 8 Wastes.
Just-In-Time (aka JIT): Just-In-Time is a system for producing and delivering the right items, at
the right time, in the right place, and in the right amounts. This concept is integral to the idea of a
Pull system.
Kaizen Event (aka Rapid Improvement Event): A Kaizen Event is also known as a Rapid
Improvement Event. Kaizen is a Japanese word that combines the ideas of “change” and
“goodness” which basically translates to “improve for the better.” In practice a Kaizen is a Rapid
Improvement Event that generally spans from 1 to 5 days and involves key process participants
focusing on solving a narrowly scoped process improvement opportunity. The difference
between Kaizen and typical workshops is threefold:
• The planning for the event is extensive
• Leadership has given explicit approval for change
• The agreed upon improvement takes place before the Kaizen event is completed
Kanban (aka signboard): Kanban is a Japanese term that translates
to "card" or “board” and indicates some form of signal within a
process. Kanbans are part of Just In Time (JIT) processing where
either a physical or electronic device indicates that it’s time to
order inventory, process a unit or move to the next step in a
process.
Kano Model: Kano Model is a technique that categorizes customer requirements into three
types:
1. Delighters
2. Satisfiers
3. Dissatisfiers.
Delighters are features that customers don’t know they want, but are delighted to find them —
“bonuses.” Satisfiers are features that customers are aware of and not necessary, but improve
customer satisfaction. Dissatisfiers are features that customers absolutely require, the absence
of which result in customer dissatisfaction.
Lead Time: Lead time is the measure of the cycle time from the moment a customer places an
order to the moment they receive the desired goods or services.
P300 COPYRIGHT 2015 GOLEANSIXSIGMA.COM. ALL RIGHTS RESERVED. 14

Leader Huddle Meetings: Leader Huddle Meetings are regular (often daily) meeting with direct
reports. The Huddle Meetings are conducted in front of the Process Performance Boards in order
to work from a visual of organizational metrics. The meetings take about 15 minutes and are
often referred to as “Stand Up” meetings to ensure they are completed quickly.
Leader Process Walks: When leaders go to where the work actually occurs to observe the
process.
Leader Standard Work (aka LSW): Actions, behaviors and tools that leaders use to build and
sustain a Lean Culture.
Leader Task Boards: Leader Task Boards are a visual check system to review critical workplace
items. It’s comprised of a list of tasks related to safety, quality, production, cost, Leader Standard
Work and daily management. It’s a popular Visual Management tool that helps leaders monitor
task completion at a glance.
Lean: Lean is a systematic method for the elimination of waste from a process with the goal of
providing what is of value to the customer. Much of what constitutes Lean stems from tools
developed at Toyota while creating the Toyota Production System. Although the Lean roots are
in manufacturing and production environments, it is widely applied to transactional processes
as well.
Lean Culture: Lean Culture refers to the combination of defining customer value, aligning around
a common purpose, striving for perfection while at the same time respecting and developing
employees. The idea is that there is more to process improvement than using a set of tools and
concepts. The idea is that the people who do the work should be the ones who fix the
processes. Lean culture results when in the quest to provide customer value, the leadership
supports and promotes the building of the "problem solving muscle" of the workforce.
Line Balancing: The practice of dividing work in a process in such a way as to produce an equal
cycle time for each step or member of a process.
Management By Fact: Management By Fact uses data and measurements in decision-making. A
cornerstone of Lean Six Sigma, it relies on quantitative analysis as opposed to “gut feel” to make
smart, informed decisions.
Measure Phase: The Measure Phase is the second phase of the DMAIC process. During this
phase the effort is to determine key ways to measure the process, define each of the key
measures and then form a plan to detail who will collect the data, in what quantity and where.
This data used as a baseline of for the process and is then displayed and studied in the Analyze
Phase.
P300 COPYRIGHT 2015 GOLEANSIXSIGMA.COM. ALL RIGHTS RESERVED. 15

Measurement Selection Matrix: A Measurement Selection Matrix helps validate and choose key
measures by assessing the strength of their relationship to customer requirements.
Mistake Proofing (aka Poka Yoke): Mistake-Proofing, also known as Poka Yoke, means to
consciously and diligently try to eliminate defects by preventing human errors before they occur
or create alarms to warn of potential defects.
Moment of Truth: The Moment of Truth is when a customer interacts with a process and forms
an opinion (positive, negative, or indifferent) about that process.
Monitoring Plan: A Monitoring Plan is a detailed data collection plan that supports the Control
Plan. It lists the measure, the targets for each measure, how the measure will be checked, how
often the measure will be checked, and who will check the measure.
Motion: Motion refers to the movement of employees involved in a given task. Motion refers
only to the movement of the person as opposed to the unit and excess motion increases cycle
time. Motion is one of the 8 Wastes.
Muda (aka Waste): Muda is the Japanese term for "waste" which refers to anything in a process
that does not add value from the customer's perspective. The 8 Wastes are a comprehensive list
of the most commonly found wastes in a process.
Multi-Voting: Multi-Voting is a voting/brainstorming technique that prioritizes ideas. Its primary
goal is to reduce the range of options, thereby preventing “information overload”. Also known as
N/3 voting, in Multi-Voting, N refers to the total number of ideas. Every team member is then
given N/3 votes and instructed to vote on the most important ideas; the team member can only
assign one vote per idea. E.g., if there are 30 ideas, each team member gets 30/3 or 10 votes
each. Since there are less votes then there are ideas, the less important ideas will naturally be
“weeded out”, thereby reducing the number of ideas the team must contend with.
New Procedure Audit: The New Procedure Audit provides an easy way to check for adaptation
to the new way of doing things once a project is successfully completed. It serves as a remind
for both you and the process participants.
Non-Utilized Talent: Non-Utilized Talent refers to the concept that employees are not being
utilized to their full capability or, conversely that they are engaged in tasks that would be more
efficiently done by someone else. Non-Utilized Talent is one of the 8 Wastes which is also
known as the waste of intellectual capital.
P300 COPYRIGHT 2015 GOLEANSIXSIGMA.COM. ALL RIGHTS RESERVED. 16

Non-Value Adding Activities: Non-Value Added Activities refer to process steps that fail to meet
one or more of the following criteria:
• The step transforms the item toward completion (something changes)
• The step is done right the first time (not a rework step)
• The customer cares (or would pay) for the step to be done
Non-Value Adding Activities add to the cost of doing business. Typical Non-Value Adding
activities include rework, inspection, movement and any of the 8 Wastes.
Null Hypothesis: The Null Hypothesis, known as HO, is the hypothesis statement that maintains
there is no difference between two or more data samples. The burden of any hypothesis test is
to disprove the Null. If there is a greater than 5% probability that the difference is due to chance,
then the Null Hypothesis is cannot be rejected and the Alternative Hypothesis should not be
pursued.
Operational Definition: Operational Definitions describe the terms used within measures such as
“accurate” or “complete” and if it’s a time-based measure, they include the stop and start points.
These detailed description of each measurement are designed to ensure that each measurement
is interpreted the same way by different people. They are key to insuring the integrity of any
measurement system.
Output: An Output is any resource (product, service, data, labor, etc.) that is the result of a
process. In a Process, the Output occurs at the end. Likewise, an Output is the last step of
SIPOC.
Output Measures: Output Measures are measures that describe an Output.
Overproduction: Overproduction means producing something faster or in more abundance than
needed. Overproduction is one of the 8 Wastes.
Pareto Chart: A Pareto Chart is a quality chart of discrete data that
helps identify the most significant types of defect occurrences. It
does this by showing both frequency of occurrences (bar graph)
and cumulative total of occurrences (line graph) on a single chart.
The type of occurrences are organized on the X-Axis from highest
to lowest frequency. Respectively, the left Y-Axis shows
frequency of occurrences, while the right Y-Axis shows the total percentage.
Pareto Principle: The Pareto Principle is a quality principle that asserts that the majority of effects
come from a minority of causes. AKA the 80/20 rule, 80% of effects come from 20% of causes.
P300 COPYRIGHT 2015 GOLEANSIXSIGMA.COM. ALL RIGHTS RESERVED. 17
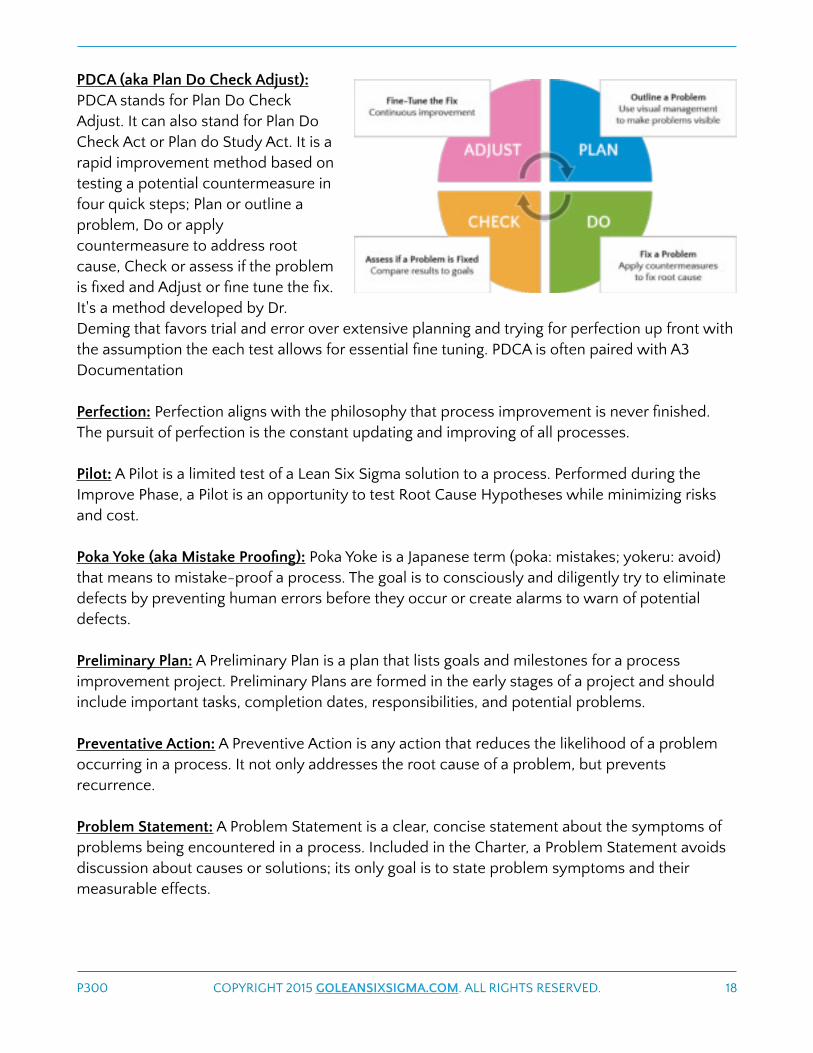
PDCA (aka Plan Do Check Adjust):
PDCA stands for Plan Do Check
Adjust. It can also stand for Plan Do
Check Act or Plan do Study Act. It is a
rapid improvement method based on
testing a potential countermeasure in
four quick steps; Plan or outline a
problem, Do or apply
countermeasure to address root
cause, Check or assess if the problem
is fixed and Adjust or fine tune the fix.
It's a method developed by Dr.
Deming that favors trial and error over extensive planning and trying for perfection up front with
the assumption the each test allows for essential fine tuning. PDCA is often paired with A3
Documentation
Perfection: Perfection aligns with the philosophy that process improvement is never finished.
The pursuit of perfection is the constant updating and improving of all processes.
Pilot: A Pilot is a limited test of a Lean Six Sigma solution to a process. Performed during the
Improve Phase, a Pilot is an opportunity to test Root Cause Hypotheses while minimizing risks
and cost.
Poka Yoke (aka Mistake Proofing): Poka Yoke is a Japanese term (poka: mistakes; yokeru: avoid)
that means to mistake-proof a process. The goal is to consciously and diligently try to eliminate
defects by preventing human errors before they occur or create alarms to warn of potential
defects.
Preliminary Plan: A Preliminary Plan is a plan that lists goals and milestones for a process
improvement project. Preliminary Plans are formed in the early stages of a project and should
include important tasks, completion dates, responsibilities, and potential problems.
Preventative Action: A Preventive Action is any action that reduces the likelihood of a problem
occurring in a process. It not only addresses the root cause of a problem, but prevents
recurrence.
Problem Statement: A Problem Statement is a clear, concise statement about the symptoms of
problems being encountered in a process. Included in the Charter, a Problem Statement avoids
discussion about causes or solutions; its only goal is to state problem symptoms and their
measurable effects.
P300 COPYRIGHT 2015 GOLEANSIXSIGMA.COM. ALL RIGHTS RESERVED. 18

Process: A Process is a stepwise combination of people, tools, materials, and methods where an
Input is converted into an Output. A fundamental term, the goal of any Lean Six Sigma project is
to streamline Processes by eliminating waste. This results in increased revenue and improved
customer satisfaction.
Process Analysis: This a a broad concept that entails the study of detailed process maps. “As Is”
process steps are scrutinized for bottlenecks, rework loops, missed handoffs, redundancy and
other inefficiencies as potential root causes of defects and waste. Analysis of the process and
data are the two main avenues used during root cause analysis.
Process Capability: Process Capability is a measurement of how well a Process’ Outputs meet
Customer Requirements. Strong Process Capability indicates that a high percentage of Output
meets Customer Requirements, while Weak Process Capability means the opposite. Weak
Process Capability is usually due to unacceptably high variability of Output that falls outside
Customer Requirements.
Process Capability Indicators: Process Capability Indicators measure how closely Process
Outputs align within customer specifications when using continuous data (time, weight, volume,
etc). These measures involve comparisons of standard deviation and process mean to customer
requirements. Cpu, Cpl and Cpk are the capability measures for continuous data, with higher
values being more desirable. Any number less than one indicates a process that is not currently
capable.
Process Improvement: Process Improvement refers to the continuous, gradual reduction of
defects, errors, costs, and wasted time in a process.
Process Management: Process Management is ongoing, high-level monitoring of processes.
Process Management uses important key measures that provide feedback about the overall
“state” of a process.
Process Map: A Process Map is a step-by-step diagram that shows the activities needed to
complete a process. Creating a Process Map is one of the first steps in a Lean Six Sigma process
improvement project.
Process Measures: Process Measures are any and all measurements of a Process. Process
Measures are critical to understanding not only the baseline state of a Process, but if (and if so,
how much) improvements have been made due to Lean Six Sigma project.
P300 COPYRIGHT 2015 GOLEANSIXSIGMA.COM. ALL RIGHTS RESERVED. 19

Process Performance Boards: Process Performance Boards are displays that enable leaders to
visually track People, Quality, Delivery, Cost and Process Improvement. They enable leaders to
answer questions such as, “Are we taking care of our people?”, “Are we efficient?” or “Are we
effective?”. These are forms of Visual Management often used during Leader Huddle Meetings to
ensure the organization is on track.
Process Redesign & Reengineering: Process Redesign is a significant reworking of a Process that
(optimally) yields significant, measurable improvement in Output. Process Redesign is best
described as “wiping the slate clean” to allow for more creative, sweeping changes.
Reengineering is an even more significant variant of Process Redesign, sometimes increasing the
scope to include the reworking of the entire business (as opposed to a process).
Process Time: Process time is a measure of the time a product is actually being worked on in a
machine or by an employee in a work area.
Process Walk (aka Gemba Walk): A Process Walk is an informational tour of the area where the
work is taking place. A Process walk is a series of structured, on-site interviews with
representative process participants with the goal of gaining a comprehensive understanding of
the process. Interviews focus on detail such as process time, wait time, defect rates, root causes
and other information that can lead to targeted improvements.
Process Walk Interview Sheet (aka Gemba Walk Interview Sheet): The Process Walk Interview
Sheet is a simple data collection form, designed for transactional processes. It is used to ask
pertinent questions during a Gemba or Process Walk.
Project Charter: The Project Charter is an official, basic document that outlines a process
improvement project. It is the first step in a Lean Six Sigma project, and therefore takes place in
the Define phase of DMAIC. However, it can be periodically reviewed, refined, and revised
throughout the project. The elements of a Project Charter can vary, but they generally include
the Business Case, Problem Statement, Goal Statement, Team Members/Roles, and Constraints/
Boundaries, and Project Scope.
Project Selection Tool: The Project Selection Tool helps you determine which projects are good
Lean Six Sigma projects based on the impact it may have on customers, what the potential time
savings are, what the potential cost savings are, and how manageable the projects are.
Proportion Defective: Proportion Defective is the fraction of units that contain defects.
Proportion Defective is a percentage value. It is calculated by dividing the number of defective
unites by the total number of units, and then multiplying by 100 to get a percentage.
P300 COPYRIGHT 2015 GOLEANSIXSIGMA.COM. ALL RIGHTS RESERVED. 20

Pull: Pull systems refer to the goal of having units “pulled” through the process at the rate of
customer demand. The opposite of a Pull system is a “Push” system in which goods or services
are prepared ahead of time potentially resulting in excess inventory or increased waste. JIT (Just
In Time) and Kanban are part of Pull systems.
Push: Push systems refer to processes that rely on forecasting or the practice of creating excess
goods and services to maintain a buffer. This method of meeting customer demand can result in
unused goods and wasted labor. The goal of Lean Six Sigma is JIT (Just In Time) or Pull system.
Quality: Quality describes how well a process consistently meets customer requirements.
RACI: A RACI Matrix is a powerful tool that helps increase accountability for a project. RACI
stands for Responsible, Accountable, Consulted and Informed. It provides structure and clarity
to projects by listing action items, responsible people and follow-up items.
Rapid Improvement Event (aka Kaizen Event): A Rapid Improvement Event is also known as a
Kaizen Event. In practice a Rapid Improvement Event generally spans from 1 to 5 days and
involves key process participants focusing on solving a narrowly scoped process improvement
opportunity. The difference between Rapid Improvement Events and typical workshops is
threefold; the planning for the event is extensive, leadership has given explicit approval for
change and the agreed upon improvement takes place before the Rapid Improvement Event is
completed.
Redundancy: Redundancy is when the same steps are done more than once in a process. To
reduce Redundancy, look for limitations causing multiple entry of the same data or materials.
Repeatability: Repeatability is a measurement concept where a single individual measures the
same results each time. Repeatability is closely linked with Reproducibility.
Reproducibility: Reproducibility is a measurement concept where different individuals measure
the same results each time. Reproducibility is closely linked with Repeatability.
Response Plan: The response plan for a process establishes, for each measure being monitored,
a threshold or trigger level for that process measure. When a process performance hits a
trigger level, the response plan details what immediate and long-term actions must be taken to
return to and maintain the desired performance.
P300 COPYRIGHT 2015 GOLEANSIXSIGMA.COM. ALL RIGHTS RESERVED. 21

Rework Loop: A Rework Loop is a situation where a step in a
process is repeated in order to correct a defect; also known as
backtracking. Rework Loops are work that must be done over and
over. They often become an accepted part of the process as
people get used to them over time. To find Rework Loops, look for
places where large amount of work move back in the process to
be fixed. Rework Loops are Non-Value Adding Activities and are
undesirable, as they add to cost and cycle time.
Risk Management: Risk Management is a continual “look-ahead”
process for minimizing the uncertainty and negative impacts of risks. Risk Management involves
identifying, analyzing, planning for, monitoring, and controlling risks.
Rolled Throughout Yield (YRT): A Rolled Throughput Yield (YRT) is a percent that measures how
many units “roll through” a process, first pass, without defects. This is a measure of internal
efficiency where YRT estimates how likely a unit will go from input to output without requiring
rework or scrap. YRT is calculated by determining the yield at each process phase, and then
multiplying those yields by each other in decimal form. The resulting yield gives a more accurate
assessment of internal waste as well as the odds of a customer experiencing an error.
Root Cause Hypothesis: Root Cause Hypothesis is an educated guess as to the cause of a
problem in a process. Root Cause Hypothesis is part of the Analyze Phase in DMAIC.
In order to form Hypotheses regarding the causes of process issues, one must conduct Root
Cause Analysis which involves questioning and investigating to move past symptoms to the the
true root of the problem.
Sampling: Sampling is a measurement technique where smaller amounts of representative data
can be used to understand the larger population. The goal is to take the smallest amount of data
possible while still being able to make statistically sound assessments. This avoids spending time
and money analyzing an entire population of data when it’s not truly necessary.
Sampling Bias: Sampling Bias results when Samples are collected in such a way that they no
longer represent the entire population. Typical sources of bias result from collecting data based
on convenience or some preconceived judgements. This can result in data that does not
represent the larger population which means decisions based on this data can be equally faulty.
Scatter Plot: A Scatter Plot is a chart that shows the relationship between two variables (if any).
A Scatter Plot is also known as an XY Plot since the variables are plotted on the X and Y axis. The
strength of correlation on a Scatter Plot can be measured using a Correlation Coefficient.
P300 COPYRIGHT 2015 GOLEANSIXSIGMA.COM. ALL RIGHTS RESERVED. 22

Scope: Scope is a clear statement that defines what is included (and, by exclusion, what is not
included) in a Lean Six Sigma process improvement project. Scope is therefore part of the
Define phase in DMAIC and is defined in the Project Charter. In other words, Scope sets the
limits of what a process improvement project can accomplish.
Seiketsu (aka Standardize): Seiketsu is the Japanese word for "Standardize" which is the fourth
step in the 5S method. The goal is to establish standards for the first three steps in the 5S
method such that all employees know how to maintain the workplace.
Seiri (aka Sort): Sieri is Japanese word for "Sort" which is the first step in the 5S method. The goal
is to remove unnecessary items from the workplace and keep only what's needed in the
appropriate quantities.
Seiso (aka Shine): Seiso is the Japanese word for "Shine" which is the third step in the 5S method.
The goal is to sweep or clean the workplace and use cleaning as a form of inspection. This can
refer to the shop floor or the office as well hard drives.
Seiton (aka Set in Order): Seiton is the Japanese word for "Set In Order" which is the second step
in the 5S method. The goal is to make items easy to find in the areas they are needed to enable
the flow of the process.
Set in Order (aka Seiton): Set in Order, also known as "Seiton", is the second step in the 5S
method. The goal is to make items easy to find in the areas they are needed to enable the flow of
the process.
Setup Reduction: Setup Reduction is the practice of dramatically reducing or eliminating the
time to change from one method or unit to another. This concept is also known as Changeover
Reduction or Single Minute Exchange of Die (SMED) where the goal is to reduce the changeover
time to single digits or under 10 minutes. This was originally developed by Shigeo Shingo in
order to reduce the time spent in setting up equipment or materials since setup does not add
value.
Shadow Boards: Shadow Boards are visual methods of storing tools or
materials and are always placed where the work is being done. Each
shadow board consists of outlines or “shadows" in the shape of
individual items to make it obvious where each should be put away. The
shadow board accomplishes two essential goals of the visual workplace
at once: it provides guidance for where to store things while at the same
time making it obvious when a tool or item is missing.
P300 COPYRIGHT 2015 GOLEANSIXSIGMA.COM. ALL RIGHTS RESERVED. 23

Shine (aka Seiso): Shine, also known as "Seiso", is the third step in the 5S method. The goal is to
sweep or clean the workplace and use cleaning as a form of inspection. This can refer to the
shop floor or the office as well hard drives.
Shitsuke (aka Sustain): Shitsuke is the Japanese word for "Sustain" which is the fifth step in the 5S
method. The goal is to maintain the standards established in the previous 5S steps which
generally involves audits of the work place.
Single-Piece-Flow: Single-Piece-Flow is the concept that products should flow from operation
to operation in the smallest increment, with one piece being the ideal. The Single-Piece-Flow
emphasizes that batching increases cycle time. The idea is that products should be pulled from
the preceding operation as needed which prevents overproduction or excess inventory.
SIPOC: A SIPOC is a high-level view of a process. It stands for Suppliers, Inputs, Process,
Outputs, and Customers. A SIPOC is ordered from start to finish. In conversational English, every
Process starts with Suppliers, who provide Inputs to the Process, which results in an Output that
is delivered to Customers.
Six Sigma: Six Sigma is a process improvement strategy that improves Output quality by
reducing Defects. Six Sigma is named after a statistical concept where a process only produces
3.4 defects per million opportunities (DPMO). Six Sigma can therefore be also thought of as a
goal, where processes not only encounter less defects, but do so consistently (low variability).
P300 COPYRIGHT 2015 GOLEANSIXSIGMA.COM. ALL RIGHTS RESERVED. 24

SMED (aka Single Minute Exchange of Die): SMED or "Single Minute Exchange of Die" is the
practice of dramatically reducing or eliminating the time to change from one method or unit to
another where the goal is to reduce the changeover time to single digits or under 10 minutes..
This concept is also known as Set-up Reduction or Changeover Reduction. This was originally
developed by Shigeo Shingo in order to reduce the time spent in setting up equipment or
materials since setup does not add value.
Sort (aka Seiri): Sort, is also known as "Seiri", is the first step in the 5S method. The goal is to
remove unnecessary items from the workplace and keep only what's needed in the appropriate
quantities.
Spaghetti Chart: The Spaghetti Chart is a graphical
tool used to track the movement of people and
distances travelled in a work process. Spaghetti
charts track movement in office spaces as well as
manufacturing shop floors. This tool name derives
from the tendency of a finished diagram to
resemble cooked spaghetti.
Special Cause Variation: Special Cause Variation refers to variation in a process which is
sporadic and non-random. All processes contain Common Cause Variation, but processes that
exhibit Special Cause Variation do not perform in a predictable manner and are technically not
in Control. Once Special Cause Variation has been identified it should be addressed specifically
and fixed or planned for. Unlike Common Cause Variation, this is generally possible without
significant modifications to a system.
Statistical Process Control (SPC): Statistical Process Control is a quality control concept that uses
statistical methods to monitor processes. SPC uses Control Charts to gather and analyze data,
and helps to determine if processes are “out of control”, and, if so, under the influence of
Common or Special Causes.
Stakeholder: A Stakeholder is any individual who is affected by or can affect a process
improvement project. In other words, a Stakeholder is anyone who has a “stake” in a project.
Stakeholders’ interests should always be considered in project.
Stakeholder Analysis: A Stakeholder Analysis enables you to outline who has a vested interest in
how a process performs. Remember that stakeholders do not receive the product or service. It
helps you determine how and when to reach out and communicate with stakeholders to build
buy-in, which is critical to a project’s success.
Standard Deviation: Standard Deviation is a statistical measure that shows the average amount
that values vary (aka “Dispersion”) from the mean. A low Standard Deviation means that values
P300 COPYRIGHT 2015 GOLEANSIXSIGMA.COM. ALL RIGHTS RESERVED. 25

cluster very close to the mean, while a high Standard Deviation means that values are spread
out far from the mean.
Standard Work: Standard Work refers to the goal of eliminating the variation in how a process or
process step is completed. This is in response to the problem of process participants developing
their own preferred ways of completing any given task. The concept dictates that if there is no
one “best” method being practiced then there is no way of achieving process excellence.
Standardize (aka Seiketsu): Standardize, also known as "Seiketsu", is the fourth step in the 5S
method. The goal is to establish standards for the first three steps in the 5S method such that all
employees know how to maintain the workplace.
Storyboard: Project Storyboards are ready-to-go project overviews. They communicate a
success story of process improvement projects and highlight the project as an example of real
world application of Lean Six Sigma tools. The Storyboard also shares lessons learned so that
others can learn from mistakes and replicate success.
Stratification: Stratification is a data analysis technique where values are grouped into different
layers (i.e., “strata”) in order to better understand data. Data can be stratified by who (type of
person), what (data types), when (the time or date data was collected), and where (the location
data was collected).
Subject Matter Expert: A Subject Matter Expert is a person who is an expert on a given topic or
skill. In Lean Six Sigma, Subject Matter Experts show a high level of expertise in a specific
process. They are particularly valuable in the Define phase of a process improvement project.
Supermarket: Supermarket refers to a visual stocking system used in
tandem with Kanban or reorder signals in a Pull system. The name
comes from the type of shelving used in a supermarket where as one
bottle of milk is removed from the shelf, another one rolls into place.
Anyone viewing the shelf from behind can see exactly what's been
removed by a customer and how much inventory needs to be
replaced.
Supplier: A Supplier is any person or organization that provides an Input to a Process. A Supplier
is the first step of SIPOC.
Survey: A Survey is a method of collecting data from Customers by asking questions. It is an
important part in determine the Voice of the Customer.
P300 COPYRIGHT 2015 GOLEANSIXSIGMA.COM. ALL RIGHTS RESERVED. 26

Sustain (aka Shitsuke): Sustain, also known as "Shitsuke", is the fifth step in the 5S method. The
goal is to maintain the standards established in the previous 5S steps which generally involves
audits of the work place.
Swimlane Map (aka Deployment Map or Cross-Functional Chart):
A Swimlane Map is a process map that separates process steps
by function, department or individual. Each lane represents a
different department or individual. The process map is called a
swim lane because the map resembles a pool with lanes
identifying the different groups in the process.
Takt Time: Takt is translated from the German word Taktzeit or "meter". The takt time is the
average unit production time needed to meet customer demand. Takt time is calculated by
dividing the time available (minutes of work/day) by the customer demand (units required/day).
Task Board: A task board is a visual management
tool that can help identify if action items have been
completed by turning task board cards from red to
green.
Transportation (aka Touches): Transportation refers
to the concept of the moves or "touches" to a unit or
product as it flows through a process. This can refer to an email sent from one department to
another or to materials being moved from one warehouse to another. Transportation is one of
the 8 Wastes.
Tree Diagram: A Tree Diagram is a type of chart
where a concept is successively broken down into
subconcepts with increasingly higher levels of
detail. It therefore resembles a tree in its finished
state, with the main concept serving as the trunk,
while subconcepts branch off.
Time Analysis: Process analysis becomes doubly
powerful when combined with the calculation of how much time is spent at each step. Delays
are often identified as the biggest source of waste in a process and Time Analysis pinpoints
where in the process the time is being wasted.
Threats & Opportunities Matrix: A Threats & Opportunities Matrix is a simple 2 x 2 grid that
captures the threats of not implementing a proposed solution and, conversely, the potential
opportunities if the solution is accepted. This matrix is often completed with a particular
Stakeholder group in mind and then it becomes part of Stakeholder Management efforts.
P300 COPYRIGHT 2015 GOLEANSIXSIGMA.COM. ALL RIGHTS RESERVED. 27

To-Be Maps: To-Be maps display the potential future state of a process after it has been
analyzed for waste reduction. This version of a process map shows the results of streamlining
efforts by removing rework loops, excess processing and other non-value adding steps. The
resulting map has fewer steps than the presenting “As Is” or current map of the process.
Upstream: Upstream refers to any processes or activities that occur before a given process. The
opposite of Downstream.
Value Adding Activities: Value Adding Activities are any activities that add value to the customer
and meet the three criteria for a Value Adding Activity. The three criteria for a Value Adding
Activity are:
• The step transforms the item toward completion
• The step is done right the first time (not a rework step)
• The customer cares (or would pay) for the step to be done
Value Analysis: Value Analysis involves assessing each process step through the eyes of the
customer and determining whether the step is a Value Adding Activity (VA), a Non-Value Adding
Activity (NVA) or a Value Enabling Activity (VE).
To be considered Value Adding (VA), the step must meet all of the three of the following criteria:
1. The step transforms the item toward completion (something changes)
2. The step is done right the first time (not a rework step)
3. The customer cares (or would pay) for the step to be done
If a step fails to meet any one of these criteria, it is considered either:
• Non-Value Adding (NVA): Typical Non-Value Adding Activities include rework, inspection,
movement and any of the 8 Wastes.
• Value Enabling (VE): These activities are considered NVA from a customer perspective but can
be satisfying a regulatory/ compliance issue or other business requirement. These are also
called Non-Value Added but Necessary, Business Value Add or Non-Value Added but
Required.
Uncovering and reducing NVA or VE steps that don’t add value in they eyes of the customer is
key to improving both the effectiveness and efficiency of a process.
Value Enabling Activities: Value Enabling Activities are activities that do not directly add value to
a customer, but must be performed to allow Value Adding Activities later on. They are therefore
necessary precursors to Value Adding Activities. Other terms used for Value Enabling activities
are “Non Value Add but Required” or “Business Value Add.”
P300 COPYRIGHT 2015 GOLEANSIXSIGMA.COM. ALL RIGHTS RESERVED. 28

Value Stream Map: Value Stream Mapping is a
technique for identifying and eliminating waste
from a process. A Value Stream Map visually maps
the flow of steps, delay, and information required to
deliver a product or service; this is called a “Current
State” Map. Value Stream Mapping then analyzes
the Current State Map in terms of 1) creating flow and 2) eliminating waste, and creates a more
efficient Future State Map.
Variation: Variation describes how consistent a process’ output is. Reducing variation is a
fundamental goal of Lean Six Sigma, as it means more consistent results that meet customer
requirements. Variation can be divided into two types: Common Cause and Special Cause.
Visual Management: Visual Management is the practice of making the
workplace visually easy to work in. This includes making it easy to identify units
and materials, updating people on the process status, showing how the process
works and providing a visible process plan for future steps.
VOC Translation Matrix: The VOC (Voice Of the Customer) Translation Matrix is
a tool that helps teams take customer comments, determine the underlying issues represented
by those comments and use this information to develop measurable customer requirements.
The goal of this tool is to translate often vague comments into something concrete so that the
team can focus their efforts to meet these requirements.
Voice of the Customer (VOC): Voice of the Customer (VOC) is data that represents the needs and
wants of your customers. VOC data is collected through various means, including Surveys and
Focus Groups.
Wait Time: Wait time is a measure of the time a unit or service is idle within a process. Waiting is
considered the most common of the 8 Wastes.
Waiting: Waiting happens internally when one colleague is idle because they are unable to
proceed with a process step until another colleague or department provides the necessary parts
or information in order to continue. This also refers to the resulting delay before customers
receive their desired goods or services. Waiting is one of the 8 Wastes.
Water Beetle (aka Water Spider): Water beetle or water spider is a term used to describe the
person responsible for maintaining correct inventories on the production line so that line
employees have no need to stop working. The term stems from the fast movement of this
employee as they check stock levels and resupply each station as necessary.
P300 COPYRIGHT 2015 GOLEANSIXSIGMA.COM. ALL RIGHTS RESERVED. 29
Weighted Criteria Matrix: A Weighted Criteria Matrix is a decision-making tool that evaluates
potential options against a list of weighted factors. Common uses include deciding between
optional solutions or choosing the most appropriate software application to purchase. Typically,
a Weighted Criteria Matrix takes the form of a table, with multiple options listed across the top
and criteria (e.g., Ease of Use, Cost, Time to Implement) listed in the leftmost column. The
criteria are weighted relative to their perceived importance and then each option is scored
against each criteria. The process of scoring the options turns this into a powerful
communication tool regardless of the final scores.
Work Cell Design: Work Cell Design is a method of organizing physical operations in the most
efficient combination to maximize value added steps and to minimize waste. The most
classically efficient work space shape is the U-shape which minimizes the waste of motion.
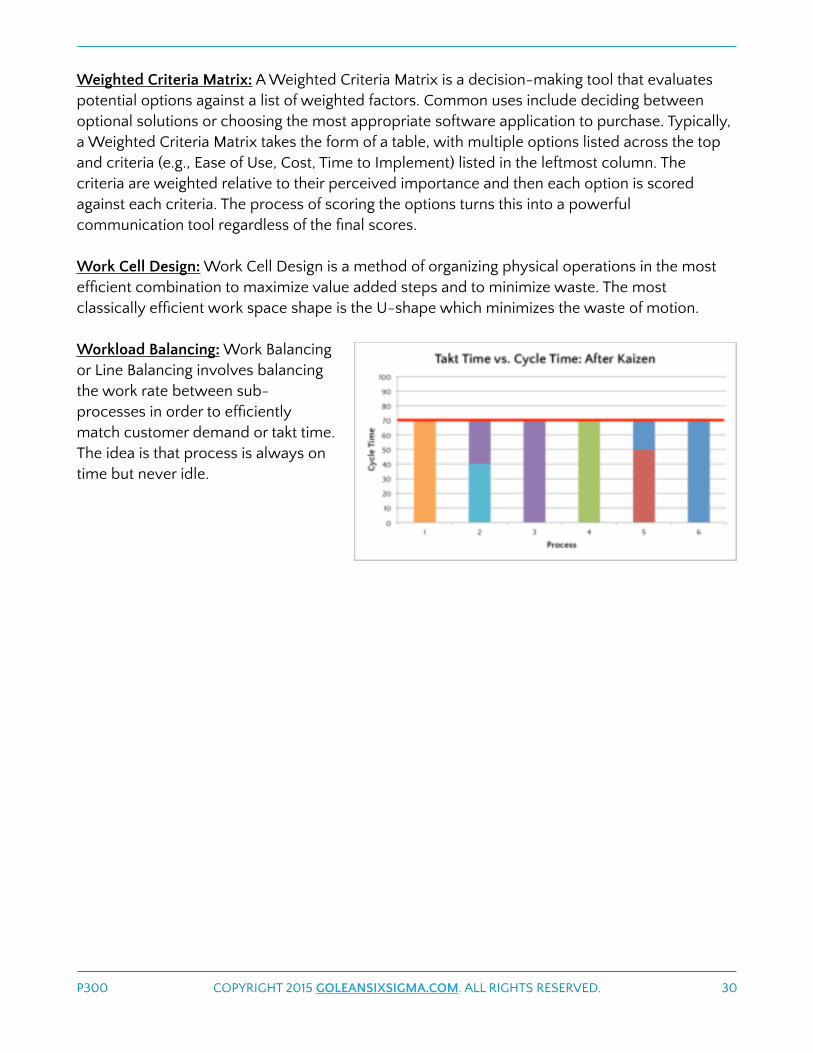
Workload Balancing: Work Balancing
or Line Balancing involves balancing
the work rate between sub-
processes in order to efficiently
match customer demand or takt time.
The idea is that process is always on
time but never idle.
P300 COPYRIGHT 2015 GOLEANSIXSIGMA.COM. ALL RIGHTS RESERVED. 30