Consumer demand for product bundling - WUR eDepot
86
Caspar Wieten Master in Consumer Studies – Wageningen University & Research centre Master in Consumer Affairs – Technische Universität München Master Thesis Draft Consumer demand for product bundling Adding a Smart TV to a bundle combining connection to internet, television, and phone
-
Upload
khangminh22 -
Category
Documents
-
view
3 -
download
0
Transcript of Consumer demand for product bundling - WUR eDepot
Caspar Wieten
Master in Consumer Studies – Wageningen University & Research centre
Master in Consumer Affairs – Technische Universität München
Master Thesis Draft
Consumer demand for product bundling Adding a Smart TV to a bundle combining connection to internet, television, and phone
2
Table of Content
Table of Content ............................................................................................................................................ 2
Introduction ................................................................................................................................................... 4
Research Question ........................................................................................................................................ 7
Background .................................................................................................................................................... 5
Smart TV .................................................................................................................................................... 5
Telecommunications Market .................................................................................................................... 5
Theoretical Framework ................................................................................................................................. 8
Bundling ..................................................................................................................................................... 8
Willingness to Pay ................................................................................................................................... 11
Conjoint Analysis ................................................................................................................................. 14
Contingent Valuation .......................................................................................................................... 15
Hypotheses .................................................................................................................................................. 17
Methodology ............................................................................................................................................... 18
Sampling and Procedure ......................................................................................................................... 18
Operationalization ................................................................................................................................... 18
Televisions and connections ................................................................................................................ 19
Demand and Willingness to Pay .......................................................................................................... 20
Financial fragility, income, and monthly housing costs ...................................................................... 20
Age and household composition ......................................................................................................... 21
Gender ................................................................................................................................................. 21
Method of Analysis .................................................................................................................................. 21
Results ......................................................................................................................................................... 22
Recode ..................................................................................................................................................... 22
Overview ................................................................................................................................................. 23
Descriptive statistics of Independent Variables ...................................................................................... 26
Correlation between income and financial fragility ................................................................................ 29
Regressions on Demand for Smart TVs ................................................................................................... 29
Regressions on Average Relative Willingness to Pay .............................................................................. 35
Regressions with control variables .......................................................................................................... 39
Discussion .................................................................................................................................................... 43
Limitations ............................................................................................................................................... 44

3
Conclusion ................................................................................................................................................... 46
References ................................................................................................................................................... 47
Appendix A Questionnaire in Dutch ............................................................................................................ 53
Appendix B: Questionnaire translated to English ....................................................................................... 68
Appendix C: Recoded Variables ................................................................................................................... 83
4
Introduction
Product bundling has been an important part of marketing strategies for a long time. It
consists of selling multiple products in one combined product. One of the sectors that has been
using product bundling heavily over the past years is telecommunications, in which sellers
combine, for example, the sales of mobile telephones with a contract including calls, texts and
internet broadband, or a combination of an internet, television, and phone connection for
households. With the increasing supply and demand for Smart TVs, which need both a
connection to the internet and television, it seems that these could be suitable for a bundle as
well – similar to the mobile phone plus contract bundle. However, such a bundle is currently
nowhere to be found on the market.
In this research, the focus will be on consumer demand in the Netherlands for such a
bundle combining an internet and television connection with a Smart TV. To study consumer
demand, the rationale behind bundling will first be studied on the basis of academic literature.
Based on the findings of this literature, a questionnaire will be created to find out how
consumers value different attributes of a bundle combining a mobile phone with a contract.
Furthermore, the contingent valuation method will be used to determine the willingness to pay
for a bundle combining Smart TV with a connection to internet, television, and phone. These
results will then be used to answer the research question concerning the consumer demand for
such a potential bundle combining a Smart TV with internet, television and phone connection.
5
Background
Smart TV
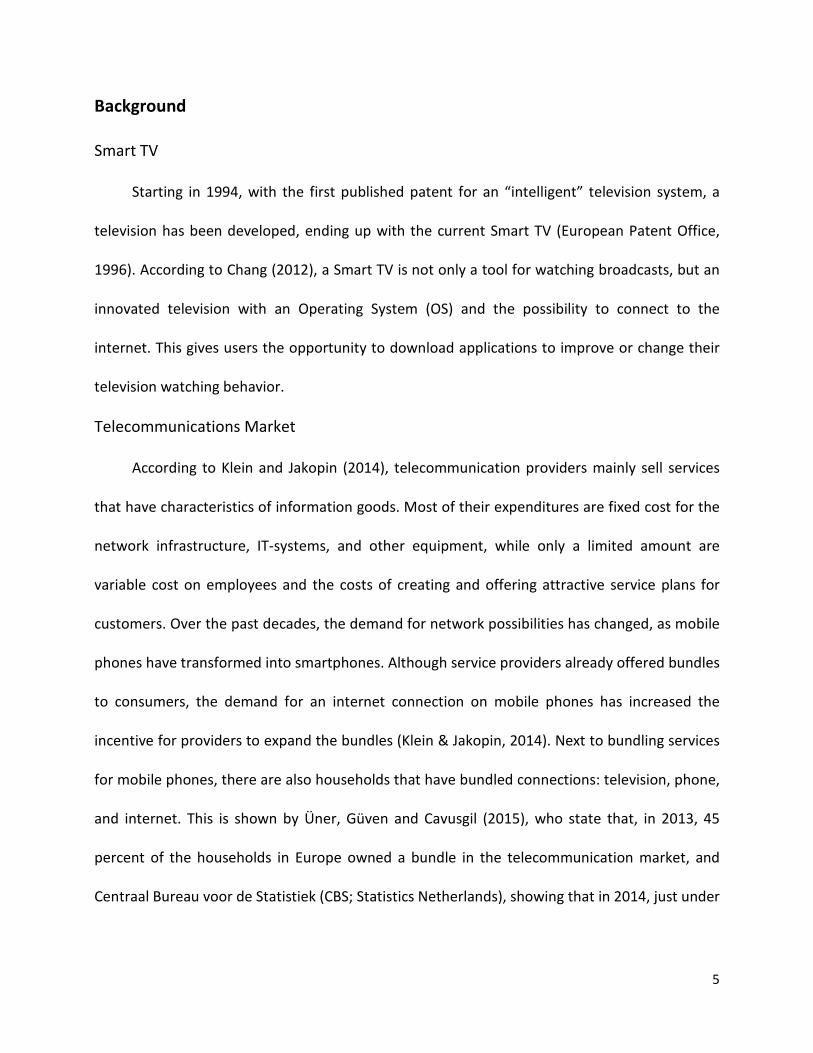
Starting in 1994, with the first published patent for an “intelligent” television system, a
television has been developed, ending up with the current Smart TV (European Patent Office,
1996). According to Chang (2012), a Smart TV is not only a tool for watching broadcasts, but an
innovated television with an Operating System (OS) and the possibility to connect to the
internet. This gives users the opportunity to download applications to improve or change their
television watching behavior.
Telecommunications Market
According to Klein and Jakopin (2014), telecommunication providers mainly sell services
that have characteristics of information goods. Most of their expenditures are fixed cost for the
network infrastructure, IT-systems, and other equipment, while only a limited amount are
variable cost on employees and the costs of creating and offering attractive service plans for
customers. Over the past decades, the demand for network possibilities has changed, as mobile
phones have transformed into smartphones. Although service providers already offered bundles
to consumers, the demand for an internet connection on mobile phones has increased the
incentive for providers to expand the bundles (Klein & Jakopin, 2014). Next to bundling services
for mobile phones, there are also households that have bundled connections: television, phone,
and internet. This is shown by Üner, Güven and Cavusgil (2015), who state that, in 2013, 45
percent of the households in Europe owned a bundle in the telecommunication market, and
Centraal Bureau voor de Statistiek (CBS; Statistics Netherlands), showing that in 2014, just under
6
five million households in the Netherlands made use of a bundle including both the connection
to internet as well as television (Centraal Bureau voor de Statistiek, 2015).
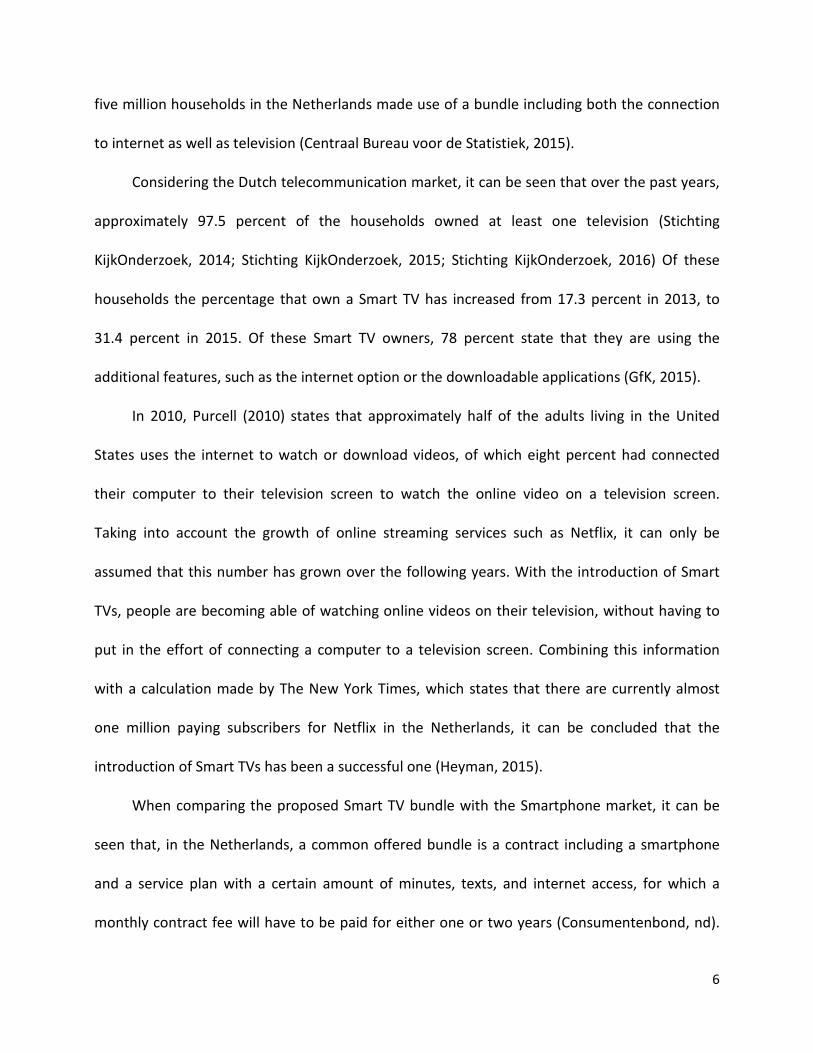
Considering the Dutch telecommunication market, it can be seen that over the past years,
approximately 97.5 percent of the households owned at least one television (Stichting
KijkOnderzoek, 2014; Stichting KijkOnderzoek, 2015; Stichting KijkOnderzoek, 2016) Of these
households the percentage that own a Smart TV has increased from 17.3 percent in 2013, to
31.4 percent in 2015. Of these Smart TV owners, 78 percent state that they are using the
additional features, such as the internet option or the downloadable applications (GfK, 2015).
In 2010, Purcell (2010) states that approximately half of the adults living in the United
States uses the internet to watch or download videos, of which eight percent had connected
their computer to their television screen to watch the online video on a television screen.
Taking into account the growth of online streaming services such as Netflix, it can only be
assumed that this number has grown over the following years. With the introduction of Smart
TVs, people are becoming able of watching online videos on their television, without having to
put in the effort of connecting a computer to a television screen. Combining this information
with a calculation made by The New York Times, which states that there are currently almost
one million paying subscribers for Netflix in the Netherlands, it can be concluded that the
introduction of Smart TVs has been a successful one (Heyman, 2015).
When comparing the proposed Smart TV bundle with the Smartphone market, it can be
seen that, in the Netherlands, a common offered bundle is a contract including a smartphone
and a service plan with a certain amount of minutes, texts, and internet access, for which a
monthly contract fee will have to be paid for either one or two years (Consumentenbond, nd).
7
This shows that the bundle includes both an object and a service, which is similar as the studied
Smart TV bundle: a Smart TV with a service plan including the connection to television, internet,
and telephony.
One major difference that needs to be taken into account, is that a Smart TV is often a
tool used and purchased by a household, while a smartphone is mainly a tool used on an
individual level. This might result in differences in the decision-making process and the
willingness to pay for a Smart TV.
Research Question
Based on the aforementioned information, the aim of this research will be to answer the
following question:
“Is there consumer demand in the Netherlands for the introduction of a bundle including a
Smart TV in the already existing bundles with connection to internet, television and phone?”
This question will be answered with the help of the following sub-questions:
“How do consumers perceive a bundle that combines a service and an object, i.e. mobile
phone with a contract?”
“What is the willingness to pay for the addition of a Smart TV to a monthly subscription
bundled with connection to internet, television and phone?”
8
Theoretical Framework
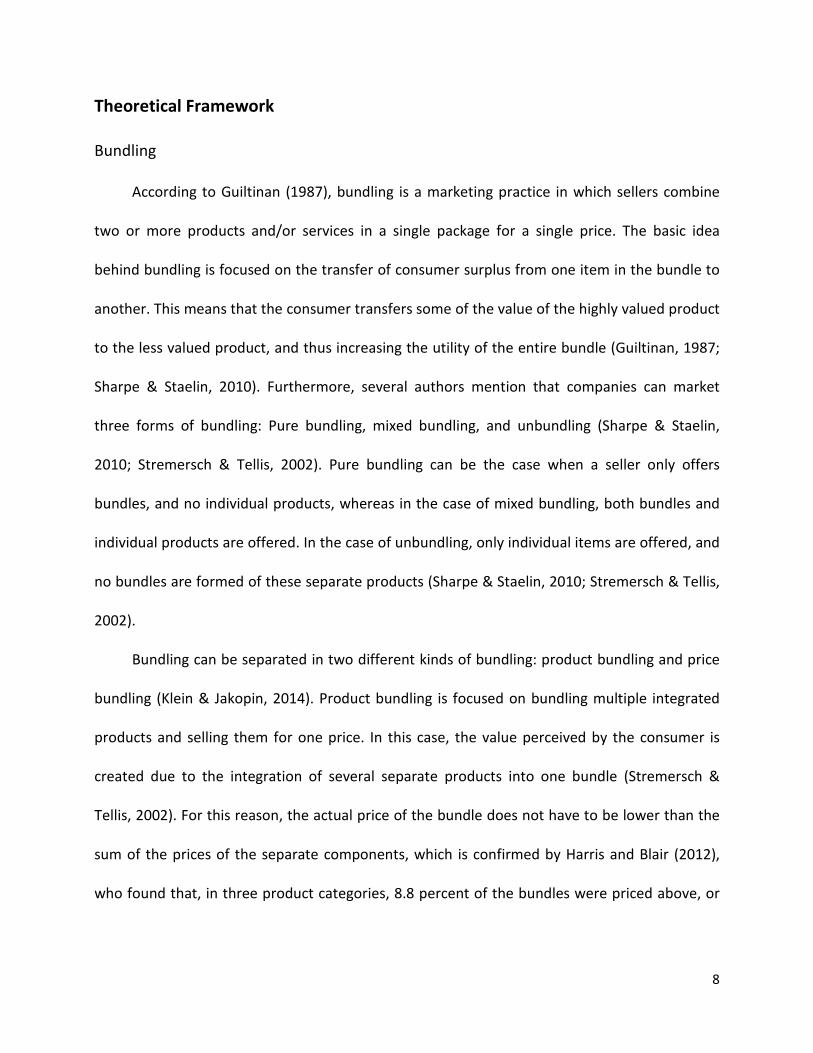
Bundling
According to Guiltinan (1987), bundling is a marketing practice in which sellers combine
two or more products and/or services in a single package for a single price. The basic idea
behind bundling is focused on the transfer of consumer surplus from one item in the bundle to
another. This means that the consumer transfers some of the value of the highly valued product
to the less valued product, and thus increasing the utility of the entire bundle (Guiltinan, 1987;
Sharpe & Staelin, 2010). Furthermore, several authors mention that companies can market
three forms of bundling: Pure bundling, mixed bundling, and unbundling (Sharpe & Staelin,
2010; Stremersch & Tellis, 2002). Pure bundling can be the case when a seller only offers
bundles, and no individual products, whereas in the case of mixed bundling, both bundles and
individual products are offered. In the case of unbundling, only individual items are offered, and
no bundles are formed of these separate products (Sharpe & Staelin, 2010; Stremersch & Tellis,
2002).
Bundling can be separated in two different kinds of bundling: product bundling and price
bundling (Klein & Jakopin, 2014). Product bundling is focused on bundling multiple integrated
products and selling them for one price. In this case, the value perceived by the consumer is
created due to the integration of several separate products into one bundle (Stremersch &
Tellis, 2002). For this reason, the actual price of the bundle does not have to be lower than the
sum of the prices of the separate components, which is confirmed by Harris and Blair (2012),
who found that, in three product categories, 8.8 percent of the bundles were priced above, or
9
at the same price of the separate components. On the other hand, price bundling is focused on
the combination of multiple products sold for a lower price than the sum of the separate prices
(Klein & Jakopin, 2014). In this case, the bundle itself does not create additional value, and thus
has to be created in the form of a discounted price (Stremersch & Tellis, 2002). This separation
of two kinds of bundling is shown from a consumers perspective by Harris and Blair (2012), who
state that bundles may be perceived as either a package of separate products, or as one, single
product.
From an economic perspective, bundling is often explained as third-degree price
discrimination (Breidert, 2006, p. 15). This can be explained as the price setting of products
depending on the customer group or segment, i.e. student discounts. In the case of bundling,
the willingness to pay for a product defines the segment that the customer is in. This is based on
an individual basis in which the consumer has a different willingness to pay for individual
products. When bundled, the customer can behave in three ways: (1) the customer has a
greater willingness to pay than the actual price of the product, and thus realizes a surplus; (2)
considering pure bundling, the consumer will identify the bundle as one product and have a
corresponding willingness to pay, resulting in the idea that it is not depending on the WTPs of
both individual products; (3) the customer will have the same willingness to pay for the bundle
as for the individual items when mixed-bundling is the case, resulting in a decision towards the
highest surplus (Breidert, 2006, p. 16).
Studies show that there are multiple advantages for consumers when buying bundles:
Klein and Jakopin (2014) show that bundling reduces the search costs for consumers, as they
have the possibility to buy complementary goods in one package for one price. This is confirmed
10
by Harris and Blair (2006), by showing that bundling has a positive effect on consumers because
of the reduced search costs, and Heeler, Nguyen and Buff (2007) who state that consumers
experience a reduction in transaction costs due to bundling. Furthermore, Harris and Blair
(2012) state that the purchase of a bundle by consumers might also be due to the convenience
experienced. As stated above, the availability of bundles will decrease search costs, but it can
also decrease the amount of bills that have to be paid as only one invoice will be sent (Üner,
Güven & Cavusgil, 2015). All these aspects reduce the amount of difficulties a consumer can
experience when purchasing or using a product. Lastly, bundling results in a perceived benefit
for the consumer because the consumer will often expect and assume that the bundle will be
sold at a discounted price (Heeler, Nguyen & Buff, 2007) This results in an increased perceived
transaction value and thus an higher overall evaluation of the offer (Nguyen, Heeler & Buff,
2009). According to Harris and Blair (2012), a problem might arise when consumers have an
increased perceived value of a bundle. They state that consumers will purchase bundles with
only a small, or without, discount because they are not able to process the price information
correctly.
Within the telecommunication sector, Üner, Güven and Cavusgil (2015) define bundling as
“at least two products from one single provider in one single invoice with or without discount”.
This shows that a provider of telecommunication services sells several different products to the
same customer in one package. In the heavily competitive telecommunication market, bundling
can be one of the solutions from companies to minimize the switching between providers of
consumers by increasing the switching costs. This will allow companies to protect their market
11
positions, while increasing the loyalty of the customers they already obtained (Üner, Güven &
Cavusgil, 2015).
Willingness to Pay
An important aspect of bundling is the Willingness to Pay (WTP) of consumers. WTP is a
concept focusing on the amount of money an individual is willing to pay for a certain good or
service (Le Gall-Ely, 2009). In other words, the WTP is the point at which someone becomes
indifferent between buying and not buying a product, and is thus the maximum price a
consumer is willing to pay (Gensler, Hinz, Skiera & Theysohn, 2012). Nowadays, it is often used
in marketing research as a critical input in pricing, product line, and assortment decisions, and is
considered essential for suppliers in the estimation of demand for certain products
(Wertenbroch and Skiera, 2002). However, the former use of willingness to pay measures was
focused on giving economic value to goods that were hard to valuate, such as environmental
goods (Hoevenagel, 1994, p. 31). By using the contingent valuation method, authorities were
able to gain knowledge about the value of environmental goods by asking for a willingness to
pay (for example in the form of additional taxes) to obtain (or keep) an environmental good,
and for a willingness to accept (lower taxes) for losing, or the deterioration of, the
environmental situation.
From an economic perspective, willingness to pay is focused on the consumer surplus that
a consumer is expected, and wants to gain (Wertenbroch, & Skiera, 2002). It can be described as
the economic measure of consumer satisfaction, and is calculated by analyzing the difference
between what the consumer is willing to pay and the actual price on the market. Whenever this
difference is positive, the consumer experiences consumer surplus. This can be compared to the
12
economic theory of reservation price, which is explained as the limit of a price for a good or
service (Breidert, 2006, p. 26). From the supply side, it defines the smallest price at which a
seller is willing to sell, often explained as the willingness to accept, whereas from the demand
side, it is the maximum price a buyer is willing to pay – willingness to pay.
Reservation price, or willingness to pay, of consumers is, amongst others, dependent on
the disposable income of the consumer. Disposable income can be defined as the total personal
income minus personal taxes, and can thus be compared to the net income (OECD, 2016). The
amount of money a person or households has available to spend is an important factor of their
willingness to pay for a certain product. In general, people with a lower disposable income will
have a lower WTP for luxury goods than people with a high disposable income as they have
more money available for expenditures.
Miller, Hofstetter, Krohmer, and Zhang (2011) show that WTP can be measured either
directly or indirectly, and that it can determine a consumers’ hypothetical or actual WTP. In the
case of marketing research and its focus on pricing and demand, it is possible that the measured
product is not yet marketed. The result is that consumers’ willingness to pay cannot be
measured based on a real and existing product, and should thus be questioned in a hypothetical
form. This can be done directly with the use of open-ended questions, and indirectly, by using a
choice-based conjoint analysis (Miller, et al., 2011). The latter uses consumers’ choices among
multiple product alternatives to calculate WTP. On the other hand, when products do exist, a
real WTP can be measured using either the Becker, DeGroot and Marschak method, in which a
participant is forced to buy a product if the price drawn from a lottery is less than or equal to his
or her indicated willingness to pay, or the incentive-aligned choice-based conjoint analysis, in
13
which the participants are obliged to make a purchase based on the WTP of their revealed
preference (Miller, et al., 2011). In these methods, the former – BDM method – is measuring
WTP directly, where the latter – measures WTP indirectly.
Wertenbroch and Skiera (2002) divide the methods of estimating WTP in studying market
transactions – similar to measuring real WTP – and survey data, which is similar to hypothetical
willingness to pay. They show that the advantage of using market transaction data is that it is
based on actual purchases and observed under realistic market conditions, while also stating
that the data only reveals that the WTP is at least as high as the posted price for the buyer,
whereas the WTP of the non-buyer is lower than the actual price. This proves that no actual
WTP can be defined from using market transaction data. On the other hand, the main
advantage of survey data is that it can be used in new product development and the evaluation
of nonmarket public goods (Wertenbroch & Skiera, 2002). However, survey data has one major
disadvantage, which is the fact that it is based on a hypothetical situation, which makes the data
prone to the hypothetical bias – which is the bias that is experienced when answering to
hypothetical situations (Miller, et al., 2011).
In bundles, it is often the case that one part of the bundle is valued more to one consumer
than to the other and vice versa (Varian, 1995). When these products would have been sold
independently, the price would be close to the lowest willingness to pay. However, when sold in
a bundle, the price can be set at the average WTP, thus increasing the utility of the consumer
and the profit of the producer.
Le Gall-Ely (2009) describes several possibilities to study WTP of consumers, including
contingent valuation and conjoint analysis. In contingent valuation, the respondent is required
14
to directly express his or her WTP for the product, while in conjoint analysis, the WTP is derived
from evaluations of alternatives and focuses on the different attributes of a product.
Conjoint Analysis
Conjoint analysis assumes that the utility of a product or service is based on the utility of
its separate different attributes (Halme and Kallio, 2011). It is defined by Green and Srinivasan
(1990) as “any decompositional method that estimates the structure of a consumer’s
preference […], given his or her overall evaluations of a set of alternatives that are prespecified
in terms of levels of different attributes”. This means that it can be measured by decomposing a
product or several products into different elements, and using the valuation of these separate
elements to define consumer preference. The underlying assumption that needs to be taken
into account based on this is that the consumer’s utility of a product is the sum of the values of
each individual attribute of the product (Breidert, 2006, p. 59). A study by Green and Wind
(1975) shows that for several examples, utility for separate aspects can change – meaning that
consumers often do not like every attribute of one product more than the attribute of the other
product – resulting in attributes offsetting each other. This is also proven by Nikou, Bouwman,
and Reuver (2014), who state that different factors can affect the decision making process
simultaneously, and Le Gall-Ely (2009), who presents that conjoint analyses focuses on revealing
compromises that consumers make between different product attributes.
According to Breidert, Hahsler, and Reuterrer (2006), one of the most important
applications of conjoint analysis is focused on pricing strategies. To find the WTP of consumers
using a conjoint analysis, products are compared in several attributes, including price, and the
WTP of a certain product is defined at the moment the participant chooses the competing
15
product, assuming that only the price has changed (Le Gall-Ely, 2009). This is done by
incorporating the price in the study as one of the elements of the product, and thus as an
additional attribute (Breidert, Hahsler, & Reuterrer, 2006). An example of a difficult market with
respect to different attributes is the mobile phone market (Simmons & Esser, 2001). The
division of attributes that is preferred by customers is broad and ranging from the quality of a
phone call to the absence of a contract. Because of these different favored attributes, providers
have also shifted their priority to one of the attributes, completely changing the market
(Simmons & Esser, 2001).
Contingent Valuation
According to Portney (1994, contingent valuation is a way of measuring the willingness to
pay for a hypothetical project or program. It requires the respondent to directly express his or
her WTP for the product in a questionnaire based on hypothetical situations. Furthermore,
Carson, Flores, and Meade (2001) show that the contingent valuation method is often used to
assess the value of environmental projects, for example by asking respondents the amount of
money they are willing to pay to keep an environmental project, such as a park. For these kind
of questions, Carson, Flores, and Meade (2001) state that, next to surveys, also in-person
interviews can be used.
Venkatachalam (2004) focuses on the criticism around contingent valuation surveys, and
states that this is mainly because of the validity and reliability. In the case of contingent
valuation, validity refers to the degree to which the method measures the true economic value
of the respondents. This can then be separated in three different aspects: content validity,
criterion validity and construct validity. Content validity can be explained as the ability of the
16
questions in the survey to measure the willingness to pay appropriately and whether all facets
of the construct are included, whereas criterion validity focuses on whether the respondents’
answers to the hypothetical questions are predicted correctly compared to the real situation
(Vossler & Kerkvliet, 2003). Lastly, construct validity refers to the degree to which a method
measures what should be measured. On the other hand, reliability is explained by
Venkatachalam (2004) to refer to the extent to which the test can be repeated to gain the same
results, which, in the case of contingent valuation, focuses on the variance of the willingness to
pay.
A common way of setting up a contingent valuation survey is by composing it of six
different aspects (Carson, Flores, & Meade, 2001). Firstly, an introduction of the context has to
be given in order to clarify the situation of the respondent and the corresponding decision that
has to be made. Furthermore, the good that will be offered has to be described in a detailed
way, such that the respondent exactly knows what he or she will pay for. For the next aspects of
the survey, Carson, Flores, and Meade (2001) state that the setting in which the good will be
provided has to be explained, as well as the method in which the product will be paid for. To
conclude the questions on the specific product and the decisions made by the respondent,
some debriefing questions should be asked to gain more insight in the reasons behind the
decisions made. The last part of the survey should involve questions on the respondent’s
characteristics, including attitudes and demographic information. All these steps are also
confirmed by Portney (1994), who states that a contingent valuation survey should contain both
the elaborate questions on the product and the willingness to pay, as well as some questions
regarding the respondent’s characteristics.

17
Hypotheses
Based on the information provided above, the following hypotheses will be tested:
1. The majority of the consumers in the Netherlands have a demand for the introduction
of a bundle including a Smart TV in the already existing bundles with connection to
internet, television and phone
2. People who perceive the characteristics of the mobile phone as an important aspect of
their mobile phone bundle will have a higher interest in the addition of a Smart TV.
3. People will be more interested in adding a Smart TV to the already existing bundles
when it concerns an expensive television.
4. People with a lower income will have a higher interest in the addition of a Smart TV.
5. People who are more financial fragile will have a higher interest in the addition of a
Smart TV.
18
Methodology
Sampling and Procedure
To retrieve the data necessary for answering the research question, a questionnaire was
created and consisted of 33 questions. For convenience of the respondents, the questionnaire
was created in Dutch (see Appendix A), and was translated to English for the purpose of this
thesis (see Appendix B).
The link to this e-questionnaire was e-mailed to the researcher’s closest contacts, asking
them to participate in this study, and thus fill in the questionnaire, and to forward it to their
closest contacts. This form of snowball sampling is described by Hoyle, Harris and Judd (2002),
who explain that it is a multistage sampling procedure in which the initial sample either gives
names or forwards the researcher towards a bigger sample. This is done until the sample size is
large enough to meet the requirements of the study. The researcher aims to have
approximately 150 respondents in order to be able to analyze the data appropriately and to
come to significant results. Snowball sampling is part of nonprobability sampling, which means
that there is no assurance that every element has a chance of being included in the sample
(Hoyle, Harris, & Judd, 2002). Therefore, it is not sure whether the sample of participants is
representative for the entire population.
Operationalization
The questions asked in the survey are mainly based on the literature described above. As
described by Hoyle, Harris, and Judd (2002), the order of the questions can have an influence on
the respondent. To avoid biases, and to avoid participants quitting the survey, the questionnaire
19
started with some easy to answer, but relevant questions. Afterwards, the questions regarding
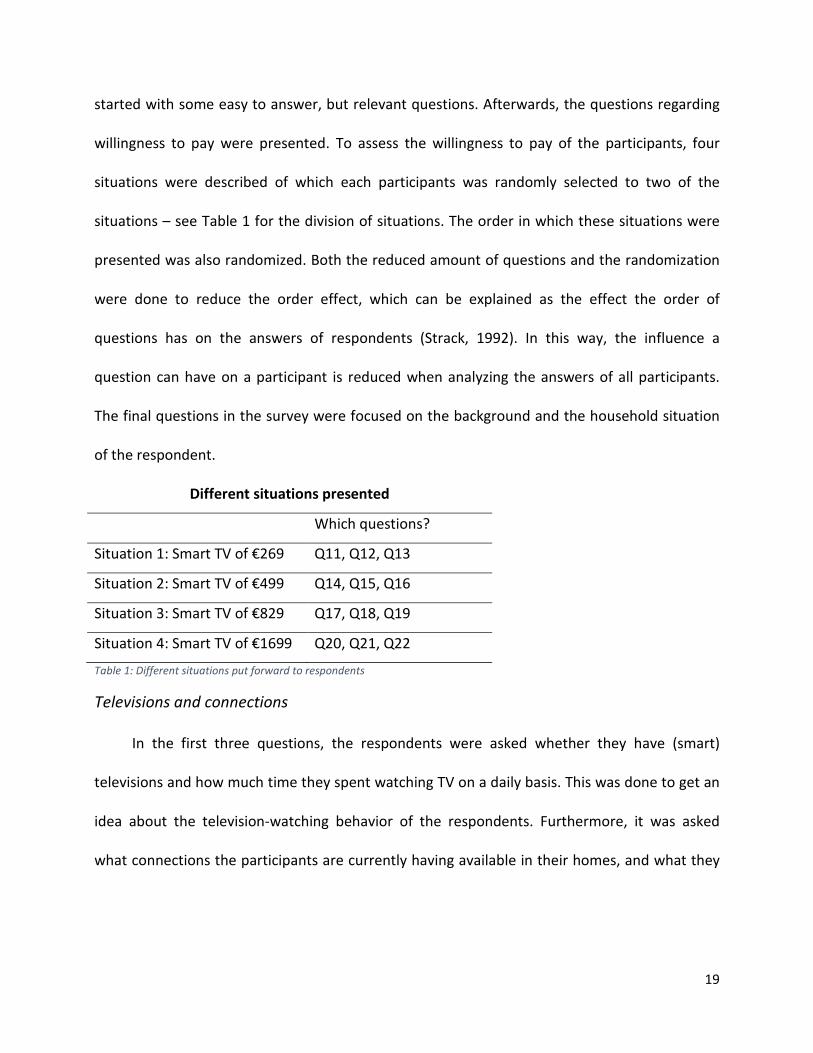
willingness to pay were presented. To assess the willingness to pay of the participants, four
situations were described of which each participants was randomly selected to two of the
situations – see Table 1 for the division of situations. The order in which these situations were
presented was also randomized. Both the reduced amount of questions and the randomization
were done to reduce the order effect, which can be explained as the effect the order of
questions has on the answers of respondents (Strack, 1992). In this way, the influence a
question can have on a participant is reduced when analyzing the answers of all participants.
The final questions in the survey were focused on the background and the household situation
of the respondent.
Different situations presented
Which questions?
Situation 1: Smart TV of €269 Q11, Q12, Q13
Situation 2: Smart TV of €499 Q14, Q15, Q16
Situation 3: Smart TV of €829 Q17, Q18, Q19
Situation 4: Smart TV of €1699 Q20, Q21, Q22
Table 1: Different situations put forward to respondents
Televisions and connections
In the first three questions, the respondents were asked whether they have (smart)
televisions and how much time they spent watching TV on a daily basis. This was done to get an
idea about the television-watching behavior of the respondents. Furthermore, it was asked
what connections the participants are currently having available in their homes, and what they
20
are paying for these connections on a monthly basis. This gave the researcher a baseline of what
was already being paid for television services.
Demand and Willingness to Pay
The next sets of questions were focused on the demand for the addition of a Smart TV to
the respondents current contract, and, if interested, what they would be willing to pay on a
monthly basis for this addition. These questions were divided into four subgroups, all focusing
on a different Smart TV. In Table 1, this division can be found, including the specifications and
the price of the specific Smart TVs. If the respondent stated that he or she was not interested in
the television, the next question would be asking why they are not interested, whereas if the
respondent stated that he or she was interested, the next question would be focusing on their
willingness to pay.
Financial fragility, income, and monthly housing costs
In order to measure the financial capability of a household, a measure called financial
fragility will be used. Financial fragility is based on the question whether respondents are able
to access emergency funds when a sudden need arises (Lusardi, Schneider, and Tufano, 2011).
By gaining this knowledge about the respondents, the available money can be identified
indirectly, and thus their ability to purchase a Smart television in once, or whether a spread-out
payment would be more suitable. This is also based on the income of the respondent’s
household members, as people with a higher income are assumedly less financial fragile,
although this might be countered by high monthly fixed costs for housing.
21
Age and household composition
In a study done by SPOT (2015), it is shown that the amount of time spent on watching
streamed, downloaded or bought (using Netflix or Videoland) movies and series differs between
age groups. They show that people aged between 13 and 34 watch approximately 30 minutes of
streamed, downloaded, or bought movies and series, whereas this is only two minutes for
people aged 65 years and older. On the other hand, older people spend more time watching
regular television than younger people. This can be connected to the questions regarding
household composition, which is done to study the effects of having certain age groups within a
household.
Gender
Adriaens, Van Damme, and Courtois (2011) show that there is no significant difference in
the amount of time adolescent males and females spent on watching television. However, CBS
shows that there is a difference in television use between men and women (Centraal Bureau
voor de Statistiek, 2014).
Method of Analysis
The questionnaire will be created and distributed by using Qualtrics. To analyze the data
retrieved from the questionnaires, IBM SPSS Statistics 20 will be used.
22
Results
Recode
In order to be able to analyze the data retrieved from the questionnaires, several variables
had to be recoded. The full list of what has been recoded can be found in Appendix C. In short,
the questions (Q2, Q3, Q4, Q25, Q28) that had to be answered with numbers have been
recoded such that the number of the answer equals the actual answer. Next to that, for
questions which had to be answered with ‘Yes’ or ‘No’ (Q5, Q10, Q11, Q14, Q17, Q20), ‘Yes’ has
been set to ‘1’ and ‘No’ has been set to ‘0’. Also, a total score for the perceived value of
respondents of mobile phones compared to their contract has been calculated. To do so, the
questions regarding specific features of their mobile phone and contract have been divided into
“Phone” or “Contract”, after which these scores have been subtracted from each other. This
results in several scores, in which positive scores are meaning a higher value for the mobile
phone than the contract and negative scores mean that the respondent values the contract
more than the mobile phone. Furthermore, dummy variables were created for income and
education, which have both been set to ‘2’ for high, and ‘1’ for low. Based on Centraal
Planbureau, €37,500 was defined as the average income per adult in the household (Centraal
Planbureau, 2016). For convenience, the gross yearly income was divided by the amount of
adults in the household to calculate the gross income per adult in the household. This was then
separated into two groups, above €37,500 per adult and below €37,500 per adult. Lastly, the
WTPs for the four specific Smart TVs have been recoded to percentages of the television price
23
as stated in the questions. These percentages have then been averaged, to come to one number
for each respondent.
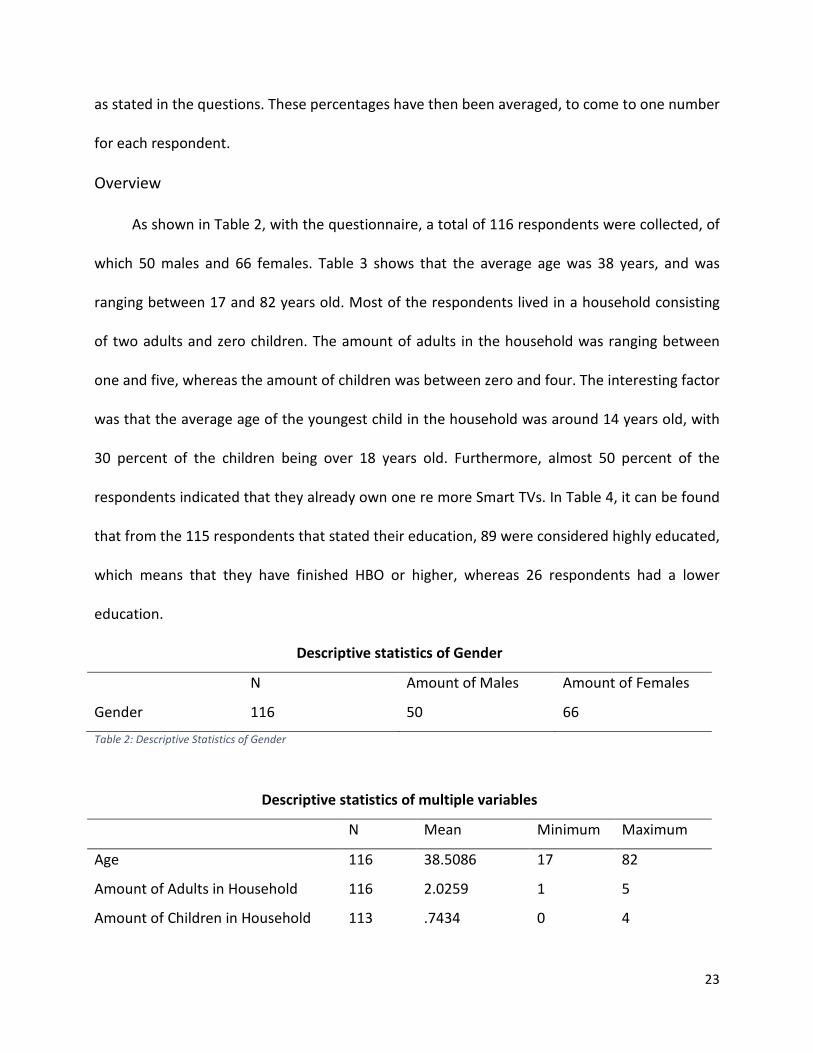
Overview
As shown in Table 2, with the questionnaire, a total of 116 respondents were collected, of
which 50 males and 66 females. Table 3 shows that the average age was 38 years, and was
ranging between 17 and 82 years old. Most of the respondents lived in a household consisting
of two adults and zero children. The amount of adults in the household was ranging between
one and five, whereas the amount of children was between zero and four. The interesting factor
was that the average age of the youngest child in the household was around 14 years old, with
30 percent of the children being over 18 years old. Furthermore, almost 50 percent of the
respondents indicated that they already own one re more Smart TVs. In Table 4, it can be found
that from the 115 respondents that stated their education, 89 were considered highly educated,
which means that they have finished HBO or higher, whereas 26 respondents had a lower
education.
Descriptive statistics of Gender
N Amount of Males Amount of Females
Gender 116 50 66
Table 2: Descriptive Statistics of Gender
Descriptive statistics of multiple variables
N Mean Minimum Maximum
Age 116 38.5086 17 82
Amount of Adults in Household 116 2.0259 1 5
Amount of Children in Household 113 .7434 0 4
24
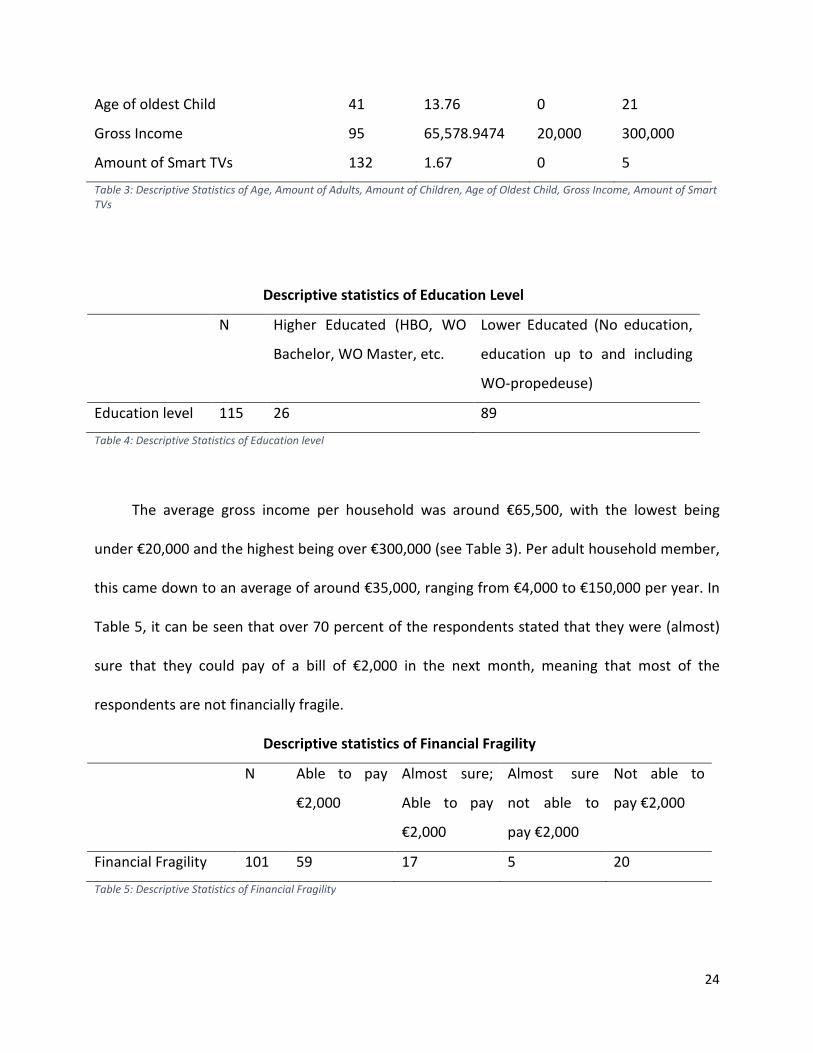
Age of oldest Child 41 13.76 0 21
Gross Income 95 65,578.9474 20,000 300,000
Amount of Smart TVs 132 1.67 0 5
Table 3: Descriptive Statistics of Age, Amount of Adults, Amount of Children, Age of Oldest Child, Gross Income, Amount of Smart TVs
Descriptive statistics of Education Level
N Higher Educated (HBO, WO
Bachelor, WO Master, etc.
Lower Educated (No education,
education up to and including
WO-propedeuse)
Education level 115 26 89
Table 4: Descriptive Statistics of Education level
The average gross income per household was around €65,500, with the lowest being
under €20,000 and the highest being over €300,000 (see Table 3). Per adult household member,
this came down to an average of around €35,000, ranging from €4,000 to €150,000 per year. In
Table 5, it can be seen that over 70 percent of the respondents stated that they were (almost)
sure that they could pay of a bill of €2,000 in the next month, meaning that most of the
respondents are not financially fragile.
Descriptive statistics of Financial Fragility
N Able to pay
€2,000
Almost sure;
Able to pay
€2,000
Almost sure
not able to
pay €2,000
Not able to
pay €2,000
Financial Fragility 101 59 17 5 20
Table 5: Descriptive Statistics of Financial Fragility
25
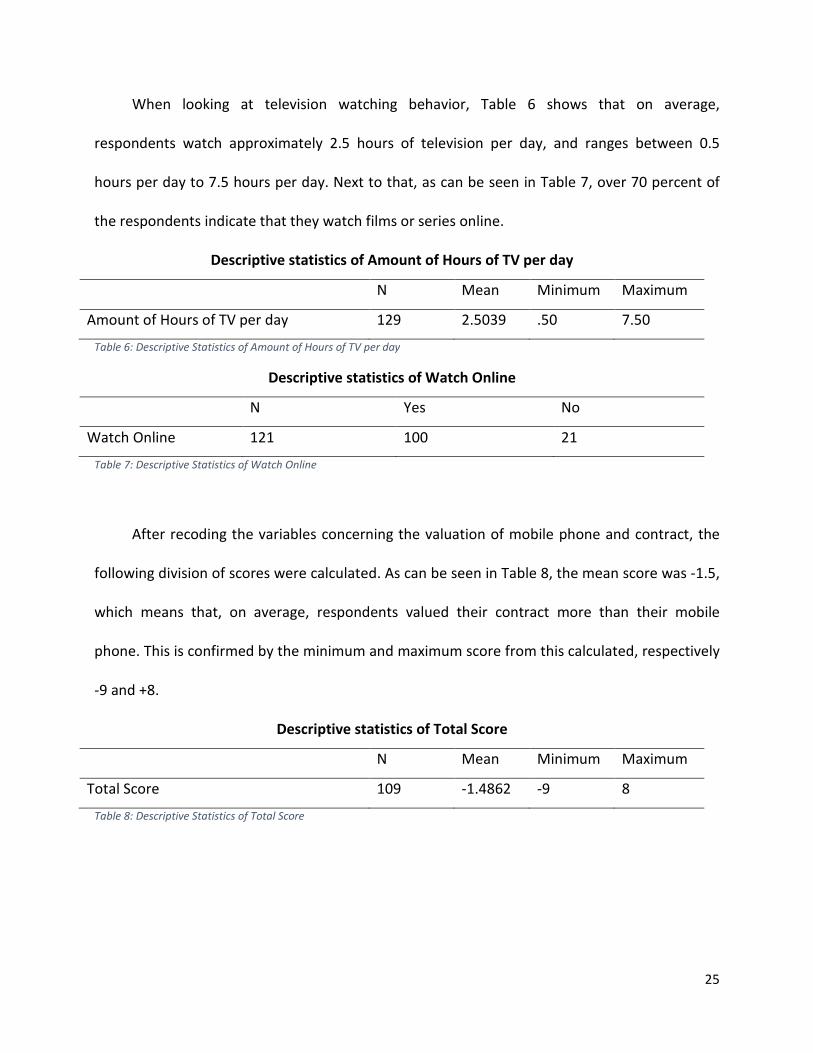
When looking at television watching behavior, Table 6 shows that on average,
respondents watch approximately 2.5 hours of television per day, and ranges between 0.5
hours per day to 7.5 hours per day. Next to that, as can be seen in Table 7, over 70 percent of
the respondents indicate that they watch films or series online.
Descriptive statistics of Amount of Hours of TV per day
N Mean Minimum Maximum
Amount of Hours of TV per day 129 2.5039 .50 7.50
Table 6: Descriptive Statistics of Amount of Hours of TV per day
Descriptive statistics of Watch Online
N Yes No
Watch Online 121 100 21
Table 7: Descriptive Statistics of Watch Online
After recoding the variables concerning the valuation of mobile phone and contract, the
following division of scores were calculated. As can be seen in Table 8, the mean score was -1.5,
which means that, on average, respondents valued their contract more than their mobile
phone. This is confirmed by the minimum and maximum score from this calculated, respectively
-9 and +8.
Descriptive statistics of Total Score
N Mean Minimum Maximum
Total Score 109 -1.4862 -9 8
Table 8: Descriptive Statistics of Total Score
26
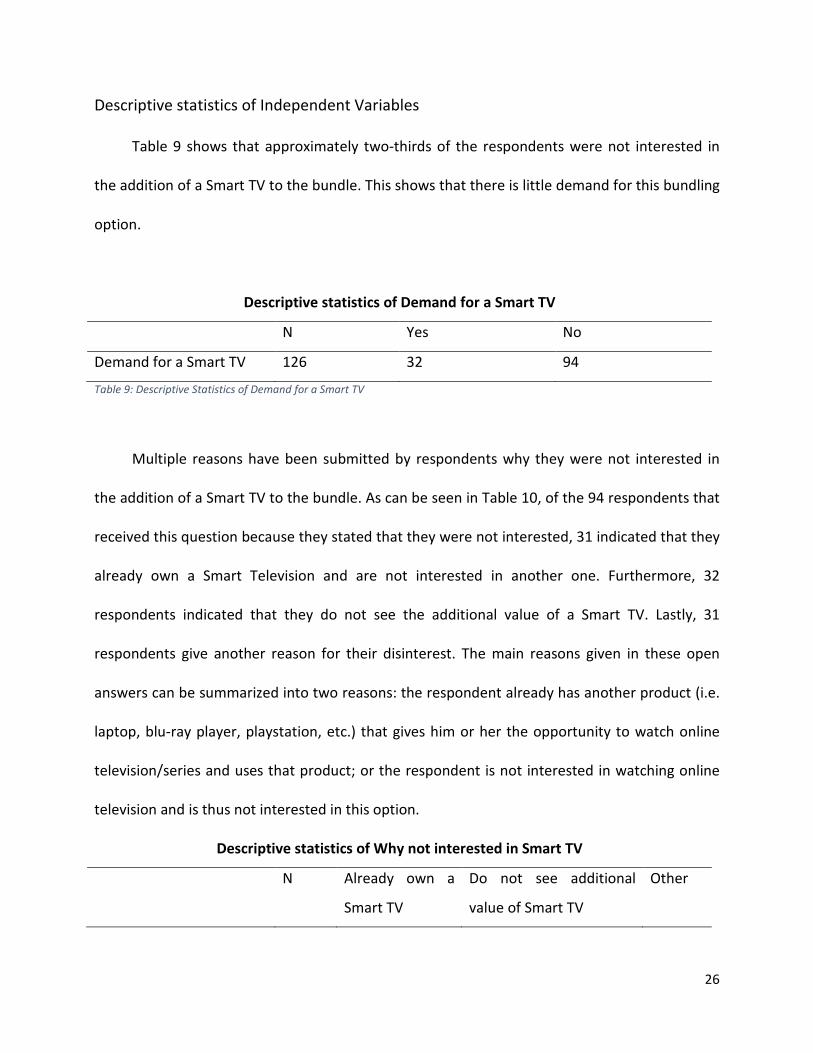
Descriptive statistics of Independent Variables
Table 9 shows that approximately two-thirds of the respondents were not interested in
the addition of a Smart TV to the bundle. This shows that there is little demand for this bundling
option.
Descriptive statistics of Demand for a Smart TV
N Yes No
Demand for a Smart TV 126 32 94
Table 9: Descriptive Statistics of Demand for a Smart TV
Multiple reasons have been submitted by respondents why they were not interested in
the addition of a Smart TV to the bundle. As can be seen in Table 10, of the 94 respondents that
received this question because they stated that they were not interested, 31 indicated that they
already own a Smart Television and are not interested in another one. Furthermore, 32
respondents indicated that they do not see the additional value of a Smart TV. Lastly, 31
respondents give another reason for their disinterest. The main reasons given in these open
answers can be summarized into two reasons: the respondent already has another product (i.e.
laptop, blu-ray player, playstation, etc.) that gives him or her the opportunity to watch online
television/series and uses that product; or the respondent is not interested in watching online
television and is thus not interested in this option.
Descriptive statistics of Why not interested in Smart TV
N Already own a
Smart TV
Do not see additional
value of Smart TV
Other
27
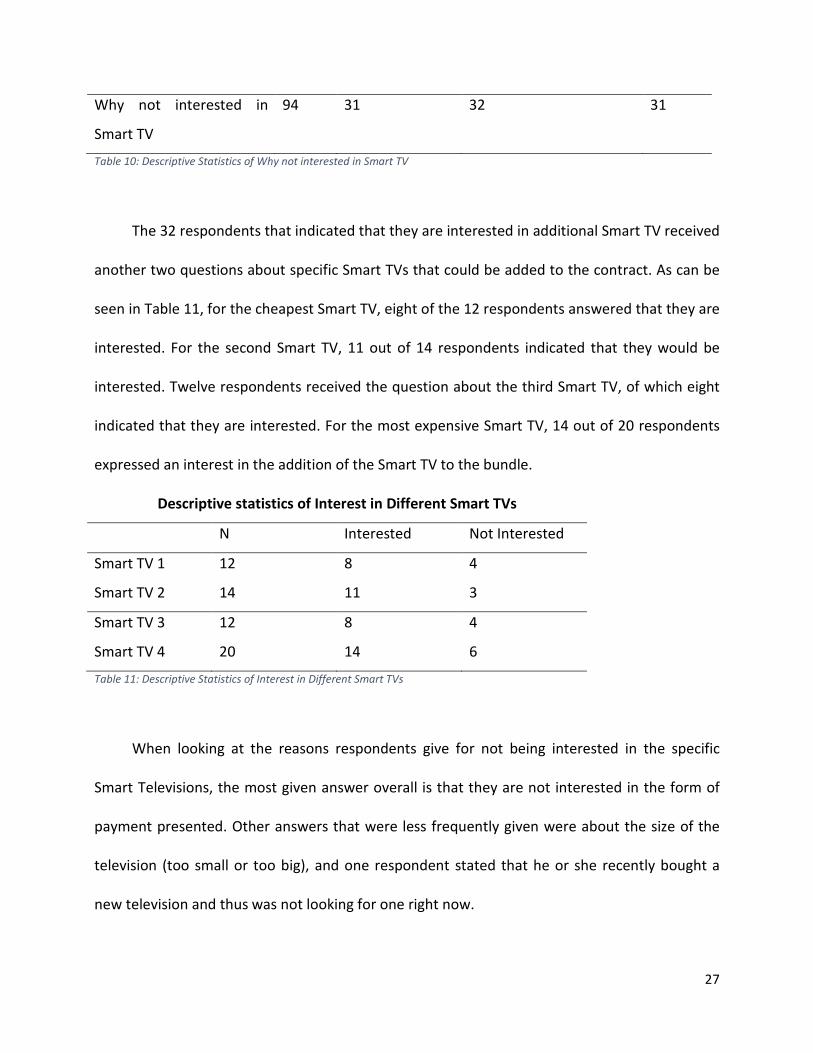
Why not interested in
Smart TV
94 31 32 31
Table 10: Descriptive Statistics of Why not interested in Smart TV
The 32 respondents that indicated that they are interested in additional Smart TV received
another two questions about specific Smart TVs that could be added to the contract. As can be
seen in Table 11, for the cheapest Smart TV, eight of the 12 respondents answered that they are
interested. For the second Smart TV, 11 out of 14 respondents indicated that they would be
interested. Twelve respondents received the question about the third Smart TV, of which eight
indicated that they are interested. For the most expensive Smart TV, 14 out of 20 respondents
expressed an interest in the addition of the Smart TV to the bundle.
Descriptive statistics of Interest in Different Smart TVs
N Interested Not Interested
Smart TV 1 12 8 4
Smart TV 2 14 11 3
Smart TV 3 12 8 4
Smart TV 4 20 14 6
Table 11: Descriptive Statistics of Interest in Different Smart TVs
When looking at the reasons respondents give for not being interested in the specific
Smart Televisions, the most given answer overall is that they are not interested in the form of
payment presented. Other answers that were less frequently given were about the size of the
television (too small or too big), and one respondent stated that he or she recently bought a
new television and thus was not looking for one right now.
28
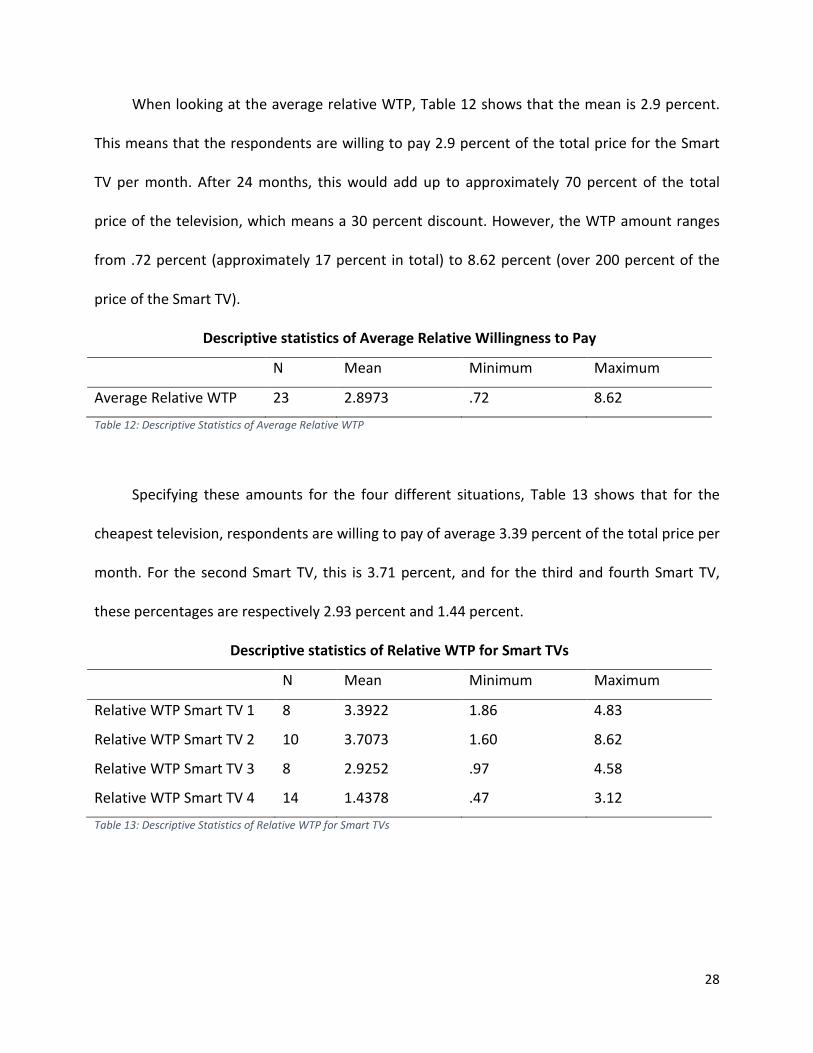
When looking at the average relative WTP, Table 12 shows that the mean is 2.9 percent.
This means that the respondents are willing to pay 2.9 percent of the total price for the Smart
TV per month. After 24 months, this would add up to approximately 70 percent of the total
price of the television, which means a 30 percent discount. However, the WTP amount ranges
from .72 percent (approximately 17 percent in total) to 8.62 percent (over 200 percent of the
price of the Smart TV).
Descriptive statistics of Average Relative Willingness to Pay
N Mean Minimum Maximum
Average Relative WTP 23 2.8973 .72 8.62
Table 12: Descriptive Statistics of Average Relative WTP
Specifying these amounts for the four different situations, Table 13 shows that for the
cheapest television, respondents are willing to pay of average 3.39 percent of the total price per
month. For the second Smart TV, this is 3.71 percent, and for the third and fourth Smart TV,
these percentages are respectively 2.93 percent and 1.44 percent.
Descriptive statistics of Relative WTP for Smart TVs
N Mean Minimum Maximum
Relative WTP Smart TV 1 8 3.3922 1.86 4.83
Relative WTP Smart TV 2 10 3.7073 1.60 8.62
Relative WTP Smart TV 3 8 2.9252 .97 4.58
Relative WTP Smart TV 4 14 1.4378 .47 3.12
Table 13: Descriptive Statistics of Relative WTP for Smart TVs
29
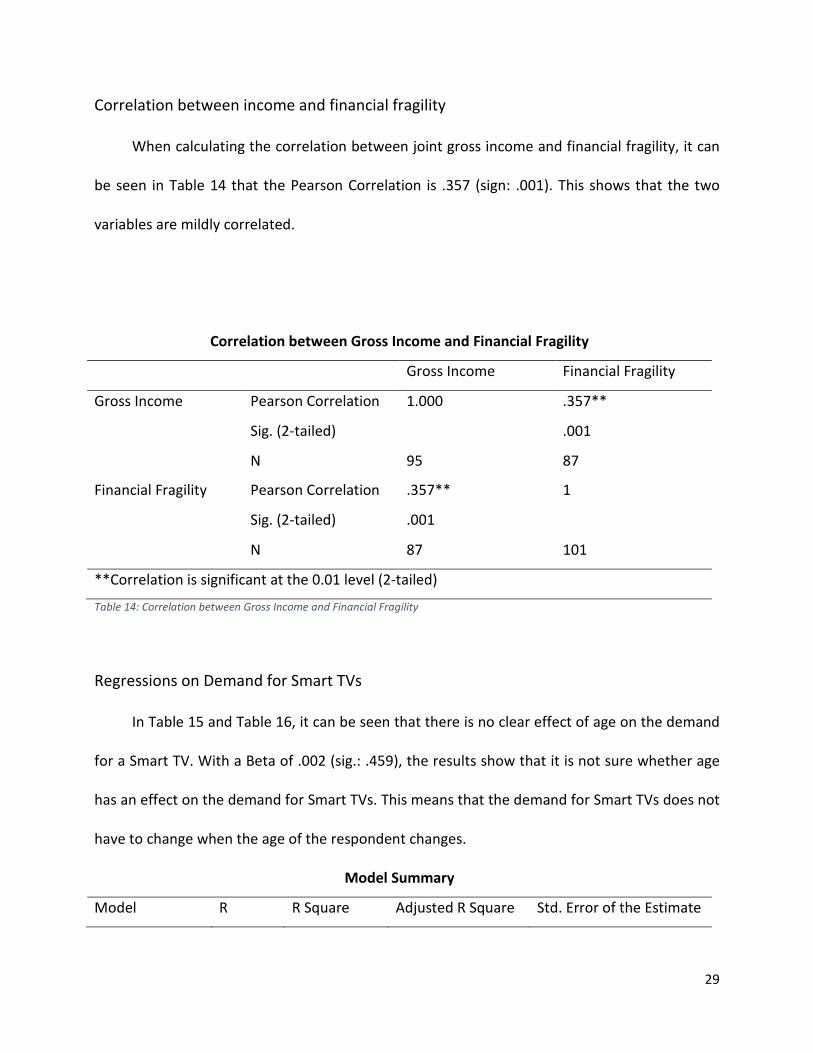
Correlation between income and financial fragility
When calculating the correlation between joint gross income and financial fragility, it can
be seen in Table 14 that the Pearson Correlation is .357 (sign: .001). This shows that the two
variables are mildly correlated.
Correlation between Gross Income and Financial Fragility
Gross Income Financial Fragility
Gross Income Pearson Correlation 1.000 .357**
Sig. (2-tailed) .001
N 95 87
Financial Fragility Pearson Correlation .357** 1
Sig. (2-tailed) .001
N 87 101
**Correlation is significant at the 0.01 level (2-tailed)
Table 14: Correlation between Gross Income and Financial Fragility
Regressions on Demand for Smart TVs
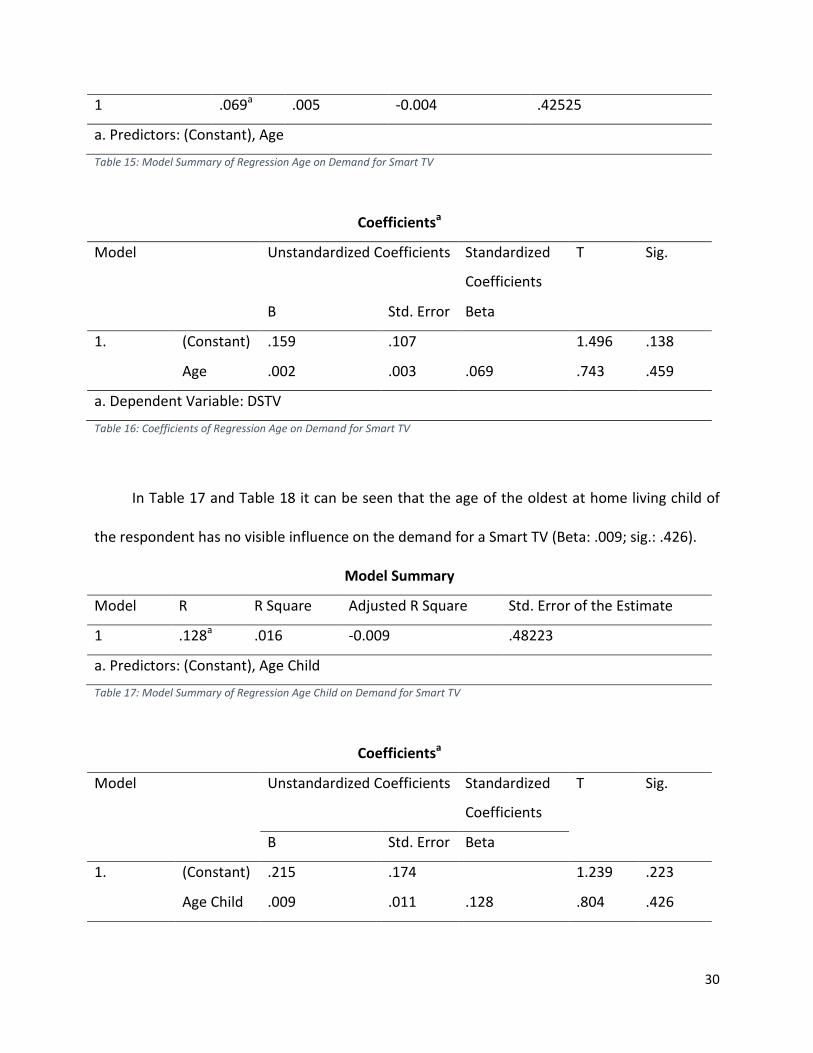
In Table 15 and Table 16, it can be seen that there is no clear effect of age on the demand
for a Smart TV. With a Beta of .002 (sig.: .459), the results show that it is not sure whether age
has an effect on the demand for Smart TVs. This means that the demand for Smart TVs does not
have to change when the age of the respondent changes.
Model Summary
Model R R Square Adjusted R Square Std. Error of the Estimate
30
1 .069a .005 -0.004 .42525
a. Predictors: (Constant), Age
Table 15: Model Summary of Regression Age on Demand for Smart TV
Coefficientsa
Model Unstandardized Coefficients Standardized
Coefficients
T Sig.
B Std. Error Beta
1. (Constant) .159 .107 1.496 .138
Age .002 .003 .069 .743 .459
a. Dependent Variable: DSTV
Table 16: Coefficients of Regression Age on Demand for Smart TV
In Table 17 and Table 18 it can be seen that the age of the oldest at home living child of
the respondent has no visible influence on the demand for a Smart TV (Beta: .009; sig.: .426).
Model Summary
Model R R Square Adjusted R Square Std. Error of the Estimate
1 .128a .016 -0.009 .48223
a. Predictors: (Constant), Age Child
Table 17: Model Summary of Regression Age Child on Demand for Smart TV
Coefficientsa
Model Unstandardized Coefficients Standardized
Coefficients
T Sig.
B Std. Error Beta
1. (Constant) .215 .174 1.239 .223
Age Child .009 .011 .128 .804 .426
31
a. Dependent Variable: DSTV
Table 18: Coefficients of Regression Age Child on Demand for Smart TV
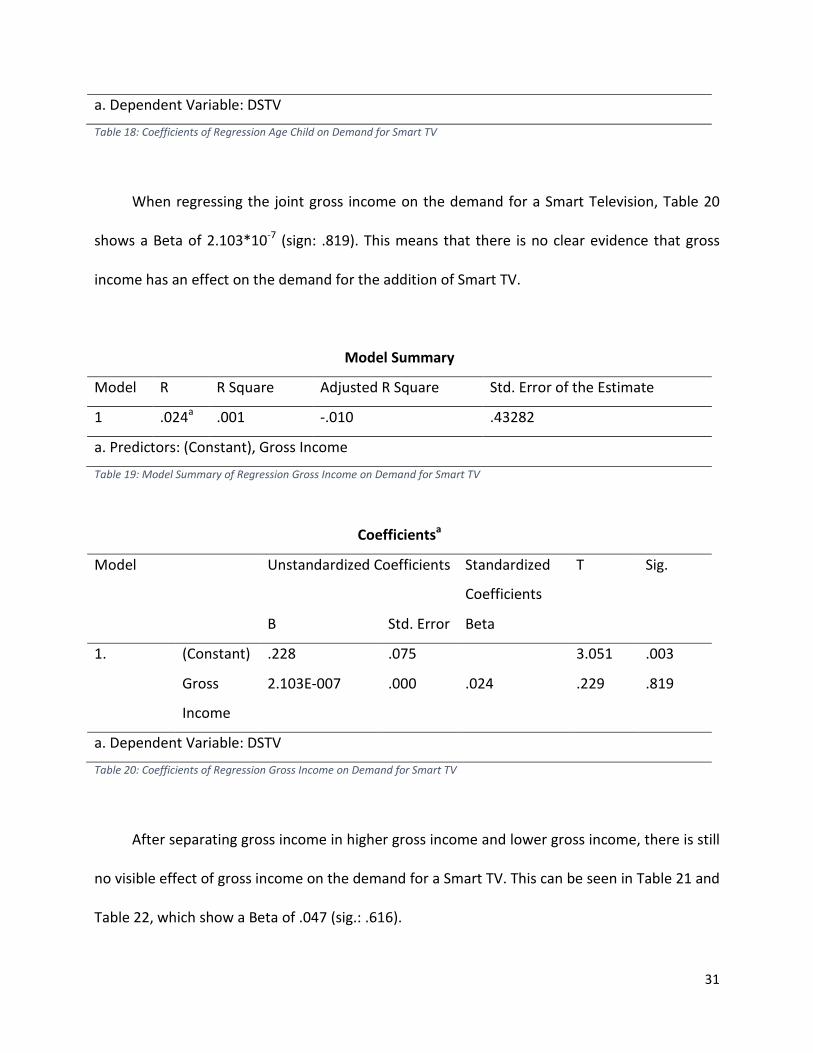
When regressing the joint gross income on the demand for a Smart Television, Table 20
shows a Beta of 2.103*10-7 (sign: .819). This means that there is no clear evidence that gross
income has an effect on the demand for the addition of Smart TV.
Model Summary
Model R R Square Adjusted R Square Std. Error of the Estimate
1 .024a .001 -.010 .43282
a. Predictors: (Constant), Gross Income
Table 19: Model Summary of Regression Gross Income on Demand for Smart TV
Coefficientsa
Model Unstandardized Coefficients Standardized
Coefficients
T Sig.
B Std. Error Beta
1. (Constant) .228 .075 3.051 .003
Gross
Income
2.103E-007 .000 .024 .229 .819
a. Dependent Variable: DSTV
Table 20: Coefficients of Regression Gross Income on Demand for Smart TV
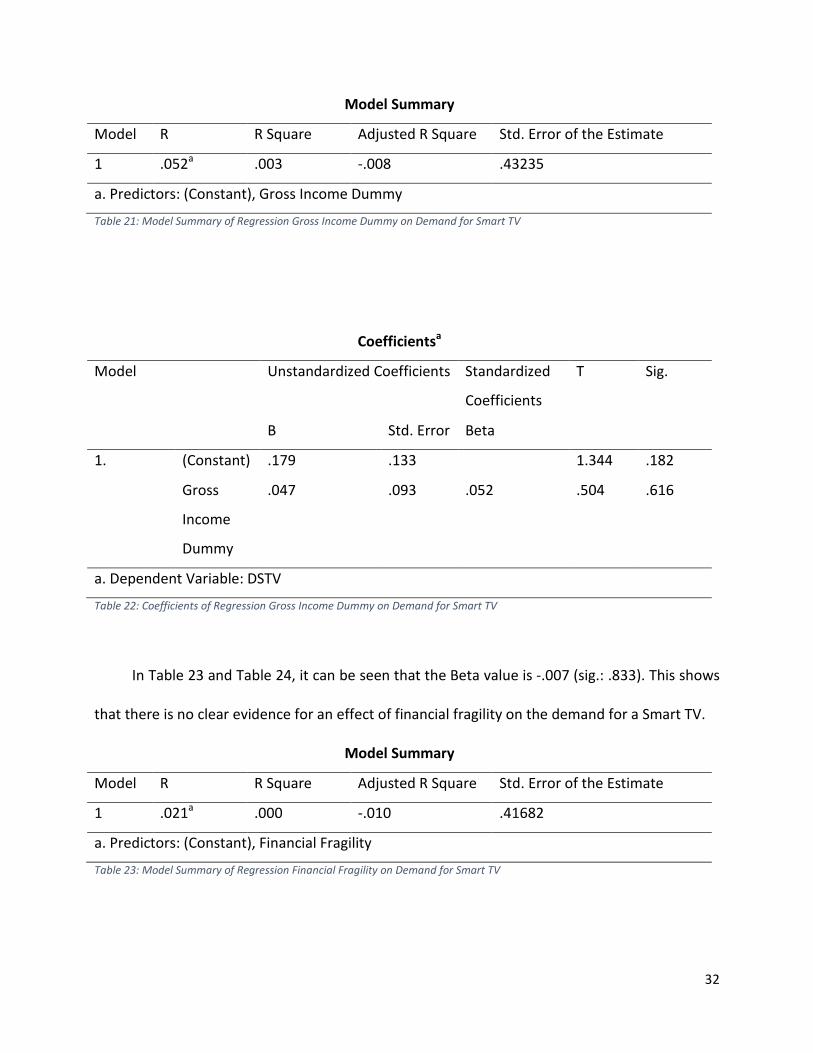
After separating gross income in higher gross income and lower gross income, there is still
no visible effect of gross income on the demand for a Smart TV. This can be seen in Table 21 and
Table 22, which show a Beta of .047 (sig.: .616).
32
Model Summary
Model R R Square Adjusted R Square Std. Error of the Estimate
1 .052a .003 -.008 .43235
a. Predictors: (Constant), Gross Income Dummy
Table 21: Model Summary of Regression Gross Income Dummy on Demand for Smart TV
Coefficientsa
Model Unstandardized Coefficients Standardized
Coefficients
T Sig.
B Std. Error Beta
1. (Constant) .179 .133 1.344 .182
Gross
Income
Dummy
.047 .093 .052 .504 .616
a. Dependent Variable: DSTV
Table 22: Coefficients of Regression Gross Income Dummy on Demand for Smart TV
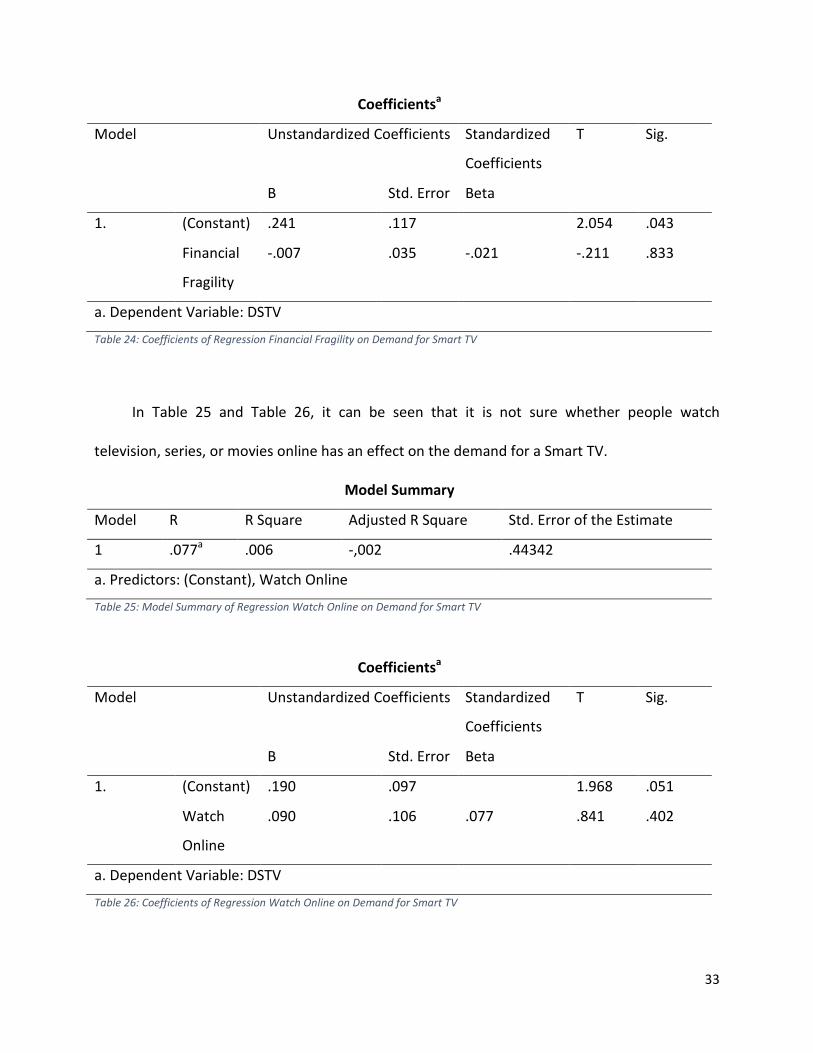
In Table 23 and Table 24, it can be seen that the Beta value is -.007 (sig.: .833). This shows
that there is no clear evidence for an effect of financial fragility on the demand for a Smart TV.
Model Summary
Model R R Square Adjusted R Square Std. Error of the Estimate
1 .021a .000 -.010 .41682
a. Predictors: (Constant), Financial Fragility
Table 23: Model Summary of Regression Financial Fragility on Demand for Smart TV
33
Coefficientsa
Model Unstandardized Coefficients Standardized
Coefficients
T Sig.
B Std. Error Beta
1. (Constant) .241 .117 2.054 .043
Financial
Fragility
-.007 .035 -.021 -.211 .833
a. Dependent Variable: DSTV
Table 24: Coefficients of Regression Financial Fragility on Demand for Smart TV
In Table 25 and Table 26, it can be seen that it is not sure whether people watch
television, series, or movies online has an effect on the demand for a Smart TV.
Model Summary
Model R R Square Adjusted R Square Std. Error of the Estimate
1 .077a .006 -,002 .44342
a. Predictors: (Constant), Watch Online
Table 25: Model Summary of Regression Watch Online on Demand for Smart TV
Coefficientsa
Model Unstandardized Coefficients Standardized
Coefficients
T Sig.
B Std. Error Beta
1. (Constant) .190 .097 1.968 .051
Watch
Online
.090 .106 .077 .841 .402
a. Dependent Variable: DSTV
Table 26: Coefficients of Regression Watch Online on Demand for Smart TV
34
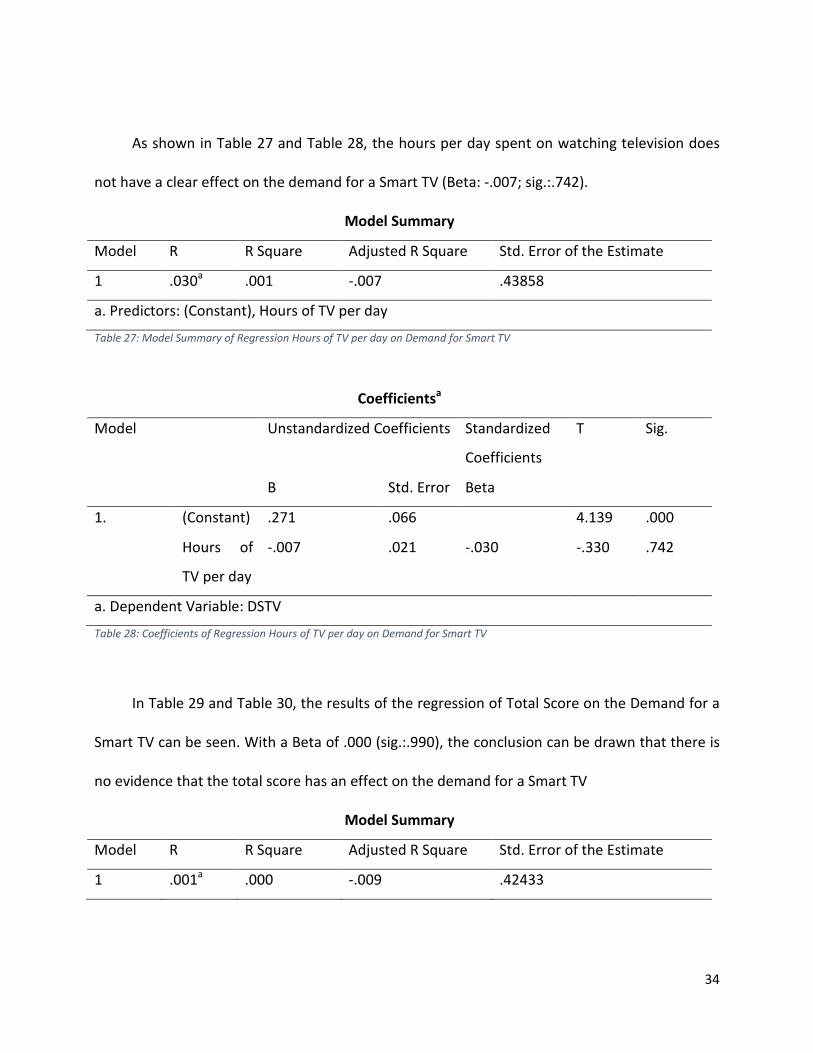
As shown in Table 27 and Table 28, the hours per day spent on watching television does
not have a clear effect on the demand for a Smart TV (Beta: -.007; sig.:.742).
Model Summary
Model R R Square Adjusted R Square Std. Error of the Estimate
1 .030a .001 -.007 .43858
a. Predictors: (Constant), Hours of TV per day
Table 27: Model Summary of Regression Hours of TV per day on Demand for Smart TV
Coefficientsa
Model Unstandardized Coefficients Standardized
Coefficients
T Sig.
B Std. Error Beta
1. (Constant) .271 .066 4.139 .000
Hours of
TV per day
-.007 .021 -.030 -.330 .742
a. Dependent Variable: DSTV
Table 28: Coefficients of Regression Hours of TV per day on Demand for Smart TV
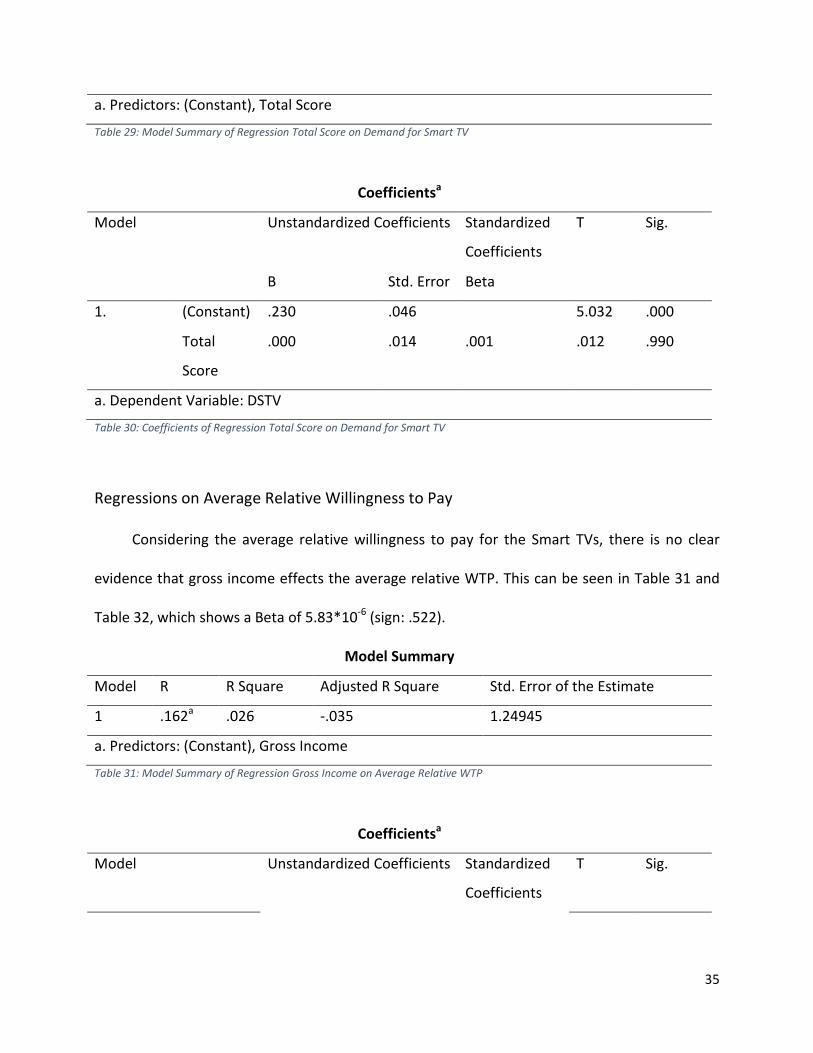
In Table 29 and Table 30, the results of the regression of Total Score on the Demand for a
Smart TV can be seen. With a Beta of .000 (sig.:.990), the conclusion can be drawn that there is
no evidence that the total score has an effect on the demand for a Smart TV
Model Summary
Model R R Square Adjusted R Square Std. Error of the Estimate
1 .001a .000 -.009 .42433
35
a. Predictors: (Constant), Total Score
Table 29: Model Summary of Regression Total Score on Demand for Smart TV
Coefficientsa
Model Unstandardized Coefficients Standardized
Coefficients
T Sig.
B Std. Error Beta
1. (Constant) .230 .046 5.032 .000
Total
Score
.000 .014 .001 .012 .990
a. Dependent Variable: DSTV
Table 30: Coefficients of Regression Total Score on Demand for Smart TV
Regressions on Average Relative Willingness to Pay
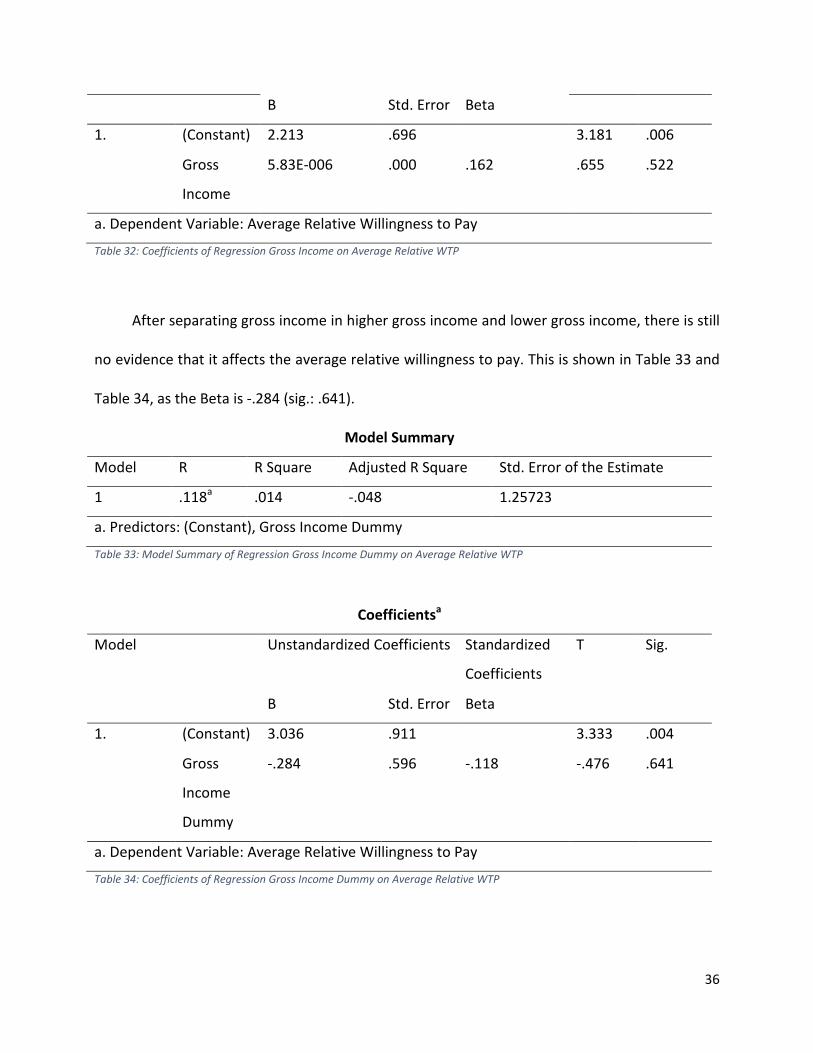
Considering the average relative willingness to pay for the Smart TVs, there is no clear
evidence that gross income effects the average relative WTP. This can be seen in Table 31 and
Table 32, which shows a Beta of 5.83*10-6 (sign: .522).
Model Summary
Model R R Square Adjusted R Square Std. Error of the Estimate
1 .162a .026 -.035 1.24945
a. Predictors: (Constant), Gross Income
Table 31: Model Summary of Regression Gross Income on Average Relative WTP
Coefficientsa
Model Unstandardized Coefficients Standardized
Coefficients
T Sig.
36
B Std. Error Beta
1. (Constant) 2.213 .696 3.181 .006
Gross
Income
5.83E-006 .000 .162 .655 .522
a. Dependent Variable: Average Relative Willingness to Pay
Table 32: Coefficients of Regression Gross Income on Average Relative WTP
After separating gross income in higher gross income and lower gross income, there is still
no evidence that it affects the average relative willingness to pay. This is shown in Table 33 and
Table 34, as the Beta is -.284 (sig.: .641).
Model Summary
Model R R Square Adjusted R Square Std. Error of the Estimate
1 .118a .014 -.048 1.25723
a. Predictors: (Constant), Gross Income Dummy
Table 33: Model Summary of Regression Gross Income Dummy on Average Relative WTP
Coefficientsa
Model Unstandardized Coefficients Standardized
Coefficients
T Sig.
B Std. Error Beta
1. (Constant) 3.036 .911 3.333 .004
Gross
Income
Dummy
-.284 .596 -.118 -.476 .641
a. Dependent Variable: Average Relative Willingness to Pay
Table 34: Coefficients of Regression Gross Income Dummy on Average Relative WTP
37
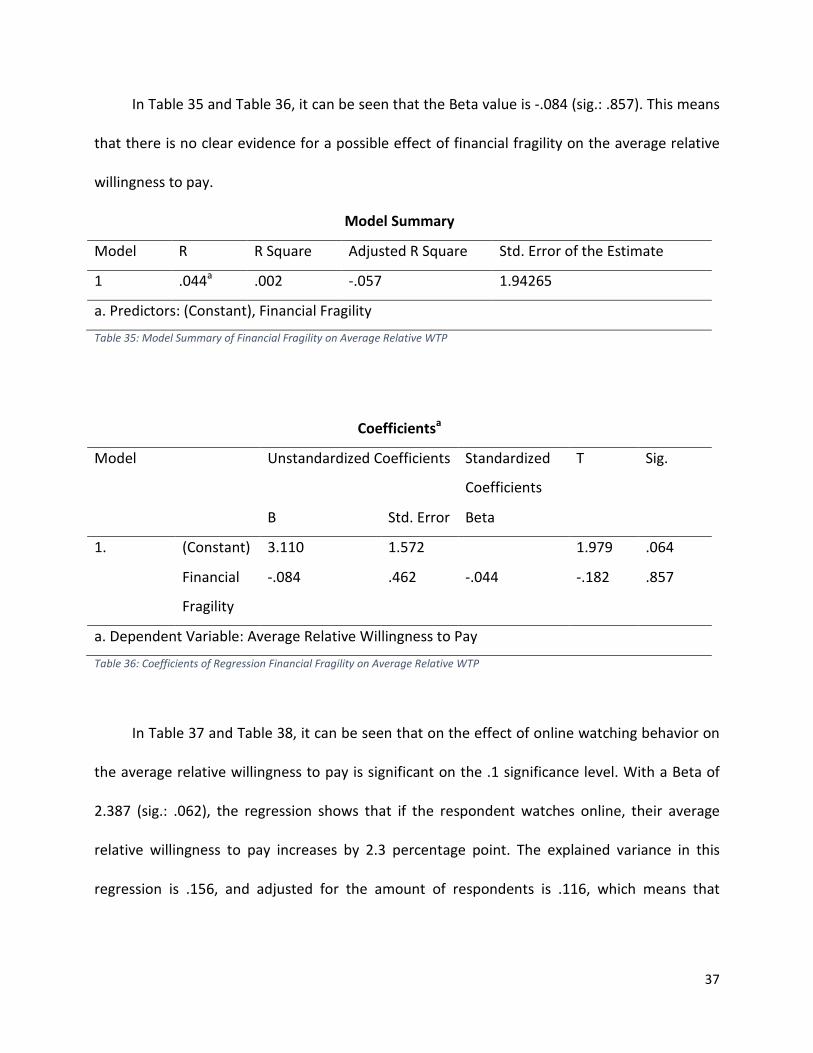
In Table 35 and Table 36, it can be seen that the Beta value is -.084 (sig.: .857). This means
that there is no clear evidence for a possible effect of financial fragility on the average relative
willingness to pay.
Model Summary
Model R R Square Adjusted R Square Std. Error of the Estimate
1 .044a .002 -.057 1.94265
a. Predictors: (Constant), Financial Fragility
Table 35: Model Summary of Financial Fragility on Average Relative WTP
Coefficientsa
Model Unstandardized Coefficients Standardized
Coefficients
T Sig.
B Std. Error Beta
1. (Constant) 3.110 1.572 1.979 .064
Financial
Fragility
-.084 .462 -.044 -.182 .857
a. Dependent Variable: Average Relative Willingness to Pay
Table 36: Coefficients of Regression Financial Fragility on Average Relative WTP
In Table 37 and Table 38, it can be seen that on the effect of online watching behavior on
the average relative willingness to pay is significant on the .1 significance level. With a Beta of
2.387 (sig.: .062), the regression shows that if the respondent watches online, their average
relative willingness to pay increases by 2.3 percentage point. The explained variance in this
regression is .156, and adjusted for the amount of respondents is .116, which means that
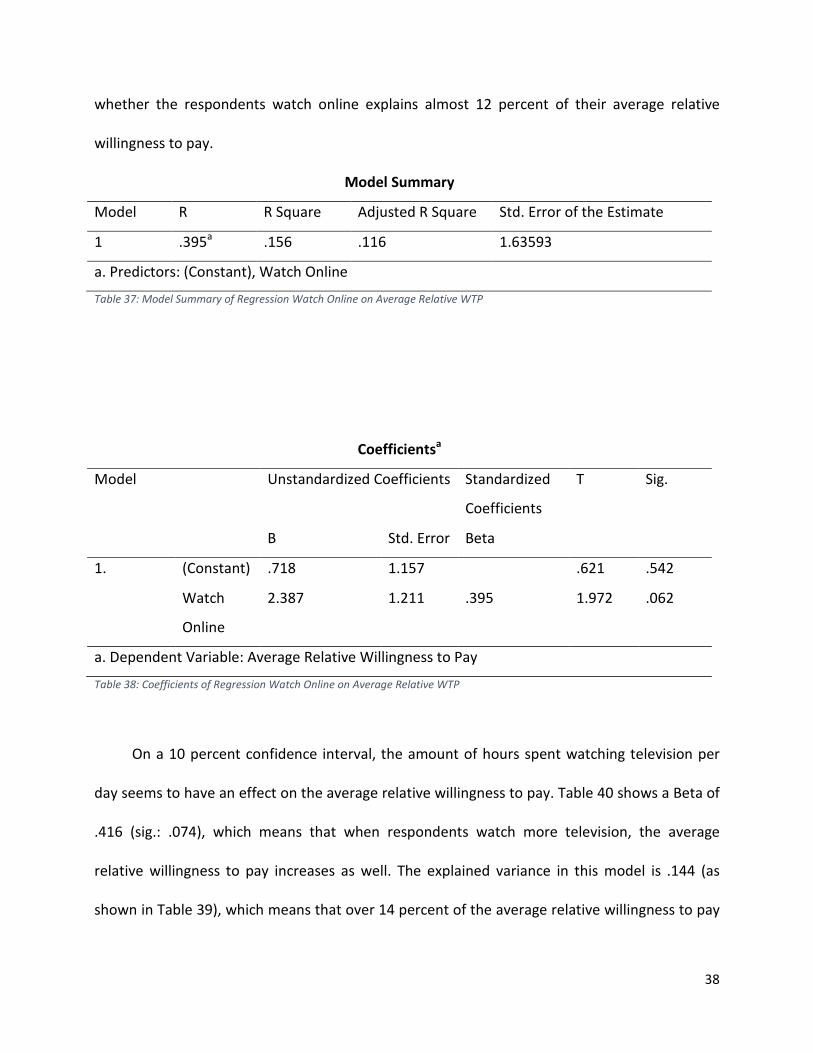
38
whether the respondents watch online explains almost 12 percent of their average relative
willingness to pay.
Model Summary
Model R R Square Adjusted R Square Std. Error of the Estimate
1 .395a .156 .116 1.63593
a. Predictors: (Constant), Watch Online
Table 37: Model Summary of Regression Watch Online on Average Relative WTP
Coefficientsa
Model Unstandardized Coefficients Standardized
Coefficients
T Sig.
B Std. Error Beta
1. (Constant) .718 1.157 .621 .542
Watch
Online
2.387 1.211 .395 1.972 .062
a. Dependent Variable: Average Relative Willingness to Pay
Table 38: Coefficients of Regression Watch Online on Average Relative WTP
On a 10 percent confidence interval, the amount of hours spent watching television per
day seems to have an effect on the average relative willingness to pay. Table 40 shows a Beta of
.416 (sig.: .074), which means that when respondents watch more television, the average
relative willingness to pay increases as well. The explained variance in this model is .144 (as
shown in Table 39), which means that over 14 percent of the average relative willingness to pay
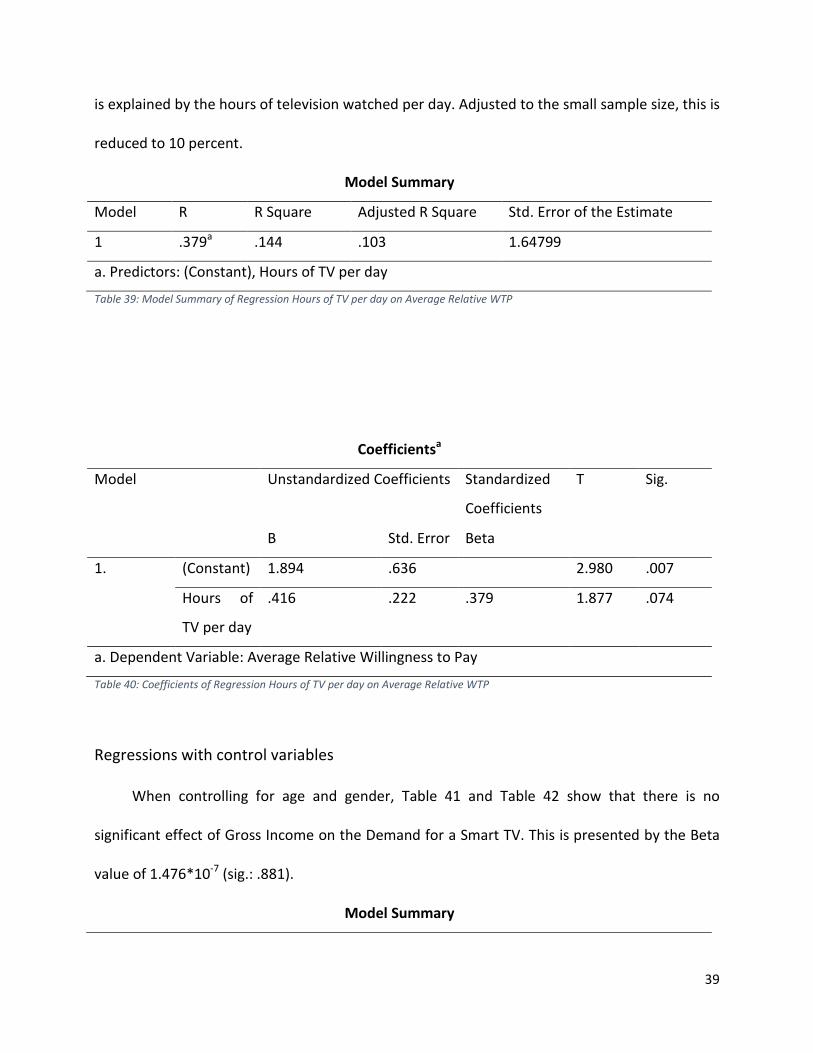
39
is explained by the hours of television watched per day. Adjusted to the small sample size, this is
reduced to 10 percent.
Model Summary
Model R R Square Adjusted R Square Std. Error of the Estimate
1 .379a .144 .103 1.64799
a. Predictors: (Constant), Hours of TV per day
Table 39: Model Summary of Regression Hours of TV per day on Average Relative WTP
Coefficientsa
Model Unstandardized Coefficients Standardized
Coefficients
T Sig.
B Std. Error Beta
1. (Constant) 1.894 .636 2.980 .007
Hours of
TV per day
.416 .222 .379 1.877 .074
a. Dependent Variable: Average Relative Willingness to Pay
Table 40: Coefficients of Regression Hours of TV per day on Average Relative WTP
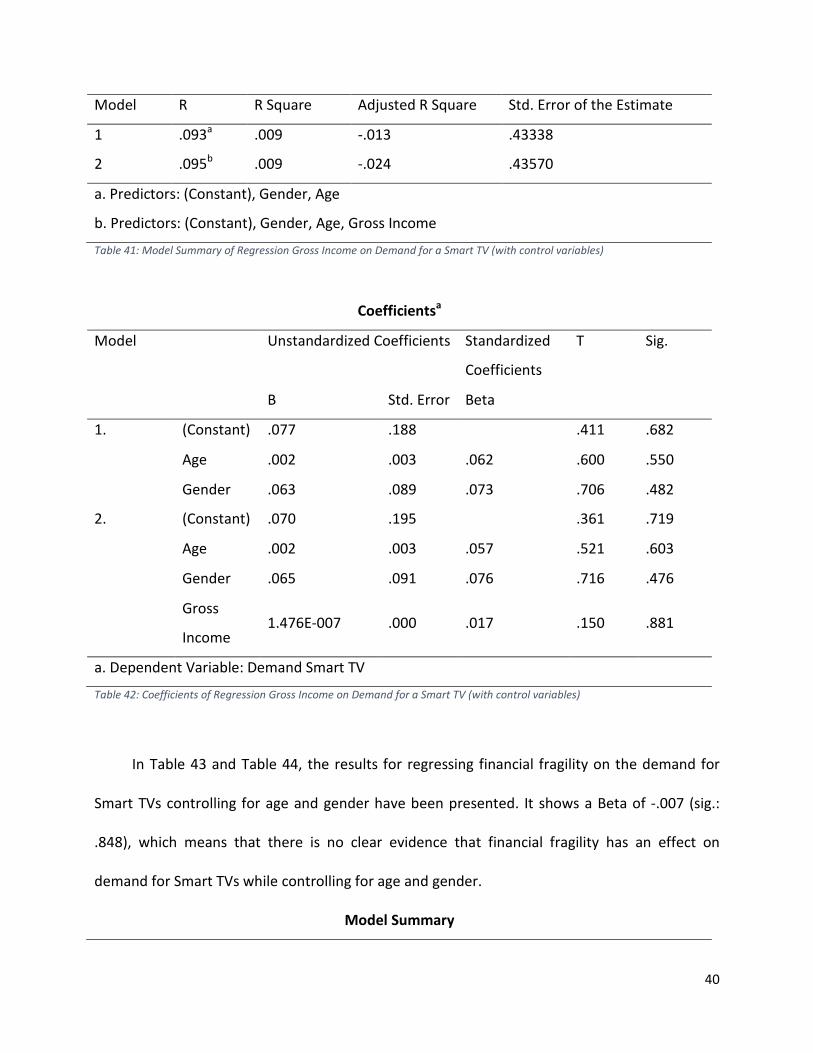
Regressions with control variables
When controlling for age and gender, Table 41 and Table 42 show that there is no
significant effect of Gross Income on the Demand for a Smart TV. This is presented by the Beta
value of 1.476*10-7 (sig.: .881).
Model Summary
40
Model R R Square Adjusted R Square Std. Error of the Estimate
1 .093a .009 -.013 .43338
2 .095b .009 -.024 .43570
a. Predictors: (Constant), Gender, Age
b. Predictors: (Constant), Gender, Age, Gross Income
Table 41: Model Summary of Regression Gross Income on Demand for a Smart TV (with control variables)
Coefficientsa
Model Unstandardized Coefficients Standardized
Coefficients
T Sig.
B Std. Error Beta
1. (Constant) .077 .188 .411 .682
Age .002 .003 .062 .600 .550
Gender .063 .089 .073 .706 .482
2. (Constant) .070 .195 .361 .719
Age .002 .003 .057 .521 .603
Gender .065 .091 .076 .716 .476
Gross
Income 1.476E-007 .000 .017 .150 .881
a. Dependent Variable: Demand Smart TV
Table 42: Coefficients of Regression Gross Income on Demand for a Smart TV (with control variables)
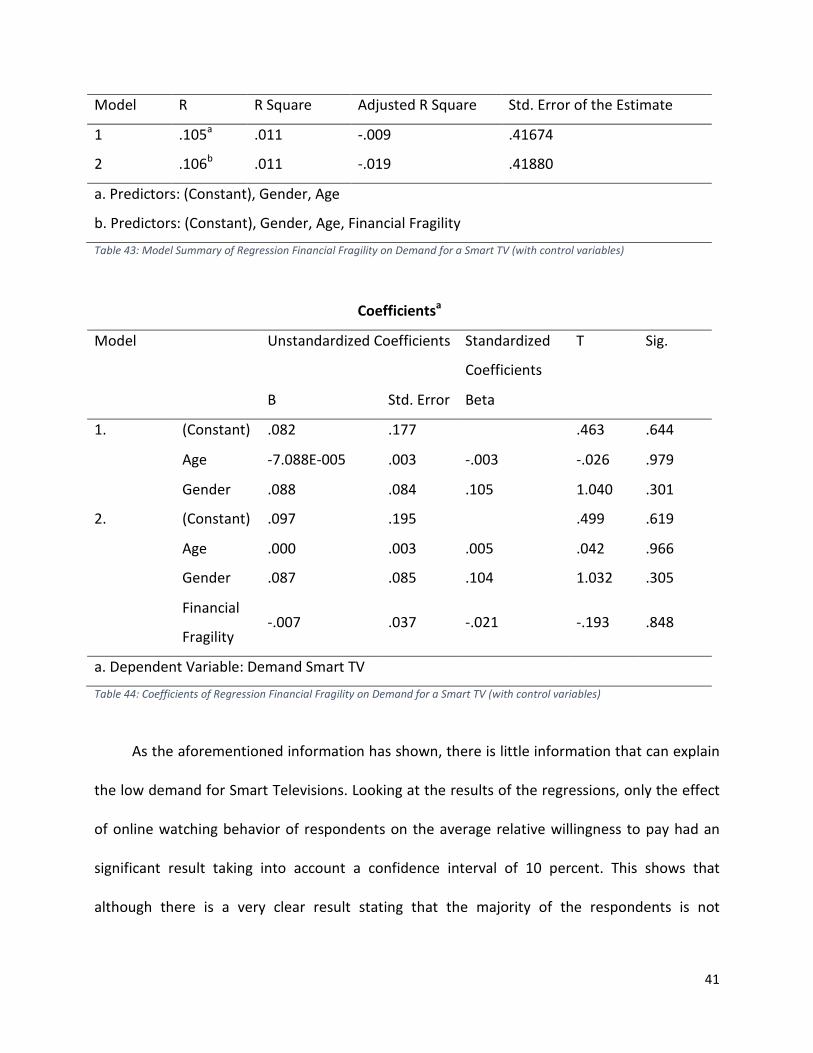
In Table 43 and Table 44, the results for regressing financial fragility on the demand for
Smart TVs controlling for age and gender have been presented. It shows a Beta of -.007 (sig.:
.848), which means that there is no clear evidence that financial fragility has an effect on
demand for Smart TVs while controlling for age and gender.
Model Summary
41
Model R R Square Adjusted R Square Std. Error of the Estimate
1 .105a .011 -.009 .41674
2 .106b .011 -.019 .41880
a. Predictors: (Constant), Gender, Age
b. Predictors: (Constant), Gender, Age, Financial Fragility
Table 43: Model Summary of Regression Financial Fragility on Demand for a Smart TV (with control variables)
Coefficientsa
Model Unstandardized Coefficients Standardized
Coefficients
T Sig.
B Std. Error Beta
1. (Constant) .082 .177 .463 .644
Age -7.088E-005 .003 -.003 -.026 .979
Gender .088 .084 .105 1.040 .301
2. (Constant) .097 .195 .499 .619
Age .000 .003 .005 .042 .966
Gender .087 .085 .104 1.032 .305
Financial
Fragility -.007 .037 -.021 -.193 .848
a. Dependent Variable: Demand Smart TV
Table 44: Coefficients of Regression Financial Fragility on Demand for a Smart TV (with control variables)
As the aforementioned information has shown, there is little information that can explain
the low demand for Smart Televisions. Looking at the results of the regressions, only the effect
of online watching behavior of respondents on the average relative willingness to pay had an
significant result taking into account a confidence interval of 10 percent. This shows that
although there is a very clear result stating that the majority of the respondents is not

42
interested in a Smart TV. After the addition of control variables, age and gender, no significant
results were found, showing that this data shows no evidence for a possible explanation about
why the respondents were not interested in a Smart TV.
43
Discussion
Whereas several studies have shown that bundles ought to be more attractive for
consumers, this study shows that for the proposed bundle this is not the case. The results have
presented evidence that the majority of the respondents is not interested in either the addition
of a Smart TV to the bundle for telephone, internet, and television in their homes, or the Smart
TV in general. However, comparing these results with the amount of people that already own a
Smart TV, which is approximately 50 percent, it is interesting to see that demand is low.
One of the most commonly given reasons for not being interested in the addition of a
Smart TV is that consumers are not interested in the extra features introduced in the Smart
television. This means that the perceived value of the additional features is low for consumers,
and that they thus do not see the benefits of a Smart TV compared to a regular television.
However, when comparing this with the amount of people that watch films or series online –
which is one of the most important features of a Smart TV – it seems that these do not match.
One possible reason for this behavior is that people mostly use their laptops for watching online
broadcasts, and do not see the necessity of watching these on a bigger screen.
Another possible reason for the disinterest in a Smart TV is the fact that some
respondents stated that they are happy with the television they already own or that they
recently bought a new television and not looking for a new one. The conclusion that can be
drawn from these answers is that people keep their televisions for a longer period. Comparing
this to the smartphone market, where people often change their mobile phones after a period
of two years, a difference can be seen that explains the results of this study. A possible
explanation is that the proposed situation where respondents pay off the Smart TV in two years
44
might be too comparable with the smartphone market where people change their mobile
phone after paying off the old one. This might have caused the respondents to think that they
will get a new Smart TV after two years, whereas they would normally keep a television for a
longer period. The fact that this option was available in the situation presented in the
questionnaire might have been missed by the respondents, and thus lead to the idea that they
are not interested. This can be linked to certain habits consumers are used to: i.e. you get a new
smartphone after every two years, whereas a television is a product that is only bought when
the old television breaks down. This difference in habits might influence the decision-making
behavior in this study. Because the respondents are used to the way certain things go, a change
in their habits might seem unnatural, and therefore they are not interested in the addition of a
Smart TV to the telecommunication bundle.
Limitations
As described above already, there are certain limitations to this study. Firstly, the
contingent valuation method focuses on hypothetical situations. Although these situations have
been presented as clearly and realistically as possible, they are still hypothetical. Therefore it is
not certain whether the respondent would make the same decision in when the situation occurs
in real life. The same can be concluded for the willingness to pay, which can differ between real
and hypothetical situations. Furthermore, the respondents are not selected randomly. By using
snowball sampling, there is the probability that it cannot be generalized to the Dutch society.
This has to be taken into account when drawing conclusions on the collected data.
Furthermore, due to the high amount of respondents stating in the beginning of the
questionnaire that they were not interested in the addition of a Smart TV to the bundle, only a

45
small amount of respondents received the questions with the specific example televisions.
Therefore, the analysis of these questions were nearly impossible.
46
Conclusion
In this paper, the demand for the addition of a Smart TV for a household
telecommunication bundle has been studied. Next to the possible demand, the willingness to
pay for such a bundle has been researched with four different situations. To be able to compare
the results, some insight in the market for mobile phones – and the bundle in which they are
offered in the Netherlands – has been looked at. From the questionnaire, the results presented
a clear disinterest in the addition of a Smart TV to the bundle, and, more importantly, a lack of
interest in the demand for a Smart TV in general. Several reasons have been given for the low
demand in a Smart TV, including the idea that people are not interested in the additional
features it offers. This results in the following conclusion and answer to the research question:
There is little demand in the Netherlands for the addition of a Smart TV to the bundle for
telephone, internet, and television. This is different than the demand for the addition of a
smartphone to the contract offered by telecommunication providers, which shows a high
demand for smartphones included in bundles with a monthly pay-off. Due to the lack of interest
in a Smart TV, the willingness to pay for the product has been hard to measure, and can thus
not be answered.
For future studies, it can be recommended to look at these results again in a few years
from now, as more information will be available on Smart TVs and people might have more
knowledge about the advantages of such a product.

47
References
Adriaens, F., Van Damme, E., and Courtois, C. (2011). The spatial and social contexts of
television-viewing adolescents. Poetics, 39. 205-227.
Breidert, C. (2006). Estimation of willingness-to-pay: Theory, measurement, application.
Wiesbaden: Deutscher Universitäts-Verlag.
Breidert, C., Hahsler, M., and Reutterer, T. (2006). A review of methods for measuring
willingness-to-pay. Innovative Marketing, 2(4). 8-32.
Carson, R. T., Flores, N. E., and Meade, N. F. (2001). Contingent valuation: Controversies and
evidence. Environmental and Resource Economics, 19. 173-210.
Centraal Bureau voor de Statistiek. (2014). Tijdsbesteding in uren per week;
persoonskenmerken. [Time expenditure in hours per week; personal characteristics].
Retrieved at July 25th, 2016 from
http://statline.cbs.nl/Statweb/publication/?DM=SLNL&PA=82617NED&D1=18&D2=1-
2&D3=l&VW=T
Centraal Bureau voor de Statistiek. (2015). ICT kennis en economie. [IT knowledge and
economy]. Retrieved at April 4th, 2016 from http://download.cbs.nl/pdf/ict-kennis-
economie-2015-pub.pdf
Centraal Planbureau. (2016). Kortetermijnraming juni 2016. [CPB’s short-term forecasts June
2016]. Retrieved at August 14th, 2016 from http://www.cpb.nl/cijfer/kortetermijnraming-
juni-2016
Chang, Y.B.H. (2012). Adoption of Smart TVs: a Bayesian network approach. Industrial
Management & Data Systems, 112(6). 891-910.
48
Consumentenbond. (nd). Mobiele telefoons en abonnementen. [Mobile phones and contracts].
Retrieved at March 8th, 2016 from http://www.consumentenbond.nl/mobiele-
telefoon/extra/prepaid-abonnement/
European Patent Office. (1996). Data processing system for television in digital or analog
network (FR2726670). Retrieved at March 7th, 2016 from
http://worldwide.espacenet.com/publicationDetails/originalDocument?CC=FR&NR=2726
670A1&KC=A1&FT=D&ND=3&date=19960510&DB=EPODOC&locale=en_EP
Gensler, S., Hinz, O., Skiera, B., and Theysohn, S. (2012). Willingness-to-pay estimation with
choice-based conjoint analysis: Addressing extreme response behavior with individually
adapted designs. European Journal of Operational Research, 219. 368-378.
GfK. (2015). Geen groei meer in bezit (mobiele) devices. [No more growth in possession of
(mobile) devices]. Retrieved at March 6th, 2016 from
http://www.gfk.com/nl/insights/press-release/geen-groei-meer-in-bezit-mobiele-devices/
Guiltinan, J. P. (1987). The price bundling of services: A normative framework. Journal of
Marketing, 51(2). 74-85.
Green, P.E., and Srinivasan, V. (1990). Conjoint analysis in marketing: New developments with
implications for research and practice. Journal of Marketing, 54(4). 3-19.
Green, P. E., and Wind, Y. W. (1975). New Way to Measure Consumers’ Judgments. The Harvard
Business Review. Retrieved at April 11th, 2016 from https://hbr.org/1975/07/new-way-to-
measure-consumers-judgments
Halme, M. and Kallio, M. (2011). Estimation methods for choice-based conjoint analysis of
consumer preferences. European Journal of Operational Research, 214. 160-167.
49
Harris, J., and Blair, E. A. (2006). Consumer preference for product bundles: The role of reduced
search costs. Journal of the Academy of Marketing Science, 34(4). 506-513.
Harris, J., and Blair, E. A. (2012). Consumer processing of bundles prices: when do discounts
matter? Journal of Product & Brand Management, 21(3). 205-214.
Heeler, R. M., Nguyen, A., and Buff, C. (2007). Bundles = discount? Revisiting complex theories
of bundle effects. Journal of Product & Brand Management, 16(7). 492-500.
Heyman, S. (2015). Netflix taps into a growing international market. The New York Times.
Retrieved at April 8th, 2016 from
http://www.nytimes.com/2015/02/12/arts/international/netflix-taps-into-a-growing-
international-market.html?_r=0
Hoevenagel, R. (1994). The contingent valuation method: Scope and validity. Amsterdam: Vrije
Universiteit.
Hoyle, R. H., Harris, M. J., and Judd, C. M. (2002). Research methods in social relations. Fort
Worth, TX: Wadsworth.
Klein, A., and Jakopin, N. (2014). Consumers’ willingness-to-pay for mobile telecommunication
service bundles. Telematics and Informatics, 31. 410-421.
Le Gall-Ely, M. (2009). Definition, measurement and determinants of the Consumer’s willingness
to pay: a critical synthesis and avenues for further research. Recherche et Applications en
Marketing, 24(2). 91-112.
Lusardi, A., Schneider, D. J., and Tufano, P. (2011). Financially fragile households: evidence and
implications. National Bureau of Economic Research. Retrieved at May 19th, 2016 from
http://www.nber.org/papers/w17072

50
Miller, K. M., Hofstetter, R., Krohmer, H., and Zhang, Z. J. (2011). How should consumers’
Willingness to Pay be measured? An empirical comparison of state-of-the-art approaches.
Journal of Marketing Research, 11(8). 172-184.
Nguyen, A., Heeler, R. M., and Buff, C. (2009). Consumer perceptions of bundles. Journal of
Product & Brand Management, 18(3). 218-225.
Nikou, S., Bouwman, H., and Reuver, M. de (2014). A consumer perspective on mobile service
platforms: A conjoint analysis approach. Communications of the Association for
Information Systems, 34(82). 1409-1424.
OECD. (2016). Household disposable income (indicator). Retrieved at May 9th, 2016 from
https://data.oecd.org/hha/household-disposable-income.htm
Portney, P. R. (1994). The contingent valuation debate: Why economists should care. The
Journal of Economic Perspectives, 8(4). 3-17.
Purcell, K. (2010). The State of Online Video. Pew Internet & American Life Project. Retrieved at
February 2, 2016 from http://www.pewinternet.org/files/old-
media//Files/Reports/2010/PIP-The-State-of-Online-Video.pdf
Sharpe, K. M., and Staelin, R. (2010). Consumption effects of bundling: Consumer perceptions,
firm actions, and public policy implications. Journal of Public Policy & Marketing, 29(2).
170-188.
Simmons, S., & Esser, M. (2001). Developing Business Solutions from Conjoint Analysis. In A.
Gustafsson, A. Herrmann, & F. Huber (Authors), Conjoint measurement; Methods and
Applications (2nd ed., pp. 67-98). Berlin: Springer-Verlag.
51
SPOT. (2015). Media:Tijd 2015, een nadere blik op het scherm. [Media: Time 2015, a closer look
at the screen]. Retrieved at July 7th, 2016 from http://spot.nl/wp-
content/uploads/2016/06/20160621-MediaTijd-2015-SPOT-analyse.pdf
Stichting KijkOnderzoek. (2014). TV in Nederland 2013. [TV in the Netherlands 2013]. Retrieved
at March 6th, 2016 from https://www.kijkonderzoek.nl/tv-in-nederland
Stichting KijkOnderzoek. (2015). TV in Nederland 2014. [TV in the Netherlands 2014]. Retrieved
at March 6th, 2016 from https://www.kijkonderzoek.nl/tv-in-nederland
Stichting KijkOnderzoek. (2016). TV in Nederland 2015. [TV in the Netherlands 2015]. Retrieved
at March 6th, 2016 from https://www.kijkonderzoek.nl/tv-in-nederland
Strack, F. (1992). “Order Effects” in Survey Research: Activation and Information Functions of
Preceding Questions. In Context Effects in Social and Psychological Research (pp. 23-34).
New York, NY: Springer.
Stremersch, S., and Tellis, G. J. (2002). Strategic bundling of products and price: A new synthesis
for marketing. Journal of Marketing, 66. 55-72.
Üner, M. M., Güven, F., and Cavusgil, S. T. (2015). Bundling of telecom offerings: An empirical
investigation in the Turkish market. Telecommunications Policy, 39. 53-64.
Varian, H.R. (1995). Pricing Information Goods. Retrieved at February 2, 2016 from
http://amitre.synthasite.com/resources/varian_Hal_price-info-goods.pdf
Venkatachalam, L. (2004). The contingent valuation method: a review. Environmental Impact
Assessment Review, 24. 89-124.
52
Vossler, C. A. and Kerkvliet, J. (2003). A criterion validity test of the contingent valuation
method: comparing hypothetical and actual voting behavior for a public referendum.
Journal of Environmental Economics and Management, 45. 631-649.
Wertenbroch, K., and Skiera, B. (2002). Measuring Consumers’ Willingness to Pay at the Point of
Purchase. Journal of Marketing Research, 39. 228-241.
53
Appendix A Questionnaire in Dutch
Q1 Beste deelnemer, Waarschijnlijk heeft u in uw huishouden een abonnement op televisie-, internet-, en/of telefonieaansluiting. Met behulp van deze vragenlijst wil ik onderzoeken of er vraag is naar de toevoeging van een Smart televisie aan dit abonnement. Een Smart Televisie is een televisie die naast de televisie aansluiting ook een internet aansluiting heeft. Door deze toevoeging kan u de Smart TV ook gebruiken om apps te downloaden en zo online video’s en films te bekijken. Ik doe dit onderzoek puur vanuit wetenschappelijke interesse en ben dus niet verbonden aan een telecom aanbieder. U krijgt in deze vragenlijst een aantal algemene vragen over televisiegebruik en uw persoonlijke situatie. Daarnaast krijgt u twee aanbiedingen voor de toevoeging van een Smart TV. Het invullen van de vragenlijst zal ongeveer 10 minuten duren en de antwoorden zullen volledig anoniem behandeld worden. Alvast bedankt voor uw bijdrage aan het onderzoek. Caspar Wieten Q2 Hoeveel televisies heeft u in uw huis staan?
o 0 o 1 o 2 o 3 o 4 o 5 o 6 o 7 o 8 o 9 o 10 o 11 o 12 o 13 o 14 o 15 of meer
54
Q3 Hoeveel van deze televisies zijn Smart Televisies? Een Smart Televisie is een televisie die naast de televisie aansluiting ook een internet aansluiting heeft. Door deze toevoeging kan u de Smart TV ook gebruiken om apps te downloaden en zo online video’s en films te bekijken. o 0 o 1 o 2 o 3 o 4 o 5 o 6 o 7 o 8 o 9 o 10 o 11 o 12 o 13 o 14 o 15 of meer Q4 Hoeveel uur per dag staat de televisie gemiddeld aan in uw huishouden? (Heeft u meerdere televisies, tel de tijd van deze televisies dan bij elkaar op)
o 0 - 1 uur o 1 - 3 uur o 3 - 5 uur o 5 - 10 uur o Meer dan 10 uur
Q5 Zou u, tegen bijbetaling, geïnteresseerd zijn in een toevoeging van een Smart TV aan uw huidige abonnement voor internet, televisie en telefonie?
o Ja o Nee
Q6 Answer if for Q5 “Nee” is Selected Waarom bent u niet geïnteresseerd in de toevoeging van een Smart TV aan uw huidige abonnement voor internet, televisie en telefonie?
o Ik heb al een (of meerdere) Smart Televisie(s) en wil er niet nog meer hebben o Ik vind dat Smart TVs geen toegevoegde waarde hebben
55
o Anders; ____________________ Q7 Op welke aansluitingen heeft u in uw huishouden een abonnement?
o Internet, televisie en vaste telefonie o Internet en televisie o Internet en vaste telefonie o Televisie en vaste telefonie o Alleen internet o Alleen televisie o Alleen vaste telefonie o Ik heb geen aansluitingen
Q8 Answer if for Q7 “Ik heb geen aansluitingen” is Not Selected Wat betaalt u maandelijks voor dit abonnement?
o Minder dan €10 o €11 - €20 o €21 - €30 o €31 - €40 o €41 - €50 o €51 - €60 o €61 - €70 o €71 - €80 o €81 - €90 o €91 - €100 o Meer dan €100 o Weet ik niet
Q9 Answer if for Q7 “Ik heb geen aansluitingen” is Not Selected Hoe tevreden bent u met wat u maandelijks betaalt?
o Zeer tevreden o Tevreden o Neutraal o Ontevreden o Zeer ontevreden
Q10 Kijkt u wel eens films/series via het internet? (bijvoorbeeld via Youtube, Netflix, HBO, andere streamingdiensten)
o Ja o Nee
Q11 Answer if for Q5 “Ja” is Selected
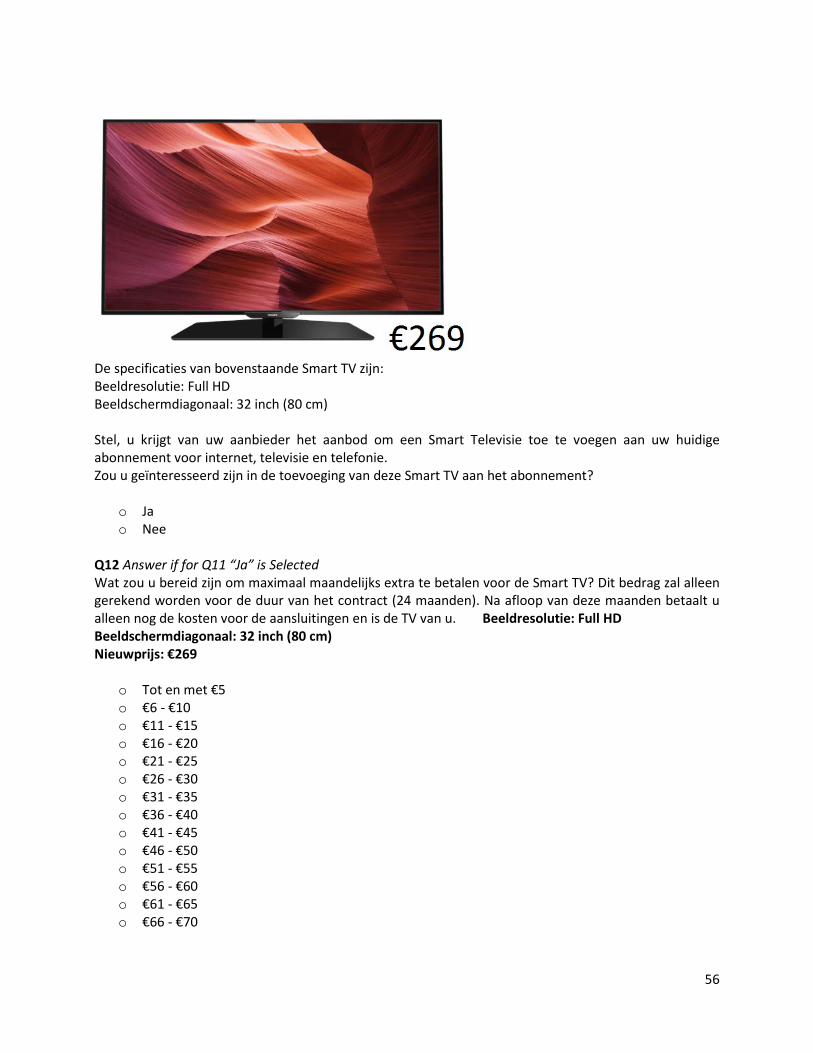
56
De specificaties van bovenstaande Smart TV zijn: Beeldresolutie: Full HD Beeldschermdiagonaal: 32 inch (80 cm) Stel, u krijgt van uw aanbieder het aanbod om een Smart Televisie toe te voegen aan uw huidige abonnement voor internet, televisie en telefonie. Zou u geïnteresseerd zijn in de toevoeging van deze Smart TV aan het abonnement?
o Ja o Nee
Q12 Answer if for Q11 “Ja” is Selected Wat zou u bereid zijn om maximaal maandelijks extra te betalen voor de Smart TV? Dit bedrag zal alleen gerekend worden voor de duur van het contract (24 maanden). Na afloop van deze maanden betaalt u alleen nog de kosten voor de aansluitingen en is de TV van u. Beeldresolutie: Full HD Beeldschermdiagonaal: 32 inch (80 cm) Nieuwprijs: €269
o Tot en met €5 o €6 - €10 o €11 - €15 o €16 - €20 o €21 - €25 o €26 - €30 o €31 - €35 o €36 - €40 o €41 - €45 o €46 - €50 o €51 - €55 o €56 - €60 o €61 - €65 o €66 - €70
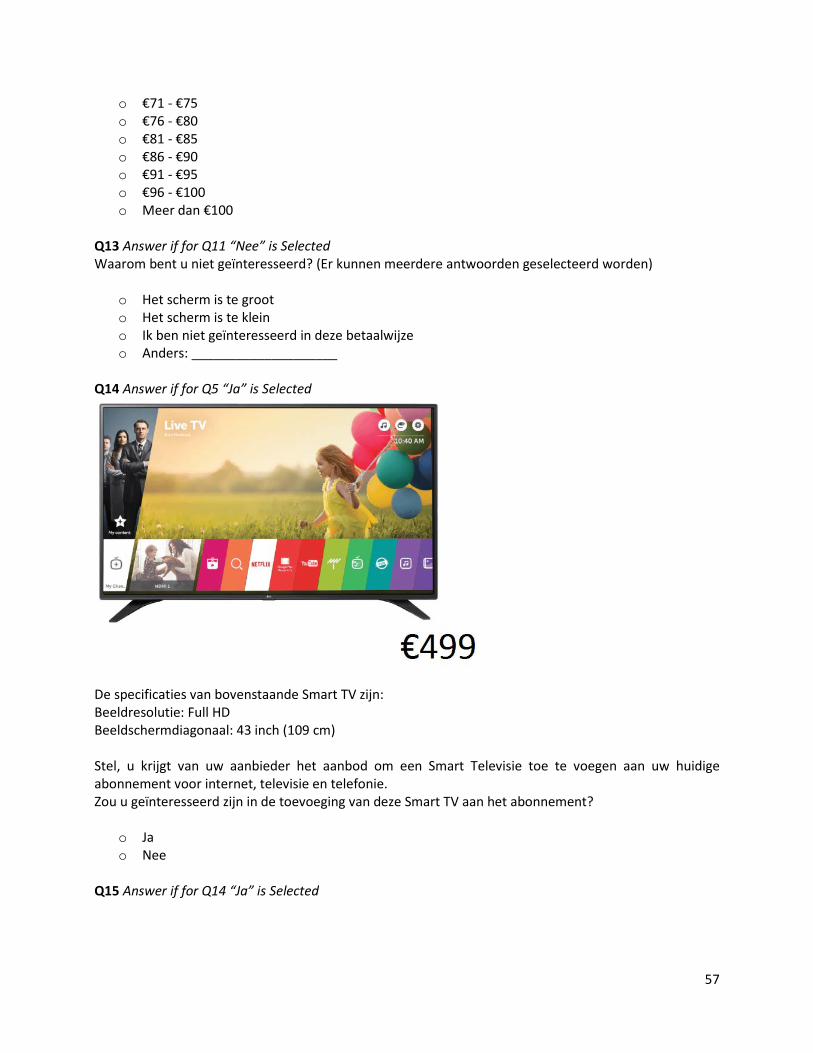
57
o €71 - €75 o €76 - €80 o €81 - €85 o €86 - €90 o €91 - €95 o €96 - €100 o Meer dan €100
Q13 Answer if for Q11 “Nee” is Selected Waarom bent u niet geïnteresseerd? (Er kunnen meerdere antwoorden geselecteerd worden)
o Het scherm is te groot o Het scherm is te klein o Ik ben niet geïnteresseerd in deze betaalwijze o Anders: ____________________
Q14 Answer if for Q5 “Ja” is Selected
De specificaties van bovenstaande Smart TV zijn: Beeldresolutie: Full HD Beeldschermdiagonaal: 43 inch (109 cm) Stel, u krijgt van uw aanbieder het aanbod om een Smart Televisie toe te voegen aan uw huidige abonnement voor internet, televisie en telefonie. Zou u geïnteresseerd zijn in de toevoeging van deze Smart TV aan het abonnement?
o Ja o Nee
Q15 Answer if for Q14 “Ja” is Selected
58
Wat zou u bereid zijn om maximaal maandelijks extra te betalen voor de Smart TV? Dit bedrag zal alleen gerekend worden voor de duur van het contract (24 maanden). Na afloop van deze maanden betaalt u alleen nog de kosten voor de aansluitingen en is de TV van u. Beeldresolutie: Full HD Beeldschermdiagonaal: 43 inch (109 cm) Nieuwprijs: €499
o Tot en met €5 o €6 - €10 o €11 - €15 o €16 - €20 o €21 - €25 o €26 - €30 o €31 - €35 o €36 - €40 o €41 - €45 o €46 - €50 o €51 - €55 o €56 - €60 o €61 - €65 o €66 - €70 o €71 - €75 o €76 - €80 o €81 - €85 o €86 - €90 o €91 - €95 o €96 - €100 o Meer dan €100
Q16 Answer if for Q14 “Nee” is Selected Waarom bent u niet geïnteresseerd? (Er kunnen meerdere antwoorden geselecteerd worden)
o Het scherm is te groot o Het scherm is te klein o Ik ben niet geïnteresseerd in deze betaalwijze o Anders: ____________________
Q17 Answer if for Q5 “Ja” is Selected

59
De specificaties van bovenstaande Smart TV zijn: Beeldresolutie: Ultra HD (4K) Beeldschermdiagonaal: 50 inch (125 cm) Stel, u krijgt van uw aanbieder het aanbod om een Smart Televisie toe te voegen aan uw huidige abonnement voor internet, televisie en telefonie. Zou u geïnteresseerd zijn in de toevoeging van deze Smart TV aan het abonnement?
o Ja o Nee
Q18 Answer if for Q17 “Ja” is Selected Wat zou u bereid zijn om maximaal maandelijks extra te betalen voor de Smart TV? Dit bedrag zal alleen gerekend worden voor de duur van het contract (24 maanden). Na afloop van deze maanden betaalt u alleen nog de kosten voor de aansluitingen en is de TV van u. Beeldresolutie: Ultra HD (4K) Beeldschermdiagonaal: 50 inch (125 cm) Nieuwprijs: €829
o Tot en met €5 o €6 - €10 o €11 - €15 o €16 - €20 o €21 - €25 o €26 - €30 o €31 - €35 o €36 - €40 o €41 - €45 o €46 - €50 o €51 - €55 o €56 - €60 o €61 - €65
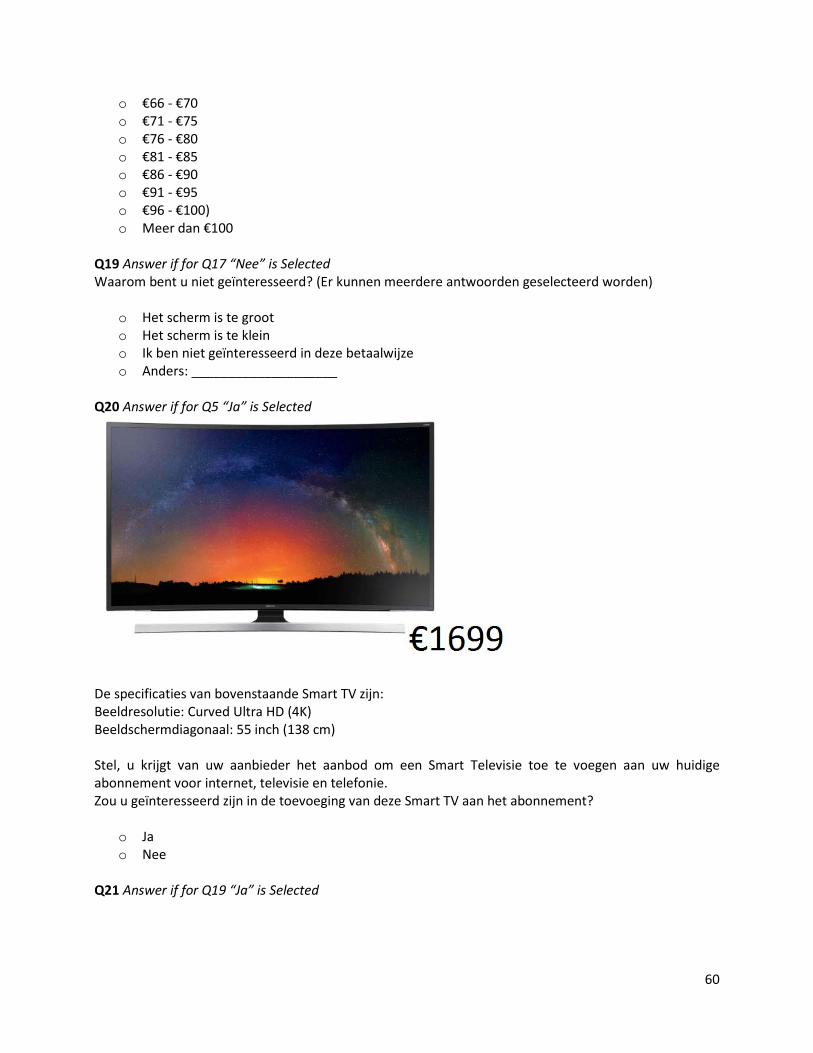
60
o €66 - €70 o €71 - €75 o €76 - €80 o €81 - €85 o €86 - €90 o €91 - €95 o €96 - €100) o Meer dan €100
Q19 Answer if for Q17 “Nee” is Selected Waarom bent u niet geïnteresseerd? (Er kunnen meerdere antwoorden geselecteerd worden)
o Het scherm is te groot o Het scherm is te klein o Ik ben niet geïnteresseerd in deze betaalwijze o Anders: ____________________
Q20 Answer if for Q5 “Ja” is Selected
De specificaties van bovenstaande Smart TV zijn: Beeldresolutie: Curved Ultra HD (4K) Beeldschermdiagonaal: 55 inch (138 cm) Stel, u krijgt van uw aanbieder het aanbod om een Smart Televisie toe te voegen aan uw huidige abonnement voor internet, televisie en telefonie. Zou u geïnteresseerd zijn in de toevoeging van deze Smart TV aan het abonnement?
o Ja o Nee
Q21 Answer if for Q19 “Ja” is Selected
61
Wat zou u bereid zijn om maximaal maandelijks extra te betalen voor de Smart TV? Dit bedrag zal alleen gerekend worden voor de duur van het contract (24 maanden). Na afloop van deze maanden betaalt u alleen nog de kosten voor de aansluitingen en is de TV van u. Beeldresolutie: Curved Ultra HD (4K) Beeldschermdiagonaal: 55 inch (138 cm) Nieuwprijs: €1699
o Tot en met €5 o €6 - €10 o €11 - €15 o €16 - €20 o €21 - €25 o €26 - €30 o €31 - €35 o €36 - €40 o €41 - €45 o €46 - €50 o €51 - €55 o €56 - €60 o €61 - €65 o €66 - €70 o €71 - €75 o €76 - €80 o €81 - €85 o €86 - €90 o €91 - €95 o €96 - €100 o Meer dan €100
Q22 Answer if for Q19 “Nee” is Selected Waarom bent u niet geïnteresseerd? (Er kunnen meerdere antwoorden geselecteerd worden)
o Het scherm is te groot o Het scherm is te klein o Ik ben niet geïnteresseerd in deze betaalwijze o Anders: ____________________
Q23 Stel dat u een nieuw abonnement met een mobiele telefoon wil gaan afsluiten. Geef aan hoe belangrijk de verschillende aspecten van een abonnement met mobiele telefoon voor u zijn. Zeer
belangrijk Belangrijk Neutraal Onbelangrijk Zeer
onbelangrijk Prijs van het abonnement met de mobiele telefoon
62
Aantal minuten / Sms
Aantal MB’s Besturingssysteem van de mobiele telefoon (Android, IOS, Windows)
Kwaliteit van de camera
Mogelijkheid tot gebruik van het 4G netwerk
Overige specificaties van de mobiele telefoon
De specifieke mobiele telefoon die u krijgt (merk en model)
Q24 U krijgt een onverwachte rekening van €2000.Hoe zeker weet u dat u deze binnen één maand kan betalen?
o Ik weet zeker dat ik die €2000 euro kan betalen o Ik weet bijna zeker dat ik die €2000 kan betalen o Ik weet bijna zeker dat ik die €2000 niet kan betalen o Ik weet zeker dat ik die €2000 niet kan betalen o Ik heb geen idee o Ik wil deze vraag niet beantwoorden
Q25 Wat is uw leeftijd?
o 16 en jonger o 17 o 18 o 19 o 20 o 21 o 22 o 23 o 24 o 25 o 26

63
o 27 o 28 o 29 o 30 o 31 o 32 o 33 o 34 o 35 o 36 o 37 o 38 o 39 o 40 o 41 o 42 o 43 o 44 o 45 o 46 o 47 o 48 o 49 o 50 o 51 o 52 o 53 o 54 o 55 o 56 o 57 o 58 o 59 o 60 o 61 o 62 o 63 o 64 o 65 o 66 o 67 o 68 o 69 o 70 o 71 o 72 o 73
64
o 74 o 75 o 76 o 77 o 78 o 79 o 80 o 81 o 82 o 83 o 84 o 85 o 86 o 87 o 88 o 89 o 90 en ouder
Q26 Wat is uw geslacht?
o Man o Vrouw
Q27 Hoe is uw huishuiden samengesteld?
o ______ Aantal volwassenen o ______ Aantal thuiswonende kinderen
Q28 Answer if for Q26 “Aantal thuiswonende kinderen” is Greater than 0 Wat is de leeftijd van uw jongste thuiswonende kind?
o 0 o 1 o 2 o 3 o 4 o 5 o 6 o 7 o 8 o 9 o 10 o 11 o 12 o 13
65
o 14 o 15 o 16 o 17 o 18 o 19 o 20 o Ouder dan 20
Q29 Wat is uw hoogst afgeronde opleiding?
o Geen onderwijs / basisonderwijs / lagere school o LBO / VBO / VMBO (kader- en beroepsgerichte leerweg) o MAVO / eerste 3 jaar HAVO en VWO / VMBO (theoretische en gemengde leerweg) o MBO o HAVO of VWO bovenbouw / WO-propedeuse o HBO / WO-bachelor of kandidaats o WO-doctoraal of master
Q30 Answer if for Q26 “Aantal volwassenen” is Greater than or Equal to 2 Kies de volwassene (maar niet uzelf) met de hoogst afgeronde opleiding binnen uw huishouden. Wat is zijn/haar hoogst afgeronde opleiding?
o Geen onderwijs / basisonderwijs / lagere school o LBO / VBO / VMBO (kader- en beroepsgerichte leerweg) o MAVO / eerste 3 jaar HAVO en VWO / VMBO (theoretische en gemengde leerweg) o MBO o HAVO of VWO bovenbouw / WO-propedeuse o HBO / WO-bachelor of kandidaats o WO-doctoraal of master
Q31 Wat is het gezamenlijke bruto inkomen van uw huishouden?
o Minder dan €20.000 o €20.000 - €30.000 o €30.000 - €40.000 o €40.000 - €50.000 o €50.000 - €60.000 o €60.000 - €70.000 o €70.000 - €80.000 o €80.000 - €90.000 o €90.000 - €100.000 o €100.000 - €110.000 o €110.000 - €120.000 o €120.000 - €130.000
66
o €130.000 - €140.000 o €140.000 - €150.000 o €150.000 - €160.000 o €160.000 - €170.000 o €170.000 - €180.000 o €180.000 - €190.000 o €190.000 - €200.000 o €200.000 - €250.000 o €250.000 - €300.000 o Meer dan €300.000
Q32 Wat is ongeveer de hoogte van uw maandelijkse woonlasten (huur/ rente en/of aflossing van hypotheek + gas,water,licht)?
o Minder dan €100 o €100 - €200 o €200 - €300 o €300 - €400 o €400 - €500 o €500 - €600 o €600 - €700 o €700 - €800 o €800 - €900 o €900 - €1000 o €1000 - €1100 o €1100 - €1200 o €1200 - €1300 o €1300 - €1400 o €1400 - €1500 o €1500 - €1600 o €1600 - €1700 o €1700 - €1800 o €1800 - €1900 o €1900 - €2000 o €2000 - €2100 o €2100 - €2200 o €2200 - €2300 o €2300 - €2400 o €2400 - €2500 o €2500 - €2600 o €2600 - €2700 o €2700 - €2800 o €2800 - €2900 o €2900 - €3000 o €3000 - €3500 o €3500 - €4000
67
o Meer dan €4000 Q33 Als u geïnteresseerd bent in de resultaten van dit onderzoek, kunt u in dit veld uw e-mailadres achterlaten. ______________________________ Met onderstaande knop kunt u het indienen van de vragenlijst bevestigen.
68
Appendix B: Questionnaire translated to English
Q1 Dear respondent, You probably already have a connection to television, internet and/or phone in your household. In this study, I want to research a possible demand for adding a Smart Television to this contract. A Smart TV is a television which has, next to the regular television connection, the possibility to connect to the internet. This can be used to download apps and watch online videos and movies. This study is done purely out of academic interest, and is thus not connected to a telecom provider. In this questionnaire, you will get some general questions about television usage and your personal situation. Next to that, you will receive two offers for the addition of a Smart TV. This questionnaire will take you approximately 10 minutes to fill in and all answers will be analyzed anonymously. Thank you very much for participating. Caspar Wieten Q2 How many televisions do you have in your home?
o 0 o 1 o 2 o 3 o 4 o 5 o 6 o 7 o 8 o 9 o 10 o 11 o 12 o 13 o 14 o 15 or more
Q3 How many of these are Smart Televisions?
69
A Smart TV is a television which has, next to the regular television connection, the possibility to connect to the internet. This can be used to download apps and watch online videos and movies. o 0 o 1 o 2 o 3 o 4 o 5 o 6 o 7 o 8 o 9 o 10 o 11 o 12 o 13 o 14 o 15 or more Q4 How much time is the television on in your household? (If you have more televisions, please add the time together)
o 0 - 1 hour o 1 - 3 hours o 3 - 5 hours o 5 - 10 hours o More than 10 hours
Q5 Would you, for a monthly fee, be interested in the addition of a Smart TV to your current contract for internet, television and phone connection?
o Yes o No
Q6 Answer if for Q5 “No” is Selected Why are you not interest in the addition of a Smart TV to your current contract for internet-, television-, and/or phone connection?
o I already have one (or more) Smart TV(s) and I do not want any more. o I do not see the additional value of a Smart TV o Other; ____________________
Q7 What connections do you have at home?
70
o Internet, television and phone o Internet and television o Internet and phone o Television and phone o Only internet o Only television o Only phone o I don’t have any connections
Q8 Answer if for Q7 “I don’t have any connections” is Not Selected What do you pay on a monthly basis for this contract?
o Less than €10 o €11 - €20 o €21 - €30 o €31 - €40 o €41 - €50 o €51 - €60 o €61 - €70 o €71 - €80 o €81 - €90 o €91 - €100 o More than €100 o I don’t know
Q9 Answer if for Q7 “I dont have any connections” is Not Selected How satisfied are you with your monthly expenses on this connection?
o Very satisfied o Satisfied o Neutral o Unsatisfied o Very unsatisfied
Q10 Do you ever watch movies/series via the internet? (for example using Youtube, Netflix, HBO, other streamingservices)
o Yes o No
Q11 Answer if for Q5 “Ja” is Selected

71
The specifications of this Smart TV are: Resolution: Full HD Screen size: 32 inch (80 cm) You are getting an offer from your provider to add a Smart TV to your current contract for internet, television and phone. Would you be interested in adding this Smart TV to your contract?
o Yes o No
Q12 Answer if for Q11 “Ja” is Selected What would you be willing to pay on a monthly basis for this Smart TV. This amount will only be charged for the duration of your contract (24 months). After this, you will only pay for the connections and the TV will be yours to keep. Resolution: Full HD Screen size: 32 inch (80 cm) Price: €269
o Up to €5 o €6 - €10 o €11 - €15 o €16 - €20 o €21 - €25 o €26 - €30 o €31 - €35 o €36 - €40 o €41 - €45 o €46 - €50 o €51 - €55 o €56 - €60 o €61 - €65 o €66 - €70
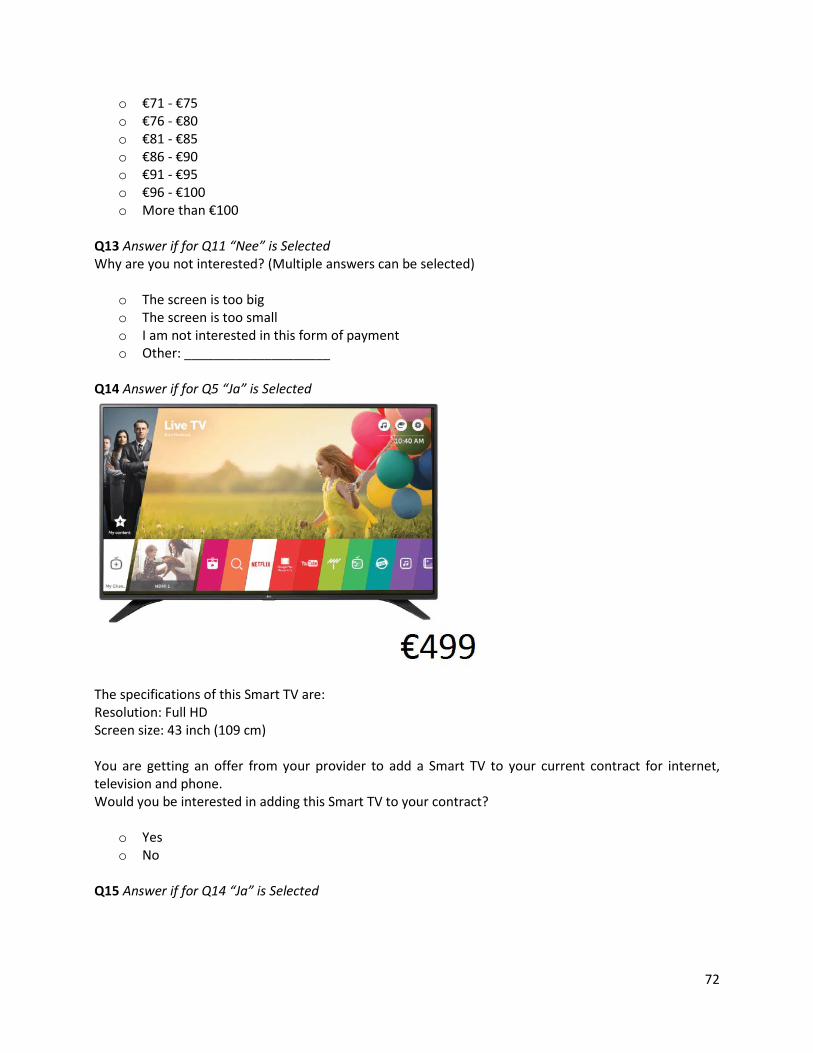
72
o €71 - €75 o €76 - €80 o €81 - €85 o €86 - €90 o €91 - €95 o €96 - €100 o More than €100
Q13 Answer if for Q11 “Nee” is Selected Why are you not interested? (Multiple answers can be selected)
o The screen is too big o The screen is too small o I am not interested in this form of payment o Other: ____________________
Q14 Answer if for Q5 “Ja” is Selected
The specifications of this Smart TV are: Resolution: Full HD Screen size: 43 inch (109 cm) You are getting an offer from your provider to add a Smart TV to your current contract for internet, television and phone. Would you be interested in adding this Smart TV to your contract?
o Yes o No
Q15 Answer if for Q14 “Ja” is Selected
73
What would you be willing to pay on a monthly basis for this Smart TV. This amount will only be charged for the duration of your contract (24 months). After this, you will only pay for the connections and the TV will be yours to keep. Resolution: Full HD Screen size: 43 inch (109 cm) Price: €499
o Up to €5 o €6 - €10 o €11 - €15 o €16 - €20 o €21 - €25 o €26 - €30 o €31 - €35 o €36 - €40 o €41 - €45 o €46 - €50 o €51 - €55 o €56 - €60 o €61 - €65 o €66 - €70 o €71 - €75 o €76 - €80 o €81 - €85 o €86 - €90 o €91 - €95 o €96 - €100 o More than €100
Q16 Answer if for Q14 “Nee” is Selected Why are you not interested? (Multiple answers can be selected)
o The screen is too big o The screen is too small o I am not interested in this form of payment o Other: ____________________
Q17 Answer if for Q5 “Ja” is Selected

74
The specifications of this Smart TV are: Resolution: Ultra HD (4K) Screen size: 50 inch (125 cm) You are getting an offer from your provider to add a Smart TV to your current contract for internet, television and phone. Would you be interested in adding this Smart TV to your contract?
o Yes o No
Q18 Answer if for Q17 “Ja” is Selected What would you be willing to pay on a monthly basis for this Smart TV. This amount will only be charged for the duration of your contract (24 months). After this, you will only pay for the connections and the TV will be yours to keep. Resolution: Ultra HD (4K) Screen size: 50 inch (125 cm) Price: €829
o Up to €5 o €6 - €10 o €11 - €15 o €16 - €20 o €21 - €25 o €26 - €30 o €31 - €35 o €36 - €40 o €41 - €45 o €46 - €50 o €51 - €55 o €56 - €60 o €61 - €65
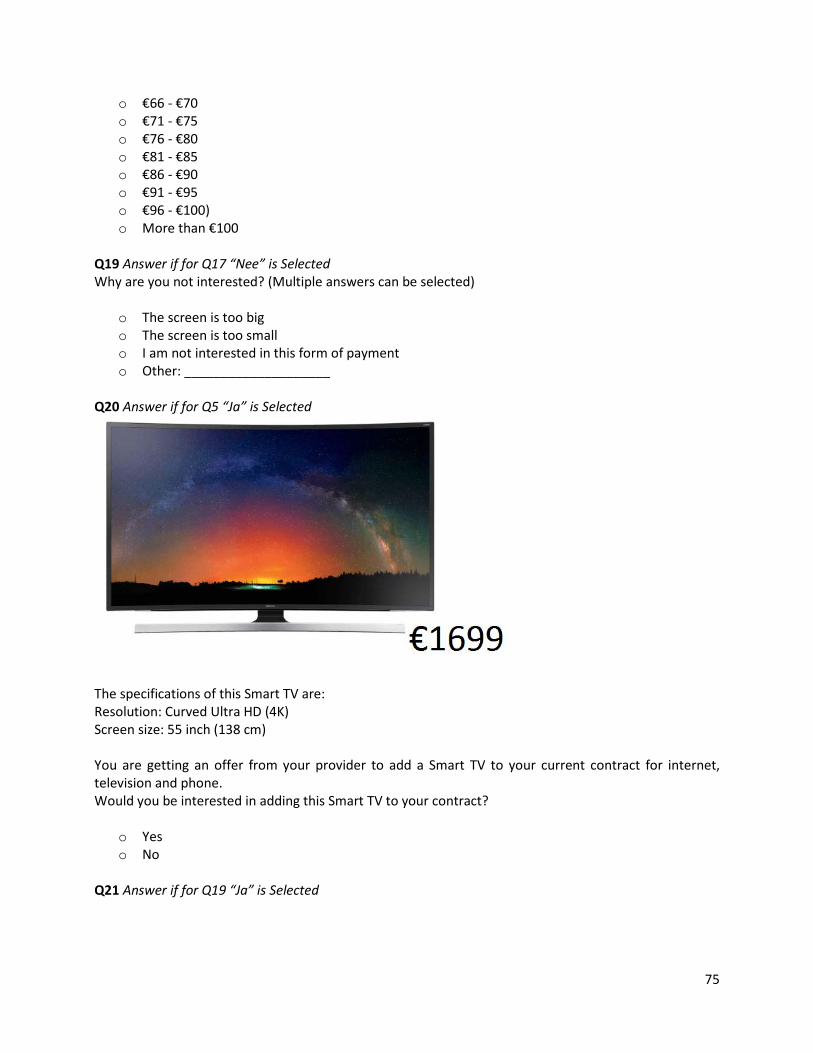
75
o €66 - €70 o €71 - €75 o €76 - €80 o €81 - €85 o €86 - €90 o €91 - €95 o €96 - €100) o More than €100
Q19 Answer if for Q17 “Nee” is Selected Why are you not interested? (Multiple answers can be selected)
o The screen is too big o The screen is too small o I am not interested in this form of payment o Other: ____________________
Q20 Answer if for Q5 “Ja” is Selected
The specifications of this Smart TV are: Resolution: Curved Ultra HD (4K) Screen size: 55 inch (138 cm) You are getting an offer from your provider to add a Smart TV to your current contract for internet, television and phone. Would you be interested in adding this Smart TV to your contract?
o Yes o No
Q21 Answer if for Q19 “Ja” is Selected
76
What would you be willing to pay on a monthly basis for this Smart TV. This amount will only be charged for the duration of your contract (24 months). After this, you will only pay for the connections and the TV will be yours to keep. Resolution: Curved Ultra HD (4K) Screen size: 55 inch (138 cm) Price: €1699
o Up to €5 o €6 - €10 o €11 - €15 o €16 - €20 o €21 - €25 o €26 - €30 o €31 - €35 o €36 - €40 o €41 - €45 o €46 - €50 o €51 - €55 o €56 - €60 o €61 - €65 o €66 - €70 o €71 - €75 o €76 - €80 o €81 - €85 o €86 - €90 o €91 - €95 o €96 - €100 o More than €100
Q22 Answer if for Q19 “Nee” is Selected Why are you not interested? (Multiple answers can be selected)
o The screen is too big o The screen is too small o I am not interested in this form of payment o Other: ____________________
Q23 You want to subscribe for a new mobile phone with contract. Please state how important the following different aspects of a mobile phone with contract are for you. Very
important Important Neutral Unimportant Very
unimportant Price of the mobile phone with contract
Minutes / Texts in
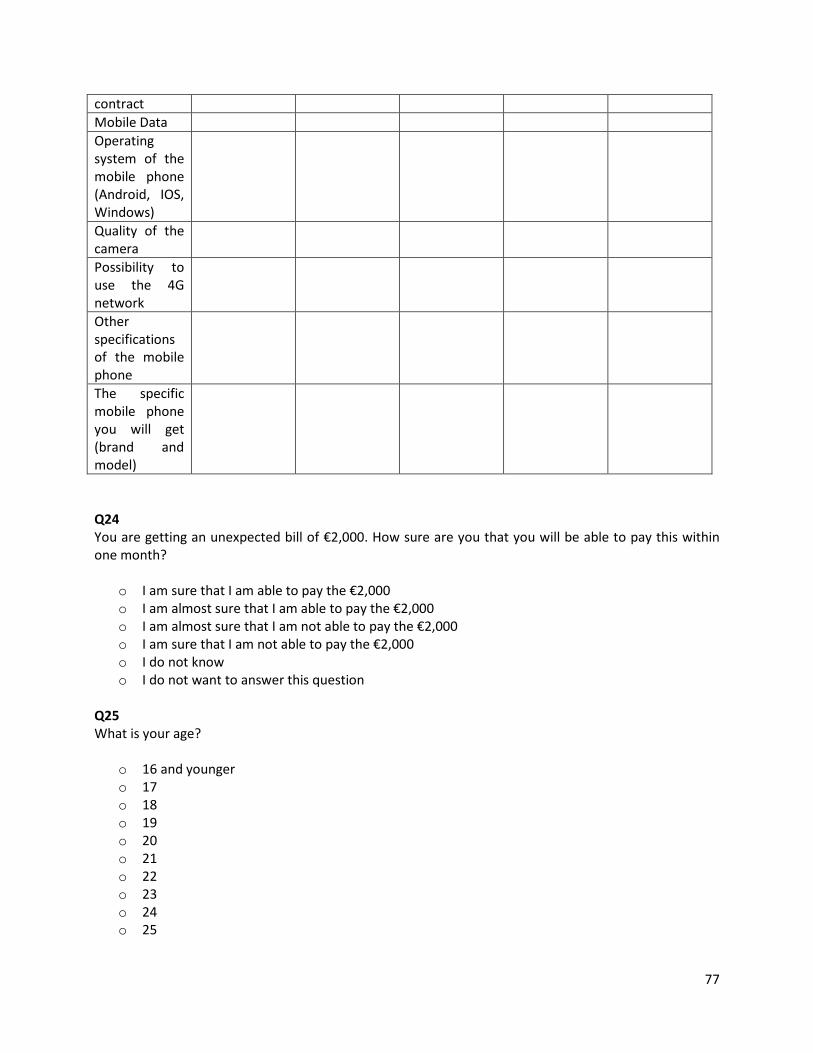
77
contract Mobile Data Operating system of the mobile phone (Android, IOS, Windows)
Quality of the camera
Possibility to use the 4G network
Other specifications of the mobile phone
The specific mobile phone you will get (brand and model)
Q24 You are getting an unexpected bill of €2,000. How sure are you that you will be able to pay this within one month?
o I am sure that I am able to pay the €2,000 o I am almost sure that I am able to pay the €2,000 o I am almost sure that I am not able to pay the €2,000 o I am sure that I am not able to pay the €2,000 o I do not know o I do not want to answer this question
Q25 What is your age?
o 16 and younger o 17 o 18 o 19 o 20 o 21 o 22 o 23 o 24 o 25

78
o 26 o 27 o 28 o 29 o 30 o 31 o 32 o 33 o 34 o 35 o 36 o 37 o 38 o 39 o 40 o 41 o 42 o 43 o 44 o 45 o 46 o 47 o 48 o 49 o 50 o 51 o 52 o 53 o 54 o 55 o 56 o 57 o 58 o 59 o 60 o 61 o 62 o 63 o 64 o 65 o 66 o 67 o 68 o 69 o 70 o 71 o 72
79
o 73 o 74 o 75 o 76 o 77 o 78 o 79 o 80 o 81 o 82 o 83 o 84 o 85 o 86 o 87 o 88 o 89 o 90 and older
Q26 What is your gender?
o Male o Female
Q27 What is the composition of your household?
o ______ Amount of adults o ______ Amount of children
Q28 Answer if for Q26 “Aantal thuiswonende kinderen” is Greater than 0 What is the age of the youngest child in your household?
o 0 o 1 o 2 o 3 o 4 o 5 o 6 o 7 o 8 o 9 o 10 o 11 o 12
80
o 13 o 14 o 15 o 16 o 17 o 18 o 19 o 20 o Older than 20
Q29 What is your highest finished education?
o No education / Primary school o LBO / VBO / VMBO (kader- en beroepsgerichte leerweg) o MAVO / first 3 years of HAVO en VWO / VMBO (theoretische en gemengde leerweg) o MBO o HAVO of VWO bovenbouw / WO-propedeuse o HBO / WO-bachelor or kandidaats o WO-doctoraal or master
Q30 Answer if for Q26 “Aantal volwassenen” is Greater than or Equal to 2 Choose the adult in your household (but not yourself) with the highest finished education. What is his or her highest finished education?
o No education / Primary school o LBO / VBO / VMBO (kader- en beroepsgerichte leerweg) o MAVO / first 3 years of HAVO en VWO / VMBO (theoretische en gemengde leerweg) o MBO o HAVO of VWO bovenbouw / WO-propedeuse o HBO / WO-bachelor of kandidaats o WO-doctoraal of master
Q31 What is the joint gross income of your household?
o Less than €20,000 o €20,000 - €30,000 o €30,000 - €40,000 o €40,000 - €50,000 o €50,000 - €60,000 o €60,000 - €70,000 o €70,000 - €80,000 o €80,000 - €90,000 o €90,000 - €100,000 o €100,000 - €110,000 o €110,000 - €120,000
81
o €120,000 - €130,000 o €130,000 - €140,000 o €140,000 - €150,000 o €150,000 - €160,000 o €160,000 - €170,000 o €170,000 - €180,000 o €180,000 - €190,000 o €190,000 - €200,000 o €200,000 - €250,000 o €250,000 - €300,000 o More than €300,000
Q32 What are approximately your monthly housing costs (rent / mortgage + gas, water, electricity)?
o Less than €100 o €100 - €200 o €200 - €300 o €300 - €400 o €400 - €500 o €500 - €600 o €600 - €700 o €700 - €800 o €800 - €900 o €900 - €1,000 o €1,000 - €1,100 o €1,100 - €1,200 o €1,200 - €1,300 o €1,300 - €1,400 o €1,400 - €1,500 o €1,500 - €1,600 o €1,600 - €1,700 o €1,700 - €1,800 o €1,800 - €1,900 o €1,900 - €2,000 o €2,000 - €2,100 o €2,100 - €2,200 o €2,200 - €2,300 o €2,300 - €2,400 o €2,400 - €2,500 o €2,500 - €2,600 o €2,600 - €2,700 o €2,700 - €2,800 o €2,800 - €2,900 o €2,900 - €3,000 o €3,000 - €3,500 o €3,500 - €4,000

82
o More than €4,000 Q33 If you are interested in the results of this research, you can fill in your e-mail address below. ______________________________ By clicking the button below you can finish and submit the questionnaire.
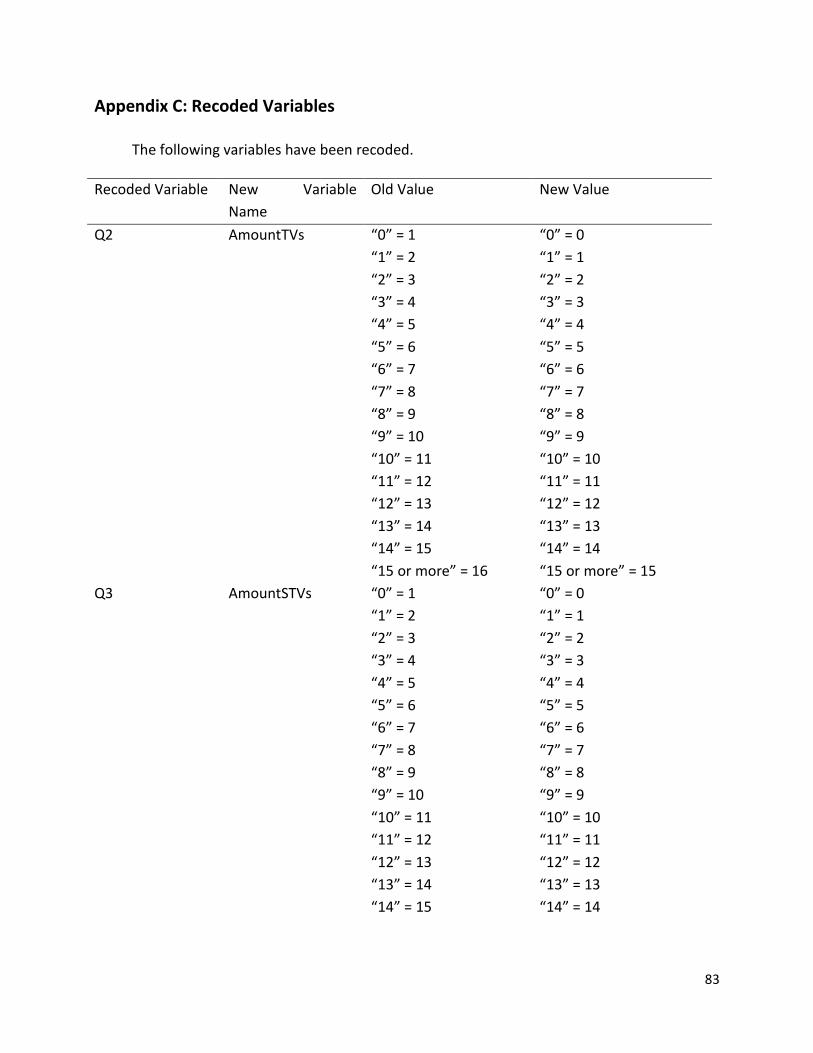
83
Appendix C: Recoded Variables
The following variables have been recoded.
Recoded Variable New Variable Name
Old Value New Value
Q2 AmountTVs “0” = 1 “1” = 2 “2” = 3 “3” = 4 “4” = 5 “5” = 6 “6” = 7 “7” = 8 “8” = 9 “9” = 10 “10” = 11 “11” = 12 “12” = 13 “13” = 14 “14” = 15 “15 or more” = 16
“0” = 0 “1” = 1 “2” = 2 “3” = 3 “4” = 4 “5” = 5 “6” = 6 “7” = 7 “8” = 8 “9” = 9 “10” = 10 “11” = 11 “12” = 12 “13” = 13 “14” = 14 “15 or more” = 15
Q3 AmountSTVs “0” = 1 “1” = 2 “2” = 3 “3” = 4 “4” = 5 “5” = 6 “6” = 7 “7” = 8 “8” = 9 “9” = 10 “10” = 11 “11” = 12 “12” = 13 “13” = 14 “14” = 15
“0” = 0 “1” = 1 “2” = 2 “3” = 3 “4” = 4 “5” = 5 “6” = 6 “7” = 7 “8” = 8 “9” = 9 “10” = 10 “11” = 11 “12” = 12 “13” = 13 “14” = 14
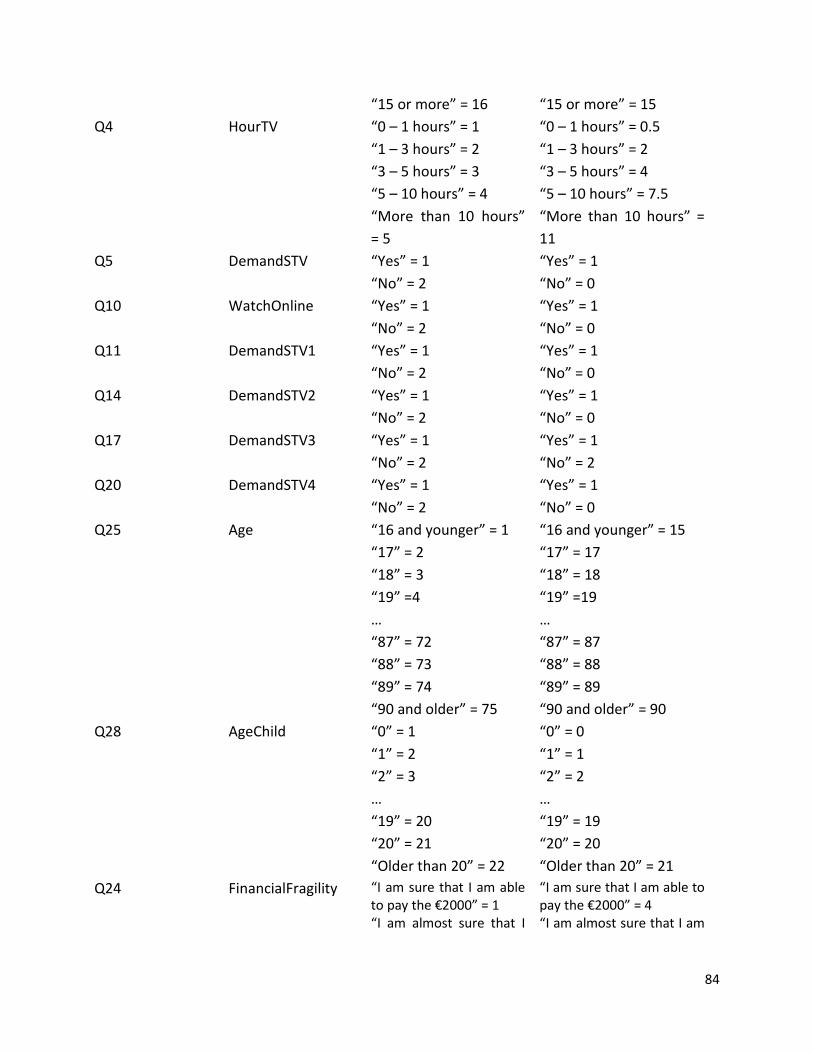
84
“15 or more” = 16 “15 or more” = 15 Q4 HourTV “0 – 1 hours” = 1
“1 – 3 hours” = 2 “3 – 5 hours” = 3 “5 – 10 hours” = 4 “More than 10 hours” = 5
“0 – 1 hours” = 0.5 “1 – 3 hours” = 2 “3 – 5 hours” = 4 “5 – 10 hours” = 7.5 “More than 10 hours” = 11
Q5 DemandSTV “Yes” = 1 “No” = 2
“Yes” = 1 “No” = 0
Q10 WatchOnline “Yes” = 1 “No” = 2
“Yes” = 1 “No” = 0
Q11 DemandSTV1 “Yes” = 1 “No” = 2
“Yes” = 1 “No” = 0
Q14 DemandSTV2 “Yes” = 1 “No” = 2
“Yes” = 1 “No” = 0
Q17 DemandSTV3 “Yes” = 1 “No” = 2
“Yes” = 1 “No” = 2
Q20 DemandSTV4 “Yes” = 1 “No” = 2
“Yes” = 1 “No” = 0
Q25 Age “16 and younger” = 1 “17” = 2 “18” = 3 “19” =4 … “87” = 72 “88” = 73 “89” = 74 “90 and older” = 75
“16 and younger” = 15 “17” = 17 “18” = 18 “19” =19 … “87” = 87 “88” = 88 “89” = 89 “90 and older” = 90
Q28 AgeChild “0” = 1 “1” = 2 “2” = 3 … “19” = 20 “20” = 21 “Older than 20” = 22
“0” = 0 “1” = 1 “2” = 2 … “19” = 19 “20” = 20 “Older than 20” = 21
Q24 FinancialFragility “I am sure that I am able to pay the €2000” = 1 “I am almost sure that I
“I am sure that I am able to pay the €2000” = 4 “I am almost sure that I am
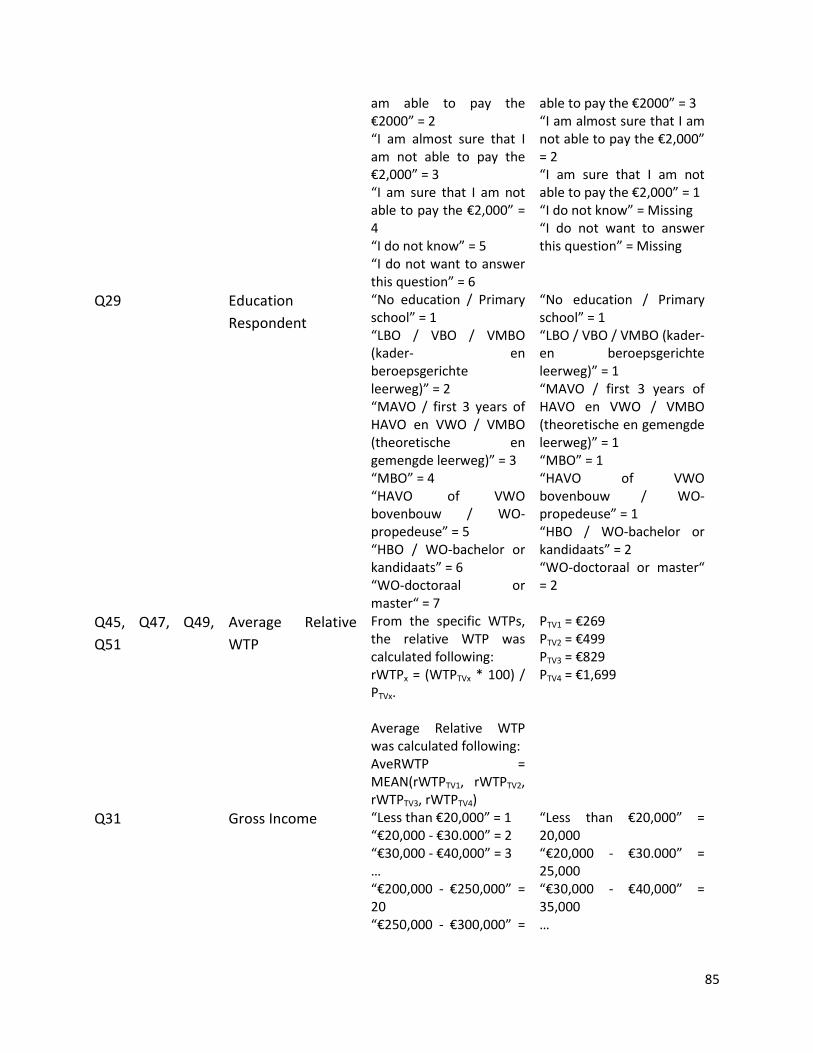
85
am able to pay the €2000” = 2 “I am almost sure that I am not able to pay the €2,000” = 3 “I am sure that I am not able to pay the €2,000” = 4 “I do not know” = 5 “I do not want to answer this question” = 6
able to pay the €2000” = 3 “I am almost sure that I am not able to pay the €2,000” = 2 “I am sure that I am not able to pay the €2,000” = 1 “I do not know” = Missing “I do not want to answer this question” = Missing
Q29 Education Respondent
“No education / Primary school” = 1 “LBO / VBO / VMBO (kader- en beroepsgerichte leerweg)” = 2 “MAVO / first 3 years of HAVO en VWO / VMBO (theoretische en gemengde leerweg)” = 3 “MBO” = 4 “HAVO of VWO bovenbouw / WO-propedeuse” = 5 “HBO / WO-bachelor or kandidaats” = 6 “WO-doctoraal or master“ = 7
“No education / Primary school” = 1 “LBO / VBO / VMBO (kader- en beroepsgerichte leerweg)” = 1 “MAVO / first 3 years of HAVO en VWO / VMBO (theoretische en gemengde leerweg)” = 1 “MBO” = 1 “HAVO of VWO bovenbouw / WO-propedeuse” = 1 “HBO / WO-bachelor or kandidaats” = 2 “WO-doctoraal or master“ = 2
Q45, Q47, Q49, Q51
Average Relative WTP
From the specific WTPs, the relative WTP was calculated following: rWTPx = (WTPTVx * 100) / PTVx. Average Relative WTP was calculated following: AveRWTP = MEAN(rWTPTV1, rWTPTV2, rWTPTV3, rWTPTV4)
PTV1 = €269 PTV2 = €499 PTV3 = €829 PTV4 = €1,699
Q31 Gross Income “Less than €20,000” = 1 “€20,000 - €30.000” = 2 “€30,000 - €40,000” = 3 … “€200,000 - €250,000” = 20 “€250,000 - €300,000” =
“Less than €20,000” = 20,000 “€20,000 - €30.000” = 25,000 “€30,000 - €40,000” = 35,000 …
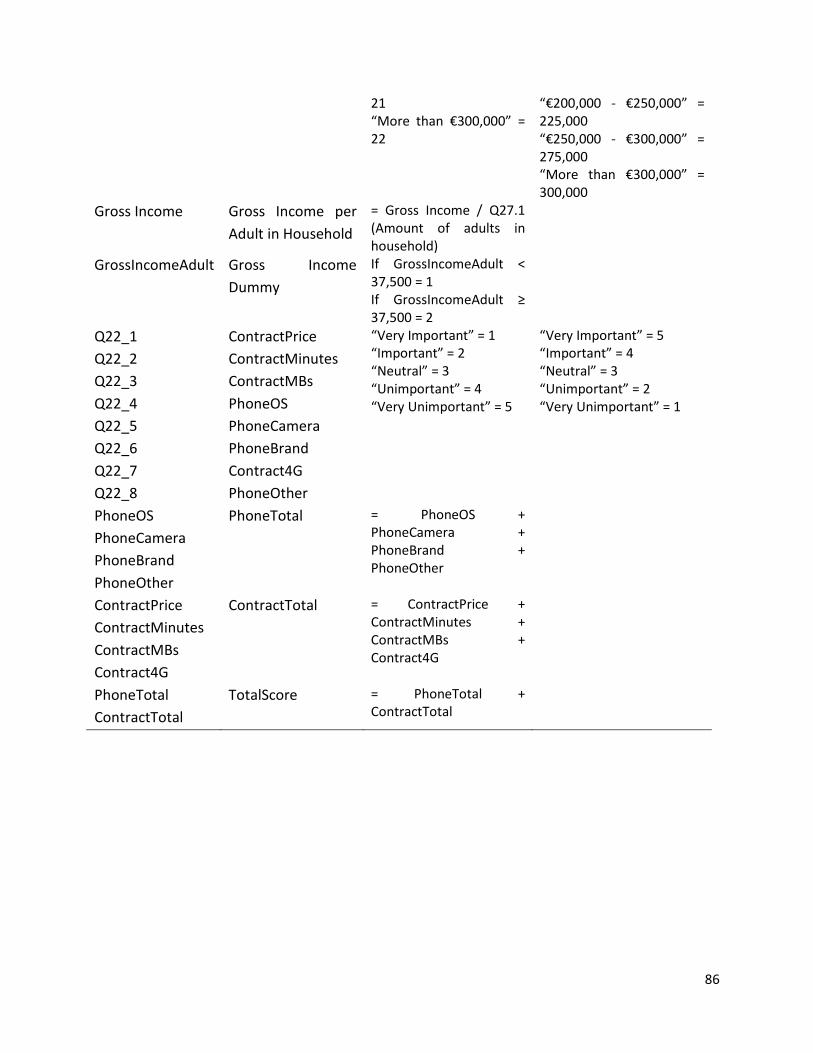
86
21 “More than €300,000” = 22
“€200,000 - €250,000” = 225,000 “€250,000 - €300,000” = 275,000 “More than €300,000” = 300,000
Gross Income Gross Income per Adult in Household
= Gross Income / Q27.1 (Amount of adults in household)
GrossIncomeAdult Gross Income Dummy
If GrossIncomeAdult < 37,500 = 1 If GrossIncomeAdult ≥ 37,500 = 2
Q22_1 Q22_2 Q22_3 Q22_4 Q22_5 Q22_6 Q22_7 Q22_8
ContractPrice ContractMinutes ContractMBs PhoneOS PhoneCamera PhoneBrand Contract4G PhoneOther
“Very Important” = 1 “Important” = 2 “Neutral” = 3 “Unimportant” = 4 “Very Unimportant” = 5
“Very Important” = 5 “Important” = 4 “Neutral” = 3 “Unimportant” = 2 “Very Unimportant” = 1
PhoneOS PhoneCamera PhoneBrand PhoneOther
PhoneTotal = PhoneOS + PhoneCamera + PhoneBrand + PhoneOther
ContractPrice ContractMinutes ContractMBs Contract4G
ContractTotal = ContractPrice + ContractMinutes + ContractMBs + Contract4G
PhoneTotal ContractTotal
TotalScore = PhoneTotal + ContractTotal