Brassinosteroid biosynthesis and signalling in Petunia hybrida
Upload
independentCategory
view
3download
0
Condensed tannin biosynthesis genes are regulated separately
from other flavonoid biosynthesis genes in apple fruit skin
Adam Matthew Takos, Benjamin Ewa Ubi 1, Simon Piers Robinson, Amanda Ruth Walker *
Commonwealth Scientific and Industrial Research Organisation, Division of Plant Industry, Adelaide Laboratory,
PO Box 350, Glen Osmond, South Australia 5064, Australia
Received 16 June 2005; accepted 29 September 2005
Available online 25 October 2005
www.elsevier.com/locate/plantsci
Plant Science 170 (2006) 487–499
Abstract
Although the molecular basis of anthocyanin biosynthesis has been studied in several types of fruit, little is known about how structural flavonoid
genes are regulated to balance the requirement for condensed tannin (CT) and flavonol synthesis.We cloned three genes encoding enzymes involved in
CT synthesis from cDNA of skin of the red apple varietyMalus � domesticaBorkh. cv. ‘Cripps Red’; two leucoanthocyanidin reductases (MdLARs)
and an anthocyanidin reductase (MdANR).Wemeasured steady-state transcript levels of the CT genes and the other structural genes of the flavonoid
pathway by Real Time PCR and correlated this with flavonoid accumulation in skin throughout early fruit growth and during ripening. Transcripts of
theMdANR gene were abundant in both green and red skin sectors early in development which correlated with accumulation of CTs in these tissues.
TheMdLAR1 gene transcripts were detected in green skin early in development but transcripts ofMdLAR2were present only in juvenile fruit. All the
CT transcriptsweremuch less abundant during fruit ripeningwhen themajority of anthocyanin accumulated and transcripts of the other pathway genes
were at a high level. The results indicated that transcription of the genes for synthesis of CTs in apple fruit skin was differentially regulated from the
other flavonoid pathway genes which were regulated in a coordinate fashion to control synthesis of anthocyanins.
# 2005 Elsevier Ireland Ltd. All rights reserved.
Keywords: Anthocyanin; Tannin; Flavonoid; Regulation; Apple; Proanthocyanidin
1. Introduction
Anthocyanins, condensed tannins (CTs) and flavonols are
secondary metabolites called flavonoids that are found in most
higher plants and are synthesized from common precursor
compounds. Anthocyanins are responsible for most of the red
and purple colours in flowers and fruits and also occur in leaves.
During fruit development anthocyanin acts as a signal of
ripening to birds and animals and therefore assists in seed
dispersal [1,2]. CTs, also referred to as proanthocyanidins, are
polymers of flavonoid molecules which, when oxidised, cause
brown pigmentation of plant seeds. CTs may act as feeding
deterrents in reproductive tissues and developing fruit [3,4] and
also impart astringency to fresh fruit, fruit juices and wine.
* Corresponding author.
E-mail address: [email protected] (A.R. Walker).1 Current address: Department of Genetics and Biotechnology, Faculty of
Science, University of Calabar, P.M.B. 1115-Calabar, Nigeria.
0168-9452/$ – see front matter # 2005 Elsevier Ireland Ltd. All rights reserved.
doi:10.1016/j.plantsci.2005.10.001
Flavonols, although colourless, can behave as co-pigments to
anthocyanins in vivo [5], are required for pollen tube formation
in some plants [6] and may also function as UV-B-protectants
[7]. Anthocyanins, CTs and flavonols are all antioxidants and
may have beneficial effects for human health when incorpo-
rated in the diet [8].
Biochemical and genetic analysis in a range of plants has
enabled the isolation of the structural genes of the flavonoid
pathway (shown in Fig. 1) and ordering of the enzymes that
they encode [9]. The pathway can be described as consisting of
‘common flavonoid’ genes required for synthesis of precursors
of the different classes of flavonoids and ‘branch-specific
flavonoid’ genes for each flavonoid class. It has been
demonstrated recently that there are two possible branch
pathways to formation of CTs in plant cells: (i) leucoantho-
cyanidin reductase (LAR) synthesizing the 2,3-trans-flavan-3-
ol [10] and (ii) a reaction catalysed by the product of the
Arabidopsis BANYULS gene [11] which has been demonstrated
to encode anthocyanidin reductase (ANR) to synthesize the 2,3-
cis-flavan-3-ol [12]. In apple fruit (Malus � domestica Borkh.)
A.M. Takos et al. / Plant Science 170 (2006) 487–499488
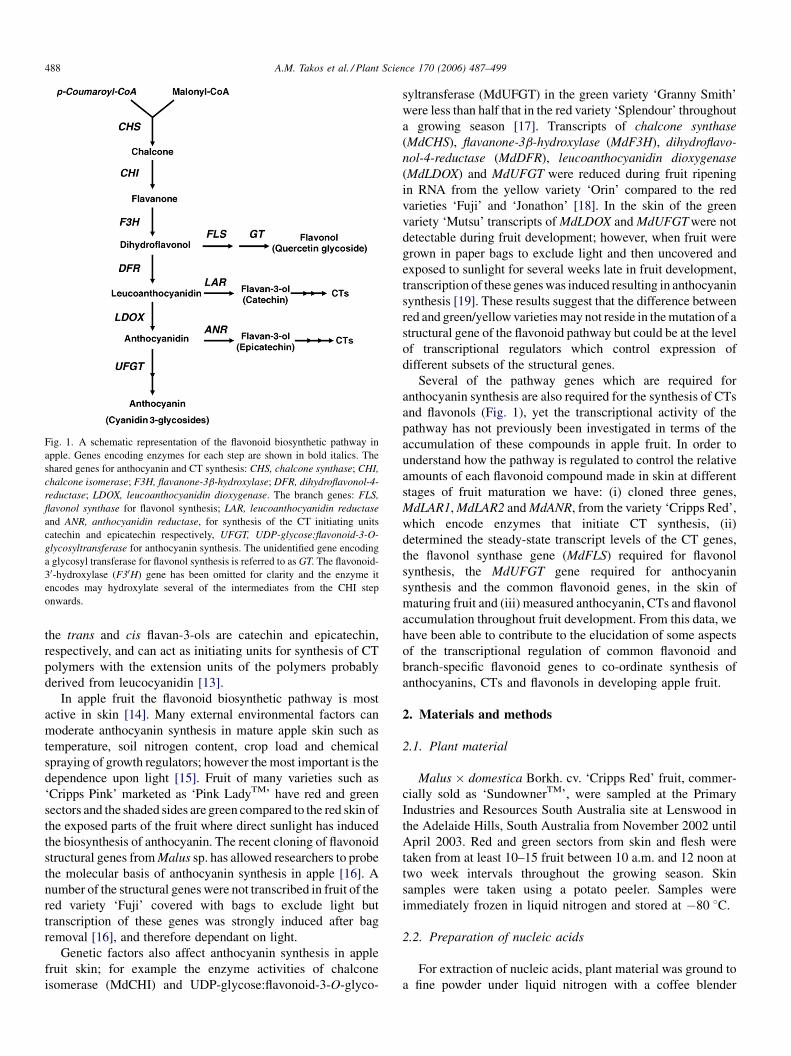
Fig. 1. A schematic representation of the flavonoid biosynthetic pathway in
apple. Genes encoding enzymes for each step are shown in bold italics. The
shared genes for anthocyanin and CT synthesis: CHS, chalcone synthase; CHI,
chalcone isomerase; F3H, flavanone-3b-hydroxylase; DFR, dihydroflavonol-4-
reductase; LDOX, leucoanthocyanidin dioxygenase. The branch genes: FLS,
flavonol synthase for flavonol synthesis; LAR, leucoanthocyanidin reductase
and ANR, anthocyanidin reductase, for synthesis of the CT initiating units
catechin and epicatechin respectively, UFGT, UDP-glycose:flavonoid-3-O-
glycosyltransferase for anthocyanin synthesis. The unidentified gene encoding
a glycosyl transferase for flavonol synthesis is referred to as GT. The flavonoid-
30-hydroxylase (F30H) gene has been omitted for clarity and the enzyme it
encodes may hydroxylate several of the intermediates from the CHI step
onwards.
the trans and cis flavan-3-ols are catechin and epicatechin,
respectively, and can act as initiating units for synthesis of CT
polymers with the extension units of the polymers probably
derived from leucocyanidin [13].
In apple fruit the flavonoid biosynthetic pathway is most
active in skin [14]. Many external environmental factors can
moderate anthocyanin synthesis in mature apple skin such as
temperature, soil nitrogen content, crop load and chemical
spraying of growth regulators; however the most important is the
dependence upon light [15]. Fruit of many varieties such as
‘Cripps Pink’ marketed as ‘Pink LadyTM’ have red and green
sectors and the shaded sides are green compared to the red skin of
the exposed parts of the fruit where direct sunlight has induced
the biosynthesis of anthocyanin. The recent cloning of flavonoid
structural genes fromMalus sp. has allowed researchers to probe
the molecular basis of anthocyanin synthesis in apple [16]. A
number of the structural genes were not transcribed in fruit of the
red variety ‘Fuji’ covered with bags to exclude light but
transcription of these genes was strongly induced after bag
removal [16], and therefore dependant on light.
Genetic factors also affect anthocyanin synthesis in apple
fruit skin; for example the enzyme activities of chalcone
isomerase (MdCHI) and UDP-glycose:flavonoid-3-O-glyco-
syltransferase (MdUFGT) in the green variety ‘Granny Smith’
were less than half that in the red variety ‘Splendour’ throughout
a growing season [17]. Transcripts of chalcone synthase
(MdCHS), flavanone-3b-hydroxylase (MdF3H), dihydroflavo-
nol-4-reductase (MdDFR), leucoanthocyanidin dioxygenase
(MdLDOX) and MdUFGT were reduced during fruit ripening
in RNA from the yellow variety ‘Orin’ compared to the red
varieties ‘Fuji’ and ‘Jonathon’ [18]. In the skin of the green
variety ‘Mutsu’ transcripts ofMdLDOX andMdUFGTwere not
detectable during fruit development; however, when fruit were
grown in paper bags to exclude light and then uncovered and
exposed to sunlight for several weeks late in fruit development,
transcription of these geneswas induced resulting in anthocyanin
synthesis [19]. These results suggest that the difference between
red and green/yellow varietiesmay not reside in themutation of a
structural gene of the flavonoid pathway but could be at the level
of transcriptional regulators which control expression of
different subsets of the structural genes.
Several of the pathway genes which are required for
anthocyanin synthesis are also required for the synthesis of CTs
and flavonols (Fig. 1), yet the transcriptional activity of the
pathway has not previously been investigated in terms of the
accumulation of these compounds in apple fruit. In order to
understand how the pathway is regulated to control the relative
amounts of each flavonoid compound made in skin at different
stages of fruit maturation we have: (i) cloned three genes,
MdLAR1,MdLAR2 andMdANR, from the variety ‘Cripps Red’,
which encode enzymes that initiate CT synthesis, (ii)
determined the steady-state transcript levels of the CT genes,
the flavonol synthase gene (MdFLS) required for flavonol
synthesis, the MdUFGT gene required for anthocyanin
synthesis and the common flavonoid genes, in the skin of
maturing fruit and (iii) measured anthocyanin, CTs and flavonol
accumulation throughout fruit development. From this data, we
have been able to contribute to the elucidation of some aspects
of the transcriptional regulation of common flavonoid and
branch-specific flavonoid genes to co-ordinate synthesis of
anthocyanins, CTs and flavonols in developing apple fruit.
2. Materials and methods
2.1. Plant material
Malus � domestica Borkh. cv. ‘Cripps Red’ fruit, commer-
cially sold as ‘SundownerTM’, were sampled at the Primary
Industries and Resources South Australia site at Lenswood in
the Adelaide Hills, South Australia from November 2002 until
April 2003. Red and green sectors from skin and flesh were
taken from at least 10–15 fruit between 10 a.m. and 12 noon at
two week intervals throughout the growing season. Skin
samples were taken using a potato peeler. Samples were
immediately frozen in liquid nitrogen and stored at �80 8C.
2.2. Preparation of nucleic acids
For extraction of nucleic acids, plant material was ground to
a fine powder under liquid nitrogen with a coffee blender

A.M. Takos et al. / Plant Science 170 (2006) 487–499 489
followed by grinding in a mortar and pestle. Total RNA was
isolated from 1 g apple tissue by a hot borate method [20]. The
final RNA pellet was resuspended in 200 ml of TE (pH 8.0) and
quantified by UV spectrometry. For storage, RNA was
precipitated with 20 ml 3 M Na-acetate (pH 6.0) and 1 ml
absolute ethanol and stored at �40 8C. Genomic DNA was
isolated from 1 g of young leaf material by a crude nuclei
preparation method [21] and stored at 4 8C.
2.3. Cloning of the MdLAR and MdANR genes
First strand cDNA was synthesized from 4 mg total RNA
from ‘Cripps Red’ immature fruit (<1 cm diameter) in a
reaction containing oligo dT(18), SuperScriptTM III RNase H-
Reverse Transcriptase and RNAseOUTTM (Invitrogen, Carls-
bad, CA, USA). Degenerate PCR primers for cloning of LAR
and ANR genes were designed from conserved regions of
known LAR and ANR protein sequences. Primers for LAR
were: LAR(F1): 50-GCIGTIAARMGITTYYTICCIWSIGART-
TYGGICAYGAY-30 and LAR(R1): 50-GRCANCCNTTDA-TRAADATRTCRTGNGT-30 and primers for ANR were:
ANR(F1): 50-GAYCCIGARAAIGAYATGATHAARCC-30 andANR(R1): 50-AAYTTIGCIARYTCIGGIACISWNGTRTT-30.Amplified PCR fragments were sequenced and nested primers
were designed for 30 RACE. Two variants of the MdLAR gene,
MdLAR1 and MdLAR2, and one MdANR sequence were
isolated by 30 RACE. Nested primers specific for each MdLAR
variant were designed for 50 RACE and the 50 fragment of
MdLAR1 was cloned using the 50 RACE System Kit, Version
2.0 (Invitrogen). Only a truncated 50 fragment of MdLAR2 was
isolated using this kit. To overcome this problem a
GeneRacerTM kit (Invitrogen) was used to clone 50 fragments
of MdLAR2 from cDNAs that were reverse transcribed only
from full-length mRNAs. The 50 fragment of MdANR was
cloned as described for MdLAR1.
Primers were designed for amplification of PCR fragments
containing the full-length coding sequences of MdLAR1,
Table 1
mRNA sequences analysed by Real Time PCR
Gene Accession number Approximate copy number in genomea
MdLDOX AF117269 1
MdLAR1 AY830131 3–4b
MdLAR2 AY830132 3–4b
MdANR AY830130 3
MdUFGTc AF117267 3
MdFLS AF119095 3
Msp.CHSd X68977 Several related sequences
Msp.CHId X68978 1–2
MdF3H AF117270 2
MdDFR AF117268 1
MdUBQ U74358 n.d.
n.d.: not determined. Oligonucleotide sequence located within coding region are ca Copy number determined by Southern analysis (data not shown).b Probe does not distinguish between MdLAR1 and MdLAR2 sequences.c Annotated as a glucosyltransferase in the Genbank database.d From Malus species.
MdLAR2 andMdANR. These fragments were obtained from the
fruit cDNA template used above using the proofreading DNA
polymerases PfuTurbo1 (Stratagene, LaJolla, CA, USA) for
the MdLAR genes and Platinum1 Pfx (Invitrogen) for MdANR
following the manufacturer’s reaction conditions. The PCR
fragments were tailed with dATP using a QIAGEN1 A-
Addition kit (QIAGEN, Hilden, Germany) and ligated to the
pDrive cloning vector (QIAGEN) or pGEM1-T Easy vector
(Promega, Madison, WI, USA). Several clones of each
construct were sequenced.
2.4. Southern analysis
Genomic DNA (2 mg) was digested with DraI, EcoRI,
EcoRV,HindIII, SacI and SphI. Electrophoresis, blotting by salt
transfer and hybridisation were performed according to the
manufacturers’ protocol using GeneScreen Plus hybridisation
membrane (NEN1 Life Sciences Products, Boston, MA). Gene
probes were labelled with [32P]-dCTP using a RediprimeTM II
DNA Labelling System (Amersham Biosciences, UK). Wash-
ing was done at 65 8C for 15 min in 0.1� SSC containing 0.1%
(w/v) SDS and was repeated twice. The accession numbers of
sequences from which probes were made and the estimated
copy number of related sequences in the apple genome for each
gene is shown in Table 1.
2.5. Northern analysis
Total RNA (2 mg) was denatured and resolved on a 1% (w/v)
agarose gel containing 1� MOPS (pH 7.5) and 5% (v/v)
formaldehyde. The RNA was blotted by salt transfer to
Nytran1SuPerCharge membrane using a TurboBlotterTM
system (Schleicher and Schuell, Dassel, Germany). A gene
probe for MdLDOX was labelled with [32P]-dCTP using a
RediprimeTM II Random Prime Labelling System following the
manufacturer’s protocol (Amersham). Hybridisation was at
65 8C in ULTRAhybTM solution (Ambion, Austin, TX, USA).
Real Time PCR primers (50 to 30)
Forward Reverse
GAAGATCATCCTTAAGCCACTG ataatttagcacaacccgctTC
TAGAGCTACTGCAAGAGGAGG cctcgaagaaaccctagaaac
tctatcagaatcaggactgttga aatatccaacaaccacaagaaac
GCATCGAAGAAATATATGACCA aatttacggtaagccagacaat
AAGGTCTCTCCAATGTACGAAT AGGAGTTTGTTGACTTTGGACT
TTCTTACAGGGAAGCTAATGAA GAGGACATGGTGGGTAGTAGTT
GCAAGTGTTGTCAGATTACGG tgatactggtgtctTCAAGCAG
GCTACAAATGCGGTGATAGAA ccttggtttccaatttttcat
GAAGATGAGCAAGGATCTTGAG tccacaaagagctttcaagtg
CAAGTACAGCTTGGAGGACAT ccaagctggtaaatgtaaaaca
CTCCGTGGTGGTTTTTAAgt ggaggcagaaacagtaccat
apitalised and within 30 untranslated region of mRNA are in lower case.
A.M. Takos et al. / Plant Science 170 (2006) 487–499490
Washing was at 65 8C for 15 min in 0.1� SSC containing 0.1%
(w/v) SDS and was repeated twice.
2.6. Real Time PCR
For Real Time PCR, cDNA was synthesized as described
above from 4 mg of total RNA for all samples except flesh
where 2 mg was used due to an inhibition of synthesis at higher
concentrations. Primers for Real Time PCR, listed in Table 1,
were designed to include at least one primer in the 30
untranslated regions of the genes where possible. For
experiments measuring transcript levels in different apple
tissues, the signal obtained for the gene of interest was
normalised against the signal from the 30 untranslated region ofthe apple UBIQUITIN gene (MdUBQ).
The cDNA templates were diluted 1:20 with H2O to provide
sufficient template for experiments and to increase specificity of
the reaction. Template cDNA (5 ml) was placed in each PCR
reaction in a final volume of 15 ml containing 266 nM of each
primer and 1� AbsoluteTM QPCR SYBR1 Green Buffer
(ABgene1, Surrey, UK). Thermocycling conditions were as
follows: an initial enzymeactivationof 15 min at 95 8C, followedby 30–35 cycles of denaturation for 30 s at 94 8C, annealing for30 s at 58 8C and extension for 30 s at 72 8C, followed by a melt
gradient starting from 50 8C and heating to 96 8C at a rate of
0.2 8C s�1. The PCR reactions were carried out in a Rotor-
GeneTM2000 Real Time PCR instrument (Corbett Research,
NSW, Australia). The fluorescence of reactions was measured
with an excitation wavelength of 470 nm and a detection
wavelength of 510 nm at the end of each extension step and at
each 1 8C increment of the melt profile.
The specificity of the PCR product generated for each set of
primerswas tested in threeways: (i) by themelt gradient inwhich
fluorescence decreases at a single discrete temperature indicating
separation of the two strands of a single DNA species, (ii) by
agarose gel electrophoresis showing a single PCR product of the
correct size and (iii) by obtaining the correct DNA sequence of
the gene from a PCR product extracted from an agarose gel. All
cDNA samples to be compared for gene expression levels were
analysed in a single batch for each primer pair. To ascribe a
relative gene copy number to each cDNA sample, a purified PCR
fragment of each gene sequence was serially diluted in 10-fold
steps to make template standards. Standards for the gene to be
analysed were included in the Real Time PCR assay of cDNA
samples. In each case, the dilution series of standards showed a
linear change in cycle threshold values and cDNA templates
were thus ascribed a gene copy number by comparing their cycle
threshold values with the standards.
2.7. Anthocyanin and flavonol analysis
For estimation of anthocyanin concentration, 0.05 g finely
ground plant material was extracted in 1 ml 1% (v/v) HCl–
methanol for 24 h at 4 8C on a rotating wheel in darkness.
Samples were clarified by centrifugation at 13,000 � g for
15 min at room temperature and absorbance was scanned
between 500 and 600 nm using a Shimadzu UV-1601
spectrophotometer (Shimadzu, Kyoto, Japan). The peak for
anthocyanin absorbance was �528 nm and concentration was
determined using a molar extinction co-efficient of 4.62 � 104
[22].
For high-performance liquid chromatography (HPLC)
analysis, anthocyanins and flavonols were extracted from
0.1 g finely ground plant material in 1 ml 1% (v/v) HCl–
methanol for 1 h at room temperature on a rotating wheel in
darkness. Samples were clarified by centrifugation at
13,000 � g for 15 min at room temperature and then 200 ml
of supernatant was transferred to autosampler vials. Analysis
was conducted on a Hewlett Packard HP 1100 HPLC with
Chemstation software using an SGE C18 RS 3 mm Wakosil
(150 mm � 4.6 mm) column protected by an SGE (Australia)
C-18 guard column. Solvent A was 10% (v/v) formic acid and
solvent B was methanol. The gradient of solvent B was: 0 min,
17%; 1 min, 17%; 15 min, 35%; 40 min, 37%; 42 min, 100%;
48 min, 100%; 50 min, 17%; 52 min, 17%. The gradient was
run at a flow rate of 1 ml min�1, at a column temperature of
40 8C and a 10 ml sample was injected. Absorbance was
measured at 520, 353, 320 and 280 nm. Standards were
cyanidin 3-galactoside, quercetin 3-galactoside, quercetin 3-
rhamnoside and quercetin 3-arabinoglucoside (Extrasynthese,
France). Flavonol concentration was calculated from a standard
curve of quercetin 3-galactoside by summing peak areas for all
flavonol species detected and expressing as quercetin 3-
galactoside equivalents.
2.8. Condensed tannin analysis
Finely ground plant material (0.1 g) was extracted in 1 ml
70% (v/v) acetone containing 0.1% (w/v) ascorbate for 24 h at
room temperature on a rotating wheel in darkness. Samples
were centrifuged at 13,000 � g for 15 min at room
temperature and then two 200 ml aliquots of the supernatant
were transferred to fresh tubes and dried under vacuum at
35 8C for 60 min. One aliquot was resuspended in 100 ml 1%
(v/v) HCl–methanol then neutralised with 100 ml sodium
acetate (200 mM, pH 7.5) for the analysis of free monomers.
The other aliquot was resuspended in 100 ml phloroglucinol
buffer (0.25 g ascorbate, 1.25 g phloroglucinol, 215 ml conc.
HCl, 25 ml methanol) and incubated at 50 8C for 20 min, then
neutralised with 100 ml sodium acetate (200 mM, pH 7.5) for
the analysis of initiating and extension units. Separate reverse-
phase-HPLC methods were used for the cleaved and
uncleaved CTs as described by Downey et al. [23]. Identity
and concentration of free monomers and initiating units were
determined from standard curves of epicatechin and catechin
(Extrasynthese). Initiating units were calculated by subtract-
ing value of epicatechin obtained from uncleaved CT analysis
(free monomers) from epicatechin value obtained from the
cleaved CT analysis. The concentration of extension unit
phloroglucinol adducts was calculated from published molar
extinction coefficients [24]. Polymer length was calculated by
summation of initiating and extension units and then dividing
by initiating units.
A.M. Takos et al. / Plant Science 170 (2006) 487–499 491
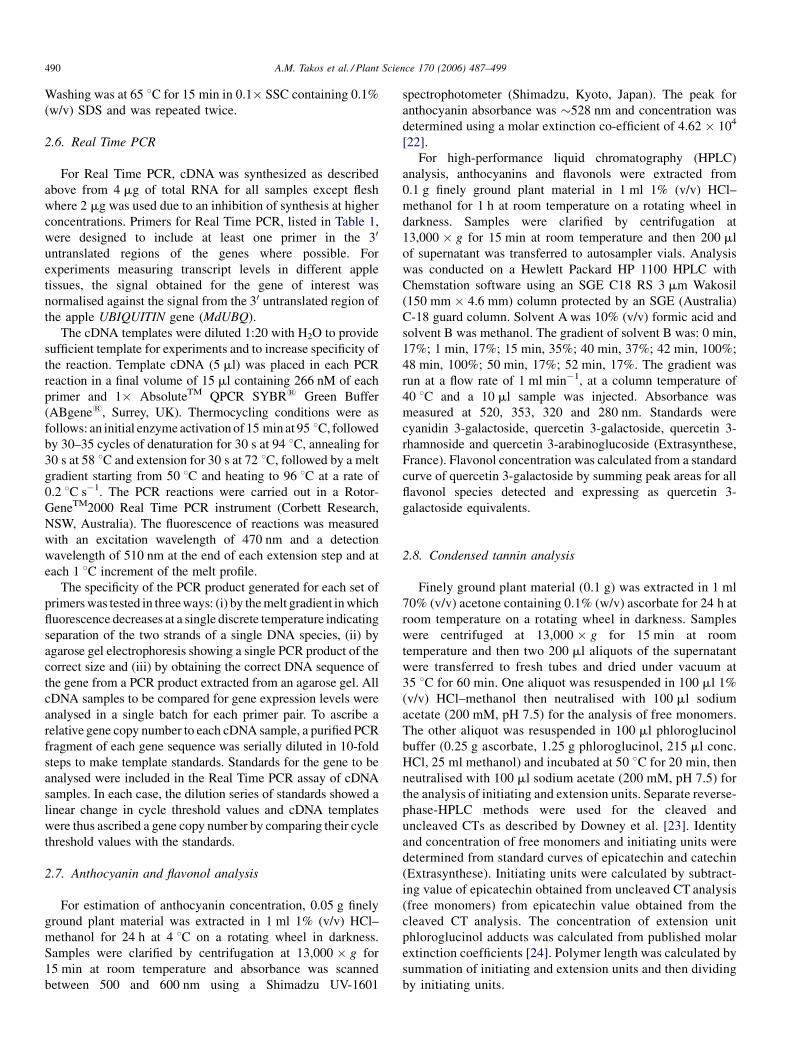
Fig. 2. Alignment of apple LAR and ANR deduced amino acid sequences. (a) Alignment of apple MdLAR1, MdLAR2 and D. uncinatum DuLAR sequences. (b)
Alignment of appleMdANR,Arabidopsis thalianaAtANR andM. truncatulaMtANR sequences. Peptide sequences were alignedwith the CLUSTALWprogram and
displayed using GeneDoc Version 2.6.002 program.
3. Results
3.1. Isolation of apple MdLAR and MdANR sequences
Since the CT genes, LAR and ANR, had not previously been
identified from apple, the complete coding regions of these
genes were cloned by PCR from cDNA made from ‘Cripps
Red’ immature fruit (<1 cm diameter). Two LAR genes,
MdLAR1 and MdLAR2, were isolated. Their deduced protein
sequences are 354 and 349 amino acid residues in length,
respectively, and have 93% similarity and 90% identity with
each other. The significant difference is located between
residues 328 and 336 of MdLAR1 which contains the motif
LLQEEEDQK whilst MdLAR2 contains PVHEEN in this
region (Fig. 2a). These sequences are close to the C-terminal
end of the proteins and are not conserved between apple and
Desmodium uncinatum LARs. This region is not known to be
critical for substrate recognition or activity [10]. Both variants
contain sequence motifs common to the Reductase–Epimer-
ase–Dehydrogenase family of proteins, which are also found in
the D. uncinatum LAR sequence. These include the Rossmann
dinucleotide-binding domain [25] characterised by the motif
GXXGXXG starting from Gly19, which may interact with
NAD(P), and three residues, Ser120, Tyr139 and Lys142, critical
to the catalytic site. The apple LAR proteins lack the D.
uncinatum LAR C-terminal extension of about 65 amino acids,
the function of which is unknown. Over the remainder of the
protein sequence MdLAR1 has 78% similarity and 67%
identity to the LAR of D. uncinatum, for which the activity of
the recombinant enzyme has been demonstrated [10]. Southern
analysis indicates that there are three or four sequences similar
to the MdLAR genes in the apple genome (Table 1).
A.M. Takos et al. / Plant Science 170 (2006) 487–499492
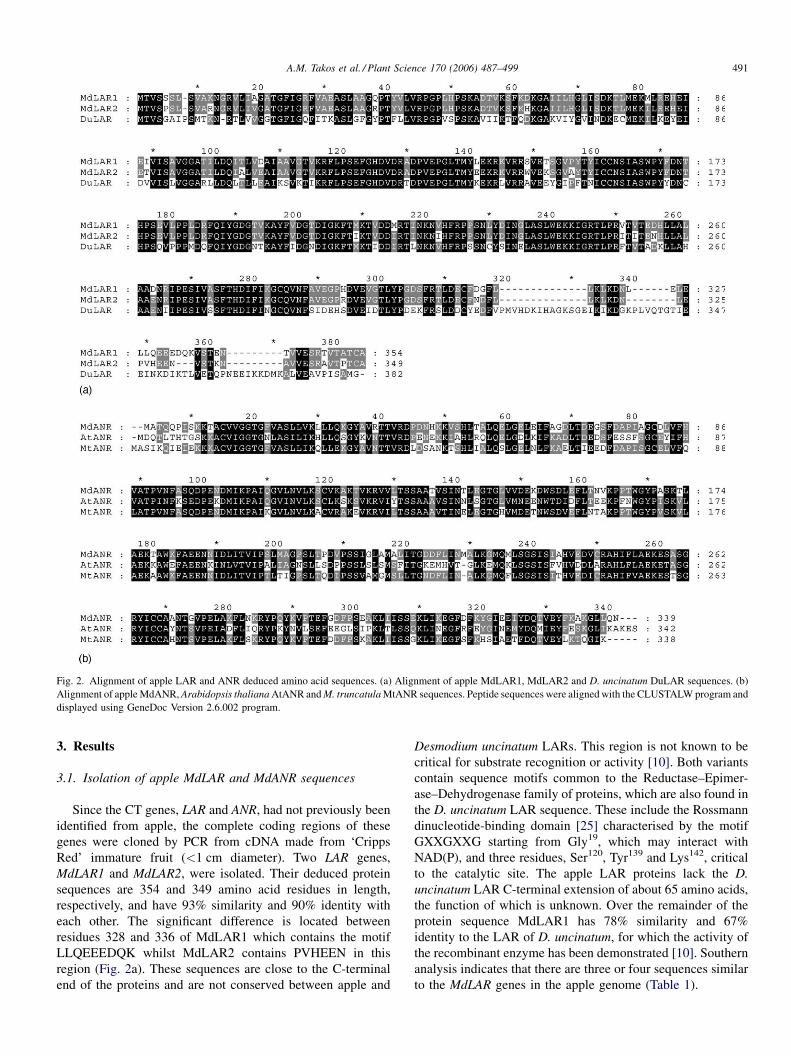
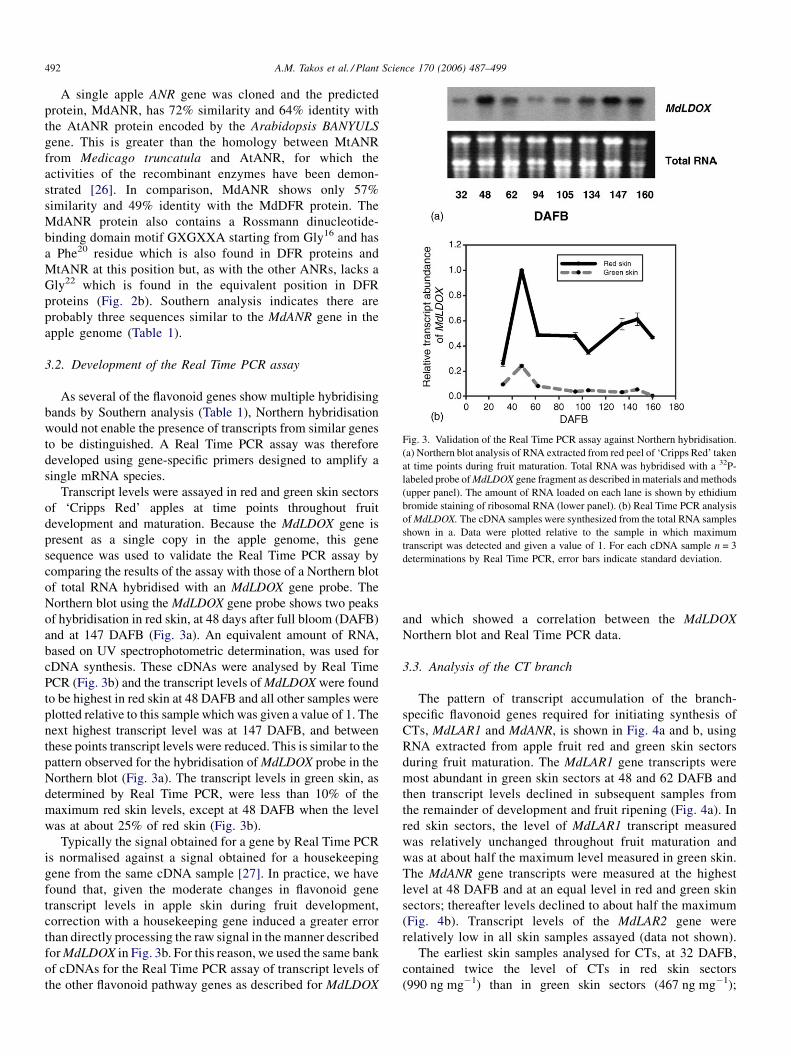
Fig. 3. Validation of the Real Time PCR assay against Northern hybridisation.
(a) Northern blot analysis of RNA extracted from red peel of ‘Cripps Red’ taken
at time points during fruit maturation. Total RNA was hybridised with a 32P-
labeled probe ofMdLDOX gene fragment as described in materials and methods
(upper panel). The amount of RNA loaded on each lane is shown by ethidium
bromide staining of ribosomal RNA (lower panel). (b) Real Time PCR analysis
ofMdLDOX. The cDNA samples were synthesized from the total RNA samples
shown in a. Data were plotted relative to the sample in which maximum
transcript was detected and given a value of 1. For each cDNA sample n = 3
determinations by Real Time PCR, error bars indicate standard deviation.
A single apple ANR gene was cloned and the predicted
protein, MdANR, has 72% similarity and 64% identity with
the AtANR protein encoded by the Arabidopsis BANYULS
gene. This is greater than the homology between MtANR
from Medicago truncatula and AtANR, for which the
activities of the recombinant enzymes have been demon-
strated [26]. In comparison, MdANR shows only 57%
similarity and 49% identity with the MdDFR protein. The
MdANR protein also contains a Rossmann dinucleotide-
binding domain motif GXGXXA starting from Gly16 and has
a Phe20 residue which is also found in DFR proteins and
MtANR at this position but, as with the other ANRs, lacks a
Gly22 which is found in the equivalent position in DFR
proteins (Fig. 2b). Southern analysis indicates there are
probably three sequences similar to the MdANR gene in the
apple genome (Table 1).
3.2. Development of the Real Time PCR assay
As several of the flavonoid genes show multiple hybridising
bands by Southern analysis (Table 1), Northern hybridisation
would not enable the presence of transcripts from similar genes
to be distinguished. A Real Time PCR assay was therefore
developed using gene-specific primers designed to amplify a
single mRNA species.
Transcript levels were assayed in red and green skin sectors
of ‘Cripps Red’ apples at time points throughout fruit
development and maturation. Because the MdLDOX gene is
present as a single copy in the apple genome, this gene
sequence was used to validate the Real Time PCR assay by
comparing the results of the assay with those of a Northern blot
of total RNA hybridised with an MdLDOX gene probe. The
Northern blot using the MdLDOX gene probe shows two peaks
of hybridisation in red skin, at 48 days after full bloom (DAFB)
and at 147 DAFB (Fig. 3a). An equivalent amount of RNA,
based on UV spectrophotometric determination, was used for
cDNA synthesis. These cDNAs were analysed by Real Time
PCR (Fig. 3b) and the transcript levels ofMdLDOX were found
to be highest in red skin at 48 DAFB and all other samples were
plotted relative to this sample which was given a value of 1. The
next highest transcript level was at 147 DAFB, and between
these points transcript levels were reduced. This is similar to the
pattern observed for the hybridisation ofMdLDOX probe in the
Northern blot (Fig. 3a). The transcript levels in green skin, as
determined by Real Time PCR, were less than 10% of the
maximum red skin levels, except at 48 DAFB when the level
was at about 25% of red skin (Fig. 3b).
Typically the signal obtained for a gene by Real Time PCR
is normalised against a signal obtained for a housekeeping
gene from the same cDNA sample [27]. In practice, we have
found that, given the moderate changes in flavonoid gene
transcript levels in apple skin during fruit development,
correction with a housekeeping gene induced a greater error
than directly processing the raw signal in the manner described
forMdLDOX in Fig. 3b. For this reason, we used the same bank
of cDNAs for the Real Time PCR assay of transcript levels of
the other flavonoid pathway genes as described for MdLDOX
and which showed a correlation between the MdLDOX
Northern blot and Real Time PCR data.
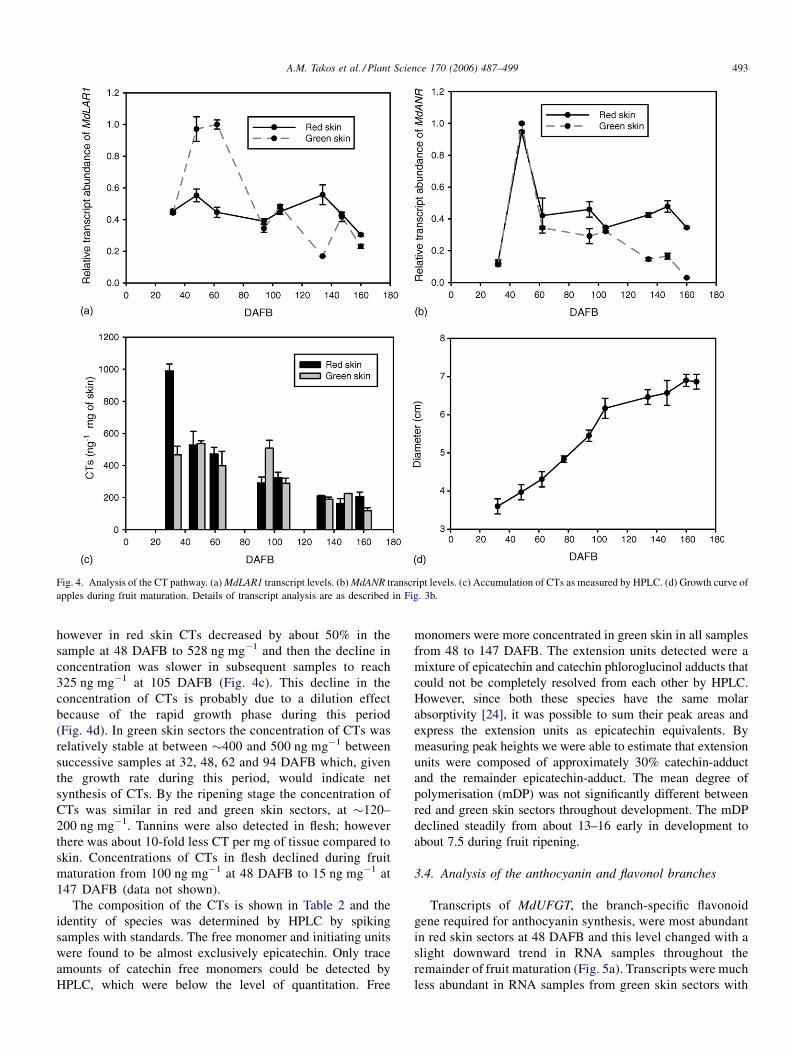
3.3. Analysis of the CT branch
The pattern of transcript accumulation of the branch-
specific flavonoid genes required for initiating synthesis of
CTs, MdLAR1 and MdANR, is shown in Fig. 4a and b, using
RNA extracted from apple fruit red and green skin sectors
during fruit maturation. The MdLAR1 gene transcripts were
most abundant in green skin sectors at 48 and 62 DAFB and
then transcript levels declined in subsequent samples from
the remainder of development and fruit ripening (Fig. 4a). In
red skin sectors, the level of MdLAR1 transcript measured
was relatively unchanged throughout fruit maturation and
was at about half the maximum level measured in green skin.
The MdANR gene transcripts were measured at the highest
level at 48 DAFB and at an equal level in red and green skin
sectors; thereafter levels declined to about half the maximum
(Fig. 4b). Transcript levels of the MdLAR2 gene were
relatively low in all skin samples assayed (data not shown).
The earliest skin samples analysed for CTs, at 32 DAFB,
contained twice the level of CTs in red skin sectors
(990 ng mg�1) than in green skin sectors (467 ng mg�1);
A.M. Takos et al. / Plant Science 170 (2006) 487–499 493
Fig. 4. Analysis of the CT pathway. (a)MdLAR1 transcript levels. (b)MdANR transcript levels. (c) Accumulation of CTs as measured by HPLC. (d) Growth curve of
apples during fruit maturation. Details of transcript analysis are as described in Fig. 3b.
however in red skin CTs decreased by about 50% in the
sample at 48 DAFB to 528 ng mg�1 and then the decline in
concentration was slower in subsequent samples to reach
325 ng mg�1 at 105 DAFB (Fig. 4c). This decline in the
concentration of CTs is probably due to a dilution effect
because of the rapid growth phase during this period
(Fig. 4d). In green skin sectors the concentration of CTs was
relatively stable at between �400 and 500 ng mg�1 between
successive samples at 32, 48, 62 and 94 DAFB which, given
the growth rate during this period, would indicate net
synthesis of CTs. By the ripening stage the concentration of
CTs was similar in red and green skin sectors, at �120–
200 ng mg�1. Tannins were also detected in flesh; however
there was about 10-fold less CT per mg of tissue compared to
skin. Concentrations of CTs in flesh declined during fruit
maturation from 100 ng mg�1 at 48 DAFB to 15 ng mg�1 at
147 DAFB (data not shown).
The composition of the CTs is shown in Table 2 and the
identity of species was determined by HPLC by spiking
samples with standards. The free monomer and initiating units
were found to be almost exclusively epicatechin. Only trace
amounts of catechin free monomers could be detected by
HPLC, which were below the level of quantitation. Free
monomers were more concentrated in green skin in all samples
from 48 to 147 DAFB. The extension units detected were a
mixture of epicatechin and catechin phloroglucinol adducts that
could not be completely resolved from each other by HPLC.
However, since both these species have the same molar
absorptivity [24], it was possible to sum their peak areas and
express the extension units as epicatechin equivalents. By
measuring peak heights we were able to estimate that extension
units were composed of approximately 30% catechin-adduct
and the remainder epicatechin-adduct. The mean degree of
polymerisation (mDP) was not significantly different between
red and green skin sectors throughout development. The mDP
declined steadily from about 13–16 early in development to
about 7.5 during fruit ripening.
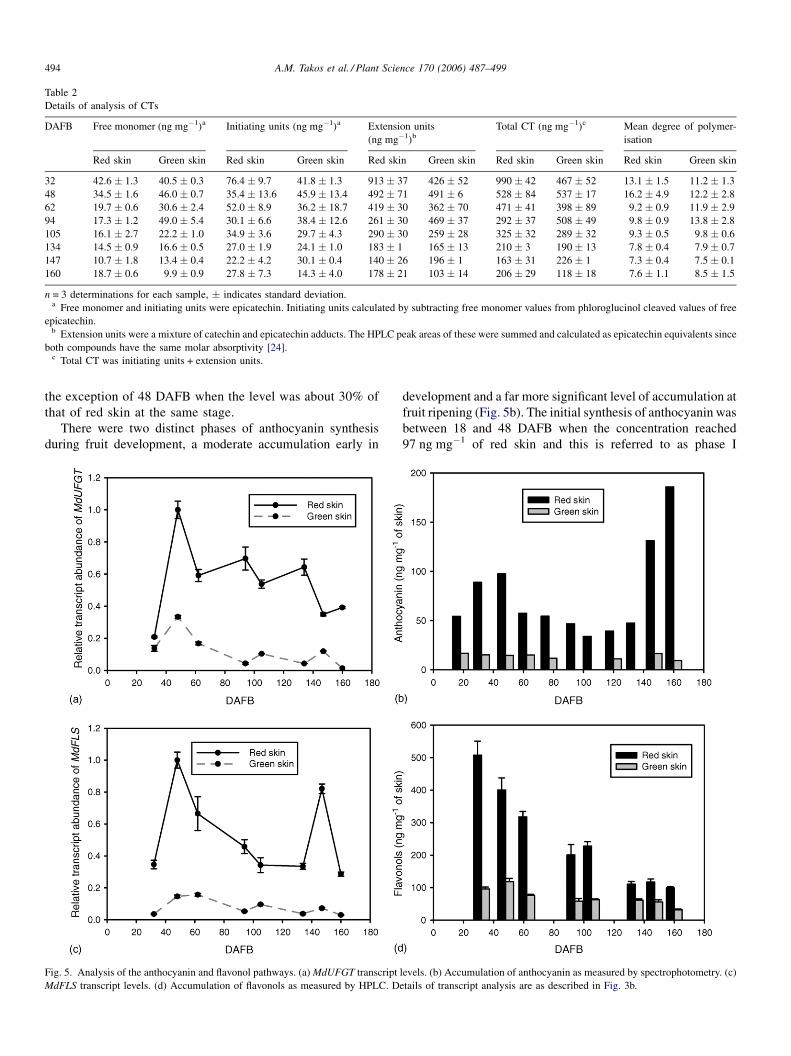
3.4. Analysis of the anthocyanin and flavonol branches
Transcripts of MdUFGT, the branch-specific flavonoid
gene required for anthocyanin synthesis, were most abundant
in red skin sectors at 48 DAFB and this level changed with a
slight downward trend in RNA samples throughout the
remainder of fruit maturation (Fig. 5a). Transcripts were much
less abundant in RNA samples from green skin sectors with
A.M. Takos et al. / Plant Science 170 (2006) 487–499494
Table 2
Details of analysis of CTs
DAFB Free monomer (ng mg�1)a Initiating units (ng mg�1)a Extension units
(ng mg�1)bTotal CT (ng mg�1)c Mean degree of polymer-
isation
Red skin Green skin Red skin Green skin Red skin Green skin Red skin Green skin Red skin Green skin
32 42.6 � 1.3 40.5 � 0.3 76.4 � 9.7 41.8 � 1.3 913 � 37 426 � 52 990 � 42 467 � 52 13.1 � 1.5 11.2 � 1.3
48 34.5 � 1.6 46.0 � 0.7 35.4 � 13.6 45.9 � 13.4 492 � 71 491 � 6 528 � 84 537 � 17 16.2 � 4.9 12.2 � 2.8
62 19.7 � 0.6 30.6 � 2.4 52.0 � 8.9 36.2 � 18.7 419 � 30 362 � 70 471 � 41 398 � 89 9.2 � 0.9 11.9 � 2.9
94 17.3 � 1.2 49.0 � 5.4 30.1 � 6.6 38.4 � 12.6 261 � 30 469 � 37 292 � 37 508 � 49 9.8 � 0.9 13.8 � 2.8
105 16.1 � 2.7 22.2 � 1.0 34.9 � 3.6 29.7 � 4.3 290 � 30 259 � 28 325 � 32 289 � 32 9.3 � 0.5 9.8 � 0.6
134 14.5 � 0.9 16.6 � 0.5 27.0 � 1.9 24.1 � 1.0 183 � 1 165 � 13 210 � 3 190 � 13 7.8 � 0.4 7.9 � 0.7
147 10.7 � 1.8 13.4 � 0.4 22.2 � 4.2 30.1 � 0.4 140 � 26 196 � 1 163 � 31 226 � 1 7.3 � 0.4 7.5 � 0.1
160 18.7 � 0.6 9.9 � 0.9 27.8 � 7.3 14.3 � 4.0 178 � 21 103 � 14 206 � 29 118 � 18 7.6 � 1.1 8.5 � 1.5
n = 3 determinations for each sample, � indicates standard deviation.a Free monomer and initiating units were epicatechin. Initiating units calculated by subtracting free monomer values from phloroglucinol cleaved values of free
epicatechin.b Extension units were a mixture of catechin and epicatechin adducts. The HPLC peak areas of these were summed and calculated as epicatechin equivalents since
both compounds have the same molar absorptivity [24].c Total CT was initiating units + extension units.
the exception of 48 DAFB when the level was about 30% of
that of red skin at the same stage.
There were two distinct phases of anthocyanin synthesis
during fruit development, a moderate accumulation early in
Fig. 5. Analysis of the anthocyanin and flavonol pathways. (a)MdUFGT transcript
MdFLS transcript levels. (d) Accumulation of flavonols as measured by HPLC. D
development and a far more significant level of accumulation at
fruit ripening (Fig. 5b). The initial synthesis of anthocyanin was
between 18 and 48 DAFB when the concentration reached
97 ng mg�1 of red skin and this is referred to as phase I
levels. (b) Accumulation of anthocyanin as measured by spectrophotometry. (c)
etails of transcript analysis are as described in Fig. 3b.
A.M. Takos et al. / Plant Science 170 (2006) 487–499 495
synthesis. Subsequently anthocyanin concentration decreased
to 34 ng mg�1 of red skin at 105 DAFB probably due to the
dilution effect of fruit growth as was noted for the synthesis of
CTs (Fig. 4d). At fruit ripening anthocyanin concentration in
red skin increased from 47 ng mg�1 of skin at 134 DAFB to
186 ng mg�1 at 160 DAFB, during the period referred to as
phase II synthesis. Less than 15 ng mg�1 of anthocyanin was
measured in green skin sectors at any point in fruit
development. The major anthocyanin species in apple skin
had previously been identified as cyanidin 3-galactoside by
HPLC [18,28]. We confirmed that this was only major species
in ‘Cripps Red’ by HPLC analysis of several samples spiked
with a standard of this compound. Anthocyanin was not
detected in flesh.
Transcripts of the MdFLS gene, required for synthesis of
flavonols, were far more abundant in red skin sectors compared
with green skin (Fig. 5c). There were two peaks in transcript
levels in red skin, at 48 and 147 DAFB.
Flavonols were probably synthesized very early in fruit
development because the first red skin sector sample analysed
at 32 DAFB had the highest concentration. Flavonols
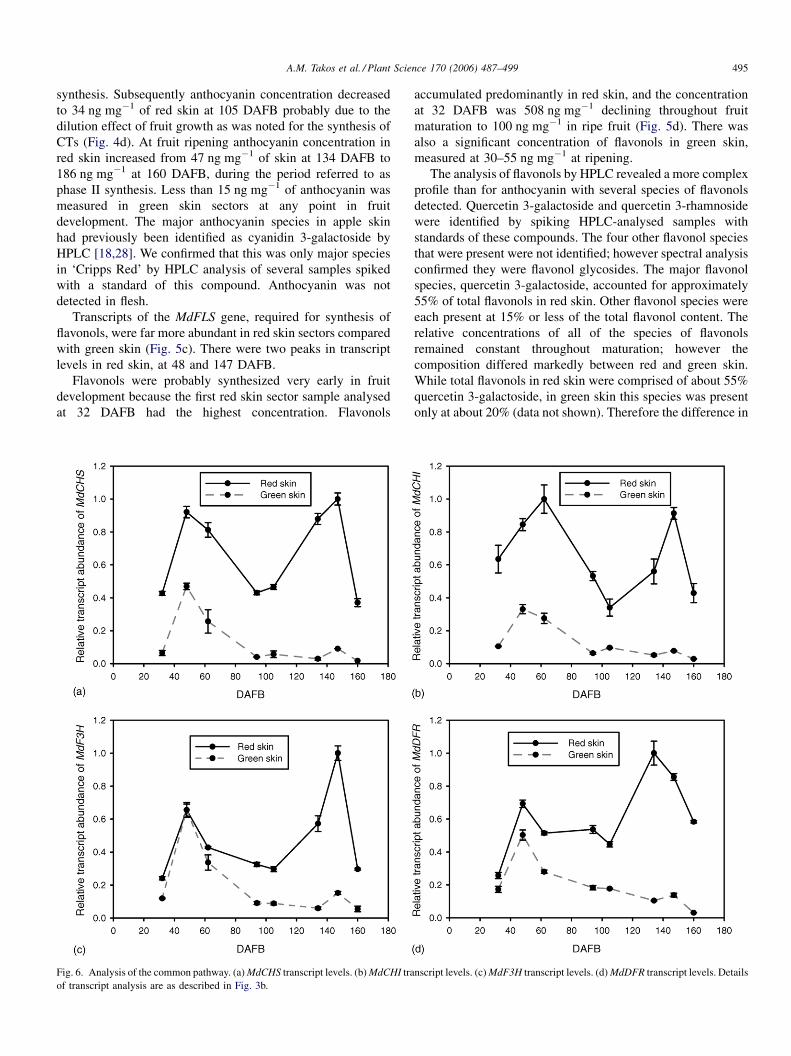
Fig. 6. Analysis of the common pathway. (a)MdCHS transcript levels. (b)MdCHI tra
of transcript analysis are as described in Fig. 3b.
accumulated predominantly in red skin, and the concentration
at 32 DAFB was 508 ng mg�1 declining throughout fruit
maturation to 100 ng mg�1 in ripe fruit (Fig. 5d). There was
also a significant concentration of flavonols in green skin,
measured at 30–55 ng mg�1 at ripening.
The analysis of flavonols by HPLC revealed a more complex
profile than for anthocyanin with several species of flavonols
detected. Quercetin 3-galactoside and quercetin 3-rhamnoside
were identified by spiking HPLC-analysed samples with
standards of these compounds. The four other flavonol species
that were present were not identified; however spectral analysis
confirmed they were flavonol glycosides. The major flavonol
species, quercetin 3-galactoside, accounted for approximately
55% of total flavonols in red skin. Other flavonol species were
each present at 15% or less of the total flavonol content. The
relative concentrations of all of the species of flavonols
remained constant throughout maturation; however the
composition differed markedly between red and green skin.
While total flavonols in red skin were comprised of about 55%
quercetin 3-galactoside, in green skin this species was present
only at about 20% (data not shown). Therefore the difference in
nscript levels. (c)MdF3H transcript levels. (d)MdDFR transcript levels. Details
A.M. Takos et al. / Plant Science 170 (2006) 487–499496
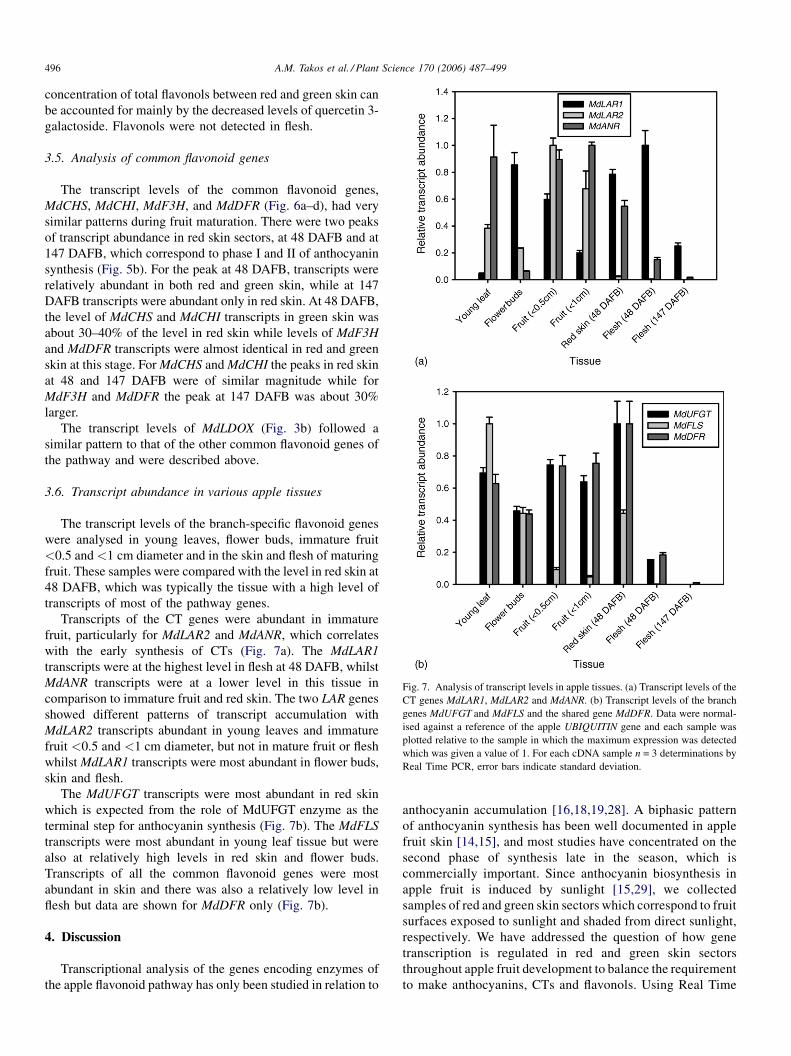
Fig. 7. Analysis of transcript levels in apple tissues. (a) Transcript levels of the
CT genes MdLAR1, MdLAR2 and MdANR. (b) Transcript levels of the branch
genes MdUFGT and MdFLS and the shared gene MdDFR. Data were normal-
ised against a reference of the apple UBIQUITIN gene and each sample was
plotted relative to the sample in which the maximum expression was detected
which was given a value of 1. For each cDNA sample n = 3 determinations by
Real Time PCR, error bars indicate standard deviation.
concentration of total flavonols between red and green skin can
be accounted for mainly by the decreased levels of quercetin 3-
galactoside. Flavonols were not detected in flesh.
3.5. Analysis of common flavonoid genes
The transcript levels of the common flavonoid genes,
MdCHS, MdCHI, MdF3H, and MdDFR (Fig. 6a–d), had very
similar patterns during fruit maturation. There were two peaks
of transcript abundance in red skin sectors, at 48 DAFB and at
147 DAFB, which correspond to phase I and II of anthocyanin
synthesis (Fig. 5b). For the peak at 48 DAFB, transcripts were
relatively abundant in both red and green skin, while at 147
DAFB transcripts were abundant only in red skin. At 48 DAFB,
the level of MdCHS and MdCHI transcripts in green skin was
about 30–40% of the level in red skin while levels of MdF3H
and MdDFR transcripts were almost identical in red and green
skin at this stage. ForMdCHS andMdCHI the peaks in red skin
at 48 and 147 DAFB were of similar magnitude while for
MdF3H and MdDFR the peak at 147 DAFB was about 30%
larger.
The transcript levels of MdLDOX (Fig. 3b) followed a
similar pattern to that of the other common flavonoid genes of
the pathway and were described above.
3.6. Transcript abundance in various apple tissues
The transcript levels of the branch-specific flavonoid genes
were analysed in young leaves, flower buds, immature fruit
<0.5 and <1 cm diameter and in the skin and flesh of maturing
fruit. These samples were compared with the level in red skin at
48 DAFB, which was typically the tissue with a high level of
transcripts of most of the pathway genes.
Transcripts of the CT genes were abundant in immature
fruit, particularly for MdLAR2 and MdANR, which correlates
with the early synthesis of CTs (Fig. 7a). The MdLAR1
transcripts were at the highest level in flesh at 48 DAFB, whilst
MdANR transcripts were at a lower level in this tissue in
comparison to immature fruit and red skin. The two LAR genes
showed different patterns of transcript accumulation with
MdLAR2 transcripts abundant in young leaves and immature
fruit <0.5 and <1 cm diameter, but not in mature fruit or flesh
whilstMdLAR1 transcripts were most abundant in flower buds,
skin and flesh.
The MdUFGT transcripts were most abundant in red skin
which is expected from the role of MdUFGT enzyme as the
terminal step for anthocyanin synthesis (Fig. 7b). The MdFLS
transcripts were most abundant in young leaf tissue but were
also at relatively high levels in red skin and flower buds.
Transcripts of all the common flavonoid genes were most
abundant in skin and there was also a relatively low level in
flesh but data are shown for MdDFR only (Fig. 7b).
4. Discussion
Transcriptional analysis of the genes encoding enzymes of
the apple flavonoid pathway has only been studied in relation to
anthocyanin accumulation [16,18,19,28]. A biphasic pattern
of anthocyanin synthesis has been well documented in apple
fruit skin [14,15], and most studies have concentrated on the
second phase of synthesis late in the season, which is
commercially important. Since anthocyanin biosynthesis in
apple fruit is induced by sunlight [15,29], we collected
samples of red and green skin sectors which correspond to fruit
surfaces exposed to sunlight and shaded from direct sunlight,
respectively. We have addressed the question of how gene
transcription is regulated in red and green skin sectors
throughout apple fruit development to balance the requirement
to make anthocyanins, CTs and flavonols. Using Real Time
A.M. Takos et al. / Plant Science 170 (2006) 487–499 497
PCR we have been able to quantify relative changes in the
transcript levels of defined gene sequences for the whole
pathway including the genes specific for flavonol and CT
synthesis. This approach has several advantages over Northern
blotting the most important being a larger dynamic range of
linear measurement, typically spanning six orders of
magnitude, and more precise quantification of steady-state
transcript levels of specific mRNA sequences [30].
Similar to other findings [28], transcripts of the common
flavonoid genes of the pathway were most abundant at two
stages, early in development and at fruit ripening, and at a lower
level between these phases. At the early developmental stage,
transcripts of the common flavonoid genes were abundant in red
and green skin which is consistent with the synthesis of
flavonoids in both these skin sectors, while at fruit ripening
transcript levels were higher in red skin to support anthocyanin
synthesis. The data, we obtained using Real Time PCR showed
that the changes in transcript levels were about three to five-fold
between lowest and highest levels. This indicates that
phenotype can be affected by relatively moderate changes in
transcript levels.
CTs accumulate in the developing fruit structure, in which
they have been reported to play a role in preventing predation
by herbivores [4]. We found the highest concentration of CTs
measured in the early red skin samples, while both red and
green skin had similar amounts of CTs later in fruit
development. During the period of rapid growth early in fruit
development, CTs were synthesized in green skin to maintain a
similar concentration whereas anthocyanins and flavonols
decreased in red skin due to a dilution effect of fruit growth. At
fruit ripening, the concentration of CTs was about 80% less
than early in development suggesting there is little synthesis of
CTs late in development of the fruit. The early synthesis of CTs
and subsequent decrease in concentration during fruit devel-
opment has also been observed in ‘Fuji’ and ‘Oorin’ apples [31]
and also other fruits such as cranberry [32], bilberry [33] and
grape [23].
The pattern of abundance of MdLAR1 and MdANR
transcripts was consistent with their roles in the synthesis of
CTs as gene transcripts were at the highest levels early in
fruit development and were abundant in both red and green
skin. Since the major initiating unit for synthesis of CTs
detected was epicatechin, the product of the MdANR enzyme
reaction [26], this would suggest that the initiation of
synthesis of CTs was mainly due to flux through the ANR
branch of the pathway rather than the LAR branch, which
would produce catechin.
The relative transcript levels of the MdANR and MdUFGT
genes during phase I of anthocyanin biosynthesis together with
the decrease in CTs in red skin suggest the possibility of
substrate competition. Although transcript levels of MdANR
appear similar in red and green skin at this stage, CTs are
synthesized in green skin where anthocyanins are not being
synthesized. In comparison, the MdUFGT transcripts were
more abundant in red skin at this stage. Therefore, if
transcription of these genes reflects the protein levels, the
competition between MdANR and MdUFGT enzymes could
favour diversion of substrate into the anthocyanin pathway in
red skin, while in green skin there is less competition for
substrates of the CT pathway. There is some evidence for
substrate competition between the anthocyanin and CT
branches in other systems; for example the Arabidopsis
banyuls mutant, which is deficient in the ANR enzyme activity
and does not have the alternative LAR pathway to initiate
synthesis of CTs, accumulates anthocyanin rather than CTs in
the seed coat [34].
The MdUFGT transcript levels peak mainly during phase I
and are lower later when the majority of anthocyanin is
synthesized; this is puzzling considering the putative role of the
UFGT enzyme for glycosylation of cyanidin. It cannot be
discounted that there may be either an alternative or dual
activity of the enzyme for glycosylation of flavonols [35]. If this
is the case this may argue against the possibility of substrate
competition between the anthocyanin and CT pathways based
upon the transcript levels of MdANR and MdUFGT.
A second variant of the LAR gene cloned from apple,
MdLAR2, had relatively high transcript levels only in immature
fruit. The MdLAR2 transcript may be located in the seed
component of these samples, as CTs are known to accumulate
in the seed coat in other plants [36,23].
Flavonols accumulated preferentially in red skin, initially
about five-fold more than green skin, and most synthesis
occurred before the earliest sample of skin analysed as we have
measured high levels of flavonols in flower buds (data not
shown). The relative abundance of MdFLS gene transcripts in
flower buds correlates with this observation (Fig. 7b). During
fruit development, flavonol concentration in red skin decreased
and at ripening was about four-fold lower than in immature
fruit. Similar observations have been made in several other
apple varieties [37–39]. Unlike other varieties, in ‘Red
Delicious’ apples MdFLS transcripts and quercetin 3-galacto-
side were found to accumulate at fruit ripening [40]; this
apparent discrepancy may be due to differences in genetic
background or environmental conditions between the studies.
In our study of the ‘Cripps Red’ variety, the pattern of MdFLS
transcript levels in skin correlates with the two peaks of
anthocyanin synthesis rather than with flavonol synthesis. The
absence of flavonol synthesis when MdFLS transcript levels
increased appears puzzling but may be due to several
possibilities. There may be a major point of regulation of
flavonol synthesis, either post-transcriptional or post-transla-
tional, so that the amount of mRNA present doesn’t accurately
reflect the amount of active enzyme. There could also be
competition for the substrate with the MdDFR enzyme
competing with the MdFLS enzyme (Fig. 1). In petunia flower
petals, reduction of FLS gene expression or increased
expression of the DFR gene can re-direct the flavonoid
pathway towards anthocyanin production [41].
The flavonoid pathway was also active in apple fruit flesh
to synthesise CTs, which accumulated in flesh at about a 10-
fold less concentration than in skin. The presence of
transcripts of the CT genes in flesh correlate with the
synthesis of CTs in this tissue. Transcripts of the MdUFGT
and MdFLS genes were far less abundant in flesh than in skin,
A.M. Takos et al. / Plant Science 170 (2006) 487–499498
which would account for the absence of anthocyanins and
flavonols in flesh.
Fruit skin represents a complex tissue in which each of the
branches of the flavonoid pathway is active at some point
during the development of the fruit. In apple fruit the transcripts
of the common flavonoid genes were abundant at two phases,
early in development when some anthocyanin as well as CTs
and flavonols were synthesized and at fruit ripening when only
anthocyanin was synthesized. This pattern of common gene
transcript abundance and flavonoid synthesis has also been
observed in other fruits such as peach and nectarine [42],
bilberry [33] and grape [43]. In addition, in strawberry the CHI
and DFR gene transcripts levels also have early and late
developmental peaks but the PAL and CHS gene transcript
levels remained almost unchanged during fruit development
[44]. However, none of these studies measured the transcript
levels of CT or flavonol branch genes. We have made the first
analysis of the molecular basis of the flavonoid pathway in
terms of CT, flavonol and anthocyanin formation in the same
tissue type.
From this data it appears that there are at least two levels
of transcriptional regulation of flavonoid structural genes
in skin of maturing apple fruit. A developmental control
is apparent at the two phases of flavonoid accumulation
during fruit development and an environmental control by
light of anthocyanin synthesis in red skin during phase I of
synthesis and more predominately at the fruit ripening stage.
There is also an influence of light on CT and flavonol
biosynthesis as the concentration of these compound was
higher in red skin before the phase I of anthocyanin
synthesis. This synthesis could have occurred earlier in fruit
development than our analysis. Our data are consistent with
co-ordinate regulation of the common flavonoid genes of the
pathway both developmentally and in response to environ-
mental stimulus. The CT genes appear to be under a different
control mechanism than the rest of the flavonoid genes,
which are more sensitive to the presence of light at ripening
than early in development. It may be that a transcription
factor, that specifically regulates the CT genes, is only
expressed early in fruit development and not during ripening.
This would explain the reduced level of transcripts of
MdLAR and MdANR and reduction of CT biosynthesis at
ripening.
Acknowledgements
The authors thank the staff from the Primary Industries
and Resources South Australia for allowing us to sample
apple fruits at the Lenswood site in the Adelaide Hills. We
thank Dr. Anthony Ashton for the design of the degenerate
LAR primers, Karin Sefton and Justine Chambers for
excellent technical assistance and Dr. Mark Downey and
Nicole Cordon for the HPLC methods for analysing
anthocyanins, flavonols and tannins. We are grateful for
the support of this work by a grant from the Western
Australian Department of Agriculture under the auspices of
Horticultural Australia Ltd.
References
[1] N.J.Dominy, J.C.Svenning,W.H.Li,Historicalcontingencyin theevolution
of primate color vision, J. Hum. Evol. 44 (2003) 25– 45.
[2] K.D. Whitney, C.E. Lister, Fruit colour polymorphism in Acacia ligulata:
seed and seedling performance, clinal patterns, and chemical variation,
Evol. Ecol. 18 (2004) 165–186.
[3] R.W. Wrangham, N.L. Conklin-Brittain, K.D. Hunt, Dietary response of
chimpanzees and cercopithecines to seasonal variation in fruit abundance.
I. Antifeedants, Int. J. Primatol. 19 (1998) 949–970.
[4] R.E. Forkner, R.J. Marquis, J.T. Lill, Feeny revisited: condensed tannins as
anti-herbivore defences in leaf-chewing herbivore communities of Quer-
cus, Ecol. Entomol. 29 (2004) 174–187.
[5] S.J. Bloor, R. Falshaw, Covalently linked anthocyanin-flavonol pigments
from blue Agapanthus flowers, Phytochemistry 53 (2000) 575–579.
[6] J. Derksen, R. van Wezel, B. Knuiman, B. Ylstra, A.J. van Tunen, Pollen
tubes of flavonol-deficient Petunia show striking alterations in wall
structure leading to tube disruption, Planta 207 (1999) 575–581.
[7] A. Solovchenko, M. Schmitz-Eiberger, Significance of skin flavonoids for
UV-B-protection in apple fruits, J. Exp. Bot. 54 (2003) 1977– 1984.
[8] K. Wolfe, X.Z. Wu, R.H. Liu, Antioxidant activity of apple peels, J. Agric.
Food Chem. 51 (2003) 609–614.
[9] B. Winkel-Shirley, Flavonoid biosynthesis. A colorful model for genetics,
biochemistry, cell biology, and biotechnology, Plant Physiol. 126 (2001)
485–493.
[10] G.J. Tanner, K.T. Francki, S. Abrahams, J.M. Watson, P.J. Larkin, A.R.
Ashton, Proanthocyanidin biosynthesis in plants – purification of legume
leucoanthocyanidin reductase and molecular cloning of its cDNA, J. Biol.
Chem. 278 (2003) 31647–31656.
[11] M. Devic, J. Guilleminot, I. Debeaujon, N. Bechtold, E. Bensaude, M.
Koornneef, G. Pelletier, M. Delseny, The BANYULS gene encodes a DFR-
like protein and is a marker of early seed coat development, Plant J. 19
(1999) 387–398.
[12] D.-Y. Xie, S.B. Sharma, N.L. Paiva, D. Ferreira, R.A. Dixon, Role of
anthocyanidin reductase, encoded by BANYULS in plant flavonoid bio-
synthesis, Science 299 (2003) 396–399.
[13] J.A. Delcour, D. Ferreira, D.G. Roux, Synthesis of condensed tannins: IX.
The condensation sequence of leucocyanidin with (+) catechin and the
resultant procyanidin, J. Chem. Soc. Perk. T. 1 (1983) 1711–1717.
[14] C.E. Lister, J.E. Lancaster, K.H. Sutton, J.R.L. Walker, Developmental
changes in the concentration and composition of flavonoids in skin of a red
and a green skin apple cultivar, J. Sci. Food Agric. 64 (1994) 155–161.
[15] M.C. Saure, External control of anthocyanin formation in apple, Sci.
Hortic. 42 (1990) 181–218.
[16] S.H. Kim, J.R. Lee, S.T. Hong, Y.K. Yoo, G. An, S.R. Kim, Molecular
cloning and analysis of anthocyanin biosynthesis genes preferentially
expressed in apple skin, Plant Sci. 165 (2003) 403–413.
[17] C.E. Lister, J.E. Lancaster, J.R.L. Walker, Developmental changes in
enzymes of flavonoid biosynthesis in the skins of red and green apple
cultivars, J. Sci. Food Agric. 71 (1996) 313–320.
[18] C. Honda, N. Kotoda, M. Wada, S. Kondo, S. Kobayashi, J. Soejima, Z.L.
Zhang, T. Tsuda, T. Moriguchi, Anthocyanin biosynthetic genes are
coordinately expressed during red coloration in apple skin, Plant Physiol.
Biochem. 40 (2002) 955–962.
[19] S. Kondo, M. Maeda, S. Kobayashi, C. Honda, Expression of anthocyanin
biosynthetic genes in Malus sylvestris L. ’Mutsu’ non-red apples, J.
Hortic. Sci. Biotech. 77 (2002) 718–723.
[20] C. Wan, T.A. Wilkins, A modified hot borate method significantly
enhances the yield of high quality RNA from Cotton (Gossypium hirsutum
L.), Anal. Biochem. 223 (1994) 7–12.
[21] M.R. Thomas, S. Matsumoto, P. Cain, N.S. Scott, Repetitive DNA of
grapevine – classes present and sequences suitable for cultivar identifica-
tion, Theor. Appl. Genet. 86 (1993) 173–180.
A.M. Takos et al. / Plant Science 170 (2006) 487–499 499
[22] S. Singha, T.A. Baugher, E.C. Townsend, M.C. D’Souza, Anthocyanin
distribution in ‘Delicious’ apples and the relationship between anthocya-
nin concentration and chromaticity values, J. Am. Soc. Hortic. Sci. 116
(1991) 497–499.
[23] M.O. Downey, J.S. Harvey, M.P. Robinson, Analysis of tannins in seeds
and skins of Shiraz grapes throughout berry development, Aust. J. Grape
Wine R. 9 (2003) 15–27.
[24] J.A. Kennedy, G.P. Jones, Analysis of proanthocyanidin cleavage products
following acid-catalysis in the presence of excess phloroglucinol, J. Agric.
Food Chem. 49 (2001) 1740–1746.
[25] C.A. Bottoms, P.E. Smith, J.J. Tanner, A structurally conserved water
molecule in Rossmann dinucleotide-binding domains, Protein Sci. 11
(2002) 2125–2137.
[26] D.-Y. Xie, S.B. Sharma, R.A. Dixon, Anthocyanin reductases from
Medicago truncatula and Arabidopsis thaliana, Arch. Biochem. Biophys.
422 (2004) 91–102.
[27] A. Bas, G. Forsberg, S. Hammarstrom, M.-L. Hammarstrom, Utility of
the housekeeping genes 18S rRNA, b-actin and glyceraldehyde-3-
phosphate-dehydrogenase for normalization in Real Time quantitative
Reverse Transcriptase – Polymerase Chain Reaction analysis of gene
expression in human T lymphocytes, Scand. J. Immunol. 59 (2004)
566–573.
[28] S. Kondo, K. Hiraoka, S. Kobayashi, C. Honda, N. Terahara, Changes in
the expression of anthocyanin biosynthetic genes during apple develop-
ment, J. Am. Soc. Hortic. Sci. 127 (2002) 971–976.
[29] O. Arakawa, Photoregulation of anthocyanin synthesis in apple fruit under
UV-B and red-light, Plant Cell Physiol. 29 (1988) 1385–1389.
[30] S. Schlavo, W.C. Yang, N.H.L. Chiu, I.S. Krull, Comparison of fluoro-
metric detection methods for quantitative polymerase chain reaction
(PCR), J. Immunoass. Immunoch. 26 (2005) 1–12.
[31] Z.H. Li, S. Sugaya, H. Gemma, S. Iwahori, Flavonoid biosynthesis and
accumulation and related enzyme activities in the skin of ‘Fuji’ and
‘Oorin’ apples during their development, J. Jpn. Soc. Hortic. Sci. 71
(2002) 317–321.
[32] I.O. Vvedenskaya, N. Vorsa, Flavonoid composition over fruit develop-
ment and maturation in American cranberry, Vaccinium macrocarpon Ait,
Plant Sci. 167 (2004) 1043–1054.
[33] L. Jaakola, K. Maatta, A.M. Pirttila, R. Torronen, S. Karenlampi, A.
Hohtola, Expression of genes involved in anthocyanin biosynthesis in
relation to anthocyanin, proanthocyanidin, and flavonol levels during
bilberry fruit development, Plant Physiol. 130 (2002) 729–739.
[34] S. Albert, M. Delseny, M. Devic, BANYULS, a novel negative regulator of
flavonoid biosynthesis in the Arabidopsis seed coat, Plant J. 11 (1997)
289–299.
[35] C.E. Lister, J.E. Lancaster, K.H. Sutton, J.R.L. Walker, Aglycone and
glycoside specificity of apple skin flavonoid glycosyltransferase, J. Agric.
Food Chem. 75 (2004) 378–382.
[36] S. Abrahams, G.J. Tanner, P.J. Larkin, A.R. Ashton, Identification and
biochemical characterisation of mutants in the proanthocyanidin pathway
in Arabidopsis, Plant Physiol. 130 (2002) 561–576.
[37] U. Mayr, D. Treutter, C. Santos-Buelga, H. Bauer, W. Feucht, Develop-
mental changes in the phenol concentrations of ‘Golden Delicious’ apple
fruits and leaves, Phytochemistry 38 (1995) 1151–1155.
[38] M.A. Awad, A. de Jager, L.H.W. van der Plas, A.R. van der Krol,
Flavonoid and chlorogenic acid changes in skin of ‘Elstar’ and ‘Jonagold’
apples during development and ripening, Sci. Hortic. 90 (2001) 69–83.
[39] R.F. Reay, J.E. Lancaster, Accumulation of anthocyanins and quercetin
glycosides in ‘Gala’ and ‘Royal Gala’ apple fruit skin with UV-B-visible
irradiation: modifying effects of fruit maturity, fruit side, and temperature,
Sci. Hortic. 90 (2001) 57–68.
[40] G. Ben-Yehudah, R. Korchinsky, G. Redel, R. Ovadya, M. Oren-Shamir,
Y. Cohen, Colour accumulation patterns and the anthocyanin biosynthetic
pathway in ‘Red Delicious’ apple variants, J. Hortic. Sci. Biotech. 80
(2005) 187–192.
[41] K.M. Davies, K.E. Schwinn, S.C. Deroles, D.G. Manson, D.H. Lewis, S.J.
Bloor, J.M. Bradley, Enhancing anthocyanin production by altering
competition for substrate between flavonol synthase and dihydroflavonol
4-reductase, Euphytica 131 (2003) 259–268.
[42] T. Tsuda, M. Yamaguchi, C. Honda, T. Moriguchi, Expression of antho-
cyanin biosynthesis genes in the skin of peach and nectarine fruit, J. Am.
Soc. Hortic. Sci. 129 (2004) 857–862.
[43] P.K. Boss, C. Davies, S.P. Robinson, Analysis of the expression of
anthocyanin pathway genes in developing Vitis vinifera L cv Shiraz grape
berries and the implications for pathway regulation, Plant Physiol. 111
(1996) 1059–1066.
[44] Y.J. Li, R. Sakiyama, H. Maruyama, S. Kawabata, Regulation of antho-
cyanin biosynthesis during fruit development in ‘Nyoho’ strawberry, J.
Jpn. Soc. Hortic. Sci. 70 (2001) 28–32.
Copyright © 2022 FDOKUMEN