Computational methods for predicting protein-protein interactions
27
1 Computational Methods For Predicting Protein-Protein Interactions Sylvain Pitre 1 , Md Alamgir 2 , James R. Green 3 , Michel Dumontier 1,2 , Frank Dehne 1 , Ashkan Golshani 2* 1 School of Computer Science, 5304 Herzberg Building, 1125 Colonel By Drive, Carleton University, Ottawa, Ontario, Canada, K1S 5B6. 2 Department of Biology and Ottawa Institute of System Biology, 209 Nesbitt Building , Carleton University, 1125 Colonel By Drive, Ottawa, Ontario, Canada, K1S 5B6. 3 Department of Systems and Computer Engineering, 4456 Mackenzie Building, 1125 Colonel By Drive, Carleton University, Ottawa, Ontario, Canada, K1S 5B6. * corresponding author Sylvain Pitre: [email protected] Md Alamgir: [email protected] James R. Green: [email protected] Michel Dumontier: [email protected] Frank Dehne: [email protected] Ashkan Golshani: [email protected] To appear in: Advances in Biochemical Engineering/Biotechnology, H. Seitz (Ed), Springer, in press. (Review)
-
Upload
independent -
Category
Documents
-
view
1 -
download
0
Transcript of Computational methods for predicting protein-protein interactions

1
Computational Methods For Predicting Protein-Protein Interactions
Sylvain Pitre 1, Md Alamgir 2, James R. Green 3, Michel Dumontier 1,2, Frank
Dehne 1, Ashkan Golshani 2*
1School of Computer Science, 5304 Herzberg Building, 1125 Colonel By Drive, Carleton University, Ottawa, Ontario, Canada, K1S 5B6.
2Department of Biology and Ottawa Institute of System Biology, 209 Nesbitt Building , Carleton University, 1125 Colonel By Drive, Ottawa, Ontario, Canada, K1S 5B6.
3Department of Systems and Computer Engineering, 4456 Mackenzie Building, 1125 Colonel By Drive, Carleton University, Ottawa, Ontario, Canada, K1S 5B6.
* corresponding author
Sylvain Pitre: [email protected] Md Alamgir: [email protected] James R. Green: [email protected] Michel Dumontier: [email protected] Frank Dehne: [email protected] Ashkan Golshani: [email protected]
To appear in:
Advances in Biochemical Engineering/Biotechnology, H. Seitz (Ed), Springer,
in press. (Review)
2
Abstract Protein-protein interactions (PPIs) play a critical role in many cellular functions. A
number of experimental techniques have been applied to discover PPIs, however these techniques
are expensive in terms of time, money and expertise. There are also large discrepancies between
the PPI data collected by the same or different such techniques in the same organism. We therefore
turn to computational techniques for the prediction of PPIs. Computational techniques have been
applied to the collection, indexing, validation, analysis, and extrapolation of PPI data. This chapter
will focus on computational prediction of PPI, reviewing a number of techniques including PIPE,
developed in our own lab. For comparison the conventional large-scale approaches to predict PPIs
are also briefly discussed. The chapter concludes with a discussion of the limitations of both
experimental and computational methods of determining PPIs.
Keywords Protein-protein interaction, computational techniques, automated
tools, interactome, PIPE
Table of Contents
1 Introduction
2 Traditional Methods of Determining PPIs
3 Computational Prediction of PPIs
3.1 Genomic Methods
3.2 Evolutionary Relationship
3.3 Protein Structure
3.4 Domain Based
3.5 Primary Protein Structure
4 Validation of experimentally determined interactomes
5 Strengths, Weaknesses and Challenges of Computational PPI Predictions
6 Future Work
7 Conclusions
References
Abbreviations
AD, Activation domain;
BIND, The Biomolecular Interaction Network Database;
DBD, DNA Binding Domain;
DBID, Database of interacting domains;
DIP, Database of Interacting Proteins
3
InterPreTS, Interaction Prediction through Tertiary Structure;
MIPS, the Munich Information center for Protein Sequences;
PDB, Protein Data Bank;
PID, Potentially interacting domain pairs;
PIPE, Protein-Protein Interaction Prediction Engine;
PPI, Protein-Protein Interaction;
PRISM, Protein Interactions by Structural Matching;
SVM, Support Vector Machine;
TAP, Tandem affinity purification;
Y2H, Yeast Two Hybrid;
1 Introduction
An overwhelming number of biological processes are mediated through the action
of proteins. In many cases, these proteins carry out their functions by interacting
with each other in either stable or transient protein complexes. The nature and
increasing complexity of these interactions is thought to be responsible for the
overall biological complexity in higher organisms. Therefore, it is believed that
humans for example, are more sophisticated than the nematode C. elegans, not
only because we possess marginally greater number of genes, but largely because
human proteins form more intricate networks [1, 2]. Recent advances in the field
of genomics and proteomics have lead to the discovery and characterization of
some of these networks [3, 4]. An organism may have numerous interactomes
representing different tissue types, biological states, etc. The complete elucidation
of all interaction networks found in an organism will have significant implications
for science [5]. For example, the cellular roles and molecular functions for
previously ill-characterized proteins may be inferred from the networks of
interactions that they participate in. Moreover, the conservation of protein
interactomes across organisms will also provide insight into their evolutionary
relationships. Practically, knowledge of interaction networks will provide insight
as to their dependencies and lead to enhanced approaches for drug discovery. For
these reasons, the elucidation of protein-protein interactions (PPIs) especially

4
within the context of an interaction network is an important goal in biological
research [6, 7].
Until recently, protein-protein interactions were determined by carrying
out experiments that were specifically designed to identify a small number of
specifically targeted interactions. However, the development of novel genomic
techniques allow for high throughput experiments which can now be carried out to
exhaustively probe all possible interactions within an entire genome.
Saccharomyces cerevisiae, also known as baker’s yeast, has emerged as the model
organism of choice for functional proteomics due to the elucidation of its genomic
sequence in 1996 [8]. Since then, whole protein-protein interaction maps have
been determined using various methods including Yeast two-hybrid [9, 10],
affinity purification/mass spectrometric identification methods such as TAP-
tagging [11, 12] and protein chips [13, 14]. Indirect large-scale approaches such
as synthetic lethal analysis [15] and correlated mRNA expression profile [16]
have also been used to investigate PPIs.
However, these methods are not without shortcomings. Not only are they
labour and time intensive, they also have a high cost associated with them.
Another important disadvantage is the poor accuracy of data generated.
Significant discrepancies between results of small-scale high-confidence
experiments and high-throughput studies have been reported [6, 17]. Inter-study
discrepancy is even higher when comparing data generated from different large-
scale studies [6, 17]. In addition, the PPI data obtained from biological
experiments often include many false positives which may connect proteins that
are not necessarily related. Therefore, it is often necessary to confirm the
interactions by other methods. Consequently, there is a growing need for the
development of computational tools that are capable of effectively identifying
protein-protein interactions as well as interpreting and validating the
experimentally derived data.
A wide range of computational methods have been developed to build,
study, and exploit protein interactomes (reviewed in [6, 17]). First, computational
methods have been developed to construct interaction databases within which
experimentally determined data is collected and annotated. Automated data
mining techniques can then be applied to extract relevant information about
potential interactions from the vast amount of PPI information in these databases.

5
As mentioned earlier, a number of experimental techniques have been used to
determine large-scale protein interaction maps. Although the significant
inconsistencies between interaction maps of the same organism obtained using
different techniques can be somewhat justified [6], computational methods have
been successfully applied to assess, validate, and carefully scrutinize these
experimentally determined protein interactomes. Based on the assumption that
physically interacting proteins have a high probability of also being functionally
related, a number of computational tools have been developed to exploit protein
interaction networks in order to predict functional features of the proteins. Lastly,
computational methods can also be used to predict novel protein-protein
interactions by learning from known interactions [6, 17].
It is the objective of this chapter to provide an overview of these
computational methods, with the main focus being on computational tools for the
prediction of novel interactions. We also highlight the specific limitations for each
of the tools discussed, as well as the systematic shortcomings common to most
computational tools. A novel tool recently developed by our bioinformatics group,
PIPE, is also discussed. For comparison, the advantages and limitations of
traditional ‘wet lab’ experimental approaches are also summarized.
Finally, due to space constraints, it is impossible to include all tools
relevant to the study of PPIs and the authors apologize in advance to all those
researchers whose work has not been cited here.
2 Traditional Methods of Determining PPIs
The yeast two-hybrid (Y2H) method was one of the first methods to be applied to
the detection of protein-protein interactions. Two protein domains are required in
the Y2H assay that have specific functions: 1) a DNA binding domain (DBD) that
helps bind to DNA, and 2) an activation domain (AD) responsible for activating
transcription of DNA. Both domains are required for the transcription of a
reporter gene [10]. The Y2H assay relies on the fusion of DBD to a protein of
interest (X) at its N-terminus and the fusion of AD to another protein of interest
(Y) at the C-terminus which forms DBD-X (bait) and AD-Y (prey). If the bait and
prey hybrids interact with each other, the transcription of the reporter gene will be
induced and, in this way, the interaction can be detected [18].

6
Y2H analysis allows the direct recognition of PPI between proteins pairs.
However, a large number of false positive interactions may arise, while a number
of true interactions will be missed (i.e. false negatives). A false positive
interaction can occur by activation of RNA polymerase by a bait protein, by the
binding of the prey AD-Y protein with upstream activating sequences (UAS), by
non-specific binding of bait and prey proteins with some endogenous proteins, or
by the binding of ‘sticky’ prey proteins with bait proteins [19]. On the other hand,
many true interactions may not be detected using Y2H assay, leading to false
negative results. In a Y2H assay, the interacting proteins must be localized to the
nucleus; since membrane proteins are typically less likely to be present in the
nucleus they are unavailable to activate reporter genes, and hence are excluded.
Proteins that require post-translational modifications to carry out functions are
also unlikely to behave or interact normally in a yeast-two hybrid experiment.
Furthermore, if the proteins are not in their natural physiological environment,
they may not be folded properly to interact [20]. During the last decade, Y2H has
been improved by designing new yeast strains containing multiple reporter genes
and new expression vectors to facilitate the transformation of yeast cells with
hybrid proteins [21].
Tandem affinity purification (TAP) tagging was developed to study
protein-protein interactions under the native conditions of the cell [22]. Gavin et
al. first attempted the TAP tag method in a high throughput manner to analyze the
yeast interactome [23]. This method is based on the double tagging of the protein
of interest on its chromosomal locus followed by a two-step purification
procedure using Staphylococcus protein A and calmodulin beads separated by a
tobacco etch virus (TEV) protease cleavage site. First, a target protein open
reading frame (ORF) is fused with the DNA sequences encoding the TAP tag and
is expressed in yeast where it can form native complexes with other proteins. The
tagged protein along with its associated proteins/complexes is then extracted from
the cell lysate. The fused protein and the associated complexes are then purified
via a two-step affinity purification procedure. Proteins that remain associated with
the target protein can then be analyzed and identified through SDS-PAGE [24]
followed by mass spectrometry analysis [22] thereby identifying the PPI partner
proteins of the original protein of interest.

7
An important advantage of TAP-tagging is its ability to identify a wide
variety of protein complexes and to test the activity of monomeric or multimeric
protein complexes that exist in vivo. Compared to yeast two-hybrid, TAP-tagging
obtains interaction information from a more natural environment since the
physiological conditions are more realistic than those created by yeast two-hybrid
including factors like post-translational modifications and pH requirements.
However, the TAP tag may interfere with the formation of some protein
complexes (as shown by [23]) by low expression of fusion proteins [25] which
can affect the ability for a protein to interact with other proteins or may cause a
mutant phenotype [26]. These problems may be minimized by using other
complementary techniques which can increase the reproducibility of any large-
scale approaches.
The large quantity of experimental PPI data being generated on a continual
basis necessitates the construction of computer-readable biological databases in
order to organize and effectively disseminate this data. A number of such
databases exist and are growing at exponential rates. The Biomolecular Interaction
Network Database (BIND), for example, is built on an extensible specification
system that permits detailed description of the manner in which the PPI data was
derived experimentally, often including links directly to the supporting evidence
from the literature [27]. The Database of Interacting Proteins (DIP) is another
database of experimentally determined protein-protein binary interactions [28].
DIP serves as an access point to a number of other related databases such as
LiveDIP, which provides information on the functional aspects of protein
complexes as well as links out to other databases such as the Database of Ligand-
Receptor Partners (DLRP). The General Repository of Interaction Datasets
(BioGRID) is a database that contains protein and genetic interactions among
proteins from 13 species [29]. Interactions are regularly added through exhaustive
curation of the primary literature. Interaction data is extracted from other
databases including BIND and MIPS, the Munich Information center for Protein
Sequences [30], as well as directly from large-scale experiments [31]. The
Molecular Interaction database (MINT) is another database of experimentally-
derived PPI data extracted from the literature, with the added feature of providing
the weight of evidence for each interaction [31].

8
Table 1
3 Computational Prediction of PPIs
Computational methods provide a complementary approach to detecting
protein-protein interactions. Indeed, the wide availability of experimental data has
spurned the development of numerous computational methods over the past few
years. In general, all computational approaches to PPI prediction attempt to
leverage knowledge of experimentally-determined previously known interactions,
in order to predict new PPIs. These methods enable one to discover novel putative
interactions and often provide information for designing new experiments for
specific protein sets.
These approaches can be classified into five general categories: methods
based on genomic information, evolutionary relationships, three dimensional
protein structure, protein domains, and primary protein structure. Specific
approaches that fall within these categories are listed in Table 2 and are discussed
below. Figure 1 presents the idea behind the five categories of methods.
Table 2
Fig. 1 (Figure1.tif)
3.1 Genomic methods
Genomic methods for interaction prediction take advantage of the availability of
information obtained by complete genome sequencing. Completely sequenced
genomes provide knowledge of which genes are present and how they are
organized (gene order). The conservation of gene order across species yields
information about the evolution of the genome, and hints at which genes may be
functionally correlated. Most computational methods that use genomic
information do not rely solely on the sequence similarity between homologous

9
genes (or their products) [53, 54], but rather assess functional links between pairs
or clusters of co-located genes.
Evidence for the evolutionary conservation of gene order can be obtained
by systematic comparison of completely sequenced genomes. Dandekhar et al
[32] compared nine bacterial and archaeal genomes and applied a method based
on co-localization to determine conserved gene pairs even within relatively low
conservation of gene-order. They found that proteins encoded by conserved gene
pairs also appeared to interact physically. Physical interactions between encoded
proteins had been demonstrated for at least 75% of the conserved gene pairs. A
further 20% of the conserved pairs were predicted to encode proteins that interact
physically [32]. While promising, the approach fails to identify interactions
between products of distantly located genes. Moreover, false predictions are
generated because the proximity constraint is not sufficient to determine physical
interaction. Finally, this approach may not be applicable to eukaryotes, because
the co-regulation of genes is not imposed at the genome structure level [33].
The co-localization of genes encoding interacting or functionally related
gene products can be taken a step further. Pairs of interacting or functionally
related proteins sometimes have homologs in another genome in which they are
fused into a single protein [55]. For example, the Gyr A and Gyr B subunits of
Escherichia coli DNA gyrase are fused as a single protein in yeast topoisomerase
II [33]. Thus, the sequence similarities between Gyr A and Gyr B and different
segments of the topoisomerase II might be used to predict that Gyr A and Gyr B
may interact in Escherichia coli [33]. Marcotte et al developed a computational
method to search for such fusion events within multiple genomes. In their study,
they uncovered 45,502 such putative protein-protein interactions in yeast. Some
proteins that were found to be linked to several other proteins also appeared to
interact functionally in pathways. Many of these putative interactions were also
confirmed experimentally as documented in the DIP database.
Similarly, Enright et al identified 215 genes involved in 64 unique fusion
events across Escherichia coli, Haemophilus infuenzae and Methanococcus
jannaschii [34]. This gene-fusion analysis approach has since been incorporated
into a computational algorithm for the prediction of PPIs and protein function
[55].
10
3.2 Evolutionary Relationship
Evolutionary relationships between two proteins can also be used to infer a
physical and functional relationship. The phylogenetic profile of a protein
describes the presence of homologs across a series of organisms. Proteins that
exhibit similar profiles may be functionally linked. For instance, proteins that
make up multimeric structural complexes or that participate in a given
biochemical pathway typically exhibit similar phylogenetic profiles. Pellegrini et
al applied phylogenetic profiling to predict the function of previously
uncharacterized proteins [35]. The comparison of profiles is further enhanced by
including evolutionary information. Vert showed that the accuracy of function
prediction using a Support Vector Machine (SVM) is improved with the use of
evolutionarily enhanced phylogenetic profiles [36]. A comparative genome
phylogenetic analysis approach has also lead to prediction of hundreds of pairs of
interactions in E. coli, and thousands in yeast [37]
3.3 Protein Structure
As the number of experimentally solved protein structures continues to
increase, three-dimensional (3D) structure information has become increasingly
applied to the prediction of physical binding [40, 56]. By considering homologous
proteins, it has been shown that close homologs (>30% sequence identity)
physically interact in the same or similar way [56]. Aloy and Russell describe
such a 3D-based method to model putative interactions [56]. The method assesses
the fit of two potential interacting partners on a complex of known 3D structure
and infers molecular details of how the interaction is likely to occur. In general, it
has been shown that residues located at the interface tend to be structurally
conserved [38]. Residues that make atomic contacts in a crystallographic complex
are analyzed. An interaction is conserved as long as the contacting resides is also
conserved. Homologues of both interacting proteins are then examined to see
whether these interactions are preserved. All possible pairs between two protein
families can then be modeled and the most likely interactions determined. The
method also provides a means of assessing the compatibility of a proposed
protein–protein interaction within such a complex as well as for ranking
interacting pairs in studies that involve protein families that show different

11
interaction specificities. The method can be used to model a complex based on the
known structure of a similar template complex, and to correctly predict
interactions within several systems [56]. Aloy et al successfully demonstrated
how 3D structures can be used to query entire interaction networks so as to
validate and infer the molecular details of interactions that have been predicted
using other methods. InterPreTS (Interaction Prediction through Tertiary
Structure) is a web-based version of the above method [39]. Homologs of a test
pair of protein sequence are identified from a database of interacting domains
(DBID) of known three-dimensional complex structures. The sequences are then
scored for how well they preserve sites of contacts at the interaction interface
[39]. InterPreTS allows one to visualize the molecular details of any predicted
interaction. Combining domain structural similarities and conserved sequence
patches among interacting proteins has also led to improved methods for
interaction prediction [43].
Lu et al report a multimeric threading approach to identifying interaction
partners and to assign quaternary structures of proteins found in the yeast DIP
database [40]. This multimeric threading algorithm, MULTIPROSPECTOR, is
able to recognize partners involved in protein interactions and correctly predict a
significant number of interacting yeast proteins pairs which have already been
identified in the DIP database. The method correctly recognized and assigned 36
of 40 homodimers, 15 of 15 heterodimers, and 65 of 69 monomers that were
scanned against a protein library of 2478 structures obtained from the Protein
Data Bank [57].
The reported prediction accuracy of current methods often varies
substantially, and recent efforts have been made to address this issue. CAPRI is a
community wide experiment that aims to fairly evaluate the state of the art in
protein-protein docking procedures by making predictions on a set of interacting
proteins for which the solution has not yet been published [41]. Models are
compared to high quality crystallographic interaction data by independent CAPRI
assessors. During the course of these experiments, it was found that models
exhibiting a high degree of native intermolecular contacts were generally good
indicators of true protein-protein interactions.
PRISM (Protein Interactions by Structural Matching) searches a dataset of
protein structures for potential interaction partners by comparing protein structure

12
pairs with a dataset of interfaces [42]. This interface dataset is a structurally and
evolutionarily representative subset of biological and crystal interactions present
in the Protein Data Bank (PDB). The algorithm calculates the similarity between
interfaces by first obtaining structural surface alignments. This measures
structural similarity of a target structure to a binding site. If two target proteins
surfaces contain similar regions to complementary partner chains it may be
inferred that those target proteins interact through similar regions. The PRISM
web server allows users to explore protein interfaces as well as predictions of
protein-protein interactions. One can search a variety of stored interfaces
categorized by functional clusters or structural similarity. For example, users can
search for proteins involved in cell metabolism, while restricting the results to
interfaces of certain sizes. PRISM’s interactive visualization tool shows the 3D
model along with the desired features. One can also submit protein structures (in
PDB format) for interaction prediction. Note that this method is only applicable to
proteins with known structure.
3.4 Domain Based
There are a number of computational techniques that are based solely on the
conservation of protein domains. For example, a method developed by Deng et al,
employs maximum likelihood estimation to infer interacting domains that are
consistent with the observed protein-protein interactions [44]. Using
evolutionarily conserved domains defined in the PFAM protein-domain database
[58], the probabilities of interactions between every pair of domains are estimated.
These inferred domain-domain interactions are subsequently used to predict
interactions between proteins. Han et al, provide a similar computational tool
which not only predicts the PPIs, but also provides the interaction probability of
input proteins and ranks the possibilities of interaction between multiple protein
pairs [45, 46]. Another prediction algorithm called PreSPI and based on conserved
domain-domain interactions was also described by Han et al [45] in which a
domain combination based protein–protein interaction probabilistic framework is
used to interpret protein–protein interactions as the result of interactions of
multiple domain pairs or of groups. This tool is able to predict the interaction
probability of proteins and also provides an interaction possibility ranking method

13
for multiple protein pairs which can be used to determine which protein pairs are
most likely to interact with each other in multiple protein pairs. A high sensitivity
of 77% and specificity 95% were obtained for the test groups containing common
domains when tested using an interacting set of protein pairs found in the yeast
DIP database. Correlations were observed between the interacting probability and
the accuracy of the prediction making the output probability a useful indicator of
prediction confidence. This method was also somewhat successful when tested on
an artificially made random pairing of proteins used as a negative test set of non-
interacting protein pairs. This method is particularly advantageous because it also
allows for mass prediction of whole protein interactions which in turn makes it
possible to construct entire protein interaction networks.
Finally, Kim et al have developed a database for potentially interacting
domain pairs (PID) refined from the DIP database of interacting proteins by
making use of InterPro, an integrated database of protein families, domains, and
functional sites. A statistical scoring system, "PID matrix score" was developed as
a reliability index for accurate functional analysis of interaction networks and a
measure of the interaction probability between domains. This method combines
various kinds of information such as sequences, interacting regions and domains
of both interacting partners [47]. In order to evaluate predictive power of the PID
matrix, cross validation was performed with subsets of DIP data (positive
datasets) and randomly generated protein pairs from TrEMBL/SwissProt database
(negative datasets). The prediction system resulted in approximately 50%
sensitivity and more than 98% specificity [47]. The result also showed that
mapping of the genome-wide interaction network can be achieved by using the
PID matrix.
3.5 Primary Protein Structure
Primary protein structure approaches are predicated on the hypothesis that
protein-protein interactions may be mediated through a specific number of short
polypeptide sequences. These sequences do not span whole domains but are found
repeatedly within the proteins of the cell. Support Vector Machine based learning
methods have shown that the primary sequence of an amino acid chain can
effectively identify protein-protein interactions [49, 50].

14
An approach by Spriznak et al, integrates the predictions obtained from
different computational approaches together with experimental data, so as to
provide functional assignments [48]. It was reported that characteristic pairs of
sequence-signatures can be learned from a database of experimentally determined
interacting proteins, where one protein contains the first sequence-signature and
its interacting partner contains the other sequence-signature. The sequence
signatures that appear together in interacting protein pairs are termed correlated
sequence-signatures. This analysis is applied to a database of experimentally
identified interacting protein pairs in yeast, from which distinct over-represented
sequence-signature pairs were identified. Although not every protein with the one
signature is expected to interact with every protein with the other signature, this
approach can be used to direct and narrow down experimental interaction screens
[48].
Another approach is based on the ability of an SVM learning system to
automatically recognize correlated patterns of sequence and substructure in the
interacting pairs of proteins found in the DIP database. These patterns typically
comprise a small number of functional residues in each protein. This
computational tool, developed by Bock and Gough, is based on primary structure
information as well as associated physicochemical properties such as charge,
hydrophobicity and surface tension. Reported prediction accuracy was 80%, but
the test set size was very small (5 previously characterized interactions) [49].
Martin et al describe an algorithm for PPI prediction [50] that follows the
approach of Bock and Gough by combining sequence information and
experimental data analysis, while extending the concept of sequence signatures
from Sprinzak et al by using subsequence pairing. Information from experimental
data, sequence analysis, and local descriptions of protein pairs, which are more
representative of the actual biology of protein–protein interaction, are combined
to generate a novel and even more general descriptor called a signature product.
The signature product is then implemented within a support vector machine
classifier as a kernel function [50]. This method was applied to publicly available
yeast datasets among others. The yeast and H.pylori datasets used to verify the
predictive ability of the method yielded accuracies of 70 to 80% using 10-fold
cross-validation. The human and mouse datasets were also used to demonstrate
that the method is capable of cross-species prediction. This method is

15
advantageous over that of Bock and Gough because it uses only experimental and
sequence information, and does not require physio-chemical information. In
addition, this approach, unlike that of Sprinzak et al, does not require prior
knowledge of domains.
Ben-Hur and Noble [51] also make use of SVMs to predict PPIs, but introduce a
novel pair-wise kernel that measures the similarity between two pairs of proteins.
SVMs and kernel methods have the ability to integrate different types of
information through the kernel function. Here kernels make use of a combination
of data including protein sequence, homologous interactions, GO annotations.
Ben-Hur and Noble explore a number of different kernel functions using yeast PPI
data from the BIND database. At a false positive rate of approximately 1%, the
sensitivity was 80%. Future directions may include data incorporation from gene
expression studies and transcription factor binding data that have been useful in
predicting protein-protein interactions.
A recent paper by Shen et al [59] presents another method based on a
SVM with a kernel function using only sequence information to predict PPI in
human. The authors report an average prediction accuracy of 83.90%.
Finally, a method developed in our own lab called PIPE (Protein-Protein
Interaction Prediction Engine) is able to predict with high confidence PPIs for any
target pair of yeast proteins given only knowledge of their primary structure data
[52]. Like other PPI prediction methods, PIPE relies on previously acquired
experimentally-derived PPI data and extrapolates this information to predict novel
PPIs. This engine compiled the dataset of 15,118 PPI pairs of S. cerevisiae from
the DIP [28] and MIPS [30] databases. PIPE predicts the probability of interaction
between two proteins by measuring how often pairs of subsequences in two query
proteins A and B are observed to co-occur in pairs of protein sequences known to
interact (see Figure 2). PIPE showed an overall accuracy of 75%, a success rate
that is on par with other commonly used biochemical techniques. PIPE analysis
also has other applications in that it can be used to study the internal architecture
of yeast protein complexes [52].
Fig. 2 (Figure2.tif)

16
To validate the predictive accuracy obtained from PIPE, previously
published positive and negative validation datasets were tested. Over a positive
database of 100 known protein pairs PIPE displayed a sensitivity of 61% and a
false negative rate of 39% [52] in predicting yeast PPIs. On the other hand,
comparing the data obtained from PIPE with the negative validation dataset
helped to verify the false positives rate for PPI. It was found that PIPE falsely
detected only 11% non-interacting proteins pairs as interacting pairs. This
indicates an 11% false positives rate and 89% specificity rate [52] for the
detection of PPI in yeast. Overall, PIPE has the accuracy of 75% [52] and lower
false positive and negative rate than TAP tag and Y2H analysis [60].
PIPE also has the ability to identify interacting sites within the sequence of
the interacting protein pairs. For example, PIPE also identified a previously
reported interaction sites between the first 75 amino acid residues of YCR084C
and the N terminal region of YBR112C. Figure 3 illustrates that PIPE has
identified that amino acid region 350-410 of protein YNL243W may interact with
the amino acid region 100-250 of protein YBL007C, with a score of 40.
Fig. 3 (Figure3.tif)
PIPE has been employed to identify and validate a novel PPI between
YGL227W and YMR135C. Although yeast gene deletion studies indicated that
both YGL227W and YMR135C may be involved in the catabolism of fructose-
1,6-bisphosphatase (FBPase) [61], little else is known about them. Following a
PIPE prediction that these two proteins may interact, dual TAP-tagging
experiments performed in our lab identified both of these proteins in co-
purification complexes. Moreover, the YGL227W TAP-tagged protein was co-
purified with six other proteins in what we termed the vid30 complex. While
TAP-tagging does not determine the internal architecture of this complex, PIPE
was able to analyze systematically each of the 21 possible PPI to predict the
internal architecture of the vid30 complex. PIPE found four proteins formed the
core of the complex, whereas three other proteins only interact with YGL227W
and YIL017C, but not with each other.
Since the original release [52] we have strived to improve the performance
and accuracy of PIPE in order to scan the entire yeast genome. In our most recent

17
work (to be published), we improve the speed of PIPE over 16,000 fold and
increased specificity (~99.9%) at the expense of a lower sensitivity (~15%).
These, improvements, together with the use of a high performance cluster
computer, allowed us to do an all-to-all examination of the entire yeast genome
(6,304 proteins, 19,867,056 possible pairs) in order to detect novel PPIs. Our
improved method detected a total of 29,589 interactions of which 14,438 were not
previously reported in any large-scale database.
4 Validation of Experimentally Determined Interactomes
Reports show that the intersections between various interaction maps obtained
using different methods are very small. A comparison study carried out by Aloy
and Russell, 2002, showed a low level of overlap among two-hybrid, affinity
purification, mass spectrometry, and bioinformatics methods [6, 17]. One such
measure for the validation of computational methods is the “interaction
generality” measure (IG1) [62]. IG1 is the number of proteins involved in a given
interaction or the number of proteins that directly interact with the target protein
pair. This measure is based on the assumption that interactions observed in a
complicated interaction network are likely to be true positives while interacting
proteins that appear to have many other interacting partners which have no further
interactions are likely to be false positives. Interactions with low generalities were
more likely to be reproducible in other independent assays and these protein pairs
are likely to be co-expressed and are therefore physically related. In [62], the
authors were able to refine the existing networks as determined by Uetz et al and
Ito et al.. Saito et al, also developed a new ‘interaction generality’ measure (IG2)
that considered the topological properties of the protein interaction network
beyond the target pair of proteins. IG2 was found to assess the reliability of
putative protein–protein interactions with higher accuracy [62].
Another measure used to determine the reliability of an interaction
between two proteins is the correlation of their mRNA expression levels. This is
then used to determine an Expression Profile Reliability Index (EPR) which
monitors the fraction of interacting proteins [63]. A Paralogous Verification
Method was also developed in which paralogous interacting proteins are searched

18
in the DIP database and counted. The reliability of their interaction is then
determined on the basis of this count [63].
5 Strengths, Weaknesses, and Challenges of Computational PPI Predictions
Researchers have embraced the use of computational methods in the elucidation
of protein-protein interactions. Computational PPI prediction methods are an
invaluable source of information that complement labour-intensive experimental
approaches such as yeast two-hybrid and TAP-tagging. However, the high-
throughput nature of bioinformatics tools should require that computational
predictions be deemed reliable only after proper scrutiny. Appropriate measures to
evaluate the significance of the interactions should be developed to minimize the
number of results that give false positives and negatives. While it is often difficult
to differentiate between novel interactions and false positives, additional
contextual clues including function, expression and localization should be brought
into consideration. As computational methods are based directly or indirectly on
experimentally obtained data, the inaccuracies in the original data will likely be
propagated into the predictions.
Several other factors contribute to the challenges that face computational
PPI predictions. False positives are prevalent in most computational methods, but
we can easily find an explanation. The model organism used for testing in many
methods, yeast, contains roughly 6300 proteins [64] which yields approximately
~19M possible pairs. Even with a false positive rate as low as 1%, we would
anticipate 190,000 falsely predicted interactions. It has been estimated that, in
actuality, there are anywhere between 10,000 to 30,000 interactions in yeast [64-
70]. Recent large-scale studies contain data sets of size closer to the bottom end of
that range (7123 in Krogan et al [71]). We can therefore see that the positive
interactions are vastly outnumbered by the number of negative interactions. Even
if we assume there are 30,000 possible interactions there is still more than a 600 to
1 ratio of negative to positive interactions (~0.158%). Therefore it is extremely
difficult to recognize the true positive predictions among the overwhelming
background of false positive predictions.
19
The lack of reliable gold standards makes the assessment of prediction
accuracy by the various tools somewhat arbitrary. The establishment of a gold
standard is essential to measure the progress in the field and will also serve as
training material for the next generation of prediction methodologies. Strong gold
standard data sets need to be constructed from multiple lines of evidence,
including structure where possible, and made freely available.
Recent developments in computational interaction prediction have opened
the door to predicting entire interactomes for a variety of organisms. For the most
sophisticated approaches, this objective is very computationally expensive and
time consuming. However, algorithmic optimizations and continued
improvements in hardware performance will help overcome these challenges.
6 Future Work
It is expected that the number of computational tools to predict novel PPIs will
continue to grow for at least another decade. The increasing prediction accuracy
of such tools makes them even more useful for the validation and analysis of
diverse interactomes. The growing availability of high quality system biology data
may provide the basis for even higher prediction accuracy for such methods. For
example, regardless of the hypotheses from which computational tools are
originated, increasing availability of three-dimensional structures of proteins and
protein complexes should provide a highly improved starting dataset, which in
turn can increase the accuracy of future tools to predict novel PPIs.
One possible direction for development of future tools is to include
multiple categories of characteristics/approaches to predict an interaction. In fact,
some recently published tools make use of a combination of characteristics to
make their predictions [72, 73]. Other investigations may focus on the elimination
of false positives associated with computational tools. Presence of false positives
in almost all computational methods has provided a challenge for computational
biologist. This might be overcome by using vigorous filters that may consider
other information about the target interaction. Evidence for the development of
such tools can already be seen in literature where for example GO ontology is
used as a filter [74].

20
7 Conclusions
In spite of the number of challenges that are faced in the use of computational
methods, one can only expect that they will have even wider applications in the
genome-wide analysis of interactomes. The most obvious result of this will be the
enlargement of protein databases. It is also expected that the efficiency of these
methods will improve. Presently, there is an emergence of a more integrated
strategy, in which genomic, proteomic and other forms of data are incorporated
into the process of generating protein interaction maps. It appears that these
strategies will also be able to take other cellular processes such as post-
translational protein modification and protein degradation into consideration.
It is impossible to deny the invaluable insight into the organization of
living organisms that has been provided by even the simplest of protein
interaction models. As these models become more sophisticated, computational
methods will become of even more importance.
References
1. Alm E, Arkin AP (2003) Curr Opin Struct Biol 13:193
2. Claverie JM (2001) Science 291:1255
3. Lander ES, Linton LM, Birren B, Nusbaum C, Zody MC, Baldwin J, Devon K, Dewar K,
Doyle M, FitzHugh W, Funke R, Gage D, Harris K, Heaford A, Howland J, Kann L,
Lehoczky J, LeVine R, McEwan P, McKernan K, Meldrim J, Mesirov JP, Miranda C, Morris
W, Naylor J, Raymond C, Rosetti M, Santos R, Sheridan A, Sougnez C, Stange-Thomann N,
Stojanovic N, Subramanian A, Wyman D, Rogers J, Sulston J, Ainscough R, Beck S,
Bentley D, Burton J, Clee C, Carter N, Coulson A, Deadman R, Deloukas P, Dunham A,
Dunham I, Durbin R, French L, Grafham D, Gregory S, Hubbard T, Humphray S, Hunt A,
Jones M, Lloyd C, McMurray A, Matthews L, Mercer S, Milne S, Mullikin JC, Mungall A,
Plumb R, Ross M, Shownkeen R, Sims S, Waterston RH, Wilson RK, Hillier LW,
McPherson JD, Marra MA, Mardis ER, Fulton LA, Chinwalla AT, Pepin KH, Gish WR,
Chissoe SL, Wendl MC, Delehaunty KD, Miner TL, Delehaunty A, Kramer JB, Cook LL,
Fulton RS, Johnson DL, Minx PJ, Clifton SW, Hawkins T, Branscomb E, Predki P,
Richardson P, Wenning S, Slezak T, Doggett N, Cheng JF, Olsen A, Lucas S, Elkin C,
Uberbacher E, Frazier M, et al. (2001) Nature 409:860
4. Venter JC, Adams MD, Myers EW, Li PW, Mural RJ, Sutton GG, Smith HO, Yandell M,
Evans CA, Holt RA, Gocayne JD, Amanatides P, Ballew RM, Huson DH, Wortman JR,
Zhang Q, Kodira CD, Zheng XH, Chen L, Skupski M, Subramanian G, Thomas PD, Zhang
J, Gabor Miklos GL, Nelson C, Broder S, Clark AG, Nadeau J, McKusick VA, Zinder N,

21
Levine AJ, Roberts RJ, Simon M, Slayman C, Hunkapiller M, Bolanos R, Delcher A, Dew I,
Fasulo D, Flanigan M, Florea L, Halpern A, Hannenhalli S, Kravitz S, Levy S, Mobarry C,
Reinert K, Remington K, Abu-Threideh J, Beasley E, Biddick K, Bonazzi V, Brandon R,
Cargill M, Chandramouliswaran I, Charlab R, Chaturvedi K, Deng Z, Di Francesco V, Dunn
P, Eilbeck K, Evangelista C, Gabrielian AE, Gan W, Ge W, Gong F, Gu Z, Guan P, Heiman
TJ, Higgins ME, Ji RR, Ke Z, Ketchum KA, Lai Z, Lei Y, Li Z, Li J, Liang Y, Lin X, Lu F,
Merkulov GV, Milshina N, Moore HM, Naik AK, Narayan VA, Neelam B, Nusskern D,
Rusch DB, Salzberg S, Shao W, Shue B, Sun J, Wang Z, Wang A, Wang X, Wang J, Wei M,
Wides R, Xiao C, Yan C, et al. (2001) Science 291:1304
5. Price ND, Papin JA, Schilling CH, Palsson BO (2003) Trends Biotechnol 21:162
6. Franzot G, Carugo O (2003) J Struct Funct Genomics 4:245
7. Salwinski L, Eisenberg D (2003) Curr Opin Struct Biol 13:377
8. Goffeau A, Barrell BG, Bussey H, Davis RW, Dujon B, Feldmann H, Galibert F, Hoheisel
JD, Jacq C, Johnston M, Louis EJ, Mewes HW, Murakami Y, Philippsen P, Tettelin H,
Oliver SG (1996) Science 274:546
9. Uetz P, Giot L, Cagney G, Mansfield TA, Judson RS, Knight JR, Lockshon D, Narayan V,
Srinivasan M, Pochart P, Qureshi-Emili A, Li Y, Godwin B, Conover D, Kalbfleisch T,
Vijayadamodar G, Yang M, Johnston M, Fields S, Rothberg JM (2000) Nature 403:623
10. Ito T, Chiba T, Ozawa R, Yoshida M, Hattori M, Sakaki Y (2001) Proc Natl Acad Sci U S A
98: 4569
11. Ho Y, Gruhler A, Heilbut A, Bader GD, Moore L, Adams SL, Millar A, Taylor P, Bennett K,
Boutilier K, Yang L, Wolting C, Donaldson I, Schandorff S, Shewnarane J, Vo M, Taggart J,
Goudreault M, Muskat B, Alfarano C, Dewar D, Lin Z, Michalickova K, Willems AR, Sassi
H, Nielsen PA, Rasmussen KJ, Andersen JR, Johansen LE, Hansen LH, Jespersen H,
Podtelejnikov A, Nielsen E, Crawford J, Poulsen V, Sorensen BD, Matthiesen J,
Hendrickson RC, Gleeson F, Pawson T, Moran MF, Durocher D, Mann M, Hogue CW,
Figeys D, Tyers M (2002) Nature 415:180
12. Mann M, Pandey A (2001) Trends Biochem Sci 26:54
13. Zhu H, Bilgin M, Bangham R, Hall D, Casamayor A, Bertone P, Lan N, Jansen R,
Bidlingmaier S, Houfek T, Mitchell T, Miller P, Dean RA, Gerstein M, Snyder M (2001)
Science 293:2101
14. Tong AH, Drees B, Nardelli G, Bader GD, Brannetti B, Castagnoli L, Evangelista M,
Ferracuti S, Nelson B, Paoluzi S, Quondam M, Zucconi A, Hogue CW, Fields S, Boone C,
Cesareni G (2002) Science 295:321
15. Tong AH, Evangelista M, Parsons AB, Xu H, Bader GD, Page N, Robinson M,
Raghibizadeh S, Hogue CW, Bussey H, Andrews B, Tyers M, Boone C (2001) Science
294:2364
16. Ge H, Liu Z, Church GM, Vidal M (2001) Nat Genet 29:482
17. Aloy P, Russell RB (2002) Trends Biochem Sci 27:633
18. Fields S, Song O (1989) Nature 340:245
19. Stephens DJ, Banting G (2000) Traffic 1:763

22
20. Semple JI, Sanderson CM, Campbell RD (2002) Brief Funct Genomic Proteomic 1:40
21. James P, Halladay J, Craig EA (1996) Genetics 144:1425
22. Rigaut G, Shevchenko A, Rutz B, Wilm M, Mann M, Seraphin B (1999) Nat Biotechnol
17:1030
23. Gavin AC, Bosche M, Krause R, Grandi P, Marzioch M, Bauer A, Schultz J, Rick JM,
Michon AM, Cruciat CM, Remor M, Hofert C, Schelder M, Brajenovic M, Ruffner H,
Merino A, Klein K, Hudak M, Dickson D, Rudi T, Gnau V, Bauch A, Bastuck S, Huhse B,
Leutwein C, Heurtier MA, Copley RR, Edelmann A, Querfurth E, Rybin V, Drewes G,
Raida M, Bouwmeester T, Bork P, Seraphin B, Kuster B, Neubauer G, Superti-Furga G
(2002) Nature 415:141
24. Rohila JS, Chen M, Cerny R, Fromm ME (2004) Plant J 38:172
25. Rubio V, Shen Y, Saijo Y, Liu Y, Gusmaroli G, Dinesh-Kumar SP, Deng XW (2005) Plant J
41:767
26. Werler PJ, Hartsuiker E, Carr AM (2003) Gene 304:133
27. Bader GD, Donaldson I, Wolting C, Ouellette BF, Pawson T, Hogue CW (2001) Nucleic
Acids Res 29:242
28. Xenarios I, Salwinski L, Duan XJ, Higney P, Kim SM, Eisenberg D (2002) Nucleic Acids
Res 30:303
29. Stark C, Breitkreutz BJ, Reguly T, Boucher L, Breitkreutz A, Tyers M (2006) Nucleic Acids
Res 34:D535
30. Mewes HW, Frishman D, Guldener U, Mannhaupt G, Mayer K, Mokrejs M, Morgenstern B,
Munsterkotter M, Rudd S, Weil B (2002) Nucleic Acids Res 30:31
31. Chatr-aryamontri A, Ceol A, Palazzi LM, Nardelli G, Schneider MV, Castagnoli L, Cesareni
G (2007) Nucleic Acids Res 35:D572
32. Dandekar T, Snel B, Huynen M, Bork P (1998) Trends Biochem Sci 23:324
33. Marcotte EM, Pellegrini M, Ng HL, Rice DW, Yeates TO, Eisenberg D (1999) Science
285:751
34. Enright AJ, Iliopoulos I, Kyrpides NC, Ouzounis CA (1999) Nature 402:86
35. Pellegrini M, Marcotte EM, Thompson MJ, Eisenberg D, Yeates TO (1999) Proc Natl Acad
Sci U S A 96:4285
36. Vert JP (2002) Bioinformatics 18 Suppl 1:S276
37. Pazos F, Valencia A (2001) Protein Eng 14:609
38. Ma B, Elkayam T, Wolfson H, Nussinov R (2003) Proc Natl Acad Sci U S A 100:5772
39. Aloy P, Russell RB (2003) Bioinformatics 19:161
40. Lu L, Lu H, Skolnick J (2002) Proteins 49:350
41. Wodak SJ, Mendez R (2004) Curr Opin Struct Biol 14:242
42. Ogmen U, Keskin O, Aytuna AS, Nussinov R, Gursoy A (2005) Nucleic Acids Res 33:W331
43. Espadaler J, Romero-Isart O, Jackson RM, Oliva B (2005) Bioinformatics 21:3360
44. Deng M, Mehta S, Sun F, Chen T (2002) Genome Res 12:1540
45. Han DS, Kim HS, Jang WH, Lee SD, Suh JK (2004) Nucleic Acids Res 32:6312
46. Han DS, Kim HS, Jang WH, Lee SD, Suh JK (2004) Genome Inform 15:171

23
47. Kim WK, Park J, Suh JK (2002) Genome Inform 13:42
48. Sprinzak E, Margalit H (2001) J Mol Biol 311:681
49. Bock JR, Gough DA (2001) Bioinformatics 17:455
50. Martin S, Roe D, Faulon JL (2005) Bioinformatics 21:218
51. Ben-Hur A, Noble WS (2005) Bioinformatics 21 Suppl 1:i38
52. Pitre S, Dehne F, Chan A, Cheetham J, Duong A, Emili A, Gebbia M, Greenblatt J, Jessulat
M, Krogan N, Luo X, Golshani A (2006) BMC Bioinformatics 7:365
53. Marcotte EM (2000) Curr Opin Struct Biol 10:359
54. Eisen MB, Spellman PT, Brown PO, Botstein D (1998) Proc Natl Acad Sci U S A 95:14863
55. Marcotte EM, Pellegrini M, Thompson MJ, Yeates TO, Eisenberg D (1999) Nature 402:83
56. Aloy P, Russell RB (2002) Proc Natl Acad Sci U S A 99:5896
57. Berman H, Henrick K, Nakamura H, Markley JL (2007) Nucleic Acids Res 35:301-303
58. Sonnhammer EL, Eddy SR, Durbin R (1997) Proteins 28:405
59. Shen J, Zhang J, Luo X, Zhu W, Yu K, Chen K, Li Y, Jiang H (2007) Proc Natl Acad Sci U
S A 104:4337
60. Edwards AM, Kus B, Jansen R, Greenbaum D, Greenblatt J, Gerstein M (2002) Trends
Genet 18:529
61. Regelmann J, Schule T, Josupeit FS, Horak J, Rose M, Entian KD, Thumm M, Wolf DH
(2003) Mol Biol Cell 14:1652
62. Saito R, Suzuki H, Hayashizaki Y (2002) Nucleic Acids Res 30:1163
63. Deane CM, Salwinski L, Xenarios I, Eisenberg D (2002) Mol Cell Proteomics 1:349
64. Grigoriev A (2003) Nucleic Acids Res 31:4157
65. Bader GD, Hogue CW (2002) Nat Biotechnol 20:991
66. Legrain P, Wojcik J, Gauthier JM (2001) Trends Genet 17:346
67. Tucker CL, Gera JF, Uetz P (2001) Trends Cell Biol 11:102
68. Sprinzak E, Sattath S, Margalit H (2003) J Mol Biol 327:919
69. Walhout AJ, Boulton SJ, Vidal M (2000) Yeast 17:88
70. Hazbun TR, Fields S (2001) Proc Natl Acad Sci U S A 98:4277
71. Krogan NJ, Cagney G, Yu H, Zhong G, Guo X, Ignatchenko A, Li J, Pu S, Datta N, Tikuisis
AP, Punna T, Peregrin-Alvarez JM, Shales M, Zhang X, Davey M, Robinson MD, Paccanaro
A, Bray JE, Sheung A, Beattie B, Richards DP, Canadien V, Lalev A, Mena F, Wong P,
Starostine A, Canete MM, Vlasblom J, Wu S, Orsi C, Collins SR, Chandran S, Haw R,
Rilstone JJ, Gandi K, Thompson NJ, Musso G, St Onge P, Ghanny S, Lam MH, Butland G,
Altaf-Ul AM, Kanaya S, Shilatifard A, O'Shea E, Weissman JS, Ingles CJ, Hughes TR,
Parkinson J, Gerstein M, Wodak SJ, Emili A, Greenblatt JF (2006) Nature 440:637
72. Wang H, Segal E, Ben-Hur A, Li Q, Vidal M, Koller D (2007) Genome Biol 8:R192
73. RJ VANB, Wessels LF, D DER, Reinders MJ (2007) J Bioinform Comput Biol 5:839
74. Mahdavi MA, Lin YH (2007) BMC Bioinformatics 8:262

24
Tables
Database URL Organism Reference
BIND http://bond.unleashedinformatics.com/ any [27]
DIP http://dip.doe-mbi.ucla.edu any [28]
BioGRID http://www.thebiogrid.org/ any [29]
MIPS http://mips.gsf.de yeast [30]
MINT http://cbm.bio.uniroma2.it/mint any [31]
Table 1: Databases of Experimental Protein-Protein Interactions

25
Method Description
Conservation of gene order across genomes [32] Whole
Genome Comparison of protein pairs in one genome to its fused single protein product
homolog in another genome [33, 34]
Correlated evolution of functionally related proteins [35] Evolutionary
relationship Tree kernel based computational system to assess similarities between
phylogenetic profiles [36, 37]
Assess fit of two interacting partners on a pre-determined complex of know 3D
structure; Web-based version InterPreTS [38, 39]
Multimeric threading algorithm MULTIPROSPECTOR to recognize partners in
protein interactions [40]
CAPRI is a community wide experiment focusing on the performance of protein-
protein docking procedures [41]
3D protein
structure
PRISM: protein interactions by structural matching [42]
Combination of similarity between sequence patches involved in interactions and
between domains of interacting partners [43]
Maximum likelihood estimation method to determine probability of interactions
between evolutionarily conserved protein domains in the PFAM protein domain
database [44]
Prediction of interaction probability of proteins; ranking system for probability of
interactions between multiple protein pairs [45, 46]
Domain
Database of potentially interacting domain (PID) pairs using a DIP database and
InterPro; PID matrix score as a reliability index for accurate analysis of
interaction networks [47]
Protein interactions mediated through specific short polypeptides sequences [48]
Automatic recognition of correlated patterns of sequences and substructure by
support vector machine; also uses associated physiochemical parameters [49]
Combination of sequence information, experimental data analysis and
subsequence paring to generate a ‘signature product’ which is implemented with
support vector machine [50]
Kernel methods for predicting protein-protein interactions [51]
Primary
protein
structure
PIPE: Protein-protein interaction prediction engine which uses primary protein
structure data from MIPS and DIP database [52]
Table 2: Computational methods for the prediction of protein-protein interactions

Figures
Figure 1: The five categories of computation PPI methods. A) Genes of proteins that are close in
different genomes are predicted to interact. Proteins 1 and 2 are predicted to interact since the
physical locations of their genes are in close proximity to each other in the genomes A, B and D.
Two proteins are also predicted to interact if they combine (fuse) to form one protein in another
organism. B) Protein pairs with similar phylogenetic profiles in different genomes are predicted to
interact. Proteins 1 and 4 are predicted to interact since they share the same phylogenetic profile.
C) Using the protein structures, docking methods will predict the best compatibility of their
interacting regions. Proteins 1 and 2 are predicted to interact since they have the best fit. D) If two
proteins A and B known to interact share a pair of conserved domains and two other proteins C
and D also share those same conserved domains, C and D are predicted to interact. E) Using the
primary protein structure and a database containing some other information (such as known
interactions), it is possible to train an algorithm to predict protein-protein interactions.
26
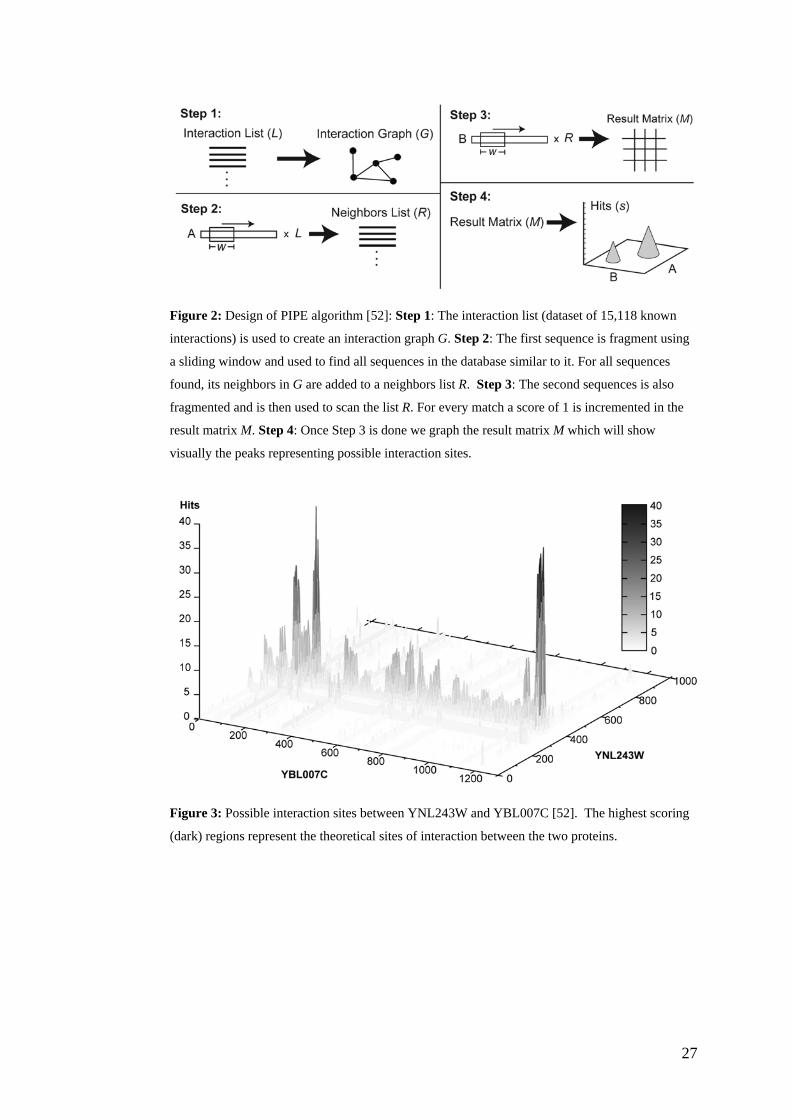
Figure 2: Design of PIPE algorithm [52]: Step 1: The interaction list (dataset of 15,118 known
interactions) is used to create an interaction graph G. Step 2: The first sequence is fragment using
a sliding window and used to find all sequences in the database similar to it. For all sequences
found, its neighbors in G are added to a neighbors list R. Step 3: The second sequences is also
fragmented and is then used to scan the list R. For every match a score of 1 is incremented in the
result matrix M. Step 4: Once Step 3 is done we graph the result matrix M which will show
visually the peaks representing possible interaction sites.
Figure 3: Possible interaction sites between YNL243W and YBL007C [52]. The highest scoring
(dark) regions represent the theoretical sites of interaction between the two proteins.
27