Exploiting Amino Acid Composition for Predicting Protein-Protein Interactions
13
Exploiting Amino Acid Composition for Predicting Protein-Protein Interactions Sushmita Roy 1 *, Diego Martinez 2 , Harriett Platero 3 , Terran Lane 4 , Margaret Werner-Washburne 5 1 Sushmita Roy Computer Science, University of New Mexico, Albuquerque, New Mexico, United States of America, 2 Diego Martinez, University of New Mexico, Albuquerque, New Mexico, United States of America, 3 Harriett Platero Biology, University of New Mexico, Albuquerque, New Mexico, United States of America, 4 Terran Lane Computer Science, University of New Mexico, Albuquerque, New Mexico, United States of America, 5 Margaret Werner-Washburne Biology, University of New Mexico, Albuquerque, New Mexico, United States of America Abstract Background: Computational prediction of protein interactions typically use protein domains as classifier features because they capture conserved information of interaction surfaces. However, approaches relying on domains as features cannot be applied to proteins without any domain information. In this paper, we explore the contribution of pure amino acid composition (AAC) for protein interaction prediction. This simple feature, which is based on normalized counts of single or pairs of amino acids, is applicable to proteins from any sequenced organism and can be used to compensate for the lack of domain information. Results: AAC performed at par with protein interaction prediction based on domains on three yeast protein interaction datasets. Similar behavior was obtained using different classifiers, indicating that our results are a function of features and not of classifiers. In addition to yeast datasets, AAC performed comparably on worm and fly datasets. Prediction of interactions for the entire yeast proteome identified a large number of novel interactions, the majority of which co-localized or participated in the same processes. Our high confidence interaction network included both well-studied and uncharacterized proteins. Proteins with known function were involved in actin assembly and cell budding. Uncharacterized proteins interacted with proteins involved in reproduction and cell budding, thus providing putative biological roles for the uncharacterized proteins. Conclusion: AAC is a simple, yet powerful feature for predicting protein interactions, and can be used alone or in conjunction with protein domains to predict new and validate existing interactions. More importantly, AAC alone performs at par with existing, but more complex, features indicating the presence of sequence-level information that is predictive of interaction, but which is not necessarily restricted to domains. Citation: Roy S, Martinez D, Platero H, Lane T, Werner-Washburne M (2009) Exploiting Amino Acid Composition for Predicting Protein-Protein Interactions. PLoS ONE 4(11): e7813. doi:10.1371/journal.pone.0007813 Editor: Dafydd Jones, Cardiff University, United Kingdom Received June 24, 2009; Accepted October 15, 2009; Published November 20, 2009 Copyright: ß 2009 Roy et al. This is an open-access article distributed under the terms of the Creative Commons Attribution License, which permits unrestricted use, distribution, and reproduction in any medium, provided the original author and source are credited. Funding: This work was supported by the HHMI-NIH/NIBIB Interfaces training grant (56005678), by an NIH (GM67593) grant to M.W.W., and by NIMH (1R01MH076282) and NSF (IIS-0705681) grants to T.L. D.M was supported by NIH grant GM60201 and H.P. was supported by NCGRI HG01315. The funders had no role in study design, data collection and analysis, decision to publish, or preparation of the manuscript. Competing Interests: The authors have declared that no competing interests exist. * E-mail: [email protected] Introduction Protein interaction networks are networks of physical interac- tions among proteins and constitute an important component of the bio-molecular network in cells. Capturing the complete set of protein interactions is crucial for understanding the programs for cellular response to different environmental stresses. Although high-throughput technology has advanced our knowledge of proteomes of many organisms [1–6], the estimated false negative rates of these datasets suggests a non-trivial fraction of interactions remains undetected [7]. Computational prediction of protein interactions are becoming increasingly popular because they provide an inexpensive way of predicting the most likely set of interactions at the entire proteome scale [8,9] and can be used to complement experimental approaches. Existing approaches typically use binary classification frameworks that differ in the features used to represent protein pairs. Researchers commonly use static features, such as protein domains [10–13], amino acid signatures [14], phylogenetic profiles [15,16] or, condition-specific dynamic features, such as gene expression [17], or literature-based features such as cellular localization [18]. Protein domains are the most commonly used static features for classification of protein interactions. Although protein domains yield high accuracy classifiers by incorporating evolutionarily- conserved information, these classifiers can only predict interac- tions between proteins with known domain information. In this paper, we ask the question if we can predict interactions among proteins without relying on domain information, and if so, how complex do our features need to be to perform as well as classifiers using domains as features. In particular, we focus on evaluating classifiers that use simple amino acid composition (AAC) features, which are based purely on normalized counts of single or pairs of amino acids for predicting protein interactions. Approaches that PLoS ONE | www.plosone.org 1 November 2009 | Volume 4 | Issue 11 | e7813
-
Upload
independent -
Category
Documents
-
view
2 -
download
0
Transcript of Exploiting Amino Acid Composition for Predicting Protein-Protein Interactions
Exploiting Amino Acid Composition for PredictingProtein-Protein InteractionsSushmita Roy1*, Diego Martinez2, Harriett Platero3, Terran Lane4, Margaret Werner-Washburne5
1 Sushmita Roy Computer Science, University of New Mexico, Albuquerque, New Mexico, United States of America, 2 Diego Martinez, University of New Mexico,
Albuquerque, New Mexico, United States of America, 3 Harriett Platero Biology, University of New Mexico, Albuquerque, New Mexico, United States of America, 4 Terran
Lane Computer Science, University of New Mexico, Albuquerque, New Mexico, United States of America, 5 Margaret Werner-Washburne Biology, University of New
Mexico, Albuquerque, New Mexico, United States of America
Abstract
Background: Computational prediction of protein interactions typically use protein domains as classifier features becausethey capture conserved information of interaction surfaces. However, approaches relying on domains as features cannot beapplied to proteins without any domain information. In this paper, we explore the contribution of pure amino acidcomposition (AAC) for protein interaction prediction. This simple feature, which is based on normalized counts of single orpairs of amino acids, is applicable to proteins from any sequenced organism and can be used to compensate for the lack ofdomain information.
Results: AAC performed at par with protein interaction prediction based on domains on three yeast protein interactiondatasets. Similar behavior was obtained using different classifiers, indicating that our results are a function of features andnot of classifiers. In addition to yeast datasets, AAC performed comparably on worm and fly datasets. Prediction ofinteractions for the entire yeast proteome identified a large number of novel interactions, the majority of which co-localizedor participated in the same processes. Our high confidence interaction network included both well-studied anduncharacterized proteins. Proteins with known function were involved in actin assembly and cell budding. Uncharacterizedproteins interacted with proteins involved in reproduction and cell budding, thus providing putative biological roles for theuncharacterized proteins.
Conclusion: AAC is a simple, yet powerful feature for predicting protein interactions, and can be used alone or inconjunction with protein domains to predict new and validate existing interactions. More importantly, AAC alone performsat par with existing, but more complex, features indicating the presence of sequence-level information that is predictive ofinteraction, but which is not necessarily restricted to domains.
Citation: Roy S, Martinez D, Platero H, Lane T, Werner-Washburne M (2009) Exploiting Amino Acid Composition for Predicting Protein-Protein Interactions. PLoSONE 4(11): e7813. doi:10.1371/journal.pone.0007813
Editor: Dafydd Jones, Cardiff University, United Kingdom
Received June 24, 2009; Accepted October 15, 2009; Published November 20, 2009
Copyright: � 2009 Roy et al. This is an open-access article distributed under the terms of the Creative Commons Attribution License, which permits unrestricteduse, distribution, and reproduction in any medium, provided the original author and source are credited.
Funding: This work was supported by the HHMI-NIH/NIBIB Interfaces training grant (56005678), by an NIH (GM67593) grant to M.W.W., and by NIMH(1R01MH076282) and NSF (IIS-0705681) grants to T.L. D.M was supported by NIH grant GM60201 and H.P. was supported by NCGRI HG01315. The funders had norole in study design, data collection and analysis, decision to publish, or preparation of the manuscript.
Competing Interests: The authors have declared that no competing interests exist.
* E-mail: [email protected]
Introduction
Protein interaction networks are networks of physical interac-
tions among proteins and constitute an important component of
the bio-molecular network in cells. Capturing the complete set of
protein interactions is crucial for understanding the programs for
cellular response to different environmental stresses. Although
high-throughput technology has advanced our knowledge of
proteomes of many organisms [1–6], the estimated false negative
rates of these datasets suggests a non-trivial fraction of interactions
remains undetected [7].
Computational prediction of protein interactions are becoming
increasingly popular because they provide an inexpensive way of
predicting the most likely set of interactions at the entire proteome
scale [8,9] and can be used to complement experimental
approaches. Existing approaches typically use binary classification
frameworks that differ in the features used to represent protein
pairs. Researchers commonly use static features, such as protein
domains [10–13], amino acid signatures [14], phylogenetic profiles
[15,16] or, condition-specific dynamic features, such as gene
expression [17], or literature-based features such as cellular
localization [18].
Protein domains are the most commonly used static features for
classification of protein interactions. Although protein domains
yield high accuracy classifiers by incorporating evolutionarily-
conserved information, these classifiers can only predict interac-
tions between proteins with known domain information. In this
paper, we ask the question if we can predict interactions among
proteins without relying on domain information, and if so, how
complex do our features need to be to perform as well as classifiers
using domains as features. In particular, we focus on evaluating
classifiers that use simple amino acid composition (AAC) features,
which are based purely on normalized counts of single or pairs of
amino acids for predicting protein interactions. Approaches that
PLoS ONE | www.plosone.org 1 November 2009 | Volume 4 | Issue 11 | e7813

do not rely on domains typically use more complex sequence
features comprising n-grams (n~3,4) [10,14], or combine
sequence with other sources of information such as gene
expression or phylogenetic profiles [19]. While these studies do
incorporate amino acid composition for predicting interactions, it
is unclear how much predictive power can be obtained from AAC
alone.
We performed a systematic analysis of the contribution of AAC
to the prediction of protein interactions focussing on different
types of datasets (Co-complex, Two-hybrid, Protein Complemen-
tation Assay) and classifiers (Maxent, Support vector machines,
Naive Bayes). This allowed us to assess the predictive power of
AAC over a range of datasets and classifier types.
Interactions predicted in yeast S. cerevisiae using AAC were of
comparable accuracy to those predicted by protein domains, and
other non-domain, but more complex, sequence features. This
level of performance suggests that AAC alone can capture a
significant amount of information required for interaction
prediction. Similar performance was obtained for datasets from
higher organisms: fly (D. melanogaster) and worm (C. elegans). A post-
processing analysis of the most important features for interaction
prediction identified both domains and AAC features to be
important. Some of these AAC features were also statistically over-
represented in domains involved in protein interactions.
Finally, we combined predictions from classifiers trained on the
three yeast datasets to generate a high confidence yeast
interactome. Our predicted interactions had significantly higher
tendency to co-express, co-localize, and participate in the same
process as compared to the predicted non-interactions, providing
expression and gene ontology-based support of our interactions.
Our predicted interactions also included several uncharacterized
proteins, including a highly connected hub, YJR151W-A, to which
we assigned putative functions based on their interaction partners
Overall, AAC has these benefits: (a) AAC is a simple, yet
powerful feature which performs surprisingly well given its
simplicity, (b) AAC can be used to predict protein interactions
irrespective of domain information availability, allowing interac-
tion predictions among uncharacterized proteins for which
domain information is scarce, (c) good performance of AAC is
independent of the classification framework, and, (d) extraction of
AAC features is computationally much more tractable than other
non-domain features, making them easily applicable to higher
organisms with lengthy protein sequences.
Results
We first compared AAC against the evolutionarily-rich protein
domain features for predicting interactions in the three yeast
interaction datasets. We then compared AAC against the tuples
and signature product features, which like AAC do not require
protein domain information on yeast, worm and fly datasets. We
then performed a post-hoc feature analysis to identify the AAC
features that were most beneficial for predicting interactions.
Finally, we used classifiers combining AAC and domains to predict
the complete yeast interactome and validated novel interactions
using Gene ontology.
Comparison with existing featuresThe goal of comparative analysis was: (a) to determine how well
a simple feature like AAC performed against well-known features
such as domains, (b) to assess if AAC features can improve
performance when used in combination with domains, (c) to
compare AAC to other non-domain sequence features such as the
tuple feature [10] and the signature product feature [14].
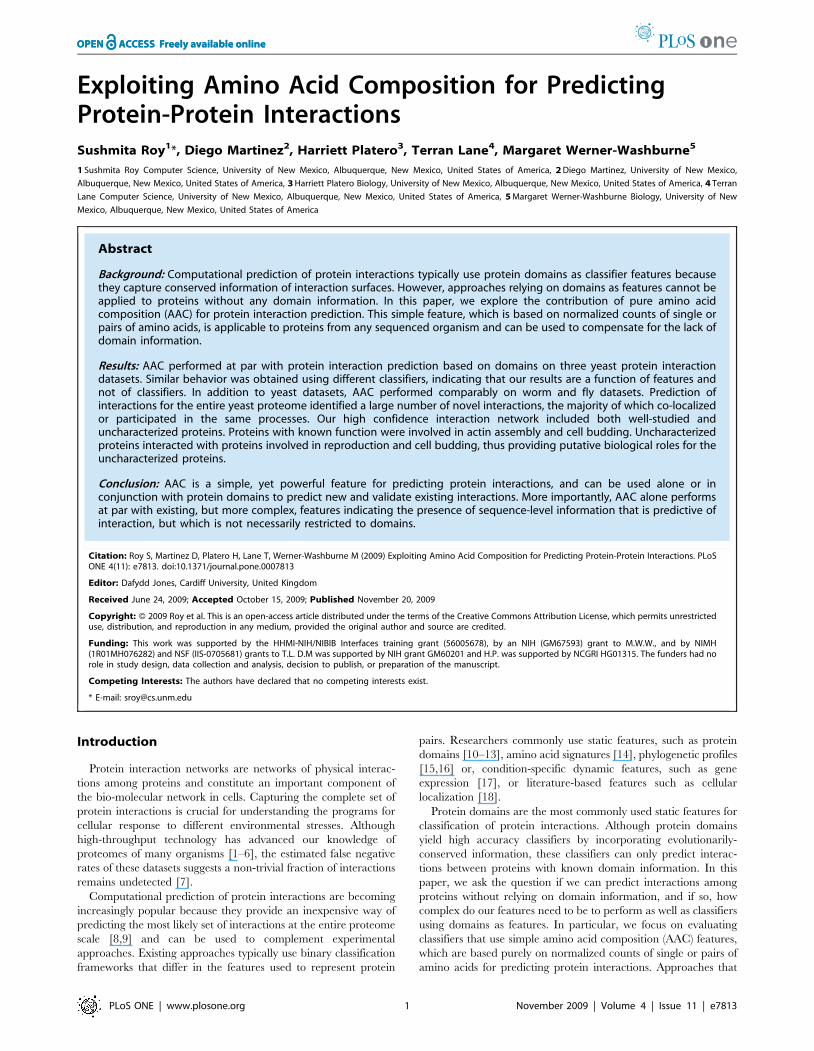
AAC performs at par with domainsWe trained and tested classifiers on the three yeast datasets
(TWOHYB, AFFMS, PCA), selecting only protein pairs for which
domain information was available for both proteins. We selected
only protein pairs with domains to have a fair and direct comparison
against a classifier that relies only on domains for interaction
prediction (Fig. 1). We compared a classifier using domains against a
classifier using either AAC monomers or AAC dimers as features.
With the exception of the Naive Bayes using AAC dimer (AFFMS,
PCA), surprisingly there was no statistically significant difference in
performance of classifiers using AAC features or domains. Overall,
both AAC features performed at par with domains in the majority of
the cases across different datasets and classifiers, which was
surprising and indicated that AAC alone captures a substantial
amount of information required for identifying interacting proteins.
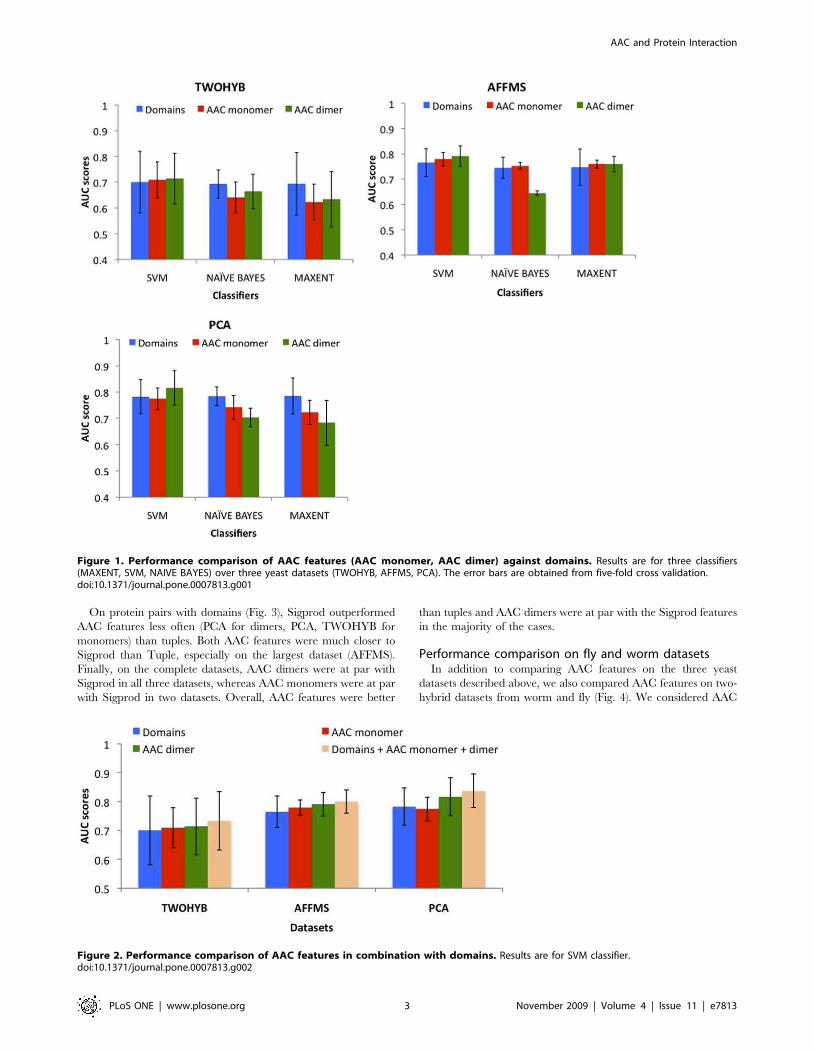
Combining AAC with domains results in no significantimprovement in performance
To assess the value of combining AAC with evolutionarily-rich
domain features, we combined domains with AAC monomer and
AAC dimer features and compared the performance of classifiers
using the combined set of features against classifiers using either of
these features alone. We estimated performance on the protein
pairs for which we had domains to allow comparison against a
classifier which used only domains as features (Fig. 2). In all three
datasets, combining AAC with domain features did not signifi-
cantly change performance, which is not surprising because the
protein pairs have domains and therefore should be highly
predictable using the domain-based classifier. This results suggests
that we can safely combine simple sequence-based features with
evolutionarily-conserved features such as domains without suffer-
ing any performance loss due to excessive features.
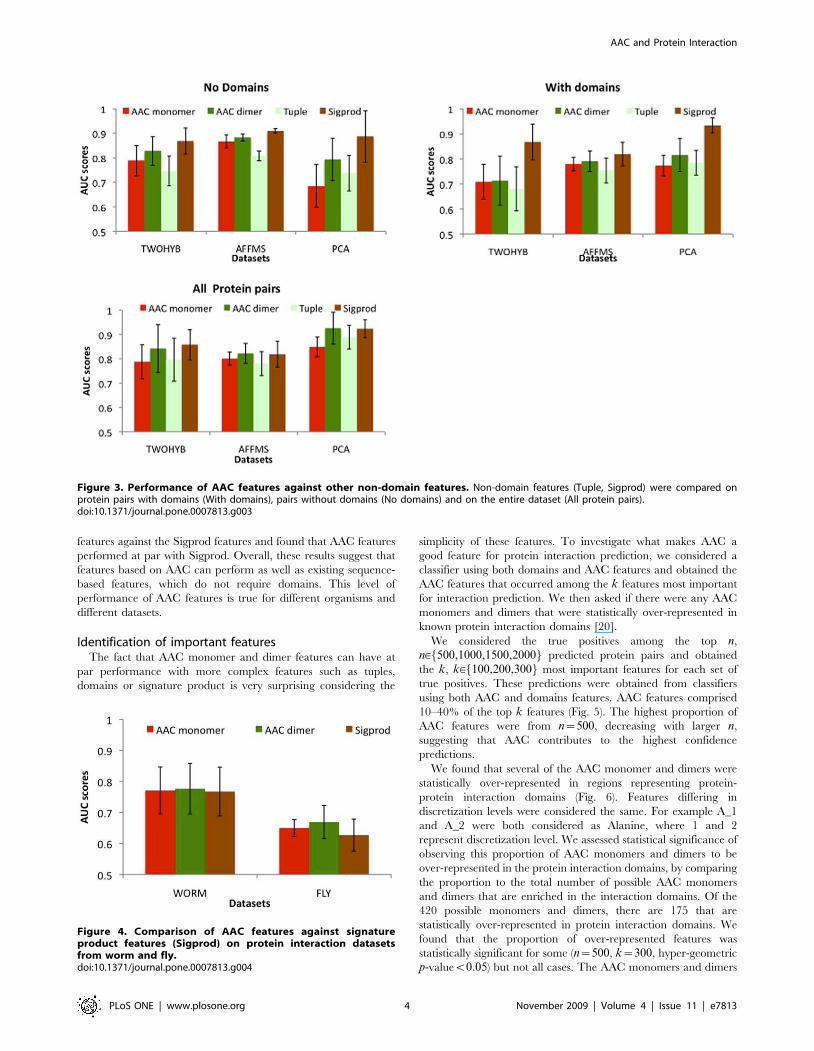
AAC performs at par with non-domain featuresWe compared the performance of AAC with other non-domain
features, which can also predict interactions between proteins
lacking domain information. The two features that we evaluated
were the tuple feature from Gomez et al. [10], and the signature
products (Sigprod) from Martin et al. [14].
We compared AAC against the tuple and Sigprod features on
three yeast datasets (TWOHYB, AFFMS, PCA). The three
datasets were each split into two parts: protein pairs with domains
and protein pairs without domains. We report the performance on
protein pairs with domains (With domains), on protein pairs
without domains (No Domains) and on the complete dataset (All
Protein pairs). The AUC-scores on protein pairs without domains
evaluated how well non-domain features including AAC are able
to predict interactions (or non-interactions) among proteins for
which no domain information is available. The AUC-scores on the
complete datasets evaluated the overall performance of different
features on protein pairs irrespective of domain information
availability. These results are for the SVM classifier, because it
provides performance numbers for all features (Sigprod is specific
to a SVM classifier). Results for the Maximum entropy classifier
are similar (Supporting text S1, Fig. S4).
On protein pairs without domains (Fig. 3), AAC dimers were
significantly better (pv8E-5) than tuples for AFFMS. AAC
monomer was also better than tuples for AFFMS (pv1:7E-4).
Tuples were never significantly better than the AAC features.
AAC features also performed at par with Sigprod with the
exception of AAC dimers for AFFMS. This indicates that for these
protein pairs, AAC dimers capture the majority of the information
captured in Sigprod.
AAC and Protein Interaction
PLoS ONE | www.plosone.org 2 November 2009 | Volume 4 | Issue 11 | e7813
On protein pairs with domains (Fig. 3), Sigprod outperformed
AAC features less often (PCA for dimers, PCA, TWOHYB for
monomers) than tuples. Both AAC features were much closer to
Sigprod than Tuple, especially on the largest dataset (AFFMS).
Finally, on the complete datasets, AAC dimers were at par with
Sigprod in all three datasets, whereas AAC monomers were at par
with Sigprod in two datasets. Overall, AAC features were better
than tuples and AAC dimers were at par with the Sigprod features
in the majority of the cases.
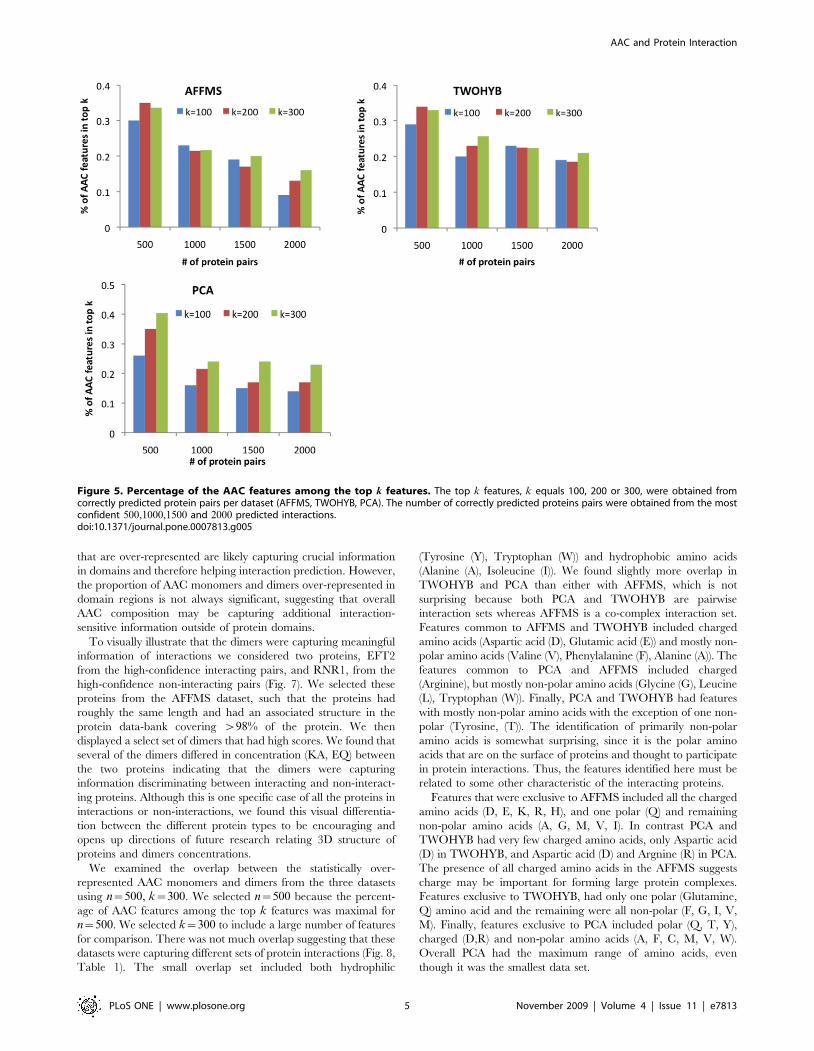
Performance comparison on fly and worm datasetsIn addition to comparing AAC features on the three yeast
datasets described above, we also compared AAC features on two-
hybrid datasets from worm and fly (Fig. 4). We considered AAC
Figure 2. Performance comparison of AAC features in combination with domains. Results are for SVM classifier.doi:10.1371/journal.pone.0007813.g002
Figure 1. Performance comparison of AAC features (AAC monomer, AAC dimer) against domains. Results are for three classifiers(MAXENT, SVM, NAIVE BAYES) over three yeast datasets (TWOHYB, AFFMS, PCA). The error bars are obtained from five-fold cross validation.doi:10.1371/journal.pone.0007813.g001
AAC and Protein Interaction
PLoS ONE | www.plosone.org 3 November 2009 | Volume 4 | Issue 11 | e7813
features against the Sigprod features and found that AAC features
performed at par with Sigprod. Overall, these results suggest that
features based on AAC can perform as well as existing sequence-
based features, which do not require domains. This level of
performance of AAC features is true for different organisms and
different datasets.
Identification of important featuresThe fact that AAC monomer and dimer features can have at
par performance with more complex features such as tuples,
domains or signature product is very surprising considering the
simplicity of these features. To investigate what makes AAC a
good feature for protein interaction prediction, we considered a
classifier using both domains and AAC features and obtained the
AAC features that occurred among the k features most important
for interaction prediction. We then asked if there were any AAC
monomers and dimers that were statistically over-represented in
known protein interaction domains [20].
We considered the true positives among the top n,
n[ 500,1000,1500,2000f g predicted protein pairs and obtained
the k, k[ 100,200,300f g most important features for each set of
true positives. These predictions were obtained from classifiers
using both AAC and domains features. AAC features comprised
10–40% of the top k features (Fig. 5). The highest proportion of
AAC features were from n~500, decreasing with larger n,
suggesting that AAC contributes to the highest confidence
predictions.
We found that several of the AAC monomer and dimers were
statistically over-represented in regions representing protein-
protein interaction domains (Fig. 6). Features differing in
discretization levels were considered the same. For example A_1
and A_2 were both considered as Alanine, where 1 and 2
represent discretization level. We assessed statistical significance of
observing this proportion of AAC monomers and dimers to be
over-represented in the protein interaction domains, by comparing
the proportion to the total number of possible AAC monomers
and dimers that are enriched in the interaction domains. Of the
420 possible monomers and dimers, there are 175 that are
statistically over-represented in protein interaction domains. We
found that the proportion of over-represented features was
statistically significant for some (n~500, k~300, hyper-geometric
p-valuev0:05) but not all cases. The AAC monomers and dimers
Figure 3. Performance of AAC features against other non-domain features. Non-domain features (Tuple, Sigprod) were compared onprotein pairs with domains (With domains), pairs without domains (No domains) and on the entire dataset (All protein pairs).doi:10.1371/journal.pone.0007813.g003
Figure 4. Comparison of AAC features against signatureproduct features (Sigprod) on protein interaction datasetsfrom worm and fly.doi:10.1371/journal.pone.0007813.g004
AAC and Protein Interaction
PLoS ONE | www.plosone.org 4 November 2009 | Volume 4 | Issue 11 | e7813
that are over-represented are likely capturing crucial information
in domains and therefore helping interaction prediction. However,
the proportion of AAC monomers and dimers over-represented in
domain regions is not always significant, suggesting that overall
AAC composition may be capturing additional interaction-
sensitive information outside of protein domains.
To visually illustrate that the dimers were capturing meaningful
information of interactions we considered two proteins, EFT2
from the high-confidence interacting pairs, and RNR1, from the
high-confidence non-interacting pairs (Fig. 7). We selected these
proteins from the AFFMS dataset, such that the proteins had
roughly the same length and had an associated structure in the
protein data-bank covering w98% of the protein. We then
displayed a select set of dimers that had high scores. We found that
several of the dimers differed in concentration (KA, EQ) between
the two proteins indicating that the dimers were capturing
information discriminating between interacting and non-interact-
ing proteins. Although this is one specific case of all the proteins in
interactions or non-interactions, we found this visual differentia-
tion between the different protein types to be encouraging and
opens up directions of future research relating 3D structure of
proteins and dimers concentrations.
We examined the overlap between the statistically over-
represented AAC monomers and dimers from the three datasets
using n~500, k~300. We selected n~500 because the percent-
age of AAC features among the top k features was maximal for
n~500. We selected k~300 to include a large number of features
for comparison. There was not much overlap suggesting that these
datasets were capturing different sets of protein interactions (Fig. 8,
Table 1). The small overlap set included both hydrophilic
(Tyrosine (Y), Tryptophan (W)) and hydrophobic amino acids
(Alanine (A), Isoleucine (I)). We found slightly more overlap in
TWOHYB and PCA than either with AFFMS, which is not
surprising because both PCA and TWOHYB are pairwise
interaction sets whereas AFFMS is a co-complex interaction set.
Features common to AFFMS and TWOHYB included charged
amino acids (Aspartic acid (D), Glutamic acid (E)) and mostly non-
polar amino acids (Valine (V), Phenylalanine (F), Alanine (A)). The
features common to PCA and AFFMS included charged
(Arginine), but mostly non-polar amino acids (Glycine (G), Leucine
(L), Tryptophan (W)). Finally, PCA and TWOHYB had features
with mostly non-polar amino acids with the exception of one non-
polar (Tyrosine, (T)). The identification of primarily non-polar
amino acids is somewhat surprising, since it is the polar amino
acids that are on the surface of proteins and thought to participate
in protein interactions. Thus, the features identified here must be
related to some other characteristic of the interacting proteins.
Features that were exclusive to AFFMS included all the charged
amino acids (D, E, K, R, H), and one polar (Q) and remaining
non-polar amino acids (A, G, M, V, I). In contrast PCA and
TWOHYB had very few charged amino acids, only Aspartic acid
(D) in TWOHYB, and Aspartic acid (D) and Argnine (R) in PCA.
The presence of all charged amino acids in the AFFMS suggests
charge may be important for forming large protein complexes.
Features exclusive to TWOHYB, had only one polar (Glutamine,
Q) amino acid and the remaining were all non-polar (F, G, I, V,
M). Finally, features exclusive to PCA included polar (Q, T, Y),
charged (D,R) and non-polar amino acids (A, F, C, M, V, W).
Overall PCA had the maximum range of amino acids, even
though it was the smallest data set.
Figure 5. Percentage of the AAC features among the top k features. The top k features, k equals 100, 200 or 300, were obtained fromcorrectly predicted protein pairs per dataset (AFFMS, TWOHYB, PCA). The number of correctly predicted proteins pairs were obtained from the mostconfident 500,1000,1500 and 2000 predicted interactions.doi:10.1371/journal.pone.0007813.g005
AAC and Protein Interaction
PLoS ONE | www.plosone.org 5 November 2009 | Volume 4 | Issue 11 | e7813

Our post-hoc analysis of important features led us to conclude that
several AAC monomers and dimers were significantly enriched in
domains involved in protein interactions, but the specific features that
were deemed important depended on the dataset: features involving
charged amino acids in AFFMS, and non-polar amino acids in
TWOHYB and a mixture of polar and non-polar amino acids in PCA.
Figure 7. Three dimensional structures of ETF2 and RNR1 proteins obtained from the protein data bank. Only dimers important forprediction are shown with the rest of the protein structure as backbone. Different colors correspond to different dimers. EE: red, AE: green, AD:blue,DA: yellow, DE: magenta, DV: cyan, EK: white, EQ: violet, KA: orange.doi:10.1371/journal.pone.0007813.g007
Figure 6. Percentage of the top AAC monomers and dimers that were significantly enriched in domain regions involved in proteininteractions.� indicates significant overlap (p-valuev0.05) with the complete set of AAC monomers and dimers found to be over-represented indomains involved in protein interactions.doi:10.1371/journal.pone.0007813.g006
AAC and Protein Interaction
PLoS ONE | www.plosone.org 6 November 2009 | Volume 4 | Issue 11 | e7813

Whole yeast proteome analysis: Identification of novelinteractions
To predict interactions in the entire yeast genome, we trained
three classifiers on the AFFMS, PCA and TWOHYB datasets.
The predicted interactome was created from the intersection of the
interaction sets predicted by each classifier. We considered
intersections at different confidence levels, ranging in 80%–95%,
and identified the number of known interactions at each
confidence level (Table 2). We found a large proportion of our
interaction set to comprise novel interactions.
Because many of our interactions were novel, we carried out
preliminary validation using expression data and gene ontology
categories [21]. Our expectations were that interacting proteins
would tend to be co-expressed and be in similar processes or
locations. For co-expression analysis we computed the correlation
coefficient between the two proteins of a predicted interaction (or
non-interaction) using expression data from Gasch et al. [22],
which profiled the transcriptomic response of yeast cells under
different stress conditions (Fig. 9). We found that the average
correlation for the interactions (0:17+0:30), while low, is higher
than the non-interacting proteins (0:03+0:291, Kolmogorov
Smirnov p-valuev9E-39). This low correlation has been seen
before and suggests that protein stability, maintained via post-
translational modifications, may play a significant role in complex
formation and function [5,23], or may be due to proteins
interacting under conditions not captured in the expression
dataset. However, compared to non-interacting proteins, the
interacting proteins exhibit a significant bias in the distribution
towards positive correlation.
We further analyzed these interactions for co-localization,
co-function, and co-process using GO Slim terms and found that
proteins predicted to interact tended to co-localize, or participate
in the same processes more than the proteins predicted to not
interact (Fig. 10). In particular, interacting proteins were
statistically enriched for co-localization (p-valuev2:8E-8) and
co-process (p-valuev1E-200) where as predicted non-interactions
were statistically depleted from co-localization (p-valuev1E-200)
and co-process (p-valuev1:5E-69). For function, even though
predicted interactions had a higher fraction of interactions
participating in the same function, both interacting and non-
interacting proteins were enriched for co-function. This suggests
that GO slim functional categories may not be as predictive of
interacting versus non-interacting proteins as process and location.
This is consistent with low sensitivity of protein interaction
identification using all GO molecular functions versus sensitivity
using a filtered set of functions [24]. To investigate this further we
considered the enrichment on a per functional category basis and
found that both interacting and non-interacting proteins were
enriched in hydrolase activity, and non-interacting proteins were
enriched in transferase activity. Further, on excluding these two
categories, the non-interacting proteins were no longer enriched in
co-function while the interacting proteins remained enriched in
co-function (pv1.7E-8). This suggests that proteins that are
hydrolases may be further grouped into other categories, some of
which interact and some of which do not interact. Proteins that are
transferases do not interact with each other. This gives us an
interesting direction of future research to investigate the propensity
of different proteins to interact based on their functional roles. The
high enrichment of co-localization and co-process is consistent
with our prediction of interactions and, validates our predicted
interactions using gene ontology, and future experimental
validation of the high confidence predictions are likely to yield
true positive interactions.
Analysis of novel interactions: Identification of newfunction
We identified 1412 high confidence (95%) interactions,
including 197 existing interactions. We examined more closely
the most highly connected nodes (hub nodes) of this high
confidence network, where a hub was a node with §20interaction partners. The largest hub was the protein LAS17, an
actin assembly protein and the yeast homolog for the Wiskott-
Aldrich disease in humans [25]. This protein has 12 known
interactions in the existing interaction databases and we found 176
more interactions, most of which were among proteins involved in
actin cytoskeleton organization, consistent with the known
function of LAS17.
Gene ontology enrichment of the hubs identified cell budding,
cytokinesis and mRNA stability and catabolism as additional
enriched processes. Other protein hubs were also involved in a
variety of processes including nuclear transport (KAP95, SRP1),
transcription (NOT3, NAB3) and telomere maintenance (GAL11,
STO1). Because hubs captured the majority of the interactions, we
concluded that interactions in the high confidence network were
involved in cell-budding, actin assembly, nuclear pore transport
and mRNA stability.
One of our goals, using sequence-based interaction classifiers,
was to capture and analyze interactions among proteins that
Figure 8. Overlap of AAC monomers and dimers from differentdatasets.doi:10.1371/journal.pone.0007813.g008
Table 1. AAC monomers and dimers over-represented inprotein interaction domains.
Dataset combination AAC Features
AFFMS, TWOHYB, PCA A I W Y
AFFMS, TWOHYB V AD DA EV FE QA
AFFMS, PCA L GR WG
TWOHYB, PCA FL G GL LA LG WA WT
AFFMS AE AM AR DV EG GG GH IQ KA KV RARV VE VK VQ
TWOHYB FG FI FV GM ID IF IV MA MG QI VG
PCA AA AF AI AV CF CM F FA FF FY GD GFGW IG LF LL LM LY
QV RD TG TV VC VF VR WC WM WS YR
AAC features enriched in domains in different combinations of the threedatasets. Each row represents the features that were exclusive to the datasetcombination in the first column. A: Alanine, C: Cysteine, D: Aspartic acid, E:Glutamic acid, F: Phenylalanine, G: Glycine, H: Histidine, I: Isoleucine, K: Lysine,M: Methionine, Q: Glutamine, R: Arginine, T: Threonine, V: Valine, W:Tryptophan, S: Serine, Y: Tyrosine. Bold indicates polar, and underline indicatescharged. Non-bold indicates non-polar.doi:10.1371/journal.pone.0007813.t001
AAC and Protein Interaction
PLoS ONE | www.plosone.org 7 November 2009 | Volume 4 | Issue 11 | e7813

cannot be analyzed using domain-based methods. This is
especially useful for uncharacterized proteins for which roles may
be inferred based on interacting proteins. Therefore we focused on
predicted protein pairs where one of the proteins did not have any
known domains. There were a total of 169 such interactions
including 75 interactions involving 13 uncharacterized proteins.
One of the uncharacterized proteins (YJR151W-A) was also a hub
with 37 interaction partners (Fig. 11). Using the ‘‘guilt by
association’’ approach we predict that this protein has a role in
transcription, because of its predicted interactions with several
universal transcription initiation factors (TIF and TAF), and also
in mRNA processing and metabolism, because of its interactions
with splicing factors, P-body, and translation-initiation proteins
[26]. Interestingly, YJR151W-A may not have been studied
carefully because it was not thought to be a gene. We assigned
putative roles to other uncharacterized proteins based on their
interactions with other characterized proteins (Table 3). The
ability to assign new putative function to uncharacterized proteins,
for which domains are also not available, highlights the usefulness
of predicting protein interactions using non-domain features such
as AAC. Overall our interaction set had both known and
uncharacterized proteins, allowing us to validate existing knowl-
edge and predict new function for uncharacterized proteins.
Discussion
We have described a novel sequence-based feature, amino
acid composition (AAC), that can be used to predict protein
interactions in different organisms. Compared to other
sequence-based features, AAC is much simpler because it models
very little sequential dependencies (domains and tuples) and no
explicit pairwise information (Sigprod). Surprisingly, despite its
simplicity, AAC performs at par with domains on protein pairs for
which domain information is available. The good performance of
AAC, in spite of its strong independence assumptions, maybe due
to its similarity to the bag of words model, which often performs at
least as well as models that do not make independence
assumptions [27].
Compared to tuple features, AAC gave better performance,
which was surprising because tuples incorporate ordering
information of sequential amino acids. A possible explanation is
that grouping of amino acids into six categories, may be too
coarse, and by doing so, the tuple features are excluding
information specific to individual amino acids, crucial for
characterizing protein interactions. Comparison to Sigprod
indicated that AAC performed at par on protein pairs without
domains, and also on the complete set of protein pairs including
those without domains.
On protein pairs with domains, Sigprod features are the best,
outperforming all other features (including domains) on at least
one dataset. The fact that Sigprod outperforms AAC features is
not surprising because it captures more sequential dependency by
looking at trimers rather than dimers or monomers. A natural
extension of the AAC features would be to look at trimers.
However, Sigprod outperforms even domains, which is very
surprising because domains represent much longer portions of the
Table 2. Number of predicted and true interactions at different confidence levels.
Confidence level Predicted Known Predicted + self loops Known + self loops
0.95 1144 86 1412 197
0.90 4352 194 4862 373
0.85 9769 313 10495 532
0.80 17084 449 18030 708
Number of predicted (using ACC and domains) and known interactions, where known interactions are those present in either AFFMS, TWOHYB or PCA.doi:10.1371/journal.pone.0007813.t002
Figure 9. Distribution of co-expression of predicted interactions and non-interactions at different confidence levels. Co-expression ismeasured by Pearson’s correlation coefficient.doi:10.1371/journal.pone.0007813.g009
AAC and Protein Interaction
PLoS ONE | www.plosone.org 8 November 2009 | Volume 4 | Issue 11 | e7813

amino acid sequence. It is possible that protein interactions do not
involve the complete domain, but specific contact points within the
domains. Dimers and trimers (Sigprod) are able to capture these
crucial contact point information thus providing good perfor-
mance. Sigprod also uses a specialized string kernel, which gives it
additional benefits and therefore improved performance. In
contrast, we use AAC features with the general purpose Gaussian
kernel. Developing a specialized string kernel for AAC features is a
direction of future research.
The value of AAC is evident for protein pairs in which one or
both proteins have no domain information. Using a classifier with
amino acid composition we were able to predict interactions of
several uncharacterized proteins and were able to predict novel
function for some of these proteins based on the known annotation
of their interacting partners.
The post-hoc analysis of why a simple feature like AAC works so
well by itself showed that several of the AAC features were
significantly over-represented in domains involved in protein-
protein interactions. This indicated that AAC features are likely
capturing crucial contact points of the protein domains, and
therefore helping in prediction. Although amino acids have been
previously shown to have differential concentration in different
interaction surfaces [28,29], our work extends this analysis to
assessing importance of amino acids in a dataset-specific manner.
We found that the importance of amino acids depended on the
particular dataset, which maybe due to the propensity of different
assays to capture different classes of interactions (e.g. transient
versus stable).
We found that AAC features constitute a non-trivial fraction
(26–40%) of the 100 most important features in a classifier using
both AAC and domains as features. If protein domains were
capturing all the properties of interacting proteins, we would not
expect AAC features to be important when used with domains.
This is further supported by the observation that only a subset of
the AAC features important for interaction prediction were
enriched in known interacting domains. This suggests the
possibility of certain properties of interacting surfaces that are
not fully captured in algorithms that search only for protein
domains. AAC features can provide a cue for detecting novel types
of protein domains encoding meta-level information important,
possibly for docking of a protein partner or presentation of the
interaction domain. Such meta-interaction surfaces identified with
high confidence can be experimentally verified, leading to the
identification of new types of protein domains, that may not be
necessarily linear.
Our prediction results using simple amino acid composition
have been quite encouraging, and has opened a plethora of
questions regarding the information that can be captured at the
level of single and pairs of amino acids. Extending this work to
recognize higher-order signals in the proteome, including
identification of meta-domains, can provide insight into the causal
and mechanistic details of protein interactions.
Methods
Feature extractionPrior to prediction of protein interactions, we represent every
protein pair in our datasets using binary feature sets corresponding
to attributes of protein pairs. These features correspond to AAC
features and domain features.
AAC as classifier featuresWe use two types of features for representing AAC: monomer
and dimer features. Monomer features capture composition of
individual amino acids, whereas dimer features capture compo-
sition of pairs of consecutive amino acids. To generate the
monomer features, we first obtain a 20-dimensional vector, qi,
representing the proportion of the 20 amino acids in a protein, Pi.
Figure 10. Co-annotation of predicted interactions and non-interactions at different confidence levels of interaction. Predictedinteractions and non-interactions at different confidence levels were analyzed for different types of co-annotation: co-process, co-location andco-function.doi:10.1371/journal.pone.0007813.g010
AAC and Protein Interaction
PLoS ONE | www.plosone.org 9 November 2009 | Volume 4 | Issue 11 | e7813

Figure 11. Protein interaction sub network with the uncharacterized ORFs. The uncharacterized ORFs are in magenta and the characterizedare in yellow.doi:10.1371/journal.pone.0007813.g011
Table 3. Predicted function of uncharacterized ORFs.
ORF Degree Putative function
YJR151W-A 37 protein-RNA complex assembly, mRNA processing, asexual reproduction
YGR174W-A 9 cell budding, asexual reproduction
YAR035C-A 8 cell budding, asexual reproduction
YGL007C-A 8 cell budding, asexual reproduction
YMR124W 5 organelle organization and biogenesis
Degree specifies the number of interaction partners of a protein.doi:10.1371/journal.pone.0007813.t003
AAC and Protein Interaction
PLoS ONE | www.plosone.org 10 November 2009 | Volume 4 | Issue 11 | e7813

Each dimension, qi jð Þ, is the count of a particular amino acid in
Pi, normalized by the length of Pi. The real-valued composition is
discretized into k~25 bins, producing a set of 500 binary features,
with 25 features per amino acid. The number of bins for
discretization is determined on a hold-out set (Supporting text S1,
Fig. S1, S2).
To generate the dimer features, we obtain a 400-dimensional
vector of all possible pairs of amino acids that can be extracted
from the protein sequence. Similar to the monomer composition
we normalize the dimer composition by l{1, where l is the length
of the protein, followed by discretization into k~10 bins, which
is determined empirically on a hold-out set (Supporting text S1,
Fig. S3).
Domains as classifier featuresThe domains are represented as binary features, with each
feature identified by the domain name. For yeast proteins, we use
domains that are available for download from the Saccharomyces
genome database. For fly and worm proteins, we used inter-
proscan domains [30].
Description of other non-domain featuresWe have compared the AAC features against other non-
domain, sequence-based features. These features are the tuple
features [10] and signature products [14]. The tuple features were
created by first grouping amino acids into six categories based on
their bio-chemical properties, and then creating all possible strings
of length 4 using these six categories.
The signature products are used directly within a support
vector machine (SVM) framework where protein pairs are
represented using a specialized signature product kernel. This
approach first extracts signatures of length 3 from the individual
protein sequences. Each signature consists of a middle letter and
two flanking amino acids represented in alphabetical order. Thus
two 3-tuples with the first and third amino acid letter permuted
have the same signature. For example the 3-tuples ATC and
CTA are both represented by the signature T(AC). The
signatures are used to construct a signature kernel specifying the
inner product between two proteins. The signature kernel itself is
used in a tensor product to define the signature product kernel
between pairs of proteins.
Protein interaction prediction via binary classificationPrediction of protein interactions via binary classifiers is a well-
known approach, briefly outlined here. In this approach, each data
point corresponds to a protein pair Pi,Pj
� �, which is associated
with a binary class random variable, C, taking two values,
INTR,NON-INTRf g. Each protein pair is represented as binary
feature vector gij , which is obtained from the OR of individual
feature vectors, gi and gj , of the two proteins Pi, respectively:
gij(k)~gi(k) _ gj(k), where k is an index over the feature set. This
allows protein pairs Pi,Pj
� �and Pj ,Pi
� �to be treated
symmetrically, that is gij~gji, Vi,j.
Protein pairs that represent interacting pairs have C~INTR,
and protein pairs representing non-interacting pairs have
C~NON-INTR. We use three types of classifiers well known
in the machine learning literature: maximum entropy classifier
(also known as logistic regression classifier), support vector
machines, and the Naive Bayes classier.
Maximum entropy classifierA maximum entropy classifier is a probabilistic classifier for
binary classification [31], estimating two conditional probability
values, P C~INTRjgij
� �and P C~NON-INTRjgij
� �for each
protein pair Pi,Pj
� �, where gij is the binary feature vector
associated with Pi,Pj
� �. The first conditional probability value
describes the probability of the proteins, Pi and Pj , to interact, and
the second conditional probability describes the probability of
these proteins to not interact. Specifically, the conditional
probability of interacting is:
P C~INTRjgij
� �~
1
Zexp {
XjF jk~1
wk � fk gij kð Þ� � !
:
Here, F is the set of 0-1-valued feature functions, fk, wk is the
weight of fk, gij kð Þ is the value of the kth feature in gij , and Z is a
normalization term. The feature functions, fk[F correspond to
attributes of protein pairs, and return 1 if the attribute is true,
and 0 if the attribute is false. Pi,Pj
� �is classified into INTR
if P Y~INTRjgij
� �wP Y~NON-INTRjgij
� �. We used the
maximum entropy classifier from the Mallet toolkit [32].
Naive Bayes classifierA naive Bayes classifier is similar to a maximum entropy
classifer in that it uses the class conditional distribution to assign a
protein pair to the interacting (INTR) or non-interacting (NON-
INTR) class. However, the form of conditional distribution is
given by
P C~INTRjgij
� �! P
jF j
k~1P gij kð ÞjC~INTR� �
P C~INTRð Þ:
The proportionality term, P gij
� �is the same for
P C~INTRjgij
� �and P C~NON-INTRjgij
� �and is not
required for class prediction. We used the Weka toolkit for the
Naive Bayes classifier [33].
Support vector machineA support vector machine (SVM) classifier does not estimate
class conditional distributions, but rather a maximum margin
hyper-plane between the positive and negative examples of the
class. The hyper-plane is defined by a set of support vectors, and a
data point is classified as INTR or NON-INTR using a set of inner
products with the support vectors. Most real-world data are not
linearly separable in the input feature space requiring non-linear
classifiers that project the input data into a high-dimensional space
where the data is separable. In SVMs, because all computations on
the input data are written as inner products, a kernel function is
typically used to efficiently compute inner products in a high-
dimensional space. We used the SVM classifier with a radial basis
kernel (s~0:01, Supporting text S1, Fig. S1) from the SVMLight
toolkit [34].
DatasetsWe analyzed several protein interaction datasets from yeast,
worm and fly (Table 4). We used three datasets for yeast, S.
cerevisiae, each capturing different types of interactions based on the
experimental assay: TWOHYB (Yeast Two-hybrid), AFFMS
(Affinity pull down with mass spectrometry) and PCA (protein
complementation assay). TWOHYB and PCA comprise pairwise
interactions, whereas AFFMS comprises co-complex interactions.
We treated these three datasets separately to avoid confounding
AAC and Protein Interaction
PLoS ONE | www.plosone.org 11 November 2009 | Volume 4 | Issue 11 | e7813
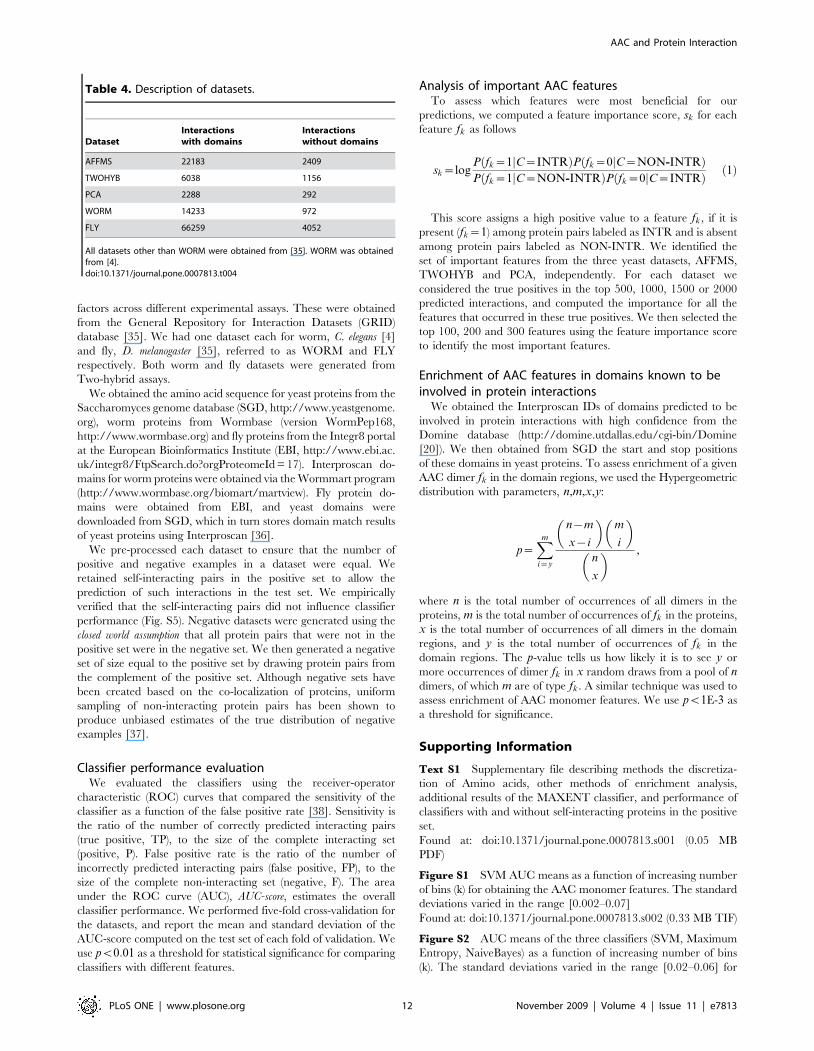
factors across different experimental assays. These were obtained
from the General Repository for Interaction Datasets (GRID)
database [35]. We had one dataset each for worm, C. elegans [4]
and fly, D. melanogaster [35], referred to as WORM and FLY
respectively. Both worm and fly datasets were generated from
Two-hybrid assays.
We obtained the amino acid sequence for yeast proteins from the
Saccharomyces genome database (SGD, http://www.yeastgenome.
org), worm proteins from Wormbase (version WormPep168,
http://www.wormbase.org) and fly proteins from the Integr8 portal
at the European Bioinformatics Institute (EBI, http://www.ebi.ac.
uk/integr8/FtpSearch.do?orgProteomeId = 17). Interproscan do-
mains for worm proteins were obtained via the Wormmart program
(http://www.wormbase.org/biomart/martview). Fly protein do-
mains were obtained from EBI, and yeast domains were
downloaded from SGD, which in turn stores domain match results
of yeast proteins using Interproscan [36].
We pre-processed each dataset to ensure that the number of
positive and negative examples in a dataset were equal. We
retained self-interacting pairs in the positive set to allow the
prediction of such interactions in the test set. We empirically
verified that the self-interacting pairs did not influence classifier
performance (Fig. S5). Negative datasets were generated using the
closed world assumption that all protein pairs that were not in the
positive set were in the negative set. We then generated a negative
set of size equal to the positive set by drawing protein pairs from
the complement of the positive set. Although negative sets have
been created based on the co-localization of proteins, uniform
sampling of non-interacting protein pairs has been shown to
produce unbiased estimates of the true distribution of negative
examples [37].
Classifier performance evaluationWe evaluated the classifiers using the receiver-operator
characteristic (ROC) curves that compared the sensitivity of the
classifier as a function of the false positive rate [38]. Sensitivity is
the ratio of the number of correctly predicted interacting pairs
(true positive, TP), to the size of the complete interacting set
(positive, P). False positive rate is the ratio of the number of
incorrectly predicted interacting pairs (false positive, FP), to the
size of the complete non-interacting set (negative, F). The area
under the ROC curve (AUC), AUC-score, estimates the overall
classifier performance. We performed five-fold cross-validation for
the datasets, and report the mean and standard deviation of the
AUC-score computed on the test set of each fold of validation. We
use pv0:01 as a threshold for statistical significance for comparing
classifiers with different features.
Analysis of important AAC featuresTo assess which features were most beneficial for our
predictions, we computed a feature importance score, sk for each
feature fk as follows
sk~logP fk~1jC~INTRð ÞP fk~0jC~NON-INTRð ÞP fk~1jC~NON-INTRð ÞP fk~0jC~INTRð Þ ð1Þ
This score assigns a high positive value to a feature fk, if it is
present (fk~1) among protein pairs labeled as INTR and is absent
among protein pairs labeled as NON-INTR. We identified the
set of important features from the three yeast datasets, AFFMS,
TWOHYB and PCA, independently. For each dataset we
considered the true positives in the top 500, 1000, 1500 or 2000
predicted interactions, and computed the importance for all the
features that occurred in these true positives. We then selected the
top 100, 200 and 300 features using the feature importance score
to identify the most important features.
Enrichment of AAC features in domains known to beinvolved in protein interactions
We obtained the Interproscan IDs of domains predicted to be
involved in protein interactions with high confidence from the
Domine database (http://domine.utdallas.edu/cgi-bin/Domine
[20]). We then obtained from SGD the start and stop positions
of these domains in yeast proteins. To assess enrichment of a given
AAC dimer fk in the domain regions, we used the Hypergeometric
distribution with parameters, n,m,x,y:
p~Xm
i~y
n{m
x{i
� �m
i
� �n
x
� � ,
where n is the total number of occurrences of all dimers in the
proteins, m is the total number of occurrences of fk in the proteins,
x is the total number of occurrences of all dimers in the domain
regions, and y is the total number of occurrences of fk in the
domain regions. The p-value tells us how likely it is to see y or
more occurrences of dimer fk in x random draws from a pool of n
dimers, of which m are of type fk. A similar technique was used to
assess enrichment of AAC monomer features. We use pv1E-3 as
a threshold for significance.
Supporting Information
Text S1 Supplementary file describing methods the discretiza-
tion of Amino acids, other methods of enrichment analysis,
additional results of the MAXENT classifier, and performance of
classifiers with and without self-interacting proteins in the positive
set.
Found at: doi:10.1371/journal.pone.0007813.s001 (0.05 MB
PDF)
Figure S1 SVM AUC means as a function of increasing number
of bins (k) for obtaining the AAC monomer features. The standard
deviations varied in the range [0.002–0.07]
Found at: doi:10.1371/journal.pone.0007813.s002 (0.33 MB TIF)
Figure S2 AUC means of the three classifiers (SVM, Maximum
Entropy, NaiveBayes) as a function of increasing number of bins
(k). The standard deviations varied in the range [0.02–0.06] for
Table 4. Description of datasets.
DatasetInteractionswith domains
Interactionswithout domains
AFFMS 22183 2409
TWOHYB 6038 1156
PCA 2288 292
WORM 14233 972
FLY 66259 4052
All datasets other than WORM were obtained from [35]. WORM was obtainedfrom [4].doi:10.1371/journal.pone.0007813.t004
AAC and Protein Interaction
PLoS ONE | www.plosone.org 12 November 2009 | Volume 4 | Issue 11 | e7813

SVM, [0.02–0.07] for Naive Bayes, and [0.02–0.05] for Maximum
entropy classifiers.
Found at: doi:10.1371/journal.pone.0007813.s003 (0.30 MB TIF)
Figure S3 AUC mean of SVM classifier as a function of
increasing number of bins (k) for obtaining the AAC dimer
features.
Found at: doi:10.1371/journal.pone.0007813.s004 (0.24 MB TIF)
Figure S4 Maximum Entropy classifier performance using AAC
or tuple features on protein pairs with and without domains, and
the complete dataset.
Found at: doi:10.1371/journal.pone.0007813.s005 (0.69 MB TIF)
Figure S5 Performance comparison of the SVM classifier with
or without the self-interacting proteins. Classifiers used either AAC
monomer or domains as features.
Found at: doi:10.1371/journal.pone.0007813.s006 (0.43 MB TIF)
Acknowledgments
We thank George Davidson for useful discussions, and Shawn Martin for
making his signature product algorithm available to us.
Author Contributions
Conceived and designed the experiments: SR DM TL MWW. Performed
the experiments: SR DM HP. Analyzed the data: SR DM HP TL MWW.
Contributed reagents/materials/analysis tools: DM HP. Wrote the paper:
SR TL MWW.
References
1. Ito T, Tashiro K, Muta S, Ozawa R, Chiba T, et al. (2000) Toward a protein-
protein interaction map of the budding yeast: A comprehensive system toexamine two-hybrid interactions in all possible combinations between the yeast
proteins. Proc Natl Acad Sci USA, 97;3.2. Uetz P, Giot L, Cagney G, Mansfield TA, Judson RS, et al. (2000) A
comprehensive analysis of protein-protein interactions in saccharomyces
cerevisiae. Nature 403.3. Krogan NJ, Cagney G, Yu H, Zhong G, Guo X, et al. (2006) Global landscape
of protein complexes in the yeast saccharomyces cerevisiae. Nature 440.4. Li S, Armstrong CM, Bertin N, Ge H, Milstein S, et al. (2004) A Map of the
Interactome Network of the Metazoan C. elegans. Science 303: 540–543.
5. Yu H, Braun P, Yildirim MA, Lemmens I, Venkatesan K, et al. (2008) High-quality binary protein interaction map of the yeast interactome network.
Science. pp 1158684+.6. Simonis N, Rual JF, Carvunis AR, Tasan M, Lemmens I, et al. (2008)
Empirically controlled mapping of the caenorhabditis elegans protein-proteininteractome network. Nat Meth 6: 47–54.
7. Huang H, Bader JS (2009) Precision and recall estimates for two-hybrid screens.
Bioinformatics (Oxford, England) 25: 372–378.8. Shoemaker BA, Panchenko AR (2007) Deciphering protein-protein interactions.
part i. experimental techniques and databases. PLOS Comput Biol 3;3.9. Shoemaker BA, Panchenko AR (2007) Deciphering protein-protein interactions.
part ii. computational methods to predict protein and domain interaction
partners. PLOS Computat Biol 3;4.10. Gomez SM, Noble WS, Rzhetsky A (2003) Learning to predict protein-protein
interactions from protein sequences. Bioinformatics 19;15.11. Sprinzak E, Margalit H (2001) Correlated sequence-signatures as markers of
protein-protein interaction. J of Mol Biol 311(4).12. Liu Y, Liu N, Zhao H (2005) Inferring protein-protein interactions through
high-throughput interaction data from diverse organisms. Bioinformatics 21(5):
3279–3285.13. Kann MG, Jothi R, Cherukuri PF, Przytycka TM (2007) Predicting protein
domain interactions from coevolution of conserved regions. Proteins 67:811–820.
14. Martin S, Roe D, Falon JL (2005) Predicting protein-protein interations using
signature products. Bioinformatics 21(2): 218–226.15. Sun J, Xu J, Liu Z, Liu Q, Zhao A, et al. (2005) Refined phylogenetic profiles
method for predicting protein-protein interactions. Bioinformatics 21;16.16. Jothi R, Przytycka TM, Aravind L (2007) Discovering functional linkages and
uncharacterized cellular pathways using phylogenetic profile comparisons: acomprehensive assessment. BMC bioinformatics 8: 173+.
17. Jansen R, Yu H, Greenbaum D, Kluger Y, Krogan NJ, et al. (2003) A bayesian
networks approach for predicting protein-protein interactions from genomicdata. Science 302;449.
18. Jaimovich A, Elidan G, Margalit H, Friedman N (2006) Towards an integratedprotein-protein interaction network: a relational markov network approach.
J Comput Biol 13(2): 145–164.
19. Qiu J, Noble WS (2008) Predicting co-complexed protein pairs fromheterogeneous data. PLoS computational biology 4.
20. Raghavachari B, Tasneem A, Przytycka TM, Jothi R (2008) Domine: a database
of protein domain interactions. Nucleic acids research 36.21. Ashburner M, Ball CA, Blake JA, Botstein D, Butler H, et al. (2000) Gene
ontology: tool for the unification of biology. The Gene Ontology Consortium.Nat Genet 25: 25–29.
22. Gasch AP, Spellman PT, Kao CM, Carmel-Harel O, Eisen MB, et al. (2000)
Genomic expression programs in the response of yeast cells to environmentalchanges. Mol Biol Cell. pp 4421–4257.
23. Werner-Washburne M, Wylie B, Boyack K, Fuge E, Galbraith J, et al. (2002)Comparative analysis of multiple genome-scale data sets. Genome Res 12:
1564–1573.
24. Mahdavi M, Lin YH (2007) False positive reduction in protein-proteininteraction predictions using gene ontology annotations. BMC Bioinformatics
8: 262+.25. Li R (1997) Bee1, a yeast protein with homology to wiscott-aldrich syndrome
protein, is critical for the assembly of cortical actin cytoskeleton. J Cell Biol 136:649–658.
26. Lee I, Lehner B, Crombie C, Wong W, Fraser A, et al. (2008) A single gene
network accurately predicts phenotypic effects of gene perturbation incaenorhabditis elegans. Nature Genetics 40: 181–188.
27. Langley P, Iba W, Thompson K (1992) An analysis of bayesian classifiers. In:National Conference on Artificial Intelligence. pp. 223–228. URL citeseer.
ist.psu.edu/langley92analysis.html.
28. Ofran Y, Rost B (2003) Analysing six types of protein-protein interfaces. J of MolBiol 325; 2: 377–387.
29. Fong JH, Keating AE, Singh M (2004) Predicting specificity in bzip coiled-coilprotein interactions. Genome Biol 5: R11.
30. Quevillon E, Silventoinen V, Pillai S, Harte N, Mulder N, et al. (2001)Interproscan: protein domains identifier. Nucleic Acids Res 33.
31. Nigam K, Lafferty J, McCallum A (1999) Using maximum entropy for text
classification. In: IJCAI-99 Workshop on Machine Learning for InformationFiltering. pp. 61–67. URL citeseer.ist.psu.edu/nigam99using.html.
32. McCallum AK (2002) Mallet: A machine learning for language toolkit. Http://mallet.cs.umass.edu.
33. Witten IH, Frank E (2002) Data mining: practical machine learning tools and
techniques with Java implementations. ACM SIGMOD Record 31: 76–77.34. Joachims T (1999) Making large-scale support vector machine learning practical.
In: Scholkopf B, Burges CJC, Smola AJ, editors, Advances in kernel methods:support vector learning, Cambridge, MA, USA: MIT Press. pp. 169–184.URL
http://portal.acm.org/citation.cfm?id=299104.35. Stark C, Breitkreutz BJ, Reguly T, Boucher L, Breitkreutz A, et al. (2006)
Biogrid: a general repository for interaction datasets. Nucleic Acids Res 1;34.
36. Quevillon E, Silventoinen V, Pillai S, Harte N, Mulder N, et al. (2005)Interproscan: protein domains identifier. Nucl Acids Res 33: W116–120.
37. Ben-Hur A, Noble WS (2006) Choosing negative examples for the prediction ofprotein-protein interactions. BMC Bioinformatics 7.
38. Lasko TA, Bhagwat JG, Zou KH, Ohno-Machado L (2005) The use of receiver
operating characteristic curves in biomedical informatics. J of BiomedicalInformatics 38: 404–415.
AAC and Protein Interaction
PLoS ONE | www.plosone.org 13 November 2009 | Volume 4 | Issue 11 | e7813