Oculomotor control, brain potentials, and timelines of word recognition during natural reading

Exploiting Timelines to Enhance Multi-document Summarization
Jun-Ping Ng1,2, Yan Chen3, Min-Yen Kan2,4, Zhoujun Li3
1DSO National Laboratories, Singapore2School of Computing, National University of Singapore, Singapore
3State Key Laboratory of Software Development Environment, Beihang University, China4Interactive and Digital Media Institute, National University of Singapore, Singapore
Abstract
We study the use of temporal informationin the form of timelines to enhance multi-document summarization. We employ afully automated temporal processing sys-tem to generate a timeline for each in-put document. We derive three featuresfrom these timelines, and show that theiruse in supervised summarization lead to asignificant 4.1% improvement in ROUGEperformance over a state-of-the-art base-line. In addition, we propose TIMEMMR,a modification to Maximal Marginal Rel-evance that promotes temporal diversityby way of computing time span similar-ity, and show its utility in summarizingcertain document sets. We also propose afiltering metric to discard noisy timelinesgenerated by our automatic processes, topurify the timeline input for summariza-tion. By selectively using timelines guidedby filtering, overall summarization perfor-mance is increased by a significant 5.9%.
1 Introduction
There has been a good amount of research in-vested into improving the temporal interpretationof text. Besides the increasing availability of an-notation standards (e.g., TIMEML (Pustejovsky etal., 2003a)) and corpora (e.g., TIDES (Ferro etal., 2000), TimeBank (Pustejovsky et al., 2003b)),the community has also organized three success-ful evaluation workshops — TempEval-1 (Verha-gen et al., 2009), -2 (Verhagen et al., 2010), and-3 (Uzzaman et al., 2013). As the state-of-the-art improves, these workshops have moved awayfrom the piecemeal evaluation of individual tem-poral processing tasks and towards the evaluationof complete end-to-end systems in TempEval-3.
We believe our understanding of the temporal in-formation found in text is sufficiently robust, andthat there is an opportunity to now leverage this in-formation in downstream applications. In this pa-per, we present our work in incorporating the useof such temporal information into multi-documentsummarization.
The goal of multi-document summarization isto generate a summary which includes the mainpoints from an input collection of documents withminimal repetition of similar points. We hope toimprove the quality of the summaries that are gen-erated by considering temporal information foundin the input text. To motivate how temporal in-formation can be useful in summarization, let usrefer to Figure 1. The three sentences describe arecent cyclone and a previous one which happenedin 1991. Recognizing that sentence (3) is about astorm that had happened in the past is importantwhen writing a summary about the recent storm,as it is not relevant and can likely be excluded.
It is reasonable to expect that a collection ofdocuments about the recent storm will containmore references to it, compared with the earlierone that happened in 1991. Visualized on a time-line, this will translate to more events (bolded inFigure 1) around the time when the recent stormoccurred. There should be fewer events mentionedin the collection for the earlier 1991 time period.Figure 2 illustrates a possible timeline laid outwith the events found in Figure 1. The eventsfrom the more recent storm are found together atthe same time. There are fewer events which talkabout the previous storm. Thus, temporal informa-tion does assist in identifying which sentences aremore relevant to the final summary.
Our work is significant as it addresses an im-portant gap in the exploitation of temporal infor-mation. While there has been prior work makinguse of temporal information for multi-document

(1) A fierce cyclone packing extreme winds and torrential rain smashed into Bangladesh’s southwestern coast Thursday,wiping out homes and trees in what officials described as the worst storm in years.(2) More than 100,000 coastal villagers have been evacuated before the cyclone made landfall.(3) The storm matched one in 1991 that sparked a tidal wave that killed an estimated 138,000 people, Karmakar told AFP.
Figure 1: Modified extract from a news article which describes a cyclone landfall. Several events whichappear in Figure 2 are bolded.
smashed
packing
wiping
describedsparked killed ...
Storm in 1991 Latest cyclone
evacuated
2013-Feb-13 11:32 +0000
Figure 2: Possible timeline for events in Figure 1.
summarization, they 1) have been largely con-fined to helping to chronologically order contentwithin summaries (Barzilay et al., 1999), or 2)focus only on the use of recency as an indicatorof saliency (Goldstein et al., 2000; Wan, 2007).In this work we construct timelines (as a repre-sentation of temporal information) automaticallyand incorporate them into a state-of-the-art multi-document summarization system. This is achievedwith 1) three novel features derived from time-lines to help measure the saliency of sentences,as well as 2) TIMEMMR, a modification to thetraditional Maximal Marginal Relevance (MMR)(Carbonell and Goldstein, 1998). TimeMMR pro-motes diversity by additionally considering tem-poral information instead of just lexical similari-ties. Through these, we demonstrate that temporalinformation is useful for multi-document summa-rization. Compared to a competitive baseline, sig-nificant improvements of up to 4.1% are obtained.
Automatic temporal processing systems are notperfect yet, and this may have an impact on theiruse for downstream applications. This work ad-ditionally proposes the use of the lengths of time-lines as a metric to gauge the usefulness of time-lines. Together with the earlier described contribu-tions, this metric further improves summarization,yielding an overall 5.9% performance increase.
2 Related Work
Barzilay et al. (1999) were one of the first to usetime for multi-document summarization. Theyrecognized the importance of generating a sum-mary which presents the time perspective of thesummarized documents correctly. They estimatedthe chronological ordering of events with a small
set of heuristics, and also made use of lexical pat-terns to perform basic time normalization on termslike “today” relative to the document creationtime. The induced ordering is used to present theselected summary content, following the chrono-logical order in the original documents.
In another line of work, Goldstein et al. (2000)made use of the temporal ordering of documentsto be summarized. In computing the relevance of apassage for inclusion into the final summary, theyconsidered the recency of the passage’s sourcedocument. Passages from more recent documentsare deemed to be more important. Wan (2007)and Demartini et al. (2010) made similar assump-tions in their work on TIMEDTEXTRANK and en-tity summarization, respectively.
Instead of just considering the notion of re-cency, Liu et al. (2009) proposed an interestingapproach using a temporal graph. Events withina document set correspond to vertices in their pro-posed graph, while edges are determined by thetemporal ordering of events. From the resultingweakly-connected graph, the largest forests are as-sumed to contain key topics within the documentset and used to influence a scoring mechanismwhich prefers sentences touching on these topics.
Wu (2008) also made use of the relative or-dering of events. He assigned complete times-tamps to events extracted from text. After lay-ing out these events onto a timeline by makinguse of these timestamps, the number of events thathappen within the same day is used to influencesentence scoring. The motivation behind this ap-proach is that days which have a large number ofevents should be more important and more worthyof reporting than others.
These prior works target either 1) sentence re-ordering, or 2) the use of recency as an indicator ofsaliency. In sentence re-ordering, final summariesare re-arranged so that the extracted sentences thatform the summary are in a chronological order.We argue that this may not be appropriate for allsummaries. Depending on the style of writing orjournalistic guidelines, a summary can arguably bewritten in a number of ways. The use of recency

as an indicator of saliency is useful, yet disregardsother accessible temporal information. If a sum-mary of a whole sequence of events is desired, re-cency becomes less useful.
The work of Wu (2008) is closely related to oneof the features proposed in this paper. He had alsomade use of temporal information to weight sen-tences to generate summaries. However his ap-proach is guided by the number of events hap-pening within the same time span, and relies onevent co-referencing. In this work, we have sim-plified this idea by dropping the need for event co-referencing (removing a source of propagated er-ror), and augmented it with two additional featuresderived from timelines. By doing so, we are ableto make better use of the available temporal infor-mation, taking into account all known events andthe time in which they occur.
A useful note here is that this work is ar-guably different from the Temporal Summariza-tion (TmpSum) track at the Text Retrieval Confer-ence (Aslam et al., 2013). Given a large streamof data in real-time, the purpose of the TmpSumtrack is to look out for a query event, and retrievespecific details about the event over a period oftime. Systems are also expected to identify thesource sentences from which these details are re-trieved. This is not the same as our approach here,which makes use of temporal information encodedin timelines to generate prose summaries.
3 Methodology
To incorporate temporal information into multi-document summarization, we adopt the workflowin Figure 3, which has two key processes: 1) tem-poral processing, and 2) summarization.
Input DocumentsInput
DocumentsInput Documents E-T
Temporal Classification
E-ETemporal
Classification
Event and TimexExtraction
SentenceScoring
SentenceRe-ordering
Pre-processing Summary
Summarization Pipeline
Temporal Processing
TimelineGeneration
TimexNormalization
TimelinesTimelines
Figure 3: Incorporating temporal information intothe SWING summarization pipeline.
Temporal Processing generates timelines fromtext, one for each input document. Timelines are
well-understood constructs which have often beenused to represent temporal information (Denis andMuller, 2011; Do et al., 2012). They indicate thetemporal relationships between two basic tempo-ral units: 1) events, and 2) time expressions (ortimexes for short). In this work, we adopt thedefinitions proposed in the standardized TIMEMLannotation (Pustejovsky et al., 2003a). An eventrefers to an eventuality, a situation that occurs oran action; while a timex is a reference to a partic-ular date or time (e.g. “2013 December 31”).
Following the “divide-and-conquer” approachdescribed in Verhagen et al. (2010), results fromthe three temporal processing steps: 1) timex nor-malization, 2) event-timex temporal relationshipclassification, and 3) event-event temporal rela-tionship classification, are merged to obtain time-lines (top half of Figure 3). We tap on existingsystems for each of these steps (Ng and Kan, 2012;Strotgen and Gertz, 2013; Ng et al., 2013).
Summarization. We make use of a state-of-the-art summarization system, SWING (Ng et al.,2012) (bottom half of Figure 3). SWING is a su-pervised, extractive summarization system whichranks sentences based on scores computed usinga set of features in the Sentence Scoring phase.The Maximal Marginal Relevance (MMR) algo-rithm is then used in the Sentence Re-orderingphase to re-order and select sentences to form thefinal summary. The timelines built in the ear-lier temporal processing can be incorporated intothis pipeline by deriving a set of features used toscore sentences in Sentence Scoring, and as inputto the MMR algorithm when computing similarityin Sentence Re-ordering.
3.1 Timelines from Temporal Processing
A typical timeline used in this work has beenshown earlier in Figure 2. The arrowed, horizon-tal axis is the timeline itself. The timeline canbe viewed as a continuum of time, with points onthe timeline referring to specific moments of time.Small solid blocks on the timeline itself are ref-erences to absolute timestamps along the timeline(e.g., “2013-Feb-13 11:32 +0000” in the figure).
The black square boxes above the timeline de-note events. Events can either occur at a specificinstance of time (e.g., an explosion), or over a pe-riod of time (e.g. a football match). Generalizing,we refer to the time period an event takes place inas its time span (vertical dotted lines). As a simpli-

left peak of e right peak of e
bigg
est
clus
ter
Time Span A Time Span A+4
e
Figure 4: A simplified timeline illustrating howthe various timeline features can be derived.
fying assumption, events are laid out on the time-line based on the starting time of their time span.Note that in our work, time spans may not cor-respond to specific instances of time, but insteadhelp in inferring an ordering of events. Eventswhich appear to the left of others take place ear-lier, while events within the same time span hap-pen together over the same time period.
3.2 Sentence Scoring with TimelinesWe derive three features from the constructedtimelines, which are then used for downstreamSentence Scoring. Figure 4 shows a simplifiedtimeline, along with annotations that are refer-enced in this section to help explain how thesetimeline features are derived.
1. Time Span Importance (TSI). We hypothe-size that when more events happen within a partic-ular time span, that time span is potentially morerelevant for summarization. Sentences that men-tion events found in such a time span should be as-signed higher scores. Referring to Figure 1, whosetimeline is shown in Figure 2, we see that the timespan with the most number of events is when thelatest cyclone made landfall. Assigning higherscores for sentences which contain events in thistime span will help us to select more relevant sen-tences if we want a summary about the cyclone.
Let TSL be the time span with the largest num-ber of events in a timeline. The importance ofa time span TSi is computed by normalizing thenumber of events in TSi against the number ofevents in TSL. The TSI of a sentence s is thenthe sum of the time span importance associated toall the words in s:
TSI(s) =
∑w∈s
|TSw||TSL|
|s|(1)
where TSw denotes the time span which a wordw is associated with, and |TSw| is the number ofevents within the time span.
2. Contextual Time Span Importance(CTSI). The importance of a time span may notdepend solely on the number of events that hap-pen within it. If it is near time spans which are“important” (i.e., one that has a large number ofevents), it should also be of relative importance. Amore concrete illustration of this can also be seenin Figure 1. Sentence (2) explains that a lot of peo-ple have been evacuated prior to the cyclone mak-ing landfall. It is imaginable that this can be use-ful information to be included in a summary, eventhough from looking at the corresponding timelinein Figure 2, the “evacuated” event falls in a timespan with a low importance score (i.e., the timespan only has one event). CTSI seeks to promotesentences such as this.
We derive the CTSI of a sentence by first com-puting the contextual importance of words in thesentence. We define the contextual importance ofa word found in time span TSi as a weighted sumof the time span importance of the two nearestpeaks TSlp and TSrp found to the left and rightof TSi, respectively. In Figure 4, taking referencefrom event e (shaded in black), the left peak to thetime span which e is in happens to be time spanA, while the right peak is time span A + 4. Thecontribution of each peak to the weighted sum isdecayed by its distance from TSi. Formally, thecontextual time span importance of a word w canbe expressed as:
ζ(w) = α
(Ilp
|TSw − TSlp|
)× (1− α)
(Irp
|TSrp − TSw|
)(2)
where TSw is the time span associated with w. Ilpand Irp are the time span importance of the peaksto the left and right of TSw respectively, while|TSw − TSlp| and |TSrp − TSw| are the num-ber of time spans between the left and right peaksof TSw respectively. α balances the importance ofthe left and right peaks, intuitively set to 0.5. TheCTSI of a sentence is computed as:
CTSI(s) =
∑e∈Es
ζ(e)
|Es|(3)
where Es denotes the set of events words in s.3. Sentence Temporal Coverage Density
(TCD). We first define the temporal coverage of asentence. This corresponds to the number of timespans that the events in a sentence talk about. Sup-pose a sentence contains events which are associ-ated with time spans TSa, TSb, TSc. The timespans are ordered in the sequence they appear on

the timeline. Then the temporal coverage of a sen-tence is defined as the number of time spans be-tween the earliest time span TSa and the latesttime span TSc. Referring to Figure 4, supposea sentence contains the three events which havebeen shaded black. The temporal coverage in thiscase includes all the time spans from time span Ato time span A+ 4, inclusive.
The constraint on the number of sentences thatcan be included in a summary requires us to selectcompact sentences which contain as many rele-vant facts as possible. Traditional lexical measuresmay attempt to achieve this by computing the ra-tio of keyphrases to the number of words in a sen-tence (Gong and Liu, 2001). Stated equivalently,when two sentences are of the same length, if onecontains more keyphrases, it should contain moreuseful facts. TCD parallels this idea with the useof temporal information, i.e. if two sentences areof the same temporal coverage, then the one withmore events should carry more useful facts.
Formally, if a sentence s contains events Es ={e1, . . . , en}, where each event is associated witha time span TSi, then TCD is computed using:
TCD(s) =|Es|
|TSn − TS1|(4)
where |Es| is the number of events found in s, and|TSn − TS1| is the temporal coverage of s.
3.3 Enhancing MMR with TimeMMR
In the sentence re-ordering stage of the SWINGpipeline, the iterative MMR algorithm is used toadjust the score of a candidate sentence, s. In eachiteration, s is penalized if it is lexically similar toother sentences that have already been selected toform the eventual summary S = {s1, s2, . . .}. Themotivating idea is to reduce repeated informationby preferring sentences which bring in new facts.
Incorporating temporal information can poten-tially improve this. In Figure 5, the sentences de-scribe many events which took place within thesame time span. They describe the destructioncaused by a hurricane with trees uprooted andbuildings blown away. A summary about the hur-ricane need not contain all of these sentences asthey are all describing the same thing. Howeverit is not trivial for the lexically-motivated MMRalgorithm to detect that events like “passed”, “up-rooted” or “damaged” are in fact repetitive.
Thus, we propose further penalizing the scoreof s if it contains events that happen in similar
time spans as those contained in sentences withinS. We refer to this as TIMEMMR. Modifying theMMR equation from Ng et al. (2012):
TimeMMR(s) = Score(s)− γR2(s, S)− (1− γ)T (s, S) (5)
where Score(s) is the score of s, S is the set ofsentences already selected to be in the summaryfrom previous iterations, and R2 is the predictedROUGE-2 score of s with respect to the alreadyselected sentences (S). γ is a weighting parameterwhich is empirically set to 0.9 after tuning over adevelopment dataset. T is the proportion of eventsin swhich happen in the same time span as anotherevent in any other sentence in S. Two events aresaid to be in the same time span if one happenswithin the time period the other happens in. Forexample, an event that takes place in “2014 June”is said to take place within the year “2014”.
While TIMEMMR is proposed here as an im-provement over MMR, the premise is that incor-porating temporal information can be helpful tominimize redundancy in summaries. In futurework, one could apply it to other state-of-the-artlexical-based approaches including that of Hen-drickx et al. (2009) and Celikyilmaz and Hakkani-Tur (2010). We also believe the same idea can betransplanted even to non-lexical motivated tech-niques such as the corpus-based similarity mea-sure proposed by Xie and Liu (2008). We choseto use MMR here as a proof-of-concept to demon-strate the viability of such a technique, and to eas-ily integrate our work into SWING.
3.4 Gauging Usefulness of TimelinesTemporal processing is imperfect. Together withthe simplifying assumptions that were made intimeline construction, our generated timelineshave errors which propagate into the summariza-tion process. With this in mind, we selectively em-ploy timelines to generate summaries only whenwe are confident of their accuracy. This can bedone by computing a metric which can be used todecide whether or not timelines should be used fora particular input document collection. We refer tothis as reliability filtering.
We postulate that the length of a timeline canserve as a simple reliability filtering metric. Theintuition for this is that for longer timelines (whichcontain more events), possible errors are spreadover the entire timeline, and do not overpower anyuseful signal that can be obtained from the time-line features outlined earlier. Errors are however

(1) An official in Barisal, 120 kilometres south of Dhaka, spoke of severe destruction as the 500 kilometre-wide mass of cloudpassed overhead.(2) “Many trees have been uprooted and houses and schools blown away,” Mostofa Kamal, a district relief and rehabilitationofficer, told AFP by telephone.(3) “Mud huts have been damaged and the roofs of several houses blown off,” said the state’s relief minister, Mortaza Hossain.
Figure 5: Extract from a news article which describes several events (bolded) happening at the sametime.
very easily propagated into summary generationfor shorter timelines, leading to less useful results.
We incorporate this into our process as follows:given an input document collection (which con-sists of 10 documents), the average size of all thetimelines for each of these 10 documents is com-puted. Only when this value is larger than a thresh-old value are the timelines used.
4 Experiments and Results
The proposed timeline features and TIMEMMRwere implemented on top of SWING, and eval-uated on the test documents from TAC-2011(Owczarzak and Dang, 2011). SWING makes useof three generic features and two features targetedspecifically at guided summarization. Since thefocus of this paper is on multi-document summa-rization, we employ only the three generic fea-tures, i.e., 1) sentence position, 2) sentence length,and 3) interpolated n-gram document frequencyin our experiments below. Summarization evalua-tion is done using ROUGE-2 (R-2) (Lin and Hovy,2003), as it has previously been shown to correlatewell with human assessment (Lin, 2004) and is of-ten used to evaluate automatic text summarization.
The results obtained are shown in Table 1. Inthe table, each row refers to a specific summariza-tion system configuration. We also show the re-sults of two reference systems, CLASSY (Conroyet al., 2011) and POLYCOM (Zhang et al., 2011),as benchmarks. CLASSY and POLYCOM are topperforming systems at TAC-2011 (ranked 2nd and3rd by R-2 in TAC 2011, respectively; the full ver-sion of SWING was ranked 1st with a R-2 scoreof 0.1380). From these results, we can see thatSWING is a very competitive baseline.
Rows 9 to 16 additionally incorporate our time-line reliability filtering. We assume that the var-ious input document sets to be summarized areavailable at the time of processing. Hence in theseexperiments, the threshold for filtering is set to bethe average of all the timeline sizes over the wholeinput dataset. In a production environment wherethis assumption may not hold, this threshold could
Configuration R-2 SigR SWING 0.1339 NAB1 CLASSY 0.1278 -B2 POLYCOM 0.1227 **Without Filtering1 SWING+TSI+CTSI+TCD 0.1394 *2 SWING+TSI+CTSI 0.1372 -3 SWING+TSI+TCD 0.1372 -4 SWING+CTSI+TCD 0.1387 *5 SWING+TSI+CTSI+TCD+TMMR 0.1389 -6 SWING+TSI+CTSI+TMMR 0.1374 -7 SWING+TSI+TCD+TMMR 0.1343 -8 SWING+CTSI+TCD+TMMR 0.1363 -With Filtering9 SWING+TSI+CTSI+TCD 0.1418 **10 SWING+TSI+CTSI 0.1378 **11 SWING+TSI+TCD 0.1389 **12 SWING+CTSI+TCD 0.1401 **13 SWING+TSI+CTSI+TCD+TMMR 0.1402 **14 SWING+TSI+CTSI+TMMR 0.1397 **15 SWING+TSI+TCD+TMMR 0.1376 *16 SWING+CTSI+TCD+TMMR 0.1390 **
Table 1: R-2 scores after incorporating temporalinformation into SWING. ‘**’ and ‘*’ denotes sig-nificant differences with respect to Row R (pairedone-tailed Student’s t-test; p < 0.05 and p < 0.1respectively), and TMMR denotes TIMEMMR.
be set by empirical tuning over a development set.Row 1 shows the usefulness of the proposed
timeline-based features. A statistically significantimprovement of 4.1% is obtained with the use ofall three features over SWING. When we use re-liability filtering (Row 9), this improvement in-creases to 5.9%.
The ablation test results in Rows 2 to 4 showa drop in R-2 each time a feature is left out. Withthe exception of Row 4, removing a feature lessensthe improvement in R-2 to be insignificant fromSWING’s. The same drop occurs even when reli-ability filtering is used (Rows 9 to 12). These in-dicate that all the proposed features are importantand need to be used together to be effective.
Rows 5 to 8 and Rows 13 to 16 show the ef-fect of TIMEMMR. While the results do not uni-formly show that TIMEMMR is effective, it can behelpful, such as when comparing Rows 2 and 6, orRows 10 and 14, where R-2 improves marginally.
Looking at Rows 1 to 8, and Rows 9 to 16, wesee the importance of reliability filtering. It is able

to guide the use of timelines such that significantimprovements in R-2 over SWING are obtained.
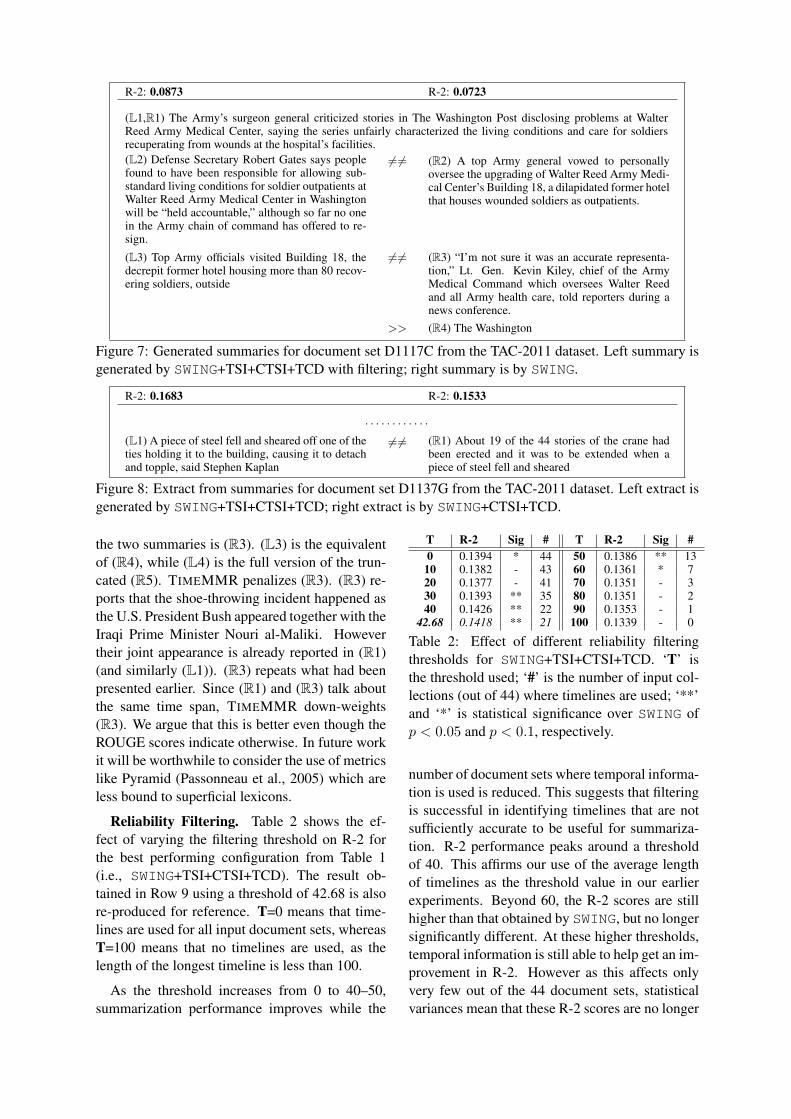
To help visualize what the differences in theseROUGE scores mean, Figure 7 shows two sum-maries1 generated for document set D1117C of theTAC-2011 dataset. The left one is produced by theconfiguration in Row 9, and the right one is pro-duced by SWING without the use of any temporalinformation.
0.0
0.2
0.4
0.6
0.8
1.0
SP Length INDF TSI CTSI TCD
Feat
ure
Scor
e
Features
L2 R2
Figure 6: Breakdown of raw feature scores for sen-tences (L2) and (R2) from Figure 7.
The higher R-2 score obtained by the summaryon the left (0.0873) compared to the one on theright (0.0723) suggests that temporal informationcan help to identify salient sentences more accu-rately. A closer look at sentences (L2) and (R2)and their R-2 scores (0.0424 and 0.0249, respec-tively) is instructive. Figure 6 shows the raw fea-ture scores of both sentences. Both sentencesscore similarly for the SWING features of sen-tence position (SP), sentence length (Length), andinterpolated n-gram document frequency (INDF);however, the scores for all three timeline featureshigher for (L2) than (R2). This helps our time sen-sitive system prefer (L2).
5 Discussion
We now examine the proposed 1) timeline fea-tures, 2) TIMEMMR algorithm, and 3) reliabil-ity filtering metric in greater detail to gain insightinto their efficacy. For the analysis on timelinefeatures, we only present an analysis for TSI andCTSI due to space constraints.
Time Span Importance. Figure 8 shows thelast sentences from a pair of summaries generatedwith and without the use of TSI (all other sen-tences were the same). The original articles de-scribe an accident where casualties were sufferedwhen a crane toppled onto a building. It is easy tosee why (L1) scores higher for R-2 — it describesthe cause of the accident just as it occurred. (R1)however talks about events which happened before
1The produced summaries are truncated to fit within a100-word limit imposed by the TAC-2011 guidelines.
the accident itself (e.g., how much of the tower hadalready been erected). In this case time span im-portance is able to correctly guide summary gen-eration by favoring time spans containing eventsrelated to the actual toppling.
Contextual Time Span Importance. CTSIrecognizes that events which happen around thetime of a big cluster of other events can be im-portant too. The benefits of this feature can beclearly seen in Figure 9. The summary on the leftachieved a R-2 score of 0.1215 while the one onthe right achieved 0.0861. (L2) and (L3) wereboth boosted by the use of the contextual impor-tance feature.
Figure 10 shows an extract of the timeline gen-erated for the source document from which (L3)is extracted. The two events inside (L3) fall intime spans A and B marked in the figure. Theirproximity to the peak P between them gives thesentence a higher score for CTSI. This boost re-sults in the sentence being selected for inclusionin the final summary. It turns out that this sentencewas lifted exactly in one of the model summariesfor this document set, resulting in a very good R-2score when contextual importance is used.
warn disappear
Peak here affects time span contextual importance of A and B
A BP
Figure 10: Extract of timeline generated for doc-ument APW ENG 20070615.0356 from the TAC-2011 dataset.
Is TIMEMMR Useful? The experimental re-sults do not conclusively affirm the usefulness ofTIMEMMR. However we believe it is becausethe ROUGE measures that are used for evalua-tion are not suited for this purpose. Recall thatTIMEMMR seeks to eliminate redundancy basedon time span similarities and not lexical likeness.ROUGE, however, measures the latter.
An interesting case in point is given in Fig-ure 11. The summary on the left is generatedusing TIMEMMR and achieved a lower ROUGEscore. The one on the right is generated with-out TIMEMMR and scores higher, suggesting thatTIMEMMR is not helpful. The key difference in
R-2: 0.0873 R-2: 0.0723
(L1,R1) The Army’s surgeon general criticized stories in The Washington Post disclosing problems at WalterReed Army Medical Center, saying the series unfairly characterized the living conditions and care for soldiersrecuperating from wounds at the hospital’s facilities.(L2) Defense Secretary Robert Gates says peoplefound to have been responsible for allowing sub-standard living conditions for soldier outpatients atWalter Reed Army Medical Center in Washingtonwill be “held accountable,” although so far no onein the Army chain of command has offered to re-sign.
6= 6= (R2) A top Army general vowed to personallyoversee the upgrading of Walter Reed Army Medi-cal Center’s Building 18, a dilapidated former hotelthat houses wounded soldiers as outpatients.
(L3) Top Army officials visited Building 18, thedecrepit former hotel housing more than 80 recov-ering soldiers, outside
6= 6= (R3) “I’m not sure it was an accurate representa-tion,” Lt. Gen. Kevin Kiley, chief of the ArmyMedical Command which oversees Walter Reedand all Army health care, told reporters during anews conference.
>> (R4) The Washington
Figure 7: Generated summaries for document set D1117C from the TAC-2011 dataset. Left summary isgenerated by SWING+TSI+CTSI+TCD with filtering; right summary is by SWING.
R-2: 0.1683 R-2: 0.1533
. . . . . . . . . . . .
(L1) A piece of steel fell and sheared off one of theties holding it to the building, causing it to detachand topple, said Stephen Kaplan
6= 6= (R1) About 19 of the 44 stories of the crane hadbeen erected and it was to be extended when apiece of steel fell and sheared
Figure 8: Extract from summaries for document set D1137G from the TAC-2011 dataset. Left extract isgenerated by SWING+TSI+CTSI+TCD; right extract is by SWING+CTSI+TCD.
the two summaries is (R3). (L3) is the equivalentof (R4), while (L4) is the full version of the trun-cated (R5). TIMEMMR penalizes (R3). (R3) re-ports that the shoe-throwing incident happened asthe U.S. President Bush appeared together with theIraqi Prime Minister Nouri al-Maliki. Howevertheir joint appearance is already reported in (R1)(and similarly (L1)). (R3) repeats what had beenpresented earlier. Since (R1) and (R3) talk aboutthe same time span, TIMEMMR down-weights(R3). We argue that this is better even though theROUGE scores indicate otherwise. In future workit will be worthwhile to consider the use of metricslike Pyramid (Passonneau et al., 2005) which areless bound to superficial lexicons.
Reliability Filtering. Table 2 shows the ef-fect of varying the filtering threshold on R-2 forthe best performing configuration from Table 1(i.e., SWING+TSI+CTSI+TCD). The result ob-tained in Row 9 using a threshold of 42.68 is alsore-produced for reference. T=0 means that time-lines are used for all input document sets, whereasT=100 means that no timelines are used, as thelength of the longest timeline is less than 100.
As the threshold increases from 0 to 40–50,summarization performance improves while the
T R-2 Sig # T R-2 Sig #0 0.1394 * 44 50 0.1386 ** 13
10 0.1382 - 43 60 0.1361 * 720 0.1377 - 41 70 0.1351 - 330 0.1393 ** 35 80 0.1351 - 240 0.1426 ** 22 90 0.1353 - 1
42.68 0.1418 ** 21 100 0.1339 - 0
Table 2: Effect of different reliability filteringthresholds for SWING+TSI+CTSI+TCD. ‘T’ isthe threshold used; ‘#’ is the number of input col-lections (out of 44) where timelines are used; ‘**’and ‘*’ is statistical significance over SWING ofp < 0.05 and p < 0.1, respectively.
number of document sets where temporal informa-tion is used is reduced. This suggests that filteringis successful in identifying timelines that are notsufficiently accurate to be useful for summariza-tion. R-2 performance peaks around a thresholdof 40. This affirms our use of the average lengthof timelines as the threshold value in our earlierexperiments. Beyond 60, the R-2 scores are stillhigher than that obtained by SWING, but no longersignificantly different. At these higher thresholds,temporal information is still able to help get an im-provement in R-2. However as this affects onlyvery few out of the 44 document sets, statisticalvariances mean that these R-2 scores are no longer

R-2: 0.1215 R-2: 0.0861
((L1,R1) Caribbean coral species essential to the region’s reef ecosystems are at risk of extinction as a result ofclimate change.(L2) But destructive fishing methods and over-harvesting have reduced worldwide catches by 90percent in the past two decades.
6= 6= (R2) The Coral Reef Task Force, created in theClinton administration, regularly assesses coralhealth.
(L3) Scientists warn that up to half of the world’scoral reefs could disappear by 2045.
6= 6= (R3) With a finished necklace retailing for upto 20,000 dollars (15,000 euros), red corals areamong the world’s most expensive wildlife com-modities.
. . . . . . . . . . . .
Figure 9: Extract from summaries for document set D1131F from the TAC-2011 dataset. Left extract isgenerated by SWING+TSI+CTSI+TCD; right extract is by SWING+TSI+TCD.
R-2: 0.2643 R-2: 0.2772
(L1,R1) – An Iraqi reporter threw his shoes at visiting U.S. President George W. Bush and called him a ”dog” inArabic during a news conference with Iraqi Prime Minister Nuri al-Maliki in Baghdad(L2,R2) ”All I can report is it is a size 10,.(L3) Muntadhar al-Zaidi, reporter of Baghdadiyatelevision jumped and threw his two shoes one byone at the president, who ducked and thus narrowlymissed being struck, raising chaos in the hall inBaghdad’s heavily fortified green Zone.
6= 6= (R3) The incident occurred as Bush was appearingwith Iraqi Prime Minister Nouri al-Maliki.
(L4) The president lowered his head and the firstshoe hit the American and Iraqi flags behind thetwo leaders.
6= 6= (R4) Muntadhar al-Zaidi, reporter of Baghdadiyatelevision jumped and threw his two shoes one byone at the president, who ducked and thus narrowlymissed being struck, raising chaos in the hall inBaghdad’s heavily fortified green Zone.
(L5) The 6= 6= (R5) The president lowered his head and the
Figure 11: Summaries for document set D1126E from the TAC-2011 dataset. Left summary is generatedby SWING+TSI+CTSI+TCD+TIMEMMR; right summary is by SWING+TSI+CTSI+TCD.
significant from that produced by SWING.
6 Conclusion
We have shown in this work how temporal in-formation in the form of timelines can be incor-porated into multi-document summarization. Weachieve this through two means, using: 1) threenovel features derived from timelines to mea-sure the saliency of sentences, and 2) TIMEMMRwhich considers time span similarity to enhancethe traditional MMR’s lexical diversity measure.
To overcome errors propagated from the under-lying temporal processing systems, we proposeda reliability filtering metric which can be used tohelp decide when temporal information should beused for summarization. The use of this metricleads to an overall 5.9% gain in R-2 over the com-petitive SWING baseline.
In future work, we are keen to study our pro-posed timeline-related features more intrinsicallyin the context of human-generated summaries.This can help us better understand their value inimproving content selection. As noted earlier,
it will be also be useful to repeat our experi-ments with less lexicon-influenced measures likethe Pyramid method (Passonneau et al., 2005).Manual assessment of the generated summariescan also be done to give a better picture of thequality of the summaries generated with the useof timelines. Finally, given the importance of re-liability filtering, a natural question is if there areother metrics that can be used to get better results.
Acknowledgments
This research is supported by the Singapore Na-tional Research Foundation under its InternationalResearch Centre @ Singapore Funding Initiativeand administered by the IDM Programme Office.
This work is also partially supported by theNational Natural Science Foundation of China(Grant Nos. 61170189, 61370126, 61202239),the Fund of the State Key Laboratory of SoftwareDevelopment Environment (Grant No. SKLSDE-2013ZX-19), and the Innovation Foundation ofBeihang University for Ph.D. Graduates (YWF-13-T-YJSY-024).
ReferencesJaved Aslam, Matthew Ekstrand-Abueg, Virgil Pavlu,
Fernado Diaz, and Tetsuya Sakai. 2013. TREC2013 Temporal Summarization. In Proceedings ofthe 22nd Text Retrieval Conference (TREC), Novem-ber.
Regina Barzilay, Kathleen McKeown, and Michael El-hadad. 1999. Information Fusion in the Context ofMulti-document Summarization. In Proceedings ofthe 37th Annual Meeting of the Association for Com-putational Linguistics on Computational Linguistics(ACL), pages 550–557, June.
Jaime Carbonell and Jade Goldstein. 1998. The Useof MMR, Diversity-based Reranking for ReorderingDocuments and Producing Summaries. In Proceed-ings of the 21st Annual International ACM Confer-ence on Research and Development in InformationRetrieval (SIGIR), pages 335–336, August.
Asli Celikyilmaz and Dilek Hakkani-Tur. 2010. A Hy-brid Hierarchical Model for Multi-document Sum-marization. In Proceedings of the 48th AnnualMeeting of the Association for Computational Lin-guistics (ACL), pages 815–824, July.
John M. Conroy, Judith D. Schlesinger, Jeff Kubina,Peter A. Rankel, and Dianne P. O’Leary. 2011.CLASSY 2011 at TAC: Guided and Multi-lingualSummaries and Evaluation Metrics. In Proceedingsof the Text Analysis Conference (TAC), November.
Gianluca Demartini, Malik Muhammad Saad Missen,Roi Blanco, and Hugo Zaragoza. 2010. EntitySummarization of News Articles. In Proceedings ofthe 33rd Annual International ACM Conference onResearch and Development in Information Retrieval(SIGIR), pages 798–796, July.
Pascal Denis and Philippe Muller. 2011. PredictingGlobally-Coherent Temporal Structures from Textsvia Endpoint Inference and Graph Decomposition.In Proceedings of the 22nd International Joint Con-ference on Artificial Intelligence (IJCAI), July.
Quang Xuan Do, Wei Lu, and Dan Roth. 2012. JointInference for Event Timeline Construction. In Pro-ceedings of the 2012 Joint Conference on EmpiricalMethods in Natural Language Processing and Com-putational Natural Language Learning (EMNLP),pages 677–689, July.
Lisa Ferro, Laurie Gerber, Inderjeet Mani, Beth Sund-heim, and George Wilson. 2000. Instruction Man-ual for the Annotation of Temporal Expressions.Technical report, The MITRE Corporation.
Jade Goldstein, Vibhu Mittal, Jaime Carbonell, andMark Kantrowitz. 2000. Multi-document Sum-marization by Sentence Extraction. In Proceedingsof the 2000 NAACL-ANLP Workshop on AutomaticSummarization, volume 4, pages 40–48, April.
Yihong Gong and Xin Liu. 2001. Generic Text Sum-marization Using Relevance Measure and Latent Se-mantic Analysis. In Proceedings of the 24th AnnualInternational ACM Conference on Research and De-velopment in Information Retrieval (SIGIR), pages19–25, September.
Iris Hendrickx, Walter Daelemans, Erwin Marsi, andEmiel Krahmer. 2009. Reducing Redundancy inMulti-document Summarization using Lexical Se-mantic Similarity. In Proceedings of the Workshopon Language Generation and Summarisation (UC-NLG+Sum), pages 63–66, August.
Chin-Yew Lin and Eduard Hovy. 2003. Auto-matic Evaluation of Summaries Using N-gram Co-occurrence Statistics. In Proceedings of the Confer-ence of the North American Chapter of the Associa-tion for Computational Linguistics on Human Lan-guage Technology (NAACL), volume 1, pages 71–78, May.
Chin-Yew Lin. 2004. Looking for a Few Good Met-rics: ROUGE and its Evaluation. In Working Notesof the 4th NTCIR Workshop Meeting, June.
Maofu Liu, Wenjie Li, and Huijun Hu. 2009. Extrac-tive Summarization Based on Event Term TemporalRelation Graph and Critical Chain. In InformationRetrieval Technology, volume 5839 of Lecture Notesin Computer Science, pages 87–99. Springer BerlinHeidelberg.
Jun-Ping Ng and Min-Yen Kan. 2012. ImprovedTemporal Relation Classification using DependencyParses and Selective Crowdsourced Annotations.In Proceedings of the International Conference onComputational Linguistics (COLING), pages 2109–2124, December.
Jun-Ping Ng, Praveen Bysani, Ziheng Lin, Min-YenKan, and Chew-Lim Tan. 2012. ExploitingCategory-Specific Information for Multi-DocumentSummarization. In Proceedings of the InternationalConference on Computational Linguistics (COL-ING), pages 2093–2108, December.
Jun-Ping Ng, Min-Yen Kan, Ziheng Lin, Wei Feng, BinChen, Jian Su, and Chew-Lim Tan. 2013. Exploit-ing Discourse Analysis for Article-Wide TemporalClassification. In Proceedings of the Conference onEmpirical Methods in Natural Language Processing(EMNLP), pages 12–23, October.
Karolina Owczarzak and Hoa Dang. 2011. Overviewof the TAC 2011 Summarization Track: GuidedTask and AESOP Task. In Proceedings of the TextAnalysis Conference (TAC), November.
Rebecca J. Passonneau, Ani Nenkova, Kathleen McK-eown, and Sergey Sigelman. 2005. Applying thePyramid Method in DUC 2005. In Proceedings ofthe Document Understanding Conference Workshopon Text Summarization, October.

James Pustejovsky, Jose Castano, Robert Ingria, RoserSaurı, Robert Gaizauskas, Andrea Setzer, and Gra-ham Katz. 2003a. TimeML: Robust Specificationof Event and Temporal Expressions in Text. In Pro-ceedings of the 5th International Workshop on Com-putational Semantics (IWCS), January.
James Pustejovsky, Patrick Hanks, Roser Sauri, An-drew See, Robert Gaizauskas, Andrea Setzer,Dragomir Radev, Beth Sundheim, David Day, LisaFerro, and Marcia Lazo. 2003b. The TIMEBANKcorpus. In Proceedings of Corpus Linguistics, pages647–656, March.
Jannik Strotgen and Michael Gertz. 2013. Multilin-gual and Cross-domain Temporal Tagging. Lan-guage Resources and Evaluation, 47(2):269–298.
Naushad Uzzaman, Hector Llorens, Leon Derczynski,Marc Verhagen, James F. Allen, and James Puste-jovsky. 2013. SemEval-2013 Task 1: TEMPEVAL-3: Evaluating Time Expressions, Events, and Tem-poral Relations. In Proceedings of the 7th Interna-tional Workshop on Semantic Evaluation (SemEval),June.
Marc Verhagen, Robert Gaizauskas, Frank Schilder,Mark Hepple, Jessica Moszkowicz, and JamesPustejovsky. 2009. The TempEval Challenge: Iden-tifying Temporal Relations in Text. Language Re-sources and Evaluation, 43(2):161–179.
Marc Verhagen, Roser Saurı, Tommaso Caselli, andJames Pustejovsky. 2010. SemEval-2010 Task 13:TempEval-2. In Proceedings of the 5th Interna-tional Workshop on Semantic Evaluation (SemEval),pages 57–62, July.
Xiaojun Wan. 2007. TimedTextRank: Adding theTemporal Dimension to Multi-Document Summa-rization. In Proceedings of the 30th Annual Interna-tional ACM Conference on Research and Develop-ment in Information Retrieval (SIGIR), pages 867–868, July.
Mingli Wu. 2008. Investigations on Temporal-Oriented Event-Based Extractive Summarization.Ph.D. thesis, Hong Kong Polytechnic University.
Shasha Xie and Yang Liu. 2008. Using Corpusand Knowledge-based Similarity Measure in Max-imum Marginal Relevance for Meeting Summariza-tion. In Proceedings of the International Confer-ence on Acoustics, Speech, and Signal Processing(ICASSP), pages 4985–4988, March.
Renxian Zhang, You Ouyang, and Wenjie Li. 2011.Guided Summarization with Aspect Recognition. InProceedings of the Text Analysis Conference (TAC),November.
Copyright © 2022 FDOKUMEN