Compensation for Retinal Vessel Density Reduces the Variation of Circumpapillary RNFL in Healthy...
10
RESEARCH ARTICLE Compensation for Retinal Vessel Density Reduces the Variation of Circumpapillary RNFL in Healthy Subjects Ivania Pereira 1,2☯ , Stephanie Weber 2☯ , Stephan Holzer 2☯ , Georg Fischer 1☯ , Clemens Vass 2☯ , Hemma Resch 2☯ * 1 Center for Medical Statistics Informatics and Intelligent Systems, Section for Medical Information Management and Imaging, Medical University Vienna, Vienna, Austria, 2 Department of Ophthalmology & Optometry, Medical University Vienna, Vienna, Austria ☯ These authors contributed equally to this work. * [email protected] Abstract This work intends to assess circumpapillary retinal vessel density (RVD) at a 3.46 mm diam- eter circle and correlate it with circumpapillary retinal nerve fiber layer (RNFL) thickness measured with Fourier-Domain Optical Coherence Tomography. Furthermore, it aims to evaluate the reduction of intersubject variability of RNFL when considering RVD as a source of information for RNFL distribution. For that, 106 healthy subjects underwent circumpapil- lary RNFL measurement. Using the scanning laser ophthalmoscope fundus image, thick- ness and position of retinal vessels were assessed and integrated in a 256-sector RVD profile. The relationship between local RVD value and local RNFL thickness was modeled by linear regression. RNFL was then compensated for RVD variation by regression formu- las. A strong statistically significant intrasubject correlation was found for all subjects be- tween RVD and RNFL profiles (mean R = 0.769). In the intersubject regression analysis, 247 of 256 RNFL sectors showed a statistically significant positive correlation with RVD (mean R = 0.423). RVD compensation of RNFL resulted in a relative reduction of up to 20% of the intersubject variance. In conclusion, RVD in a 3.46mm circle has a clinically relevant influence on the RNFL distribution. RVD may be used to develop more individualized nor- mative values for RNFL measurement, which might improve early diagnosis of glaucoma. Introduction Glaucoma is the second most frequent cause of irreversible blindness in industrialized nations. It is estimated that in 2020, about 80 million of people will be affected by the disease.[1] While there is currently no cure for this disease, treatment can delay its progression, and so early and accurate diagnosis of glaucoma is important to preserve vision. Early glaucoma diagnosis is partially based on retinal nerve fiber layer (RNFL) thickness, which can be assessed by scanning laser polarimetry (SLP) or optical coherence tomography PLOS ONE | DOI:10.1371/journal.pone.0120378 March 18, 2015 1 / 10 OPEN ACCESS Citation: Pereira I, Weber S, Holzer S, Fischer G, Vass C, Resch H (2015) Compensation for Retinal Vessel Density Reduces the Variation of Circumpapillary RNFL in Healthy Subjects. PLoS ONE 10(3): e0120378. doi:10.1371/journal. pone.0120378 Academic Editor: Zsolt Ablonczy, Medical University of South Carolina, UNITED STATES Received: November 19, 2014 Accepted: February 6, 2015 Published: March 18, 2015 Copyright: © 2015 Pereira et al. This is an open access article distributed under the terms of the Creative Commons Attribution License, which permits unrestricted use, distribution, and reproduction in any medium, provided the original author and source are credited. Data Availability Statement: All relevant data are within the paper. Funding: The study was funded by: Wiener Wissenschafts-, Forschungs- and Technologiefonds, WWTF – LS11-046. The persons responsible for the funding are GF and CV. The funders had no role in study design, data collection and analysis, decision to publish, or preparation of the manuscript. Competing Interests: The authors have declared that no competing interests exist.
-
Upload
independent -
Category
Documents
-
view
0 -
download
0
Transcript of Compensation for Retinal Vessel Density Reduces the Variation of Circumpapillary RNFL in Healthy...

RESEARCH ARTICLE
Compensation for Retinal Vessel DensityReduces the Variation of CircumpapillaryRNFL in Healthy SubjectsIvania Pereira1,2☯, Stephanie Weber2☯, Stephan Holzer2☯, Georg Fischer1☯,Clemens Vass2☯, Hemma Resch2☯*
1 Center for Medical Statistics Informatics and Intelligent Systems, Section for Medical InformationManagement and Imaging, Medical University Vienna, Vienna, Austria, 2 Department of Ophthalmology &Optometry, Medical University Vienna, Vienna, Austria
☯ These authors contributed equally to this work.* [email protected]
AbstractThis work intends to assess circumpapillary retinal vessel density (RVD) at a 3.46 mm diam-
eter circle and correlate it with circumpapillary retinal nerve fiber layer (RNFL) thickness
measured with Fourier-Domain Optical Coherence Tomography. Furthermore, it aims to
evaluate the reduction of intersubject variability of RNFL when considering RVD as a source
of information for RNFL distribution. For that, 106 healthy subjects underwent circumpapil-
lary RNFL measurement. Using the scanning laser ophthalmoscope fundus image, thick-
ness and position of retinal vessels were assessed and integrated in a 256-sector RVD
profile. The relationship between local RVD value and local RNFL thickness was modeled
by linear regression. RNFL was then compensated for RVD variation by regression formu-
las. A strong statistically significant intrasubject correlation was found for all subjects be-
tween RVD and RNFL profiles (mean R = 0.769). In the intersubject regression analysis,
247 of 256 RNFL sectors showed a statistically significant positive correlation with RVD
(mean R = 0.423). RVD compensation of RNFL resulted in a relative reduction of up to 20%
of the intersubject variance. In conclusion, RVD in a 3.46mm circle has a clinically relevant
influence on the RNFL distribution. RVD may be used to develop more individualized nor-
mative values for RNFL measurement, which might improve early diagnosis of glaucoma.
IntroductionGlaucoma is the second most frequent cause of irreversible blindness in industrialized nations.It is estimated that in 2020, about 80 million of people will be affected by the disease.[1] Whilethere is currently no cure for this disease, treatment can delay its progression, and so early andaccurate diagnosis of glaucoma is important to preserve vision.
Early glaucoma diagnosis is partially based on retinal nerve fiber layer (RNFL) thickness,which can be assessed by scanning laser polarimetry (SLP) or optical coherence tomography
PLOSONE | DOI:10.1371/journal.pone.0120378 March 18, 2015 1 / 10
OPEN ACCESS
Citation: Pereira I, Weber S, Holzer S, Fischer G,Vass C, Resch H (2015) Compensation for RetinalVessel Density Reduces the Variation ofCircumpapillary RNFL in Healthy Subjects. PLoSONE 10(3): e0120378. doi:10.1371/journal.pone.0120378
Academic Editor: Zsolt Ablonczy, Medical Universityof South Carolina, UNITED STATES
Received: November 19, 2014
Accepted: February 6, 2015
Published: March 18, 2015
Copyright: © 2015 Pereira et al. This is an openaccess article distributed under the terms of theCreative Commons Attribution License, which permitsunrestricted use, distribution, and reproduction in anymedium, provided the original author and source arecredited.
Data Availability Statement: All relevant data arewithin the paper.
Funding: The study was funded by: WienerWissenschafts-, Forschungs- and Technologiefonds,WWTF – LS11-046. The persons responsible for thefunding are GF and CV. The funders had no role instudy design, data collection and analysis, decision topublish, or preparation of the manuscript.
Competing Interests: The authors have declaredthat no competing interests exist.

(OCT). RNFL becomes thinner in pathological cases, compared with healthy eyes,[2–8] due tothe irreversible loss of the ganglion cells and their axons. However, the discrimination in RNFLthickness measurements between healthy and glaucoma cases is impaired by considerableinterindividual variance among the healthy population. Some of the factors driving this vari-ance can be compensated for, like sex, age and ethnicity, while others such as optic disc (OD)size and axial length [7–15] are presently not considered.
It has been shown by others [16,17] and by our group [18,19] that one additional source ofinterindividual variance of the RNFL is the variable circumpapillary distribution of the retinalblood vessels. A correlation was reported [16,17] between major temporal retinal blood vesselsand major maxima of peripapillary RNFL thickness. Our group [18] reported a correlation be-tween smaller angles of the major temporal vessels and a more oblique course of the nerve fiberbundles of the RNFL. Recently we introduced the circumpapillary retinal vessel density profile(RVD) as a function of distribution and thicknesses of the retinal vessels.[19] We have shownthat the circumpapillary RVD as measured at the OD border may help to partially explain theRNFL variation.
Considering that during embryonic development, retinal vessels follow the paths and nutri-ent demands of the sprouting axons, it is presumable that measuring both the RVD and RNFLthickness at the same location might improve the previously reported associations. In the pres-ent work, we investigated the correlation between peripapillary RNFL thickness measured withFourier-Domain OCT (FD-OCT) and RVD, both assessed at the same location (3.46 mm di-ameter circle).
Subjects and Methods
SubjectsThis study was performed in collaboration between the Department of Ophthalmology andOptometry and the Section for Medical Information Management and Imaging of the Centerfor Medical Statistics Informatics and Intelligent Systems of the Medical University of Vienna.The protocol was approved by the Ethics Committee of the Medical University of Vienna, Aus-tria, and written informed consent was obtained from all volunteers. The Guidelines of GoodClinical practice and the Declaration of Helsinki were followed.
Inclusion and exclusion criteria and examination procedures were described elsewhere.[19]
MethodsThe selection and measurement of the retinal vessels was performed using individual SLO im-ages acquired with an OD centered protocol from Cirrus FD-OCT. The correspondent RNFLmeasurements were also used in this analysis. A customized software was developed in Matlab(Matlab R2012b, Mathworks Inc., Massachusetts, USA), similar to the one developed for theprevious model.[19] For each image, a trained grader identified the OD margin and, from itscenter, three concentric circles were automatically placed on the image. One of those circleswas the RNFL measurement circle defined by FD-OCT, with diameter of 3.46 mm. Two addi-tional circles, with diameters 3.57 mm and 3.35 mm, were added for robustness of the measure-ments. Using these circles, the grader identified the borders of all measurable vessels visible inthe SLO image and crossing the specified circles. The measured vessel thickness and the respec-tive coordinates along the three circles were averaged, to obtain one thickness value and a cen-ter point for each vessel. For each vessel we determined the angle of the intersection between ahorizontal line passing through the OD center and a line between OD center and the vesselcenter point. RVD profile for all subjects was obtained in a similar fashion as previously de-scribed [19] and optimized for median intersubject correlation maximization.
Vessel Compensation Reduces the Variation of Circumpapillary RNFL
PLOSONE | DOI:10.1371/journal.pone.0120378 March 18, 2015 2 / 10

Statistical analysis. Statistical analysis was performed using the SPSS software package(SPSS Inc. USA) release No. 21.0.0.0. All statistical significant results present p<0.05. A statisti-cal analysis similar to the first model including intra- and intersubject correlations was per-formed in order to allow a comparison between methods.[19]
A modified temporal-superior-nasal-inferior-temporal (TSNIT) graph was defined basedon the slopes of the regression lines of all sectors, according to the formula y =mx + b. Theslope is considered statistically significant if both limits of the 95% CI have an equal sign (eitherboth positive or both negative).
Additionally, we calculated the difference between the 10th and 90th percentiles of RVD foreach sector. This difference was multiplied with the according regression slope, to analyze theimpact of vessel thickness on RNFL profile for subjects with more atypical RVD profile.
Furthermore, the RVD-compensated RNFL thickness was determined using equation (1)and applying it to each sector of each subject.
RNFLcompensated ¼ RNFLmeasured � ðRVDsubject � RVDmeanÞ � slope ð1Þ
The coefficients of variance (CV), both for the measured and the RVD-compensated RNFLthickness values, were calculated for each of the 256 sectors, as well as for the 12 clockhour sectors.
Results
Description of statistical subsetWe used the same statistical subset, which has been described,[19] to allow direct comparisonwith the published results. The demographic distribution of the sample is provided in Table 1.
The parameters used for Gaussian-shaped convolution were N = 47, α = 2.7 for RVD mea-surements along the RNFL measurement area.
Correlation between RVD and RNFLTo better understand the sources of the variability of RNFL measurements in healthy subjects,we analyzed how RVD was correlated with RNFL profile at a 3.46 mm diameter circle. Resultsshowed that all individual RVD measurements (106 subjects) have a statistically significant,mostly strong positive correlation with the respective RNFL profile (mean value 0.769 ± 0.117).Moreover, intersubject linear regression analysis resulted in a significant Pearson correlationcoefficient in 96% of the sectors (mean value of 0.423 ± 0.121). Comparing to the previousmodel, the significant sectors increased from 181 to 247 (out of 256) sectors, and the meanintersubject correlation coefficient increased by 62% (from 0.260 to 0.423). Detailed results arepresented in Table 2. Values between brackets refer to the previous model.
Table 1. Subjects demographic characteristics.
Number of subjects 106
Sex (male/female) 49/57
Eye (right/left) 66/40
Age (mean years ± SD†) 36.9±16.9
Refractive Error (mean diopters ± SD†) 0.05±1.46
Mean Deviation (mean dB ± SD†) -0.13±1.04
† SD = Standard Deviation
doi:10.1371/journal.pone.0120378.t001
Vessel Compensation Reduces the Variation of Circumpapillary RNFL
PLOSONE | DOI:10.1371/journal.pone.0120378 March 18, 2015 3 / 10

The average RVD profiles for both models are illustrated in Fig. 1 (thicker lines refer tothe present model; thinner lines refer to the previous model). The double hump pattern of theRVD distribution resembles the shape of the RNFL distribution for both models. However, thetemporal-superior and the temporal-inferior peaks of RVD are shifted between 10° and 15° inthe temporal direction when RVD was measured at 3.46 mm (new model) as compared tomeasurement at the OD margin (old model).
Regression analysis between RVD and RNFLAmodified TSNIT profile (Fig. 2), based on the intersubject linear regression analysis, displaysthe regression slopes of the 256 sectors. The solid line represents the intersubject regressionslopes for each sector and the dashed lines refer to the 95% CI of the slopes.
Table 2. Statistical results for intra- and intersubject Pearson correlation coefficients analysis: comparison to the previous model.
Intrasubject correlation coefficients: New model (old model) Intersubject correlation coefficients: New model (old model)
significance 106 subjects (101) 247 sectors (181)
max. 0.955 (0.839) 0. 652 (0.490)
min. 0.314 (0.150) 0.083 (0.000)
mean 0.769 (0.535) 0.423 (0.260)
S.D. 0.117 (0.164) 0.121 (0.114)
25 percentile 0.705 (0.418) 0.344 (0.176)
75 percentile 0.843 (0.674) 0.505 (0.348)
90 percentile 0.899 (0.744) 0.596 (0.405)
doi:10.1371/journal.pone.0120378.t002
Fig 1. Average and Standard deviation of Retinal Vessel Density. Temporal—superior—nasal—inferior—temporal (TSNIT) graph for the averagemeasurements of retinal vessel density (RVD) distribution in 106 healthy subjects. Solid lines represent the mean value and dashed lines representaverage ± 1SD. Thicker lines refer to RVD profiles determined in a 3.46 mm diameter circle and thinner lines refer to RVD at the optic disc margin.
doi:10.1371/journal.pone.0120378.g001
Vessel Compensation Reduces the Variation of Circumpapillary RNFL
PLOSONE | DOI:10.1371/journal.pone.0120378 March 18, 2015 4 / 10

The slopes were significantly positive for almost every sector (i.e. the 95% CI did not includethe zero line), with the exception of a part of the papillo-macular bundle area. Maxima valueswere reached in the superior-temporal region. Comparing with our previous model [19], therewas a pronounced increase in slopes in large parts of the TSNIT profile obtained for the 3.46mmmeasurement circle. The average slope increased from 1.05 to 1.55 µm/pixel in thenew model.
Influence of atypical RVD in RNFL distributionsTo determine the potential clinical relevance of our results, we estimated the impact of RVDvariation on RNFL thickness for cases with more atypical RVD. This was achieved by calculat-ing the difference between the 10th and 90th percentiles of the RVD and multiplying these val-ues by the respective intersubject regression slopes (Fig. 3). Regions with higher differencesconcentrate in superior and inferior regions, with a maximum difference up to approximately50 microns.
Reduced RNFL variance by compensation for RVD variationFinally, we compensated the measured RNFL profiles for the impact of RVD variation. Thiswas achieved using the regression formulas and equation (1) to normalize the measured RNFLthickness of each subject and sector to the expected value for a subject with average RVD of
Fig 2. Modified TSNIT graphs of the regression coefficients.Modified Temporal—superior—nasal—inferior—temporal (TSNIT) graph plotting theregression coefficients obtained from the regression analysis (solid line) and the respective 95% confidence interval (CI) (dashed lines).
doi:10.1371/journal.pone.0120378.g002
Vessel Compensation Reduces the Variation of Circumpapillary RNFL
PLOSONE | DOI:10.1371/journal.pone.0120378 March 18, 2015 5 / 10

this sector. Fig. 4 shows the profile of the intersubject variability, both for the measured valuesof RNFL thickness and for the RVD-compensated model. The mean ± 2xSD values of themeasured RNFL thickness (thinner lines) are plotted against the mean ± 2SD values of theRVD-compensated model (thicker lines). Mean values are not influenced by the compensationprocess, but the variation is considerably reduced by the compensation. On average, the CV forthe measured RNFL thickness was 18%, while for the RVD-compensated model it was 16%,meaning a relative reduction of variance of 11%. The maximum difference was in the temporalsuperior area, where the CV for the measured RNFL thickness was 18.7, which was reduced byour compensation to 15%, a relative reduction of 20%. Further results are present in Table 3.
DiscussionIn this paper, we report that the RNFL thickness in healthy volunteers has a strong intraindivi-dual correlation with the RVD profile, which reflects retinal vessels thickness and distributionon a 3.46 mm diameter circle around the optic disc. Intersubject correlation between RNFLand RVD was moderate, with a mean correlation coefficient of 0.423. The RVD profile, on av-erage, may explain 18%—for some regions, up to 43%—of the RNFL intersubject variance.This is a meaningful improvement compared to our older model,[19] where, on average, theRVD explained 7% (up to 24%) of the RNFL variation. Furthermore, our proposed method ofRVD-compensation reduced the CV of the RNFL by up to 20%, instead of 11% in the previous
Fig 3. Estimated impact of RVD on RNFL thickness. Estimated impact of retinal vessel density (RVD) variation on retinal nerve fiber layer (RNFL)thickness. Solid line represent the difference between the 10%most extreme values of RVD, multiplied by the regression coefficients; dashed lines refer tothe 95% CI.
doi:10.1371/journal.pone.0120378.g003
Vessel Compensation Reduces the Variation of Circumpapillary RNFL
PLOSONE | DOI:10.1371/journal.pone.0120378 March 18, 2015 6 / 10
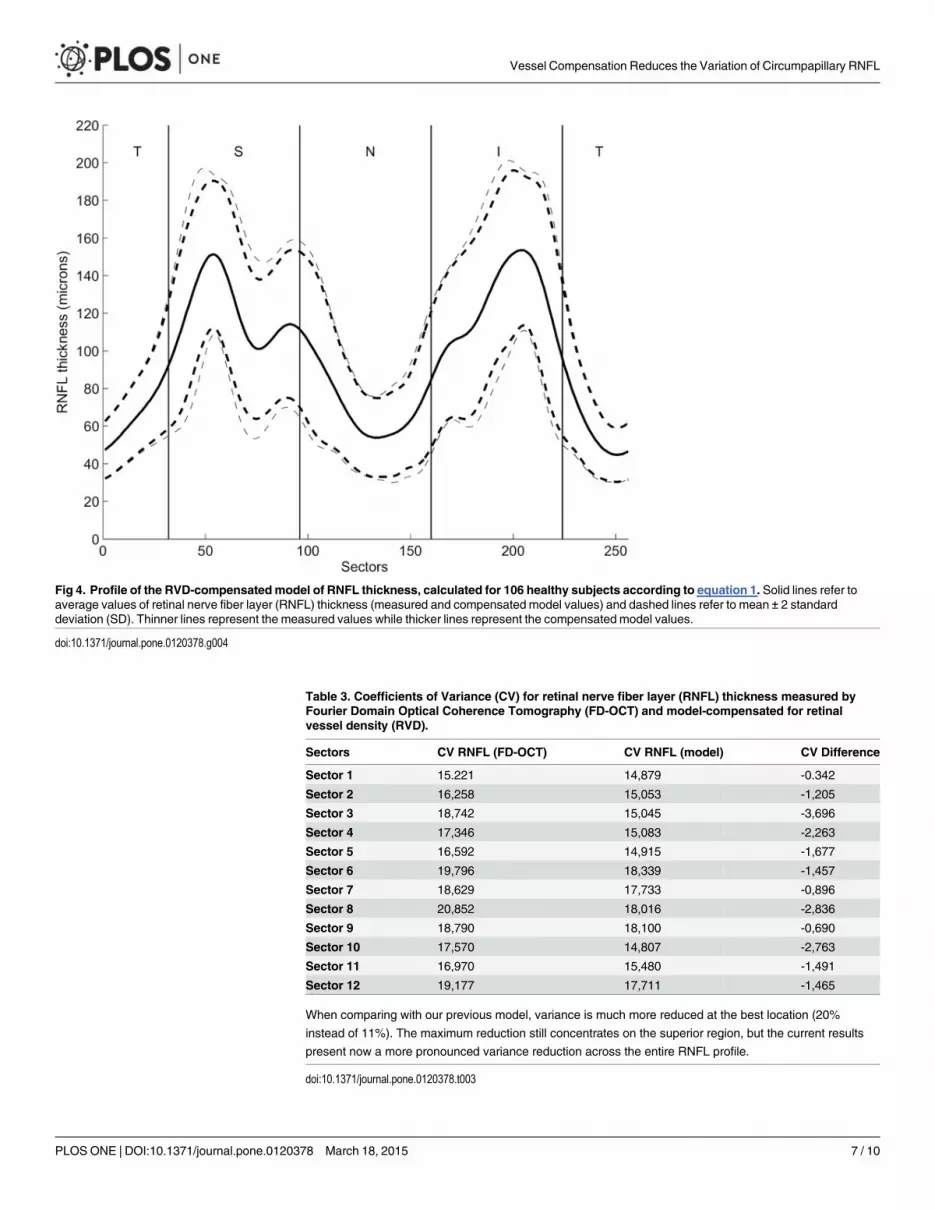
Fig 4. Profile of the RVD-compensatedmodel of RNFL thickness, calculated for 106 healthy subjects according to equation 1. Solid lines refer toaverage values of retinal nerve fiber layer (RNFL) thickness (measured and compensated model values) and dashed lines refer to mean ± 2 standarddeviation (SD). Thinner lines represent the measured values while thicker lines represent the compensated model values.
doi:10.1371/journal.pone.0120378.g004
Table 3. Coefficients of Variance (CV) for retinal nerve fiber layer (RNFL) thickness measured byFourier Domain Optical Coherence Tomography (FD-OCT) and model-compensated for retinalvessel density (RVD).
Sectors CV RNFL (FD-OCT) CV RNFL (model) CV Difference
Sector 1 15.221 14,879 -0.342
Sector 2 16,258 15,053 -1,205
Sector 3 18,742 15,045 -3,696
Sector 4 17,346 15,083 -2,263
Sector 5 16,592 14,915 -1,677
Sector 6 19,796 18,339 -1,457
Sector 7 18,629 17,733 -0,896
Sector 8 20,852 18,016 -2,836
Sector 9 18,790 18,100 -0,690
Sector 10 17,570 14,807 -2,763
Sector 11 16,970 15,480 -1,491
Sector 12 19,177 17,711 -1,465
When comparing with our previous model, variance is much more reduced at the best location (20%
instead of 11%). The maximum reduction still concentrates on the superior region, but the current results
present now a more pronounced variance reduction across the entire RNFL profile.
doi:10.1371/journal.pone.0120378.t003
Vessel Compensation Reduces the Variation of Circumpapillary RNFL
PLOSONE | DOI:10.1371/journal.pone.0120378 March 18, 2015 7 / 10

model, Contrary to this—and also expectedly—the mean TSNIT profile of RNFL remained un-changed. This demonstrates that our approach was successful in reducing the range of norma-tive data without changing the basic characteristic of the TSNIT curve.
Clinically, when using RNFLmeasurement for diagnostic purposes,[7–15] the interindividualvariation is primarily a problem for the most atypical cases, the outliers of the distribution in thepopulation.We thus looked at the expected difference in RNFL between subjects with large orsmall RVD (90% to 10% percentiles). This difference amounted to more than 30 µm for large partsof the circumference and reached 50 µm in some areas. When compared to measurements taken atthe ODmargin, the expected difference increased by 20 microns in large parts of the TSNIT graph.
These new results confirm the importance of considering retinal vessel patterns when ana-lyzing RNFL thickness values. An accurate determination of vessel density is crucial to under-stand major characteristics of circumpapillary RNFL thickness, such as peak deviation. It isconceivable that a subject with a high RVD in a given area of the TSNIT graph and an incipientRNFL defect just at that location might show up as normal. On the other hand, a healthy sub-ject with a low RVD in some areas might be erroneously classified as pathologic. This couldsimply be due to the lack of compensation for the RVD influence on RNFL thickness measure-ments. While the glaucoma expert may well recognize the atypical RNFL distribution and takeit into account, this might not hold true for the majority of ophthalmologists using RNFL mea-surements in routine setting. Taking into account RVD influence on RNFL profile might betterdiscriminate between healthy and pathological cases.
The limitations in this study have been delineated before.[19] So far, our method is basedon subjective grading of the vessel diameters, which might introduce a bias. To overcome this,our method will be validated in an independent set of data. Moreover, it should be investigatedwhether the consideration of physiological factors, such as fovea position, refractive error andoptic disc size.[20], influences our results.
Our study was based on the assumption that there is an association between both retinalblood vessels and RNFL distributions. We are interested in developing a method to partiallycompensate for the intersubject variance. The physiologic basis for this assumption can befound in central nervous system development during fetal formation. This justification hasbeen previously explored.[19,21–23] Given the biological factors, one might expect that regionsof higher RVD, with a more developed vessel network, would mark regions of thicker RNFL atbirth and through lifetime, when normal circumstances are preserved.
In our opinion, the improved correlations of the current compared to the old model resultfrom the fact that the retinal vessels, especially in the temporal superior and inferior regions,do not assume a radial path, but a curved path deflected towards the macula. This is illustratedin the location of the RVD peaks in Fig. 1, where its maxima, as measured at 3.46 mm, are tem-porally shifted 10 to 15 degree, when compared to the measurements at the OD margin. It ap-pears thus natural that measuring the RVD at the same location as the RNFL, as in our presentmodel, results in a better correlation between these two parameters.
In conclusion, our proposed method of RVD-compensation of RNFL measurements, bothmeasured at a 3.46 mm diameter circle, presents a clinically relevant relative reduction of varianceof up to 20%. Importantly, this work will help to develop more individualized normative values forRNFLmeasurements, which may in future lead to improvement in early diagnosis of glaucoma.
Author ContributionsConceived and designed the experiments: IP GF CV HR. Performed the experiments: IP SHHR. Analyzed the data: IP SW GF CV HR. Contributed reagents/materials/analysis tools: IPSW GF CV. Wrote the paper: IP SH GF CV HR.
Vessel Compensation Reduces the Variation of Circumpapillary RNFL
PLOSONE | DOI:10.1371/journal.pone.0120378 March 18, 2015 8 / 10

References1. Quigley HA, Broman AT (2006) The number of people with glaucoma worldwide in 2010 and 2020.
Br J Ophthalmol 90: 262–267. PMID: 16488940
2. Medeiros FA, Zangwill LM, Bowd C, Weinreb RN (2004) Comparison of the GDx VCC scanning laserpolarimeter, HRT II confocal scanning laser ophthalmoscope, and stratus OCT optical coherence tomo-graph for the detection of glaucoma. Arch Ophthalmol 122: 827–837. PMID: 15197057
3. Kanamori A, Nagai-Kusuhara A, Escano MF, Maeda H, Nakamura M, Negi A (2006) Comparison ofconfocal scanning laser ophthalmoscopy, scanning laser polarimetry and optical coherence tomogra-phy to discriminate ocular hypertension and glaucoma at an early stage. Graefes Arch Clin ExpOphthalmol 244: 58–68. PMID: 16044326
4. Bowd C, Zangwill LM, Berry CC, Blumenthal EZ, Vasile C, Sanchez-Galeana C, et al. (2001) Detectingearly glaucoma by assessment of retinal nerve fiber layer thickness and visual function. Invest Ophthal-mol Vis Sci 42: 1993–2003. PMID: 11481263
5. Schuman JS, Hee MR, Puliafito CA, Wong C, Pedut-Kloizman T, Lin CP, et al. (1995) Quantification ofnerve fiber layer thickness in normal and glaucomatous eyes using optical coherence tomography.Arch Ophthalmol 113: 586–596. PMID: 7748128
6. Kanamori A, Nakamura M, Escano MF, Seya R, Maeda H, Negi A (2003) Evaluation of the glaucoma-tous damage on retinal nerve fiber layer thickness measured by optical coherence tomography.Am J Ophthalmol 135: 513–520. PMID: 12654369
7. Townsend KA, Wollstein G, Schuman JS (2009) Imaging of the retinal nerve fibre layer for glaucoma.Br J Ophthalmol 93: 139–143. doi: 10.1136/bjo.2008.145540 PMID: 19028735
8. Hirasawa H, Tomidokoro A, Araie M, Konno S, Saito H, Iwase A, et al. (2010) Peripapillary retinal nervefiber layer thickness determined by spectral-domain optical coherence tomography in ophthalmologicallynormal eyes. Arch Ophthalmol 128: 1420–1426. doi: 10.1001/archophthalmol.2010.244 PMID: 21060043
9. Poinoosawmy D, Fontana L, Wu JX, Fitzke FW, Hitchings RA (1997) Variation of nerve fibre layerthickness measurements with age and ethnicity by scanning laser polarimetry. Br J Ophthalmol 81:350–354. PMID: 9227197
10. Chi Q- M, Tomita G, Inazumi K, Hayakawa T, Ido T, Kitazawa Y (1995) Evaluation of the Effect ofAging on the Retinal Nerve Fiber Layer Thickness Using Scanning Laser Polarimetry. J Glaucoma 4:406–413. PMID: 19920707
11. Funaki S, Shirakashi M, Abe H (1998) Relation between size of optic disc and thickness of retinal nervefibre layer in normal subjects. British Journal of Ophthalmology 82: 1242–1245. PMID: 9924325
12. Yoo YC, Lee CM, Park JH (2012) Changes in peripapillary retinal nerve fiber layer distribution by axiallength. Optom Vis Sci 89: 4–11. doi: 10.1097/OPX.0b013e3182358008 PMID: 21983121
13. Kang SH, Hong SW, Im SK, Lee SH, Ahn MD (2010) Effect of myopia on the thickness of the retinalnerve fiber layer measured by Cirrus HD optical coherence tomography. Invest Ophthalmol Vis Sci 51:4075–4083. doi: 10.1167/iovs.09-4737 PMID: 20237247
14. Bowd C, Zangwill LM, Blumenthal EZ, Vasile C, Boehm AG, Gokhale PA, et al. (2002) Imaging of theoptic disc and retinal nerve fiber layer: the effects of age, optic disc area, refractive error, and gender.J Opt Soc Am A Opt Image Sci Vis 19: 197–207. PMID: 11778725
15. Savini G, Zanini M, Carelli V, Sadun AA, Ross-Cisneros FN, Barboni P (2005) Correlation betweenretinal nerve fibre layer thickness and optic nerve head size: an optical coherence tomography study.Br J Ophthalmol 89: 489–492. PMID: 15774930
16. Hood DC, Fortune B, Arthur SN, Xing D, Salant JA, Ritch R, et al. (2008) Blood vessel contributions toretinal nerve fiber layer thickness profiles measured with optical coherence tomography. J Glaucoma17: 519–528. doi: 10.1097/IJG.0b013e3181629a02 PMID: 18854727
17. Hood DC, Salant JA, Arthur SN, Ritch R, Liebmann JM (2010) The location of the inferior and superiortemporal blood vessels and interindividual variability of the retinal nerve fiber layer thickness. J Glauco-ma 19: 158–166. doi: 10.1097/IJG.0b013e3181af31ec PMID: 19661824
18. Resch H, Brela B, Resch-Wolfslehner C, Vass C (2011) Position of retinal blood vessels correlates withretinal nerve fibre layer thickness profiles as measured with GDx VCC and ECC. Br J Ophthalmol 95:680–684. doi: 10.1136/bjo.2009.170068 PMID: 20805131
19. Pereira I, Weber S, Holzer S, Resch H, Kiss B, Fischer G, et al. (2014) Correlation between retinal ves-sel density profile and circumpapillary RNFL thickness measured with Fourier-domain optical coher-ence tomography. Br J Ophthalmol 98: 538–543. doi: 10.1136/bjophthalmol-2013-303910 PMID:24390166
20. Hong SW, Ahn MD, Kang SH, Im SK (2010) Analysis of peripapillary retinal nerve fiber distribution innormal young adults. Invest Ophthalmol Vis Sci 51: 3515–3523. doi: 10.1167/iovs.09-4888 PMID:20164448
Vessel Compensation Reduces the Variation of Circumpapillary RNFL
PLOSONE | DOI:10.1371/journal.pone.0120378 March 18, 2015 9 / 10

21. Stone J, Itin A, Alon T, Pe'er J, Gnessin H, Chan-Ling T, et al. (1995) Development of retinal vascula-ture is mediated by hypoxia-induced vascular endothelial growth factor (VEGF) expression by neuro-glia. J Neurosci 15: 4738–4747. PMID: 7623107
22. Carmeliet P, Tessier-Lavigne M (2005) Commonmechanisms of nerve and blood vessel wiring. Nature436: 193–200. PMID: 16015319
23. Dorrell MI, Friedlander M (2006) Mechanisms of endothelial cell guidance and vascular patterning inthe developing mouse retina. Prog Retin Eye Res 25: 277–295. PMID: 16515881
Vessel Compensation Reduces the Variation of Circumpapillary RNFL
PLOSONE | DOI:10.1371/journal.pone.0120378 March 18, 2015 10 / 10