Vessel Reporting Procedures Contents
17
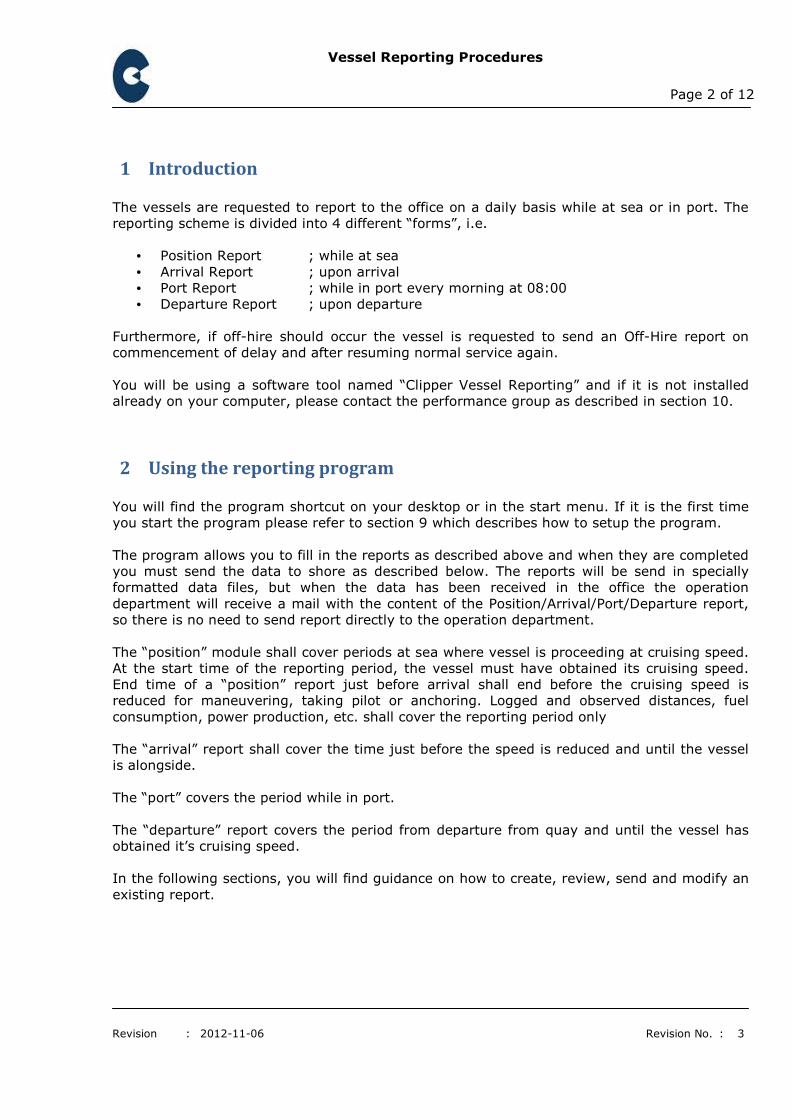
Vessel Reporting Procedures Page 1 of 12 Revision : 2012-11-06 Revision No. : 3 Contents 1 Introduction .................................................................................................................................... 2 2 Using the reporting program .......................................................................................................... 2 2.1 Create a new report ............................................................................................................... 3 2.2 Validation of report ................................................................................................................ 4 2.3 Send a report .......................................................................................................................... 4 2.4 Modify existing report ............................................................................................................ 5 3 Awaiting berthing at anchorage place / drifting at sea .................................................................. 5 4 Canal passage ................................................................................................................................. 5 5 Weather reporting.......................................................................................................................... 5 6 Fuel consumption reporting ........................................................................................................... 6 6.1 Common flow meter for ME and Aux. Engines ...................................................................... 7 6.2 Separate fuel service system for aux. engines without flow meter ....................................... 8 6.3 Boiler without flow meter ...................................................................................................... 8 7 Reporting of remaining fuel onboard (ROB) .................................................................................. 9 8 Reporting of Bunkering .................................................................................................................. 9 9 System Setup .................................................................................................................................. 9 10 Contacts .................................................................................................................................... 12
-
Upload
independent -
Category
Documents
-
view
2 -
download
0
Transcript of Vessel Reporting Procedures Contents
Vessel Reporting Procedures
Page 1 of 12
Revision : 2012-11-06 Revision No. : 3
Contents 1 Introduction .................................................................................................................................... 2
2 Using the reporting program .......................................................................................................... 2
2.1 Create a new report ............................................................................................................... 3
2.2 Validation of report ................................................................................................................ 4
2.3 Send a report .......................................................................................................................... 4
2.4 Modify existing report ............................................................................................................ 5
3 Awaiting berthing at anchorage place / drifting at sea .................................................................. 5
4 Canal passage ................................................................................................................................. 5
5 Weather reporting .......................................................................................................................... 5
6 Fuel consumption reporting ........................................................................................................... 6
6.1 Common flow meter for ME and Aux. Engines ...................................................................... 7
6.2 Separate fuel service system for aux. engines without flow meter ....................................... 8
6.3 Boiler without flow meter ...................................................................................................... 8
7 Reporting of remaining fuel onboard (ROB) .................................................................................. 9
8 Reporting of Bunkering .................................................................................................................. 9
9 System Setup .................................................................................................................................. 9
10 Contacts .................................................................................................................................... 12
Vessel Reporting Procedures
Page 2 of 12
Revision : 2012-11-06 Revision No. : 3
1 Introduction
The vessels are requested to report to the office on a daily basis while at sea or in port. The
reporting scheme is divided into 4 different “forms”, i.e.
• Position Report ; while at sea
• Arrival Report ; upon arrival
• Port Report ; while in port every morning at 08:00
• Departure Report ; upon departure
Furthermore, if off-hire should occur the vessel is requested to send an Off-Hire report on
commencement of delay and after resuming normal service again.
You will be using a software tool named “Clipper Vessel Reporting” and if it is not installed
already on your computer, please contact the performance group as described in section 10.
2 Using the reporting program
You will find the program shortcut on your desktop or in the start menu. If it is the first time
you start the program please refer to section 9 which describes how to setup the program.
The program allows you to fill in the reports as described above and when they are completed
you must send the data to shore as described below. The reports will be send in specially
formatted data files, but when the data has been received in the office the operation
department will receive a mail with the content of the Position/Arrival/Port/Departure report,
so there is no need to send report directly to the operation department.
The “position” module shall cover periods at sea where vessel is proceeding at cruising speed.
At the start time of the reporting period, the vessel must have obtained its cruising speed.
End time of a “position” report just before arrival shall end before the cruising speed is
reduced for maneuvering, taking pilot or anchoring. Logged and observed distances, fuel
consumption, power production, etc. shall cover the reporting period only
The “arrival” report shall cover the time just before the speed is reduced and until the vessel
is alongside.
The “port” covers the period while in port.
The “departure” report covers the period from departure from quay and until the vessel has
obtained it’s cruising speed.
In the following sections, you will find guidance on how to create, review, send and modify an
existing report.
Vessel Reporting Procedures
Page 3 of 12
Revision : 2012-11-06 Revision No. : 3
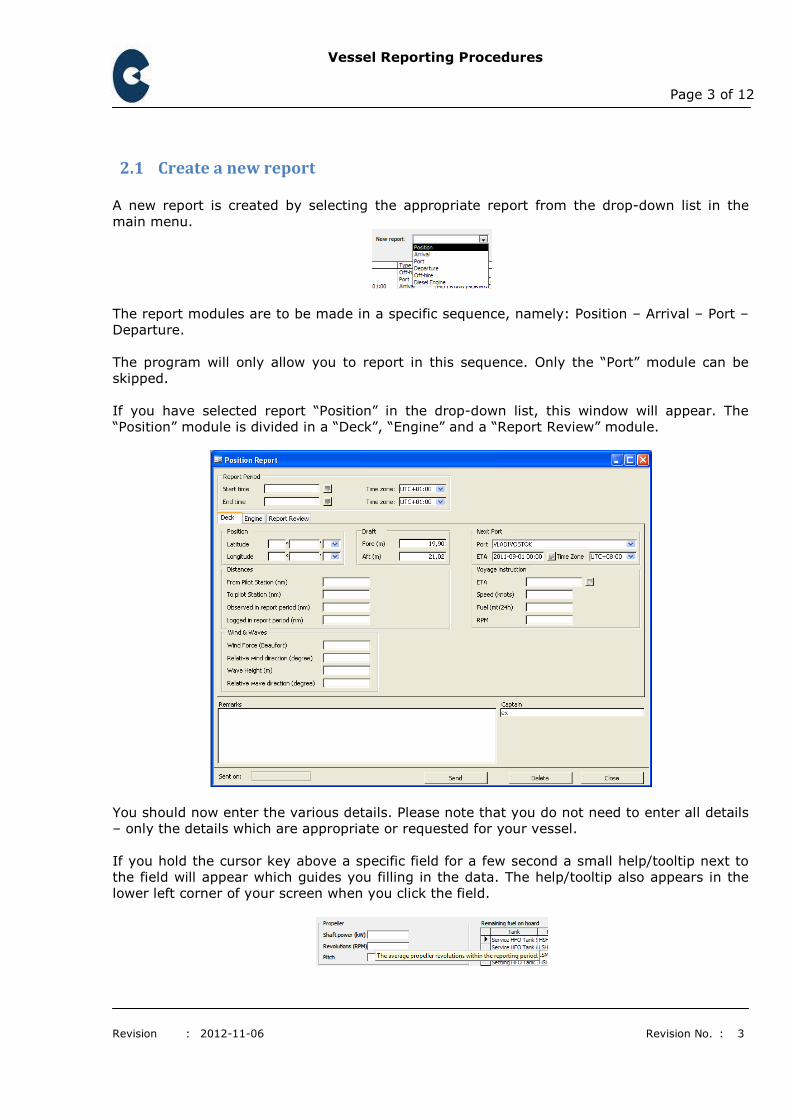
2.1 Create a new report
A new report is created by selecting the appropriate report from the drop-down list in the
main menu.
The report modules are to be made in a specific sequence, namely: Position – Arrival – Port –
Departure.
The program will only allow you to report in this sequence. Only the “Port” module can be
skipped.
If you have selected report “Position” in the drop-down list, this window will appear. The
“Position” module is divided in a “Deck”, “Engine” and a “Report Review” module.
You should now enter the various details. Please note that you do not need to enter all details
– only the details which are appropriate or requested for your vessel.
If you hold the cursor key above a specific field for a few second a small help/tooltip next to
the field will appear which guides you filling in the data. The help/tooltip also appears in the
lower left corner of your screen when you click the field.

Vessel Reporting Procedures
Page 4 of 12
Revision : 2012-11-06 Revision No. : 3
The data is automatically saved when you close the window, so when the next user opens the
report, he will see the data filled in already.
2.2 Validation of report
The program can automatically review and validate data entered in the report. In case the
data is incorrect or out of range, a report notification will be generated.
Before sending a report / after making necessary entries, all report notifications have to be
reviewed. The report notifications are found in the “Report Review” tab to the right of the
“Deck” and “Engine” tabs.
Report notifications are made to all entries that are incorrect or out of range. Examples of
report notifications are:
The average electrical load on generator is too low /high. Total running hours of generators are lower that re porting period. Observed/logged distance has not been reported. The observed speed (27.5 knots) is probably too hig h.
Basis feedback from “report notifications”, the entered data should be corrected by user
before report is send. Corrections is done by going back on either the “Deck” or “Engine” tab
and correct the entry. Once the data is corrected, the report notification will disappear in the
“Report Review”.
If you evaluate that the data entry is correct although a report notification is made, you must
enter an explanation in the comment box. E.g. example as below:
Observed distance has not been reported. Comment: S peed log out of order. The average electrical load (550 kW) is probably to o high. Comment: Due to use of both cranes.
It is mandatory to make a comment on report notifications that are not corrected.
User is to confirm notifications before sending by clicking the “Confirm notification(s)” button.
2.3 Send a report
When the report has been completed, it must be send to the office. In order to do so, you
must click the <Send> button, and the system will create a data file.
If the mail setup has been configured to use “Drop folder” (see section 9 for further details)
the file will be saved to the specified folder, and you will have to pick it up manually if your
mail system have not been configured to pick it up automatically.
If the mail setup has been configured to use “SMTP Server” it will be send automatically.
Vessel Reporting Procedures
Page 5 of 12
Revision : 2012-11-06 Revision No. : 3
2.4 Modify existing report
If you need to edit an existing report you simply double-click on the report in the list and click
the Edit button when the report has opened.
If the report has been sent already, simply double-click on the report, click the “Edit” button,
make your correction(s) or additional entries and send it again. The new report will
automatically overwrite the old report.
3 Awaiting berthing at anchorage place / drifting at sea
If the vessel will be awaiting berthing at anchorage place or drifting, the vessel must send an
Arrival report upon anchoring and a port report every day while awaiting berthing. When the
berthing has been completed another Arrival report must be send.
4 Canal passage
If the vessel is passing a Canal for instance the Suez Canal or the Panama Canal the vessel
should send an Arrival report when arriving at the anchorage area. Upon departing the canal
and resuming cruising speed a Departure report must be sent.
5 Weather reporting
The vessel is requested to report both wind and wave conditions while at sea, i.e. in the
Position reports. The four (4) parameters to be reported are:
• Wind Force (Beaufort): In order to help estimating the Beaufort number, please refer
to the enclosed appendix which contains pictures for easy determination of the wind
(and sea)
• Relative wind direction (degree): This is the wind direction relative to the ship’s course.
It may be determined by means of the anemometer.
• Wave Height (m): This is the significant wave height and includes both the wind driven
waves and the swells. The height should be estimated visually, and the enclosed
appendix might serve as a help in this respect.
• Relative wave direction (degree): This is the wave direction relative to the ship’s
course. It should be determined visually.
Important: The above weather parameters should be the actual values at the reporting time,
i.e. the actual values at the end of the reporting period.
Vessel Reporting Procedures
Page 6 of 12
Revision : 2012-11-06 Revision No. : 3
6 Fuel consumption reporting
The vessel is requested to report consumption on the major consumers, i.e. the main engine,
auxiliary engines and boiler.
Below, you will find instruction on how to calculate consumption of the different consumer-
groups.
Generally, soundings and flow-meter readings are in volumes. In order to convert the volume
to mass and adjust to the actual temperature, the below calculation can be used.
If density at 150C is known, density at the actual temperature can be calculated as follows:
Density at X 0C = Density at 15 0C – 0,00064 x (X-15)
(where X is actual temp of fuel in 0C at the flow meter)
Quantity in metric Tons = Volume x Density at X 0C
Example: Consumption from flow meter readings during reporting period = 25,0 m 3 Density at 15 °C = 0,993 mt/m 3 Fuel temperature = 88°C Density at 88°C = 0,993 – (0,00064 x (88 - 15) = 0,9463 mt/m 3 Consumption = 25,0 m 3 x 0,9463 mt/ m 3 = 23,657 mt
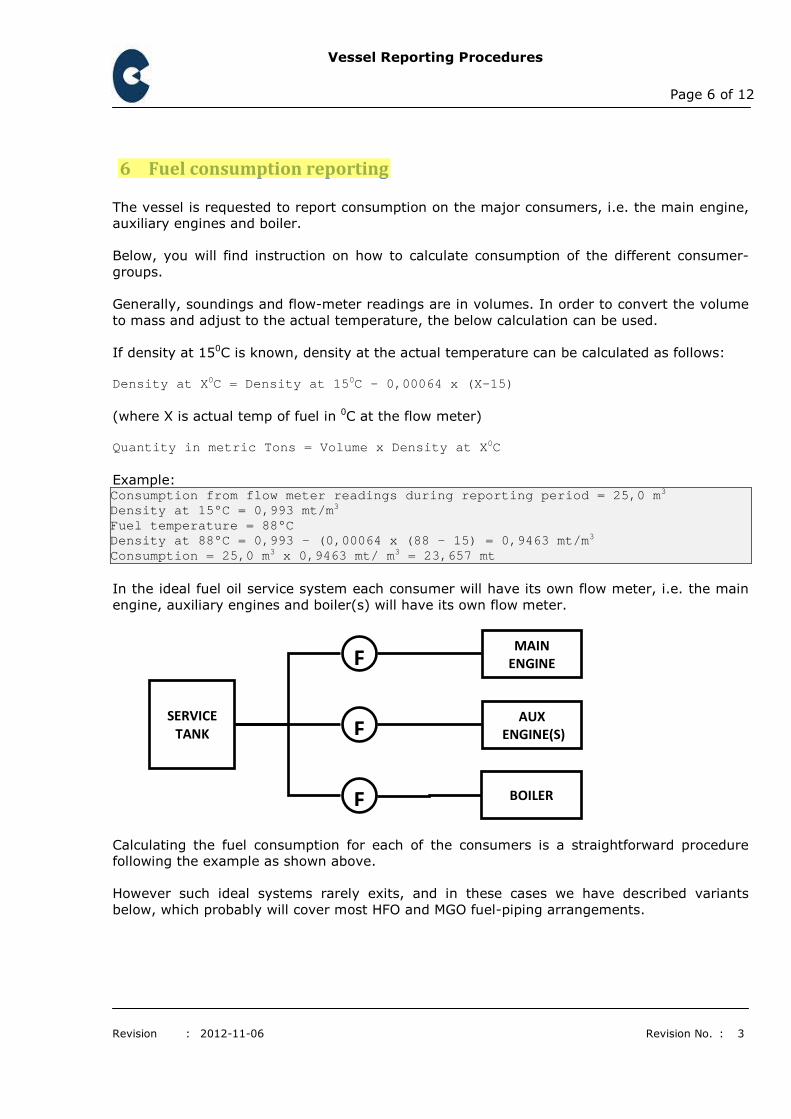
In the ideal fuel oil service system each consumer will have its own flow meter, i.e. the main
engine, auxiliary engines and boiler(s) will have its own flow meter.
Calculating the fuel consumption for each of the consumers is a straightforward procedure
following the example as shown above.
However such ideal systems rarely exits, and in these cases we have described variants
below, which probably will cover most HFO and MGO fuel-piping arrangements.
F MAIN
ENGINE
SERVICE
TANK F AUX
ENGINE(S)
F BOILER
ИГОРЬ
Подсветка
Vessel Reporting Procedures
Page 7 of 12
Revision : 2012-11-06 Revision No. : 3
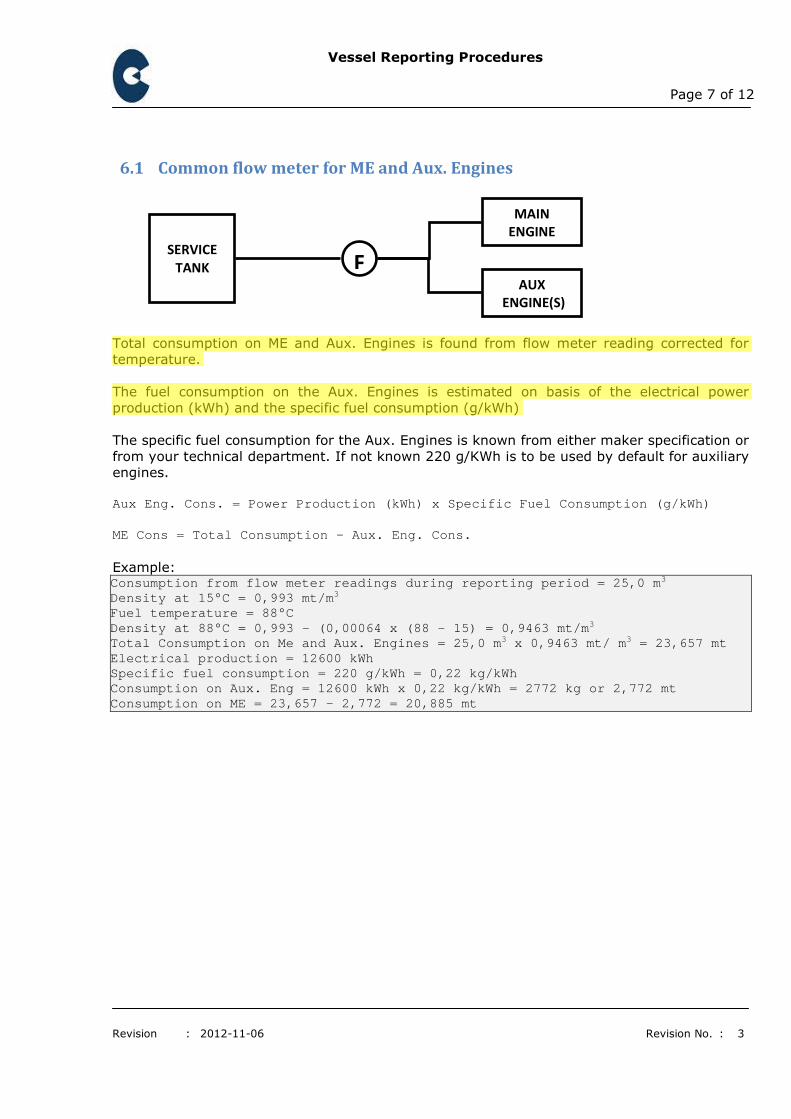
6.1 Common flow meter for ME and Aux. Engines
Total consumption on ME and Aux. Engines is found from flow meter reading corrected for
temperature.
The fuel consumption on the Aux. Engines is estimated on basis of the electrical power
production (kWh) and the specific fuel consumption (g/kWh)
The specific fuel consumption for the Aux. Engines is known from either maker specification or
from your technical department. If not known 220 g/KWh is to be used by default for auxiliary
engines.
Aux Eng. Cons. = Power Production (kWh) x Specific Fuel Consumption (g/kWh) ME Cons = Total Consumption – Aux. Eng. Cons.
Example: Consumption from flow meter readings during reporti ng period = 25,0 m3 Density at 15 °C = 0,993 mt/m 3 Fuel temperature = 88°C Density at 88°C = 0,993 – (0,00064 x (88 - 15) = 0,9463 mt/m 3 Total Consumption on Me and Aux. Engines = 25,0 m 3 x 0,9463 mt/ m 3 = 23,657 mt Electrical production = 12600 kWh Specific fuel consumption = 220 g/kWh = 0,22 kg/kWh Consumption on Aux. Eng = 12600 kWh x 0,22 kg/k Wh = 2772 kg or 2,772 mt Consumption on ME = 23,657 – 2,772 = 20,885 mt
MAIN
ENGINE
SERVICE
TANK F AUX
ENGINE(S)
ИГОРЬ
Подсветка
ИГОРЬ
Подсветка
Vessel Reporting Procedures
Page 8 of 12
Revision : 2012-11-06 Revision No. : 3
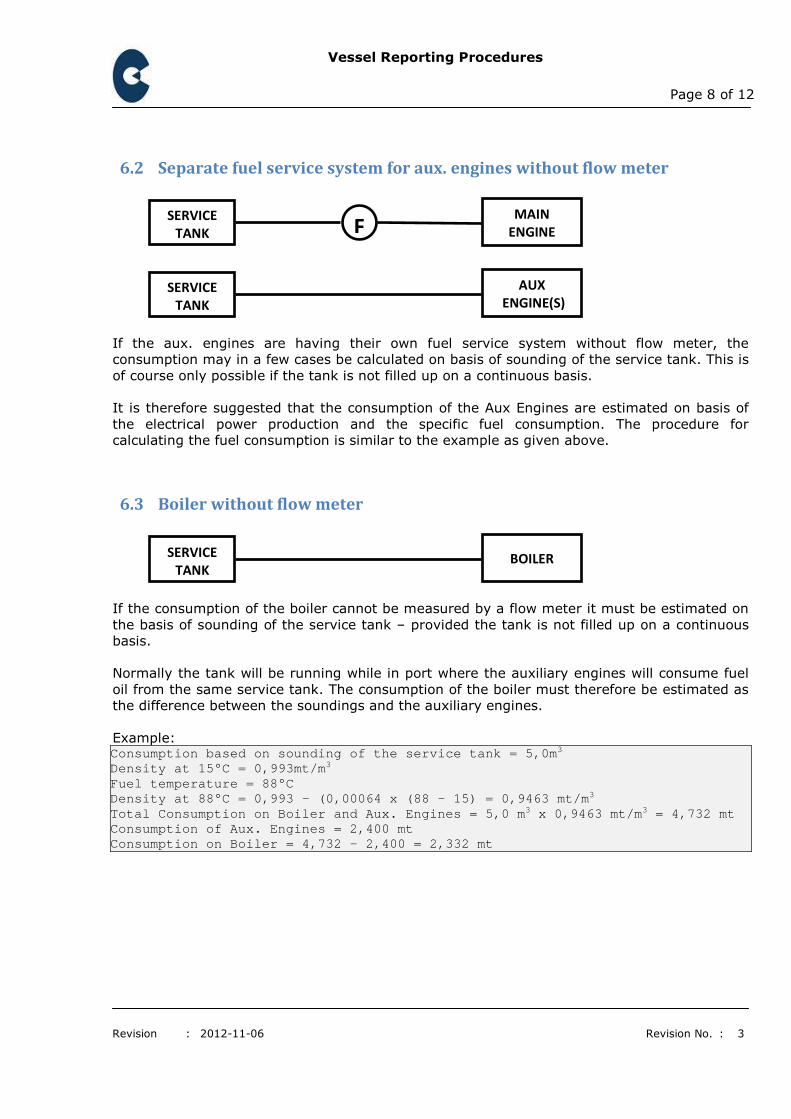
6.2 Separate fuel service system for aux. engines without flow meter
If the aux. engines are having their own fuel service system without flow meter, the
consumption may in a few cases be calculated on basis of sounding of the service tank. This is
of course only possible if the tank is not filled up on a continuous basis.
It is therefore suggested that the consumption of the Aux Engines are estimated on basis of
the electrical power production and the specific fuel consumption. The procedure for
calculating the fuel consumption is similar to the example as given above.
6.3 Boiler without flow meter
If the consumption of the boiler cannot be measured by a flow meter it must be estimated on
the basis of sounding of the service tank – provided the tank is not filled up on a continuous
basis.
Normally the tank will be running while in port where the auxiliary engines will consume fuel
oil from the same service tank. The consumption of the boiler must therefore be estimated as
the difference between the soundings and the auxiliary engines.
Example: Consumption based on sounding of the service tank = 5 ,0m 3 Density at 15 °C = 0,993mt/m 3 Fuel temperature = 88°C Density at 88°C = 0,993 – (0,00064 x (88 - 15) = 0,9463 mt/m 3 Total Consumption on Boiler and Aux. Engines = 5,0 m 3 x 0,9463 mt/m 3 = 4,732 mt Consumption of Aux. Engines = 2,400 mt Consumption on Boiler = 4,732 – 2,400 = 2,332 mt
BOILER SERVICE
TANK
F MAIN
ENGINE
SERVICE
TANK
AUX
ENGINE(S) SERVICE
TANK
Vessel Reporting Procedures
Page 9 of 12
Revision : 2012-11-06 Revision No. : 3
7 Reporting of remaining fuel onboard (ROB)
Remaining of fuel onboard in metric tons is to be reported regularly. When daily consumption
has been determined as described above, the remaining onboard is easily obtained by
subtracting consumption from the ROB from the previous day.
When residual of fuels onboard is determined by a reliable sounding of the different tanks,
these figures are to be recorded as the remaining onboard, even if the figures do not
correspond to the figures obtained by calculation only.
Example: Day 1: ROB = 465 mt Day 2: Consumption = 30 mt, then ROB = 435 mt Day 3: Consumption = 30 mt, then ROB = 405 mt Day 4: Good sounding of all tanks is made and content in tanks = 420 m 3 at 45°C Density = 0,993 at 15°C Density at 45°C = 0,993 – 0,00064 x (45-15) = 0,9738 mt/m 3 ROB in Metric tons = 420 m 3 x 0,9738 mt/m 3 = 409 mt On day 4, you are to report ROB as 409 mt
8 Reporting of Bunkering
When you have received bunkers, the quantities received must be reported in the “departure”
report, under “remaining fuel onboard” and “bunkered” column.
9 System Setup
If the system is not installed on your computer, please follow the guideline as provided along
with the program. If you need any help with the installation please see section 10 for contact
details.
After installation of the system, you must configure the system for you vessel. Please follow
the guidelines below - it will only take you a few minutes.
When you start the application the first time you will see this window.
Vessel Reporting Procedures
Page 10 of 12
Revision : 2012-11-06 Revision No. : 3
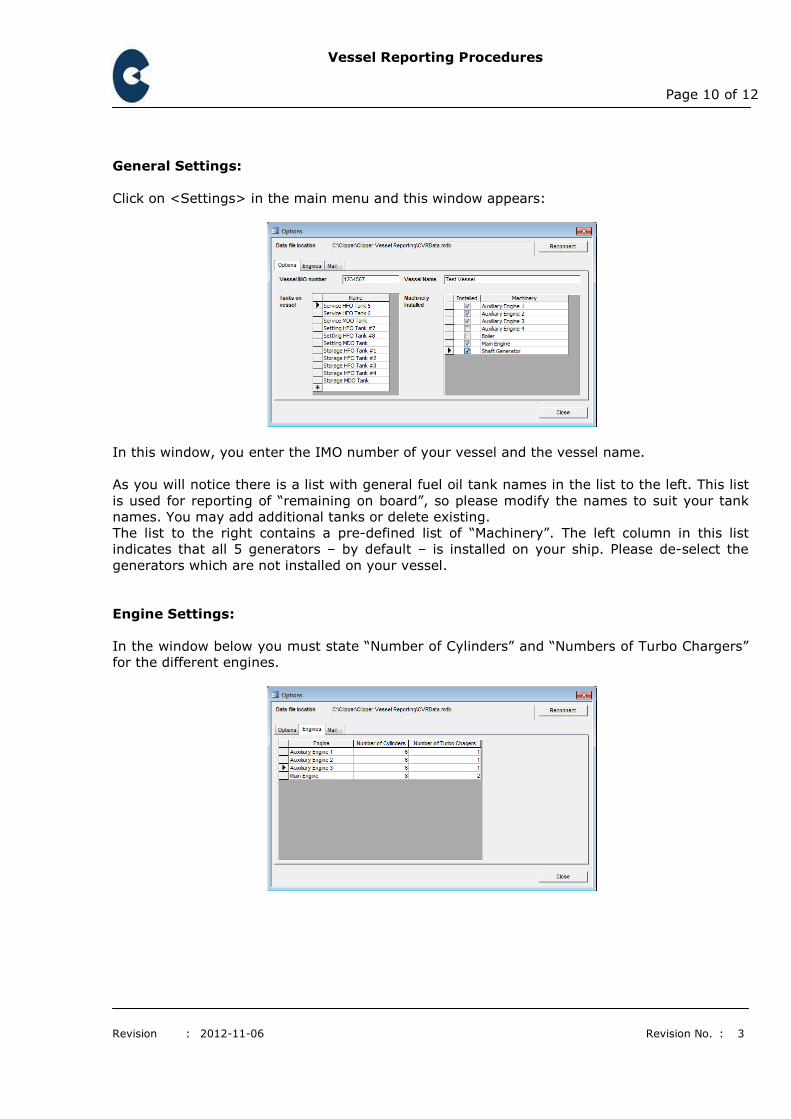
General Settings:
Click on <Settings> in the main menu and this window appears:
In this window, you enter the IMO number of your vessel and the vessel name.
As you will notice there is a list with general fuel oil tank names in the list to the left. This list
is used for reporting of “remaining on board”, so please modify the names to suit your tank
names. You may add additional tanks or delete existing.
The list to the right contains a pre-defined list of “Machinery”. The left column in this list
indicates that all 5 generators – by default – is installed on your ship. Please de-select the
generators which are not installed on your vessel.
Engine Settings:
In the window below you must state “Number of Cylinders” and “Numbers of Turbo Chargers”
for the different engines.
Vessel Reporting Procedures
Page 11 of 12
Revision : 2012-11-06 Revision No. : 3
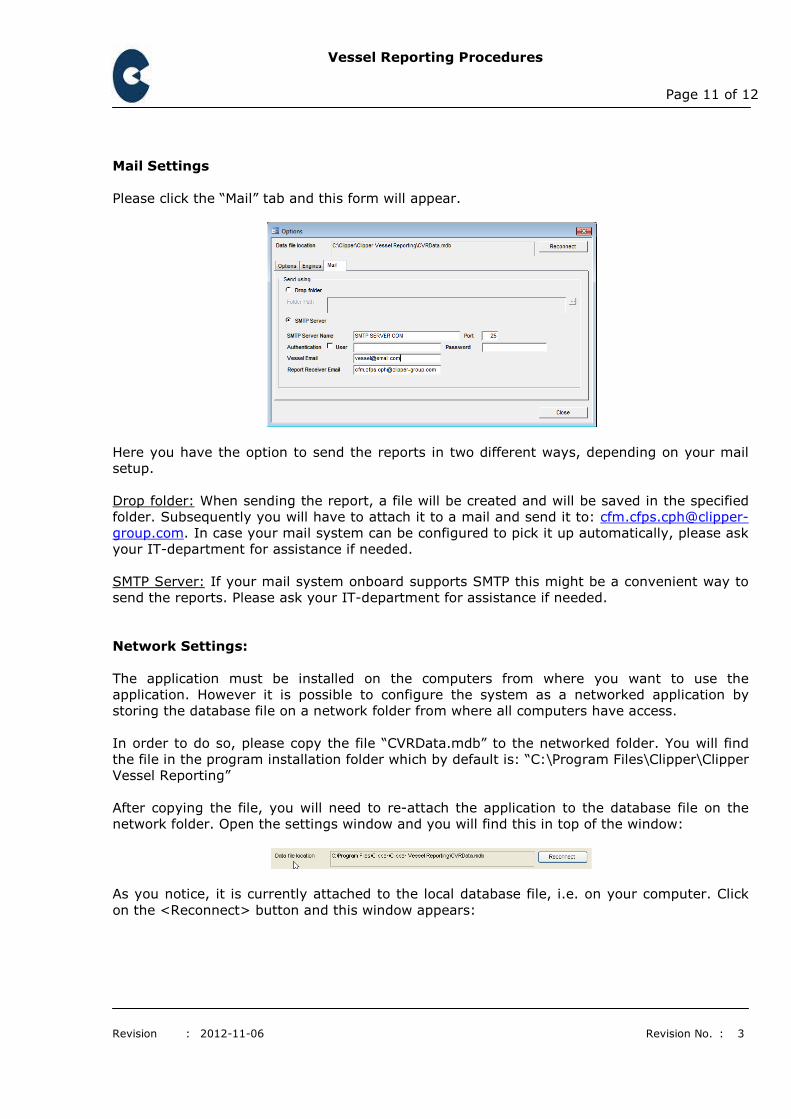
Mail Settings
Please click the “Mail” tab and this form will appear.
Here you have the option to send the reports in two different ways, depending on your mail
setup.
Drop folder: When sending the report, a file will be created and will be saved in the specified
folder. Subsequently you will have to attach it to a mail and send it to: cfm.cfps.cph@clipper-
group.com. In case your mail system can be configured to pick it up automatically, please ask
your IT-department for assistance if needed.
SMTP Server: If your mail system onboard supports SMTP this might be a convenient way to
send the reports. Please ask your IT-department for assistance if needed.
Network Settings:
The application must be installed on the computers from where you want to use the
application. However it is possible to configure the system as a networked application by
storing the database file on a network folder from where all computers have access.
In order to do so, please copy the file “CVRData.mdb” to the networked folder. You will find
the file in the program installation folder which by default is: “C:\Program Files\Clipper\Clipper
Vessel Reporting”
After copying the file, you will need to re-attach the application to the database file on the
network folder. Open the settings window and you will find this in top of the window:
As you notice, it is currently attached to the local database file, i.e. on your computer. Click
on the <Reconnect> button and this window appears:
Vessel Reporting Procedures
Page 12 of 12
Revision : 2012-11-06 Revision No. : 3
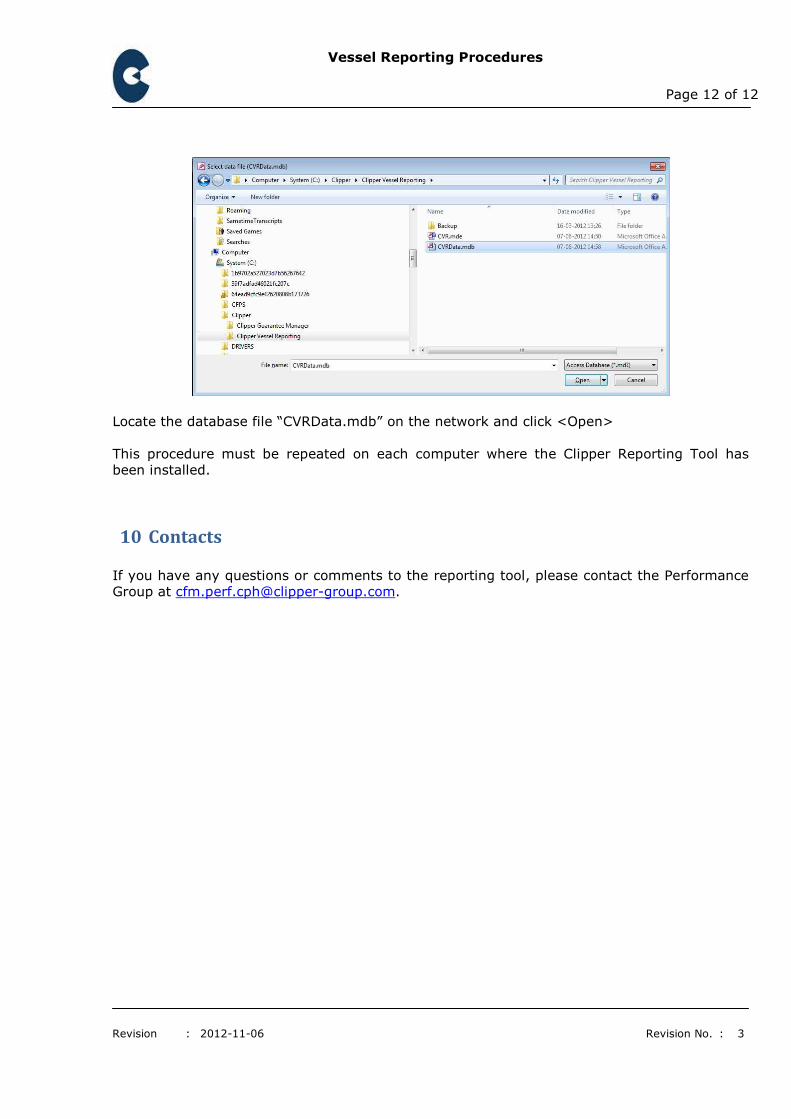
Locate the database file “CVRData.mdb” on the network and click <Open>
This procedure must be repeated on each computer where the Clipper Reporting Tool has
been installed.
10 Contacts
If you have any questions or comments to the reporting tool, please contact the Performance
Group at [email protected].
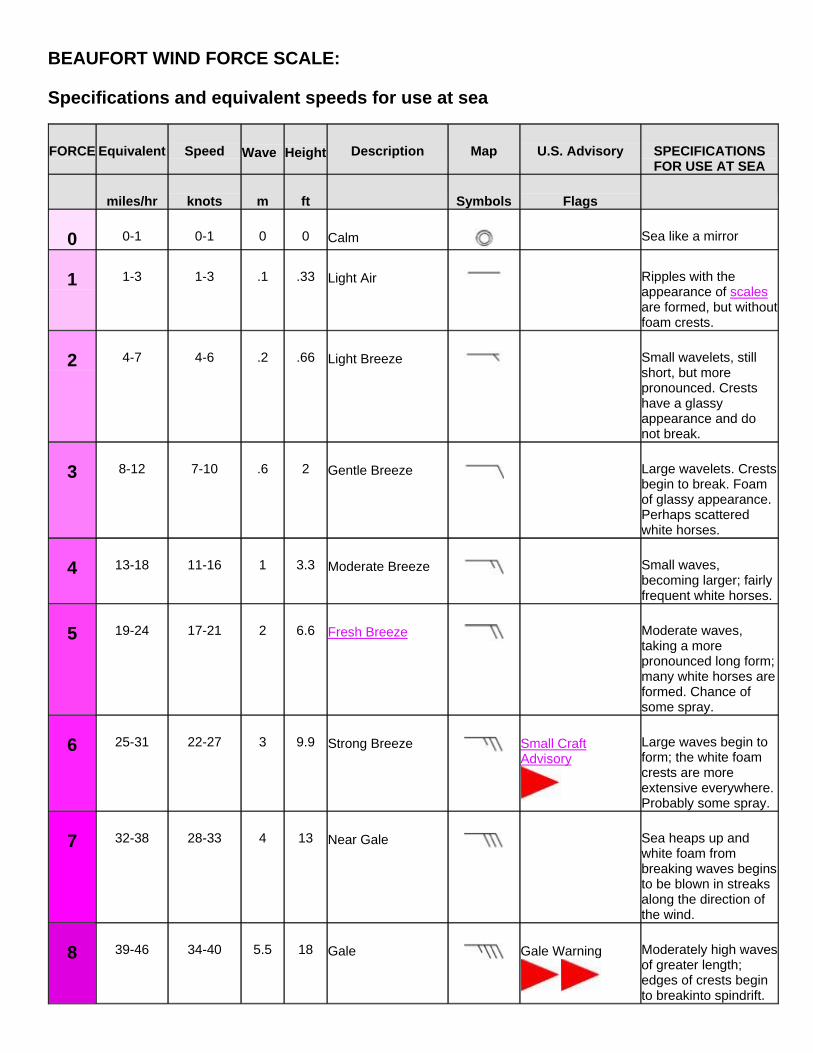
BEAUFORT WIND FORCE SCALE:
Specifications and equivalent speeds for use at sea
FORCE Equivalent
Speed Wave
Height
Description Map U.S. Advisory SPECIFICATIONS
FOR USE AT SEA
miles/hr
knots m ft Symbols
Flags
0 0-1
0-1 0 0 Calm
Sea like a mirror
1 1-3
1-3 .1 .33 Light Air Ripples with the
appearance of scales are formed, but without foam crests.
2 4-7
4-6 .2 .66 Light Breeze
Small wavelets, still short, but more
pronounced. Crests have a glassy appearance and do not break.
3 8-12
7-10 .6 2 Gentle Breeze
Large wavelets. Crests begin to break. Foam of glassy appearance. Perhaps scattered white horses.
4 13-18
11-16 1 3.3
Small waves, becoming larger; fairly frequent white horses.
Moderate Breeze
5 19-24
17-21 2 6.6 Fresh Breeze
Moderate waves, taking a more
pronounced long form; many white horses are formed. Chance of some spray.
6 25-31
Strong Breeze Small Craft
Large waves begin to form; the white foam crests are more extensive everywhere. Probably some spray.
22-27 3 9.9 Advisory
7 32-38
28-33 4 13 Near Gale
Sea heaps up and white foam from
breaking waves begins to be blown in streaks along the direction of the wind.
8 39-46
Gale Gale Warning
34-40 5.5 18 Moderately high waves of greater length; edges of crests begin to breakinto spindrift.
The foam is blown in well-marked streaks slong the direction of the wind.
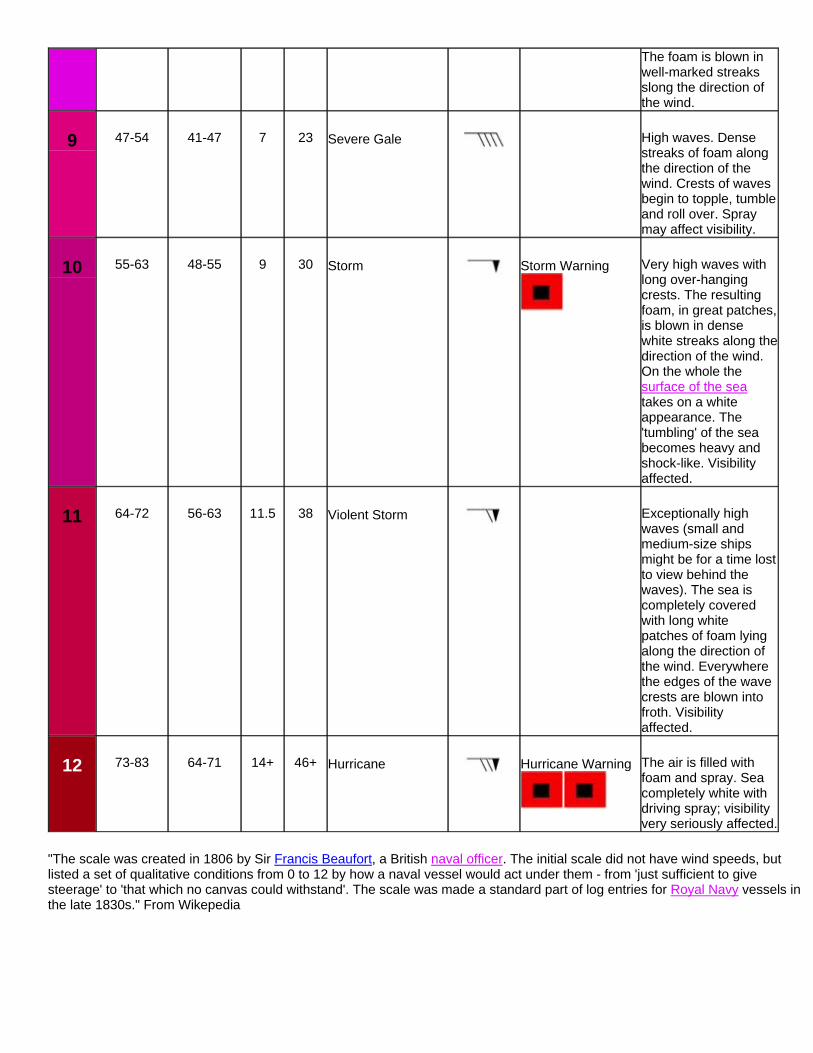
9 47-54
41-47 7 23 Severe Gale
High waves. Dense streaks of foam along the direction of the
wind. Crests of waves begin to topple, tumble and roll over. Spray may affect visibility.
10 55-63
Storm Storm Warning
Very high waves with long over-hanging crests. The resulting foam, in great patches, is blown in dense white streaks along the direction of the wind. On the whole the surface of the sea takes on a white appearance. The
48-55 9 30
'tumbling' of the sea becomes heavy and shock-like. Visibility affected.
11 64-72
56-63 11.5 38 Violent Storm
Exceptionally high waves (small and medium-size ships might be for a time lost to view behind the waves). The sea is completely covered with long white patches of foam lying along the direction of the wind. Everywhere
the edges of the wave crests are blown into froth. Visibility affected.
12 73-83
Hurricane Hurricane Warning
The air is filled with foam and spray. Sea completely white with driving spray; visibility very seriously affected.
64-71 14+ 46+
"The scale was created in 1806 by Sir Francis Beaufort, a British naval officer. The initial scale did not have wind speeds, but listed a set of qualitative conditions from 0 to 12 by how a naval vessel would act under them - from 'just sufficient to give steerage' to 'that which no canvas could withstand'. The scale was made a standard part of log entries for Royal Navy vessels in the late 1830s." From Wikepedia
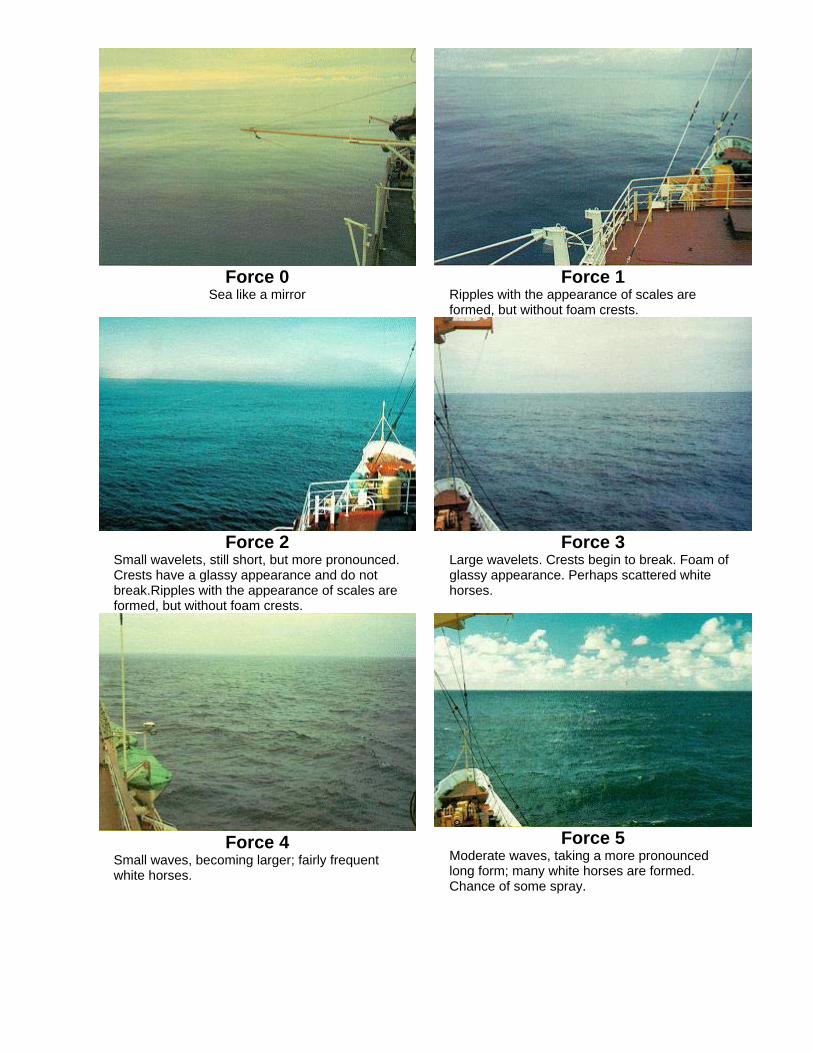
Force 0 Force 1 Sea like a mirror Ripples with the appearance of scales are
formed, but without foam crests.
Force 2 Force 3 Small wavelets, still short, but more pronounced. Crests have a glassy appearance and do not break.Ripples with the appearance of scales are formed, but without foam crests.
Large wavelets. Crests begin to break. Foam of glassy appearance. Perhaps scattered white horses.
Force 5 Force 4 Moderate waves, taking a more pronounced long form; many white horses are formed. Chance of some spray.
Small waves, becoming larger; fairly frequent white horses.
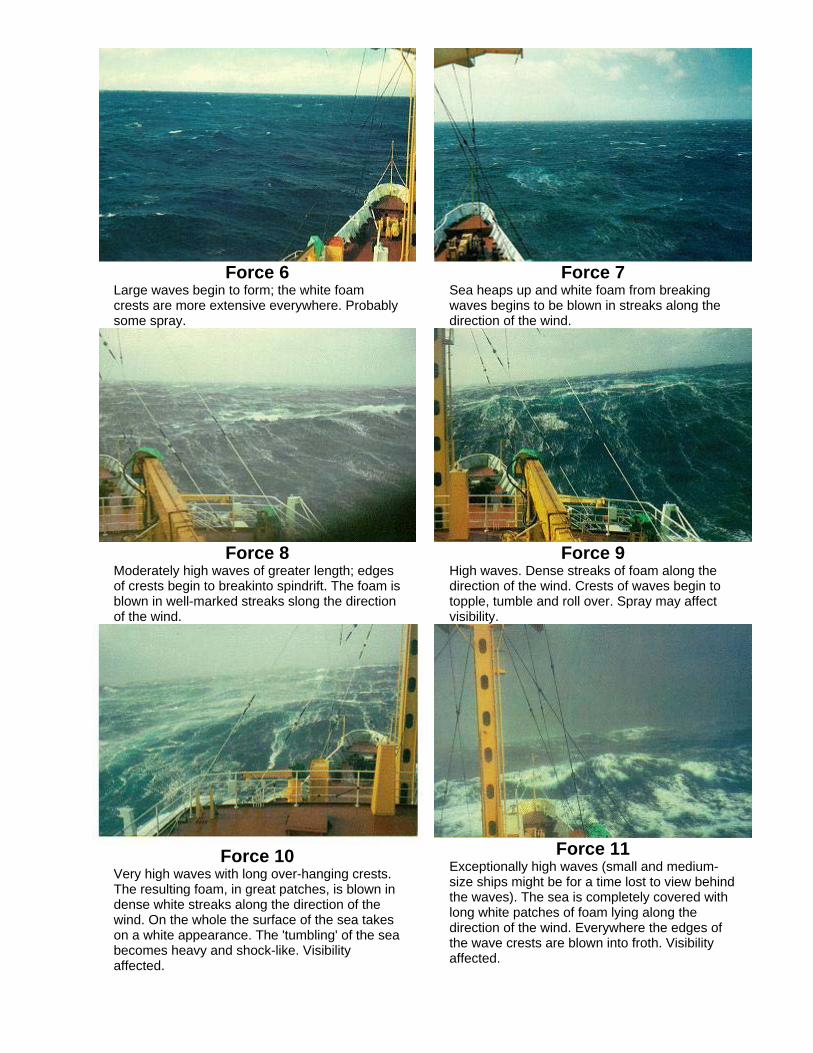
Force 6 Force 7 Large waves begin to form; the white foam crests are more extensive everywhere. Probably some spray.
Sea heaps up and white foam from breaking waves begins to be blown in streaks along the direction of the wind.
Force 8 Force 9 Moderately high waves of greater length; edges of crests begin to breakinto spindrift. The foam is blown in well-marked streaks slong the direction of the wind.
High waves. Dense streaks of foam along the direction of the wind. Crests of waves begin to topple, tumble and roll over. Spray may affect visibility.
Force 11 Force 10 Exceptionally high waves (small and medium-size ships might be for a time lost to view behind the waves). The sea is completely covered with long white patches of foam lying along the direction of the wind. Everywhere the edges of the wave crests are blown into froth. Visibility affected.
Very high waves with long over-hanging crests. The resulting foam, in great patches, is blown in dense white streaks along the direction of the wind. On the whole the surface of the sea takes on a white appearance. The 'tumbling' of the sea becomes heavy and shock-like. Visibility affected.
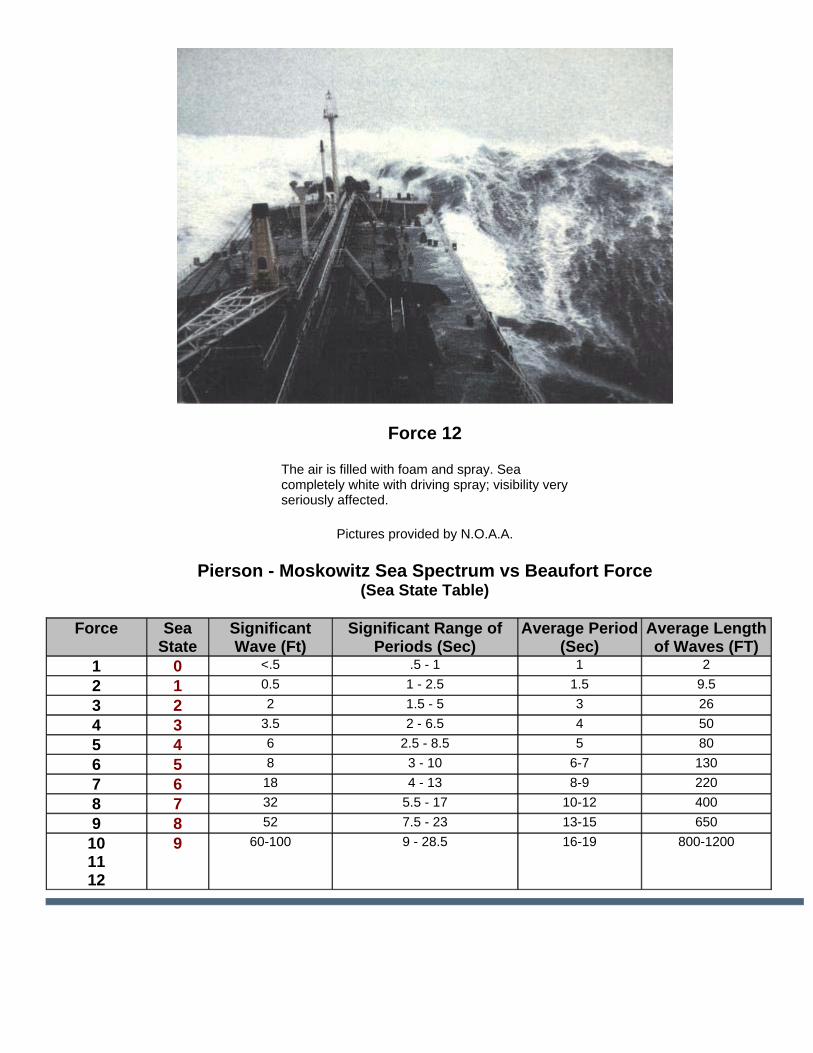
Force 12
The air is filled with foam and spray. Sea completely white with driving spray; visibility very seriously affected.
Pictures provided by N.O.A.A.
Pierson - Moskowitz Sea Spectrum vs Beaufort Force (Sea State Table)
Force Sea
State Significant Wave (Ft)
Significant Range of Periods (Sec)
Average Period (Sec)
Average Length of Waves (FT)
1 0 <.5 .5 - 1 1 2 2 1 0.5 1 - 2.5 1.5 9.5 3 2 2 1.5 - 5 3 26 4 3 3.5 2 - 6.5 4 50 5 4 6 2.5 - 8.5 5 80 6 5 8 3 - 10 6-7 130 7 6 18 4 - 13 8-9 220 8 7 32 5.5 - 17 10-12 400 9 8 52 7.5 - 23 13-15 650
10 11 12
9 60-100 9 - 28.5 16-19 800-1200