Comparison of Financial Performance Analysis of Malek ...
64
INTERNSHIP REPORT ON Comparison of Financial Performance Analysis of Malek Spinning Mills Ltd and its Subsidiaries. Submitted to Dr. Salehuddin Ahmed Professor BRAC Business School BRAC University Submitted By Brity Dev ID # 16364024 Masters of Business Administration BRAC Business School BRAC University Date of Submission: 23 th December 2018
-
Upload
khangminh22 -
Category
Documents
-
view
2 -
download
0
Transcript of Comparison of Financial Performance Analysis of Malek ...
INTERNSHIP REPORT
ON
Comparison of Financial Performance Analysis of
Malek Spinning Mills Ltd and its Subsidiaries.
Submitted to
Dr. Salehuddin Ahmed
Professor
BRAC Business School
BRAC University
Submitted By Brity Dev
ID # 16364024
Masters of Business Administration
BRAC Business School
BRAC University
Date of Submission: 23th December 2018
INTERNSHIP REPORT ON
Comparison of Financial Performance Analysis of
Malek Spinning Mills Ltd and its Subsidiaries.
Letter of Transmittal
23th December, 2018
Dr. Salehuddin Ahmed
Professor
BRAC Business School
BRAC University
Subject: Submission of Internship report on “Financial Performance Analysis of Malek
Spinning Mills Ltd and its Subsidiaries.”
Dear Sir,
I am the student of MBA program of the BRAC University. I am happy and delighted to
submit the report for your kind evaluation and appreciation.
I have prepared this report based on my exposure to "Financial Performance of Malek
Spinning Mills Ltd and its subsidiaries" It is a great pleasure for me to present you this
report on discuss with financial manager. Here I tried my best to collect the complete
information available.
I also regard my heart full thanks to you to help and guide me to prepare my report
successfully.
Sincerely yours
-------------------------
Brity Dev
ID # 16364024
Masters of Business Administration
BRAC Business School
BRAC University
Declaration by the Supervisor
This is certifying that the internship report on "Financial Performance Analysis of Malek
Spinning Mills Ltd and its subsidiaries” submitted for the partial completion of Masters
of Business Administration (MBA) degree from BRAC University. Brity Dev,
MBA 16364024, has done this report from 1st October, 2018 to 1th December, 2018 under
my supervision. Of the Internship report has been submitted for any degree or title
recognition before. I wish it will help her future career.
She is permitted to submit the report.
------------------- ---------------------------------
Supervisor
Dr. Salehuddin Ahmed
Professor
BRAC Business School
BRAC University
Acknowledgement
At first I would like to thank my respectful Supervisor Dr. Salehuddin Ahmed Professor
, BRAC Business School, BRAC University. To give me the opportunity to complete my
internship at Malek Spinning Mills Limited. I would like to thank Malek Spinning Mills
Limited to offer me the internship program at their office.
I must also thank our honorable teachers of the department for their advices and help in
drafting this report. I would also like to thank the following people for their support and
contribution to the report directly and indirectly:
Mr. Bidyut Kumar Chaki, Chief Financial Officer (MSML)
Mr, S.M. Iqbal Sarkar, AGM(Finance & Accounts)
I would lastly like to thank BRAC University and Malek Spinning Mills Ltd. for their great
support.
Executive Summary
This report "Financial Performance Analysis of Malek spinning Mills Ltd and its
subsidiaries" is prepared to fulfill the partial requirement of the internship program of
MBA, BRAC Business School, BRAC University. The topic of study was selected upon
consultation with course Supervisor of respective department. In the organization part of
this report a details description of Malek Spinning Mills Ltd. (MSML) and its subsidiaries
in terms of their managerial operation, finance operation and production operation and so
on. The textile industry plays a vital role in the socio-economic development of
Bangladesh. This study is designed to review the financial performance of Malek Spinning
Mills Ltd and its subsidiaries.
In the second chapter, I have shown the information about the organization, their
governance, ownership structure, vision mission, business process etc. these will provide a
quick knowledge about the organization.
The Financial Performance of this industry and its subsidiaries are measured in terms of
Ratio (Liquidity, profitability, activity and solvency ratios and official records as well as
primary data collected by interview. It was observed from the study of the financial
statement of the textile industry.
I also focused on trend analysis because I though it is important to analyze trends in ratios
as well as their absolute levels. Trend analysis gives clues as whether a firm’s financial
condition is likely to improve or to deteriorate. Comparisons are then made to the base year
by expressing the other years’ amount as a percentage of the base years’ amounts.
That the profit earning capacity, liquidity position, financial position and the performance
of the most of the textiles are not in sound position. The reasons behind this position of the
industry are inefficiency of financial management, absence of realistic goals, strict
government regulation and increased cost of raw-materials, labor and overhead. The
financial performance should be improved immediately. Therefore the appropriate
authority should take measures for the removal of above problems. Malek Spinning Mills
Ltd. is supposed to be Bangladesh's largest textile company. MSML it has targeted the
industries the company needs most for progress and improved living standards. Is also
focused on those industries, which make the most of Bangladesh's competitive advantages
in the international market.
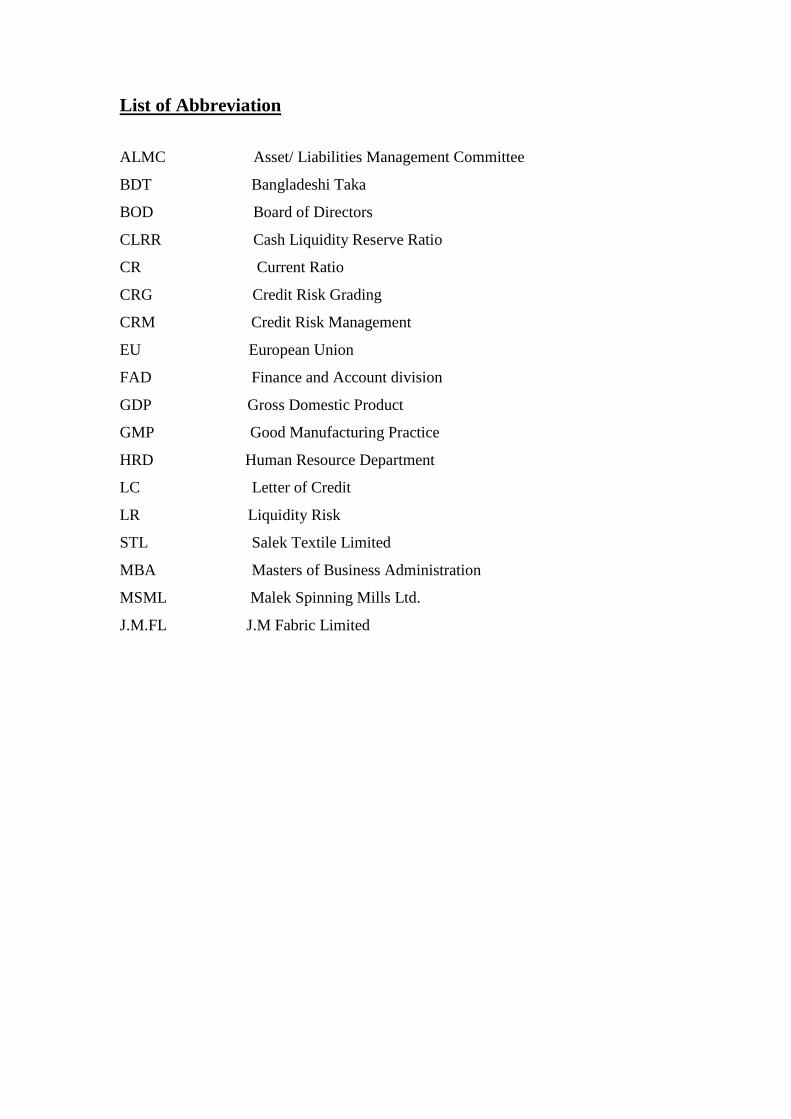
List of Abbreviation
ALMC Asset/ Liabilities Management Committee
BDT Bangladeshi Taka
BOD Board of Directors
CLRR Cash Liquidity Reserve Ratio
CR Current Ratio
CRG Credit Risk Grading
CRM Credit Risk Management
EU European Union
FAD Finance and Account division
GDP Gross Domestic Product
GMP Good Manufacturing Practice
HRD Human Resource Department
LC Letter of Credit
LR Liquidity Risk
STL Salek Textile Limited
MBA Masters of Business Administration
MSML Malek Spinning Mills Ltd.
J.M.FL J.M Fabric Limited
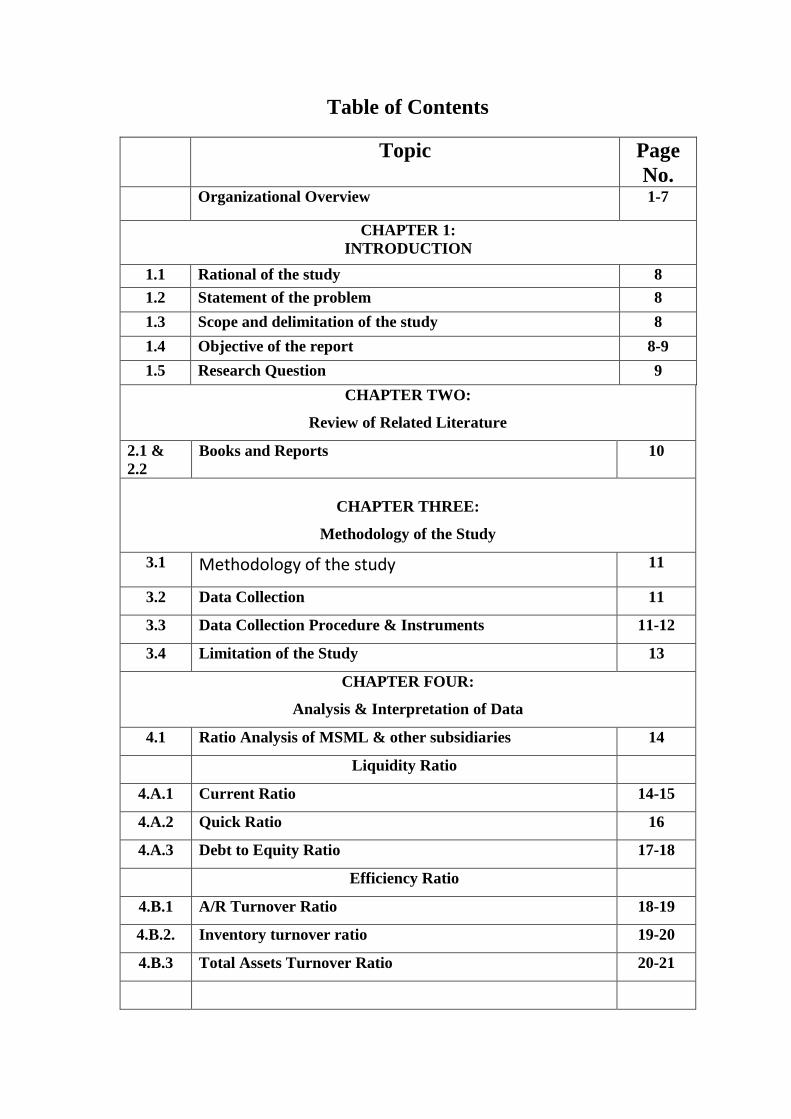
Table of Contents
Topic Page
No. Organizational Overview 1-7
CHAPTER 1:
INTRODUCTION
1.1 Rational of the study 8
1.2 Statement of the problem 8
1.3 Scope and delimitation of the study 8
1.4 Objective of the report 8-9
1.5 Research Question 9
CHAPTER TWO:
Review of Related Literature
2.1 &
2.2
Books and Reports 10
CHAPTER THREE:
Methodology of the Study
3.1 Methodology of the study 11
3.2 Data Collection 11
3.3 Data Collection Procedure & Instruments 11-12
3.4 Limitation of the Study 13
CHAPTER FOUR:
Analysis & Interpretation of Data
4.1 Ratio Analysis of MSML & other subsidiaries 14
Liquidity Ratio
4.A.1 Current Ratio 14-15
4.A.2 Quick Ratio 16
4.A.3 Debt to Equity Ratio 17-18
Efficiency Ratio
4.B.1 A/R Turnover Ratio 18-19
4.B.2. Inventory turnover ratio 19-20
4.B.3 Total Assets Turnover Ratio 20-21
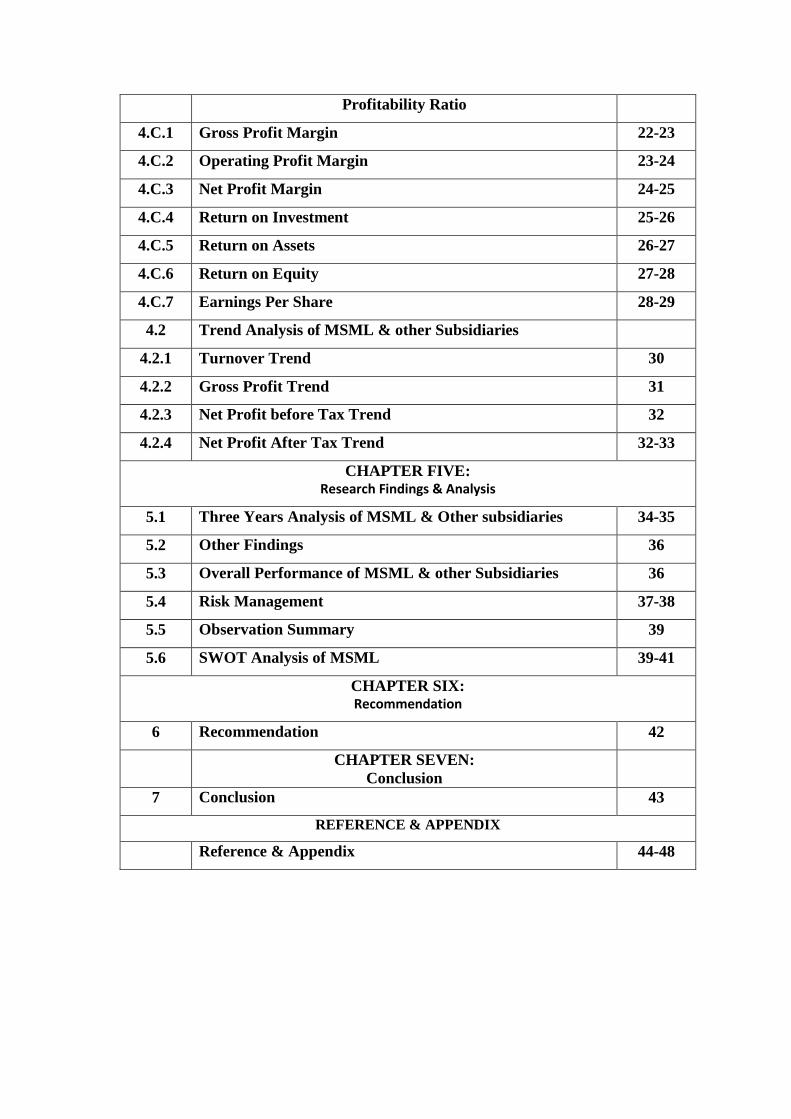
Profitability Ratio
4.C.1 Gross Profit Margin 22-23
4.C.2 Operating Profit Margin 23-24
4.C.3 Net Profit Margin 24-25
4.C.4 Return on Investment 25-26
4.C.5 Return on Assets 26-27
4.C.6 Return on Equity 27-28
4.C.7 Earnings Per Share 28-29
4.2 Trend Analysis of MSML & other Subsidiaries
4.2.1 Turnover Trend 30
4.2.2 Gross Profit Trend 31
4.2.3 Net Profit before Tax Trend 32
4.2.4 Net Profit After Tax Trend 32-33
CHAPTER FIVE: Research Findings & Analysis
5.1 Three Years Analysis of MSML & Other subsidiaries 34-35
5.2 Other Findings 36
5.3 Overall Performance of MSML & other Subsidiaries 36
5.4 Risk Management 37-38
5.5 Observation Summary 39
5.6 SWOT Analysis of MSML 39-41
CHAPTER SIX: Recommendation
6 Recommendation 42
CHAPTER SEVEN:
Conclusion
7 Conclusion 43
REFERENCE & APPENDIX
Reference & Appendix 44-48
Organizational Overview
1
Organizational Overview of Malek Spinning Mills Limited
Malek Spinning Mills Limited, a Public Limited Company has been envisaged by a group
of dynamic entrepreneurs who have been immense contribution to development of the
textile sector of Bangladesh. The sponsors have a very long history in industrial
management with the earlier generation starting in Bombay in the early 20th century and
then moving to Bangladesh in 1974. The Company was incorporated in Bangladesh on
November 02, 1989 as Private Limited Company. Subsequently the company was
converted into a Public Limited Company on September 14, 2008 under the Companies
Act 1994. The existing project is located at Shafipur, Kaliakoir, Gazipur and started its
commercial operation on January 01, 1991. Presently MSML is engaged in producing
combed and carded yarn of various counts. The Company manufactures open end yarn for
denim and home textile markets and denim ready-made garments. The installed production
capacity of the Company is approximately 12,600,000 kilograms yarn per annum with over
63,600 spindles. The Company offers Carded and Combed Hosiery Yarn of counts ranging
from 20/s to 34/s, Yarn composition 100% Cotton, T/C, Chief Value of Cotton (CVC),
100% Polyester yarn, and Blended yarn of different counts. Its goods are supplied to knit
industries for export. Its subsidiaries include Salek Textile Limited, including a composite
mill of textile sector with approximately three operational units, and J.M. Fabrics Limited,
including a knitting, dyeing, finishing and garments factory. The Company's factories are
located at Shafipur, Kaliakoir, Bhawal Mirzapur, Gazipur, and Mahna Bhabanipur,
Gazipur. Presently MSML is a deemed exporter and majority of its goods are supplied to
Knit industries for export.The registered corporate Office of the company is located at
117/A, Tejgaon I/A, Dhaka.
Concise Information Year of Incorporation: 02 November, 1989
o Year of Commencement of Production: 01 January, 1991
o Year of Conversion to Public Ltd. Co.: 14 September, 2008
o Year of Initial Public Offering (IPO): 2010
o Stock Exchange listing date: 2nd August, 2010 (DSE & CSE)
o Authorized Capital: Tk.3,000 Million
o Paid Up Capital: Tk.1, 936 Million
o Product Lines: Combed and carded yarn of various counts
2
o Number of Employees (30th June 2017): a. Executive & staff: 193 b.
Workers: 1,191
o Subsidiary Companies: a. Salek Textile Ltd. b. Newasia Synthetics Ltd. c.
J.M. Fabrics Ltd.
Other Subsidiaries Profile-
Salek Textile Limited
Salek Textile Limited Started its commercial operation form 1 April ,2009.It is a subsidiary
company of Malek Spinning Mills LTD which holds 97.925% share and other sponsors of
Malek Spinning Mills Ltd hold 2.08% share of the company as on 30th June 2017.The
Authorized Share Capital of the company is 500,000,000.00. The paid-up capital as on 30th
June, 2017 stood at tk. 482,608,700.00.It has three operational units. The rotor unit
produces open end yarn of various counts having a capacity of 14621 tons yarn per annum.
The fabric unit produces denim fabric of various size and grade having capacity of 9600000
yards and the RMG unit produces denim products having capacity of 4500000 pcs per
annum. The production capacity of STL is14,621,000 kgs yarn,9,600,000 yards fabric and
4,500,000 Pcs RMG products per annum. The company made additional investment of
Tk.184,756,388 during the year 2016-2017.
New Asia Synthetics Limited
The company was incorporated 30th July, 2008 as a private limited company and
subsequently on October 24, 2009 it has been converted into a public Limited company.
The company is also a subsidiary company of Malek spinning Mills Limited which holds
99.293% Share and other sponsors of Malek Spinning Mills Ltd. 0.707% share of the
company. The Authorized Share Capital of the company is 5000,000,000.00. The paid-up
capital as on 30th June, 2017 stood at tk.500,000,000,00 .Due to non-availability of Gas
connection from Titas Gas Transmission & Distribution Company Ltd. the project has
been shelved until the situation changes regarding the availability of gas connection. The
Company made additional investment of Tk.65,114,890.00 during the year 2016-
2017under Land & Land Development. The Net Assets Value (NAV) per share of the
company as on 30th June 2017stood at Tk.365.12
3
J.M. Fabrics Limited-
.M. Fabrics Limited started its commercial operation from 18th day of August 2007. The
Company is engaged in the production of 100% export oriented garments and knit fabric
with a production capacity of 16 Metric Tons dyed fabric and 68(sixty eight) lines of cutting
and sewing operation with all necessary facilities, storage etc. The company is a subsidiary
company of Malek Spinning Mills Limited which holds 99.998% share and another sponsor
of Malek Spinning Mills Ltd. Holds 0.002% share of the company as on 30th June 2017.
The Authorized Share Capital of the company is 500,000,000.00. The paid-up capital as on
30th June, 2017 stood at tk.400,000,000,00 .
Corporate Governance
Being a public limited company, corporate governance of MSML has been found moderate.
In FY2010-11 the company went into IPO and the ownership structure becomes diversified.
As on June 30, 2016 general public are holding 36.09% shares of the company. However,
after IPO flotation the family members of Mr. A. Matin Chowdhury (Managing Director)
are holding 31.13% shares of the company jointly as on June 30, 2016. The company has
appointed an independent director. The brief shareholding
4
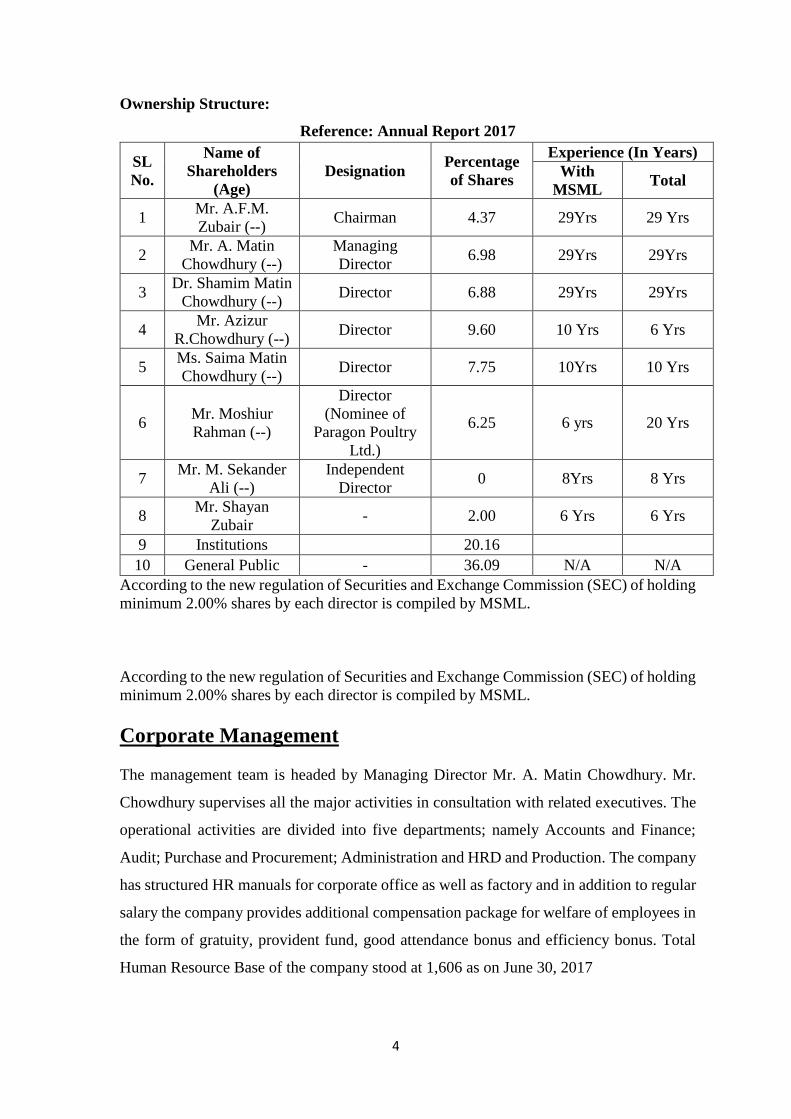
Ownership Structure:
Reference: Annual Report 2017
According to the new regulation of Securities and Exchange Commission (SEC) of holding
minimum 2.00% shares by each director is compiled by MSML.
According to the new regulation of Securities and Exchange Commission (SEC) of holding
minimum 2.00% shares by each director is compiled by MSML.
Corporate Management
The management team is headed by Managing Director Mr. A. Matin Chowdhury. Mr.
Chowdhury supervises all the major activities in consultation with related executives. The
operational activities are divided into five departments; namely Accounts and Finance;
Audit; Purchase and Procurement; Administration and HRD and Production. The company
has structured HR manuals for corporate office as well as factory and in addition to regular
salary the company provides additional compensation package for welfare of employees in
the form of gratuity, provident fund, good attendance bonus and efficiency bonus. Total
Human Resource Base of the company stood at 1,606 as on June 30, 2017
SL
No.
Name of
Shareholders
(Age)
Designation Percentage
of Shares
Experience (In Years)
With
MSML Total
1 Mr. A.F.M.
Zubair (--) Chairman 4.37 29Yrs 29 Yrs
2 Mr. A. Matin
Chowdhury (--)
Managing
Director 6.98 29Yrs 29Yrs
3 Dr. Shamim Matin
Chowdhury (--) Director 6.88 29Yrs 29Yrs
4 Mr. Azizur
R.Chowdhury (--) Director 9.60 10 Yrs 6 Yrs
5 Ms. Saima Matin
Chowdhury (--) Director 7.75 10Yrs 10 Yrs
6 Mr. Moshiur
Rahman (--)
Director
(Nominee of
Paragon Poultry
Ltd.)
6.25 6 yrs 20 Yrs
7 Mr. M. Sekander
Ali (--)
Independent
Director 0 8Yrs 8 Yrs
8 Mr. Shayan
Zubair - 2.00 6 Yrs 6 Yrs
9 Institutions 20.16
10 General Public - 36.09 N/A N/A
5
The use of IT system in MIS has been found to be good in MSML. The company uses
‘Tally” software for accounting purpose. There is a high-tech satellite point to point link
network between the factory and the head office. In addition, they have incorporated video
conferencing to facilitate communication with the factory. MSML has also developed
customized software to keep track of inventories, deliveries, document position, etc.
(Sources: Consulting with the officers of the company)
Vision of Malek Spinning Mills ltd and its Subsidiaries.
Attain highest standards of quality in its all business activities.
Sustained growth in real terms.
Have professionally trained high quality motivated workforce, working as a team in all
environments.
Attain past glorious position and be recognized locally as well as internationally as a
dynamic, quality conscious and progressive company and industry leader.
Mission statement of Malek Spinning Mills ltd and its Subsidiaries
To manufacture quality products for customer satisfaction through:
Honoring the commitment.
Continuous endeavor for improvement through adoption of most modern
technology in production.
Strict adherence to quality control.
Developing a sense of high reliability through fair dealing.
Becoming a part of country’s development and economic prosperity.
Commitment to following business principles and its Subsidiaries
Effective and efficient operations
Strong capital liquidity
Conservative borrowing policy
Strict expense discipline
Outstanding customer service
6
Key business values of MSML and subsidiaries.
The highest personal standards of integrity at all values
Commitment to truth and fair dealing
Hand-on management at all levels
Openly esteemed commitment to quality and competence
A minimum of bureaucracy
Fast decisions and implementation
Putting the group’s interests ahead of the individual’s
The appropriate delegation of authority with accountability
Fair and objective employer
A merit approach to recruitment/selection/promotion.
A commitment to complying with the spirit and letter of all laws and regulations
The promotion of good environment to the welfare and development of each local
community.
(Sources: Consulting with the officers of the company)
Industry overview
Textile sector of Bangladesh is playing a very important role in the economic development
of the country by earning huge foreign exchange. This earning is just second to wage
earners remittance. Besides creation of employment opportunities and supporting
government policy of poverty alleviation, textile sector has become the accelerator of
economic growth. Over more than a decade, the sector has experienced significant
development and export earnings of textile and clothing has increased considerably. The
knitwear sector’s export earnings stood at US$ 6.4 billion while woven’s was $6.1 billion
during the last year. Keeping the momentum, Bangladesh has already become one of the
major suppliers of clothing in the EU market. The sector also has remarkable contribution
to GDP (around 10%) as around 77% of the export earnings come from this sector. Along
with fulfilling the requirement of domestic fabric and yarn, at this moment 100% demand
for raw materials for knit RMG are being met by local sources. Over the years, since
liberation, the number of spinning mills has gradually increased. The country has 1,350
textile mills with cumulative investment of TK. 400 billion which is considered to be the
biggest in the industrial sector. Spindle capacity has increased to 7.2 million having yarn
production capacity of 1,600 million kg. Loom capacity has also increased to 5,000 million
having fabric production capacity of 1,600 million meters. Considerable size of backward
7
linkage industry has been established for which knit sub sector has also achieved
phenomenal growth. The achievement so far made was possible due to permitting textile
machinery imports at zero duty/tax and other incentives. However, due to significant
involvement of capital machineries, the sector, on an average, is highly leveraged having
70% borrowing in the capital structure. (Reference: Various BTMA Publications)
In recent times, Bangladesh has also emerged as a significant supplier of Denim cloths &
Home textile products to the European market. This has become possible due to availability
of local raw materials-particularly cotton yarn which are being produced mainly from
cotton waste. Denim fabric manufacturers are experiencing problems though due to
unspecified rate of wastage for denim fabric, high duty/tax on spare parts of denim
machines, delay in obtaining utilization permission (UP), delay in realizing money from
exported fabrics etc. The demand for clothing continues to have an increasing trend due
to increased population. However, the production of yarn and cloths are not increasing in
line with demand resulting into considerable demand-supply gap. Due to irregular gas
supply, textile production has started falling which resulted to even a maximum of 50%
production loss. The problem started since February 2010 and now has reached its worst
peak in Dhaka, Chittagong, Gazipur, Savar and Narayangonj zones. At the time of
recovering from the impact of global recession, the gas crisis posed to be a big menace for
the sector which can even cause Bangladesh to lose international market share. Despite
these facts, there is ample scope in the consolidated sector to explore maximum benefit out
of it for which fair deal by the government in terms of infrastructure, utilities, policies,
financial support and necessary market protection from illegal entry of textile raw materials
and finished good is required. (Sources: Consulting with officers of the Company)

Chapter One
Introduction
8
1. Introduction to the Report
1.1 Rationale of the Study
This program helped me to understand the organizational norms, organizational culture etc.
The topic was quite interesting; those encouraged me to put my effort to analyze
performance of Malek Spinning Mills Ltd and its subsidiaries. I expect that this experience
during my internship will assist me to enhance my career development.
My findings may help the shareholders and as well as managers and thereby ensuring that
management works for the best interest of shareholders and produce better corporate
financial result.
1.2 Statement of the problems
This report "Financial Performance Analysis of Malek spinning Mills Ltd and its
subsidiaries" is prepared to fulfill the partial requirement of the internship program of
Masters of Business Administration, BRAC Business School, BRAC University it aslo help
me to understand how to evaluate a company in term of its ratio.
1.3 Scope and delimitation of the study
Now in this global age the activities of Textile sector Grows very fast. The scope of the
study is to analyze the departments includes Account and Finance section of Malek
Spinning Mills Ltd. during the internship period. As a student of BRAC University MBA
program it is very much necessary for me to know about the formal process of this
department
1.4 Objective of the Report
The internship on the previously stated title, for Financial analysis of Malek Spinning Mills
limited and its Subsidiaries will be prepared to fulfill the particular requirement of the
internship program as 3 credits of the MBA program of the university.
The objective of this report can be divided into two parts:
1.4.1 General Objectives
The key objective of the report is to analysis the financial performance of Malek Spinning
Mills Ltd and Its Subsidiaries.
9
1.4.2Specific objectives
To Compute the Financial position of the company and its subsidiaries.
To analysis the profitability and solvency position of the firm and its Subsidiaries.
To analysis the efficiency of the firm through ratios.
To suggest ways and means to improve the present condition.
To examine the overall performance of the company and subsidiaries.
To study the future prospect of Malek spinning Mills Ltd and its subsidiaries.
To know overall activities conducted by Malek Spinning Mills Ltd and subsidiaries.
And also get idea through acquiring practical experience from textile activities and
know the several products & Services offered by Malek Spinning Mills Ltd.
1.5 Research Questions
1. What is the current financial position of this company and its Subsidiaries?
2. What is the current position of this company in the textile industry?
3. Among Different Subsidiaries, which one is the most profitable and less profitable for this
company?
4. How this company’s Financial position can be improved?

Chapter Two
Review of Related Literature
10
2. Review of Related Literature
2.1 Books:
Stephen A. Ross, Randolph W. Westerfield, Jeffrey Jaffe (2006-2007),
Corporate Finance (7th edition.), Tata McGraw-Hill Pubishing Company Ltd. New
Delhi.
Scott Besley, Eugene F. Brigham, Essentials of Managerial Finance (13th Edition.)
Scott Besley, Eugene F. Brigham, Essentials of Managerial Finance (14th Edition.)
2.2 Reports
Annual Report
Malek Spinning Mills LTD, Annual Report 2014-2015
Malek Spinning Mills LTD, Annual Report 2015-2016
Malek Spinning Mills LTD, Annual Report 2016-2017
Chapter Three
Methodology of the Study
11
3.1 Methodology of the study:
This Report would be Descriptive in type that briefly reveals the overall financial activities
performed by the Malek Spinning Mills Ltd and its subsidiaries. Collection of primary and
secondary data were required for the analysis. Annual reports of Malek Spinning Mills Ltd.
was the source of secondary data in this regard. Ratio analysis and trend analysis were used
as major tools for the financial performance analysis of Malek Spinning Mills Ltd.
3.2 Data Collection:
There were two sources of data collection. Such as,
1. Primary sources,
2. Secondary sources.
3.2.1 Primary sources of data:
Conversations with the different officials of Malek Spinning Mills ltd.
Take expert opinion from the officers.
Direct Observation.
Informal Discussion.
3.2.2 Secondary sources of data:
Annual report of Malek Spinning Mills Ltd.
Different text books and journals.
Various reports and articles related to study.
Some of my course elements as related to the report.
Web base support from the internet and intranet.
3.3 Data collection Procedure and Instruments
3.3.1 Data collection Procedure
Conducting this report the following procedures were used to collect data with the
respective instruments:
Collection of primary data:
All the relevant data and information were mainly collected from the observation, informal
discussion, group discussion, conversation and so on,
Collection of Secondary Data:
Secondary data were collected basically from annual Reports, Journals,
12
Brochures, paper, Magazines, publications, books and others form of publications, official
websites.
3.3.2 Instrument used for analysis
Quantitative data were collected and analyzed according to acceptable standards of
practice. Different tables and graphs were used to make data more meaningful and
comparable. Qualitative data were analyzed rationally. Important percentages and averages
were calculated using two major tools to analyze the financial performance of Malek
Spinning Mills Ltd and its subsidiaries.
These are:
3.3.2. A Ratio Analysis
3.3.2. B Trend Analysis
3.2.2. A Ratio Analysis:
Ratio analysis is a widely used tool of financial analysis; the term ratio refers to the
numerical and quantitative relationship between two variables. It is defined as the
systematic used of ratio to interpret the financial statement and current financial condition
can be determined. Ratio can be classified into three broad groups-
Liquidity Ratios
Efficiency Ratios
Profitability Ratios
3.3.2. B Trend Analysis:
It is really important to analysis trends in ratios as well as their absolute levels. This analysis
informs us whether a company’s financial condition improving or deteriorating.
3.3.2. C other tools:
After collecting all the data they were coded and data were processed, analyzed, and
graphically represented using MS excel and MS word. the study will be of exploratory
nature. The finding of this study were based on analyzed both the primary and secondary
data. Moreover, this were a combination of both fieldwork and desk research.
13
3.4 Limitations of the Study:
This study is not free from limitations. It is important to note that these limitations would
be contributed in developing a dazzling and outstanding report. Below these limitations
are:
Limitation of time: Major limitation of this report is time constrained. it were
really tough to know details about a giant company like- Malek Spinning Mills
Ltd.
Lack of Secondary data: The annual report and websites are the main
secondary information sources that were sufficient to complete the report.
Limitation of Scope: Because of strategic and comparative position of the
company, it didn't disclose the confidential information which might make the
report more worthy.
Lack of experience: there is a chance of having some mistakes in this report
though best effort will have been applied to avoid any kind of mistake.
Sometimes I could not communicate with the respective personnel of Malek
spinning Mills Ltd. properly as they are very busy.
Information was very hard to understand.
Chapter 4
Analysis and Interpretation of
the Data
14
4.1 Ratio Analysis of Malek Spinning Mills Ltd and its subsidiaries.
Ratio Analysis
A tool used by individuals to conduct a quantitative analysis of information in a company’s
financial statements. Ratios are calculated from current year numbers and are then
compared to previous years, other companies, the Industry, or even the economy to judge
the performance of the company. The basic inputs to ratio analysis are the firm’s income
statement and balance sheet for the periods to be examined. Ratio analysis is predominately
used by proponents of fundamental analysis
In Ratio Analysis I am Basically Focus on The three Major types of Ratio these are:
A. Liquidity ratios
B. Efficiency ratios
C. Profitability ratios
A. Liquidity Ratio:
Liquidity refers to the ability of a firm to meet its short-term financial obligations
when and as they come due. It also refers to the solvency of the firm’s overall
financial position.
The main concern of liquidity ratio is to measure the ability of the firms to meet
their short-term maturing obligations. Failure to do this will result in the total failure
of the business, as it would be forced into liquidation.
The three basic measures of liquidity are.
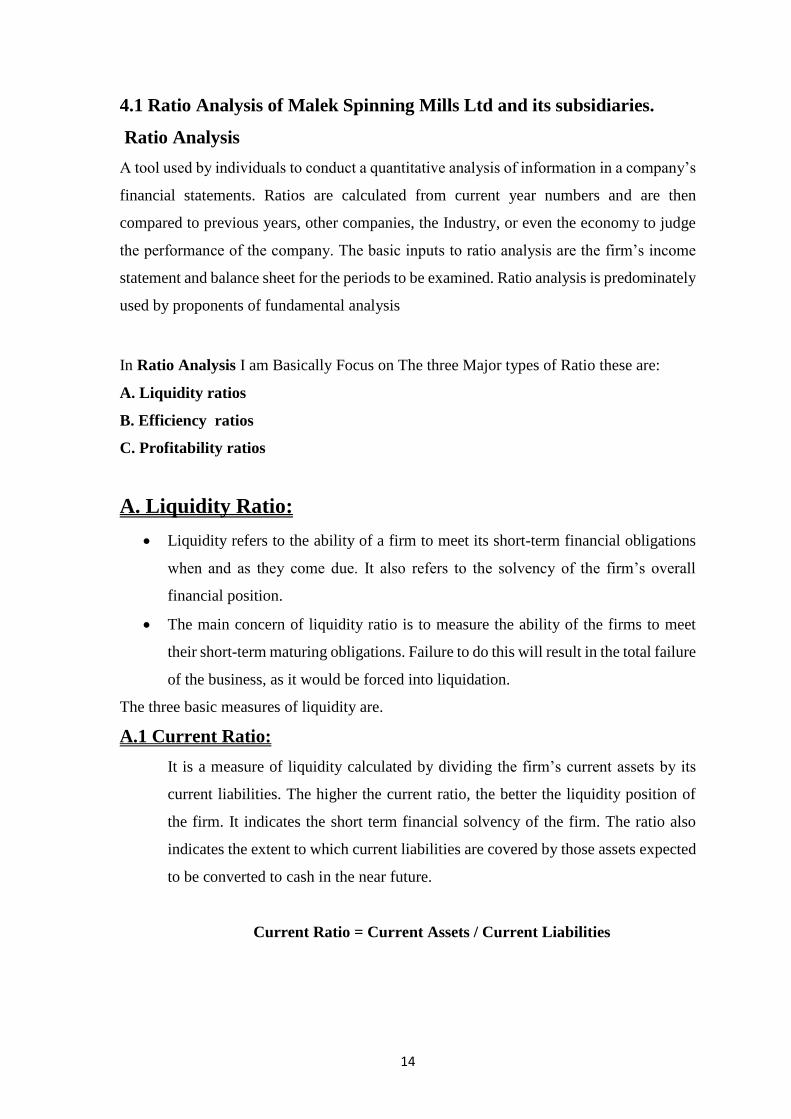
A.1 Current Ratio:
It is a measure of liquidity calculated by dividing the firm’s current assets by its
current liabilities. The higher the current ratio, the better the liquidity position of
the firm. It indicates the short term financial solvency of the firm. The ratio also
indicates the extent to which current liabilities are covered by those assets expected
to be converted to cash in the near future.
Current Ratio = Current Assets / Current Liabilities
15
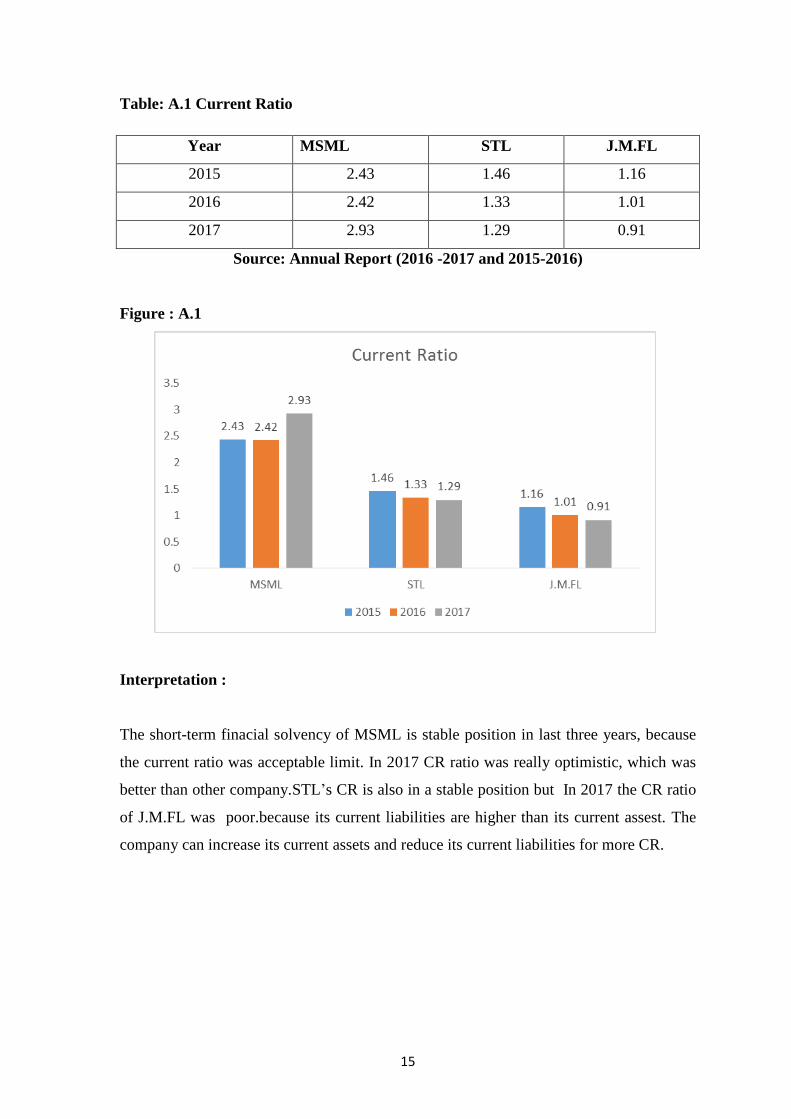
Table: A.1 Current Ratio
Year MSML STL J.M.FL
2015 2.43 1.46 1.16
2016 2.42 1.33 1.01
2017 2.93 1.29 0.91
Source: Annual Report (2016 -2017 and 2015-2016)
Figure : A.1
Interpretation :
The short-term finacial solvency of MSML is stable position in last three years, because
the current ratio was acceptable limit. In 2017 CR ratio was really optimistic, which was
better than other company.STL’s CR is also in a stable position but In 2017 the CR ratio
of J.M.FL was poor.because its current liabilities are higher than its current assest. The
company can increase its current assets and reduce its current liabilities for more CR.
16
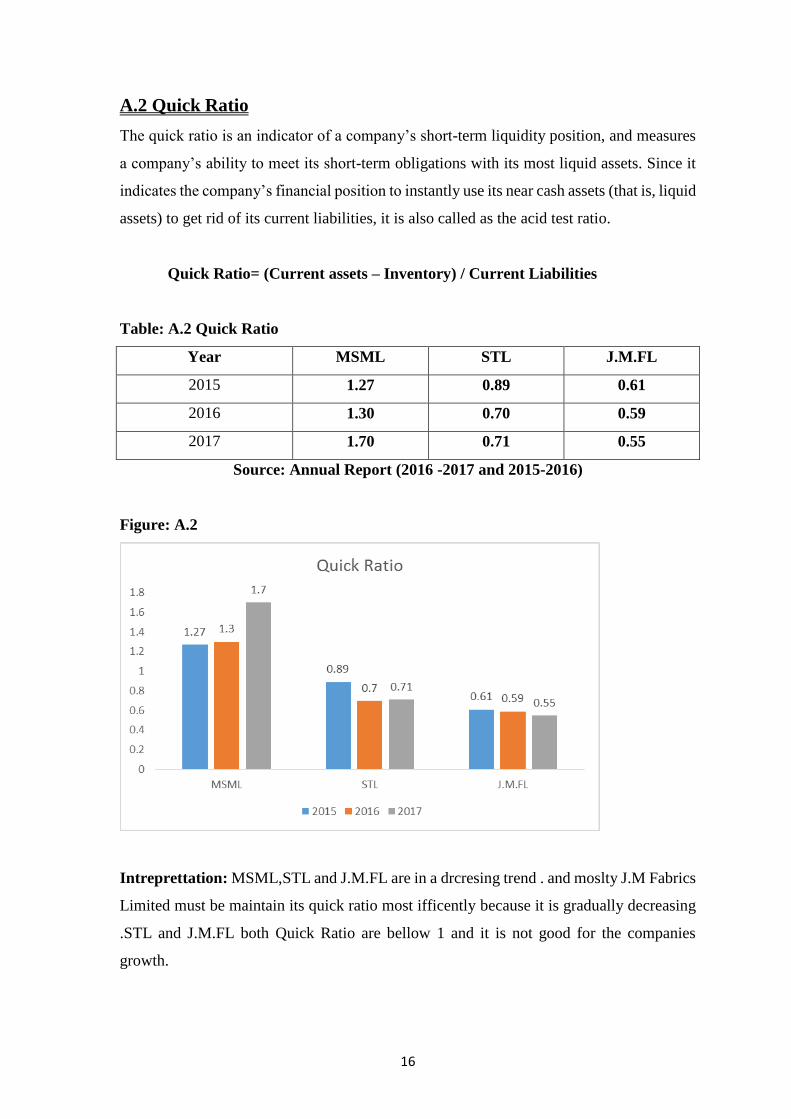
A.2 Quick Ratio
The quick ratio is an indicator of a company’s short-term liquidity position, and measures
a company’s ability to meet its short-term obligations with its most liquid assets. Since it
indicates the company’s financial position to instantly use its near cash assets (that is, liquid
assets) to get rid of its current liabilities, it is also called as the acid test ratio.
Quick Ratio= (Current assets – Inventory) / Current Liabilities
Table: A.2 Quick Ratio
Year MSML STL J.M.FL
2015 1.27 0.89 0.61
2016 1.30 0.70 0.59
2017 1.70 0.71 0.55
Source: Annual Report (2016 -2017 and 2015-2016)
Figure: A.2
Intreprettation: MSML,STL and J.M.FL are in a drcresing trend . and moslty J.M Fabrics
Limited must be maintain its quick ratio most ifficently because it is gradually decreasing
.STL and J.M.FL both Quick Ratio are bellow 1 and it is not good for the companies
growth.
17
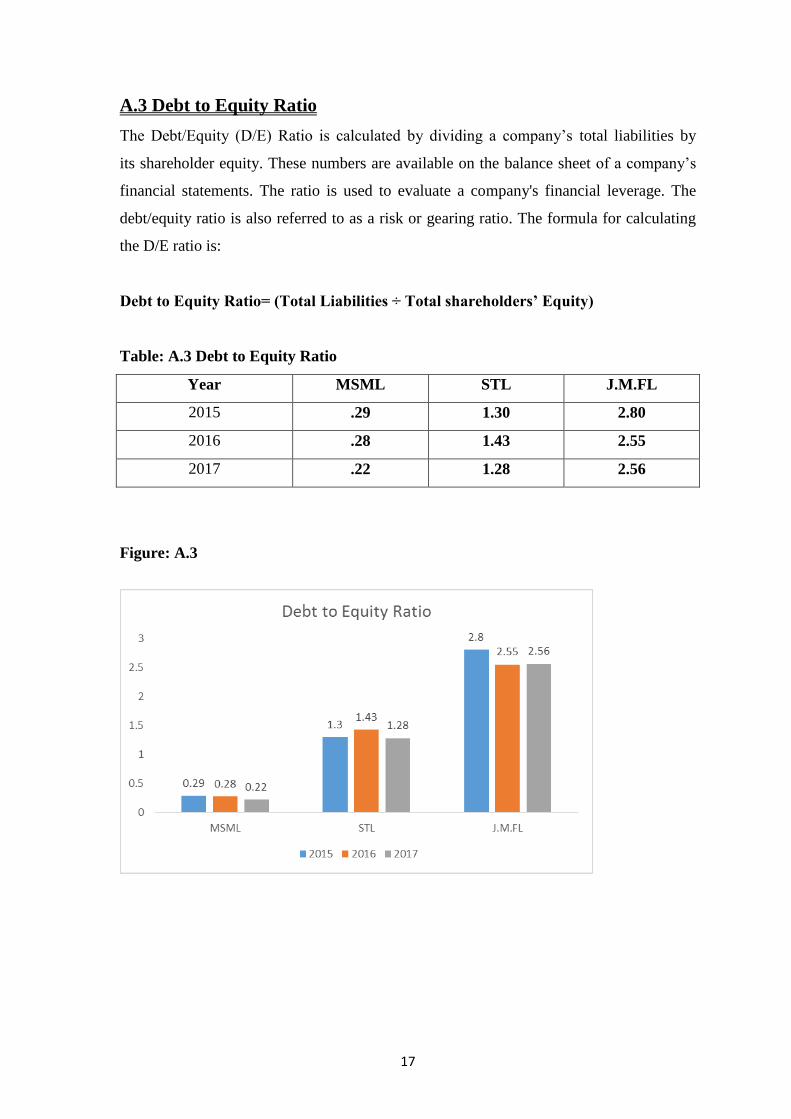
A.3 Debt to Equity Ratio
The Debt/Equity (D/E) Ratio is calculated by dividing a company’s total liabilities by
its shareholder equity. These numbers are available on the balance sheet of a company’s
financial statements. The ratio is used to evaluate a company's financial leverage. The
debt/equity ratio is also referred to as a risk or gearing ratio. The formula for calculating
the D/E ratio is:
Debt to Equity Ratio= (Total Liabilities ÷ Total shareholders’ Equity)
Table: A.3 Debt to Equity Ratio
Year MSML STL J.M.FL
2015 .29 1.30 2.80
2016 .28 1.43 2.55
2017 .22 1.28 2.56
Figure: A.3
18
Interpretation: High Debt/equity ratio is often associated with high risk and that means
the company has been aggressive in financing its growth with debt. And here we can we
MSML has lower D/E ratio than the other two, and J.F Fabric have most higher D/E ratio
so it is in a risky position.
Efficiency Ratio:
If a business does not use its assets effectively, investors in the business would rather take
their money and place it somewhere else. In order for the assets to be used effectively, the
business needs a high turnover.
Unless the business continues to generate high turnover, assets will be idle as it is
impossible to buy and sell fixed assets continuously as turnover changes. Activity ratios
are therefore used to assess how active various assets are in the business. Activity ratios
are discussed next.
B.1 Accounts Receivable Turnover Ratio-
The receivables turnover ratio is an accounting measure used to quantify a firm's
effectiveness in extending credit and in collecting debts on that credit. The receivables
turnover ratio is an activity ratio measuring how efficiently a firm uses its assets.
Receivables turnover ratio can be calculated by dividing the net value of credit sales
during a given period by the average accounts receivable during the same period. Average
accounts receivable can be calculated by adding the value of accounts receivable at the
beginning of the desired period to their value at the end of the period and dividing the
sum by two.
The method for calculating receivables turnover ratio can be represented with the
following formula:
Accounts Receivable Turnover= (Net Credit Sales ÷ Average Accounts Receivable)
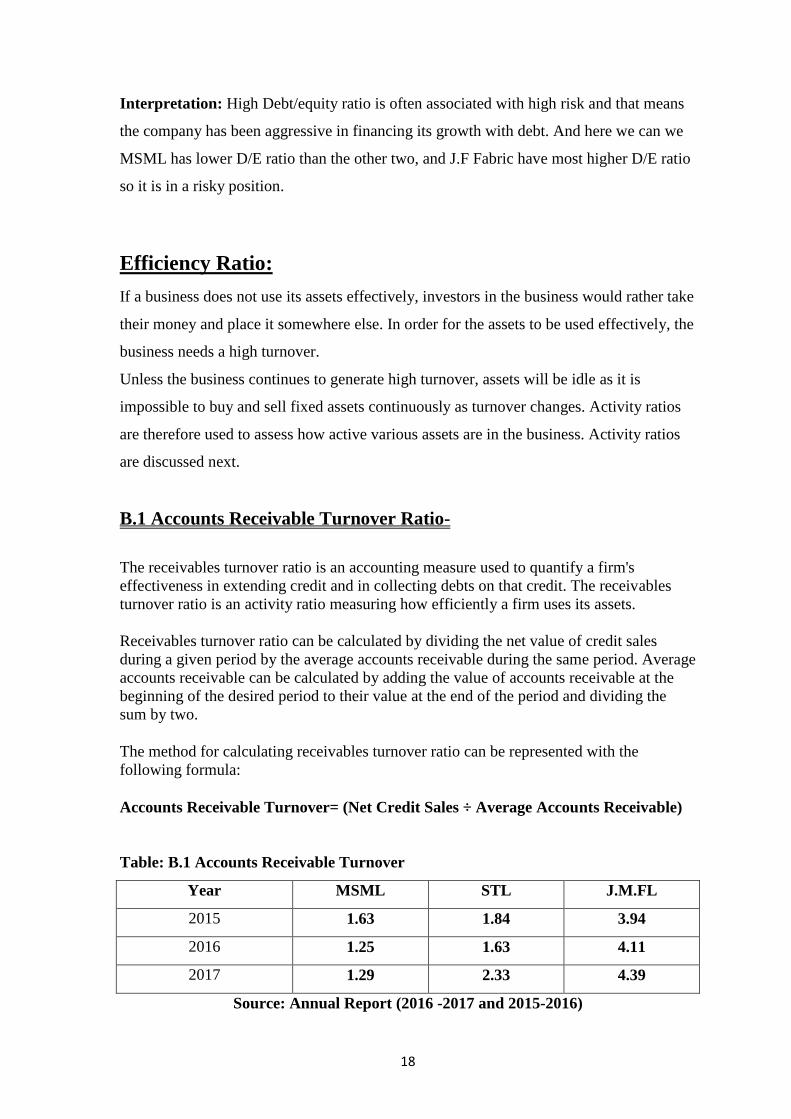
Table: B.1 Accounts Receivable Turnover
Year MSML STL J.M.FL
2015 1.63 1.84 3.94
2016 1.25 1.63 4.11
2017 1.29 2.33 4.39
Source: Annual Report (2016 -2017 and 2015-2016)
19
Figure: B.1 Accounts Receivable Turnover
Interpretation: The receivables turnover ratio is an activity ratio measuring how
efficiently a firm uses its assets. Here we can see, A/R turnover Ratio in slowly growing
and it is a positive sign for this companies because it says this companies can manage its
assets efficiently .
B.2 Inventory Turnover Ratio
The inventory turnover ratio is an efficiency ratio that shows how effectively inventory is
managed by comparing cost of goods sold with average inventory for a period. This
measures how many times average inventory is “turned” or sold during a period. In other
words, it measures how many times a company sold its total average inventory dollar
amount during the year.
Inventory Turnover Ratio= (Cost of Goods Sold ÷ Average Inventory)
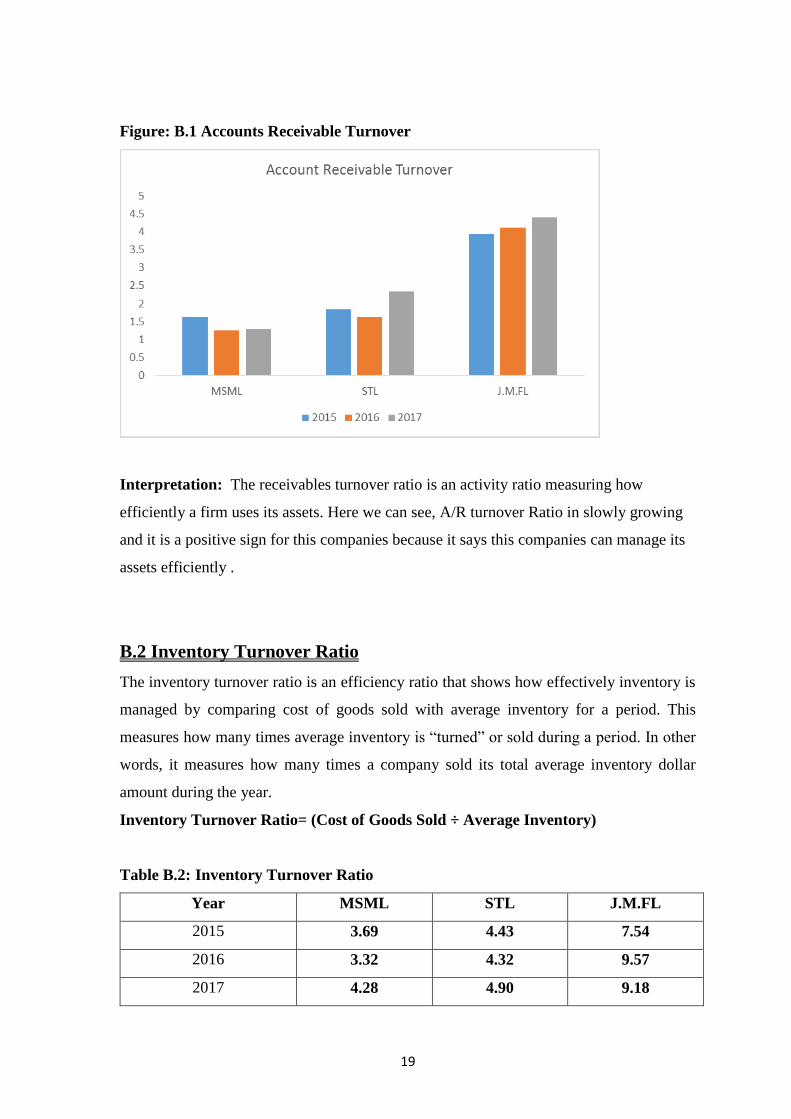
Table B.2: Inventory Turnover Ratio
Year MSML STL J.M.FL
2015 3.69 4.43 7.54
2016 3.32 4.32 9.57
2017 4.28 4.90 9.18
20
Source: Annual Report (2016 -2017 and 2015-2016)
Figure B.2: Inventory Turnover Ratio
Interpretation-Inventory turnover ratio indicate how effectively inventory is managed by
comparing cost of goods sold with average inventory for a period. And we can see this
company’s inventory turnover ratio is in a stable position and it is satisfactory.
B.3 Total Assets Turnover Ratio
The total turnover is similar to fixed assets turnover since both measures a company’s
effectiveness is generating sales revenue from investments back into the company. Total
asset turnover evaluates the efficiency of managing all of the company’s assets.
Total Assets Turnover = Sales ÷ Total Assets
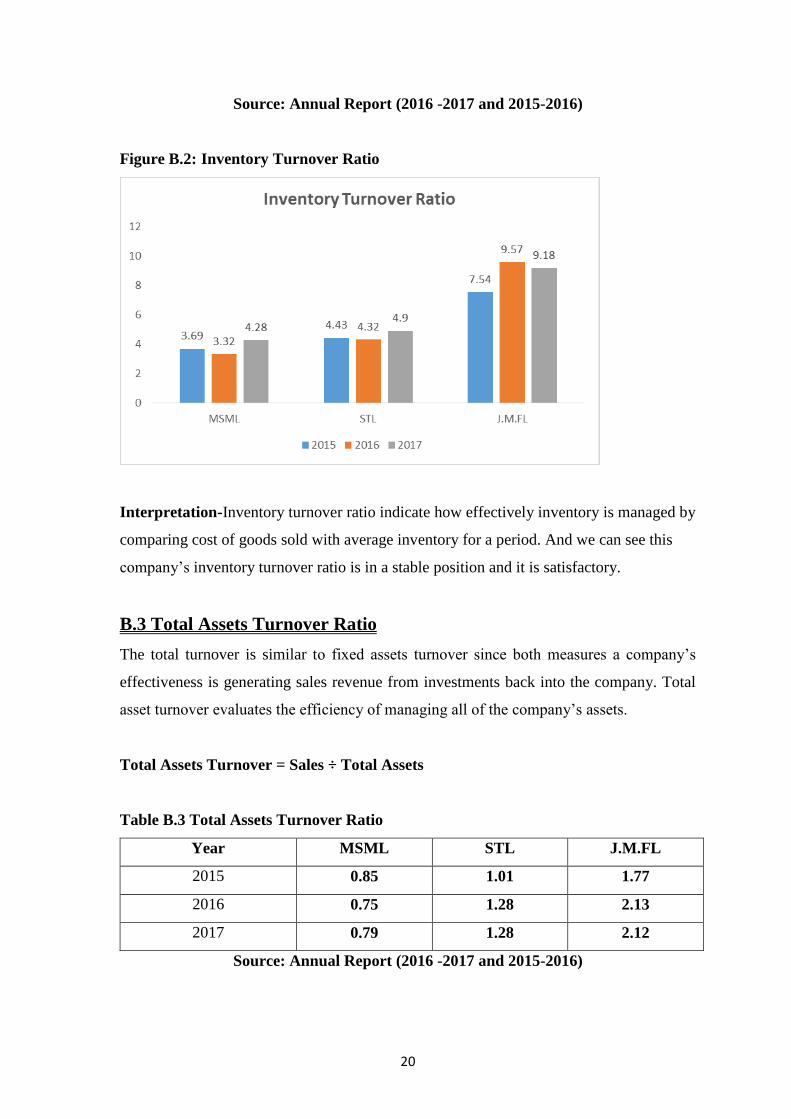
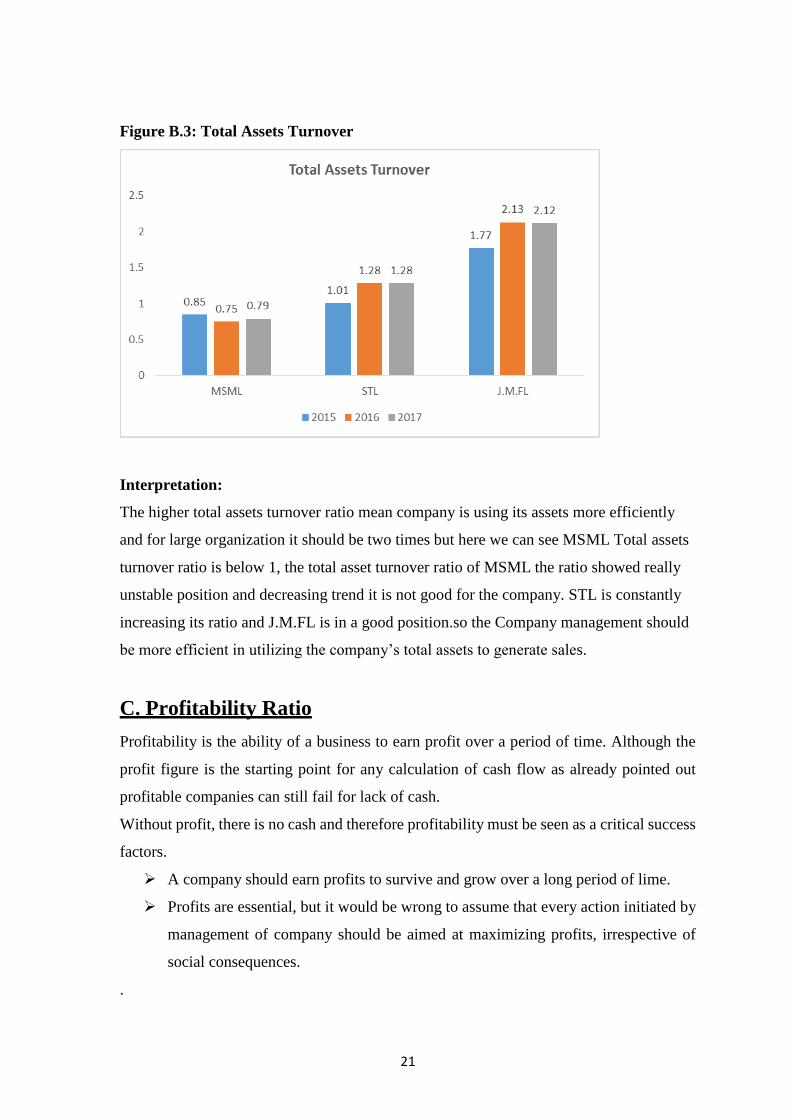
Table B.3 Total Assets Turnover Ratio
Year MSML STL J.M.FL
2015 0.85 1.01 1.77
2016 0.75 1.28 2.13
2017 0.79 1.28 2.12
Source: Annual Report (2016 -2017 and 2015-2016)
21
Figure B.3: Total Assets Turnover
Interpretation:
The higher total assets turnover ratio mean company is using its assets more efficiently
and for large organization it should be two times but here we can see MSML Total assets
turnover ratio is below 1, the total asset turnover ratio of MSML the ratio showed really
unstable position and decreasing trend it is not good for the company. STL is constantly
increasing its ratio and J.M.FL is in a good position.so the Company management should
be more efficient in utilizing the company’s total assets to generate sales.
C. Profitability Ratio
Profitability is the ability of a business to earn profit over a period of time. Although the
profit figure is the starting point for any calculation of cash flow as already pointed out
profitable companies can still fail for lack of cash.
Without profit, there is no cash and therefore profitability must be seen as a critical success
factors.
A company should earn profits to survive and grow over a long period of lime.
Profits are essential, but it would be wrong to assume that every action initiated by
management of company should be aimed at maximizing profits, irrespective of
social consequences.
.

22
Profitability is a result of a larger number of policies and decisions, 'the profitability ratios
show combined effects of liquidity, asset management (activity) and debt management
(gearing) on operating results. The overall measure of success of a business is the
profitability which results from the effective use of its resources.)
C.1. Gross Profit Margin
The gross profit margin measures the percentage of each sales price remaining after the
firm has paid for its goods. The higher the gross profit margin is the better. A high ratio of
gross profits to sales is a sign of good management of cost of goods sold.
Gross Profit Margin = (Sales - COGS) ÷ Sales = (Gross Profit ÷ Sales) x 100
Table C.1: Gross Profit Margin (%)
Year MSML STL J.M.FL
2015 12.46 12.62 6.06
2016 13.01 10.92 6.07
2017 11.20 10.69 6.07
Source: Annual Report (2016 -2017 and 2015-2016)
Figure C.1: Gross Profit Margin (%)
23
Interpretation-
We know that the acceptable limit of gross profit margin is 20% to 30% and MSML and
its subsidiaries didn’t achieve the acceptable limit. The cost of goods sold should efficiently
managed by MSM Land its subsidiaries for producing a satisfactory gross profit margin
ratio. For success to achieve adequate coverage for operating expenses and better return to
the owners of the business. The company should increase more sales and manage its cost
of goods sold more efficiently.
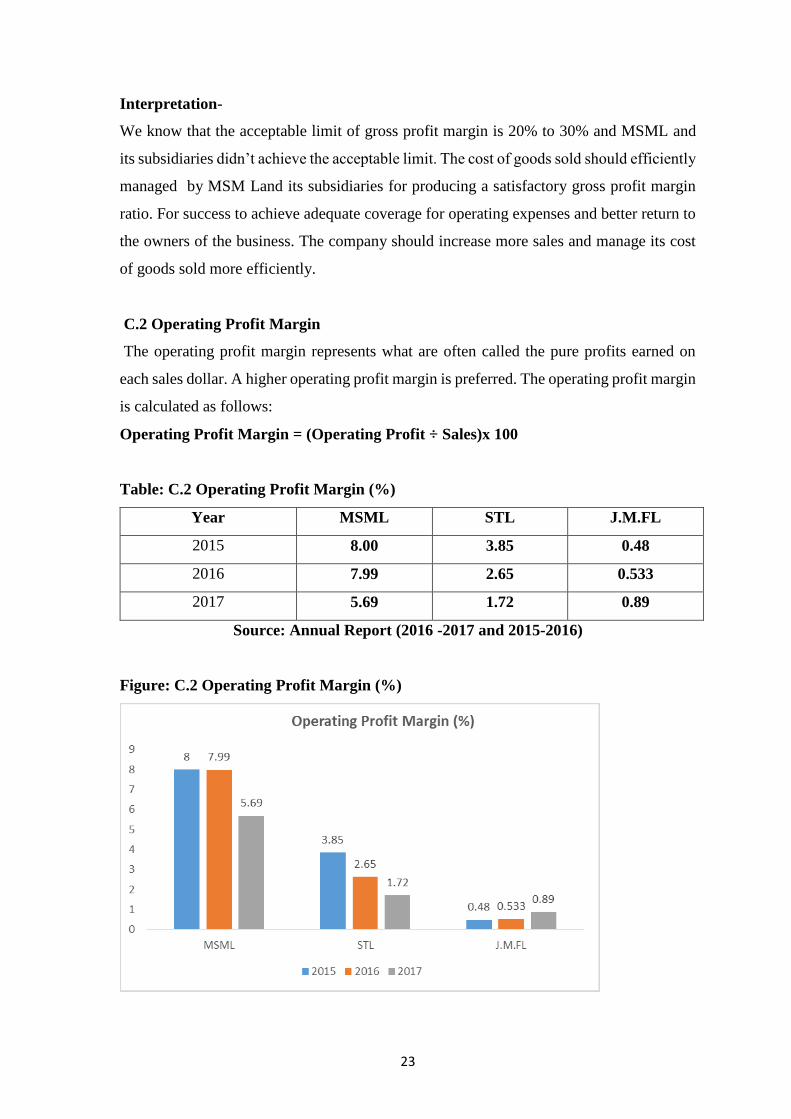
C.2 Operating Profit Margin
The operating profit margin represents what are often called the pure profits earned on
each sales dollar. A higher operating profit margin is preferred. The operating profit margin
is calculated as follows:
Operating Profit Margin = (Operating Profit ÷ Sales)x 100
Table: C.2 Operating Profit Margin (%)
Year MSML STL J.M.FL
2015 8.00 3.85 0.48
2016 7.99 2.65 0.533
2017 5.69 1.72 0.89
Source: Annual Report (2016 -2017 and 2015-2016)
Figure: C.2 Operating Profit Margin (%)
24
Interpretation:
The operating profit margin ratio indicates the cost price effectiveness of the operation.
Here MSML and its subsidiaries is not in a better position. The ratio is comparatively better
in MSML but it was very poor in J.M.FL. The company should enhance its sales by
managing the operating cost efficiently.
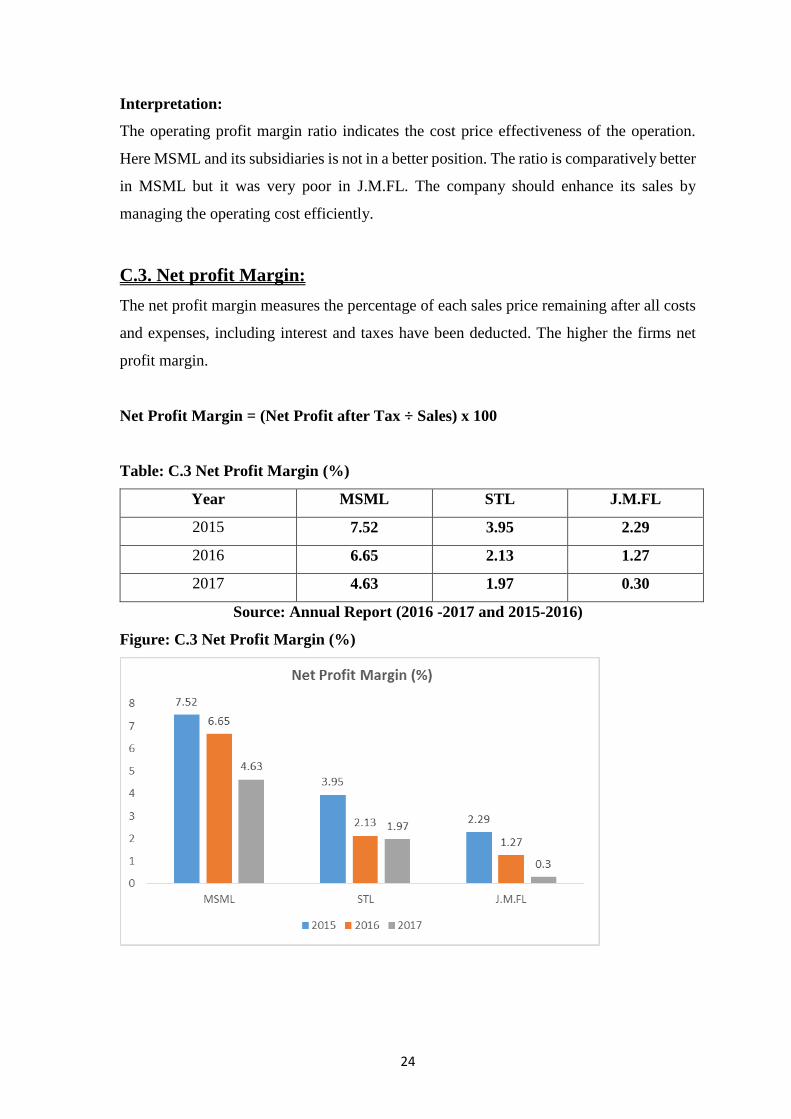
C.3. Net profit Margin:
The net profit margin measures the percentage of each sales price remaining after all costs
and expenses, including interest and taxes have been deducted. The higher the firms net
profit margin.
Net Profit Margin = (Net Profit after Tax ÷ Sales) x 100
Table: C.3 Net Profit Margin (%)
Year MSML STL J.M.FL
2015 7.52 3.95 2.29
2016 6.65 2.13 1.27
2017 4.63 1.97 0.30
Source: Annual Report (2016 -2017 and 2015-2016)
Figure: C.3 Net Profit Margin (%)
25
Interpretation:
We know that the acceptable limit of net profit margin is 5% to 10%. MSML was highly
efficient in sales performance during that period and success to achieve the cost-
effectiveness of operations as it has better net profit margin but STL and J.M.FL is not in a
good position because it is below 5%. But this two subsidiaries can increase its
management’s ability to operate the business by enhancing sales with the cost effectiveness
of the operation.
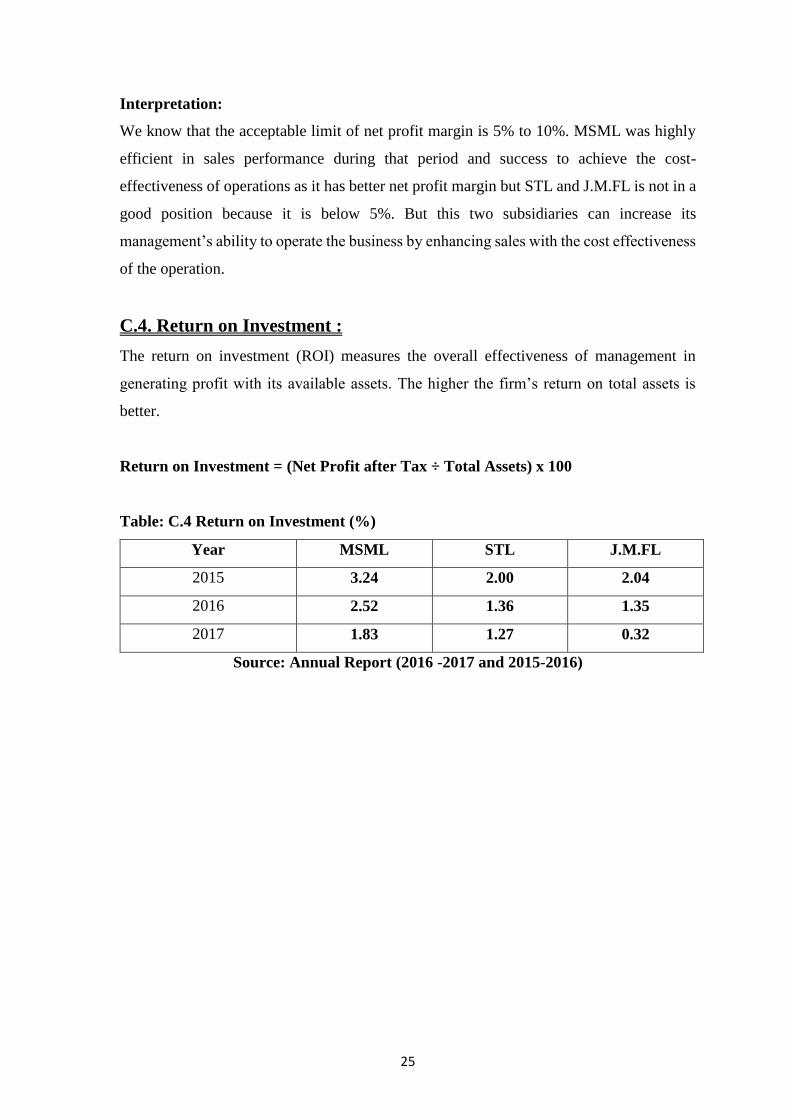
C.4. Return on Investment :
The return on investment (ROI) measures the overall effectiveness of management in
generating profit with its available assets. The higher the firm’s return on total assets is
better.
Return on Investment = (Net Profit after Tax ÷ Total Assets) x 100
Table: C.4 Return on Investment (%)
Year MSML STL J.M.FL
2015 3.24 2.00 2.04
2016 2.52 1.36 1.35
2017 1.83 1.27 0.32
Source: Annual Report (2016 -2017 and 2015-2016)
26
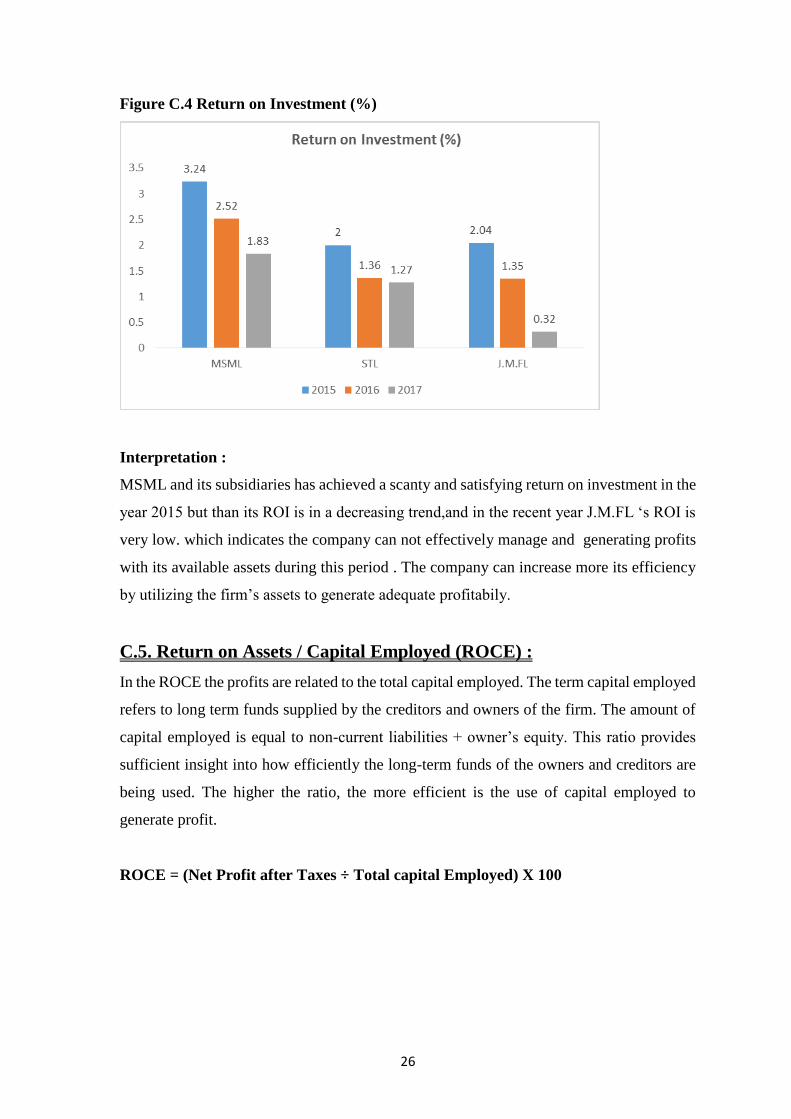
Figure C.4 Return on Investment (%)
Interpretation :
MSML and its subsidiaries has achieved a scanty and satisfying return on investment in the
year 2015 but than its ROI is in a decreasing trend,and in the recent year J.M.FL ‘s ROI is
very low. which indicates the company can not effectively manage and generating profits
with its available assets during this period . The company can increase more its efficiency
by utilizing the firm’s assets to generate adequate profitabily.
C.5. Return on Assets / Capital Employed (ROCE) :
In the ROCE the profits are related to the total capital employed. The term capital employed
refers to long term funds supplied by the creditors and owners of the firm. The amount of
capital employed is equal to non-current liabilities + owner’s equity. This ratio provides
sufficient insight into how efficiently the long-term funds of the owners and creditors are
being used. The higher the ratio, the more efficient is the use of capital employed to
generate profit.
ROCE = (Net Profit after Taxes ÷ Total capital Employed) X 100
27
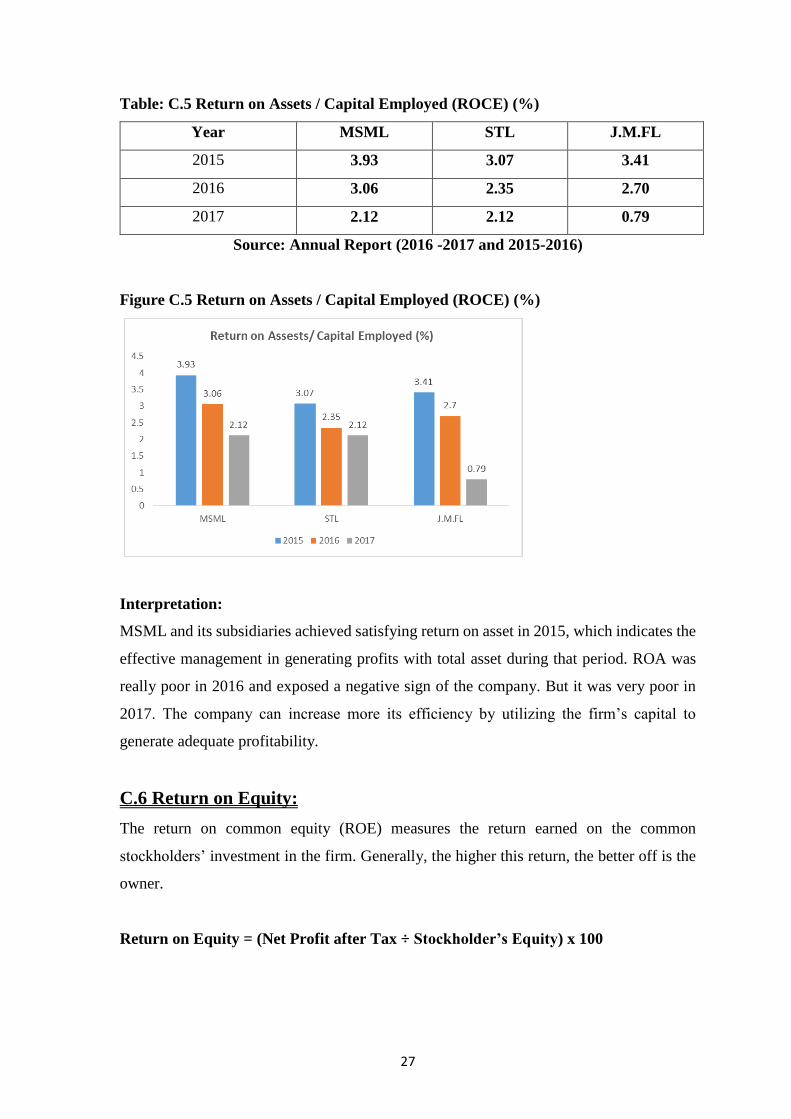
Table: C.5 Return on Assets / Capital Employed (ROCE) (%)
Year MSML STL J.M.FL
2015 3.93 3.07 3.41
2016 3.06 2.35 2.70
2017 2.12 2.12 0.79
Source: Annual Report (2016 -2017 and 2015-2016)
Figure C.5 Return on Assets / Capital Employed (ROCE) (%)
Interpretation:
MSML and its subsidiaries achieved satisfying return on asset in 2015, which indicates the
effective management in generating profits with total asset during that period. ROA was
really poor in 2016 and exposed a negative sign of the company. But it was very poor in
2017. The company can increase more its efficiency by utilizing the firm’s capital to
generate adequate profitability.
C.6 Return on Equity:
The return on common equity (ROE) measures the return earned on the common
stockholders’ investment in the firm. Generally, the higher this return, the better off is the
owner.
Return on Equity = (Net Profit after Tax ÷ Stockholder’s Equity) x 100
28
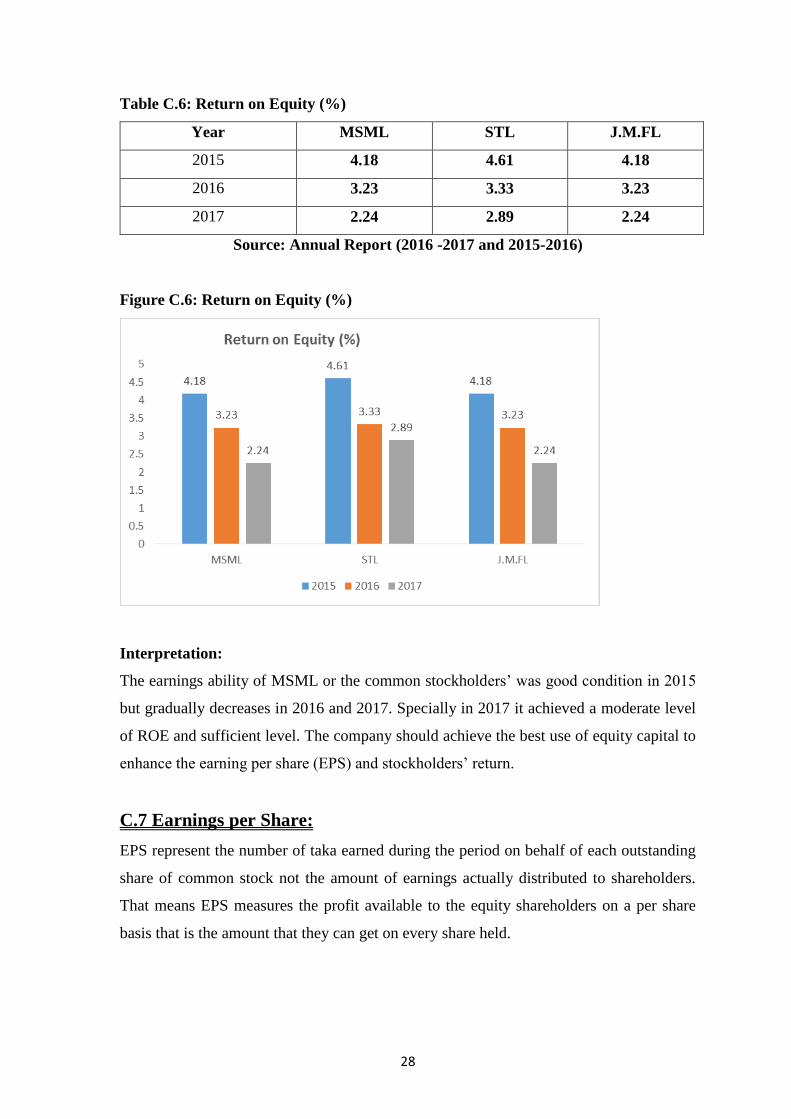
Table C.6: Return on Equity (%)
Year MSML STL J.M.FL
2015 4.18 4.61 4.18
2016 3.23 3.33 3.23
2017 2.24 2.89 2.24
Source: Annual Report (2016 -2017 and 2015-2016)
Figure C.6: Return on Equity (%)
Interpretation:
The earnings ability of MSML or the common stockholders’ was good condition in 2015
but gradually decreases in 2016 and 2017. Specially in 2017 it achieved a moderate level
of ROE and sufficient level. The company should achieve the best use of equity capital to
enhance the earning per share (EPS) and stockholders’ return.
C.7 Earnings per Share:
EPS represent the number of taka earned during the period on behalf of each outstanding
share of common stock not the amount of earnings actually distributed to shareholders.
That means EPS measures the profit available to the equity shareholders on a per share
basis that is the amount that they can get on every share held.
29
EPS = EPS available for common stockholders ÷ No. of shares of common stock
outstanding
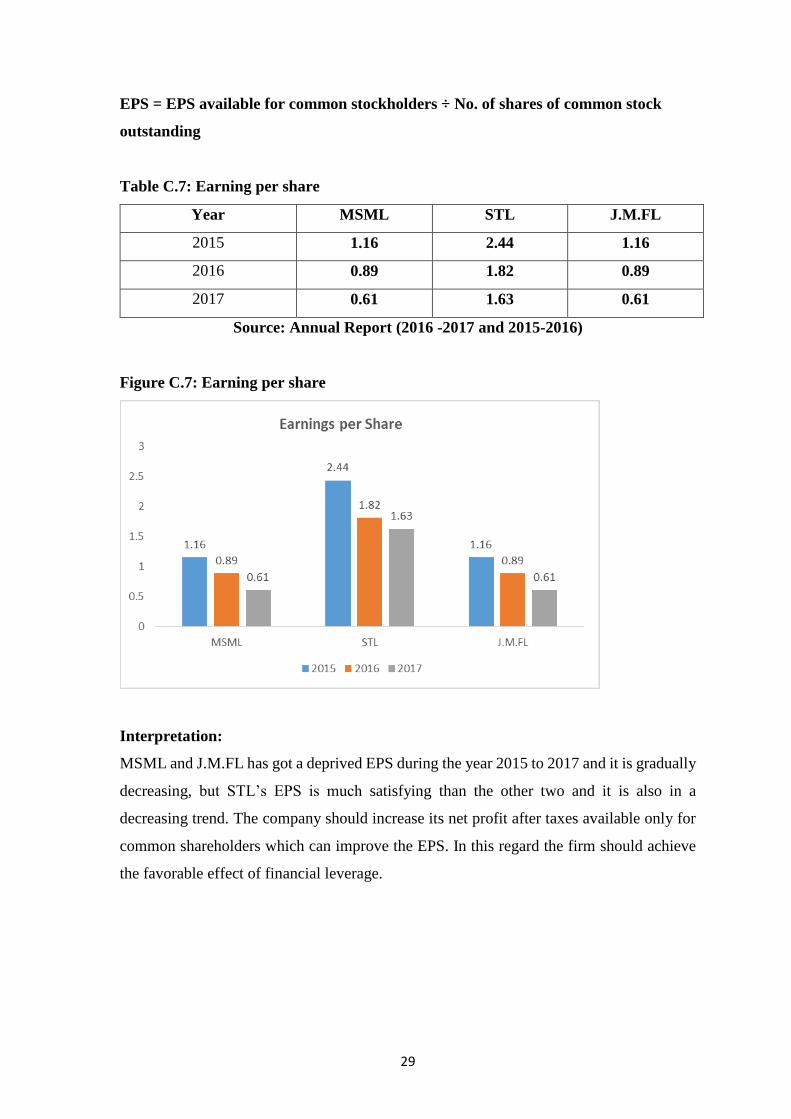
Table C.7: Earning per share
Year MSML STL J.M.FL
2015 1.16 2.44 1.16
2016 0.89 1.82 0.89
2017 0.61 1.63 0.61
Source: Annual Report (2016 -2017 and 2015-2016)
Figure C.7: Earning per share
Interpretation:
MSML and J.M.FL has got a deprived EPS during the year 2015 to 2017 and it is gradually
decreasing, but STL’s EPS is much satisfying than the other two and it is also in a
decreasing trend. The company should increase its net profit after taxes available only for
common shareholders which can improve the EPS. In this regard the firm should achieve
the favorable effect of financial leverage.
30
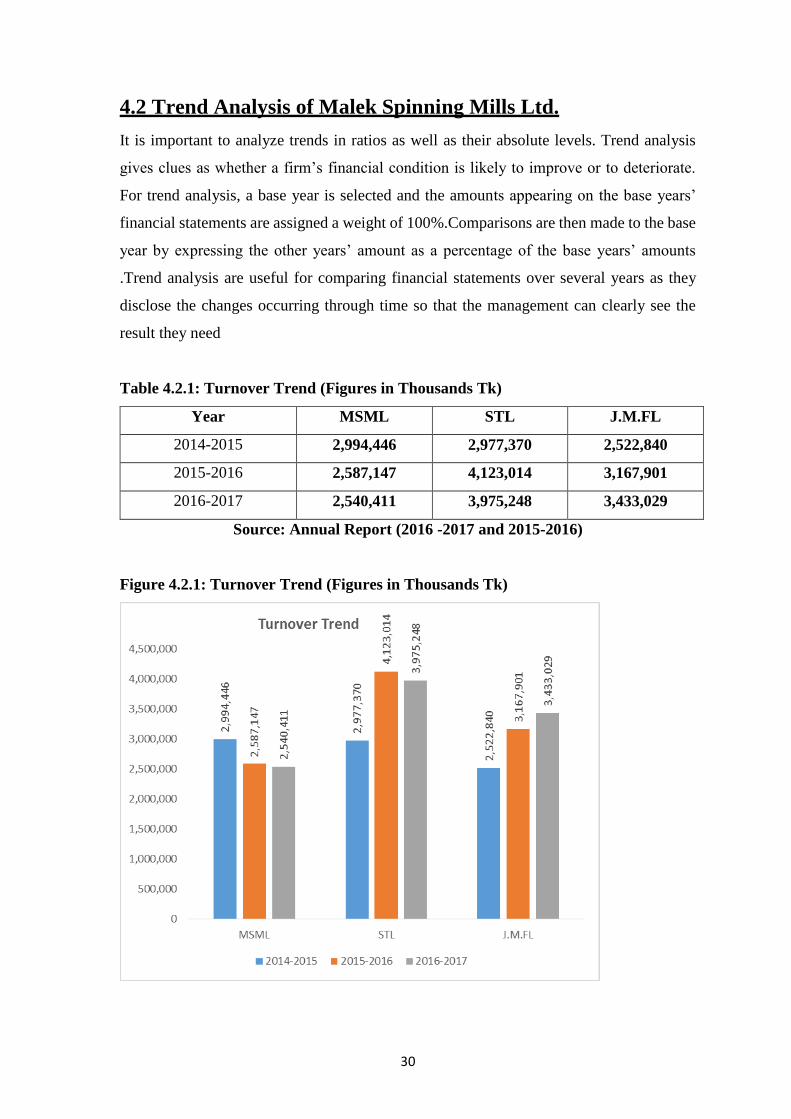
4.2 Trend Analysis of Malek Spinning Mills Ltd.
It is important to analyze trends in ratios as well as their absolute levels. Trend analysis
gives clues as whether a firm’s financial condition is likely to improve or to deteriorate.
For trend analysis, a base year is selected and the amounts appearing on the base years’
financial statements are assigned a weight of 100%.Comparisons are then made to the base
year by expressing the other years’ amount as a percentage of the base years’ amounts
.Trend analysis are useful for comparing financial statements over several years as they
disclose the changes occurring through time so that the management can clearly see the
result they need
Table 4.2.1: Turnover Trend (Figures in Thousands Tk)
Year MSML STL J.M.FL
2014-2015 2,994,446 2,977,370 2,522,840
2015-2016 2,587,147 4,123,014 3,167,901
2016-2017 2,540,411 3,975,248 3,433,029
Source: Annual Report (2016 -2017 and 2015-2016)
Figure 4.2.1: Turnover Trend (Figures in Thousands Tk)
31
Interpretation: The above table and graph shows sales figure from 2014-2015 to 2015-
2016. And it shows that sales fluctuated during the period. The sales peaked in the year
2016-2017 for J.M.FL but MSML sales is lower than the previous years.
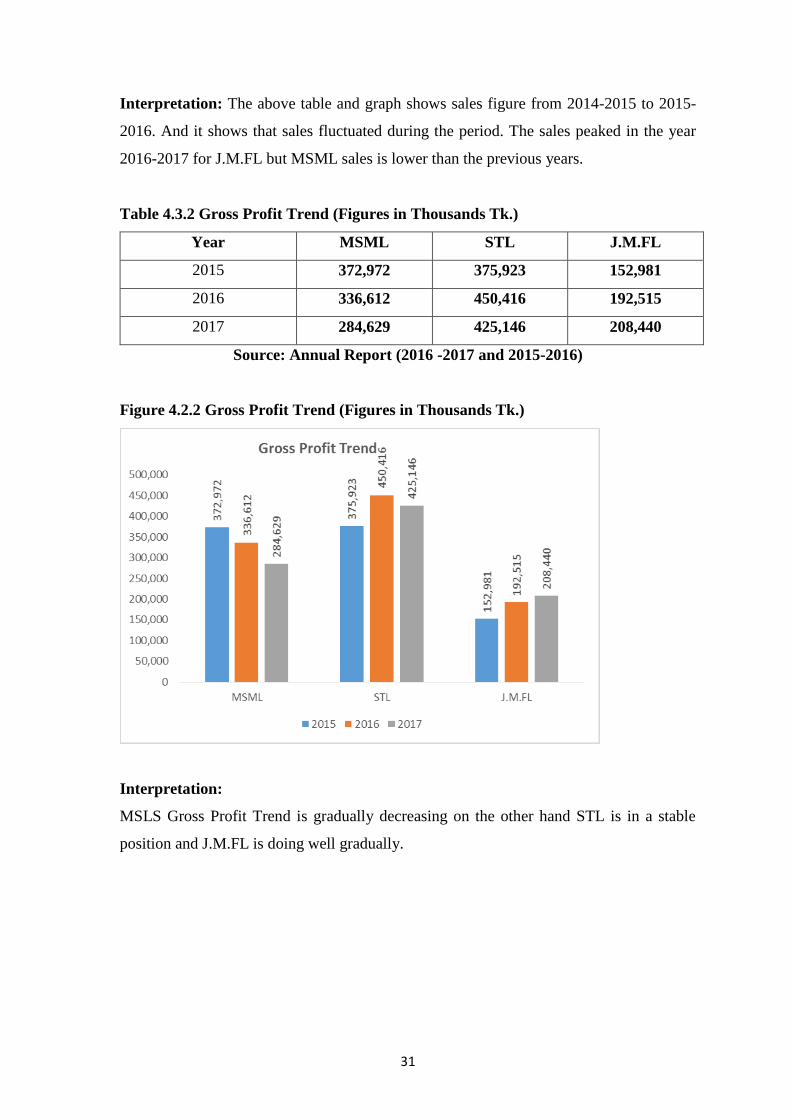
Table 4.3.2 Gross Profit Trend (Figures in Thousands Tk.)
Year MSML STL J.M.FL
2015 372,972 375,923 152,981
2016 336,612 450,416 192,515
2017 284,629 425,146 208,440
Source: Annual Report (2016 -2017 and 2015-2016)
Figure 4.2.2 Gross Profit Trend (Figures in Thousands Tk.)
Interpretation:
MSLS Gross Profit Trend is gradually decreasing on the other hand STL is in a stable
position and J.M.FL is doing well gradually.
32
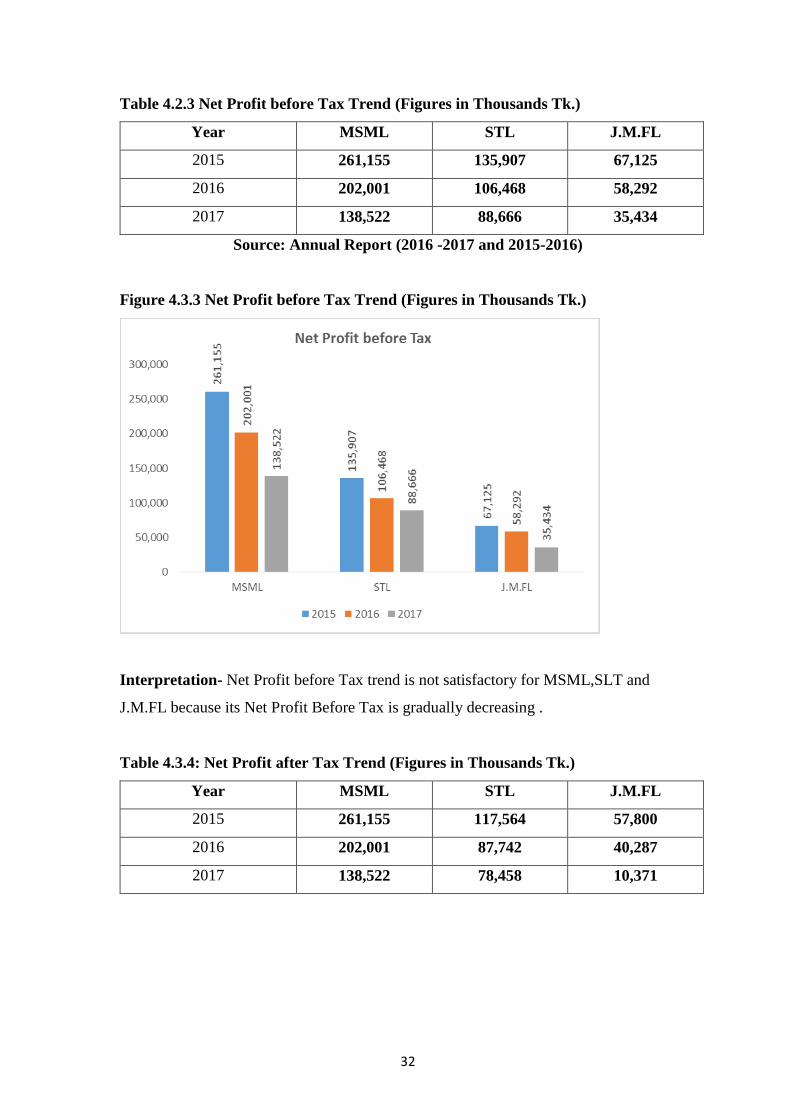
Table 4.2.3 Net Profit before Tax Trend (Figures in Thousands Tk.)
Year MSML STL J.M.FL
2015 261,155 135,907 67,125
2016 202,001 106,468 58,292
2017 138,522 88,666 35,434
Source: Annual Report (2016 -2017 and 2015-2016)
Figure 4.3.3 Net Profit before Tax Trend (Figures in Thousands Tk.)
Interpretation- Net Profit before Tax trend is not satisfactory for MSML,SLT and
J.M.FL because its Net Profit Before Tax is gradually decreasing .
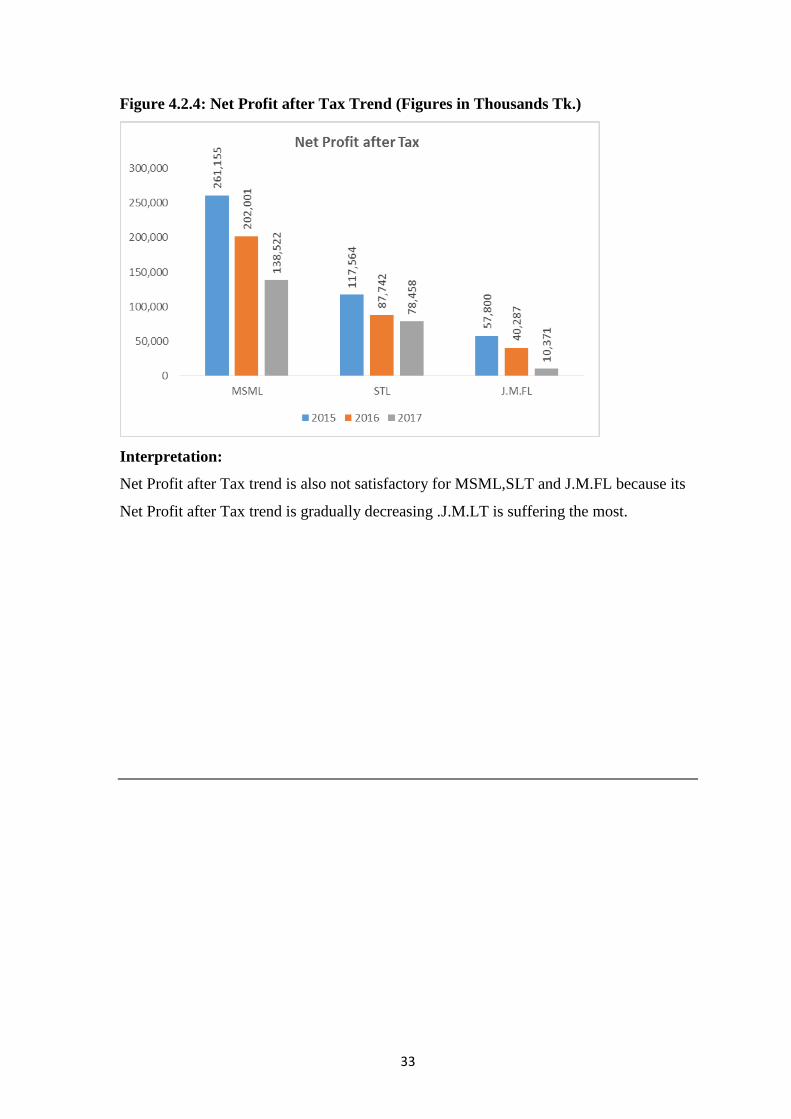
Table 4.3.4: Net Profit after Tax Trend (Figures in Thousands Tk.)
Year MSML STL J.M.FL
2015 261,155 117,564 57,800
2016 202,001 87,742 40,287
2017 138,522 78,458 10,371
33
Figure 4.2.4: Net Profit after Tax Trend (Figures in Thousands Tk.)
Interpretation:
Net Profit after Tax trend is also not satisfactory for MSML,SLT and J.M.FL because its
Net Profit after Tax trend is gradually decreasing .J.M.LT is suffering the most.
Chapter 5
Findings of the Study
34
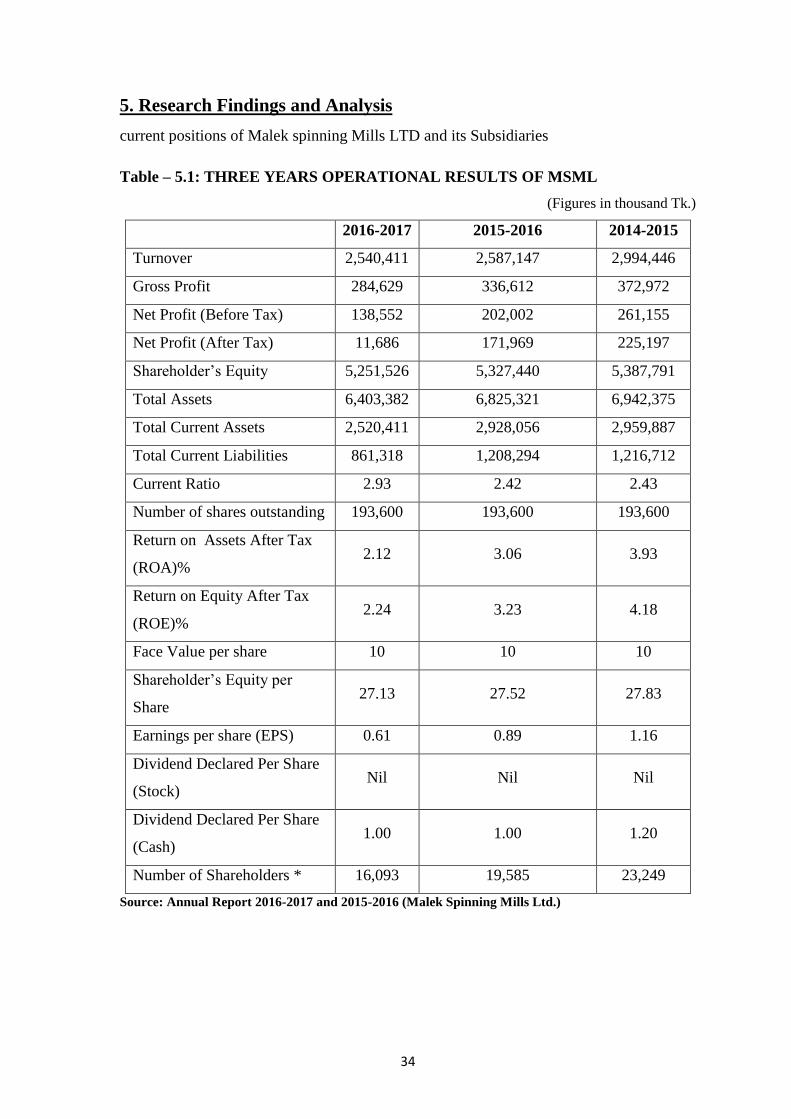
5. Research Findings and Analysis
current positions of Malek spinning Mills LTD and its Subsidiaries
Table – 5.1: THREE YEARS OPERATIONAL RESULTS OF MSML
(Figures in thousand Tk.)
2016-2017 2015-2016 2014-2015
Turnover 2,540,411 2,587,147 2,994,446
Gross Profit 284,629 336,612 372,972
Net Profit (Before Tax) 138,552 202,002 261,155
Net Profit (After Tax) 11,686 171,969 225,197
Shareholder’s Equity 5,251,526 5,327,440 5,387,791
Total Assets 6,403,382 6,825,321 6,942,375
Total Current Assets 2,520,411 2,928,056 2,959,887
Total Current Liabilities 861,318 1,208,294 1,216,712
Current Ratio 2.93 2.42 2.43
Number of shares outstanding 193,600 193,600 193,600
Return on Assets After Tax
(ROA)% 2.12 3.06 3.93
Return on Equity After Tax
(ROE)% 2.24 3.23 4.18
Face Value per share 10 10 10
Shareholder’s Equity per
Share 27.13 27.52 27.83
Earnings per share (EPS) 0.61 0.89 1.16
Dividend Declared Per Share
(Stock) Nil Nil Nil
Dividend Declared Per Share
(Cash) 1.00 1.00 1.20
Number of Shareholders * 16,093 19,585 23,249
Source: Annual Report 2016-2017 and 2015-2016 (Malek Spinning Mills Ltd.)
35
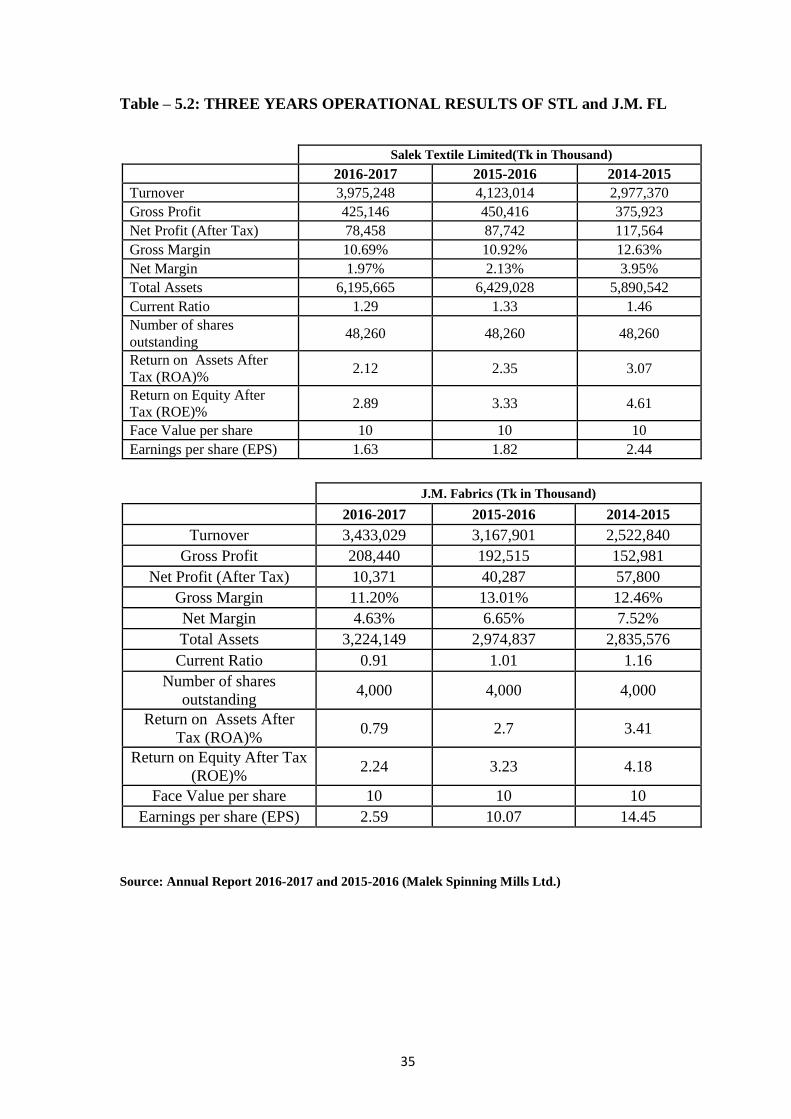
Table – 5.2: THREE YEARS OPERATIONAL RESULTS OF STL and J.M. FL
Salek Textile Limited(Tk in Thousand)
2016-2017 2015-2016 2014-2015
Turnover 3,975,248 4,123,014 2,977,370
Gross Profit 425,146 450,416 375,923
Net Profit (After Tax) 78,458 87,742 117,564
Gross Margin 10.69% 10.92% 12.63%
Net Margin 1.97% 2.13% 3.95%
Total Assets 6,195,665 6,429,028 5,890,542
Current Ratio 1.29 1.33 1.46
Number of shares
outstanding 48,260 48,260 48,260
Return on Assets After
Tax (ROA)% 2.12 2.35 3.07
Return on Equity After
Tax (ROE)% 2.89 3.33 4.61
Face Value per share 10 10 10
Earnings per share (EPS) 1.63 1.82 2.44
J.M. Fabrics (Tk in Thousand)
2016-2017 2015-2016 2014-2015
Turnover 3,433,029 3,167,901 2,522,840
Gross Profit 208,440 192,515 152,981
Net Profit (After Tax) 10,371 40,287 57,800
Gross Margin 11.20% 13.01% 12.46%
Net Margin 4.63% 6.65% 7.52%
Total Assets 3,224,149 2,974,837 2,835,576
Current Ratio 0.91 1.01 1.16
Number of shares
outstanding 4,000 4,000 4,000
Return on Assets After
Tax (ROA)% 0.79 2.7 3.41
Return on Equity After Tax
(ROE)% 2.24 3.23 4.18
Face Value per share 10 10 10
Earnings per share (EPS) 2.59 10.07 14.45
Source: Annual Report 2016-2017 and 2015-2016 (Malek Spinning Mills Ltd.)
36
Other Findings:
(a) Cost of Goods Sold: The cost of goods sold was 88.80% during the year as compared
to 86.99% during the previous year, as significant increase of 1.81%.
(b) Export: The company had achieved an export turnover of Tk.2,540.41 million during
the year ended 30th June 2017. Last year’s export turnover was Tk.2,587.15 million. The
turnover had decreased by1.81% over the last year due to fall in sales quantity.
(c) Gross Profit: Gross Profit earned during the year amounted to Tk.284.63
million as against Tk.336.61 million during the previous year. Gross profit decreased
due to decrease of sales compared to last year and Raw Material consumption is not
proportionately decrease compare to last year.
(d) Net Profit/(Loss): The company had succeeded in earning a Net Profit of Tk.117.69
million compared to last year’s Net Profit of Tk.171.97 million. The Net Profit decreased
due to increase in cost of goods sold and operational expenses compared to last year and
other expenses did not decrease proportionately compared to last year
The overall performance of malek Spinning Mills and its subsidiaries
The net profit of the company for the year 2016-2017 stood at Tk. 117,685,842 as against
Tk. 171,969,153 during the previous year, as a result, net profit (after tax)decline of
31.57% over the previous year. During the year sales revenue of the company had
decreased by 1.81% from Tk. 2,587,146,675 in 2015-16 to Tk. 2,540,411,247 in 2016-17
due to the reduction of selling price in the face of stiff competition and consequent fall in
prices in international market. The cost of goods sold was 88.80% during the year as
compared to 86.99% during the previous year, as the significant increase of 1.81%. Gross
Profit earned during the year amounted to Tk. 284.63 million as against Tk. 336.61 million
during the previous year. As a result, Net Profit percentage had decreased by 2.02% on
sales over the previous year (6.65% of sales in the year 2015-16 & 4.63% of sales in the
year 2016-2017).
The Board of Directors has recommended for the declaration of a Cash Dividend @ 10%
i.e. Tk. 1.00 (one) per share of Tk. 10.00 each for ordinary shares held by the shareholders
as on the Record Date. `
37
RISK MANAGEMENT
1. Operational Risk
The management personnel both in head office and production premise seem to be
competent and experienced to run the operation effectively. However, better human
resources development plan for both officers and workers may increase the efficiency in
operation. In order to reduce the operational risk, the company has established internal audit
department to follow up the internal control policies. However, computerization in the total
operational process is yet to be established to reduce the data processing and preservation
risk.
2. Price Fluctuation Risk for raw materials.
Price fluctuations of raw cotton as well as finished goods and volatility of prices in the
international market also exposed the company to market risks. In 2017, the company faced
difficulties when the raw cotton price hiked to USD 1.86 from USD USD 1.72 per Kg.
Thus, like many companies in the industry, MSML is exposed to price fluctuation risk.
3. Exchange Rate Risk.
Exchange rate risk may also affect the business of this company, because companies major
raw material will be mainly produce from USA, company will have to pay for the raw
materials in foreign currency. On the other hand it exports the entire merchandise for which
it receipts payment in foreign currency as well. It will conduct most of its foreign currency
transaction in USD dollars. Hence, any significant volatility in exchange rate of TK against
US dollars will increase the volatility of the company’s cash flow and profitability.
4. Supply Risk
The company imports major raw cotton from USA, the major supplier of quality cotton of
the world. Due to good market reputation among the suppliers, MSML is less exposed to
supply risk.

38
5. Market Risk
MSML, being a backward linkage unit of the textile based group consuming about 40
percent of its annual sales; it enjoys an in-built demand of its product. This, to some extent,
puts aside the company from the tough competition in this sector. Besides, due to its quality
yarn, there are some other customers who had been purchasing yarn from the company
since long.
6. Gas Supply Risk
MSML has set up gas burning generators with total 6,300 KW capacities to support smooth
power to the production. Low gas pressure is a major threat to keep the optimum production
capacity utilization. The company has agreement with Titas Gas, a government entity for
uninterrupted supply. At present, MSML required standard pressure is 20 psi. However,
during last four months it got on an average 14 psi pressure for the use.
(Sources:- Consulting with officers of the company).
39
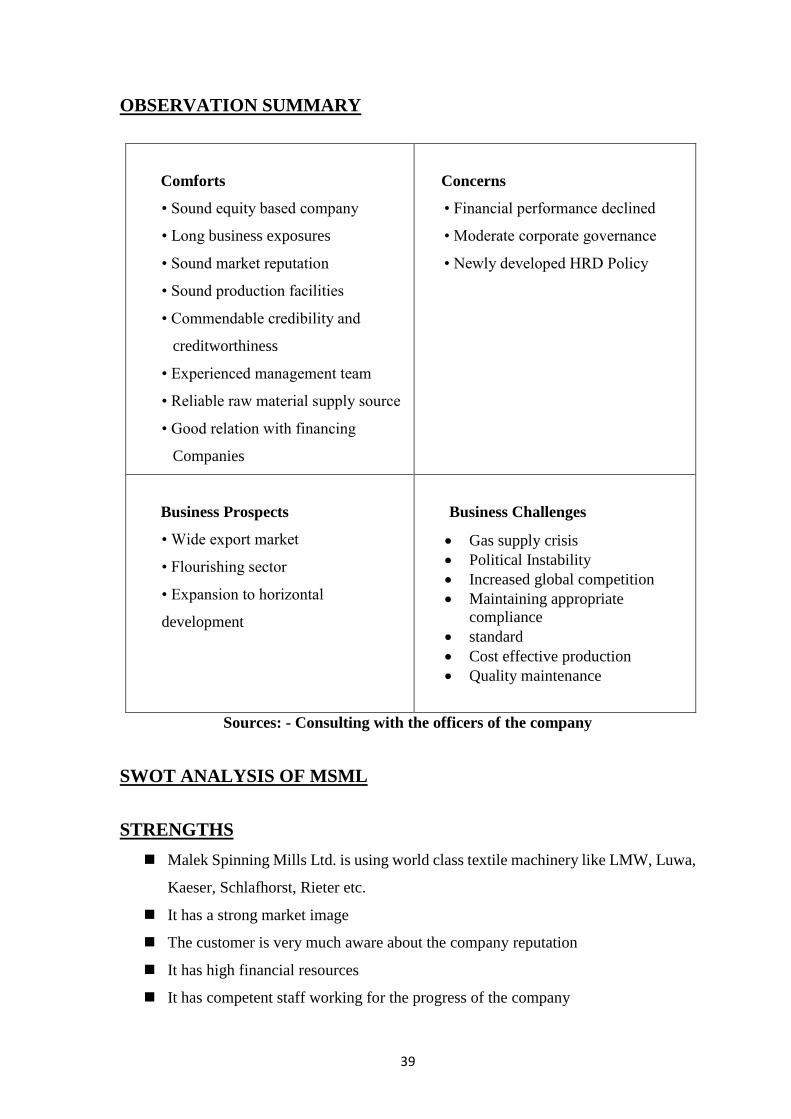
OBSERVATION SUMMARY
Comforts
• Sound equity based company
• Long business exposures
• Sound market reputation
• Sound production facilities
• Commendable credibility and
creditworthiness
• Experienced management team
• Reliable raw material supply source
• Good relation with financing
Companies
Concerns
• Financial performance declined
• Moderate corporate governance
• Newly developed HRD Policy
Business Prospects
• Wide export market
• Flourishing sector
• Expansion to horizontal
development
Business Challenges
Gas supply crisis
Political Instability
Increased global competition
Maintaining appropriate
compliance
standard
Cost effective production
Quality maintenance
Sources: - Consulting with the officers of the company
SWOT ANALYSIS OF MSML
STRENGTHS
Malek Spinning Mills Ltd. is using world class textile machinery like LMW, Luwa,
Kaeser, Schlafhorst, Rieter etc.
It has a strong market image
The customer is very much aware about the company reputation
It has high financial resources
It has competent staff working for the progress of the company
40
It has 100% automated system of production
Organization has friendly working environment
It has various certificate like Oeko-Tex Certificate, Cotton USA certificate and
USTERIZED certificate.
It has a wide range of products
WEAKNESSES
Malek Spinning Mills Ltd. ignores the local market
There is lack of proper training programs especially for workers. They learn through
experience and from seniors that’s the reason of high rate of wastage during
production.
Wastage is very high especially in spinning sector
Malek Spinning Mills Ltd. has not effective sales system for cotton waste and yarn
waste.
Sometime delivery delayed due to lack of production planning
Middle level management is demotivated due to insufficient salary and wages
package and promotions are held after a long period
There is no job commitment among the employees.
There is no proper performance evaluation system that motivates the staffs.
OPPORTUNITIES
As Malek Spinning Mills Ltd. is Oeko-Tex certified, Cotton USA certified and
USTERIZED certified company so it has a chance to increase & expand business.
The demand of its products is high in local and international market.
Govt. is providing VAT rebate facility and concessionary income tax rate for textile
sector.
Long term loans are easily available.
41
THREATS
Foreign investment in textile sector in Sri Lanka, Pakistan and India is a danger in
future for Malek Spinning Mills Ltd.
It has been seen that many other groups in Bangladesh have entered in competition
with Malek Spinning Mills Ltd. If they will not be competed well, there is a chance
that they can get share of export from foreign buyers.
High inflation rates hinder in competing the Indian yarn at international level.
Fluctuating prices of dollar also affect the purchase of cotton in off-season.
Due to world economic crisis, overall sales position was totally down last few
months, but now these countries are again on the road of progress. If the previous
customers are not properly attended, they may be lost forever.
Govt. permission for importing of yarn from India through Benapole port directly
affects textile Sector. (Sources: - Consulting with officers of the company)

Chapter 6 and 7
Recommendation and Conclusion
42
6. Recommendation Malek Spinning Mills Limited and its subsidiaries can take the following
recommendations into consideration: 1. MSML and its subsidiaries can increase their current assets more by enhancing the
accounts receivable and can decrease its current liabilities by reducing its bank
overdraft and short term loan.
2. The Companies can try to increase its quick assets like-cash, accounts receivable
and marketable securities.
3. It also can reduce inventory to improve its inventory turnover ratio.
4. Company’s management should be more efficient in utilizing the company’s capital
to generate sales.
5. MSML and its subsidiaries are supposed to offer attractive credit policy to its
customers by extending credit period from 60 days to 90 days.
6. The companies should try to utilize its fixed assets more efficiently to accelerate
sales.
7. The company’s management should be more efficient in utilizing the company’s
total assets to generate sales.
8. It should aim to achieve optimum capital structure by reducing debt capital as well
as by increasing equity capital to finance its total assets.
9. The Companies ought to enhance its earnings by accelerating its sales as well as by
minimizing its operating costs in order to get adequate earnings.
10. MSML and its subsidiaries should make an effort to increase its sales and manage
its cost of goods sold efficiently.
11. The companies can enhance its sales by managing the operating cost efficiently.
12. It should amplify its management’s ability to operate the business by enhancing
sales with the cost price effectiveness of the operation.
13. The companies should try hard to intensify its efficiency in utilizing the firm’s
assets to generate adequate profitability.
14. The companies should increase its efficiency in utilizing the firm’s capital to
generate adequate profitability.
15. It is supposed to achieve the best use of equity capital to enhance the earning per
share (EPS) and stockholders’ return.
16. MSML and subsidiaries should increase its net profit after taxes available only for
common shareholders which can improve the EPS. In this regard the firm should
achieve the favorable effect of financial leverage
43
7. Conclusion
Bangladesh is an over populated country of South Asia. It is a full of Natural resources.
But the economic condition is very poor and Unemployed rate of population is another
Burden for developing our country .Creating new employment opportunity in our country
by investing large capital must be needed .MSML is playing a vital role for our country
economy MSML is a well repute Spinning Mills. Which has better quality product at a
competitive price. Malek Spinning Mills Limited is very sound in the financial year 2015-
16. But due to increase the price of raw material and increase operating expense because of
the increase of salary of its employee its net profit decrease in the year 2016-2017. But they
have overcome it by taking essential steps. As they have paid loan payment, the financial
cost decrease than previous year and to overcome this situation they have to minimize cost
in the other hand. Its subsidiary company Salek Textile Limited is a newly established
organization which has a strong market position. MSML has a sound status with strong
International quality certificates that would be acceptable for all buyers in terms of quality
& social accountability management system. These would enhance the marketing power of
the company for entering new markets and expand business in a professional way. So at
last, from the analysis and discussion, I may conclude that MSML and its subsidiaries is
being grown up Industry because of its byres areas, Fractural development, production
capacity, human resource and others activities which are quite satisfactory.
44
8. References and Appendix
8.1 References
Stephen A. Ross, Randolph W. Westerfield, Jeffrey Jaffe (2006-2007),
Corporate Finance (7th edt.), Tata McGraw-Hill Pubishing Company Ltd. New
Delhi.
Scott Besley, Eugene F. Brigham, Essentials of Managerial Finance (13th Edt.)
Scott Besley, Eugene F. Brigham, Essentials of Managerial Finance (14th Edt.)
http://www.malekspinning.com
Malek Spinning Mills LTD, Annual Report 2014-2015
Malek Spinning Mills LTD, Annual Report 2015-2016
Malek Spinning Mills LTD, Annual Report 2016-2017
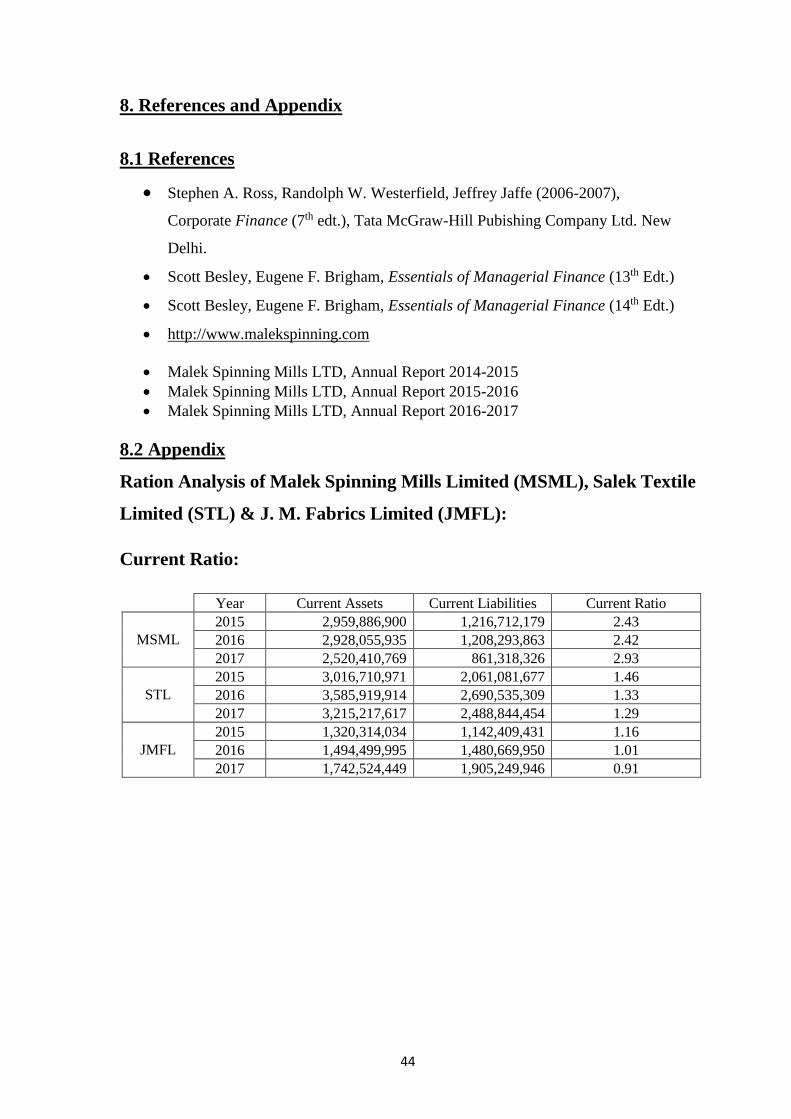
8.2 Appendix
Ration Analysis of Malek Spinning Mills Limited (MSML), Salek Textile
Limited (STL) & J. M. Fabrics Limited (JMFL):
Current Ratio:
Year Current Assets Current Liabilities Current Ratio
MSML
2015 2,959,886,900 1,216,712,179 2.43
2016 2,928,055,935 1,208,293,863 2.42
2017 2,520,410,769 861,318,326 2.93
STL
2015 3,016,710,971 2,061,081,677 1.46
2016 3,585,919,914 2,690,535,309 1.33
2017 3,215,217,617 2,488,844,454 1.29
JMFL
2015 1,320,314,034 1,142,409,431 1.16
2016 1,494,499,995 1,480,669,950 1.01
2017 1,742,524,449 1,905,249,946 0.91
45
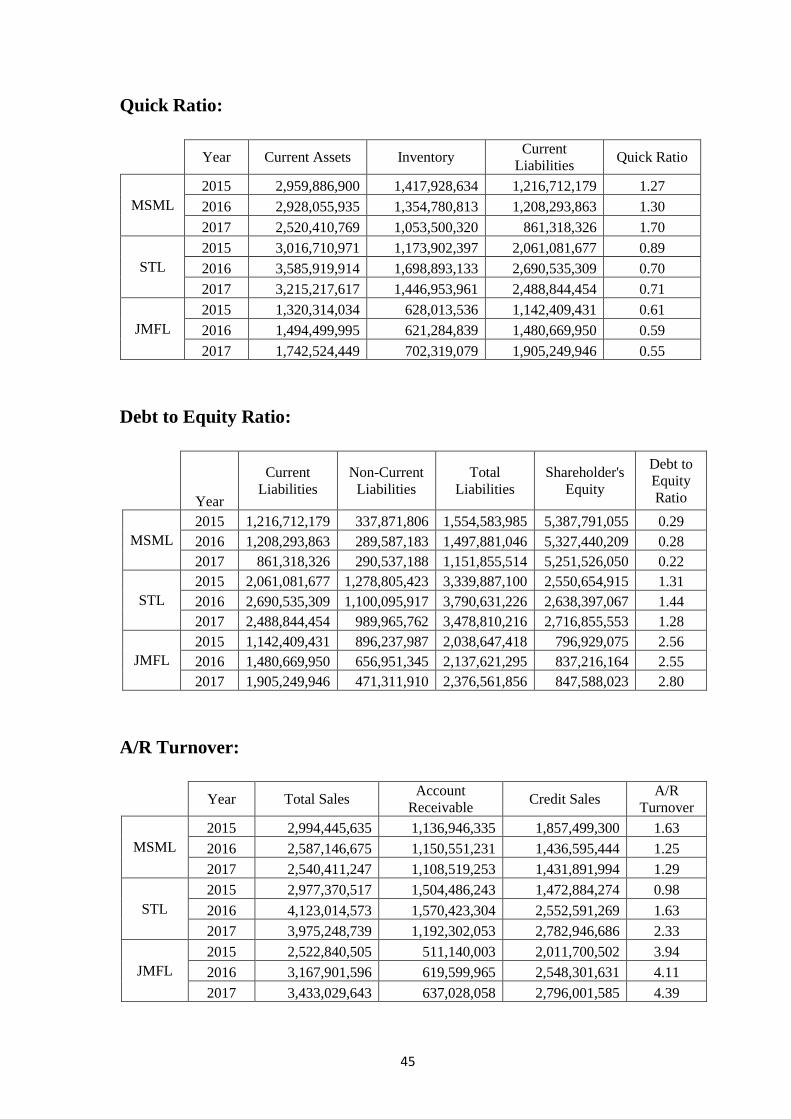
Quick Ratio:
Year Current Assets Inventory
Current
Liabilities Quick Ratio
MSML
2015 2,959,886,900 1,417,928,634 1,216,712,179 1.27
2016 2,928,055,935 1,354,780,813 1,208,293,863 1.30
2017 2,520,410,769 1,053,500,320 861,318,326 1.70
STL
2015 3,016,710,971 1,173,902,397 2,061,081,677 0.89
2016 3,585,919,914 1,698,893,133 2,690,535,309 0.70
2017 3,215,217,617 1,446,953,961 2,488,844,454 0.71
JMFL
2015 1,320,314,034 628,013,536 1,142,409,431 0.61
2016 1,494,499,995 621,284,839 1,480,669,950 0.59
2017 1,742,524,449 702,319,079 1,905,249,946 0.55
Debt to Equity Ratio:
Year
Current
Liabilities
Non-Current
Liabilities
Total
Liabilities
Shareholder's
Equity
Debt to
Equity
Ratio
MSML
2015 1,216,712,179 337,871,806 1,554,583,985 5,387,791,055 0.29
2016 1,208,293,863 289,587,183 1,497,881,046 5,327,440,209 0.28
2017 861,318,326 290,537,188 1,151,855,514 5,251,526,050 0.22
STL
2015 2,061,081,677 1,278,805,423 3,339,887,100 2,550,654,915 1.31
2016 2,690,535,309 1,100,095,917 3,790,631,226 2,638,397,067 1.44
2017 2,488,844,454 989,965,762 3,478,810,216 2,716,855,553 1.28
JMFL
2015 1,142,409,431 896,237,987 2,038,647,418 796,929,075 2.56
2016 1,480,669,950 656,951,345 2,137,621,295 837,216,164 2.55
2017 1,905,249,946 471,311,910 2,376,561,856 847,588,023 2.80
A/R Turnover:
Year Total Sales
Account
Receivable Credit Sales
A/R
Turnover
MSML
2015 2,994,445,635 1,136,946,335 1,857,499,300 1.63
2016 2,587,146,675 1,150,551,231 1,436,595,444 1.25
2017 2,540,411,247 1,108,519,253 1,431,891,994 1.29
STL
2015 2,977,370,517 1,504,486,243 1,472,884,274 0.98
2016 4,123,014,573 1,570,423,304 2,552,591,269 1.63
2017 3,975,248,739 1,192,302,053 2,782,946,686 2.33
JMFL
2015 2,522,840,505 511,140,003 2,011,700,502 3.94
2016 3,167,901,596 619,599,965 2,548,301,631 4.11
2017 3,433,029,643 637,028,058 2,796,001,585 4.39
46
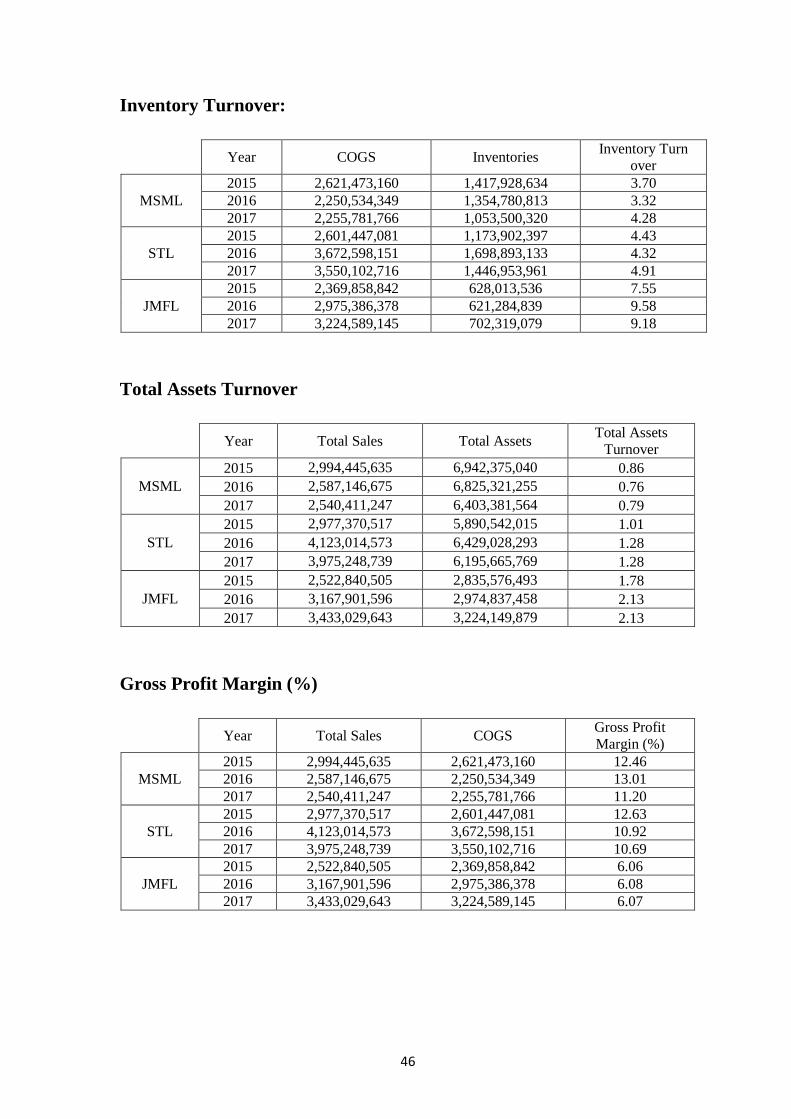
Inventory Turnover:
Year COGS Inventories
Inventory Turn
over
MSML
2015 2,621,473,160 1,417,928,634 3.70
2016 2,250,534,349 1,354,780,813 3.32
2017 2,255,781,766 1,053,500,320 4.28
STL
2015 2,601,447,081 1,173,902,397 4.43
2016 3,672,598,151 1,698,893,133 4.32
2017 3,550,102,716 1,446,953,961 4.91
JMFL
2015 2,369,858,842 628,013,536 7.55
2016 2,975,386,378 621,284,839 9.58
2017 3,224,589,145 702,319,079 9.18
Total Assets Turnover
Year Total Sales Total Assets
Total Assets
Turnover
MSML
2015 2,994,445,635 6,942,375,040 0.86
2016 2,587,146,675 6,825,321,255 0.76
2017 2,540,411,247 6,403,381,564 0.79
STL
2015 2,977,370,517 5,890,542,015 1.01
2016 4,123,014,573 6,429,028,293 1.28
2017 3,975,248,739 6,195,665,769 1.28
JMFL
2015 2,522,840,505 2,835,576,493 1.78
2016 3,167,901,596 2,974,837,458 2.13
2017 3,433,029,643 3,224,149,879 2.13
Gross Profit Margin (%)
Year Total Sales COGS
Gross Profit
Margin (%)
MSML
2015 2,994,445,635 2,621,473,160 12.46
2016 2,587,146,675 2,250,534,349 13.01
2017 2,540,411,247 2,255,781,766 11.20
STL
2015 2,977,370,517 2,601,447,081 12.63
2016 4,123,014,573 3,672,598,151 10.92
2017 3,975,248,739 3,550,102,716 10.69
JMFL
2015 2,522,840,505 2,369,858,842 6.06
2016 3,167,901,596 2,975,386,378 6.08
2017 3,433,029,643 3,224,589,145 6.07
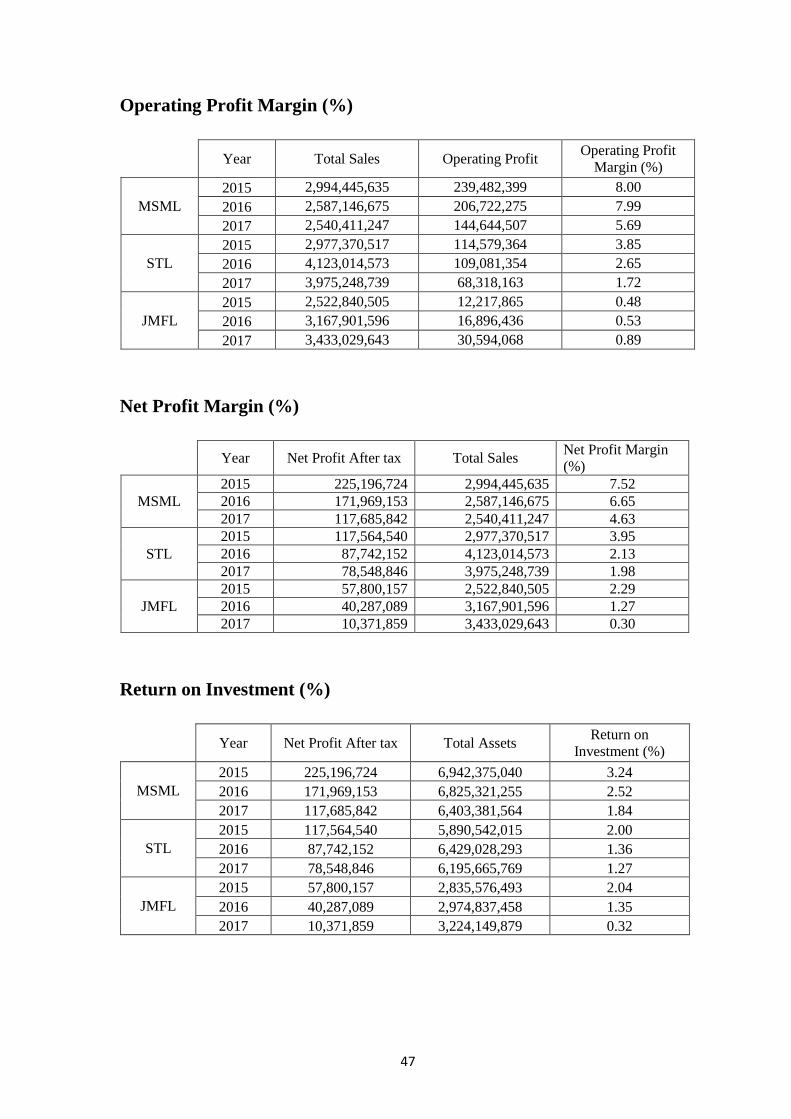
47
Operating Profit Margin (%)
Year Total Sales Operating Profit
Operating Profit
Margin (%)
MSML
2015 2,994,445,635 239,482,399 8.00
2016 2,587,146,675 206,722,275 7.99
2017 2,540,411,247 144,644,507 5.69
STL
2015 2,977,370,517 114,579,364 3.85
2016 4,123,014,573 109,081,354 2.65
2017 3,975,248,739 68,318,163 1.72
JMFL
2015 2,522,840,505 12,217,865 0.48
2016 3,167,901,596 16,896,436 0.53
2017 3,433,029,643 30,594,068 0.89
Net Profit Margin (%)
Year Net Profit After tax Total Sales
Net Profit Margin
(%)
MSML
2015 225,196,724 2,994,445,635 7.52
2016 171,969,153 2,587,146,675 6.65
2017 117,685,842 2,540,411,247 4.63
STL
2015 117,564,540 2,977,370,517 3.95
2016 87,742,152 4,123,014,573 2.13
2017 78,548,846 3,975,248,739 1.98
JMFL
2015 57,800,157 2,522,840,505 2.29
2016 40,287,089 3,167,901,596 1.27
2017 10,371,859 3,433,029,643 0.30
Return on Investment (%)
Year Net Profit After tax Total Assets
Return on
Investment (%)
MSML
2015 225,196,724 6,942,375,040 3.24
2016 171,969,153 6,825,321,255 2.52
2017 117,685,842 6,403,381,564 1.84
STL
2015 117,564,540 5,890,542,015 2.00
2016 87,742,152 6,429,028,293 1.36
2017 78,548,846 6,195,665,769 1.27
JMFL
2015 57,800,157 2,835,576,493 2.04
2016 40,287,089 2,974,837,458 1.35
2017 10,371,859 3,224,149,879 0.32
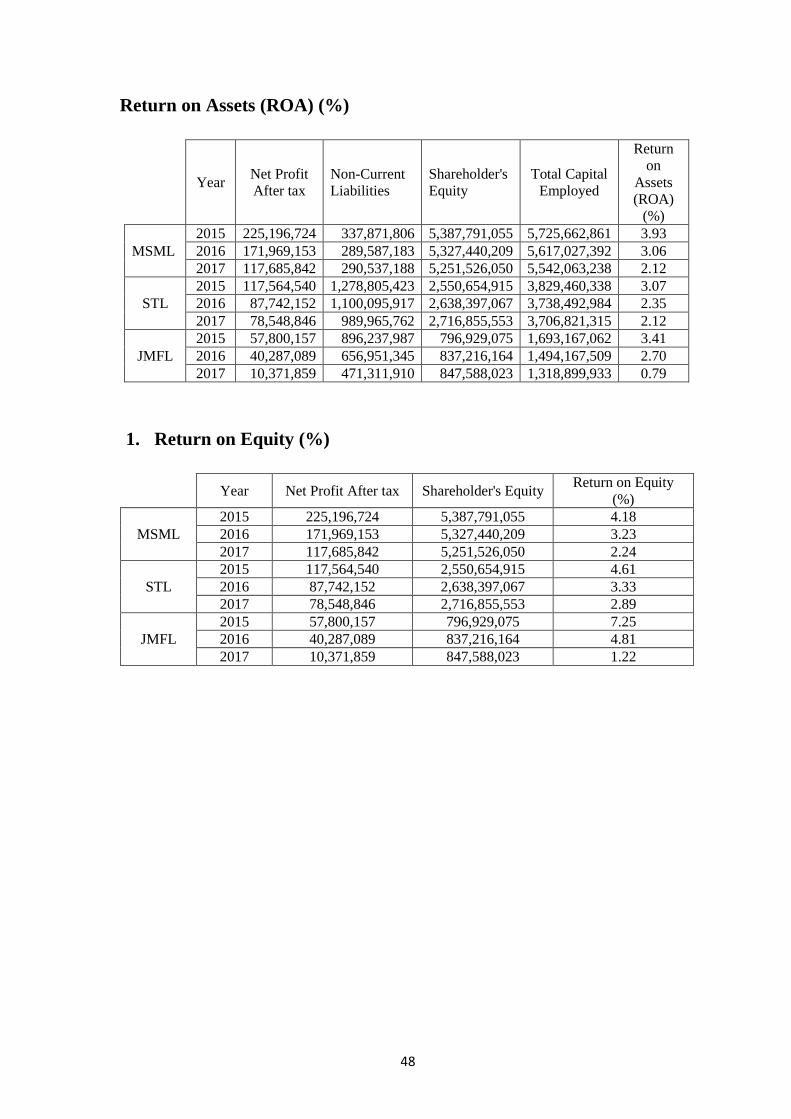
48
Return on Assets (ROA) (%)
Year Net Profit
After tax
Non-Current
Liabilities
Shareholder's
Equity
Total Capital
Employed
Return
on
Assets
(ROA)
(%)
MSML
2015 225,196,724 337,871,806 5,387,791,055 5,725,662,861 3.93
2016 171,969,153 289,587,183 5,327,440,209 5,617,027,392 3.06
2017 117,685,842 290,537,188 5,251,526,050 5,542,063,238 2.12
STL
2015 117,564,540 1,278,805,423 2,550,654,915 3,829,460,338 3.07
2016 87,742,152 1,100,095,917 2,638,397,067 3,738,492,984 2.35
2017 78,548,846 989,965,762 2,716,855,553 3,706,821,315 2.12
JMFL
2015 57,800,157 896,237,987 796,929,075 1,693,167,062 3.41
2016 40,287,089 656,951,345 837,216,164 1,494,167,509 2.70
2017 10,371,859 471,311,910 847,588,023 1,318,899,933 0.79
1. Return on Equity (%)
Year Net Profit After tax Shareholder's Equity
Return on Equity
(%)
MSML
2015 225,196,724 5,387,791,055 4.18
2016 171,969,153 5,327,440,209 3.23
2017 117,685,842 5,251,526,050 2.24
STL
2015 117,564,540 2,550,654,915 4.61
2016 87,742,152 2,638,397,067 3.33
2017 78,548,846 2,716,855,553 2.89
JMFL
2015 57,800,157 796,929,075 7.25
2016 40,287,089 837,216,164 4.81
2017 10,371,859 847,588,023 1.22