Climate Change Impacts on Yield and Financial Performance ...
Upload
khangminh22Category
view
0download
0
BUDGETARY CONTROL AND FINANCIAL PERFORMANCE OF INTERNATIONAL
NON-GOVERNMENTAL ORGANIZATIONS IN UGANDA: A CASE OF CARDNO-
STRENGTHENING DECENTRALISATION FOR SUSTAINABILITY PROGRAMME
BY
JOHN JAKAIT
REG. NO: 14/MBA/12/007
A DISSERTATION SUBMITTED TO THE SCHOOL OF MANAGEMENT SCIENCE IN
PARTIAL FULFILMENT OF THE REQUIREMETS FOR THE AWARD OF DEGREE
OF MASTER OF BUSINESS ADMISTRATION, OF UGANDA MANAGEMENT
INSTITUTE
JANUARY, 2018

i
DECLARATION
I John Jakait, hereby declare that this report is my original work and to the best of my knowledge
it has never been submitted to any other institution for any academic awards before. Where other
scholars’ research was used, it has been duly acknowledged.
Signature……………………………………….. Date……………………………
JOHN JAKAIT

ii
APPROVAL
This is to certify that this thesis was conducted under my supervision and the dissertation has been
submitted for examination with my approval as the candidate’s supervisors.
Sign………………………………………….
Dr. Godfrey Mugurusi Date…………………………………………..
UMI Supervisor
Sign………………………………………….
Dr. Michael Kiwanuka Date…………………………………………..
UMI Supervisor

iii
DEDICATION
This work is dedicated to my dear parents Benjamin Jakait and Mary Jakait, who sacrificed their
hard earned money to see me through and on whose foundation I continue building myself. To
my dear wife Christine Arikot and children Ethan Melvin Jakait, Ethel Melisa Jakait, and Edlyn
Melisanda Jakait for their love and moral support that has enabled me to accomplish this study.
I must also dedicate this book to them for their high sense of patience and understanding during
periods I was emotionally and physically not with them in the course of the study even where
they would have wanted my presence most.

iv
ACKNOWLEDGEMENT
This is my most pleasant moment to express my acknowledgement and gratitude to a number of
people who have in various ways contributed to the completion of this work. First and foremost,
I would like to express my gratitude to Dr. Godfrey Mugurusi and Dr. Michael Kiwanuka, my
supervisors for their unwavering guidance, constructive commitment and generally for
successfully seeing through this work
Accordingly, I feel indebted to all the various groups of people who provided me with support,
talked things over, read, proof read and edited the report as well as providing constructive
comments which immensely improved this report.
In a special way, I also wish to express my gratitude to the management and staff of Cardno SDS
Programme, Uganda where I conducted the study from. They did not only grant me the
permission to conduct the study in the organization but they also provided the study with
invaluable support and information as respondents
Thanks to all my friends at Uganda Management Institute who have been more than a friend to
me. Their company in the institute and during the time of doing the MBA together has been
immense. Last and not least, I beg forgiveness of all those who have been with me over the
course of the years and whose names I may not have mention.
Any errors and omissions are entirely mine

v
TABLE OF CONTENTS
DECLARATION ............................................................................................................................. i
APPROVAL ................................................................................................................................... ii
DEDICATION ............................................................................................................................... iii
ACKNOWLEDGEMENT ............................................................................................................. iv
TABLE OF CONTENTS ................................................................................................................ v
LIST OF FIGURES ........................................................................................................................ x
LIST OF ACRONYMS ................................................................................................................. xi
ABSTRACT ................................................................................................................................. xiv
CHAPTER ONE:INTRODUCTION .......................................................................................... 1
1.1 Introduction ............................................................................................................................... 1
1.2 Background to the study ........................................................................................................... 1
1.2.1 Historical perspective ............................................................................................................. 1
1.2.2 Theoretical perspective .......................................................................................................... 3
1.2.3 Conceptual perspective .......................................................................................................... 4
1.3 Statement of the Problem .......................................................................................................... 6
1.4 Purpose of the study .................................................................................................................. 7
1.5 Objectives of the study.............................................................................................................. 7
1.6 Research questions .................................................................................................................... 8
1.7 Research hypotheses ................................................................................................................. 8
1.8 The Conceptual framework....................................................................................................... 9
1.9 Significance of the study ......................................................................................................... 10
1.10 Justification of the study ....................................................................................................... 10
1.11 Scope of the study ................................................................................................................. 11
1.11.1 Geographical Scope ........................................................................................................... 11

vi
1.11.2 Time Scope ........................................................................................................................ 11
1.11.3 Content Scope .................................................................................................................... 11
1.12 Operational definitions.......................................................................................................... 12
CHAPTER TWO:LITERATURE REVIEW ........................................................................... 13
2.1 Introduction ............................................................................................................................. 13
2.2 Theoretical literature review ................................................................................................... 13
2.3 Related literature review ......................................................................................................... 16
2.3.1 Budgetary process and financial performance ..................................................................... 16
2.3.2 Fund accountability and financial performance. .................................................................. 18
2.3.3 Variance analysis and financial performance ...................................................................... 22
2.4 Summary of Literature Review ............................................................................................... 27
CHAPTER THREE:METHODOLOGY .................................................................................. 29
3.1 Introduction ............................................................................................................................. 29
3.2 Study design ............................................................................................................................ 29
3.3 Study population ..................................................................................................................... 30
3.4 Determination of sample size.................................................................................................. 30
3.5 Sampling techniques and procedures ...................................................................................... 31
3.6 Data collection methods .......................................................................................................... 32
3.6.1 Questionnaire Survey Method ............................................................................................. 32
3.6.2 Interview Method ................................................................................................................. 32
3.6.3 Documentary review method ............................................................................................... 33
3.7 Data collection instrument ...................................................................................................... 33
3.7.1 Self-administered Questionnaires (SAQs) ........................................................................... 33
3.7.2 Interview guide .................................................................................................................... 34
3.7.3 Documentary review guide .................................................................................................. 34

vii
3.8 Validity and reliability ............................................................................................................ 34
3.8.1 Validity ................................................................................................................................ 34
3.8.2 Reliability ............................................................................................................................. 36
3.9 Procedure of data collection .................................................................................................... 37
3.10 Data Analysis. ....................................................................................................................... 37
3.10.1 Quantitative Analysis ......................................................................................................... 37
3.10.2 Qualitative Analysis ........................................................................................................... 38
3.11. Measurement of Variables ................................................................................................... 38
3.12 Ethical considerations ........................................................................................................... 39
CHAPTER FOUR:PRESENTATION, ANALYSIS AND INTERPRETATION OF
RESULTS .................................................................................................................................... 40
4.1 Introduction ............................................................................................................................. 40
4.2 Response Rate ......................................................................................................................... 40
4.3 Background Characteristics of the Respondents..................................................................... 41
4.3.1Gender Characteristics of the Respondents .......................................................................... 41
4.3.2 Age of the Respondents ....................................................................................................... 42
4.4 Empirical Results based on Study’s Research Objectives ...................................................... 44
4.4.1 Budgetary process on financial performance of Cardno SDS Programme.......................... 44
4.4.1.1 Hypothesis Testing One: ................................................................................................... 47
4.4.2 Fund accountability and financial performance ................................................................... 50
4.4.2.1 Hypothesis Testing............................................................................................................ 53
4.4.3 Variance analysis and financial performance ...................................................................... 56
4.12 Summary of findings on the dependent variable (Financial Performance) .......................... 61
4.4.3.2 Hypothesis testing ............................................................................................................. 63
4.4.3.31 Pearson Correlation Coefficient ...................................................................................... 63

viii
4.4.3.4 Regression Analysis .......................................................................................................... 64
CHAPTER FIVE:SUMMARY, DISCUSSION, CONCLUSIONAND
RECOMMENDATIONS ............................................................................................................ 66
5.1 Introduction ............................................................................................................................. 66
5.2 Summary of the findings ......................................................................................................... 66
5.2.1 Budgetary Process and Financial Performance.................................................................... 66
5.2.2 Fund Accountability and Financial Performance ................................................................ 66
5.2.3 The effect of Variance Analysis on the Financial Performance .......................................... 66
5.3 Discussion ............................................................................................................................... 67
5.3.2 Fund Accountability and Financial Performance ................................................................ 70
5.3.3 Variance Analysis and Financial Performance .................................................................... 72
5.5 Conclusions ............................................................................................................................. 74
5.5.1 Budgetary Process and Financial Performance.................................................................... 74
5.5.2 Fund Accountability and Financial Performance ................................................................ 74
5.5.3 Variance Analysis and Financial Performance .................................................................... 75
5.6 Recommendations ................................................................................................................... 75
5.6.1 Budgetary Process and Financial Performance.................................................................... 75
5.6.2 Fund Accountability and the Financial Performance ........................................................... 75
5.6.3 Variance Analysis and Financial Performance .................................................................... 76
5.7 Limitations and Assumptions of the Study ............................................................................. 76
5.8 Areas for further Research ...................................................................................................... 78
REFERENCES ............................................................................................................................. 79
Appendix 2: Interview guide for Cardno SDS Programme management........................................ i
Appendix 3: Documentary review guide ......................................................................................... i

ix
LIST OF TABLES
Table 3.1: Study Population, sample size and sampling techniques ............................................. 31
Table 3. 2: Cronbach’s Alpha Coefficient test results .................................................................. 35
Table 3.3: Cronbach’s Alpha Coefficient ..................................................................................... 36
Table 4.1: Response Rate .............................................................................................................. 40
Table 4.2: Gender statistics of the respondents ............................................................................ 41
Table 4.3: Age Statistics of the respondents ................................................................................. 42
Table 4.6: Budgetary process and Financial Performance ............................................................ 45
Table 4. 7: Correlation matrix for budgetary process and financial performance ........................ 48
Table 4. 8: Regression Analysis for the influence of Budgetary process and financial
performance .................................................................................................................................. 48
Table 4. 9: Analysis of Variance Showing the Results on the effect of Budgetary process on
financial performance ................................................................................................................... 49
Table 4.10: Fund Accountability and Financial Performance ...................................................... 51
Table 4. 11: Correlation matrix for fund accountability and financial performance .................... 54
Table 4. 12: Regression Analysis for fund accountability and financial performance ................. 54
Table 4. 13: Analysis of Variance Showing the Results on Fund accountability and financial
performance .................................................................................................................................. 55
Table 4. 14: Variance analysis and Financial Performance .......................................................... 57
Table 4. 15: Descriptive Statistics on Performance ...................................................................... 61
Table 4. 16: Correlation matrix for variance analysis and financial performance ........................ 64
Table 4. 17: Regression Analysis for variance analysis and financial performance .................... 64

x
LIST OF FIGURES
Figure 1: The conceptual framework .............................................................................................. 9

xi
LIST OF ACRONYMS
ACCA Association of the Chartered Certified Accountants
COP Chief of Party
CPAU Certified Public Accountants of Uganda
CVI Content Validity Index
DC District of Colombia
DCOP Deputy Chief of Party
IAS International Accounting Standards
INGOs International Non-Governmental organizations
NGOs Non-Governmental organizations
NPM New Public Management
RAA Reasonableness, Allowableness, and Allocableness
SAPs Structural Adjustment Programs
SAQs Self-Administered Questionnaires
SDS Strengthening Decentralization for Sustainability
US United States
USA United States of America
USAID United States Agency for International Development

xiv
ABSTRACT
The study examined the relationship between budgetary control and financial performance of
International Non-Governmental Organizations in Uganda: A case of Cardno- Strengthening
Decentralisation for Sustainability Programme in Uganda. Specifically, the study objectives were to
examine the effect of budgetary process; fund accountability; and variance analysis on the financial
performance of Cardno SDS Programme. The study was a descriptive cross sectional survey design
that adopted both quantitative and qualitative approaches. Questionnaires and Interview guides
were used to observe the targeted 70 respondents out of which 60 actually of the respondents
participated in the surve whereas Qualitative data was analysed using regression analysis and
correlation coefficients, the qualitative analysis was done using content and thematic analysis. The
results indicated that all the three dimensions including budgetary process; fund accountability; and
Variance analysis positively affected the financial performance of International NGOs in Uganda. It
was concluded that: budgetary control positively influences financial performance in Cardno-
Strengthening Decentralisation for Sustainability Programme in Uganda. It was recommended that
all departments and stakeholders should be actively involved in the budget formulation,
implementation and execution process. To ensure better financial performance, there is need to
observe proper accountability of funds, and involve all stakeholders in budget preparation.
International organisations should carry out periodical performance evaluation of all departments
and the entire organization to ensure effective attainment of budgetary goals

1
CHAPTER ONE
INTRODUCTION
1.1 Introduction
The study examined the relationship between budgetary control and financial performance of
International Non-Governmental Organizations in Uganda: A case of Cardno- Strengthening
Decentralization for Sustainability Programme in Uganda as an initiative of Cardno Emerging
Markets USA based in Washington DC in America. In this study, budgetary control was
conceived as the independent variable and financial performance as the dependent variable. This
chapter presents the background, problem statement, purpose, objectives, research questions,
research hypothesis, conceptual framework, study significance, justification, scope and
operational definitions.
1.2 Background to the study
1.2.1 Historical perspective
Since the 19th century in Europe, budgeting has been a tool used by organizations to address the
issues of planning and control. By this commentary, budgets guides the institution to its
performance in financial and operational areas since it is related to financial performance. The
use of a budget has helped companies in Europe achieve specific objectives (Jordan, 2003 as
cited in Mulumba, 2009). Relatedly, Ruthrock (2011) noted that NGOs are some of such
businesses whose risk is certain given that they don’t function in isolation their dynamic and
complex operating environment. Given the riskiness of activities, an NGO make risk
management a very significant process and activity right from inception to ensure effective
financial performance (Ruthrock, 2012). For NGOs to attain their goals, decision makers need to

2
first of all identify the risk involved, measure its intensity, assess it, monitor it and then look for
measures on how to control it.
In comparison with NGOs, most of the public sector reform programs that have taken place in
developing countries during the 21st century were introduced as part of the Structural
Adjustment Programs (SAPs) of the World Bank in the 1980s (Mulumba, 2014).
Appleford (2000) stated that an important internal control is the operating and activity budget of
an NGO. This is the Master Budget and should include all monies approved in donor proposals
and all activities planned for in a given period of time (preferably fiscal period of the
organization). The line items in the budget should coincide with chart of accounts line items so
that expenses can easily be tagged to the budget. He noted that, NGOs are generally expected to
produce financial reports to various interested parties including the Board of Directors, the NGO
Board, appointed auditors and donors (Ssengoba, 2014). However, NGOs are increasingly
becoming like businesses, for example, Charities act (2009) in Ireland requires all charities to be
formally registered and in most cases submit annual financial reports to a registrar which is
similar to the requirements of the NGO co-ordination board in Kenya and the NGO Board in
Uganda. From management accounting point of view, NGOs can of course adopt budgetary
control and other performance measures as normally used in a business. According to the
controller’s report (Waidhuba, 2011) on strategic level, budgeting clarifies organization’s
competitive priorities, advantages and strategies for the future. It is also a technique for setting
the institutional priorities by allocating scarce resources to those activities that officials deem to
be the most important and rationing it to those areas deemed less vital (Goldstein, 2005). The
Government of Uganda has adopted setting aside in each financial year a day for the reading of

3
the financial year budget and the budgetary controls are embedded in the Constitution of the
country and the various enactments.
1.2.2 Theoretical perspective
This study was underpinned by the Control Theory in regard to responsibility accounting as
advanced by Hopwood (1976). According to the theory, there are three forms of controls of work
in organizations including; administrative, self and social controls. Administrative controls are
concerned with performance measurement systems and budgetary monitoring system. Whereas
these can be useful, they need to be carefully designed in order to avoid demotivating effects.
Social controls operate through staff sharing common perspectives. Quality circles and team
working are examples of this form of control. Self-control considers individual behavior but this
can be helped by a suitable system of rewards like performance related pay. It is important to
note that these forms of control are interrelated.
Whereas social controls may predominate small organizations where management can interact
with staff on a day to day basis, this may not be the case with large and more complex
organizations having senior management who may need to delegate decision making and
responsibility to semi-autonomous divisions/units (Mulumba, 2014). There however, remains the
need to ensure that these divisions/units are operating in accordance with organizational goals
and hence a range of controls will need to be created. These controls include the budget planning
and monitoring system (Hopwood, 1976). One core element of the management control system
is responsibility accounting which involves the creation of responsibility center’s which enable
accountability for financial outcomes and results to be allocated to individuals throughout the
organization. For each center, the process involves setting a performance target, measuring
performance, comparing performance against the target, analyzing the variances and taking

4
action where significant variances exist between actual and target performance (Hopwood,
1976).
The control theory is relevant for this study on account that, management control system is
concerned with; responsibility accounting in which performance targets and allocation of
responsible persons to given centers are set during the budgetary process, control of the budget
allocation to such responsibility centers and their performance levels rests on the identified
responsible officers. Sharing of common perspectives through teamwork and quality circles as
observed in the social controls enables joint target setting between the supervisors and supervisee
that can be measured through outcomes reflected in form of burn rates and fund accountability
quality. Performance comparison is achieved through monitoring which enables variance
identification and analysis making it easy for significant variances to be identified and corrected
for improvement.
1.2.3 Conceptual perspective
These key concepts in the study were budgetary control and financial performance. Hopwood
(1976) looks at a budget as basically a financial management instrument describing where and
how the organization will spend the money and where the money will come from to pay the
expenses. In that direction, therefore, a budget can been described as quantitative plan for a
defined period of time. It may include planned sales volumes and revenues, resource quantities,
costs and expenses, assets, liabilities and cash flows.
According to Arora (1995), budgetary control is the system of controlling costs through budgets.
It involves comparison of actual performance of the budgeted with the view of ascertaining
whether what was planned agrees with actual performance. If deviations occur reasons for the
differences are ascertained and recommendation for remedial action to match actual performance

5
with plans is done. The basic objectives of budgetary control are planning, coordination and
control. It is difficult to discuss budgeting without mentioning control Arora (1995). In this
study, budgetary control was used to refer to a system in which budgets are used to control costs
through comparison of actual performance against budgeted and ascertaining reasons for
difference so as to take remedial action.
Performance is defined by Cox (2009) as the extent to which employees’ interests and values are
congruent with the company. This implies a situation where employees think of themselves as
belonging to the organization and derive value from their membership. Performance refers to the
output in terms of quantity and quality that helps the organization to realize its set objectives. In
other words performance can be measured by traits, behaviors’ and/or outcomes (Bratton &
Gold, 2003). On the other hand, Sebbowa (2009), refers to financial performance as the ability to
operate efficiently, profitability, survive, grow and react to the environmental opportunities and
threats.
1.2.4 Contextual perspective
Cardno Strengthening Decentralization for Sustainability (SDS) Programme is implemented by
Cardno Emerging Markets USA, Ltd. The Cardno SDS Programme commenced its activities
geared towards improving health and community services among selected Decentralized District
Local Governments in May 2010. It currently operates in 35 districts in the Eastern, Central, and
Western regions of Uganda.
Despite the above approaches, mechanisms and effort deployed by Cardno SDS Programme, its
financial performance is still wanting in terms of reporting, accuracy, income utilization ratio,
and consistency. Internal Audit review report, (February 2014) on grant financial performance in
the sampled 13 out of the 35 supported districts revealed poor financial performance with over

6
UGX 500,000,000 reported as questioned costs. Being a performance based financing grant,
many districts (Over 20) did not qualify for 100% grant disbursement due to insufficient
accountabilities resulting into questioned costs, Grant desk review and validation reports,
(2013/2014). The inadequacy in the performance was attributed to insufficient financial
accountabilities resulting from failure to adhere to approved procedures, legal framework and
lack of budgetary controls to identify and correct major variances
1.3 Statement of the Problem
Budgetary controls are being enhanced by all organizations as strategies intended to facilitate
budget compliance and consequently financial performance (Mulumba, 2014). In the same
pursuit, Cardno SDS Programme has put in place various budgetary control tools in a bid to
support and improve her financial performance in Uganda. This has happened in 35 selected
districts drawn from Eastern, Central, and Western regions of Uganda. Such budgetary control
systems adopted by Cardno SDS include budgetary process, funds accountability and variance
analysis involving all relevant parties, approval of the budgets by Cardno SDS Programme Home
Office, linking of the budgets to quick books accounting package, variance analysis and relaying
of the budget performance to respective departmental heads on periodic basis. The budget
controls have been employed to ensure efficient financial performance
In spite of the commitment to the above budgetary control framework, the organization has so far
experienced marginal success in terms of financial performance. The Grant desk review and
validation reports (2013/2014) for example, revealed inadequacies in the financial performance
of the grants with over 57% of the districts failing to obtain 100% grant disbursement due to
questioned costs. Similarly, the Internal Audit review report, (2014, February) on grant financial

7
performance in the sampled 37% of the supported districts revealed poor financial performance
with over UGX 500,000,000 reported as unaccounted for. This inadequacy in the financial
performance has persistently continued and is attributed to poor financial accountabilities
resulting from failure to adhere to approved procedures, approved framework and lack of
emphasis on budgetary controls to promptly identify and correct major variances.
The inadequacy in financial performance has been attributed to the poor financial performance
which if unchecked will result into; mismanagement of funds, loss of funding, eventual collapse
of the program and failure to deliver relevant services to the intended beneficiaries. The study
therefore, investigated the relationship between budgetary control and financial performance of
International Non-Governmental Organizations in Uganda: A case of Cardno- Strengthening
Decentralization for Sustainability Programme in Uganda.
1.4 Purpose of the study
The purpose of the study was to analyze the relationship between budgetary control and financial
performance of International Non-Governmental Organizations in Uganda: A case of Cardno-
Strengthening Decentralization for Sustainability Programme in Uganda as.
1.5 Objectives of the study
i. To examine the effect of budgetary process on financial performance of Cardno SDS
Programme in Uganda.
ii. To examine the effect of fund accountability on the financial performance of Cardno SDS
Programme in Uganda.
8
iii. To assess the effect of variance analysis on the financial performance of Cardno SDS
Programme in Uganda.
1.6 Research questions
i. How does budgetary process affect financial performance at Cardno SDS Programme in
Uganda?
ii. What is the effect of fund accountability on financial performance at Cardno SDS
Programme in Uganda?
iii. To what extent does variance analysis affect financial performance at Cardno SDS
Programme in Uganda?
1.7 Research hypotheses
i. Budgetary process positively affects financial performance of International NGOs in
Uganda.
ii. Fund accountability positively affects financial performance of International NGOs in
Uganda.
iii. Variance analysis positively affects financial performance of International NGOs in
Uganda.

9
1.8 The Conceptual framework
Figure 1.1: The conceptual framework
Source: Adapted and modified from Hopwood (1976)
Figure 1.1 demonstrates the relationship between budgetary control and financial performance.
Budgetary Process was measured in terms of budgetary standards, budgetary control evaluation.
Fund accountability was measured in terms of financial accountability and financial audits.
Variance analysis was looked at in terms of budgetary reporting and budgetary monitoring.
Financial compliance
Reporting
Consistency
Reliability
Timeliness
Accuracy
Ratio Analysis
Current ratio
Income utilization ratio
Compliance with
standards and Accuracy
Financial Performance
Budgetary Process
Budgetary Standards
Budgetary Control Evaluation
Budgetary standards
Budgetary control evaluation
Fund Accountability
Financial Accountability
Financial Audits
Financial accountability
Financial Audits
Variance Analysis
Budgetary reporting
Budgetary monitoring
Budgetary reporting
Budgetary monitoring
Budgetary Controls
Independent Variable Dependent Variable

10
Financial performance was measured in terms of financial compliance, reliability and ratio
analysis.
1.9 Significance of the study
The findings of the study may be useful to a variety of stakeholders in Uganda:
The study findings may be used by Government of Uganda to set and define priorities in
budgeting and also determine mitigation measures to budgetary challenges. To that extent, this
study was critical and timely considering public outcry on delays in implementation of budgets.
The study findings may also guide NGO policy on budgeting and all stakeholders managing
budgets in general to design robust mechanism for proper budgeting.
Furthermore the study findings may contribute to the existing body of knowledge on budgetary
control and financial performance. Accordingly, the study findings may inform future research
by providing a foundation to indicate areas of further research to subsequent scholars in the field
of contractor selection and monitoring
1.10 Justification of the study
Most NGO’s implement their activities using donor funds or grants usually obligated annually
based on approved budgets and work plans. The challenge often is the associated lack of or
weakness in budgetary controls resulting into inadequacy in accountability and eventual poor
financial performance.
This situation may be improved through provision of necessary capacity building to those
involved in financial management and systems strengthening of financial management
mechanism.

11
This study would help identify gaps in the financial management capacity and the systems in
place which if closed can improve financial performance. Such gaps could be bridged through
personnel training and development using customized in-house trainings and workshops geared
towards professional and performance improvement workshops. The availability of providers for
such services including; Inside NGO, ACCA, CPAU and inspirational speakers can be to the
advantage of the organizations deserving the service.
1.11 Scope of the study
1.11.1 Geographical Scope
The study was conducted at Cardno SDS Programme, Kampala Office. This geographical
coverage was preferred because it enabled the assessment of budgetary control and its impact on
the financial performance in the entire program given that it was centrally managed at the
Kampala Office.
1.11.2 Time Scope
The study focused on the period 2012 to June 2016. This period was preferred because it’s when
Cardno SDS Programme consistently experienced challenges in its financial performance
(Cardno SDS, 2016).
1.11.3 Content Scope
This study was limited to Budgetary control’s attributes relating to the dimensions of; budget
process, accountability and variance analysis while financial performance attributes was limited
to dimensions relating to; report’s reliability, promptness and dependence. The study was
conducted on a sampled population of 40 Cardno SDS Programme’s employees.

12
1.12 Operational definitions
Budgetary control: Refers to a system in which budgets are used to control costs through
comparison of actual performance against budgeted and ascertaining reasons for difference so as
to take remedial action. Budgetary control was operationalized to mean budgetary process, fund
accountability, and variance analysis.
Budget process: a systematic and continuous process in which performance targets are
established, budgetary policies are communicated in detail while actual revenues and
expenditures is constantly monitored. Budgetary Process was operationalized to mean budgetary
standards, budgetary control evaluation.
Fund accountability: Is the provision of a report on how funds entrusted to a given party were
deployed while considering timeliness, understandability, reliability and relevance of the
financial information provided. Fund accountability was operationalized to mean financial
accountability and financial audits.
Variance analysis: Is the mechanism that employs both feedback and feed forward monitoring
controls on actual and expected outputs to correct loopholes in the performance process.
Variance analysis was operationalized to mean budgetary reporting and budgetary monitoring.
Financial performance: Refers to the process of assessing financial progress right from the
initial budgeting stage up to the financial reporting stage. Financial performance was
operationalized to mean financial compliance, reliability and ratio analysis.

13
CHAPTER TWO
LITERATURE REVIEW
2.1 Introduction
The study investigated the effect of budgetary control on the financial performance of
international non-governmental organizations in Uganda taking a case of Cardno SDS
Programme. In this chapter, theoretical and related literature by different Authors was reviewed.
The review focused on the literature relating to budgetary control, how it relates, influences or
affects financial performance.
2.2 Theoretical literature review
As earlier indicated, this study was guided by the control theory of Hopwood, (1976). As a
response to the criticisms leveled against classical theory, non-accounting-based approaches to
study management control began to emerge. It seemed that the overreliance on accounting
controls triggered management control researchers to broaden the scope of their research by
encompassing interdisciplinary and multidisciplinary perspectives such as anthropology, social
theory, organization theory, and development economics.
Hopwood (1974) pioneered the non-classical or modern tradition calling for different approaches
to study management control issues other than the accounting approach that had the
underpinning of the systems theory approach. He emphasized the social and self-control aspects
of management control. In doing so, Hopwood provided a link between the classical theory and
the sociological and psychological ideas in the organization theory literature more generally
Berry et al., (2005).
Hopwood (1976) identified three forms of control of work in organizations as indicated below;

14
Administrative controls: These controls include performance measurement systems and the
budget monitoring system form part of these. Whereas these can be useful, they need to be
carefully designed in order to avoid demotivating effects.
Social controls operate through staff sharing common perspectives. Quality circles and team
working are examples of this form of control. Self-control is down to individual behavior but can
be helped by a suitable system of rewards including performance related pay. It is important to
note that these forms of control are interrelated. Social controls may predominate in a small
organization where management can interact with staff on a day to day basis. However, in larger
and more complex organizations, senior management needs to delegate decision making and
responsibility thus semi-autonomous divisions/units may be created. There however, remains the
need to ensure that these divisions/units are operating in accordance with organizational goals
and hence a range of controls will need to be created. These controls will include the budget
planning and monitoring system (Hopwood, 1976).
One core element of the management control system is responsibility accounting which involves
the creation of responsibility centers which enable accountability for financial outcomes and
results to be allocated to individuals throughout the organization. For each center the process
involves setting a performance target, measuring performance, comparing performance against
the target, analyzing the variances and taking action where significant variances exist between
actual and target performance (Hopwood, 1976).
Following Hopwood, Etzioni, (1960) and Ouchi, (1979) further contributed toward this end by
introducing management control concepts based on social and psychological aspects of
employee behavior. With the advent of the social perspective into the management control
literature, the deficiency of the accounting-based approach became more prominent. It was

15
argued that the management control literature did not include much broader and appropriate
theoretical and methodological insights (Chua, 1986; Chua et al.,(1989; Cowton, & Dopson,
2002; Hopper et al., 2009; Whitley, 1999).
These scholars argued that management control represented the surface-level manifestations of
much deeper issues rooted in the social, cultural, historical, and anthropological aspects of
organizations and that to have a comprehensive understanding of the way in which management
controls operate, these variables needed to be included in research frameworks. Given this
argument, the inadequacy of the classical theory has become much prominent. Firstly,
perspectives such as power, conflicts, and social and organizational anthropology require
theoretical models different to the cybernetic model. As explained earlier, it is clear that systems
theory and cybernetics clearly demarcated the boundary of the organization’s internal operations
and the external environment. Management control research using systems and cybernetics
approaches treated deeper social and cultural issues as contingency variables that belonged to the
external environment. This led to the preclusion of these variables from management control
studies.
The contingency research approach (based on contingency theory) that emerged with the open
system theory approach and that dominated the management control research until recently
appeared to have loosely considered the deep-rooted cultural, social, political, and
anthropological contextual factors affecting management controls of non-Western nations
(Efferin & Hopper, 2007; Hewege, 2011; Hopper et al., 2009). Control is a system or process
consisting of comparisons between standard and actual performances, with the comparisons
serving as a basis for determining the proper responses to actual operating results. If control is

16
viewed from the stand point of its direct relationship to planning, then it becomes
complementary to planning (Simiyu, 1979).
2.3 Related literature review
The detailed review of related literature critically evaluate the relationship and how budgetary
control associate with financial performance.
2.3.1 Budgetary process and financial performance
The main purpose of budgeting is to aid planning; coordinate activities; communicate plans to
various responsible managers; motivate employees; control activities by comparing actual with
budgets; evaluate performance; and express conformity with social norms (Anthony &
Govindarajan, 2011; Luft & Shields, 2013). Based on the above listed objectives for budgeting,
Uddin (2015) concluded that budgets have an important role in a management control system of
both public and private sector organizations. The two components of budget are the revenue side
that shows the source of funds, and the expenditure side that shows how the money raised will be
spent (Lucy, 2012). Accordingly, there are two types of budget including the recurrent budget
that focuses on general spending policies; and the development or capital budget that focuses on
long-term projects or investments. Conceptually, a budget is the principal mechanism through
which the policy intentions of any organization are translated into concrete actions and results on
the ground. The budget is an important policy document through which governments establish
their economic and social priorities and set the direction of the economy. However, it is not
clear whether when citizen are involved in the process of budgeting, chances of achieving
desired budgeting objectives are enhanced in a decentralized local government system in a
developing country. For purposes of this study budgeting was looked at in terms of formulation,
implementation and reporting.

17
According to Maxi (2009) in his study on budgeting formulation carried out in Brazil notes that
most but not all governments prepare and issue their annual financial budgets as public
documents or make them publically available. The three main stages in the budgetary process
which may be conducted on a cash or accrual basis at each of the levels of government (local,
state and national) happens: During the formulation stage, initial budget are developed and
submitted to the legislature for consideration. Spending authority is granted by legislative bodies
based on the political priorities and fiscal policies of government (Adhola, 2011). These budgets
reflect the financial characteristics of the government’s plan for the forth coming period and are
used to analyze the potential consequences of these plans on the economy; Adherence of these
fiscal policies is accomplished during the execution stage; and Ex-ante public reporting of the
initial budgets and forecasts budgetary data (important for transparency) permits the government
to identify its financial intentions. However the author ignores the key elements of budget
formulation like consultation, participation and prioritization.
The study of Silva and Jayamaha, (2012), sought to evaluate budgetary process of apparel
industry in Sri Lanka and see whether budgetary process had significant impact on financial
reporting performance of such industry. The budgetary process of apparel industry was assessed
by using variables such as planning, coordination, control, communication and evaluation. The
performance of apparel industry in Sri Lanka was examined by using Return on Assets. Based on
the data extracted from apparel industry’s financial statements, correlation coefficients and
regression analysis showed that budgetary process have significant associations with the
organizational performance of apparel industry in Sri Lanka. This confirms that efficient apparel
companies maintain sound budgetary process which contributes to higher levels of
organizational financial reporting performance hence a positive relationship.

18
Prior studies on the relationship between budget control and performance have obtained mixed
results. Most studies have found a clearly positive relationship between budget participation and
performance. Some have found a negative relationship while others have not found any
relationship at all. Stedry (2000) and Charrington (2009) found that a participative budgeting
approach has a negative impact on performance. They have in general explained this with the
fact that the budgetee (stakeholder) exploits budget participation to create “budget slacks”. The
reason for this is that according to them, there is a conflict between the organization’s and
individual goals (Cyert & March 2002). Stedry (2000) showed theoretically that the budgetee
tries to lower the budget objective levels to their aspiration levels through budget formulation
during the planning phase. The above study was qualitative compared to the current study that
used mixed methodological approaches.
According to Phyrr (1970), inadequate budgetary controls lead to objectives not being clear and
performance not being achieved or satisfactory. This reduces output because employees do not
know or are doubtful about what to do, when and how to do it. They spend a lot of time seeking
clarifications from executives, thus leading to delays in identification of deviations from plans,
which lead to failure in goal achievement and hence poor performance (Phyrr, 1970).
2.3.2 Fund accountability and financial performance.
According to Hegarty (1997), financial accountability refers to the requirement for one party to
report on the deployment of funds entrusted to that party through independent and professionally
audited financial statements. The financial statement supporting documentation is often tagged to
the approved budget to assess whether the payments were supported by approved budgets. The
financial performance is thus measured by the degree to which activities have been transacted
within the planned periods, approved limits and authorized budget line items.

19
Whereas Hegarty (1997) emphasizes that financial accountability is an indispensable
management device in providing essential information for effective monitoring and controlling
of resources. It is worth noting that it focuses on initial amounts released for specified anticipated
activities. It is therefore necessary to confirm whether such funds were actually spent on the
same activities or not, if spent, how much was it? What is the balance? (If any) and where is it?
Were the funds deployed as scheduled? If not why?
He also added that accounting statement are authoritative statements on how particular type of
transactions and other events should be reflected in financial statements. Accordingly,
compliance with accounting standards will normally be necessary for financial statements to give
a true and fair view. In May 1996, the council of IFAC approved a project to design and produce
a set of authoritative statements on financial reporting with a view of equating them to
International Accounting Standards. This was aimed at achieving timely financial reporting.
However, these have adversely been affected by weak enabling environment in developing
countries.
Przeworski and Manin (2009) argue that a quality strategic vision and plan should be:
a) responsive to how residents/communities see things- the city vision
b) be strategic in intent- i.e. long-term, futuristic, visionary, compelling, understandable, and
memorable
c) reflect strategic choices that have been made
d) be simple, not obscure or complex
e) lay a critical path and costed sequence of actions
f) have clear links to the organizations own process of delivery of services;

20
g) have accountability and commitment, with work plans that are open to monitoring and
evaluation.
However the above author’s thoughts have greatly influenced the current planning and
budgeting approaches in developing countries such as Uganda.
In the views of Strom (2000) the linkage between the visions, the plan, the budgets and the
delivery of services are still very weak. In addition, monitoring and accountability have
continuously been reported as inadequate . These inadequacies lead to ineffective urban services.
However in relation to Uganda, financial accountability remains wanting as most of the funds in
institutions are misappropriated.
Aucoin and Heintzman (2000) suggests that for the public sector budgeting system to be
effective, it should possess qualities such as accountability and transparency, timeliness and
responsiveness comprehensiveness honesty and others. The budget is a legal requirement and is
the ultimate statement of government priorities. It is one of the most powerful instruments of
public expenditure management (PEM) that directly affect the nature, level and the effectiveness
of the public services. However the researcher is cognizant of the fact that budgets are not
merely matters of arithmetic but are important tools when it comes to financial accountability.
It has been strongly argued that the desired objectives of budgets under a government are:
efficient allocation of resources via responsive and accountable governments; and equitable
provision of services to the citizens in different jurisdictions and promotion of economic growth
for example (Bergman & Damgaard, 2000). These arguments are only plausible if setting the

21
budget objectives help address four crucial questions: a) is there clear identification and ranking
of goals; b) can progress towards goals be objectively assessed.
However, very often there are no explicit goals or objectives embodied in policy decision to
spend public money. And even when the objectives are set, they are so hazily stated that the
good performance and the bad performance are difficult to judge.
Accountability has traditionally been viewed from the stand point of the suppliers of services.
Accountability means being able to provide an explanation or justification, and accept
responsibility for events or transactions and one’s own actions in relation to these events or
transactions (Kikonyogo, 2000). According to Fulton Committee (2008), accountable
management means holding individuals and units that are responsible for performances.
However, the Fulton Committee (2008) does not mention the fact that these institutions
achievements depend upon the identification and or establishment of accountable units within
organization departmental units. This is where output can be measured against costs or other
criteria and where individuals can be held personally responsible for their performance. This is a
view of public accountability through hierarchical control.
Another approach to accountability aims at testing the feasibility of “exit” and “voice” in dealing
with the services that are provided by the donors. In a free market, an individual has the right to
exercise his preference for one product over another, or articulate his preferences. This is done, so that
the provider of the product can moderate or adjust it so as to conform to the consumer's preferences
(Lwanga, 2000). In this approach, it is argued that a citizen should have an opportunity to express
his/her view either through “exit" or through his "voice".

22
Accountability in using public funds is a concept that has received a good deal of attention over the
past years (Premchand, 2003). It is now universally recognized as one of the mean for ensuring
proper and effective use of public funds. It is also used in the optimization c resources, especially in
the context of the expansion of (he activities of the State into social and economic sectors, require
the presence of a Supreme Audit Institution (Premchand, 2003). The need for the audit function in
advancing public funds management and accountability has gained recognition in many developing
countries. This came as a result of increasing volume of transactions among countries. The resources
of these countries in relation to their pressing need are severely limited and thus the need to use these
resources more effectively (Saito, 2009).
However, the fact is that these countries want to develop fast and catch up with the developed
countries. The impatience for quick growth has often led to hasty decision making and consequent
deficiencies in the planning, organization and execution of programs. Hence, the need for greater
vigil on the part of the audit functions. Although the need for ensuring accountability is universally
recognized, its application in modern state often creates confusion and conflict amongst academics,
professionals, public servants, ministers, politicians and the public ((Premchand, 2003). The
process of planning for development increases the amplitude of public finances and public
expenditure programmes.
2.3.3 Variance analysis and financial performance
Budgetary practices being a standard for performance are used to evaluate managerial
performance Srinivasan, (1987). Similarly, Douglas, (1994) used a case study approach and
found that budgeting practices place high importance on budget-to-actual comparison for
performance evaluation purposes both at corporate and subsidiary levels.

23
Anderson (1993) also supported this view stating that in most US companies, the development of
Budget is still used as the main performance measurement system and that consistency in the
reports produced is vital in identifying variance. Budgetary standards and targets tend to be the
criteria upon which the performance of organizations is evaluated. These standards and targets
provide a basis for identifying and appraising selected aspects of organizational performance,
since they are the criteria used to guide and motivate it. Carolyn, et al. (2007) examined the
association between effects of budgetary control on performance, using a sample of large U.S.
cities over 2003-2004 timeframe. Within this context they examined whether the tightness of
budgetary controls or effective level of budgetary control within the cities as measured by budget
variance contribute to performance as measured by bond rating and found that effective level of
budgetary control is significantly and positively related to bond rating.
Budgetary control is the system of controlling costs through budgets. It involves comparison of
actual performance with the budgeted with the view of ascertaining whether what was planned
agrees with actual performance. If deviations occur reasons for the difference are ascertained and
recommendation of remedial action to match actual performance with plans is done. The basic
objectives of budgetary control are planning, coordination and control. It’s difficult to discuss
one without mentioning the other Arora, (1995).
In contrast, Merchant and Brownell (2002) found a positive relationship between budget
formulation and performance. The most recent literature, however, appear to advocate for a
participative approach as it can be more effective and people may be inclined to attempt achieve
budgetary goals if they have been consulted in the budget setting exercise (Hilton, 2000).

24
The authors however notes that certain precautionary measures such as providing incentives for
accurate budget projections are necessary if participative budgeting is to be effective but he is
silent on the issue of prioritization yet prioritization goes hand in hand with formulation.
Much as those measures can be taken, it can only be done in the initial stages but if done at a
later stage then the whole process loses meaning. In addition to Hilton (2000) views, the
researcher intends to stress that for such precautionary measures to work successfully,
communities and the local councils as the prime beneficiaries should work together with Donors
and the private sector to contribute to the development of common visions and strategies to
fulfill their objectives. The partnership arising out of this collaboration will lead to a clear
understanding and appreciation of each other’s contribution and therefore harmony in planning
and implementation of development activities.
Budgeting allows managers to focus on exploiting opportunities instead of figuratively speaking.
In this way, the system provides sustainability to business process within the enterprise. It is a
process of the utmost importance to management (Horngran, 2011). Viscione (2014) lists
objectives, which build a budgeting system as follows: “Set acceptable target for revenue and
expenses. Increase the likelihood that targets will be reached, provide time and opportunity to
formulate and evaluate opinions should obstacle arise”. According to (Martiz, 2015), the most
important reason for budgeting in any organization is to ensure that organization knows how
much money it needs, how to get the money it needs and then how to use the money.

25
Coombs (2002) also outlines the objectives of budget preparation in public enterprises as; to
establish the required income level, authorization of expenditure s, and control of expenditure to
ensure total expenditures does not exceed the budgeted during service delivery. However it is
worth noting that budgetary allocations might not always be sufficiently estimated. This can
happen when adequate funding for predictable or reoccurring expenses is not included in the
budget. This might require the budget to be modified after adoption to account for the shortfall.
Typical corrections will include transferring funds from other allocation categories or from the
organization's surplus, sometimes referred to as savings. Just as budgetary allocation estimates
can be insufficient, revenues can be underestimated hence significantly affecting service delivery
in local governments of Uganda. This can happen if a downturn in the economy occurs after a
budget is adopted, thus harming revenue streams. Insufficient revenues might require the need to
reduce budgetary allocations in order for expenditures not to exceed revenues at the end of the
budget year (Martiz, 2015).
The scholar further argues that budgetary allocations should be routinely monitored to ensure the
amounts budgeted are sufficient to meet expenditures. It is important to have a tracking system in
place for all purchase orders and bills. The purchase orders and bills should be matched regularly
against the budgetary allocation to ensure sufficient funds exist for the remainder of the budget
year
According to Terry (2003) budgeting is known as responsibility accounting. This means that
plans and resulting information on performance plan is expressed in terms of human
responsibilities because it is people that control operations not reports. The process of budgeting
makes it necessary for the organization to be organized into responsibility with clear statements
of the responsibilities of each manager who has a budget. The adoption of a budget authorizes

26
the plans contained within it. This process enables management by exception to be practiced.
This is where a subordinate is given a clearly defined role with the requisite authority and
resources to carry out that part of the overall plan assigned to him and if activities do not proceed
as planned, the variations are reported to higher authority.
A manager’s performance is often judged partly by his ability to meet budgets. When
considering a manager for promotion or salary increase or recognition, a manager‘s budget
record and his ability to meet the targets incorporated in budgets is often an important factor.
Budgets used as a target can assist the manager in monitoring his own performance. The
knowledge that a budget will be used for performance evaluation causes changes in the
manager’s attitude to the whole budget process. The reward system of an organization is often
liked to achievement of certain levels of performance frequently measured in accounting terms
(Terry, 2003).
Other researchers explain the positive effects of budgetary implementation on performance
through an information theoretical perspective. Because budgetary implementation gives the
stakeholders a high extent of feedback information, performance is also increased (Becker and
Green 2002).
Some authors ignore the fact that budget implementation’s relationship with financial
performance cannot be studied in isolation of feedback. Much as Samuelson (2001) observed
that budget coordination affects the efficiency of the six levels of decision making under an
organizational decision making process, he ignored feedback as an important element of budget

27
implementation. The six levels of decision making under organizational decision making process
emphasize objective- planning, decision-making, realization and follow-up.
2.4 Summary of Literature Review
The review of literature revealed a number of argument with some author’s views concurring
while others disagreed. There were authors who totally had independent perspectives. The
researcher pointed out his stand as pertains the different discussion on the subject and drew
conclusions.
Budgetary process: inadequate budgetary controls lead to unclear objectives thus failure to
achieve satisfactory performance. The authors noted that employees are not sure of what to do,
when and how to do it. Much time is spent seeking clarifications from executives leading to
delays in identification of deviations from plans and eventual failure in goal achievement hence
poor performance.
Fund accountability: However, a number of gaps have been identified as per the literature
reviewed which this study will bridge. Authors like Klein (2015) focus on specific field yet this
study will take a general focus. Most studies above used smaller samples, most of them adopted
secondary data and in contrast the study will use a big sample size and on the other hand adopt
both secondary and primary data. The dimension of fund accountability is discussed by most
authors but most of them are silent on the element of fund accountability and how it relates to
budgeting.

28
Variance analysis: Variance analysis as a variable is discussed by most authors without relating it
to financial performance which is the central dimension of the study. Most of the studies on the
subject above are based on developed countries with a well-developed budgetary systems. Most
studies were qualitative and do not guide us on the relationship between the study variables. In
bridging the gap, this study will test the hypotheses of the study basing on bivariate means that is
Pearson correlation coefficient. Considering the above, the conclusions and recommendations of
the study will take a wider perspective looking at budgetary control not as a general point but
focusing specifically on the key the indicators as laid down in the conceptual framework.

29
CHAPTER THREE
METHODOLOGY
3.1 Introduction
The study investigated the effect of budgetary control on the financial performance of
international non-governmental organizations in Uganda taking a case of Cardno SDS
Programme This Chapter presents the methods used to carry out the study. The chapter includes
the study design, population of the study, determination of the sample size, sampling techniques
and procedure, data collection methods, data collection instruments, data validity and reliability,
data collection procedures, data analysis and measurement of variables.
3.2 Study design
A cross sectional survey design was adopted for this study. Using a cross sectional survey, data
is collected from a cross section of respondents at a single point in time (Ezeani, 2005). Across
sectional survey is less time consuming and easy to apply (Kothari, 2004). The study applied
both quantitative and qualitative approaches. Creswell (2009) noted that quantitative methods
are more objective and help to investigate the relationships between the identified variables. This
study also applied qualitative approaches which involved in depths probe and application of
subjectively interpreted data. Qualitative researchers aim to gather an in-depth understanding of
human behavior and the reasons that govern such behavior (Babbie, 2013). Quantitative
approaches were adopted in sampling, collection of data, data quality control and in data
analysis.
.

30
3.3 Study population
The study population was Cardno SDS NGO Head Office with 75 staff from which a sample of
60 was selected for the study. Cardno SDS Programme comprises; 5 Senior Management Team
(SMT) members, with departmental employee distribution as follows:
Grants – 8, Monitoring and Evaluation (M&E) – 12, Human Resource for Health (HRH) – 3,
Education – 2, Finance and Operations – 13 and Coordination 48 other employees.
3.4 Determination of sample size
The sample size was determined using a statistical tables developed by Morgan and Krejcie
(1970), cited from Amin (2005). A sample of 60 respondents was thus selected from the total
population of 44 employees. The table 2 below provides the breakdown of the departmental
categorization, respective access population, sample size and sampling technique used.

31
Table 3.1: Study Population, sample size and sampling techniques
Category
Accessible
Population Sample size Sampling Technique
1 Senior Management Team 5 5 Simple random sampling
2 Grants team 8 8 Simple random sampling
3 M&E team 4 4 Purposive
4 HRH team 3 3 Purposive
5 Coordination 1 1 Purposive
6 Education 2 2 Purposive
7 Finance & Operations 14 14 Simple random sampling
9 M&E Interns 23 21 Simple random sampling
Total 75 60
Source: Cardno SDS Programme Organizational Chart (2014/2015)
3.5 Sampling techniques and procedures
The sampling techniques for the study as indicated in Table 3.4.1 above include: simple random
sampling preferred because it eliminates bias and allows equal opportunity for each member in
the population to be selected Amin, (2005); Bakkabulindi, (2008). It involved writing given
“category names” on equal size papers, folding them up uniformly, mixing thoroughly and
randomly pick until the required sample size was reached. Purposeful sampling was adopted to
enable selection of staff with relevant information for the study. It was preferred due to its ease
of triangulation and flexibility while meeting multiple interests and needs Patton, (1990).

32
3.6 Data collection methods
Primary data (original) was collected using; questionnaire survey method, Interview and
observation. Secondary data from available literature was collected through documentary review
method.
3.6.1 Questionnaire Survey Method
The Questionnaires survey method involved generating structured questions to be filled by
selected respondents (Staff). It was suitable for respondents on account of their knowledge and
understanding Saunders et al, (2003). This method was preferred because the employees could
read, analyse, write and also spare time to fill the questionnaires. It is cost effective with a large
coverage of respondents in a relatively short time. It generates reliable data since respondents
answer the questions in their own mood without being affected by the researcher’s presence
Mbaga, (1990), Mugenda and Mugenda (1999). It also guarantees respondent’s confidence,
honesty and objectivity due to anonymity and no interviewer’s bias.
3.6.2 Interview Method
Interview is a verbal conversation between two people with the objective of collecting relevant
information for the purpose of research. It is useful in getting the story behind participant’s
experience, helps interviewer in-depth information around the topic and can be used as a follow
up to certain respondents McNamara, (1999). Interviews were conducted by the researcher
asking oral questions while a selected respondent or group of respondents answered. According
to Amin (2005) this method is appropriate for collecting data from a small number of
respondents and provides immediate feedback while allowing adequate probing. The interviews
were administered on selected Senior Management Team (SMT) members and supervisors to

33
obtain qualitative data as reinforcement to quantitatively generated data. The method employed
appropriate approaches such as; face-to-face, e-mail, Skype and telephone interviews based on
convenience. This method was preferred due to its perceived cost effectiveness, ability to get
respondents personal feelings captured through given expressions and statements. The method
enabled in-depth investigation, repetition and clarification of unclear questions.
3.6.3 Documentary review method
This method involved review of available literature from different sources such as;
organizational records, Industry analysis, financial text books, magazines, journals, articles,
internet websites, dissertations and newspapers to enable collection of relevant data Sekaran,
(2003). This method was preferred to others because it is saves time and money and it helped to
validate data collected using other methods (Sekaran, 2003). In addition, the study also captured
documents of the internet. The review enhanced the quality and reliability of the study findings
by capturing reported facts, practices, gaps and contrasts.
3.7 Data collection instrument
3.7.1 Self-administered Questionnaires (SAQs)
The Questionnaire survey method used Self-administered questionnaires (SAQs) as
recommended by Amin (2005). SAQs comprised closed ended questions that require the
respondent to indicate his/her level of acceptance, non-acceptance or uncertainty. The instrument
sought information relating to the attributes of budgetary control and financial performance
dimensions. The respondents were requested to provide a brief summary of their views in
support of the responses made. Respondents were also requested to describe themselves by
providing information as indicated in the personal data section. This instrument was designed

34
and pre-tested before it was finally administered to sampled respondents who filled and the
completed SAQs were immediately collected by the researcher.
3.7.2 Interview guide
The Interview method used Interview guide as recommended by Amin (2005). The guide was in
a form of a checklist that outlined areas of concern to which respondents responses were sought.
For closed ended questions, the Interviewer ticked under Yes column to indicate agreement with
what was wanted and under No column to indicate non-agreement. For open ended questions, the
interviewer made the necessary summary notes to the responses. Each interview area was
allocated specific time so that the interview is conducted within the proposed timeframe.
3.7.3 Documentary review guide
The documentary review method used documentary review guide as recommended by Sekaran
(2003). The researcher prepared a documentary review checklist of existing sources of data and
information that were in line with the study interest the guide indicated the relevant documents to
be reviewed within the content scope of the study. These included; financial policy documents,
organizational periodic newsletters, financial and activity reports.
3.8 Validity and reliability
3.8.1 Validity
Validity refers to the ability of the test instrument to collect justifiable and truthful data. It is
therefore the extent to which the instrument measures what it is intended to measure Amin,
(2004). The validity of the instrument was achieved by computing the Content Validity Index
(CVI). The accepted range of CVI for the instrument to be administered is from 0.7 to 1 Amin,
(2004); Kothari & Palls, (1994). A CVI below 0.7 does not suffice validity of the instrument and

35
is thus not recommended for administration. The instrument’s validity was derived by subjecting
it to critique by experts in the study area, their results of judgment summarized and CVI
computed using the formula:
CVI = Number of valid items in the questionnaire
Total number of items in the questionnaire
The instrument was then administered as the computed CVI was not below 0.7 as given in the
table below
Table 3. 2: Cronbach’s Alpha Coefficient test results
Variables
Content Validity Index Results
Budgeting participation
0.734
Budgetary process 0.886
Fund accountability 0.834
Variance analysis 0.811
Financial performance
0.842
Source: Primary Data (2017)
Based on Cronbach’s Alpha Coefficient, the scales for the variables were reliable. All scales had
a reliability coefficient greater than 0.7. In the case of psychometric tests, all were within the
range of 0.7 and above indicating that the results were valid.

36
3.8.2 Reliability
Reliability is the ability of the test instrument to collect the same data consistently under similar
conditions Amin, (2004); Odiya, (2009). It is thus about accuracy and consistency of the
instrument. The reliability of the instrument was gained through piloting and pre-testing of the
instruments on 5 respondents to get feedback that enabled improvement of the instrument by
incorporating relevant and constructive amendments before administering the instrument. The
reliability of the instrument was computed using the Cronbach’s Alpha Coefficient by applying
the formulae below;
Where k = Number of items in the questionnaire
= Standard deviation squared (variance) for each individual Item
= Variance for the total items in the questionnaire
Table 3.3: Cronbach’s Alpha Coefficient
Variables
Cronbach’s Alpha Coefficient
Budgeting participation
0.801
Budgetary process 0.778
Fund accountability 0.805
Variance analysis 0.784
Financial performance
0.756
Source: Primary Data (2017)

37
Based on Cronbach’s Alpha Coefficient, the scales for the variables were reliable. All scales had
a reliability coefficient greater than 0.7. In the case of psychometric tests, all were within the
range of 0.7 and above indicating that the results were reliable.
3.9 Procedure of data collection
Upon the approval of the research proposal, the researcher obtained, an introductory letter from
UMI and presented it to the management of Cardno SDS in order to get permission to collect
data from all categories of the respondents. The researcher proceeded to distribute questionnaires
to selected respondents for completion and later collected them. The researcher was then also
able to meet with potential and prospective respondents and fix appointments for data collection.
Relevant inquiries, observations and document reviews were conducted while noting key issues.
3.10 Data Analysis.
3.10.1 Quantitative Analysis
The quantitative data was scrutinized for any omissions or inadequate information from the
questionnaires. Statistical Package for Social Scientists (SPSS) was used for analysis to enable
generation of necessary figures, tables, graphs and charts. Descriptive statistics was applied to
summarize, describe and interpret the different phenomenon such as distribution of scores
(Mugenda & Mugenda, 1999). These included frequency tables and measures of central tendency
expressed in terms of Mean, Mode, Median, standard deviation and variance. Spearman’s
Correlation coefficient and regression methods were used to find the relationship between
budgetary control and financial performance.

38
3.10.2 Qualitative Analysis
Thematic analysis was applied to analyze qualitative data from the responses. Thematic analysis
is a process of encoding qualitative information by developing codes, words or phrases that serve
as labels for sections of data (Boyatzis, 1998). It was used to identify, analyze, interpret and
report patterns within the data. It involved getting familiar with the data, generating initial codes,
searching for themes, reviewing themes, defining and naming themes and generating the report.
Data was reviewed, notes made, sorted and classified into themes and categories that were
scrutinized, analyzed, collated and presented in form of paraphrase and where necessary quoted
upon obtaining permission from the respondent. The data was presented in tabular forms, pie
charts and graphs to ease interpretation and gain meaning.
3.11. Measurement of Variables
The variables were quantitatively measured using the 5 point Likert scale indicating different
levels of agreement and disagreement indicated as; strongly agree, agree, not sure, disagree and
strongly disagree as outlined by (Kothari, 2004). The likert scale is convenient in complex
situations where in-depth data about a research problem is difficult to get from respondents.
Equidistant weights ranging from 5–1 were assigned to responses from strongly agree to
strongly disagree respectively to ease quantitative analysis. The respondents’ position in terms
of acceptability, non-acceptability or uncertainty and their magnitude regarding attributes of
budgetary control and financial performance dimensions were then ascertained. The qualitative
variables were measured through personal interpretation and subjective judgment of the meaning
attached to the expressions, statements and non-verbal communication elicited during the study.

39
3.12 Ethical considerations
There are several reasons why it is important to adhere to ethical norms in research. First, norms
promote the aims of research, such as knowledge, truth, and avoidance of error. For example,
prohibitions against fabricating, falsifying, or misrepresenting research data promote the truth
and avoid error. Second, since research often involves a great deal of cooperation and
coordination among many different people in different disciplines and institutions, ethical
standards promote the values that are essential to collaborative work, such as trust,
accountability, mutual respect, and fairness (Amin, 2005). To avoid plagiarism, the work was
subjected to the anti-plagiarism test using the anti-plagiarism software called turn it in of
different authors were acknowledged whenever they are cited.

40
CHAPTER FOUR
PRESENTATION, ANALYSIS AND INTERPRETATION OF RESULTS
4.1 Introduction
The study investigated the effect of budgetary control on the financial performance of
international non-governmental organizations in Uganda taking a case of Cardno SDS
Programme. This chapter presents the findings, analysis and interpretation of the findings on the
effect of budgetary control on the financial performance a case of Cardno SDS Programme.
4.2 Response Rate
The response rate was computed and findings are presented in table 4.1 below
Table 4.1: Response Rate
Instrument Target Response Actual Response Response rate (%)
Questionnaire 70 60 85
Interviews 12 09 75
Total 82 69 84.1
Table 4.1 above presents the response rate from the study. Out of the 70 questionnaires
distributed, only 60 were returned making a response rate of 85%. Out of the 12 respondents
targeted for face to face interviews, 9 were actually carried out implying a response rate of 75%.
The overall response rate for the study was 84.1%. This response rate was deemed adequate
since it was over and above the 50% recommended by Sekaran (2003)
.

41
4.3 Background Characteristics of the Respondents
This section presents findings about the demographic characteristics of respondents. These are
gender, age, education, marital status and working experience. The findings for these background
characteristics of respondents are submitted in the next sub-sections
4.3.1Gender Characteristics of the Respondents
Table 4.2 below presents the findings on the gender characteristics of the respondents
Table 4.2: Gender statistics of the respondents
Gender Frequency Percentage
Female 29 49.2
Male 31 50.8
Total 60 100
Source: Primary Data (2017) N=60
Table 4.2 shows that the majority of the respondents were male (50.8%) and female were
(49.2%). Although the results show some disparities between the male and female respondents,
the study was gender representative since both groups were part of the study.

42
4.3.2 Age of the Respondents
The study looked at the age distribution of the respondents using a frequency distribution. The
results obtained on the item are presented in table 4.3 below
Table 4.3: Age Statistics of the respondents
Age in years Frequency Percentage
20-29 08 12.5
30-39 32 54.2
40-49 15 25
50 and above 05 8.3
Total 60 100
Source: Primary Data (2017) N=60
The age categories of the respondents were studied according to their age groups. This was
important for the study because it was believed that differences in age indicated differences in
opinions. Therefore, establishing different age groups of the people who were involved helped to
provided varied opinions about the study problem. From the above table, the majority of
respondents who took part in the study were between 30-39 years were 54.2% and those who
were between the age of 20-29 were 12.5% and those that were between 40-49 years were 25%
and lastly those that were above 50 years were 8.3%. This shows that the data collected was
representative of all age groups.

43
Table 4.3.3: Distribution of Respondents by Level of Education the Respondents
The table 4.4 Level of education Statistics of the respondents
Highest Level of Education Frequency Percentage
Diploma 23 19.2
Bachelors 76 63.3
Post graduate 21 17.5
Others 00 00
Total 60 100
Source: Primary Data (2017) N=60
The majority of the respondents were first degree holders making a total percentage of 63.3%,
the respondents with post graduate qualifications were 17.5%, and the diploma were 19.2%.
These results indicate that the respondents had reasonably good education qualifications and the
desired skills and knowledge to deliver. Besides, the respondents were deemed to be able to read,
understand the questionnaire and gave appropriate responses.
Table 4.3.4: Distribution of Respondents by Marital of the Respondents
Table 4.5 Marital Statistics of the Respondents
Marital status Frequency Percentage
Single 36 60
Married 19 31.6
Separated 02 2.5
Divorced 02 3.4
Widowed 01 2.5
Total 60 100
Source: Primary Data (2017) N=60

44
The majority of the respondents were single (60%) and the married were 31.6%. This indicated
that the data collected was representative to respondents of different marital status.
4.4 Empirical Results based on Study’s Research Objectives
In this section, the empirical results for each of the specific research objectives is presented,
analysed and interpreted with an overall goal of demonstrating the effect of budgetary process on
financial performance of Cardno SDS Programme.
4.4.1 Budgetary process on financial performance of Cardno SDS Programme
The first objective of the study was intended to demonstrate to the effect of budgetary process on
financial performance of Cardno SDS Programme. While the questionnaire included a list of
items that measured budgetary process whose responses are presented, in-depth interviews and
documentary findings support the empirical findings.
The descriptive results in form of mean scores, standard deviations and percentage distribution of
respondents who agreed to each of the statements in the survey instruments covering budgetary
control as a variable are presented
This sub section is the centrepiece of this work. It presents findings, discusses and critique
existing approaches to the budgetary process. The point of this examination and critique is to
unearth the budgetary process on financial performance. The task of this section is further to dig
more deeply into the implications of the difference between the pursuit of “good” management
and the pursuit of effectiveness of the budgetary process.
Findings to address the budgetary process were obtained using a variety of methods including
survey instrument, interviews and document analysis. The self-administered questionnaire

45
measured laws using eight items on a Likert scale. The eight items measuring the budgetary
process are presented in Table 4.6. The items were scaled using the five-point Likert scale where
code 1 = Strongly Disagree, 2 = Disagree, 3 = Undecided, 4 = Agree and 5 = Strongly Agree.
For each of the above items, descriptive statistics that include frequencies, percentages and
means are presented in Table 4.6.
Table 4.4: Budgetary process and Financial Performance
Items SA A N D SD Mean
I’m involved in the budget setting process 30.8% 51% 1.0% 8.3% 9.1% 3.999
We are sensitized on the budget control
process
5% 11.6
%
- 41.6% 40% 1.968
All the stakeholders to the budget are
involved
16.4% 64% 9.1% 1.6% 8.3% 4.04
All departments are always involved in the
budgeting process
44.3% 45.3
%
00% 8.6% %5.15 2.10
Approved Budgets are shared with all
Departments
17.5% 21.6
%
5.0% 27.5% 28.3% 2.21
Leadership and support is given to all the
Subordinates throughout the budget process
by managers
14.1% 14.1
%
5.0% 38.3% 28.3% 2.01
Each department prepares a budget prior to
the Overall budget
16.4% 64% 9.1% 1.6% 8.3% 4.04
Source: Primary data (2017) N =60
SD = Strongly Disagree, D = Disagree, N = Neutral, SA = Strongly Agree and A = Agree,
F = Frequency, % = Percentage
The details below interrogate the empirical results through advanced statistical tests to
demonstrate the views of the respondents on the relationship budgetary process and financial
performance. The details are supported by interviews results and documentary evidence.

46
As to whether they are involved in the budget setting process, the tabulated responses indicated a
mean of 3.999 above the median score of three. This implied that they are involved in the budget
setting process.
A Respondent noted that “we are invited to give our ideas at the beginning of the budget
exercise which is finally incorporated into the budget”.
As to whether they are sensitized on the budget control process (81.6%) disagreed while 16.6%
agreed with the item implying that they are not sensitized on the budget control process.
As to whether all the stakeholders to the budget are involved, the majority of the respondents
(80.4%) agreed with the statement.
A respondent lamented “most leaders usually make decisions as individuals often leaving out the
vital input of the budget by ignoring the views of the residents yet the residents are motivated
whenever their ideas are embedded in the budget”
When asked whether all departments are always involved in the budgeting process, indicating a
mean of 4.04.
A senior officer noted “it is not always the case that budgeting is a participative process,
theoretically it is but practically it may not be the case”
As to whether they are involved in the budget setting process, the tabulated responses indicated a
mean of 2.10 below the median score of three. This implied that they are not involved in the
budget setting process.
As to whether approved budgets are shared with all departments, the tabulated responses
indicated a mean of 2.21 below the median score of three. This implied that approved budgets
are not shared with all departments.

47
As to whether leadership and support is given to all the subordinates throughout the budget
process by managers, the tabulated responses indicated a mean of 2.01 below the median score
of three. This implied that leadership and support is not given to all the subordinates throughout
the budget process by managers.
Interview findings revealed that leadership and support is not given to all the subordinates
throughout the budget process by managers. This could due to the nature of the structures that
are in place.
As to whether each department prepares a budget prior to the overall budget, the tabulated
responses indicated a mean of 4.04 below the median score of three. This implied that each
department prepares a budget prior to the Overall budget.
4.4.1.1 Hypothesis Testing One:
Hypothesis One Stated that Budgetary process affects financial performance of International
NGOs in Uganda. The hypotheses was tested using Pearson Correlation coefficient and
Regression Analysis
The hypothesis was tested using the Pearson correlation coefficient and the results of the
hypothesis are given Table 4.7 below.

48
Table 4. 5: Correlation matrix for budgetary process and financial performance
Budgetary process Financial Performance
Budgetary
process
Pearson
Correlation 1 .772(**)
Sig. (2-tailed) . .000
N
60 60
Financial
Performance
Pearson
Correlation .772(**) 1
Sig. (2-tailed) .000 .
N 60 60
** Correlation is significant at the 0.01 level (2-tailed).
Source Primary data (2017)
The results show that the correlation coefficient is 0.772(**) and its significance level 0.000.
This implied that budgetary process significantly affects the financial performance of
international organizations. Therefore according to the results there is a positive significant effect
of budgetary process on the financial performance. Therefore the alternative hypothesis that was
earlier postulated is accepted.
Table 4. 6: Regression Analysis for the influence of Budgetary process and financial
performance
Table 4.8 provides the R and R2 value. The R value is 0.772, which represents the simple
correlation and, therefore, indicates a moderate degree of correlation. The R2 value indicates how
Model Summary
.772 a .485 .401 .50252 Model 1
R R Square Adjusted R Square
Std. Error of the Estimate
Predictors: (Constant), budgetary process a.

49
much of the dependent variable the financial performance can be explained by the independent
variable budgetary process. The standard error of the estimate is .50252 and the adjusted R square
value is 0.401. Therefore the adjusted square value of .401 implied that the budgetary process
predicts the financial performance; in other words financial performance is dependent on the
budgetary process by 40.1%
Table 4. 7: Analysis of Variance Showing the Results on the effect of Budgetary process on
financial performance
These are the degrees of freedom associated with the sources of variance. The total variance has
N-1 degrees of freedom. The Regression degrees of freedom correspond to the number of
coefficients estimated minus 1. Including the intercept, there are 5 coefficients, so the model has
5-1=4 degrees of freedom. The Error degree of freedom is the DF total minus the DF mode - 1
=58. Mean Square are the Mean Squares, the Sum of Squares divided by their respective DF.
The F-statistic is the Mean Square (Regression) divided by the Mean Square (Residual)
.239/.247=2.593. The p-value is compared to some alpha level in testing the null hypothesis that
all of the model coefficients are 0.The full model is statistically significant (F = .968, df = 59, 1,
sig. = .327), even though the financial performance was statistically significant (p>.05) by itself.
The value for this table had a total degrees of freedom of 59 because four observation had
missing data and were not included in the analysis. The other degree of freedom corresponds to
ANOVA b
.239 1 .239 .968 .327 a
29.179 58 .247 29.418 59
Regression Residual Total
Model 1
Sum of Squares df Mean Square F Sig.
Predictors: (Constant), budgetary process a.
Dependent Variable: financial performance b.

50
the intercept (constant) of the regression line. F-Statistics is .968, given the strength of the
correlation, our model is statistically significant (p > .0005)
4.4.2 Fund accountability and financial performance
The survey instruments used for the study had a list of 07 items measuring the effect of fund
accountability on the financial performance whose descriptive findings are presented. The
researcher analyzed the questionnaires that were distributed to the respondents and responses
were based on Likert scale ranging from one which represented strongly disagrees to five which
reflected strongly agree. The resulting summary statistics are in Table 4.10 below.

51
Table 4.8: Fund Accountability and Financial Performance
Items SA A N D SD Mean
Financial transactions are recorded
immediately upon occurrence
56.6% 14.1
%
13.3% 15% 11.6% 3.990
Financial transactions are approved before
implementation
20.8% 20.8
%
6.6% 30% 21.6% 2.84
Financial transactions have adequate
supporting documentation
16.6% 16.6
%
- 14.1% 52.5% 1.78
Financial documentation is reviewed for
completeness
21.6% 20% 8.3% 21.6% 28.3% 2.80
Fund accountability reports meet approved
standards
30.8% 37.5
%
4.1% 11.6% 20% 3.88
Fund accountabilities are periodically
audited independently
16.4% 64% 9.1% 1.6% 8.3% 4.04
The Auditors recommendations are
implemented by management
44.3% 45.3
%
00% 8.6% %5.15 3.89
Source: Primary data (2017) N=60
SD = Strongly Disagree, D = Disagree, N = Neutral, SA = Strongly Agree and A = Agree, F =
Frequency, % = Percentage
Below is an interrogation of the empirical results through advanced statistical tests to
demonstrate the views of the respondents on how fund accountability influences financial
performance. The details below are supported by interviews results and documentary evidence.
As to whether financial transactions are recorded immediately upon occurrence, responses
showed that cumulatively the majority percentage (67.2%) of the respondents disagreed while
29.1% agreed and 2.5% were undecided. The mean = 3.990 suggested that most respondents
were in agreement with the item hence suggesting that financial transactions are recorded
immediately upon occurrence.

52
A respondent lamented “Like in any other organisation, that financial transactions are recorded
immediately upon occurrence”.
As to whether financial transactions are approved before implementation, responses showed that
cumulatively the majority percentage (61.6%) of the respondents disagreed while 20.8% agreed
and 20.8% agreed. The mean = 2.84 suggested that most respondents were in disagreement with
the item hence suggesting that financial transactions are not approved before implementation.
Interview findings revealed that financial transactions are approved before implementation like
in any other organisation hence this helps to foster accountability.
As to whether financial transactions have adequate supporting documentation, responses showed
that cumulatively the majority percentage (33.2%) of the respondents agreed while 76.6%
disagreed. The mean = 1.78 suggested that financial transactions have adequate supporting
documentation.
A respondent noted
Not all the time do financial transactions have adequate supporting documentation, this could be
an exception to the rule as some times transactions may arise out of emergence
Survey findings revealed that financial documentation is reviewed for completeness, the mean
of 2.80 indicated that the majority of the respondents disagreed that financial documentation is
reviewed for completeness.
As to whether fund accountability reports meet approved standards, responses showed that
cumulatively the majority percentage (68.3%) of the respondents agreed while 31.7% disagreed.
The mean = 3.88 suggested that fund accountability reports meet approved standards.
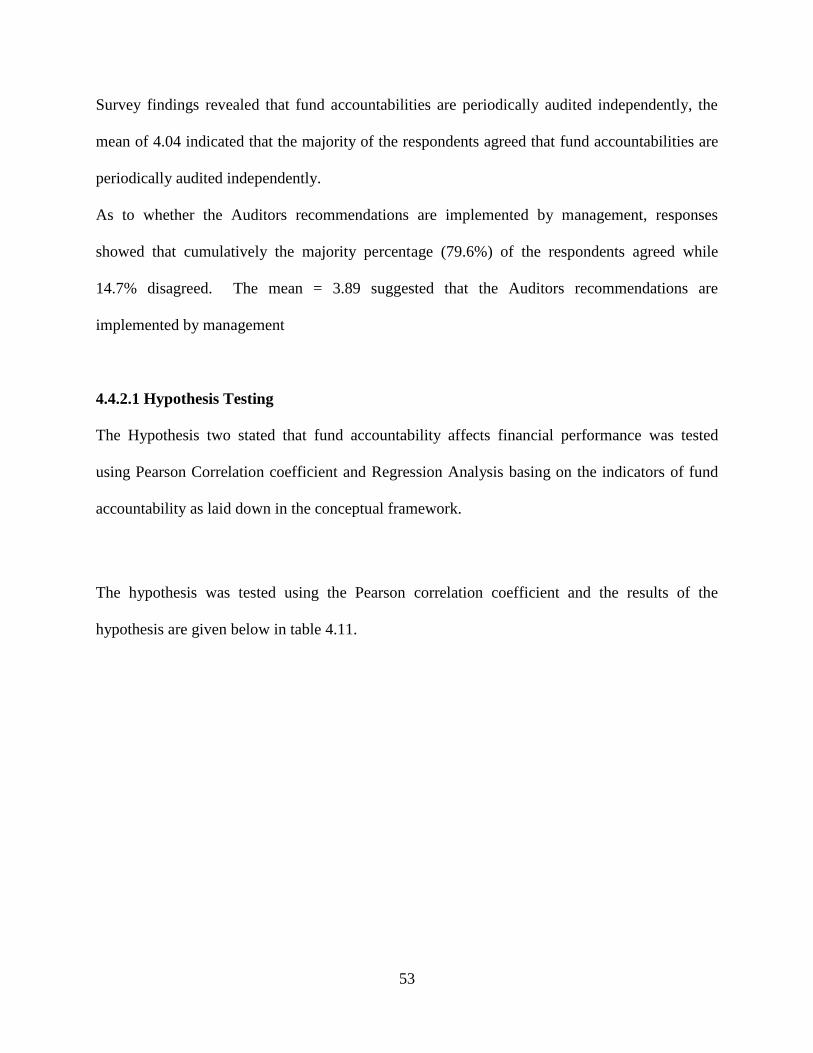
53
Survey findings revealed that fund accountabilities are periodically audited independently, the
mean of 4.04 indicated that the majority of the respondents agreed that fund accountabilities are
periodically audited independently.
As to whether the Auditors recommendations are implemented by management, responses
showed that cumulatively the majority percentage (79.6%) of the respondents agreed while
14.7% disagreed. The mean = 3.89 suggested that the Auditors recommendations are
implemented by management
4.4.2.1 Hypothesis Testing
The Hypothesis two stated that fund accountability affects financial performance was tested
using Pearson Correlation coefficient and Regression Analysis basing on the indicators of fund
accountability as laid down in the conceptual framework.
The hypothesis was tested using the Pearson correlation coefficient and the results of the
hypothesis are given below in table 4.11.

54
Table 4. 9: Correlation matrix for fund accountability and financial performance
Fund accountability Financial Performance
Fund
accountability
Pearson
Correlation 1 .212(**)
Sig. (2-tailed) . .000
N 60 60
Financial
Performance
Pearson
Correlation .212(**) 1
Sig. (2-tailed) .000 .
N 60 60
** Correlation is significant at the 0.01 level (2-tailed).
Source Primary data (2017)
The results show that the correlation coefficient is 0.212(**) and its significance level 0.000.
This implied that fund accountability significantly affects the financial performance. Therefore
according to the results there is a positive significant effect of fund accountability on financial
performance. Therefore the alternative hypothesis that was earlier postulated is accepted.
Table 4. 10: Regression Analysis for fund accountability and financial performance
Table 4.12 Provides the R and R2 value. The R value is 0.212, which represents the simple
correlation and, therefore, indicates a moderate degree of correlation. The R2 value indicates how
much of the dependent variable financial performance can be explained by the independent
variable fund accountability. The standard error of the estimate is .48939 and the adjusted R
Model Summary
.212 a .419 .378 .48939 Model 1
R R Square Adjusted R Square
Std. Error of the Estimate
Predictors: (Constant), fund accountability a.

55
square value is 0.378. Therefore the adjusted square value of .378 implied that the fund
accountability predicts the financial performance; in other words the financial performance is
dependent on fund accountability by 37.8%
Table 4. 11: Analysis of Variance Showing the Results on Fund accountability and financial
performance
These are the degrees of freedom associated with the sources of variance. The total variance has
N-1 degrees of freedom. The Regression degrees of freedom correspond to the number of
coefficients estimated minus 1. Including the intercept, there are 5 coefficients, so the model has
5-1=4 degrees of freedom. The Error degree of freedom is the DF total minus the DF model, 115
- 3 =114. Mean Square are the Mean Squares, the Sum of Squares divided by their respective
DF. The F-statistic is the Mean Square (Regression) divided by the Mean Square (Residual)
1.784/.240= 7.450. The p-value is compared to some alpha level in testing the null hypothesis
that all of the model coefficients are 0.The full model is not statistically significant (F = 7.450, df
= 115, 1, sig.= .007), even though financial performance was statistically significant (p>.05) by
itself. The value for this table had a total degrees of freedom of 115 because four observation had
missing data and were not included in the analysis. The other degree of freedom corresponds to
the intercept (constant) of the regression line. F-Statistics is 7.450, given the strength of the
correlation, our model is statistically significant (p > .0005)
ANOVA b
1.784 1 1.784 7.450 .007 a
27.303 55 .240 29.087 56
Regression Residual Total
Model 1
Sum of Squares df Mean Square F Sig.
Predictors: (Constant), fund accountability a.
Dependent Variable: fund accountability b.

56
In summary, the respondents were asked to give their summary opinions about policies. Several
responses were given but generally their indicated that the responses on fund accountability were
fair. In total 60 respondents provided responses indicating that fund accountability drafted are
good but the financial performance has faced challenges.
4.4.3 Variance analysis and financial performance
The items on the variance analysis were derived from the third of objective of the study.
Question items measuring responsive variance analysis were put to the respondents. The items
were scaled using the five-point Likert scale where code 1 = Strongly Disagree, 2 = Disagree, 3
= Undecided, 4 = Agree and 5 = Strongly Agree. Descriptive data is as presented in Table 4.14.

57
Table 4. 12: Variance analysis and Financial Performance
Items SA A N D SD Mean
Managers hold budget conferences
/meetings regularly to review performance
23.3% 18.3
%
6.6% 35.8% 22.5% 2.34
We have budget policies to check on
spending
29.1% 37.5
%
4.16% 12.5% 16.6% 3.96
Control of the budget activities is done by
the head of departments
34.1% 30.8
%
- 17.5% 17.5% 3.70
The costs of activities are always reviewed
by the executive committee
25% 21% 3.3% 32.5% 15.8% 2.30
Budget performance evaluation reports are
prepared regularly
16.6% 64.1
%
5.0% 5.0% 10% 3.88
Budget deviations are reported to budget
committee/Executives
21.6% 20% 8.3% 21.6% 28.3% 2.80
The deviations from the budget targets are
frequently reported
30.8% 37.5
%
4.1% 11.6% 20% 3.88
Managers always take timely corrective
actions when adverse variances are reported
16.4% 64% 9.1% 1.6% 8.3% 4.04
There is a regular follow up on budget plans
by the budget committee/departmental
heads
44.3% 45.3
%
00% 8.6% %5.15 3.85
Source: Primary data (2017) N=60
SD = Strongly Disagree, D = Disagree, N = Neutral, SA = Strongly Agree and A = Agree, F =
Frequency, % = Percentage
Basing on survey findings, it was established from the respondents in relation to item one,
managers hold budget conferences /meetings regularly to review performance,cumulatively the
majority percentage (58.3%) of the respondents disagreed with 41.6% agreed and 6.6% were
undecided. The mean = 2.34 which on the five-point Likert scale (from a minimum of 1 for the

58
worst case scenario strongly disagree to a maximum of 5, which is the best case scenario
strongly agree) that was used to measure responses was close to 2 which corresponded to
disagree. This suggested that the managers do not hold budget conferences /meetings regularly to
review performance. A respondent noted “sometimes managers do not hold budget conferences
/meetings regularly to review performance”
As to whether they have budget policies to check on spending, cumulatively the majority
percentage (66.6%) of the respondents agreed with 29.1% disagreed and 4.16% were undecided.
The mean = 3.96 was close to four meaning that the majority of the respondents disagreed with
the item hence this suggested that they have budget policies to check on spending.
Three respondents supported the argument that there are loopholes within the structures for
budgeting, they cited the case where organizations have failed to budget well. Further the
respondents revealed that there are loopholes within the structures for budgeting this represented
60% of the total interviewed.
In relation to item three, the respondents were required to state whether control of the budget
activities is done by the head of departments. The computed test figures reveal that the mean is
3.70 and the standard deviation is .1244 indicating agreement. A respondent felt that the Control
of the budget activities is done by the head of departments but has a long way to go. However the
opinion leaders (57%) had mixed responses about the control of the budget activities is done by
the head of departments.
Basing on survey findings, it was established from the respondents in relation to item one, the
costs of activities are always reviewed by the executive committee,cumulatively the majority
percentage (58.3%) of the respondents disagreed with 41.6% agreed and 6.6% were undecided.
The mean = 2.30 which on the five-point Likert scale (from a minimum of 1 for the worst case

59
scenario strongly disagree to a maximum of 5, which is the best case scenario strongly agree)
that was used to measure responses was close to 2 which corresponded to disagree. This
suggested that the costs of activities are always reviewed by the executive committee
As to whether budget performance evaluation reports are prepared regularly, cumulatively the
majority percentage (80.7%) of the respondents agreed with 15% disagreed and 5% were
undecided. The mean = 3.96 was close to four meaning that the majority of the respondents
disagreed with the item hence this suggested that budget performance evaluation reports are
prepared regularly. The international organisation has a budget policies to check on spending
Three respondents supported the argument that budget performance evaluation reports are
prepared regularly, they cited the case where reports may not be prepared on time. Further the
respondents revealed that budget performance evaluation reports are prepared regularly this
represented 60% of the total interviewed.
In relation to item three, the respondents were required to state whether budget deviations are
reported to budget committee/Executives. The computed test figures reveal that the mean is 2.80
and the standard deviation is .1244 indicating disagreement. A respondent felt that Budget
deviations are not reported to budget committee/Executives. However the opinion leaders (57%)
had mixed responses about budget deviations are reported to budget committee/Executives.
As to whether the deviations from the budget targets are frequently reported, cumulatively the
majority percentage (68.3%) of the respondents agreed with 31.6% disagreed and 4.1% were
undecided. The mean = 3.88 was close to four meaning that the majority of the respondents
disagreed with the item hence this suggested that the deviations from the budget targets are
frequently reported.

60
Three respondents supported the argument that budget targets are frequently reported, they cited
the case where reports may not be prepared on time. Further the respondents revealed that target
are not attained sometimes, this represented, 60% of the total interviewed.
In relation to item three, the respondents were required to state whether managers always take
timely corrective actions when adverse variances are reported. The computed test figures reveal
that the mean is 4.04 indicating agreement. A respondent felt that managers always take timely
corrective actions when adverse variances are reported.
As to whether there is a regular follow up on budget plans by the budget committee/departmental
heads, cumulatively the majority percentage (79.6%) of the respondents agreed with 14.7%
disagreed. The mean = 3.85 was close to four meaning that the majority of the respondents
agreed with the item hence this suggested that there is a regular follow up on budget plans by the
budget committee/departmental heads.

61
4.12 Summary of findings on the dependent variable (Financial Performance)
Presentation of the summary of responses on the dependent variable (Financial Performance)
Table 4. 13: Descriptive Statistics on Performance
Items SA A N
D
SD Mean Std.
Dev
There is a lot of return on
Equity.
31% 45% 00 11% 13 3.87 .396
There is a lot of return on
assets
23% 63% 00 4% 10 4.06 .242
There is a lot of return on
capital employed
26% 45% 00 11% 18 3.82 .967
Management acts with a
great degree of integrity in
execution of their roles
31% 34% 00 13% 22 3.60 .135
Ethical values are upheld
in all management
decisions
34% 62% 2% 4% 6.0 4.70 .401
Our Board of directors and
its committees are
independent of
Management
29% 59% 3% 9% 12 4.46 1.31
Source: Primary data (2017) N=60
SD = Strongly Disagree, D = Disagree, N = Neutral, SA = Strongly Agree and A = Agree,
% = Percentage
As to whether there is a lot of return on Equity, the respondent’s responses indicated that
cumulatively, the larger percentage (76%) of the respondents agreed and 24% disagreed. The

62
mean = 3.87 was above the median score, three, which on the five-point Likert scale used to
measure the items indicated that there is a lot of return on Equity.
Responses to the question as to whether there is a lot of return on assets (86%) disagreed while
14% agreed. The mean = 4.06 above four indicated that there is a lot of return on assets.
A respondent (Director Finance & Admin) relatedly noted;
The organisations have accumulated a lot of assets over the years that include fixed and non-
fixed assets for example building, cars, land etc.
With respect to whether there is a lot of return on capital employed, cumulatively the larger
percentage (71%) agreed with 29% disagreeing. The mean = 3.82 which corresponded to agreed
indicated the majority of the respondents agreed that there is a lot of return on capital employed.
As to whether management acts with a great degree of integrity in execution of their roles,
cumulatively the larger percentage (65%) agreed with 35% disagreed. The mean = 3.60 meant
that Management acts with a great degree of integrity in execution of their roles.
Regarding whether ethical values are upheld in all management decisions , cumulatively the
larger percentage (94%) agreed and 6.0% disagreed. The mean = 4.70 implied that ethical values
are upheld in all management decisions .
Whether Board of directors and its committees are independent of Management, cumulatively
the larger percentage (88%) agreed with 18% disagreeing. The mean = 4.46 implied that the
Board of directors and its committees are independent of Management.

63
Findings from interviews revealed that the board has committees for example finance, credit,
procurement. The board reviews advance forms and finds out whether the loans are actually
being given to members. The finance committee reports on how the organisation is performing.
Responses to the question as to whether internal controls contribute to financial performance
(90%) agreed while 10% disagreed. The mean = 4.38 above the median score, three, that
indicated that internal control contribute to financial performance.
Findings revealed that there are still gaps, budgetary constraints for M&E, what members are
doing with the loans taken. The organisations are not giving enough financial education to its
members.
4.4.3.2 Hypothesis testing
4.4.3.31 Pearson Correlation Coefficient
The hypothesis was tested using the Pearson correlation coefficient and the results of the
hypothesis are given Table 4.16 below.

64
Table 4. 14: Correlation matrix for variance analysis and financial performance
Variance analysis Financial Performance
Variance
analysis
Pearson
Correlation 1 .701
Sig. (2-tailed) . .000
N
60 60
Financial
Performance
Pearson
Correlation .701 1
Sig. (2-tailed) .000 .
N 60 60
** Correlation is significant at the 0.01 level (2-tailed).
Source Primary data (2017)
The results show that the correlation coefficient is 0.701 and its significance level 0.000. This
implied that variance analysis affects financial performance. Therefore according to the results
there is a positive effect of variance analysis and financial performance. Therefore the alternative
hypothesis that was earlier postulated is accepted.
4.4.3.4 Regression Analysis
A regression analysis for variance analysis and financial performance was run and the results
from the analysis are below in table 4.17
Table 4. 15: Regression Analysis for variance analysis and financial performance
Model R R Square Adjusted R Square Std. Error of the Estimate
1 .701(a) .391 .334 1.675
a Predictors: (Constant), variance analysis
Source Primary data (2017)

65
Table 4.17 provides the R and R2 value. The R value is 0.701, which represents the simple
correlation and, therefore, indicates a low degree of correlation. The R2 value indicates how
much of the dependent variable financial performance can be explained by the independent
variable variance analysis. In this case, 0.391 can be explained, which is very large. The standard
error of the estimate is 1.675 and the adjusted R square value is 0.334. Therefore the adjusted
square value of .334 implied that variance analysis affects the financial performance; in other
words the financial performance is dependent on variance analysis by 33.4
This Chapter focused on presenting the findings, interpretation and analysis, the next chapter
focuses on the summary of findings, discussion of the findings, conclusions, recommendations
and areas for further research. The researcher now turns to chapter five to present the summary
of findings, discussion of the findings, conclusions and recommendations.

66
CHAPTER FIVE
SUMMARY, DISCUSSION, CONCLUSIONAND RECOMMENDATIONS
5.1 Introduction
The study investigated the effect of budgetary control on the financial performance of
international non-governmental organizations in Uganda taking a case of Cardno SDS
Programme This chapter presents the summary of the findings, discussion, conclusions obtained
from the findings and the recommendations on analysis and interpretation of the findings.
5.2 Summary of the findings
5.2.1 Budgetary Process and Financial Performance
The results budgetary process have a positive significantly influences on financial performance.
Therefore according to the results there is a positive significant relationship between budgetary
process and financial performance. The finding implies that budgetary process predicts financial
performance; in other words financial performance is dependent on the budgetary process
5.2.2 Fund Accountability and Financial Performance
The results fund accountability have a positive significantly influences on financial performance.
Therefore according to the results there is a positive significant relationship between fund
accountability and financial performance. The finding implies that fund accountability predicts
financial performance; in other words financial performance is dependent on fund accountability
5.2.3 The effect of Variance Analysis on the Financial Performance
The results variance analysis have a positive significantly influences on financial performance.
Therefore according to the results there is a positive significant relationship between variance

67
analysis and financial performance. The finding implies that variance analysis predicts financial
performance; in other words financial performance is dependent on variance analysis
5.3 Discussion
This subsection presents the discussion of the study findings research question by research
question.
5.3.1 Budgetary Process and Financial Performance
Findings revealed that there is a positive significant relationship between budgetary process and
financial performance. The results showed that as a budget is formulated, all organizational
departments are invited to participate, ideas are solicited from a few members, few of the ideas
are prioritized then the budgetary goals are communicated and lastly few of the members are
consulted before the budget is implemented. The draft budget is then presented to the executive
committee of the organization for review. This is supported by Demonn (2009) who
recommended that proper budget formulation assist managers in managing and controlling the
financial performance of an organization for which they are responsible. Graig and Cliff (2008)
also supported the fact that once the budget formulation is smoothly done, planned inflows will
be realized and then the outflow will be properly monitored.
Findings revealed that the organisations give priority to sectors that are a concern to national
development. When releasing the funds the priority is normally given to activities that are always
linked to the overall priorities. It is not only the priority given to activities that determines the
level of funds to be allocated to an activity; it is also the level of funding required by the activity.
The priority activity may be to rehabilitate the council headquarters building, but this may
require a lot of funds than the regulatory activities. This is in line with Saito (2000) who states

68
that when drawing budgets priority should be given to the key sectors. When releasing the funds
the priority is normally given to activities that are always linked to priorities areas of the
department. It is not only priority given to activities that determines the level of funds to be
allocated to an activity; it is also the level of funding required by the activity.

69
Cherrington and Cherington’s (2003) study found that the “top-down” imposition of budget
targets actually led to higher performance amongst the recipients as opposed to those managers
who more or less set their own targets. This view was also advanced by studies by Henderson
(2007); the hypothesis preferred that feedback on budget results would indicate success or failure
and thus an incentive for higher financial performance. The ideas of Cherrington and
Cherington’s (2003) are consistent with the findings that feedback on budget results indicates
success thus an incentive for higher performance. This is consistent with Hopwood (1976)’s
theory. Employees are more likely to "buy into" a goal if they feel they are part of its creation. In
addition to selecting the right type of goal, an effective program must entail feedback.
Findings revealed that organizations set budgetary goals although most times are not achievable.
The findings are consistent with Herifetz and Laurie (2004) who made a similar conclusion,
which the duo stating that when people set budgetary goals, they work towards achieving them
although sometimes they may not be achieved. This is in line with Hopwood (1976)’s theory
who argues that an individual’s goal can be viewed as the performance levels rise. If an
individual becomes committed to a given goal, it will influence the individual’s subsequent
actions, and consequently the individual’s performance level. Once a subordinate is committed to
his or her budget goals, he or she will increase his or her effort to achieve the set goals.
The funds were found to be utilized as planned but less in amounts estimated. The expenditures
are guided by the work plans and policies in place. It was observed that besides leakage in the
funds released, there were key emerging issues in the budget implementation that need to be
addressed. The findings are in line with Saito (2000) who noted that there should be proper
management of funds hence the little funds available should be put to proper use. Under the

70
Hopwood (1976)’s, theory, that the internal controls should be intact in order to achieve
efficiency of operations.
Findings revealed that budget reporting assists managers in managing and controlling the
activities for which they are responsible for. By comparing the actual results with the budgeted
amounts for different categories of expenses, managers can ascertain which costs do not conform
to the original plan thus require their attention. This process enables management to operate a
system of management by exception, which means that a manager’s attention and effort can be
concentrated on significant deviations from the expected results. As a result of efficient budget
reporting, Arora (2015) noted that budget reporting is part and parcel of the budget process and
what is more important for an organization is to have the reporting done efficiently and
systematically This is in line with Kerr (2008) who states that the primary function of budget
reporting is to provide the ex-ante motivation to achieve the budget and the ex-post
reinforcements necessary to ensure future motivation. This is what makes variances to be
perceived as extremely important and valid measures of performance.
5.3.2 Fund Accountability and Financial Performance
Findings revealed that there is a positive relationship between fund accountability and financial
performance. The study also found out that auditing will enhance accountability of financial
management. The findings are consistent with Stein, Ernesto, Alejandro, Grisanti, and Ernesto-
Talvi (2009:23) who noted that auditing could help enhance the proper management of finances.
Olson, Guthrie, and Humphrey (2008:54) highlights. Merchant (2001), Brownell (2002) and
Covaleski et al (2003) all found a positive relationship between fund accountability and financial
performance. Its noteworthy that earlier study on relationship between implementation and
financial performance lead one to conclude that even when prioritization in the budgeting

71
process is seen as being correct, its value would be situation - specific; there by becoming a key
performance driver. To find out whether the budget implementation influences financial
performance, respondents answered certain questions which indicated that financial was being
affected by certain factors such as; delay in budget implementation, late release of resources,
little or no supervision and coordination of the implementation process, and some respondents
further asserted that they always get discussions with their supervisors which helps the
implementation although the supervisors are slow at consulting them at times. It was observed
that NGOs have tried to capture adequate financial resources to develop and maintain their
programmes. The findings are in line with Argyris (2002) who notes that adequate financing
should be a top priority in Uganda.
Findings revealed that sometimes the work of the auditors is interfered with by some actors.
Most respondents revealed that to be effective, auditors must have been seen to be independent
and competent. The role of the auditors can only be effective if the office is viewed as being
independent. Without these characteristics, the auditors may lack credibility. The organizations
have supported the various development partners to refine and streamline budgeting making it
robust and water tight to minimize wastage. A case in point is streamlining the process to ensure
value for money delivered through competition. Lack of transparency and accountability in the
management of the funds was reported by the majority of respondents as a loophole in some
organizations.
Findings revealed that the Audit section internal audit section performs excellent work. Dubnick
(2003) noted that internal auditors must evaluates and provides reasonable assurance that risk
management, control, and governance systems are functioning as intended and will enable the
organization’s objectives and goals to be met. They must also report risk management issues and

72
internal controls deficiencies identified directly to the audit committee and provides
recommendations for improving the organization’s operations, in terms of both efficient and
effective performance. Internal auditors must evaluates regulatory compliance program with
consultation from top management. It was observed that auditing is a core business and the
foundation for the ability to have a positive influence on financial performance. Alongside
annual audits, performance audits, inquiries, and special studies allows the internal audit staffs to
review in depth how the departments uses resources and to suggest opportunities to improve
financial performance where they have considered specific matters. The findings are in line with
Mulgan (2000)
5.3.3 Variance Analysis and Financial Performance
The findings revealed that there is a positive significant effect of variance analysis on financial
performance. Recent literature also asserts that variance analysis measures are very important in
the budgeting process as implied in the principal stages of the budgeting process (Mulumba,
2009). Prior studies on budgeting and participation found that a participative budgeting approach
had an influence on process and the financial performance (Cherrington & Cherrington, 2003).
This is in line with the goal setting theory by Edwin Locke (1968) which states that a subject
involvement in a pursuit of a goal can have an effect on goal attainment.
The findings revealed that the majority strongly disagreed that their ideas are not asked for and
taken into account when the budgetary process begins. This is inconsistent with Becker and
Green (2002) who assert that budgeting exercise requires a participative approach where the
citizens freely give in their views.

73
The findings revealed that budgeting is a critical exercise. Further analysis indicated that
residents are invited to participate in the budget process and adequate time is given to them for
preparation. This is consistent with Brancht and Tsouros (2000) who found out that budgetary
analysis influences performance. It is worthy to note that, earlier studies on relationship between
analysis and performance lead one to conclude that participation fosters good performance. Even
when participation in the budgetary process is seen as being correct, its value would be
situational - specific there by becoming a key performance driver.
Findings further revealed that argues that budgetary analysis enhances subordinates’ budgetary
goal commitment. This is consistent with Charpentier (2008) who argues that budgetary analysis
enhances subordinates’ budgetary goal commitment. This view point is consistent and supported
by shields and shields (2008) who argues that the act of participation increases “subordinate’s
trust, sense of control, and involvement with the organization, which then jointly causes less
resistance to change and more acceptance of, and commitment to, the budget decision.” Thus
further, it has been suggested that budgetary participation serves as a motivational function by
providing an opportunity for subordinates to get involved in and have influence on budgetary
goal setting, consequently increasing budget goal commitment. It follows that the motivational
role of budget participation will increase subordinates’ budget goal commitment.
Findings revealed that budgetary analysis serves as a motivational function by providing an
opportunity for subordinates to get involved in and have influence on budgetary goal setting,
consequently increasing budget goal commitment. The majority of the respondents agreed that
when they participate in the budgetary exercise they are motivated to work hard. This is in line
with Hopwood (1976)’s theory, budgetary analysis must serve as a motivational function by

74
providing an opportunity for subordinates to get involved in and have influence on the budget
goal setting, consequently increases their budget goal commitment. Hopwood (1976) stated that
employees were motivated by clear goals and appropriate feedback. Locke went on to say that
working toward a goal provided a major source of motivation to actually reach the goal which, in
turn, improved financial performance.
5.5 Conclusions
On the basis of the study findings, a number of conclusions were made in line with the objectives
of the study.
5.5.1 Budgetary Process and Financial Performance
The study concluded that there is a positive significant effect of budgetary process on financial
performance. This finding implies that effective budgetary process will improve the financial
performance of the programme. International organisations prioritize budgets by putting key
areas into first consideration that is, deciding on the activities that must be done before others are
carried out. Therefore budgetary prioritization is an important element if goals are to be attained.
5.5.2 Fund Accountability and Financial Performance
The study concluded that fund accountability positively affect the financial performance of
international NGOs in Uganda. The budget exercise has remained an affair of the entire
organization with top management ensuring that the implementation is effectively done. To
ensure effective implementation of the budget, departments are required to develop and
implement time bound fund management plan for their activities. Coordinating budgeting is a
team work exercise and has to remain a team work exercise. To foster the spirit of team work,

75
after budget preparation, there are usually other meetings organized monthly, quarterly and
annually to give feedback to stakeholders on how budget performed up to year end
5.5.3 Variance Analysis and Financial Performance
The study concluded that there was a positive effect of variance analysis on financial performance
in International NGOs in Uganda. The loopholes are witnessed in some of the organisation for
example excessive number of budgetary appropriations tends to impede efficient implementation of
programs. Even when information on budgeting is made available, it is often incomprehensible in
the organisation. However, variance analysis has provided and encouraged simplification and
transparency, it has helped make the budget forecasts easier to understand and more credible. Tasks
are explained before programmes kick off. Job rotation is not very common in Cardno SDS
programme so this has not affected budget implementation in any case.
5.6 Recommendations
In light of the study conclusions, the following recommendations were made in line with the
objectives of this study.
5.6.1 Budgetary Process and Financial Performance
All departments and stakeholders should be actively involved in the budgetary formulation
exercise to a large extent because departmental goals contribute to organizational objects. This
should be made on a monthly basis thus enabling the management team/decision making body to
identify the items that are not proceeding to the organizational plan and take collective actions in
case of any deviations.
5.6.2 Fund Accountability and the Financial Performance
To ensure a better level of financial performance should observe proper accountability of funds,
and involve all the necessary parties in the budget preparation through the preparation of

76
monthly reports continuously. There is need to widen and extend the scope of accountability
following the budget implementation process i.e the performance report as well as explaining
causes of budget deviations can be worked on.
5.6.3 Variance Analysis and Financial Performance
International organizations should carry out periodical performance evaluation of all departments
and the entire organization to ensure budgetary goals and achievements. This action should take
the form of reward or punishment of the implementers (agents) to foster goal attainment. This is
because budget goals have direct effect on both budget motivation and financial performance.
There is need to widen and extend the scope of stakeholder participation through consultation as
the budget implementation process is being done and this will involve explaining the causes of
budget deviations.
5.7 Limitations and Assumptions of the Study
There were a number of limitations associated with decisions made regarding the
methodology. They relate to the choice of participants, the type of data collected and the
analytic process.
Another limitation was the time frame in which data was collected. The data constituted a
snapshot of one point on the implementation continuum. Interviews date is limited in a
number of ways including the limitations present in the questions themselves and also in the
nature of the responses from participants. The participant’s responses were based only on the
questions that the researcher asked but there could have been more information through
observation hence sometimes misleading information is given during interviews.

77
Some respondents were not willing to give information unless paid and at some instances, the
researcher had to wait till late in the evening when the respondents are through with their
work so as to interview them.
Adopting a mixed methodological approach required a lot of skills and reading about the two
approaches which was not easy.
For the key informants, given their busy schedules, some interviews were rescheduled to fit
their timetables, but these also sometimes failed. The research took slightly long to conduct
particular interviews which delayed the study. There was also a problem of absenteeism by
some of the respondents at the designated place of carrying out the interviews. Therefore
collecting data from them through the questionnaires proved to be a big challenge. In some
instances, respondents wanted pay prior to providing information.
The researcher managed these problems by making use of the supportive team leader who in
one instance was willing to introduce the researcher in person to the respondents a through
sensitization of respondents on the importance and significance of the study. The Uganda
Management Institute introductory letter helped to allay any fears and doubts among some
respondents. Efforts were made to maintain confidentiality of the responses. The absenteeism
of some officials was tackled by frequent to the banks, and above all establishing good
rapport.
The research took slightly long to conduct particular interviews which delayed the study.
There was also a problem of absenteeism by some of the respondents at the designated place
of carrying out the interviews. Therefore collecting data from them through the
questionnaires proved to be a big challenge. In some instances, respondents wanted pay prior
to providing information.

78
5.8 Areas for further Research
The study focused on only budgetary participation, control, and prioritization. Motivation
ownership and their effect on budget performance that the study did not examine would
warranty further study.
The findings of this research appear to associate certain revelations to unethical behaviour of
the managers, which could be having an effect on budgetary performance of organizations.
This calls for research to study whether there exists any form of relationship between ethical
behaviour of budget managers and budgetary performance of organizations.
In addition, there is need to study additional factors in a budgeting setting that influence
performance, goal acceptance, and job satisfaction. For example, it would be interesting to
study the effect of workplace cooperation, the opportunity for advancement, tension in the
workplace, incentives, pay equity, and the ability to disagree with superiors and its impact on
the above mentioned variables.

79
REFERENCES
Alesina, A. & Perotti, R. (1996). Reducing Budget Deficits. Swedish Economic Policy Review
Amaratunga, D. (2001). Theory Building in Facilities Management Performance Measurement:
Application of Some Core Performance Measurement and Management Principles.
Unpublished PhD Thesis. The University of Salford: UK.
Arora, M.N. (1995). Cost Accounting, Principles and Practice (4th ed.). Vikas Publishing
Basheka, B. C., Oluka, P. N., & Mugurusi, G. (2015). Citizen-driven approaches for
combating public procurement corruption in Uganda's local government systems:
an empirical survey. International Journal of Logistics Systems and Management,
21(4), 442-464
Berry A. J, Broadbent J., Otley D. T.(2005). Management control: Theories, issues and performance
(2nd ed.). Basingstoke, UK: Palgrave Macmillan.
Cairns B., Harris M., Hutchison R. &Tricker, M. (2005). Improving Performance: The Adoption and
Implementation of Quality Systems in U.K. Nonprofits. Non-profit Management &Leadership,
16(2), 135-151.
Carolyne, M., Callahan, Waymire & Renea, T. (2007, November 2). An Examination of the Effects of
Budgetary Control on Performance: Evidence from the cities.AAA 2008 MAS Meeting Paper.
http://ssrn.com/abstract=1003930.
Carr, J. Joseph, (2000). Requirements Engineering and Management: The Key to Designing Quality
Complex Systems: The TQM Magazine Volume 12 No. 6 PP.400-407.
Chua W. F. (1986). Radical developments in accounting thought. Accounting Review, 61, 601-632

80
Chua W. F., Lowe T., Puxty A. G. (1989). Critical perspectives in management control. Basingstoke,
UK: Macmillan.
Cowton C. J., Dopson S.(2002). Foucault’s prison? Management control in an automotive distributor.
Management Accounting Research, 13, 191-213.
Douglas, B.R. (1994).The budget process in a multinational firm. The multinational business review. 2,
58-63.
Drury, C. (2006), Cost and Management Accounting (6th ed). Boston Irwin. McGraw-Hill, 422-471.
Dunk, A.S. (1989). Budget Emphasis, Budgetary Participation and Managerial Performance: A Note.
Accounting, Organization & Society, 14(4), 321- 324.
Efferin S., Hopper T. M.(2007). Management control, culture and ethnicity in a Chinese Indonesian
company. Accounting, Organizations and Society, 32, 223-262.CrossRefWeb of Science
Epstein, M.J, & McFarlan, W. (October, 2011). Measuring efficiency and effectiveness of a Non
Profit‘s Performance. Stategic Finance.
Etzioni, A. (1960). A comparative analysis of complex organizations. New York, NY: Free Press.
Hansen, S.C., Otley, D.T. & Van der Stede, W.A. (2003). Practice Developments in Budgeting: An
Overview and Research Perspective. Journal of Management Accounting Research, 15, 95-
116.
Hewege C. R. (2006, December). Management control issues of a privatised entity in Sri Lanka:
Hedeki Kamitsuma of NTT at SLT: Managing transition period of privatisation. Paper
presented at the 5th Asia Academy of Management Conference Tokyo, Japan.
Hewege C. R. (2007, July). Issues in changing management control regime of a privatised entity:
Japanese management in Sri Lankan context. Paper presented at the International Conference
on Business and Information, Tokyo, Japan.

81
Hewege C. R.(2011). Acculturation and management control Japanese Soul in Sri Lankan Physique.
Contemporary Management Research, 7, 3-20.
Hirst, M.K. (1987). The Effects of Setting Budget Goals and Task Uncertainty on Performance: A
Theoretical Analysis. The Accounting Review, 62(4), 774-784.
Hopper T. M., Macintosh N. B. (1993). Management accounting as a disciplinary practice: The case of
ITT under Harold Geneen. Management Accounting Research, 4, 181-216.
Hopper T. M., Powell A. (1985). Making sense of research in to the organizational and social aspects
of management accounting: A review of the underlying assumptions. Journal of Management
Studies, 22, 429-465.
Hopper T.,Tsamenyi M., Uddin S., Wickramasinghe D.(2009). Management accounting in less
developed countries: What is known and needs knowing. Accounting, Auditing &
Accountability Journal, 22, 469-514.
Hopwood A. (1972). An empirical study of the role of accounting data in performance evaluation.
Journal of Accounting Research, 10, 82-152.
Hopwood A. (1974). Accounting and Human Behaviour. London, England: Haymarket.
Hopwood A. G., Miller P.(Eds.). Accounting as a Social and Institutional Practice. Cambridge, UK:
Cambridge University Press.
Hopwood, A.G. (1976). Accounting and Human Behaviour. Eaglewood Cliffs, New Jersey: Prentice
Hall.
Horvath, P. & Seiter M. (2009). Performance Measurement. Die Betriebswirtschaft, 69 (3), 393-413.
Kaplan, R.S., & Norton, D.P. (1996). The Balanced Scorecard: Translating Strategy into Action.
Boston, MA: Harvard Business School Press.

82
Lucey, T. (2002).Costing (6th Edition). 403-410.
Mugenda, M.O. and Mugenda, A. (1999). Research Methods: Qualitative and Quantitative
Approaches. Africa Centre for Technology Studies, Nairobi, Kenya.
Osoro, P.M. (2001). Budgetary Control in NGOs in Kenya: A Case of World Vision. Unpublished
MBA Project. University of Nairobi.
Otley, D.T. & Pollanen, R.M. (2000). Budgetary Criteria in Performance Evaluation: A Critical
Appraisal Using New Evidence. Accounting, Organization &Society, 25(4/5), 483-496.
Otley, S. (1987). Budget Use and Management Performance. Journal of Accounting Research, 16(1).
Ouchi W. G. (1977). The relationship between organizational structure and organizational control.
Administrative Science Quarterly, 22, 95-113.CrossRefWeb of Science
Ouchi W. G. (1979). A conceptual framework for the design of organisational control mechanisms.
Management Science, 25, 833-848.CrossRefWeb of Science
Ouchi W. G. (1980). Markets, bureaucracies and clans. Administrative Science Quarterly, 25, 129-141
Phyrr, P. (1970). Zero Base Budgeting: A Practical Management Tour Tool for Evaluating Expenses”.
New York: John Wiley.
Sawhill, J.C. &Williamson, D. (2001). Mission Impossible; Measuring Success in Non-profit
Organizations. Non-profit Management & Leadership, 11(3)384-385.
Scott, W.R. (1987). Information Processing: Creating Organizations. Englewood Cliffs, NJ: Prentice
Hall.
Simiyu N.T.T. (1977). A Study of the problems of budgeting and motivation at the supervisors’ level in
Manufacturing Firms in Kenya .Unpublished MBA Project. University of Nairobi.
Simiyu, N.T.T., (1979). Participatory Budget Setting and Budget Commitment. Unpublished Thesis.

83
University of Nairobi.
Whitley R. (1999). Firms, institutions and management control: The comparative analysis of
coordination and control systems. Accounting, Organization and Society, 24, 507-524
Zimmerman, et al. (2006).The Use of Performance Measurement in South Carolina Nonprofits. Non-
profitManagement&Leadership,16(3),315-327.

i
APPENDICES
Appendix 1: Questionnaire
UGANDA MANAGEMENT INSTITUTE
MASTER OF BUSINESS ADMINISTRATION
QUESTIONNAIRE
Dear respondent, I am conducting a study on budgetary control and financial
performance of International Non-Governmental Organizational in Uganda as part of
my study at Uganda Management Institute (UMI). As one of the respondent, your
response is very important to this study. The information provided will only be used for
academic purpose, and will be treated with utmost confidentiality.
Thank you in advance.
PART A: GENERAL QUESTIONS (Please tick in the appropriate box provided)
What time dimensions does your overall organization budget cover?
(a) Less than 1 year ( ) (b) 1-5 years ( ) (c) 5 and above years ( ) (d) None ( )
How often is it reviewed?
(a) Monthly ( ) (b) Quarterly ( ) (c) Annually ( ) (d) None ( )
What is your approximate annual budget revenue?
(a) $100,000 and less () (b) $ 100,000-S200,000 () (c) $200,000-$300,000 ( ) (d)
300,000 and above ( )

ii
How long have you worked for the organization
Less than 1 Year ( ) (b) I -2 Years ( ) (c) 2-5 Years ( ) (d) 5 and above ( )
PART B: BUDGETARY PROCESS
Please respond to the following statements by indicating the extent to which you agree or
disagree with the activities. Strongly disagree (1) Disagree (2) Not Sure (3) Agree (4) Strongly
Agree (5)
S/N Questions Please tick in the appropriate box provided
Strongly
disagree
(1)
Disagree
(2)
Not sure
(3)
Agree
(4)
Strongly
Agree
(5)
1 I’m involved in the budget setting
process
2 We are sensitized on the budget
control process
3 All the stakeholders to the budget
are involved
4 All departments are always
involved in the budgeting process
5 Approved Budgets are shared with
all Departments
6 Leadership and support is given to
all the Subordinates throughout
the budget process by managers

iii
7 Each department prepares a
budget prior to the Overall budget

iv
PART C: FUND ACCOUNTABILITY
Please respond to the following statements by indicating the extent to which you agree
or disagree with the activities. Strongly Disagree (1) Disagree (2) Not sure (3) Agree
(4) Strongly Agree (5).Tick your choice
S/N Questions Please tick in the appropriate box provided
Strongly
disagree
(1)
Disagree
(2)
Not sure
(3)
Agree
(4)
Strongly
Agree
(5)
1 Financial transactions are
recorded immediately upon
occurrence
2 Financial transactions are
approved before implementation
3 Financial transactions have
adequate supporting
documentation
4 Financial documentation is
reviewed for completeness
5 Fund accountability reports meet
approved standards
6 Fund accountabilities are
periodically audited independently
7 The Auditors recommendations

v
are implemented by management
8 The Auditors recommendations
are implemented by management

vi
PART D: VARIANCE ANALYSIS
Please respond to the following statements by indicating the extent to which you agree or
disagree with the activities. Statement Strongly Disagree (1) Disagree (2) Not Sure (3) Agree (4)
Strongly Agree (5).
S/N Questions Please tick in the appropriate box provided
Strongly
disagree
(1)
Disagree
(2)
Not sure
(3)
Agree
(4)
Strongly
Agree
(5)
1 Managers hold budget conferences
/meetings regularly to review
performance
2 We have budget policies to check on
spending
3 Control of the budget activities is
done by the head of departments
4 The costs of activities are always
reviewed by the executive committee
5 Budget performance evaluation
reports are prepared regularly
6 Budget deviations are reported to
budget committee/Executives
7 The deviations from the budget
targets are frequently reported
8 Managers always take timely

vii
corrective actions when adverse
variances are reported
9 There is a regular follow up on
budget plans by the budget
committee/departmental heads
Thank you for your time and God Bless You.

i
Appendix 2: Interview guide for Cardno SDS Programme management
UGANDA MANAGEMENT INSTITUTE
MASTER OF BUSINESS ADMINISTRATION
INTERVIEW GUIDE
PART A: GENERAL QUESTIONS
1. Understand the respondent better i.e. name, department, duration spent in the
organization.
2. Get the respondents understanding of the organizations average annual revenue.
3. Get the respondents understanding of how often the budget is reviewed.
PART B: BUDGETARY PROCESS
1. Establish whether there are approved policies and procedures.
2. Assess stakeholder’s involvement in the budgeting process.
3. Evaluate the extent to which budgets are shared in the organization.
4. Inquire whether leadership and support is provided to all subordinates by
managers during the budgeting process.

ii
PART C: FUND ACCOUNTABILITY
1. Evaluate the approval process of financial transactions.
2. Assess how financial transactions are supported in the organization.
3. Establish whether review of financial transactions is conducted and by whom.
4. Establish whether the financial statements are examined by an Independent
Auditors the major findings.

iii
PART D: VARIANCE ANALYSIS
1. Establish whether Management regularly conducts budgetary performance
reviews.
2. Assess the Budget analysis process.
3. Establish whether deviations from the budget targets are frequently reported.
4. Assess whether Managers always take corrective action on identified adverse
variances

i
Appendix 3: Documentary review guide
UGANDA MANAGEMENT INSTITUTE
MASTER OF BUSINESS ADMINISTRATION
DOCUMENTARY REVIEW GUIDE
Study entity: Cardno SDS Programme
S/No. Document to be reviewed Area of interest Completion
status
Remarks
1 Policy manuals
Establish approved
procedures
2 Audited financial statements
Major findings per Auditors
report and Management letter
3 News Letters
Reported periodic financial
and activities status
4 News papers
Reported topical related
issues
Copyright © 2022 FDOKUMEN