financial performance analysis of debre birhan natural spring ...
52
i ST.MERY’S UNIVERSITY SCHOOL OF GRADUATE STUDIES FACULTY OF BUSINESS FINANCIAL PERFORMANCE ANALYSIS OF DEBRE BIRHAN NATURAL SPRING WATER PLC By Solomon Gizaw APPROVED BY BOARD OF EXAMINERS _________________________________ ____________________________ Dean, School of Business Date and Signature _________________________________ ____________________________ Advisor Date and Signature _________________________________ ____________________________ External Examiner Date and Signature _________________________________ ____________________________ Internal Examiner Date and Signature
-
Upload
khangminh22 -
Category
Documents
-
view
1 -
download
0
Transcript of financial performance analysis of debre birhan natural spring ...

i
ST.MERY’S UNIVERSITY
SCHOOL OF GRADUATE STUDIES
FACULTY OF BUSINESS
FINANCIAL PERFORMANCE ANALYSIS OF
DEBRE BIRHAN NATURAL SPRING WATER PLC
By
Solomon Gizaw
APPROVED BY BOARD OF EXAMINERS
_________________________________ ____________________________
Dean, School of Business Date and Signature
_________________________________ ____________________________
Advisor Date and Signature
_________________________________ ____________________________
External Examiner Date and Signature
_________________________________ ____________________________
Internal Examiner Date and Signature

ii
Declaration
I declare that this thesis titled as the effect of accounting method on the performance of
DebreBirhan Natural Spring Water PLC, 2016 constitute my original work, that it had not been
submitted for post graduate program in this university or other universities and that all sources of
materials used for the thesis have been properly acknowledged.
Declared by;
Name: Solomon Gizaw
Signature _____________________
St. Mary’s University, Addis Ababa
June 2016

iii
ENDORSEMENT
This thesis has been submitted to St. Mary’s University, School of Graduate Studies, Faculty ofBusiness for examination with my approval as a university advisor.
_________________________ _______________________
Advisor Signature
St. Mary’s University, Addis Ababa June, 2016

iv
ACRONYMS
FASB – Financial Accounting Standard Board
GAAP - Generally Accepted Accounting Standards
DBNSW - DebreBirhan Natural Spring Water
NPAT – Net Profit After Tax
COGS – Cost of Goods Sold
AI – Average Inventory
ITOR – Inventory Turnover Ratio
EPS - Earnings per share
ROCE - Return on capital employed
NPM – Net Profit Margin
NIBT - Net Income Before Tax
NIBTI - Net Income Before Tax & Interest
CR – Cash Ratio
CL – Current Liability
CA – Current Asset
QA – Quick Asset
CTR – Current Ratio

v
List of Tables
Table 4.1 the cash ratio analysis of the company ……………………………………………….19
Table 4.2 The SPSS result of cash ratio of the company ………………………..………………20
Table 4.3 The Quick ratio of the company ……………………………………………..……….21
Table 4.4 The SPSS result of quick ratio of the company……………………………......……..22
Table 4.5 the current ratio of the company ………………………….…………………………..24
Table 4.6 The SPSS result of current ratio of the company…………………………………...…24
Table 4.7 Inventory turnover ratio of the company …………………………………………..…26
Table 4.8 The SPSS result of inventory turnover ratio of the company …………...……………27
Table 4.9 The Earnings per share of the company ………………………………………...…….28
Table 4.10 The SPSS result of Earnings per share of the company …………………….………29
Table 4.11 Net profit margin of the company ………………………………………………..….30
Table 4.12 The SPSS result of Net profit margin of the company ………………………..…….31
Table 4.13 Return on capital employed of the company …………………………………….….32
Table 4.14 The SPSS result of return on capital employed of the company…………………....33
Table 4.15 the debt to equity ratio of the company ………………………………………….….35
Table 4.16 The SPSS result of debt to equity ratio of the company……………………………..35

vi
ABSTRACT
Through financial analysis, companies can review their performance in the past years which
enables also helping in identifying their weaknesses and improving on them. Ratio analysis used
to reveal the trends in production which provides an opportunity for estimation of future trends
and thus the foundation for budget planning so as to determine the course of action for the growth
and development of the business. Due to such analysis and measurements most companies loss
their retained earnings and become liquidated. The study conducted by collecting secondary data
from the company audited financial statements. The descriptive type of research design is used to
data analysed accordingly. The performance indicators such liquidity, profitability and leverage
ratios are analysed in line with the industry average norms and conclusion and recommendations
are stated as ; in order to have a better earning management and better financial analysis results in
relation profitability, the company has to implement better cost reduction strategies by cutting off
costs and also strategies for more production techniques which enable to increase the sales
volume of the company, In order to have a strong ability in relation to liquidity the company has
to increase its sales which enables to have more cash inflows and also has to reduce its current
liability by using long term financing, In order to have better leverage ration the company’s
shareholders has to increase their number of shares by investing themselves or inviting the
external investors to join which increases the number of share and the cash position of the
company.

vii
Table of Contents
Table of contents……………………………………………………………………………….vii
CHAPTER ONE ...........................................................................................................................1
INTRODUCTION ........................................................................................................................1
1.1 Background of the study .....................................................................................................1
1.2 Statement of the problem ....................................................................................................4
1.3 Basics research questions ....................................................................................................4
1.4 Objective of the study .........................................................................................................4
1.4.1 General objective ..........................................................................................................4
1.4.2 Specific objective .........................................................................................................4
1.5 Scope of the study ...............................................................................................................5
1.6 Significance of the study .....................................................................................................5
1.7 Limitations of Research ......................................................................................................5
CHAPTER TWO ..........................................................................................................................6
LITRATURE REVIEW................................................................................................................6
2.1 Liquidity ratios ....................................................................................................................7
2.1.1 Acid-Test Ratio.............................................................................................................7
2.1.2 Cash Ratio.....................................................................................................................8
2.1.3 Current ratio..................................................................................................................8
2.1.4 Working capital ............................................................................................................9
2.2 Profitability ratios..............................................................................................................11
2.2.1 Inventory turnover ......................................................................................................11
2.2.2 Earnings per share ......................................................................................................12
2.2.3 Net profit margin (or profit margin, net margin, return on revenue)..........................13
2.2.4 Return on capital employed (ROCE)..........................................................................14
2.3 Leverage ratio....................................................................................................................14

viii
CHAPTER THREE ....................................................................................................................16
RESEARCH METHODOLOGY................................................................................................16
2.1 Research design and methods ...........................................................................................16
2.2 Method and sources of data collection ..............................................................................17
2.3 Method of data analysis ....................................................................................................17
2.4 Research ethical consideration ..........................................................................................17
CHAPTER FOUR.......................................................................................................................18
DATA ANALYSIS.....................................................................................................................18
4.1 Financial ratio analysis......................................................................................................18
4.1.1 Liquidity Ratios ..........................................................................................................18
4.1.1.1 Cash Ratio................................................................................................................18
4.1.1.2 Quick ratio ...............................................................................................................21
4.1.1.3 Current ratio or working capital ratio ......................................................................22
4.1.2 Profitability Ratios .........................................................................................................25
4.1.2.1 Inventory turnover ratio...........................................................................................25
4.1.2.2 Earnings per share ...................................................................................................27
4.1.2.3 Net Profit Margin Ratio...........................................................................................29
4.1.2.4 Return on Capital Employed ...................................................................................31
4.1.3 Leverage ratio.................................................................................................................33
4.1.3.1 Debt to equity ratio ..................................................................................................33
CHAPTER FIVE ........................................................................................................................36
CONCLUSIONS AND RECOMMENDATIONS .....................................................................36
5.1 CONCLUSIONS...............................................................................................................36
5.2 Recommendations .............................................................................................................37
References...................................................................................................................................39

ix

1
CHAPTER ONE
INTRODUCTION
1.1 Background of the study
Financial statement analysis can be referred as a process of understanding the risk and
profitability of a company by analyzing reported financial information, especially annual and
quarterly reports. Financial statement analysis is an extremely useful tool in understanding
the financial performance of any company. It allowsdetermining a business’s current position
with regards to its commercial strengths (e.g. Customer base) and weaknesses (e.g. Volatile
costs). Financial statement analysis is a study about accounting ratios among various items
included in the balance sheet. These ratios include asset utilization ratios, profitability ratios,
leverage ratios, liquidity ratios, and valuation ratios. Moreover, financial statement analysis is a
quantifying method for determining the past, current, and prospective performance of a
company (Bruce Mackenzie).
According to Brigham & Houston,there different advantages of financial statement analysis.
These are; providing an idea to the investors about deciding on investing their funds in a
particular company, ensuring the regulatory authorities (like IASB) that the company was
following the required accounting standards, it helps the government agencies in analyzing the
taxation owed to the firm, and above all, the company is able to analyze its own performance
over a specific time period.Financial statement analysis is an exceptionally powerful tool for a
variety of users of financial statements, each having different objectives in learning about the
financial circumstances of the entity. There are a number of users of financial statement
analysis. They are: Creditors, anyone who has lent funds to a company is interested in its
ability to pay back the debt, and so will focus on various cash flow measures. Investors, both
current and prospective investors examine financial statements to learn about a company's
ability to continue issuing dividends, or to generate cash flow, or to continue growing at its
historical rate (depending upon their investment philosophies). Management, the company
controller prepares an ongoing analysis of the company's financial results, particularly in
relation to a number of operational metrics that are not seen by outside entities.

2
There are two key methods for analyzing financial statements. The first method is the use of
horizontal analysis. Horizontal analysis is the comparison of financial information over a series
of reporting periods, while vertical analysis is the proportional analysis of a financial
statement, where each line item on a financial statement is listed as a percentage of another
item. Typically, this means that every line item on an income statement is stated as a
percentage of gross sales, while every line item on a balance sheet is stated as a percentage of
total assets. Thus, horizontal analysis is the review of the results of multiple time periods,
while vertical analysis is the review of the proportion of accounts to each other within a single
period. The second method for analyzing financial statements is the use of many kinds of
ratios. There are several general categories of ratios, each designed to examine a different
aspect of a company's performance. The general groups of ratios are: Liquidity ratios, this is
the most fundamentally important set of ratios, because they measure the ability of a company
to remain in business. Leverage ratios, which reveal the extent to which a company is relying
upon debt to fund its operations, and its ability to pay back the debt. Profitability ratios, these
ratios measure how well a company performs in generating a profit (Steven Bragg).
A company’s financial statements provide various financial information that investors and
creditors use to evaluate a company’s financial performance. Financial statements are also
important to a company’s managers because by publishing financial statements, management
can communicate with interested outside parties about its accomplishment running the
company. Different financial statements focus on different areas of financial performances. Of
those the first is financial conditions which are the major concern to investors and creditors. As
capital providers, investors and creditors rely on a company’s financial condition for both the
safety and profitability of their investments. More specifically, investors and creditors need to
know where their money went and where it is now. The financial statement of balance sheet
addresses such issues by providing detailed information about a company’s asset investment.
The balance sheet also lists a company’s outstanding debt and equity components, and so debt
and equity investors can better understand their relative positions in a company’s capital mix.
The second focus is on the performance of operating results which are shown in the balance
sheet of a company’s assets, liabilities and equity at the end of a financial reporting period,
they don’t reveal what happened during the period from operations that may have caused
changes in financial conditions. Therefore, operating results during the period also concerns

3
investors. The financial statement of the income statement reports operating results such as
sales, expenses and profits or losses. Using the income statement, investors can both evaluate a
company’s past income performance and assess the uncertainty of future cash flows. The third
focus area of performance was a cash flow of a company’s profits reported in the income
statement are accounting income and most likely contain certain non-cash elements, providing
no direct information on a company’s cash exchange during the period. Moreover, a company
also incurs cash inflows and outflows during a period from other non-operating activities,
namely investing and financing. The fourth focus area of performance was on shareholders’
equity which is especially important to equity investors because it shows the changes in
various equity components, including retained earnings, during a period. The amount of
shareholders’ equity is a company’s total assets minus its total liabilities, representing the
company’s net worth. A steady growth in a company’s shareholders’ equity by way of
increasing retained earnings, as opposed to expanding shareholder base, means the
accumulation of investment returns for current equity shareholders (Elliot, Barry & Elliot,
Jamie ).
Ratio analysis enables to determine profitability. It assists managers to work out the production
of the company by figuring the profitability ratios and also the management can evaluate their
revenues to check with their productivity which helps the company in appraising its
profitability performance. Ratio analysis helps in evaluating solvency. The companies are able
to keep an eye on the correlation between the assets and the liabilities, in any case, the
liabilities exceed the assets, and the company is able to know its financial position which
enables set up a plan for loan repayment.Ratio analysis is also helpful to recluses, in addition to
shareholders, debenture holders, and creditors. Besides, bankers are also able to know the
profitability of the company to find out whether they are able to pay the dividend and interests
under a specific period.Ratio analysis is also helpful in analyzing the performance of a
company. Through financial analysis, companies can review their performance in the past
years which enables also helping in identifying their weaknesses and improving on them. Ratio
analysis used to reveal the trends in production which provides an opportunity for estimation of
future trends and thus the foundation for budget planning so as to determine the course of
action for the growth and development of the business (Johnstone).
4
1.2 Statement of the problem
Nowadays the former and well known water bottling companies are becoming liquidated and
lose their company retained earnings. These study paper titled as “Financial Performance
Analysis of DebreBirhan Natural Spring Water plc” aims to evaluate and analyze the financial
performances in relation to balance sheet and income statement accounts.
1.3 Basics research questions
The study paper analyze the financial statements of DebreBirhan Natural Spring Water plc of
nine fiscal periods using comparative financial ratios, enables to seek an answer to the
question; what are the norms and industry figures of the company and the water bottling
sectors using liquidity, profitability and leverage?
1.4 Objective of the study
1.4.1 General objective
The general objective of the study was analyzing of the financial performance of DebreBirhan
Natural Spring Water PLC by using financial tools.
1.4.2 Specific objective
Moreover, this study specifically aims to meet the following objectives:
To determine the liquidity, profitability and leverage of the company
To determine norms and industry figures of the company
At last it states the findings and their recommendation

5
1.5 Scope of the study
The study coversalmost the entire area of financial operations of the company. The study has
been conducted with the help of data obtained from audited financial records. The audited
financial records are the company annual reports pertaining to past 9 years from 2006 to
2014.The study analyses and measures the financial performance of the organization by using
performance evaluation indicators in relation to liquidity, profitability and leverage by using
financial analysis.
1.6 Significance of the study
Financial analysis determines a company's health and stability. The study has importance for
the users of financial information that investors and creditors to evaluate a company’s financial
performance. Stockholders can find out how management employs resources and whether they
use them properly. Governments and regulatory authorities use financial statements to
determine the legality of a company's fiscal decisions and to use the financial statement
analysis to decide the correct taxation for the company. The study enables to know what’s
happening among a company’s competitors and when make an investment decision. It also
enables the organization to compare its performance with the industry standards to measure
investment opportunities such as the success or failure.
1.7 Limitations of Research
Every research work has its own limitation. The main limitations of this paper are inadequate
time which is not possible to analyze allrespects relevant to the study, the analysis is based on
annual reports of the company in which the accuracy and reliability of analysis depends on
reliability of figures derived from financial statement.

6
CHAPTER TWO
LITRATURE REVIEW
Financial accounting is the process of systematic recording of the business transactions in the
various books of accounts maintained by the organization with the ultimate intention of
preparing the financial statement there from. Financial performance analysis is the process of
identifying the financial strengths and weaknesses of the firm by properly establishing the
relationship between the items of balance sheet and profit and loss account. It also helps in
short-term and long-term forecasting and growth can be identified with the help of financial
performance analysis. The dictionary meaning of ‘analysis’ is to resolve or separate a thing in
to its element or components parts for tracing their relation to the things as whole and to each
other.
According to John.N.Meyer, “The financial statement provides summary of accounts of a
business enterprise, the balance sheet reflecting assets, liabilities and capital as on a certain
date and the income statement showing the result of operation during a certain period”. The
financial statements are prepared with a view to depict the financial position of the concern.
They are based on the recorded facts and are usually expressed in monetary terms. The
financial statement are prepared periodically that is generally for the accounting period. The
term financial statement has been widely used to represent two statements prepared by
accountants at the end of specific period. They are: Profit and loss a/c or income statement and
balance sheet or statement of financial position.
Ratio analysis is an important technique. It is a powerful tool of financial Analysis. It is
defined as “The indicated quotient of two mathematical expressions” and as “the relationship
between two or more things”.Systematic use of ratio is to interpret the financial statement so
that the strength and weakness of a firm as well as its historical performance and current
financial condition can be determined.A ratio is only comparison of the numerator with the
denominator .The term ratio refers to the numerical or quantitative relationship between two
figures. Thus, ratio is the relationship between two figures and obtained by dividing a former
by the latter. Ratios are designed show how one number is related to another.The data given in
the financial statements are in absolute form and are dumb and are unable to communicate

7
anything. Ratios are relative form of financial data and are very useful technique to check upon
the efficiency of a firm. Some ratios indicate the trend or progress or downfall of the firm.
2.1 Liquidity ratios
Liquidity ratios are the ratios that measure the ability of a company to meet its short term debt
obligations. These ratios measure the ability of a company to pay off its short-term liabilities
when they fall due. The liquidity ratios are a result of dividing cash and other liquid assets by
the short term borrowings and current liabilities. They show the number of times the short term
debt obligations are covered by the cash and liquid assets.
If the value is greater than 1, it means the short term obligations are fully covered.Generally,
the higher the liquidity ratios are, the higher the margin of safety that the company possesses to
meet its current liabilities. Liquidity ratios greater than 1 indicate that the company is in good
financial health and it is less likely fall into financial difficulties.
Most common examples of liquidity ratios include current ratio, acid test ratio (also known as
quick ratio), cash ratio and working capital ratio. Different assets are considered to be relevant
by different analysts. Some analysts consider only the cash and cash equivalents as relevant
assets because they are most likely to be used to meet short term liabilities in an emergency.
Some analysts consider the debtors and trade receivables as relevant assets in addition to cash
and cash equivalents. The value of inventory is also considered relevant asset for calculations
of liquidity ratios by some analysts.
2.1.1 Acid-Test Ratio
The term “Acid-test ratio” is also known as quick ratio. The most basic definition of acid-test
ratio is that, “it measures current (short term) liquidity and position of the company”. To do the
analysis accountants weight current assets of the company against the current liabilities which
result in the ratio that highlights the liquidity of the company.
The formula for the acid-test ratio is:
Quick ratio = (Current Assets – Inventory) / Current liabilities

8
This concept is important as if the company’s financial statements (income statement, balance
sheet) get through the analysis of the acid-test ratio, then the short term debts can be paid by
the company.
2.1.2 Cash Ratio
Cash ratio (also called cash asset ratio) is the ratio of a company's cash and cash equivalent
assets to its total liabilities. Cash ratio is a refinement of quick ratio and indicates the extent to
which readily available funds can pay off current liabilities. Potential creditors use this ratio as
a measure of a company's liquidity and how easily it can service debt and cover short-term
liabilities. Cash ratio is the most stringent and conservative of the three liquidity ratios (current,
quick and cash ratio). It only looks at the company's most liquid short-term assets – cash and
cash equivalents – which can be most easily used to pay off current obligations.
Calculation (formula)
Cash ratio is calculated by dividing absolute liquid assets by current liabilities:
Cash ratio = Cash and cash equivalents / Current Liabilities
Both variables are shown on the balance sheet (statement of financial position).
Norms and Limits of cash ratio
Cash ratio is not as popular in financial analysis as current or quick ratios, its usefulness is
limited. There is no common norm for cash ratio. In some countries a cash ratio of not less than
0.2 is considered as acceptable. But ratios that are too high may show poor asset utilization for
a company holding large amounts of cash on its balance sheet.
2.1.3 Current ratio
Current ratio is balance-sheet financial performance measure of company liquidity. Current
ratio indicates a company's ability to meet short-term debt obligations. The current ratio
measures whether or not a firm has enough resources to pay its debts over the next 12 months.
The current ratio is balance-sheet financial performance measure of company liquidity. The
current ratio indicates a company's ability to meet short-term debt obligations. The current

9
ratio measures whether or not a firm has enough resources to pay its debts over the next 12
months. Potential creditors use this ratio in determining whether or not to make short-term
loans. The current ratio can also give a sense of the efficiency of a company's operating cycle
or its ability to turn its product into cash. The current ratio is also known as the working capital
ratio.
Calculation (formula)
The current ratio is calculated by dividing current assets by current liabilities:
The current ratio = Current Assets / Current Liabilities
Both variables are shown on the balance sheet (statement of financial position).
Norms and Limits of current ratio
The higher the ratio, the more liquid the company is. Commonly acceptable current ratio is 2;
it's a comfortable financial position for most enterprises. Acceptable current ratios vary from
industry to industry. For most industrial companies, 1.5 may be an acceptable current ratio.
Low values for the current ratio (values less than 1) indicate that a firm may have difficulty
meeting current obligations. However, an investor should also take note of a company's
operating cash flow in order to get a better sense of its liquidity. A low current ratio can often
be supported by a strong operating cash flow.
If the current ratio is too high (much more than 2) , then the company may not be using its
current assets or its short-term financing facilities efficiently. This may also indicate problems
in working capital management. All other things being equal, creditors consider a high current
ratio to be better than a low current ratio, because a high current ratio means that the company
is more likely to meet its liabilities which are due over the next 12 months.
2.1.4 Working capital
Working capital is the amount by which the value of a company's current assets exceeds its
current liabilities. It was also called net working capital. Sometimes the term "working capital"
is used as synonym for "current assets" but more frequently as "net working capital", i.e. the
10
amount of current assets that is in excess of current liabilities. Working capital is frequently
used to measure a firm's ability to meet current obligations. It measures how much in liquid
assets a company has available to build its business.
Working capital is a common measure of a company's liquidity, efficiency, and overall health.
Decisions relating to working capital and short term financing are referred to as working
capital management. These involve managing the relationship between an entity's short-term
assets (inventories, accounts receivable, cash) and its short-term liabilities.
Calculation (formula)
Working capital (net working capital) = Current Assets - Current Liabilities
Both variables are shown on the balance sheet (statement of financial position).
Norms and Limits of working capital
The number can be positive (acceptable values) or negative (unsafe values), depending on how
much debt the company is carrying. Positive working capital generally indicates that a
company is able to pay off its short-term liabilities almost immediately. In general, companies
that have a lot of working capital will be more successful since they can expand and improve
their operations.Companies with negative working capital may lack the funds necessary for
growth. Analysts are sensitive to decreases in working capital; they suggest a company is
becoming overleveraged, is struggling to maintain or grow sales, is paying bills too quickly, or
is collecting receivables too slowly. Though in some businesses (such as grocery retail)
working capital can be negative (such business is being partly funded by its suppliers).
2.2 Profitability ratios
It measures a company’s ability to generate earnings relative to sales, assets and equity. These
ratios assess the ability of a company to generate earnings, profits and cash flows relative to
relative to some metric, often the amount of money invested. They highlight how effectively
the profitability of a company is being managed.
Common examples of profitability ratios include return on sales, return on investment, return
on equity, return on capital employed (ROCE), gross profit margin and net profit margin. All

11
of these ratios indicate how well a company is performing at generating profits or revenues
relative to a certain metric. For most of these ratios, a higher value is desirable. A higher value
means that the company is doing well and it is good at generating profits, revenues and cash
flows.
2.2.1 Inventory turnover
Inventory turnover is a measure of the number of times inventory is sold or used in a given
time period such as one year. It is a good indicator of inventory quality (whether the inventory
is obsolete or not), efficient buying practices, and inventory management. This ratio is
important because gross profit is earned each time inventory is turned over. It was also
called stock turnover.
Calculation (formula)
Inventory turnover is calculated by dividing the cost of goods sold by the average inventory
level ((beginning inventory + ending inventory)/2):
Inventory turnover = Cost of goods sold / Average Inventory
In the income statement (statement of comprehensive income, IFRS) cost of goods sold
(COGS) is named "Cost of sales". The number of days in the period can then be divided by the
inventory turnover formula to calculate the number of days it takes to sell the inventory on
hand or "inventory turnover days":
Days inventory outstanding = 365 / Inventory turnover
Norms and Limits of inventory turnover
There is no general norm for the inventory turnover ratio; it should be compared against
industry averages. A relatively low inventory turnover may be the result of ineffective
inventory management (that is, carrying too large an inventory) and poor sales or carrying out-
of-date inventory to avoid writing off inventory losses against income. Normally a high
number indicates a greater sales efficiency and a lower risk of loss through un-saleable stock.
However, too high an inventory turnover that is out of proportion to industry norms may
suggest losses due to shortages, and poor customer-service.A high value for inventory turnover

12
usually accompanies a low gross profit figure. This means that a company needs to sell a lot of
items to maintain an adequate return on the capital invested in the company.
2.2.2 Earnings per share
Earnings per share (EPS) are the portion of the company’s distributable profit which is
allocated to each outstanding equity share (common share). Earnings per share are a very good
indicator of the profitability of any organization, and it is one of the most widely used
measures of profitability.
The earning per share is a useful measure of profitability, and when compared with EPS of
other similar companies, it gives a view of the comparative earning power of the companies.
EPS when calculated over a number of years indicates whether the earning power of the
company has improved or deteriorated. Investors usually look for companies with steadily
increasing earnings per share. Growth in EPS is an important measure of management
performance because it shows how much money the company is making for it’s shareholders,
not only due to changes in profit, but also after all the effects of issuance of new shares (this is
especially important when the growth comes as a result of acquisition).
Calculation (formula)
The EPS is calculated by dividing net profit after taxes and preference dividends by the
number of outstanding equity shares. This can be expressed in terms of the following formula:
Earnings per share = (Net Profit after Taxes – Preference Dividends) / No of Equity
Shares
If the capital structure changes (i.e. the number of shares changes) during the reporting period,
a weighted average number of equity shares is used to for the calculations of EPS.
Norms and Limits of earning per share
It should be noted that two different companies could generate the same EPS but one could do
so with a lesser equity. All other things being equal, this company is better than the other one
because it is more efficient at using its capital for generating profits. It is important that the

13
investors do not rely on only measure of earnings per share for making investment decisions.
Instead they should use in conjunction with other measures and financial statement analysis.
2.2.3 Net profit margin (or profit margin, net margin, return on revenue)
It is a ratio of profitability calculated as after-tax net income (net profits) divided by sales
(revenue). Net profit margin is displayed as a percentage. It shows the amount of each sales
dollar left over after all expenses have been paid. Net profit margin is a key ratio of
profitability. It is very useful when comparing companies in similar industries. A higher net
profit margin means that a company is more efficient at converting sales into actual profit.
The profit margin ratio, also called the return on sales ratio or gross profit ratio, is a
profitability ratio that measures the amount of net income earned with each Birr of sales
generated by comparing the net income and net sales of a company. In other words, the profit
margin ratio shows what percentage of sales are left over after all expenses are paid by the
business.
Calculation (formula) of net profit margin
Net profit margin = Profit (after tax) / Revenue
Both variables are shown on the income statement or statement of comprehensive income.
2.2.4 Return on capital employed (ROCE)
It is a measure of the returns that a business is achieving from the capital employed, usually
expressed in percentage terms. Capital employed equals a company's Equity plus Non-current
liabilities (or Total Assets − Current Liabilities), in other words all the long-term funds used by
the company. ROCE indicates the efficiency and profitability of a company's capital
investments.ROCE should always be higher than the rate at which the company borrows
otherwise any increase in borrowing will reduce shareholders' earnings, and vice versa; a good
ROCE is one that is greater than the rate at which the company borrows.

14
Calculation (formula) of ROCE
ROCE = EBIT / Capital Employed = EBIT / (Equity + Non-current Liabilities) = EBIT /
(Total Assets - Current Liabilities)
A more accurate variation of this ratio is return on average capital employed (ROACE), which
takes the average of opening and closing capital employed for the time period. One limitation
of ROCE is the fact that it does not account for the depreciation and amortization of the capital
employed. Because capital employed is in the denominator, a company with depreciated assets
may find its ROCE increases without an actual increase in profit.
2.3 Leverage ratio
Financial leverage can be aptly described as the extent to which a business or investor is using
the borrowed money. Business companies with high leverage are considered to be at risk of
bankruptcy if, in case, they are not able to repay the debts, it might lead to difficulties in
getting new lenders in future. It is not that financial leverage is always bad. However, it can
lead to an increased shareholders’ return on investment. Also, very often, there are tax
advantages related with borrowing, also known as leverage.
Calculating financial leverage
Financial leverage indicates the reliability of a business on its debts in order to operate.
Knowing about the method and technique of calculating financial leverage can help you
determine a business’ financial solvency and its dependency upon its borrowings.
The key steps involved in the calculation of Financial Leverage are:Compute the total debt
owed by the company. This counts both short term as well as long term debt, also including
commodities like mortgages and money due for services provided.Estimate the total equity
held by the shareholders in the company. This requires multiplying the number of outstanding
shares by the stock price. The total amount thus obtained represents the shareholder
equity.Divide the total debt by total equity. The quotient thus obtained represents the financial
leverage ratio.

15
Formula of leverage ratio
The most well-known financial leverage ratio is the debt-to-equity ratio (see also debt ratio,
equity ratio). It is calculated as:
Total debt / Shareholders Equity
Norms and Limits of leverage ratio
If the financial leverage ratio of a company is higher than 2-to-1, it indicates financial
weakness. If the company is leveraged highly, it is considered to be near bankruptcy. Also, it
might not be able to secure new capital if it is incapable of meeting its current obligations.
The ratios used to determine about the companies’ financing methods, or the ability to meet the
obligations. There are many ratios to calculate leverage but the important factors include debt,
interest expenses, equity and assets. The most important leverage ratio is the debt to equity
ratio that gives you an idea about the debt one company is in and the equity it has at its
disposal. It can also be said that leverage ratios tend to find the debt a company has on its
balance sheet or its financial health. For a shareholder the first claim he has is against the
company’s assets, therefore a company might not be left with nothing in the phase of
bankruptcy after satisfying the debt holders besides the assets. The most well-known debt to
equity ratio determines the risk that a company is in if it has taken tones of death. Companies
with less debt equity ratio are less risky than the companies having a high ratio. It is important
for a shareholder to look at the financial ratios in order to invest in it. The formula for debt to
equity ratio is:
Debt/Equity = (Short term debt + Long term debt)/Equity

16
CHAPTER THREE
RESEARCH METHODOLOGY
This chapter presents the detail of methodology which showthe frame work that discussed the
research design and method, the method and source of data collection and the method of data
analysis of the study.
2.1 Research design and methods
The research paper used both descriptive and quantitative research in context and in design.
Quantitative data in the sense that it aims to draw out conclusions from the financial data
gathered, summarized, and processes. As a research procedure, the researcher obtained the
audited financial statements for the last nine periods (2006 to 2014) of DebreBirhan Natural
Spring Water plc. Financial information’s which are necessary for financial performance
analysis were derived from these financial statements. These were then summarized and
processed to come up with comparative financial ratios and computed in the statistical package
for social science computer package to obtain the descriptive results of the mean and standard
deviation that were used in the analysis phase was compared with the norms and industry
average figures of the standard financial ratios.
2.2 Method and sources of datacollection
To analyze and measure the financial performance analysis of the company the secondary data
collection method wereused. The study used the past nine year’s data from the audited
financial statements of the company. In addition the study used various reports, books, journals
and different website sources which are related to the study objectives.

17
2.3 Method of data analysis
To describe the financial performance analysis of DebreBirhan Natural Spring Water plc the
quantitative data were analyzed and interpreted by using descriptive method of data analysis.
The data that was collected through secondary source which was the audited financial
statements were analyzed by using the descriptive statics of the computer application for social
scientists of various financial ratio indicators for evaluating the financial performance analysis
of the company.
For much easier to read and understand the data were presented on tabular form to prepare the
result of the financial ratio performance indicators for final analysis and to compare it with
industry average norms and limits of the financial ratios in relation to the liquidity, profitability
and leverage.
2.4 Research ethical consideration
Ethical clearances were primarily obtained from St. Marry University and then permission
from the organization. Finally informed verbal consent wasobtained from the study subjects
and data collection on the basis of voluntarily participation with the company. The obtained
audited financial statements were consumed only for the purpose of academic and any of these
and other information’s are confidential.

18
CHAPTER FOUR
DATA ANALYSIS
4.1 Financial ratio analysis
4.1.1 Liquidity Ratios
Liquidity ratios analyze the ability of a company to pay off both its current liabilities as they
become due as well as their long-term liabilities as they become current. In other words, these
ratios show the cash levels of a company and the ability to turn other assets into cash to pay off
liabilities and other current obligations. Liquidity is not only a measure of how much cash a
business has. It is also a measure of how easy it will be for the company to raise enough cash
or convert assets into cash. Assets like accounts receivable, trading securities, and inventory
are relatively easy for many companies to convert into cash in the short term. Thus, all of these
assets go into the liquidity calculation of a company. The most common liquidity ratios are
cash ratio, current ration, quick ratio, working capital ratio.
4.1.1.1 Cash Ratio
The cash ratio or cash coverage ratio is a liquidity ratio that measures a firm's ability to pay off
its current liabilities with only cash and cash equivalents. The cash ratio is much more
restrictive than the current ratio or quick ratio because no other current assets can be used to
pay off current debt other than cash. This is why many creditors look at the cash ratio. They
want to see if a company maintains adequate cash balances to pay off all of their current debts
as they come due. Creditors also like the fact that inventory and accounts receivable are left out
of the equation because both of these accounts are not guaranteed to be available for debt
servicing. Inventory could take months or years to sell and receivables could take weeks to
collect. Cash is guaranteed to be available for creditors. The cash coverage ratio is calculated
by adding cash and cash equivalents and dividing by the total current liabilities of a company.
Most companies’ list cash and cash equivalents together on their balance sheet, but some
companies list them separately. Cash equivalents are investments and other assets that can be
converted into cash within 90 days. These assets are so close to cash that GAAP considers

19
them an equivalent. Current liabilities are always shown separately from long-term liabilities
on the face of the balance sheet.
The analysis of cash ratio shows how well a company can pay off its current liabilities with
only cash and cash equivalents. This ratio shows cash and equivalents as a percentage of
current liabilities. A ratio of 1 means that the company has the same amount of cash and
equivalents as it has current debt. In other words, in order to pay off its current debt, the
company would have to use all of its cash and equivalents. A ratio above 1 means that all of
the current liabilities can be paid with cash and equivalents. A ratio below 1 means that the
company needs more than just its cash reserves to pay off its current debt. As with most
liquidity ratios, a higher cash coverage ratio means that the company is more liquid and can
more easily fund its debt. Creditors are particularly interested in this ratio because they want to
make sure their loans will be repaid. Any ratio above 1 is considered to be a good liquidity
measure.
Table 4.1 the cash ratio analysis of the company
Fiscal period
Reported Balance Sheet data’s
Cash CL CR
JULY 7,2006 323,477 2,556,771 0.13
JULY 7,2007 1,782,836 3,111,526 0.57
JULY 7,2008 606,543 3,103,669 0.2
JULY 7,2009 424,961 5,616,857 0.08
JULY 7,2010 1,033,262 4,074,119 0.25
JULY 7,2011 1,049,801 4,856,238 0.22
JULY 7,2012 527,416 6,303,107 0.08
JULY 7,2013 16,200,988 6,129,887 2.64
JULY 7,2014 1,024,416 15,654,089 0.07
Total 22,973,700 51,406,263 0.45
Source; Audited financial statement of DBNSW

20
Table 4.2 The SPSS result of cash ratio of the company
Case Processing Summary
RPSL Ratio Statistics of CASH / CL
Count Mean 0.47
Overall 9 Median 0.195
Excluded 0 Weighted Mean 0.447
Total 9 Std. Deviation 0.83
Source; Audited financial statement of DBNSW
The above table describes the cash ratio of the company. Based on the audited financial
statement of the company nine years data was analyzed. To analyze cash ratio of the
company’s nine years data the SPSS package was used. To analyze the descriptive statistics of
ratio the cash and the current liability was entered in the system as an input data by considering
the variables. The SPSS system result of case processing summary result shows the included
and excluded data input of the reported cash and cash balances of those data nine were
included and the other none was excluded. These are because for analyzing input data the
system considers all of the reported cash and current liability amounts for all periods. The total
of cash balances for all periods was 22,973,700 and the current liability was 51,406,263. The
cash ratio of nine periods was 0.447, which mean that in order to pay 1 Birr the entire current
liability the company’s cash amount was .45 cents. From these the company ability to cover
debt with only cash was unsatisfied and had a liquidity problem. The highest cash ratio from
all years was during fiscal period 2013 which is Birr 2.67 and the lowest was during fiscal
period 2014 which is 0.07 cents.
4.1.1.2 Quick ratio
The quick ratio or acid test ratio is a liquidity ratio that measures the ability of a company to
pay its current liabilities when they come due with only quick assets. Quick assets are current
assets that can be converted to cash within 90 days or in the short-term. Cash, cash equivalents,
short-term investments or marketable securities, and current accounts receivable are considered
quick assets. The acid test of finance shows how well a company can quickly convert
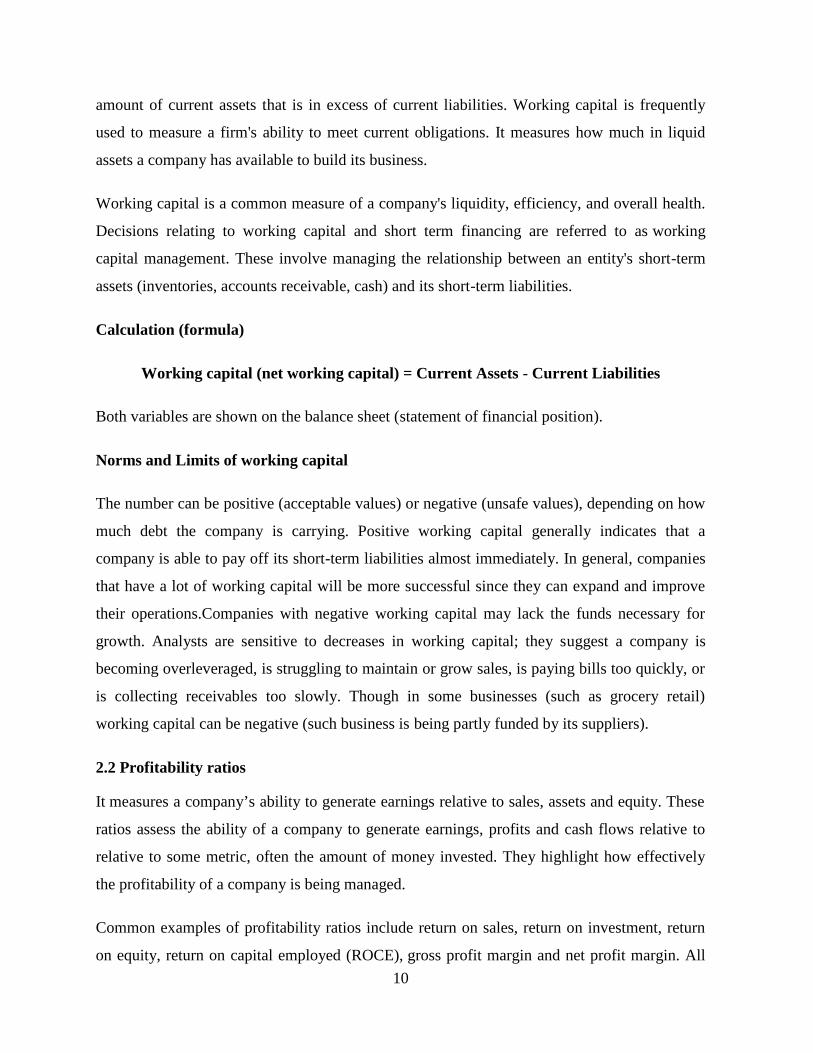
21
its assets into cash in order to pay off its current liabilities. It also shows the level of quick
assets to current liabilities.
The quick ratio is calculated by adding cash, cash equivalents, short-term investments, and
current receivables together then dividing them by current liabilities. Sometimes company
financial statements don't give a breakdown of quick assets on the balance sheet.
Table 4.3 The Quick ratio of the company
Fiscal period
RPSL
Quick asset Current liability Quick ratio
JULY 7,2006 573,743 2,556,771 0.22
JULY 7,2007 2,268,093 3,111,526 0.73
JULY 7,2008 810,550 3,103,669 0.26
JULY 7,2009 1,428,011 5,616,857 0.25
JULY 7,2010 2,940,295 4,074,119 0.72
JULY 7,2011 3,179,276 4,856,238 0.65
JULY 7,2012 4,415,033 6,303,107 0.7
JULY 7,2013 16,934,447 6,129,887 2.76
JULY 7,2014 25,182,519 15,654,089 1.61
Total 57,731,967 51,406,263 1.12
Source; Audited financial statement of DBNSW
Table 4.4 The SPSS result of quick ratio of the company
Case Processing Summary
Data entered Ratio Statistics for QA / CL
Count Mean 0.88
Overall 9 Median 0.7
Excluded 0 Weighted Mean 1.123
Total 9 Std. Deviation 0.822
Source; Audited financial statement of DBNSW

22
The above table describes the quick ratio of the company. Based on the audited financial
statement of the company nine years data the quick ratio was analyzed. To analyze quick ratio
of the company’s nine years data the SPSS package was used. To analyze the descriptive
statistics of ratio the quick asset and the current liability was entered in the system as an input
data by considering the variables. The SPSS system result of case processing summary result
shows the included and excluded data input of the reported quick asset and current liability of
the nine were included and the other none was excluded. These are because for analyzing input
data the system considers the entire reported quick asset and current liability amounts for all
periods. The total of quick asset balances for all periods was 57,731,967 and the current
liability was 51,406,263. The quick ratio of nine periods was 1.12, which means that in order
to pay 1 Birr the entire current liability the company’s quick assets was Birr 1.12. The highest
quick ratio from all years was during fiscal period 2013 which is Birr 2.76 and the lowest was
during fiscal period 2006 which was 0.22 cents.
4.1.1.3 Current ratio or working capital ratio
The current ratio is a liquidity and efficiency ratio that measures a firm's ability to pay off its
short-term liabilities with its current assets. The current ratio is an important measure of
liquidity because short-term liabilities are due within the next year. This means that a company
has a limited amount of time in order to raise the funds to pay for these liabilities. Current
assets like cash, cash equivalents, and marketable securities can easily be converted into cash
in the short term. This means that companies with larger amounts of current assets will more
easily be able to pay off current liabilities when they become due without having to sell off
long-term, revenue generating assets.
The current ratio is calculated by dividing current assets by current liabilities. This ratio is
stated in numeric format rather than in decimal format. GAAP requires that companies
separate current and long-term assets and liabilities on the balance sheet. This split allows
investors and creditors to calculate important ratios like the current ratio. The current ratio
helps investors and creditors understand the liquidity of a company and how easily that
company will be able to pay off its current liabilities. This ratio expresses a firm's current debt
in terms of current assets. So a current ratio of 2 would mean that the company has 2 times
more current assets than current liabilities. A higher current ratio is always more favorable than

23
a lower current ratio because it shows the company can more easily make current debt
payments. If a company has to sell of fixed assets to pay for its current liabilities, this usually
means the company isn't making enough from operations to support activities.
Since the working capital ratio measures current assets as a percentage of current liabilities, it
would only make sense that a higher ratio is more favorable. A WCR of 1 indicates the current
assets equal current liabilities. A ratio of 1 is usually considered the middle ground. It's not
risky, but it is also not very safe. This means that the firm would have to sell all of its current
assets in order to pay off its current liabilities. A ratio less than 1 is considered risky by
creditors and investors because it shows the company isn't running efficiently and can't cover
its current debt properly. A ratio less than 1 is always a bad thing and is often referred to as
negative working capital. On the other hand, a ratio above 1 shows outsiders that the company
can pay all of its current liabilities and still have current assets left over or positive working
capital.
Table 4.5the current ratio of the company
Fiscal periodRPSL
CA CL CTR
JULY 7,2006 3,143,174 2,556,771 1.23
JULY 7,2007 3,808,135 3,111,526 1.22
JULY 7,2008 7,683,737 3,103,669 2.48
JULY 7,2009 8,705,735 5,616,857 1.55
JULY 7,2010 9,226,919 4,074,119 2.26
JULY 7,2011 7,289,779 4,856,238 1.5
JULY 7,2012 5,922,698 6,303,107 0.94
JULY 7,2013 18,276,726 6,129,887 2.98
JULY 7,2014 33,187,335 15,654,089 2.12
Total 97,244,238 51,406,263 1.89
Source; Audited financial statement of DBNSW

24
Table 4.6 The SPSS result of current ratio of the company
Case Processing Summary
RPSL Ratio Statistics for CA / CL
Count Mean 1.81
Overall 9 Median 1.55
Excluded 0 Weighted Mean 1.892
Total 9 Std. Deviation 0.682
Source; Audited financial statement of DBNSW
The above table describes the quick ratio of the company. Based on the audited financial
statement of the company’s nine years data was analyzed. To analyze current ratio of the
company’s nine years data the SPSS package was used. To analyze the descriptive statistics of
ratio the current asset and the current liability was entered in the system as an input data by
considering the variables. The SPSS system result of case processing summary result shows
the included and excluded data input of the reported current asset and current liability of the
data nine years were included and the other none was excluded. These are because for
analyzing input data the system considers the entire reported current asset and current liability
amounts for all periods. The total of current asset balances for all periods was 97,244,238 and
the current liability was 51,406,263. The current ratio of nine periods was 1.89, which means
that in order to pay 1 Birr the entire current liability the company’s current assets was Birr
1.89. The highest current ratio from all years was during fiscal period 2013 which is Birr 2.98
and the lowest was during fiscal period 2011 which was Birr 1.5.
4.1.2 Profitability Ratios
Profitability ratios compare income statement accounts and categories to show a company's
ability to generate profits from its operations. Profitability ratios focus on a company's return
on investment in inventory and other assets. These ratios basically show how well companies
can achieve profits from their operations. Investors and creditors can use profitability ratios to
judge a company's return on investment based on its relative level of resources and assets. In
other words, profitability ratios can be used to judge whether companies are making enough
operational profit from their assets. In this sense, profitability ratios relate to efficiency ratios

25
because they show how well companies are using their assets to generate profits. Profitability
is also important to the concept of solvency and going concern.
4.1.2.1 Inventory turnover ratio
The inventory turnover ratio is an efficiency ratio that shows how effectively inventory is
managed by comparing cost of goods sold with average inventory for a period. This measures
how many times average inventory is "turned" or sold during a period. In other words, it
measures how many times a company sold its total average inventory Birr amount during the
year. This ratio is important because total turnover depends on two main components of
performance. The first component is finished goods production. If larger amounts of inventory
are manufactured during the year, the company will have to sell greater amounts of inventory
to improve its turnover. If the company can't sell these greater amounts of inventory, it will
incur storage costs and other holding costs. The second component is sales. Sales have to
match inventory purchases otherwise the inventory will not turn effectively.
The inventory turnover ratio is calculated by dividing the cost of goods sold for a period by the
average inventory for that period. Average inventory is used instead of ending inventory
because many companies' production fluctuates greatly throughout the year. Average inventory
is usually calculated by adding the beginning and ending inventory and dividing by two. The
cost of goods sold is reported on the income statement.
Inventory turnover is a measure of how efficiently a company can control its products, so it is
important to have a high turn. This shows the company does not overspend by manufacturing
too much finished goods inventory and wastes resources by storing non-salable inventory. It
also shows that the company can effectively sell the finished products that were manufactured.
This measurement also shows investors how liquid a company's finished goods inventory is.
Finished product inventory is one of the biggest assets manufacturing company’s reports on
its balance sheet. If this finished goods inventory can't be sold, it is worthless to the company.
This measurement shows how easily a company can turn its inventory into cash. Creditors are
particularly interested in this because inventory is often put up as collateral for loans. Banks
want to know that this inventory will be easy to sell. Inventory turns vary with industry.

26
Table 4.7 Inventory turnover ratio of the company
Fiscal periods RPSL
COGS AI ITOR
JULY 7,2006 2,808,429 69,345 41
JULY 7,2007 11,290,669 106,692 106
JULY 7,2008 10,751,621 141,608 76
JULY 7,2009 12,441,648 156,016 80
JULY 7,2010 10,291,253 265,650 39
JULY 7,2011 15,210,202 285,752 53
JULY 7,2012 12,929,779 122,832 105
JULY 7,2013 1,587,257 122,832 13
JULY 7,2014 2,578,858 90,963 28
Total 79,889,716 1,361,689 59
Source; Audited financial statement of DBNSW
Table 4.8 The SPSS result of inventory turnover ratio of the company
Case Processing Summary
RPSLRatio Statistics for
COGS / AVGINV
Count Mean 60.056
Overall 9 Median 53.229
Excluded 0 Weighted Mean 58.67
Total 9 Std. Deviation 33.332
Source; Audited financial statement of DBNSW
The above table describes the inventory turnover ratio of the company. Based on the audited
financial statement of the nine years data average inventory turnover ratio was 59 times, which
means that the company sold its average inventory 59 times during the fiscal years. From the
those nine years the highest inventory turnover was 106 times during the fiscal year 2007 and
the lowest was 13 times the fiscal year 2013.

27
4.1.2.2 Earnings per share
Earnings per share, also called net income per share, is a market prospect ratio that measures
the amount of net income earned per share of stock outstanding. In other words, this is the
amount of money each share of stock would receive if all of the profits were distributed to the
outstanding shares at the end of the year. Earnings per share are also a calculation that shows
how profitable a company is on a shareholder basis. So a larger company's profits per share can
be compared to smaller company's profits per share. Obviously, this calculation is heavily
influenced on how many shares are outstanding. Thus, a larger company will have to split its
earning amongst many more shares of stock compared to a smaller company.
Earnings per share or basic earnings per share is calculated by subtracting preferred dividends
from net income and dividing by the weighted average common shares outstanding. The
preferred dividends are removed from net income in the earnings per share calculation. This is
because EPS only measures the income available to common stockholders. Preferred dividends
are set-aside for the preferred shareholders and can't belong to the common shareholders.
Most of the time earning per share is calculated for year-end financial statements. Since
companies often issue new stock and buy back treasury stock throughout the year, the
weighted average common shares are used in the calculation. The weighted average common
shares outstanding is can be simplified by adding the beginning and ending outstanding shares
and dividing by two.
The analysis of earning per share is the same as any profitability or market prospect ratio.
Higher earnings per share are always better than a lower ratio because this means the company
is more profitable and the company has more profits to distribute to its shareholders. Although
many investors don't pay much attention to the EPS, higher earnings per share ratio often make
the stock price of a company rise. Since so many things can manipulate this ratio, investors
tend to look at it but don't let it influence their decisions drastically.

28
Table 4.9 the Earnings per share of the company
Fiscal period
RPSL
Net income
after tax
Common stock
outstanding EPS
JULY 7,2006 -1,909,083 1,000 -1,909
JULY 7,2007 -2,520,719 1,000 -2,521
JULY 7,2008 1,803,924 1,000 1,804
JULY 7,2009 -158,345 1,000 -158
JULY 7,2010 435,653 1,000 436
JULY 7,2011 -457,433 1,000 -457
JULY 7,2012 -1,852,315 1,000 -1,852
JULY 7,2013 -2,532,902 1,000 -2,533
JULY 7,2014 -418,231 1,000 -418
Total -7,609,451 9,000 -7,609
Source; Audited financial statement of DBNSW
Table 4.10 The SPSS result of Earnings per share of the company
Case Processing Summary
Ratio Statistics for NIAT / CS
Count Mean 1.12E+03
Overall 2 Median 1.12E+03
Excluded 7 Weighted Mean 1.12E+03
Total 9 Std. Dev. 967.514
Source; Audited financial statement of DBNSW
The above tables describe the EPS of the company. Based on the audited financial statement of
the company of the nine years data was analyzed. From those years the company reported a
profit for only two fiscal period’s i.e. (FY 2007, FY 2008, FY 2009 and FY 2010) and a loss
the five fiscal periods i.e. ( FY 2006, FY 2011, FY 2012, FY 2013 and FY 2014). To analyze
the EPS of the company’s nine years data the SPSS package was used. To analyze the

29
descriptive statistics of ratio the net income after tax and the shares outstanding was entered in
the system as an input data by considering the variables. The SPSS system result of case
processing summary result shows the included and excluded data input of the reported profit
statement under straight line method only four were included and the other five was excluded.
These are because for analyzing input data the system considers only the reported profit
amounts for the periods. Based on these analyses during those years the company’s weight
mean of the EPS was 1.12E+03 and the standard deviation was 967.514.
4.1.2.3 Net Profit Margin Ratio
The profit margin ratio, also called the return on sales ratio or gross profit ratio, is a
profitability ratio that measures the amount of net income earned with each Birr of sales
generated by comparing the net income and net sales of a company. In other words, the profit
margin ratio shows what percentage of sales are left over after all expenses are paid by the
business. Creditors and investors use this ratio to measure how effectively a company can
convert sales into net income. Investors want to make sure profits are high enough to distribute
dividends while creditors want to make sure the company has enough profits to pay back its
loans.The return on sales ratio is often used by internal management to set performance goals
for the future. The profit margin ratio formula can be calculated by dividing net income by net
sales. A net sale is calculated by subtracting any returns or refunds from gross sales. Net
income equals total revenues minus total expenses and is usually the last number reported on
the income statement.
The profit margin ratio directly measures what percentage of sales is made up of net income. In
other words, it measures how much profits are produced at a certain level of sales. This ratio
also indirectly measures how well a company manages its expenses relative to its net sales.
That is why companies strive to achieve higher ratios. They can do this by either generating
more revenues why keeping expenses constant or keep revenues constant and lower expenses.
Since most of the time generating additional revenues is much more difficult than cutting
expenses, managers generally tend to reduce spending budgets to improve their profit ratio.
Like most profitability ratios, this ratio is best used to compare like sized companies in the
same industry. This ratio is also effective for measuring past performance of a company.

30
Table 4.11 Net profit margin of the company
Fiscal period
RPSL
NIBT Net sales NPM
JULY 7,2006 -1,909,083 2,270,851 -84%
JULY 7,2007 -2,520,719 13,055,841 -19%
JULY 7,2008 1,803,924 16,910,172 11%
JULY 7,2009 -158,345 18,298,132 -1%
JULY 7,2010 645,186 16,451,527 4%
JULY 7,2011 -457,433 19,882,498 -2%
JULY 7,2012 -1,852,315 16,187,536 -11%
JULY 7,2013 -2,532,902 4,460,853 -57%
JULY 7,2014 -418,231 4,055,494 -10%
Total -7,399,918 111,572,904 -7%
Source; Audited financial statement of DBNSW
Table 4.12 The SPSS result of Net profit margin of the company
Case Processing
SummaryRatio Statistics for NIBT / NS
Count Mean 0.073
Overall 2 Median 0.073
Excluded 7 Weighted Mean 0.073
Total 9 Std. Deviation 0.048
Source; Audited financial statement of DBNSW
The above table describes the net profit margin ratio of the company. Based on the audited
financial statement of the company of the nine years data was analyzed. From those years the
company reported a profit for only two fiscal period’s i.e. (FY 2008, and FY 2010) and a loss
the five fiscal periods i.e. ( FY 2006, FY 2007, FY 2011, FY 2012, FY 2013 and FY 2014). To
analyze the net profit margin of the company’s nine years data the SPSS package was used. To
analyze the descriptive statistics of ratio the net income before tax and the net sales was
entered in the system as an input data by considering the variables. The SPSS system result of

31
case processing summary result shows the included and excluded data input of the reported
profit statement under straight line method only two were included and the other seven was
excluded. These are because for analyzing input data the system considers only the reported
profit amounts for the periods i.e. net income of 1,8003,924 and 645,186 which equals to the
total of 2,449,110 and the net sales 16,910,172 and 16,451,527 which equal to the total
33,361,699. Therefore from those two profitable periods total net income was divided by total
a net sale that provides 7.3% which states that the company obtains a 7.3% profit from the net
sales. And the standard deviation which the difference of net profit during the years divided by
the difference of the net sales was deviated from the mean was 0.048 (4.8%).
4.1.2.4 Return on Capital Employed
Return on capital employed or ROCE is a profitability ratio that measures how efficiently a
company can generate profits from its capital employed by comparing net operating profit to
capital employed. In other words, return on capital employed shows investors how many Birr
in profits each Birr of capital employed generates. ROCE is a long-term profitability ratio
because it shows how effectively assets are performing while taking into consideration long-
term financing. This is why ROCE is a more useful ratio than return on equity to evaluate the
longevity of a company.
This ratio is based on two important calculations: operating profit and capital employed. Net
operating profit is often called EBIT or earnings before interest and taxes. EBIT is often
reported on the income statement because it shows the company profits generated from
operations. EBIT can be calculated by adding interest and taxes back into net income. Capital
employed is a fairly convoluted term because it can be used to refer to many different financial
ratios. Most often capital employed refers to the total assets of a company less all current
liabilities. Return on capital employed formula is calculated by dividing net operating profit or
EBIT by the employed capital or by subtracting current liabilities from total assets. The return
on capital employed ratio shows how much profit each Birr of employed capital generates.
Obviously, a higher ratio would be more favorable because it means that more Birr of profits
are generated by each Birr of capital employed.

32
Table 4.13 Return on capital employed of the company
Fiscal period
RPSL
NIBTICapital
employedROCE
JULY 7,2006 -1,463,805 18,575,574 -8%
JULY 7,2007 -1,303,327 14,230,631 -9%
JULY 7,2008 2,749,459 13,037,604 21%
JULY 7,2009 692,010 6,591,632 10%
JULY 7,2010 1,422,960 5,330,886 27%
JULY 7,2011 -35,956 2,676,937 -1%
JULY 7,2012 -1,143,142 459,741 -249%
JULY 7,2013 -1,832,438 13,317,996 -14%
JULY 7,2014 166,906 45,295,155 0%
Total -747,333 119,516,156 -222%
Source; Audited financial statement of DBNSW
Table 4.14 The SPSS result of return on capital employed of the company
Case Processing Summary
RPSL Ratio Statistics for NIBET / CEMP
Count Mean 0.147
Overall 4 Median 0.158
Excluded 5 Weighted Mean 0.072
Total 9 Std. Deviation 0.117
Source; Audited financial statement of DBNSW
The above table describes the return on capital employed of the company. Based on the audited
financial statement of the company of the nine years data was analyzed. From those years the
company reported a net income before tax and interest expense was only for four fiscal
period’s i.e. (FY 2008, FY 2009, FY 2010 and FY 2014) and a loss the five fiscal periods i.e. (
FY 2006, FY 2007, FY 2011, FY 2012, and FY 2013). To analyze return on capital employed

33
of the company’s nine years data the SPSS package was used. To analyze the descriptive
statistics of ratio the net income before tax and interest expense and the capital employed was
entered in the system as an input data by considering the variables. The SPSS system result of
case processing summary result shows the included and excluded data input of the reported
profit before tax and interest expense statement under straight line method only four were
included and the other five was excluded. These are because for analyzing input data the
system considers only the reported profit amounts for the period’s i.e. net income before tax
and interest expense of FY 2008 2,749,459.00, FY 2009 692,010.00, FY 2010 1,422,960.00
and FY 2014 166,906.00 which equals to the total of 5,031,335 and the capital employed FY
008 13,037,604.00, FY 2009 6,591,632.00, FY 2010 5,330,886.00 and FY 2014 45,295,155
which equal to the total 70,255,277. Therefore from those four the total net income before tax
and interest expense periods was divided by total a total capital employed that provides a
weight mean of 7.2 % which states that for every Birr invested in capital employed the
company obtains Birr 7.2 profit. And the standard deviation was 11.7%.
4.1.3 Leverage ratio
4.1.3.1 Debt to equity ratio
The debt to equity ratio is a financial, liquidity ratio that compares a company's total debt to
total equity. The debt to equity ratio shows the percentage of company financing that comes
from creditors and investors. A higher debt to equity ratio indicates that more creditor
financing (bank loans) is used than investor financing (shareholders).
The debt to equity ratio is calculated by dividing total liabilities by total equity. The debt to
equity ratio is considered a balance sheet ratio because all of the elements are reported on the
balance sheet. The analysis of ratio in industry has different debt to equity ratio benchmarks, as
some industries tend to use more debt financing than others.
A lower debt to equity ratio usually implies a more financially stable business. Companies with
a higher debt to equity ratio are considered more risky to creditors and investors than
companies with a lower ratio. Unlike equity financing, debt must be repaid to the lender. Since
debt financing also requires debt servicing or regular interest payments, debt can be a far more
expensive form of financing than equity financing. Companies leveraging large amounts of

34
debt might not be able to make the payments. Creditors view a higher debt to equity ratio as
risky because it shows that the investors haven’t funded the operations as much as creditors
have.This could mean that investor’s don’t want to fund the business operations because the
company isn’t performing well. Lack of performance might also be the reason why the
company is seeking out extra debt financing.
Table 4.15 the debt to equity ratio of the company
Fiscal period
RPSL
Total
Liability
Total
Equity
Debt to
Equity ratio
JULY 7,2006 17,041,428 23,041,428 0.74
JULY 7,2007 15,771,959 21,771,959 0.72
JULY 7,2008 13,309,602 19,309,602 0.69
JULY 7,2009 16,529,892 22,529,892 0.73
JULY 7,2010 13,475,206 19,475,206 0.69
JULY 7,2011 11,933,059 17,933,059 0.67
JULY 7,2012 13,101,232 19,101,232 0.69
JULY 7,2013 29,260,896 35,260,896 0.83
JULY 7,2014 49,154,501 55,154,501 0.89
Total 179,577,775 233,577,775 0.77
Source; Audited financial statement of DBNSW
Table 4.16 The SPSS result of debt to equity ratio of the company
Case Processing Summary
RPSL Ratio Statistics for TL / TEQT
Count Mean 0.739
Overall 9 Median 0.724
Excluded 0 Weighted Mean 0.769
Total 9 Std. Deviation 0.075
Source; Audited financial statement of DBNSW

35
The above table describes the debt to equity ratio of the company. Based on the audited
financial statement of the company of the nine years data was analyzed. To analyze debt to
equity ratio of the company’s nine years data the SPSS package was used. To analyze the
descriptive statistics of ratio the total liability and the total equity was entered in the system as
an input data by considering the variables. The SPSS system result of case processing
summary result shows the included and excluded data input of the reported balance sheet
accounts of the nine were included and the other none was excluded. These are because for
analyzing input data the system considers the entire reported total liability and total equity
amounts for all periods. The total of liability balances for all periods was 179,577,775 and the
total equity was 233,577,775. The debt to equity ratio of nine periods was 0.77, which means
that 0.77 cents of the business is owned by the creditors and only 0.23 cents of company equity
was owned by the shareholders. The company has fewer stakes in the business asset. From
these one can understand that the company use a debt financing capital structure. The highest
debt to equity ratio from all years was during fiscal period 2014 which is Birr 0.89 and the
lowest was during fiscal period 2011 which was Birr 0.67.
Summary of the financial ration analysis
The result of regression model and the researcher constructions on the effect of depreciation
methods on the performance of the company’s report of financial statements was summarized
in the following table 4.17.
VariablesRPSL
Mean Std. Deviation
Profitability Ratios
Inventory turnover ratio 60.056 33.332
Earnings per share 1.12E+03 967.514
Net Profit Margin Ratio 0.073 0.048
Return on Capital Employed 0.147 0.117
Liquidity Ratios
Cash Ratio 0.47 0.83
Quick ratio 0.88 0.822
Current ratio 1.81 0.682
Leverage ratio Debt to equity ratio 0.739 0.075
Source: researcher’s own constructions

36
CHAPTER FIVE
CONCLUSIONS AND RECOMMENDATIONS
5.1 CONCLUSIONS
1. The liquidity indicator of the management performance was discussion and presented
to evaluate the financial performance of the company. The cash ratio which is the
ability of firm to settle its current liability by cash and cash balances, of the nine years
fiscal periods was 0.45 cents and as standard norms the cash ratio of not less than 0.2 is
considered as acceptable. On the other side of testing liquidity is by analyzing the quick
asset, which is the ability of the firm to pay off company current liability by its current
asset with the exception of stock, of the nine years weight mean was Birr 1.12. The
ability to pay off the company’s current liability of Birr 1 by only using of quick assets
without selling of any fixed asset was 1.12 and was an acceptable with the standards of
norm. The last liquidity indicator was the current ratio, which states that the ability of a
company’s 1 Birr of current liability by using the company’s current asset was Birr
1.80. As a concluding point, in all management performance indicator of liquidity
analysis the ability of the firm to pay off its obligations by cash ratio, quick ratio and
current ratio was better in a comparison to the standards of norms.
2. The profitability indicator of management performance was discussion and presented
to evaluate the financial performance of the company’s financial statement, the average
inventory turnover of the nine years fiscal periods was 59. These means that the cost of
goods sold was lower. The other profitability indicatory was the earning per share
analysis. The EPS of the financial statement reported was Birr 1.12E+0. On the Net
Profit Margin analysis which enables a profit percentage of the sales, the company
obtains 7.3% of profit from net sales. Again the net profit margin of the reported profit
was 10%. The last profitability indicatory was Return on Capital Employed, a
percentage that states the invested Birr amount in capital employed a profit. It was
7.2%. The return on capital employed rate for every one birr invested in capital

37
employed the company obtains profit of Birr 28.8. Therefore based on the analysis of
the comparative financial statement of the DebreBirhan Natural Spring Water PLC, it
was clearly seen that the financial performance analysis of profitability was not
satisfactory.
3. The leverage indicator of the management performance was discussion and presented
to evaluate financial performance of the company. The leverage ratio which is the debt
to equity ratio, which indicates the percentage of the business equity, was owned by the
shareholders or creditors. The debt to equity ratio of the last nine years fiscal period
presents that 77% of the business was owned by creditors and the remaining only 23%
of the business equity was owned by the shareholders in reference to the reported
balance sheet statement of the company. Therefore most of the company equity was
owned by the creditors, which indicates that the company uses a debt financing capital
structure.

38
5.2 Recommendations
1. As a recommendation, in order to have a better earning management and better
financial analysis results in relation profitability, the company has to implement better
cost reduction strategies by cutting off costs and also strategies for more production
techniques which enable to increase the sales volume of the company.
2. In order to have a strong ability in relation to liquidity the company has to increase its
sales which enables to have more cash inflows and also has to reduce its current
liability by using long term financing.
3. In order to have better leverage ration the company’s shareholders has to increase their
number of shares by investing themselves or inviting the external investors to join
which increases the number of share and the cash position of the company.

39
References
1. Brigham, E., & Houston, J. (2009). Fundamentals of Financial Management. Mason.
2. Drake, P. (2010). Financial ratio analysis.
3. Frase, L., &Ormiston, A. (2004). Understanding Financial Statements. New Jersey:
Pearson Prentice Hall.
4. Hey-Cunningham, D. (1993). Financial Statements Demystified. New South Wales:
Allen &Unwin.
5. Johnstone, D. B. (2009). Worldwide Trends in Financing Higher Education. In J.
Knight, Financing Access and Equity in Higher Education. Rotterdam: Sense
Publishers
6. IFRS financial reporting and analysis software
7. Jonne J. Lee, Renewable Energy Finance Professional, IRENA, 2016 published.
8. Bruce Mackenzie, 2005, Financial management,
9. The audited financial statement of DebreBirhan Natural Spring Water Plc from the
fiscal period ended Sene 30, 2006, 2007, 2008, 2009, 2010, 2011, 2012, 2013 and 2014
G.C.

Annex -A
JULY 7,2006 JULY 7,2007 JULY 7,2008 JULY 7,2009 JULY 7,2010 JULY 7,2011 JULY 7,2012 JULY 7,2013 JULY 7,2014
ASSETS EMPLOYED
FIXED ASSETS (net) 15,537,690 11,751,127 7,343,227 3,057,031 178,076 243,386 469,909 515,977 22,666,377
Construction on progress - - - - 370,231 655,180 5,095,532DEFFERED CHARGES (net) 2,451,481 1,782,895 1,114,309 445,723 10 10 10 - -
Total Fixed Asset 17,989,171 13,534,022 8,457,536 3,502,754 178,086 243,396 840,150 1,171,157 27,761,909
CURRENT ASSETS
Stock and goods in transit 2,569,431 1,540,042 6,873,187 7,277,724 6,286,624 4,110,503 1,507,665 1,342,279 8,004,816
Goods in transit of imported Machineries 20,882,627
Debtors and prepayments 249,166 363,020 204,007 854,812 1,758,795 1,703,471 3,640,867 453,418 2,304,456
VAT receeivables - - - 354,776 72,764 104,160 775,582
Withholding tax receivable 1,100 122,237 - 148,238 148,238 71,228 73,986 75,881 95,438
Cash and cash balances 323,477 1,782,836 606,543 424,961 1,033,262 1,049,801 527,416 16,200,988 1,024,416
Government Bond (non interest bearing) - - - - - - 100,000 100,000 100,000
DEBRE BIRHAN NATURAL SPRING WATER PLCBALANCE SHEET STATEMENT
Government Bond (non interest bearing) - - - - - - 100,000 100,000 100,000
3,143,174 3,808,135 7,683,737 8,705,735 9,226,919 7,289,779 5,922,698 18,276,726 33,187,335
LESS;- CURRENT LIABILITIES
Creditors and accruals 439,938 542,231 517,717 4,834,445 3,036,038 4,110,210 6,220,370 6,033,309 9,016,849
Provision for taxation 215,207 - 139,896 - - - -
VAT payable 123,967 246,474 194,647 197,080 176,398 - 82,737 96,578 -
Long term bank loan- Current maturity 1,992,866 2,322,821 2,176,098 585,332 721,787 746,028 - - 6,637,240
2,556,771 3,111,526 3,103,669 5,616,857 4,074,119 4,856,238 6,303,107 6,129,887 15,654,089
NET CURRENT ASSETS 586,403 696,609 4,580,068 3,088,878 5,152,800 2,433,541 (380,409) 12,146,839 17,533,246
TOTAL ASSET EMPLYOED 18,575,574 14,230,631 13,037,604 6,591,632 5,330,886 2,676,937 459,741 13,317,996 45,295,155
FINANCED BYSHARE CAPITAL 6,000 ordinary shares of 1,000 Birr each . 6,000,000 6,000,000 6,000,000 6,000,000 6,000,000 6,000,000 6,000,000 6,000,000
LEGAL RESERVE - 63,074 63,074 84,857 84,857 84,857 84,857 84,857
PROFIT AND LOSS ACCOUNT (1,909,083) (4,429,802) (3,231,403) (10,384,477) (10,155,058) (10,484,741) (12,423,241) (15,897,871) (15,172,741)
SHAEHOLDERS'S ACCOUNT 1,525,359 1,174,980 192,479 569,240 569,240 733,686 6,798,125 1,637,016 5,647,125
LONG TERM BANK LOAN 12,959,298 11,485,453 10,013,454 10,343,795 8,831,847 6,343,135 - 21,493,993 27,853,287
12,575,574 14,230,631 13,037,604 6,591,632 5,330,886 2,676,937 459,741 13,317,995 24,412,528

Annex -B
JULY 7,2006 JULY 7,2007 JULY 7,2008 JULY 7,2009 JULY 7,2010 JULY 7,2011 JULY 7,2012 JULY 7,2013 JULY 7,2014
SALES 2,270,851 13,055,841 16,910,172 18,298,132 16,451,527 19,882,498 16,187,536 4,460,853 4,055,494LESS;- ROYALITY TAX (45,417) (261,117) (338,203) (365,963) (329,104) (397,650) (323,751) (89,217) (81,110)
2,225,434 12,794,724 16,571,969 17,932,169 16,122,423 19,484,848 15,863,785 4,371,636 3,974,384COST OF SALES (2,808,429) (11,290,669) (10,751,621) (12,441,649) (10,291,253) (15,210,202) (12,929,779) (1,587,258) (2,578,858)
GROSS PROFIT ( LOSS) (582,995) 1,504,055 5,820,348 5,490,520 5,831,170 4,274,646 2,934,006 2,784,378 1,395,526OTHER INCOME - 13,137 73,214 50,154 37,711 47,288 27,936 6,172 5,760
(582,995) 1,517,192 5,893,562 5,540,674 5,868,881 4,321,934 2,961,942 2,790,550 1,401,286
GENERAL AND SELLING EXPENSESSalaries, wages and benefits 109,857 399,115 542,052 814,415 1,201,210 1,257,975 1,391,140 2,041,669 168,788Perdiem and travel 21,550 154,399 162,566 178,023 299,152 323,978 118,444 214,637 4,287Water and electricity 583 3,939 25,319 7,954 - 13,496 10,278 56,902 876Communication 7,126 23,405 14,052 38,374 68,567 84,173 59,099 30,758 5,745Frieght and transport 34,705 56,167 35,681 44,996 10,395 19,615 84,183 121,170 1,615Bank charges and interest 445,278 1,217,392 945,535 850,355 777,774 421,477 709,173 700,464 585,137Insurance 6,978 83,005 143,912 104,825 145,963 139,128 168,554 183,912 3,155Rent 120,407 344,382 312,394 321,658 261,406 286,071 496,543 471,902 63,563Car running 75,728 186,900 575,505 460,883 523,699 960,561 962,693 224,860 69,385
DEBRE BIRHAN NATURAL SPRING WATER PLCINCOME AND LOSS STATEMENT
Car running 75,728 186,900 575,505 460,883 523,699 960,561 962,693 224,860 69,385Repair and maintenance 4,800 221,572 14,464 522,418 333,684 345,796 395,756 424,518 54,849Printing, stationery and supplies 33,247 43,089 23,534 42,651 29,899 93,332 80,265 37,443 9,722Advertisement 175,114 113,459 57,547 80,070 5,120 142,198 5,296 2,300 5,000Sales commission 21,963 158,402 194,442 166,939 113,937 115,610 103,016 19,470 6,837Professional fee 7,000 31,970 23,000 19,550 10,500 211,991 52,100 15,000 15,000Depreciation 247,275 965,274 985,767 1,997,301 1,355,530 19,135 73,923 171,027 68,302Entertainment 4,105 11,773 4,250 22,435 23,566 24,427 54,278 31,627 76,009Miscellaneous 1,097 22,669 6,080 17,967 5,799 24,612 15,256 4,241 6,067Registration and license fee 9,275 999 23,538 8,205 4,640 7,255 4,555 36,713 -Penalities - - - - 12,582 244,846 - 533,259 313,253Uniform and outfits - - - 23,163 10,520 29,705 1,580 3,720Gifts and donation - - - - 17,109 7,173 - - -Bad debts - - - - - 25,998 - - 358,207
(1,326,088) (4,037,911) (4,089,638) (5,699,019) (5,223,695) (4,779,367) (4,814,257) (5,323,452) (1,819,517)
PROFIT/LOSS BEFORE TAX (1,909,083) (2,520,719) 1,803,924 (158,345) 645,186 (457,433) (1,852,315) (2,532,902) (418,231)PROVISION FOR TAXATION - - - - (209,533) - - - -
NET PROFIT/LOSS AFTER TAX (1,909,083) (2,520,719) 1,803,924 (158,345) 435,653 (457,433) (1,852,315) (2,532,902) (418,231)LEGAL RESERVE - - - - (21,783) - - - -
NET PROFIT/LOSS AFTER LEGAL RESERVE (1,909,083) (2,520,719) 1,803,924 (158,345) 413,870 (457,433) (1,852,315) (2,532,902) (418,231)
LOSS BROUGHT FORWARD - (1,909,083) (4,429,802) (3,231,403) (10,384,477) (10,155,058) (10,484,741) (12,423,241) (15,897,871)
DIVIDEND PAID - - - (1,198,399) - -PRIOR YEARS ADJUSTMENT - - - (5,796,331) (184,451) 127,751 (86,185) (948,730) 1,143,359
LOSS CARRIED FORWARD (1,909,083) (4,429,802) (2,625,878) (10,384,478) (10,155,058) (10,484,740) (12,423,241) (15,904,873) (15,172,743)

Annex -C
JULY 7,2006 JULY 7,2007 JULY 7,2008 JULY 7,2009 JULY 7,2010 JULY 7,2011 JULY 7,2012 JULY 7,2013 JULY 7,2014
Direct material 1,441,532 6,403,575 5,310,404 7,305,450 5,924,680 11,022,980 8,009,357 1,157,404 1,578,868
Direct labour 94,989 473,034 564,986 698,165 705,911 901,765 1,096,325 240,768 151,545
Manufacturing overheads 86,560 368,671 1,026,508 479,184 521,656 312,329 630,746 11,572 42,043
Raw material damaged & wastages 169,749 1,155,596 - -
Excise tax 883,768 1,439,450 2,429,060 1,955,279 219,271 354,491
Depreciation 1,101,176 3,312,807 3,314,964 2,301,485 1,578,119 90,247 40,708 - 124,859
DEBRE BIRHAN NATURAL SPRING WATER PLC
COST OF SALES STATEMENT
Depreciation 1,101,176 3,312,807 3,314,964 2,301,485 1,578,119 90,247 40,708 - 124,859
Amortization 222,862 668,586 668,586 668,586 445,714 - - 10 221,545
Cost of manufacturings 2,947,119 11,226,673 10,885,448 12,336,638 10,615,530 14,926,130 12,888,011 1,629,025 2,473,351
ADD;- Finished Products- Beginning - 138,690 74,694 208,521 103,511 427,788 143,716 101,948 143,716
LESS;- Finished Products- Ending (138,690) (74,694) (208,521) (103,511) (427,788) (143,716) (101,948) (143,716) (38,209)
2,808,429 11,290,669 10,751,621 12,441,648 10,291,253 15,210,202 12,929,779 1,587,257 2,578,858

FIXED ASSET Annex -D
JULY 7,2006 JULY 7,2007 JULY 7,2008 JULY 7,2009 JULY 7,2010 JULY 7,2011 JULY 7,2012 JULY 7,2013 JULY 7,2014
Fixed asset costs 16,886,034 17,377,552 17,203,716 17,207,975 17,262,669 17,437,361 17,778,517 17,786,611 17,819,621
Total Depreciation Expense 1,348,344 4,278,081 4,234,064 4,298,788 2,933,649 109,382 114,633 171,026 193,161
Dep Expense- Cost of sales 730,457 2,203,291 2,210,814 2,210,815 1,487,872 - 40,708 40,705 40,705
Dep Expense- Admin + Sales 617,887 2,074,790 2,023,250 2,087,973 1,445,777 109,382 73,925 130,321 152,456
Accumulated depreciation 1,348,344 5,626,425 9,860,489 14,159,277 17,092,926 17,202,308 17,316,941 17,487,967 17,681,128
DEBRE BIRHAN NATURAL SPRING WATER PLC
DEPRECIATION EXPENSES FOR FIXED ASSETS
Accumulated depreciation 1,348,344 5,626,425 9,860,489 14,159,277 17,092,926 17,202,308 17,316,941 17,487,967 17,681,128
Book Value 15,537,690 11,751,127 7,343,227 3,048,698 169,743 235,053 461,576 298,644 138,493