Studies into the suitability of the cell-penetrating peptide
Upload
independentCategory
view
4download
0
Nata et al (MEJS) Volume 1 (1): 36 - 58
© Mekelle University ISSN: 2073-073X
Groundwater Suitability for Irrigation: a Case Study from Debre Kidane Watershed, Eastern Tigray, Ethiopia
*Nata Tadesse1, K. Bheemalingeswara1 and Asmelash Berhane2
1Department of Earth Science, College of Natural and Computational Sciences, Mekelle University, P.O. Box 1604, Mekelle, Ethiopia (* [email protected]) 2Department of LaRMEP, College of Dry Land Agriculture and Natural Resource Management, Mekelle University, Mekelle, Ethiopia
ABSTRACT
The present paper tries to assess groundwater suitability for irrigation purpose in Debre Kidane Watershed (45.09 km2), northern Ethiopia. The goal was to evaluate the suitability of the groundwater for irrigation, examine the water types and to investigate possible long and short term impact on groundwater quality. Thirty six water samples each were collected in rainy and dry (irrigation) seasons from the active shallow hand dug wells. The well selection for detailed study and water sampling was done using stratified followed by random sampling technique. The number of wells selected for study is accounting 10% of the total available hand dug wells in the area. Parameters such as electrical conductivity (EC), pH, Total Dissolved Solids (TDS), temperature and other physical properties were recorded in the field. Major anions and cations (Ca2+, Mg2+, K+, Na+, CO3
2-, HCO3-, Cl-, SO4
2- and NO3-) were analyzed in the laboratory. Chemical data
suggests that the water type in the area though varies from Mg-HCO3, Ca-HCO3, Mg-Cl, Na-HCO3 to K- HCO3, predominantly it is mixed cation-HCO3 type in the rainy season; and Ca-HCO3 (Piper diagram) and Na-HCO3 (Stiff diagram) in irrigation season. Dominance of Na in irrigation season and increase in Sodium Absorption Ratio (SAR) are primarily due to possible increase of Na absorption in the soil replacing Ca. According to the guidelines for irrigation water quality, the groundwater is suitable for irrigation with some minor exceptions. In rainy season, 89% of the samples fall under the water class “good” and 11% “permissible” whereas in irrigation season only 30% are classified as “good” and 70% under “permissible” class. Toxicity in terms of SAR and salinity though presently under control and there is no specific toxicity effect on vegetables and field crops, however, there are indications of their increase in due course of time if proper measures are not taken. Keywords: Groundwater, Irrigation, Salinity, SAR, Toxicity, Water quality, Hand dug
well, Ethiopia.
1. INTRODUCTION
Water occurring either as surface or subsurface water is the mankind’s most vital and
versatile natural resources. Surface water exists in rivers, lakes, ponds, and oceans.
Surface water mainly rainwater by percolating through soil and weathered rock horizons

Nata et al (MEJS) Volume 1 (1): 36 - 58
© Mekelle University ISSN: 2073-073X
occupies the subsurface permeable layers and develops into a groundwater. Due to its
interaction for longer period of time with soil, weathered and fresh rock materials which
in turn vary in composition, groundwater compared to surface water provides a wide
range of variation in its composition. Thus, the utility of groundwater depends not only
on its abundance but also on its quality. Groundwater utilization for irrigation and
domestic purposes has been at a maximum compared others, like livestock and, industrial
use etc., particularly due to food security problems and global climatic changes. Thus
groundwater has become an important source for irrigation and it has become an integral
part of the irrigation strategy “to overcome food scarcity” in many developing countries
including in African continent. Such efforts have helped to expand irrigation with time
particularly from 1950’s the expansion has been rapidly increasing (Rosegrant et al.,
1999). Currently, it accounts for about 72% of global water withdrawals and about 90%
in the case of developing countries.
According to the Ministry of Water Resources (2002), Ethiopia is endowed with huge
natural water resources, which include 122 billion m3 annual surface runoff and 2.9
billion m3 of groundwater. However, the county’s water resource has contributed little to
the country’s socio-economic development, because major part of the surface runoff is
not utilized and at the same utilization of groundwater for irrigation is still in infantile
stage. In the case of the Tigray region the main economic means is rain fed agriculture.
The region is characterized by undulating topography and experiences arid to semi-arid
conditions with highly erratic and unreliable rainfall. Thus the region is not in a position
to cover the annual food requirement of its people. To alleviate the challenges of food
insecurity in the country promotion of irrigated agriculture was given priority (Mekuria,
2003). Thus, hand dug well construction has become one of the activities both by the
individuals as well as the government on a sustainable basis. Implementation of this
technology does not need high investment and skilled work force instead a household can
easily adopt and practice it. However, the issue of sustainability in terms of quality and
quantity which changes with time and type of practices in the field, demands attention.
The changing conditions have provided impetus to develop irrigation using groundwater.
Debre Kidane Watershed in Tigray is one such area where about 360 shallow hand dug
wells were constructed primarily to overcome the moisture scarcity. The households
Nata et al (MEJS) Volume 1 (1): 36 - 58
© Mekelle University ISSN: 2073-073X
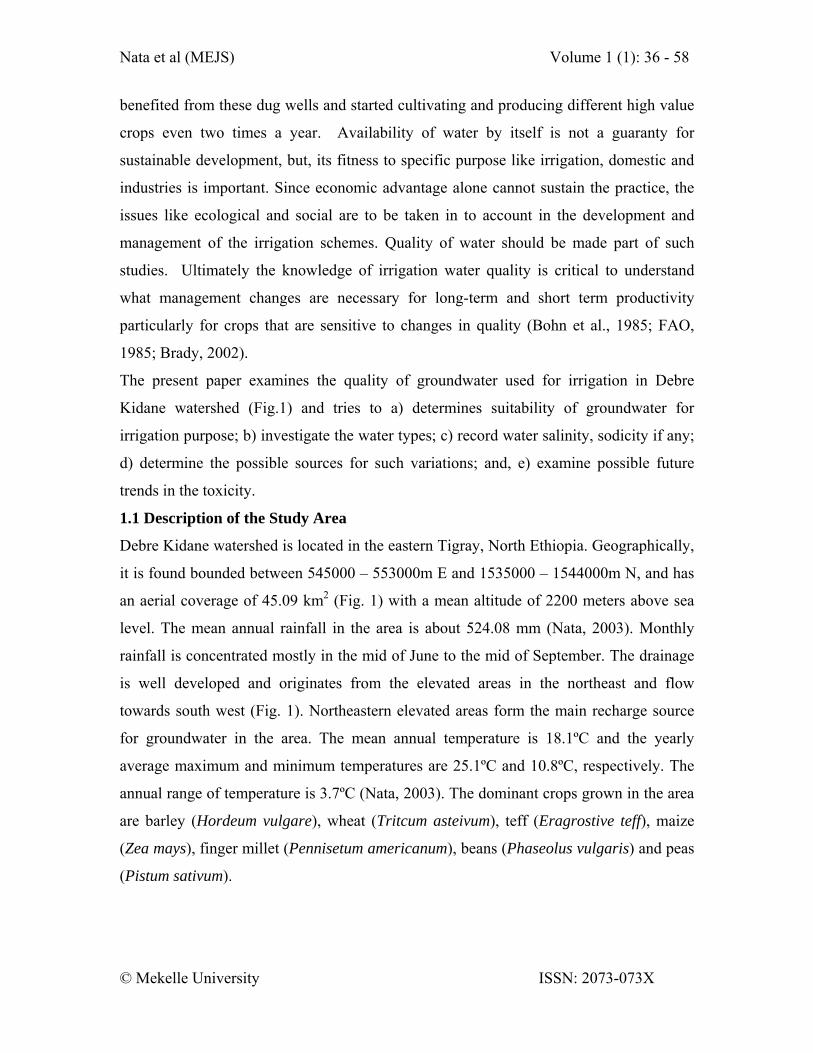
benefited from these dug wells and started cultivating and producing different high value
crops even two times a year. Availability of water by itself is not a guaranty for
sustainable development, but, its fitness to specific purpose like irrigation, domestic and
industries is important. Since economic advantage alone cannot sustain the practice, the
issues like ecological and social are to be taken in to account in the development and
management of the irrigation schemes. Quality of water should be made part of such
studies. Ultimately the knowledge of irrigation water quality is critical to understand
what management changes are necessary for long-term and short term productivity
particularly for crops that are sensitive to changes in quality (Bohn et al., 1985; FAO,
1985; Brady, 2002).
The present paper examines the quality of groundwater used for irrigation in Debre
Kidane watershed (Fig.1) and tries to a) determines suitability of groundwater for
irrigation purpose; b) investigate the water types; c) record water salinity, sodicity if any;
d) determine the possible sources for such variations; and, e) examine possible future
trends in the toxicity.
1.1 Description of the Study Area
Debre Kidane watershed is located in the eastern Tigray, North Ethiopia. Geographically,
it is found bounded between 545000 – 553000m E and 1535000 – 1544000m N, and has
an aerial coverage of 45.09 km2 (Fig. 1) with a mean altitude of 2200 meters above sea
level. The mean annual rainfall in the area is about 524.08 mm (Nata, 2003). Monthly
rainfall is concentrated mostly in the mid of June to the mid of September. The drainage
is well developed and originates from the elevated areas in the northeast and flow
towards south west (Fig. 1). Northeastern elevated areas form the main recharge source
for groundwater in the area. The mean annual temperature is 18.1ºC and the yearly
average maximum and minimum temperatures are 25.1ºC and 10.8ºC, respectively. The
annual range of temperature is 3.7ºC (Nata, 2003). The dominant crops grown in the area
are barley (Hordeum vulgare), wheat (Tritcum asteivum), teff (Eragrostive teff), maize
(Zea mays), finger millet (Pennisetum americanum), beans (Phaseolus vulgaris) and peas
(Pistum sativum).

Nata et al (MEJS) Volume 1 (1): 36 - 58
© Mekelle University ISSN: 2073-073X
Soil texture observed in the field are sandy, light clay, silty, loamy sand, and loam.
Dominant soil texture being silt loam (Nata et al., 2008). Major soil of the watershed
from along the inlet and outlet is Vertisols, Cambisol, Leptosol, and Alluvisol.
In the study area the types of aquifers are localized, confined and unconfined types.
Confined aquifers are located in the discharge areas of the basins and the unconfined
types are found in the recharge areas. Out of the observed hand dug wells, 72.5% are
located in unconfined aquifers and the remaining are in the confined aquifers (Nata et al.,
2008).

Nata et al (MEJS) Volume 1 (1): 36 - 58
© Mekelle University ISSN: 2073-073X
Tigray
Amhara
Afar
4039383712
13
14
15
0 18 Miles
0 1 Kilometer
1535000
1544000
545000 553000
N
N
(A)
(B)
Streams
Figure 1. Location and drainage map of the watershed (Nata et al., 2007). (Source for A: Disaster Prevention and Preparedness Agency (DPPA), 2006)

Nata et al (MEJS) Volume 1 (1): 36 - 58
© Mekelle University ISSN: 2073-073X
2. GEOLOGY AND AQUIFER CONDITION OF THE STUDY AREA
The area consists of three types of rock units, the low-grade metamorphosed Proterozoic
basement rocks and overlying sedimentary rocks comprising sandstone and tillite of
Paleozoic age and recent alluvial deposits (Fig. 2) (Nata et. al., 2007). A brief account of
the rock types and the aquifer characteristics is given below.
2.1 Geology
2.1.1 Basement rocks
These are the dominating rock type in the area and their outcrops are found in northern,
northeastern, eastern, southeastern, central, southwestern, and northwestern parts of the
study area. They occupy both low in the southern parts and high elevated areas in the
northern parts and show flat to steep slopes. They cover 22.8% of the area (Nata et. al.,
2007).
The basement rocks are composed of metavolcanics and metasediments. The most
conspicuous foliation trend is north-south with deviations to northeast and northwest.
Apart from foliations, fractures are also present and are irregularly spaced in the rock. In
some places they show light to dark grey, light to dark brown and reddish color.
Dominant minerals present in these low grade greenschist facies rocks include: mafic
minerals, chlorite, quartz, feldspars and opaque in metavolcanic rocks and quartz,
chlorite, feldspar, muscovite, pyrite, limonite in metasediments (Nata et. al., 2007).
2.1.2 Sandstone
This rock unit accounts for about 8.4% of the total study area (Nata et. al., 2007). The
outcrops of these rocks are found in the southern and southeastern parts of the study area.
They occupy higher elevations in the topography, show steep slopes, cliff forming, and
overlie the basement rocks. The rock out crops is very limited as they are covered by
alluvium. However, as it was observed from the geological logs of the hand dug wells, it
extends from southeast to the central, southwestern, western and northwestern parts of the
study area. Its maximum thickness which is observed at the southeastern periphery of the
watershed is of about 160 meters (Nata et. al., 2007).
It is composed of white, coarse grained, cross-bedded, calcareous sandstone containing
lenses of siltstone, grit and polymict conglomerate with sub-rounded to well-rounded

Nata et al (MEJS) Volume 1 (1): 36 - 58
© Mekelle University ISSN: 2073-073X
pebbles, cobbles and boulders. Clasts of granite, gneisses are scattered erratically and are
seen in many places. The lower part of the sandstone is white in color with medium
grained angular grains and at places strongly cemented by clay minerals. Upper part is
the glacial unit, shows features of a glacio-fluvial deposit, angular, poorly sorted grains of
quartz and lenses of conglomerate. The rock is porous, highly weathered and show
presence of fractures, joints and cross bedding. Among structures, joints are prominent
and show presence of two sets of joints in sandstone which lies N15ºE and N25ºW (Nata
et al., 2007).
The tillite unit is not found as an outcrop in the study area. However, as it was observed
from the lithologs of the hand dug wells, this rock is found underlying the alluvium in the
northern, northeastern, eastern, southeastern, southern southwestern parts of the
watershed (Nata et al., 2007). It is characterized by dark grey color, poorly sorted texture,
the presence of big boulder and its unstratified nature. On the basis of the logs of the hand
dug wells, its maximum thickness is about 4.5m. The rock is dominated by quartz with
limited amount of feldspar and varying amounts of clay, silt and ferruginous and
calcareous cementing material (Nata et al., 2007).
2.1.3 Alluvial Deposits
In the watershed alluvial deposits are found covering wide area both in the highlands and
the lowlands. They are also found as thin strips along the margins of the major rivers and
their tributaries. The alluvium is accounting for about 68.8% of the area. The relative
abundances and stratigraphic relations of the sediments, however, are generally not
uniform through out the watershed. Toward the mountains front that is NW and E and
topographically high areas in the central parts of the study area, where river gradients are
high due to steep slopes, the alluvial sediments, in general, are dominated by sub-angular
to sub-rounded coarse grained quartz. In the western parts of the watershed, where the
gradient of the rivers decreases down slope, the alluvial deposit is characterized by the
presence of medium to fine grained sand with variable content of silt and clay. The
maximum thickness of the alluvium is about 3.50 m.
2.2 Hydrogeology
2.2.1 Aquifer Types and Characteristics

Nata et al (MEJS) Volume 1 (1): 36 - 58
© Mekelle University ISSN: 2073-073X
Different rock types and unconsolidated sediments which host water and act as aquifers
have been classified into two based on the type of porosity and permeability and their
extent.
1. Localized aquifers with intergranular porosity and permeability
(unconsolidated sediments: alluvial sediments along the margins of the major
river and its tributaries); and,
2. Less extensive aquifers with intergranular and fractured porosity and
permeability (consolidated sediments and basement rocks: sandstone, tillite
and basement rocks).
A brief account of the hydrogeological characteristics of the different rocks and
unconsolidated sediments of the watershed is given below with a particular reference to
their water storage and transmission capacities (Fig. 3) (Nata et al., 2008).
Figure 2. Geological and Hand dug well location map, Debre Kidane, eastern Tigray (Nata et al., 2007).
0 1 Kilometer
Legend
Sandstone
Alluvium
Basement rocks
1535000
1544000
545000 553000
N
Hand Dug Well

Nata et al (MEJS) Volume 1 (1): 36 - 58
© Mekelle University ISSN: 2073-073X
2.2.1.1 Basement rocks
These rocks are generally impervious, nevertheless local pockets of groundwater
reservoir occurs in the weathered layer and fracture zones. Geological and
hydrogeological logs of nine hand dug wells in the western and central parts of the
watershed indicate that the weathered and fractured zones are the main sources of
groundwater supply in the basement rocks with discharges of hand dug wells range from
0.4 to 1.5 l/s.
2.2.1.2 Sandstone
The rock is characterized by highly weathered and fractured nature. These weathered and
fractured zones as a whole reaches up to a maximum depth of about 4 m. However, in
this rock secondary porosity is significant due to fracturing. Fracturing has increased the
void space as well as its capacity for water transmission and enhanced its usefulness to
the water supply. However, at places it is reduced due to high degree of cementation and
in turn permeability and productivity. This rock is considered to host a highly potential
aquifer in the flat areas (northern and northeastern parts of the watershed) compared to
the steeply to gentle dipping rocks which act as a conduit rather than being an aquifer in
the southern and southeastern parts of the area.
In the case of tillite presence of considerable amounts of silt and clay as minerals and as
cement reduces the intergranular permeabilities drastically and makes the rock
impervious and hamper water movement. At places, however, the fractures provide
secondary porosity and permeability and hence make the rock permeable for groundwater
flow and storage,
2.2.1.3 Alluvial Deposits
These recent deposits cover major parts of the area overlying both the basement and
sedimentary rocks. They vary in thickness as well as in composition in the plateau areas
and along the margins of the rivers and tributaries. The alluvial deposits mainly comprise
of clay, silt, sand and gravel sized particles in different proportion. These deposits have
an average thickness 3.50 m. In the western part of the study area, these deposits can be
considered as potential water bearing formation due to their primary porosity and location

Nata et al (MEJS) Volume 1 (1): 36 - 58
© Mekelle University ISSN: 2073-073X
whereas due to their location in the southern parts the alluvium act as a conduit rather
than being an aquifer (Fig. 3).
3. METHODOLOGY
Initially inventory of all hand dug wells that are functional for irrigation purpose was
carried out. During inventory in situ measurement of electrical conductivity, temperature
of the groundwater and air temperature for each well were carried out. Since the electrical
conductivity values were measured in situ at a temperature different from the standard 25
°C, an adjustment of the electrical conductivity values of the water was made by
multiplying the respective measured electrical conductivity value by the factor
corresponding to the temperature at which the measurement was made.
0 1 Kilometer
N
1535000
1544000
545000 553000
Legend
Medium Productive Area
Poor Productive Area
High Productive Area
Figure 3. Groundwater potential in the study area (After Nata et al., 2008).
To determine the number of water samples for chemical analyses stratified and random
sampling techniques were utilized. The in situ measured and corrected electrical

Nata et al (MEJS) Volume 1 (1): 36 - 58
© Mekelle University ISSN: 2073-073X
conductivity values of the groundwater were grouped into different water classes based
on Quality Classification of Water for Irrigation (Wilcox, 1955). Then after, 36 water
samples were selected randomly from the different water classes for chemical analyses.
Since majority of the wells in the area are present in the alluvium in the river valley, the
wells selected for sampling are also restricted to this part of the area. Thirty six water
samples each were collected from hand dug wells in both rainy season and irrigation
(dry) season. Apart from temperature, other physical parameters like turbidity, colure,
taste and odor were also measured at each site. For the purpose of chemical analysis the
water samples were collected in one liter plastic bottles after thorough wash. All the
water sample locations are shown in the figure 2.
The water samples were analyzed in the Geochemistry Laboratory of Applied Geology
Department, Mekelle University, Mekelle. The samples were analyzed for calcium
(Ca2+), magnesium (Mg2+), potassium (K+), sodium (Na+), bicarbonate (HCO3-), chloride
(Cl-), sulfate (SO42-), and nitrate (NO3
-). Besides, pH and electrical conductivity in µS/cm
at 25 °C were also measured.
The cations were analyzed using Atomic Absorption Spectrophotometer and the anions
using UV-Spectrophotometer (Varian Spectra, 50B). The data are presented in the form
of graphs. Piper, Stiff and Box and Whisker diagrams were used for representing and
comparing water quality analyses
In this study FAO (1985 and 1989) guidelines are used to evaluate the suitability of the
groundwater of the watershed for irrigation. The guidelines were proposed for evaluating
the potential of an irrigation water to create soil or crop problems.
Various thematic maps such as location, digital terrain model of the watershed, drainage,
geological, and hydrogeological were produced by using ArcView 3.3 and CorelDRAW
12 software’s.
4. RESULTS
4.1 Electrical Conductivity, pH and Total Dissolved Solid (TDS)
EC values were recorded in 36 functional hand dug wells indicate that electrical
conductivity values range from 0.05-2.0 dSm-1 with a mean of 0.945 dSm-1. The values
measured for 36 groundwater samples vary from 0.27 dSm-1 to 0.96 dSm-1 with an

Nata et al (MEJS) Volume 1 (1): 36 - 58
© Mekelle University ISSN: 2073-073X
average of 0.53 dSm-1 at 25oC for rainy season. The same during irrigation season range
from 0.399 to 1.696 dSm-1 at 25oC with a mean of 0.877 dSm-1 at 25oC. The EC values in
groundwater are much higher during irrigation season up to 65% compared to the same of
the rainy season (Fig. 4).
Hydrogen ion concentrations (pH) range from 7.70 to 8.60 during rainy season and 7.22
to 8.39 during irrigation season. The average pH value in rainy and irrigation season is
8.12 and 8.01, respectively. Total dissolved solid (TDS) values in both the seasons for
groundwater range from 274.34 to 1092.2 mg/l. In general, TDS values for groundwater
in both rainy and irrigation seasons are less than 1000 mg/l.
4.2 Cations
Among cations, calcium is the most abundant element and varies from 8 to 60 mg/l
during rainy season with a mean concentration of 35.03 mg/l. During irrigation season,
the most abundant cation is Ca2+ followed by Na+, K+ and Mg2+. The highest measured
calcium concentration is 91 mg/l and the lowest is 30 mg/l, and the mean concentration is
64.92 mg/l. In comparing the concentration of calcium in the rainy season to that of
irrigation season, it is found that the concentration of calcium increased by about 50% in
the irrigation season. In the case of magnesium the concentrations during the rainy season
range from 6 to 42 mg/l with an average value of 20.15 mg/l. While in dry season the
concentrations of magnesium (Mg2+) range from 8 to 41 mg/l with an average value of
22.25 mg/l. In general, without exception Ca2+ is dominant over Mg2+ and magnesium do
not show any significant change in concentration.
During rainy season Na+ values range from 8 to 140 with a mean concentration of 43.33
mg/l (Fig.5). In dry season the values range from 18 to 193 with a mean concentration of
54.56 mg/l. In the irrigation (dry) season, the concentration of sodium is increased by
about 25% compared to the rainy season. K+ values very low and do not show any
variation and hence not considered here.

Nata et al (MEJS) Volume 1 (1): 36 - 58
© Mekelle University ISSN: 2073-073X
Figure 4. EC of groundwater samples in rainfall and irrigation season
(RF- rainy season; IRR- Irrigation (dry) season).
Figure 5. Na concentration in the rainy and irrigation seasons.
4.3 Anions
4.3.1 Bicarbonate (HCO-3) and Carbonate (CO3
2-)
In the study area, carbonate is found mainly in the form of bicarbonates and is the most
abundant ion among anions. During rainy season, the concentrations of bicarbonate
(HCO-3) range from 82.88 to 477.50 mg/l with an average value of 230.28 mg/l. The
same during dry season range from 170.80 to 547.00 mg/l with a mean value of 342.38
mg/l. The mean concentration of bicarbonate in irrigation season is increased by about
12% compared to the rainy season. In both seasons the carbonate (CO32-) concentrations
are very low and all are below 6.7 mg/l.
4.3.2 Chloride (Cl-)
Na concntration (mg/l)
0.0
50.0
100.0
150.0
200.0
250.0
W10
3W
16W
39W
34W
187W
271W
130
W49
W15
6W
227W
167W
260W
329W
236W
314W
152W
318W
110
Wells code
Na(
mg/
l)
Rain seasonIrrigation

Nata et al (MEJS) Volume 1 (1): 36 - 58
© Mekelle University ISSN: 2073-073X
In the study area chloride is the second abundant anion next to bicarbonate. Chloride
values range from 9.5 to 133.4 mg/l in the rainy season with a mean concentration of
50.71 mg/l. In the irrigation season, the concentrations of chloride (Cl-) range from 6.5 to
156.1 mg/l with an average value of 45.41 mg/l. Chloride ion do not show any significant
seasonal variation (Fig. 6).
Chloride concntration
020406080
100120140160180
W10
3
W16
W39
W34
W18
7
W27
1
W13
0
W49
W15
6
W22
7
W16
7
W26
0
W32
9
W23
6
W31
4
W15
2
W31
8
W11
0
Wells Code
Cl-
(mg/
L)
Water (RF) Water(IRR)
Figure 6. Chloride ion concentration in the rainy and irrigation seasons
(RF- Rainy season; IRR- Irrigation (dry) Season)).
4.3.3 Sulphate (SO4-2)
Sulphate is the third most abundant anion next to bicarbonate and chloride in the study
area. The values range from 7.2 to 51.80 mg/l in the rainy season with a mean
concentration of 25.03 mg/l. In the irrigation season, the concentrations of sulphate
(SO42-) range from 15.12 to 86.09 mg/l with an average value of 36.35 mg/l.
4.3.4 Nitrate (NO3-)
The measured nitrate concentrations range from 0.5 to 43.9 mg/l in the rainy season with
a mean concentration of 9.74 mg/l and range from 3.00 to 57.98 mg/l for dry season with
an average value of 16.47 mg/l (Fig.7).

Nata et al (MEJS) Volume 1 (1): 36 - 58
© Mekelle University ISSN: 2073-073X
Figure 7. Nitrate values in water from hand dug wells (RF- rainy season; IRR- dry
season).
4.4 Water Type
To understand the chemical type of water, different diagrams such as Piper, Stiff, and
Box and Whisker diagrams were used to plot the data. The purpose of plotting data in
various diagrams is to see how much effective they are for irrigation data and what
additional information they provide compared to Piper diagram. Before plotting the
proportions of both the anions and cations they were converted from ppm to epm.
Samples collected in both rainy and irrigation season were plotted in these Piper, Stiff
and Box and Whisker diagrams. They are shown in figure 8 (Piper); figure 9 (Stiff) and
figure 10 (Box and Whisker). According to these plots groundwater type in the study area
varies from Mg-HCO3, Ca-HCO3, Mg-Cl, Na-HCO3 to K-HCO3 type. During rainy
season, the dominant water type is Ca-HCO3 and is indicated by 42% of the samples,
followed by Mg- HCO3 by 30%, Na- HCO3 by 22%, Mg-Cl by 3% and K-HCO3 by 3%
samples. In irrigation season the Ca-HCO3 is the dominant type indicated by 69% of the
samples and is followed by Na-HCO3 type by 24% and Mg- HCO3 type by 7% samples.
Interestingly, Piper diagram shows HCO3 and mixed cation type for rainy season and Ca-
Na-HCO3 type for dry season. Whereas Stiff diagram shows Ca-HCO3 type for rainy
season and Na-HCO3 for dry season and Box and Whisker plot indicates Ca-HCO3 type
for both the seasons.

Nata et al (MEJS) Volume 1 (1): 36 - 58
© Mekelle University ISSN: 2073-073X
Figure 8. Piper diagram for the water samples A. rainy and B. irrigation season.
Figure 9. Stiff diagrams (A) Ca -HCO3 water type and (B) Na-Ca-Mg-HCO3-Cl type.
Figure 10. Box and Whisker plot for water samples, (A) rainy and (B) irrigation season.

Nata et al (MEJS) Volume 1 (1): 36 - 58
© Mekelle University ISSN: 2073-073X
4.5 Sodium Absorption Ratio (SAR)
SAR (Todd, 1980) was calculated using Aqua Chem 4.0 software. The values range from
0.35 to 6.51 with an average value of 1.51 for rainy season. The mean, minimum and
maximum SAR during the irrigation season is 1.44, 0.49 and 5.63, respectively.
5. DISCUSSION
5.1 Physical and Chemical Characteristics
Groundwater being subsurface water derives its contents from different sources like soil,
weathered rock, fresh rock and fertilizer with which it will be in contact during
infiltration or percolation. This will be aided by the climate (ex. Temperature); CO2 either
free or dissolved state in soil and time duration. Variations in the content of groundwater
often associated with irrigation practices, temperature, CO2 and time as the main
lithological source generally remain constant. Such changes are prominent during rainy
and dry seasons where both quality and quantity will be affected. During rainy season
supply of water being more its ability to carry suspended material will be more compared
to ions due to limited amount time duration. The data collected on color, taste etc in the
field, shows that about 12% of the samples are muddy or turbid in rainy season with
red/brownish color due to the presence excessive amount of suspended matter. Whereas it
was found that the water was transparent in dry season. Regarding other parameters, there
was no problem of odder or taste or aroma in samples in both the seasons.
Furthermore, a major part of the water in rainy season leaves the catchment as run off and
the remaining part will percolate through irrigated soil, alluvial cover and weathered rock
to recharge groundwater. So the shallow hand dug wells get recharge prominently from
two different routes, 1) drainage channels with sand dominated channel sediments, and 2)
irrigated soil, non-irrigated soil and weathered rock. Thus sheet flow and stream water
supply dominate rainy season while soil infiltration during dry season. This is well
reflected in the compositional variations observed in the water samples collected during
rainy and dry seasons. Such as Ca, HCO3, NO3 and SO4 are dominant in the dry
compared to the rainy season. The reason for such variations is partly natural and partly
anthropogenic.

Nata et al (MEJS) Volume 1 (1): 36 - 58
© Mekelle University ISSN: 2073-073X
EC, pH and TDS data suggest though shows variation in their values the majority of the
values lie within the acceptable range for irrigation purpose (FAO, 1989). According to
FAO (1989) irrigation water quality guidelines, normal pH range is 6.5 to 8.4. Out of the
total analyzed groundwater samples in both sampling seasons, 97% of them are within
this normal range.
In the case of carbonate and bicarbonate ions, which are derived from the dissolution of
carbonate minerals and available carbonic acid in the soil horizons, are within the
acceptable range according to FAO (1985) water quality guidelines for irrigation purpose.
The acceptable range for bicarbonate acceptable range is 1-10 meq/l for bicarbonate and
0-0.1 meq/l for carbonate. Therefore, the groundwater of the watershed has no restriction
in use for irrigation purposes.
Chloride values being <4 meq/l in the samples collected in rainy season and also the
same values in all the samples except one for dry season indicating that if the
groundwater of the watershed is considered for surface irrigation use, no chloride toxicity
will rise. However, a groundwater from one well needs slight to moderate restriction on
use.
According to FAO (1985), water with a sulphate concentration of 0-20 meq/l is
considered as a usual range in irrigation water. In the study area, the concentration is not
above 1.0 meq/liter. Therefore, it is recommended for use for irrigation purpose without
restriction.
Unlike most other elements in groundwater, nitrate is not derived primarily from the
minerals (rocks) that make up the groundwater reservoir. Instead, nitrate enters
groundwater as part of nitrogen cycle in the earth’s hydrosphere and biosphere. In
groundwater natural nitrate concentrations generally range from 0.1 to 10 mg/l (Davis
and Dewiest, 1966). Nitrate - nitrogen (NO3 – N) content greater than 30 mg/l is
considered harmful and is severely restricted to use for irrigation purposes (FAO, 1989).
Out of the total analyzed groundwater samples (Fig. 8), 31% in rainy season and 3% in
irrigation season have a concentration of nitrate - nitrogen (NO3 – N) below 5 mg/l.
Groundwater from these wells is not hazardous and needs no restriction on use (FAO,
1989). 3% in rainy season and 8% in irrigation season have a concentration of nitrate -
nitrogen (NO3 – N) greater than 30 mg/l. Groundwater from these wells is hazardous and

Nata et al (MEJS) Volume 1 (1): 36 - 58
© Mekelle University ISSN: 2073-073X
needs severe restriction on use. In the remaining 66% in rainy season and 89 % in
irrigation season, the groundwater of the watershed have a concentration of nitrate -
nitrogen (NO3 – N) between 5 and 30 mg/l. Groundwater from these wells needs slight
to moderate degree of restriction on use. The source for this ion seems to be
anthropogenic.
In the case of Ca, Mg and Na the concentration being in the range of 0-20 meq/l for Ca2+,
0-5 meq/l for Mg2+ and 18-193 ppm for Na. These values though are within the
acceptable range for irrigation (FAO, 1985) purpose, some of the samples showing higher
values for Na in dry season which is well reflected in the Stiff diagram (Fig. 9), seems is
an indicator towards increasing Na with time and in turn SAR. Sodium ion is mainly
derived from the breakdown of silicate minerals particularly feldspars (albite) and
generally get mobilized in water in dissolved state and hence will be lower its content in
the stream and shallow hand dug well as well in the rainy season. It is also well reflected
in its concentrations during rainy season. But during irrigation (dry) season the values are
higher because the well gets its recharge mainly from the soil and rock sources in
addition from drainage channels. The reason for such increase of Na content may be
because 1) it gets more time to interact with the source material soil and rock; 2) the
irrigated soil is becoming sodium-rich gradually due to its absorption replacing Ca; 3)
availability of more minerals in the weathered front and alluvium for interaction and
dissolution. Though the reasons are common for other cations as well in the case of Na,
absorption process seems to be prominent.
5.2 Salinity Hazard
In the rainy season, out of the analyzed thirty six groundwater samples, twenty eight
samples have an electrical conductivity values below 0.7 dS/m and the remaining eight
samples have an electrical conductivity ranging from 0.72 to 0.96 dS/m (Fig. 4). In
irrigation (dry) season, out of the analyzed thirty six groundwater samples, eleven
samples have an electrical conductivity values below 0.7 dS/m and the remaining twenty
five samples have a range from 0.71 to 1.70 dS/m. Therefore, based on electrical
conductivity values, two types of groundwater are recognized in the study area-
groundwater which is not hazardous and needs no restriction on use and groundwater
which needs slight to moderate degree of restriction on use. The first type groundwater

Nata et al (MEJS) Volume 1 (1): 36 - 58
© Mekelle University ISSN: 2073-073X
can be used for irrigation for almost all crops and for almost all kinds of soils. No soil or
cropping problems will rise. Very little salinity may develop which may require slight
leaching; but it is permissible under normal irrigation practices except in soils of
extremely low permeabilities. To achieve a full yield potential using the second type,
gradually increasing care in selection of crop and management alternatives are required.
5.3 Water Infiltration Rate (Sodicity)
An infiltration problem related to water quality occurs when the normal infiltration rate
for the applied water or rainfall is appreciably reduced and water remains on the soil
surface too long or infiltrates too slowly to supply the crop with sufficient water to
maintain acceptable yields. Although the infiltration rate of water into soil varies widely
and can be greatly influenced by the quality of the irrigation water, soil factors such as
structure, degree of compaction, organic matter content and chemical make-up can also
greatly influence the intake rate. The two most common water quality factors which
influence the normal infiltration rate are the salinity of the water and its sodium content
relative to the calcium and magnesium content. High salinity water will increase
infiltration. Low salinity water or water with high sodium to calcium and magnesium
ratio will decrease infiltration. Both factors may operate at the same time. The infiltration
rate generally increases with increasing salinity and decreases with either decreasing
salinity or increasing sodium content relative to calcium and magnesium - the sodium
adsorption ratio (SAR). Therefore, the two factors, salinity and SAR provide information
on its ultimate effect on water infiltration rate.
5.3.1 Rainy season
Out of the analyzed thirty six groundwater samples, 1) five samples show SAR values
between 3 and 6 and electrical conductivity between 1.2 and 0.3 dS/m at 25 ºC; 2) twenty
three samples have a computed SAR ranging from 0 to 3 and an electrical conductivity
value ranging from 0. 7 to 0.2 dS/m at 25 ºC; and 3) seven samples have a computed
SAR values ranging from 0 - 3 and a corresponding electrical conductivity greater than
0.7 dS/m at 25 ºC. In this season in general two types of water are recognized:
groundwater which needs slight to moderate degree of restriction on use (i.e.,
groundwater from both the five and twenty three samples) and a groundwater which is
Nata et al (MEJS) Volume 1 (1): 36 - 58
© Mekelle University ISSN: 2073-073X
not hazardous and needs no restriction on use, which is a groundwater from the last seven
samples (FAO, 1989).
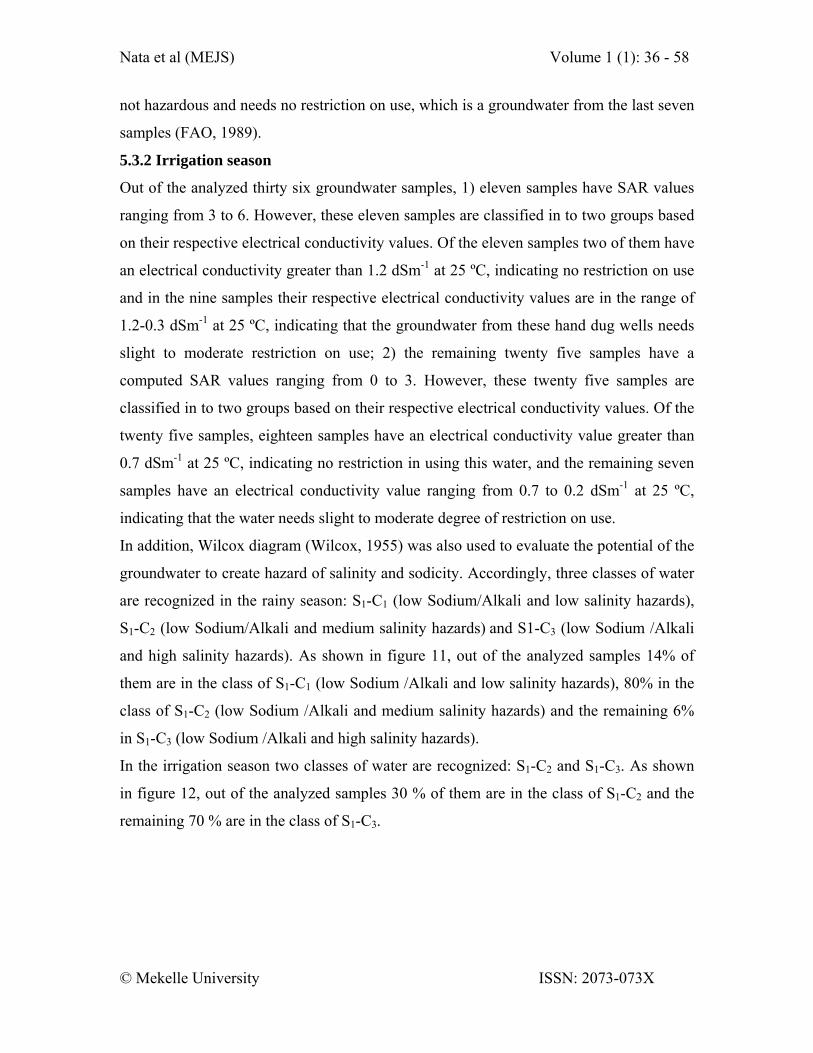
5.3.2 Irrigation season
Out of the analyzed thirty six groundwater samples, 1) eleven samples have SAR values
ranging from 3 to 6. However, these eleven samples are classified in to two groups based
on their respective electrical conductivity values. Of the eleven samples two of them have
an electrical conductivity greater than 1.2 dSm-1 at 25 ºC, indicating no restriction on use
and in the nine samples their respective electrical conductivity values are in the range of
1.2-0.3 dSm-1 at 25 ºC, indicating that the groundwater from these hand dug wells needs
slight to moderate restriction on use; 2) the remaining twenty five samples have a
computed SAR values ranging from 0 to 3. However, these twenty five samples are
classified in to two groups based on their respective electrical conductivity values. Of the
twenty five samples, eighteen samples have an electrical conductivity value greater than
0.7 dSm-1 at 25 ºC, indicating no restriction in using this water, and the remaining seven
samples have an electrical conductivity value ranging from 0.7 to 0.2 dSm-1 at 25 ºC,
indicating that the water needs slight to moderate degree of restriction on use.
In addition, Wilcox diagram (Wilcox, 1955) was also used to evaluate the potential of the
groundwater to create hazard of salinity and sodicity. Accordingly, three classes of water
are recognized in the rainy season: S1-C1 (low Sodium/Alkali and low salinity hazards),
S1-C2 (low Sodium/Alkali and medium salinity hazards) and S1-C3 (low Sodium /Alkali
and high salinity hazards). As shown in figure 11, out of the analyzed samples 14% of
them are in the class of S1-C1 (low Sodium /Alkali and low salinity hazards), 80% in the
class of S1-C2 (low Sodium /Alkali and medium salinity hazards) and the remaining 6%
in S1-C3 (low Sodium /Alkali and high salinity hazards).
In the irrigation season two classes of water are recognized: S1-C2 and S1-C3. As shown
in figure 12, out of the analyzed samples 30 % of them are in the class of S1-C2 and the
remaining 70 % are in the class of S1-C3.

Nata et al (MEJS) Volume 1 (1): 36 - 58
© Mekelle University ISSN: 2073-073X
Figure 11. Irrigation water classes using Wilcox diagram (Rainy season).
Figure 12. Irrigation water classes using Wilcox diagram (Irrigation season).
100 1000Salinity Hazard (Cond)
0
6
13
19
26
32
Sod i
um H
a zar
d (S
AR)
250 750 2250C1 C2 C3 C4
S1S2
S3
S4
KKKK KK
K
KKKKKKKK K KKK
K KK KK KK KK
KK KKK KKK
LegendLegend
K Default
Sodium (Alkali) hazard:S1: LowS2: MediumS3: HighS4: Very high
Salinity hazard:C1: LowC2: MediumC3: HighC4: Very high
3
4
LegendLegend
K Default
Sodium (Alkali) hazard:S1: LowS2: MediumS3: HighS4: Very high
Salinity hazard:C1: LowC2: MediumC3: HighC4: Very high
100 1000
Salinity Hazard (Cond)
0
6
13
19
26
32
Sodium
Haz
ard (S
AR)
250 750 2250C1 C2 C3 C4
S1
S2
S3
S4
II
III
I
IIIII I III IIIII
II II II
I II I IIIIII
Sample data

Nata et al (MEJS) Volume 1 (1): 36 - 58
© Mekelle University ISSN: 2073-073X
5.4 Toxicity Problems
5.4.1 Rainy season
With the exception of five samples, in all the remaining thirty one samples the SAR
values are well below 3, indicating no sodium toxicity will rise by using the groundwater
from these hand dug wells for surface irrigation (FAO, 1989). In the five samples the
SAR values lie within the range from 3 to 9, suggesting the necessity of slight to
moderate degree of restriction on use of the groundwater from these five hand dug wells
for surface irrigation. The likelihood of sodium toxicity hazards is high if the
groundwater from these five hand dug wells is considered for use.
In the case of SAR, the values below 9 indicate low or little danger for sodium and use on
sodium sensitive crops must be cautioned; between 10 and 17 medium hazard; 18 and 25
highly hazard and above ≥ 26 very high hazard (Grattan, 2002).
5.4.2 Irrigation season
Out of the analyzed thirty six groundwater samples, in the twenty five samples the SAR
values are well below 3, indicating no sodium toxicity will rise by using the groundwater
from these hand dug wells for surface irrigation (FAO, 1989). In the remaining eleven
samples the computed SAR values lay within the range from 3 to 9, suggesting the
necessity of slight to moderate degree of restriction on use of the groundwater from these
eleven hand dug wells for surface irrigation. The likelihood of sodium toxicity hazards is
high if the groundwater from these eleven hand dug wells is considered for use.
5.5 Water Classes
The suitability of the groundwater for irrigation is also examined based on Wilcox (1955)
classification scheme. Accordingly, in the rainy season the groundwater is categorized
into two groups: good and permissible. Out of the total analyzed samples, 89% of the
groundwater is in good class and the remaining 11% is in permissible class. In the
irrigation season, out of the total analyzed samples, 30% of them are in good class and
70% is in the permissible class.
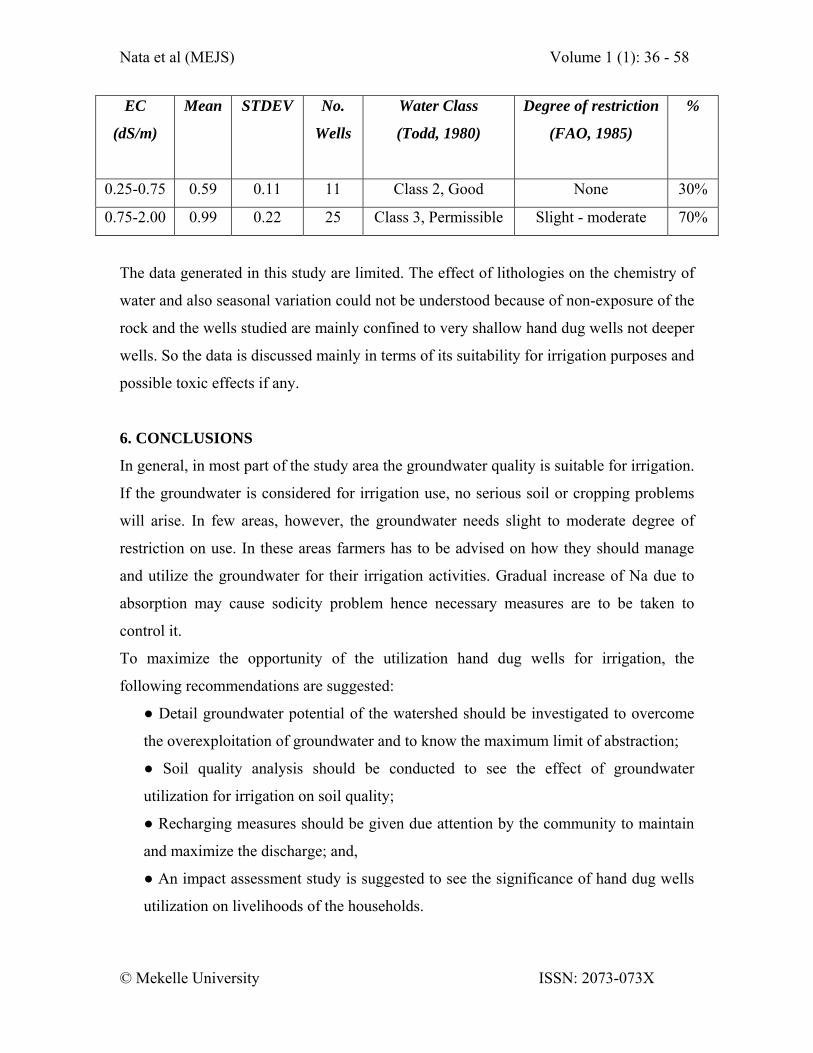
Table 1. Quality classification of water for irrigation (Irrigation season) (after Wilcox,
1955).
Nata et al (MEJS) Volume 1 (1): 36 - 58
© Mekelle University ISSN: 2073-073X
EC
(dS/m)
Mean
STDEV
No.
Wells
Water Class
(Todd, 1980)
Degree of restriction
(FAO, 1985)
%
0.25-0.75 0.59 0.11 11 Class 2, Good None 30%
0.75-2.00 0.99 0.22 25 Class 3, Permissible Slight - moderate 70%
The data generated in this study are limited. The effect of lithologies on the chemistry of
water and also seasonal variation could not be understood because of non-exposure of the
rock and the wells studied are mainly confined to very shallow hand dug wells not deeper
wells. So the data is discussed mainly in terms of its suitability for irrigation purposes and
possible toxic effects if any.
6. CONCLUSIONS
In general, in most part of the study area the groundwater quality is suitable for irrigation.
If the groundwater is considered for irrigation use, no serious soil or cropping problems
will arise. In few areas, however, the groundwater needs slight to moderate degree of
restriction on use. In these areas farmers has to be advised on how they should manage
and utilize the groundwater for their irrigation activities. Gradual increase of Na due to
absorption may cause sodicity problem hence necessary measures are to be taken to
control it.
To maximize the opportunity of the utilization hand dug wells for irrigation, the
following recommendations are suggested:
● Detail groundwater potential of the watershed should be investigated to overcome
the overexploitation of groundwater and to know the maximum limit of abstraction;
● Soil quality analysis should be conducted to see the effect of groundwater
utilization for irrigation on soil quality;
● Recharging measures should be given due attention by the community to maintain
and maximize the discharge; and,
● An impact assessment study is suggested to see the significance of hand dug wells
utilization on livelihoods of the households.
Nata et al (MEJS) Volume 1 (1): 36 - 58
© Mekelle University ISSN: 2073-073X
7. ACKNOWLEDGEMENTS
We thank the Department of Earth Sciences, Mekelle University, for providing
geochemistry laboratory facilities to carry out the water analysis work. Thanks are also
due to all those friends who helped during field and lab work and for going through the
manuscript many times and providing many constructive criticisms.
8. REFERENCES
Bohn, H. L., Brain L. M. & George A. O’Connor. 1985. Soil chemistry, Second Edition.
John Wiley & Sons, New York, pp. 234-248.
Brady, N. C. 2002. The Nature and properties of soil, Upper Addle River, 13th Edition.
Macmillan, New Jersey, pp. 413-436.
Davis, S.N. & DeWiest, R. J. M., 1966. Hydrogeology. John Wiley & Sons, New York,
pp. 463.
FAO. 1985. Water quality for agriculture. Food and Agricultural Organization (FAO) of
the United Nations. FAO, Irrigation and Drainage Paper 29, Rome.
FAO. 1989. Water quality for agriculture. FAO, Rome, pp. 163.
Grattan, Stephen R. 2002. Irrigation water salinity and crop production. University of
California. (http://www.avocadosource.com/links/
Salinity/GrattanStephen2002_ABS.htm -7k –) (Accessed on August 12,
2005).
Mekuria Tafesse. 2003. Small-scale irrigation for food security in sub-Saharan Africa.
Report and recommendations of a CTA study visit Ethiopia, 20–29 January
2003, CTA Working Document Number 8031, The ACP-EU Technical
Centre for Agricultural and Rural Cooperation (CTA), The Netherlands.
Ministry of Water Resources. 2002. Water Sector Development Program 2002-2016
Report. The Federal Democratic Republic of Ethiopia, Ministry of Water
Resources, Addis Abeba, Ethiopia.
Nata Tadesse. 2003. Hydrogeological investigation and environmentally sound plans for
the development of groundwater in the Weri River Basin, Tigray, Ethiopia.
Ph.D. diss., Institutes of Applied Geology, University of Natural Resources
and Applied Life Sciences (BOKU) Vienna, Vienna.
Nata et al (MEJS) Volume 1 (1): 36 - 58
© Mekelle University ISSN: 2073-073X
Nata Tadesse, Ahmed Mohammed & Essayas Tsegaye. 2007. Comparison on Aquifer
Characterization of Abrha-Weatsbha Area and Debre Kidane Watershed,
Tigray. Unpublished Report, Department of Applied Geology, Mekelle
University, Mekelle.
Nata Tadesse, Asmelash Berhane & Bheemalingeswara, K. 2008. Initiatives,
Opportunities and Challenges in Shallow Groundwater Utilization: a Case
Study from Debrekidane Watershed, Hawzien Woreda, Tigray Region,
Northern Ethiopia. Agricultural Engineering International: the CIGR Ejournal.
Manuscript LW 08 008, Vol. X, p. 22.
Rosegrant, M.W. & Clauidi Ringler. 1999. Impact food security and rural development of
reallocating water from agriculture, environment and production technology
division, International Food Policy Research Institute (IFPRI); EPTD
Discussion Paper No.47, USA.
Todd, D. K. 1980. Groundwater hydrology. John Wiley & Sons, New York, pp. 525.
Wilcox, L. V. 1955. Classification and use of irrigation waters, U.S. Dept. Agric. Circ.
969, Washington, D.C., pp. 19.
Copyright © 2022 FDOKUMEN