Sediment deposition and pedogenesis in exclosures in the Tigray highlands, Ethiopia
24
Sediment deposition and pedogenesis in exclosures in the Tigray highlands, Ethiopia Katrien Descheemaeker a, * , Jan Nyssen a,b , Joni Rossi a , Jean Poesen c , Mitiku Haile b , Dirk Raes a , Bart Muys d , Jan Moeyersons e , Seppe Deckers a a Laboratory for Soil and Water Management, K.U.Leuven, Vital Decosterstraat 102, B-3000 Leuven, Belgium b Department of Land Resource Management and Environmental Protection, Mekelle University, PO Box 231, Mekelle, Ethiopia c Physical and Regional Geography Research Group, K.U.Leuven, Redingenstraat 16, B-3000 Leuven, Belgium d Laboratory for Forest, Nature and Landscape, Vital Decosterstraat 102, B-3000 Leuven, Belgium e Royal Museum for Central Africa, B-1960 Tervuren, Belgium Received 5 July 2004; received in revised form 1 April 2005; accepted 27 April 2005 Available online 6 July 2005 Abstract In the Tigray highlands of Northern Ethiopia, the establishment of exclosures (i.e., areas closed for grazing and agriculture) has become an important measure to combat land degradation and restore vegetative cover. Exclosures are commonly found on steep slopes and downslope from a sediment source area. In this study their sediment trapping capacity and controlling factors were investigated. Total sediment depth turned out to be related to vegetation cover, sediment source area and in some cases slope gradient. Thickness of recent, short-term (b 20 years) sediment deposits was strongly related to distance from the top edge of the closed area, slope gradient, vegetation cover and characteristics of the sediment source area. Mean sediment deposition rates ranged between 26 and 123 Mg ha 1 yr 1 . Under influence of vegetation and sediment deposition dark soils rich in organic matter (Phaeozems) develop. In view of their high sediment trapping capacity, exclosures are highly valued as efficient soil conservation measures in the Tigray highlands. D 2005 Elsevier B.V. All rights reserved. Keywords: Closed areas; Sediment trapping; Vegetative sediment buffer; Phaeozems; Forest restoration; Eucalyptus; East Africa 1. Introduction Land degradation, comprising degradation of the natural vegetation cover, soil erosion, loss of soil fertility and moisture stress is a well-known problem in the Ethiopian highlands (Herweg and Stillhardt, 1999). Deforestation, overgrazing, expansion of crop- 0016-7061/$ - see front matter D 2005 Elsevier B.V. All rights reserved. doi:10.1016/j.geoderma.2005.04.027 * Corresponding author. Tel.: +32 16329765; fax: +32 16329760. E-mail address: [email protected] (K. Descheemaeker). Geoderma 132 (2006) 291 – 314 www.elsevier.com/locate/geoderma
-
Upload
independent -
Category
Documents
-
view
0 -
download
0
Transcript of Sediment deposition and pedogenesis in exclosures in the Tigray highlands, Ethiopia

www.elsevier.com/locate/geoderma
Geoderma 132 (2
Sediment deposition and pedogenesis in exclosures in the
Tigray highlands, Ethiopia
Katrien Descheemaeker a,*, Jan Nyssen a,b, Joni Rossi a, Jean Poesen c, Mitiku Haile b,
Dirk Raes a, Bart Muys d, Jan Moeyersons e, Seppe Deckers a
aLaboratory for Soil and Water Management, K.U.Leuven, Vital Decosterstraat 102, B-3000 Leuven, BelgiumbDepartment of Land Resource Management and Environmental Protection, Mekelle University, PO Box 231, Mekelle, Ethiopia
cPhysical and Regional Geography Research Group, K.U.Leuven, Redingenstraat 16, B-3000 Leuven, BelgiumdLaboratory for Forest, Nature and Landscape, Vital Decosterstraat 102, B-3000 Leuven, Belgium
eRoyal Museum for Central Africa, B-1960 Tervuren, Belgium
Received 5 July 2004; received in revised form 1 April 2005; accepted 27 April 2005
Available online 6 July 2005
Abstract
In the Tigray highlands of Northern Ethiopia, the establishment of exclosures (i.e., areas closed for grazing and
agriculture) has become an important measure to combat land degradation and restore vegetative cover. Exclosures are
commonly found on steep slopes and downslope from a sediment source area. In this study their sediment trapping
capacity and controlling factors were investigated. Total sediment depth turned out to be related to vegetation cover,
sediment source area and in some cases slope gradient. Thickness of recent, short-term (b20 years) sediment deposits
was strongly related to distance from the top edge of the closed area, slope gradient, vegetation cover and characteristics
of the sediment source area. Mean sediment deposition rates ranged between 26 and 123 Mg ha�1 yr�1. Under
influence of vegetation and sediment deposition dark soils rich in organic matter (Phaeozems) develop. In view of their
high sediment trapping capacity, exclosures are highly valued as efficient soil conservation measures in the Tigray
highlands.
D 2005 Elsevier B.V. All rights reserved.
Keywords: Closed areas; Sediment trapping; Vegetative sediment buffer; Phaeozems; Forest restoration; Eucalyptus; East Africa
0016-7061/$ - see front matter D 2005 Elsevier B.V. All rights reserved.
doi:10.1016/j.geoderma.2005.04.027
* Corresponding author. Tel.: +32 16329765; fax: +32 16329760.
E-mail address: [email protected]
(K. Descheemaeker).
1. Introduction
Land degradation, comprising degradation of the
natural vegetation cover, soil erosion, loss of soil
fertility and moisture stress is a well-known problem
in the Ethiopian highlands (Herweg and Stillhardt,
1999). Deforestation, overgrazing, expansion of crop-
006) 291–314

K. Descheemaeker et al. / Geoderma 132 (2006) 291–314292
land and unsustainable use of natural resources are the
main causes for the alarming state of land degradation
in the highlands of the northern province Tigray
(Nyssen et al., 2004).
In an attempt to rehabilitate the natural environ-
ment, the Northern Ethiopian society reacted by taking
soil and water conservation measures. Initially, mainly
physical structures were introduced (Chadhokar and
Solomon, 1988), such as the now widespread stone
bunds constructed along contour lines. However, in the
1980s it was realized that vegetation restoration is very
important and often less costly (Fiedler and Belay,
1988). This idea was put into practice by closing the
most degraded areas for grazing and agriculture
through the joint initiative of local communities, Gov-
ernmental and Non-Governmental Organizations.
Later on, this measure was adopted in the policy
framework of the Tigray Forestry Action Plan
(TFAP, 1996). However, the establishment of exclo-
sures should not be seen as an intervention merely
focusing on environmental rehabilitation. Income gen-
eration and community relief through food and cash
for work were also aimed at.
The terms bexclosureQ and bclosed areaQ denom-
inate the areas set aside, where agriculture and
grazing became forbidden (Kebrom et al., 1997;
Wisborg et al., 2000; Tenna et al., 2001; Aerts et
al., 2001, 2003). Exclosures are defined by Le
Houerou (2000) as areas of natural vegetation pro-
tected from the intrusion of major degradation
agents, such as humans, livestock and big game.
In Tigray, exclosures are demarcated on community
land and mostly found on very steep and degraded
slopes. Management and control of the area by a
guard lies within the responsibility of the local
authority. The objectives of exclosure are rehabilita-
tion of degraded land, production of grass for fodder
and thatching, wood for fuel and construction and
non-wood forest products.
Eweg et al. (1998) noted that the recovery process
in exclosures invariably starts with a rapid increase in
richness and soil cover of the herbaceous species.
After 3 to 5 years shrub and tree species gain impor-
tance and suppress the herbaceous species.
According to different studies (Chadhokar, 1992;
Mitiku and Kindeya, 1998; Wisborg et al., 2000;
Aerts et al., 2003, 2004) several positive effects of
exclosures can be observed. Natural vegetation is
regenerating, runoff and sheet and rill erosion are
reduced, the land is stabilised, soil moisture availabil-
ity is increased and a microclimate is reinstalled.
Moreover, new springs originate and during a longer
period more water is flowing in the rivers draining the
catchments. Exclosures thus seem to be a very suc-
cessful measure improving soil and water conserva-
tion. But, at the same time they cause more pressure
on remaining grazing land.
In view of the high land pressure and scarcity of
fuel wood and grazing land, it is important to quantify
the benefits and trade-offs of exclosures and to obtain
a profound knowledge about the effects of the set-
aside policy on different aspects of the natural envi-
ronment. One important process requiring further in-
vestigation is sediment trapping and soil development
in exclosures. From field observations it is clear that
under certain conditions exclosures can trap a consid-
erable amount of sediment. As such, they could con-
tribute to the buildup of fertile soil in formerly
degraded lands and act as buffers reducing sediment
transport in the landscape.
The process of sediment deposition by vegeta-
tion buffers has been studied extensively. Deposi-
tion is the result of a modification of the hydraulic
characteristics of the water flow, such as a reduc-
tion in flow turbulence and velocity (Abu-Zreig,
2001). Through this, infiltration is promoted so
that the sediment load is deposited due to a low-
ered transport capacity of the flow (Lacey, 2000).
In places where all water infiltrates, all sediment is
deposited. Abu-Zreig (2001) gives an overview of
the efforts undertaken to experimentally characterize
the performance of vegetative buffer strips with
different dimensions and characteristics. The most
important factors influencing the sediment trapping
capacity of these buffers seem to be length, inflow
sediment type, slope gradient, soil type and surface
roughness, which is related to vegetation type and
cover. Studies on the effectiveness of forest buffers
in reducing overland flow and its sediment concen-
tration reveal that sediment trapping capacity
depends on vegetation type, surface roughness, to-
pographic variables like slope gradient, length and
shape, soil characteristics like water storage capac-
ity and saturated hydraulic conductivity, and over-
land flow velocity (Croke et al., 1999; Lacey,
2000).

K. Descheemaeker et al. / Geoderma 132 (2006) 291–314 293
In many soil erosion studies however, sediment
trapping is neglected, so that erosion models often
overestimate catchment sediment yields (Rey, 2003).
On a broader landscape scale, the transfer of water and
sediment from disturbed to less disturbed parts of the
landscape is a very important aspect in catchment
impact assessment, but there is still scarcity of data
on the nature of hillslope sediment storage and the
rates of sediment transfer and delivery (Croke et al.,
1999). The importance of redeposition in sediment
yield studies is also endorsed by the phenomenon of
dramatic decrease in sediment delivery ratios when
zooming out from small to larger areas in the land-
scape (Bergkamp, 1998; Braud et al., 2001).
In the literature on sediment deposition only few
studies are available, presenting estimates of
amounts of sediment deposited in field situations.
Notwithstanding Bojo and Cassells (1995) noting
that for the specific case of Ethiopia no empirical
data are available on sediment deposition patterns in
relation to geomorphic parameters, there are some
indications. Hurni (1985) shows, for a 116 ha catch-
ment in Wello, that the rate of sediment redeposition
(17 Mg ha�1 y�1) is more important than the rate
of sediment export through the drainage system (7
Mg ha�1 y�1). In a vegetation-rich catchment in
South-western Ethiopia, redeposition of eroded sed-
iment occurs at a rate of 30 Mg ha�1 y�1, while
sediment export rates through the river are only 1.1
Mg ha�1 y�1. However, also here no details are
provided on specific locations and conditions for
sediment deposition.
The overall objective of this study is to better
understand sediment deposition processes and soil
formation in exclosures with the aim to contribute
to a better land management system in the Tigray
highlands. More specific objectives of this study
are (1) to assess pedogenesis in exclosures, (2) to
characterise different types of deposited sediment
according to their spatial distribution, morphological
and chemical characteristics, age and timescale of
deposition, (3) to develop a field method for deter-
mining thickness of deposited sediment, (4) to
define the role of vegetation cover, topography
and sediment source area characteristics in the de-
position of sediment and its spatial distribution and
(5) to assess the sediment deposition rate within
exclosures.
2. Methodology
To study changes in sediment deposition rates or
conservation of fertile top soil induced by land use
dynamics, one could monitor different land use types
for a long time, and record what happens. This very
costly and time-consuming method can however be
substituted by a more simple method, in which top
soils within different land use types are compared.
The prerequisite for this method is that for the differ-
ent treatments (i.e., land use types) differences in
lithological, topographic and climatic conditions are
negligible, so that space can replace time (Woldeam-
lak and Stroosnijder, 2003). This inferential approach
has been used widely in studies on the effects of land
use changes on soil properties (Adejuwon and Eka-
nade, 1988; Abubakar, 1996, 1997; Hajabbasi et al.,
1997; Lumbanraja et al., 1998; Jaiyeoba, 1998; Pania-
gua et al., 1999; Liu et al., 2002; Woldeamlak and
Stroosnijder, 2003).
In this study, the effect of the exclosure land use
type on pedogenesis and sediment trapping was
assessed by comparing soils in typical exclosure
areas with soils in comparable landscape situations
but under other land use types.
2.1. Study area
The study area (Fig. 1) is located in the Dogu’a
Tembien (Tembien highlands) district in central
Tigray, near the district capital Hagere Selam (13839V N, 398 10V E, altitude 2650 m a.s.l.). This area
is representative for the northern Ethiopian highlands,
because of its elevation and morphology. The lithol-
ogy of the study area is composed of Mesozoic sed-
imentary rocks (Adigrat sandstone, Antalo limestone
and Amba Aradam sandstone), covered by Tertiary
flood basalts (Bosellini et al., 1997). The subhorizon-
tal layering of rock formations of different resistance
to weathering results in a stepped landscape, where
flats alternate with steep escarpments (Nyssen et al.,
2002). Mean annual rainfall is around 700 mm, most-
ly concentrated in the rainy season from June to
September.
According to the ratio of annual precipitation to
potential evapotranspiration, UNEP (1994) qualifies
land degradation in the study area as desertification.
Therefore, soil and water conservation merits high

Fig. 1. Location of the study area in Ethiopia (black circle on country map), and overview of study sites and selected parcels with different land uses. Bold lines in parcels indicate
studied transects.
K.Desch
eemaeker
etal./Geoderm
a132(2006)291–314
294

K. Descheemaeker et al. / Geoderma 132 (2006) 291–314 295
priority attention (Nyssen et al., 2000, 2004). In the
1980s a start was made with closing degraded areas.
According to the local Agricultural Office exclosures
now cover about 12% of the total area in the study
district. They mostly form 50 to 150 m wide and 200
to 2000 m long vegetation strips on steep slopes
parallel to the contour lines.
During a preliminary survey an inventory of 43
exclosure sites was made. These sites were located on
a topographic map and described according to lithol-
ogy, soil type, vegetation type, slope gradient and
aspect, management and year of closure. Based on
the information collected, three representative study
sites (Fig. 1, Table 1) were selected, each of them
located on one of the dominant lithological units of
the study area: i.e., Haragua (sandstone), May Ba’ati
(limestone) and Adewro (basalt). Within the study
sites, several parcels with different land use were
selected in similar landscape positions, to enable com-
parative analysis. The land use types investigated are
exclosures of different ages, degraded rangelands, a
Eucalyptus forest and church forests. The latter are
sacred places where the vegetation has always been
protected. Church forests are often located in small
valleys with more favorable moisture conditions.
However, for this study we selected church forests
located in landscape situations comparable to the ones
of the other parcels. A brief description of all study
sites and parcels is given in Table 1.
Land use dynamics on steep slopes, which are now
under exclosure, went through a number of typical
evolution stages, illustrated in Fig. 2: (1) removal of
the original forest vegetation due to population pres-
sure, (2) severe soil erosion and land degradation
under overgrazing, (3) vegetation regeneration and
sediment trapping after exclosure establishment. In
all study sites, the selected parcels represent the dif-
ferent stages in this land use evolution.
All parcels are located on steep slopes with gradi-
ents of 35% to 70% and widths of 100 to 150 m.
Along their upper edge they are bordered by flatter
(slope gradients generally up to 20%), usually
cropped land, where runoff and soil erosion take
place. The upslope land is the sediment source area.
It produces important volumes of sediment carried by
runoff water to the study areas. This is illustrated in
Fig. 3, representing the May Ba’ati site with the
studied parcels and their sediment source areas.
2.2. Soil study
Soil profiles were described in 15 representative
profile pits in the different parcels, using the Guide-
lines for Soil Description (FAO, 1990). Classification
was carried out following the World Reference Base
for Soil Resources (WRB) (FAO et al., 1998). About
300 soil augerings, for which a selection of variables
(depth, texture, colour, structure, consistence, pres-
ence of CaCO3, stoniness) was recorded, complemen-
ted the detailed profile study.
A distinction was made between breference soil
horizonQ and bsediment layerQ. The latter one consist
of soil material deposited on top of the original soil
profile and conserved under the influence of vegeta-
tion. The reference soil horizon refers to the original
soil profile. Based on profile and augering descrip-
tions and chemical analyses, typical characteristics of
both types of layers were determined for the three
study sites. Depths of deposited sediment were then
determined in the field by measuring thickness of soil
material showing characteristics of sediment layers
until a reference horizon was reached.
2.3. Transect study
A transect study was conducted to record depths of
deposited sediment in all land use types. Therefore,
three transects were laid out along the slope (bold
lines in Fig. 1) in each parcel of the study sites. The
following variables were recorded every 20 m along
these transects starting 10 m from the top edge:
2.3.1. Depth of sediment deposition (SED)
At each location, 5 augerings at one meter distance
from each other were made to determine the average
sediment depth. Soil colour, texture, stoniness and
indications on structure and consistence were
recorded for each stratum.
2.3.2. Slope gradient (SLO)
At each location, slope gradient was measured
using a clinometer.
2.3.3. Vegetation cover (VEG)
Soil cover by trees, shrubs, herbs and grasses was
recorded in the second half of the rainy season of the
year 2002 for each segment of the transect (0–20 m,

Table 1
Description of study sites and the selected parcels with different land uses
Site name Location Approximate
elevation (m a.s.l.)
Lithology Parcel
code
Land use
type
Parcel
area (ha)
Years of
closure
Slope
gradient (%)
Vegetation
cover (%)
Main shrub and
tree species
Haragua 138 40V 54W N,
398 09V 29W E
2100 Adigrat
sandstone
HFO Church forest 1.3 55 75 Calpurnia aurea(Ait.)
Benth. subsp. aurea
Rhus natalensis Krauss
Adathoda schimperana
Nees (Wilson)
Celtis africana Burm. f.
HXY Young exclosure 2.2 5 55 55 Dodonea angustifolia L.f.
Euclea schimperi (A.DC.) Dandy
Lantana viburnoides
(Forssk.) Vahl.
Rhus natalensis Krauss
HRA Rangeland 1.5 50 25 Aloe macrocarpa Tod.
May BaVati 138 38V 52W N,
398 13V 15W E
2300 Antalo
limestone
MFO Church forest 1.8 35 75 Acokanthera schimperi
(A. DC.) Benth.
Euclea schimperi (A.DC.) Dandy
Carissa edulis (Forssk) Vahl
Rhus glutinosa
Hochst. ex A. Rich
MXOa Old
exclosure A
3.0 20 55 50 Acacia etbaica Schweinf.
Dodonea angustifolia L.f.
Carissa edulis (Forssk) Vahl
Euclea schimperi (A.DC.) Dandy
MXOb Old exclosure B 6.7 20 45 50 Acacia etbaicaSchweinf.
Dodonea angustifolia L.f.
Carissa edulis (Forssk) Vahl
Euclea schimperi (A.DC.) Dandy
MXY Young exclosure 1.5 3 60 25 Becium grandiflorum
(Lam.) Pichi-Serm.
Acacia etbaicaSchweinf.
Euclea schimperi (A.DC.) Dandy
Adewro 138 37V 27W N,
398 09V 7W E
2700 Tertiary Ashange
basalt
AFO Church forest 3.3 65 60 Calpurnia aurea (Ait.)
Benth. sub. Aurea
Euphorbia candelabrumKotschy
Olea europaeasubsp. cuspidata
(Wall. Ex. DC) Ciffieri
AEU Eucalyptus
plantation
0.9 16 70 50 Eucalyptus globulus Labill.
Aloe macrocarpa Tod.
AXY Young exclosure 1.1 4 70 35 Rumex nervosus Vahl.
Aloe macrocarpa Tod.
ARA Rangeland 0.5 20 5 Aloe macrocarpa Tod.
Rumex nervosus Vahl.
K.Desch
eemaeker
etal./Geoderm
a132(2006)291–314
296
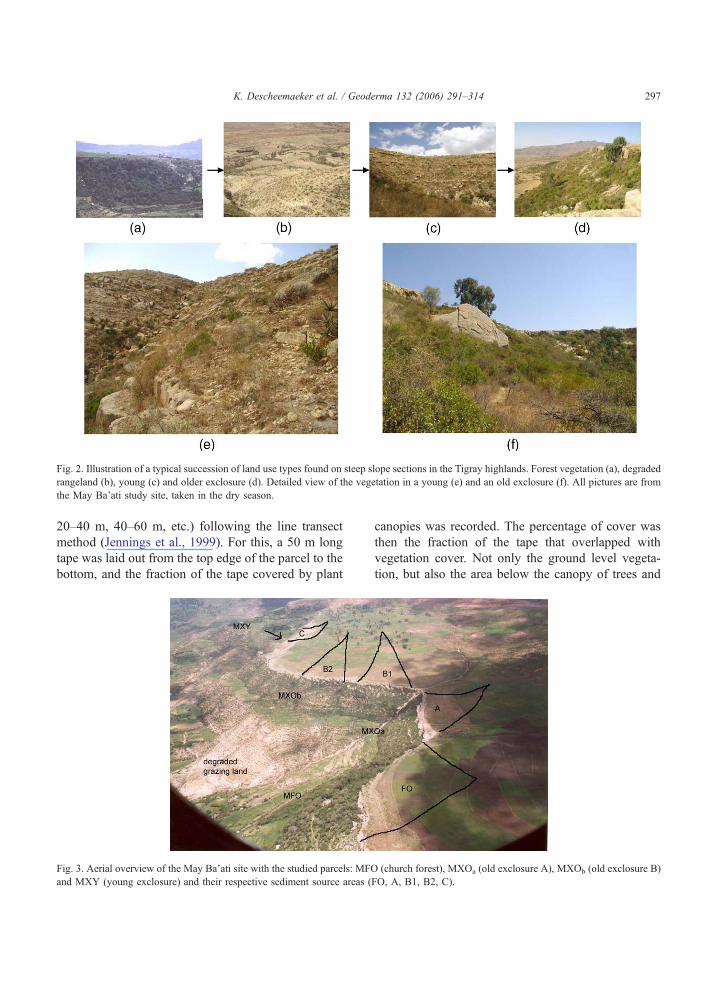
Fig. 2. Illustration of a typical succession of land use types found on steep slope sections in the Tigray highlands. Forest vegetation (a), degraded
rangeland (b), young (c) and older exclosure (d). Detailed view of the vegetation in a young (e) and an old exclosure (f). All pictures are from
the May Ba’ati study site, taken in the dry season.
K. Descheemaeker et al. / Geoderma 132 (2006) 291–314 297
20–40 m, 40–60 m, etc.) following the line transect
method (Jennings et al., 1999). For this, a 50 m long
tape was laid out from the top edge of the parcel to the
bottom, and the fraction of the tape covered by plant
Fig. 3. Aerial overview of the May Ba’ati site with the studied parcels: MFO
and MXY (young exclosure) and their respective sediment source areas (
canopies was recorded. The percentage of cover was
then the fraction of the tape that overlapped with
vegetation cover. Not only the ground level vegeta-
tion, but also the area below the canopy of trees and
(church forest), MXOa (old exclosure A), MXOb (old exclosure B)
FO, A, B1, B2, C).

K. Descheemaeker et al. / Geoderma 132 (2006) 291–314298
shrubs was included in this measurement. These
places are usually covered with leaf litter and there-
fore contribute to sediment trapping.
2.4. Delineation and description of the sediment
source area
The sediment source area for each studied parcel
was mapped based on field surveys and topographical
maps. Next, the susceptibility of the sediment source
area to water erosion was characterized by field as-
sessment of slope gradient, vegetation cover, soil
erodibility, stoniness and presence of soil conservation
structures.
2.5. Soil analyses
Soil samples were taken from all horizons of the
soil pits, as well as from the topsoil in each of the
studied parcels at three distances (10, 50 and 100 m)
from the top edge of the area. The topsoil samples are
composite samples consisting of a mixture of 5 soil
samples taken at a depth of 0–15 cm, 1 m apart from
each other.
After air-drying, all samples were passed through a
2-mm sieve for laboratory analyses. Texture was de-
termined using the sieve–pipette method (Sheldrik
and Wang, 1993); pH by using a pH-meter in 1 :2.5
soil /water and soil /KCl solution ratio (Hendershot et
al., 1993); available P by using the BrayII-extraction
method (Dewis and Freitas, 1970); cation exchange
capacity (CEC) and exchangeable bases by using
silverthiourea as an index cation at the soil pH (Chha-
bra et al., 1975); CaCO3 by reaction with HCl and
titration with NaOH (Allison and Moodie, 1965).
Total C and N content were determined by the dry
combustion method (Tiessen and Moir, 1993) using a
VARIO MAX total element analyzer (Elementar,
Hanau, Germany). Organic C content was then calcu-
lated by subtracting the C content present in CaCO3
from the total C content.
2.6. Data analysis
Correlation analysis and linear regression were
performed to determine and characterize relations be-
tween thickness of deposited sediment and controlling
factors. In some cases Weighted Least Squares (WLS)
regression was used, to correct for unequal error
variances. ANOVA analysis and post hoc tests
(Tukey and Tamhane T2 for equal and unequal error
variances, respectively) were used to test significant
differences between class means for different vari-
ables. All statistical analyses were performed using
SPSS 11.0 (SPSS, 2001).
3. Results
3.1. Soil study
A brief description of soil types and their proper-
ties is given, followed by an interpretation of pedo-
genetic processes and different sediment types in the
three study sites.
3.1.1. May Ba’ati
Calcisols, Calcaric Regosols and Calcaric Cambi-
sols (FAO et al., 1998) are the most common soil
types encountered under degraded rangeland situa-
tions in May Ba’ati (Fig. 1, Table 1). Typical horizons
show light brown colours, a low organic matter con-
tent (less than 1% organic C), a very high CaCO3
content (up to more than 50%) and can be designated
as either old colluvium (with high rock fragment
content) or in situ weathered parent material. In
some places a darker horizon with higher organic
matter content is still preserved on top of the soil
and in these cases soils key out as Calcaric Cambisols.
In the young exclosure (area MXY), which was
only closed since 3 years, most soils are very similar
to the ones under rangeland, although several auger-
ings show a darker upper horizon, leading to the
assumption that soils were less degraded in this loca-
tion before it was closed. In the first meters from the
top of the exclosure, shallow sediment deposits were
found, deposited since the area was closed. The sed-
iment can be distinguished from other soil material as
it shows characteristics of the soil material from the
upslope sediment source area (non-calcareous materi-
al in which basaltic stones and sandstones are present
and absence of limestone fragments) and by its rela-
tively low rock fragment content (maximum 15%).
The upslope sediment source area consists of flatter
land on top of the limestone cliff, bordering the upper
side of the parcel. Soils in the sediment source area are

K. Descheemaeker et al. / Geoderma 132 (2006) 291–314 299
mostly Cumulihaplic Regosols (FAO et al., 1998)
formed in colluvium from sandstone and basaltic
parent material.
Besides the presence of Humi-calcaric Cambisols
(FAO et al., 1998), which are distinguished by darker
upper horizons, rich in organic matter (N2.5% organic
C), and deeper-lying light brown calcaric horizons
similar to the ones in the degraded rangeland, the
older exclosures (areas MXOa and MXOb) are char-
acterized by the presence of Phaeozems (FAO et al.,
1998) (Table 2), which have been formed in
allochthonous soil material. Phaeozems are dark
soils rich in organic matter, occurring where enough
precipitation ensures some percolation in most years,
but also where the soil can dry out in some periods
(FAO et al., 1998). The classification as Phaeozems is
justified by the presence of a mollic horizon, a base
saturation of at least 50%, and the absence of second-
ary carbonates and no other diagnostic horizons than
cambic horizons. Phaeozems in the old exclosures of
May Ba’ati are mostly found in the upper sections (0–
Table 2
Soil profile description of representative Phaeozems for the three study si
Haragua May BaVati
Ah 0–20 cm; brownish black colour (7.5 YR 2/2);
sandy clay texture; many sandstone rock
fragments; soft, friable, sticky and plastic
consistence; moderate, coarse and granular
structure; many fine and medium pores; 3.3%
organic carbon; 71% base saturation
0–30 cm; dark
(7.5 YR 3/3);
limestone and
fragments; slig
sticky and ve
moderate, coa
structure; man
4.4% organic
saturation
B1 20–55 cm; dark brown colour (7.5 YR 3/3);
sandy clay texture; abundant sandstone rock
fragments; slightly hard, friable, slightly sticky
and slightly plastic consistence; moderate, coarse
and subangular blocky structure; many fine and
medium pores; 1.0% organic carbon; 63% base
saturation
30–70 cm; bro
(7.5 YR 3/2);
limestone and
fragments; ha
very plastic co
medium and s
structure; com
1.6% organic
saturation
B2 55–120 cm; brownish black colour (7.5 YR 3/2);
sandy clay texture; abundant sandstone rock
fragments; slightly hard, friable, very sticky and
plastic consistence; moderate, very coarse and
subangular blocky structure; many fine and
medium pores; 0.6% organic carbon; 53% base
saturation
70–150 cm;
(10 YR 3/2);
limestone and
fragments; ha
plastic consist
medium and s
structure; com
1.1% organic
saturation
30 m from the top edge) of the slopes or in flatter
positions up to 60 m from the top edge. They consist
of a deep soil profile (up to 1.5 m) of dark, deposited
material originating from the upslope source area,
which is evidenced by (1) the presence of sandstones
and basalt stones, and (2) the sharp transition to a
deeper soil layer showing similarities with the soil
layers found in the degraded situations (high CaCO3
content, light brown colours). In the deposited sedi-
ment layers, a mollic horizon was formed near the
surface under influence of regenerating vegetation. In
the subsoil, a cambic horizon with a blocky structure
is present, the lower part of which showing a CaCO3–
pseudomycelium (FAO et al., 1998) on the ped faces
between 60 and 80 cm depth.
Since it is highly unlikely that all this allochtho-
nous material accumulated since closure 20 years ago,
it must be concluded that the deeper, more strongly
structured horizons, consist of older, conserved sedi-
ment. As we find similar, very deep (up to 2 m)
Phaeozems under the old protected church forest vege-
tes
Adewro
brown colour
clay texture; common
sandstone rock
htly hard, very friable,
ry plastic consistence;
rse and crumby
y very fine pores;
carbon; 65% base
0–50 cm; brownish black colour
(10 YR 2/2); sandy loam texture;
common basalt rock fragments; loose,
very friable, non sticky and non plastic
consistence; moderate, medium and
granular structure; many very fine pores;
2.5% organic carbon; 52% base
saturation
wnish black colour
clay texture; common
sandstone rock
rd, friable, sticky and
nsistence; moderate,
ubangular blocky
mon very fine pores;
carbon; 58% base
50–90 cm; very dark brown colour
(7.5 YR 2/3); loamy sand texture; many
basalt rock fragments; loose, very
friable, non sticky and non plastic
consistence; moderate, medium and
granular structure; many fine pores;
0.6% organic carbon; 74% base
saturation
brownish black colour
clay texture; few
sandstone rock
rd, friable, sticky and
ence; moderate,
ubangular blocky
mon very fine pores;
carbon; 60% base
90–145 cm; very dark brown colour
(7.5 YR 2/3); loamy sand texture;
abundant basalt rock fragments; hard,
friable, slightly sticky and slightly plastic
consistence; moderate, coarse rock
structure; few fine pores; 0% organic
carbon; 81% base saturation

K. Descheemaeker et al. / Geoderma 132 (2006) 291–314300
tation, it is assumed that Phaeozems started being
formed when deforestation and agriculture in the
upslope source areas led to erosion and thus sediment
production that could be trapped by the vegetation
belts bordering the fields at their lower side. When
exactly this process of sediment production, transport
and deposition started is not known, but taking into
account the considerable depths of the Phaeozems, it
must be at least several centuries. Nyssen et al. (2004)
mention estimates of 2000 to 2450 years BP for the
time when deforestation started in Ethiopia. Deposi-
tion carried on for centuries until land pressure became
so high that also the forest vegetation on the slopes was
totally removed and land degradation started there as
well. During the degradation phase, the vegetation
belts, except for the church forests, were destroyed
and the Phaeozems started to erode. However, at the
time of closing, the dark cambic horizons were not
fully eroded in areas like MXOa and MXOb, as they
are still present deeper in the profile. Since closing,
new sediment has been deposited on these conserved,
older layers, and a new mollic horizon with a crumby
structure was formed near the surface.
It is thus clear that sediment deposition has taken
place during two periods, as illustrated in Fig. 4. The
first sediment deposition phase, in which the deeper
Phaeozem layers were formed, is designated as boldQand bmedium-termQ, as it lasted for several centuries.
The second deposition phase started recently, at the
time of closing and it is still a short-term process as
Fig. 4. Sketch to illustrate evolution of land use, sediment deposition and pe
explains processes occurring on the hillslope.
the oldest exclosures found in the study area are only
20 years old.
3.1.2. Haragua
Under the degraded rangeland situation in Haragua
(Fig. 1, Table 1), most common soil types are Rego-
sols (FAO et al., 1998), comprising loamy sand layers
of brown colour and low organic matter content (0.5%
organic C) and lacking any profile development.
Under the protected vegetation of the church forest,
Humi-endoskeletic Phaeozems (FAO et al., 1998)
(Table 2) are found with a mollic horizon on top and
a cambic horizon in the deeper soil layers. Colours of
the soil material range from brownish black to black.
The soil horizon succession in the exclosure pre-
sents a dark brown horizon on top of a brownish black
or black horizon. The fact that a lighter coloured hori-
zon overlies a darker horizon leads to a reconstruction
of soil development similar to the one in May Ba’ati:
Phaeozems have developed under vegetation influence
in trapped sediment originating from upslope areas. In
the degradation phase, the soils of the steep slope,
which is now under exclosure, have been eroded, but
not completely. Since closure, new sediment is being
trapped again by the regenerating vegetation, but as the
vegetation is not yet as rich as before (or as compared to
the church forest vegetation), soil organic matter con-
tent is not that high (1.3% compared to 1.6% organic C
in the Phaeozem under the forest vegetation), which is
also demonstrated by a lighter colour. Most common
dogenesis on steep slope sections now under exclosure. Text in italic

K. Descheemaeker et al. / Geoderma 132 (2006) 291–314 301
soils in the exclosure key out as Thaptomollic Cambi-
sols (FAO et al., 1998), reflecting the fact that con-
served, older sediment layers are buried by recently
deposited sediment.
3.1.3. Adewro
In Adewro (Fig. 1, Table 1) the distinction between
recent, short-term sediment deposited since closure,
and older, conserved sediment could not be estab-
lished. In all studied parcels, Phaeozems (FAO et
al., 1998) are the most common soils (Table 2),
even in the rangeland, where degradation apparently
has not yet led to complete erosion of the mollic
horizon at the surface.
Texture analyses reveal that the sand / silt ratio of
soil material in the rangeland and its source area is up
to four times smaller than that in the other areas and
their respective source areas (0.5 compared to values
around 2). Since texture is so different, it was not
found feasible to use horizon characteristics of the
degraded rangeland area to retrieve reference soil
horizons in the exclosures. However, taking into ac-
count the stone pavement at the soil surface in the
rangeland, there is no doubt that no sediment origi-
nating from the source area was recently deposited
here. Moreover, in view of the fact that the sand
fraction increased remarkably compared to the source
area (from 27% to 36%) at the expense of the silt
fraction (from 53% to 42%), it can be concluded that
no sediment deposition but erosion is taking place
here, removing first finer and leaving behind more
sandy soil material.
To determine the depth of the sediment layer in the
other parcels, the same logic as found for May Ba’ati
and Haragua was continued in Adewro. Although no
Table 3
General characteristics and locations of different sediment types in exclos
Study site Sediment type Characteristics
Haragua Recent, short-term Dark brown co
Old, medium-term Black colour
May BaVati Recent, short-term Not calcareous
(b15%), crum
Old, medium-term,
preserved
Low stoniness
strong structur
presence of ps
Old, medium-term,
remobilized
Calcareous, hi
Adewro No differentiation
differences in lithology exist between sediment source
areas and the parcels (all are on basaltic material),
evidence of deposition under vegetation influence
consisted in (a) upper horizons rich in organic matter
(N3% organic C), with (b) low rock fragment content,
leading to (c) a clear boundary with the underlying,
weathered basaltic parent material.
3.1.4. The concept of reference soil horizons and
different types of deposited sediment layers
Based on the detailed soil analysis in the three
study sites, the concept of reference soil horizons
and deposited sediment layers has been further devel-
oped. In our case, reference soil horizons are part of
generally truncated, in situ developed soils, compris-
ing soil material with low organic carbon content.
They can be found in all land use types for a given
study site. In degraded situations however, the refer-
ence soil horizon is found near or at the soil surface,
while in exclosures or in sites, which have not been
strongly degraded, the same reference soil horizons
are found below deposited sediment layers. As such,
reference soil horizons serve as a reference face: all
soil material found on top of the upper reference soil
horizon and showing (1) evidence of transportation
through the allochthonous nature of the material and
(2) characteristics such as dark colours and high or-
ganic matter content indicating soil formation under
influence of vegetation, is considered as material de-
posited and conserved under influence of vegetation
and called deposited sediment.
While studying the characteristics of deposited
sediment layers and reference soil horizons, a need
for further differentiation was felt (Table 3). A refer-
ence soil horizon can be either in situ weathered
ures of the three study sites
Location
lour Top of profiles
Deeper in profiles
, low stoniness
by structure
First 50–60 m from top of area,
upper soil layer of Phaeozems
(b15%),
e, calcareous,
eudomycelium
First 50–60 m from top of area,
especially in flatter positions,
deeper in profile of Phaeozems
gh stoniness (N15%) From 50–60 m from the top
downwards, top of profiles

Table 4
Characteristics of reference soil horizons and sediment layers
Type of soil layer Colora Rock
fragment
contentb
Bulk
density
(t m�3)
Organic
C (%)
Ntot
(%)
CaCO3
(%)
Pav(ppm)
Base
saturation
(%)
CEC (meq/
100 g soil)
Sand
(%)
Silt
(%)
Clay
(%)
Sand/silt (Sand+silt) /
clay
Haragua S Recent, short-term
(n =7)
Dark brown Few–many 1.47
(0.15)
1.3
(0.9)
0.1
(0.1)
1.1
(1.0)
1.2
(1.3)
55.2
(12.2)
18.2
(8.5)
78.4
(1.3)
8.6
(0.4)
13.0
(1.5)
9.1
(0.5)
6.7
(0.9)
S Old, medium-term
(n =10)
Brownish
black–black
Few–many 1.40
(0.11)
1.6
(1.0)
0.1
(0.1)
1.6
(1.1)
8.5
(8.0)
56.3
(8.7)
17.5
(9.2)
66.2
(7.8)
15.9
(3.7)
17.9
(4.1)
4.4
(1.5)
4.8
(1.3)
R Reference (n =5) Brown Few–many 1.56
(0.13)
0.5
(0.1)
0.1
(0.01)
0.2
(0.1)
0.9
(0.7)
38.1
(2.3)
7.7
(2.3)
86.1
(3.3)
5.6
(1.8)
8.3
(1.6)
16.3
(5.7)
11.3
(2.3)
May
BaVati
S Recent,
short-term (n =12)
Dark brown
to black
Very
few–common
1.01
(0.14)
4.2
(2.4)
0.3
(0.2)
2.4
(1.3)
6.3
(10.6)
88.9
(29.1)
42.9
(15.9)
19.6
(7.9)
43.6
(17.5)
37.1
(18.6)
0.5
(0.3)
2.8
(2.6)
S Old, medium-term,
conserved (n =6)
Dark brown
to black
Very
few–common
1.35
(0.05)
1.5
(0.1)
0.6
(0.8)
14.9
(12.2)
5.4
(3.2)
64.9
(11.6)
50.4
(8.1)
17.3
(5.0)
22.7
(5.0)
60.0
(0.0)
0.8
(0.4)
0.7
(0.0)
S Old, medium-term,
remobilised
(n =10)
Dark brown
to black
Many–
abundant
1.16
(0.117)
2.5
(0.7)
0.2
(0.1)
41.6
(20.4)
2.6
(0.6)
83.0
(7.4)
30.9
(3.5)
24.0
(7.2)
28.3
(4.5)
47.6
(9.3)
0.9
(0.3)
1.2
(0.4)
R Old colluvium
(n =7)
Yellow-orange-bright
or yellowish brown
Common–
abundant
1.40
(0.15)
0.72
(0.4)
0.1
(0.01)
49.8
(23.9)
1.7
(3.6)
470.5
(607.1)
31.7
(44.2)
43.2
(17.2)
31.6
(13.1)
25.3
(10.5)
2.0
(1.9)
3.5
(1.7)
R In situ parent
material (n =6)
Orange-bright or
yellowish brown
Very
few–common
1.59
(0.19)
0.2
(0.3)
0.03
(0.02)
59.0
(37.8)
3.0
(3.3)
177.5
(155.9)
10.6
(5.3)
31.0
(17.1)
37.3
(16.3)
32.0
(7.9)
1.0
(0.8)
2.3
(0.7)
Adewro S Sediment (n =12) Brownish black-
dark brown
Few–common 1.10
(0.24)
3.4
(1.2)
0.3
(0.1)
2.5
(0.4)
6.7
(9.1)
50.0
(3.3)
30.2
(2.8)
52.1
(8.5)
31.5
(5.5)
16.4
(3.9)
1.7
(0.6)
5.5
(1.8)
R Reference (n =9) Dark brown Abundant 1.50
(0.18)
0.2
(0.3)
0.05
(0.04)
7.6
(3.8)
0.0
(0.01)
78.9
(13.4)
34.0
(9.0)
76.2
(1.9)
17.8
(2.4)
6.0
(0.6)
4.4
(0.7)
15.8
(1.8)
Average values with standard deviations between brackets. In the second column, S and R indicate deposited sediment layers and reference soil layers, respectively.a Based on Munsell Soil Colours.b Stoniness: very few: b2%; few: 2–5%; common: 5–15%; many: 15–40%; abundant: 40–80%.
K.Desch
eemaeker
etal./Geoderm
a132(2006)291–314
302

Table 5
Correlation coefficients (Spearman’s rho) for total sediment depth
and other recorded variables for the three study sites
DIS SLO VEGtot
Haragua (n =56) SLO �0.500**VEGtot �0.090 �0.067SEDtot �0.124 �0.008 0.659**
May BaVati (n =92) SLO 0.313**
VEGtot �0.016 �0.447**SEDtot �0.110 �0.447** 0.429**
Adewro (n =77) SLO �0.053VEGtot 0.587** 0.132
SEDtot 0.317** 0.149 0.726**
(SLO: slope gradient (%); VEGtot: total vegetation cover (%);
SEDtot: total sediment depth (cm); DIS: distance from top edge
of the parcel (m)).
**: Correlation is significant at the .01 level (2-tailed).
Table 6
Best fitting regression functions relating total sediment depth (SED-
tot (cm)) with slope gradient (SLO (%)) and or total vegetation
cover (VEGtot (%)) for the three study sites (all given regression
functions are significant at p =0.000)
Site Regression function R2
Haragua (n =56) SEDtot =�19.34+1.604VEGtot�0.00762 VEGtot 2a
0.65b
May BaVati (n =92) SEDtot =126.171�23.275ln(SLO) 0.27
SEDtot =7.712+0.594VEGtot 0.24
SEDtot =89.373+0.567VEGtot�21.826ln(SLO)a
0.67b
Adewro (n =77) SEDtot =2.653+0.426 VEGtota 0.60
a Weighted Least Squares regression was used to correct for
unequal error variances.b The adjusted R2 value is given.
K. Descheemaeker et al. / Geoderma 132 (2006) 291–314 303
parent material or old colluvium. The latter contains
a high content of unweathered rock fragments and is
thought to be deposited through mass transport
(Nyssen et al., 2002), before the old sediment was
deposited. Sediment layers are subdivided in brecent,short-term sedimentQ, deposited since exclosure es-
tablishment, and bold, medium-term sedimentQ. In
May Ba’ati, the latter is further refined by the
specifications bconservedQ and bremobilizedQ. Dur-
ing the degradation phase the remobilized sediment
has been redeposited further downslope, resulting
in a more stony and calcareous nature (see also
Fig. 4).
In Table 4 characteristics of reference soil horizons
and deposited sediment layers are given for the three
study sites. Organic carbon content, total nitrogen
content and available phosphorus are the principal
variables allowing to distinguish between reference
soil horizons and deposited sediment layers for all
study sites, while stoniness, bulk density, texture
and CaCO3 content serve this purpose only in some
sites. Based on the data summarized in Table 4, vari-
ables which can be easily used in the field were
determined for the three study sites. In May Ba’ati,
colour, the presence of CaCO3 and rock fragment
content are the most clearly distinguishing variables.
In Haragua indications on colour and texture lead to
correct designations, while in Adewro, knowledge on
rock fragment content and texture will do so. Using
also the indications given in Table 3, a further refine-
ment between types of deposited sediment layers was
carried out in the field.
As two clearly different sediment deposition
phases were distinguished, it was decided to split up
the analysis of the data collected through the transect
study in an analysis of recent, short-term sediment
deposits on the one hand and total deposited sediment
on the other hand. The latter stands for the total
thickness of recent, short-term and old, medium-
term deposited sediment layers taken together and as
such, it reflects the total thickness of fertile soil pres-
ent in exclosure areas. In the remainder of this paper,
the terms recent, short-term and old, medium-term
will be simply referred to as recent and old.
3.2. Total sediment deposits
Relations between total sediment thickness and
explanatory variables, such as slope gradient, current
vegetation cover and distance from the top edge of the
parcel, have been analyzed for all study sites by
correlation (Table 5) and linear regression analysis
(Table 6 and Fig. 5). One can criticise using current
vegetation cover to represent the medium-term vege-
tation cover that is believed to have influenced total
sediment thickness. However, it can be assumed that
within an exclosure, places, which nowadays have
low vegetation cover were most probably bearing
less vegetation during the degradation phase also.
The same reasoning holds for zones which currently
have high vegetation cover. These zones are found on
more favorable locations, supporting also more vege-
tation both during the forest and the degradation
phase. As such it does seem reasonable to take current

Haragua
SE
Dto
t (cm
)S
ED
tot (
cm)
0
20
40
60
80
100
120
May Ba'ati
0
20
40
60
80
100
May Ba'ati
0
20
40
60
80
100
120
140
Adewro
VEGtot (%)
0 20 40 60 80 100
VEGtot (%)
0 20 40 60 80 100
VEGtot (%)
0 20 40 60 80 100
SLO (%)
0 20 40 60 80 100
SE
Dto
t (cm
)S
ED
tot (
cm)
0
10
20
30
40
50
60
n = 77R2 = 0.60SEDtot = 2.653+0.426VEGtot
n = 92R2 = 0.27SEDtot = 126.171–23.275ln(SLO)
n = 92R2 = 0.24SEDtot = 7.712+0.594VEGtot
n = 56R2 = 0.65SEDtot = –19.34+1.604VEGtot –0.00762VEGtot 2
Fig. 5. Best fitting regression functions relating total sediment depth (SEDtot) with slope gradient (SLO) or vegetation cover (VEGtot) for the
three study sites.
K. Descheemaeker et al. / Geoderma 132 (2006) 291–314304
vegetation cover as a substitute for vegetation cover
over the studied medium-term period.
Total sediment depth in Haragua is significantly
correlated with total vegetation cover only (Table 5),
further explained by a significant regression, using the
quadratic term of total vegetation cover as explanatory
variable (adjusted R2=0.65; n=56; p =0.000) (Table
6 and Fig. 5). Neither slope gradient nor distance is
correlated with total sediment depth. As it is expected
that more sediment is deposited close to the sediment
source area near the top edge of the parcel and where
the slope gradient is relatively low, it should not
surprise that for the exclosure and the church forest
in Haragua, total sediment depths are found to be
relatively higher near the top edge (despite the steep
slope) and at the bottom (thanks to the gentle slope).
ANOVA analysis and post hoc testing for com-
parison of mean values of total sediment thickness
were conducted to establish slope gradient and veg-
etation cover classes with significantly different total
sediment thicknesses. This analysis reveals two
clear groups of total vegetation cover in Haragua
(Table 7). The first group (classes with vegetation
cover below 40%) can be found in the rangeland,
which has an average vegetation cover of 25%
(Table 1), while classes with vegetation cover of
more than 40%, forming the second group, are
encountered in the exclosure (average total vegeta-
tion cover of 50%, see Table 1) and in the forest
(average total vegetation cover of 75%, see Table
1), where total sediment thicknesses are more than 3
times higher (Table 7).

Table 8
Correlation coefficients (Spearman’s rho) for all recorded variables
for the Eucalyptus forest in Adewro (n =19)
DIS SLO VEGtot VEGunder VEGeuc
SLO 0.048
VEGtot �0.371 0.283
VEGunder 0.114 0.357 0.792**
VEGeuc �0.253 �0.246 �0.489* �0.830**SEDtot 0.303 0.239 0.258 0.421 �0.413(SLO: slope gradient (%); VEGtot: total vegetation cover (%);
VEGunder: understorey vegetation cover (%); VEGeuc: Eucalyptus
tree cover (%); SEDtot: total sediment depth (cm); DIS: distance
from top edge of the parcel (m)).
**: Correlation is significant at the .01 level (2-tailed); *: Correla-
tion is significant at the .05 level (2-tailed).
Table 7
Mean values of total sediment depth (in cm) for vegetation cover
classes and slope gradient classes for the three study sites and results
of ANOVA analysis and post hoc tests to compare means
Classes Haragua
(n =56)
May Ba’ati
(n =92)
Adewro
(n =77)
Vegetation cover 0–20% 4.3 a 15.2 a 5.5 a
21–40% 16.6 a 29.0 ab 17.2 b
41–60% 58.2 b 36.2 ab 23.4 bc
61–80% 57.3 b 44.4 b 32.3 c
81–100% 56.8 b 66.8 c 33.2 c
F-value
(sign.)
12.415
(0.000)
7.695
(0.000)
18.040
(0.000)
Slope gradient 0–30% 23.8 a 60.4 a 13.9 a
31–65% 40.8 a 34.5 b 24.2 a
66–100% 35.5 a 26.5 b 24.4 a
F-value
(sign.)
0.868
(0.426)
13.508
(0.000)
3.750
(0.028)
Vegetation cover and slope gradient classes within the same site
have significantly different sediment depths if they have no letters in
common (based on Tamhane’s T2 test for unequal variances for
May Ba’ati and on the Tukey test for Adewro and Haragua).
K. Descheemaeker et al. / Geoderma 132 (2006) 291–314 305
In May Ba’ati, total sediment depth is significant-
ly correlated with slope gradient (negative correla-
tion) and with total vegetation cover (positive
correlation). Distance from top is negatively, but
not significantly correlated with total sediment
depth (Table 5). The results of the linear regression
analysis confirm these findings, bringing forward
(the natural logarithm of) slope gradient and total
vegetation cover as best explanatory variables both
in single (R2=0.27 for slope gradient and R2=0.24
for total vegetation cover; n =92; p =0.000) as in
multiple regression (adjusted R2=0.67; n =92; p =
0.000) (Table 6 and Fig. 5).
After ANOVA analysis and post hoc testing, a
difference in total sediment depth between the first
slope gradient class and the other classes was dem-
onstrated for May Ba’ati (Table 7), meaning that in
areas with slope gradient less than 30% almost
the double amount of sediment is trapped and
conserved compared to areas where slope gradients
are higher. Concerning total vegetation cover, it is
striking that there is still a significant difference in
sediment depth under a vegetation cover of 60%
to 80% compared to a cover of 80% to 100%
(Table 7).
In Adewro, total sediment depth is significantly
and positively correlated with total vegetation cover
and distance from the top of the parcels (Table 5).
The correlation between the latter variable and
sediment depth is probably due to a strong positive
correlation between total vegetation cover and dis-
tance. When only the Eucalyptus forest is consid-
ered, it is noted that total sediment depth is not
significantly correlated with any other variable, and
that even a negative correlation exists between soil
cover by Eucalyptus trees and total sediment depth
(Table 8). An explanation for this different behav-
iour can be that Eucalyptus trees suppress the
understorey vegetation (illustrated by the signifi-
cantly negative correlation between these 2 vari-
ables, Table 8), which plays a role in trapping
sediment (positive correlation between sediment
depth and understorey vegetation). Our findings
concerning this phenomenon are confirmed by
Fiedler and Belay (1988) who stated that Euca-
lyptus forests in Ethiopia in areas with rainfall
less than 750 mm have a weakly developed un-
derstorey and forest floor which may enhance run-
off and erosion and thus counteract sediment trapping
processes.
The relation between total vegetation cover and
total sediment depth in Adewro is further illustrated
through linear regression (R2=0.60; n =77; p =0.000)
(Table 6 and Fig. 5) and the results of the ANOVA
analysis (Table 7).
Slope gradient and total vegetation cover measured
along transects explain the spatial distribution of total
sediment thicknesses within a studied parcel. The
average depth of total sediment in a parcel as a
whole is believed to be influenced first of all by the

K. Descheemaeker et al. / Geoderma 132 (2006) 291–314306
ratio between sediment source area and trapping area
and secondly by the land use of the parcel, variables
which do not vary along the studied transects. Not-
withstanding the fact that the current land use of a
parcel is not representative for the land use during
the entire period of sediment deposition, it influences
how much of the deposited sediment could be pre-
served. As such, a logical scoring from 1 to 4 was
attributed to each land use type according to its
degree of degradation over time, so that land use
type could be treated as a quantitative variable in the
analysis. Land use type as well as the ratio of
sediment source area to trapping area are positively
correlated to average total sediment depth, although
only the former significantly (n=11; p =0.027).
When both variables are combined, a significant
Haragua - exclosure, HXY
distance from top (m)
0 20 40 60 80 100 120
0 20 40 60 80 100 120
rece
nt, s
hort
-ter
m s
edim
ent d
epth
(cm
)
0
5
10
15
20
slop
e gr
adie
nt a
nd v
eget
atio
n co
ver
(%)
0
20
40
60
80
100
0
20
40
60
80
100
May Ba'ati - old exclosure B, MXOb
distance from top (m)
rece
nt s
edim
ent d
epth
(cm
)
0
5
10
15
20
slop
e gr
adie
nt a
nd v
eget
aito
n co
ver
(%)
Fig. 6. Overview of transect study results for recent, short-term sediment d
Vegetation cover (dotted lines) and slope gradient (full lines) are also ind
multiple regression function is obtained for the
three study sites taken together:
SEDtot;av ¼ � 26:4þ 15:4LU þ 16:4 S=T
n ¼ 11;R2 ¼ 0:88; p ¼ 0:000� �
Where SEDtot,av: average total sediment depth for
the whole parcel (cm); LU: land use type scoring: 1:
degraded rangeland, 2: young exclosure, 3: old exclo-
sure, 4: church forest; S /T: ratio of sediment source
area to sediment trapping area.
3.3. Recent sediment deposits
Since no distinction between recent and old sed-
iment could be made in Adewro, recent sediment
0 20 40 60 80 100 120
0 20 40 60 80 100 120
0
20
40
60
80
100
0
20
40
60
80
100
May Ba'ati - old exclosure A, MXOa
distance from top (m)
rece
nt, s
hort
-ter
m s
edim
ent d
epth
(cm
)
0
5
10
15
20
slop
e gr
adie
nt a
nd v
eget
atio
n co
ver
(%)
May Ba'ati - young exclosure, MXY
distance from top (m)
rece
nt, s
hort
-ter
m s
edim
ent d
epth
(cm
)
0
5
10
15
20
slop
e gr
adie
nt a
nd v
eget
atio
n co
ver
(%)
epth (bars) as a function of distance from the top edge of the parcel.
icated.

Table 10
Best fitting regression functions relating recent, short-term sediment
depth (SEDrec (cm)) with slope gradient (SLO (%)), distance from
the top of the parcel (DIS (m)) and vegetation cover (VEGtot (%))
for May Ba’ati (all given regression functions are significant at
p =0.000, except the third and the last one, where p =0.008 and
p =0.026, respectively)
Site Regression function R2
All land use types
together (n =42)
SEDrec =18.268�4.462ln(DIS) (*) 0.67
SEDrec =28.512�6.476ln(SLO) (*) 0.48
SEDrec =�0.467+0.110(VEGtot) (*) 0.16
MXOa (n =14) SEDrec =17.096�4.239ln(DIS) 0.85
MXO b (n =16) SEDrec =28.154�6.843ln(DIS) 0.80
MXY (n =12) SEDrec =7.571�1.966ln(DIS) (*) 0.40
(*) Weighted Least Squares regression was used to correct for
unequal error variances.
(MXOa, MXOb, MXY,: old exclosures A and B and young exclo-
sure in May Ba’ati).
K. Descheemaeker et al. / Geoderma 132 (2006) 291–314 307
thickness was only measured in May Ba’ati and
Haragua.
The different pattern of deposition in these two
study sites is immediately striking from Fig. 6. In
Haragua, recent sediment depth shows a regular distri-
bution over the whole hillslope with an average of
about 7 cm, while in May Ba’ati, recent sediment
depth decreases rapidly with distance from the top to
reach a value of zero at a distance of 40 or 60 m for the
young and old exclosures, respectively. In the young
three-year-old exclosure of May Ba’ati (MXY), on
average 5 cm of recent sediment is found just below
the top edge of the area, while in the old exclosures of
20 years, recent sediment depths range from 1.6 cm at
40 m distance up to 10 cm at 5 m distance from the top
edge in MXOa and from 2.5 cm to 17 cm in MXOb at
the same respective distances from the top edge.
From Fig. 6 it can be assumed that in May Ba’ati
strong correlations exist between recent sediment
depth, slope gradient and vegetation cover, while in
Haragua none of these are likely, as was confirmed by
correlation analysis (Table 9). Regression functions
relating recent sediment depth with slope gradient,
distance and vegetation cover were significant only in
May Ba’ati (Table 10 and Fig. 7). Multiple regression
with a combination of explanatory variables could not
increase the R2 of the simple regression with distance.
When regression functions relating recent sediment
depth with distance are calculated for the different
land use types of May Ba’ati separately, R2 increases
except for the young exclosure MXY (Table 10). This
is not surprising since the variation in recent sediment
Table 9
Correlation coefficients (Spearman’s rho) for recent, short-term
sediment depth and other recorded variables for the exclosures of
two study sites
DIS SLO VEGtot
Haragua
(n =18)
SLO �0.637**VEGtot �0.146 0.218
SEDrec 0.278 �0.085 0.098
May Ba’ati
(n =42)
SLO 0.545**
VEGtot �0.213 �0.495**SEDrec �0.784** �0.588** 0.391*
(SLO: slope gradient (%); VEGtot: total vegetation cover (%);
SEDrec: recent, short-term sediment depth (cm); DIS: distance
from top edge of the parcel (m)).
* Correlation is significant at the .05 level (2-tailed).
** Correlation is significant at the .01 level (2-tailed).
depth caused by the fact that different land use types
are taken together is lost. For the young exclosure
however, variation in recent sediment depth is still
relatively high (reflected by a lower R2), because in
this area vegetation cover is less continuous (Fig. 2),
which induces also a higher spatial variability in
deposited sediment depth.
Using averages of the recorded values for recent
sediment depth and a mean bulk density value of 1.47
Mg m�3 for Haragua and 1.01 Mg m�3 for May Ba’ati
as determined for recent sediment in these areas (Table
4), the mass of deposited sediment per hectare since
closure was calculated. Dividing these results by the
respective years of closure to obtain an estimation of
the annual short-term sediment deposition rate resulted
in values of 25 to 93 Mg ha�1 yr�1 for May Ba’ati and
123 Mg ha�1 yr�1 for Haragua (Table 11). For the
exclosures in May Ba’ati average values for annual
short-term sediment deposition rates range from 0.52
to 1.77 cm yr�1 for locations near the top edge of the
parcels and decrease rapidly to zero with distance
(Table 11). This trend is not observed in the exclosure
in Haragua, where the deposition rate fluctuates be-
tween 0.9 and 1.8 cm yr�1. The weighted average for
the strip in which sediment deposition occurs, amounts
to almost 1.4 cm yr�1 in Haragua, whereas the weight-
ed average values for the May Ba’ati exclosures don’t
exceed 0.8 cm yr�1 (Table 11).
Differences in recent sediment deposition rate be-
tween different land use types can be caused by several
factors, such as the area and the condition of the

DIS (m)
0 10 20 30 40 50 60 70
SE
Dre
c (c
m)
0
5
10
15
20
25
n = 42
R2 = 0.67
n = 42R2 = 0.48
SEDrec = 18.268 – 4.462ln(DIS)
SEDrec = 28.512 – 6.476ln(SLO)
n = 42R2 = 0.16SEDrec = –0.467 + 0.11(VEGtot)
SLO (%)
0 20 40 60 80 100 120
0 20 40 60 80 100 120
SE
Dre
c (c
m)
0
5
10
15
20
25
VEGtot (%)
SE
Dre
c (c
m)
0
5
10
15
20
25
Fig. 7. Best fitting regression functions relating recent, short-term
sediment depth (SEDrec) with distance from the top edge of the
parcel (DIS), slope gradient (SLO) and total vegetation cover
(VEGtot) for May Ba’ati.
Table 11
Recent, short-term sediment deposition for Haragua and May Ba’at
DIS HXY MXOa MXOb MXY
SEDrec (Mg ha�1) (years of closure)
n.a. 616 (5) 512 (20) 928 (20) 279 (3)
SEDrec (Mg ha�1 yr�1)
n.a. 123.2 25.6 46.4 93.0
SEDrec (cm yr�1)
5 0.90 0.52 0.84 1.77
20 1.13 0.19 0.43 0.53
40 1.82 0.08 0.13 0
60 1.45 0 0 0
80 1.48 0 0 0
100 1.59 0 0 0
120 1.24 0 0 0
weighted average 1.37 0.26 0.46 0.77
SEDrec: recent, short-term sediment; DIS: distance from top edge of
the parcel (m)).
(HXY: exclosure in Haragua; MXOa, MXOb, MXY: old exclosures
A and B and young exclosure in May Ba’ati).
K. Descheemaeker et al. / Geoderma 132 (2006) 291–314308
sediment source area. Also the state of the exclosure
itself (vegetation cover, slope gradient) could play a
role. In contrast to total sediment however, recent
sediment deposition rate is inversely related to land
use type, as in the young exclosures deposition rates
are much higher. Furthermore, taking into account the
pattern of deposition in relation to distance from the top
in May Ba’ati, it is concluded that all sediment that
enters into the exclosure is deposited, regardless of the
exclosure’s condition. In Haragua on the contrary, re-
cent sediment depths do not tend to zero with increas-
ing distance from the top edge, so that this assumption
does not hold and trapping efficiencies are lower than
100% here. The explanation for different sediment
deposition rates must therefore be related to the ratio
of sediment source to trapping area and the erodibility
of the sediment source area rather than in the conditions
of the exclosure itself.
Assuming complete sediment deposition within the
exclosures, erosion rates for the sediment source area
were calculated (Table 12). Since 100% sediment trap-
ping cannot be assumed in Haragua, erosion rates there
can be even higher than the value indicated in Table
12. The different recent sediment deposition rates
(25.6 versus 46.4 Mg ha�1 yr�1) in otherwise similar
parcels like MXOa and MXOb can be explained by
their different ratio of erosion area to trapping area (2.7
versus 4.6; Table 12). The area ratios of MXY and
MXOb are very similar, but their deposition rates are
not, which is reflected in different erosion rates for the
i
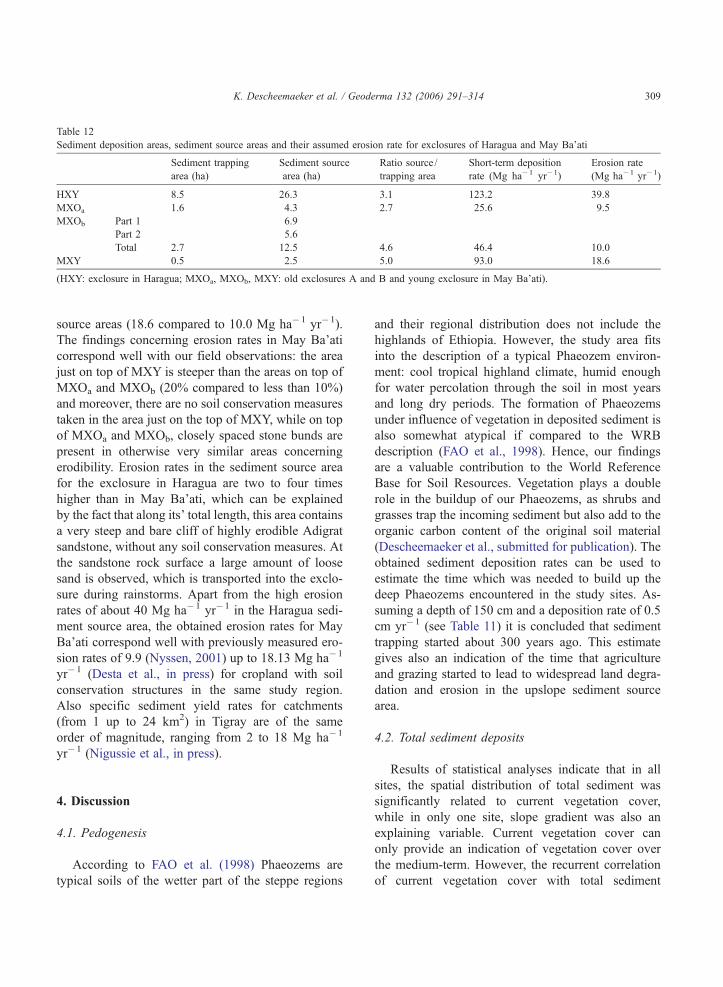
Table 12
Sediment deposition areas, sediment source areas and their assumed erosion rate for exclosures of Haragua and May Ba’ati
Sediment trapping
area (ha)
Sediment source
area (ha)
Ratio source /
trapping area
Short-term deposition
rate (Mg ha�1 yr�1)
Erosion rate
(Mg ha�1 yr�1)
HXY 8.5 26.3 3.1 123.2 39.8
MXOa 1.6 4.3 2.7 25.6 9.5
MXOb Part 1 6.9
Part 2 5.6
Total 2.7 12.5 4.6 46.4 10.0
MXY 0.5 2.5 5.0 93.0 18.6
(HXY: exclosure in Haragua; MXOa, MXOb, MXY: old exclosures A and B and young exclosure in May Ba’ati).
K. Descheemaeker et al. / Geoderma 132 (2006) 291–314 309
source areas (18.6 compared to 10.0 Mg ha�1 yr�1).
The findings concerning erosion rates in May Ba’ati
correspond well with our field observations: the area
just on top of MXY is steeper than the areas on top of
MXOa and MXOb (20% compared to less than 10%)
and moreover, there are no soil conservation measures
taken in the area just on the top of MXY, while on top
of MXOa and MXOb, closely spaced stone bunds are
present in otherwise very similar areas concerning
erodibility. Erosion rates in the sediment source area
for the exclosure in Haragua are two to four times
higher than in May Ba’ati, which can be explained
by the fact that along its’ total length, this area contains
a very steep and bare cliff of highly erodible Adigrat
sandstone, without any soil conservation measures. At
the sandstone rock surface a large amount of loose
sand is observed, which is transported into the exclo-
sure during rainstorms. Apart from the high erosion
rates of about 40 Mg ha�1 yr�1 in the Haragua sedi-
ment source area, the obtained erosion rates for May
Ba’ati correspond well with previously measured ero-
sion rates of 9.9 (Nyssen, 2001) up to 18.13 Mg ha�1
yr�1 (Desta et al., in press) for cropland with soil
conservation structures in the same study region.
Also specific sediment yield rates for catchments
(from 1 up to 24 km2) in Tigray are of the same
order of magnitude, ranging from 2 to 18 Mg ha�1
yr�1 (Nigussie et al., in press).
4. Discussion
4.1. Pedogenesis
According to FAO et al. (1998) Phaeozems are
typical soils of the wetter part of the steppe regions
and their regional distribution does not include the
highlands of Ethiopia. However, the study area fits
into the description of a typical Phaeozem environ-
ment: cool tropical highland climate, humid enough
for water percolation through the soil in most years
and long dry periods. The formation of Phaeozems
under influence of vegetation in deposited sediment is
also somewhat atypical if compared to the WRB
description (FAO et al., 1998). Hence, our findings
are a valuable contribution to the World Reference
Base for Soil Resources. Vegetation plays a double
role in the buildup of our Phaeozems, as shrubs and
grasses trap the incoming sediment but also add to the
organic carbon content of the original soil material
(Descheemaeker et al., submitted for publication). The
obtained sediment deposition rates can be used to
estimate the time which was needed to build up the
deep Phaeozems encountered in the study sites. As-
suming a depth of 150 cm and a deposition rate of 0.5
cm yr�1 (see Table 11) it is concluded that sediment
trapping started about 300 years ago. This estimate
gives also an indication of the time that agriculture
and grazing started to lead to widespread land degra-
dation and erosion in the upslope sediment source
area.
4.2. Total sediment deposits
Results of statistical analyses indicate that in all
sites, the spatial distribution of total sediment was
significantly related to current vegetation cover,
while in only one site, slope gradient was also an
explaining variable. Current vegetation cover can
only provide an indication of vegetation cover over
the medium-term. However, the recurrent correlation
of current vegetation cover with total sediment

K. Descheemaeker et al. / Geoderma 132 (2006) 291–314310
depth, which was demonstrated for all study sites,
proves that it is a valid substitute. In contrast to
recent sediment depth, no relation with distance
was found for total sediment depth. A possible
explanation is that soil material deposited under
former forest vegetation was remobilized after de-
forestation and redeposited further downslope, so
that the initial relation with distance became
blurred. The strong regression predicting average
total sediment depth of a parcel shows that the
parcels’ land use and its’ ratio of sediment source
area to trapping area represent the general condi-
tions for a hillslope bearing more or less total
sediment. Local effects of vegetation cover and
slope gradient are key determinants of total sedi-
ment distribution within a parcel.
4.3. Recent sediment trapping in exclosures
By studying recent sediment deposits, which is
the sediment deposited under the current land use,
i.e., regenerating vegetation, a better understanding
of the process of sediment trapping in exclosure
areas was obtained. For the study site May Ba’ati,
results indicate a significant relation between recent
sediment thickness and both slope gradient (negative
correlation) and vegetation cover (positive correla-
tion). Many studies on water erosion processes
revealed significant relations between slope gradient
(positive) and vegetation cover (negative) on the one
hand and sediment yields on the other hand (Sorriso-
Valvo et al., 1995; Gutierrez and Hernandez, 1996;
Sole-Benet et al., 1997; Woo et al., 1997; Cerda,
1998; Puigdefabregas et al., 1999; Braud et al.,
2001; Erskine et al., 2002). As expected, these rela-
tions for water erosion are just the opposite of the
relations we found for sediment trapping. For the
study site May Ba’ati, our findings further demon-
strate a strong and exponentially decreasing relation
between thickness of recently deposited sediment
and distance from the upper edge of the exclosure.
Van Dijk et al. (1996) found the same type of
relation between sediment concentration and filter
length and also Abu-Zreig (2001) concluded from
a review on factors affecting sediment trapping in
vegetative filter strips that filter length is the most
significant factor. In Haragua however, this typical
pattern of exponentially decreasing recent sediment
depth with distance from the source area was not
found. This can be explained by the fact that very
high slope gradients of almost 70% are found just
below the top edge of the exclosure. This could
have caused the deposition to move downslope as
was also reported by Jin and Romkens (2001).
Differences between study sites in sediment deposi-
tion patterns and the way factors control these pro-
cesses, could not be clearly explained by differences
in lithology, except for the Adigrat sandstone in
Haragua, which, through its high erodibility, can
explain the very high sediment deposition rates in
the exclosure.
In the literature on sediment deposition, only a few
studies (Beuselinck et al., 2000; Wallbrink et al.,
2002) can be found on actual amounts, locations
and conditions of sediment deposited in field situa-
tions. A problem complicating the comparison be-
tween this and their study is the difference in
characteristics of source areas and vegetation strips.
Wallbrink et al. (2002) found an average deposition
rate of 17 Mg ha�1 yr�1 in filter strips bordering
forest logging areas. Beuselinck et al. (2000) recorded
deposition rates of 4 and 15 Mg ha�1 after 1 big
rainfall event for 2 different catchments in the Belgian
Loam Belt. Vegetation-controlled deposition in the
latter study occurred mainly due to small strips of
vegetation in between fields. The values we measured
for yearly sediment deposition (25.6 to 123.2 Mg
ha�1, Table 11) are clearly higher. Compared to the
results of Beuselinck et al. (2000), this can be
explained by the fact that the latter values refer to
deposition in a total catchment area, and result from
1 rainfall event only. An explanation for the discrep-
ancy with the values of Wallbrink et al. (2002) can
be found in the fact that in the latter study already a
significant amount of eroded sediment from log land-
ings and snig tracks is probably deposited in the
general harvest areas (Croke et al., 1999) before it
reaches the filters. Bojo and Cassells (1995) give an
overview of sediment delivery ratios at catchment
scale ranging from 1% to 30%, found by various
authors for different areas in Ethiopia. Consequently,
70% up to 99% of the eroded sediment was depos-
ited before reaching the catchment outlet. The very
high trapping capacity of exclosure areas, which was
demonstrated in this study, can at least partly explain
this phenomenon.

K. Descheemaeker et al. / Geoderma 132 (2006) 291–314 311
The analogy between exclosures in their landscape
context and banded vegetation, described by Valentin
et al. (1999) can be noted, as exclosures are usually
forming vegetation bands on steep slopes bordering
cropland or more degraded rangelands, where natural
vegetation cover is less. Exclosures, as well as band-
ed vegetation phenomena, are source–sink systems
of soil and water. Similar to the so-called interbands,
there is also a lot of runoff and soil erosion in the
cropland and degraded rangelands of our study sites,
since vegetative protection from rain impact is very
low. In both systems the vegetation bands act as
sinks, showing increased infiltration and sediment
deposition.
As the high sediment trapping capacity of exclo-
sures is proved, it is worth considering them as an
effective way to reduce the sediment input to water
reservoirs, which are threatened by rapid siltation
(Nigussie et al., in press), by applying them on se-
lected areas bordering the reservoir. As concluded
from the study on recent sediment, depths of depos-
ited sediment exponentially decrease with distance
from the top edge of exclosures. Therefore, where
slope gradients are not too steep just below the top
edge (less than 50%), an exclosure width of 50–60 m
should be sufficient to trap nearly all of the incoming
sediment.
Furthermore, since exclosures can act as important
sinks of water and sediment, a supplementary option
might be to divert gullies, which are the main trans-
port ways of sediment out of the catchment, into an
exclosure. As such, water and sediment, which would
otherwise be lost, are captured by the exclosure.
However, this potential conservation measure still
has to be tested for its feasibility in the field.
5. Conclusions
In the Tigray highlands, Phaeozems are developing
under influence of vegetation and sediment deposi-
tion. Their formation started probably at least 300
years ago.
In exclosures located downslope from sediment
source areas, two main types of deposited sediment
are found. They are designated as recent, short-term
(b20 years) sediment deposits and old, medium-term
(20–300 years) sediment deposits. Both types are
characterized by specific chemical and morphological
properties, and typical landscape positions.
The detailed description of these characteristics
makes it possible to distinguish the sediment layers
from reference soil layers. By soil augering, the depth
of the deposited sediment layers can be easily deter-
mined in the field.
Total sediment depth in banded exclosure strips is
mainly vegetation-controlled as in only one case a
significant (negative) relation with slope gradient
was found. Besides land use type, the ratio between
sediment source area and trapping area helps to ex-
plain the average depth of total deposited sediment on
a hillslope.
Recent sediment trapping in exclosures is related to
distance from the top edge, slope gradient and vege-
tation cover, but also to the sediment source area and
its’ erodibility. Even on steep slopes (35–50%), very
high short-term (b20 years) sediment deposition rates
were observed in exclosures located below large sed-
iment source areas.
Because of their high sediment trapping capacity,
exclosures established in 50 to 100 m wide strips
across the slope are a very efficient soil and water
conservation measure. They accelerate fertile soil
buildup and prevent important sediment loads from
leaving the catchment or silting up water reservoirs.
However, for exclosures to continue playing their
environmental conservation role in the future, it will
be necessary to take into account also socio-economic
needs. A sustainable and socially fair harvesting sys-
tem of the wood resources or a rotational grazing
system in which several exclosure areas take turns
being opened, are only two examples of how progress
in this direction could be achieved.
Acknowledgements
The research was conducted within the framework
of the Zala–Daget project, funded by the VLIR (Flem-
ish Interuniversity Council, project n8 VLIR/EI 237).Katrien Descheemaeker is funded through an FWO
Vlaanderen Aspirant scholarship and Joni Rossi was
financially supported by a grant from dInterfacultyCouncil for Development Co-operationT of the Katho-lieke Universiteit Leuven. The support by Mekelle
University and the laboratory facilities and help at

K. Descheemaeker et al. / Geoderma 132 (2006) 291–314312
the Faculty of Agricultural and Applied Biological
Sciences of the K.U. Leuven are greatly appreciated.
Furthermore, we want to thank the local Bureau of
Agriculture branch, the authorities and exclosure
guards of several villages of the Dogu’a Tembien
district and Girmay Hailemariam, Romha Assefa
and Haftu Assefa for their field assistance.
References
Abubakar, S.M., 1996. Rehabilitation of degraded lands by means
of fallowing in a semiarid area of northern Nigeria. Land
Degradation & Development 7, 133–144.
Abubakar, S.M., 1997. Monitoring land degradation in the semi-
arid tropics using an inferential approach: the Kabomo basin
case study, Nigeria. Land Degradation & Development 8,
311–323.
Abu-Zreig, M., 2001. Factors affecting sediment trapping in vege-
tated filter strips simulation study using VFSMOD. Hydrolog-
ical Processes 15, 1477–1488.
Adejuwon, J.O., Ekanade, O., 1988. A comparison of soil properties
under different land use types in a part of the Nigerian cocoa
belt. Catena 15, 319–331.
Aerts, R., Mitiku Haile, Muys, B., Deckers, J., Hermy, M., Moeyer-
sons, J., 2001. Forest rehabilitation and water conservation in
the Tigray highlands, Northern Ethiopia. European Tropical
Forestry Research Network News 33, 29–31.
Aerts, R., November, E., Mintesinot Behailu,, Deckers, J., Hermy,
M., Muys, B., 2003. Forest rehabilitation: one approach to water
conservation in Central Tigray. Water 6, 34–37 (Eth. J. Wat.
Sci. and Tech.)
Aerts, R., Wagendorp, T., November, E., Mintesinot Behailu,,
Deckers, J., Muys, B., 2004. Ecosystem thermal buffer capac-
ity as an indicator of the restoration status of protected areas in
the Northern Ethiopian Highlands. Restoration Ecology 12,
586–596.
Allison, L.E., Moodie, C.D., 1965. Carbonate. In: Black, C.A., et
al., (Eds.), Methods of Soil Analysis. Part 2. Chemical and
Microbiological Properties, (1st edition) American Society of
Agronomy, Madison, WI.
Bergkamp, G., 1998. A hierarchical view of the interactions of
runoff and infiltration with vegetation and microtopography in
semiarid shrublands. Catena 33, 201–220.
Beuselinck, L., Steegen, A., Govers, G., Nachtergaele, J., Takken,
I., Poesen, J., 2000. Characteristics of sediment deposits formed
by intense rainfall events in small catchments in the Belgian
Loam Belt. Geomorphology 32, 69–82.
Bojo, J., Cassells, D., 1995. Land degradation and rehabilitation in
Ethiopia: a reassessment. AFTES Working Paper, vol. 17. The
World Bank. (48 pp.)
Bosellini, A., Russo, A., Fantozzi, P.L., Assefa, G., Solomon,
T., 1997. The Mesozoic succession of the Mekele outlier
(Tigre Province, Ethiopia). Memorie di Scienze Geologiche
49, 95–116.
Braud, I., Vich, A.I.J., Zuluaga, J., Fornero, L., Pedrani, A., 2001.
Vegetation influence on runoff and sediment yield in the Andes
region: observation and modelling. Journal of Hydrology 254,
124–144.
Cerda, A., 1998. The influence of geomorphological position and
vegetation cover on the erosional and hydrological processes
on a Mediterranean hillslope. Hydrological Processes 12,
661–671.
Chadhokar, P.A., 1992. Area closure for soil conservation in
Ethiopia: potential and dangers. In: Hurni, H., Kebedo Tato
(Eds.), Erosion, Conservation and Small-Scale Farming, a
Reviewed Selection of Papers Presented at the 6th Internation-
al Soil Conservation Conference Held in Ethiopia and Kenya,
6–18 November 1989, Geographica Bernensia, vol. 2. ISCO,
pp. 329–333 (WASWC).
Chadhokar, P.A., Solomon Abate, 1988. Importance of revegetation
in soil conservation in Ethiopia. In: Richwanich, S. (Ed.), Land
Conservation for Future Generations. Proceedings of the 5th
International Soil Conservation Conference, Bangkok, Thailand,
pp. 1203–1213.
Chhabra, R., Pleysier, J., Cremers, A., 1975. The measurement of
the cation exchange capacity and exchangeable cations in soils:
a new method. In: Bailey, S.W. (Ed.), Proceedings of the
International Clay Conference. Applied Publishing Ltd, Wilm-
ette, Illinois, USA, pp. 439–449.
Croke, J., Hairsine, P., Fogarty, P., 1999. Sediment transport, redis-
tribution and storage on logged forest hillslopes in south-eastern
Australia. Hydrological Processes 13, 2705–2720.
Descheemaeker, K., Naudts, J., Nyssen, J., De Geyndt, K.,
Mitiku Haile, Moeyersons, J., Poesen, J., Deckers, J., submit-
ted for publication. Trapping sediment and organic carbon in
exclosures in an Ethiopian highland. Land Degradation and
Development.
Desta Gebremichael, Nyssen, J., Poesen, J., Deckers, J., Mitiku
Haile, Govers, G., Moeyersons, J., in press. Effectiveness
of stone bunds in controlling soil erosion on cropland in
the Tigray highlands, Northern Ethiopia. Soil Use and
Management.
Dewis, J., Freitas, F., 1970. Physical and chemical methods of soil
and water analysis. Soils Bulletin, vol. 10. FAO, Rome, Italy.
Erskine, W.D., Mahmoudzadeh, A., Myers, C., 2002. Land use
effects on sediment yields and soil loss rates in small basins
of Triassic sandstone near Sydney, NSW, Australia. Catena 49,
271–287.
Eweg, H.P.A., Van Lammeren, R., Deurloo, H., Woldu, Z., 1998.
Analysing degradation and rehabilitation for sustainable land
management in the highlands of Ethiopia. Land Degradation &
Development 9, 529–542.
FAO, 1990. Guidelines for Soil Description. FAO, Rome, Italy.
FAO, ISRIC, ISSS, 1998. World reference base of soil resources.
World Soil Resources Reports, vol. 84. FAO, Rome, Italy.
Fiedler, H.J., Gebeyehu Belay, 1988. Forests and their importance
for soil conservation in Ethiopia. Archiv fur Naturschutz und
Landschaftsforschung 28, 161–175.
Gutierrez, J., Hernandez, I.I., 1996. Runoff and interrill erosion as
affected by grass cover in a semi-arid rangeland of northern
Mexico. Journal of Arid Environments 34, 287–295.

K. Descheemaeker et al. / Geoderma 132 (2006) 291–314 313
Hajabbasi, M.A., Jalalian, A., Karimzadeh, H.R., 1997. Deforesta-
tion effects on soil physical and chemical properties, Lordegan,
Iran. Plant and Soil 190, 301–308.
Hendershot, W.H., Lalande, H., Duquette, M., 1993. Soil reaction
and exchangeable acidity. In: Carter, M.R. (Ed.), Soil Sampling
and Methods of Analysis. Canadian Society of Soil Science,
Lewis Publishers, Boca Raton, USA, pp. 499–512.
Herweg, K., Stillhardt, B., 1999. The variability of soil erosion in
the highlands of Ethiopia and Eritrea. Average and extreme
erosion patterns. Soil Conservation Research Programme, Re-
search Report, vol. 42. University of Berne, Switzerland.
Hurni, H., 1985. Erosion-productivity-conservation systems in
Ethiopia. Proceedings 4th International Conference on Soil
Conservation, Maracay, Venezuela, pp. 654–674.
Jaiyeoba, I.A., 1998. Changes in soil properties related to conver-
sion of savannah woodland into Pine and Eucalyptus planta-
tions, Northern Nigeria. Land Degradation & Development 9,
207–215.
Jennings, S.B., Brown, N.D., Sheil, D., 1999. Assessing forest
canopies and understorey illumination: canopy closure, canopy
cover and other measures. Forestry 72, 59–73.
Jin, C.-X., Romkens, M.J.M., 2001. Experimental studies of factors
in determining sediment trapping in vegetative filter strips.
Transactions of the ASAE 44, 277–288.
Kebrom Tekle, Backeus, I., Skoglund, J., Zerihun Woldu, 1997.
Vegetation on hillslopes in southern Wello, Ethiopia: degra-
dation and regeneration. Nordic Journal of Botany 17,
483–493.
Lacey, S.T., 2000. Runoff and sediment attenuation by undisturbed
and lightly disturbed forest buffers. Water, Air and Soil Pollu-
tion 122, 121–138.
Le Houerou, H.N., 2000. Restoration and rehabilitation of arid
and semiarid Mediterranean ecosystems in North Africa and
West Asia: a review. Arid Soil Research and Rehabilitation
14, 3–14.
Liu, S.L., Fu, B.J., Lu, Y.H., Chen, L.D., 2002. Effects of refores-
tation and deforestation on soil properties in humid mountainous
areas: a case study in Wolong Nature Reserve, Sichuan prov-
ince, China. Soil Use and Management 18, 376–380.
Lumbanraja, J., Syam, T., Nishide, H., Mahi, A.K., Utomo, M.,
Kimura, S., Kimura, M., 1998. Deterioration of soil fertility by
land use changes in South Sumatra, Indonesia: from 1970 to
1990. Hydrological Processes 12, 2003–2013.
Mitiku Haile, Kindeya Gebrehiwot, 1998. Efforts to rehabilitate
degraded lands: local initiatives for planning resource manage-
ment in Tigray (Northern Ethiopia). Sustainable Development of
Dryland Areas of East Africa, Proceedings of the International
Workshop Addis Ababa, November 9–12 1998, European Com-
mission, pp. 319–328.
Nigussie Haregeweyn, Poesen, J., Nyssen, J., De Wit, J., Mitiku
Haile, Govers, G., Deckers, S., in press. Reservoirs in Tigray:
characteristics and sediment deposition problems. Land Degra-
dation and Development.
Nyssen, J., 2001. Erosion processes and soil conservation in a
tropical mountain catchment under threat of anthropogenic de-
sertification— a case study from Northern Ethiopia. PhD Thesis,
Katholieke Universiteit Leuven, Belgium, 380p.
Nyssen, J., Mitiku Haile, Moeyersons, J., Poesen, J., Deckers, J.,
2000. Soil and water conservation in Tigray (Northern Ethio-
pia): the traditional daget technique and its integration with
introduced techniques. Land Degradation & Development 11,
199–208.
Nyssen, J., Moeyersons, J., Poesen, J., Deckers, J., Mitiku Haile,
2002. The environmental significance of the remobilisation of
ancient mass movements in the Atbara–Tekeze headwaters,
Northern Ethiopia. Geomorphology 49, 303–322.
Nyssen, J., Poesen, J., Moeyersons, J., Deckers, J., Mitiku Haile,
Lang, A., 2004. Human impact on the environment in the
Ethiopian and Eritrean highlands—a state of the art. Earth
Science Reviews 64, 273–320.
Paniagua, A., Kammerbauer, J., Avedillo, M., Andrews, A.M., 1999.
Relationship of soil characteristics to vegetation successions on a
sequence of degraded and rehabilitated soils in Honduras. Agri-
culture, Ecosystems & Environment 72, 215–225.
Puigdefabregas, J., Sole, A., Gutierrez, L., del Barrio, G., Boer, M.,
1999. Scales and processes of water and sediment redistribution
in drylands: results from the Rambla Honda field site in South-
east Spain. Earth-Science Reviews 48, 39–70.
Rey, F., 2003. Influence of vegetation distribution on sediment yield
in forested marly gullies. Catena 50, 549–562.
Sheldrik, B.H., Wang, C., 1993. Particle size distribution. In: Carter,
M.R. (Ed.). Soil Sampling and Methods of Analysis. Canadian
Society of Soil Science, Lewis Publishers, Boca Raton, USA,
pp. 499–512.
Sole-Benet, A., Calvo, A., Cerda, A., Lazaro, R., Pini, R., Barbero,
J., 1997. Influences of micro-relief patterns and plant cover on
runoff related processes in badlands from Tabernas (SE Spain).
Catena 31, 23–38.
Sorriso-Valvo, M., Bryan, R.B., Yair, A., Iovino, F., Antronico, L.,
1995. Impact of afforestation on hydrological response and
sediment production in a small Calabrian catchment. Catena
25, 89–104.
SPSS 11.0.1, 2001. SPSS for Windows, Release 11.0.1. SPSS Inc.
Tenna Shitarek, Sintayehu Manaye, Berihun Abebe, 2001.
Strengthening user-rights over local resources in Wollo,
Ethiopia. IIED Drylands Programme, Issue Paper, vol. 103.
23 pp.
TFAP, 1996. Tigray Forestry Action Plan, Tigray Bureau of Agri-
culture and Natural Resources Development, Regional Govern-
ment of Tigray, Mekelle.
Tiessen, H., Moir, J.O., 1993. Total and organic carbon. In: Carter,
M.R. (Ed.). Soil Sampling and Methods of Analysis. Canadian
Society of Soil Science, Lewis Publishers, Boca Raton, USA,
pp. 187–200.
UNEP, 1994. United Nations Convention to Combat Desertification,
Berne. (71 pp.)
Valentin, C., D’Herbes, J.M., Poesen, J., 1999. Soil and water
components of banded vegetation patterns. Catena 37, 1–24.
Van Dijk, P.M., Kwaad, F.J.P.M., Klapwijk, M., 1996. Retention of
water and sediment by grass strips. Hydrological Processes 10,
1069–1080.
Wallbrink, P.J., Roddy, B.P., Olley, J.M., 2002. A tracer budget
quantifying soil redistribution on hillslopes after forest harvest-
ing. Catena 47, 179–201.

K. Descheemaeker et al. / Geoderma 132 (2006) 291–314314
Wisborg, P., Shylendra, H.S., Gebrehiwot, K., Shanker, R., Tilahun,
Y., Nagothu, U.S., Tewoldeberhan, S., Bose, P., 2000. Rehabil-
itation of CPRS through re-crafting of village institutions: a
comparative study from Ethiopia and India. Paper presented at
the 8th Biennial Conference of the International Association for
the Study of Common Property (IASCP), Bloomington, Indiana,
May 31 – June 4, 2000, 26p.
Woldeamlak Bewket, Stroosnijder, L., 2003. Effects of agroecolo-
gical land use succession on soil properties in Chemoga Water-
shed, Blue Nile basin, Ethiopia. Geoderma 111, 85–98.
Woo, M., Fang, G., di Cenzo, P.D., 1997. The role of vegetation in
the retardation of rill erosion. Catena 29, 145–159.