Pedogenesis in the sorted patterned ground of Devon Plateau, Devon Island, Nunavut, Canada
Upload
khangminh22Category
view
3download
0
SILTATION PATTERN AND PEDOGENESIS IN THE
COASTAL ZONE OF BANGLADESH
A DISSERTATION
BY
Md. Mahiuddin
B.Sc. (Hons), M.Sc in Soil Science (DU) Registration No: 130 Session: 2012-2013
For the fulfillment of the requirements of the degree of
DOCTOR OF PHILOSOPHY
IN
SOIL SCIENCE
DEPARTMENT OF SOIL, WATER AND ENVIRONMENT
UNIVERSITY OF DHAKA
OCTOBER, 2017
SILTATION PATTERN AND PEDOGENESIS IN THE
COASTAL ZONE OF BANGLADESH
A dissertation submitted to the Department of Soil, Water and Environment,
University of Dhaka in partial fulfillment of the requirements for the degree
Of
BY
Md. Mahiuddin
B.Sc. (Hons), M.Sc in Soil Science (DU) Registration No: 130 Session: 2012-2013
DEPARTMENT OF SOIL, WATER AND ENVIRONMENT
UNIVERSITY OF DHAKA
OCTOBER, 2017
DOCTOR OF PHILOSOPHY
IN
SOIL SCIENCE

iii
iv
Md. Mahiuddin
Ph.D Research Student
Registration no 130/ 2012-2013
Session: 2012-2013
Dept. of Soil, Water and Environment
University of Dhaka
Dhaka- 1000, Bangladesh
E-mail: [email protected]
DECLARATION
I hereby declare that the research presented in this thesis entitled “Siltation Pattern and
Pedogenesis in the Coastal Zone of Bangladesh” was carried out by me for the degree of
Doctor of Philosophy (Ph.D) in Soil Science under the supervision of Prof. Dr. Md. Aminur
Rahman Mazumder and Prof. Dr. Md. Zakir Hossain Khan of the Department of Soil,
Water and Environment, University of Dhaka, Bangladesh.
I further declare that the thesis is my own work and effort and that it has not been
submitted anywhere for any award. Where other sources of information have been used, they
have been acknowledged at the respective place in the text.
Place: Dhaka
Date:
v
CERTIFICATE
Certified that Mr. Md. Mahiuddin has submitted this thesis entitled “SILTATION PATTERN
AND PEDOGENESIS IN THE COASTAL ZONE OF BANGLADESH” in partial fulfillment of the
requirement for the award of the degree of Doctor of Philosophy( Ph.D) in Soil Science under the faculty of
Biological Science, University of Dhaka, Bangladesh. Mr. Md. Mahiuddin successfully completed his course
work and carried out his field study as well as laboratory work meticulously during the session 2102- 2013.
This thesis has been prepared on the basis of original research work carried out in the laboratory of
the Department of Soil, Water and Environment, University of Dhaka by Mr. Md. Mahiuddin under our
supervision. So far my knowledge goes; no part of this thesis has been submitted elsewhere for any other
degree or diploma.
We also certify that it is a bonafied research work of Md. Mahiuddin and the thesis is found
satisfactory for submission to the Department of Soil, Water and Environment University of Dhaka,
Bangladesh.
(Prof. Dr. Md. Aminur Rahman Mazumder) (Prof. Dr. Md. Zakir Hossain Khan)
Supervisor Department of Soil, Water and Environment
University of Dhaka
Bangladesh
Supervisor Department of Soil, Water and Environment
University of Dhaka
Bangladesh
vi
ACKNOLEDGEMENT
With the remembrance of almighty ALLAH, the author has the immense pleasure to
express his sincere and heartiest appreciation, deep sense of gratitude , indebtedness and best
regard to his honorable teacher Dr. Aminur Rahman Mazumder, M. Sc. (Dhaka),Ph. D
(Dhaka), Ex-Chairman & Professor, Department of Soil, Water and Environment, University of
Dhaka for his valuable instruction, scholastic and enthusiastic supervision, constant
encouragement, excellent co-operation, worthy suggestions, advice and stimulating discussions,
critical comments, affectionate feelings and keen interest throughout the period of the research
work and during the preparation of the manuscript.
The author wishes to express his deepest sense of gratitude and appreciation to
Professor Md. Zakir Hossain Khan, Ph. D (Vienna), University of Dhaka, Bangladesh for
continuous encouragement, valuable guidance and fruitful suggestions for the successful
completion of this program me. He guided me in every step in writing the report in systematic
ways. The guidance was very much helpful to me to prepare scientific research and general
report. This type of report will be a guideline in my professional life and will also help me to
achieve the overall goals and objectives this research work.
The author expresses his heartfelt thanks and gratitude to Honourary Professor Dr.
Mohammad Sultan Hussain, University of Dhaka for keen interest, valuable advice and
insightful suggestions in this research work and preparation. He took the pains of going through
the draft of this thesis for which I am grateful to him.
The author wishes to express his ever gratefulness and indebtedness to Dr. S.M. Ullah,
retired professor, Department of Soil, water and Environment for his spontaneous
encouragement, advice, valuable suggestions and help during the whole period of research
work. The author is also grateful to all other members of teaching staff of the same department
for their encouragement and inspiration.
The author expresses his indebtedness to Professor S.M. Imamul Huq and at present
Vice Chancellor, University of Barisal for his heartfelt cooperation, necessary help and
suggestions.
The author wishes to extend his gratification to Professor Dr. M. Sirajul Hoque,
Chairman, Department of Soil, Water and Environment, University of Dhaka, Professors Dr. R.
Mandal, Dr.M. Didarul Alam, Dr. Md. Khalilur Rahman, Dr. Akter Hossain, Dr. Mahbubur
vii
Rahman and Dr. Zakia Parveen for providing him laboratory and research facilities whenever
required during the whole period of research work.
The author gratefully acknowledge his elder brother Md. Ikhtiar Uddin, Senior
Scientific Officer, Soil Resource Development Institute, Barisal for help and co-operation in
the selection of soil sampling sites and collection of soil samples in the field in spite of him all
problems to pursue this study.
The author expresses his cordial thanks to Professor Abu Zofar Md. Moslehuddin,
Department of Soil Science, Bangladesh Agricultural University, Mymensingh, for his
generous help and assistance in the X-ray diffraction analysis.
The author expresses his indebtedness and gratitude to the Ministry of Education, Govt.
of Bangladesh for giving deputation for awarding him scholarship and research grant to
complete Ph,D programme in Soil Science.
The author also remembers the kind consent and cooperation of Prof. Dr. Shin Ichiro
Wada, Department of Agro-environmental Science, Faculty of Agriculture, Kyushu University,
Fukuoka 812-8581, Japan for assistance in carrying out the X-ray diffraction analysis of clay
samples.
The author wishes to express his gratefulness to Mr. Kazi M. Idris, former Principal
Scientific officer, Soil Resources Development Institute, Dhaka and National Consultant, FAO
and DANIDA, who helped in interpreting the morphological properties of the soils and also in
their characterization.
The author is also grateful to Mohammad Ibrahim, technical officer, GIS Lab,
Department of Soil, Water and Environment, University of Dhaka, for his support and good
wishes during the completion of the studies.
The author expresses his cordial thanks to Prof. Dr. Md. Mahmudul Islam, Department
of Soil Science, Govt. B M College, Barisal for kind co-operation and help.
Last but not the least, the author likes to expresses his deep sense of gratitude and
appreciation to his wife Mrs. Afsana Shakhi and his offspring whose encouragement and help
have always been a source of inspiration during the period of this work.
The author also wants to acknowledge the local people for their support during the sampling
period.
October, 2017 Author
viii
ABSTRACT
Siltation pattern and pedogenesis in the coastal zone of Bangladesh were studied.
Suspended sediment load carried by the two rivers, the Bishkhali and the Arial Khan rivers of
the coastal zone in Bangladesh was determined on seasonal basis for three consecutive years in
order to observe siltation pattern. Suspended sediment load in the Bishkhali river was very
high (9.4 kg per sq. meter per month) in the dry season as compared to that in the wet season
(4.6 kg per sq. meter per month) whereas in the Arial Khan River the suspended sediment load
was low in dry season (4.1 kg per sq. meter per month) as compared to that in the wet season
(13.06 kg per sq. meter per month) due to severe water turbulence of the rivers. The
mechanical, chemical, physico-chemical and elemental compositions of the sediments were
determined and the importance of siltation in soil genesis was also studied.
Eight soil profiles from eight extensive soil series viz. Bhola, Nilkamal, Pirojpur, Hogla
,Muladi, Barisal, Jhalakati, and Ramgati occurring in the coastal floodplains of Bangladesh
were studied morphologically in the field, and soil samples were collected on genetic horizon
basis for their laboratory analyses. All these soils remain seasonally flooded for varying
periods during the monsoon months and develop some unique morphological features.
Development of a cambic horizon is the most notable morphogenetic property in these soils.
Particle size distribution showed wide variations in their clay fractions in the soil profiles. The
quantity of clay was higher in the basin soils than in the ridge soils. Silt was the dominant size
fraction in the sediment of the Bishkhali and the Arial Khan rivers.
The chemical properties of the soils such as pH, organic carbon, total nitrogen, cation
exchange capacity, exchangeable bases, free oxides of Fe and Mn, free lime and the fusion
analysis of the sediments, whole soils and their clays were determined.
Results of fusion analyses of the sediments, soils and their clay fractions were presented. Both
in soils and sediments silica was the most abundant element comprising a large part (58 to
65%) of the elemental composition of them. The other dominant elements were in decrasing
order of abundance: SiO2 > Al2O3 > Fe2O3 > MgO > CaO > K2O > TiO2 >P2O5 > MnO2.
ix
The vertical distribution pattern of silica, alumina, and ferric oxide were not uniform. The
silica: sesquioxide molar ratios of the soils indicated that the soil parent materials were
heterogeneous.
Illite was the dominant mineral in the clay fraction of Muladi, Barisal, Jhalakati and
Ramgati soils, whereas the other soils had mixed mineralogical composition consisting of mica,
smectite, chlorite, kaolinite and trace amount of vermiculite.
Gleization seemed to be the major pedogenic process of soil formation. Composition of
parent material (sediments) and the associated aquic moisture regime dominantly influenced
the genesis of these soils. All the soils meet the criteria of the Inceptisols order of the US Soil
Taxonomy. The soils were characterized at the family category level according to the US Soil
Taxonomy and correlated with World Reference Base (WRB) system. The studied soils were
classed as six families which will be useful for their management implication as well as agro-
technology transfer program.
x
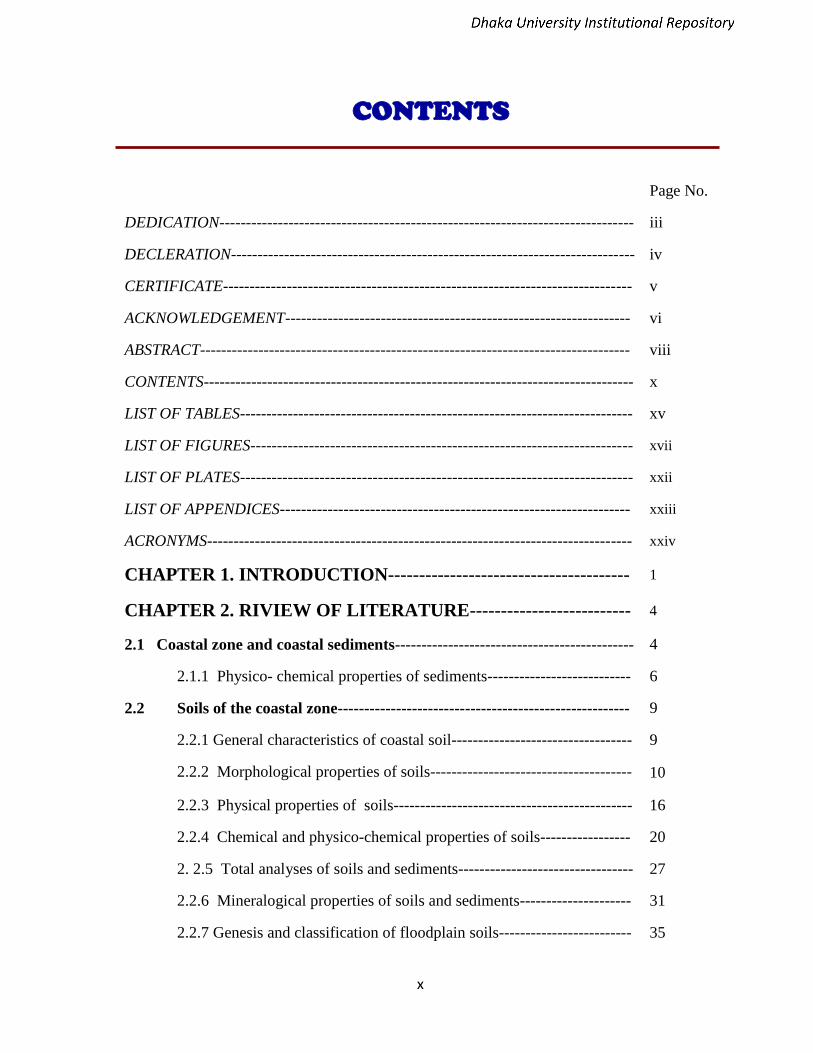
CONTENTS
Page No.
DEDICATION------------------------------------------------------------------------------ iii
DECLERATION---------------------------------------------------------------------------- iv
CERTIFICATE----------------------------------------------------------------------------- v
ACKNOWLEDGEMENT----------------------------------------------------------------- vi
ABSTRACT--------------------------------------------------------------------------------- viii
CONTENTS--------------------------------------------------------------------------------- x
LIST OF TABLES-------------------------------------------------------------------------- xv
LIST OF FIGURES------------------------------------------------------------------------ xvii
LIST OF PLATES-------------------------------------------------------------------------- xxii
LIST OF APPENDICES------------------------------------------------------------------ xxiii
ACRONYMS-------------------------------------------------------------------------------- xxiv
CHAPTER 1. INTRODUCTION--------------------------------------- 1
CHAPTER 2. RIVIEW OF LITERATURE-------------------------- 4
2.1 Coastal zone and coastal sediments--------------------------------------------- 4
2.1.1 Physico- chemical properties of sediments--------------------------- 6
2.2 Soils of the coastal zone------------------------------------------------------- 9
2.2.1 General characteristics of coastal soil---------------------------------- 9
2.2.2 Morphological properties of soils-------------------------------------- 10
2.2.3 Physical properties of soils--------------------------------------------- 16
2.2.4 Chemical and physico-chemical properties of soils----------------- 20
2. 2.5 Total analyses of soils and sediments--------------------------------- 27
2.2.6 Mineralogical properties of soils and sediments--------------------- 31
2.2.7 Genesis and classification of floodplain soils------------------------- 35
xi
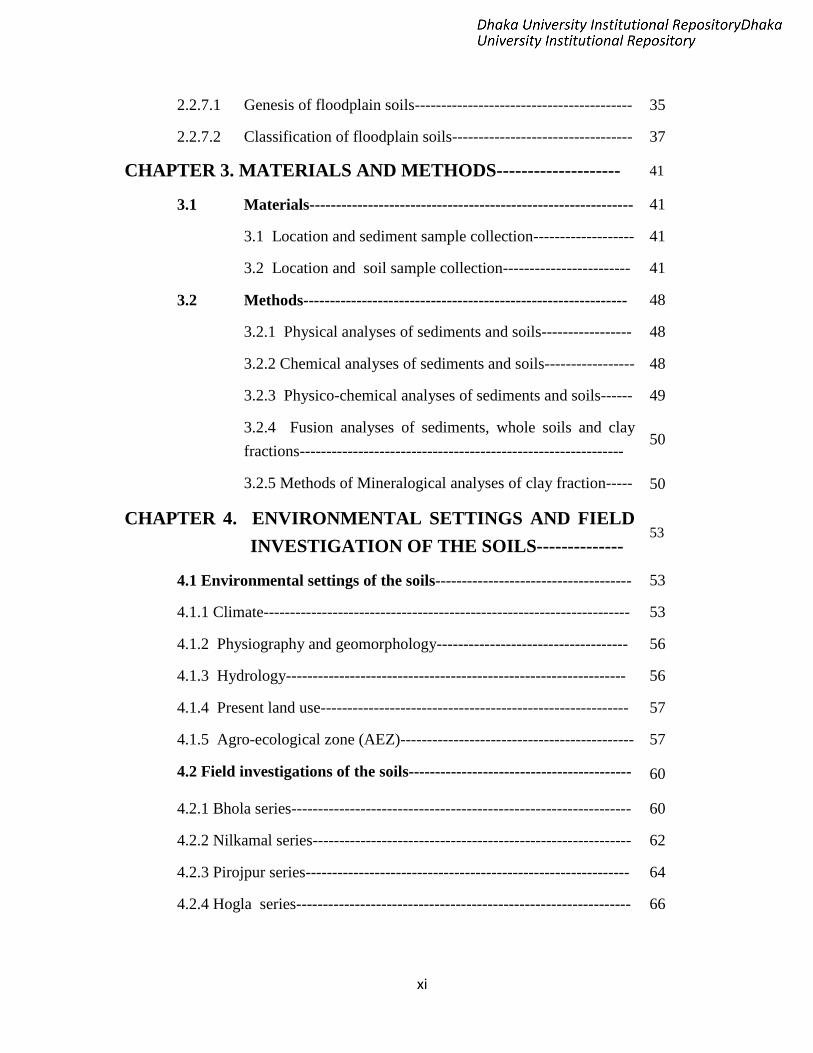
2.2.7.1 Genesis of floodplain soils----------------------------------------- 35
2.2.7.2 Classification of floodplain soils---------------------------------- 37
CHAPTER 3. MATERIALS AND METHODS-------------------- 41
3.1 Materials------------------------------------------------------------- 41
3.1 Location and sediment sample collection------------------- 41
3.2 Location and soil sample collection------------------------ 41
3.2 Methods------------------------------------------------------------- 48
3.2.1 Physical analyses of sediments and soils----------------- 48
3.2.2 Chemical analyses of sediments and soils----------------- 48
3.2.3 Physico-chemical analyses of sediments and soils------ 49
3.2.4 Fusion analyses of sediments, whole soils and clay
fractions------------------------------------------------------------- 50
3.2.5 Methods of Mineralogical analyses of clay fraction----- 50
CHAPTER 4. ENVIRONMENTAL SETTINGS AND FIELD
INVESTIGATION OF THE SOILS-------------- 53
4.1 Environmental settings of the soils------------------------------------- 53
4.1.1 Climate--------------------------------------------------------------------- 53
4.1.2 Physiography and geomorphology------------------------------------ 56
4.1.3 Hydrology---------------------------------------------------------------- 56
4.1.4 Present land use---------------------------------------------------------- 57
4.1.5 Agro-ecological zone (AEZ)-------------------------------------------- 57
4.2 Field investigations of the soils------------------------------------------ 60
4.2.1 Bhola series---------------------------------------------------------------- 60
4.2.2 Nilkamal series------------------------------------------------------------ 62
4.2.3 Pirojpur series-------------------------------------------------------------
4.2.4 Hogla series---------------------------------------------------------------
64
66

xii
4.2.5 Muladi series-------------------------------------------------------------
4.2.6 Barisal series-------------------------------------------------------------
4.2.7 Jhalakati series-----------------------------------------------------------
4.2.8 Ramgati series-----------------------------------------------------------
68
70
72
74
CHAPTER 5. RESULTS AND DISCUSSION-------------------- 76
5.1 Suspended sediment load----------------------------------------------- 76
5.2 Physical properties of sediments---------------------------------- 77
5.2.1 Particle density ----------------------------------------------- 77
5.2.2 Loss on ignition --------------------------------------------- 80
5.2.3 Particle size distribution ------------------------------------ 80
5.3 Chemical parameters of the sediments------------------------------- 84
. 5.3.1 pH ------------------------------------------------------------ 84
5.3.2 Electrical conductivity -------------------------------------- 84
5.3.3 Free lime ------------------------------------------------------ 84
5.3.4 Organic carbon ---------------------------------------------- 85
5.4 Physico- Chemical properties of sediments--------------------- 86
5.4.1 Exchangeable cations ------------------------------------- 86
5.4.2 Cation exchange capacity ------------------------------- 86
5.4.3 Base saturation percentage (BSP)----------------------- 86
5.5 Total analyses of the sediments------------------------------- 87
5.6 Morphological characteristics of the soils------------------ 89
5.7 Physical properties of the soils------------------------------- 95
5.7.1 Particle density-------------------------------------------- 95
5.7.2 Bulk density and porosity--------------------------------- 95
5.7.3 Moisture at field condition ------------------------------ 99
5.7.4 Hygroscopic moisture------------------------------------ 99

xiii
5.7.5 Loss on ignition-------------------------------------------- 102
5.7.6 Particle size distribution---------------------------------- 107
5.8 Chemical properties of the soils------------------------------ 114
5.8.1 Soil Reaction (pH)----------------------------------------- 114
5.8.2 Free lime---------------------------------------------------- 120
5.8.3 Electrical conductivity------------------------------------ 120
5.8.4 Organic matter, Total nitrogen and C/N ratio---------- 121
5.9 Physico- chemical properties of the soils------------------- 128
5.9.1 Cation exchange capacity (CEC)------------------------ 128
5.9.2 Exchangeable cations------------------------------------- 132
5.9.3 Total exchangeable bases--------------------------------- 139
5.9.4 Base saturation percentage-------------------------------- 139
5.10 Free oxides in soils---------------------------------------------- 141
5.10.1 Dithionate extractable free iron oxide----------------- 141
5.10.2. Dithionate extractable free manganese oxide-------- 144
5.10.3 Free iron oxides as indicator of soil development--- 148
5.11 Total analysis----------------------------------------------------- 151
5.11.1 Fusion analysis of the whole soils---------------------- 151
5.11.2 Fusion analysis of the clay fraction-------------------- 163
5.11.3 Total potassium (K2O) contents in soils and clays--- 169
5.11.4 Titanium (TiO2) contents in soils and clays---------- 177
5.12 Mineralogical composition of clay fraction (< 2µm)----- 180
5.12.1 X-ray diffraction (XRD) analysis of clay fraction 180
CHAPTER 6. GENESIS AND CLASSIFICATION OF THE
SOILS---------------------------------------------------- 194
6.1 Genesis of the soils under investigation------------------- 194
6.2. Classification of the soils under investigation----------- 196
xiv
CHAPTER 7. SUMMARY AND CONCLUSION---------------- 201
CHAPTER 8. REFERENCES---------------------------------------- 206
CHAPTER 9. APPENDICES----------------------------------------- 224
xv
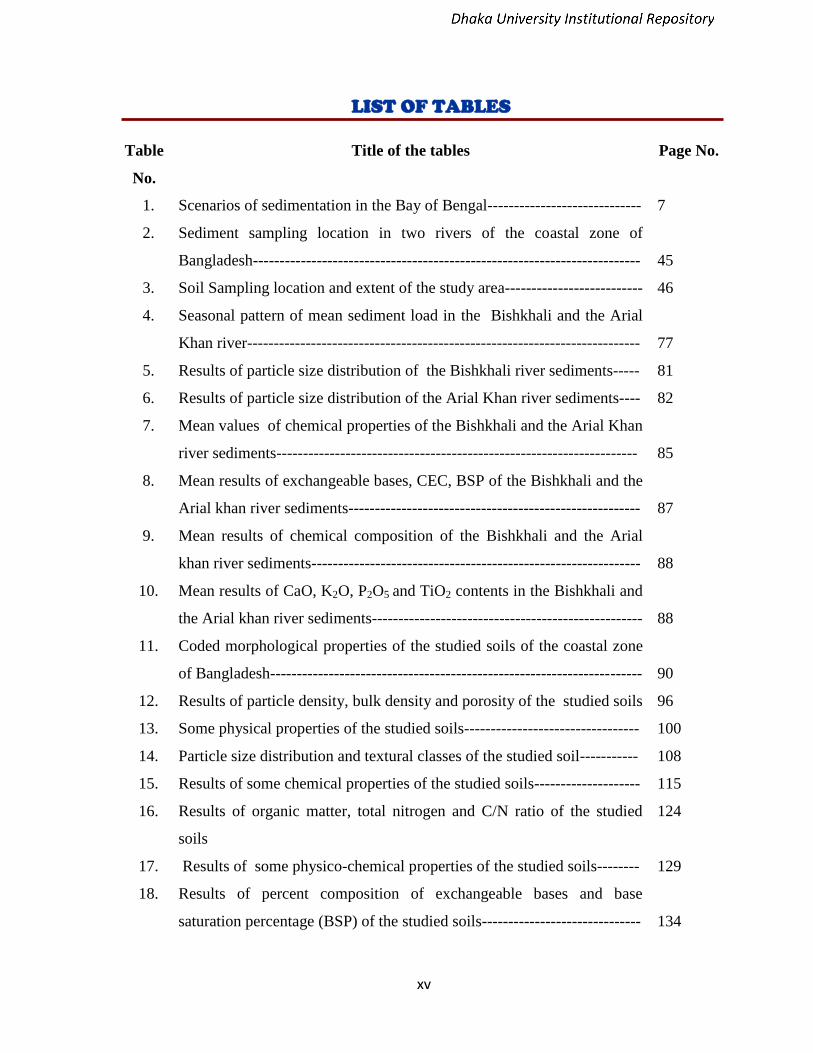
LIST OF TABLES
Table
No.
Title of the tables Page No.
1. Scenarios of sedimentation in the Bay of Bengal----------------------------- 7
2. Sediment sampling location in two rivers of the coastal zone of
Bangladesh-------------------------------------------------------------------------
45
3. Soil Sampling location and extent of the study area-------------------------- 46
4. Seasonal pattern of mean sediment load in the Bishkhali and the Arial
Khan river--------------------------------------------------------------------------
77
5. Results of particle size distribution of the Bishkhali river sediments----- 81
6. Results of particle size distribution of the Arial Khan river sediments---- 82
7. Mean values of chemical properties of the Bishkhali and the Arial Khan
river sediments--------------------------------------------------------------------
85
8. Mean results of exchangeable bases, CEC, BSP of the Bishkhali and the
Arial khan river sediments-------------------------------------------------------
87
9. Mean results of chemical composition of the Bishkhali and the Arial
khan river sediments--------------------------------------------------------------
88
10. Mean results of CaO, K2O, P2O5 and TiO2 contents in the Bishkhali and
the Arial khan river sediments---------------------------------------------------
88
11. Coded morphological properties of the studied soils of the coastal zone
of Bangladesh----------------------------------------------------------------------
90
12. Results of particle density, bulk density and porosity of the studied soils 96
13. Some physical properties of the studied soils--------------------------------- 100
14. Particle size distribution and textural classes of the studied soil----------- 108
15. Results of some chemical properties of the studied soils-------------------- 115
16. Results of organic matter, total nitrogen and C/N ratio of the studied
soils
124
17. Results of some physico-chemical properties of the studied soils-------- 129
18. Results of percent composition of exchangeable bases and base
saturation percentage (BSP) of the studied soils------------------------------
134
xvi
19. Results of dithionate extractable iron and manganese oxides in the
studied soils------------------------------------------------------------------------
142
20. Results of total and extractable iron and manganese in the studied soils- 149
21. Results of chemical composition of the whole soils from fusion
analysis-----------------------------------------------------------------------------
152
22. Results of molar ratios of SiO2 /R2O3 , SiO2 /Al2O3 , Al2O3/Fe2O3 in the
studied soils -----------------------------------------------------------------------
156
23. Results of total CaO, MgO, P2O5, and MnO2 content in the whole soils-- 161
24. Results of chemical composition of clay fraction of the studied soils----- 165
25. Results of molar ratios of SiO2 /R2O3 , SiO2 / Al2O3 , Al2O3/Fe2O3 in the
clay fraction of the studied soils------------------------------------------------
167
26. Results of CaO, MgO, P2O5, and MnO2 in the clay fractions of the
studied soils------------------------------------------------------------------------
170
27. Total potassium (K2O) contents in the soils and their clay fractions------- 172
28. Total TiO2 contents in the soils and their clay fractions -------------------- 178
29. Semi- quantative estimation of minerals in the clay fraction (<2µm) of
the surface soils -------------------------------------------------------------------
185
30. Derived values for soil classification------------------------------------------- 199
31. Classification of the studied soils---------------------------------------------- 200
xvii
LIST OF FIGURES
Figure
No.
Title of the figure Page
No.
1. Map of Bangladesh showing coastal zone (Islam, 2004)---------------------------------- 5
2. Map showing the sampling points of sediment collection from the Bishkhali river
in Bangladesh-----------------------------------------------------------------------------------
42
3. Map showing the sampling points of sediment collection from the Arial Khan river
in Bangladesh-----------------------------------------------------------------------------------
43
4. Map showing the soil sampling locations in the coastal area of Bangladesh------- 47
5. Climatic data and the soil water balance of Barisal---------------------------------------- 54
6. Climatic data and the soil water balance of Bhola---------------------------------------- 54
7. Climatic data and the soil water balance of Patuakhali---------------------------------- 55
8. Climatic data and the soil water balance of Khepupara---------------------------------- 55
9. Map of Agro-ecological Regions of Bangladesh showing study area---------------- 59
10. Landscape and vegetation around Bhola soil profile------------------------------------ 61
11. Profile of the Bhola soil series-------------------------------------------------------------- 63
12. Vegetation and landscape around Nilkamal soil----------------------------------------- 63
13. Profile of the Nilkamal soil series---------------------------------------------------------- 65
14. Landscape and vegetation around Pirojpur soil profile--------------------------------- 65
15. Profile of the Pirojpur soil series----------------------------------------------------------- 67
16. Landscape and vegetation around Hogla soil profile site------------------------------- 67
17. Profile of the Hogla soil series-------------------------------------------------------------- 69
18. Vegetation and landscape around Muladi soil profile site------------------------------ 69
19. Profile of the Muladi soil series------------------------------------------------------------- 71
20. Landscape and vegetation around Barisal profile site----------------------------------- 71
21. Profile of the Barisal series------------------------------------------------------------------ 73
22. Vegetation and landscape around Jhalakati profile site--------------------------------- 73
xviii
Figure
No.
Title of the figure Page
No.
23. Profile of the Jhalakati soil series----------------------------------------------------------- 75
24. Landscape and vegetation around Ramgati soil profile site---------------------------- 75
25. Profile of the Ramgati series---------------------------------------------------------------- 75
26. Seasonal pattern of sediment load in the Bishkhali river (May 2013 to April 2014) 78
27. Seasonal pattern of sediment load in the Bishkhali river ( May 2014 to April 2015) 78
28. Seasonal pattern of sediment load in the Bishkhali river (May 2015 to April 2016) 78
29. Seasonal pattern of sediment load in the Arial Khan river (May 2013 to April 2014) 79
30. Seasonal pattern of sediment load in the Arial Khan river ( May 2014 to April 2015) 79
31. Seasonal pattern of sediment load in the Arial Khan river ( May 2015 to April
2016)---------------------------------------------------------------------------------------------
79
32. Distribution of the textural classes in the sediments of Bishkhali River--------------- 83
33. Distribution of the textural class in the sediments of Arial Khan River----------------- 83
34. Some morphological properties of the studied pedons------------------------------------ 93
35. Relationship between bulk density and percent porosity of the studied soil----------- 98
36. Correlation and regression between hygroscopic moisture and percent clay of the
studied soil--------------------------------------------------------------------------------------
102
37. Correlation between percent clay and oven dry/air dry ratio of the studied soils------ 103
38. Graph shows the mean value of field moisture, hygroscopic moisture and loss on
ignition of the studied pedons-----------------------------------------------------------------
103
39. Relationship between organic matter and loss on ignition of the studied pedons 104
40. Correlation between percent clay and loss on ignition of the studied soil------------ 104
41. Vertical distribution of field moisture, hygroscopic moisture and loss on ignition of
the Bhola, Nilkamal , Pirojpur and Hogla soil series--------------------------------------
105
42. Vertical distribution of field moisture, hygroscopic moisture and loss on ignition of
Muladi, Barisal, Jhalakati and Ramgati soil series-----------------------------------------
106
43. Graph shows the mean value of sand silt and clay of the studied pedons-------------- 110
xix
Figure
No.
Title of the figure Page
No.
44. Vertical distribution of sand, silt and clay in Bhola, Nilkamal. Pirojpur and Hogla
soil series----------------------------------------------------------------------------------------
112
45. Vertical distribution of sand, silt and clay in Muladi, Barisal. Jhalakati and Ramgati
soil series-----------------------------------------------------------------------------------------
113
46. A projection of the textural class of the studied soil--------------------------------------- 114
47. Correlation between pH (H2O) and pH (KCl) in the soils under investigation--------- 117
48. Vertical distribution of pH (H2O) and pH (KCl) in Bhola, Nilkamal. Pirojpur and
Hogla series under study--------------------------------------------------------------------
118
49. Vertical distribution of pH (H2O) and pH (KCl) in Muladi, Barisal, Jhalakati and
Ramgati series under study--------------------------------------------------------------------
119
50. Graph shows the mean value of free lime content in the soils under study------------- 120
51. Graph shows the mean value of electrical conductivity of the pedons under study 121
52 Vertical distribution of organic carbon, organic matter and total N in Bhola,
Nilkamal, Pirojpur and Hogla soil series----------------------------------------------------
122
53 Vertical distribution of organic carbon, organic matter and total N in Muladi,
Badrisal, Jhalkati and Ramgati soil series--------------------------------------------------
123
54. Relationship between percent organic matter and total nitrogen contents in the soils
under investigation-----------------------------------------------------------------------------
127
55. Relationship between percent clay and cation exchange capacity in the soils under
investigation-------------------------------------------------------------------------------------
131
56. Correlation regression between organic matter and cation exchange capacity of the
studied soil---------------------------------------------------------------------------------------
131
57. Graph shows the mean value of the Na+, K
+, Ca
++, Mg
++ of the studied soils--------- 132
58. Vertical distribution of cation exchange capacity and total ex. bases in Bhola,
Nilkamal. Pirojpur and Hogla soil under study--------------------------------------------
137
59. Vertical distribution of cation exchange capacity and total ex. bases in Muladi,
Barisal, Lhalakati and Ramgati soil under study-------------------------------------------
138
xx
Figure
No.
Title of the figure Page
No.
60 Graph shows the mean value of the exchangeable bases of the studied soils---------- 140
61. Graph shows the mean value of the base saturation percentage of the studied soils-- 140
62. Relationship between percent total Fe2O3 and free Fe2O3 in the soils under
investigation-------------------------------------------------------------------------------------
144
63. Graph shows the mean value of free iron oxide and free manganese oxide in the
soils under study--------------------------------------------------------------------------------
145
64. Relationship between percent free Fe2O3 and percent free MnO2 in the soils--------- 145
65. Graph shows the vertical distribution of free iron and manganese oxide in Bhola,
Nilkamll, Barisal and Jhalakati series--------------------------------------------------------
146
66. Graph shows the vertical distribution of free iron and manganese oxide in Muladi,
Barisal, Jhalakati and Ramgati series--------------------------------------------------------
147
67. Graph shows the mean value of the total iron (Fet) and free iron ( Fed) of the studied
soils---------------------------------------------------------------------------------------------
148
68. Graph shows the (Free Fe/ Total Fe)*100 ratio as indicators of the soil
development-----------------------------------------------------------------------------------
151
69. Graph shows mean value of total silica, alumina and iron oxide of the soils under
study---------------------------------------------------------------------------------------------
154
70. Graph shows the vertical distribution of silica, alumina and ironoxide in the soil of
Bhola, Nilkamal, Pirojpur and Hogla soil---------------------------------------------------
159
71. Graph shows the vertical distribution of silica, alumina and ironoxide in the whole
soil of Muladi, Barisal, Jhalakati and Ramgati soil---------------------------------------
160
72. Graph shows the mean value of total silica, alumina and iron oxide of the clay
fraction of the studied soils--------------------------------------------------------------------
164
73. Vertical distribution of total potassium oxide ( K2O) in soils and clay fraction of
soil of Bhola, Nilkamal. Pirojpur and Hogla Series----------------------------------------
175
74. Vertical distribution of total potassium oxide (K2O) in soils and clay fraction of soil
of Muladi, Barisal, Jhalakati and Ramgati Series-------------------------------------
176
xxi
Figure
No.
Title of the figure Page
No.
75. Graph shows the mean value of TiO2 in whole soil and clay fraction of the soil
under study------------------------------------------------------------------------------------
180
76. Graph shows the vertical distribution of TiO2 in soil and clay in Bhola, Nilkamal.
Pirojpur and Hogla series----------------------------------------------------------------------
181
77. Graph shows the vertical distribution of TiO2 in soil and clay in Muladi, Barisal,
Jhalakati and Ramgati series------------------------------------------------------------------
182
78. X-ray diffractogram of clay samples from Ap horizon of Bhola series----------------- 186
79. X-ray diffractogram of clay samples from Ap horizon of Nilkamal series------------- 187
80. X-ray diffractogram of clay samples from Ap horizon of Pirojpur series-------------- 188
81.
X-ray diffractogram of clay samples from Ap horizon of Hogla series----------------- 189
82. X-ray diffractogram of clay samples from Ap horizon of Muladi series---------------- 190
83. X-ray diffractogram of clay samples from Ap horizon of Barisal series---------------- 191
84. X-ray diffractogram of clay samples from Ap horizon of Jhalakati series------------ 192
85. X-ray diffractogram of clay samples from Ap horizon of Ramgati series-------------- 193
xxii
LIST OF PLATES
No. Title of the plates Page No.
1. A photograph depicting the typical riverine landscape of the
Bishkhali river------------------------------------------------------------
44
2. A photograph depicting the typical riverine landscape of the Arial
Khan river------------------------------------------------------------------
44
xxiii
LIST OF APPENDICES
No. Title of the appendix Page
No.
1. Sediment load in Bishkhali river------------------------------------------------ 224
2. Sediment load in Arial Khan river--------------------------------------------- 225
3. Results of physical properties of Bishkhali river sediments---------------- 226
4. Results of physical properties of Arial Khan river sediments--------------- 227
5. Results of chemical properties of Bishkhali river sediments---------------- 228
6. Results of chemical properties of Arial Khan river sediments------------- 229
7. Results of exchangeable cations in Bishkhali river sediments------------- 230
8. Results of exchangeable cations in Arial Khan river sediments------------ 231
9. Results of total analysis of Bishkhali river sediments-------------------- 232
10. Results of total analysis of Bishkhali river sediments--------------------- 233
11. Results of total analysis of Arial Khan river sediments-------------------- 234
12. Results of fusion analysis of Arial Khan river sediments-------------------- 235
13. Abbreviations and notations used in coded morphological properties of
the studied soils-------------------------------------------------------------------- 236
14. Some meteorological data of Barisal, Bhola, Patuakhali and Khepupara
stations------------------------------------------------------------------------------ 240
15. Average meteorological data of the studied coastal area (2012)------------ 241
16. Classification of Land Types (FAO-UNDP, 1988)--------------------------- 242
17. Classification of soils on the basis of the electrical conductivity values--- 242
18. Classification of soils on the basis of Organic matter content and cation
exchange capacity----------------------------------------------------------------- 242
19. Values used for classification soil acidity and alkalinity--------------------- 243
20. Correlation coefficient between parameter of the studied soils------------- 243
21. Types of drainage condition----------------------------------------------------- 244
22. Factors for the conversion of Conductivity Values to 25°C----------------- 244
23. Important carbonate contents for classification------------------------------- 245
24. Approximate d-spacing of first order basal reflection after different
treatments for identification of clay minerals---------------------------------- 245
25. Identification of peak in X-ray diffractograms for clay minerals----------- 246
26. Semi-quantative estimation of minerals from X-ray diffractograms------- 247
xxiv
LIST OF ACRONYMS
AD : Air dry
AEZ : Agro-ecological Region
Av : Average
BARC : Bangladesh Agricultural Research Council
BARI : Bangladesh Agricultural Research Institute.
BBS : Bangladesh Bureau of Statistics
BCAS : Bangladesh Centre for Advance Studies
BRAC : Bangladesh Rural for Advancement Committee
BRRI : Bangladesh Rice Research institute
CEC : Cation Exchange Capacity
cm : Centimeter
cmol/kg : Centimoles per killogram
CZPo : Coastal Zone Policy
Db : Bulk Density
Dp : Particle Density
EC : Electrical conductivity.
f : Porosity
FAO : Food and Agricultural Organization
g : Gram
g/cc : Gram/ cubic centimeter
GBM : Ganges – Brahamaputra- Meghna river system.
GPS : Global Positioning System
xxv
ha : Hectare
HM : Hygroscopic moisture
HYV : High Yielding Variety
ICEAB : International conference on Environmental Aspects of Bangladesh.
IRRI : International Rice Research Institute
Kg : Killogram
Km : Killometer
LOI : Loss on Ignition
m2/m : Square meter per month
mmhos/cm : Millimhos per centimeter
OC : Organic carbon
OM : Organic matter
PET : Potential evapo-transpiration
Ppm : Parts per million
Sq.km : Square kilometer
SRDI : Soil Resources Development Institute
TEB : Total exchangeable bases
UNDP : United Nations Development Program
USDA : United States Department of Agriculture
XRD : X-ray diffraction
CHAPTER-1
INTRODUCTION
Chapter I Introduction
1 | P a g e
CHAPTER - 1
INTRODUCTION
Bangladesh, a floodplain delta, is a land of rivers and canals covering an area of
147,570 sq. km (Sarwar, 2005) and lying across the tropic of cancer. The country is sloping
gently from the north to the south, meeting the Bay of Bengal at the southern end.
Bangladesh has around 710 km long coastline covering 2.85 million hectares of coastal
floodplain which lies between 21-23º N latitudes and 89 - 90º E longitudes
(Karim et al. 1990). Coastal zone of Bangladesh consists of 19 districts comprising 147
upazillas (CZPo, 2005) and accommodates more than 35 million people (MoWR, 2006). It
encompasses parts of eight agro-ecological zones of the country (FAO- UNDP, 1988). This
coastal floodplain has a fragile environment with some unique natural features. Most of the
land in the coastal floodplains has an elevation of less than one meter above mean sea level
and is subjected to flooding by tides which enter through the numerous creeks, canals, rivers
and estuaries. Both tidal and wind actions in the coastal zone are strong and the tropical
cyclones and their associated storm surges are the common natural calamities.
Bangladesh occupies a unique geographic location spanning a relatively short stretch
of land between the mighty Himalayan mountain chain and the open ocean. It is virtually
the only drainage outlet for a vast river basin complex made up the Ganges, Brahmaputra,
Jamuna and Meghna rivers and their network of tributaries.
Most of the rivers of Bangladesh are meandering and braided in nature which are
favorable for bank erosion (Elahi, 1991). Bank erosion and channel migration depends on
hydro-morphological factors such as flood, water discharge, water velocity etc. Every year
floods cause tremendous morphological change along their banks of courses of these rivers
around the coastal zone of Bangladesh during the pre and post inundation period.
A vast network of rivers and cannels, an enormous discharge of river waters heavily
laden with sediments are the most important features in the coastal morphology of
Bangladesh. Sediments are dominant feature in the geo-morphological dynamics of the
coastal area. Nearly a billion ton of sediments enter through the Ganges- Brahmaputra-
Meghna (GBM) river systems. The combined flow of these rivers is as close to 200,000
m3/s. Annual load of suspended sediments received by the GBM river systems is estimated
to 2.5 × 10⁹ tons (Rahman, 1989). About two-third of these sediments discharge into the
Bay of Bengal. A portion of this is deposited in the coastal zone.
Bangladesh has a total land surface of 12.31 million hectares of which presently
7.85 million hectares are under agriculture (NAP, 2006).Out of about 1.689 million hectares
Chapter I Introduction
2 | P a g e
of coastal land, 1.056 million hectares of land are affected by soil salinity of various
degrees. About 0.328, 0.274, 0.189, 0.161 and 0.101 million hectares of land are affected
by very slight, slight, moderate, strong and very strong salinity respectively
(SRDI Staff, 2010). Some of the new land of coastal districts is affected by different
degrees of salinity, which reduces agricultural productivity remarkably. The area of the
salinity affected soils is increased to 21% in the last four decades in this region. This
situation is expected to become worse further because of the effects of climate change
(Salauddin and Asikuzzaman, 2012).
Farmers mostly cultivate low yielding traditional rice varieties during the wet season
in the coastal zone. Most of the land remains fallow in the dry season (January- May)
because of soil salinity, lack of good quality irrigation water and late draining condition
(Karim et al. 1990; and SRDI, 2001). Crop production of the salt affected areas in the
coastal regions differs considerably from non saline areas. At the same time food demand in
the area is increasing with the steady increase in human population. The cropping patterns
practiced in the coastal areas are mainly Fallow-Fallow-T. Aman Rice.
Faced with the task of providing food to the burgeoning population of coastal zone,
the Government of East Pakistan implemented the coastal embankment project during the
1960’s under which 4000 km of high embankments were built to enclose the entire tidal
floodplains in the coastal areas within 90 polders (Firoze, 2003). After the construction of
polders, the daily inflow of tidal water reduced and consequently the active sedimentation
and erosion process has almost ceased except in brackish water shrimp cultivation area.
Within the polders, sedimentation and inundation process are still active with saline water in
the coastal area. At present, northern part of the area within the polder is flooded mainly
with rain water. The most significant feature of hydrology in relation to agricultural
development is the seasonal shallow flooding. In the coastal regions of Bangladesh
highland, medium highland, medium lowland, lowland and very lowland occupies about
5%, 50%, 10%, 4% and 1% land respectively, in coastal areas (SRDI Staff, 2010).
Different rivers bring different alluvial materials having varying mineralogical
compositions. Soil forming agencies working on these materials produce distinctive soils.
Knowledge about the chemical and mineralogical compositions of the sediments is of prime
importance for understanding the pedogenesis in the coastal zone and their productivity.
The chemical and mineralogical composition of soils depends on the nature of sediments
over which they have developed. Minerals are indicators of the extent of weathering that
has taken place, and the presence or absence of particular mineral gives clues to how soils
have been formed (Schulze,1989). The inherent potentiality of soil can be estimated from
the nature and amounts of minerals in soils (Kawagauchi and Kyuma, 1977). Quite a few
research works are carried out on mineralogy of coastal soils so far (Egashira and Yasmin,
1990; Moslehuddin and Egashira, 1996).
Chapter I Introduction
3 | P a g e
Basic understanding of the soil is a prerequisite for sound and sustainable land
management. Unfortunately soils of the coastal belt of Bangladesh as a whole have been
subjected to the least amount of scientific study. Only a few research works have been done
on the problems and prospects of crop production in the coastal areas of Bangladesh
(Karim et al. 1990). Our present knowledge on the genesis and characterization of the
coastal soils in Bangladesh is very limited. Hence, more physical, chemical and
mineralogical characterization of the soils of the coastal zone of Bangladesh is needed to
understand the mineralogical impact on soil productivity and also to understand the mineral
transformation, degree of weathering and soil development. Moreover sediment dynamics
and siltation patterns have had significant role in the accretion and erosion of land in the
coastal regions and also have profound influence on the genesis of the soils.
Therefore the present research work has been undertaken on eight pedons belonging
to the eight extensive soil series forming on the floodplain of the nearby rivers of Bishkhali
and Arial Khan rivers in the coastal zone Bangladesh with the following aims and
objectives:
1. To determine the suspended sediment load of two rivers (Bishkhali and Arial
Khan River) in the coastal zone of Bangladesh in order to investigate the
siltation patterns.
2. To study the morphological and physical characteristics of the selected pedons.
3. To furnish basic information on the chemical and mineralogical properties of the
sediments and soils.
4. To determine the chemical composition of the sediments and soils.
5. To through light on the probable genetic processes that were responsible for the
formation of these soils.
6. Finally to characterize the soils at the family level according to US Soil
Taxonomy and some other system of soil classification to provide a scientific
data base for national land use planning.

CHAPTER-2
REVIEW OF LITERATURE
Chapter II Review of Literature
4 | P a g e
CHAPTER - 2
REVIEW OF LITERATURE
It was felt essential to know the findings of research work carried out elsewhere on
coastal sediments, especially on their siltation pattern and soil genesis in the coastal zone of
Bangladesh. Literatures dealing with the properties of sediments and soils in the coastal zone
are presented below.
2.1 Coastal zone and coastal sediments
Coastal zone is a geographically delineated area which is distinctly characterized by the
aggregation of interacting coastal environments and corresponding natural and man-maid structural
systems. The southern part of Bangladesh falls under coastal zone that receives discharge of
numerous rivers, including Ganges-Brahmputra-Meghna (GBM) river system, creating one of
the most productive ecosystems of the world. Except Chittagong-Cox’s Bazar, all parts of the
coastal zone are plain land. However, the shape of the coastal zone is quite unstable and
changing time to time due to erosion and accretion.
The coast of Bangladesh is about 710 km in long and can be broadly divided into three
regions: the deltaic eastern region, the deltaic central region, and the stable deltaic western
region. According to the coastal zone policy (CZPo, 2005) of the Government of Bangladesh,
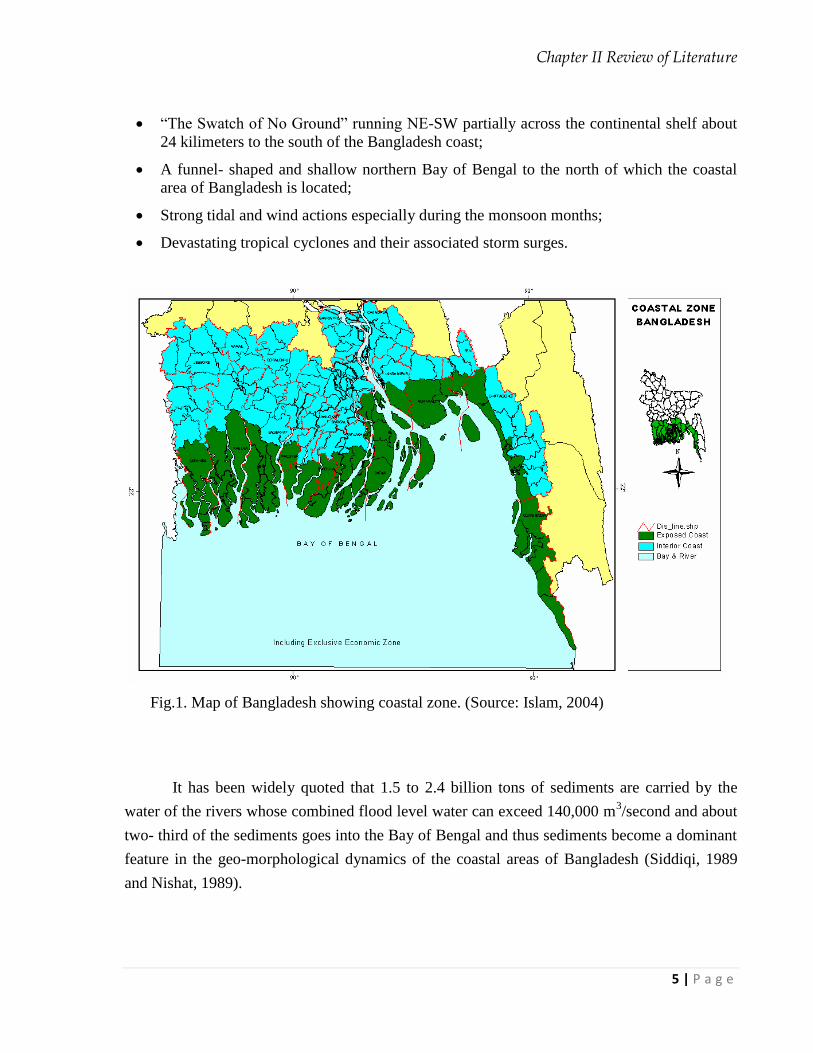
19 districts out of 64 belong to the coastal zone covering a total of 147 upazillas (Fig.1) of the
country. Out of these 19 districts, only 12 districts meet the sea or lower estuary directly. It
covers about 47,201 square kilometer land area, which is 32 percent of total landmass of the
country (Islam, 2004). It is characterized by a vast network of rivers covering an area of 9380
km2, a large number of islands between channels, a submarine canyon, the funnel shaped part
of the northern Bay of Bengal , low relief and horrendous tropical cyclones.
The characteristics of the coastal region of Bangladesh have been studied by the UN-ESCAP
(1988). According to them the coastal morphology of Bangladesh can be characterized by the
following features:
A vast network of rivers;
An enormous discharge of river water heavily loaded with sediments, both suspended and
bed load;
A large number of channels in between the channels;
Chapter II Review of Literature
5 | P a g e
“The Swatch of No Ground” running NE-SW partially across the continental shelf about
24 kilimeters to the south of the Bangladesh coast;
A funnel- shaped and shallow northern Bay of Bengal to the north of which the coastal
area of Bangladesh is located;
Strong tidal and wind actions especially during the monsoon months;
Devastating tropical cyclones and their associated storm surges.
It has been widely quoted that 1.5 to 2.4 billion tons of sediments are carried by the
water of the rivers whose combined flood level water can exceed 140,000 m3/second and about
two- third of the sediments goes into the Bay of Bengal and thus sediments become a dominant
feature in the geo-morphological dynamics of the coastal areas of Bangladesh (Siddiqi, 1989
and Nishat, 1989).
Fig.1. Map of Bangladesh showing coastal zone. (Source: Islam, 2004)
Chapter II Review of Literature
6 | P a g e
2.1.1 physico- chemical properties of sediments
Bangladesh is considered as the largest deltaic plain of the world of three mighty rivers,
namely the Ganges, the Brahmaputra, and the Meghna commonly known together as GBM.
Along with GBM, the major river systems in Bangladesh are mainly originated from the
Himalayas which are situated in the north to the Bengal delta. GBM carries a total of about 2.4
billion tons of sediments per year (Coleman, 1969) into the Bay of Bengal. These sediments
interact with dynamic process in the Bay of Bengal leading to coastal geomorphologic changes
(Ali, 1989).
The floodplain soils of Bangladesh have developed on unconsolidated sediments. These
sediments are not homogenous in age, texture and mineralogy (FAO, 1971). The major rivers
in Bangladesh carry earthy materials of different geological origin, and consequently the
floodplain soils differ in their chemical and mineralogical composition. The floodplain soils are
continuously enriched by fresh siltation during flooding and rapid profile development takes
place with clear morphological features as influenced by their typical hydrological situation
(Brammer, 1971).
The suspended solids in the water of the Mckong River serve to enrich annually the
soils of the Mckong delta by adding phosphorus and potassium bearing minerals (Uehera et al.
1979). In the Ganges River water the increase in calcium is attributed to the addition of calcium
from the carbonate rich terrain through which the river passes (Abbas and Subranium, 1984).
Ghimire et al. (1990) have carried out an experiment on the causes and effects of
siltation on the environment of Nepal based upon about 20 years of river discharge data (1960s
to 1980s) on three important river systems in Nepal and remarked that the greatest mean annual
suspended sediment load was 1.434 g/L.
Bangladesh occupies the greater part of a large delta formed by the fluvial sediments.
The combined annual sediment flow through the big rivers in Bangladesh has been estimated to
be about 2.5 billion tons (Hossain, 1992). All these sediments come from the upper reaches and
most of them come during the monsoon season.
The three rivers: the Ganges, the Brahmaputra and the Meghna (GBM) carry nearly 6
million cusecs of water and 13 million tons of suspended sediment loads per day during the
flood season to the Bay of Bengal, nearly three times the quantity borne by the Missisippi River
(Anwar, 1989).
Chapter II Review of Literature
7 | P a g e
Martinelli et al. (1992) have conducted a research on the chemical and mineralogical
composition of Amazon River floodplain sediments in Brazil and observed that the average
elemental composition (wt %) decreased in the order: Si>Al>>Fe>Na>Ca>k>Mg>>Ti. Silicon
was the most abundant element varying (as SiO2) from 63.4% to 97.1%. On average Calcium
(11 meq/100 g of sediment) was the dominant exchangeable basic cation followed by Mg (2.58
meq/100g) and then by K (0.22 meq/100) and Na (0.11 meq/100g) respectively. They also
suggest six principal minerals were assumed to be present: Na-plagioclase; Ca-plagioclase;
Illite; Smectite- Vermiculite; Kaolinite and Quartz.
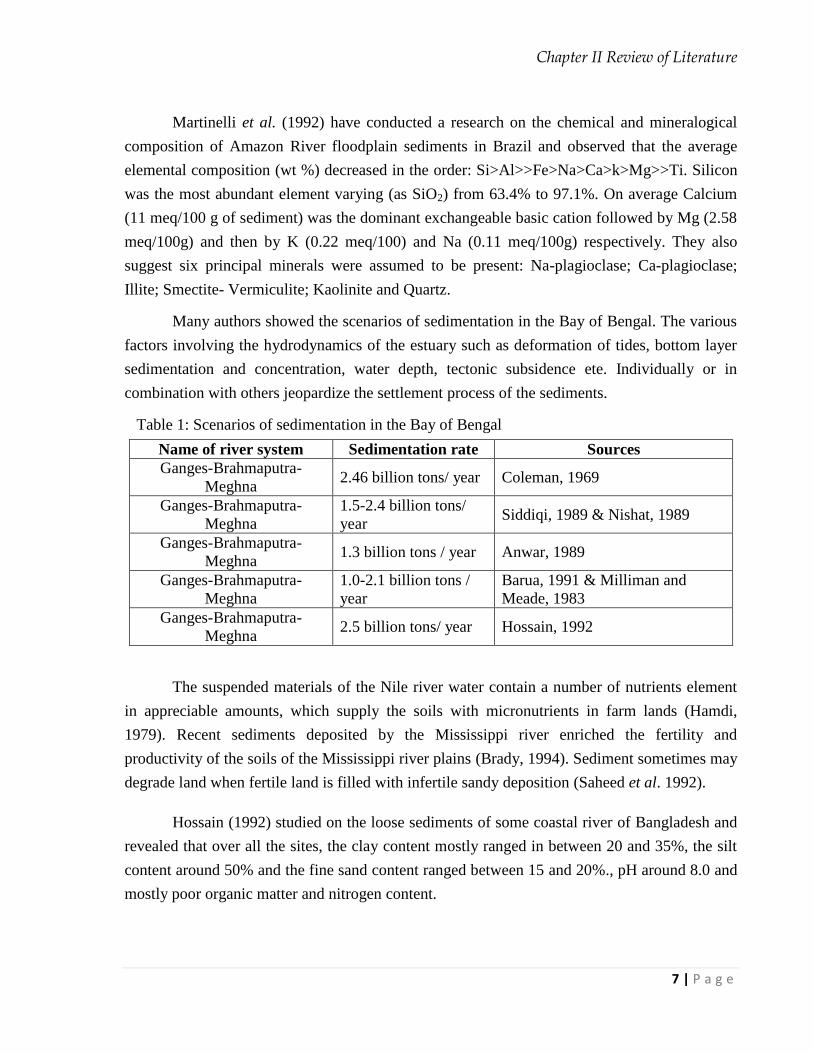
Many authors showed the scenarios of sedimentation in the Bay of Bengal. The various
factors involving the hydrodynamics of the estuary such as deformation of tides, bottom layer
sedimentation and concentration, water depth, tectonic subsidence ete. Individually or in
combination with others jeopardize the settlement process of the sediments.
Table 1: Scenarios of sedimentation in the Bay of Bengal
Name of river system Sedimentation rate Sources
Ganges-Brahmaputra-
Meghna 2.46 billion tons/ year Coleman, 1969
Ganges-Brahmaputra-
Meghna
1.5-2.4 billion tons/
year Siddiqi, 1989 & Nishat, 1989
Ganges-Brahmaputra-
Meghna 1.3 billion tons / year Anwar, 1989
Ganges-Brahmaputra-
Meghna
1.0-2.1 billion tons /
year
Barua, 1991 & Milliman and
Meade, 1983
Ganges-Brahmaputra-
Meghna 2.5 billion tons/ year Hossain, 1992
The suspended materials of the Nile river water contain a number of nutrients element
in appreciable amounts, which supply the soils with micronutrients in farm lands (Hamdi,
1979). Recent sediments deposited by the Mississippi river enriched the fertility and
productivity of the soils of the Mississippi river plains (Brady, 1994). Sediment sometimes may
degrade land when fertile land is filled with infertile sandy deposition (Saheed et al. 1992).
Hossain (1992) studied on the loose sediments of some coastal river of Bangladesh and
revealed that over all the sites, the clay content mostly ranged in between 20 and 35%, the silt
content around 50% and the fine sand content ranged between 15 and 20%., pH around 8.0 and
mostly poor organic matter and nitrogen content.
Chapter II Review of Literature
8 | P a g e
From the study of the texture and mineralogy of sediments from the Ganges-
Brahmaputra-Meghna river system in the Bengal Basin, Bangladesh, Datta and Subramanian
(1996) indicated that the sediment load of the GBM river system consists exclusively of fine
sand, silt and clay and is deposited under uniformly fluctuating, unidirectional energy
conditions. The sediments have a close similarity in grain size with the sediments of the
surrounding floodplain. The mineral assemblage is dominated by quartz and feldspars. Illite
and Kaolinite are the major clay minerals. The heavy mineral assemblage is dominated by
unstable minerals which are mostly derived from metamorphic rocks. The sediments show
lower concentration of Pb, Hg and As and higher value of Cd. They pointed out that the
textural, mineralogical and chemical nature of the sediments thus has an important bearing on
the environmental quality of the basin as well as the Bay of Bengal.
Chakrapani (2005) studied the sediment discharge in some large rivers in the world as
well as factors controlling variations in river sediment loads and found that sediment in the
river water is 1200 t/yr in Amazon; 1060 ton/yr in Ganges/ Brahmaputra; 1050 t/yr in Huang
He and 210 t/yr in Mississippi river and factors like relief, channel slope, basin size, seasonality
of rains, human perturbations, water flow and tectonic activities control sediment loads in river.
The sediment load of the Ganges and the Brahmaputra river water in Bangladesh was
examined by Rahman et al. (2009) and concluded that in dry season the average content of
sediment of the river water is 75 mg/l and that in wet season is 705 mg/l. They also elucidated
that sand and silt together was the dominant size fractions in the sediments of both the Ganges
and Brahmaputra rivers. The textural classes of the sediments in the waters of the Ganges and
the Brahmaputra rivers vary from silt loam to loam. There was no appreciable difference in the
textural classes between the sediments of two rivers. The pH of the sediments ranged from 6.95
to 7.9. The electrical conductivity of the sediments was low which indicates they are non-saline
sediments. The cation exchange capacity of the sediments ranged from 10 to12.2 cmol/kg. The
highest value (CEC) is found in the sediments of Ganges River and lowest in the sediments of
Brahmaputra River. Lime content in the Ganges sediments is higher which indicates their
calcarious nature than the Brahmaputra sediments. The average content of organic matter in the
Ganges river sediments is 0.65 percent and Brahmaputra river sediments is 0.62 percent , did
not show much variation among the sediments. The C/N ratio is slightly higher (9.3) in the
sediments of Ganges River than the Brahmaputra River. This may be due to the higher lime
contents.
Jalal et al. (2009) have studied the physico-chemical characteristics of the coastal water
sediments in Pulau Tuba River, Langkawi, Malaysia from four stations and remarked that the
Chapter II Review of Literature
9 | P a g e
silt was the dominant size fraction followed by sand and clay. pH of the sediment is around 7.8.
The organic carbon content ranged from 1.92 to 3.00 percent; Fe content 19.6 to 366.9 µg per
gram; Mn content 18.2 to 39.75 µg per gram and Pb content is 1.10 to 3.15 µg per gram.
Specific conductivity (49.83- 51.63 mS/cm) did not show sharp variation among the stations.
Particle size analysis of a growing sand bar at Sonadia Island, Bangladesh has studied by
Hoque et al. (2013) .Sediment samples were collected from 9 (nine) stations and texture
analysis of sediment had done . The percentage of sediment weight was 0.05, 0.11, 19.07,
70.27, 7.94 and 2.56% and concluded that particle size distribution of sediment is a
fundamental property of sediment as it influences other fundamental properties of sediment.
2.2 Soils of the coastal zone
A brief literature review on the findings of research works carried out elsewhere by
different scientists on pedological aspects of soils in the coastal environments is given below.
2.2.1 General characteristics of coastal soils
The areas are subject to flooding in the monsoon season and water logging in parts of
basin areas in most parts of the dry season. Tidal flooding through a network of tidal creaks and
drainage channels connected to the main river system inundates the soil and impregnates them
with soluble salts thereby rendering the topsoil and subsoil salinity. After the construction of
polders, the daily inflow of tidal water reduced and consequently the active sedimentation and
erosion process has almost ceased except in brackish water shrimp cultivation area. Within the
polders, sedimentation and inundation process are still active with saline water. At present,
northern part of the area within the polder is flooded mainly with rain water. The most
significant featureof hydrology in relation to agriculture development is the seasonal shallow
flooding.Highland, medium highland, medium lowland, lowland and very lowland occupies
about 5%, 50%, 10%, 4% and 1% land respectively, in coastal areas.In these areas, flood water
recedes from about 20% areawithin October, from 30% in November to mid December and
from 20% area in late December or in early January.
All soils contain some water soluble salts. Plants absorb essential plant nutrients in the
form of soluble salts, but excessive accumulation of soluble salts suppresses plant growth. Salt
affected soils are common in coastal area. Out of about1.689 million hectares of coastal land
1.056 million hactares are affected by soil salinity of various degrees which has been studied by
a number of workers on their various aspects (Hassan and Razzaq 1981, Karim et al. 1982,
Hussain and Rahman 1983, Hussain et al. 1989). Most of these tidally flooded soils are suitable
for aman rice cultivation as the rainfall during monsoon is adequate for washing the soils below
Chapter II Review of Literature
10 | P a g e
a safer limit. Physiographically floodplain landscapes are not always really flat. Often a number
of micro-relief features occur there which include a succession of broad ridges (levees) and
depressions (black swamps or old channels). Often the sandy or silty materials occupy the
ridges and clayey materials occupy the depressions, but the relative proportions of the different
textured materials vary considerably between and within the floodplains.
Development of soil profile can be extraordinarily rapid, except in permeability wet
sites on active floodplains receiving regular addition of new alluvium. Ripening and oxidation
of raw alluvium apparently take place within 2-3 years, and homogenization by soil fauna
destroys alluvial stratification to 20-50 cm within about 25 years (Brammer, 1971). In materials
heavier than light silt loams, prismatic structure developed in the sub-soil under the influence
of seasonal wetting and drying whereas claey materials may develop a blocky structure. Ped
faces quickly become coated with gleyans comprising unorianted clay, fine silt and humus
eluviated from the top soil. Brammer (1971) pointed out that within span of 25 years; a cambic
horizon may form in floodplain sediments.
Soil Resources Development institute (SRDI, 2010) noted that in almost all the coastal
belt soils, salinity is highest in the top soil in the dry season and is appreciably less in the sub-
soil but often shows an increasing trend below a depth of one meter. About 0.328, 0.274, 0.189,
0.161, and 0.0101 million hactares of land are affected by very slight (S1), slight (S2), moderate
(S3), strong (S4) and very strong salinity (S5) , respectively.
2.2.2 Morphological properties of soils
Studies of the morphological features of soils during the field work are of prime
importance for their identification and classification, because they are believed to have resulted
from the pedogenic processes. The morphological characteristics of soils that have been
included in this review are colour, structure, concretions and mottlings, gleys, plough pan and
flood coatings.
Horizon Boundary
Khan et al. (2012) have studied the three surface-water gley soils from the Meghna
floodplain of Bangladesh and remarked that all the soil profiles showed abrupt to clear and
smooth horizon boundaries that reflecting young soil development or rejuvenation processes.
Chapter II Review of Literature
11 | P a g e
Soil colour
Color is the most conspicuous feature of any soil and is one of the most important and
useful characteristics for its identification. Soil Scientists commonly use grey colours
(Chroma< 2) as an indicator of seasonally/permanently saturated and reduced soil conditions.
Various studies have indicated that reducing conditions result in greyish color in poorly
drained soils or horizons and oxidizing conditions are responsible for the brighter colors in
better drained soils. Studies of water table fluctuations in soils have shown that soil colors can
be used as a general indicator of saturated and reduced conditions, as well as movement of
ground water table (Mackintosh and Vander Hust, 1978; Zobek and Ritche, 1984; Pickering
and Venemen, 1984; Evans and Franzmeier, 1986).
Sinha et al. (1965) in their study of some heavy textured soils in the Gangetic plains of
Bihar, distinguished soils that remained under water for 3 to 4 months in a year from those that
were under water for a shorter period. The former have chroma of 2 or less with mottles,
whereas the latter have chroma of more than 2. A chroma of 2 or less has been used to indicate
a water saturation regime free of oxygen, when the soil temperature exceeds 5°C for some part
of the year (Soil Survey Staff, 1998).
The relationship between water saturation and sol color has been explained primarily by
the oxidation reduction states of Fe and Mn compounds, which regulate the distribution and
forms of these elements within the soil profile (Mc.keague, 1965; Bonner and Relston, 1968).
Reduction of Fe requires exclusion of oxygen for a prolonged period of time, a population of
(micro-organisms and organic matter as a source of energy for the micro-organisms (Jenny,
1980).
SRDI Staff (1965-86) surveyed the soils of the Brahmaputra floodplain area and noted
that soils formed in the seasonally flooded old Brahmaputra floodplain have surface soils
colour ranging from olive to grey and olive grey in ridges and grey to dark grey in lower slope
of ridges and basins. Subsoil colour ranges from grey to dark grey in ridges and grey to mixed
dark grey in basins.
Brammer (1971) noted that the textures of soils are known to affect the brightness of
colour in some soils of Bangladesh. Usually the light textured soils tend to have lighter colour
and the heavy textured soils tend to have darker colours. The reduction and segregation of iron
in the channel soil, however, had been intense enough to produce horizons dominated by grey
or olive grey colour with chroma of 2 or less. In the heavy textured soils, organic matter might
have a role in producing grey colour.
Chapter II Review of Literature
12 | P a g e
Stoops and Eswaran (1985) noted that with increasing hydomorphism iron hydroxide
segregations appear in the groundmass and low chromas in the peds, Morphological
characteristics of wet soils: In: Wetland Soils Characterization, Classification and Utilization.
During flooding there is a net loss of iron from these soils which helps in developing a
grey to dark grey hue. Gleization is thus a general soil forming process in these soils (Hussain,
1992).
Mokma and Cremans (1991) made an attempt to establish a relationship between
saturation and B horizon color patterns in soils of three hydrosequences in south- central
Michigan. They found that the matrix colors of these B horizons changed with duration of
saturation as follows: hues became more yellow or olive as duration of saturation increased;
chromas tended to decrease with increasing duration of saturation at temperature exceeding
5ºC, duration of saturation increased as the proportion of grey (≤2 chroma) mottles increased.
Szogi and Hudnall (1992) emphasized that in studying the seasonally wet soils the
terms "epi saturation" and "endosaturation" must be differentiated because the different nature
and duration of perched and ground water tables. The endosaturation conditions are related to
the occurrence of horizons with oxidizing conditions above reduced horizons. In saturated
zones of soils that have true water tables, the redox potentials are low, particularly if the water
table is not very mobile.
Okusami and Rust (1992) studied the hydromorphic soils from some inland depressions,
alluvial plains and coastal sediments. A 10YR hue was observed in addition to other typical
morphological features of hydromorphic soils. Redder hues within a 10YR matrix colour
indicated an iron accumulation zone which reflected the aerobic or anaerobic fluctuation zones.
Begum et al. (2004) found that the colour of the Manpura Island soils of Bangladesh
vary from grey to dark grey because of organic matter accumulation in the soils.
Akter et al. (2004) point out that the soils had mixture of grey, olive grey and dark grey
developmental colours with values ranging from 3 to 6 in the some seasonally flooded soils of
Bangladesh. They also mentioned that the chromas are lower than 2 in all horizons, indicating
evidence of prolonged submergence and subsequent development of reducing condition during
the flooding season.
Nizam Uddin et al. (2009 b) studied some soils of the Surma-Kushiyara floodplain of
Bangladesh and found that the colour of top soil was generally grey to very dark grey.

Chapter II Review of Literature
13 | P a g e
Mazumder et al. (2010) postulated that the soil matrix had a mixture of olive grey, grey
and dark grey colours with values ranging from 4 to 5 of the old Brahmaputra floodplain soils
in Bangladesh. The chrma was 1 in all soils except the Sherpur peon (4), which aws caused by
prolonged submergence during the monsoon season.
Hossain et al. (2011) reported that in the intensively cultivated soils of Ganges River
Floodplain of Bangladesh, the soil matrix had a mixture of Olive brown (2.5 Y 4/4), light olive
brown (2.5 Y 5/4; 2.5 Y 5/6), grayish brown (2.5 Y 5/2) and dark grey colors. Seasonal
flooding ranging from 2 to 3 months, the soils have developed redoxi-morphic features. The
redox depletion at the surface contributed to the development of dark grey color of the surface
soils.
Khan et al. (2012) have studied the three surface-water gley soils from the Meghna
floodplain of Bangladesh and found that the soils exhibit grey matrix colour with value 3 to 5
and chroma 1 to 3 possibly due to prolonged submergence and subsequent development of
reducing conditions during the flooding season. A low chroma of the matrix is generally
associated with the gleying phenomena of the soils.
Mottlings
Mottlings are important property in the seasonally flooded soils in the floodplain areas.
Joffe (1968) noted that the presence of mottles near the surface horizon indicate fluctuation of
ground water table while the presence of gleys in the lower zone is an unfailing indication of
perennial hydromorphism.
Akter et al. (2004) concluded from the study of some seasonally flooded soils of
Bangladesh that all the soils have strong brown to dark brown yellowish brown colour patterns
in the subsoils and fine distinct mottles have developed along root channels and pores created
by crabs and other aquatic creatures that facilitate air to enter into the soil mass when the flood
water recedes.
Begum et al. (2004) studied some soils from the Manpura Island in the coastal zone of
Bangladesh and found that mottles were usually absent in the surface horizon of the soils.
However prominent mottles were found in the subsurface horizons of the studied soils which
varied in abundance size and contrast.
Nizam Uddin et al. (2009a) postulated that due to alternate wetting and drying
conditions abundant quantities of mottles have been formed in all the soil profiles of the
Surma-Kushiyara floodplain of Bangladesh. They also mentioned that colours of mottles were
Chapter II Review of Literature
14 | P a g e
a combination of dark redish brown to dark yellowish brown and mottled horizon occurred in
the subsoil zone.
Mazumder et al. (2010) elucidated from the study of some representative soil profiles
developed on the Brahmaputra alluvium that the alternate wetting and drying conditions in
these soils resulted in the reduction and subsequent release of iron oxides which are
accumulated in the form of dark brown to dark yellowish brown mottles in the middle zone of
the profiles.
Hassan et al. (2012) point out that due to alternate wetting and drying condition
abundant quantities of mottles have been formed in all the soil profiles of the Ganges
floodplain of Bangladesh and the colours of mottles were a combination of yellowish brown to
dark brown.
Khan et al. (2012) have studied the three surface-water gley soils from the Meghna
floodplain of Bangladesh and observed that all the soils have dark brown to dark yellowish
brown mottles, prominent in the middle zone of the profiles. Alternate wetting and drying
conditions in the soils resulted in release of Fe from iron bearing minerals which in turn was
precipitated and fixed in the form of mottles in the sub-surface horizon. Surface gleying
(pseudogleys) and sub-surface grayization (gleys) are the most notable morphometric features
in these soils.
Flood coatings
Flood coatings are formed mainly in the seasonally flooded lands of Bangladesh.
Brammer (1971) defined flood coatings as the shiny surface of soil cracks and pores formed by
deposition of material washed from the soil surface or the top soil under seasonally flooded
conditions, These coatings are typically continuous, thick and of a grey color. These shiny
materials are composed of clay, fine silt and humus. Flood coatings is clearly different from
clay skins ( argilans), which comprise well oriented fine clay and which are generally regarded
as indicating long continued soil development.
Khan et al. (2012) elucidated from the study of three surface-water gley soils from the
Meghna floodplain of Bangladesh that all the soils have continuous, thick, grey to dark grey
flood coatings on the structural ped faces due to mechanical down washing of unoriented clay,
fine silt and humus when the soils get flooded and ploughed (Brammer, 1971).
Chapter II Review of Literature
15 | P a g e
Gleys
Brammer and Brinkman (1977) observed that surface water gleys are extensively
developed on the seasonally wet landscapes. These gley soils are hydromorphic soils with albic
horizon and the upper horizons contain less clay than the deeper ones. The pH values in these
soils changes due to fluctuation of ground water. Surface water gley soils indicate loss of clay
in the surface layer. Ferrolysis involves reduction of soils in the wet season producing ferrous
iron, which displaces part of the exchangeable basic cations and aluminium.
Akter et al. (2004) studied some seasonally flooded soils of Bangladesh and reported
that the surface water gley or pseudogley is a special morphogenetic formation in soils that
have an impervious clay pan and developed under aquic moisture regime. Soils under aquatic
rice cultivation for a long time acquire some specific morphological features which are called
aquarizems (Kyuma, 1978).
Plough pan
The formation of a plaugh pan is the outcome of field operations like tillage. By passing
over the field frequently the plaughing equipments compact the soil and encourage the
development of a compact zone (plaugh pan) immediately bellow the palughed layer.
Joshua et al. (1983) studied some representative Ganges river floodplain soils of
Bangladesh and found the bulk densities varying from 1.35 to 1.5 gm/cc. He reported that the
higher bulk densities are frequently associated with the surface horizons of the medium
textured soils of the levve areas. This condition could be attributed to the structural breakdown
and compaction of the soils due to ploughing under wet conditions.
SRDI Staff (1965-1986) found that the lower bulk density in clay loam soils ranges
from 1.26 to 1.46 gm/cc and the higher bulk density which ranges from 1.52 to 1.62 gm/cc are
associated with plough pan which are mostly silt loam in the soil of old Brahmaputra
floodplains. It was also reported that lower bulk density has been encountered in heavy textured
soil and density increases with depth in the soils.
Khan et al. (2012) have studied the three surface-water gley soils from the Meghna
floodplain of Bangladesh and observed that ploughpan was a special morphogenetic
(anthropogenic) feature in these soils. Ploughpan- a compact slowly permeable layer- below the
Ap horizon has been formed due to puddling by using traditional ploughs to which the soils
were subjected to for transplanted paddy cultivation. On all landscape puddling for rice
Chapter II Review of Literature
16 | P a g e
cultivation apparently accelerates the processes giving rise to the albic horizon and concentrate
them in the ploughed layer and ploughpan.
2.2.3 Physical properties of soils
Physical properties of soils do not change their pattern easily in comparison to the chemical
properties of soils and hence impart the stable and most useful contribution in soil classification
purposes and in the diagnosis, management and improvement of cultivated soils.
Paticle density
Khan et al. (1997) found that particle density of the soils of Madhupur Tract in the surface
horizons varies from 2.66 to 2.69 g/cm3 and increased in the underlying horizons. The highest
recorded value was 2.73 g/cm3.
According to Rahman et al. (1992) the particle density values at different depth of the profiles
of Ganges- kobadak project ranged between 2.56 and 2.73 g/ cm3. No definite order in the
change of particle density values with increasing depth of horizons in a given profile was
observed.
Bulk density
SRDI Staff ( 1965- 1986) studied some soils of Old Brahmaputra floodplain and reported that
bulk density ranging from 1.26 to 1.40 g/cm3 occur in the surface soils and the bulk density
ranging from 1.54 to 1.62 g/cm3 are associated with ploughpans. They also indicated that bulk
densities from 1.41 to 1.48 g/cm3 have been encountered in heavy textured soil, and density
tends to increase with depth in these soils.
Joshua et al., (1983) and Rahman et al. (1992) elucidated that the bulk densities of Ganges
river floodplain generally vary between 1.15 and 1.56 g/cm3 at different depths. They also
reported that the higher bulk densities were frequently associated with the surface horizons of
the medium textured soils of the upper slopes. This condition has been attributed to the
structural breakdown and compaction of the soils due to ploughing under wet conditions.
Hannan (1995) stated that the bulk density values ranged between 1.27 and 1.41 g /cm3 in Old
Brahmaputra alluvium; 1.32 to 1.53 g/cc in Madhupur Tract. It was observed that bulk density
of the soils had significant negative correlation with silt, organic matter content and state of
micro-aggregate.
Chapter II Review of Literature
17 | P a g e
Soil texture
Soil texture is one of the most fundamental and permanent characteristics that has direct
bearings on structure, porosity, adhesion, consistency and physico-chemical behavior of soils.
SRDI Staff (1965-1986) working on the soils of Dhaka and Comilla districts stated that
the soils developed on the Meghna and Brahmaputra floodplains almost everywhere showed a
distributional pattern of friable silt loams to silty clay loams on the ridges and clays in the
basins. Some clay in older floodplain areas were very heavy and cracked widely when dry and
flood coatin
Brammer (1971) reported that silt loams and silty clay loams predominate on the old
Meghna Estuarine floodplain, whereas silty clays and clays occur extensively on the old
Brahmaputra floodplain. He noted that loam was the dominant textural class in Bangladesh
soils followed by clay.
Toreent and Nettleton (1979) showed that chemical weathering affects the particle
distribution.They found significant correlation between weathering index (fine silt: total silt)
and temperature which could be useful in assessing the uniformity of parent material.
Hassan and Razzzaque (1981) observed that silt was the dominant size fraction in the
soils of the Sundarbans.
Joshua et al. (1983) mentioned that the soils of the Tista floodplain, in general,
contained a high percentage of silt and this property appears to be characteristic for the soils of
this floodplain. The silt content was usually higher than 50 percent, but occasionally may be as
high as 90%. The clay content in these soils was mostly less than 30%.
Okusami and Rust (1992) pointed out that the soil texture varied quite widely with land
types in their study of hydromorphic soils from inland depressions, alluvial plains and coastal
sediments.
Begum et al. (2004) have studied the morphological features of some soils from the
Manpura Islad in Bangladesh and concluded that the dominant texture of the soils is silt loam.
Nizam Uddin et al. (2009a) concluded from the study of the Surma-Kushiyara
floodplain soils of Bangladesh that the texture of the soil was mostly silt loam up to a depth of
120 cm. and mechanisms such as sedimentary discontinuities where in situ weathering of
primary minerals and neo-formation of clay minerals might be the causes of this differentiation.

Chapter II Review of Literature
18 | P a g e
Mazumder et al. (2010) found that the texture of the old Brahmaputra floodplain soils
of Bangladesh varied from silt loam to clay. The soils contained large quantity of silt, ranged
from 8 to 80% with an average of 51%. The average clay content 28%. This high silt content is
a characteristic property of the floodplain soils of Bangladesh. The vertical and horizontal
variation in texture is due to sedimentation rather tha weathering.Akter et al. (2011), also
reported the same results from the study of some seasonally flooded soils of Bangladesh and
point out that the soils are fine-textured show textural variations ranging from silt loam to clay.
Hassan et al. (2012) also found the same result from the study of some soils from the
Ganges floodplain of Bangladesh.
Khan et al. (2013) studied nine surface (0-15 cm depth) soil samples representing nine
typical soil series from the Ganges, Brahmaputra and Meghna floodplains of Bangladesh and
observed that the Gangetic soil had the highest clay content (17-77%) among the studied soils.
As all the soils have developed on alluvial materials there is wide variation in clay content.
This kind of variation is common in sedimentary environments.
Hussain et al. (2013) examined the three surface soils of Urir Char of Meghna Estuay
floodplain and found that silt is the dominant fraction ranged from 54 to 58% followed by clay
and sand. Soils are young, loamy textured in nature.
Soil structure
SRDI Staff (1965-86) found that the moderately well to imperfectly drained sub soils
have weak to moderately strong prismatic and blocky structure in the old Brahmaputra
floodplain area. The imperfectly to poorly drained soils have moderately strong to very strong
prismatic structure; and the poorly to very poorly drained soils have strong prismatic and
blocky structures.
Akter et al. (2004) concluded from the study of some seasonally flooded soils of
Bangladesh that the structure is massive in the surface horizon of all the soils. Any stable
structure did not developed in the surface horizon as it has been ploughed for many years with
puddling. A moderate medium to course prismatic and blocky structure has developed in the B
horizons of all the soils. The same results also found by Nizam Uddin et al. (2009a) in the
Surma-Kushiyara floodplain, Khan et al. (2012) in the Meghna floodplain soils in Bangladesh.
Khan et al. (2012) have studied the three surface-water gley soils from the Meghna
floodplain of Bangladesh and observed that the soil structure is massive in the surface horizons
because of ploughing for many years with puddling. A moderate medium to coarse prismatic
Chapter II Review of Literature
19 | P a g e
and blocky structure has developed in the B horizons. Brammer (1996) also found the same
result from the study of some soils from the Ganges floodplain of Bangladesh. The structure is
massive in the surface horizons because of ploughing for many years with puddling.
Structurelessness in the lower most horizons was also observed in these soils.
Soil moisture
Soil moisture retention is strongly related to the surface area per unit mass of the soil. It
is also related to the texture of the soil and the clay mineral types.
Das et al. (1974) studied water retention characteristics of 12 alluvial soil profiles from
West Bengal. Soil series varying in textures from sandy loam to sandy clay loam showed
increasing trend of water holding capacity with depth (42.9-58.7%). Availability of water
ranged from 7.1 to 23.3 percent in Gheora and from 7.7 to 16.0 percent in Mehrauli profile.
Velayutham and Raj (1977) stated that the assessment of water requirement, planning of
irrigation schedules and prediction of probable crop response to irrigation depend very much
upon differences in available water capacity of soils. They found that loamy soils had
maximum available water capacity followed by sandy loam and clay loam.
Joshua and Rahman (1983) studied soil moisture characteristics in four profiles in
Ganges river floodplain of Bangladesh. They reported that in the moisture retention graphs of
the loamy soils, the moisture contents decreased sharply with increase in tension above 50 cm
of H2O ( pF 1.65). This sharp decrease in moisture content persist upto one atmosphere tension
during which most of the stored moisture was released. The silty clay loam soils, which have
more clay than the silt loam soils, do not exhibit the sharp moisture release at the tension of 50
cm water.
Diwakar and Singh (1992) suggested that clay fractions might be dominant modifier of
the water content at higher energies of retention. Soil water tension at higher tension is mainly
a function of amount and nature of clay (Joshua and Rahman, 1983).
Nizam Uddin et al. (2009b) reported that the hygroscopic moisture in the Surma-
Kushiyara floodplain soils of Bangladesh ranged from 1.37 to 6.1 percent. The mean value of
hygroscopic moisture in the soils is 4.03 percent. Such variation in moisture content retained by
air dry soils is possibly due to the difference in their clay and organic matter contents.
Chapter II Review of Literature
20 | P a g e
2.2.4 Chemical and physico-chemical properties of soils
Electrical conductivity (EC)
EC is an excellent and rapid method for obtaining an estimate of total salt content in any
suspension. If excessive quantities of soluble salts accumulate in the root zone, the crop has
extra difficulty in extracting enough water from the soil salty solution, thereby affecting yield
adversely. So it is important to determination of electrical conductivity in evaluating soil and
water quality in terms of salinity hazard (ASCE, 1990, Somani, 1991). The EC of aqueous salt
solution increases at the rate of about 2% per degree Celcius rise in temperature. The standard
temperature for reporting EC is 25 0 C (USSL Staff, 1954).
SRDI Staff (1967) noted that in almost all the coastal belt soils, EC is highest in the top
soil in the dry season and is appreciably less in the sub-soil but often shows an increasing trend
below a depth of one meter.
Hossain et al. (2011) studied on some soils from the coastal area of Bangladesh and
reported that the EC of the soils ranged from 1.0 to 5.5 mmhos/cm at 25 0 C. The vertical
distribution pattern of EC is irregular. In some pedons, there is a trend of decreasing EC value
with depth is noticed.
Hussain et al. (2013) elucidated that the electrical conductivity of the Meghna Estuay
floodplain soils ranged from 5.8 to7.5 dS/m that indicates the saline nature of the soil. They
also reported that most plants suffer salt injury at an electrical conductivity of the soil
saturation extract of 4 dS/m or higher.
Soil reaction (pH)
Soil reaction is the most important single chemical characteristic which has a great
influence on many physico-chemical, chemical and mineralogical properties of a soil.
Suitability of soil as a medium for plant growth and desirable micro-organisms depends upon
whether the soil is acid, neutral or alkaline and, therefore, this property receives special
attention in pedogenesis and classification study of soils.
Ponnamperuma (1985) observed that when an aerobic soil was submerged, its pH
decreased during the first few days, reached a minimum and then increased asymptotically to a
fairly stable value of 6.7 to 7.2 a few weeks later in a 1: 1 soil water suspension. He reported
that the overall effect of flooding is an increase in pH of most acid mineral soils which was due

Chapter II Review of Literature
21 | P a g e
to the reduction of Fe3+
; and a decrease in pH of alkaline soils which was due to CO2
accumulation.
Walia and Chamuah (1992) reported that the seasonally flooded soils of the
Brahmaputra valley in Assam were slightly acidic to neutral in reactions and the pH increased
with depth. Ali (1994) postulated that the Ganges alluvium have higher pH values than the soils
of the Brahmaputra alluvium from his study on the effects of alternate wetting and drying
cycles on some representative Bangladesh soils.
Begum et al. (2004) conducted a research on the Monpura Island, located in coastal area
of Bangladesh from the pedological and edaphological aspect and pointed out that the reaction
of the soils are alkaline with a mean value of 8.0.
Islam et al. (2008) concluded from their study of some low land rice soils of the lower
Atrai basin of Bangladesh that the pH of the soils ranges from 6.2 to 6.9 with a mean value of
6.5. Nizam Uddin et al. (2009a) studied some Surma-Kushiyara floodplain soils of Bangladesh
and found slightly acidic in reaction and the pH of the soils increased with depth of soil profile.
Mazumder et al. (2010) carried out pedogenic study of some soil profiles from the old
Brahmaputra floodplain of Bangladesh and observed that the soils of the Brahmaputra
floodplain were acidic to neutral with pH values ranging from 5.3 to 7.8. He also reported that
in all soil profiles, there was a trend of increasing pH with depth.
Hossain et al. (2011) found that the soils were neutral to alkaline with pH values
ranging from 6.9 to 7.9 from the characterization and classification of some intensively
cultivated soils from the Ganges river floodplain of Bangladesh.
Akter et al. (2011) have conducted an experiment on pedogenic study of the seasonally
flooded soils of Bangladesh and reported that that the pH values of the soils ranges from 5.4 to
7.0, a feature common in seasonal flooded soils in Bangladesh and the values shows increasing
trends with the increase of depth. These soils were slightly acidic to neutral and are negatively
charged with ∆pH values ranging between – 0.2 and -1.2. The ∆pH values are presumed to be
due to the difference in reserve acidity.
Khan et al. (2012) elucidated from the study of three surface-water gley soils from the
Meghna floodplain of Bangladesh that the soils were moderately acidic to neutral with pH
values ranging from 5.07 to 7.32 and also reported that there was a trend of increasing pH up to
a certain depth. The ∆pH values were all negative and ranged from -0.90 to -2.01, presumed to
be difference in reserve acidity.
Chapter II Review of Literature
22 | P a g e
Hussain et al. (2013) revealed that the Meghna estuarine floodplain soils were alkaline
in reaction. The pH (H2O) value ranged from 7.5 to 7.7.
Organic matter
Hussain et al. (1989) studied chemical properties of four pedons from Bhola district of
Bangladesh and noted that in those soils the organic matter content was higher at the surface
soils and showed a gradual decreasing pattern with depth. Saheed and Hussain (1992) reported
that both organic carbon and total nitrogen contents in the wet mineral soils in Bangladesh were
low. More than half of the soils had organic carbon content in the range of 0.5 to 1.0 percent.
Walia and Chamuah (1992) reported that the flood affected soils of Brahmaputra valley
have moderate quantity of organic matter (more than 1%). Sidhu et al. (1994) remarked that the
organic carbon content of the floodplain Entisols of Punjab decreased irregularly with depth
indicating their stratified nature.
Nizam Uddin et al. (2009a) found the low amount of organic matter content of the
Surma-Kushiyara floodplain soils of Bangladesh. Low content of organic matter may be caused
by rapid decomposition of organic residues because of high temperature and rainfall, higher
cropping intensity under tropical condition.
Mazumder et al. (2010) Carried out pedogenic study of some soil profiles from the old
Brahmaputra floodplain of Bangladesh and observed that the organic carbon content in the soils
is low and range from 0.20 to 1.07%. Low organic carbon content is a problem of Bangladesh
soils, which is possibly due to rapid decomposition of organic matter under hyperthermic
temperature regime. Hossain et al. (2011) also found the same results of the Ganges river
floodplain soils of Bangladesh.
Akter et al. (2011) have conducted an experiment on pedogenic study of the seasonally
flooded soils of Bangladesh and reported that organic matter content in the surface horizons of
the studied soils ranged from 1.76 to 2.05 percent that decreased steadily with depth.
Khan et al. (2012) elucidated from the study of three surface-water gley soils from the
Meghna floodplain of Bangladesh that the organic carbon contents is low and ranges from 0.21
to 1.83 percent. These results are in agreement with those reported for soils from the
floodplains of Bangladesh.
Hussain et al. (2013) revealed that organic carbon content in the Meghna Estuay
floodplain soils were up to the mark and ranged from 1.79 to 1.95 percent.
Chapter II Review of Literature
23 | P a g e
Total nitrogen
Rahman (2001) studied the chemical and mineralogical composition of major river
sediments of Bangladesh and their impact on genesis and nutrient status of soils and found that
the total nitrogen of the soil ranges from 0.04 to 0.12% and surface soil of the pedon contains
the higher amount of nitrogen than the underlying horizon. From the study of some
hydromorphic soils from the Ganges delta in Bangladesh Ferdous et al. (2005) concluded that
the total nitrogen content ranges from 0.01 to 0.71 percent with a mean value of 0.11 percent
and total nitrogen content shows decreasing trend with depth.
Mazumder et al. (2010) carried out pedogenic study of some soil profiles from the old
Brahmaputra floodplain of Bangladesh and observed that the total nitrogen content in the soil
ranged from 0.02 to 0.10% and vertical distribution pattern is irregular.
Akter et al. (2011) suggest from the pedogenic study of the seasonally flooded soils of
Bangladesh that the total nitrogen content of the soils ranges from 0.05 to 0.19% and the values
shows decreasing trends with the increase of depth. Mazumder (1996) also reported similar
trend for some seasonally flooded Brahmaputra floodplain soils.
Khan et al. (2012) pointed out from the study of three surface-water gley soils from the
Meghna floodplain of Bangladesh that the total nitrogen contents of the soils ranges from 0.02
to 0.18 percent with an average of 0.07 percent. The seasonally flooded soils of Bangladesh are
presently puddle using the mechanical or traditional ploughs to cultivate transplanted paddy.
Consequently paddy straws are smeared in the top soil in large quantity and C/N ratio
increases. The microbial activities in top soil are augmented as the microbes can derive
adequate energy from the added paddy straw. The phenomenon depletes the soil nitrogen
content as the microbes derive the needed nitrogen for cell formation from the soil humus.
Cation exchange capacity (CEC)
SRDI Staff (1965-86) reported that the CEC of the top soil of most of the Brahmaputra
floodplain area having less than 2 percent organic matter ranged from 9- 23 cmol/kg soil. The
CEC of subsoils was usually slightly higher ranging from 10 - 28 cmol/kg of soil. The values of
CEC slightly increased with depth due to their increased clay content.
Chatterjee and Dalal (1976) reported that the CEC value of some soils from Bihar and
West Bengal decreased with depth from 4.1 to 10.2 cmol/kg soil.
Pathak and Patel (1980) studied some physic-chemical characteristics of salt affected
soils of India and observed that CEC values showed increasing trend with clay content and soil
Chapter II Review of Literature
24 | P a g e
depth. They reported a range of CEC from 2.1 to 11 cmol/kg when the clay content in soils
ranged from 25 to 55 percent.
In a study on the physic-chemical characteristics of some coastal saline soils of
Bangladesh, Hussain and Rahman (1983) observed that the cation exchange capacity of these
soils was relatively low ranged from 12.6 to 20.6 cmol/kg of soil.
Thawale et al. (1991) found that the CEC of the soils of agricultural school farm
sawangi ranges from 35.7 to 62.8 cmol/kg soil indicating montmorillonite type of clay
minerals.
Walia and Chamuah (1992) reported that the CEC of the floodplain soils of
Brahmaputra valley in Assam ranged between 6.6 and 18.0 cmol/kg of soil.
Mazumder (1996) in a study of some soils from the Brahmaputra floodplain of
Bangladesh obtained significant positive correlation between cation exchange capacity and
percent clay and also with the organic matter.
Nizam Uddin et al. (2009a) reported that the cation exchange capacity of the Surma-
Kushiyara floodplain soils of Bangladesh ranges from 13.14 to 24.56 cmol/kg soil. The
variation of CEC of the soils reflects the important influence of both the clay and organic
matter content of these soils.
Rahman et al. (2009) found that the CEC of Ganges and Brahmaputra river sediments
ranges from 10 to 12 cmol/kg soil. They also noted that CEC is higher in Ganges river sediment
than the Brahmaputra river sediment.
Mazumder et al. (2010) Carried out pedogenic study of some soil profiles from the old
Brahmaputra floodplain of Bangladesh and observed that the CEC of the soil ranged from 3.14
to 21.84 cmol/kg with an average of 10.10 cmol/kg and found significant positive correlation
with the clay content. Hossain et al. (2011) found high cation exchange capacity of the Ganges
river floodplain soils of Bangladesh.
Akter et al. (2011) conclude from the pedogenic study of the seasonally flooded soils of
Bangladesh that the CEC of the soils ranges from 9 to 33 with a mean value of 14.9 cmol/kg
and also point out that there was a highly significant positive correlation with clay and organic
matter. Khan et al. (2012) found the CEC of the Meghna floodplain soils ranges from 3.53 to
14.8 cmol/kg with an average of 10.10 cmol/kg.
Khan and Ottner (2012) have studied the three surface-water gley soils from the
Meghna floodplain of Bangladesh and noted that the CEC of the soils ranged from 3.53 to
Chapter II Review of Literature
25 | P a g e
14.08 cmol/kg with an average of 10.10 cmol/kg. The CEC in these soils bears a significant
positive correlation with the clay contents (r= 0.87**).
Khan et al. (2013) studied nine surface (0-15 cm depth) soil samples representing nine
typical soil series from the Ganges, Brahmaputra and Meghna floodplains of Bangladesh and
observed that the CEC was comparatively higher in the Gangetic soilsthan that in the non-
Gangetic soils. The CEC varied between 12.96 and 27.66 for Gangetic soils and between 7.08
and 12.08 for non-Gangetic soils. They claimed that the type and amount of clay minerals and
organic matter content regulates the CEC of these soils.
Hussain et al. (2013) showed that the cation exchange capacity in the Meghna Estuay
floodplain soils were high and ranged from 19.88 to 20.45 cmol/ kg.
Exchangeable cations
In the study of hydromorphic soils from inland depressions, alluvial plains and coastal
sediments, Okusami and Rust (1992) stated that the general cation distribution are Ca > Al > H
> Mg > K> Na (inland depressions); Ca > Mg > Al > Na > H > K (alluvial plains) and Al > Mg
> Ca > H > Na (coastal plains).
Khan (1995) Determined exchangeable bases such as Ca++
, Mg++
, Na+, and K
+ in some
floodplain soils of Bangladesh and also calculated their percentage composition. Calcium was
found to be by far the most dominant metal cation in most of the soils. Next to calcium comes
the magnesium. The exchangeable Ca++
/Mg++
ratio in the soils ranged from 1.4 to 9.4.
Buol et al. (2001) reported that the Ca++/ Mg++ ratio in the soil decreases with
increasing maturity.
Nizam Uddin et al. (2009a) studied some soils of the Surma-Kushiyara floodplain of
Bangladesh and reported that the exchangeable Ca++
/Mg++
ratio varied from 1.2 to 1.9.
Mazumder et al. (2010) found that calcium was the dominant cation in the exchange
phase followed by Mg++
and K+ of the old Brahmaputra floodplain soils of Bangladesh. Akter
et al., (2011) found Ca++
is the dominant cation in the colloidal complex followed my Mg++
,
Na+, and K
+.
Khan et al. (2012) have studied the three surface-water gley soils from the Meghna
floodplain of Bangladesh and observed that the Mg++
in some horizons of the profiles was the
dominant cation in the exchange phase of these soils followed by Ca++
and K+ ion. The Mean
Ca++
/ Mg++
ratio was 0.85 which is less than unitu indicating loss of Ca++
due to Gleization in
these soils.
Chapter II Review of Literature
26 | P a g e
Hussain et al. (2013) examined the three surface soils of Urir Char of Meghna Estuay
floodplain and found that magnesium was the dominant exchangeable cation followed by
calcium, sodium and potassium.
Base saturation percentage
Ali (1994) observed that high degree of saturation in some alluvial soils of Brahmaputra
and Gangetic floodplains is noticed.
Khan (1995) found the base saturation percentage of Brahmaputra floodplain soils was
ranged from 53 to 100 and the mean value was 77 percent. Hossain et al. (2011) found high
base saturation percentage of the Ganges river floodplain soils of Bangladesh. Akter et al.
(2011) mentioned high base saturation percentage of the seasonally flooded soils of
Bangladesh. Hussain et al. (2014) revealed that percent base saturation (BSP) of surface soils
of Urir Char of Meghna Estuay floodplain was very high ranged from 90 to 92%.
Mazumder et al. (2010) carried out pedogenic study of some soil profiles from the old
Brahmaputra floodplain of Bangladesh and observed that calcium is the dominant cation in the
exchange phase of these soils followed by mg2+ and K
+. The sols had very high percentage of
base saturation 52 to 80%.
Khan et al. (2012) have studied the three surface-water gley soils from the Meghna
floodplain of Bangladesh and reported that the soils have very high percent base saturation
ranged from 59 to 87%.
Free iron and manganese oxides
Juo et al. (1974) reported that the active Fe decreases with the increases of profile depth
suggesting that the larger portion of Fe oxides are present as crystalline forms in the upper
horizons of well drained profiles. They also reported the co-migration of clay and Fe oxides
from A to B horizon in some Nigerian soils.
Schwertmann and Taylor (1977) reported that the weathering of iron-bearing primary
minerals in soils is known to release structural iron through hydrolytic oxidation. In the pH
range that usually occurs in soils, the released iron is precipitated as oxides, hydrooxides, or
oxyhydroxides (Gartels and Christ, 1965). Soils contain variable amount of free oxides and
amorphous or x-amorphous constituents (Ghabru et al. 1990). Schwertmann and Taylor (1977)
further noted that even at low concentration in a soil, iron oxides have a high pigmentation
power and determine the colour of many soils.
Chapter II Review of Literature
27 | P a g e
Hussain et al. (1989) stated that the free iron oxide content in the soils of Bhola is low
due to loss of iron with draining water. He reported that at a depth of around 40-80 cm in all the
studied pedons an enrichment of free iron oxide occurred which was due to their fixation in the
profiles in the form of mottles.
Orlov (1992) stated that the contents and forms of Fe and Mn in soil and then vertical
distribution in the profiles reflected the trend and peculiarity of the soil formation process.
Hussain et al. (1992) found that the free iron oxide content in the soils of Bhola was low
due to loss of iron when reduced during the wet season along with draining water. They
reported that at a depth of around 40-60 cm in the soil pedon an enrichment of free iron oxide
occurs which was probably due to their fixation in the soils in the form of mottles. Mottles,
therefore, were prominent at the middle zone of the soil profiles where oxidation reduction
condition alternates (Saheed and Hussain, 1992).
The movement of manganese oxide and its distridution in soil profile were significant
criteria in pedogenic study as it behaves like iron oxide (Joffee, 1966). Mandal (1960) however
stated that the course of manganese transformationin soil was somewhat different from that of
iron.
Khan (1995) and Muzib (1969) studied some seasonally flooded soils of Bangladesh
and reported that free Fe2O3 contents in these soils were low. The average free Fe2O3 content in
the soils was around one percent in the Ganges and Brahrnaputra floodplain but it was
surprisingly lower in the Meghna floodplain soils.
Rahman (2001) found 1.38 percent mean free iron oxide and 0.038 percent mean free
manganese oxide in soils of Brahmaputra and Ganges river floodplain in Bangladesh.
2.2.5 Total analysis of sediments and soils
Silicon is the most abundant element in the earth’s crust and in most soils. Wilding et
al. (1977) stated that silicon occurs as six distinct minerals: quartz, tridymite, cristobalite,
coesite, stishovite and opal. Due to its strong resistance to weathering and ubiquitous nature,
quartz is the most abundant mineral in the coarser fractions of most soils and occurs in nearly
every locality on the earth’s surface. Recent aquatic sediments show decrease in silica content
with particle size. The primary silica content is generally concentrated in the sand and silt
fractions with secondary minerals in the clay fraction. The sand and silt fractions of the most
soils are dominantly silicates (Borchardt et al. 1968; Huizing, 1971). Silicate minerals exert a
secondary influence on most physic-chemical properties in soils including surface area, ion
Chapter II Review of Literature
28 | P a g e
exchange, moisture retention, plasticity, cohesion and adhesion, as well as, shrinkage and
swelling.
Hussain et al. (2014) studied the chemical composition of clay fraction of some selected
soils developed on various parent materials in Bangladesh and found that the silica percentage
was 53.40%, 53.70%, 54.10%, 52.40% and 52.80% in Brahmaputra alluvial soil, Ganges
alluvial soil, Meghna alluvial soil, Tista alluvial soil and Madhupur clay soil respectively and
concluded that silicate clay minerals were dominant in these soils. More than 50% SiO2 in the
clay fraction indicated quite stable clay minerals and the pedochemical weathering processes
were slow as there was virtually little amount of iron and magnesium in the clay fraction.
Aluminium
Dolout et al. (1987) reported that there exist a relationship between the pedochemical
reactions and the forms of aluminium. Forms and amounts of aluminium have influence on
flocculation, pH, surface area, surface charge and also pedogenic process of the soil profile.
Karim (1984) reported that formation of goethite took place at pH 5.8. Van Mensvoort et al.
(1985) reported that aluminium concentrations were directly related to soil pH and toxic
concentration can occur only below pH 5.0.
Mazumder et al. (2010) carried out pedogenic study of some soil profiles from the old
Brahmaputra floodplain of Bangladesh and observed that aluminium is the second abundant
element in these soils with the mean value was 12.8%. Vertical distribution pattern showed
little variation.
Hussain et al. (2014) studied the chemical composition of clay fraction of some selected
soils developed on various parent materials in Bangladesh and found that the alumina
percentage was 20.90%, 19.00%, 17.97%, 18.70% and 18.25% in Brahmaputra alluvial soil,
Ganges alluvial soil, Meghna alluvial soil, Tista alluvial soil and Madhupur clay soil
respectively and indicated the presence of high quantities of ferroaluminosilicate minerals in
these soils.
Potassium
Potassium in soil is classified in three forms: unavailable, slowly available, and readily
available or exchangeable.Unavailable potassium comprises approximately 90-98% of the total
potassium (Khan et al. 2013). Slowly available potassium, which is fixed and non-
exchangeable, is the form trapped between the layers of sheets of certain kind of clay minerals.
Readily available potassium is a dissolved form of potassium or held on the surface of clay
Chapter II Review of Literature
29 | P a g e
particles. A dynamic equilibrium exists between the different forms of potassium in soils.
Availability of K for plants therefore depends on weathering of potassium bearing minerals in
soils, exchangeable K from the inorganic colloidal complexes.
Potassium status of soils depends largely on soil parent material as well as the degree of
weathering (Graham, 1953). Potassium is low in highly weathered soil and in Histosols. Young
soils derived from materials rich in K-bearing minerals contain abundant potassium. Hussain et
al. (1983) reported that the vertical distribution of K2O in the soil shows an irregular
distribution pattern and further noted that it is quite an expected feature in alluvial soils when
the parent materials are derived from distant and varied sources.
Hussain et al. (2014) studied the chemical composition of clay fraction of some selected
soils developed on various parent materials in Bangladesh and found that the potassium (K2O)
percentage was 2.71%, 2.95%, 2.70%, 2.70%, and 2.68% in Brahmaputra alluvial soil, Ganges
alluvial soil, Meghna alluvial soil, Tista alluvial soil and Madhupur clay soil respectively and
assumption that the quantity of potassium ion depletion in soil clays is not appreciable.
Phosphorus
Mazumder et al. (2010) carried out pedogenic study on some soil profiles from the Old
Brahmaputra floodplain of Bangladesh and observed that the P2O5 contents vary widely
ranging from 500 to 1700 ppm with a mean value of 1000 ppm. The vertical distribution
pattern of P2O5 in the soil profiles were abrupt indicating an alluvial character of the soil
material.
Iron
Chatterjee and Dalal (1976) indicated that the alluvial soils in Bihar and West Bengal
were higher in total Fe2O3 content near the surface than that in the lowers layers. No definite
sequence in the distribution of iron with depth was noted probably due to young nature of the
alluvial deposits.
Jha et al. (1984) examined the distribution of micronutrients in some calcarious soils
and found that the total iron had been accumulated in low land soils. Fraction of the total iron
in available form was also the highest in the low land profile apparently due to prolonged
submergence and reducing conditions and high clay content while higher pH and
calcareousness reduced the availability of iron in upland soil profile. Total iron showed a
positive relationship with total Mn and available P. No definite sequence in the distribution of
Fe was noted probably due to young nature of the alluvial deposits.

Chapter II Review of Literature
30 | P a g e
Titanium
From a study of the distribution of titanium in the clay fraction of some Bangladesh
soils Karim and Hussain (1963) reported that the average value of TiO2 in clay fraction of the
soil was 1.5 percent.
Hussain and Swindale (1974) reported that TiO2 in soils ranged from 0.6 to 5.0 percent.
The TiO2 content was higher in the calcarious soils and was uniformly distributed within the
profile
Mazumder (1976) worked on some deep water rice soils of Bangladesh and noted that
the TiO2 content of the clay fraction of the soils was around 1.49 percent. He observed that the
distribution of TiO2 from the surface downward followed closely the sequence of sand/silt ratio
which was irregular in nature.
Hussain and Islam (1979) studied the TiO2 content of a number of whole soils and
clays from Bangladesh and reported the mean TiO2 contents as 0.67 and 1.14 percent for the
whole soils and clays, respectively.
Sharma and Dev (1985) reported that TiO2 content of the whole soils in the northeast of
Punjub ranged from 0.27 to 2.16 percent. The irregular distribution pattern of titanium content
indicated wide-spread stratifications.
Singh and Mishra (1994) stated that the TiO2 content of the soils of the Indo-Gangetic
Plain of Bihar ranged from 0.6 to 1.1 percent. It has been observed that TiO2 occurred in the
finer fraction of soils.
Islam (2014b) determined TiO2 in the clay fractions of some soils of Bangladesh and
found the average value of TiO2 as 0.84 percent.
SiO2/R2O3 molar ratio
Hussain and Swindale (1974) stated that in Hawaiian Gray Hydromorphic Soils the
SiO2/R2O3 and SiO2/Al2O3 molar ratios of the soils increased with increasing degree of
hydromorphism. The SiO2/R2O3 and SiO2/Al2O3 molar ratios of the fine clay fraction of the
soils increased with increasing drainage impedance.
Hussain et al. (2014) investigated the chemical composition of clay fraction on
some selected soils developed on various parent materials in Bangladesh and found that the
SiO2/R2O3 molar ratio in Brahmaputra alluvial soil is 3.42; 3.69 in Ganges alluvial soil, 3.86
in Meghna alluvial soil; 3.73 in Tista alluvial soil and 3.68 in Madhupur clay soil and indicated

Chapter II Review of Literature
31 | P a g e
that the minerals in the clay complex are of 2:1 layer silicate types such as illite, vermiculite,
montmorrilonite, and mixed layer minerals etc. are dominant in these soils.
2.2.6 Mineralogical properties of sediments and soils
Mineralogical composition of soils is very important to have an idea on genesis,
physico-chemical properties, nutrient behavior as well as inherent potentiality of soils.
Hassan and Razzaq (1981) investigated four soil profiles from the Sunderban forest area
on Ganges Tidal Floodplain and found that all soils were dominated by mica and smectite with
some kaolinite, chlorite, vermiculite and interstratified minerals.
White (1985) reported qualitative estimates of clay mineralogical composition of a large
number of soils of Bangladesh and opined that mica (muscovite) and kaolinite were the
predominant minerals in the clay fraction of the most floodplain soils. He speculated that mica
was transformed to vermiculite under acidic condition in the Brahmaputra, Meghna and Tista
Floodplain soils; while under neutral to alkaline reaction and poor drainage conditions mica
was transformed to smectite in Ganges Floodplain soils.
The mineralogy of silt and fine and coarse clays of four soil profiles was studied by
Islam and Lotse (1986) using X-ray diffraction (XRD), ion exchange and selective dissolution
techniques. Mica and smectite were found to be dominant in Batara and Ghior series of Ganges
River Floodplain, whereas mica and Kaolinite were dominant in Naraibag and Ghatile series of
Old Meghna Estuarine Floodplain and Old Brahmaputra Floodplain respectively.
Hussain et al. (1989) reported high contents of mica, kaolinite and smectite in the clay
fraction of some Gangetic alluvium soils of the coastal belt of Bangladesh. The variation in the
content of smectite with depth was insignificant which led them to conclude that this mineral
was allogenic in origin.
Egashira and Yasmin (1990) reported the mineralogy of some floodplain soils. Mica
and chlorite were found to be dominant in Tista and Old Brahnaputra floodplain soils, and the
latter also contained large amounts of vermiculite; the calcareous part of Ganges floodplain
soils was composed of smectite and mica while the noncalcareous or decalcified part contained
mica and chlorite. A terrace soil was dominated by mica and interstratified kaolinite-smectite
and mica-vermiculite-smectite.
Mall and Mishra (1994) stated that the fine sand mineralogy of the Gangetic alluvial
soils of Bihar is dominated by light minerals in the order: quartz > feldspar > muscovite. Heavy
fraction contains mainly opaque minerals, biotite and garnet, although zircon, apatite, rutile and
Chapter II Review of Literature
32 | P a g e
chloritized mica are also present in some soils. Biotite and feldspars are the weatherable
minerals. Fine sand fraction from the river beds contains garnet, opaque minerals, quartz,
feldspar and muscovite.
Egashira et al. (1994) stated that the mineralogy of paddy soil in southern Fukuoka
prefecture, Japan was related to the geological characteristics of the sediment from which they
were derived. He also stated that the mineralogical differences were reflected in soil fertility.
Silt and clay mineralogy of ten soil series, three from terrace areas and seven from
floodplains, were studied by Moslehuddin and Egashira (1996). They reported that silt fractions
were dominated by quartz in all soils while terrace soils contained relatively higher quartz and
lower mica, chlorite and plagioclase. Mica was present in large amount in the clay fraction of
all the soils.
Khan et al. (1997) studied five benchmark soil profiles from different floodplains of
Bangladesh and found that mica was the dominant mineral in the clay fractions of most of those
soils. The other minerals in the clay fraction of those soils were kaolinite, vermiculite, chlorite
and interstratified minerals. The clay minerals appear to be inherited from parentmaterials with
very little in situ mineral transformation.
Mineralogical study of some Meghna Floodplain soils was carried out by Moslehuddin
et al. (1998b) to determine the contribution of different river sediments as the parent material In
general; mica, smectite, vermiculite; chlorite and kaolinite were the major clay minerals in
these soils. Soils of Lower Meghna River Floodplain were dominated by mica, vermiculite and
chlorite, and were estimated to be developed from the Jamuna (Brahmaputra) sediments while
the contribution of the Meghna/Old Brahmaputra sediments increased towards the surface. The
Ganges sediments had apparently no contribution. In contrast, soils of Young Meghna
Estuarine Floodplain contained good amounts of smectite and chlorite in addition to mica, and
were estimated to be developed from the Ganges and Meghna/Old Brahnaputra sediments.
Iftekhar et al. (2004) elucidated from mineralogical characterization of clay fraction of
some Ganges floodplain soils of Bangladesh that mica was the dominant clay minerals in all
the soils. Although high content of smectite was found in Ghior and Ishwardi soils, it was
minor in other three cases which might be because of disappearance of smectite from top soils.
The mineralogy of ten soils consisting of nine representative soil series of Low Ganges
River Floodplain studied by Rahman et al. (2005). The clay content of the surface soil ranged
from 18.6 to 35.7%. They reported that mica and smectite were the dominant minerals in the
clay size fraction.
Chapter II Review of Literature
33 | P a g e
Hussain et al. (2006) pointed out from their mineralogical study of some hydromorphic
soils of the Ganges delta in Bangladesh that smectite was the dominant mineral with weathered
mica and chlorite along with small quantities of kaolinite and mixed layer minerals.
Hussain et al. (2011) concluded from the characterization and classification of some
intensively cultivated soils from the Ganges river floodplain of Bangladesh that smectite was
the dominant clay minerals followed by mica and kaolinite with small quantities of vermiculite
and interstratified minerals. The minerals in the clay fraction of the soils appear to be inherited
from individual parent materials with very little in situ mineral transformation (Khan and
Ottner, 2011).
From the study of bulk and clay composition of some Benchmark soils of Bangladesh
Khan and Ottner (2012) indicated the smectite mineral , with peak intensity at 17Å in the Mg-
saturated-ethylene glycol (ME) and in the K-saturated- ethylene glycol (KE) solvated sampales.
Vermiculite can be distinguished as true vermiculite and soil vermiculite, considering that the
true vermiculite is a rock forming mineral or 14Å vermiculite, while soil vermiculite is of
pedogenic origin and sometimes called or 18Å vermiculite (Moore and Reynolds. 1997). They
also reported that the occurance of considerable quantities of 18 Å vermiculite in the clay
fraction of the soils of Bangladesh was not detected by the earliar workers (Islam and Lotse,
1986; Moslehuddin and Egashira, 1997). Soil vermiculite (18Å) might have been
misinterpreted for smectite in the soils of the Gangetic floodplain. When the peak at 14Å in the
Mg- saturated specimen expands to 17Å in the ME solvated specimen then, it is absolutely
smectite but if contracted to 10 Å in the K- saturated specimen and KE solvated specimen then
it is 18 Å vermiculite or soil vermiculite.
Khan et al. (2012) studied the mineralogical composition of three soil series from the
Meghna floodplain of Bangladesh and noted that illite was the dominant mineral in the clay
fraction, soil vermiculite was the second dominant clay minerals followed by kaolinite and
chlorite. They also found small quantities of smectite and primary vermiculite minerals. They
further mentioned that most minerals in the clay fraction of floodplain soils are assumed to be
inherited rather than in situ transformation.
Hussain et al. (2013) revealed that in the bulk soils of Meghna estuarine floodplain of
Urir Char soils, layer silicates and quartz were the dominant minerals while the quantity of
feldspars was around ten percent. Quantity of weatherable minerals was very high in the soils.
Illite is the dominant mineral in the clay fraction of the soils followed by smectite. Mixed layer
minerals were absent in these soils.
Chapter II Review of Literature
34 | P a g e
Reza et al. (2013) elucidated from their mineralogical study of some soils of lower
Purnabhaba floodplain in Bangladesh and reported that clay fraction was commonly dominated
by mica followed by interstratified mica–vermiculite–smectite and kaolinite–smectite minerals,
accompanied with small amounts of kaolinite, chlorite, interstratified mica–chlorite,
vermiculite, quartz, feldspars and lepidocrocite. The soils of the lower Purnabhaba floodplain
(AEZ 6) included in the mineralogical suite of mica–mixed layer minerals–kaolinite along with
terrace soils in Bangladesh (Moslehuddin et al.1999).
Khan et al. (2013) studied nine surface (0-15 cm depth) soil samples representing nine
typical soil series from the Ganges, Brahmaputra and Meghna floodplains of Bangladesh and
observed that the gangetic floodplain soils predominated with 18 A vermiculite> illite>smectite
minerals contained higher amount of all forms of potassium compared to the Brahmaputra and
Meghna floodplain soils in which illite and Kaolinite predominated.
Akter et al. (2015) studied twenty four soils from three representative soil series
(Ramgati, Hatiya and Silonia) of AEZ -18: Young Meghna Estuarine Floodplain soils of
Bangladesh in context of mineralogical characterization of clay fraction of these soils and
remarked that clay fraction was dominated by mica. Chlorite and kaolinite were also identified
as dominant mineral in almost all soils. Smectite, and vermiculite and/or vermiculite–chlorite
intergrade minerals were also detected in most soils. The variation in the mineralogical
composition was supposed to be attributed from the difference in the proportion of parent
sediments from three major rivers (GBM) of Bangladesh.
Kader et al. (2015) conducted a research on the mineralogical composition of twenty
four widely distributed paddy soils from different agro-ecological regions ( AEZ 9, 10, 12 , 17,
22, 25, 28) of Bangladesh using x-ray diffraction (XRD) and postulated that five layer silicate
(mica, smectite, chlorite, vermiculite and Kaolinite) and four complex minerals (quartz,
feldspar, goethite and lepidocrocite) and two interstratified minerals ( Vermiculite- chlorite
and mica- chlorite)were contained in the <2 µm clay fraction. Mica (20 to 50%) was the most
predominant mineral identified in the studied soils. Next to mica, chlorite (5 to 20%) and
Kaolinite (2-37%) were present in all the soils. Other than layer silicates quartz (4-21%) was
the predominant non-silicate mineral identified in all the studied soils. According to the clay
mineralogical composition, most of the studied soils were found to the initial stage of
weathering.
Chapter II Review of Literature
35 | P a g e
2.2.7 Genesis and classification of floodplain soils
2.2.7.1 Genesis of floodplain soils
Brammer and Brinkman (1977) correlated surface water gley soils in Bangladesh with
the hydromorphic soils developed on the floodplain landforms occurring widely in south east
Asia, the degraded rice soils of Burma (Karmanov, 1968); the "aquarizems" of Japan (Kyuma
and Kawaguchi, 1966), and the "anthrasols"(Dudal and Moorman, 1964) that form in areas
long used for seasonal wetland rice cultivation. Hydromorphism is the common soil forming
process in all these soils.
Surface water gley or pseudogley or inverted gleys are the principal morphological
properties of soils that developed under aquic moisture regime. Dudal (1965) reported the
existence of inverted gley in well drained soils that was used for wetland rice cultivation. When
soils that have a non-aquic moisture regime are brought under wetland rice cultivation by
irrigation, the surface horizons of such soil develop a gleying phenomenon that cultivated gley.
In this case, the morphological properties of an aquic soil moisture regime are imposed on the
upper part of the profiles while the lower horizons reflect the free drainage of the original
profile (Saheed and Hussain, 1996).
Moorman (1980) reported that a large proportion of the rice soils in the major and minor
alluvial plains of south and East Asia belong to various great groups of the Aquents and
Aquepts suborders. He stated that alteration of diagnostic characteristics of may, however, take
place locally in the pedons of wet rice lands which remain submerged for long periods.
Moorman (1978) also noted that in flood plain soils the subsurface horizon may develop neutral
grey colours due to continuous waterlogging and absence of oxygen. This is seen in double and
triple-croped irrigated rice land on fine clayey Inceptisols. Such soils may lose the
characteristics required to classify them as Inceptisols, particularly the diagnostic cambic
horizon, and they may become Aquents.
Moorman (1980) further postulated that the changes in soil moisture regine under paddy
cultivation is most fundamental in moderately well drained soils, where a surface and
subsurface gley developed which is not connected continuously with a subsoil gley. Moorman
and Van Breemen (1978) termed this specific soil moisture regime as anthraquic. In Taxonomic
terms it can be defined as periodic man-induced water saturation of the solum to depth of at
least 40 cm without corresponding periodic water saturation and reduction in the horizons
below. The soil material in the surfacial horizons, submitted to an anthraquic moisture regime
shows the same colours of low chroma in the matrix or in the mottles as defined for the aquic
Chapter II Review of Literature
36 | P a g e
suborder in soil taxonomy (Soil Survey Staff, 1975). The lower horizons, however, do not,
show these low chroma colours, indicating the absence of longer period of water saturation and
reduction. Moorman (1978) made a formal proposal to introduce the term “anthraquic” soil
moisture regime in soil taxonomy.
Hussain and Chowdhury (1980) studied pedochemical properties and genesis of some
soils from the Moribund Ganges delta in Bangladesh. Based on Fe and Mn contents the studied
soils were grouped into two distinct classes. About twenty percent of the total Fe and Mn were
found to occur as free oxides. The mean SiO2/R2O3 molar ratio in these soils was 4.6 which
indicated that the 2:1 minerals are dominant in the clay fraction. Mica constituted one third of
the clay fraction. Pedogenic processes in the soils appeared to be relatively weaker;
decalcification was considered to be the dominant pedogenic process.
Hassan (1984) studied the soil formation in the floodplain areas of Bangladesh and
observed that the soil formation in this region takes place in several stages. Initially, the
sediments have low bulk density and high water content. In the ripening stage moisture is lost
irreversibly resulting in an increase in bulk density. Subsequently, the sediments become
homogenized due to bioturbations. At this stage the formation of soil structure begins due to
alternate seasonal shrinking and swelling caused by wetting and drying in the wet and dry
seasons, respectively soils of this region possess either A-C type profile, or locally an A-(B)-C
type profile. Biotic factors, depending on the duration of dry and wet periods, contribute to the
soil structure formation. Effects of other soil forming factors become diffused due to high
ground water table and jubenility of these soils. It is interesting to note that in most cases, the
attributes of the parent materials dominate the soil properties.
Ali (1994) noted that an anthraquic epipedon forms in the floodplain soils of
Bangladesh under an imposed aquic moisture regime having rice cultivation for a long time.
Mazumder et al. (2010) elucidated from the morphogenesis and characterization of
some soils from the Brahmaputra floodplain of Bangladesh that seasonal submergence and
drying set the conditions of the alternate oxidation and reduction which are the most striking
features of the pedochemical environment in these soils. These alternate wetting and drying
situations hasten the processes of soil profile development. The alternation of wetting and
drying conditions also resulted in the release of iron and manganese from Fe-bearing minerals.
Subsequently, these oxide minerals are accumulated in the form of mottles in various horizons.
They noted that this kind of mobilization and fixation of iron oxide minerals in the form of
mottles in the soils indicates that gley horizon occur in the deeper zone of the soils in the
Chapter II Review of Literature
37 | P a g e
permanent ground water zone. Gleization can possibly be designated as the major pedogenic
processes in these soils. Nizamuddin et al. (2009b), Hossain et al. (2011) also concluded that
gleization seems to be the dominant pedogenic processes in the floodplain soils of Bangladesh.
Khan et al. (2012) studied the three surface-water gley soils from the Meghna
floodplain of Bangladesh and concluded that the presence of gleys, mottles and flood coatings
or gleyans indicates that there was hydromorphism in these soils. The process of
hydromorphism in the soils was mainly attained due to the reduction and/ or loss of iron and
manganese and the development of grey colours. Gley horizons occur in the deeper zone of the
soils in the permanent ground water zone. Gleization ca possibly be designated as the major
pedogenic process in these soils The low exchangeable Ca2+
/Mg2+
ratio, massive structure in
the top soil and structurelessness in the lowermost horizon of these soils also support this fact.
2.2.7.2 Classification of floodplain soils
SRDI Staff (1965-86) while surveying the soils of Mymensingh district found that
almost all floodplain soils have characteristic topsoils which are seasonally wet and gleyed and
have prominent iron staining along root channels. These topsoils consist of a passive or cloddy
plough layer at the surface underlain by a massive and compact Ploughpan. They observed that
the ploughpan, formed in older soils often has strong iron stain at its base. These stains/iron
cutans have been developed by continuous ploughing puddling for rice cultivation and
prolonged seasonal flooding. They commented that these toosoils cannot be correlated
satisfactorily with the diagnostic epipedons described is soil taxonomy.
The above authors further reported that the most of these soils have cambic B vnn
which was identified on the basis of destruction of the alluvial stratification, development of
prismatic or blocky structure, usually with the peds coated by the flood tans and strong
oxidation within the peds. Because of grey mottling and moist colours on ped faces of the soils,
they were classified as Haplaquepts according to the USDA classification system. The soils
having 50% or more matrix colour chroma ≥ 2 within 75 cm depth were classified as Aeric
subgroup. They observed that some profiles of Ghatail series have vertic properties. They are
clayey down to 100 cm or deeper and have some slickensides and wedge shaped peds in the
subsoil. These soils could not be classified in the vertic sub-group because slickensides were
not close enough to intersect and cracks of one cm or more wide at a depth of 50 cm were not
found to develop.
Inceptisols are usually moist and have weakly developed natural soil horizons that do
not represent significant illuviation or eluviation or extreme weathering (Soil Survey Staff,
Chapter II Review of Literature
38 | P a g e
1975). Many of these soils are young, although they are always older than Entisol. These soils
have no spodic, argillic, natric, calcic, gypsic, salic or oxic horizon, but have conductivity of
the saturation extract of less than 2 mmhos/cm at 25°C and have one or more of the following:
a histic, umbric or ochric epipedon; a cambic horizon, a fragipan or a duripan. These soils have
an appreciable accumulation of organic matter and there must be some evidence that the parent
materials have been 'sufficiently altered by Agenesis (Hussain, 1992; Soil Survey Staff, 1994).
Murthy et al. (1962) examined the morphological characteristics of four soil profiles
from the alluvial soils in the Ganges river plains of Central Uttar Pradesh and ordering to the
USDA soil classification system they put some of them in the great group and others into the
Haplaquoll great group as these have very the pH due to their drainage impedance.
Floodplain soils that are used for rice cultivation have been considered as artificial
hydromorphic soils (Kanno, 1962), an anthraquic great soil group (Dudal and Moormann,
1964), anthropic subgroup of the great soil groups (Dudal, 1965), aquorizems (Kyuma and
Kawaguchi, 1966), land use phases of original hydraquic sub-groups (Ottowa, 1973) and
lowland paddy soils (Mitsuchi, 1974). According to Mohr et al. (1972) the rice soils in south
and Southeast Asia and Japan are diverse and have been classified into seven soil orders of US
soil taxonomy, such as Entisols, Inceptisols, Vertisols, Alfisols, Ultisols, Oxisols and Histosols.
Kanno (1978) commented that the soils whose properties have been greatly changed by
rice cultivation should be classified as independent great group, whereas the rice soils in which
the inherent characteristics of the preceding soils have been dominantly maintained should be
classified as the sub-groups of the preceding great group.
Paramananthan (1978) stated that the areas where wetland rice was traditionally
cultivated were alluvial soils and floodplains or simply as rice growing areas. Rice grwoing
soils in Malayasia have not been classified beyond subgroup level. According to the
classification of Thorp and Smith (1949) most of the soils would be classified as Low gleys and
in the Hydromorphous sub-order of Intrazonal soils
According to Paramananthan (1978), most of the rice soils of Malaysia fall into the two
sub-orders of US Soil taxonomy. These sub-orders are: Aquent and Aquepts. A few of the soils
fell into the order Ultisols.
SRDI Staff (1965-1986) correlated Melandaha and Dhamrai series as Typic
Haplaquepts; Silmandi, Sonatala, Lokdeo and Ghatail series as Aerie Haplaquepts and Sherpur
series as Aquic Ustochrepts in the USDA soil taxonomic system. Zijsvelt (1980) and Hussain,
(1992) attempted to correlate the major soil series of Bangladesh into the family category.
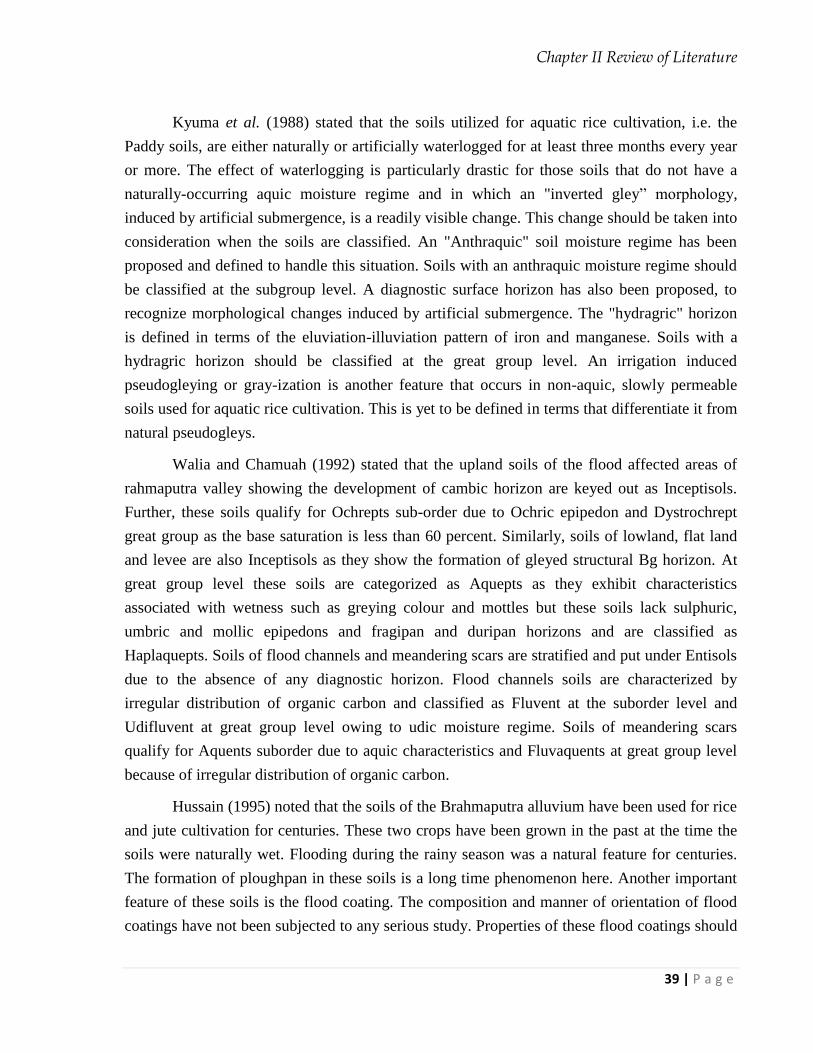
Chapter II Review of Literature
39 | P a g e
Kyuma et al. (1988) stated that the soils utilized for aquatic rice cultivation, i.e. the
Paddy soils, are either naturally or artificially waterlogged for at least three months every year
or more. The effect of waterlogging is particularly drastic for those soils that do not have a
naturally-occurring aquic moisture regime and in which an "inverted gley” morphology,
induced by artificial submergence, is a readily visible change. This change should be taken into
consideration when the soils are classified. An "Anthraquic" soil moisture regime has been
proposed and defined to handle this situation. Soils with an anthraquic moisture regime should
be classified at the subgroup level. A diagnostic surface horizon has also been proposed, to
recognize morphological changes induced by artificial submergence. The "hydragric" horizon
is defined in terms of the eluviation-illuviation pattern of iron and manganese. Soils with a
hydragric horizon should be classified at the great group level. An irrigation induced
pseudogleying or gray-ization is another feature that occurs in non-aquic, slowly permeable
soils used for aquatic rice cultivation. This is yet to be defined in terms that differentiate it from
natural pseudogleys.
Walia and Chamuah (1992) stated that the upland soils of the flood affected areas of
rahmaputra valley showing the development of cambic horizon are keyed out as Inceptisols.
Further, these soils qualify for Ochrepts sub-order due to Ochric epipedon and Dystrochrept
great group as the base saturation is less than 60 percent. Similarly, soils of lowland, flat land
and levee are also Inceptisols as they show the formation of gleyed structural Bg horizon. At
great group level these soils are categorized as Aquepts as they exhibit characteristics
associated with wetness such as greying colour and mottles but these soils lack sulphuric,
umbric and mollic epipedons and fragipan and duripan horizons and are classified as
Haplaquepts. Soils of flood channels and meandering scars are stratified and put under Entisols
due to the absence of any diagnostic horizon. Flood channels soils are characterized by
irregular distribution of organic carbon and classified as Fluvent at the suborder level and
Udifluvent at great group level owing to udic moisture regime. Soils of meandering scars
qualify for Aquents suborder due to aquic characteristics and Fluvaquents at great group level
because of irregular distribution of organic carbon.
Hussain (1995) noted that the soils of the Brahmaputra alluvium have been used for rice
and jute cultivation for centuries. These two crops have been grown in the past at the time the
soils were naturally wet. Flooding during the rainy season was a natural feature for centuries.
The formation of ploughpan in these soils is a long time phenomenon here. Another important
feature of these soils is the flood coating. The composition and manner of orientation of flood
coatings have not been subjected to any serious study. Properties of these flood coatings should
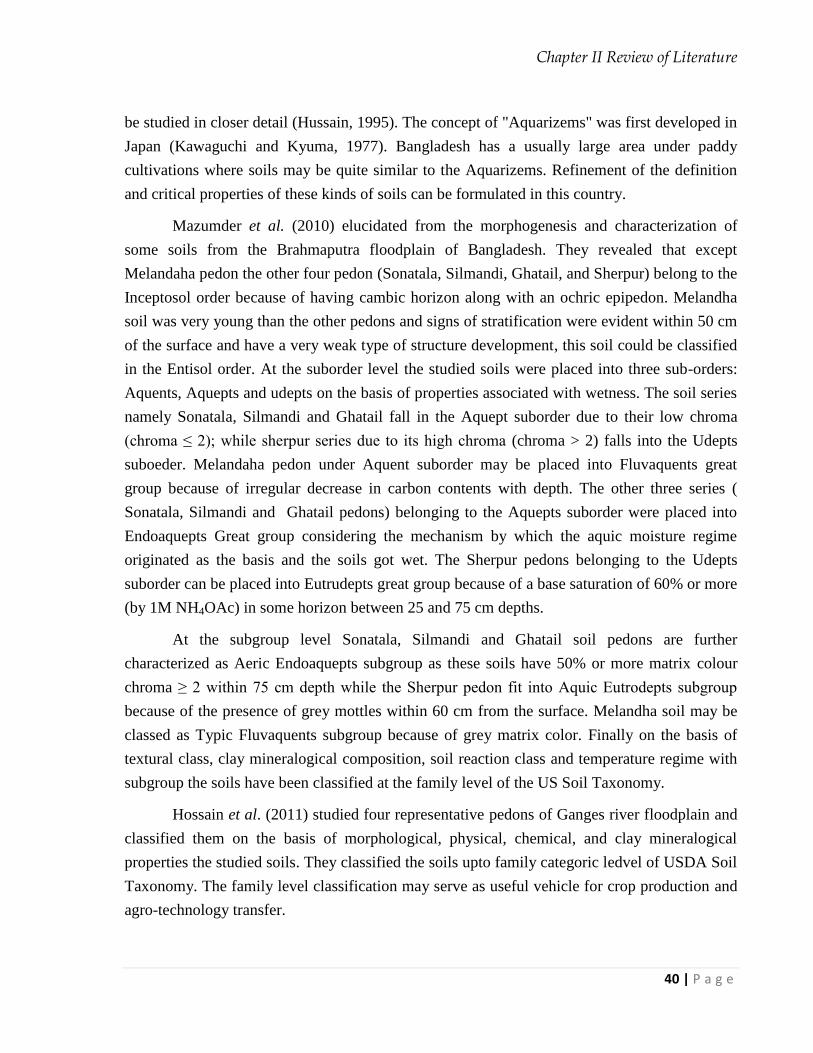
Chapter II Review of Literature
40 | P a g e
be studied in closer detail (Hussain, 1995). The concept of "Aquarizems" was first developed in
Japan (Kawaguchi and Kyuma, 1977). Bangladesh has a usually large area under paddy
cultivations where soils may be quite similar to the Aquarizems. Refinement of the definition
and critical properties of these kinds of soils can be formulated in this country.
Mazumder et al. (2010) elucidated from the morphogenesis and characterization of
some soils from the Brahmaputra floodplain of Bangladesh. They revealed that except
Melandaha pedon the other four pedon (Sonatala, Silmandi, Ghatail, and Sherpur) belong to the
Inceptosol order because of having cambic horizon along with an ochric epipedon. Melandha
soil was very young than the other pedons and signs of stratification were evident within 50 cm
of the surface and have a very weak type of structure development, this soil could be classified
in the Entisol order. At the suborder level the studied soils were placed into three sub-orders:
Aquents, Aquepts and udepts on the basis of properties associated with wetness. The soil series
namely Sonatala, Silmandi and Ghatail fall in the Aquept suborder due to their low chroma
(chroma ≤ 2); while sherpur series due to its high chroma (chroma > 2) falls into the Udepts
suboeder. Melandaha pedon under Aquent suborder may be placed into Fluvaquents great
group because of irregular decrease in carbon contents with depth. The other three series (
Sonatala, Silmandi and Ghatail pedons) belonging to the Aquepts suborder were placed into
Endoaquepts Great group considering the mechanism by which the aquic moisture regime
originated as the basis and the soils got wet. The Sherpur pedons belonging to the Udepts
suborder can be placed into Eutrudepts great group because of a base saturation of 60% or more
(by 1M NH4OAc) in some horizon between 25 and 75 cm depths.
At the subgroup level Sonatala, Silmandi and Ghatail soil pedons are further
characterized as Aeric Endoaquepts subgroup as these soils have 50% or more matrix colour
chroma ≥ 2 within 75 cm depth while the Sherpur pedon fit into Aquic Eutrodepts subgroup
because of the presence of grey mottles within 60 cm from the surface. Melandha soil may be
classed as Typic Fluvaquents subgroup because of grey matrix color. Finally on the basis of
textural class, clay mineralogical composition, soil reaction class and temperature regime with
subgroup the soils have been classified at the family level of the US Soil Taxonomy.
Hossain et al. (2011) studied four representative pedons of Ganges river floodplain and
classified them on the basis of morphological, physical, chemical, and clay mineralogical
properties the studied soils. They classified the soils upto family categoric ledvel of USDA Soil
Taxonomy. The family level classification may serve as useful vehicle for crop production and
agro-technology transfer.
CHAPTER-3
MATERIALS AND METHODS
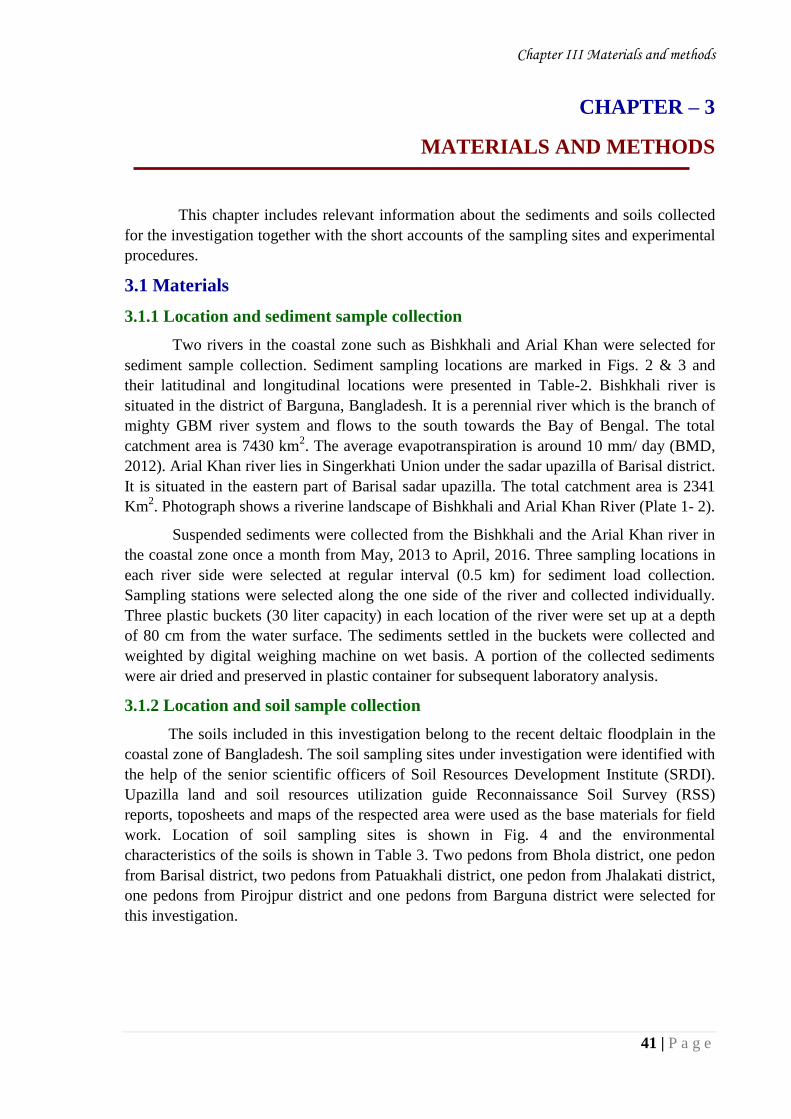
Chapter III Materials and methods
41 | P a g e
CHAPTER – 3
MATERIALS AND METHODS
This chapter includes relevant information about the sediments and soils collected
for the investigation together with the short accounts of the sampling sites and experimental
procedures.
3.1 Materials
3.1.1 Location and sediment sample collection
Two rivers in the coastal zone such as Bishkhali and Arial Khan were selected for
sediment sample collection. Sediment sampling locations are marked in Figs. 2 & 3 and
their latitudinal and longitudinal locations were presented in Table-2. Bishkhali river is
situated in the district of Barguna, Bangladesh. It is a perennial river which is the branch of
mighty GBM river system and flows to the south towards the Bay of Bengal. The total
catchment area is 7430 km2. The average evapotranspiration is around 10 mm/ day (BMD,
2012). Arial Khan river lies in Singerkhati Union under the sadar upazilla of Barisal district.
It is situated in the eastern part of Barisal sadar upazilla. The total catchment area is 2341
Km2. Photograph shows a riverine landscape of Bishkhali and Arial Khan River (Plate 1- 2).
Suspended sediments were collected from the Bishkhali and the Arial Khan river in
the coastal zone once a month from May, 2013 to April, 2016. Three sampling locations in
each river side were selected at regular interval (0.5 km) for sediment load collection.
Sampling stations were selected along the one side of the river and collected individually.
Three plastic buckets (30 liter capacity) in each location of the river were set up at a depth
of 80 cm from the water surface. The sediments settled in the buckets were collected and
weighted by digital weighing machine on wet basis. A portion of the collected sediments
were air dried and preserved in plastic container for subsequent laboratory analysis.
3.1.2 Location and soil sample collection
The soils included in this investigation belong to the recent deltaic floodplain in the
coastal zone of Bangladesh. The soil sampling sites under investigation were identified with
the help of the senior scientific officers of Soil Resources Development Institute (SRDI).
Upazilla land and soil resources utilization guide Reconnaissance Soil Survey (RSS)
reports, toposheets and maps of the respected area were used as the base materials for field
work. Location of soil sampling sites is shown in Fig. 4 and the environmental
characteristics of the soils is shown in Table 3. Two pedons from Bhola district, one pedon
from Barisal district, two pedons from Patuakhali district, one pedon from Jhalakati district,
one pedons from Pirojpur district and one pedons from Barguna district were selected for
this investigation.
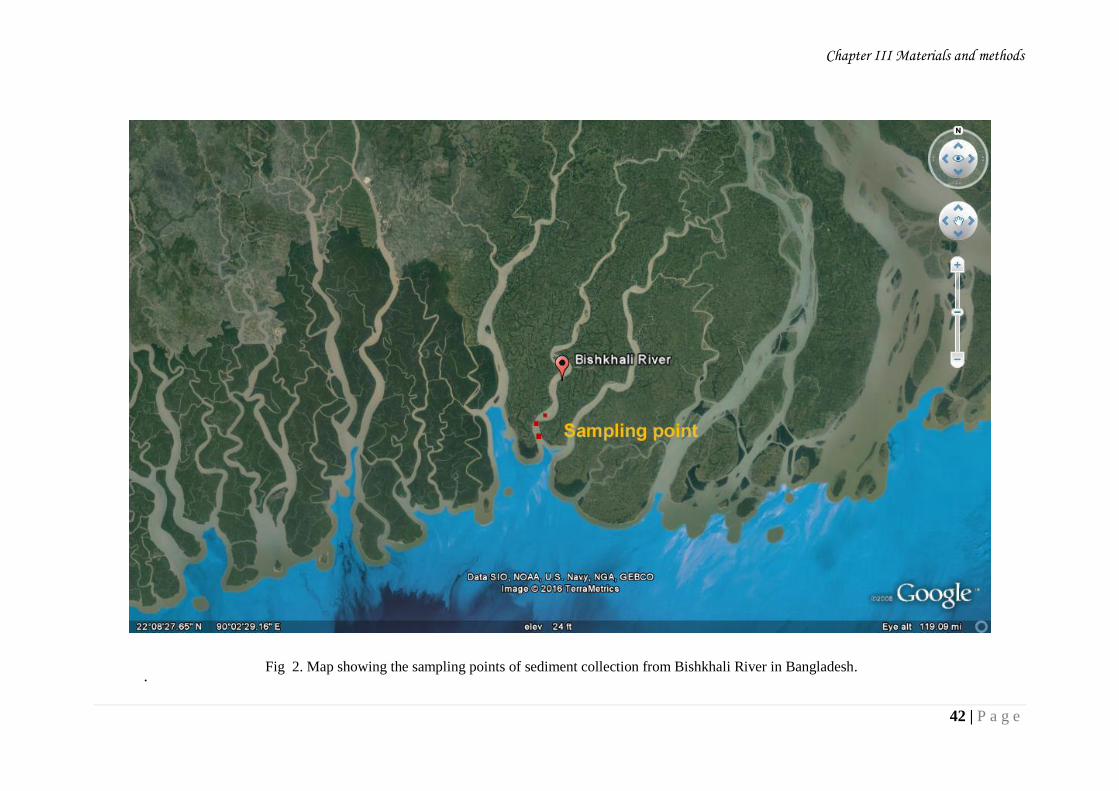
Chapter III Materials and methods
42 | P a g e
. Fig 2. Map showing the sampling points of sediment collection from Bishkhali River in Bangladesh.
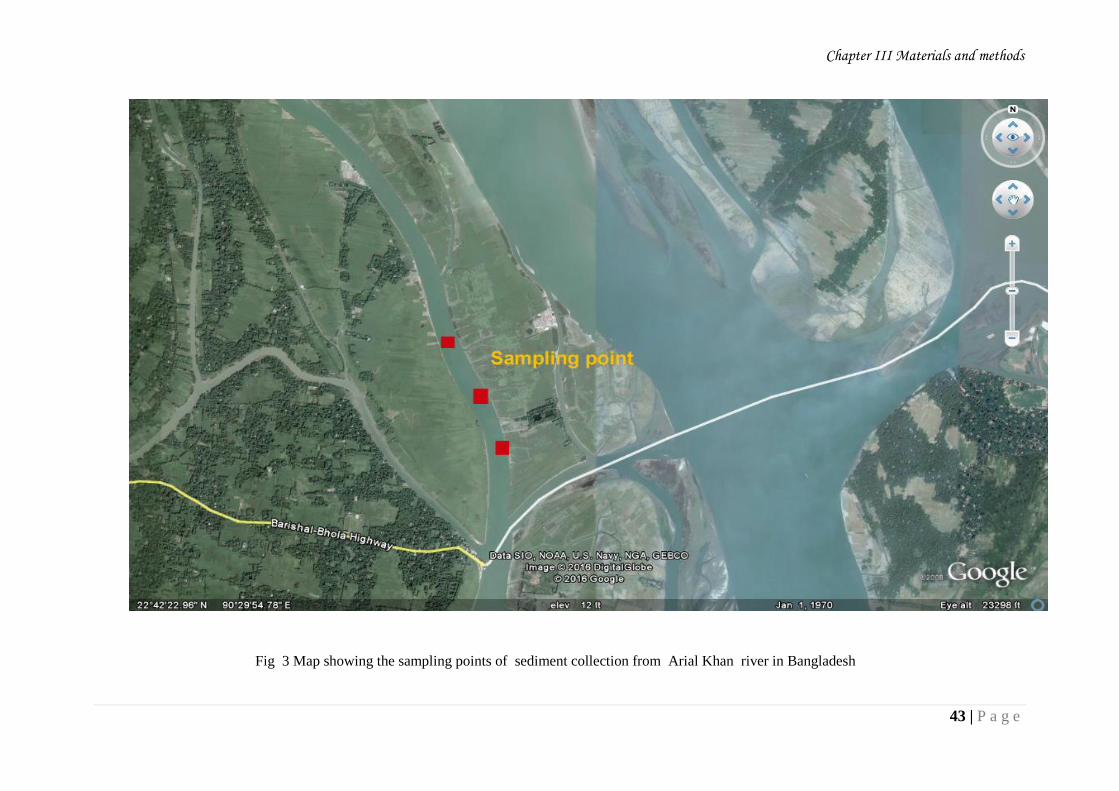
Chapter III Materials and methods
43 | P a g e
Fig 3 Map showing the sampling points of sediment collection from Arial Khan river in Bangladesh
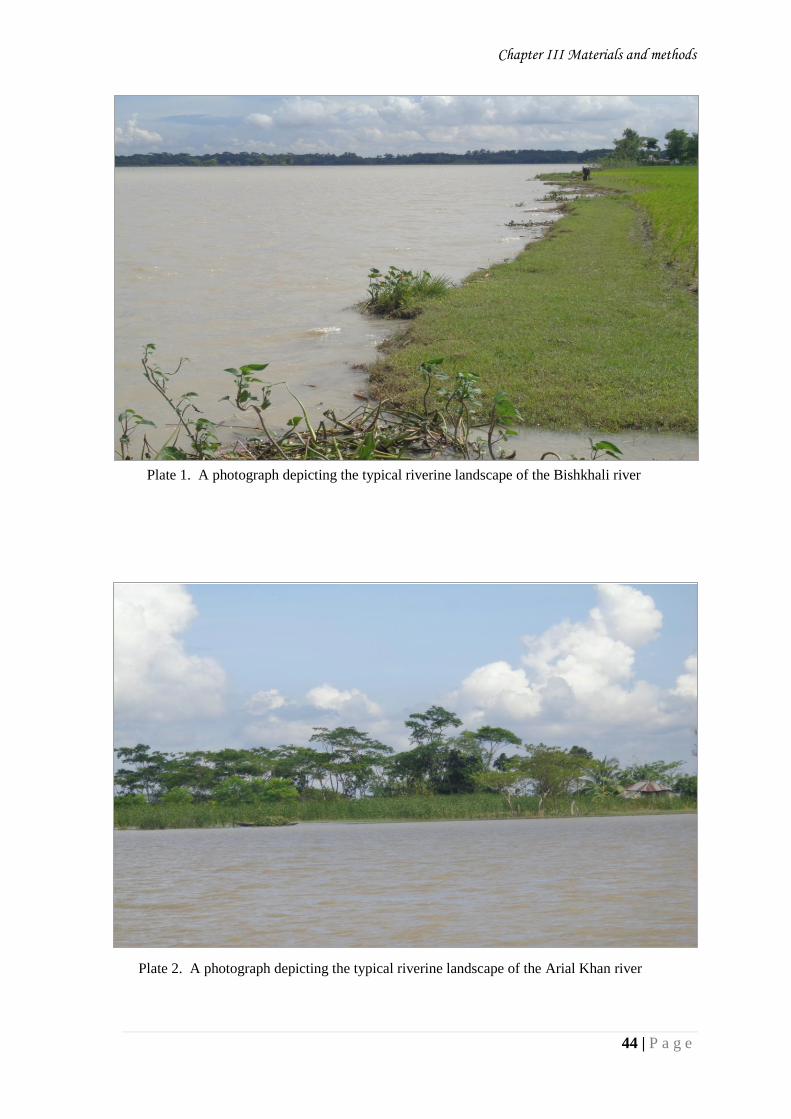
Chapter III Materials and methods
44 | P a g e
Plate 1. A photograph depicting the typical riverine landscape of the Bishkhali river
Plate 2. A photograph depicting the typical riverine landscape of the Arial Khan river
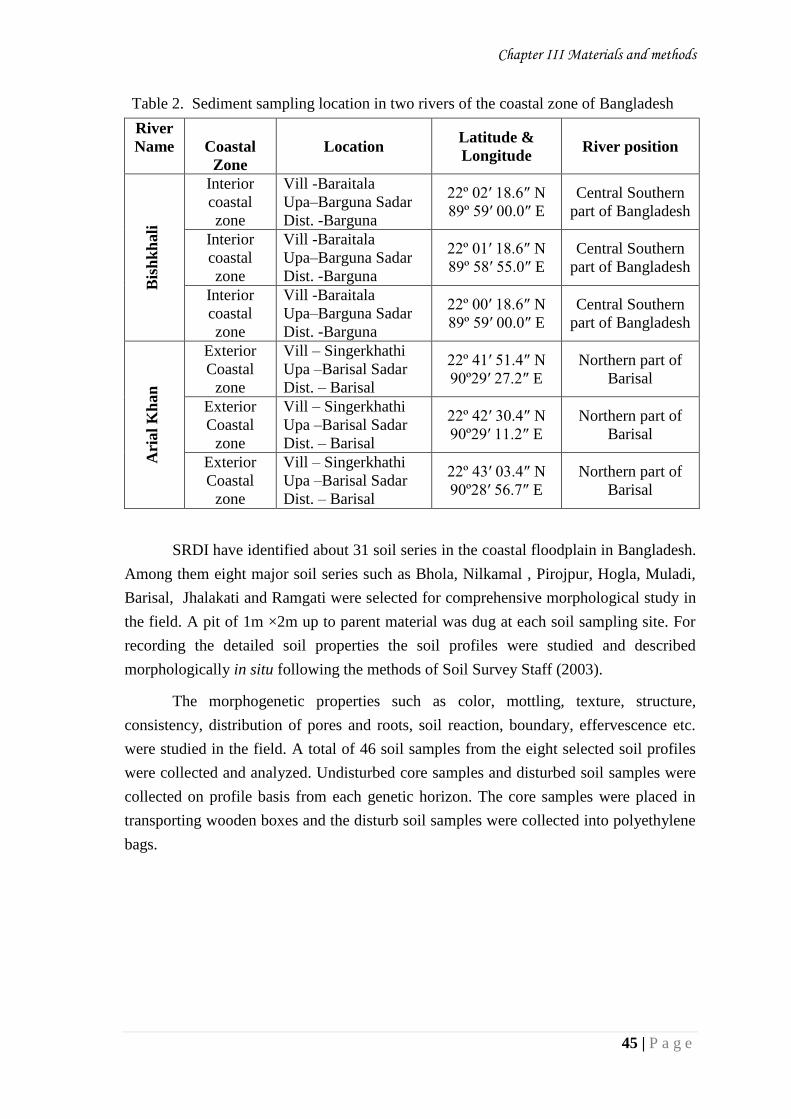
Chapter III Materials and methods
45 | P a g e
Table 2. Sediment sampling location in two rivers of the coastal zone of Bangladesh
River
Name
Coastal
Zone
Location Latitude &
Longitude River position
Bis
hk
hali
Interior
coastal
zone
Vill -Baraitala
Upa–Barguna Sadar
Dist. -Barguna
22º 02′ 18.6″ N
89º 59′ 00.0″ E
Central Southern
part of Bangladesh
Interior
coastal
zone
Vill -Baraitala
Upa–Barguna Sadar
Dist. -Barguna
22º 01′ 18.6″ N
89º 58′ 55.0″ E
Central Southern
part of Bangladesh
Interior
coastal
zone
Vill -Baraitala
Upa–Barguna Sadar
Dist. -Barguna
22º 00′ 18.6″ N
89º 59′ 00.0″ E
Central Southern
part of Bangladesh
Ari
al
Kh
an
Exterior
Coastal
zone
Vill – Singerkhathi
Upa –Barisal Sadar
Dist. – Barisal
22º 41′ 51.4″ N
90º29′ 27.2″ E
Northern part of
Barisal
Exterior
Coastal
zone
Vill – Singerkhathi
Upa –Barisal Sadar
Dist. – Barisal
22º 42′ 30.4″ N
90º29′ 11.2″ E
Northern part of
Barisal
Exterior
Coastal
zone
Vill – Singerkhathi
Upa –Barisal Sadar
Dist. – Barisal
22º 43′ 03.4″ N
90º28′ 56.7″ E
Northern part of
Barisal
SRDI have identified about 31 soil series in the coastal floodplain in Bangladesh.
Among them eight major soil series such as Bhola, Nilkamal , Pirojpur, Hogla, Muladi,
Barisal, Jhalakati and Ramgati were selected for comprehensive morphological study in
the field. A pit of 1m ×2m up to parent material was dug at each soil sampling site. For
recording the detailed soil properties the soil profiles were studied and described
morphologically in situ following the methods of Soil Survey Staff (2003).
The morphogenetic properties such as color, mottling, texture, structure,
consistency, distribution of pores and roots, soil reaction, boundary, effervescence etc.
were studied in the field. A total of 46 soil samples from the eight selected soil profiles
were collected and analyzed. Undisturbed core samples and disturbed soil samples were
collected on profile basis from each genetic horizon. The core samples were placed in
transporting wooden boxes and the disturb soil samples were collected into polyethylene
bags.
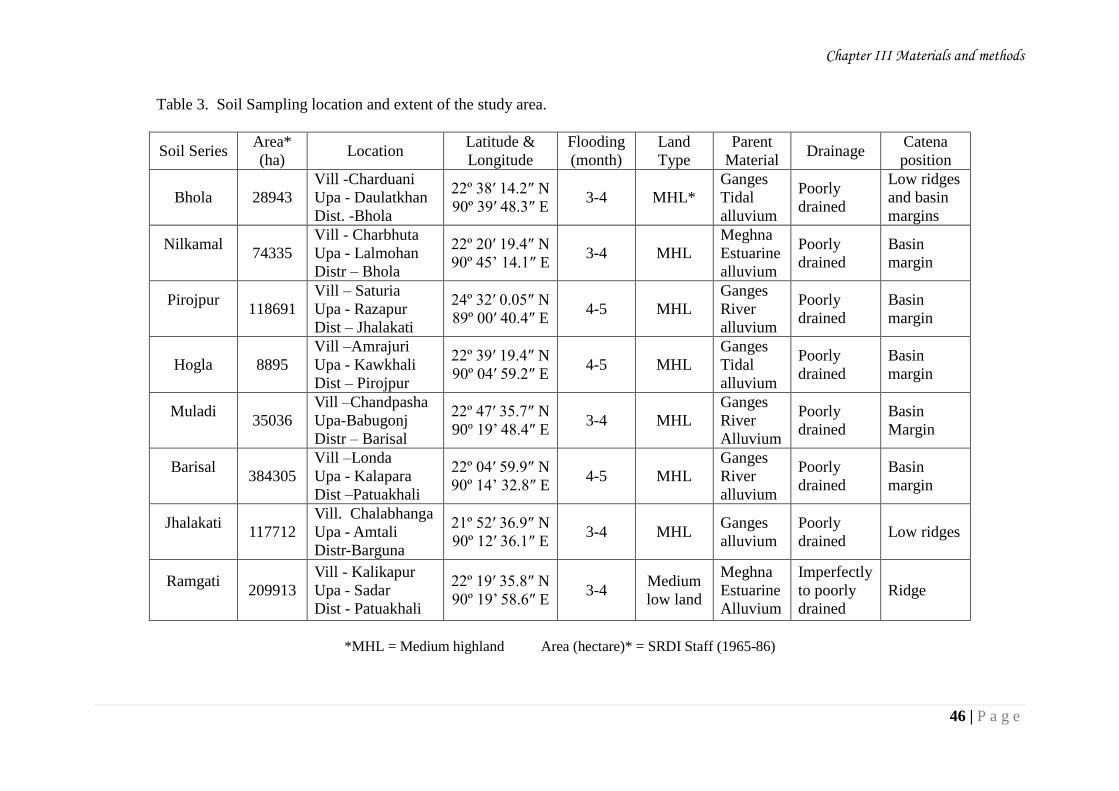
Chapter III Materials and methods
46 | P a g e
Table 3. Soil Sampling location and extent of the study area.
Soil Series Area*
(ha) Location
Latitude &
Longitude
Flooding
(month)
Land
Type
Parent
Material Drainage
Catena
position
Bhola 28943
Vill -Charduani
Upa - Daulatkhan
Dist. -Bhola
22º 38′ 14.2″ N
90º 39′ 48.3″ E 3-4 MHL*
Ganges
Tidal
alluvium
Poorly
drained
Low ridges
and basin
margins
Nilkamal
74335
Vill - Charbhuta
Upa - Lalmohan
Distr – Bhola
22º 20′ 19.4″ N
90º 45’ 14.1″ E 3-4 MHL
Meghna
Estuarine
alluvium
Poorly
drained
Basin
margin
Pirojpur
118691
Vill – Saturia
Upa - Razapur
Dist – Jhalakati
24º 32′ 0.05″ N
89º 00′ 40.4″ E 4-5 MHL
Ganges
River
alluvium
Poorly
drained
Basin
margin
Hogla 8895
Vill –Amrajuri
Upa - Kawkhali
Dist – Pirojpur
22º 39′ 19.4″ N
90º 04′ 59.2″ E 4-5 MHL
Ganges
Tidal
alluvium
Poorly
drained
Basin
margin
Muladi
35036
Vill –Chandpasha
Upa-Babugonj
Distr – Barisal
22º 47′ 35.7″ N
90º 19’ 48.4″ E 3-4 MHL
Ganges
River
Alluvium
Poorly
drained
Basin
Margin
Barisal
384305
Vill –Londa
Upa - Kalapara
Dist –Patuakhali
22º 04′ 59.9″ N
90º 14’ 32.8″ E 4-5 MHL
Ganges
River
alluvium
Poorly
drained
Basin
margin
Jhalakati
117712
Vill. Chalabhanga
Upa - Amtali
Distr-Barguna
21º 52′ 36.9″ N
90º 12′ 36.1″ E 3-4 MHL
Ganges
alluvium
Poorly
drained Low ridges
Ramgati
209913
Vill - Kalikapur
Upa - Sadar
Dist - Patuakhali
22º 19′ 35.8″ N
90º 19’ 58.6″ E 3-4
Medium
low land
Meghna
Estuarine
Alluvium
Imperfectly
to poorly
drained
Ridge
*MHL = Medium highland Area (hectare)* = SRDI Staff (1965-86)
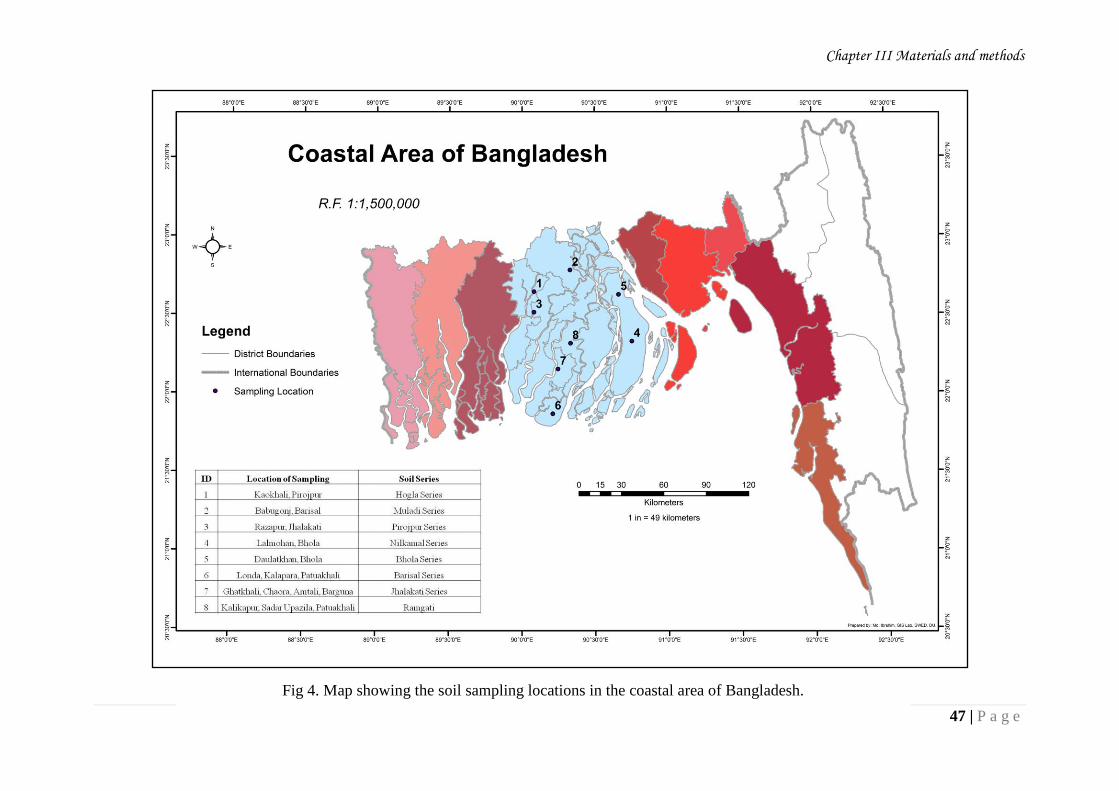
Chapter III Materials and methods
47 | P a g e
Fig 4. Map showing the soil sampling locations in the coastal area of Bangladesh.
Chapter III Materials and methods
48 | P a g e
Prior to laboratory analyses, the collected soil samples were spread on a piece of polythene
paper and big lumps were broken and air dried under shade. The air dried soil samples were
ground in a mortar and pestle and pass the ground soil sample through a 2 mm sieve and
mixed thoroughly.
The sieved soil was then stored into a plastic container. Each container was labeled to show
the location, depth, sample number and date of collection and stored the containers in a cool
dry place in the laboratory for laboratory analysis.
3.2 Laboratory methods
Some important physical, chemical and mineralogical properties of the sediment and
soil samples were analyzed. Most of the methods employed in the present study were
published procedures. A brief outline of each procedure has been given in all cases.
3.2.1 Physical analyses of sediments and soils
i) Particle size analysis of sediments and soils: Particle size analysis of sediment
and soil was carried out in the laboratory following the Hydrometer method as described by
Day (1965). Marshall’s triangular co-ordinate system as devised by the United States
Department of Agriculture (USDA, 1951) was used to determine the textural class.
ii) Moisture content: The percentage of moisture in soil was determined by drying a
known amount of soil in an oven at 105˚c for 24 hours until a constant weight was
obtained and the moisture percentage was calculated from loss of moisture (Black, 1965).
iii) Particle density (Dp): Particle density of sediment and soil was determined by
Pycnometer method as described by Black (1965).
iv) Total porosity (f): Total porosity of soil was calculated from the data of particle
density and bulk density using the formula as described by Stricking (1956) which is stated
below:
% Porosity = 1 - (density particle
densitybulk ) × 100.
v) Hygroscopic moisture: Hygroscopic moisture content of the soils was determined
in laboratory by drying the air-dry soil in an oven at 105°C for 24 hours.
3.2.2 Chemical analyses of sediments and soils
i) Soil reaction (pH): pH of the sediment and soil samples was determined with a
Lovibond pH meter (model pH200) at a sediment/ soil: water ratio of 1:2.5. pH also was
determined with 1 N KCl solution using the same soil : solution ratio as above. The ∆pH
values were calculated by subtracting pH with water from pH with 1N KCl solution.

Chapter III Materials and methods
49 | P a g e
ii) Organic carbon: Organic carbon content of the sediment and soil sample was
determined volumetrically by wet oxidation and rapid titration method of Walkley and
Black (1934) as described by Jackson (1964). Total organic matter content was estimated by
multiplying the percentage of organic carbon with the conventional “Van Bemmelen’s
factor of 1.723.
iii) Total Nitrogen: Total nitrogen in both the sediments and soils were determined
by kjeldahl’s distillation method as described by Page (1982).
iv) Free oxides of iron and manganese: Free oxides of iron (Fed) and
manganese(Mnd) were extracted by sodium dithionate-citrate system buffered with sodium
bicarbonate as described by Mehra and Jackson (1960).The extracted iron and manganese
were determined by atomic absorption spectrophotometer.
v) Electrical conductivity: Electrical conductivity was determined with a ratio of
soil: water 1:5 by using an EC meter (USSL Staff, 1954).
vi) Free CaCO3: Rapid titration method was followed for the determination of the
free calcium carbonate in both the sediments and soils (Piper, 1966).
vi) Loss on ignition (LOI): Loss on ignition of soils and clays samples was
determined by using muffle furnace after ignition of soils and clay samples for 2 hours at
900˚ C (Piper, 1966).
3.2.3 Physico-chemical analyses of sediments and soils
i) Cation exchange capacity (CEC): Cation exchange capacity (CEC) was
determined by 1N NH4OAc solution buffered at pH 7.0 (Chapman and Pratt, 1965).
ii) Exchangeable bases: Exchangeable bases (Na+, K
+, Ca
2+and Mg
2+) were
determined from the 1 N ammonium acetate leachate of the soils as described by Jackson
(1962). The Ca2+
and Mg2+
ions were determined by atomic absorption spectrophotometer,
while Na+
and K+ were analyzed by a Gallencamp flame photometer (Black, 1965).
iii) Base saturation percentage (BSP): The base saturation percentage was
calculated by using the following formula.
BSP = (capacity exchangeCation
bases leexchangeab Total) × 100
Chapter III Materials and methods
50 | P a g e
3.2.4 Fusion analyses of sediments, whole soils and clay fractions
Fusion analysis entails the determination of the total elemental estimate of the
inorganic components of the sediments, soils and clays by fusion method. This analysis was
carried out by Na2CO3 fusion method as devised by Piper (1966) and Jackson (1967).
i) Silica (SiO2): Silica in both sediment and soil samples was determined by the
method of silicate analyses proposed by Jackson (1967), which involves sodium carbonate
fusion, double evaporation of the HCl extract of the fuse and dehydrate, ignition and
purification by HCl acid.
ii) Total phosphorus (P2O5): Total phosphorus content in the extract was
determined by Shimadzu spectrophotometer (UV-120-02 model) at 460 mµ wavelengths,
after developing yellow color with molybdate- vandate, as described by Jackson (1967).
iii) Total potassium (K2O): Total potassium was determined by a Gallenkamp
flame photometer (Jackson, 1967).
iv)Total titanium (TiO2): Titanium was determined colorimetrically by developing
yellow colour with 30% H2O2 (Black, 1965).
v) Total Aluminium, Iron, manganese, calcium and magnesium: Total
aluminium, iron, .manganese, calcium and magnesium were determined from sodium
carbonate fusion extract of the sediments, soils and clays as described by Jackson (1967).
3.2.5 Methods of mineralogical analyses of clay fraction
Soil sample representing Ap horizon (surface) from each soil profiles were selected
for the mineralogical analysis of clay fraction. X-ray diffraction (XRD) analysis was done
for the determination of mineralogical composition.
3.2.5.1 X-ray diffraction (XRD) analysis of clay fraction:
i) Dispersion and Separation of Clay fraction: To concentrate clay fraction the soil were
thoroughly dispersed. To achieve successful dispersion the following pretreatments were
used for the removal of flocculating and cementing agents.
Removal of carbonate and organic matter: A weighed amount of soil sample was
placed in a tall 600 ml beaker and treated with 30% H2O2 in order to decompose
organic matter (Jackson, 1965). The soil samples were washed twice with 1N
sodium acetate solution (pH 5.0) and once with alcohol.
Removal of free silica and alumina: The soil sample in step 1 was further treated
with 2% Na2CO3 solution to remove out both silica and alumina.
Removal of iron and manganese oxides: Free oxides of Fe and Mn were removed
from soils by citrate bicarbonate dithionite extraction method as described by
Chapter III Materials and methods
51 | P a g e
Jackson (1965). The soil sample was brought into suspension with distilled water
and it was now ready for separation into different size fractions.
The clay fraction was separated by gravitational sedimentation method using sodium
carbonate solution as the dispersing agent. The suspension was stirred and then allowed to
stand for 8 hours for each separation (Day, 1965). The clay fraction was decanted by means
of a siphon. This procedure was repeated until the remaining suspension appeared clear,
after the time needed for silt to settle down to a fixed depth. The separated clay suspension
was flocculated by the addition of 1 N NaCl solution.
ii) Preparation of slide and X-ray diffraction analysis: Specimens for X-ray diffraction of
the clay fraction were prepared by taking duplicate clay sols containing 50 mg of clay were
placed in 10 mL centrifugal tube. Washing by centrifugation and decantation was carried
out twice with 8 ml of an equal mixture of 1 M NaCl and 1M NaCH3COOH (pH 5.0) in
order to decrease the pH of the preserved clay sols. Of the duplicate sets, one was saturated
with K and the other with Mg by washing 3 times with 8 ml of 1M KCl and 0.5 M MgCl2,
respectively. Excess salt was removed by washing once with water. Clay in the tube was
thoroughly suspended with 1 ml of water. An aliquot of 0.4 ml of the suspension was
dropped onto a glass slide (28×48 mm), covering two- third of the area, air dried and X-
rayed (parallel powder mount). XRD patterns were obtained using a Rigaku diffractometer
with Ni- filtered CuKα radiation at 40 kV, 20 mA and at a scanning speed of 2°2θ per
minute over a range of 3 to 35º 2θ. In addition to the air dried specimen, the Mg- saturated
clay specimen was X-rayed after salvation with glycerol, and the K- saturated clay
specimen was x-rayed after heating at 300 and 550°C for 2 hours.
Identification of clay minerals was made mainly on the basis of their characteristic
basal reflections (C- axis length) following the procedure of Jackson (1975). Approximate
mineral composition of the < 2µm clay fraction was estimated based on the relative peak
intensities in the XRD patterns of the random powder mount.The peak intensity was
calculated by multiplying peak height with peak width at half height ( Moslehuddin and
Egashira, 1996). The intensity ratio of two components P and Q in a multi-component
mixture can be related to their weight ratio as follows:
Ip/ Iq = Kp.q (wp/wq)
`Where, Ip and Iq are the intensities of the P and Q components, respectively in
XRD, Kp.q is the constant and wp and wq are the weight proportions of the P and Q
components, respectively (Islam and Lotse, 1986). Since mica was detected in all samples,
all the other minerals were paired with mica and the intensity ratios of all the pairs were
calculated. With application of appropriate values for Kp.q (Egashira and Yasmin, 1990;
Egashira and Watanabe, 1994) listed in Appendix 24, the weight ratios of all the pairs were
Chapter III Materials and methods
52 | P a g e
calculated. Assuming that the sum of the weight ratios is one, the weight proportions of all
the minerals in the clay fraction were obtained.
Dispersion and separation of clay fraction was done in the Pedology Laboratory,
Department of Soil, Water and Environment, University of Dhaka and slide preparation was
done in the Laboratory of Soil Science Department, Bangladesh Agricultural University,
Mymenshing. XRD patterns were obtained using a Rigaku X-ray diffractometer in the
Laboratory of Environmental Geochemistry, Division of Bioproduction Environmental
Science, Department of Agro-environmental Science, Faculty of Agriculture, Kyushu
University, Fukuoka 812-8581, Japan.
CHAPTER-4
ENVIRONMENTAL SETTINGS
Chapter IV Environmental Settings of the Study Area
53 | P a g e
CHAPTER – 4
ENVIRONMENTAL SETTINGS AND FIELD INVESTIGATION OF THE SOILS
This chapter deals with different aspects of soil environment which is vitally
necessary for the correct assessment of the finding of any pedological work. With this view
an attempt has been made to trace the available environmental information. Brief
morphological description of the soils studied in the field has also been included in this
section.
4.1 Environmental settings of the soils
4.1.1 Climate
The climate of the investigated area has been characterized as tropical monsoon
(Manalo, 1975) climate with three main seasons: (i) the monsoon or the rainy season from
June to October. During this time more than 75 percent of the total annual rainfall is
received (ii) the winter season extends from November to February and is cool and rainless.
This season is dry (iii) the pre-monsoon or the hot season extends from March to May
which has the highest temperature and evaporation rates of the year and during which
occasional thunder showers happen.
Within the investigated areas Barisal, Bhola, patuakhali has weather recording
station but Jhalakati, Barguna and Pirojpur has no weather recording station. Hence the
climatic data of Khepupara and Barisal stations, recorded by meteorological department,
can be taken into consideration for the area under investigation.
The climatic data for Barisal, Bhola, Patuakhali and Khepupara station are presented in
Appendix 14 on yearly basis. This indicates that the mean annual rainfall (2012) of the area
under Barisal District is about 1836 mm, Bhola District is about 1484 mm, Patuakhali
District is about 1920 mm and Khepupara Upazila is about 2625 mm and the mean annual
air temperature is about 26.11○C recorded for Barisal; 25.87
○C for Bhola, 26.4
○C for
Patuakhali and 26.31○C for Khepupara are presented in Appendix 15. During the monsoon
month’s rain is frequent and occasionally heavy. The heaviest rainfall occurs in the months
of June to August. In December the area receives the lowest rainfall.
The mean monthly air temperatures vary between about 10.9○C in January and 34.2
○
C in May. The diurnal range in temperature is about 15○C in the dry season (Dec. to March)
and about 6○C in the rainy season (June to September).During the months from May to
October there is surplus of water and from November to April there is water deficit. Mean
monthly humidity is highest during the monsoon months (Appendix 15). The soil
temperature regime has not been determined but is believed to be Hyperthermic. Mean
annual evaporation is 83.4 mm in Barisal, 87.88 mm in Patuakhali, 87.04 in Bhola and
90.41mm in Khepupara. There is thus an excess annual rainfall over evaporation.

Chapter IV Environmental Settings of the Study Area
54 | P a g e
Fig 5. Climatic data and the soil water balance of Barisal.
Fig 6. Climatic data and the soil water balance of Bhola.
Water Surplus
Water Deficit
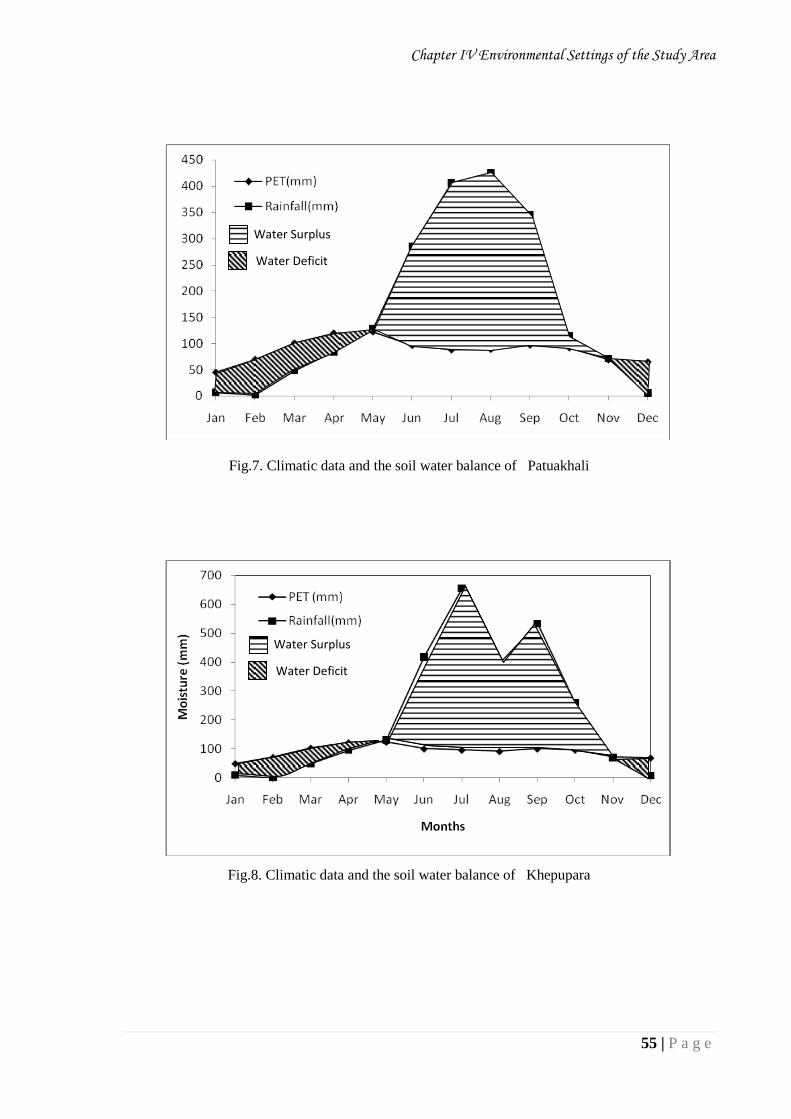
Chapter IV Environmental Settings of the Study Area
55 | P a g e
Fig.7. Climatic data and the soil water balance of Patuakhali
Fig.8. Climatic data and the soil water balance of Khepupara
Water Surplus
Water Deficit
Water Surplus
Water Deficit
Chapter IV Environmental Settings of the Study Area
56 | P a g e
4.1.2 Physiography and geomorphology
The major physiographic unit exists in the studied area were Old Meghna Estuarine
Floodplain, Young Meghna Estuarine Floodplain, Ganges Tidal Floodplain, Ganges River
Floodplain and Lower Meghna River Floodplain. It occupies level landscape with narrow
floodplain ridges and broad shallow basins crisscrossed by an intricate network of tidal
rivers and creeks. Estuarine land in the coastal belt is forming at present in the south of
Noakhali mainland and in the islands of Meghna estuary. The land apparently originates as
Char formations within the open estuary and builds up by slow tidal sedimentation. New
alluvium is still being accumulated near the active river channels.
Rivers change their courses from time to time abandoning and reoccupying various
parts of their floodplains and thus providing sediments of different ages in different areas
and reflect important changes in the river courses that have taken place probably within the
last 1000 years. The islands in the Meghna estuary are constantly changing shape and
position as a result of erosion and new depositions takes place in the island of Bhola district.
The area is under laid by recent and sub-recent alluvia brought down by the Ganges. Their
lithologies are dominated by silt and clay sized particles. Most of the deposits appear to
have been laid down under estuarine or tidal flat conditions and are very finely stratified.
Elevations in the area under study are less than 1.5 m above mean sea level.
4.1.3 Hydrology
The rivers Ganges or Padma and the Brahamaputra or Jamuna and Meghna are the
predominating factors controlling the hydrology of the area under the investigation. Bhola is
virtually an island in the Bay of Bengal surrounded by water bodies on all sides. The rivers
in the investigated areas are tidal throughout the dry season, the daily tidal range decreasing
from south to north. Monsoon season floods push back the tidal limit to about the latitude of
Barisal Town. Water in the rivers is fresh almost to their mouths at the height of the
monsoon season floods, but saline water gradually penetrates inland up the rivers during the
dry season (World Bank,2001).The coastal embankment is designed to prevent salt water
flooding. Flooding is mainly by the accumulation of rain water as well as over- bank
spilling from the rivers. High water level of the rivers prevents escape from extensive areas
of flood water resulting from direct rainfall.
Almost all the areas under the investigation surplus water remained from the month
of April to October (Figs.5 to 8) and are flooded in the rainy season and remain flooded for
several months each year. Depth of flooding is controlled by rivers levels and the ground
water table. In the rainy season the ground water table goes above the surface of the soil. In
the rainy season the ground water table goes above the surface of the soil. The soils in the
area are flooded up to 1-2 feet for up to 3 months on the ridges and up to 2-4 feet deep for
Chapter IV Environmental Settings of the Study Area
57 | P a g e
3-6 months in the basins. In the tidal and young estuarine floodplains the flooding is up to
1-3 feet deep for 3-6 months but flood levels are subject to daily tidal fluctuation.
Drainage in the coastal areas is mainly controlled and regulated by the rivers and
creeks crisscrossing the landscape. These lands are inundated twice a day of varying depths
during high tides. In addition to the protection against regular inundations and salt water
intrusion, the embankments reduce the tidal dynamics. This has an adverse effect on the
drainage conditions (siltation) and the ecosystems (water logging). These negative effects
have already been visible in many places of the coastal belt (EGIS, 1998; BARC, 1996).
4.1.4 Present land use
No natural vegetation is present in the area under the investigation as the land is
under cultivation. Monsoon rainfall is generally sufficient to reduce top soil salinity so that
transplanted aman grown throughout the coastal zone when the salt is washed down below
the rooting zone of the seasonally growing plants. During dry season, the salt comes up near
the soil surface by capillary rise of water, when white crusts of salt appear at the surface
soils.
Cultivation of winter rice (IRRI) has been introduced recently and is becoming
popular gradually. Some Rabi crops like mustard, khesari, gram, lentils are grown on river
bank soils during the winter season especially on the silty soils of Bhola. Present land use in
the coastal areas is of extensive type with insufficient and unbalanced application of
fertilizer. The yield as a result is low which is barely sufficient to meet the needs of the
increasing population. Salinity in these soils varies with the season
4.1.5 Agroecological regions (AEZ)
Bangladesh has thirty agro ecological regions. Three major agro ecological regions (FAO-
UNDP, 1988) have been identified in the studied area. Brief description of these AEZ is
given below:
AEZ 11. Ganges River Floodplain
AEZ 12. Ganges Tidal Floodplain
AEZ 18. Young Meghna Estuarine Floodplain
Ganges River Floodplain
This region comprises the active floodplains of the Ganges river and part of the
lower Meghna river (major subregion Active Ganges Floodplain), and the older and
younger parts of the Ganges meander floodplain. The total area of the region is 23962 km2
(Brammer, 2012). It comprises the greater district of Jessore, and Kustia and parts of
Rajshahi, Pabna, Faridpur, Khulna, Barisal and Dhaka. In general the topography is smooth
but it locally comprises rapidly alternating, linear low ridges and depressions, especially in

Chapter IV Environmental Settings of the Study Area
58 | P a g e
the west. The Ganges River is consistently shifting its course, eroding its banks and
depositing large volume of new alluvium on its beds banks, char lands and floodplains. The
Ganges alluvium is calcareous. Clayey soils predominate in basins and on some ridges. The
substratum is mainly silt, but is sandy in many places of the west. Flooding is mainly deep
and long but becomes shallow and short in the west. Ganges sediments contain a high
content of easily-weather able minerals. They have a high content of smectite in the clay
fraction.
The floodplain is divided into active and moribund deltaic regions. It is a typical
meander floodplain with broad ridges and basins and several large and deep oxbow lakes or
cut- off channels. It locally has irregular relief of series of low narrow linear ridges and in
filled channels. Bank erosion and deposition occur continuously in and around the active
Ganges channels. The sediments are calcarious and rich in feldsper and biotite. The older
soils are decalcified to varying depths.
Ganges Tidal floodplain
Tidal floodplain is formed under the influence of tidal flooding. The materials
carried by the tidal rivers are predominantly fine. The land is flooded by the high tides. The
landscape has a distinctive, almost level, criss-crossed by numerous inter connecting tidal
creeks and rivers. It occupies an area of 16413km2 (Brammer, 2012) covering the entire
tidal coastal land of Barisal, Patuakhali and Khulna region. It differs from the adjoining
meander floodplain in having lower relief of low narrow ridges and shallow broad basins.
The sediments are mainly non-calcarious clays, becoming siltier in the east and have a
burried peat layer in the west. The mangrove forest of sundarbans occupies about 5570 sk.
km in the southwest. Flooding is shallow and tidally affected. Dry season salinity occurs in
the southern part of Patuakhali and in most of khulna region. Acid sulphate soils occur in
the southwest, in areas adjoining the sundarbans
Young Meghna Estuarine Floodplain
The young estuarine floodplain occupies an area 13120 km2 covering the southeast
district of Bhola to Brahamanbaria district. This landscape has been formed by the actions
of the rivers of Meghna. It is almost level land within and adjoining the Meghna estuary
including both island and mainland areas. Here new deposition and erosion are constantly
taking place on the land margins, altering the shape of the land areas and channels. The
sediments are predominantly silty and very fine sandy which are finely stratified and
slightly calcareous.. It is mainly by rainwater or non-saline river water. Occasional storm
surges associated with tropical cyclones affect the area.
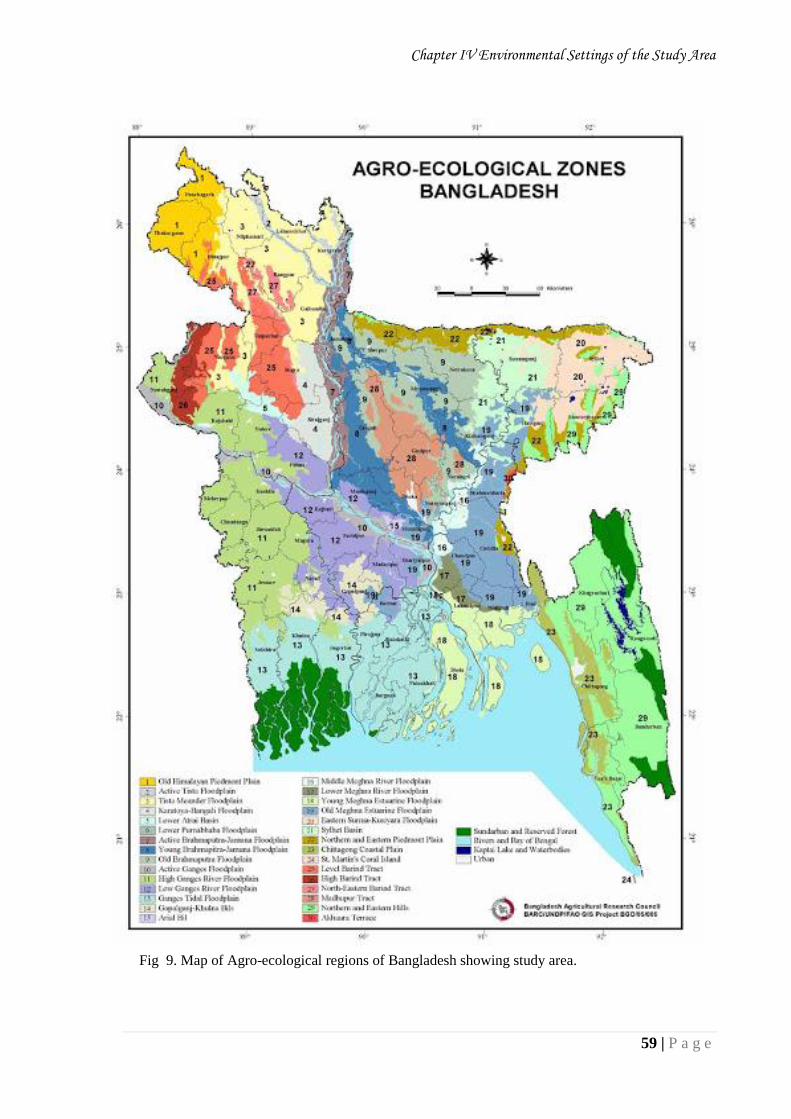
Chapter IV Environmental Settings of the Study Area
59 | P a g e
Fig 9. Map of Agro-ecological regions of Bangladesh showing study area.
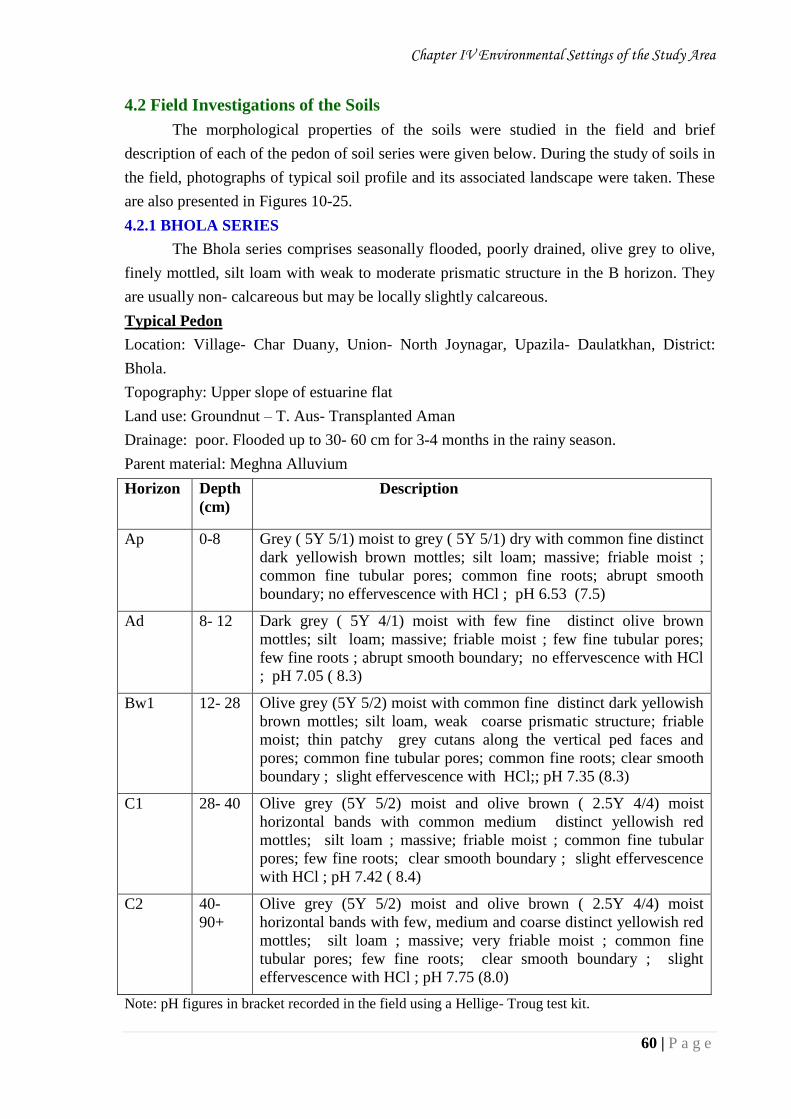
Chapter IV Environmental Settings of the Study Area
60 | P a g e
4.2 Field Investigations of the Soils
The morphological properties of the soils were studied in the field and brief
description of each of the pedon of soil series were given below. During the study of soils in
the field, photographs of typical soil profile and its associated landscape were taken. These
are also presented in Figures 10-25.
4.2.1 BHOLA SERIES
The Bhola series comprises seasonally flooded, poorly drained, olive grey to olive,
finely mottled, silt loam with weak to moderate prismatic structure in the B horizon. They
are usually non- calcareous but may be locally slightly calcareous.
Typical Pedon
Location: Village- Char Duany, Union- North Joynagar, Upazila- Daulatkhan, District:
Bhola.
Topography: Upper slope of estuarine flat
Land use: Groundnut – T. Aus- Transplanted Aman
Drainage: poor. Flooded up to 30- 60 cm for 3-4 months in the rainy season.
Parent material: Meghna Alluvium
Horizon Depth
(cm)
Description
Ap 0-8 Grey ( 5Y 5/1) moist to grey ( 5Y 5/1) dry with common fine distinct
dark yellowish brown mottles; silt loam; massive; friable moist ;
common fine tubular pores; common fine roots; abrupt smooth
boundary; no effervescence with HCl ; pH 6.53 (7.5)
Ad 8- 12
Dark grey ( 5Y 4/1) moist with few fine distinct olive brown
mottles; silt loam; massive; friable moist ; few fine tubular pores;
few fine roots ; abrupt smooth boundary; no effervescence with HCl
; pH 7.05 ( 8.3)
Bw1 12- 28 Olive grey (5Y 5/2) moist with common fine distinct dark yellowish
brown mottles; silt loam, weak coarse prismatic structure; friable
moist; thin patchy grey cutans along the vertical ped faces and
pores; common fine tubular pores; common fine roots; clear smooth
boundary ; slight effervescence with HCl;; pH 7.35 (8.3)
C1 28- 40 Olive grey (5Y 5/2) moist and olive brown ( 2.5Y 4/4) moist
horizontal bands with common medium distinct yellowish red
mottles; silt loam ; massive; friable moist ; common fine tubular
pores; few fine roots; clear smooth boundary ; slight effervescence
with HCl ; pH 7.42 ( 8.4)
C2 40-
90+
Olive grey (5Y 5/2) moist and olive brown ( 2.5Y 4/4) moist
horizontal bands with few, medium and coarse distinct yellowish red
mottles; silt loam ; massive; very friable moist ; common fine
tubular pores; few fine roots; clear smooth boundary ; slight
effervescence with HCl ; pH 7.75 (8.0)
Note: pH figures in bracket recorded in the field using a Hellige- Troug test kit.
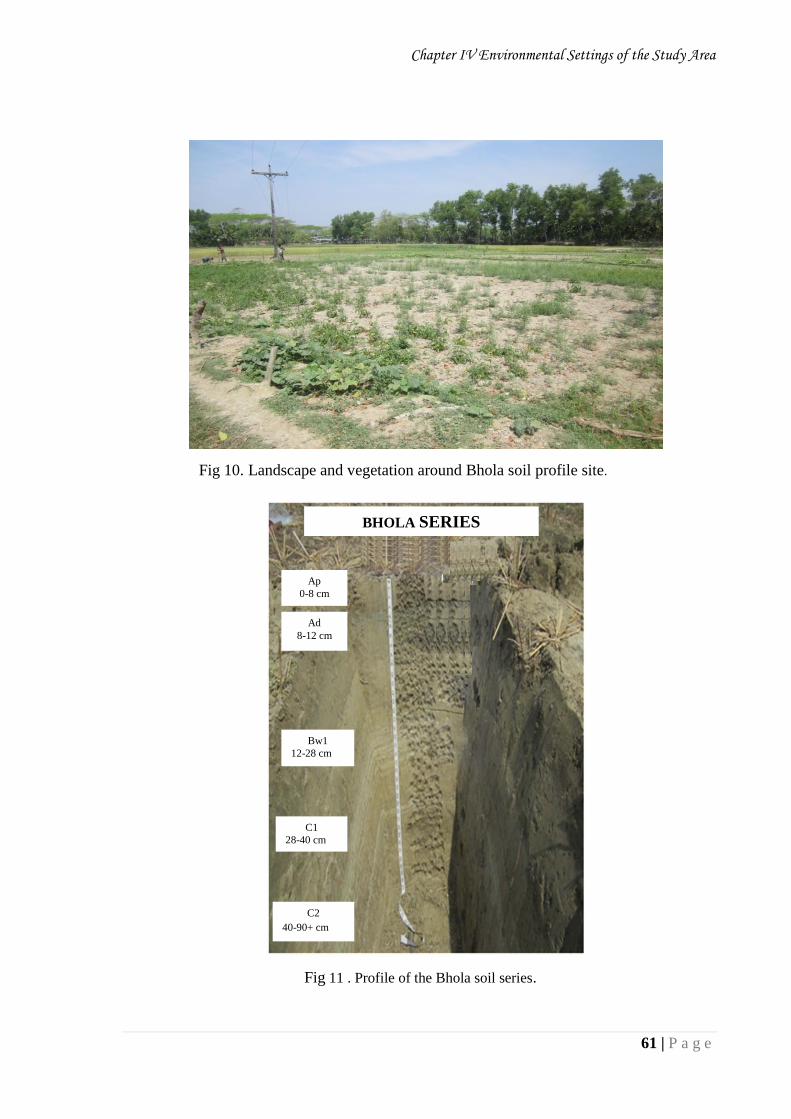
Chapter IV Environmental Settings of the Study Area
61 | P a g e
Fig 11 . Profile of the Bhola soil series.
Fig 10. Landscape and vegetation around Bhola soil profile site.
Ap
0-8 cm
Ad
8-12 cm
Bw1
12-28 cm
C1
28-40 cm
C2
40-90+ cm
BHOLA SERIES

Chapter IV Environmental Settings of the Study Area
62 | P a g e
4.2.2 NILKAMAL SERIES
The Nilkamal series comprises seasonally flooded, poorly drained, grey to olive grey, finely
mottled, slightly calcarious silt loam topsoil overlying an olive, firm, silt loam to silty clay
loam subsoil with weak to moderate very coarse prismatic structure and broken moderately
thick grey cutans on vertical ped faces. They are non- saline to moderately saline.
Typical Pedon
Location: Village- Char Bhuta, Union- Char Bhuta, Upazila- Lalmohan, District: Bhola
Topography: Very gently undulating levee
Land use: T.Aman – fallow- Transplanted Aman
Drainage: poor. Flooded up to 60- 90 cm during low tide and 3- 4 feet during high tide for
3- 4 months in the rainy season.
Parent material: Meghna Alluvium
Horizon Depth
(cm)
Description
Ap 0-13 Grey ( 5Y 5/1) moist with few fine faint yellowish brown mottles;
silt loam; massive; firm moist ; common fine tubular pores; common
fine roots ; clear smooth boundary; slight effervescence with HCl ;
pH 6.68 (8.2)
Ad 13- 18
Grey ( 5Y 5/1) moist to grey (5Y6/1) dry with many fine distinct
olive brown mottles; silt loam; massive; firm moist ; common fine
tubular pores; common fine roots ; abrupt smooth boundary; no
effervescence with HCl ; pH 7.37 ( 8.0)
Bw1 18- 45 Olive (5Y 5/3) moist with common fine distinct dark yellowish brown
mottles; silty clay loam, moderate very coarse prismatic; firm moist;
broken moderately thick grey cutans; common fine tubular pores; few
fine roots; clear smooth boundary ; slight effervescence with HCl;;
pH 7.52 (8.2)
Bw2 45- 80 Alternate bonds of grey (5Y 5/2), olive grey ( 5 Y 3/2) and olive
brown (2.5 Y 4/4) moist with common medium distinct dark reddish
brown mottles; silt loam ; massive; friable moist ; patchy grey cutans
;few fine tubular pores; gradual smooth boundary ; slight
effervescence with HCl ; pH 7.63 (8.2)
C1 80-
105+
Alternate bonds of grey (5Y 5/1), olive grey ( 5 Y 5/2) and olive
brown (2.5 Y 4/4) moist with few fine medium distinct dark brown
mottles; silt loam ; massive; very friable moist ; patchy grey cutans
;few fine tubular pores; gradual smooth boundary ; slight
effervescence with HCl ; pH 7.71 (8.2)
Note: pH figures in bracket recorded in the field using a Hellige- Troug test kit.
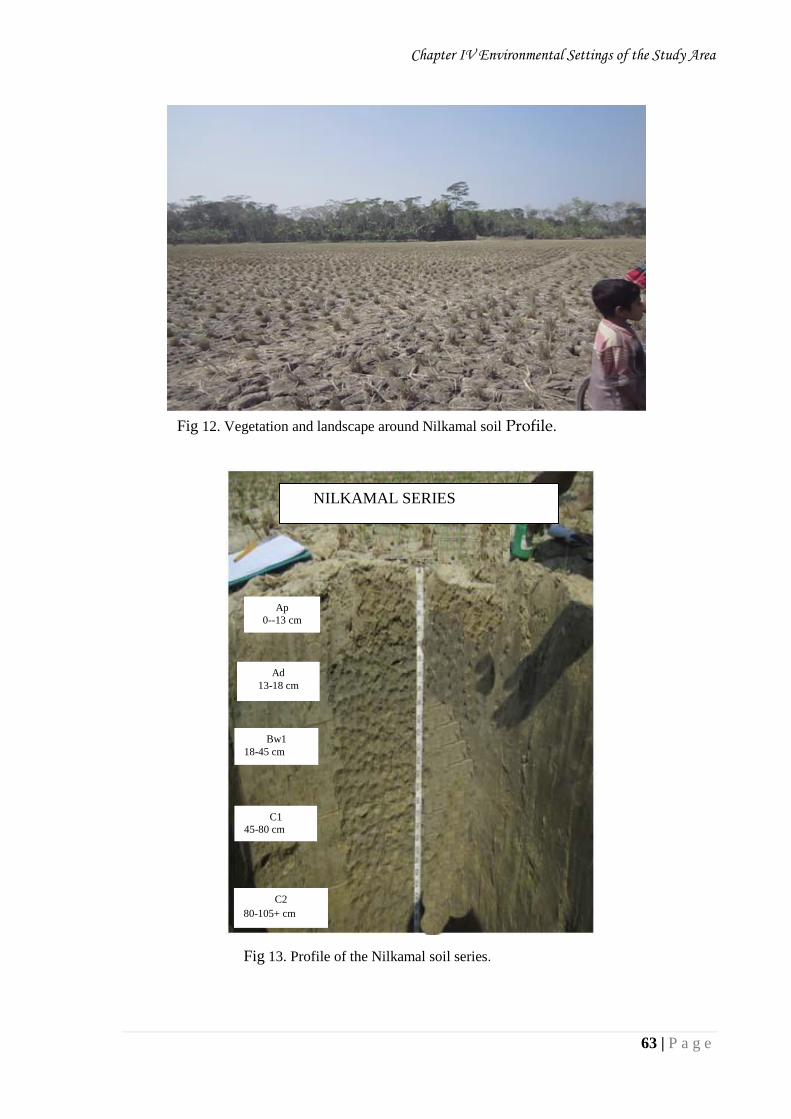
Chapter IV Environmental Settings of the Study Area
63 | P a g e
Fig 12. Vegetation and landscape around Nilkamal soil Profile.
Fig 13. Profile of the Nilkamal soil series.
Ap
0--13 cm
Ad
13-18 cm
Bw1
18-45 cm
C1
45-80 cm
C2
80-105+ cm
NILKAMAL SERIES
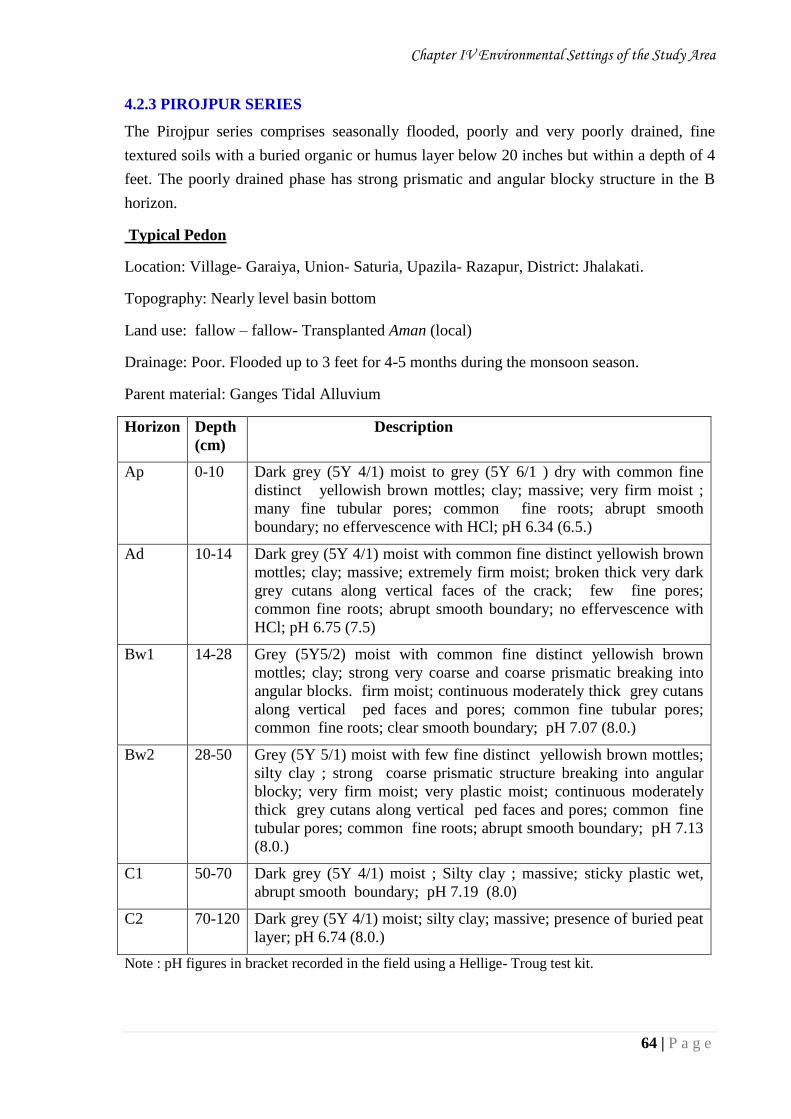
Chapter IV Environmental Settings of the Study Area
64 | P a g e
4.2.3 PIROJPUR SERIES
The Pirojpur series comprises seasonally flooded, poorly and very poorly drained, fine
textured soils with a buried organic or humus layer below 20 inches but within a depth of 4
feet. The poorly drained phase has strong prismatic and angular blocky structure in the B
horizon.
Typical Pedon
Location: Village- Garaiya, Union- Saturia, Upazila- Razapur, District: Jhalakati.
Topography: Nearly level basin bottom
Land use: fallow – fallow- Transplanted Aman (local)
Drainage: Poor. Flooded up to 3 feet for 4-5 months during the monsoon season.
Parent material: Ganges Tidal Alluvium
Horizon Depth
(cm)
Description
Ap 0-10 Dark grey (5Y 4/1) moist to grey (5Y 6/1 ) dry with common fine
distinct yellowish brown mottles; clay; massive; very firm moist ;
many fine tubular pores; common fine roots; abrupt smooth
boundary; no effervescence with HCl; pH 6.34 (6.5.)
Ad 10-14
Dark grey (5Y 4/1) moist with common fine distinct yellowish brown
mottles; clay; massive; extremely firm moist; broken thick very dark
grey cutans along vertical faces of the crack; few fine pores;
common fine roots; abrupt smooth boundary; no effervescence with
HCl; pH 6.75 (7.5)
Bw1 14-28 Grey (5Y5/2) moist with common fine distinct yellowish brown
mottles; clay; strong very coarse and coarse prismatic breaking into
angular blocks. firm moist; continuous moderately thick grey cutans
along vertical ped faces and pores; common fine tubular pores;
common fine roots; clear smooth boundary; pH 7.07 (8.0.)
Bw2 28-50 Grey (5Y 5/1) moist with few fine distinct yellowish brown mottles;
silty clay ; strong coarse prismatic structure breaking into angular
blocky; very firm moist; very plastic moist; continuous moderately
thick grey cutans along vertical ped faces and pores; common fine
tubular pores; common fine roots; abrupt smooth boundary; pH 7.13
(8.0.)
C1 50-70 Dark grey (5Y 4/1) moist ; Silty clay ; massive; sticky plastic wet,
abrupt smooth boundary; pH 7.19 (8.0)
C2 70-120 Dark grey (5Y 4/1) moist; silty clay; massive; presence of buried peat
layer; pH 6.74 (8.0.)
Note : pH figures in bracket recorded in the field using a Hellige- Troug test kit.

Chapter IV Environmental Settings of the Study Area
65 | P a g e
Fig 14 . Landscape and vegetation around Pirojpur soil profile site.
Fig 15 . Profile of the Pirojpur soil series.
PIROJPUR SERIES
Ap
0-10 cm
Ad
10-14 cm
Bw1
14-28 cm
C1
50-70 cm
C2
70-120+ cm
Bw1
28-50 cm
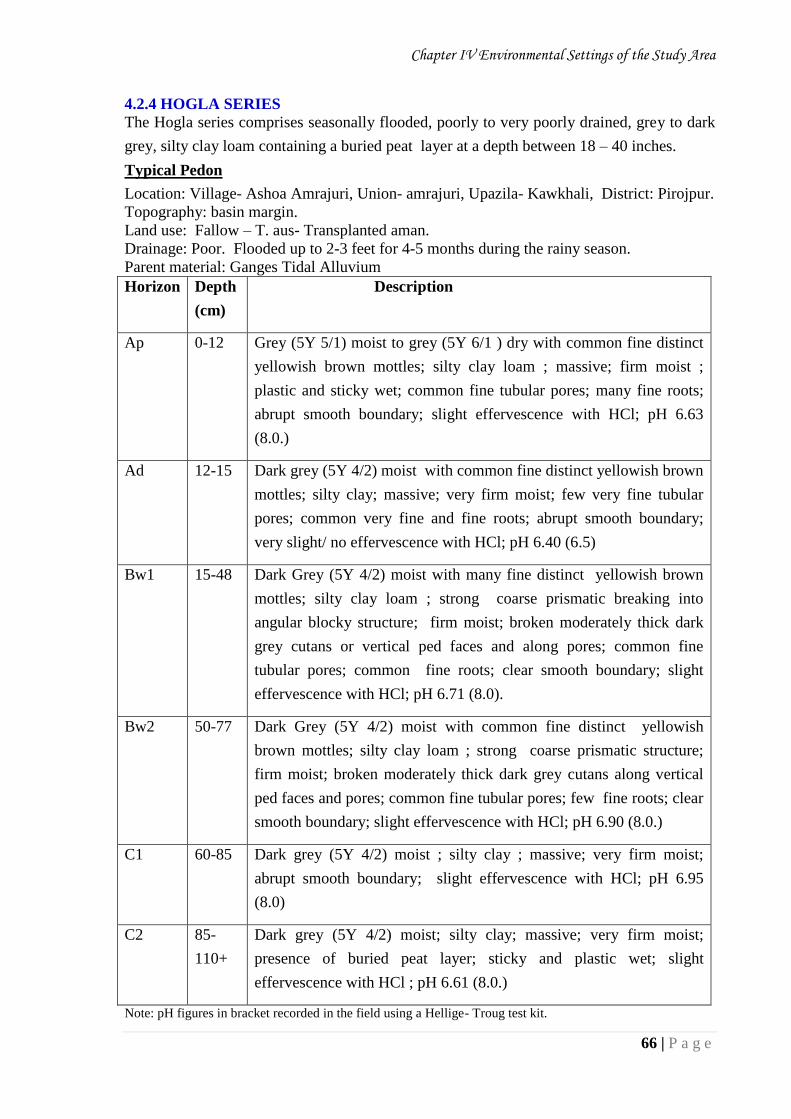
Chapter IV Environmental Settings of the Study Area
66 | P a g e
4.2.4 HOGLA SERIES
The Hogla series comprises seasonally flooded, poorly to very poorly drained, grey to dark
grey, silty clay loam containing a buried peat layer at a depth between 18 – 40 inches.
Typical Pedon
Location: Village- Ashoa Amrajuri, Union- amrajuri, Upazila- Kawkhali, District: Pirojpur.
Topography: basin margin.
Land use: Fallow – T. aus- Transplanted aman.
Drainage: Poor. Flooded up to 2-3 feet for 4-5 months during the rainy season.
Parent material: Ganges Tidal Alluvium
Horizon Depth
(cm)
Description
Ap 0-12 Grey (5Y 5/1) moist to grey (5Y 6/1 ) dry with common fine distinct
yellowish brown mottles; silty clay loam ; massive; firm moist ;
plastic and sticky wet; common fine tubular pores; many fine roots;
abrupt smooth boundary; slight effervescence with HCl; pH 6.63
(8.0.)
Ad 12-15
Dark grey (5Y 4/2) moist with common fine distinct yellowish brown
mottles; silty clay; massive; very firm moist; few very fine tubular
pores; common very fine and fine roots; abrupt smooth boundary;
very slight/ no effervescence with HCl; pH 6.40 (6.5)
Bw1 15-48 Dark Grey (5Y 4/2) moist with many fine distinct yellowish brown
mottles; silty clay loam ; strong coarse prismatic breaking into
angular blocky structure; firm moist; broken moderately thick dark
grey cutans or vertical ped faces and along pores; common fine
tubular pores; common fine roots; clear smooth boundary; slight
effervescence with HCl; pH 6.71 (8.0).
Bw2 50-77 Dark Grey (5Y 4/2) moist with common fine distinct yellowish
brown mottles; silty clay loam ; strong coarse prismatic structure;
firm moist; broken moderately thick dark grey cutans along vertical
ped faces and pores; common fine tubular pores; few fine roots; clear
smooth boundary; slight effervescence with HCl; pH 6.90 (8.0.)
C1 60-85 Dark grey (5Y 4/2) moist ; silty clay ; massive; very firm moist;
abrupt smooth boundary; slight effervescence with HCl; pH 6.95
(8.0)
C2 85-
110+
Dark grey (5Y 4/2) moist; silty clay; massive; very firm moist;
presence of buried peat layer; sticky and plastic wet; slight
effervescence with HCl ; pH 6.61 (8.0.)
Note: pH figures in bracket recorded in the field using a Hellige- Troug test kit.
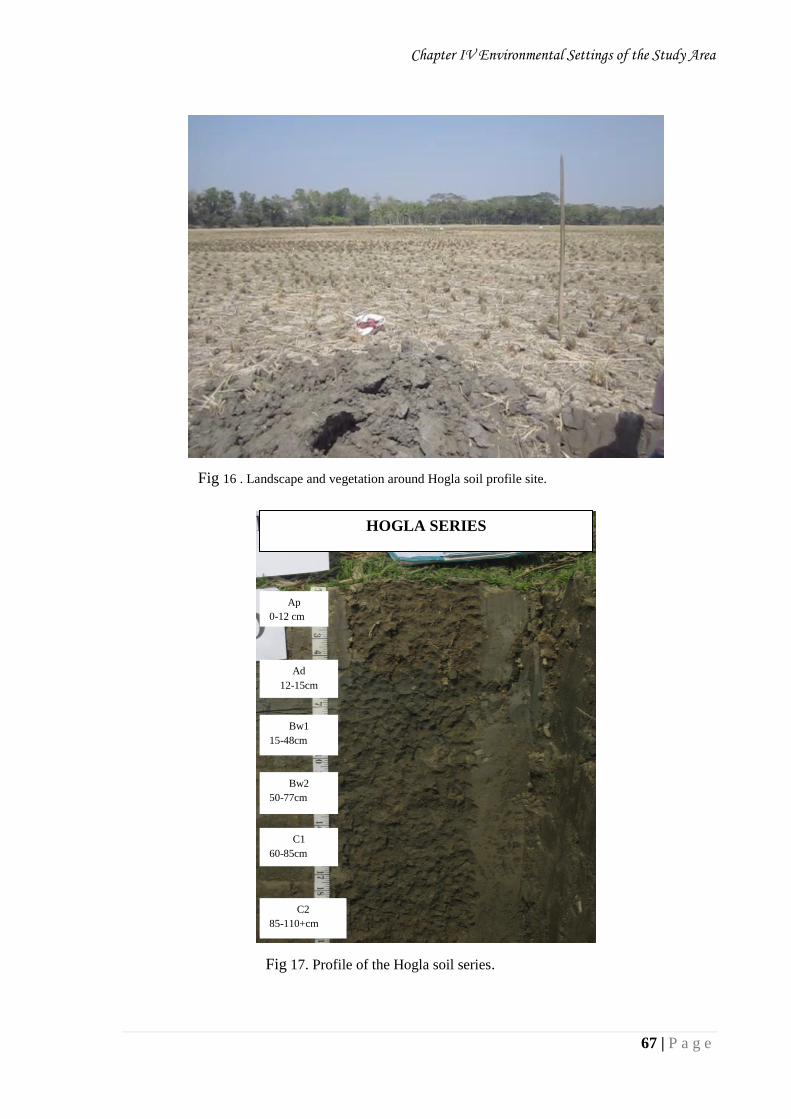
Chapter IV Environmental Settings of the Study Area
67 | P a g e
Plate 10. Profile of the Hogla soil series.
Fig 16 . Landscape and vegetation around Hogla soil profile site.
Ap
0-12 cm
cm
Ad
12-15cm
Bw1
15-48cm
Bw2
50-77cm
C1
60-85cm
C2
85-110+cm
Fig 17. Profile of the Hogla soil series.
HOGLA SERIES
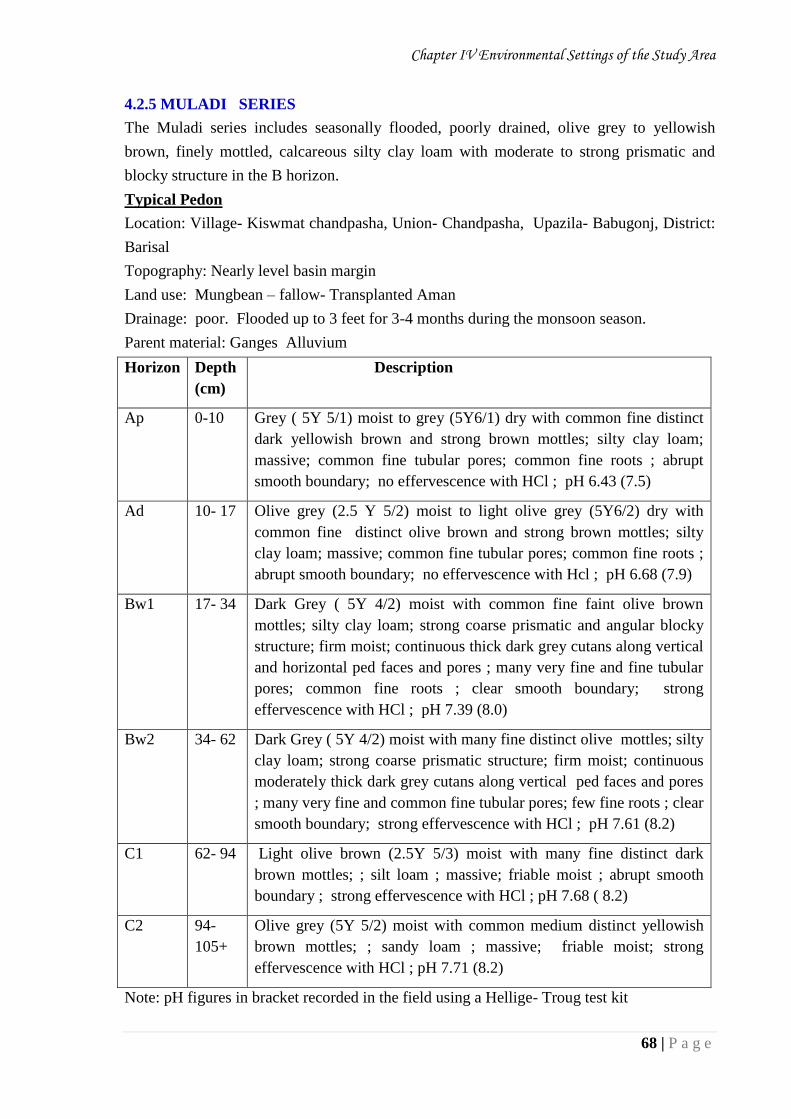
Chapter IV Environmental Settings of the Study Area
68 | P a g e
4.2.5 MULADI SERIES
The Muladi series includes seasonally flooded, poorly drained, olive grey to yellowish
brown, finely mottled, calcareous silty clay loam with moderate to strong prismatic and
blocky structure in the B horizon.
Typical Pedon
Location: Village- Kiswmat chandpasha, Union- Chandpasha, Upazila- Babugonj, District:
Barisal
Topography: Nearly level basin margin
Land use: Mungbean – fallow- Transplanted Aman
Drainage: poor. Flooded up to 3 feet for 3-4 months during the monsoon season.
Parent material: Ganges Alluvium
Horizon Depth
(cm)
Description
Ap 0-10 Grey ( 5Y 5/1) moist to grey (5Y6/1) dry with common fine distinct
dark yellowish brown and strong brown mottles; silty clay loam;
massive; common fine tubular pores; common fine roots ; abrupt
smooth boundary; no effervescence with HCl ; pH 6.43 (7.5)
Ad 10- 17
Olive grey (2.5 Y 5/2) moist to light olive grey (5Y6/2) dry with
common fine distinct olive brown and strong brown mottles; silty
clay loam; massive; common fine tubular pores; common fine roots ;
abrupt smooth boundary; no effervescence with Hcl ; pH 6.68 (7.9)
Bw1 17- 34 Dark Grey ( 5Y 4/2) moist with common fine faint olive brown
mottles; silty clay loam; strong coarse prismatic and angular blocky
structure; firm moist; continuous thick dark grey cutans along vertical
and horizontal ped faces and pores ; many very fine and fine tubular
pores; common fine roots ; clear smooth boundary; strong
effervescence with HCl ; pH 7.39 (8.0)
Bw2 34- 62 Dark Grey ( 5Y 4/2) moist with many fine distinct olive mottles; silty
clay loam; strong coarse prismatic structure; firm moist; continuous
moderately thick dark grey cutans along vertical ped faces and pores
; many very fine and common fine tubular pores; few fine roots ; clear
smooth boundary; strong effervescence with HCl ; pH 7.61 (8.2)
C1 62- 94 Light olive brown (2.5Y 5/3) moist with many fine distinct dark
brown mottles; ; silt loam ; massive; friable moist ; abrupt smooth
boundary ; strong effervescence with HCl ; pH 7.68 ( 8.2)
C2 94-
105+
Olive grey (5Y 5/2) moist with common medium distinct yellowish
brown mottles; ; sandy loam ; massive; friable moist; strong
effervescence with HCl ; pH 7.71 (8.2)
Note: pH figures in bracket recorded in the field using a Hellige- Troug test kit
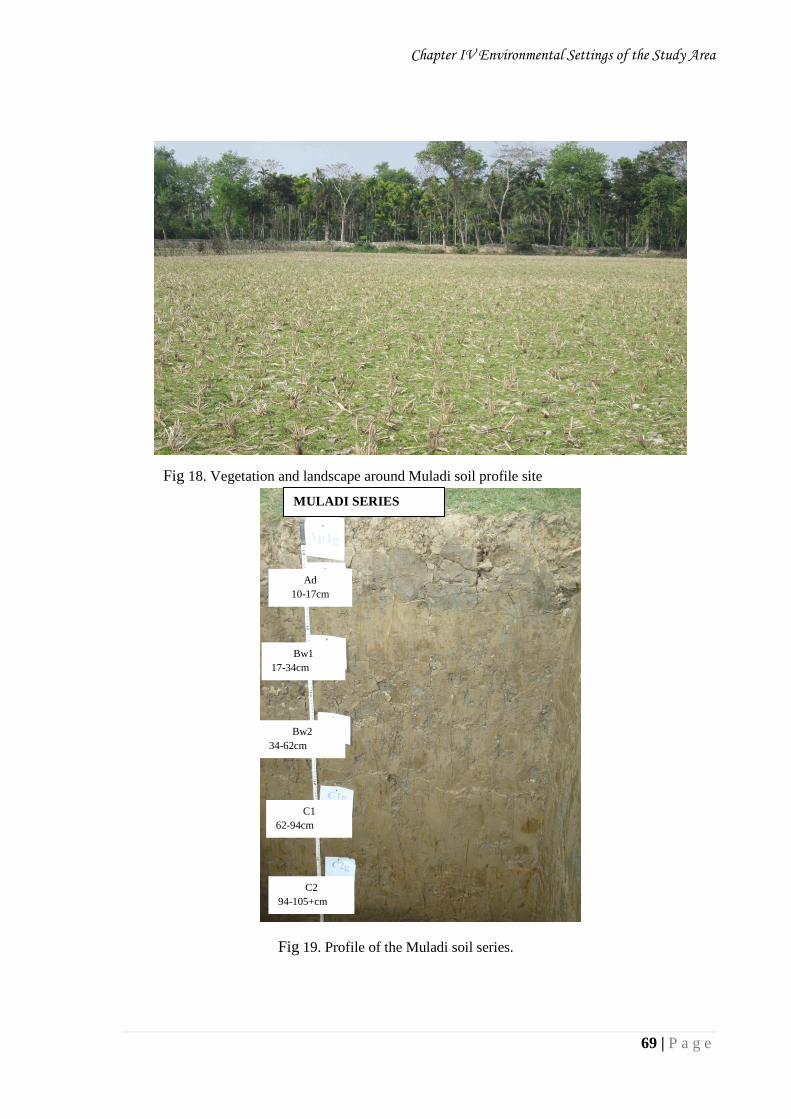
Chapter IV Environmental Settings of the Study Area
69 | P a g e
Fig 19. Profile of the Muladi soil series.
Fig 18. Vegetation and landscape around Muladi soil profile site
Ad
10-17cm
Bw1
17-34cm
Bw2
34-62cm
C1
62-94cm
C2
94-105+cm
MULADI SERIES
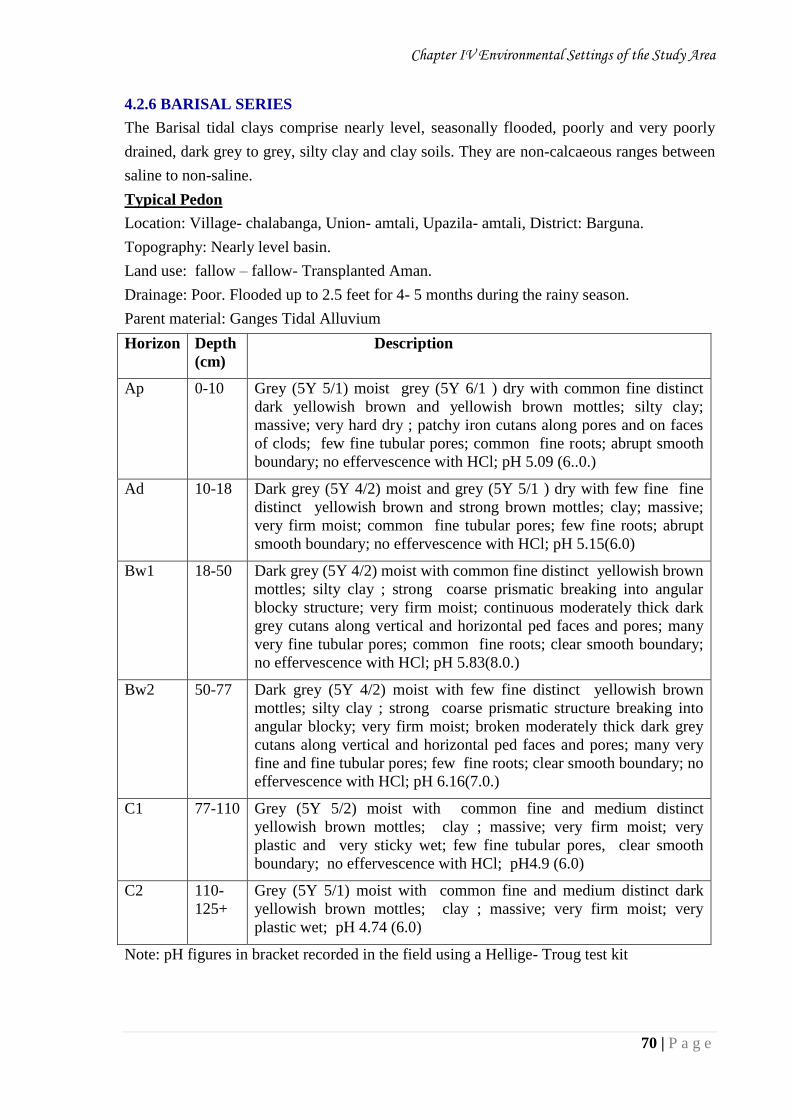
Chapter IV Environmental Settings of the Study Area
70 | P a g e
4.2.6 BARISAL SERIES
The Barisal tidal clays comprise nearly level, seasonally flooded, poorly and very poorly
drained, dark grey to grey, silty clay and clay soils. They are non-calcaeous ranges between
saline to non-saline.
Typical Pedon
Location: Village- chalabanga, Union- amtali, Upazila- amtali, District: Barguna.
Topography: Nearly level basin.
Land use: fallow – fallow- Transplanted Aman.
Drainage: Poor. Flooded up to 2.5 feet for 4- 5 months during the rainy season.
Parent material: Ganges Tidal Alluvium
Horizon Depth
(cm)
Description
Ap 0-10 Grey (5Y 5/1) moist grey (5Y 6/1 ) dry with common fine distinct
dark yellowish brown and yellowish brown mottles; silty clay;
massive; very hard dry ; patchy iron cutans along pores and on faces
of clods; few fine tubular pores; common fine roots; abrupt smooth
boundary; no effervescence with HCl; pH 5.09 (6..0.)
Ad 10-18
Dark grey (5Y 4/2) moist and grey (5Y 5/1 ) dry with few fine fine
distinct yellowish brown and strong brown mottles; clay; massive;
very firm moist; common fine tubular pores; few fine roots; abrupt
smooth boundary; no effervescence with HCl; pH 5.15(6.0)
Bw1 18-50 Dark grey (5Y 4/2) moist with common fine distinct yellowish brown
mottles; silty clay ; strong coarse prismatic breaking into angular
blocky structure; very firm moist; continuous moderately thick dark
grey cutans along vertical and horizontal ped faces and pores; many
very fine tubular pores; common fine roots; clear smooth boundary;
no effervescence with HCl; pH 5.83(8.0.)
Bw2 50-77 Dark grey (5Y 4/2) moist with few fine distinct yellowish brown
mottles; silty clay ; strong coarse prismatic structure breaking into
angular blocky; very firm moist; broken moderately thick dark grey
cutans along vertical and horizontal ped faces and pores; many very
fine and fine tubular pores; few fine roots; clear smooth boundary; no
effervescence with HCl; pH 6.16(7.0.)
C1 77-110 Grey (5Y 5/2) moist with common fine and medium distinct
yellowish brown mottles; clay ; massive; very firm moist; very
plastic and very sticky wet; few fine tubular pores, clear smooth
boundary; no effervescence with HCl; pH4.9 (6.0)
C2 110-
125+
Grey (5Y 5/1) moist with common fine and medium distinct dark
yellowish brown mottles; clay ; massive; very firm moist; very
plastic wet; pH 4.74 (6.0)
Note: pH figures in bracket recorded in the field using a Hellige- Troug test kit
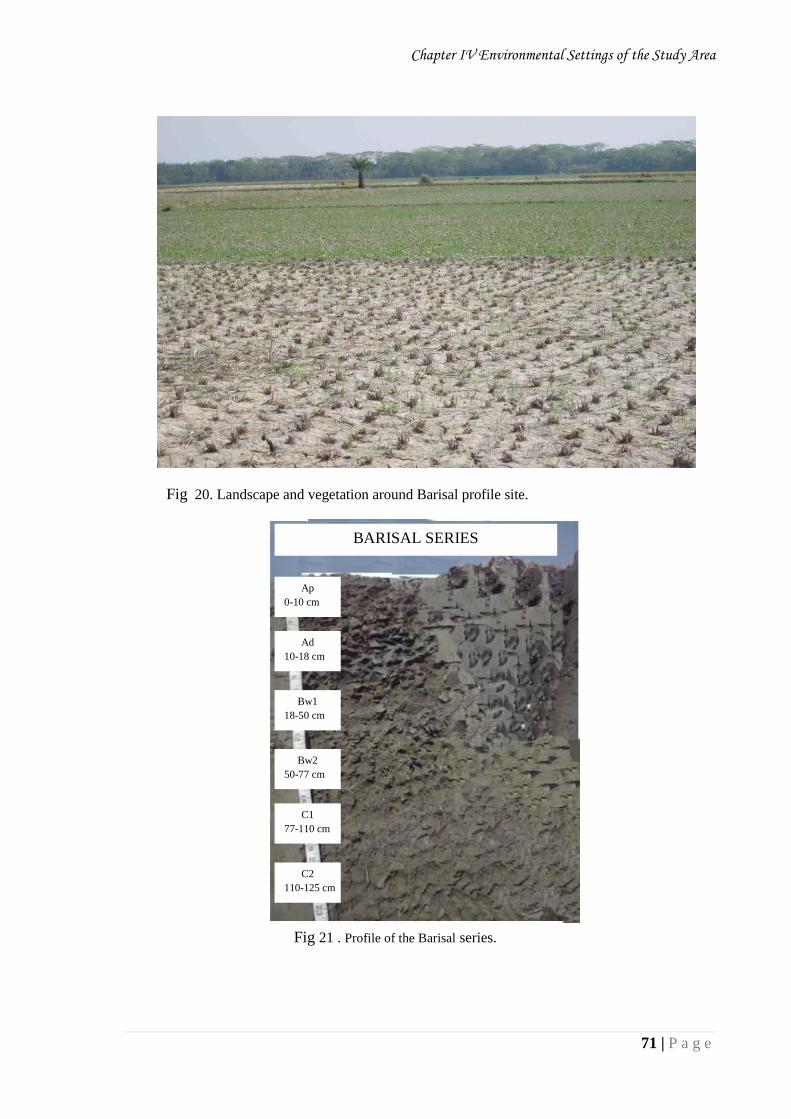
Chapter IV Environmental Settings of the Study Area
71 | P a g e
Fig 20. Landscape and vegetation around Barisal profile site.
Fig 21 . Profile of the Barisal series.
Ap
0-10 cm
cm
Ad
10-18 cm
cm
Bw1
18-50 cm
cm
Bw2
50-77 cm
cm
C1
77-110 cm
cm
C2
110-125 cm
cm
BARISAL SERIES
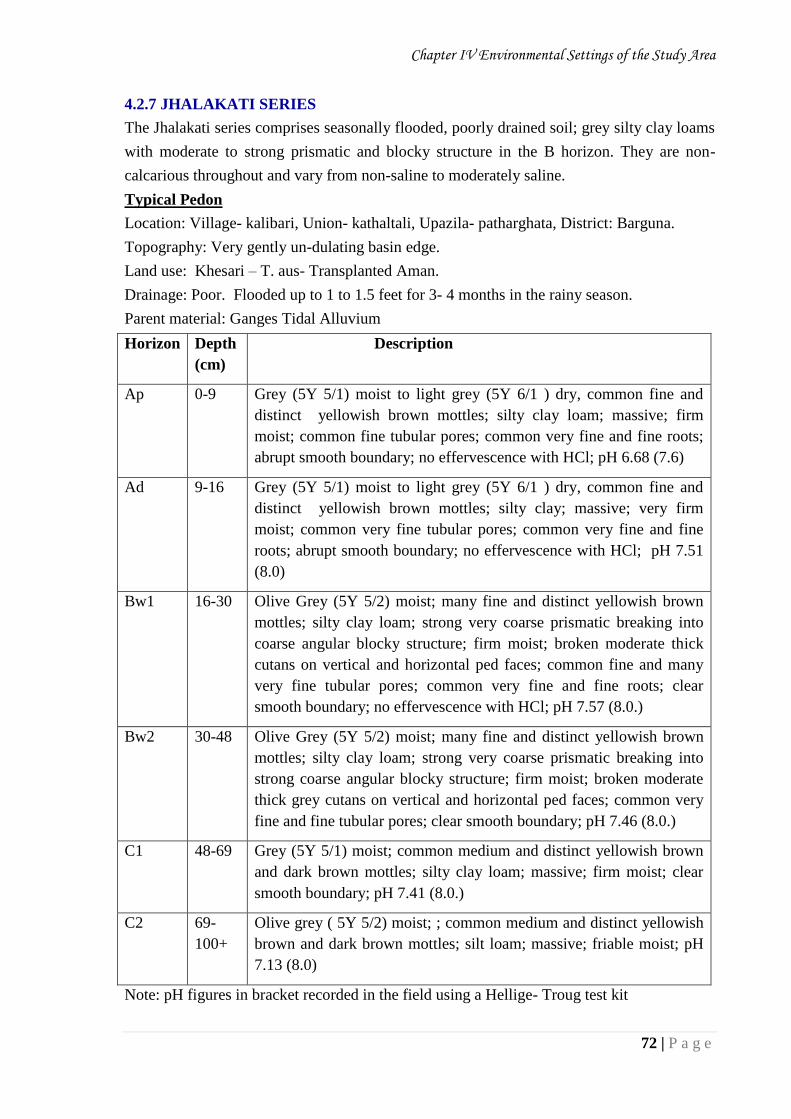
Chapter IV Environmental Settings of the Study Area
72 | P a g e
4.2.7 JHALAKATI SERIES
The Jhalakati series comprises seasonally flooded, poorly drained soil; grey silty clay loams
with moderate to strong prismatic and blocky structure in the B horizon. They are non-
calcarious throughout and vary from non-saline to moderately saline.
Typical Pedon
Location: Village- kalibari, Union- kathaltali, Upazila- patharghata, District: Barguna.
Topography: Very gently un-dulating basin edge.
Land use: Khesari – T. aus- Transplanted Aman.
Drainage: Poor. Flooded up to 1 to 1.5 feet for 3- 4 months in the rainy season.
Parent material: Ganges Tidal Alluvium
Horizon Depth
(cm)
Description
Ap 0-9 Grey (5Y 5/1) moist to light grey (5Y 6/1 ) dry, common fine and
distinct yellowish brown mottles; silty clay loam; massive; firm
moist; common fine tubular pores; common very fine and fine roots;
abrupt smooth boundary; no effervescence with HCl; pH 6.68 (7.6)
Ad 9-16
Grey (5Y 5/1) moist to light grey (5Y 6/1 ) dry, common fine and
distinct yellowish brown mottles; silty clay; massive; very firm
moist; common very fine tubular pores; common very fine and fine
roots; abrupt smooth boundary; no effervescence with HCl; pH 7.51
(8.0)
Bw1 16-30 Olive Grey (5Y 5/2) moist; many fine and distinct yellowish brown
mottles; silty clay loam; strong very coarse prismatic breaking into
coarse angular blocky structure; firm moist; broken moderate thick
cutans on vertical and horizontal ped faces; common fine and many
very fine tubular pores; common very fine and fine roots; clear
smooth boundary; no effervescence with HCl; pH 7.57 (8.0.)
Bw2 30-48 Olive Grey (5Y 5/2) moist; many fine and distinct yellowish brown
mottles; silty clay loam; strong very coarse prismatic breaking into
strong coarse angular blocky structure; firm moist; broken moderate
thick grey cutans on vertical and horizontal ped faces; common very
fine and fine tubular pores; clear smooth boundary; pH 7.46 (8.0.)
C1 48-69 Grey (5Y 5/1) moist; common medium and distinct yellowish brown
and dark brown mottles; silty clay loam; massive; firm moist; clear
smooth boundary; pH 7.41 (8.0.)
C2 69-
100+
Olive grey ( 5Y 5/2) moist; ; common medium and distinct yellowish
brown and dark brown mottles; silt loam; massive; friable moist; pH
7.13 (8.0)
Note: pH figures in bracket recorded in the field using a Hellige- Troug test kit
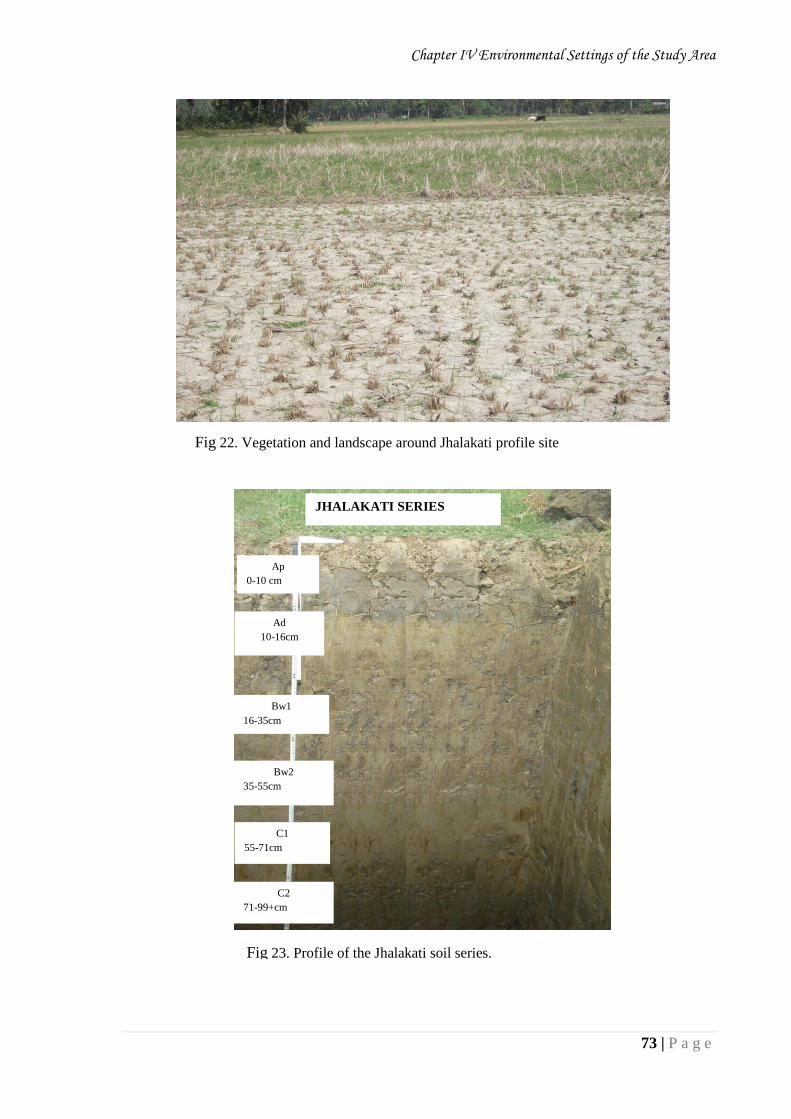
Chapter IV Environmental Settings of the Study Area
73 | P a g e
Fig 22. Vegetation and landscape around Jhalakati profile site
Fig 23. Profile of the Jhalakati soil series.
JHALAKATI SERIES
Ap
0-10 cm
cm
Ad
10-16cm
Bw1
16-35cm
Bw2
35-55cm
C1
55-71cm
C2
71-99+cm
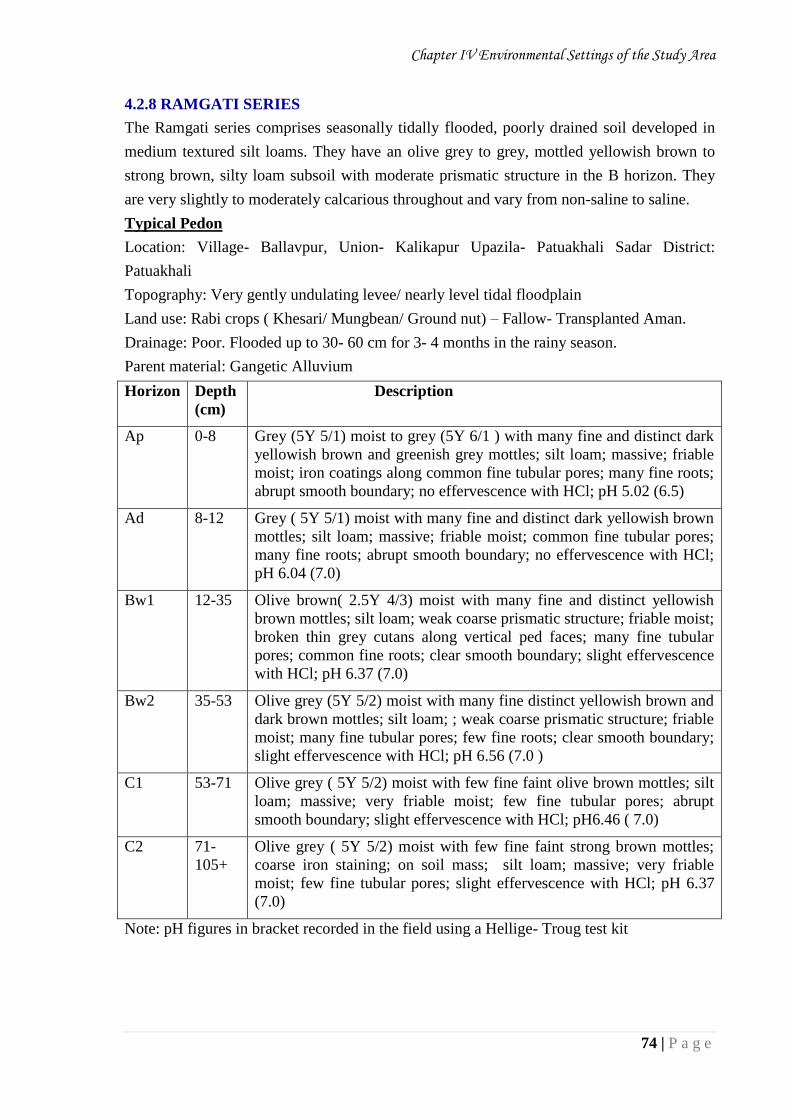
Chapter IV Environmental Settings of the Study Area
74 | P a g e
4.2.8 RAMGATI SERIES
The Ramgati series comprises seasonally tidally flooded, poorly drained soil developed in
medium textured silt loams. They have an olive grey to grey, mottled yellowish brown to
strong brown, silty loam subsoil with moderate prismatic structure in the B horizon. They
are very slightly to moderately calcarious throughout and vary from non-saline to saline.
Typical Pedon
Location: Village- Ballavpur, Union- Kalikapur Upazila- Patuakhali Sadar District:
Patuakhali
Topography: Very gently undulating levee/ nearly level tidal floodplain
Land use: Rabi crops ( Khesari/ Mungbean/ Ground nut) – Fallow- Transplanted Aman.
Drainage: Poor. Flooded up to 30- 60 cm for 3- 4 months in the rainy season.
Parent material: Gangetic Alluvium
Horizon Depth
(cm)
Description
Ap 0-8 Grey (5Y 5/1) moist to grey (5Y 6/1 ) with many fine and distinct dark
yellowish brown and greenish grey mottles; silt loam; massive; friable
moist; iron coatings along common fine tubular pores; many fine roots;
abrupt smooth boundary; no effervescence with HCl; pH 5.02 (6.5)
Ad 8-12 Grey ( 5Y 5/1) moist with many fine and distinct dark yellowish brown
mottles; silt loam; massive; friable moist; common fine tubular pores;
many fine roots; abrupt smooth boundary; no effervescence with HCl;
pH 6.04 (7.0)
Bw1 12-35 Olive brown( 2.5Y 4/3) moist with many fine and distinct yellowish
brown mottles; silt loam; weak coarse prismatic structure; friable moist;
broken thin grey cutans along vertical ped faces; many fine tubular
pores; common fine roots; clear smooth boundary; slight effervescence
with HCl; pH 6.37 (7.0)
Bw2 35-53 Olive grey (5Y 5/2) moist with many fine distinct yellowish brown and
dark brown mottles; silt loam; ; weak coarse prismatic structure; friable
moist; many fine tubular pores; few fine roots; clear smooth boundary;
slight effervescence with HCl; pH 6.56 (7.0 )
C1 53-71 Olive grey ( 5Y 5/2) moist with few fine faint olive brown mottles; silt
loam; massive; very friable moist; few fine tubular pores; abrupt
smooth boundary; slight effervescence with HCl; pH6.46 ( 7.0)
C2 71-
105+
Olive grey ( 5Y 5/2) moist with few fine faint strong brown mottles;
coarse iron staining; on soil mass; silt loam; massive; very friable
moist; few fine tubular pores; slight effervescence with HCl; pH 6.37
(7.0)
Note: pH figures in bracket recorded in the field using a Hellige- Troug test kit
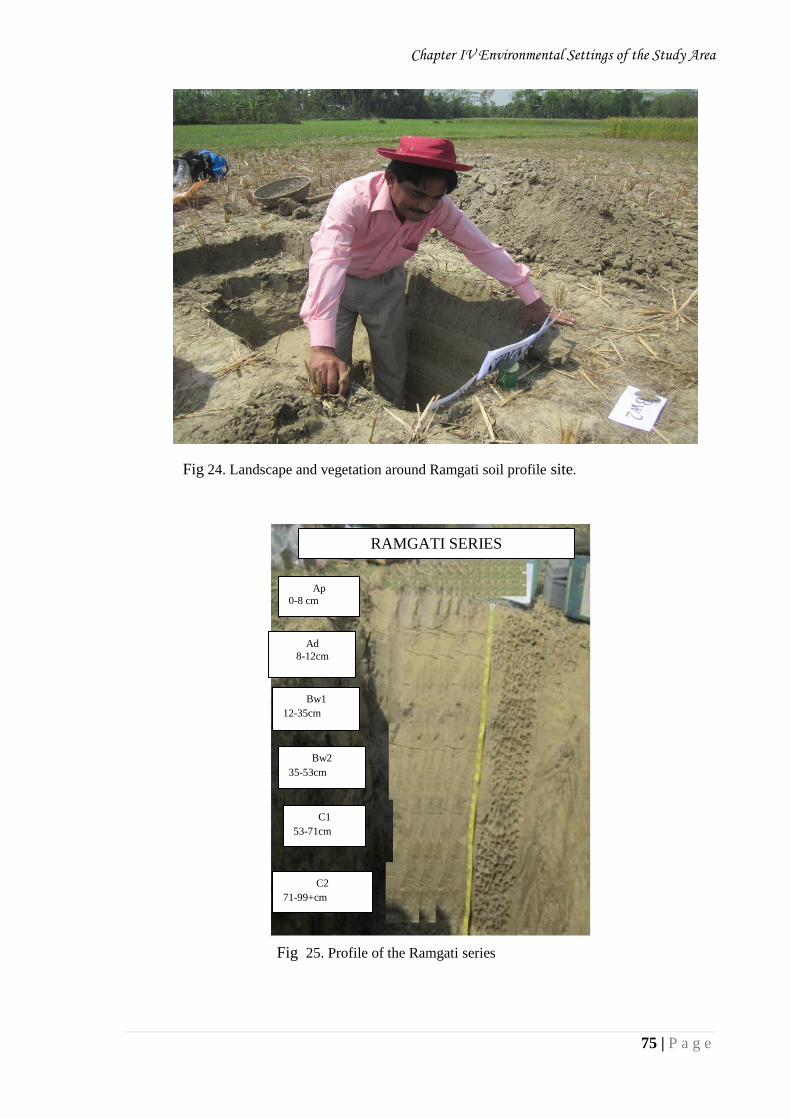
Chapter IV Environmental Settings of the Study Area
75 | P a g e
Fig 24. Landscape and vegetation around Ramgati soil profile site.
Ap
0-8 cm
cm
Ad
8-12cm
Bw1
12-35cm
Bw2
35-53cm
C1
53-71cm
C2
71-99+cm
Fig 25. Profile of the Ramgati series
RAMGATI SERIES

CHAPTER-5
RESULTS AND DISCUSSION
Chapter V Results and Discussion
76 | P a g e
CHAPTER – 5
RESULTS AND DISCUSSION
The results of the investigations carried out in the field as well as in the laboratory are
presented and discussed in this section.
5.1 Suspended sediment load
The amounts of suspended sediment carried by the two rivers such as the Bishkhali and
the Arial Khan rivers flowing through the coastal zone of Bangladesh ranged from 4.10 to
13.06 kg/ sq. meter/ month (Table 4 and Appendix 1 & 2).
Suspended sediment load of the Bishkhali river water in the coastal zone of Bangladesh
was very high (9.4 kg per sq. meter per month) in the dry season as compared to that in the wet
season (4.6 kg per sq. meter per month) whereas in the Arial Khan river the suspended
sediment load was low in dry season (4.1 kg per sq. meter per month) as compared to that in
the wet season (13.06 kg per sq. meter per month) due to variation in water turbulence of the
two rivers.
Suspended sediment load was found higher in the dry season than that in the wet season
in Bishkhali River (Figs. 26 to 28). Because of extreme flow of water in wet season, sediment
load was found lower in wet season than in dry season.
Suspended sediment load was noticed higher in wet season compared to the dry season
in Arial Khan river (Figs. 29 to 31). Conducive environment of sedimentation may prevails in
the wet season of Arial Khan River; hence sediment discharge was higher in wet season than
the dry season. Similar observation has been made by Siddiqi (1989) and Rahman (2009). They
noted that the sediment load is very high and the sediment carrying capacity of the rivers is also
very high during the wet season.
The sediment load of the Ganges and the Brahmaputra river water in Bangladesh was
examined by Rahman et al. (2009) and concluded that in dry season the average content of
sediment of the river water was 75 mg/l and that in wet season was705 mg/l.
Chakrapani (2005) studied the sediment discharge in some large rivers in the world as
well as factors controlling variations in river sediment load and concluded that sediment in the
river water is 1200 t/yr in Amazon; 1060 ton/yr in Ganges/ Brahmaputra; 1050 t/yr in Huang
He and 210 t/yr in Mississippi river and factors like relief, channel slope, basin size, seasonality
of rains, human perturbations, water flow and tectonic activities control sediment loads in river.
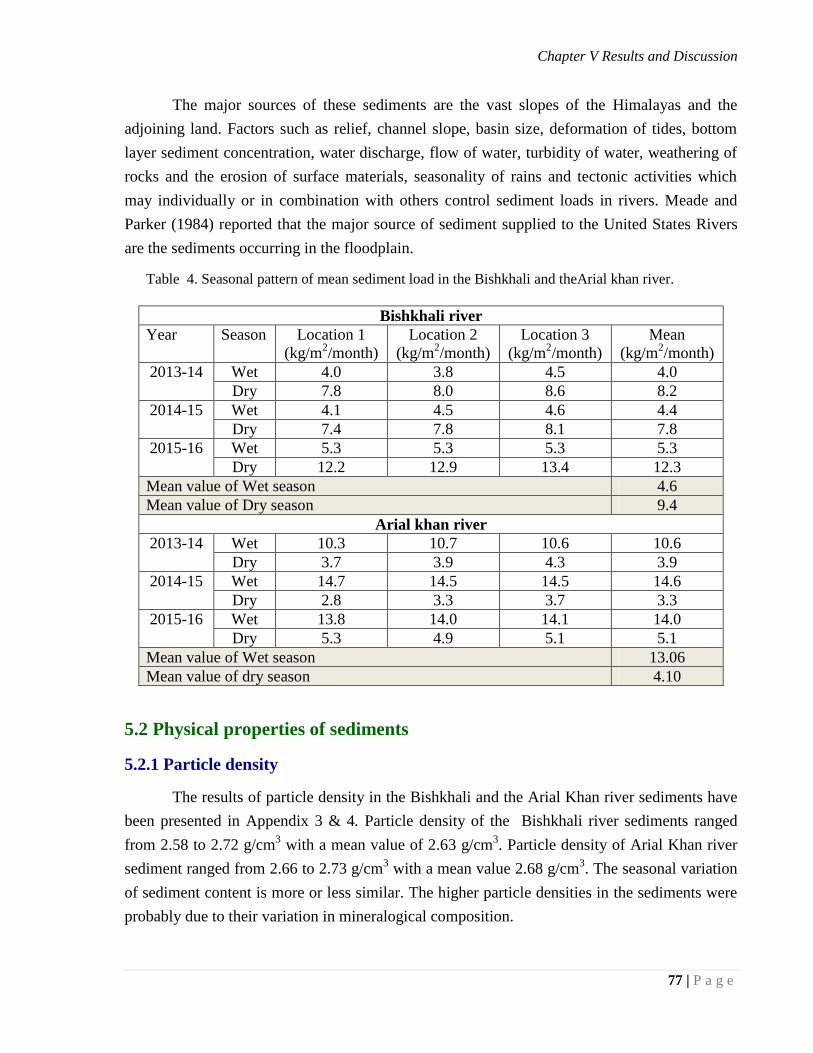
Chapter V Results and Discussion
77 | P a g e
The major sources of these sediments are the vast slopes of the Himalayas and the
adjoining land. Factors such as relief, channel slope, basin size, deformation of tides, bottom
layer sediment concentration, water discharge, flow of water, turbidity of water, weathering of
rocks and the erosion of surface materials, seasonality of rains and tectonic activities which
may individually or in combination with others control sediment loads in rivers. Meade and
Parker (1984) reported that the major source of sediment supplied to the United States Rivers
are the sediments occurring in the floodplain.
Table 4. Seasonal pattern of mean sediment load in the Bishkhali and theArial khan river.
Bishkhali river
Year Season Location 1
(kg/m2/month)
Location 2
(kg/m2/month)
Location 3
(kg/m2/month)
Mean
(kg/m2/month)
2013-14 Wet 4.0 3.8 4.5 4.0
Dry 7.8 8.0 8.6 8.2
2014-15 Wet 4.1 4.5 4.6 4.4
Dry 7.4 7.8 8.1 7.8
2015-16 Wet 5.3 5.3 5.3 5.3
Dry 12.2 12.9 13.4 12.3
Mean value of Wet season 4.6
Mean value of Dry season 9.4
Arial khan river
2013-14 Wet 10.3 10.7 10.6 10.6
Dry 3.7 3.9 4.3 3.9
2014-15 Wet 14.7 14.5 14.5 14.6
Dry 2.8 3.3 3.7 3.3
2015-16 Wet 13.8 14.0 14.1 14.0
Dry 5.3 4.9 5.1 5.1
Mean value of Wet season 13.06
Mean value of dry season 4.10
5.2 Physical properties of sediments
5.2.1 Particle density
The results of particle density in the Bishkhali and the Arial Khan river sediments have
been presented in Appendix 3 & 4. Particle density of the Bishkhali river sediments ranged
from 2.58 to 2.72 g/cm3 with a mean value of 2.63 g/cm
3. Particle density of Arial Khan river
sediment ranged from 2.66 to 2.73 g/cm3 with a mean value 2.68 g/cm
3. The seasonal variation
of sediment content is more or less similar. The higher particle densities in the sediments were
probably due to their variation in mineralogical composition.
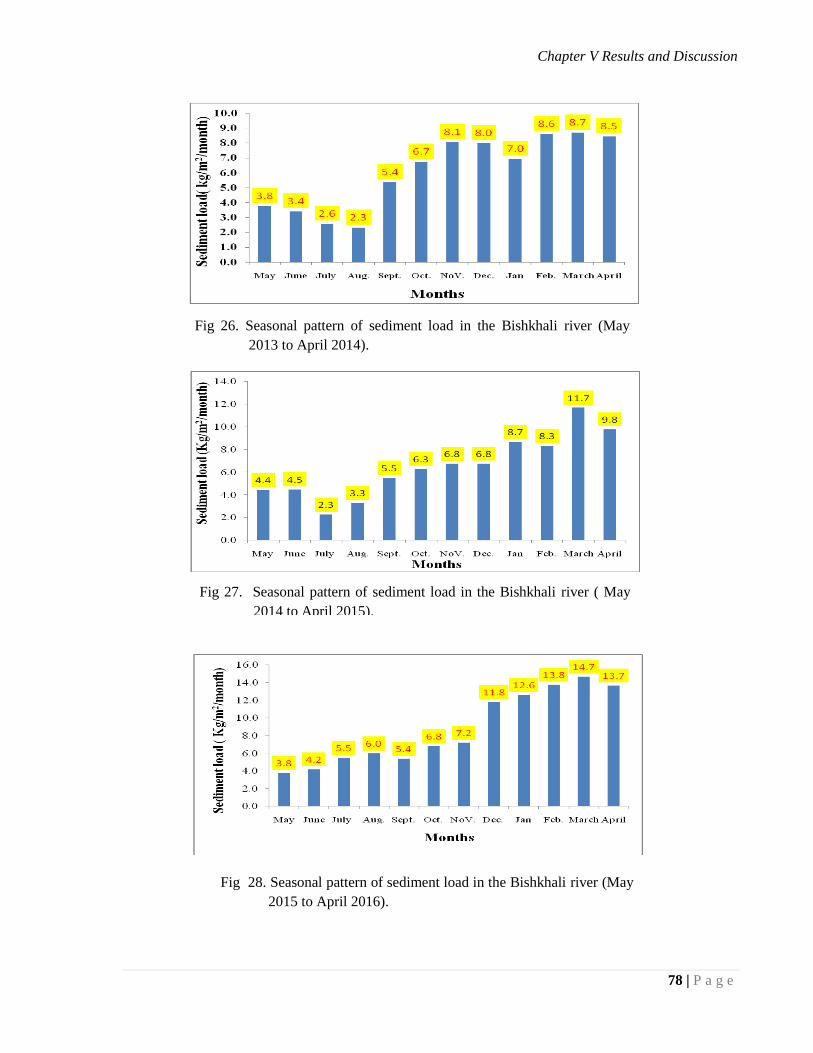
Chapter V Results and Discussion
78 | P a g e
Fig 27. Seasonal pattern of sediment load in the Bishkhali river ( May
2014 to April 2015).
Fig 26. Seasonal pattern of sediment load in the Bishkhali river (May
2013 to April 2014).
Fig 28. Seasonal pattern of sediment load in the Bishkhali river (May
2015 to April 2016).
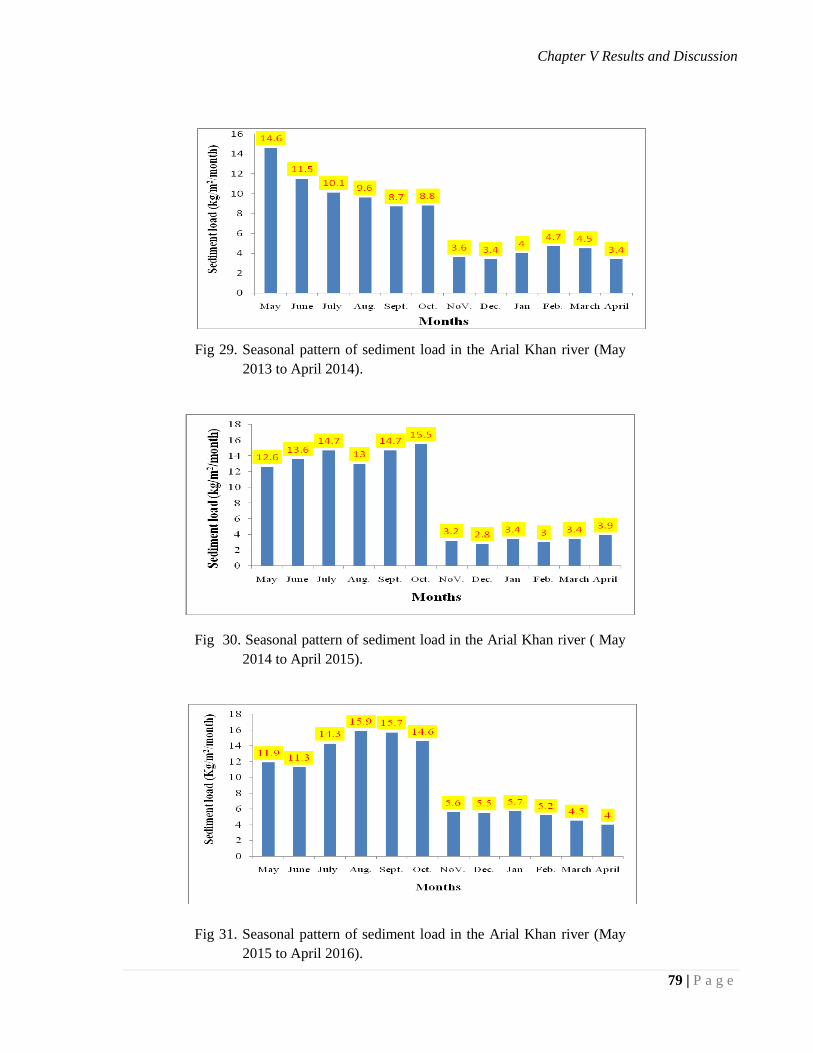
Chapter V Results and Discussion
79 | P a g e
Fig 29. Seasonal pattern of sediment load in the Arial Khan river (May
2013 to April 2014).
Fig 30. Seasonal pattern of sediment load in the Arial Khan river ( May
2014 to April 2015).
Fig 31. Seasonal pattern of sediment load in the Arial Khan river (May
2015 to April 2016).
Chapter V Results and Discussion
80 | P a g e
5.2.2 Loss on ignition (LOI)
The results of LOI in the Bishkhali and the Arial Khan river sediments have been
presented in Appendix 3 & 4. LOI ranged from 5.0 to 6.5 percent with a mean value of 5.8
percent in Bishkhali river sediment and 4.9 to 6.1 percent with an average value of 5.6 percent
in Arial Khan river sediment. The loss on ignition is usually dependent on organic matter, lime
and relative abundance of the clay minerals (Khan 1954; Quasem 1956, Hussain, 1961, and
Rahman, 2009).
5.2.3 Particle size distribution
The results of particle size distribution in the studied sediments have been presented in
Table 5 & 6. The particle size analysis of the sediments indicates that sediments of both the
rivers consist exclusively of sand, silt and clay. Silt was the dominant size fraction followed by
sand and clay. The silt content in the Bishkhali river sediment ranged from 57 to 61 percent
with a mean value of 59 percent and in the Arial Khan river it ranged from 57 to 65 percent
with a mean value of 61 percent in. This is in agreement with the findings of Hossain (1992).
He studied on loose sediments of some coastal river and noted that silt was the dominant size
fraction in them (>50%).
The sand content in the suspended sediments ranged from 16 to 24 percent and clay
content ranged from 18 to 23 percent. The percentage of sand, silt and clay fraction slightly
varied between the wet and dry season. There were no appreciable variations in the contents of
sand, silt and clay between the sediments of two rivers. These results are in agreement with the
findings of Morghan and Mclntire (1959); (FAO, 1977); Alam et al. (1990) and Umitsu (1993).
The above authors stated that the floodplain sediments of the Ganges- Brahmaputra- Meghna
( GBM) rivers in the Bengal basin were mainly composed of fine sand and silt.
Jalal et al. (2009) have studied the physico-chemical characteristics of the coastal water
sediments in Pulau Tuba River, Langkawi, Malaysia from four stations and remarked that the
silt was the dominant size fraction followed by sand and clay. Their findings are also in accord
with us.
The textural classes of both the river suspended sediments were silt loam (Fig 27 & 28).
Similar observations have been made by Rahman et al. (2009). They noted that the textural
classes in the suspended sediments of the Ganges and Brahmaputra rivers from silt loam to
loam.
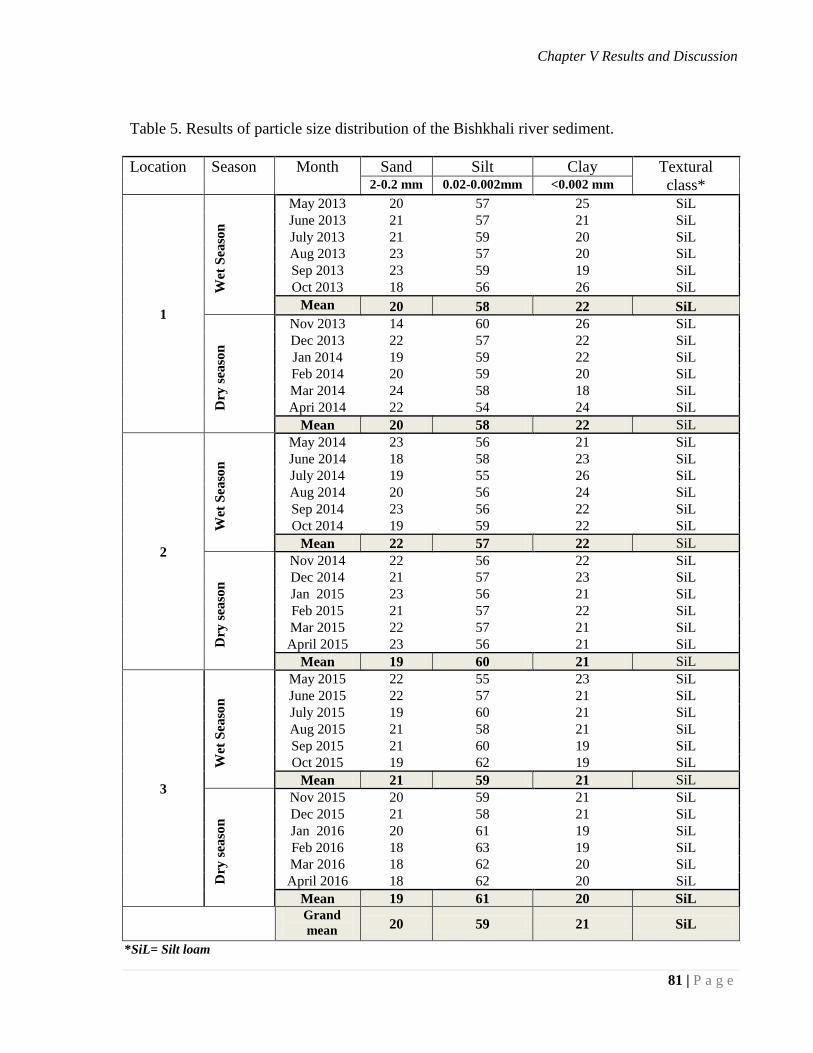
Chapter V Results and Discussion
81 | P a g e
Table 5. Results of particle size distribution of the Bishkhali river sediment.
Location Season Month Sand Silt Clay Textural
class* 2-0.2 mm 0.02-0.002mm <0.002 mm
1
Wet
Sea
son
May 2013 20 57 25 SiL
June 2013 21 57 21 SiL
July 2013 21 59 20 SiL
Aug 2013 23 57 20 SiL
Sep 2013 23 59 19 SiL
Oct 2013 18 56 26 SiL
Mean 20 58 22 SiL
Dry
sea
son
Nov 2013 14 60 26 SiL
Dec 2013 22 57 22 SiL
Jan 2014 19 59 22 SiL
Feb 2014 20 59 20 SiL
Mar 2014 24 58 18 SiL
Apri 2014 22 54 24 SiL
Mean 20 58 22 SiL
2
Wet
Sea
son
May 2014 23 56 21 SiL
June 2014 18 58 23 SiL
July 2014 19 55 26 SiL
Aug 2014 20 56 24 SiL
Sep 2014 23 56 22 SiL
Oct 2014 19 59 22 SiL
Mean 22 57 22 SiL
Dry
sea
son
Nov 2014 22 56 22 SiL
Dec 2014 21 57 23 SiL
Jan 2015 23 56 21 SiL
Feb 2015 21 57 22 SiL
Mar 2015 22 57 21 SiL
April 2015 23 56 21 SiL
Mean 19 60 21 SiL
3
Wet
Sea
son
May 2015 22 55 23 SiL
June 2015 22 57 21 SiL
July 2015 19 60 21 SiL
Aug 2015 21 58 21 SiL
Sep 2015 21 60 19 SiL
Oct 2015 19 62 19 SiL
Mean 21 59 21 SiL
Dry
sea
son
Nov 2015 20 59 21 SiL
Dec 2015 21 58 21 SiL
Jan 2016 20 61 19 SiL
Feb 2016 18 63 19 SiL
Mar 2016 18 62 20 SiL
April 2016 18 62 20 SiL
Mean 19 61 20 SiL
Grand
mean 20 59 21 SiL
*SiL= Silt loam
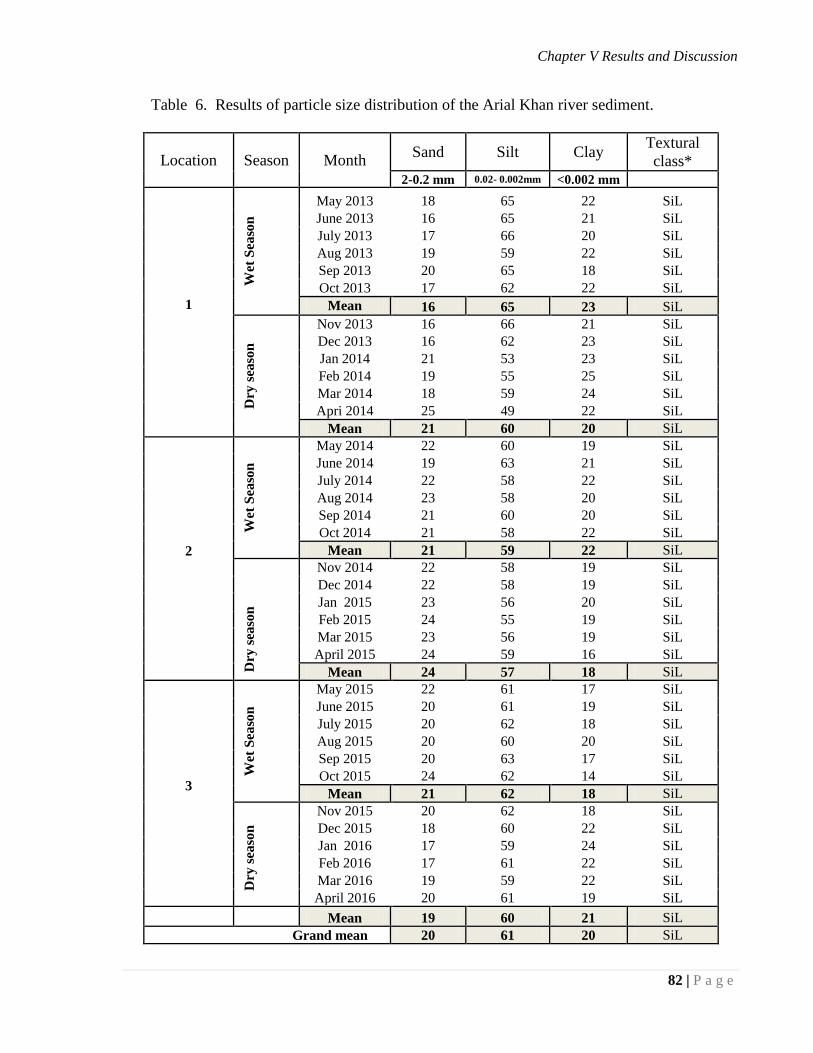
Chapter V Results and Discussion
82 | P a g e
Table 6. Results of particle size distribution of the Arial Khan river sediment.
Location Season Month Sand Silt Clay
Textural
class* 2-0.2 mm 0.02- 0.002mm <0.002 mm
1
Wet
Sea
son
May 2013 18 65 22 SiL
June 2013 16 65 21 SiL
July 2013 17 66 20 SiL
Aug 2013 19 59 22 SiL
Sep 2013 20 65 18 SiL
Oct 2013 17 62 22 SiL
Mean 16 65 23 SiL
Dry
sea
son
Nov 2013 16 66 21 SiL
Dec 2013 16 62 23 SiL
Jan 2014 21 53 23 SiL
Feb 2014 19 55 25 SiL
Mar 2014 18 59 24 SiL
Apri 2014 25 49 22 SiL
Mean 21 60 20 SiL
2
Wet
Sea
son
May 2014 22 60 19 SiL
June 2014 19 63 21 SiL
July 2014 22 58 22 SiL
Aug 2014 23 58 20 SiL
Sep 2014 21 60 20 SiL
Oct 2014 21 58 22 SiL
Mean 21 59 22 SiL
Dry
sea
son
Nov 2014 22 58 19 SiL
Dec 2014 22 58 19 SiL
Jan 2015 23 56 20 SiL
Feb 2015 24 55 19 SiL
Mar 2015 23 56 19 SiL
April 2015 24 59 16 SiL
Mean 24 57 18 SiL
3
Wet
Sea
son
May 2015 22 61 17 SiL
June 2015 20 61 19 SiL
July 2015 20 62 18 SiL
Aug 2015 20 60 20 SiL
Sep 2015 20 63 17 SiL
Oct 2015 24 62 14 SiL
Mean 21 62 18 SiL
Dry
sea
son
Nov 2015 20 62 18 SiL
Dec 2015 18 60 22 SiL
Jan 2016 17 59 24 SiL
Feb 2016 17 61 22 SiL
Mar 2016 19 59 22 SiL
April 2016 20 61 19 SiL
Mean 19 60 21 SiL
Grand mean 20 61 20 SiL
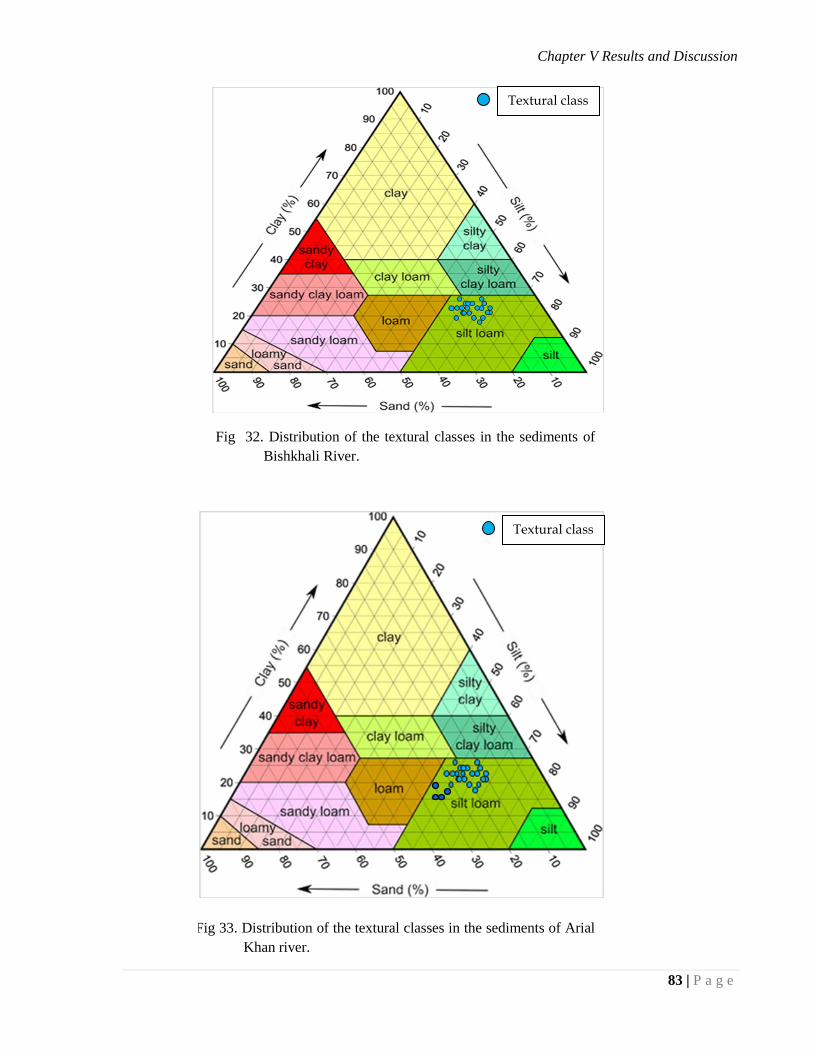
Chapter V Results and Discussion
83 | P a g e
Fig 32. Distribution of the textural classes in the sediments of
Bishkhali River.
Textural class
Fig 33. Distribution of the textural classes in the sediments of Arial
Khan river.
Textural class
Chapter V Results and Discussion
84 | P a g e
5.3 Chemical parameters of the sediments
5.3.1 pH
The results of pH (H2O) of the sediment samples have been presented in Table 7 &
Appendix 5 & 6. The pH of the sediments ranged from 7.7 to 8.0 with a mean value of 7.9. The
high pH value was found in both the river suspended sediments that indicates slightly alkaline
in reaction. The results showed that there were no significant differences in pH value between
the sediments of two rivers. When pH was determined with I N KCl solution in place of water,
there was a substantial decrease in pH values than that in water. This decrease in pH value has
been designated as ∆pH value. The ∆pH values of all the studied sediments were negative and
ranged from – 0.1 to – 0.3 which point out low content of reserve acidity.
Hossain (1992) studied the loose sediments of some coastal river of Bangladesh and
noted pH values in all the sediments around 8.0. Rahman et al. (2009) found the pH of the
Ganges and the Brahmaputra sediments ranged from 6.95 to 7.9.
Jalal et al. (2009) examined the coastal sediment of Malaysia and found the pH value ranged
from 7.72 to 8.20.
5.3.2 Electrical conductivity (EC)
The electrical conductivity of the sediment ranged from 0.248 to 0.167 dS/m (Table 7;
Appendix 5 & 6) which was very low. EC value in the sediments indicates that sediments are
non-saline. The results showed seasonal variation among the sediments of two rivers and are in
accord with the findings of Rahman (2009); (BARC, 2012). Rahman studied the Ganges and
Brahmaputra river sediment and found the (EC) ranged from 0.20 to 0.32 dS/m .
5.3.3 Free lime of the sediments
The presence of free lime provides information about the nature of sediment. The free
lime contents in the studied sediments range from 3.0 to 5.4 percent (Table 7; Appendix 5 & 6).
In both the season free lime was found more or less similar in composition in both the river
sediments. From these findings it can be assumed that sediments are well mixed of three
mighty rivers – Ganges, Brahmaputra and Meghna and slightly calcarious in nature. Lime
content in the Ganges sediments was found higher than the Brahmaputra sediment and Ganges
sediments reported as calcareous sediment (Rahman et al. 2009).
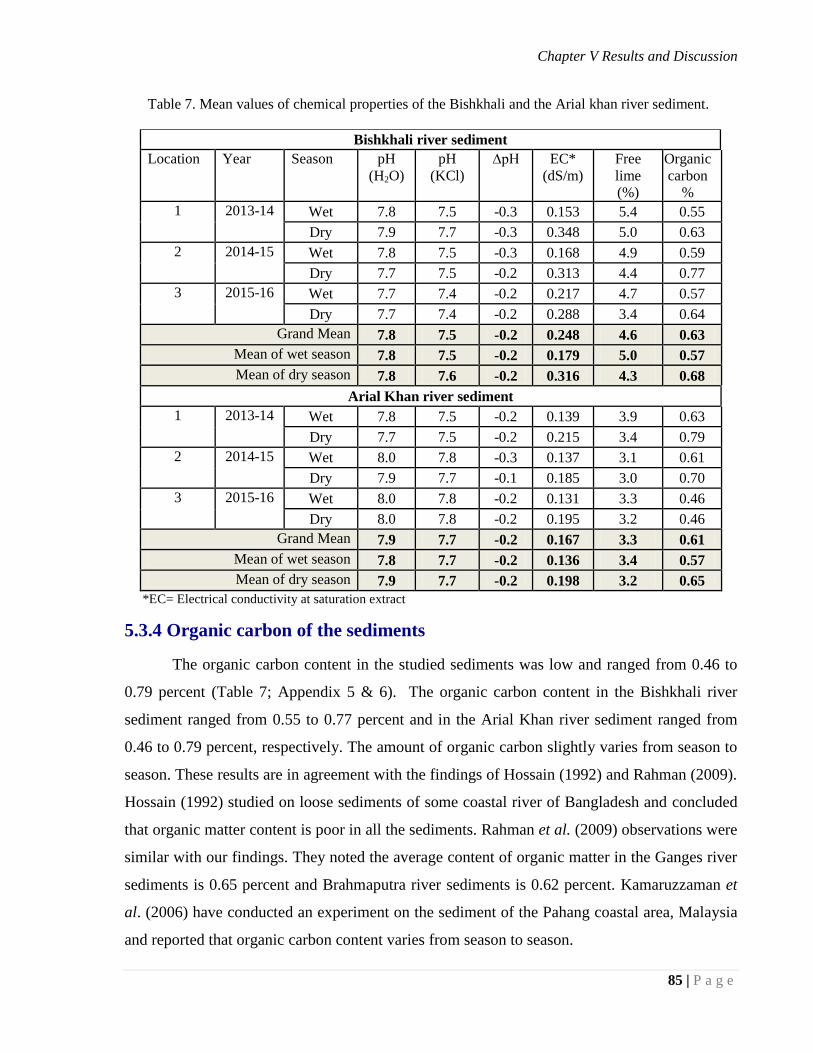
Chapter V Results and Discussion
85 | P a g e
Table 7. Mean values of chemical properties of the Bishkhali and the Arial khan river sediment.
Bishkhali river sediment
Location Year Season pH
(H2O)
pH
(KCl)
∆pH EC*
(dS/m)
Free
lime
(%)
Organic
carbon
%
1 2013-14 Wet 7.8 7.5 -0.3 0.153 5.4 0.55
Dry 7.9 7.7 -0.3 0.348 5.0 0.63
2 2014-15 Wet 7.8 7.5 -0.3 0.168 4.9 0.59
Dry 7.7 7.5 -0.2 0.313 4.4 0.77
3 2015-16 Wet 7.7 7.4 -0.2 0.217 4.7 0.57
Dry 7.7 7.4 -0.2 0.288 3.4 0.64
Grand Mean 7.8 7.5 -0.2 0.248 4.6 0.63
Mean of wet season 7.8 7.5 -0.2 0.179 5.0 0.57
Mean of dry season 7.8 7.6 -0.2 0.316 4.3 0.68
Arial Khan river sediment
1 2013-14 Wet 7.8 7.5 -0.2 0.139 3.9 0.63
Dry 7.7 7.5 -0.2 0.215 3.4 0.79
2 2014-15 Wet 8.0 7.8 -0.3 0.137 3.1 0.61
Dry 7.9 7.7 -0.1 0.185 3.0 0.70
3 2015-16 Wet 8.0 7.8 -0.2 0.131 3.3 0.46
Dry 8.0 7.8 -0.2 0.195 3.2 0.46
Grand Mean 7.9 7.7 -0.2 0.167 3.3 0.61
Mean of wet season 7.8 7.7 -0.2 0.136 3.4 0.57
Mean of dry season 7.9 7.7 -0.2 0.198 3.2 0.65
*EC= Electrical conductivity at saturation extract
5.3.4 Organic carbon of the sediments
The organic carbon content in the studied sediments was low and ranged from 0.46 to
0.79 percent (Table 7; Appendix 5 & 6). The organic carbon content in the Bishkhali river
sediment ranged from 0.55 to 0.77 percent and in the Arial Khan river sediment ranged from
0.46 to 0.79 percent, respectively. The amount of organic carbon slightly varies from season to
season. These results are in agreement with the findings of Hossain (1992) and Rahman (2009).
Hossain (1992) studied on loose sediments of some coastal river of Bangladesh and concluded
that organic matter content is poor in all the sediments. Rahman et al. (2009) observations were
similar with our findings. They noted the average content of organic matter in the Ganges river
sediments is 0.65 percent and Brahmaputra river sediments is 0.62 percent. Kamaruzzaman et
al. (2006) have conducted an experiment on the sediment of the Pahang coastal area, Malaysia
and reported that organic carbon content varies from season to season.
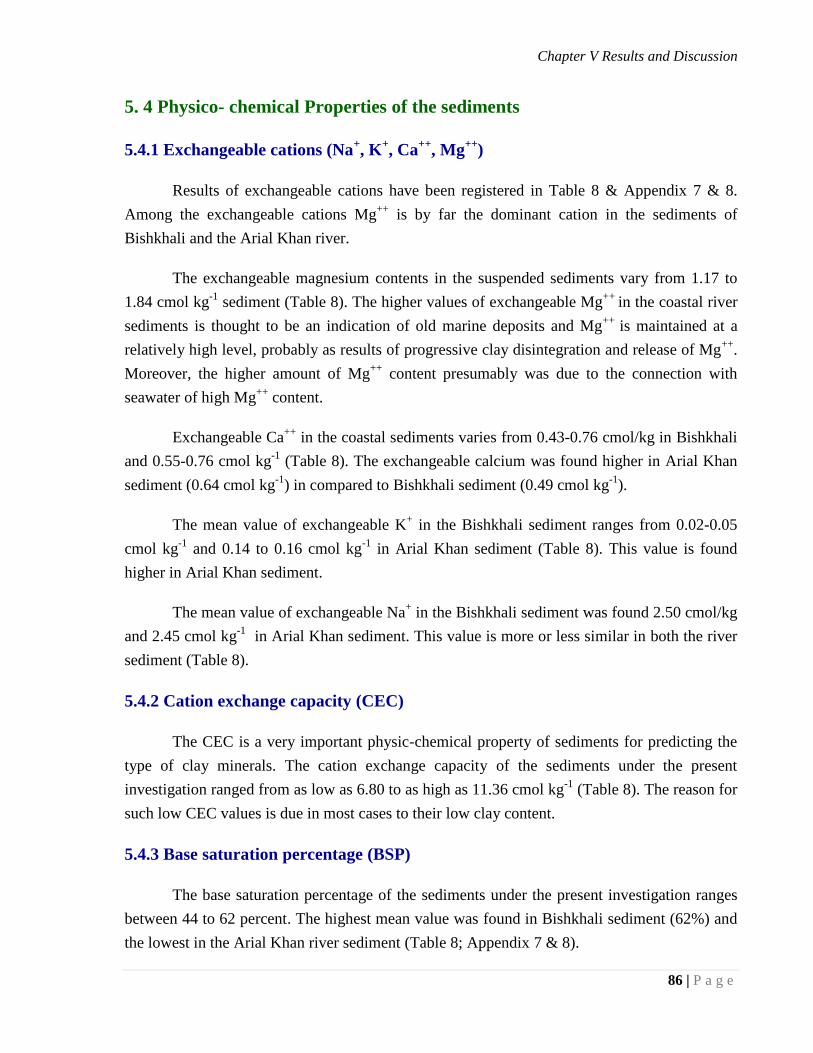
Chapter V Results and Discussion
86 | P a g e
5. 4 Physico- chemical Properties of the sediments
5.4.1 Exchangeable cations (Na+, K
+, Ca
++, Mg
++)
Results of exchangeable cations have been registered in Table 8 & Appendix 7 & 8.
Among the exchangeable cations Mg++
is by far the dominant cation in the sediments of
Bishkhali and the Arial Khan river.
The exchangeable magnesium contents in the suspended sediments vary from 1.17 to
1.84 cmol kg-1
sediment (Table 8). The higher values of exchangeable Mg++
in the coastal river
sediments is thought to be an indication of old marine deposits and Mg++
is maintained at a
relatively high level, probably as results of progressive clay disintegration and release of Mg++
.
Moreover, the higher amount of Mg++
content presumably was due to the connection with
seawater of high Mg++
content.
Exchangeable Ca++
in the coastal sediments varies from 0.43-0.76 cmol/kg in Bishkhali
and 0.55-0.76 cmol kg-1
(Table 8). The exchangeable calcium was found higher in Arial Khan
sediment (0.64 cmol kg-1
) in compared to Bishkhali sediment (0.49 cmol kg-1
).
The mean value of exchangeable K+ in the Bishkhali sediment ranges from 0.02-0.05
cmol kg-1
and 0.14 to 0.16 cmol kg-1
in Arial Khan sediment (Table 8). This value is found
higher in Arial Khan sediment.
The mean value of exchangeable Na+ in the Bishkhali sediment was found 2.50 cmol/kg
and 2.45 cmol kg-1
in Arial Khan sediment. This value is more or less similar in both the river
sediment (Table 8).
5.4.2 Cation exchange capacity (CEC)
The CEC is a very important physic-chemical property of sediments for predicting the
type of clay minerals. The cation exchange capacity of the sediments under the present
investigation ranged from as low as 6.80 to as high as 11.36 cmol kg-1
(Table 8). The reason for
such low CEC values is due in most cases to their low clay content.
5.4.3 Base saturation percentage (BSP)
The base saturation percentage of the sediments under the present investigation ranges
between 44 to 62 percent. The highest mean value was found in Bishkhali sediment (62%) and
the lowest in the Arial Khan river sediment (Table 8; Appendix 7 & 8).
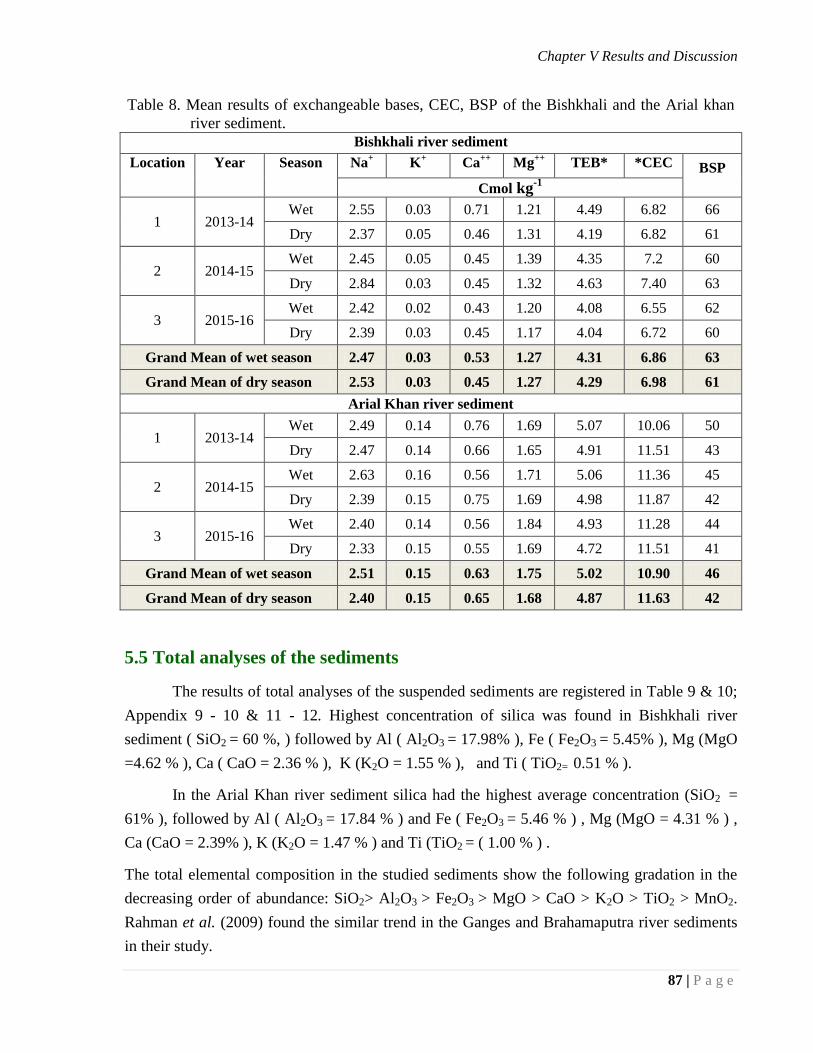
Chapter V Results and Discussion
87 | P a g e
Table 8. Mean results of exchangeable bases, CEC, BSP of the Bishkhali and the Arial khan
river sediment.
Bishkhali river sediment
Location Year Season Na+ K
+ Ca
++ Mg
++ TEB* *CEC BSP
Cmol kg-1
1 2013-14 Wet 2.55 0.03 0.71 1.21 4.49 6.82 66
Dry 2.37 0.05 0.46 1.31 4.19 6.82 61
2 2014-15 Wet 2.45 0.05 0.45 1.39 4.35 7.2 60
Dry 2.84 0.03 0.45 1.32 4.63 7.40 63
3 2015-16 Wet 2.42 0.02 0.43 1.20 4.08 6.55 62
Dry 2.39 0.03 0.45 1.17 4.04 6.72 60
Grand Mean of wet season 2.47 0.03 0.53 1.27 4.31 6.86 63
Grand Mean of dry season 2.53 0.03 0.45 1.27 4.29 6.98 61
Arial Khan river sediment
1 2013-14 Wet 2.49 0.14 0.76 1.69 5.07 10.06 50
Dry 2.47 0.14 0.66 1.65 4.91 11.51 43
2 2014-15 Wet 2.63 0.16 0.56 1.71 5.06 11.36 45
Dry 2.39 0.15 0.75 1.69 4.98 11.87 42
3 2015-16 Wet 2.40 0.14 0.56 1.84 4.93 11.28 44
Dry 2.33 0.15 0.55 1.69 4.72 11.51 41
Grand Mean of wet season 2.51 0.15 0.63 1.75 5.02 10.90 46
Grand Mean of dry season 2.40 0.15 0.65 1.68 4.87 11.63 42
5.5 Total analyses of the sediments
The results of total analyses of the suspended sediments are registered in Table 9 & 10;
Appendix 9 - 10 & 11 - 12. Highest concentration of silica was found in Bishkhali river
sediment ( SiO2 = 60 %, ) followed by Al ( Al2O3 = 17.98% ), Fe ( Fe2O3 = 5.45% ), Mg (MgO
=4.62 % ), Ca ( CaO = 2.36 % ), K (K2O = 1.55 % ), and Ti ( TiO2= 0.51 % ).
In the Arial Khan river sediment silica had the highest average concentration (SiO2 =
61% ), followed by Al ( Al2O3 = 17.84 % ) and Fe ( Fe2O3 = 5.46 % ) , Mg (MgO = 4.31 % ) ,
Ca (CaO = 2.39% ), K (K2O = 1.47 % ) and Ti (TiO2 = ( 1.00 % ) .
The total elemental composition in the studied sediments show the following gradation in the
decreasing order of abundance: SiO2> Al2O3 > Fe2O3 > MgO > CaO > K2O > TiO2 > MnO2.
Rahman et al. (2009) found the similar trend in the Ganges and Brahamaputra river sediments
in their study.
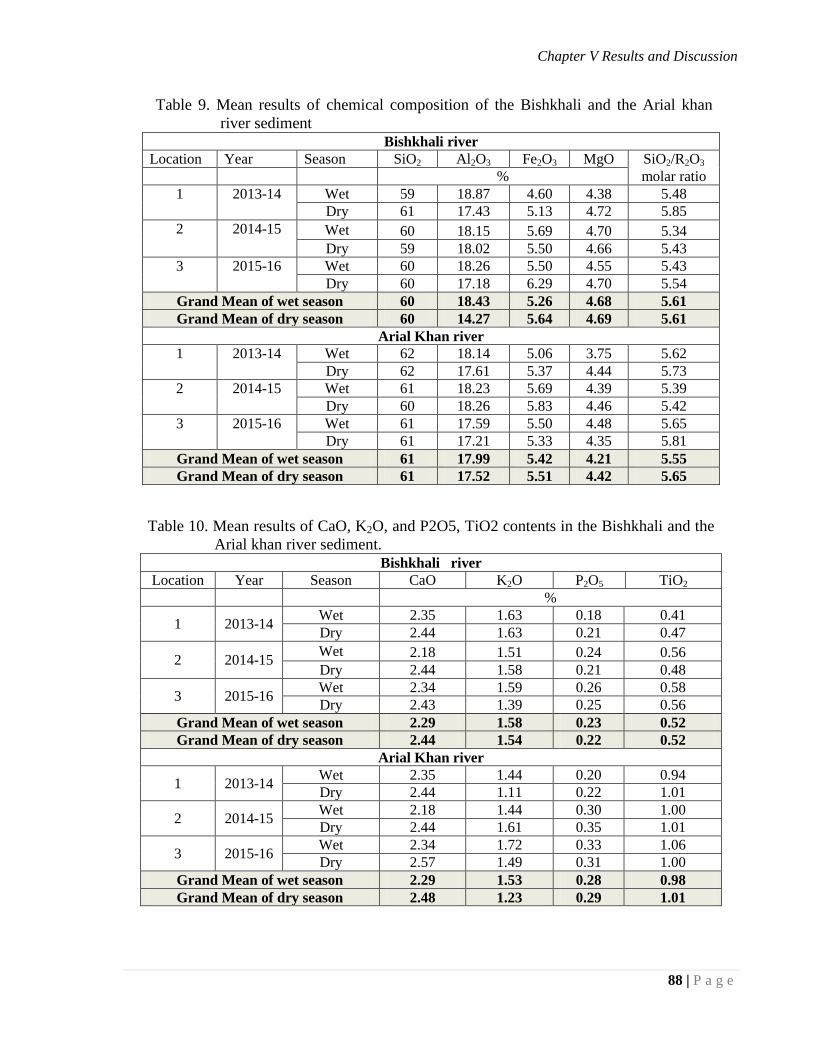
Chapter V Results and Discussion
88 | P a g e
Table 9. Mean results of chemical composition of the Bishkhali and the Arial khan
river sediment
Bishkhali river
Location Year Season SiO2 Al2O3 Fe2O3 MgO SiO2/R2O3
% molar ratio
1 2013-14 Wet 59 18.87 4.60 4.38 5.48
Dry 61 17.43 5.13 4.72 5.85
2 2014-15 Wet 60 18.15 5.69 4.70 5.34
Dry 59 18.02 5.50 4.66 5.43
3 2015-16 Wet 60 18.26 5.50 4.55 5.43
Dry 60 17.18 6.29 4.70 5.54
Grand Mean of wet season 60 18.43 5.26 4.68 5.61
Grand Mean of dry season 60 14.27 5.64 4.69 5.61
Arial Khan river
1 2013-14 Wet 62 18.14 5.06 3.75 5.62
Dry 62 17.61 5.37 4.44 5.73
2 2014-15 Wet 61 18.23 5.69 4.39 5.39
Dry 60 18.26 5.83 4.46 5.42
3 2015-16 Wet 61 17.59 5.50 4.48 5.65
Dry 61 17.21 5.33 4.35 5.81
Grand Mean of wet season 61 17.99 5.42 4.21 5.55
Grand Mean of dry season 61 17.52 5.51 4.42 5.65
Table 10. Mean results of CaO, K2O, and P2O5, TiO2 contents in the Bishkhali and the
Arial khan river sediment.
Bishkhali river
Location Year Season CaO K2O P2O5 TiO2
%
1 2013-14 Wet 2.35 1.63 0.18 0.41
Dry 2.44 1.63 0.21 0.47
2 2014-15 Wet 2.18 1.51 0.24 0.56
Dry 2.44 1.58 0.21 0.48
3 2015-16 Wet 2.34 1.59 0.26 0.58
Dry 2.43 1.39 0.25 0.56
Grand Mean of wet season 2.29 1.58 0.23 0.52
Grand Mean of dry season 2.44 1.54 0.22 0.52
Arial Khan river
1 2013-14 Wet 2.35 1.44 0.20 0.94
Dry 2.44 1.11 0.22 1.01
2 2014-15 Wet 2.18 1.44 0.30 1.00
Dry 2.44 1.61 0.35 1.01
3 2015-16 Wet 2.34 1.72 0.33 1.06
Dry 2.57 1.49 0.31 1.00
Grand Mean of wet season 2.29 1.53 0.28 0.98
Grand Mean of dry season 2.48 1.23 0.29 1.01
Chapter V Results and Discussion
89 | P a g e
5.6 Morphological characteristics of the soils
An attempt has been made to look into the morphological characteristics of the coastal
floodplain soils of Bangladesh to see whether they reflect the influence of the existing soil
forming factors. Detailed morphological description of the soil profiles have been presented in
the previous chapter. From that description it is evident that an incipient B horizon has
developed in all the soils under study. This development is an outstanding feature in the life
history of these soils. This B horizon has been designated as structural B and therefore has been
considered as a cambic horizon.
The coded morphological properties of the studied soils have been presented in Table
11. Among the salient morphogenetic properties of the soils colour, mottling, consistence,
structure, texture and root distribution have been recorded and discussed in the following
sections.
The matrix colour of the present soils is a combination of grey to dark grey and olive
grey to light olive grey colours. Under moist condition, the matrix color of surface horizon of
all the profiles was found to be grey (5Y 5/1, moist) and dark grey (5Y 4/1 moist). The
dominant hue of the soil matrix, when moist is 5Y while two or three horizons were 2.5Y.
These hues in these soils have been developed due to prolonged submergence during rainy
season and drying condition during the dry months. These hues are related to the loss of free
iron in these soils. The soils have low chroma which is < 2 in most of them (Table 11).
All the soils remain flooded during the monsoon season. Oxidation during the dry
season and reduction during the wet season are the two usual conditions in these soils. Through
this alternate oxidation-reduction condition the soil materials gradually become ripened. The
seasonal alternate drying and wetting cycles in the soils resulted in release of iron from iron
bearing minerals and create a condition for transformation of Fe2+
to Fe3+
which in turn was
precipitated and fixed in the form of mottles in the sub-surface horizon of the soils. This
process has been designated as Ferrolysis by Brinkman (1977).
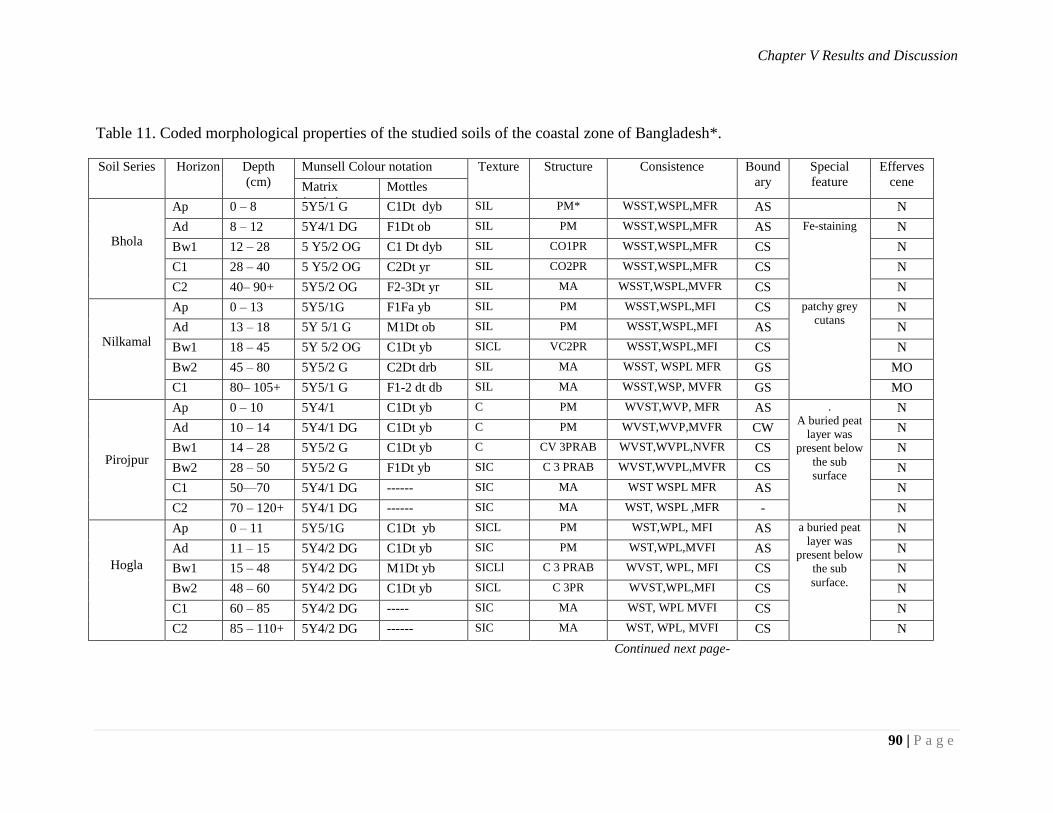
Chapter V Results and Discussion
90 | P a g e
Table 11. Coded morphological properties of the studied soils of the coastal zone of Bangladesh*.
Soil Series Horizon Depth
(cm)
Munsell Colour notation Texture Structure Consistence Bound
ary
Special
feature
Efferves
cene Matrix
(moist)
Mottles
Bhola
Ap 0 – 8 5Y5/1 G C1Dt dyb SIL PM* WSST,WSPL,MFR AS N
Ad 8 – 12 5Y4/1 DG F1Dt ob SIL PM WSST,WSPL,MFR AS Fe-staining N
Bw1 12 – 28 5 Y5/2 OG C1 Dt dyb SIL CO1PR WSST,WSPL,MFR CS N
C1 28 – 40 5 Y5/2 OG C2Dt yr SIL CO2PR WSST,WSPL,MFR CS N
C2 40– 90+ 5Y5/2 OG F2-3Dt yr SIL MA WSST,WSPL,MVFR CS N
Nilkamal
Ap 0 – 13 5Y5/1G F1Fa yb SIL PM WSST,WSPL,MFI CS patchy grey
cutans N
Ad 13 – 18 5Y 5/1 G M1Dt ob SIL PM WSST,WSPL,MFI AS N
Bw1 18 – 45 5Y 5/2 OG C1Dt yb SICL VC2PR WSST,WSPL,MFI CS N
Bw2 45 – 80 5Y5/2 G C2Dt drb SIL MA WSST, WSPL MFR GS MO
C1 80– 105+ 5Y5/1 G F1-2 dt db SIL MA WSST,WSP, MVFR GS MO
Pirojpur
Ap 0 – 10 5Y4/1
C1Dt yb C PM WVST,WVP, MFR AS .
A buried peat
layer was
present below
the sub
surface
N
Ad 10 – 14 5Y4/1 DG C1Dt yb C PM WVST,WVP,MVFR CW N
Bw1 14 – 28 5Y5/2 G C1Dt yb C CV 3PRAB WVST,WVPL,NVFR CS N
Bw2 28 – 50 5Y5/2 G F1Dt yb SIC C 3 PRAB WVST,WVPL,MVFR CS N
C1 50—70 5Y4/1 DG ------ SIC MA WST WSPL MFR AS N
C2 70 – 120+ 5Y4/1 DG ------ SIC MA WST, WSPL ,MFR - N
Hogla
Ap 0 – 11 5Y5/1G C1Dt yb SICL PM WST,WPL, MFI AS a buried peat
layer was
present below
the sub
surface.
N
Ad 11 – 15 5Y4/2 DG C1Dt yb SIC PM WST,WPL,MVFI AS N
Bw1 15 – 48 5Y4/2 DG M1Dt yb SICLl C 3 PRAB WVST, WPL, MFI CS N
Bw2 48 – 60 5Y4/2 DG C1Dt yb SICL C 3PR WVST,WPL,MFI CS N
C1 60 – 85 5Y4/2 DG ----- SIC MA WST, WPL MVFI CS N
C2 85 – 110+ 5Y4/2 DG ------ SIC MA WST, WPL, MVFI CS N
Continued next page-
---------
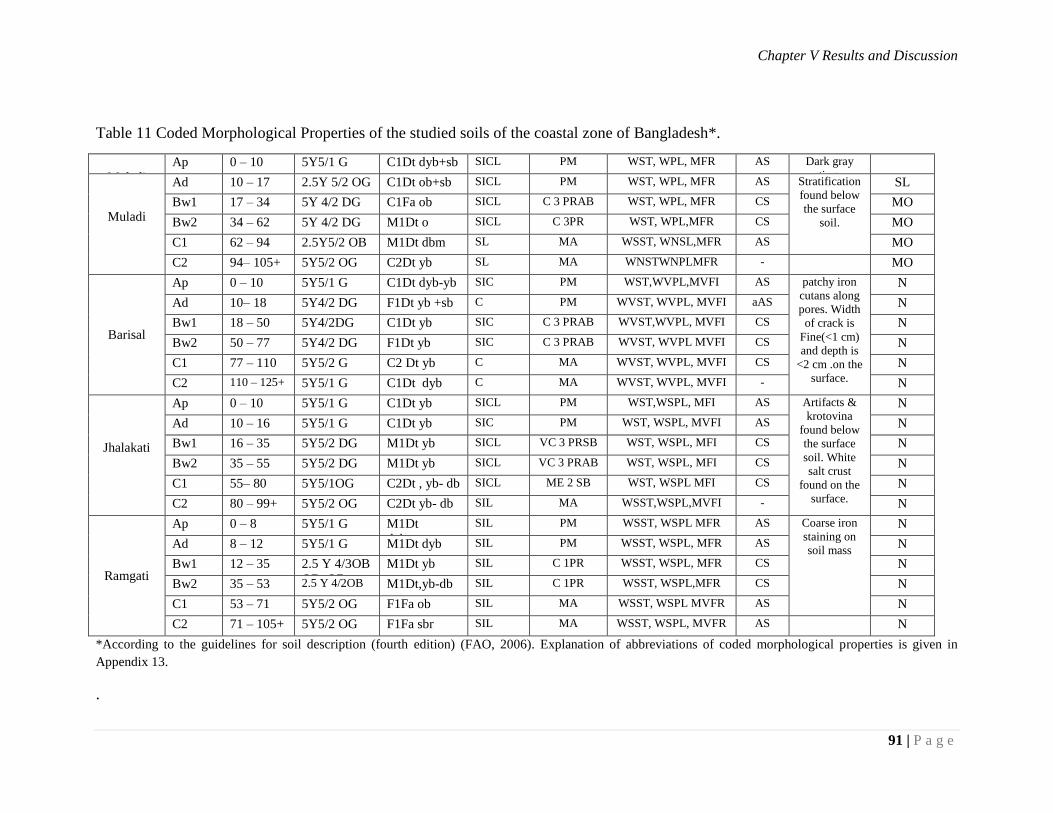
Chapter V Results and Discussion
91 | P a g e
Table 11 Coded Morphological Properties of the studied soils of the coastal zone of Bangladesh*.
Muladi
Ap 0 – 10 5Y5/1 G C1Dt dyb+sb SICL PM WST, WPL, MFR AS Dark gray
coatings on
ped faces
Muladi
Ad 10 – 17 2.5Y 5/2 OG C1Dt ob+sb SICL PM WST, WPL, MFR AS Stratification
found below
the surface
soil.
SL
Bw1 17 – 34 5Y 4/2 DG C1Fa ob SICL C 3 PRAB WST, WPL, MFR CS MO
Bw2 34 – 62 5Y 4/2 DG M1Dt o SICL C 3PR WST, WPL,MFR CS MO
C1 62 – 94 2.5Y5/2 OB M1Dt dbm SL MA WSST, WNSL,MFR AS MO
C2 94– 105+ 5Y5/2 OG C2Dt yb SL MA WNSTWNPLMFR - MO
Barisal
Ap 0 – 10 5Y5/1 G C1Dt dyb-yb SIC PM WST,WVPL,MVFI AS patchy iron
cutans along
pores. Width
of crack is
Fine(<1 cm)
and depth is
<2 cm .on the
surface.
N
Ad 10– 18 5Y4/2 DG F1Dt yb +sb C PM WVST, WVPL, MVFI aAS N
Bw1 18 – 50 5Y4/2DG C1Dt yb SIC C 3 PRAB WVST,WVPL, MVFI CS N
Bw2 50 – 77 5Y4/2 DG F1Dt yb SIC C 3 PRAB WVST, WVPL MVFI CS N
C1 77 – 110 5Y5/2 G C2 Dt yb C MA WVST, WVPL, MVFI CS N
C2 110 – 125+ 5Y5/1 G C1Dt dyb C MA WVST, WVPL, MVFI - N
Jhalakati
Ap 0 – 10 5Y5/1 G C1Dt yb SICL PM WST,WSPL, MFI AS Artifacts &
krotovina
found below
the surface
soil. White
salt crust
found on the
surface.
N
Ad 10 – 16 5Y5/1 G C1Dt yb SIC PM WST, WSPL, MVFI AS N
Bw1 16 – 35 5Y5/2 DG M1Dt yb SICL VC 3 PRSB WST, WSPL, MFI CS N
Bw2 35 – 55 5Y5/2 DG M1Dt yb SICL VC 3 PRAB WST, WSPL, MFI CS N
C1 55– 80 5Y5/1OG C2Dt , yb- db SICL ME 2 SB WST, WSPL MFI CS N
C2 80 – 99+ 5Y5/2 OG C2Dt yb- db SIL MA WSST,WSPL,MVFI - N
Ramgati
Ap 0 – 8 5Y5/1 G M1Dt
dyb+gg
SIL PM WSST, WSPL MFR AS Coarse iron
staining on
soil mass
N
Ad 8 – 12 5Y5/1 G M1Dt dyb SIL PM WSST, WSPL, MFR AS N
Bw1 12 – 35 2.5 Y 4/3OB
OB OB
M1Dt yb SIL C 1PR WSST, WSPL, MFR CS N
Bw2 35 – 53 2.5 Y 4/2OB M1Dt,yb-db SIL C 1PR WSST, WSPL,MFR CS N
C1 53 – 71 5Y5/2 OG F1Fa ob SIL MA WSST, WSPL MVFR AS N
C2 71 – 105+ 5Y5/2 OG F1Fa sbr SIL MA WSST, WSPL, MVFR AS N
*According to the guidelines for soil description (fourth edition) (FAO, 2006). Explanation of abbreviations of coded morphological properties is given in
Appendix 13.
.
Chapter V Results and Discussion
92 | P a g e
The variation of soil colors may be related to variation in duration of flooding
period, oxidation-reduction and movement of iron from the surface downward as well as the
quantity of organic matter (Brammer, 1971; Daniel et al. 1971; Diwakar and Singh, 1992;
Begum et al. 2004). The variation in drainage condition is also responsible for variation in
soil colors
Moorman (1978) noted that in seasonally flooded soils the sub-surface horizon
usually develop perfect grey colors. It must be remembered that the relict colors i.e. those
inherited from the parent materials, may be present in some soils.
Hussain et al. (1989) also pointed out the occurrence of similar hues in some soils of
coastal belt. It was noted earlier that the studied soils are basically poorly drained. In poorly
drained soil, water is removed so slowly that the soil remains wet for longer period of time.
The land sometimes remains wet after the monsoon season.
Due to alternate wetting and drying condition abundant quantities of mottles have
formed in all the soil profiles (Table 11). The color of mottles was a combination of dark
brown to strong brown and light yellowish brown to yellowish brown. These color patterns
might have been developed along root channels and pores created by crabs and other soil
habitats that facilitate air to enter into the soil mass when the flood water recedes. The size
and contrast of mottles showed variation from soil to soil. This is due to the intensity and
duration of oxidation-reduction conditions in the soils (Rahman et al. 2009; Khan et al.
2012; Islam et al. 2014b). The presence of mottled in the sub-surface zone is the
characteristics of hydromorphic soils (Joffe, 1966).
The formation of variously coloured mottles is generally associated with seasonal
fluctuation of ground water table (Mckeague, 1965). Field evidence suggests that the degree
of development of mottles differs considerably in soils of apparently similar moisture
regime. Such difference in development of mottle at least partly may be ascribed to the
nature of the parent materials.
Silt loam to silty clay loam is the dominant texture in the sub-soil horizons of ridge
position whereas in the sub-soils horizons of basin soil profile it is silty clay to clay.
The structure of the soils was massive in all the surface horizon of the studied soils.
Any stable structure did not develop in the surface horizon as it has been ploughed for many
years with puddling as a usual feature. Weak prismatic to angular blocky structure showed
in the B horizon of all the studied profiles.
Continuous or nearly continuous thick dark grey to very dark grey cutans along
vertical and horizontal ped faces were found in the sub-soils in all the profiles. The coatings
on ped faces may possibly be due to mechanical down washing of material from the soil
surface through cracks when the soils are flooded and ploughed (Khan et al. 2012).
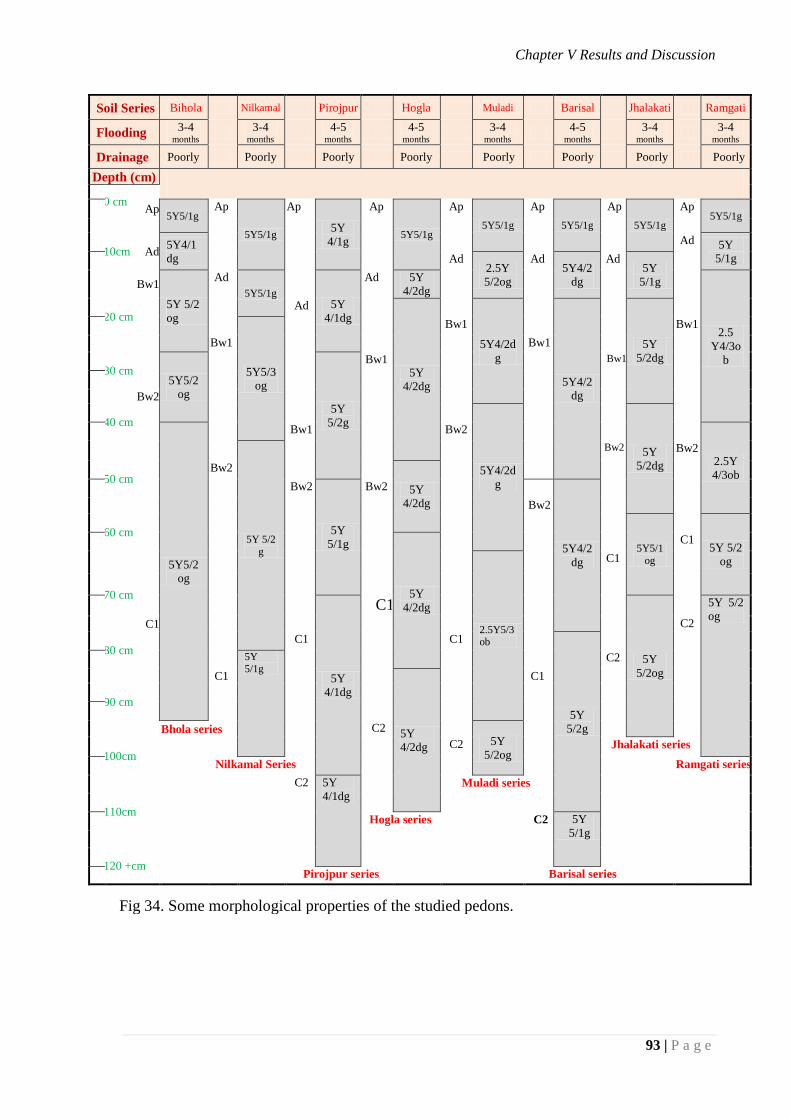
Chapter V Results and Discussion
93 | P a g e
Soil Series Bihola Nilkamal Pirojpur Hogla Muladi Barisal Jhalakati Ramgati
Flooding 3-4
months 3-4
months 4-5
months 4-5
months 3-4
months 4-5
months 3-4
months 3-4
months
Drainage Poorly Poorly Poorly Poorly Poorly Poorly Poorly Poorly
Depth (cm)
0 cm
Ap 5Y5/1g
Ap
5Y5/1g
Ap
5Y
4/1g
Ap
5Y5/1g
Ap
5Y5/1g
Ap
5Y5/1g
Ap
5Y5/1g
Ap 5Y5/1g
10cm Ad 5Y4/1
dg
Ad 5Y
5/1g
Ad 2.5Y
5/2og
Ad 5Y4/2
dg
Ad 5Y
5/1g
Bw1
5Y 5/2
og
Ad
5Y5/1g
5Y
4/1dg
Ad 5Y
4/2dg
2.5
Y4/3o
b
20 cm Ad
5Y
4/2dg
5Y4/2d
g
5Y4/2
dg
5Y
5/2dg
5Y5/3
og
Bw1 Bw1
Bw1 Bw1
30 cm 5Y5/2
og
5Y
5/2g
Bw1 Bw1
Bw2
40 cm
5Y4/2d
g
5Y
5/2dg
5Y5/2
og
Bw1 Bw2
2.5Y
4/3ob
5Y 5/2
g
Bw2 Bw2
50 cm Bw2
5Y
4/2dg
Bw2
5Y
5/1g
Bw2
5Y4/2
dg
Bw2
60 cm
5Y5/1
og
5Y 5/2
og
5Y
4/2dg
C1
2.5Y5/3ob
C1
70 cm
5Y
4/1dg
C1
5Y
5/2og
5Y 5/2
og C1 C2
80 cm C1 C1
5Y
5/2g
5Y 5/1g
C2
C1
5Y
4/2dg
C1
90 cm
Bhola series C2 5Y
5/2og
100cm C2 Jhalakati series
Nilkamal Series Ramgati series
C2 5Y
4/1dg
Muladi series
110cm
Hogla series C2 5Y
5/1g
120 +cm Pirojpur series Barisal series
Fig 34. Some morphological properties of the studied pedons.
Chapter V Results and Discussion
94 | P a g e
Horizon boundaries are important morphological properties in soil profiles. Horizon
boundaries provide information on the dominant soil- forming processes that have formed
the soil. Most soil boundaries are zones of transition rather than sharp line of division. Clear
smooth boundary was found in most of the soils. Khan et al. (2012) also found the similar
boundary in the floodplain soil of Bangladesh.
Another important feature is the effervescence of carbon dioxide gas with 10% HCl
to the soil. The effervescence indicates the amount of calcium carbonate present of the soils.
Bhola, Nilkamal and Ramgati soil show slightly effervescence (audible effervescence but
not visible) while Muladi soil showed moderately effervescence (visible effervescence) with
HCl. No effervescence phenomenon found in the rest soil pedon.
Ploughpan occurs at a depth of 5 to 15 cm in all the pedons, depending on the
normal depth of ploughing. It is normally formed due to continuous rice cultivation (FAO,
1971). It has been observed that the ploughpan becomes thicker and harder through
continuous practice of transplanted Aman rice cultivation.
Results of soil consistence are very important for soil management especially during
tillage. This assumes importance when the soils are ploughed in wet condition. The
consistence of the soils under study have been determined under three moisture conditions-
moist and wet (Soil Survey Staff, 1975).
The consistence of the surface soils of studied alluvium soil was found to be hard to
very hard when dry. Most of these soils had firm consistence in moist condition. In the
lower part of Hogla and Pirojpur series slightly sticky to sticky and plastic consistence was
observed in wet condition. The consistence of the soil material of different horizons
depends on several characteristics of the soils such as textural class and the type of clay
minerals present.
It seems expedient to summarize here the salient morphological features of the soils
under the present investigation.
Grey matrix color is a characteristic feature of these soils. The top soils were
generally grey to dark grey in color (moist) with silt loam to silty clay textures
except Pirojpur and Barisal soils where it was clayey in the top soil.
The sub-soils were generally grey to olive grey in color (moist) with silt loam to
silty clay textures except in Pirojpur and Barisal soils where it was clayey.
Flood coatings and variously colored mottles present in the sub-soil zone of all the
soil profiles.
Prismatic to sub-angular blocky structures were developed in the sub-surface
horizons of all the profiles whereas massive structure was found in the surface
horizons.
Chapter V Results and Discussion
95 | P a g e
Development of cambic horizon is the most notable morphogenetic feature in these
soils.
All the soil profiles showed abrupt to clear smooth horizon boundaries reflecting
rejuvenation in soil development.
Parent material of the soils is of alluvial origin with regular siltation from flooding
water. The attributes of parent material and the associated aquic soil moisture
regime dominantly influenced the genesis of these soils.
Thus it seems quite clear that the pedogenic factors such as climate, parent material,
drainage conditions and relief position etc. that are pertinent to the soils under the
investigation were responsible for the development of some morphological features.
5.7 Physical properties of the soils
Physical properties does not change their pattern easily as chemical properties and
hence impart the most useful contribution in soil classification, management and
improvement of cultivated soils. Some of these characteristics are recorded in the field and
others in the laboratory. The outstanding findings of physical parameters are described
below:
5.7.1 Particle density
Particle density of the studied soils ranged from 2.54 to 2.67 g/cm3 in top soils while
it was observed 2.50 to 2.72 g/cm3 in sub-soils (Table 12). In almost all soils particle
density showed higher values in sub soils than top soils due to the presence of higher clay
contents. The higher particle densities in the sub-soils are also probably due to their
variation in mineralogical composition. Higher values of particle density (2.70-2.72 g/cm3)
in the sub-soils of some Bangladesh soils were reported by Huizing (1970). These findings
were in accord with the results reported by BARC (1991), Rahman et al. (2005).
5.7.2 Bulk density and porosity
The bulk density of the soils varies from 1.23 to 1.53 g/cm3 with a mean value of 1.37g/cm
3
(Table12). Higher bulk density was associated with compactness and low pore space in
soils. Low bulk density values (generally below 1.3 g/cm3) indicate a porous soil condition.
Most of the floodplain soils were found to have higher bulk density due to compaction
resulting from rice cultivation in wet season.
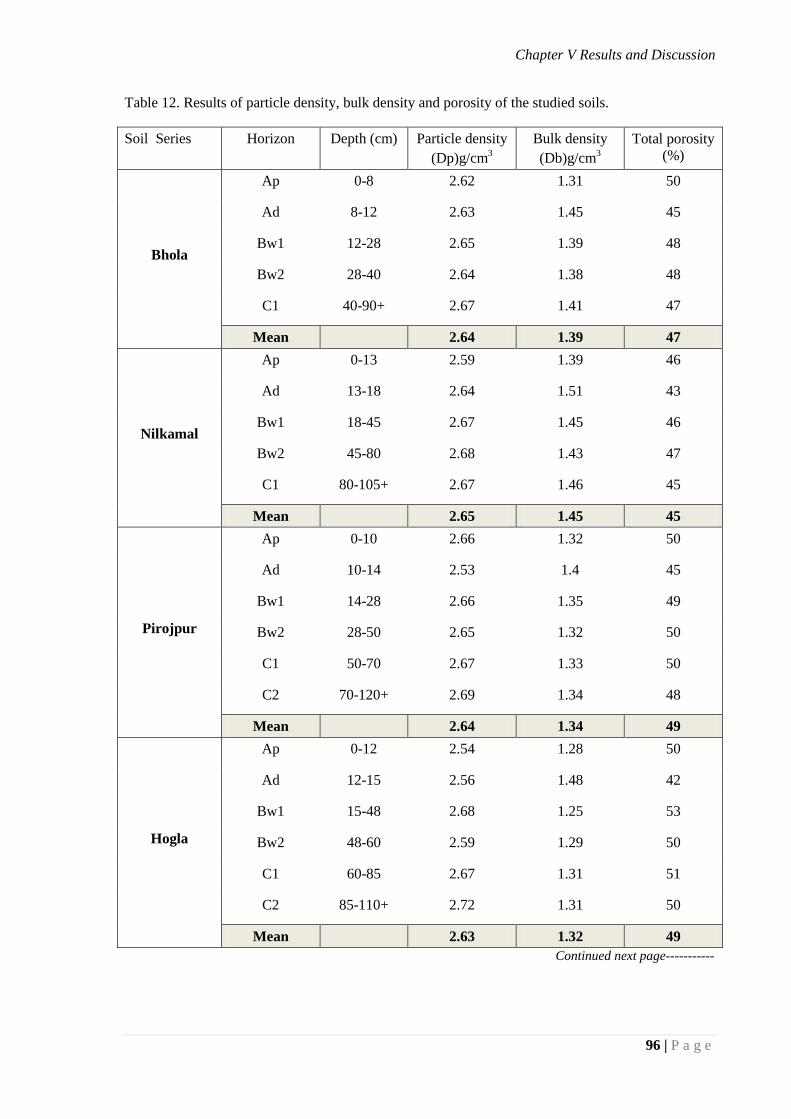
Chapter V Results and Discussion
96 | P a g e
Table 12. Results of particle density, bulk density and porosity of the studied soils.
Soil Series Horizon Depth (cm) Particle density
(Dp)g/cm3
Bulk density
(Db)g/cm3
Total porosity
(%)
Bhola
Ap 0-8 2.62 1.31 50
Ad 8-12 2.63 1.45 45
Bw1 12-28 2.65 1.39 48
Bw2 28-40 2.64 1.38 48
C1 40-90+ 2.67 1.41 47
Mean 2.64 1.39 47
Nilkamal
Ap 0-13 2.59 1.39 46
Ad 13-18 2.64 1.51 43
Bw1 18-45 2.67 1.45 46
Bw2 45-80 2.68 1.43 47
C1 80-105+ 2.67 1.46 45
Mean 2.65 1.45 45
Pirojpur
Ap 0-10 2.66 1.32 50
Ad 10-14 2.53 1.4 45
Bw1 14-28 2.66 1.35 49
Bw2 28-50 2.65 1.32 50
C1 50-70 2.67 1.33 50
C2 70-120+ 2.69 1.34 48
Mean 2.64 1.34 49
Hogla
Ap 0-12 2.54 1.28 50
Ad 12-15 2.56 1.48 42
Bw1 15-48 2.68 1.25 53
Bw2 48-60 2.59 1.29 50
C1 60-85 2.67 1.31 51
C2 85-110+ 2.72 1.31 50
Mean 2.63 1.32 49
Continued next page-----------
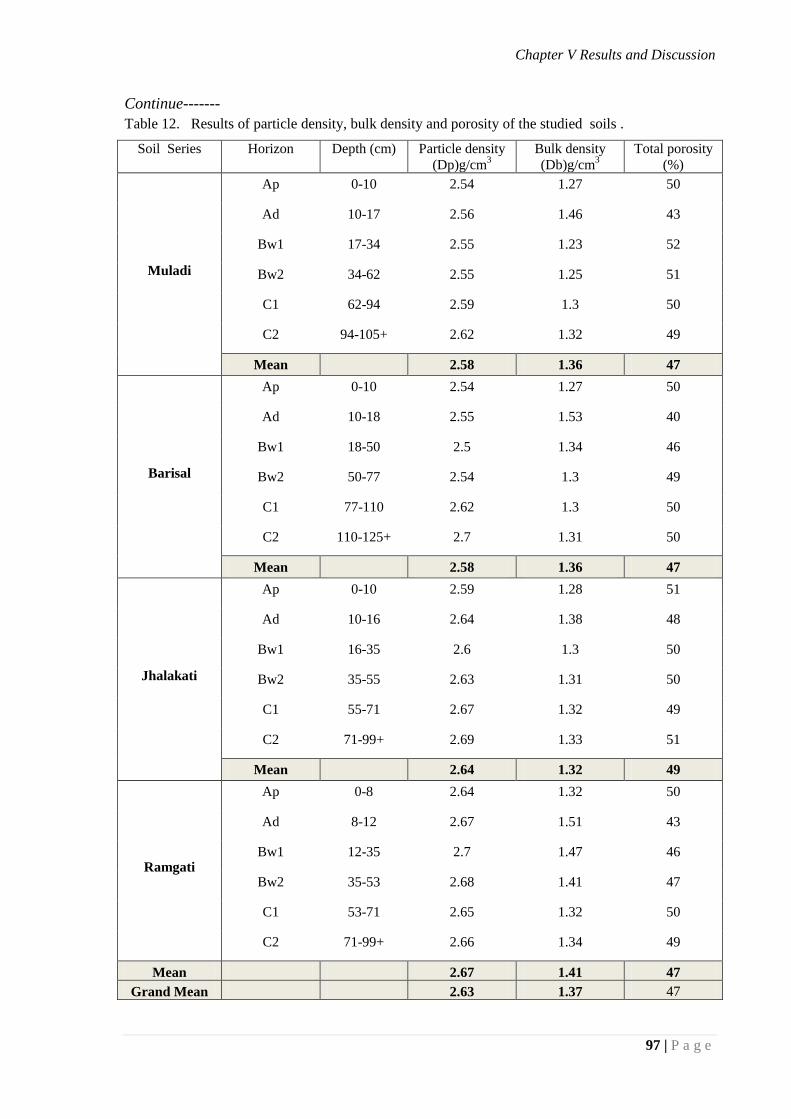
Chapter V Results and Discussion
97 | P a g e
Continue-------
Table 12. Results of particle density, bulk density and porosity of the studied soils .
Soil Series Horizon Depth (cm) Particle density
(Dp)g/cm3
Bulk density
(Db)g/cm3
Total porosity
(%)
Muladi
Ap 0-10 2.54 1.27 50
Ad 10-17 2.56 1.46 43
Bw1 17-34 2.55 1.23 52
Bw2 34-62 2.55 1.25 51
C1 62-94 2.59 1.3 50
C2 94-105+ 2.62 1.32 49
Mean 2.58 1.36 47
Barisal
Ap 0-10 2.54 1.27 50
Ad 10-18 2.55 1.53 40
Bw1 18-50 2.5 1.34 46
Bw2 50-77 2.54 1.3 49
C1 77-110 2.62 1.3 50
C2 110-125+ 2.7 1.31 50
Mean 2.58 1.36 47
Jhalakati
Ap 0-10 2.59 1.28 51
Ad 10-16 2.64 1.38 48
Bw1 16-35 2.6 1.3 50
Bw2 35-55 2.63 1.31 50
C1 55-71 2.67 1.32 49
C2 71-99+ 2.69 1.33 51
Mean 2.64 1.32 49
Ramgati
Ap 0-8 2.64 1.32 50
Ad 8-12 2.67 1.51 43
Bw1 12-35 2.7 1.47 46
Bw2 35-53 2.68 1.41 47
C1 53-71 2.65 1.32 50
C2 71-99+ 2.66 1.34 49
Mean 2.67 1.41 47
Grand Mean 2.63 1.37 47

Chapter V Results and Discussion
98 | P a g e
High bulk density values indicate a poorer environment for root growth, reduced
aeration (FAO, 2006). This values are slightly higher than those presented by Kawaguchi
and Kyama (1969a and 1969b); Tanaka and Yoshida (1970); and Van Breeman (1976).
These values are comparatively higher in the Ad horizons than in the Ap horizons of all the
pedons under the investigation. These higher bulk density values are thought to be due to
compaction by ploughing and decrease of organic matter content (Landon, 1991).
The porosity of the soils ranges from 43 to 53 percent with a mean value of 47
percent (Table 12). Total porosity values were comparatively lower in the Ad horizons than
in the Ap horizon in all the investigated soils. The high bulk density and low porosity in the
Ad horizons of these soils is due to formation of a compact plough layer at the shallow
depth of the soils. Joshua et al. (1983) was in all agreement with this results who reported
that higher bulk densities could be attributed to the structural breakdown and compaction of
the soils due to ploughing under wet conditions. Similar results were also obtained by Xing
and Dudas (1992) in some floodplain soils of China and Rahman et al. (1992).
A significant positive correlation (r = +0.933) was found between bulk density and
porosity in all the studied soils (Fig 35) which indicates that the higher the porosity the
lower is the bulk density and vice versa that may be due to clay and organic matter content
of the soils.
Fig 35. Relationship between bulk density and Percent porosity of the
studied soil.
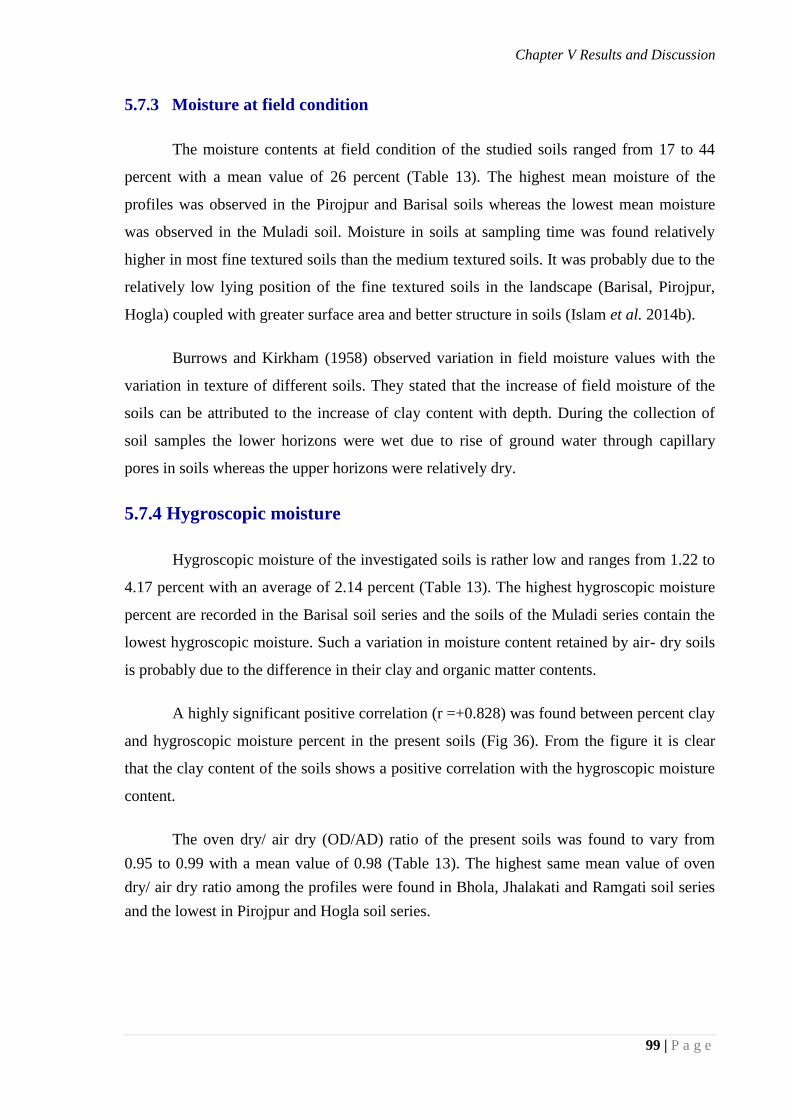
Chapter V Results and Discussion
99 | P a g e
5.7.3 Moisture at field condition
The moisture contents at field condition of the studied soils ranged from 17 to 44
percent with a mean value of 26 percent (Table 13). The highest mean moisture of the
profiles was observed in the Pirojpur and Barisal soils whereas the lowest mean moisture
was observed in the Muladi soil. Moisture in soils at sampling time was found relatively
higher in most fine textured soils than the medium textured soils. It was probably due to the
relatively low lying position of the fine textured soils in the landscape (Barisal, Pirojpur,
Hogla) coupled with greater surface area and better structure in soils (Islam et al. 2014b).
Burrows and Kirkham (1958) observed variation in field moisture values with the
variation in texture of different soils. They stated that the increase of field moisture of the
soils can be attributed to the increase of clay content with depth. During the collection of
soil samples the lower horizons were wet due to rise of ground water through capillary
pores in soils whereas the upper horizons were relatively dry.
5.7.4 Hygroscopic moisture
Hygroscopic moisture of the investigated soils is rather low and ranges from 1.22 to
4.17 percent with an average of 2.14 percent (Table 13). The highest hygroscopic moisture
percent are recorded in the Barisal soil series and the soils of the Muladi series contain the
lowest hygroscopic moisture. Such a variation in moisture content retained by air- dry soils
is probably due to the difference in their clay and organic matter contents.
A highly significant positive correlation (r =+0.828) was found between percent clay
and hygroscopic moisture percent in the present soils (Fig 36). From the figure it is clear
that the clay content of the soils shows a positive correlation with the hygroscopic moisture
content.
The oven dry/ air dry (OD/AD) ratio of the present soils was found to vary from
0.95 to 0.99 with a mean value of 0.98 (Table 13). The highest same mean value of oven
dry/ air dry ratio among the profiles were found in Bhola, Jhalakati and Ramgati soil series
and the lowest in Pirojpur and Hogla soil series.

Chapter V Results and Discussion
100 | P a g e
Table 13. Some physical properties of the studied soils.
Soil
Series Horizon
Depth
(cm)
Field
moisture (%)
Hygroscopic
moisture (%)
OD/AD
ratio
Loss on
ignition (%)
Bhola
Ap 0-8 20 3 0.97 10
Ad 8-12 19 2 0.98 7
Bw1 12-28 23 2 0.98 8
Bw2 28-40 24 2 0.97 8
C1 40-90+ 26 2 0.99 6
Mean 22 2 0.98 8
Nilkamal
Ap 0-13 20 2 0.98 8
Ad 13-18 19 3 0.97 7
Bw1 18-45 23 3 0.97 6
Bw2 45-80 26 2 0.98 6
C1 80-105+ 28 2 0.97 5
Mean 23 2 0.97 7
Pirojpur
Ap 0-10 23 4 0.96 9
Ad 10-14 21 4 0.96 9
Bw1 14-28 31 3 0.97 5
Bw2 28-50 37 4 0.96 9
C1 50-70 40 4 0.97 8
C2 70-120+ 44 4 0.96 10
Mean 33 4 0.96 8
Hogla
Ap 0-12 27 4 0.95 8
Ad 12-15 25 4 0.96 8
Bw1 15-48 29 4 0.97 7
Bw2 48-60 30 4 0.97 7
C1 60-85 33 4 0.96 7
C2 85-110+ 35 4 0.96 14
Mean 30 4 0.96 8
Continued next page-------
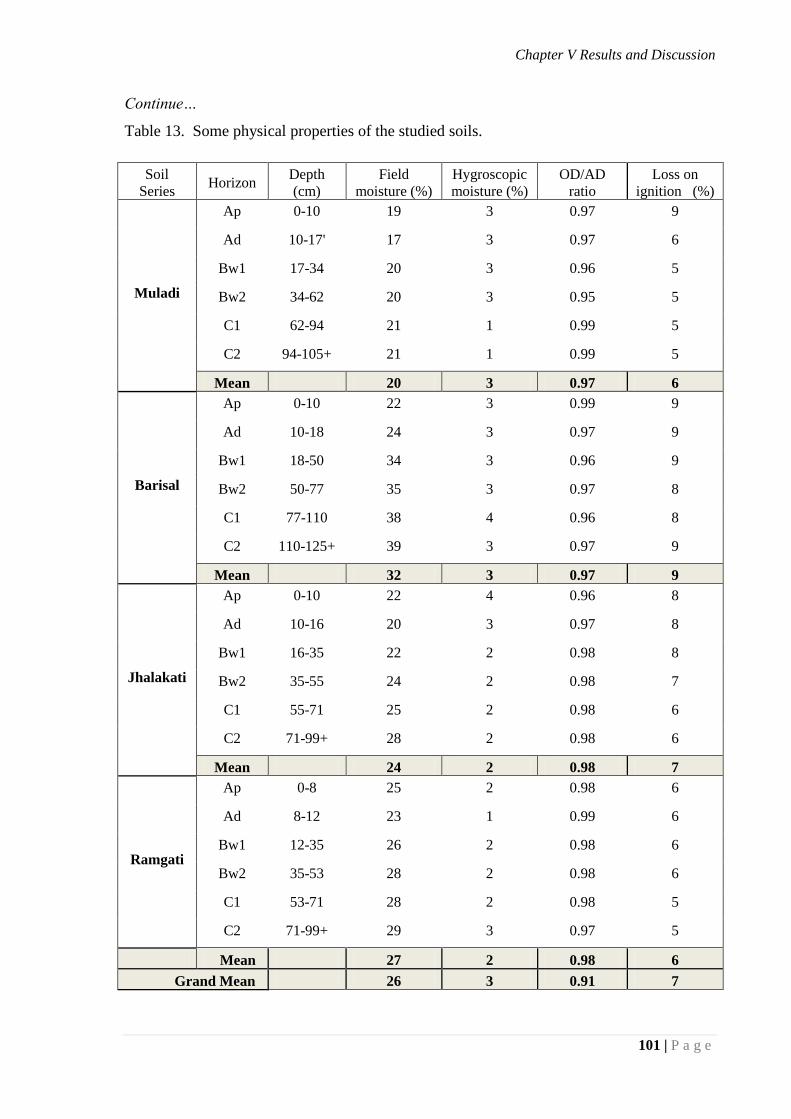
Chapter V Results and Discussion
101 | P a g e
Continue…
Table 13. Some physical properties of the studied soils.
Soil
Series Horizon
Depth
(cm)
Field
moisture (%)
Hygroscopic
moisture (%)
OD/AD
ratio
Loss on
ignition (%)
Muladi
Ap 0-10 19 3 0.97 9
Ad 10-17' 17 3 0.97 6
Bw1 17-34 20 3 0.96 5
Bw2 34-62 20 3 0.95 5
C1 62-94 21 1 0.99 5
C2 94-105+ 21 1 0.99 5
Mean 20 3 0.97 6
Barisal
Ap 0-10 22 3 0.99 9
Ad 10-18 24 3 0.97 9
Bw1 18-50 34 3 0.96 9
Bw2 50-77 35 3 0.97 8
C1 77-110 38 4 0.96 8
C2 110-125+ 39 3 0.97 9
Mean 32 3 0.97 9
Jhalakati
Ap 0-10 22 4 0.96 8
Ad 10-16 20 3 0.97 8
Bw1 16-35 22 2 0.98 8
Bw2 35-55 24 2 0.98 7
C1 55-71 25 2 0.98 6
C2 71-99+ 28 2 0.98 6
Mean 24 2 0.98 7
Ramgati
Ap 0-8 25 2 0.98 6
Ad 8-12 23 1 0.99 6
Bw1 12-35 26 2 0.98 6
Bw2 35-53 28 2 0.98 6
C1 53-71 28 2 0.98 5
C2 71-99+ 29 3 0.97 5
Mean 27 2 0.98 6
Grand Mean 26 3 0.91 7
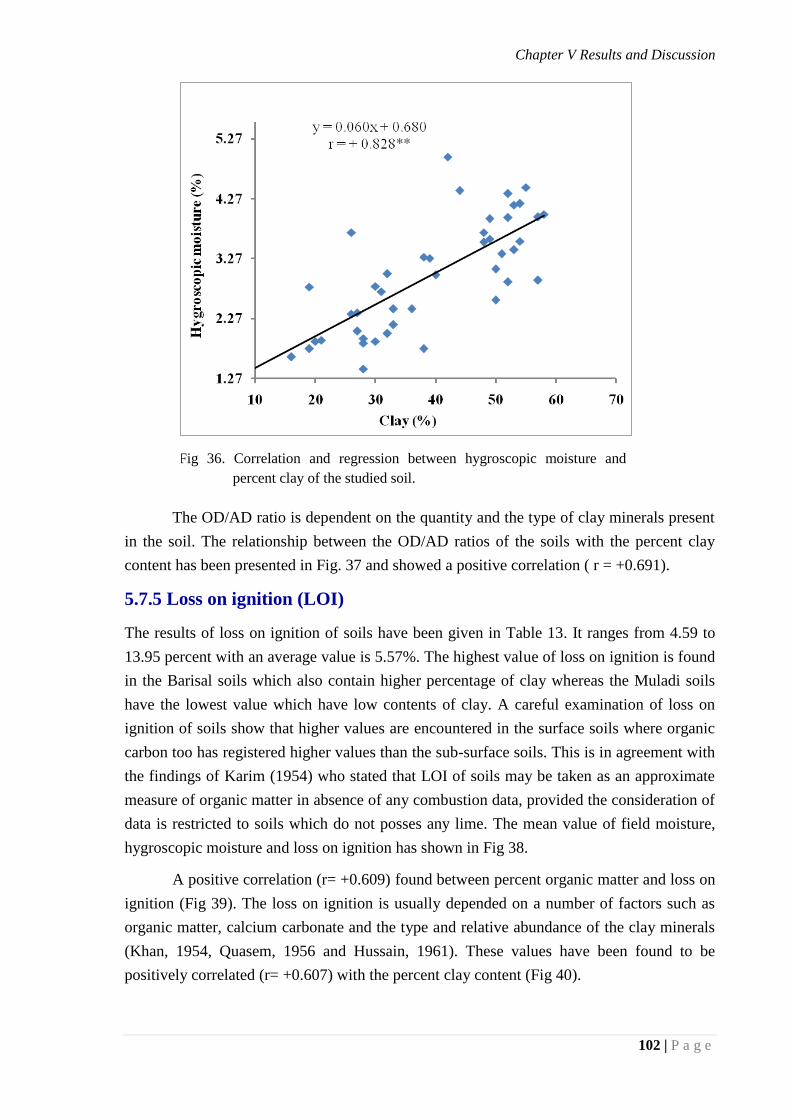
Chapter V Results and Discussion
102 | P a g e
The OD/AD ratio is dependent on the quantity and the type of clay minerals present
in the soil. The relationship between the OD/AD ratios of the soils with the percent clay
content has been presented in Fig. 37 and showed a positive correlation ( r = +0.691).
5.7.5 Loss on ignition (LOI)
The results of loss on ignition of soils have been given in Table 13. It ranges from 4.59 to
13.95 percent with an average value is 5.57%. The highest value of loss on ignition is found
in the Barisal soils which also contain higher percentage of clay whereas the Muladi soils
have the lowest value which have low contents of clay. A careful examination of loss on
ignition of soils show that higher values are encountered in the surface soils where organic
carbon too has registered higher values than the sub-surface soils. This is in agreement with
the findings of Karim (1954) who stated that LOI of soils may be taken as an approximate
measure of organic matter in absence of any combustion data, provided the consideration of
data is restricted to soils which do not posses any lime. The mean value of field moisture,
hygroscopic moisture and loss on ignition has shown in Fig 38.
A positive correlation (r= +0.609) found between percent organic matter and loss on
ignition (Fig 39). The loss on ignition is usually depended on a number of factors such as
organic matter, calcium carbonate and the type and relative abundance of the clay minerals
(Khan, 1954, Quasem, 1956 and Hussain, 1961). These values have been found to be
positively correlated (r= +0.607) with the percent clay content (Fig 40).
Fig 36. Correlation and regression between hygroscopic moisture and
percent clay of the studied soil.
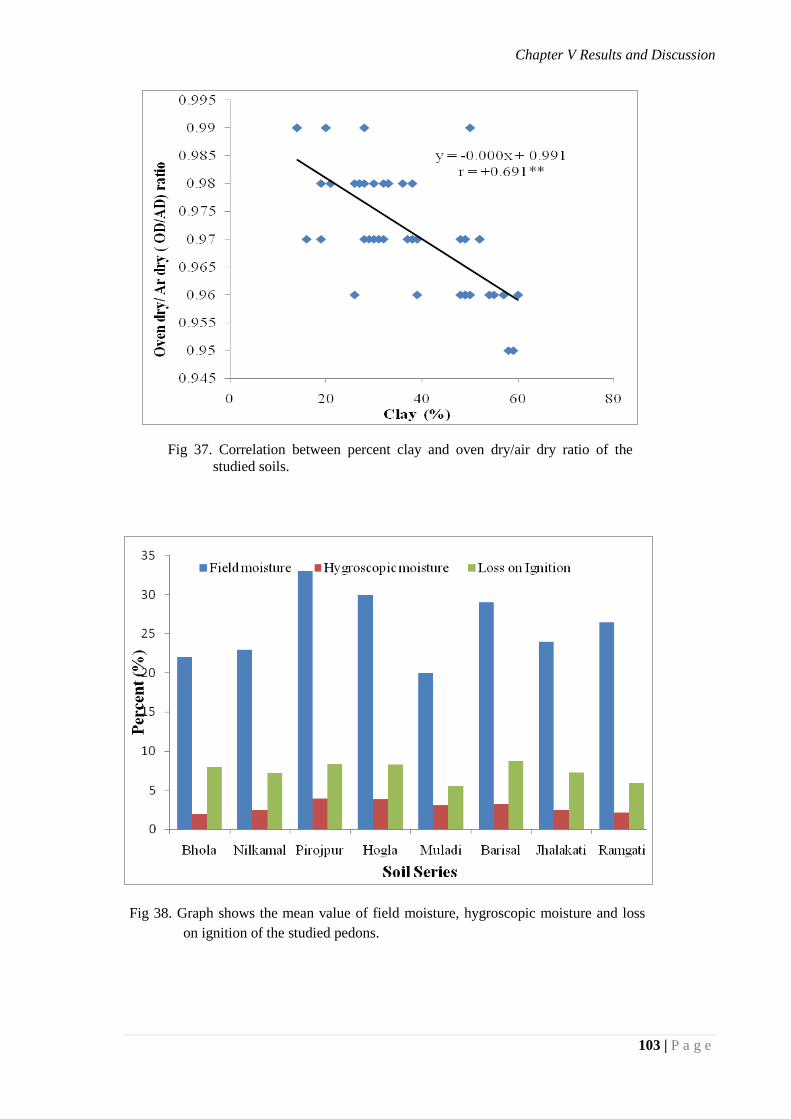
Chapter V Results and Discussion
103 | P a g e
Fig 37. Correlation between percent clay and oven dry/air dry ratio of the
studied soils.
Fig 38. Graph shows the mean value of field moisture, hygroscopic moisture and loss
on ignition of the studied pedons.
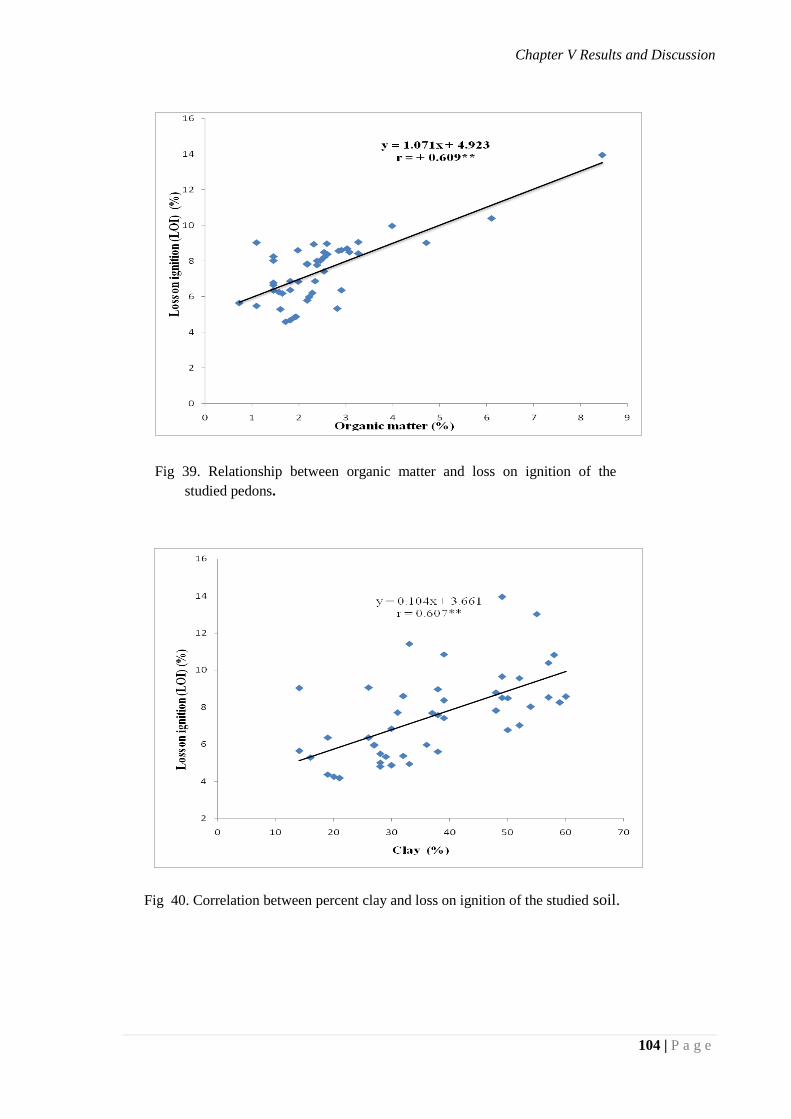
Chapter V Results and Discussion
104 | P a g e
Fig 40. Correlation between percent clay and loss on ignition of the studied soil.
Fig 39. Relationship between organic matter and loss on ignition of the
studied pedons.
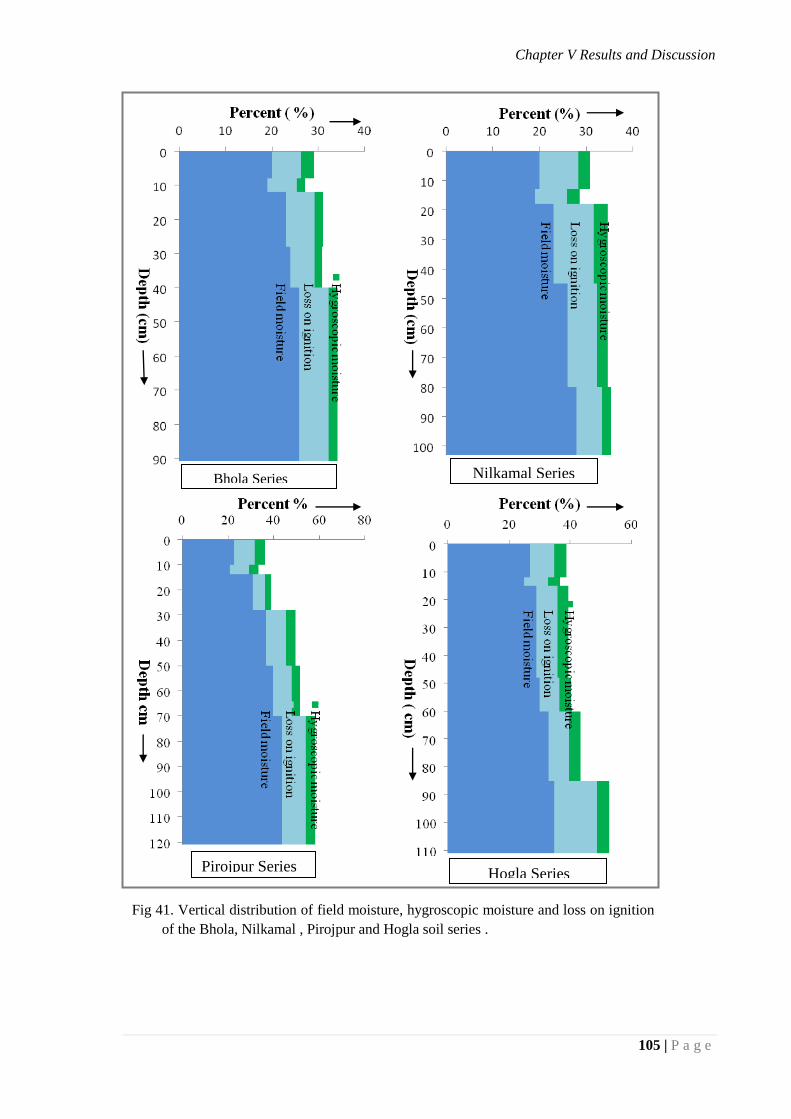
Chapter V Results and Discussion
105 | P a g e
Bhola Series
Hogla Series Pirojpur Series
Nilkamal Series
Fig 41. Vertical distribution of field moisture, hygroscopic moisture and loss on ignition
of the Bhola, Nilkamal , Pirojpur and Hogla soil series .
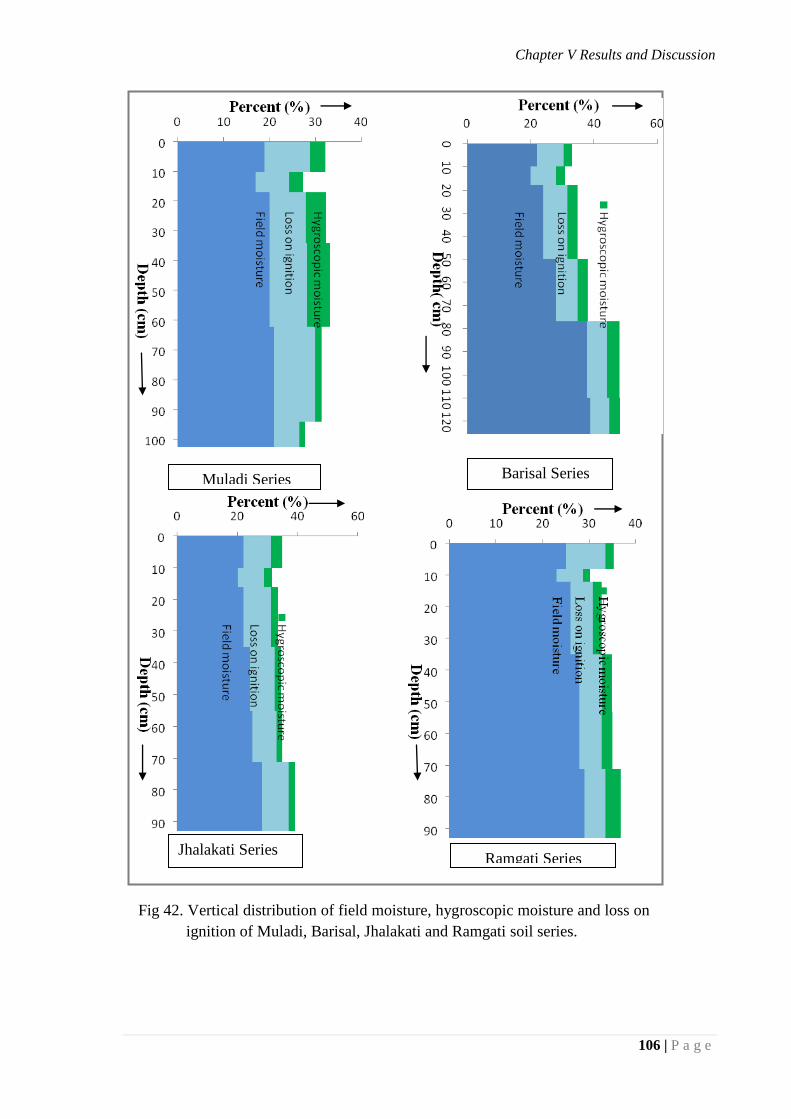
Chapter V Results and Discussion
106 | P a g e
Muladi Series
Jhalakati Series Ramgati Series
Barisal Series
Fig 42. Vertical distribution of field moisture, hygroscopic moisture and loss on
ignition of Muladi, Barisal, Jhalakati and Ramgati soil series.
Chapter V Results and Discussion
107 | P a g e
5.7.6 Particle size distribution
The percentage of sand, silt and clay and textural class of soils are very important
characteristics of soil profile which reflect the pedogenic and geologic history of a soil. The
results of particle size distribution in the studied soils have been presented in Table 14. The
mean values of sand, silt and clay of the studied soil profiles are shown in Fig 43.
The sand contents in the studied soils vary within very wide limits. Quantity of sand
ranges from 3 to 52 percent with the mean of 13 percent. These results are in agreement
with the findings o SRDI Staff (1965-86); Brammer (1971); Islam et al. 2014b. The highest
value of sand was found in Muladi soil while the lowest value in Bhola soil. Based on the
sand content the studied pedon shows the following gradation:
Muladi > Barisal > Nilkamal > Jhalakati > Ramgati > Pirojpur > Hogla > Bhola
The vertical distribution patterns of of sand fraction in these pedons shows an
irregular trend which is related to their geogenic origin rather than pedogenic (Figs.44
& 45). In Muladi soil sand content of the surface horizon is 12 percent which increases from
45 to 52 percent in the C1 and C2 horizons. In the Barisal profile sand content of the surface
horizon is 17 percent which decreases to 11 percent in the C2 horizon. On the basis of the
vertical distribution of sand it can be generally concluded that the parent materials of the
present soils are heterogeneous and this heterogeneity may be related to their depositional
environment.
The silt content has assumed a significant status in the soils. The general level of silt
content is high ranging from 32 to 77 percent with a mean value of 50 percent (Table 18).
The highest mean silt content within the profile is observed in the Bhola soil (76 percent)
whereas the lowest in the Barisal soil (36 percent) (Fig. 56). Silt is the dominant fraction in
Bhola, Nilkamal, Muladi, Jhalakati and Ramgati soils but in the Pirojpur, Hogla and Barisal
soils the clay contents exceed the silt content. Such a high level of silt is due to their
geogenic orogin and annual siltation regularly. Based on the per cent silt content, the pedons
show the following gradation:
Bhola > Jhalakati > Nilkamal > Ramgati > Muladi > Hogla > Pirojpur > Barisal
The vertical distribution of silt fraction in the pedons shows an irregular trend (Figs. 44 &
45). There is no significant trend in the distribution of silt in the profiles under studied. In
addition the sand/ silt ratio of the present soils varies from 0.04 to 1.21 with a mean value of
0.29 (Table 14).

Chapter V Results and Discussion
108 | P a g e
Table 14. Particle size distribution and textural classes of the studied soils
Soil
Series Horizon
Depth
(cm)
Particle Size Distribution (%) Textural
Class
Sand / Silt
ratio
Silt/Clay
ratio Sand Silt Clay
Bhola
Ap 0-8 4 77 19 SiL 0.05 4.05
Ad 8-12 5 76 19 SiL 0.07 4.00
Bw1 12-28 3 76 21 SiL 0.04 3.62
Bw2 28-40 5 79 16 SiL 0.06 4.94
C1 40-90+ 8 72 20 SiL 0.11 3.60
Mean 5 76 19 0.07 4.04
Nilkamal
Ap 0-13 14 53 33 SiCL 0.26 1.61
Ad 13-18 12 57 31 SiCL 0.23 1.90
Bw1 18-45 12 56 32 SiCL 0.21 1.75
Bw2 45-80 15 59 26 SiL 0.25 2.27
C1 80-105+ 16 56 28 SiL 0.29 2.00
Mean 14 56 30 0.25 1.91
Pirojpur
Ap 0-10 8 37 55 C 0.22 0.67
Ad 10-14 9 37 54 C 0.24 0.69
Bw1 14-28 9 34 57 C 0.26 0.60
Bw2 28-50 10 38 52 C 0.26 0.73
C1 50-70 11 35 54 C 0.31 0.65
C2 70-120+ 13 34 53 C 0.38 0.64
Mean 10 36 54 0.28 0.66
Hogla
Ap 0-12 6 36 58 C 0.17 0.62
Ad 12-15 6 37 57 C 0.16 0.65
Bw1 15-48 5 47 48 SiC 0.11 0.98
Bw2 48-60 4 47 49 SiC 0.09 0.96
C1 60-85 8 44 48 SiC 0.18 0.92
C2 85-110+ 9 42 49 SiC 0.21 0.86
Mean 6 42 52 0.15 0.83
Continued next page----
-
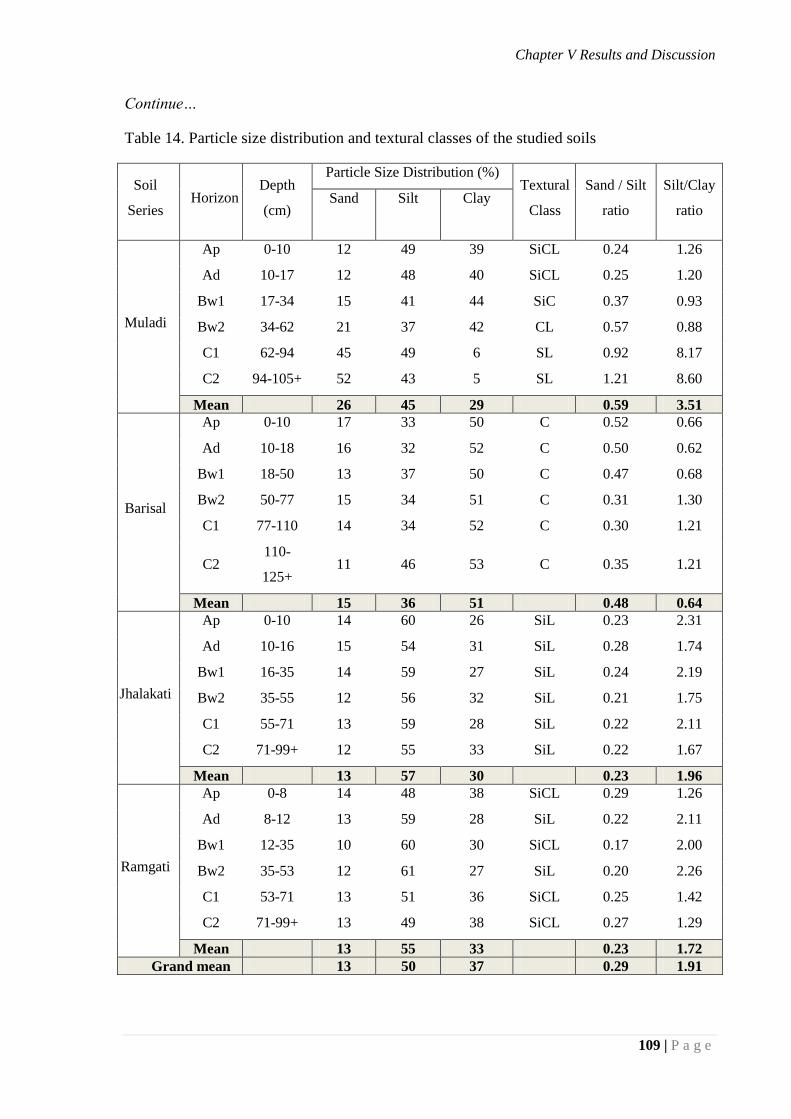
Chapter V Results and Discussion
109 | P a g e
Continue…
Table 14. Particle size distribution and textural classes of the studied soils
Soil
Series Horizon
Depth
(cm)
Particle Size Distribution (%) Textural
Class
Sand / Silt
ratio
Silt/Clay
ratio Sand
Silt
Clay
Muladi
Ap 0-10 12 49 39 SiCL 0.24 1.26
Ad 10-17 12 48 40 SiCL 0.25 1.20
Bw1 17-34 15 41 44 SiC 0.37 0.93
Bw2 34-62 21 37 42 CL 0.57 0.88
C1 62-94 45 49 6 SL 0.92 8.17
C2 94-105+ 52 43 5 SL 1.21 8.60
Mean 26 45 29 0.59 3.51
Barisal
Ap 0-10 17 33 50 C 0.52 0.66
Ad 10-18 16 32 52 C 0.50 0.62
Bw1 18-50 13 37 50 C 0.47 0.68
Bw2 50-77 15 34 51 C 0.31 1.30
C1 77-110 14 34 52 C 0.30 1.21
C2 110-
125+ 11 46 53 C 0.35 1.21
Mean 15 36 51 0.48 0.64
Jhalakati
Ap 0-10 14 60 26 SiL 0.23 2.31
Ad 10-16 15 54 31 SiL 0.28 1.74
Bw1 16-35 14 59 27 SiL 0.24 2.19
Bw2 35-55 12 56 32 SiL 0.21 1.75
C1 55-71 13 59 28 SiL 0.22 2.11
C2 71-99+ 12 55 33 SiL 0.22 1.67
Mean 13 57 30 0.23 1.96
Ramgati
Ap 0-8 14 48 38 SiCL 0.29 1.26
Ad 8-12 13 59 28 SiL 0.22 2.11
Bw1 12-35 10 60 30 SiCL 0.17 2.00
Bw2 35-53 12 61 27 SiL 0.20 2.26
C1 53-71 13 51 36 SiCL 0.25 1.42
C2 71-99+ 13 49 38 SiCL 0.27 1.29
Mean 13 55 33 0.23 1.72
Grand mean 13 50 37 0.29 1.91
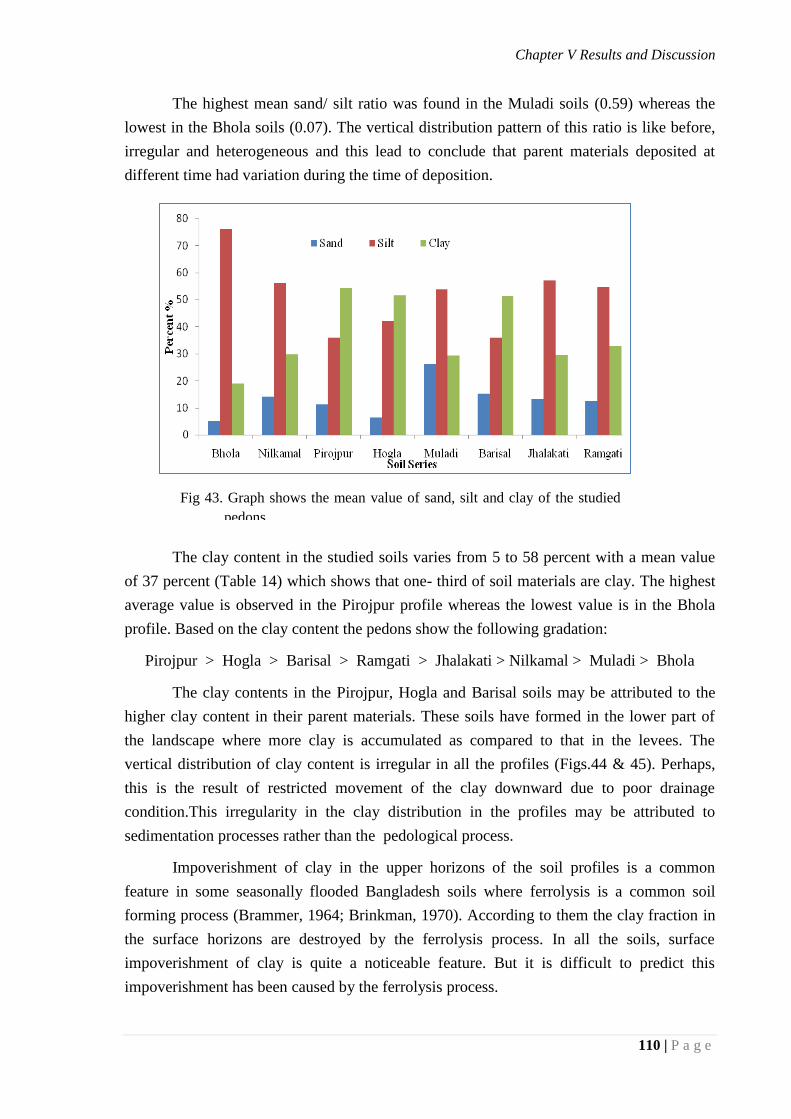
Chapter V Results and Discussion
110 | P a g e
The highest mean sand/ silt ratio was found in the Muladi soils (0.59) whereas the
lowest in the Bhola soils (0.07). The vertical distribution pattern of this ratio is like before,
irregular and heterogeneous and this lead to conclude that parent materials deposited at
different time had variation during the time of deposition.
The clay content in the studied soils varies from 5 to 58 percent with a mean value
of 37 percent (Table 14) which shows that one- third of soil materials are clay. The highest
average value is observed in the Pirojpur profile whereas the lowest value is in the Bhola
profile. Based on the clay content the pedons show the following gradation:
Pirojpur > Hogla > Barisal > Ramgati > Jhalakati > Nilkamal > Muladi > Bhola
The clay contents in the Pirojpur, Hogla and Barisal soils may be attributed to the
higher clay content in their parent materials. These soils have formed in the lower part of
the landscape where more clay is accumulated as compared to that in the levees. The
vertical distribution of clay content is irregular in all the profiles (Figs.44 & 45). Perhaps,
this is the result of restricted movement of the clay downward due to poor drainage
condition.This irregularity in the clay distribution in the profiles may be attributed to
sedimentation processes rather than the pedological process.
Impoverishment of clay in the upper horizons of the soil profiles is a common
feature in some seasonally flooded Bangladesh soils where ferrolysis is a common soil
forming process (Brammer, 1964; Brinkman, 1970). According to them the clay fraction in
the surface horizons are destroyed by the ferrolysis process. In all the soils, surface
impoverishment of clay is quite a noticeable feature. But it is difficult to predict this
impoverishment has been caused by the ferrolysis process.
Fig 43. Graph shows the mean value of sand, silt and clay of the studied
pedons.

Chapter V Results and Discussion
111 | P a g e
The silt/ clay ratio of the studied soils varies from 0.60 to 8.60 with a mean value of
1.91. The distribution patterns of this ratio down the profiles are not equally uniform in all
the soils under the present investigation (Table 14). The silt/ clay ratio thus varies within
wide limits. The highest average ratio is observed in the Bhola pedon (4.04) and lowest in
Barisal pedon. The irregular silt/ clay ratio in the profiles indicates that the present soils are
young and there is little possibility of movement of clay downward and their sub-sequent
accumulation in the B horizon. In addition, this is due to the fact that the parent materials of
these soils were deposited in different depositional environments such as near the levee or
away from the levee. Variation in the above ratio may also be due to the fact that the silt
minerals are being destroyed during weathering and clay minerals are being formed.
Textural class was determined on the basis of sand, silt and clay percent are reported
in Fig 46. The textural class of the soil under investigation shows a wide variation. It ranges
from silt loam to clayey texture (Table 14). This variation in textural classes of soils is a
common feature in many of the floodplain areas of Bangladesh.
From Marshall textural triangle it is clear that most of the studied soils are silty clay,
silty clay loam, silt loam, sandy loam, and clay texture. Among the 46 studied soils 15 soils
are silt loam, 14 soils are clay, 9 soils are silty clay loam, 5 soils are silty clay, 2 soils are
sandy loam, and 1 soil is clay loam textural class.
To sum up the results of particle size distribution of soils the following points may be made:
a. The vertical distribution of sand, silt and clay in all the studied soil profiles are more
or less irregular which indicates heterogeneous nature of the parent materials.
b. Silt is the dominant size fraction in the soils of coastal zone.
c. The sand content is low in all the soils except Muladi soil.
d. Particle size distribution of the soils appears to be similar to that of the river borne
sediments.
e. From the particle size distribution it is clear that the geological deposition is the
main factor for their formation. Pedological processes have been very weak and
have not brought about any significant translocation of materials of any size within
the pedons.
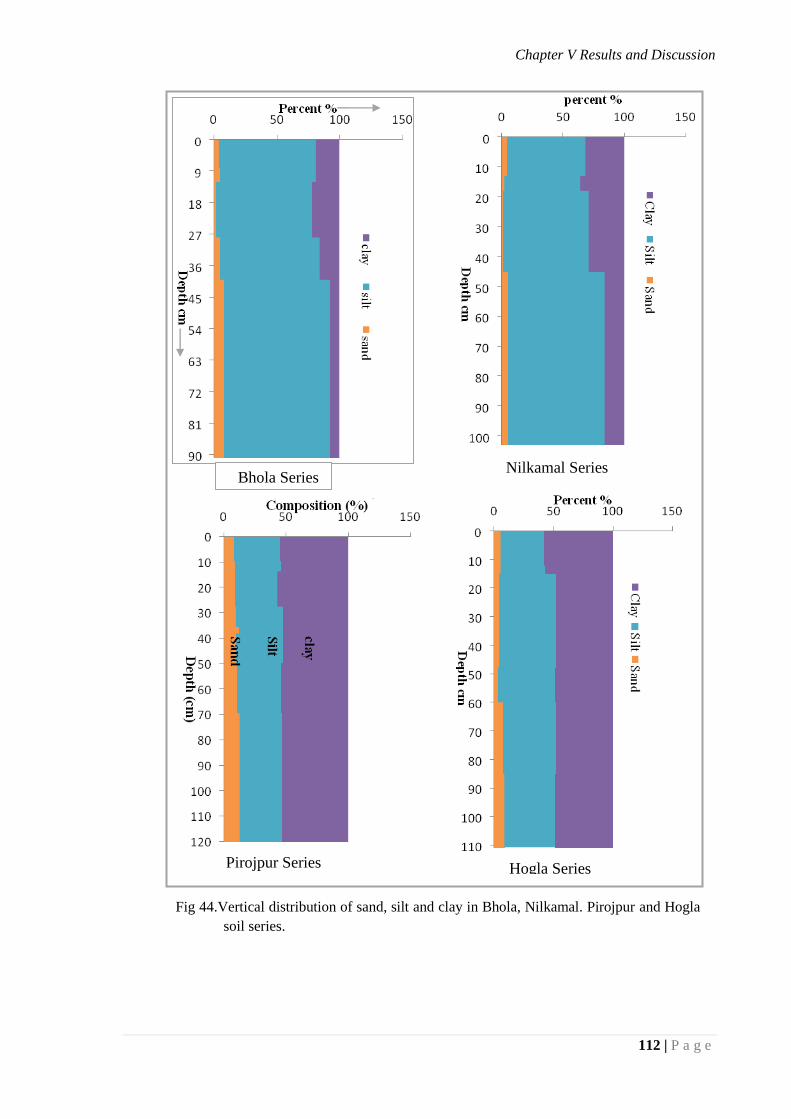
Chapter V Results and Discussion
112 | P a g e
Bhola Series
Hogla Series
Nilkamal Series
Pirojpur Series
Fig 44.Vertical distribution of sand, silt and clay in Bhola, Nilkamal. Pirojpur and Hogla
soil series.
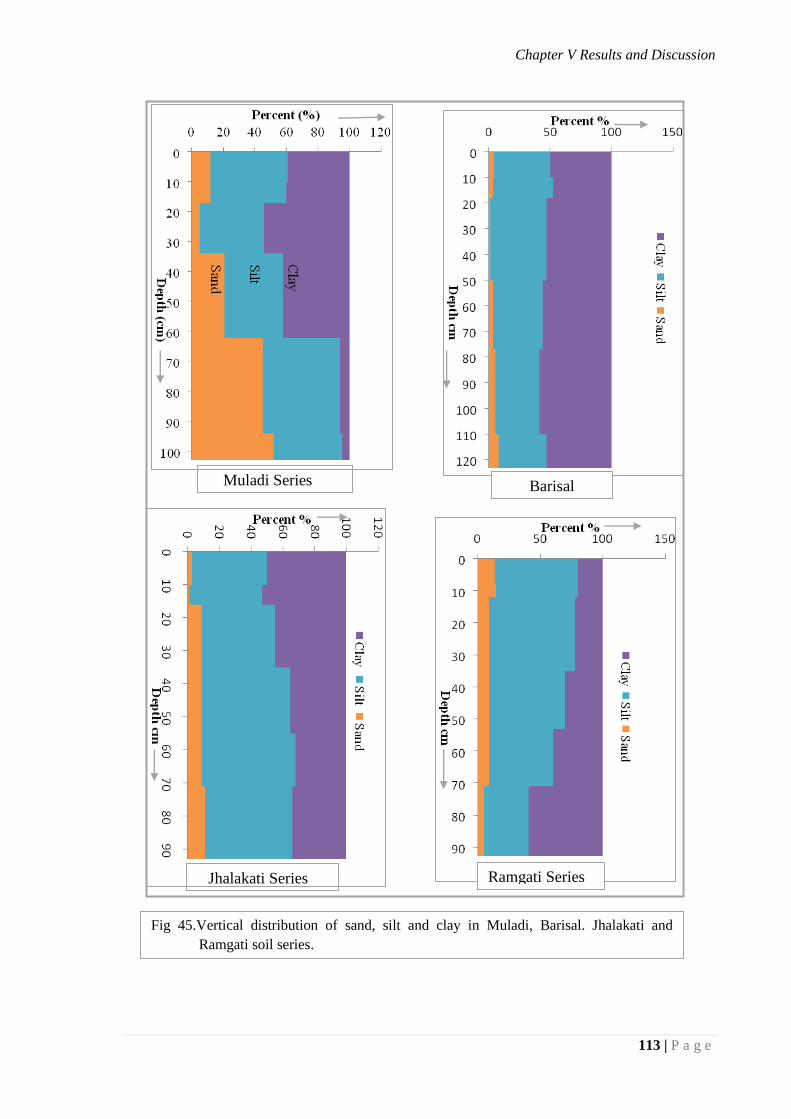
Chapter V Results and Discussion
113 | P a g e
Barisal
Series
Jhalakati Series Ramgati Series
Muladi Series
Fig 45.Vertical distribution of sand, silt and clay in Muladi, Barisal. Jhalakati and
Ramgati soil series.
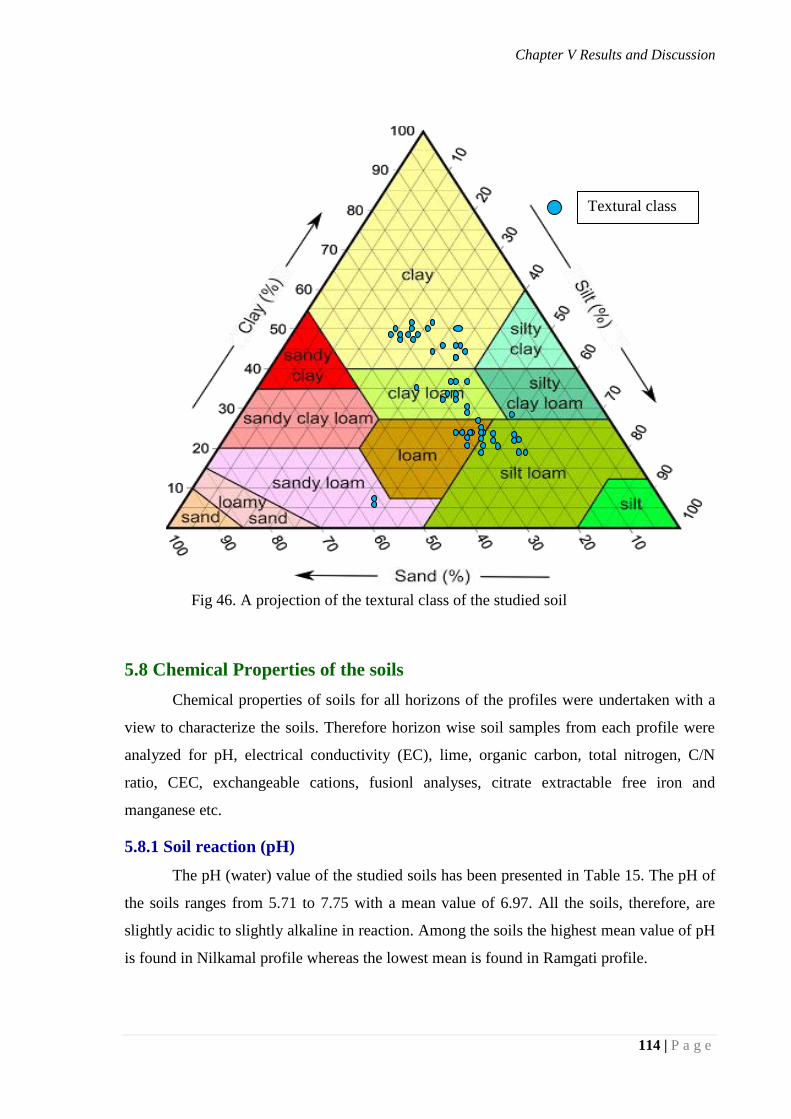
Chapter V Results and Discussion
114 | P a g e
5.8 Chemical Properties of the soils
Chemical properties of soils for all horizons of the profiles were undertaken with a
view to characterize the soils. Therefore horizon wise soil samples from each profile were
analyzed for pH, electrical conductivity (EC), lime, organic carbon, total nitrogen, C/N
ratio, CEC, exchangeable cations, fusionl analyses, citrate extractable free iron and
manganese etc.
5.8.1 Soil reaction (pH)
The pH (water) value of the studied soils has been presented in Table 15. The pH of
the soils ranges from 5.71 to 7.75 with a mean value of 6.97. All the soils, therefore, are
slightly acidic to slightly alkaline in reaction. Among the soils the highest mean value of pH
is found in Nilkamal profile whereas the lowest mean is found in Ramgati profile.
Fig 46. A projection of the textural class of the studied soil
Textural class
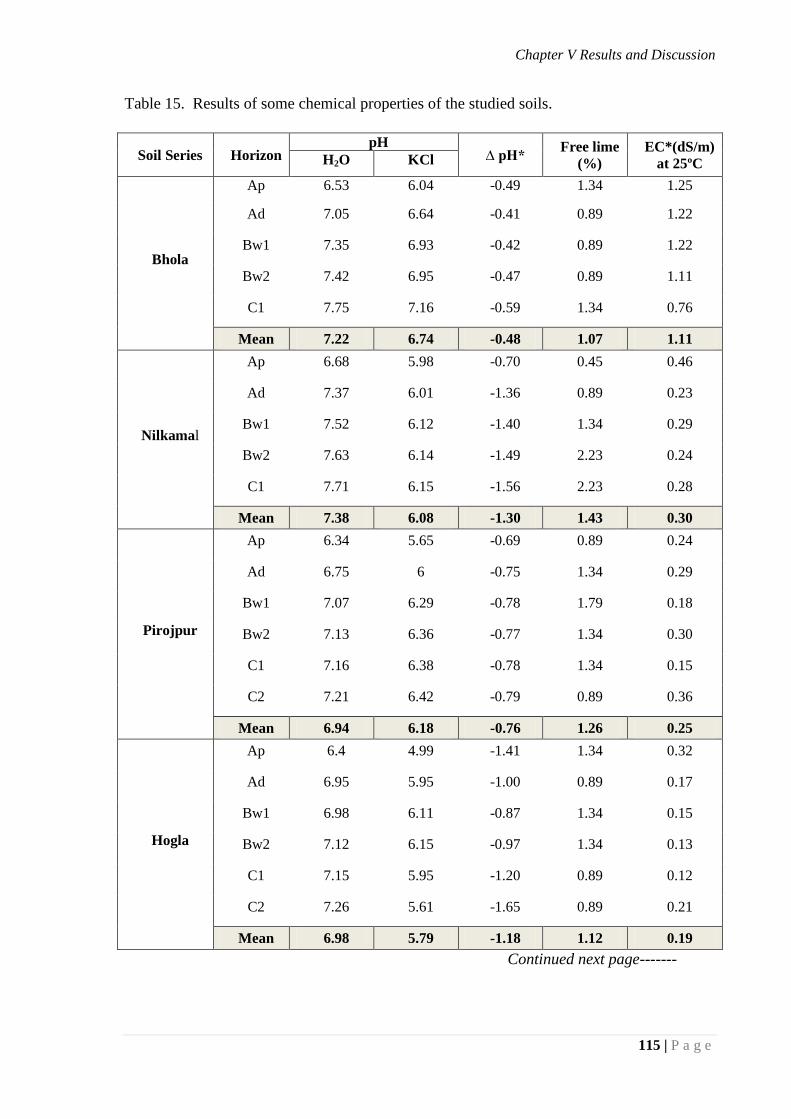
Chapter V Results and Discussion
115 | P a g e
Table 15. Results of some chemical properties of the studied soils.
Soil Series Horizon pH
∆ pH* Free lime
(%)
EC*(dS/m)
at 25ºC H2O KCl
Bhola
Ap 6.53 6.04 -0.49 1.34 1.25
Ad 7.05 6.64 -0.41 0.89 1.22
Bw1 7.35 6.93 -0.42 0.89 1.22
Bw2 7.42 6.95 -0.47 0.89 1.11
C1 7.75 7.16 -0.59 1.34 0.76
Mean 7.22 6.74 -0.48 1.07 1.11
Nilkamal
Ap 6.68 5.98 -0.70 0.45 0.46
Ad 7.37 6.01 -1.36 0.89 0.23
Bw1 7.52 6.12 -1.40 1.34 0.29
Bw2 7.63 6.14 -1.49 2.23 0.24
C1 7.71 6.15 -1.56 2.23 0.28
Mean 7.38 6.08 -1.30 1.43 0.30
Pirojpur
Ap 6.34 5.65 -0.69 0.89 0.24
Ad 6.75 6 -0.75 1.34 0.29
Bw1 7.07 6.29 -0.78 1.79 0.18
Bw2 7.13 6.36 -0.77 1.34 0.30
C1 7.16 6.38 -0.78 1.34 0.15
C2 7.21 6.42 -0.79 0.89 0.36
Mean 6.94 6.18 -0.76 1.26 0.25
Hogla
Ap 6.4 4.99 -1.41 1.34 0.32
Ad 6.95 5.95 -1.00 0.89 0.17
Bw1 6.98 6.11 -0.87 1.34 0.15
Bw2 7.12 6.15 -0.97 1.34 0.13
C1 7.15 5.95 -1.20 0.89 0.12
C2 7.26 5.61 -1.65 0.89 0.21
Mean 6.98 5.79 -1.18 1.12 0.19
Continued next page-------
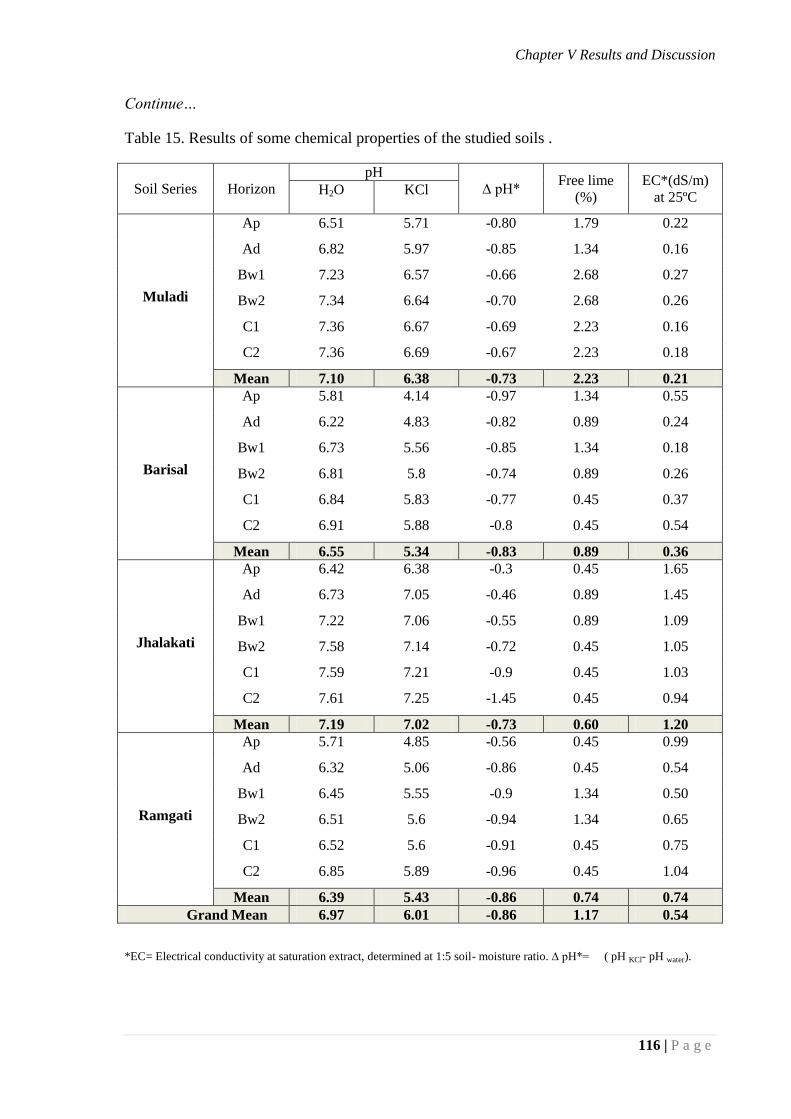
Chapter V Results and Discussion
116 | P a g e
Continue…
Table 15. Results of some chemical properties of the studied soils .
Soil Series Horizon
pH
∆ pH* Free lime
(%)
EC*(dS/m)
at 25ºC H2O KCl
Muladi
Ap 6.51 5.71 -0.80 1.79 0.22
Ad 6.82 5.97 -0.85 1.34 0.16
Bw1 7.23 6.57 -0.66 2.68 0.27
Bw2 7.34 6.64 -0.70 2.68 0.26
C1 7.36 6.67 -0.69 2.23 0.16
C2 7.36 6.69 -0.67 2.23 0.18
Mean 7.10 6.38 -0.73 2.23 0.21
Barisal
Ap 5.81 4.14 -0.97 1.34 0.55
Ad 6.22 4.83 -0.82 0.89 0.24
Bw1 6.73 5.56 -0.85 1.34 0.18
Bw2 6.81 5.8 -0.74 0.89 0.26
C1 6.84 5.83 -0.77 0.45 0.37
C2 6.91 5.88 -0.8 0.45 0.54
Mean 6.55 5.34 -0.83 0.89 0.36
Jhalakati
Ap 6.42 6.38 -0.3 0.45 1.65
Ad 6.73 7.05 -0.46 0.89 1.45
Bw1 7.22 7.06 -0.55 0.89 1.09
Bw2 7.58 7.14 -0.72 0.45 1.05
C1 7.59 7.21 -0.9 0.45 1.03
C2 7.61 7.25 -1.45 0.45 0.94
Mean 7.19 7.02 -0.73 0.60 1.20
Ramgati
Ap 5.71 4.85 -0.56 0.45 0.99
Ad 6.32 5.06 -0.86 0.45 0.54
Bw1 6.45 5.55 -0.9 1.34 0.50
Bw2 6.51 5.6 -0.94 1.34 0.65
C1 6.52 5.6 -0.91 0.45 0.75
C2 6.85 5.89 -0.96 0.45 1.04
Mean 6.39 5.43 -0.86 0.74 0.74
Grand Mean 6.97 6.01 -0.86 1.17 0.54
*EC= Electrical conductivity at saturation extract, determined at 1:5 soil- moisture ratio. ∆ pH*= ( pH KCl- pH water).
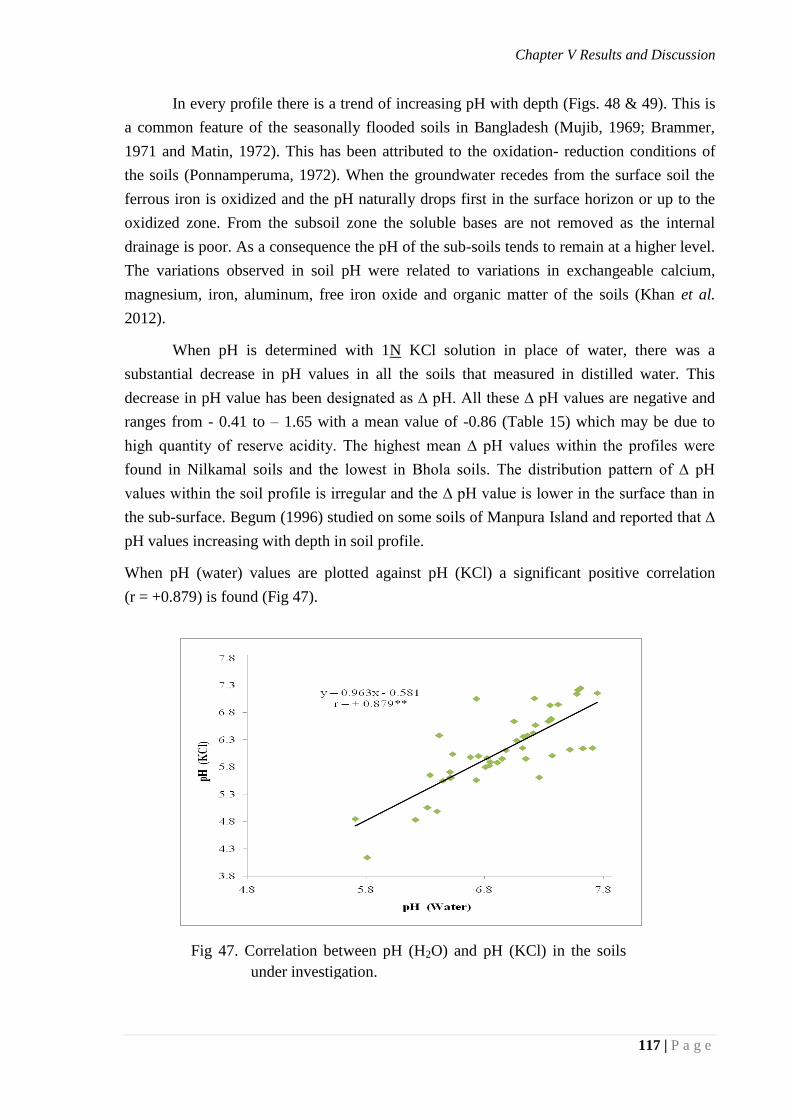
Chapter V Results and Discussion
117 | P a g e
In every profile there is a trend of increasing pH with depth (Figs. 48 & 49). This is
a common feature of the seasonally flooded soils in Bangladesh (Mujib, 1969; Brammer,
1971 and Matin, 1972). This has been attributed to the oxidation- reduction conditions of
the soils (Ponnamperuma, 1972). When the groundwater recedes from the surface soil the
ferrous iron is oxidized and the pH naturally drops first in the surface horizon or up to the
oxidized zone. From the subsoil zone the soluble bases are not removed as the internal
drainage is poor. As a consequence the pH of the sub-soils tends to remain at a higher level.
The variations observed in soil pH were related to variations in exchangeable calcium,
magnesium, iron, aluminum, free iron oxide and organic matter of the soils (Khan et al.
2012).
When pH is determined with 1N KCl solution in place of water, there was a
substantial decrease in pH values in all the soils that measured in distilled water. This
decrease in pH value has been designated as ∆ pH. All these ∆ pH values are negative and
ranges from - 0.41 to – 1.65 with a mean value of -0.86 (Table 15) which may be due to
high quantity of reserve acidity. The highest mean ∆ pH values within the profiles were
found in Nilkamal soils and the lowest in Bhola soils. The distribution pattern of ∆ pH
values within the soil profile is irregular and the ∆ pH value is lower in the surface than in
the sub-surface. Begum (1996) studied on some soils of Manpura Island and reported that ∆
pH values increasing with depth in soil profile.
When pH (water) values are plotted against pH (KCl) a significant positive correlation
(r = +0.879) is found (Fig 47).
Fig 47. Correlation between pH (H2O) and pH (KCl) in the soils
under investigation.
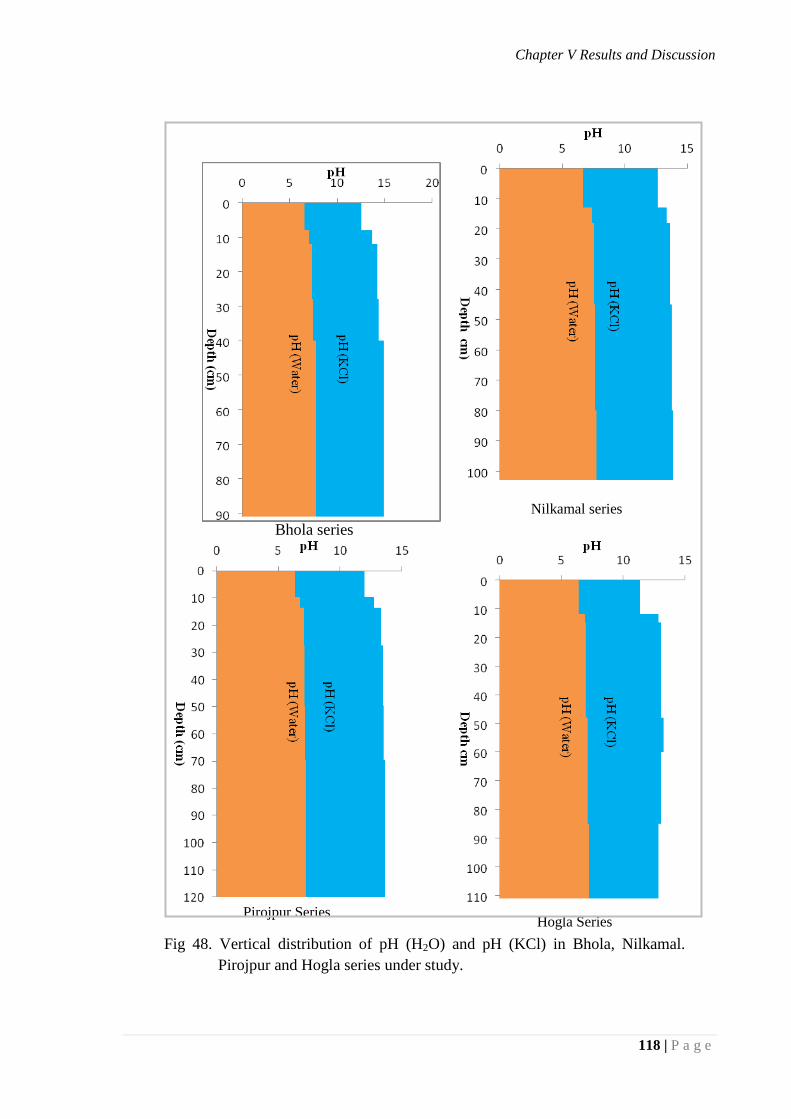
Chapter V Results and Discussion
118 | P a g e
Fig 48. Vertical distribution of pH (H2O) and pH (KCl) in Bhola, Nilkamal.
Pirojpur and Hogla series under study.
Hogla Series Pirojpur Series
Nilkamal series
Bhola series
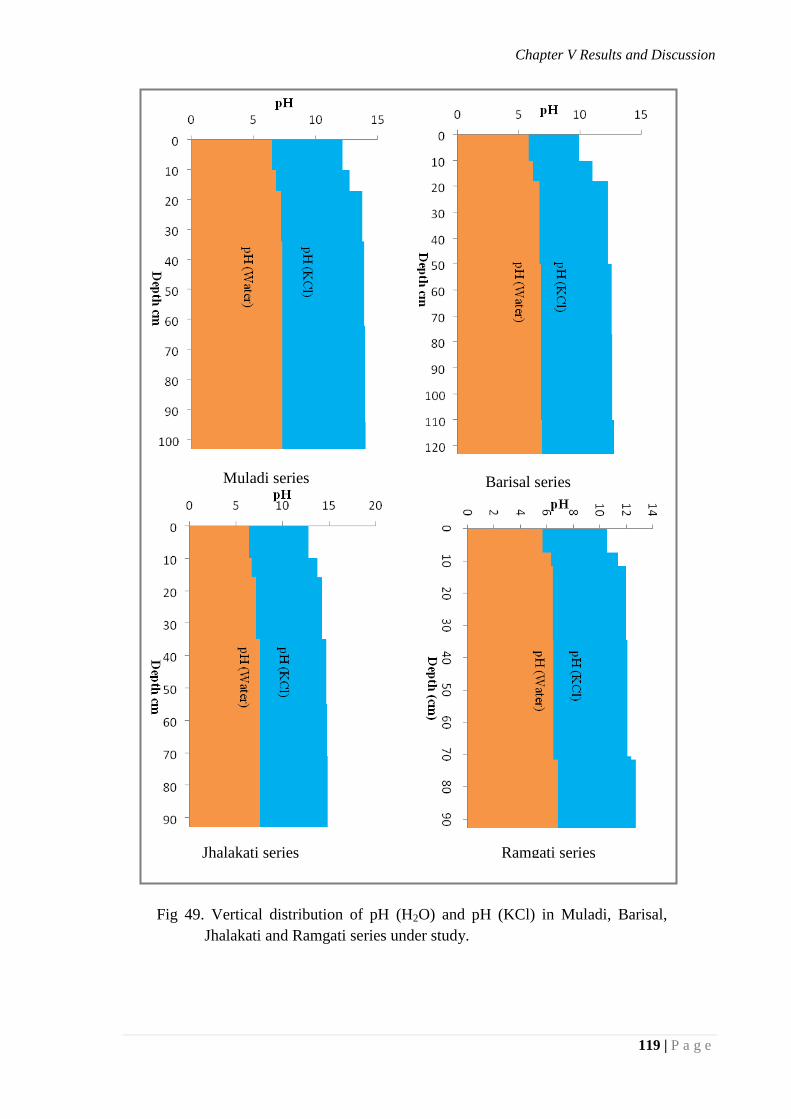
Chapter V Results and Discussion
119 | P a g e
Muladi series Barisal series
Jhalakati series Ramgati series
Fig 49. Vertical distribution of pH (H2O) and pH (KCl) in Muladi, Barisal,
Jhalakati and Ramgati series under study.

Chapter V Results and Discussion
120 | P a g e
5.8.2 Free lime
Results of free lime content in the studied soils are presented in Table 15. Free lime
content varies from 0.45 to 2.68 percent with a mean value 1.17 percent. Free lime less than
2 percent indicate that the soils are non-calcareous in nature. The highest mean value is
observed in Muladi profile (2.23 percent) whereas lowest mean value in Hogla profile (Fig
50). The results indicate that there is no free lime in the studied soils except Muladi soil.
Muladi soil is regarded as slightly calcareous but rest of the soils is non-calcareous in
nature.
5.8.3 Electrical conductivity (EC)
The EC content ranges from 0.12 to 1.65 dS/m with a mean value of 0.54 dS/m at
25○C (Table 15). Highest value is found in Jhalakati soil and lowest in Hogla soils (Fig 51).
The surface horizon of Jhalakati soil has EC value of 1.29 dS/m due to higher electrolytic
elements. EC value (less than 4 dS/m) suggested all the soils contained at nondetrimental
level for agricultural production (BARC, 2012).
The vertical distribution pattern of EC is found irregular. In some profiles, however,
there is a trend of decreasing EC value with depth. The low salt content in these soils is due
to the fact that all these soils are located within the polders. Due to continuous leaching by
rainwater every year during the wet season free salts in these soils have been washed away.
As a consequence salt content is low and with respect to salinity these are completely
normal soils. However during the dry season in the months of late February and early march
white salts appear at the surface of the soils which disappear with falling of first rain.
Fig 50. Graph shows the mean value of free lime of the studied soils
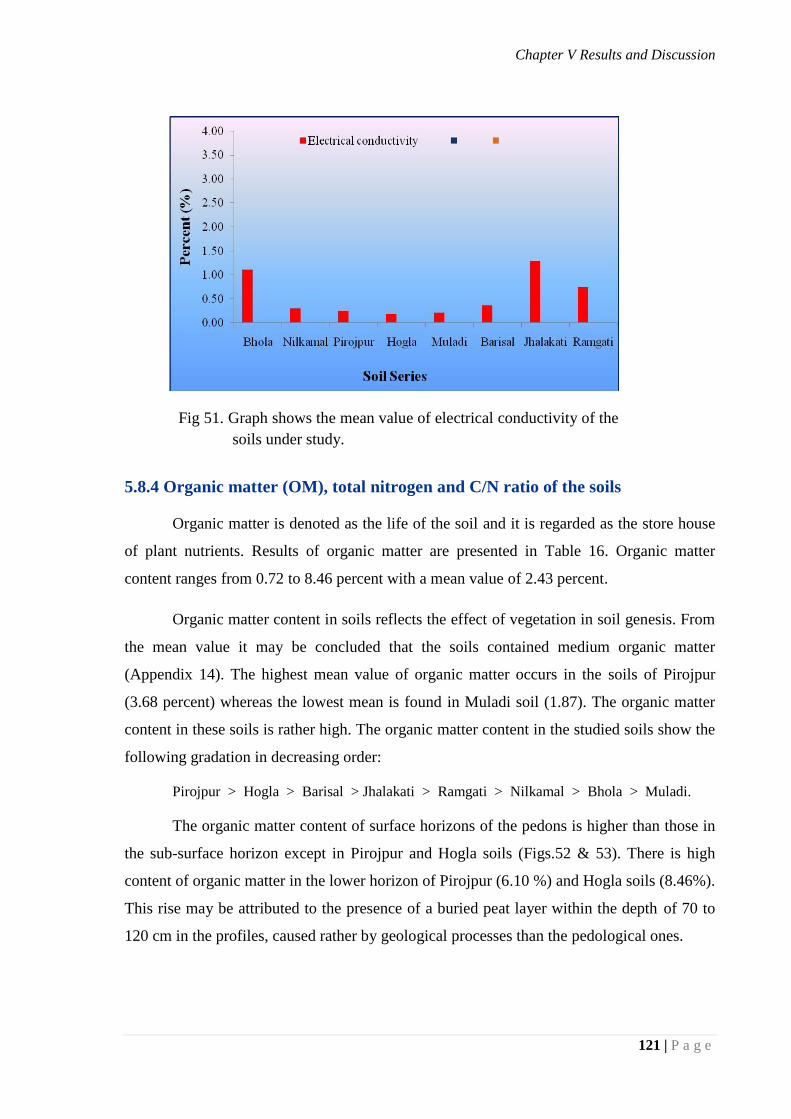
Chapter V Results and Discussion
121 | P a g e
5.8.4 Organic matter (OM), total nitrogen and C/N ratio of the soils
Organic matter is denoted as the life of the soil and it is regarded as the store house
of plant nutrients. Results of organic matter are presented in Table 16. Organic matter
content ranges from 0.72 to 8.46 percent with a mean value of 2.43 percent.
Organic matter content in soils reflects the effect of vegetation in soil genesis. From
the mean value it may be concluded that the soils contained medium organic matter
(Appendix 14). The highest mean value of organic matter occurs in the soils of Pirojpur
(3.68 percent) whereas the lowest mean is found in Muladi soil (1.87). The organic matter
content in these soils is rather high. The organic matter content in the studied soils show the
following gradation in decreasing order:
Pirojpur > Hogla > Barisal > Jhalakati > Ramgati > Nilkamal > Bhola > Muladi.
The organic matter content of surface horizons of the pedons is higher than those in
the sub-surface horizon except in Pirojpur and Hogla soils (Figs.52 & 53). There is high
content of organic matter in the lower horizon of Pirojpur (6.10 %) and Hogla soils (8.46%).
This rise may be attributed to the presence of a buried peat layer within the depth of 70 to
120 cm in the profiles, caused rather by geological processes than the pedological ones.
Fig 51. Graph shows the mean value of electrical conductivity of the
soils under study.
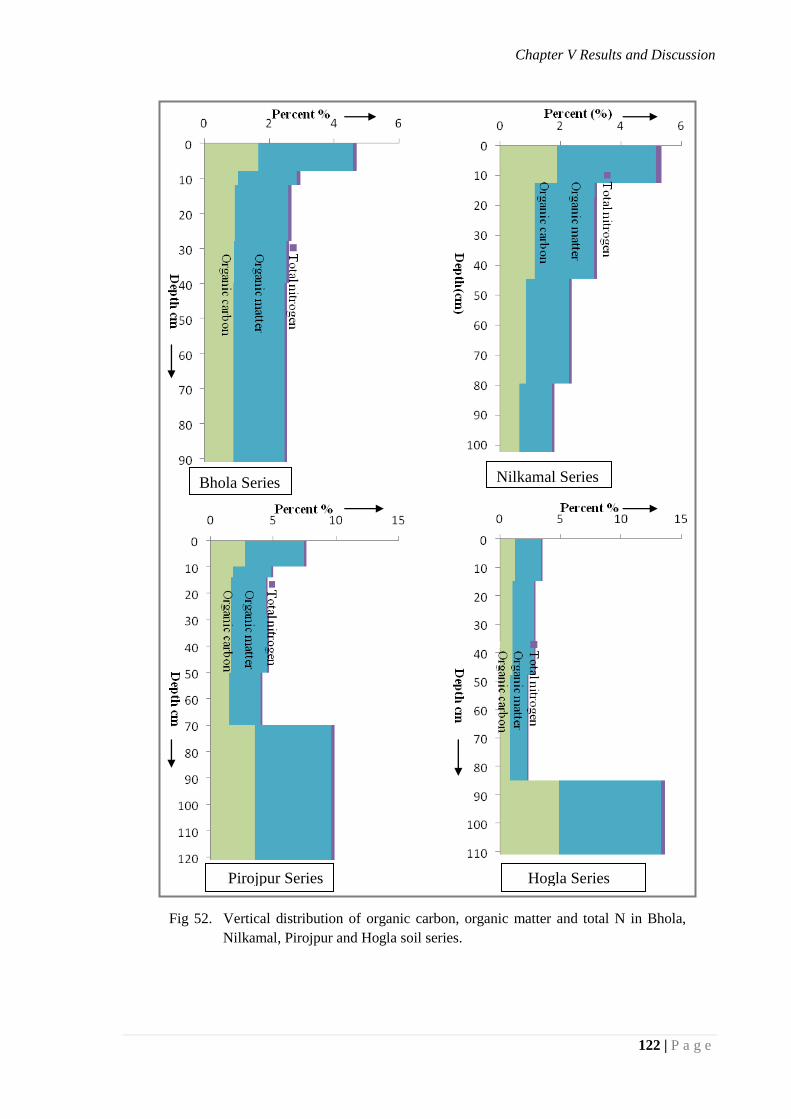
Chapter V Results and Discussion
122 | P a g e
Nilkamal Series
Pirojpur Series Hogla Series
Bhola Series
Fig 52. Vertical distribution of organic carbon, organic matter and total N in Bhola,
Nilkamal, Pirojpur and Hogla soil series.
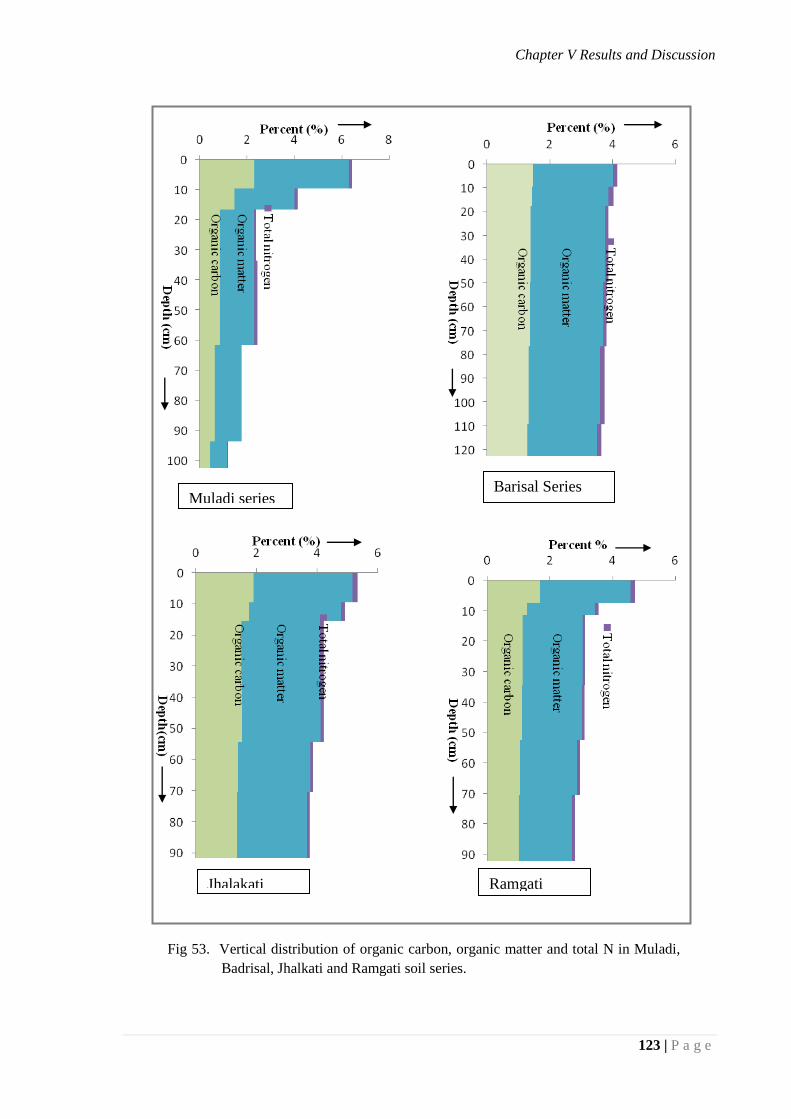
Chapter V Results and Discussion
123 | P a g e
Barisal Series
Ramgati
Series
Jhalakati
Series
Muladi series
Fig 53. Vertical distribution of organic carbon, organic matter and total N in Muladi,
Badrisal, Jhalkati and Ramgati soil series.
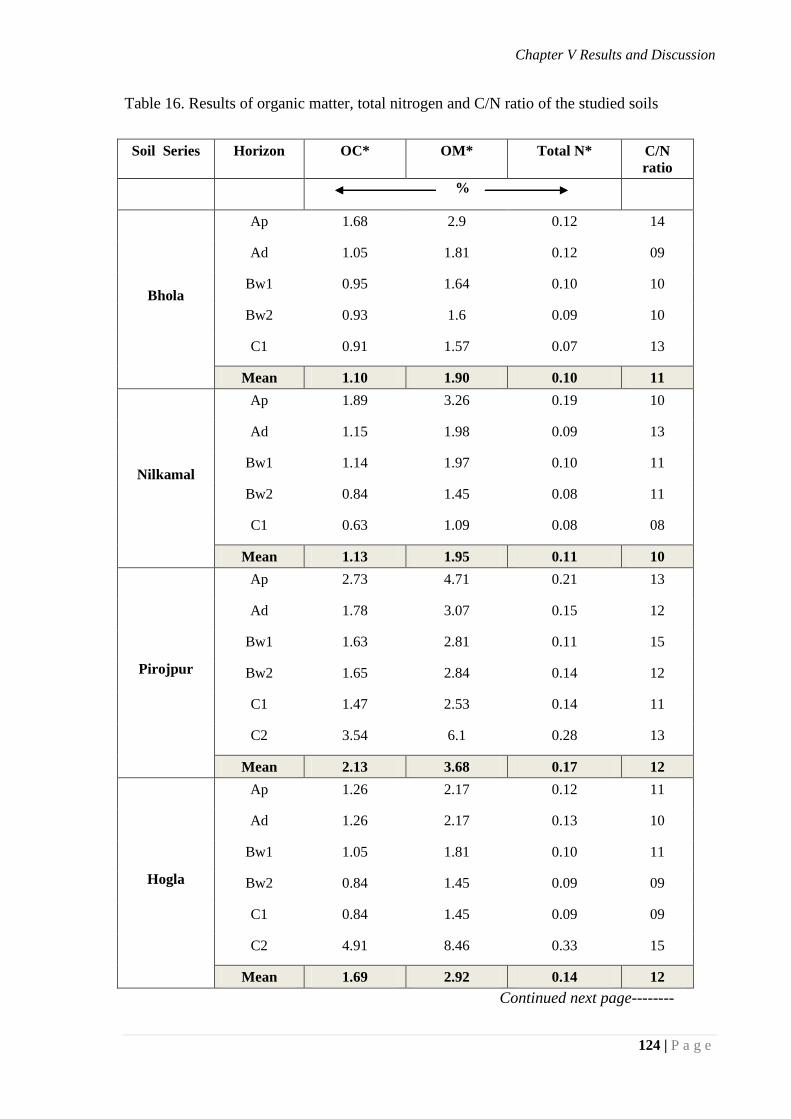
Chapter V Results and Discussion
124 | P a g e
Table 16. Results of organic matter, total nitrogen and C/N ratio of the studied soils
Soil Series Horizon OC* OM* Total N* C/N
ratio
%
Bhola
Ap 1.68 2.9 0.12 14
Ad 1.05 1.81 0.12 09
Bw1 0.95 1.64 0.10 10
Bw2 0.93 1.6 0.09 10
C1 0.91 1.57 0.07 13
Mean 1.10 1.90 0.10 11
Nilkamal
Ap 1.89 3.26 0.19 10
Ad 1.15 1.98 0.09 13
Bw1 1.14 1.97 0.10 11
Bw2 0.84 1.45 0.08 11
C1 0.63 1.09 0.08 08
Mean 1.13 1.95 0.11 10
Pirojpur
Ap 2.73 4.71 0.21 13
Ad 1.78 3.07 0.15 12
Bw1 1.63 2.81 0.11 15
Bw2 1.65 2.84 0.14 12
C1 1.47 2.53 0.14 11
C2 3.54 6.1 0.28 13
Mean 2.13 3.68 0.17 12
Hogla
Ap 1.26 2.17 0.12 11
Ad 1.26 2.17 0.13 10
Bw1 1.05 1.81 0.10 11
Bw2 0.84 1.45 0.09 09
C1 0.84 1.45 0.09 09
C2 4.91 8.46 0.33 15
Mean 1.69 2.92 0.14 12
Continued next page--------
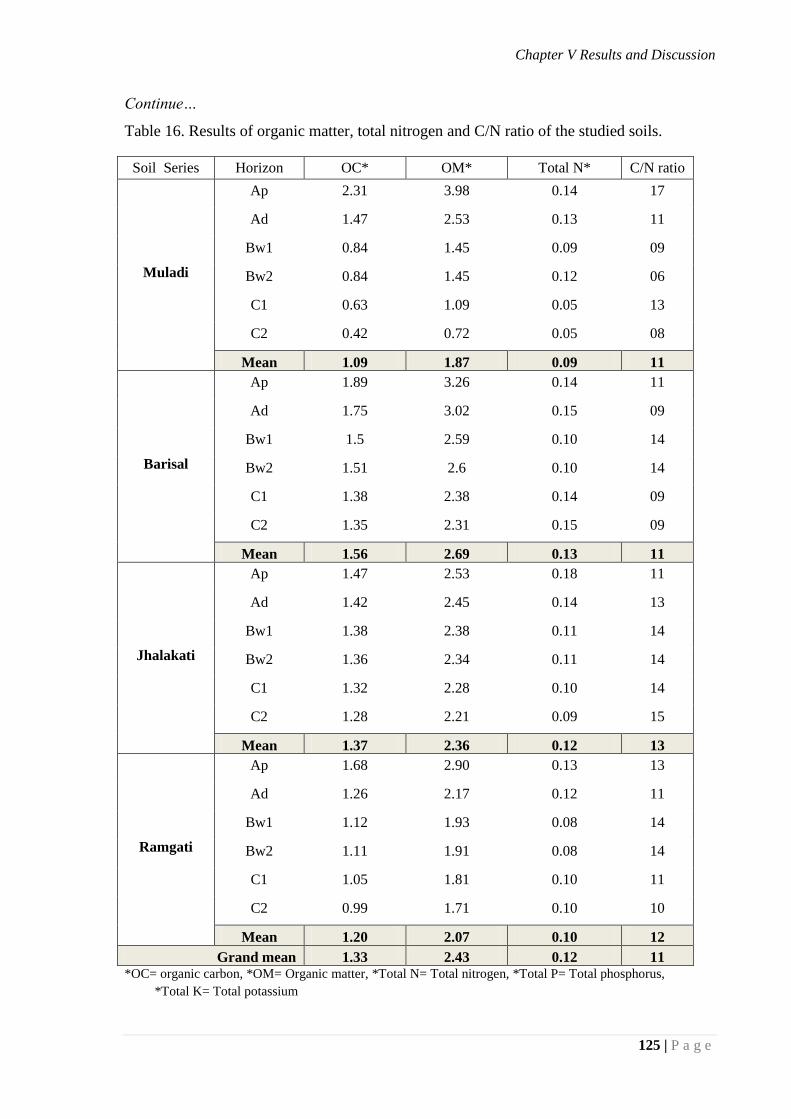
Chapter V Results and Discussion
125 | P a g e
Continue…
Table 16. Results of organic matter, total nitrogen and C/N ratio of the studied soils.
Soil Series Horizon OC* OM* Total N* C/N ratio
Muladi
Ap 2.31 3.98 0.14 17
Ad 1.47 2.53 0.13 11
Bw1 0.84 1.45 0.09 09
Bw2 0.84 1.45 0.12 06
C1 0.63 1.09 0.05 13
C2 0.42 0.72 0.05 08
Mean 1.09 1.87 0.09 11
Barisal
Ap 1.89 3.26 0.14 11
Ad 1.75 3.02 0.15 09
Bw1 1.5 2.59 0.10 14
Bw2 1.51 2.6 0.10 14
C1 1.38 2.38 0.14 09
C2 1.35 2.31 0.15 09
Mean 1.56 2.69 0.13 11
Jhalakati
Ap 1.47 2.53 0.18 11
Ad 1.42 2.45 0.14 13
Bw1 1.38 2.38 0.11 14
Bw2 1.36 2.34 0.11 14
C1 1.32 2.28 0.10 14
C2 1.28 2.21 0.09 15
Mean 1.37 2.36 0.12 13
Ramgati
Ap 1.68 2.90 0.13 13
Ad 1.26 2.17 0.12 11
Bw1 1.12 1.93 0.08 14
Bw2 1.11 1.91 0.08 14
C1 1.05 1.81 0.10 11
C2 0.99 1.71 0.10 10
Mean 1.20 2.07 0.10 12
Grand mean 1.33 2.43 0.12 11 *OC= organic carbon, *OM= Organic matter, *Total N= Total nitrogen, *Total P= Total phosphorus,
*Total K= Total potassium
Chapter V Results and Discussion
126 | P a g e
This soil was subsequently buried under new deposits. After burial the high organic
carbon content in these horizons was preserved as their decomposition was slowed or
almost stopped.
At a distant past, these high organic matter containing layers were at the soil
surface but fresh deposition of sediments have buried these surface soil layers converting
them into paleosols (Saheed and Hussain, 1992). Such surface deposition of fresh sediments
on previous soil surfaces was a common feature in many flooded soils of the southwestern
part of Bangladesh (Ferdous et al. 2005). With respect to the organic matter content, the
investigated soils are similar to those of other nearly offshore islands (Hussain et al. 1989;
Begum, 1996; Islam et al. 2014b) in Bangladesh.
There is high content of organic matter in the lower horizon of Pirojpur (6.10 %) and
Hogla soils (8.46%). This rise may be attributed to the presence of a buried peat layer
within the depth of 70 to 120 cm in the profiles, caused rather by geological processes than
the pedological ones. This soil was subsequently buried under new deposits. After burial the
high organic carbon content in these horizons was preserved as their decomposition was
slowed or almost stopped. At a distant past, these high organic matter containing layers
were at the soil surface but fresh deposition of sediments have buried these surface soil
layers converting them into paleosols (Saheed and Hussain, 1992). Such surface deposition
of fresh sediments on previous soil surfaces was a common feature in many flooded soils of
the southwestern part of Bangladesh (Ferdous et al. 2005).
With respect to the organic matter content, the investigated soils are similar to those
of other nearly offshore islands (Hussain et al. 1989; Begum, 1996; Islam et al. 2014b) in
Bangladesh. Pirojpur and Hogla soils contains relatively high amount of organic matter
throughout the profile. This rise may be attributed to the presence of a buried peat layer
within the depth of 70 to 120 cm in the profiles, caused rather by geological processes than
the pedological ones. This soil was subsequently buried under new deposits. After burial the
high organic carbon content in these horizons was preserved as their decomposition was
slowed or almost stopped. At a distant past, these high organic matter containing layers
were at the soil surface but fresh deposition of sediments have buried these surface soil
layers converting them into paleosols. Such surface deposition of fresh sediments on
previous soil surfaces was a common feature in many flooded soils of the southwestern part
of Bangladesh (Ferdous et al. 2005).
The highest content of organic matter is found in the surface soil of Pirojpur profile (4.71
percent) while the lowest content is found in Hogla profile. The higher organic matter in the
surface horizons might be due to maximum root activity of biomass as well as natural and
artificial additions of fresh or partly decomposed organic matterial in the form of manure
and crop residues (Hussain et al. 1989).
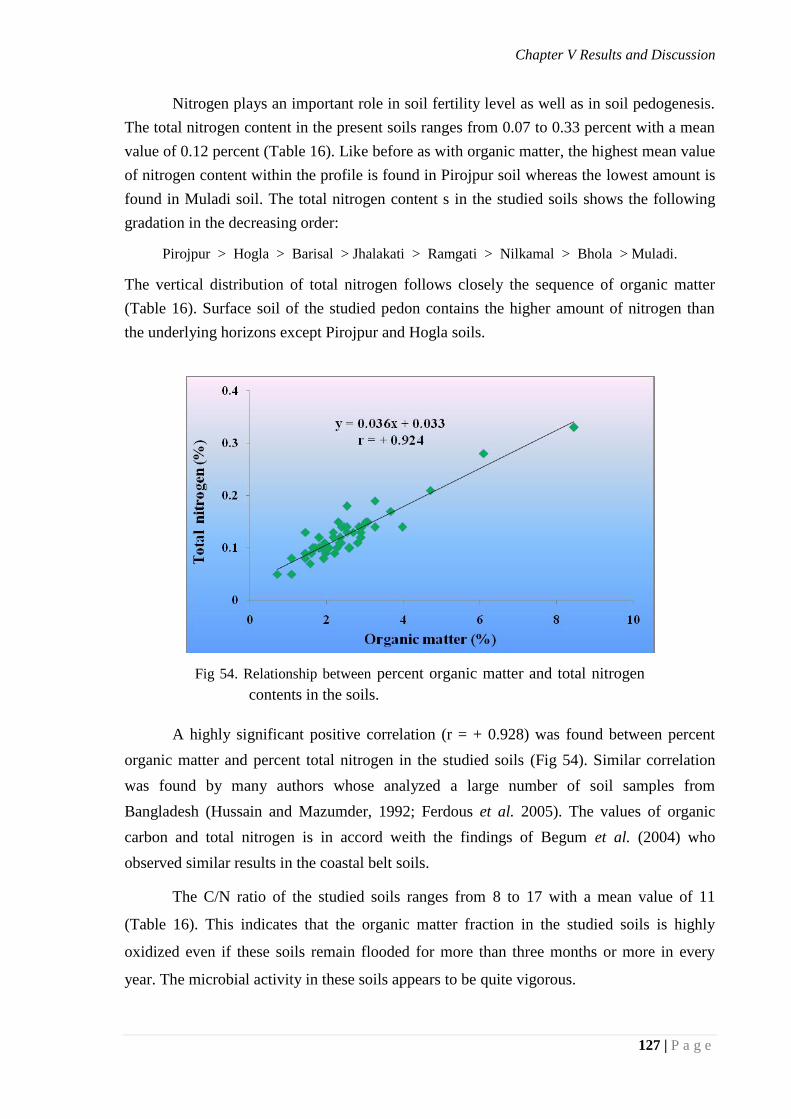
Chapter V Results and Discussion
127 | P a g e
Nitrogen plays an important role in soil fertility level as well as in soil pedogenesis.
The total nitrogen content in the present soils ranges from 0.07 to 0.33 percent with a mean
value of 0.12 percent (Table 16). Like before as with organic matter, the highest mean value
of nitrogen content within the profile is found in Pirojpur soil whereas the lowest amount is
found in Muladi soil. The total nitrogen content s in the studied soils shows the following
gradation in the decreasing order:
Pirojpur > Hogla > Barisal > Jhalakati > Ramgati > Nilkamal > Bhola > Muladi.
The vertical distribution of total nitrogen follows closely the sequence of organic matter
(Table 16). Surface soil of the studied pedon contains the higher amount of nitrogen than
the underlying horizons except Pirojpur and Hogla soils.
A highly significant positive correlation (r = + 0.928) was found between percent
organic matter and percent total nitrogen in the studied soils (Fig 54). Similar correlation
was found by many authors whose analyzed a large number of soil samples from
Bangladesh (Hussain and Mazumder, 1992; Ferdous et al. 2005). The values of organic
carbon and total nitrogen is in accord weith the findings of Begum et al. (2004) who
observed similar results in the coastal belt soils.
The C/N ratio of the studied soils ranges from 8 to 17 with a mean value of 11
(Table 16). This indicates that the organic matter fraction in the studied soils is highly
oxidized even if these soils remain flooded for more than three months or more in every
year. The microbial activity in these soils appears to be quite vigorous.
Fig 54. Relationship between percent organic matter and total nitrogen
contents in the soils.
Chapter V Results and Discussion
128 | P a g e
Distribution pattern of C/N ratio value in the profiles from the surface downward
show an irregular pattern with depth in most of the soils (Table 16). The irregular
distribution of C/N ratio value in the profiles is due to the different degree of decomposition
at various horizons.This short of irregular pattern is quite common in the floodplain soils of
Bangladesh (Mazumder, 1996; Hussain et al. 1989). Slight fall of C/N ratio with depth in
the profile has been reported by SRDI Staff (1965-86) in the soils from the coastal areas of
Barisal division.
5.9 Physico- chemical properties of the soils
5.9.1 Cation Exchange Capacity (CEC) of thec soils
The cation exchange capacity of the soils under the present investigation ranges
from 14.01 to 23.21 cmol kg-1
with a mean value of 17.22 cmol/ kg soil (Table 17). The
highest mean value of CEC among the profiles is found in the Hogla soils and the lowest in
the Ramgati soil. These results indicate that fine textured soils contain the higher CEC than
the medium textured soils due to their higher clay content. The increase in CEC values with
increasing clay contents in soils was also observed by many researchers (Gupta and Mishra,
1970; Pathak et al.1980; Begum, 2004 Islam et al. 2014b).
Nahar (1987) studied some soils of coastal area in Bangladesh and reported that the
CEC values ranges from 8.41 to 16.2 cmol kg-1
.
The variation of CEC of the studied pedons reflected the important influence of both
the clay and organic matter content of these soils. The distribution patterns of CEC with
depth in the profiles show an irregular trend like those of clay and organic matter.
The index of weathering (IW = CEC/ clay ratio) of these soils is found to vary from
0.31 to 2.77 with a mean index of 0.58 (Table 17). Such a wide range in the above ratio
indicates a wide variation in the type and amount of clay minerals present in the clay
fraction of these soils. These results are in accord with the findings of Begum (1996) and
Taraqqi (2007) who worked on some soils of coastal zone.
A significant positive correlation (r = +0.71) has been found between CEC and percent clay
(Fig 55) and also found a significant positive correlation (r = +0.676) between CEC and
percent organic matter in the present studied soils (Fig 56).
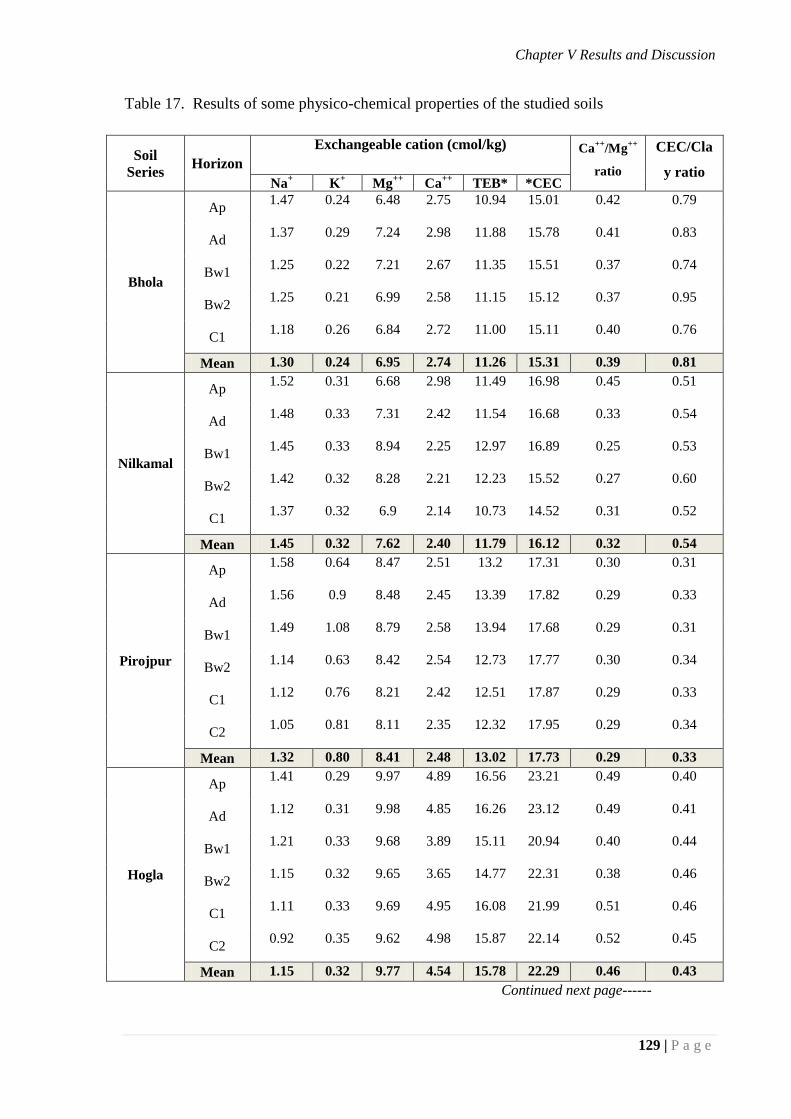
Chapter V Results and Discussion
129 | P a g e
Table 17. Results of some physico-chemical properties of the studied soils
Soil
Series Horizon
Exchangeable cation (cmol/kg) Ca++
/Mg++
ratio
CEC/Cla
y ratio Na
+ K
+ Mg
++ Ca
++ TEB* *CEC
Bhola
Ap 1.47 0.24 6.48 2.75 10.94 15.01 0.42 0.79
Ad 1.37 0.29 7.24 2.98 11.88 15.78 0.41 0.83
Bw1 1.25 0.22 7.21 2.67 11.35 15.51 0.37 0.74
Bw2 1.25 0.21 6.99 2.58 11.15 15.12 0.37 0.95
C1 1.18 0.26 6.84 2.72 11.00 15.11 0.40 0.76
Mean 1.30 0.24 6.95 2.74 11.26 15.31 0.39 0.81
Nilkamal
Ap 1.52 0.31 6.68 2.98 11.49 16.98 0.45 0.51
Ad 1.48 0.33 7.31 2.42 11.54 16.68 0.33 0.54
Bw1 1.45 0.33 8.94 2.25 12.97 16.89 0.25 0.53
Bw2 1.42 0.32 8.28 2.21 12.23 15.52 0.27 0.60
C1 1.37 0.32 6.9 2.14 10.73 14.52 0.31 0.52
Mean 1.45 0.32 7.62 2.40 11.79 16.12 0.32 0.54
Pirojpur
Ap 1.58 0.64 8.47 2.51 13.2 17.31 0.30 0.31
Ad 1.56 0.9 8.48 2.45 13.39 17.82 0.29 0.33
Bw1 1.49 1.08 8.79 2.58 13.94 17.68 0.29 0.31
Bw2 1.14 0.63 8.42 2.54 12.73 17.77 0.30 0.34
C1 1.12 0.76 8.21 2.42 12.51 17.87 0.29 0.33
C2 1.05 0.81 8.11 2.35 12.32 17.95 0.29 0.34
Mean 1.32 0.80 8.41 2.48 13.02 17.73 0.29 0.33
Hogla
Ap 1.41 0.29 9.97 4.89 16.56 23.21 0.49 0.40
Ad 1.12 0.31 9.98 4.85 16.26 23.12 0.49 0.41
Bw1 1.21 0.33 9.68 3.89 15.11 20.94 0.40 0.44
Bw2 1.15 0.32 9.65 3.65 14.77 22.31 0.38 0.46
C1 1.11 0.33 9.69 4.95 16.08 21.99 0.51 0.46
C2 0.92 0.35 9.62 4.98 15.87 22.14 0.52 0.45
Mean 1.15 0.32 9.77 4.54 15.78 22.29 0.46 0.43
Continued next page------
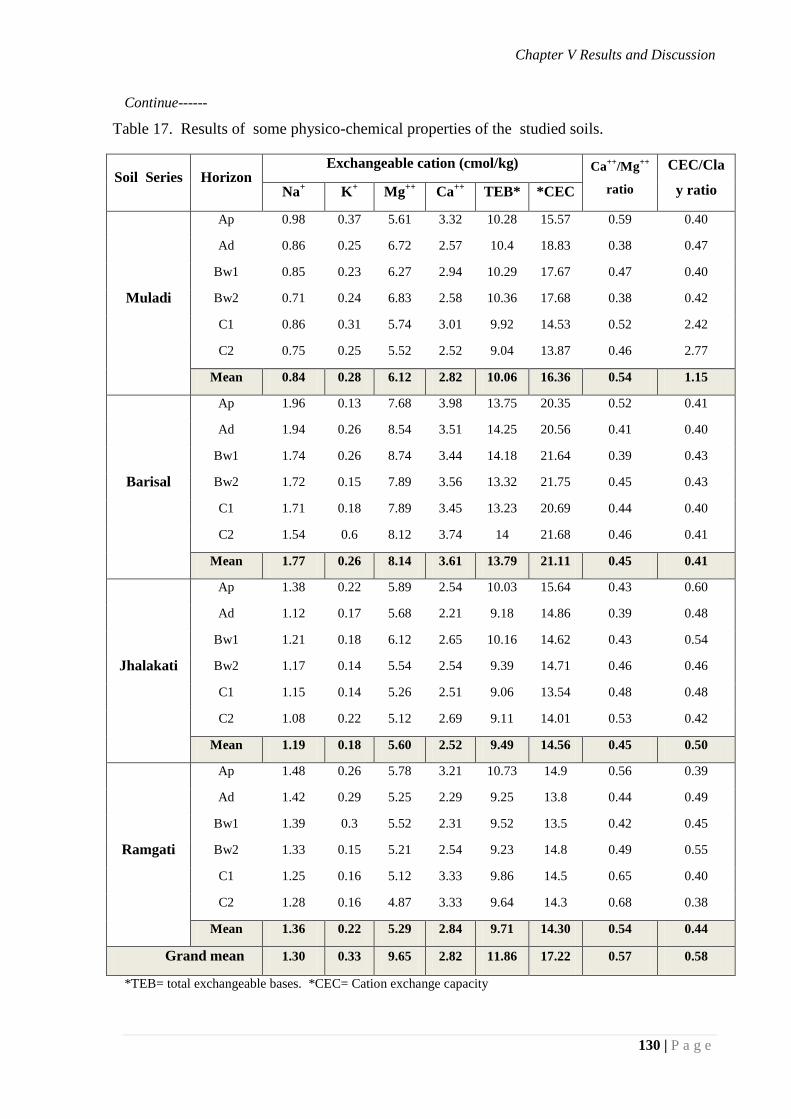
Chapter V Results and Discussion
130 | P a g e
Continue------
Table 17. Results of some physico-chemical properties of the studied soils.
Soil Series Horizon Exchangeable cation (cmol/kg) Ca
++/Mg
++
ratio
CEC/Cla
y ratio Na+ K
+ Mg
++ Ca
++ TEB* *CEC
Muladi
Ap 0.98 0.37 5.61 3.32 10.28 15.57 0.59 0.40
Ad 0.86 0.25 6.72 2.57 10.4 18.83 0.38 0.47
Bw1 0.85 0.23 6.27 2.94 10.29 17.67 0.47 0.40
Bw2 0.71 0.24 6.83 2.58 10.36 17.68 0.38 0.42
C1 0.86 0.31 5.74 3.01 9.92 14.53 0.52 2.42
C2 0.75 0.25 5.52 2.52 9.04 13.87 0.46 2.77
Mean 0.84 0.28 6.12 2.82 10.06 16.36 0.54 1.15
Barisal
Ap 1.96 0.13 7.68 3.98 13.75 20.35 0.52 0.41
Ad 1.94 0.26 8.54 3.51 14.25 20.56 0.41 0.40
Bw1 1.74 0.26 8.74 3.44 14.18 21.64 0.39 0.43
Bw2 1.72 0.15 7.89 3.56 13.32 21.75 0.45 0.43
C1 1.71 0.18 7.89 3.45 13.23 20.69 0.44 0.40
C2 1.54 0.6 8.12 3.74 14 21.68 0.46 0.41
Mean 1.77 0.26 8.14 3.61 13.79 21.11 0.45 0.41
Jhalakati
Ap 1.38 0.22 5.89 2.54 10.03 15.64 0.43 0.60
Ad 1.12 0.17 5.68 2.21 9.18 14.86 0.39 0.48
Bw1 1.21 0.18 6.12 2.65 10.16 14.62 0.43 0.54
Bw2 1.17 0.14 5.54 2.54 9.39 14.71 0.46 0.46
C1 1.15 0.14 5.26 2.51 9.06 13.54 0.48 0.48
C2 1.08 0.22 5.12 2.69 9.11 14.01 0.53 0.42
Mean 1.19 0.18 5.60 2.52 9.49 14.56 0.45 0.50
Ramgati
Ap 1.48 0.26 5.78 3.21 10.73 14.9 0.56 0.39
Ad 1.42 0.29 5.25 2.29 9.25 13.8 0.44 0.49
Bw1 1.39 0.3 5.52 2.31 9.52 13.5 0.42 0.45
Bw2 1.33 0.15 5.21 2.54 9.23 14.8 0.49 0.55
C1 1.25 0.16 5.12 3.33 9.86 14.5 0.65 0.40
C2 1.28 0.16 4.87 3.33 9.64 14.3 0.68 0.38
Mean 1.36 0.22 5.29 2.84 9.71 14.30 0.54 0.44
Grand mean 1.30 0.33 9.65 2.82 11.86 17.22 0.57 0.58
*TEB= total exchangeable bases. *CEC= Cation exchange capacity
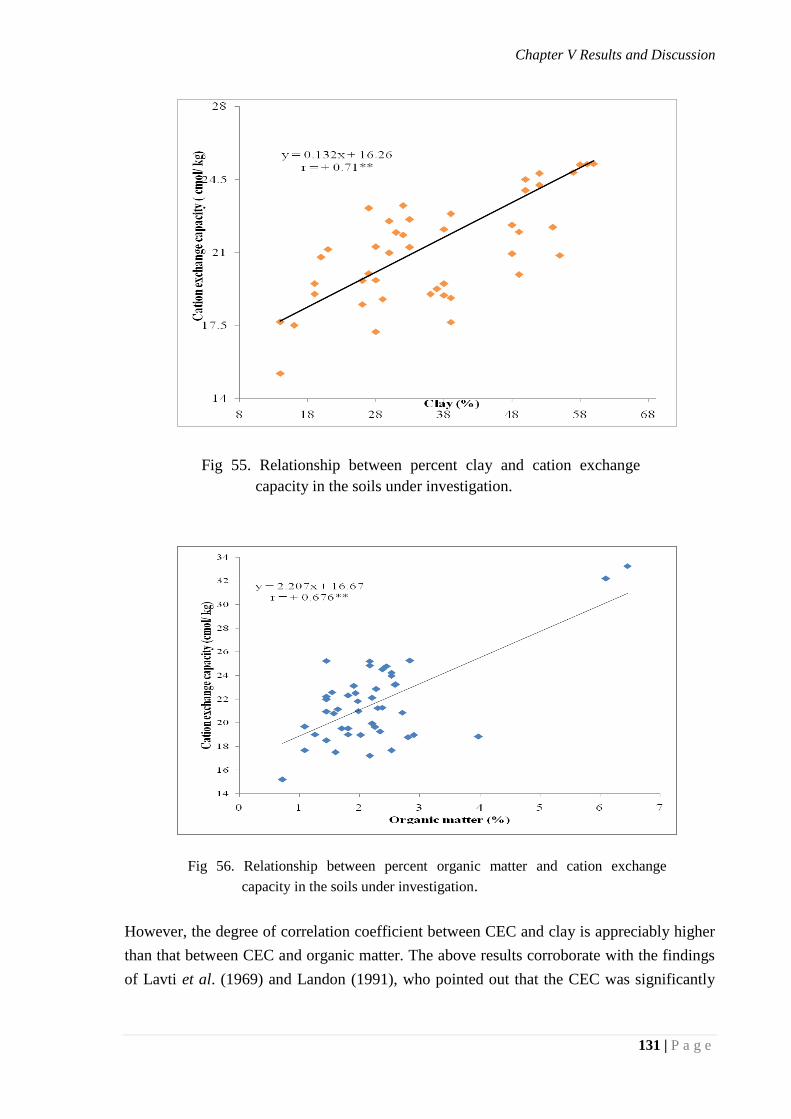
Chapter V Results and Discussion
131 | P a g e
However, the degree of correlation coefficient between CEC and clay is appreciably higher
than that between CEC and organic matter. The above results corroborate with the findings
of Lavti et al. (1969) and Landon (1991), who pointed out that the CEC was significantly
Fig 55. Relationship between percent clay and cation exchange
capacity in the soils under investigation.
Fig 56. Relationship between percent organic matter and cation exchange
capacity in the soils under investigation.
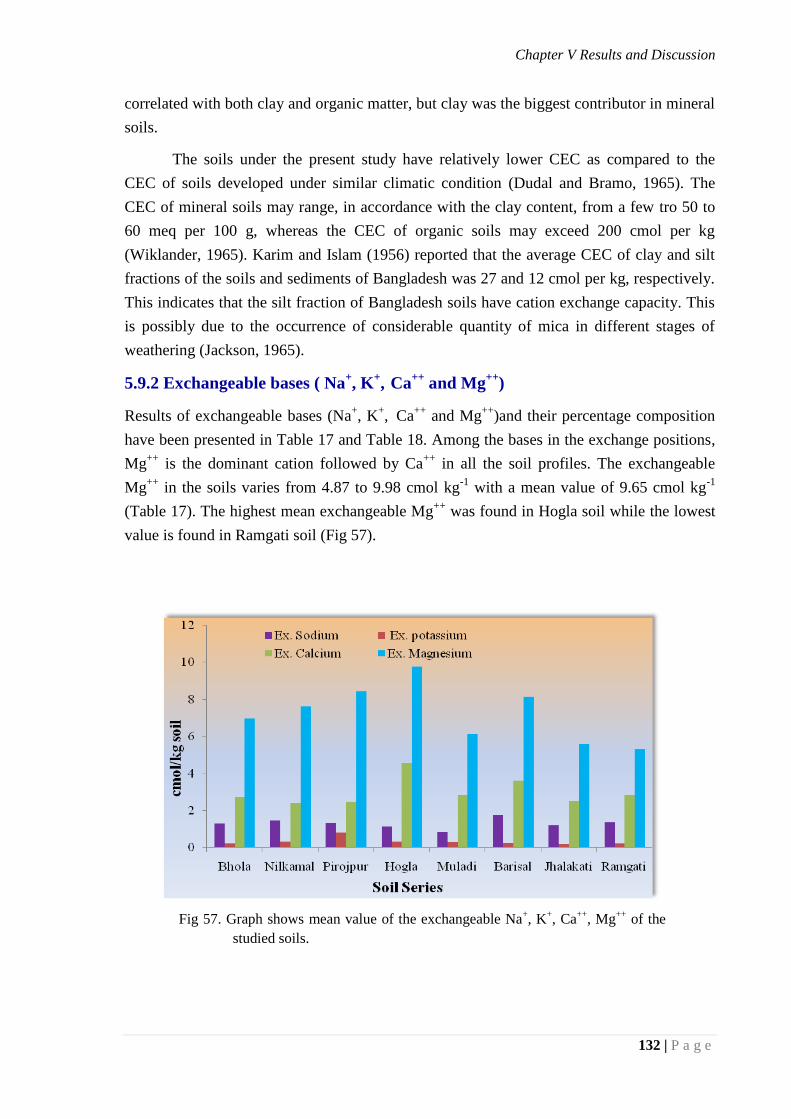
Chapter V Results and Discussion
132 | P a g e
correlated with both clay and organic matter, but clay was the biggest contributor in mineral
soils.
The soils under the present study have relatively lower CEC as compared to the
CEC of soils developed under similar climatic condition (Dudal and Bramo, 1965). The
CEC of mineral soils may range, in accordance with the clay content, from a few tro 50 to
60 meq per 100 g, whereas the CEC of organic soils may exceed 200 cmol per kg
(Wiklander, 1965). Karim and Islam (1956) reported that the average CEC of clay and silt
fractions of the soils and sediments of Bangladesh was 27 and 12 cmol per kg, respectively.
This indicates that the silt fraction of Bangladesh soils have cation exchange capacity. This
is possibly due to the occurrence of considerable quantity of mica in different stages of
weathering (Jackson, 1965).
5.9.2 Exchangeable bases ( Na+, K
+, Ca
++ and Mg
++)
Results of exchangeable bases (Na+, K
+, Ca
++ and Mg
++)and their percentage composition
have been presented in Table 17 and Table 18. Among the bases in the exchange positions,
Mg++
is the dominant cation followed by Ca++
in all the soil profiles. The exchangeable
Mg++
in the soils varies from 4.87 to 9.98 cmol kg-1
with a mean value of 9.65 cmol kg-1
(Table 17). The highest mean exchangeable Mg++
was found in Hogla soil while the lowest
value is found in Ramgati soil (Fig 57).
Fig 57. Graph shows mean value of the exchangeable Na+, K
+, Ca
++, Mg
++ of the
studied soils.
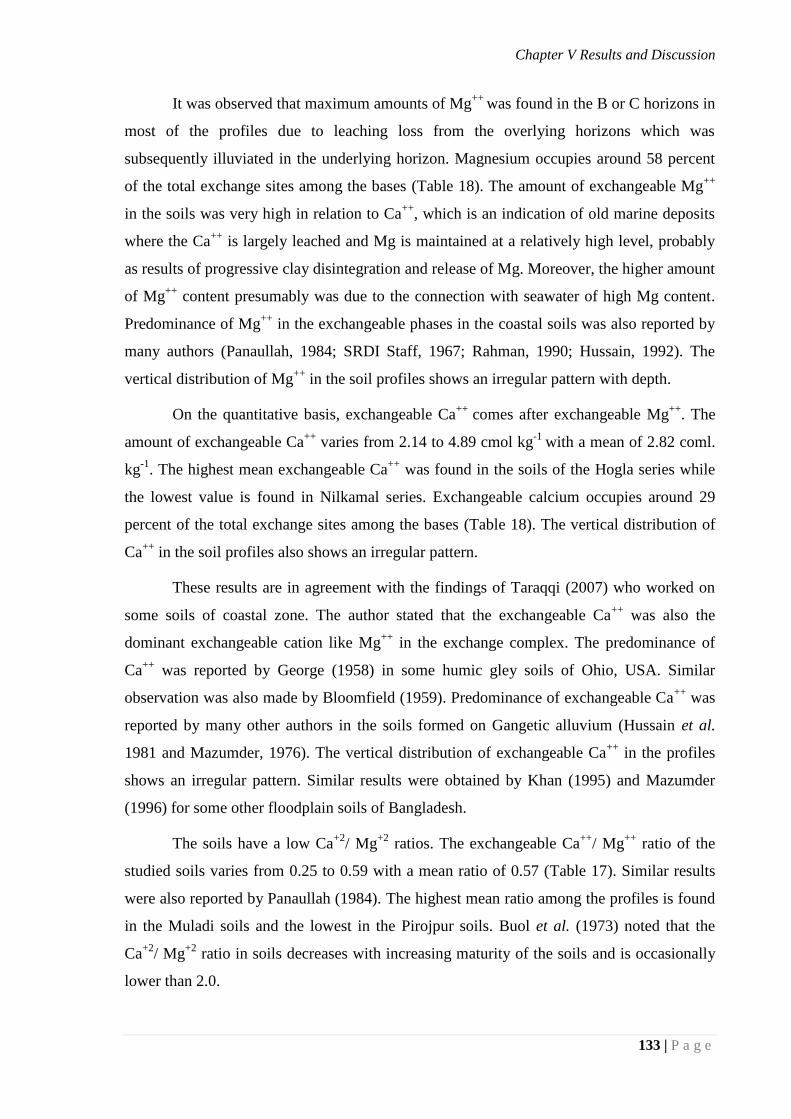
Chapter V Results and Discussion
133 | P a g e
It was observed that maximum amounts of Mg++
was found in the B or C horizons in
most of the profiles due to leaching loss from the overlying horizons which was
subsequently illuviated in the underlying horizon. Magnesium occupies around 58 percent
of the total exchange sites among the bases (Table 18). The amount of exchangeable Mg++
in the soils was very high in relation to Ca++
, which is an indication of old marine deposits
where the Ca++
is largely leached and Mg is maintained at a relatively high level, probably
as results of progressive clay disintegration and release of Mg. Moreover, the higher amount
of Mg++
content presumably was due to the connection with seawater of high Mg content.
Predominance of Mg++
in the exchangeable phases in the coastal soils was also reported by
many authors (Panaullah, 1984; SRDI Staff, 1967; Rahman, 1990; Hussain, 1992). The
vertical distribution of Mg++
in the soil profiles shows an irregular pattern with depth.
On the quantitative basis, exchangeable Ca++
comes after exchangeable Mg++
. The
amount of exchangeable Ca++
varies from 2.14 to 4.89 cmol kg-1
with a mean of 2.82 coml.
kg-1
. The highest mean exchangeable Ca++
was found in the soils of the Hogla series while
the lowest value is found in Nilkamal series. Exchangeable calcium occupies around 29
percent of the total exchange sites among the bases (Table 18). The vertical distribution of
Ca++
in the soil profiles also shows an irregular pattern.
These results are in agreement with the findings of Taraqqi (2007) who worked on
some soils of coastal zone. The author stated that the exchangeable Ca++
was also the
dominant exchangeable cation like Mg++
in the exchange complex. The predominance of
Ca++
was reported by George (1958) in some humic gley soils of Ohio, USA. Similar
observation was also made by Bloomfield (1959). Predominance of exchangeable Ca++
was
reported by many other authors in the soils formed on Gangetic alluvium (Hussain et al.
1981 and Mazumder, 1976). The vertical distribution of exchangeable Ca++
in the profiles
shows an irregular pattern. Similar results were obtained by Khan (1995) and Mazumder
(1996) for some other floodplain soils of Bangladesh.
The soils have a low Ca+2
/ Mg+2
ratios. The exchangeable Ca++
/ Mg++
ratio of the
studied soils varies from 0.25 to 0.59 with a mean ratio of 0.57 (Table 17). Similar results
were also reported by Panaullah (1984). The highest mean ratio among the profiles is found
in the Muladi soils and the lowest in the Pirojpur soils. Buol et al. (1973) noted that the
Ca+2
/ Mg+2
ratio in soils decreases with increasing maturity of the soils and is occasionally
lower than 2.0.
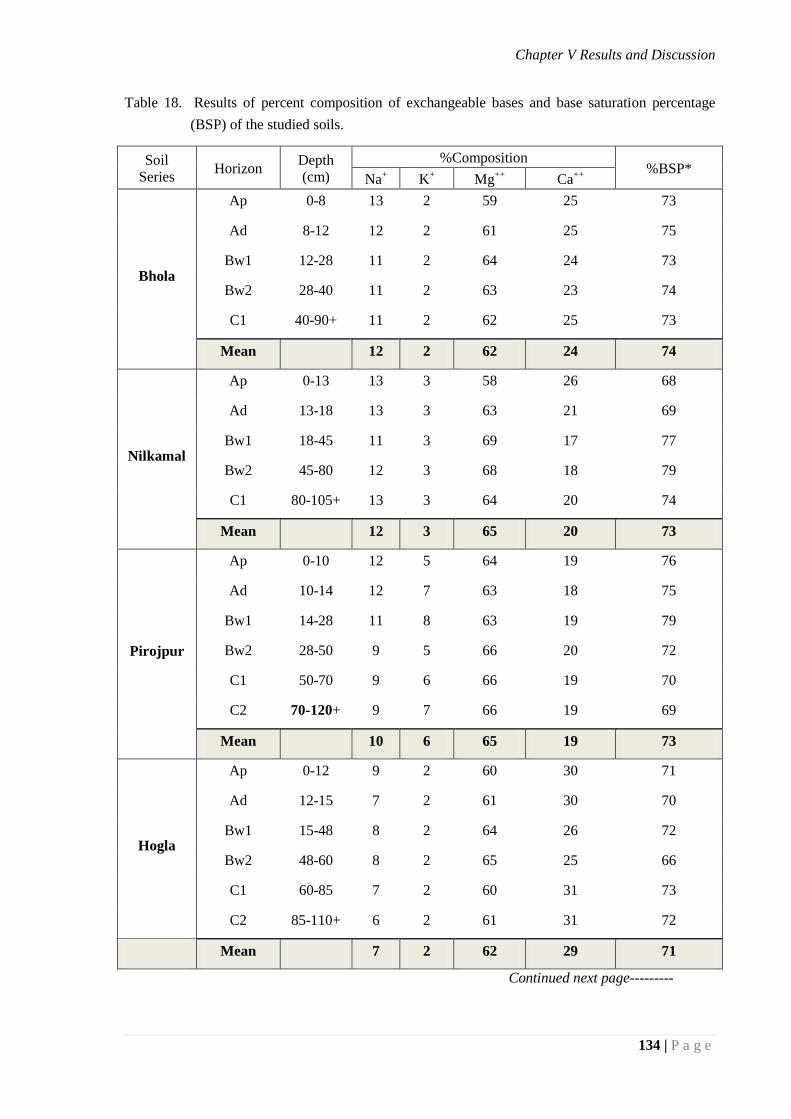
Chapter V Results and Discussion
134 | P a g e
Table 18. Results of percent composition of exchangeable bases and base saturation percentage
(BSP) of the studied soils.
Soil
Series Horizon
Depth
(cm)
%Composition %BSP*
Na+ K
+ Mg
++ Ca
++
Bhola
Ap 0-8 13 2 59 25 73
Ad 8-12 12 2 61 25 75
Bw1 12-28 11 2 64 24 73
Bw2 28-40 11 2 63 23 74
C1 40-90+ 11 2 62 25 73
Mean 12 2 62 24 74
Nilkamal
Ap 0-13 13 3 58 26 68
Ad 13-18 13 3 63 21 69
Bw1 18-45 11 3 69 17 77
Bw2 45-80 12 3 68 18 79
C1 80-105+ 13 3 64 20 74
Mean 12 3 65 20 73
Pirojpur
Ap 0-10 12 5 64 19 76
Ad 10-14 12 7 63 18 75
Bw1 14-28 11 8 63 19 79
Bw2 28-50 9 5 66 20 72
C1 50-70 9 6 66 19 70
C2 70-120+ 9 7 66 19 69
Mean 10 6 65 19 73
Hogla
Ap 0-12 9 2 60 30 71
Ad 12-15 7 2 61 30 70
Bw1 15-48 8 2 64 26 72
Bw2 48-60 8 2 65 25 66
C1 60-85 7 2 60 31 73
C2 85-110+ 6 2 61 31 72
Mean 7 2 62 29 71
Continued next page---------
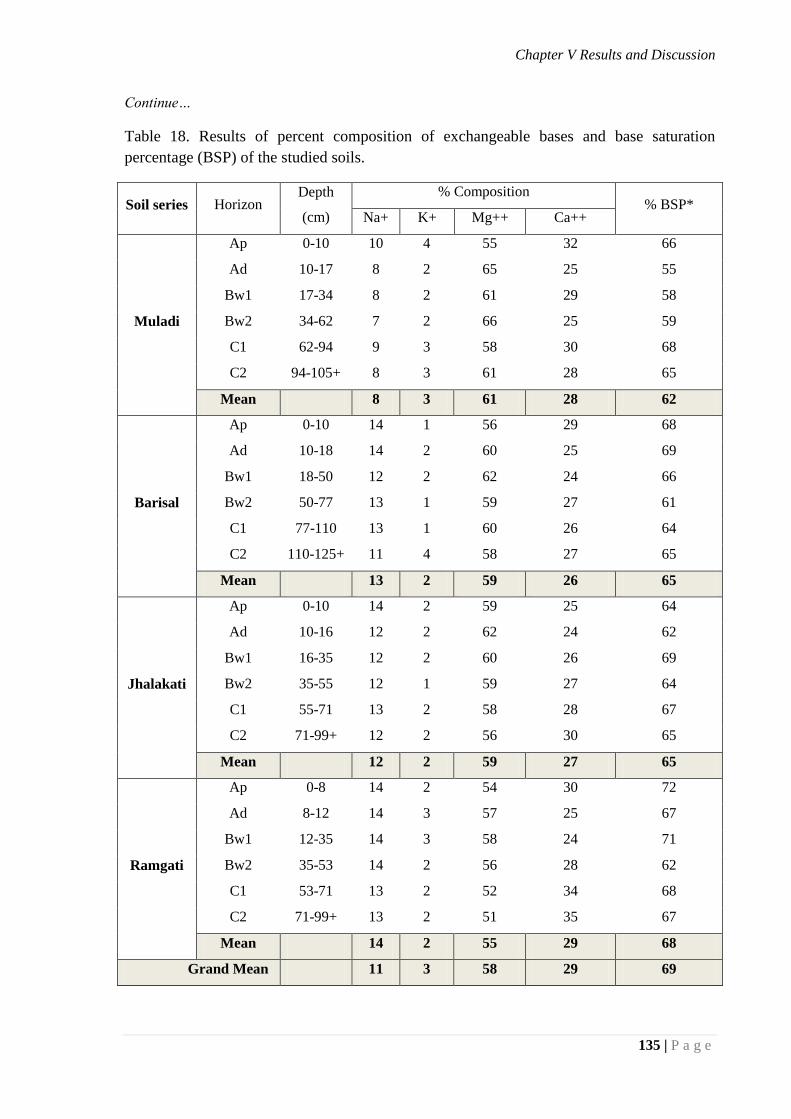
Chapter V Results and Discussion
135 | P a g e
Continue…
Table 18. Results of percent composition of exchangeable bases and base saturation
percentage (BSP) of the studied soils.
Soil series Horizon Depth
(cm)
% Composition % BSP*
Na+ K+ Mg++ Ca++
Muladi
Ap 0-10 10 4 55 32 66
Ad 10-17 8 2 65 25 55
Bw1 17-34 8 2 61 29 58
Bw2 34-62 7 2 66 25 59
C1 62-94 9 3 58 30 68
C2 94-105+ 8 3 61 28 65
Mean 8 3 61 28 62
Barisal
Ap 0-10 14 1 56 29 68
Ad 10-18 14 2 60 25 69
Bw1 18-50 12 2 62 24 66
Bw2 50-77 13 1 59 27 61
C1 77-110 13 1 60 26 64
C2 110-125+ 11 4 58 27 65
Mean 13 2 59 26 65
Jhalakati
Ap 0-10 14 2 59 25 64
Ad 10-16 12 2 62 24 62
Bw1 16-35 12 2 60 26 69
Bw2 35-55 12 1 59 27 64
C1 55-71 13 2 58 28 67
C2 71-99+ 12 2 56 30 65
Mean 12 2 59 27 65
Ramgati
Ap 0-8 14 2 54 30 72
Ad 8-12 14 3 57 25 67
Bw1 12-35 14 3 58 24 71
Bw2 35-53 14 2 56 28 62
C1 53-71 13 2 52 34 68
C2 71-99+ 13 2 51 35 67
Mean 14 2 55 29 68
Grand Mean 11 3 58 29 69
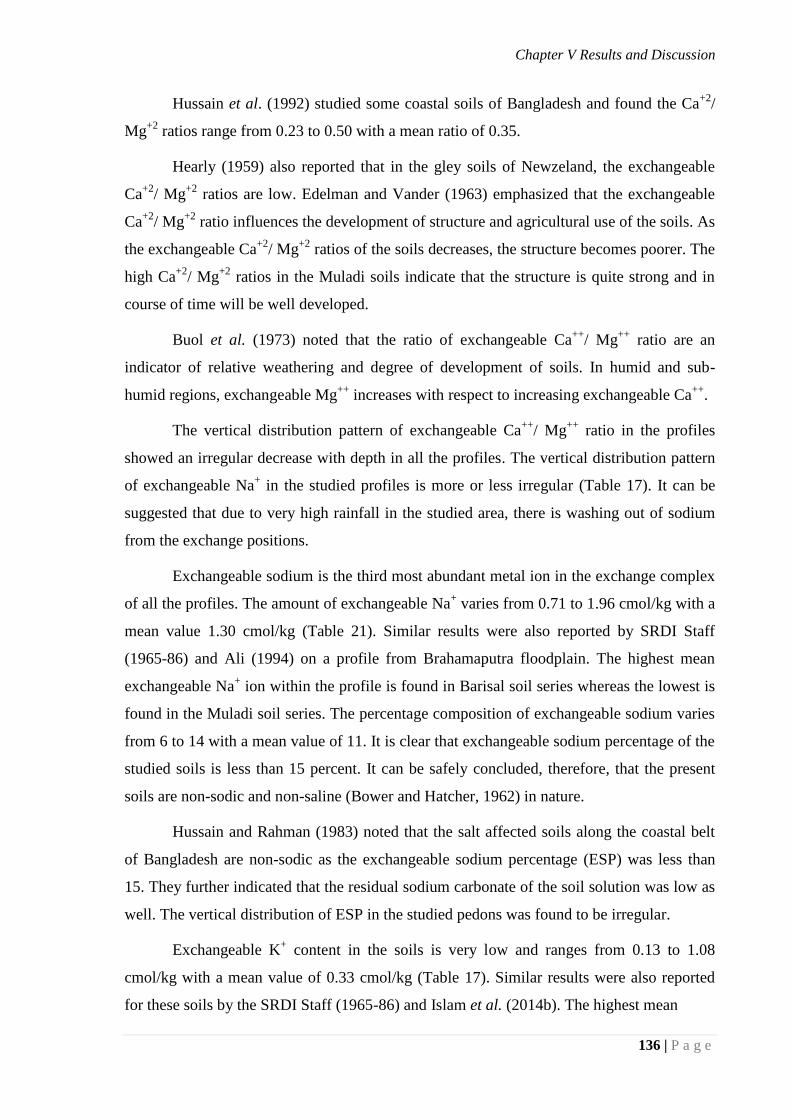
Chapter V Results and Discussion
136 | P a g e
Hussain et al. (1992) studied some coastal soils of Bangladesh and found the Ca+2
/
Mg+2
ratios range from 0.23 to 0.50 with a mean ratio of 0.35.
Hearly (1959) also reported that in the gley soils of Newzeland, the exchangeable
Ca+2
/ Mg+2
ratios are low. Edelman and Vander (1963) emphasized that the exchangeable
Ca+2
/ Mg+2
ratio influences the development of structure and agricultural use of the soils. As
the exchangeable Ca+2
/ Mg+2
ratios of the soils decreases, the structure becomes poorer. The
high Ca+2
/ Mg+2
ratios in the Muladi soils indicate that the structure is quite strong and in
course of time will be well developed.
Buol et al. (1973) noted that the ratio of exchangeable Ca++
/ Mg++
ratio are an
indicator of relative weathering and degree of development of soils. In humid and sub-
humid regions, exchangeable Mg++
increases with respect to increasing exchangeable Ca++
.
The vertical distribution pattern of exchangeable Ca++
/ Mg++
ratio in the profiles
showed an irregular decrease with depth in all the profiles. The vertical distribution pattern
of exchangeable Na+ in the studied profiles is more or less irregular (Table 17). It can be
suggested that due to very high rainfall in the studied area, there is washing out of sodium
from the exchange positions.
Exchangeable sodium is the third most abundant metal ion in the exchange complex
of all the profiles. The amount of exchangeable Na+ varies from 0.71 to 1.96 cmol/kg with a
mean value 1.30 cmol/kg (Table 21). Similar results were also reported by SRDI Staff
(1965-86) and Ali (1994) on a profile from Brahamaputra floodplain. The highest mean
exchangeable Na+ ion within the profile is found in Barisal soil series whereas the lowest is
found in the Muladi soil series. The percentage composition of exchangeable sodium varies
from 6 to 14 with a mean value of 11. It is clear that exchangeable sodium percentage of the
studied soils is less than 15 percent. It can be safely concluded, therefore, that the present
soils are non-sodic and non-saline (Bower and Hatcher, 1962) in nature.
Hussain and Rahman (1983) noted that the salt affected soils along the coastal belt
of Bangladesh are non-sodic as the exchangeable sodium percentage (ESP) was less than
15. They further indicated that the residual sodium carbonate of the soil solution was low as
well. The vertical distribution of ESP in the studied pedons was found to be irregular.
Exchangeable K+ content in the soils is very low and ranges from 0.13 to 1.08
cmol/kg with a mean value of 0.33 cmol/kg (Table 17). Similar results were also reported
for these soils by the SRDI Staff (1965-86) and Islam et al. (2014b). The highest mean
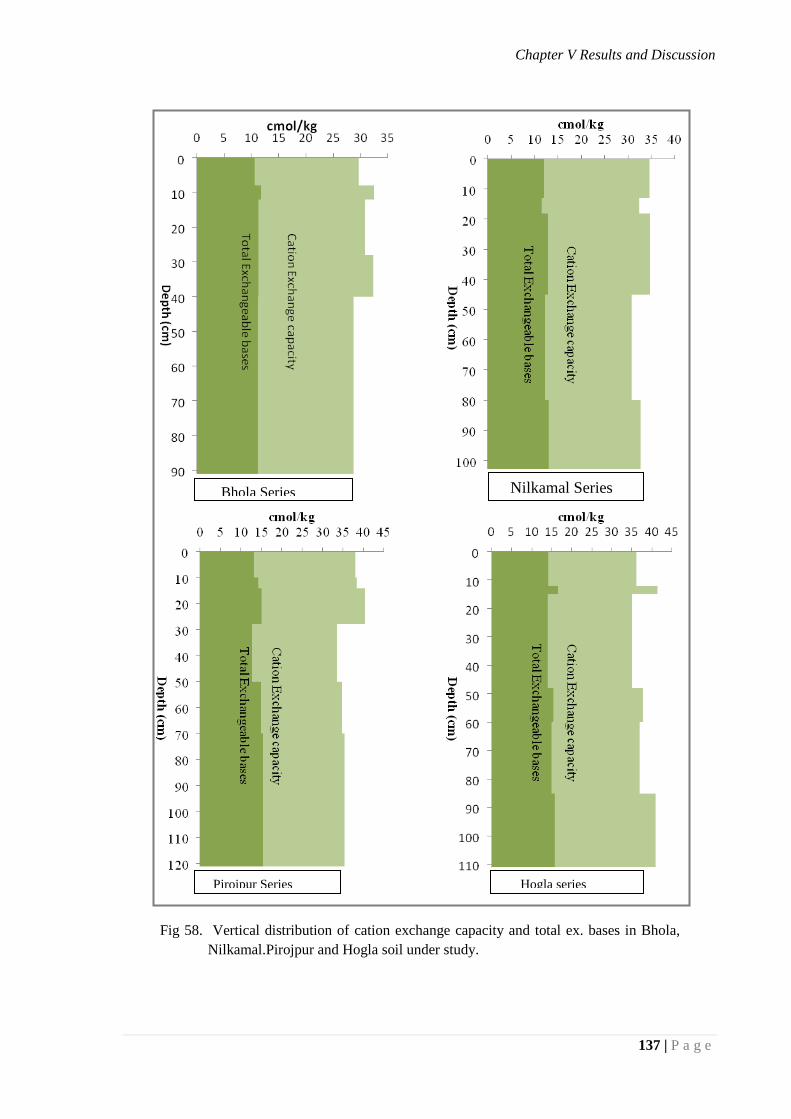
Chapter V Results and Discussion
137 | P a g e
Bhola Series Nilkamal Series
Pirojpur Series Hogla series
Fig 58. Vertical distribution of cation exchange capacity and total ex. bases in Bhola,
Nilkamal.Pirojpur and Hogla soil under study.
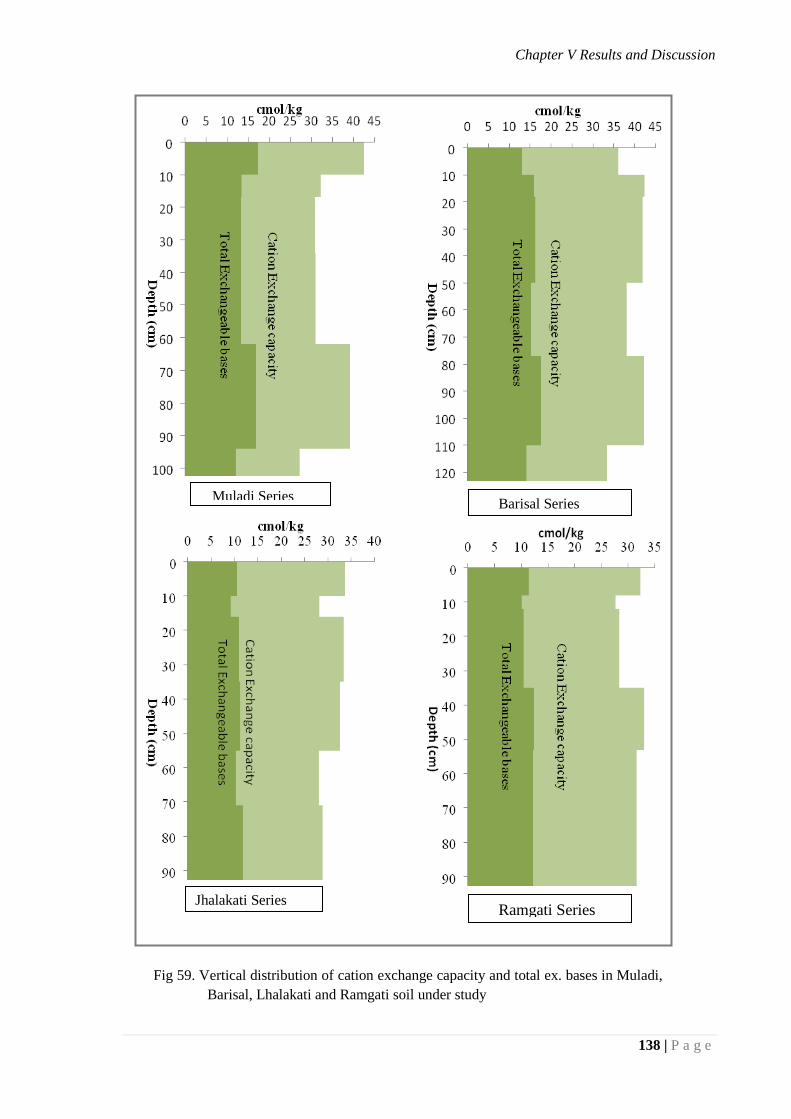
Chapter V Results and Discussion
138 | P a g e
Muladi Series Barisal Series
Jhalakati Series Ramgati Series
Fig 59. Vertical distribution of cation exchange capacity and total ex. bases in Muladi,
Barisal, Lhalakati and Ramgati soil under study
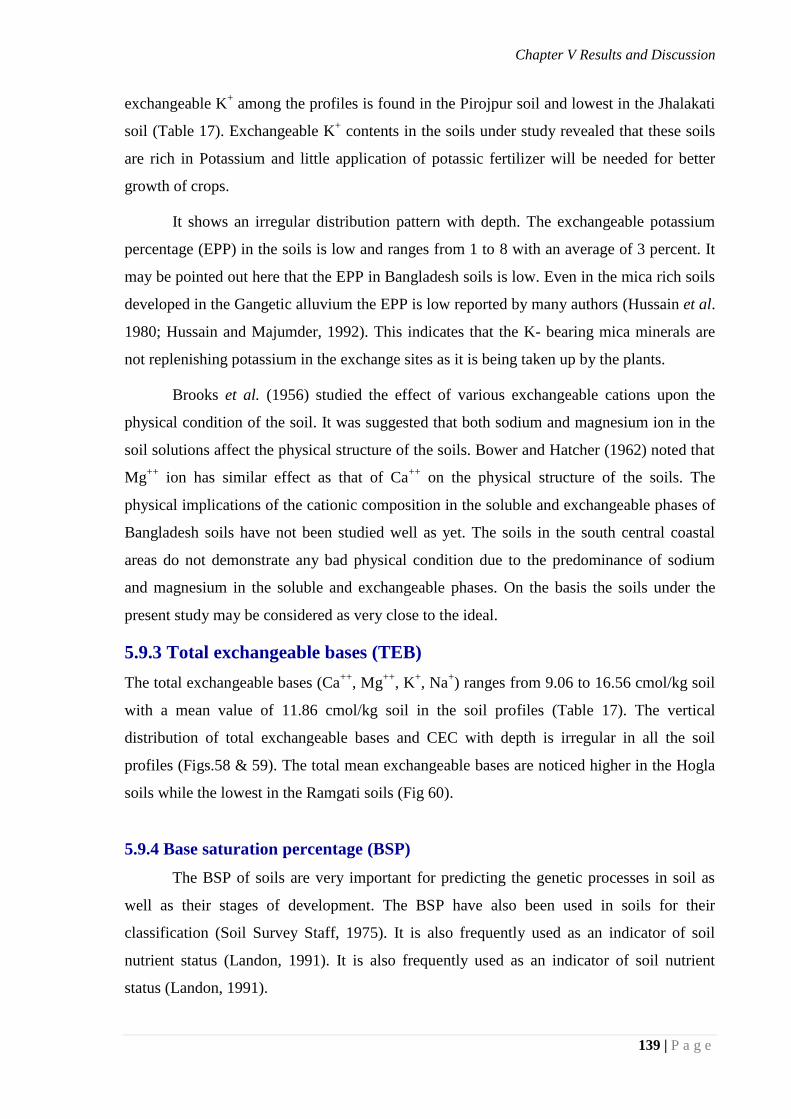
Chapter V Results and Discussion
139 | P a g e
exchangeable K+ among the profiles is found in the Pirojpur soil and lowest in the Jhalakati
soil (Table 17). Exchangeable K+ contents in the soils under study revealed that these soils
are rich in Potassium and little application of potassic fertilizer will be needed for better
growth of crops.
It shows an irregular distribution pattern with depth. The exchangeable potassium
percentage (EPP) in the soils is low and ranges from 1 to 8 with an average of 3 percent. It
may be pointed out here that the EPP in Bangladesh soils is low. Even in the mica rich soils
developed in the Gangetic alluvium the EPP is low reported by many authors (Hussain et al.
1980; Hussain and Majumder, 1992). This indicates that the K- bearing mica minerals are
not replenishing potassium in the exchange sites as it is being taken up by the plants.
Brooks et al. (1956) studied the effect of various exchangeable cations upon the
physical condition of the soil. It was suggested that both sodium and magnesium ion in the
soil solutions affect the physical structure of the soils. Bower and Hatcher (1962) noted that
Mg++
ion has similar effect as that of Ca++
on the physical structure of the soils. The
physical implications of the cationic composition in the soluble and exchangeable phases of
Bangladesh soils have not been studied well as yet. The soils in the south central coastal
areas do not demonstrate any bad physical condition due to the predominance of sodium
and magnesium in the soluble and exchangeable phases. On the basis the soils under the
present study may be considered as very close to the ideal.
5.9.3 Total exchangeable bases (TEB)
The total exchangeable bases (Ca++
, Mg++
, K+, Na
+) ranges from 9.06 to 16.56 cmol/kg soil
with a mean value of 11.86 cmol/kg soil in the soil profiles (Table 17). The vertical
distribution of total exchangeable bases and CEC with depth is irregular in all the soil
profiles (Figs.58 & 59). The total mean exchangeable bases are noticed higher in the Hogla
soils while the lowest in the Ramgati soils (Fig 60).
5.9.4 Base saturation percentage (BSP)
The BSP of soils are very important for predicting the genetic processes in soil as
well as their stages of development. The BSP have also been used in soils for their
classification (Soil Survey Staff, 1975). It is also frequently used as an indicator of soil
nutrient status (Landon, 1991). It is also frequently used as an indicator of soil nutrient
status (Landon, 1991).
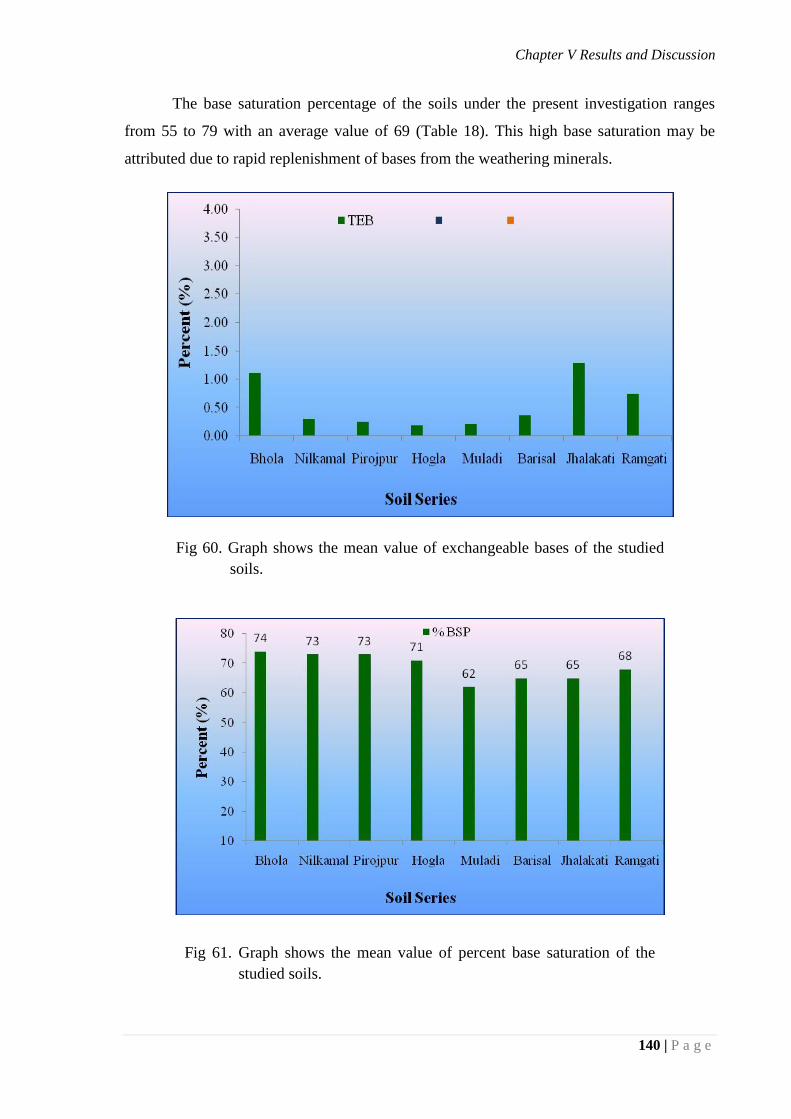
Chapter V Results and Discussion
140 | P a g e
The base saturation percentage of the soils under the present investigation ranges
from 55 to 79 with an average value of 69 (Table 18). This high base saturation may be
attributed due to rapid replenishment of bases from the weathering minerals.
Fig 60. Graph shows the mean value of exchangeable bases of the studied
soils.
Fig 61. Graph shows the mean value of percent base saturation of the
studied soils.
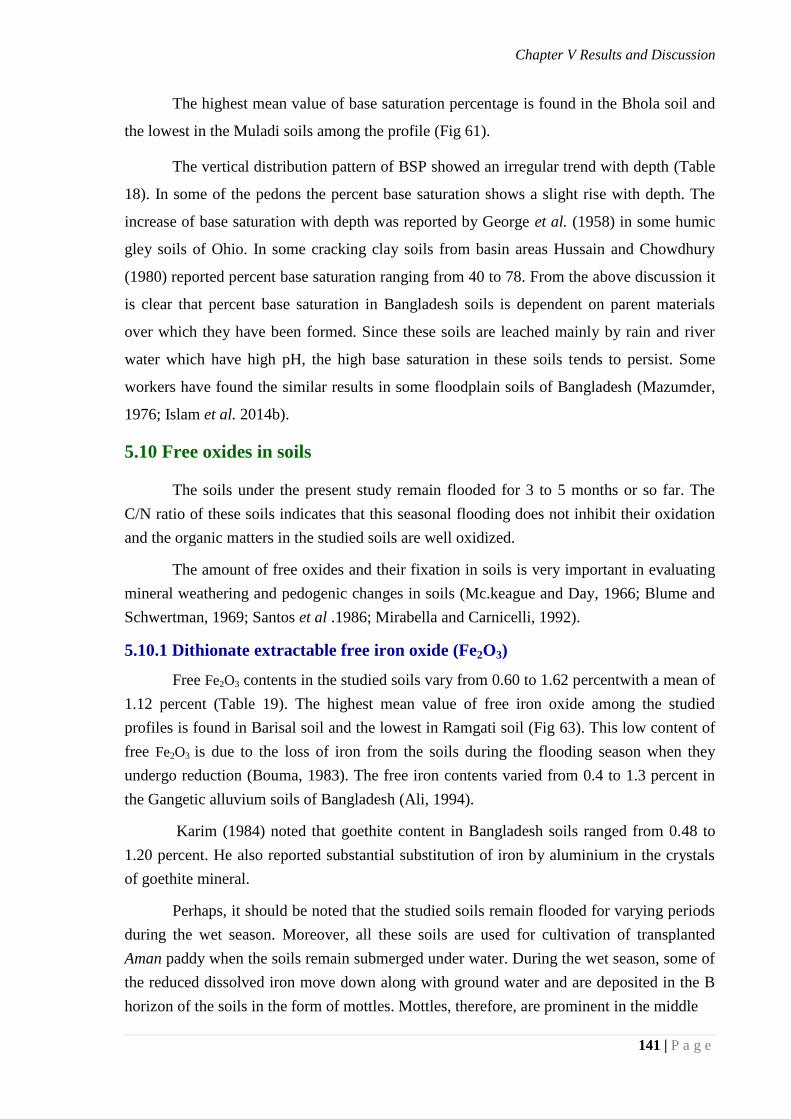
Chapter V Results and Discussion
141 | P a g e
The highest mean value of base saturation percentage is found in the Bhola soil and
the lowest in the Muladi soils among the profile (Fig 61).
The vertical distribution pattern of BSP showed an irregular trend with depth (Table
18). In some of the pedons the percent base saturation shows a slight rise with depth. The
increase of base saturation with depth was reported by George et al. (1958) in some humic
gley soils of Ohio. In some cracking clay soils from basin areas Hussain and Chowdhury
(1980) reported percent base saturation ranging from 40 to 78. From the above discussion it
is clear that percent base saturation in Bangladesh soils is dependent on parent materials
over which they have been formed. Since these soils are leached mainly by rain and river
water which have high pH, the high base saturation in these soils tends to persist. Some
workers have found the similar results in some floodplain soils of Bangladesh (Mazumder,
1976; Islam et al. 2014b).
5.10 Free oxides in soils
The soils under the present study remain flooded for 3 to 5 months or so far. The
C/N ratio of these soils indicates that this seasonal flooding does not inhibit their oxidation
and the organic matters in the studied soils are well oxidized.
The amount of free oxides and their fixation in soils is very important in evaluating
mineral weathering and pedogenic changes in soils (Mc.keague and Day, 1966; Blume and
Schwertman, 1969; Santos et al .1986; Mirabella and Carnicelli, 1992).
5.10.1 Dithionate extractable free iron oxide (Fe2O3)
Free Fe2O3 contents in the studied soils vary from 0.60 to 1.62 percentwith a mean of
1.12 percent (Table 19). The highest mean value of free iron oxide among the studied
profiles is found in Barisal soil and the lowest in Ramgati soil (Fig 63). This low content of
free Fe2O3 is due to the loss of iron from the soils during the flooding season when they
undergo reduction (Bouma, 1983). The free iron contents varied from 0.4 to 1.3 percent in
the Gangetic alluvium soils of Bangladesh (Ali, 1994).
Karim (1984) noted that goethite content in Bangladesh soils ranged from 0.48 to
1.20 percent. He also reported substantial substitution of iron by aluminium in the crystals
of goethite mineral.
Perhaps, it should be noted that the studied soils remain flooded for varying periods
during the wet season. Moreover, all these soils are used for cultivation of transplanted
Aman paddy when the soils remain submerged under water. During the wet season, some of
the reduced dissolved iron move down along with ground water and are deposited in the B
horizon of the soils in the form of mottles. Mottles, therefore, are prominent in the middle
Chapter V Results and Discussion
142 | P a g e
Table 19. Results of dithionate extractable iron and manganese oxides of the studied soils.
Soil Series
Horizons
Free Fe2O3 Free MnO2
Total Fe2O3 Free Fe2O3/
Free MnO2
ratio
Total
Fe2O3/ Free
Fe2O3 ratio %
Bhola
Ap 1.41 0.032 4.70 44 3
Ad 1.25 0.035 4.59 36 4
Bw1 1.07 0.033 5.93 32 6
Bw2 1.21 0.035 4.69 35 4
C1 1.04 0.043 5.09 24 5
Mean 1.20 0.035 5.00 34 4
Nilkamal
Ap 1.04 0.019 6.43 55 6
Ad 1.44 0.032 5.16 45 4
Bw1 1.80 0.030 7.58 60 4
Bw2 1.14 0.052 6.51 22 6
C1 1.08 0.055 4.63 20 4
Mean 1.30 0.038 6.06 40 5
Pirojpur
Ap 1.16 0.046 6.71 25 6
Ad 1.42 0.043 7.92 33 6
Bw1 1.61 0.054 7.64 30 5
Bw2 1.27 0.049 6.94 26 5
C1 1.22 0.049 5.39 25 4
C2 1.29 0.055 6.63 23 5
Mean 1.33 0.049 6.87 27 5
Hogla
Ap 1.17 0.028 6.87 42 6
Ad 1.12 0.022 7.90 51 7
Bw1 1.37 0.032 7.90 43 6
Bw2 1.48 0.035 6.89 42 5
C1 1.36 0.036 5.87 38 4
C2 0.73 0.014 6.68 52 9
Mean 1.21 0.028 7.02 45 6
Continued next page-------
---
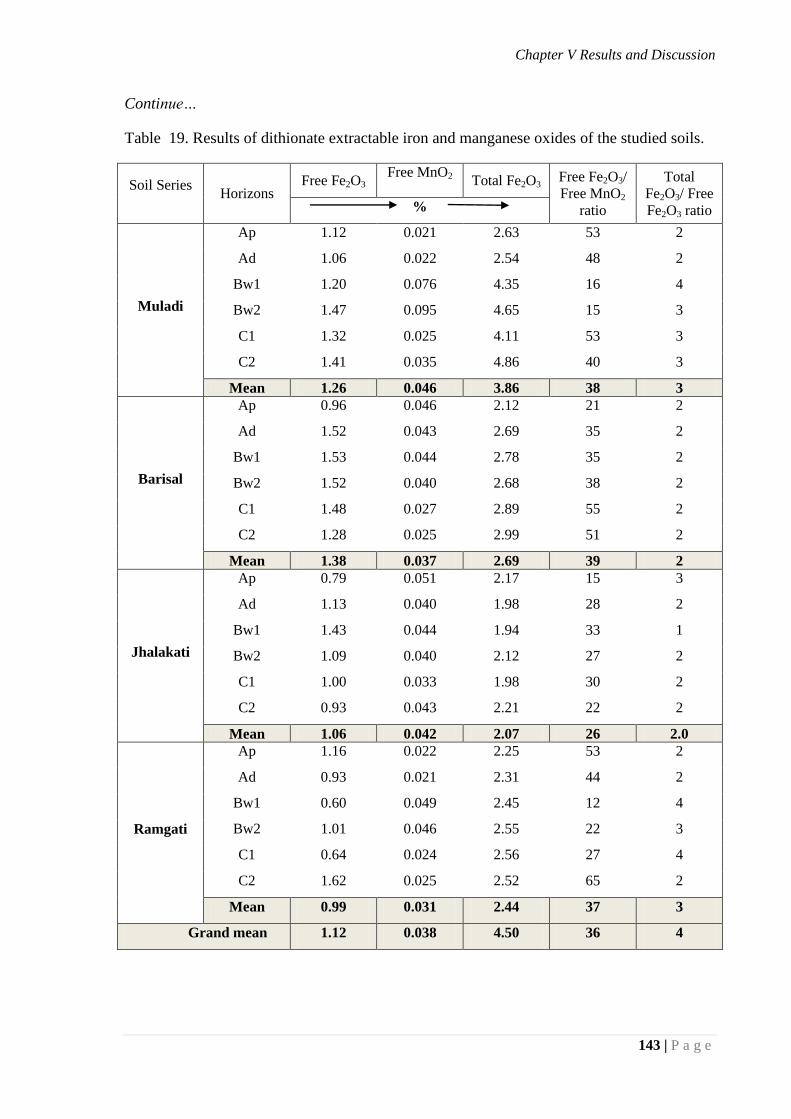
Chapter V Results and Discussion
143 | P a g e
Continue…
Table 19. Results of dithionate extractable iron and manganese oxides of the studied soils.
Soil Series
Horizons
Free Fe2O3 Free MnO2
Total Fe2O3 Free Fe2O3/
Free MnO2
ratio
Total
Fe2O3/ Free
Fe2O3 ratio %
Muladi
Ap 1.12 0.021 2.63 53 2
Ad 1.06 0.022 2.54 48 2
Bw1 1.20 0.076 4.35 16 4
Bw2 1.47 0.095 4.65 15 3
C1 1.32 0.025 4.11 53 3
C2 1.41 0.035 4.86 40 3
Mean 1.26 0.046 3.86 38 3
Barisal
Ap 0.96 0.046 2.12 21 2
Ad 1.52 0.043 2.69 35 2
Bw1 1.53 0.044 2.78 35 2
Bw2 1.52 0.040 2.68 38 2
C1 1.48 0.027 2.89 55 2
C2 1.28 0.025 2.99 51 2
Mean 1.38 0.037 2.69 39 2
Jhalakati
Ap 0.79 0.051 2.17 15 3
Ad 1.13 0.040 1.98 28 2
Bw1 1.43 0.044 1.94 33 1
Bw2 1.09 0.040 2.12 27 2
C1 1.00 0.033 1.98 30 2
C2 0.93 0.043 2.21 22 2
Mean 1.06 0.042 2.07 26 2.0
Ramgati
Ap 1.16 0.022 2.25 53 2
Ad 0.93 0.021 2.31 44 2
Bw1 0.60 0.049 2.45 12 4
Bw2 1.01 0.046 2.55 22 3
C1 0.64 0.024 2.56 27 4
C2 1.62 0.025 2.52 65 2
Mean 0.99 0.031 2.44 37 3
Grand mean 1.12 0.038 4.50 36 4
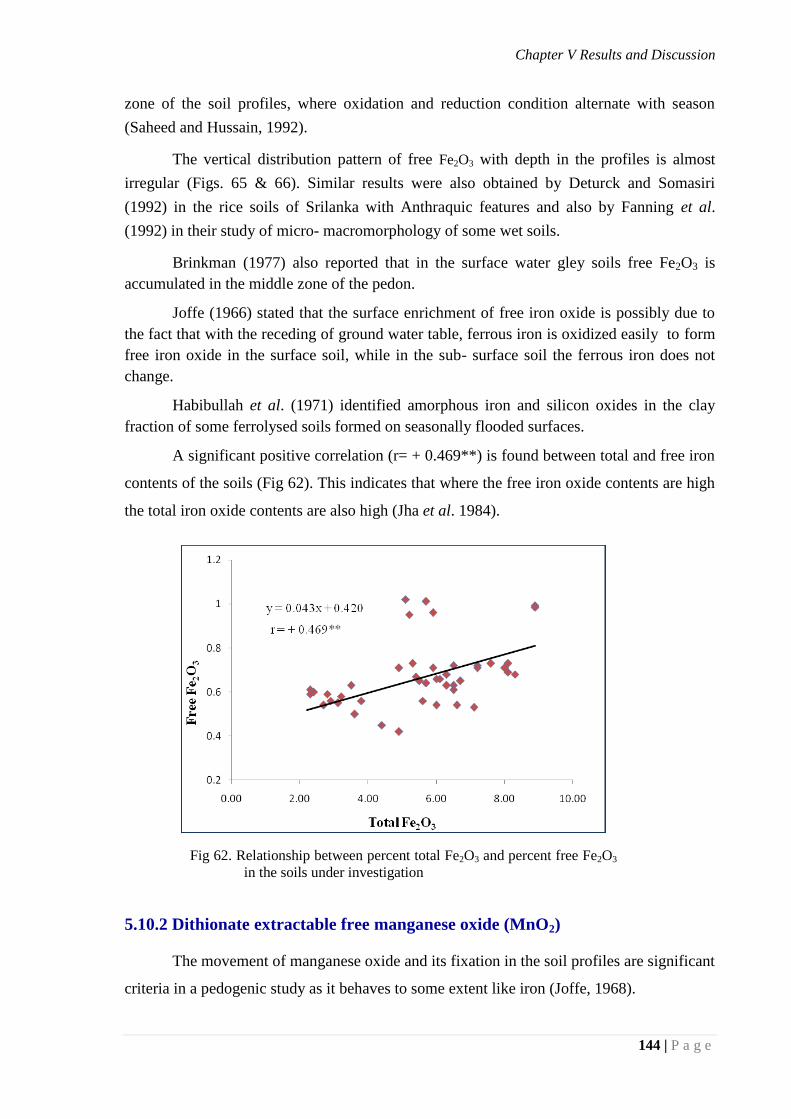
Chapter V Results and Discussion
144 | P a g e
zone of the soil profiles, where oxidation and reduction condition alternate with season
(Saheed and Hussain, 1992).
The vertical distribution pattern of free Fe2O3 with depth in the profiles is almost
irregular (Figs. 65 & 66). Similar results were also obtained by Deturck and Somasiri
(1992) in the rice soils of Srilanka with Anthraquic features and also by Fanning et al.
(1992) in their study of micro- macromorphology of some wet soils.
Brinkman (1977) also reported that in the surface water gley soils free Fe2O3 is
accumulated in the middle zone of the pedon.
Joffe (1966) stated that the surface enrichment of free iron oxide is possibly due to
the fact that with the receding of ground water table, ferrous iron is oxidized easily to form
free iron oxide in the surface soil, while in the sub- surface soil the ferrous iron does not
change.
Habibullah et al. (1971) identified amorphous iron and silicon oxides in the clay
fraction of some ferrolysed soils formed on seasonally flooded surfaces.
A significant positive correlation (r= + 0.469**) is found between total and free iron
contents of the soils (Fig 62). This indicates that where the free iron oxide contents are high
the total iron oxide contents are also high (Jha et al. 1984).
5.10.2 Dithionate extractable free manganese oxide (MnO2)
The movement of manganese oxide and its fixation in the soil profiles are significant
criteria in a pedogenic study as it behaves to some extent like iron (Joffe, 1968).
Fig 62. Relationship between percent total Fe2O3 and percent free Fe2O3
in the soils under investigation
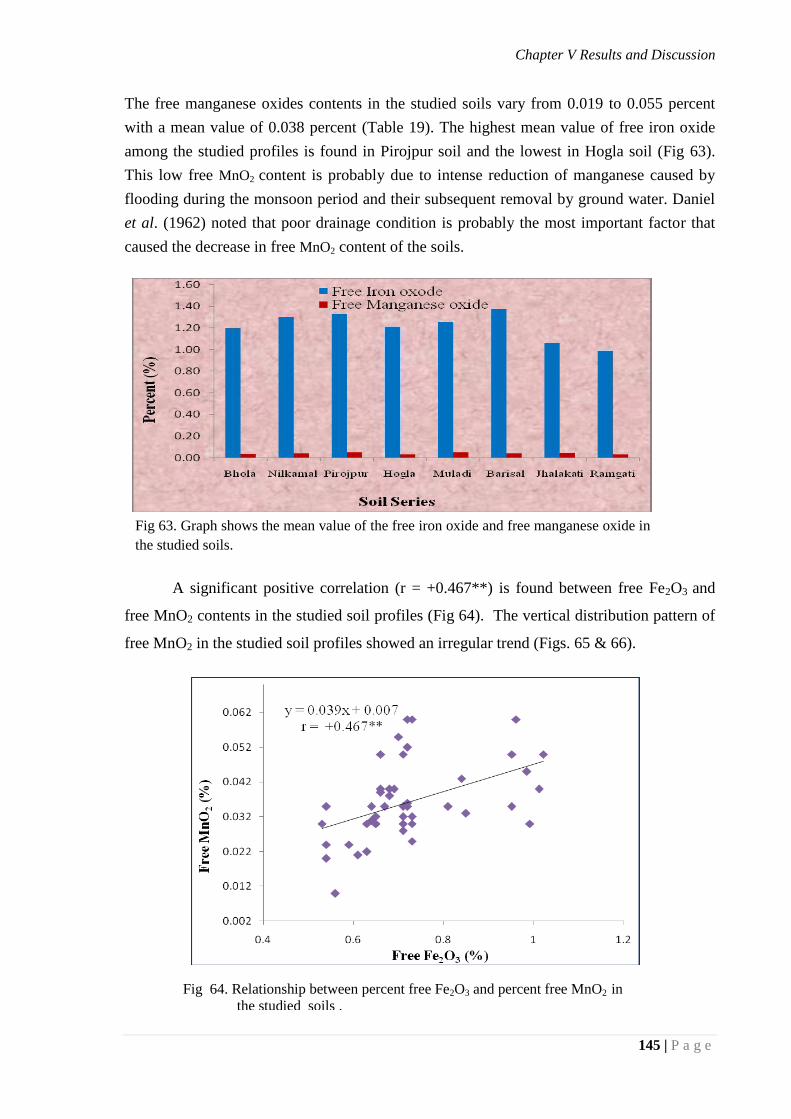
Chapter V Results and Discussion
145 | P a g e
The free manganese oxides contents in the studied soils vary from 0.019 to 0.055 percent
with a mean value of 0.038 percent (Table 19). The highest mean value of free iron oxide
among the studied profiles is found in Pirojpur soil and the lowest in Hogla soil (Fig 63).
This low free MnO2 content is probably due to intense reduction of manganese caused by
flooding during the monsoon period and their subsequent removal by ground water. Daniel
et al. (1962) noted that poor drainage condition is probably the most important factor that
caused the decrease in free MnO2 content of the soils.
A significant positive correlation (r = +0.467**) is found between free Fe2O3 and
free MnO2 contents in the studied soil profiles (Fig 64). The vertical distribution pattern of
free MnO2 in the studied soil profiles showed an irregular trend (Figs. 65 & 66).
Fig 63. Graph shows the mean value of the free iron oxide and free manganese oxide in
the studied soils.
Fig 64. Relationship between percent free Fe2O3 and percent free MnO2 in
the studied soils .
Fig 64. Relationship between percent free Fe2O3 and percent free MnO2 in
the studied soils .

Chapter V Results and Discussion
146 | P a g e
Bhola Series Nilkamal
Series
Pirojpur series Hogla Series
Fig 65. Graph shows the vertical distribution of free iron and manganese oxide
in Bhola, Nilkamll, Barisal and Jhalakati series.
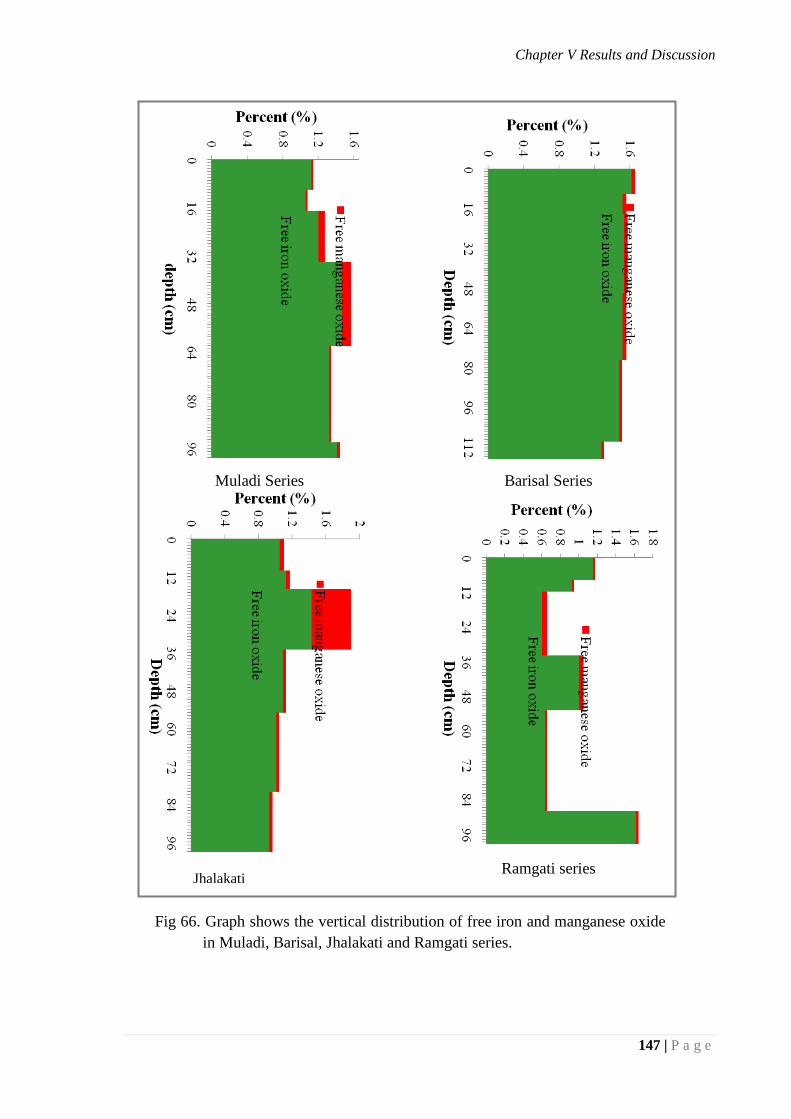
Chapter V Results and Discussion
147 | P a g e
Fig 66. Graph shows the vertical distribution of free iron and manganese oxide
in Muladi, Barisal, Jhalakati and Ramgati series.
Muladi Series Barisal Series
Jhalakati
series
Ramgati series
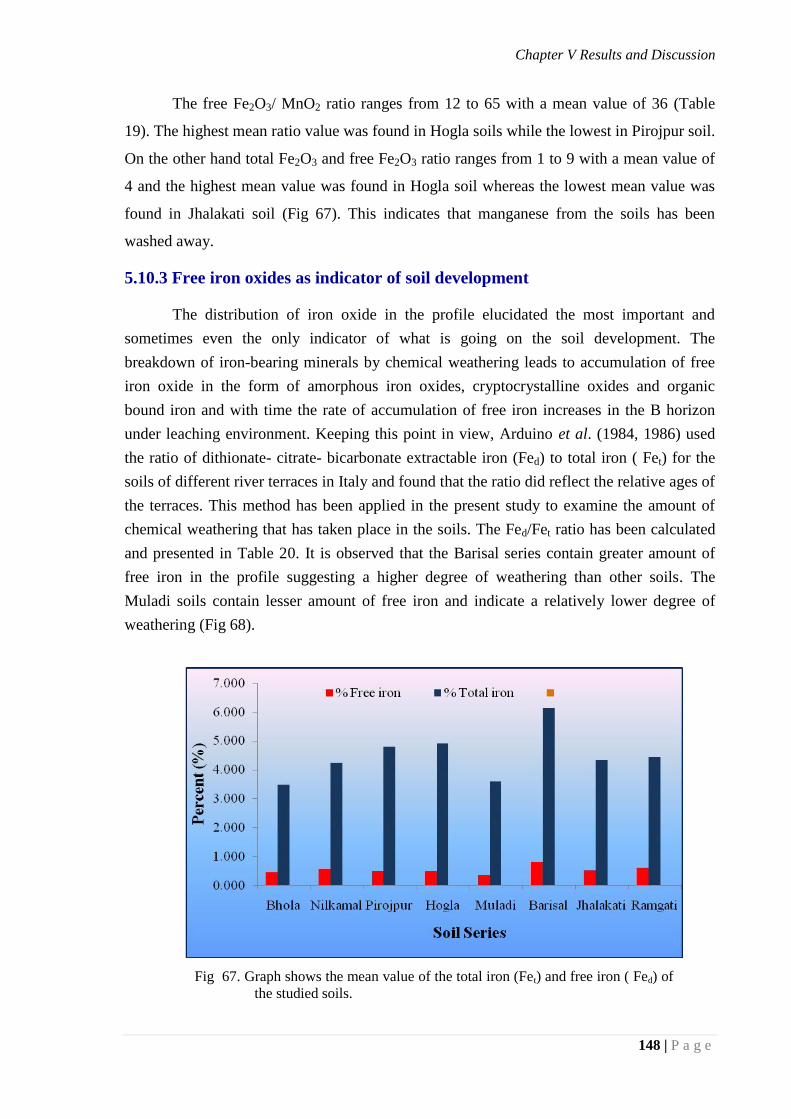
Chapter V Results and Discussion
148 | P a g e
The free Fe2O3/ MnO2 ratio ranges from 12 to 65 with a mean value of 36 (Table
19). The highest mean ratio value was found in Hogla soils while the lowest in Pirojpur soil.
On the other hand total Fe2O3 and free Fe2O3 ratio ranges from 1 to 9 with a mean value of
4 and the highest mean value was found in Hogla soil whereas the lowest mean value was
found in Jhalakati soil (Fig 67). This indicates that manganese from the soils has been
washed away.
5.10.3 Free iron oxides as indicator of soil development
The distribution of iron oxide in the profile elucidated the most important and
sometimes even the only indicator of what is going on the soil development. The
breakdown of iron-bearing minerals by chemical weathering leads to accumulation of free
iron oxide in the form of amorphous iron oxides, cryptocrystalline oxides and organic
bound iron and with time the rate of accumulation of free iron increases in the B horizon
under leaching environment. Keeping this point in view, Arduino et al. (1984, 1986) used
the ratio of dithionate- citrate- bicarbonate extractable iron (Fed) to total iron ( Fet) for the
soils of different river terraces in Italy and found that the ratio did reflect the relative ages of
the terraces. This method has been applied in the present study to examine the amount of
chemical weathering that has taken place in the soils. The Fed/Fet ratio has been calculated
and presented in Table 20. It is observed that the Barisal series contain greater amount of
free iron in the profile suggesting a higher degree of weathering than other soils. The
Muladi soils contain lesser amount of free iron and indicate a relatively lower degree of
weathering (Fig 68).
Fig 67. Graph shows the mean value of the total iron (Fet) and free iron ( Fed) of
the studied soils.
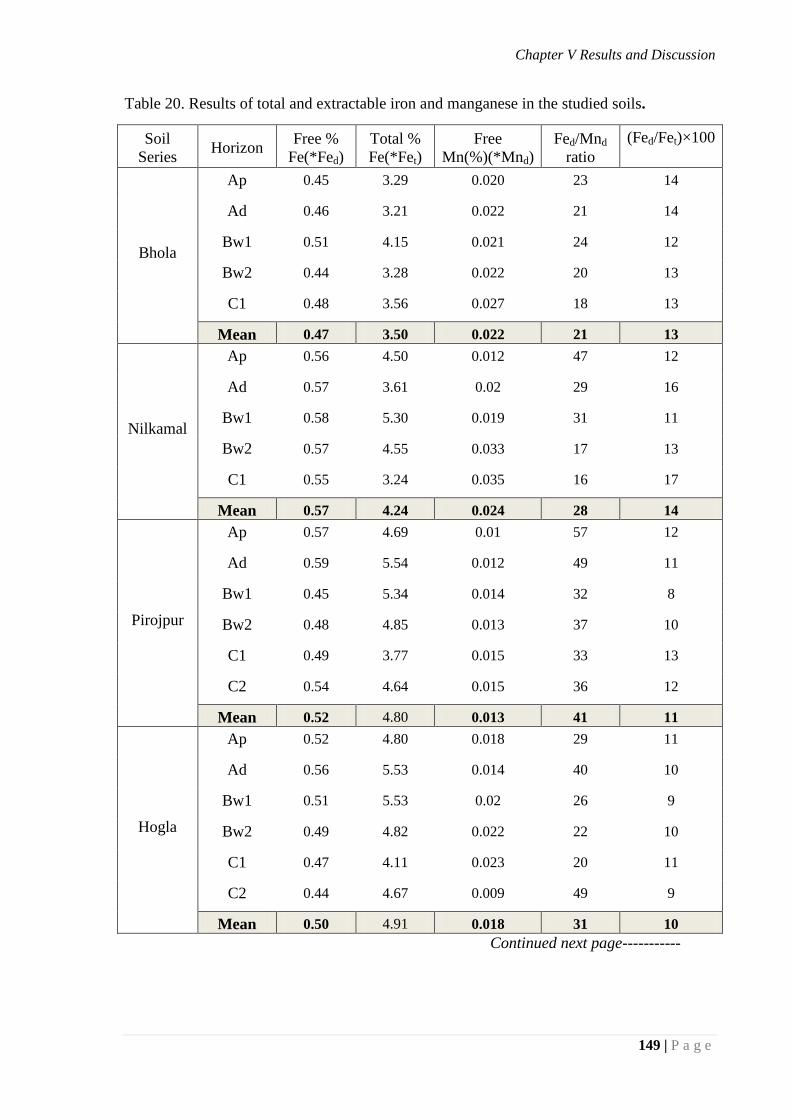
Chapter V Results and Discussion
149 | P a g e
Table 20. Results of total and extractable iron and manganese in the studied soils.
Soil
Series Horizon
Free %
Fe(*Fed)
Total %
Fe(*Fet)
Free
Mn(%)(*Mnd)
Fed/Mnd
ratio
(Fed/Fet)×100
Bhola
Ap 0.45 3.29 0.020 23 14
Ad 0.46 3.21 0.022 21 14
Bw1 0.51 4.15 0.021 24 12
Bw2 0.44 3.28 0.022 20 13
C1 0.48 3.56 0.027 18 13
Mean 0.47 3.50 0.022 21 13
Nilkamal
Ap 0.56 4.50 0.012 47 12
Ad 0.57 3.61 0.02 29 16
Bw1 0.58 5.30 0.019 31 11
Bw2 0.57 4.55 0.033 17 13
C1 0.55 3.24 0.035 16 17
Mean 0.57 4.24 0.024 28 14
Pirojpur
Ap 0.57 4.69 0.01 57 12
Ad 0.59 5.54 0.012 49 11
Bw1 0.45 5.34 0.014 32 8
Bw2 0.48 4.85 0.013 37 10
C1 0.49 3.77 0.015 33 13
C2 0.54 4.64 0.015 36 12
Mean 0.52 4.80 0.013 41 11
Hogla
Ap 0.52 4.80 0.018 29 11
Ad 0.56 5.53 0.014 40 10
Bw1 0.51 5.53 0.02 26 9
Bw2 0.49 4.82 0.022 22 10
C1 0.47 4.11 0.023 20 11
C2 0.44 4.67 0.009 49 9
Mean 0.50 4.91 0.018 31 10
Continued next page-----------
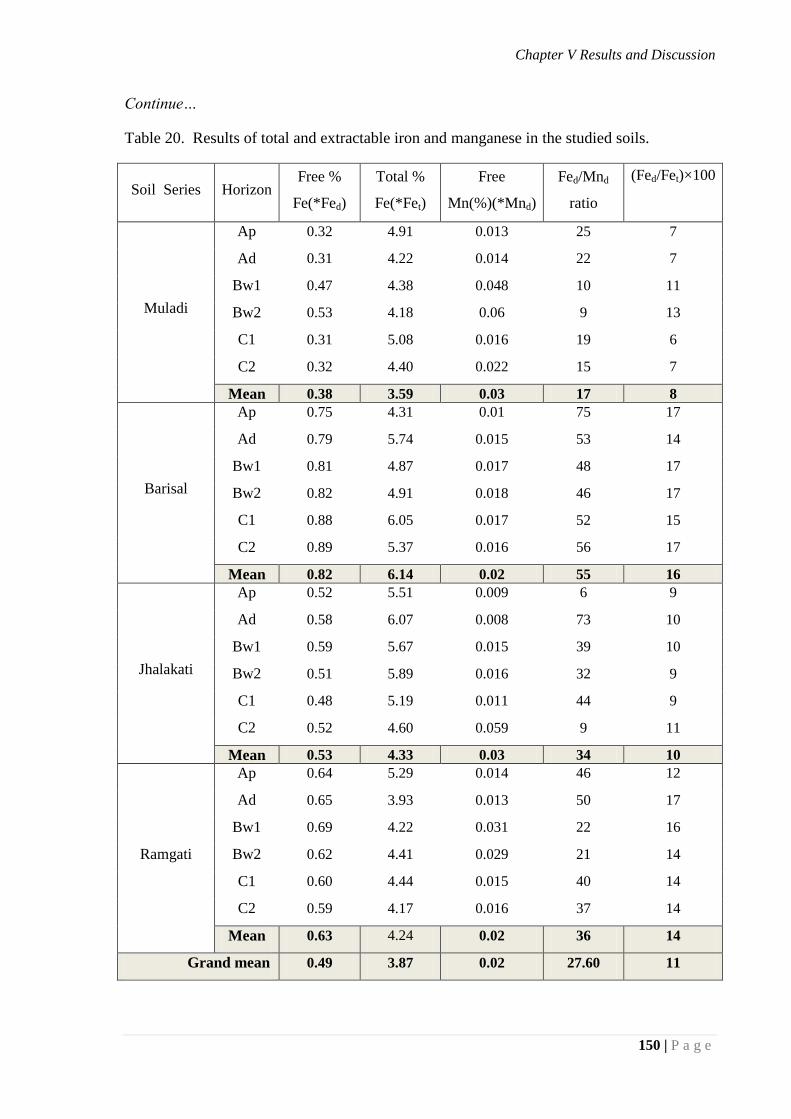
Chapter V Results and Discussion
150 | P a g e
Continue…
Table 20. Results of total and extractable iron and manganese in the studied soils.
Soil Series Horizon Free %
Fe(*Fed)
Total %
Fe(*Fet)
Free
Mn(%)(*Mnd)
Fed/Mnd
ratio
(Fed/Fet)×100
Muladi
Ap 0.32 4.91 0.013 25 7
Ad 0.31 4.22 0.014 22 7
Bw1 0.47 4.38 0.048 10 11
Bw2 0.53 4.18 0.06 9 13
C1 0.31 5.08 0.016 19 6
C2 0.32 4.40 0.022 15 7
Mean 0.38 3.59 0.03 17 8
Barisal
Ap 0.75 4.31 0.01 75 17
Ad 0.79 5.74 0.015 53 14
Bw1 0.81 4.87 0.017 48 17
Bw2 0.82 4.91 0.018 46 17
C1 0.88 6.05 0.017 52 15
C2 0.89 5.37 0.016 56 17
Mean 0.82 6.14 0.02 55 16
Jhalakati
Ap 0.52 5.51 0.009 6 9
Ad 0.58 6.07 0.008 73 10
Bw1 0.59 5.67 0.015 39 10
Bw2 0.51 5.89 0.016 32 9
C1 0.48 5.19 0.011 44 9
C2 0.52 4.60 0.059 9 11
Mean 0.53 4.33 0.03 34 10
Ramgati
Ap 0.64 5.29 0.014 46 12
Ad 0.65 3.93 0.013 50 17
Bw1 0.69 4.22 0.031 22 16
Bw2 0.62 4.41 0.029 21 14
C1 0.60 4.44 0.015 40 14
C2 0.59 4.17 0.016 37 14
Mean 0.63 4.24 0.02 36 14
Grand mean 0.49 3.87 0.02 27.60 11
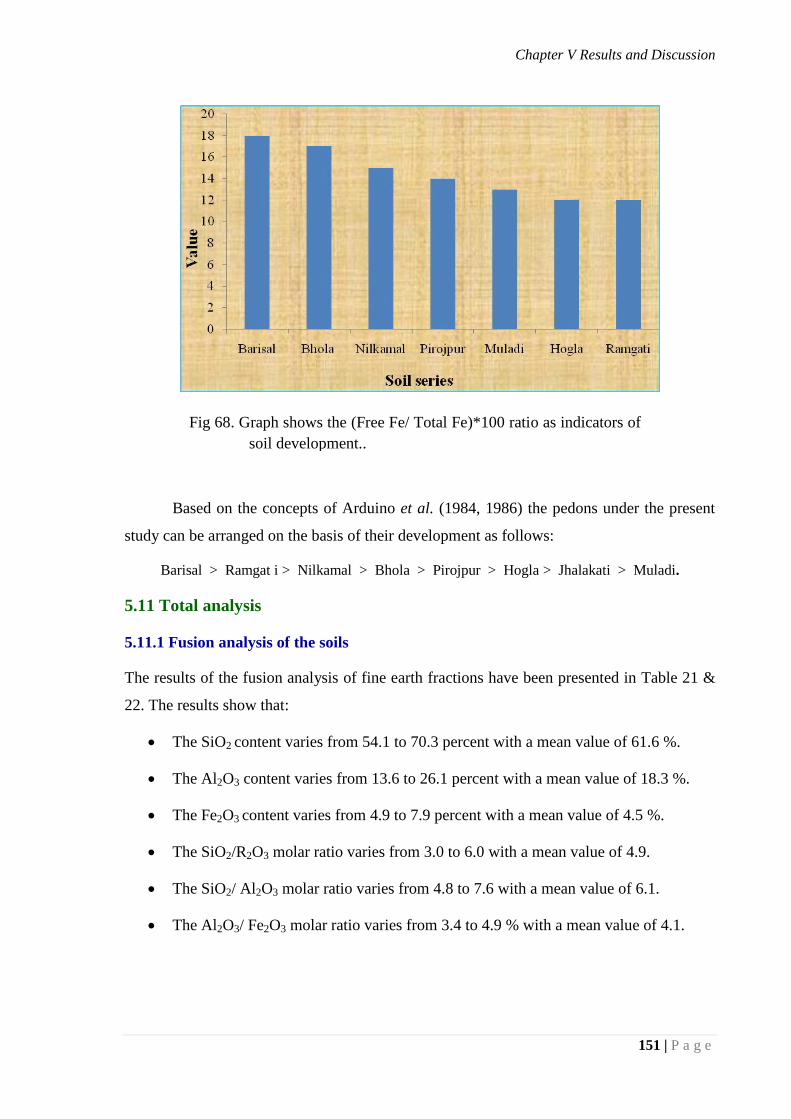
Chapter V Results and Discussion
151 | P a g e
Based on the concepts of Arduino et al. (1984, 1986) the pedons under the present
study can be arranged on the basis of their development as follows:
Barisal > Ramgat i > Nilkamal > Bhola > Pirojpur > Hogla > Jhalakati > Muladi.
5.11 Total analysis
5.11.1 Fusion analysis of the soils
The results of the fusion analysis of fine earth fractions have been presented in Table 21 &
22. The results show that:
The SiO2 content varies from 54.1 to 70.3 percent with a mean value of 61.6 %.
The Al2O3 content varies from 13.6 to 26.1 percent with a mean value of 18.3 %.
The Fe2O3 content varies from 4.9 to 7.9 percent with a mean value of 4.5 %.
The SiO2/R2O3 molar ratio varies from 3.0 to 6.0 with a mean value of 4.9.
The SiO2/ Al2O3 molar ratio varies from 4.8 to 7.6 with a mean value of 6.1.
The Al2O3/ Fe2O3 molar ratio varies from 3.4 to 4.9 % with a mean value of 4.1.
Fig 68. Graph shows the (Free Fe/ Total Fe)*100 ratio as indicators of
soil development..
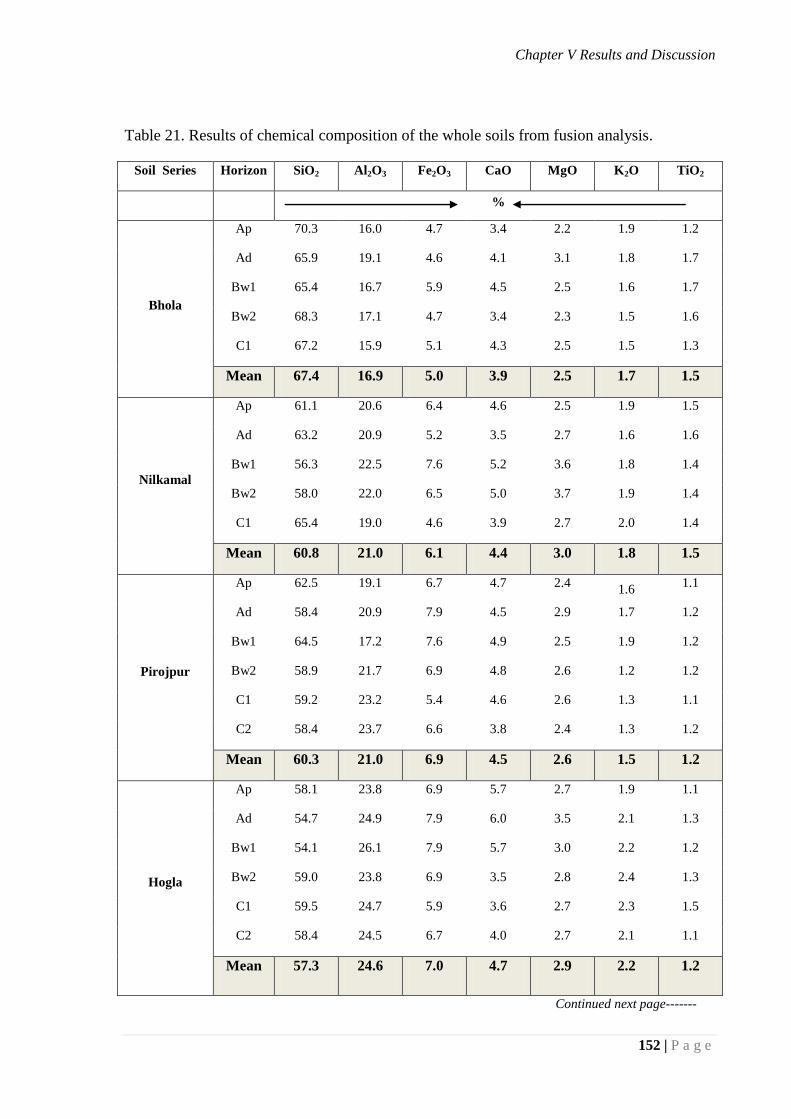
Chapter V Results and Discussion
152 | P a g e
Table 21. Results of chemical composition of the whole soils from fusion analysis.
Soil Series Horizon SiO2 Al2O3 Fe2O3 CaO MgO K2O TiO2
%
Bhola
Ap 70.3 16.0 4.7 3.4 2.2 1.9 1.2
Ad 65.9 19.1 4.6 4.1 3.1 1.8 1.7
Bw1 65.4 16.7 5.9 4.5 2.5 1.6 1.7
Bw2 68.3 17.1 4.7 3.4 2.3 1.5 1.6
C1 67.2 15.9 5.1 4.3 2.5 1.5 1.3
Mean 67.4 16.9 5.0 3.9 2.5 1.7 1.5
Nilkamal
Ap 61.1 20.6 6.4 4.6 2.5 1.9 1.5
Ad 63.2 20.9 5.2 3.5 2.7 1.6 1.6
Bw1 56.3 22.5 7.6 5.2 3.6 1.8 1.4
Bw2 58.0 22.0 6.5 5.0 3.7 1.9 1.4
C1 65.4 19.0 4.6 3.9 2.7 2.0 1.4
Mean 60.8 21.0 6.1 4.4 3.0 1.8 1.5
Pirojpur
Ap 62.5 19.1 6.7 4.7 2.4 1.6
1.1
Ad 58.4 20.9 7.9 4.5 2.9 1.7 1.2
Bw1 64.5 17.2 7.6 4.9 2.5 1.9 1.2
Bw2 58.9 21.7 6.9 4.8 2.6 1.2 1.2
C1 59.2 23.2 5.4 4.6 2.6 1.3 1.1
C2 58.4 23.7 6.6 3.8 2.4 1.3 1.2
Mean 60.3 21.0 6.9 4.5 2.6 1.5 1.2
Hogla
Ap 58.1 23.8 6.9 5.7 2.7 1.9 1.1
Ad 54.7 24.9 7.9 6.0 3.5 2.1 1.3
Bw1 54.1 26.1 7.9 5.7 3.0 2.2 1.2
Bw2 59.0 23.8 6.9 3.5 2.8 2.4 1.3
C1 59.5 24.7 5.9 3.6 2.7 2.3 1.5
C2 58.4 24.5 6.7 4.0 2.7 2.1 1.1
Mean 57.3 24.6 7.0 4.7 2.9 2.2 1.2
Continued next page-------
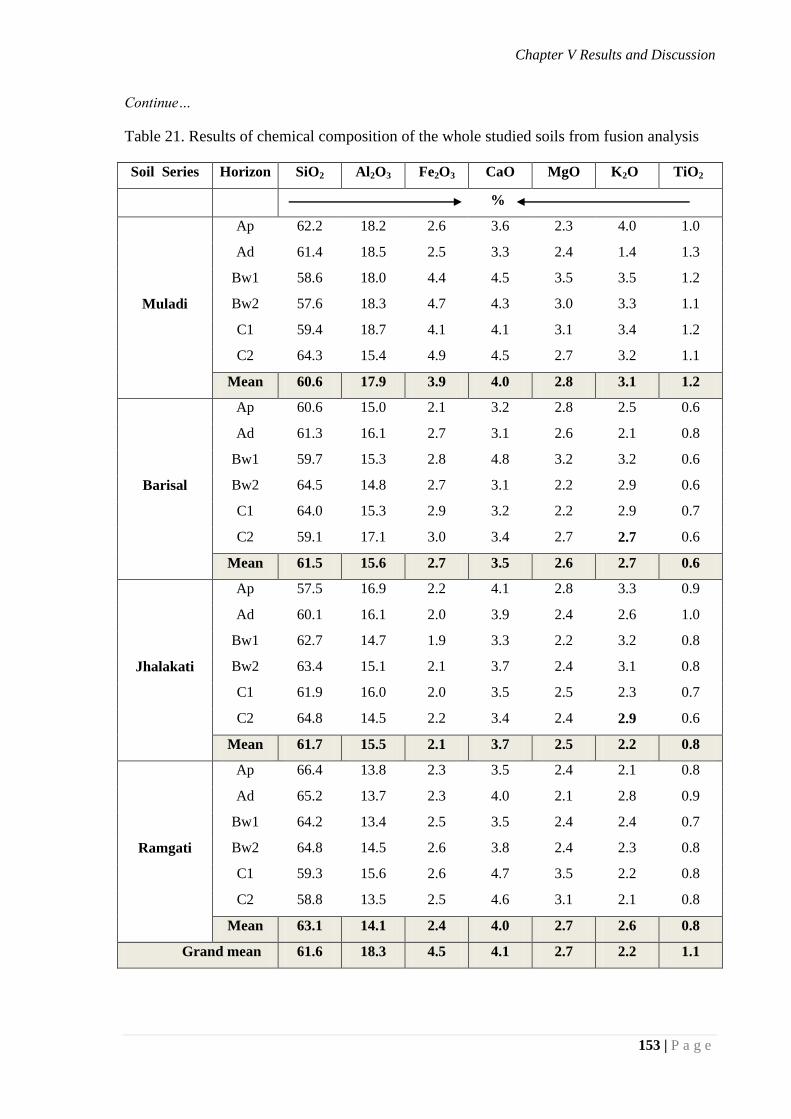
Chapter V Results and Discussion
153 | P a g e
Continue…
Table 21. Results of chemical composition of the whole studied soils from fusion analysis
Soil Series Horizon SiO2 Al2O3 Fe2O3 CaO MgO K2O TiO2
%
Muladi
Ap 62.2 18.2 2.6 3.6 2.3 4.0 1.0
Ad 61.4 18.5 2.5 3.3 2.4 1.4 1.3
Bw1 58.6 18.0 4.4 4.5 3.5 3.5 1.2
Bw2 57.6 18.3 4.7 4.3 3.0 3.3 1.1
C1 59.4 18.7 4.1 4.1 3.1 3.4 1.2
C2 64.3 15.4 4.9 4.5 2.7 3.2 1.1
Mean 60.6 17.9 3.9 4.0 2.8 3.1 1.2
Barisal
Ap 60.6 15.0 2.1 3.2 2.8 2.5 0.6
Ad 61.3 16.1 2.7 3.1 2.6 2.1 0.8
Bw1 59.7 15.3 2.8 4.8 3.2 3.2 0.6
Bw2 64.5 14.8 2.7 3.1 2.2 2.9 0.6
C1 64.0 15.3 2.9 3.2 2.2 2.9 0.7
C2 59.1 17.1 3.0 3.4 2.7 2.7 0.6
Mean 61.5 15.6 2.7 3.5 2.6 2.7 0.6
Jhalakati
Ap 57.5 16.9 2.2 4.1 2.8 3.3 0.9
Ad 60.1 16.1 2.0 3.9 2.4 2.6 1.0
Bw1 62.7 14.7 1.9 3.3 2.2 3.2 0.8
Bw2 63.4 15.1 2.1 3.7 2.4 3.1 0.8
C1 61.9 16.0 2.0 3.5 2.5 2.3 0.7
C2 64.8 14.5 2.2 3.4 2.4 2.9 0.6
Mean 61.7 15.5 2.1 3.7 2.5 2.2 0.8
Ramgati
Ap 66.4 13.8 2.3 3.5 2.4 2.1 0.8
Ad 65.2 13.7 2.3 4.0 2.1 2.8 0.9
Bw1 64.2 13.4 2.5 3.5 2.4 2.4 0.7
Bw2 64.8 14.5 2.6 3.8 2.4 2.3 0.8
C1 59.3 15.6 2.6 4.7 3.5 2.2 0.8
C2 58.8 13.5 2.5 4.6 3.1 2.1 0.8
Mean 63.1 14.1 2.4 4.0 2.7 2.6 0.8
Grand mean 61.6 18.3 4.5 4.1 2.7 2.2 1.1
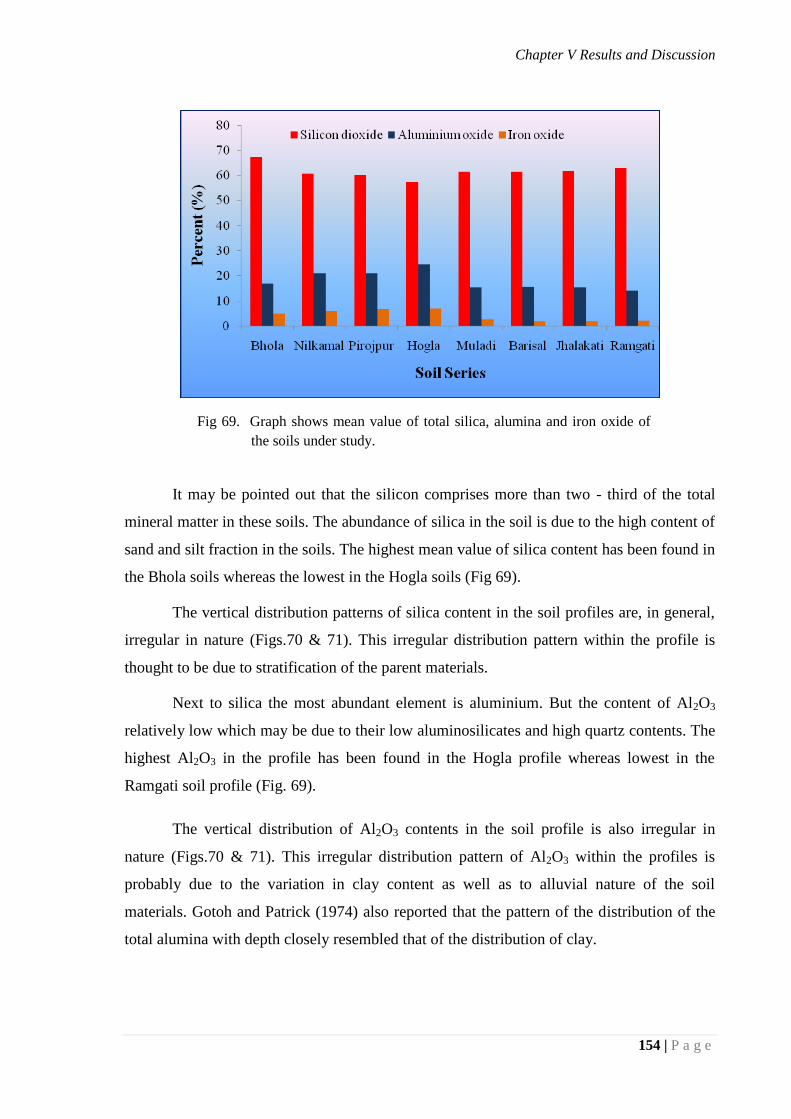
Chapter V Results and Discussion
154 | P a g e
It may be pointed out that the silicon comprises more than two - third of the total
mineral matter in these soils. The abundance of silica in the soil is due to the high content of
sand and silt fraction in the soils. The highest mean value of silica content has been found in
the Bhola soils whereas the lowest in the Hogla soils (Fig 69).
The vertical distribution patterns of silica content in the soil profiles are, in general,
irregular in nature (Figs.70 & 71). This irregular distribution pattern within the profile is
thought to be due to stratification of the parent materials.
Next to silica the most abundant element is aluminium. But the content of Al2O3
relatively low which may be due to their low aluminosilicates and high quartz contents. The
highest Al2O3 in the profile has been found in the Hogla profile whereas lowest in the
Ramgati soil profile (Fig. 69).
The vertical distribution of Al2O3 contents in the soil profile is also irregular in
nature (Figs.70 & 71). This irregular distribution pattern of Al2O3 within the profiles is
probably due to the variation in clay content as well as to alluvial nature of the soil
materials. Gotoh and Patrick (1974) also reported that the pattern of the distribution of the
total alumina with depth closely resembled that of the distribution of clay.
Fig 69. Graph shows mean value of total silica, alumina and iron oxide of
the soils under study.
Chapter V Results and Discussion
155 | P a g e
The next abundant element after aluminium is iron. The highest Fe2O3 has been
found in the Hogla soil whereas lowest in the Jhalakati soils. The variations of the highest
and the lowest mean value is wide (Fig 69).
The vertical distribution of total Fe2O3 content in the soil profiles is irregular in
nature but in some cases a slight enrichment of Fe2O3 was noticed in the subsoils of the
profiles (Figs. 70 & 71).
Chatterjee and Dalal (1976) observed higher Fe2O3 content in the surface horizon of
some alluvial soils in India. Higher Fe2O3 content in the sub-soils was noticed by
Mazumder (1996) in some Brahamaputra floodplain soils of Bangladesh.
The SiO2/R2O3 molar ratio of the studied soils range from 3.0 to 6.0 with a mean
value of 4.9 (Table 22). This ratio in the studied soil profile is thought to be due to their
medium texture. Higher SiO2/R2O3 ratio in the studied pedons is observed in the Bhola soil
whereas the lowest value is found in the Hogla soils.
The vertical distribution pattern of SiO2/R2O3 ratio from the surface downward
follows an irregular pattern in all the soil profiles (Table 22). The irregular distribution of
SiO2/R2O3 ratio throughout the profile suggested parent materials were heterogenity of
mixed origin.
The mean SiO2/R2O3 ratio in the studied soils is high. Such a high ratio also
indicates that the little weathered primary silicates are the dominant mineral fraction in
these soils. The SiO2/R2O3 ratios of the soils are more or less identical to that of the
SiO2/R2O3 ratio of the suspended sediments of the coastal rivers.
The SiO2/ Al2O3 molar ratio in the studied soils varies from 4.8 to 7.6 with a mean
value of 6.1 (Table 22). Such type of ratio confirms the heterogeneous nature of the soil
materials. The highest mean of SiO2/ Al2O3 ratio in the studied soils is observed in Bhola
soils while the lowest value is found in Hogla soil.
The vertical distribution of SiO2/ Al2O3 ratio from the surface downward follows an
irregular pattern in all the studied pedons . This may indicate the existence of stratification.
Similar results were observed by Nahar (1987) in some coastal plain soils in Bangladesh.

Chapter V Results and Discussion
156 | P a g e
Table 22. Results of molar ratios of SiO2, Al2O3, Fe2O3 in the studied soils.
Soil Series Horizon SiO2 Al2O3 Fe2O3 SiO2/R2O3 SiO2/Al2O3 Al2O3/Fe2O3
%
Molar ratio
Bhola
Ap 70.3 16.0 4.7 6.3 7.5 5.3
Ad 65.9 19.1 4.6 5.1 5.9 6.5
Bw1 65.4 16.7 5.9 5.4 6.6 4.4
Bw2 68.3 17.1 4.7 5.8 6.8 5.7
C1 67.2 15.9 5.1 6.0 7.2 4.9
Mean 67.4 16.9 5.0 5.7 6.8 5.3
Nilkamal
Ap 61.1 20.6 6.4 4.2 5.0 5.0
Ad 63.2 20.9 5.2 4.4 5.1 6.3
Bw1 56.3 22.5 7.6 3.5 4.2 4.7
Bw2 58.0 22.0 6.5 3.8 4.5 5.3
C1 65.4 19.0 4.6 5.0 5.8 6.4
Mean 60.8 21.0 6.1 4.2 4.9 5.4
Pirojpur
Ap 62.5 19.1 6.7 4.5 5.6 4.5
Ad 58.4 20.9 7.9 3.8 4.7 4.1
Bw1 64.5 17.2 7.6 5.0 6.4 3.5
Bw2 58.9 21.7 6.9 3.8 4.6 4.9
C1 59.2 23.2 5.4 3.8 4.3 6.7
C2 58.4 23.7 6.6 3.6 4.2 5.6
Mean 60.3 21.0 6.9 4.0 4.9 4.8
Hogla
Ap 58.1 23.8 6.9 3.5 4.2 5.4
Ad 54.7 24.9 7.9 3.1 3.7 4.9
Bw1 54.1 26.1 7.9 3.0 3.5 5.2
Bw2 59.0 23.8 6.9 3.6 4.2 5.4
C1 59.5 24.7 5.9 3.6 4.1 6.6
C2 58.4 24.5 6.7 3.5 4.1 5.7
Mean 57.3 24.6 7.0 3.3 4.0 5.5
Continue next page-------
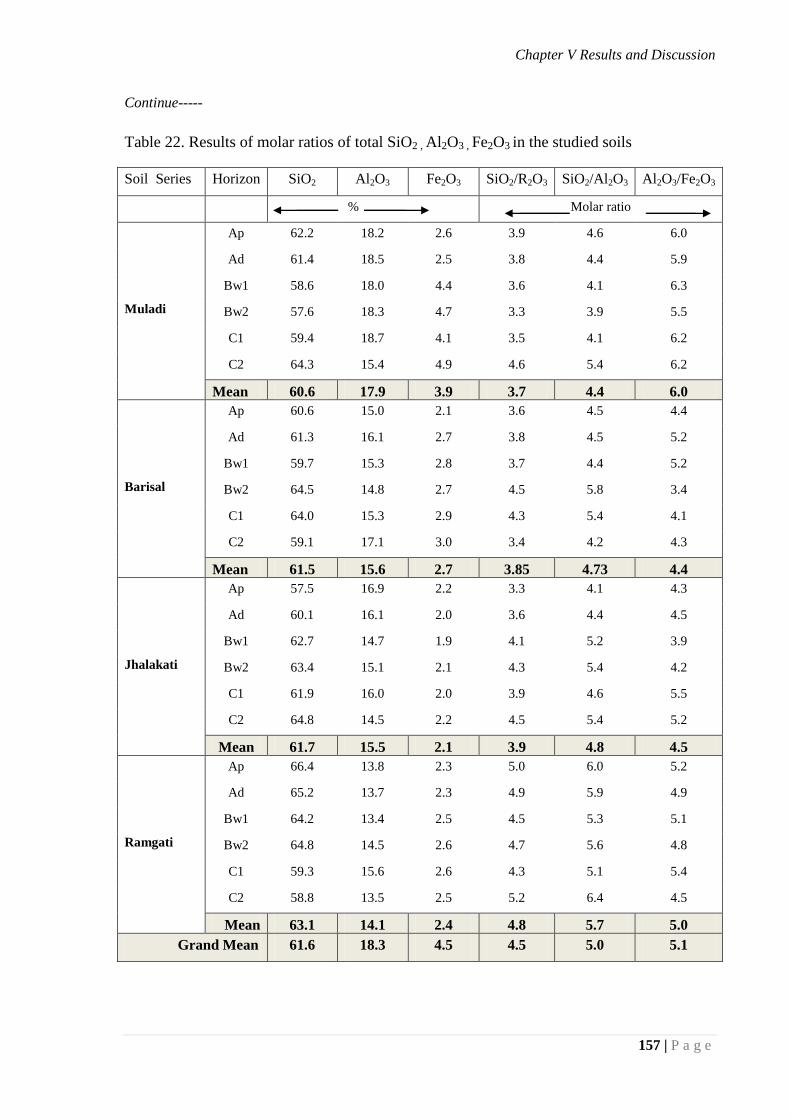
Chapter V Results and Discussion
157 | P a g e
Continue-----
Table 22. Results of molar ratios of total SiO2 , Al2O3 , Fe2O3 in the studied soils
Soil Series Horizon SiO2 Al2O3 Fe2O3 SiO2/R2O3 SiO2/Al2O3 Al2O3/Fe2O3
% Molar ratio
Muladi
Ap 62.2 18.2 2.6 3.9 4.6 6.0
Ad 61.4 18.5 2.5 3.8 4.4 5.9
Bw1 58.6 18.0 4.4 3.6 4.1 6.3
Bw2 57.6 18.3 4.7 3.3 3.9 5.5
C1 59.4 18.7 4.1 3.5 4.1 6.2
C2 64.3 15.4 4.9 4.6 5.4 6.2
Mean 60.6 17.9 3.9 3.7 4.4 6.0
Barisal
Ap 60.6 15.0 2.1 3.6 4.5 4.4
Ad 61.3 16.1 2.7 3.8 4.5 5.2
Bw1 59.7 15.3 2.8 3.7 4.4 5.2
Bw2 64.5 14.8 2.7 4.5 5.8 3.4
C1 64.0 15.3 2.9 4.3 5.4 4.1
C2 59.1 17.1 3.0 3.4 4.2 4.3
Mean 61.5 15.6 2.7 3.85 4.73 4.4
Jhalakati
Ap 57.5 16.9 2.2 3.3 4.1 4.3
Ad 60.1 16.1 2.0 3.6 4.4 4.5
Bw1 62.7 14.7 1.9 4.1 5.2 3.9
Bw2 63.4 15.1 2.1 4.3 5.4 4.2
C1 61.9 16.0 2.0 3.9 4.6 5.5
C2 64.8 14.5 2.2 4.5 5.4 5.2
Mean 61.7 15.5 2.1 3.9 4.8 4.5
Ramgati
Ap 66.4 13.8 2.3 5.0 6.0 5.2
Ad 65.2 13.7 2.3 4.9 5.9 4.9
Bw1 64.2 13.4 2.5 4.5 5.3 5.1
Bw2 64.8 14.5 2.6 4.7 5.6 4.8
C1 59.3 15.6 2.6 4.3 5.1 5.4
C2 58.8 13.5 2.5 5.2 6.4 4.5
Mean 63.1 14.1 2.4 4.8 5.7 5.0
Grand Mean 61.6 18.3 4.5 4.5 5.0 5.1
Chapter V Results and Discussion
158 | P a g e
The Al2O3/ Fe2O3 ratio in the studied soils varies from 3.4 to 4.9 with a mean value
of 4.1 (Table 22). The vertical distribution of Al2O3/ Fe2O3 ratio from the surface downward
follows an irregular pattern in all the soil profiles. The highest mean value of Al2O3/ Fe2O3
ratio is found in the Muladi soils and the lowest in the Barisal soils (Table 22). From the
vertical distribution pattern of the above ratios, it may be inferred that the parent materials
of the soils are not homogenous in nature. This finding is in conformity with the previous
works carried out by many authors on Bangladesh soils (Khan, 1995; Mazumder, 1996;
Rahman, 2001). From the above result it seems that the parent materials of these soils are of
mixed origin and of non-uniform chemical composition. The molar ratios of the soils are
very much close to that of the suspended sediments of the rivers in the coastal zone of
Bangladesh.
The total CaO contents in the soils range from 3.05 to 5.99 percent with a mean
value of 4.10 percent (Table 23). The highest value of CaO content found in the soil of
Hogla and the lowest in the Barisal series (Fig. 94). The total CaO contents in these soils are
rather high. The vertical distribution pattern of CaO content from the surface downward
follows an irregular trend.
The total MgO content ranges from 3.1 to 6.0 percent with a mean value of 2.7
percent (Table 23). The highest mean value of MgO content found in the soil of Hogla
series whereas the lowest in the Barisal series. The total MgO contents in these soils are
rather low. These results are in accord with the findings of Ali (1994).
The vertical distribution pattern of CaO content from the surface downward follows
an irregular trend in the studied soils (Table 23). These findings are in accord with the
results of many authors worked on floodplain soils (Mazumder, 1996; Khan et al. 1997).
Higher CaO content in the surface horizon was observed by Chatterjee and Dalal (1976) in
some alluviated soils of Bihar and west Bengal.
The irregular distribution pattern of calcium and magnesium oxides in all the soil
profiles may be considered as an indication of the fact that the pedochemical weathering
processes have not brought any change in the distribution pattern of the minerals containing
these elements. In other words, the ferromagnesium minerals have had no time allowance
for weathering and remained as they were when deposited by geological processes.
Consequently, the soils may be regarded as in the youthful stage.The total MnO2 content in
the soils under study ranges from 0.01 to 0.14 percent with a mean value of 0.04 percent
(Table 23).
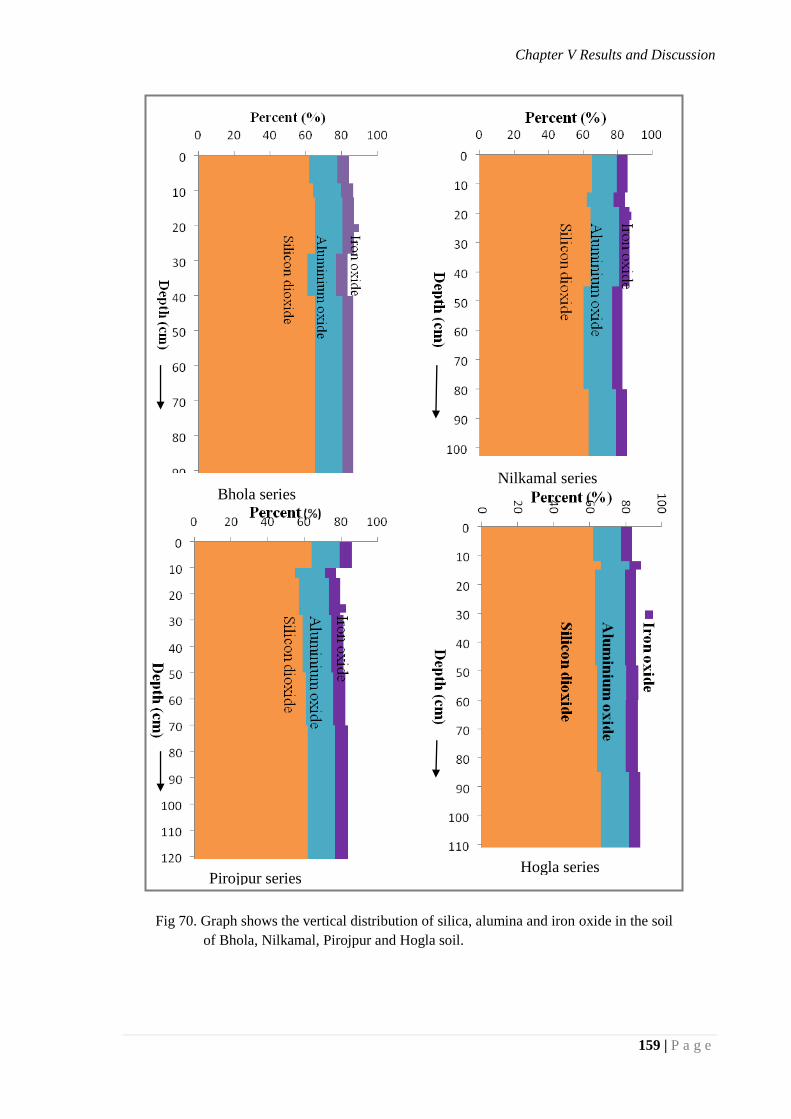
Chapter V Results and Discussion
159 | P a g e
Bhola series Nilkamal series
Pirojpur series Hogla series
Fig 70. Graph shows the vertical distribution of silica, alumina and iron oxide in the soil
of Bhola, Nilkamal, Pirojpur and Hogla soil.
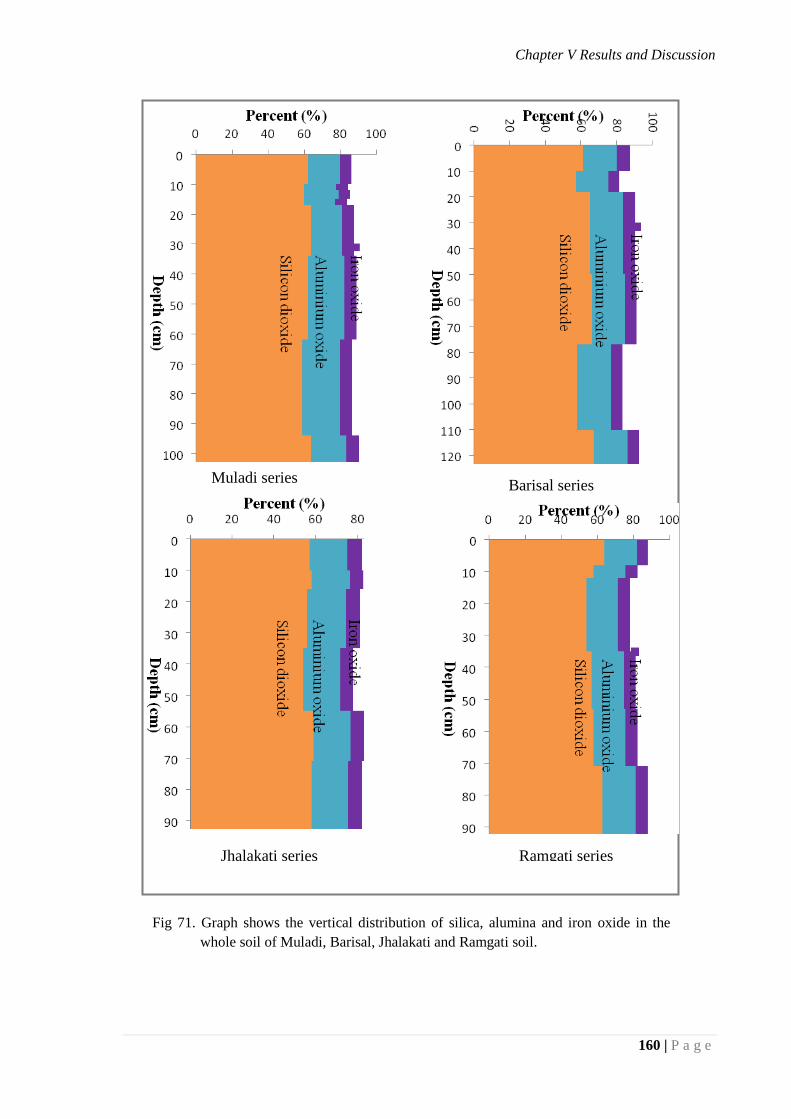
Chapter V Results and Discussion
160 | P a g e
Fig 71. Graph shows the vertical distribution of silica, alumina and iron oxide in the
whole soil of Muladi, Barisal, Jhalakati and Ramgati soil.
Barisal series
Ramgati series Jhalakati series
Muladi series
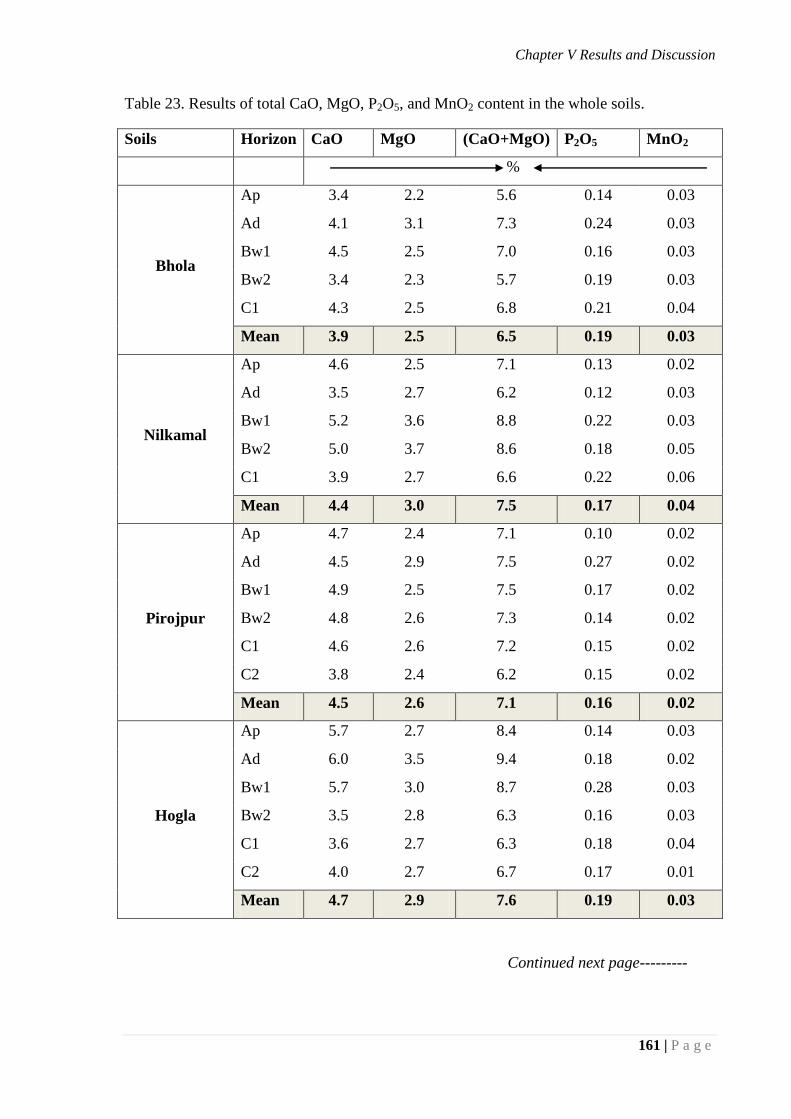
Chapter V Results and Discussion
161 | P a g e
Table 23. Results of total CaO, MgO, P2O5, and MnO2 content in the whole soils.
Soils Horizon CaO MgO (CaO+MgO) P2O5 MnO2
%
Bhola
Ap 3.4 2.2 5.6 0.14 0.03
Ad 4.1 3.1 7.3 0.24 0.03
Bw1 4.5 2.5 7.0 0.16 0.03
Bw2 3.4 2.3 5.7 0.19 0.03
C1 4.3 2.5 6.8 0.21 0.04
Mean 3.9 2.5 6.5 0.19 0.03
Nilkamal
Ap 4.6 2.5 7.1 0.13 0.02
Ad 3.5 2.7 6.2 0.12 0.03
Bw1 5.2 3.6 8.8 0.22 0.03
Bw2 5.0 3.7 8.6 0.18 0.05
C1 3.9 2.7 6.6 0.22 0.06
Mean 4.4 3.0 7.5 0.17 0.04
Pirojpur
Ap 4.7 2.4 7.1 0.10 0.02
Ad 4.5 2.9 7.5 0.27 0.02
Bw1 4.9 2.5 7.5 0.17 0.02
Bw2 4.8 2.6 7.3 0.14 0.02
C1 4.6 2.6 7.2 0.15 0.02
C2 3.8 2.4 6.2 0.15 0.02
Mean 4.5 2.6 7.1 0.16 0.02
Hogla
Ap 5.7 2.7 8.4 0.14 0.03
Ad 6.0 3.5 9.4 0.18 0.02
Bw1 5.7 3.0 8.7 0.28 0.03
Bw2 3.5 2.8 6.3 0.16 0.03
C1 3.6 2.7 6.3 0.18 0.04
C2 4.0 2.7 6.7 0.17 0.01
Mean 4.7 2.9 7.6 0.19 0.03
Continued next page---------
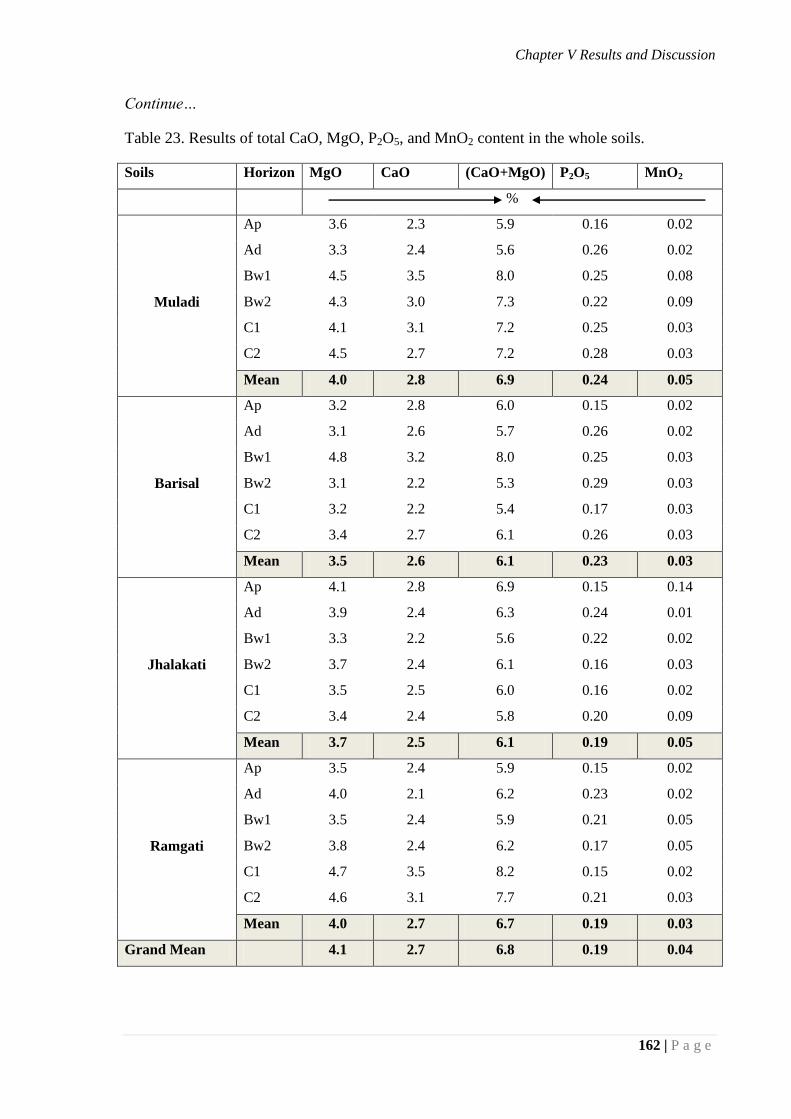
Chapter V Results and Discussion
162 | P a g e
Continue…
Table 23. Results of total CaO, MgO, P2O5, and MnO2 content in the whole soils.
Soils Horizon MgO CaO (CaO+MgO) P2O5 MnO2
%
Muladi
Ap 3.6 2.3 5.9 0.16 0.02
Ad 3.3 2.4 5.6 0.26 0.02
Bw1 4.5 3.5 8.0 0.25 0.08
Bw2 4.3 3.0 7.3 0.22 0.09
C1 4.1 3.1 7.2 0.25 0.03
C2 4.5 2.7 7.2 0.28 0.03
Mean 4.0 2.8 6.9 0.24 0.05
Barisal
Ap 3.2 2.8 6.0 0.15 0.02
Ad 3.1 2.6 5.7 0.26 0.02
Bw1 4.8 3.2 8.0 0.25 0.03
Bw2 3.1 2.2 5.3 0.29 0.03
C1 3.2 2.2 5.4 0.17 0.03
C2 3.4 2.7 6.1 0.26 0.03
Mean 3.5 2.6 6.1 0.23 0.03
Jhalakati
Ap 4.1 2.8 6.9 0.15 0.14
Ad 3.9 2.4 6.3 0.24 0.01
Bw1 3.3 2.2 5.6 0.22 0.02
Bw2 3.7 2.4 6.1 0.16 0.03
C1 3.5 2.5 6.0 0.16 0.02
C2 3.4 2.4 5.8 0.20 0.09
Mean 3.7 2.5 6.1 0.19 0.05
Ramgati
Ap 3.5 2.4 5.9 0.15 0.02
Ad 4.0 2.1 6.2 0.23 0.02
Bw1 3.5 2.4 5.9 0.21 0.05
Bw2 3.8 2.4 6.2 0.17 0.05
C1 4.7 3.5 8.2 0.15 0.02
C2 4.6 3.1 7.7 0.21 0.03
Mean 4.0 2.7 6.7 0.19 0.03
Grand Mean 4.1 2.7 6.8 0.19 0.04
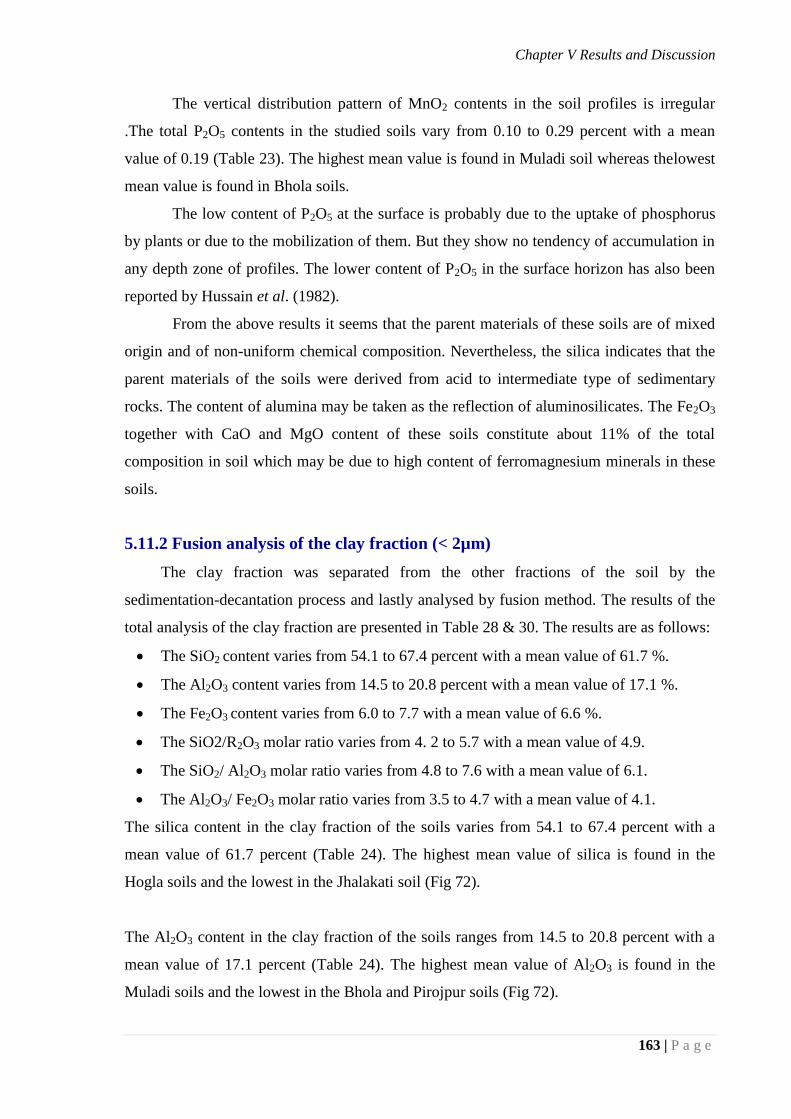
Chapter V Results and Discussion
163 | P a g e
The vertical distribution pattern of MnO2 contents in the soil profiles is irregular
.The total P2O5 contents in the studied soils vary from 0.10 to 0.29 percent with a mean
value of 0.19 (Table 23). The highest mean value is found in Muladi soil whereas thelowest
mean value is found in Bhola soils.
The low content of P2O5 at the surface is probably due to the uptake of phosphorus
by plants or due to the mobilization of them. But they show no tendency of accumulation in
any depth zone of profiles. The lower content of P2O5 in the surface horizon has also been
reported by Hussain et al. (1982).
From the above results it seems that the parent materials of these soils are of mixed
origin and of non-uniform chemical composition. Nevertheless, the silica indicates that the
parent materials of the soils were derived from acid to intermediate type of sedimentary
rocks. The content of alumina may be taken as the reflection of aluminosilicates. The Fe2O3
together with CaO and MgO content of these soils constitute about 11% of the total
composition in soil which may be due to high content of ferromagnesium minerals in these
soils.
5.11.2 Fusion analysis of the clay fraction (< 2µm)
The clay fraction was separated from the other fractions of the soil by the
sedimentation-decantation process and lastly analysed by fusion method. The results of the
total analysis of the clay fraction are presented in Table 28 & 30. The results are as follows:
The SiO2 content varies from 54.1 to 67.4 percent with a mean value of 61.7 %.
The Al2O3 content varies from 14.5 to 20.8 percent with a mean value of 17.1 %.
The Fe2O3 content varies from 6.0 to 7.7 with a mean value of 6.6 %.
The SiO2/R2O3 molar ratio varies from 4. 2 to 5.7 with a mean value of 4.9.
The SiO2/ Al2O3 molar ratio varies from 4.8 to 7.6 with a mean value of 6.1.
The Al2O3/ Fe2O3 molar ratio varies from 3.5 to 4.7 with a mean value of 4.1.
The silica content in the clay fraction of the soils varies from 54.1 to 67.4 percent with a
mean value of 61.7 percent (Table 24). The highest mean value of silica is found in the
Hogla soils and the lowest in the Jhalakati soil (Fig 72).
The Al2O3 content in the clay fraction of the soils ranges from 14.5 to 20.8 percent with a
mean value of 17.1 percent (Table 24). The highest mean value of Al2O3 is found in the
Muladi soils and the lowest in the Bhola and Pirojpur soils (Fig 72).
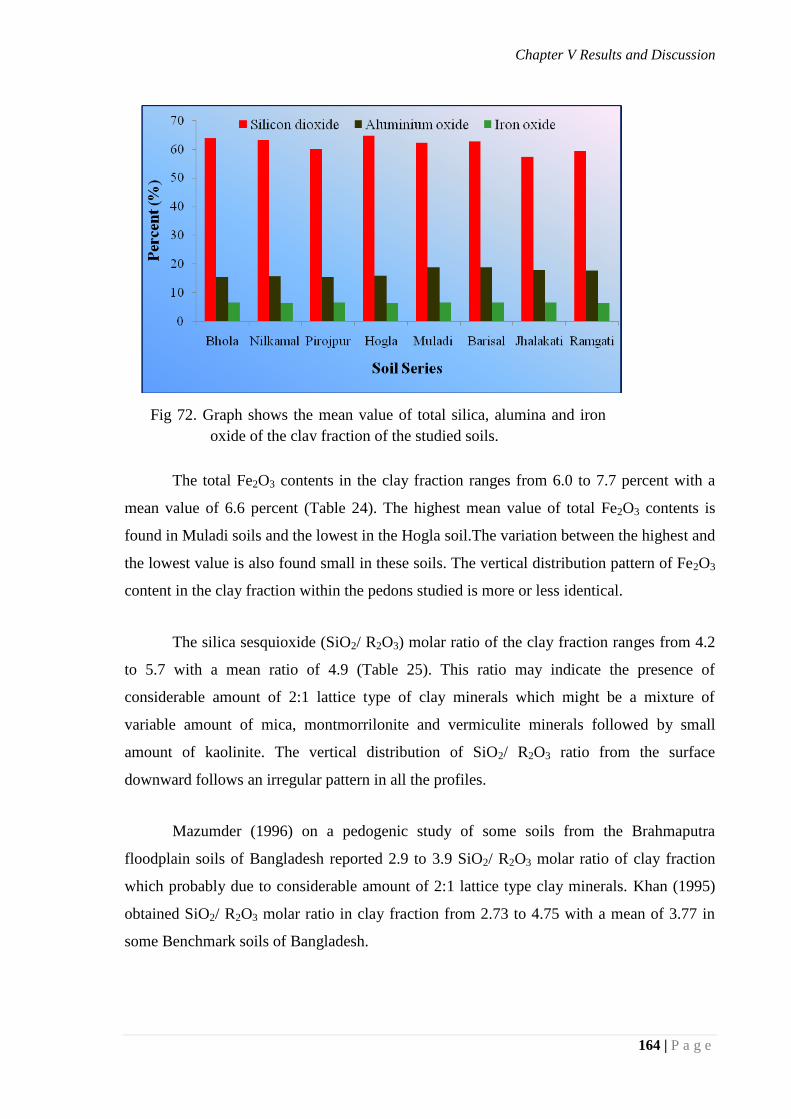
Chapter V Results and Discussion
164 | P a g e
The total Fe2O3 contents in the clay fraction ranges from 6.0 to 7.7 percent with a
mean value of 6.6 percent (Table 24). The highest mean value of total Fe2O3 contents is
found in Muladi soils and the lowest in the Hogla soil.The variation between the highest and
the lowest value is also found small in these soils. The vertical distribution pattern of Fe2O3
content in the clay fraction within the pedons studied is more or less identical.
The silica sesquioxide (SiO2/ R2O3) molar ratio of the clay fraction ranges from 4.2
to 5.7 with a mean ratio of 4.9 (Table 25). This ratio may indicate the presence of
considerable amount of 2:1 lattice type of clay minerals which might be a mixture of
variable amount of mica, montmorrilonite and vermiculite minerals followed by small
amount of kaolinite. The vertical distribution of SiO2/ R2O3 ratio from the surface
downward follows an irregular pattern in all the profiles.
Mazumder (1996) on a pedogenic study of some soils from the Brahmaputra
floodplain soils of Bangladesh reported 2.9 to 3.9 SiO2/ R2O3 molar ratio of clay fraction
which probably due to considerable amount of 2:1 lattice type clay minerals. Khan (1995)
obtained SiO2/ R2O3 molar ratio in clay fraction from 2.73 to 4.75 with a mean of 3.77 in
some Benchmark soils of Bangladesh.
Fig 72. Graph shows the mean value of total silica, alumina and iron
oxide of the clay fraction of the studied soils.

Chapter V Results and Discussion
165 | P a g e
Table 24. Results of chemical composition in the clay fraction of the studied soils.
Soil Series Horizon SiO2 Al2O3 Fe2O3 CaO MgO K2O TiO2
%
Bhola
Ap 62.1 15.5 6.7 0.01 2.3 2.1 1.9
Ad 64.2 15.8 6.8 0.02 2.5 2.6 2.1
Bw1 65.3 15.4 6.6 0.06 1.9 2.4 1.8
Bw2 61.4 15.9 6.6 0.01 3.2 2.0 1.8
C1 65.7 15.5 6.1 0.07 1.8 2.0 1.9
Mean 63.7 15.6 6.6 0.03 2.4 2.9 1.8
Nilkamal
Ap 65.3 14.5 6.2 0.02 3.2 3.1 1.6
Ad 62.4 15.4 6.9 0.03 3.1 2.5 1.6
Bw1 64.5 16.8 6.1 0.02 3.0 2.4 1.6
Bw2 60.2 16.6 6.2 0.01 2.7 2.6 1.7
C1 63.3 15.9 6.5 0.02 2.1 2.3 1.3
Mean 63.1 15.8 6.4 0.02 2.8 2.9 1.6
Pirojpur
Ap 64.7 15.2 6.9 0.02 4.7 2.6 2.0
Ad 56.2 16.2 6.2 0.02 4.0 2.7 2.0
Bw1 57.1 16.4 6.4 0.01 3.9 2.2 1.9
Bw2 59.1 15.9 6.7 0.02 3.7 2.7 1.9
C1 61.4 14.9 6.6 0.03 3.5 2.9 1.8
C2 62.2 15.1 6.9 0.05 2.2 2.0 1.8
Mean 60.1 15.6 6.6 0.03 3.7 2.5 1.9
Hogla
Ap 62.8 15.4 6.1 0.02 3.0 3.3 1.9
Ad 66.4 16.2 6.5 0.01 3.2 3.5 1.9
Bw1 63.5 16.6 6.0 0.02 3.5 3.9 1.9
Bw2 64.1 16.4 6.7 0.01 3.7 3.4 1.9
C1 64.5 15.9 6.9 0.05 3.8 3.1 1.8
C2 66.8 15.8 6.2 0.02 3.6 2.8 1.7
Mean 64.7 16.1 6.4 0.02 3.5 3.3 1.9
Continued next page------
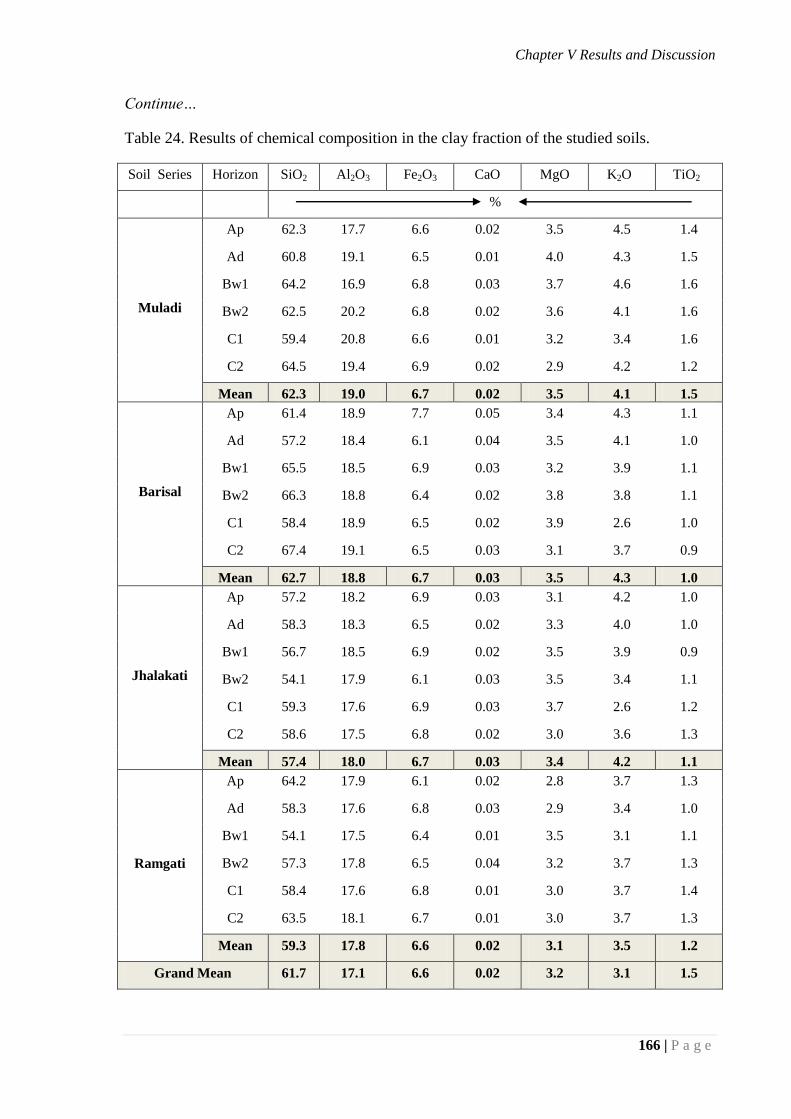
Chapter V Results and Discussion
166 | P a g e
Continue…
Table 24. Results of chemical composition in the clay fraction of the studied soils.
Soil Series Horizon SiO2 Al2O3 Fe2O3 CaO MgO K2O TiO2
%
Muladi
Ap 62.3 17.7 6.6 0.02 3.5 4.5 1.4
Ad 60.8 19.1 6.5 0.01 4.0 4.3 1.5
Bw1 64.2 16.9 6.8 0.03 3.7 4.6 1.6
Bw2 62.5 20.2 6.8 0.02 3.6 4.1 1.6
C1 59.4 20.8 6.6 0.01 3.2 3.4 1.6
C2 64.5 19.4 6.9 0.02 2.9 4.2 1.2
Mean 62.3 19.0 6.7 0.02 3.5 4.1 1.5
Barisal
Ap 61.4 18.9 7.7 0.05 3.4 4.3 1.1
Ad 57.2 18.4 6.1 0.04 3.5 4.1 1.0
Bw1 65.5 18.5 6.9 0.03 3.2 3.9 1.1
Bw2 66.3 18.8 6.4 0.02 3.8 3.8 1.1
C1 58.4 18.9 6.5 0.02 3.9 2.6 1.0
C2 67.4 19.1 6.5 0.03 3.1 3.7 0.9
Mean 62.7 18.8 6.7 0.03 3.5 4.3 1.0
Jhalakati
Ap 57.2 18.2 6.9 0.03 3.1 4.2 1.0
Ad 58.3 18.3 6.5 0.02 3.3 4.0 1.0
Bw1 56.7 18.5 6.9 0.02 3.5 3.9 0.9
Bw2 54.1 17.9 6.1 0.03 3.5 3.4 1.1
C1 59.3 17.6 6.9 0.03 3.7 2.6 1.2
C2 58.6 17.5 6.8 0.02 3.0 3.6 1.3
Mean 57.4 18.0 6.7 0.03 3.4 4.2 1.1
Ramgati
Ap 64.2 17.9 6.1 0.02 2.8 3.7 1.3
Ad 58.3 17.6 6.8 0.03 2.9 3.4 1.0
Bw1 54.1 17.5 6.4 0.01 3.5 3.1 1.1
Bw2 57.3 17.8 6.5 0.04 3.2 3.7 1.3
C1 58.4 17.6 6.8 0.01 3.0 3.7 1.4
C2 63.5 18.1 6.7 0.01 3.0 3.7 1.3
Mean 59.3 17.8 6.6 0.02 3.1 3.5 1.2
Grand Mean 61.7 17.1 6.6 0.02 3.2 3.1 1.5
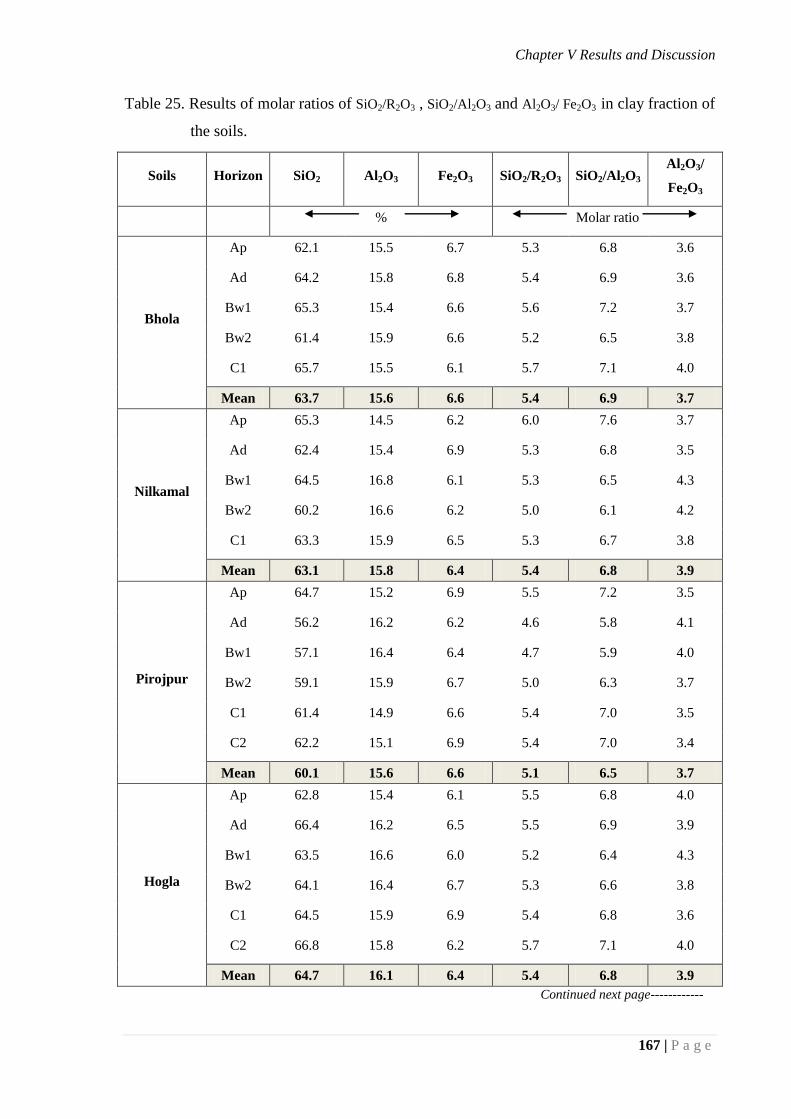
Chapter V Results and Discussion
167 | P a g e
Table 25. Results of molar ratios of SiO2/R2O3 , SiO2/Al2O3 and Al2O3/ Fe2O3 in clay fraction of
the soils.
Soils Horizon SiO2 Al2O3 Fe2O3 SiO2/R2O3 SiO2/Al2O3 Al2O3/
Fe2O3
% Molar ratio
Bhola
Ap 62.1 15.5 6.7 5.3 6.8 3.6
Ad 64.2 15.8 6.8 5.4 6.9 3.6
Bw1 65.3 15.4 6.6 5.6 7.2 3.7
Bw2 61.4 15.9 6.6 5.2 6.5 3.8
C1 65.7 15.5 6.1 5.7 7.1 4.0
Mean 63.7 15.6 6.6 5.4 6.9 3.7
Nilkamal
Ap 65.3 14.5 6.2 6.0 7.6 3.7
Ad 62.4 15.4 6.9 5.3 6.8 3.5
Bw1 64.5 16.8 6.1 5.3 6.5 4.3
Bw2 60.2 16.6 6.2 5.0 6.1 4.2
C1 63.3 15.9 6.5 5.3 6.7 3.8
Mean 63.1 15.8 6.4 5.4 6.8 3.9
Pirojpur
Ap 64.7 15.2 6.9 5.5 7.2 3.5
Ad 56.2 16.2 6.2 4.6 5.8 4.1
Bw1 57.1 16.4 6.4 4.7 5.9 4.0
Bw2 59.1 15.9 6.7 5.0 6.3 3.7
C1 61.4 14.9 6.6 5.4 7.0 3.5
C2 62.2 15.1 6.9 5.4 7.0 3.4
Mean 60.1 15.6 6.6 5.1 6.5 3.7
Hogla
Ap 62.8 15.4 6.1 5.5 6.8 4.0
Ad 66.4 16.2 6.5 5.5 6.9 3.9
Bw1 63.5 16.6 6.0 5.2 6.4 4.3
Bw2 64.1 16.4 6.7 5.3 6.6 3.8
C1 64.5 15.9 6.9 5.4 6.8 3.6
C2 66.8 15.8 6.2 5.7 7.1 4.0
Mean 64.7 16.1 6.4 5.4 6.8 3.9
Continued next page------------
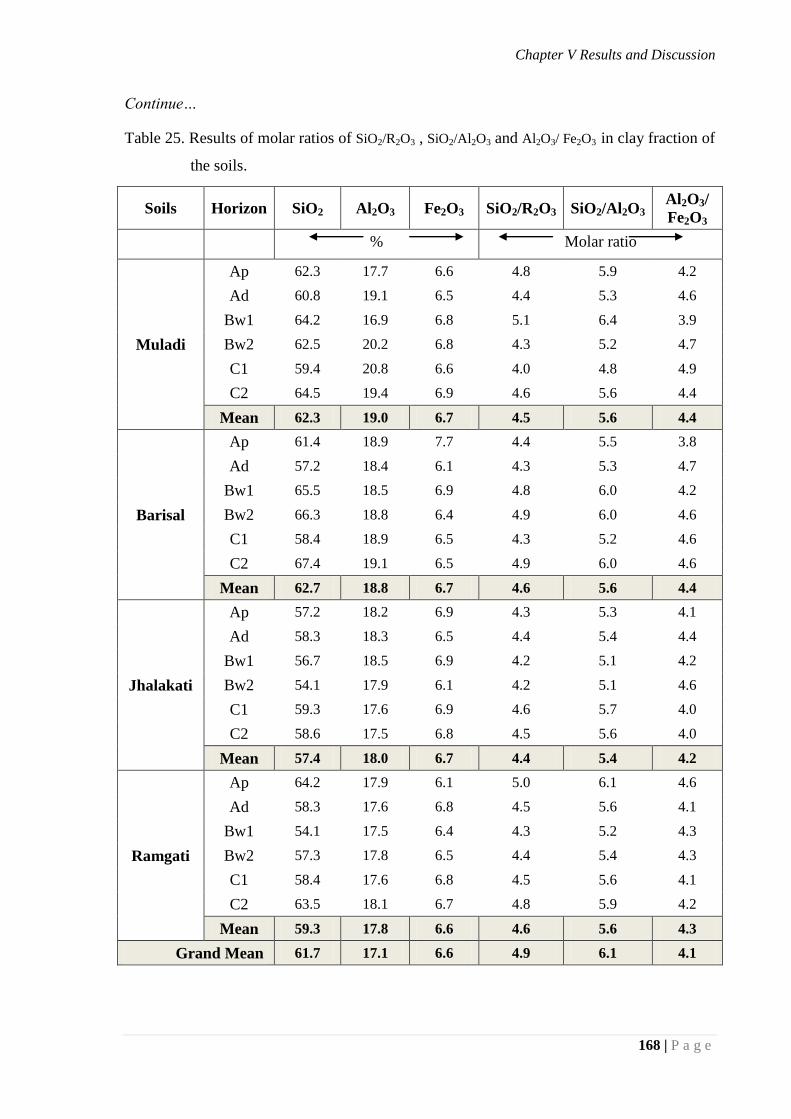
Chapter V Results and Discussion
168 | P a g e
Continue…
Table 25. Results of molar ratios of SiO2/R2O3 , SiO2/Al2O3 and Al2O3/ Fe2O3 in clay fraction of
the soils.
Soils Horizon SiO2 Al2O3 Fe2O3 SiO2/R2O3 SiO2/Al2O3 Al2O3/
Fe2O3
% Molar ratio
Muladi
Ap 62.3 17.7 6.6 4.8 5.9 4.2
Ad 60.8 19.1 6.5 4.4 5.3 4.6
Bw1 64.2 16.9 6.8 5.1 6.4 3.9
Bw2 62.5 20.2 6.8 4.3 5.2 4.7
C1 59.4 20.8 6.6 4.0 4.8 4.9
C2 64.5 19.4 6.9 4.6 5.6 4.4
Mean 62.3 19.0 6.7 4.5 5.6 4.4
Barisal
Ap 61.4 18.9 7.7 4.4 5.5 3.8
Ad 57.2 18.4 6.1 4.3 5.3 4.7
Bw1 65.5 18.5 6.9 4.8 6.0 4.2
Bw2 66.3 18.8 6.4 4.9 6.0 4.6
C1 58.4 18.9 6.5 4.3 5.2 4.6
C2 67.4 19.1 6.5 4.9 6.0 4.6
Mean 62.7 18.8 6.7 4.6 5.6 4.4
Jhalakati
Ap 57.2 18.2 6.9 4.3 5.3 4.1
Ad 58.3 18.3 6.5 4.4 5.4 4.4
Bw1 56.7 18.5 6.9 4.2 5.1 4.2
Bw2 54.1 17.9 6.1 4.2 5.1 4.6
C1 59.3 17.6 6.9 4.6 5.7 4.0
C2 58.6 17.5 6.8 4.5 5.6 4.0
Mean 57.4 18.0 6.7 4.4 5.4 4.2
Ramgati
Ap 64.2 17.9 6.1 5.0 6.1 4.6
Ad 58.3 17.6 6.8 4.5 5.6 4.1
Bw1 54.1 17.5 6.4 4.3 5.2 4.3
Bw2 57.3 17.8 6.5 4.4 5.4 4.3
C1 58.4 17.6 6.8 4.5 5.6 4.1
C2 63.5 18.1 6.7 4.8 5.9 4.2
Mean 59.3 17.8 6.6 4.6 5.6 4.3
Grand Mean 61.7 17.1 6.6 4.9 6.1 4.1
Chapter V Results and Discussion
169 | P a g e
The SiO2/ Al2O3 molar ratio in the clay fraction varies from 4.8 to 7.6 with a mean
value of 6.1 (Table 25). The highest mean value is found in the Bhola soil and the lowest in
the Jhalakati soil. The Al2O3/ Fe2O3 ratio varies from 3.5 to 4.7 percent with a mean value
of 4.1 (Table 25). The highest mean ratio is found in Barisal soil whereas the lowest in
Bhola soil. The vertical distribution of the ratio within the profiles shows an irregular trend.
The CaO content of the clay fraction is very low ranges from 0.01 to 0.07 percent
with a mean value of 0.02 percent (Table 26).
The MgO content in the clay fraction ranges from 1.8 to 4.7 with a mean of 3.2
percent (Table 26). These results indicate that the clay minerals are rich in magnesium. The
highest mean ratio is found in Pirojpur soil whereas the lowest value is found in Bhola soils.
The MnO2 content in the clays varies from 0.07 to 0.36 percent with an average value of
0.14 percent (Table 26). The P2O5 content in the clays varies from 0.07 to 0.21 percent with
an average value of 0.13 percent (Table 26).The vertical distribution of P2O5 and MnO2
content in the clay fraction of the pedons show irregular pattern.
The loss on ignition of the clay fraction ranges from 10 to 21 percent with a mean of
13 percent (Table 26). The loss on ignition of the clay fraction was found to be highest in
Barisal soil whereas the lowest value is found in Muladi and Hogla soils. The variation of
LOI is mainly due to variation of the type and amount of clay minerals present in the clay
fraction of these soils.
5.11.3 Total potassium (K2O) contents in soils and clays
Potassium in the soils
The K2O content in mineral soils usually ranges from 0.05 to 3.5 percent (Jackson,
1975). The distribution of K2O in soils on a worldwide basis follows a definite
geomorphologic pattern and is related more to the conditions of weathering of the potash
feldspars and mica than to the composition of the parent rock themselves (Jackson, 1964).
The total K2O content of the soils under the present study have been presented in
Table 27. The K2O contents in the whole soils vary from 1.31 to 3.99 percent and the mean
value is 2.30 percent. Similar results were also observed in Bangladesh soils by Mazumder,
1976; Chowdhury et al. 1992; Khan, 1995 and Rahman, 2001.
The total potassium content in these soils is quite high, which may be due to the
presence of abundant quantity of potassium bearing minerals such as micas and feldspars. In
fact, mica flakes in some soil samples could be seen even with unaided eye in the field.
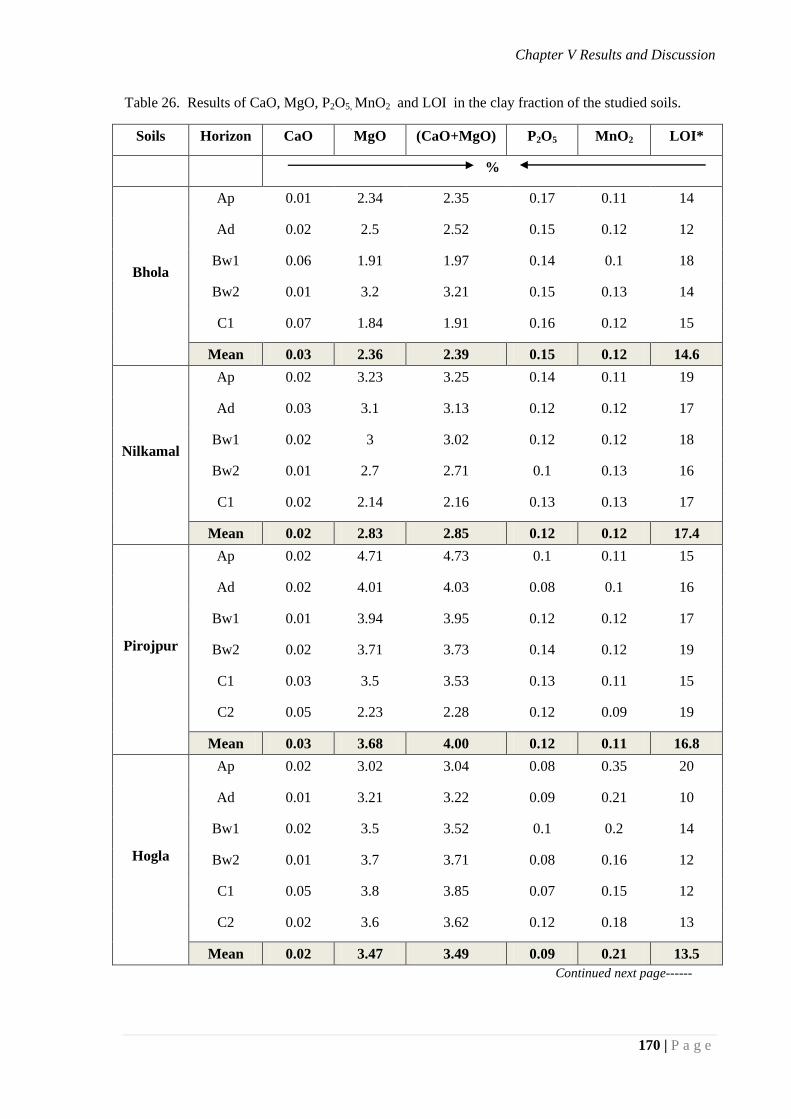
Chapter V Results and Discussion
170 | P a g e
Table 26. Results of CaO, MgO, P2O5, MnO2 and LOI in the clay fraction of the studied soils.
Soils Horizon CaO MgO (CaO+MgO) P2O5 MnO2 LOI*
%
Bhola
Ap 0.01 2.34 2.35 0.17 0.11 14
Ad 0.02 2.5 2.52 0.15 0.12 12
Bw1 0.06 1.91 1.97 0.14 0.1 18
Bw2 0.01 3.2 3.21 0.15 0.13 14
C1 0.07 1.84 1.91 0.16 0.12 15
Mean 0.03 2.36 2.39 0.15 0.12 14.6
Nilkamal
Ap 0.02 3.23 3.25 0.14 0.11 19
Ad 0.03 3.1 3.13 0.12 0.12 17
Bw1 0.02 3 3.02 0.12 0.12 18
Bw2 0.01 2.7 2.71 0.1 0.13 16
C1 0.02 2.14 2.16 0.13 0.13 17
Mean 0.02 2.83 2.85 0.12 0.12 17.4
Pirojpur
Ap 0.02 4.71 4.73 0.1 0.11 15
Ad 0.02 4.01 4.03 0.08 0.1 16
Bw1 0.01 3.94 3.95 0.12 0.12 17
Bw2 0.02 3.71 3.73 0.14 0.12 19
C1 0.03 3.5 3.53 0.13 0.11 15
C2 0.05 2.23 2.28 0.12 0.09 19
Mean 0.03 3.68 4.00 0.12 0.11 16.8
Hogla
Ap 0.02 3.02 3.04 0.08 0.35 20
Ad 0.01 3.21 3.22 0.09 0.21 10
Bw1 0.02 3.5 3.52 0.1 0.2 14
Bw2 0.01 3.7 3.71 0.08 0.16 12
C1 0.05 3.8 3.85 0.07 0.15 12
C2 0.02 3.6 3.62 0.12 0.18 13
Mean 0.02 3.47 3.49 0.09 0.21 13.5
Continued next page------
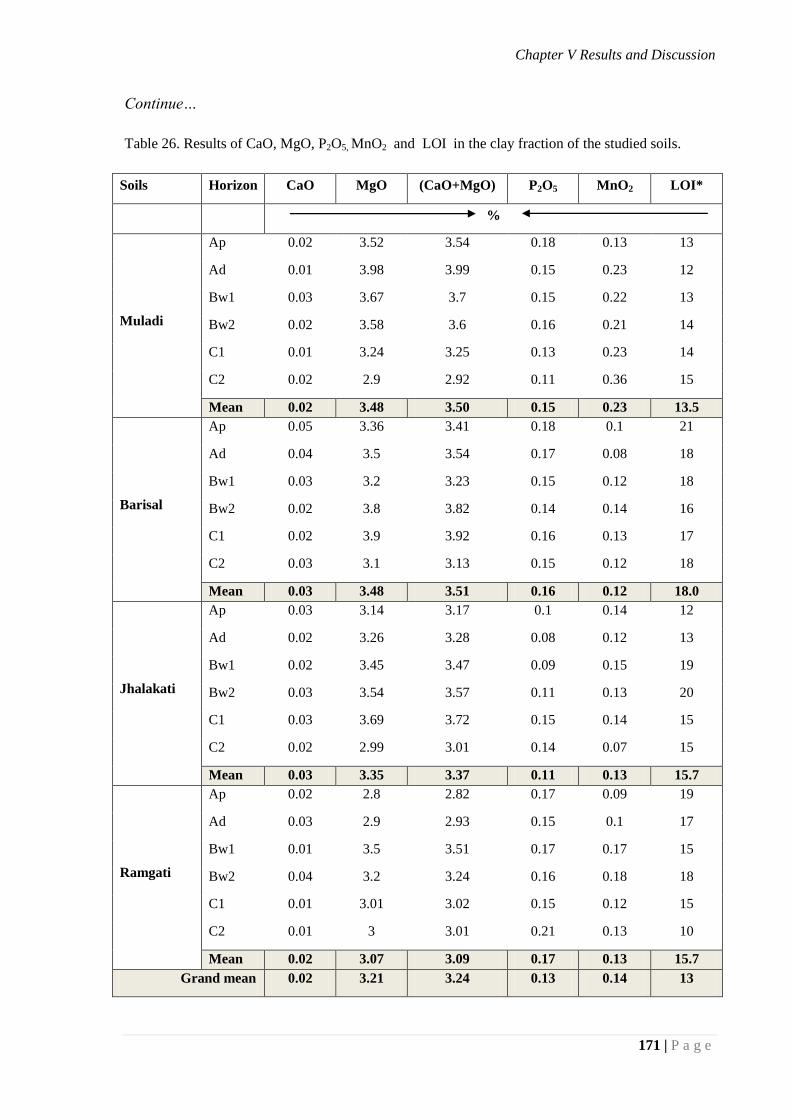
Chapter V Results and Discussion
171 | P a g e
Continue…
Table 26. Results of CaO, MgO, P2O5, MnO2 and LOI in the clay fraction of the studied soils.
Soils Horizon CaO MgO (CaO+MgO) P2O5 MnO2 LOI*
%
Muladi
Ap 0.02 3.52 3.54 0.18 0.13 13
Ad 0.01 3.98 3.99 0.15 0.23 12
Bw1 0.03 3.67 3.7 0.15 0.22 13
Bw2 0.02 3.58 3.6 0.16 0.21 14
C1 0.01 3.24 3.25 0.13 0.23 14
C2 0.02 2.9 2.92 0.11 0.36 15
Mean 0.02 3.48 3.50 0.15 0.23 13.5
Barisal
Ap 0.05 3.36 3.41 0.18 0.1 21
Ad 0.04 3.5 3.54 0.17 0.08 18
Bw1 0.03 3.2 3.23 0.15 0.12 18
Bw2 0.02 3.8 3.82 0.14 0.14 16
C1 0.02 3.9 3.92 0.16 0.13 17
C2 0.03 3.1 3.13 0.15 0.12 18
Mean 0.03 3.48 3.51 0.16 0.12 18.0
Jhalakati
Ap 0.03 3.14 3.17 0.1 0.14 12
Ad 0.02 3.26 3.28 0.08 0.12 13
Bw1 0.02 3.45 3.47 0.09 0.15 19
Bw2 0.03 3.54 3.57 0.11 0.13 20
C1 0.03 3.69 3.72 0.15 0.14 15
C2 0.02 2.99 3.01 0.14 0.07 15
Mean 0.03 3.35 3.37 0.11 0.13 15.7
Ramgati
Ap 0.02 2.8 2.82 0.17 0.09 19
Ad 0.03 2.9 2.93 0.15 0.1 17
Bw1 0.01 3.5 3.51 0.17 0.17 15
Bw2 0.04 3.2 3.24 0.16 0.18 18
C1 0.01 3.01 3.02 0.15 0.12 15
C2 0.01 3 3.01 0.21 0.13 10
Mean 0.02 3.07 3.09 0.17 0.13 15.7
Grand mean 0.02 3.21 3.24 0.13 0.14 13
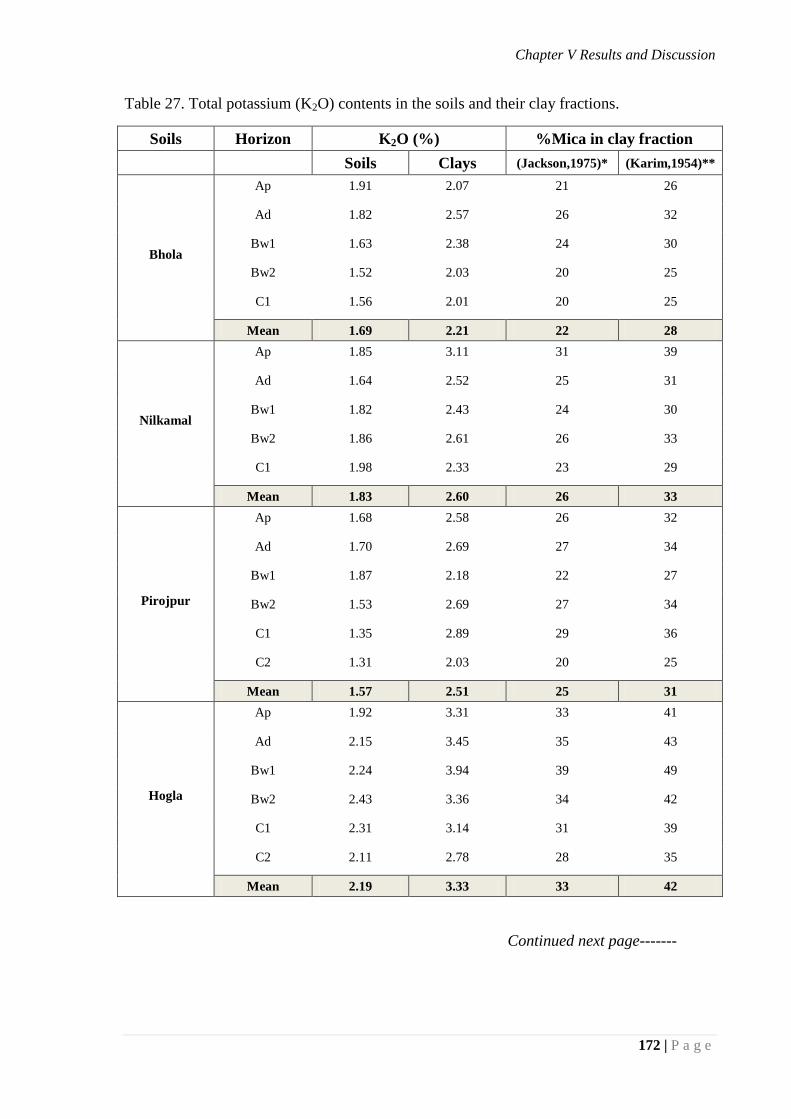
Chapter V Results and Discussion
172 | P a g e
Table 27. Total potassium (K2O) contents in the soils and their clay fractions.
Soils Horizon K2O (%) %Mica in clay fraction
Soils Clays (Jackson,1975)* (Karim,1954)**
Bhola
Ap 1.91 2.07 21 26
Ad 1.82 2.57 26 32
Bw1 1.63 2.38 24 30
Bw2 1.52 2.03 20 25
C1 1.56 2.01 20 25
Mean 1.69 2.21 22 28
Nilkamal
Ap 1.85 3.11 31 39
Ad 1.64 2.52 25 31
Bw1 1.82 2.43 24 30
Bw2 1.86 2.61 26 33
C1 1.98 2.33 23 29
Mean 1.83 2.60 26 33
Pirojpur
Ap 1.68 2.58 26 32
Ad 1.70 2.69 27 34
Bw1 1.87 2.18 22 27
Bw2 1.53 2.69 27 34
C1 1.35 2.89 29 36
C2 1.31 2.03 20 25
Mean 1.57 2.51 25 31
Hogla
Ap 1.92 3.31 33 41
Ad 2.15 3.45 35 43
Bw1 2.24 3.94 39 49
Bw2 2.43 3.36 34 42
C1 2.31 3.14 31 39
C2 2.11 2.78 28 35
Mean 2.19 3.33 33 42
Continued next page-------

Chapter V Results and Discussion
173 | P a g e
Continue…
Table 27. Total potassium (K2O) contents in the soils and their clay fractions.
Soils Horizon K2O (%) %Mica in clay fraction
Soils Clays (Jackson,1975)** (Karim,1954)**
Muladi
Ap 3.99 4.51 45 56
Ad 3.43 4.32 43 54
Bw1 3.54 4.63 46 58
Bw2 3.25 4.11 41 51
C1 2.42 3.42 34 43
C2 3.18 4.17 42 52
Mean 3.30 4.19 42 52
Barisal
Ap 2.52 4.31 43 54
Ad 2.12 4.12 41 51
Bw1 3.24 3.91 39 49
Bw2 2.88 3.82 38 48
C1 2.93 2.62 26 33
C2 2.74 3.71 37 46
Mean 2.74 3.75 37 47
Jhalakati
Ap 3.33 4.21 42 53
Ad 2.55 4.01 40 50
Bw1 3.16 3.92 39 49
Bw2 3.12 3.43 34 43
C1 2.34 2.62 26 33
C2 2.90 3.61 36 45
Mean 2.90 3.63 36 45
Ramgati
Ap 2.11 3.71 37 46
Ad 2.82 3.37 34 42
Bw1 2.43 3.09 31 39
Bw2 2.31 3.71 37 46
C1 2.26 3.66 37 46
C2 2.13 3.72 37 47
Mean 2.34 3.54 35 44
Grand mean 2.30 3.22 32 40
*% mica in clay= % K2O in clay x 100/10 ** % mica in clay= % K2O in clay x 100/8
Chapter V Results and Discussion
174 | P a g e
Presence of mica flakes in the soil under study also indicates that these soils are
relatively young. The highest amount of K2O in the whole soil is found in Muladi soil while
the lowest amount is found in Pirojpur soil (Fig 73). This variation in K2O content in these
soils is due probably to the variation in the K-bearing minerals in their parent material
(Laves, 1978; Mengel and Kirkby, 1982; Mazumder et al. 2010).
The vertical distribution of K2O content in the soil profiles is in general irregular in
nature (Figs. 73 & 74). Although the distribution pattern within the soil profile is irregular,
there is a little accumulation of K2O content in the B-horizon of all the soils. The
impoverishment of K2O from the surface horizons of the studied pedons indicates that the
mica present in these horizons are being weathered and K is being lost from their inter
lattice space forming iliite / hydrated mica. This may be caused by the seasonal flooding
and fluctuating ground water table. The K is known to be highly sensitive to leaching during
weathering and soil formation (Jenny, 1941). The differential leaching of potassium in the
soils studied may be due to variation in their drainage condition. The above results are in
agreement with the findings of Diwakar and Singh (1992) in some floodplain soils of India.
Potassium in the clay fraction
The amount of K2O in the clay fraction varies from 2.01 to 4.63 percent with a mean
value is 3.22 percent (Table 27). The highest amount of K2O in the clay fraction was found
in Muladi soil while the lowest amount was found in Bhola soil. This variation of potassium
content in the clay fraction is due to the variations in the K-bearing minerals mainly mica in
the clay fraction.The vertical distribution pattern of K2O content in the clay fraction within
the profile is irregular (Figs. 77 & 78).
A rough estimation of mica minerals in the clay fraction has been made from their
K2O contents using Karim’s (1954) and Jackson’s (1975) method. The former author used 8
percent K2O and the latter author used 10 percent K2O for calculating percent mica in the
clay fraction.
In the clay fraction potassium is usually present in mica minerals. The amount of mica
mineral can be approximately estimated when it is assumed that there is no potassium
bearing minerals except mica. It is clear that there is abundant mica minerals present in the
clay fraction. The amount varies from 26 to 58 percent with a mean value of 40 percent
(Karim, 1954) (Table 27). The highest mica content is present in Muladi soil while the
lowest in Bholal soil.
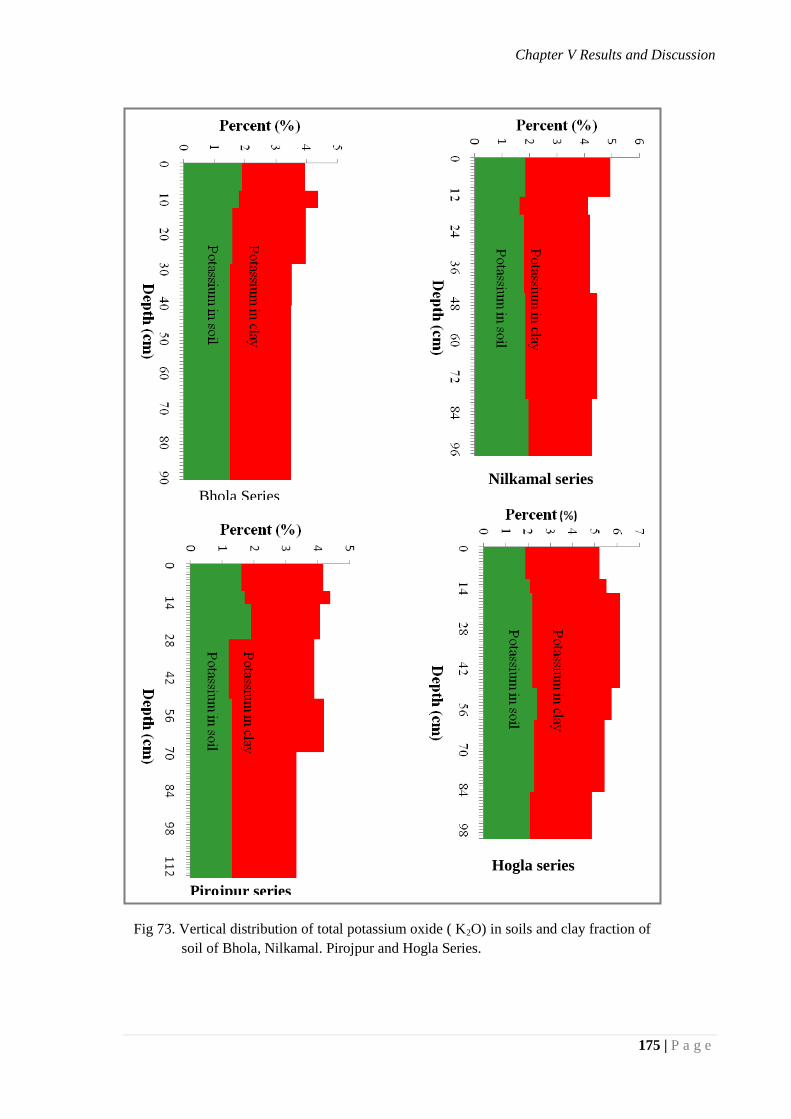
Chapter V Results and Discussion
175 | P a g e
Fig 73. Vertical distribution of total potassium oxide ( K2O) in soils and clay fraction of
soil of Bhola, Nilkamal. Pirojpur and Hogla Series.
Bhola Series Nilkamal series
Hogla series
Pirojpur series

Chapter V Results and Discussion
176 | P a g e
Muladi Serhies Barisal Series
Jhalakati Series Ramgati
Series
Fig 74. Vertical distribution of total potassium oxide ( K2O) in soils and clay fraction of
soil of Muladi, Barisal, Jhalakati and Ramgati Series.
Chapter V Results and Discussion
177 | P a g e
The mean mica content in the clay fraction of the soils was in 32 percent according
to Jackson’s method (1975) and according to Karim’s method the mean mica content in the
clay fraction was 40 percent.Such a high quantity of mica is present in the soils under the
present investigation which suggests that the supply of potassium for consumption by plants
will be adequate and there will be little need for application of potassium containing
fertilizer for optimum crop production.
5.11.4 Titanium (TiO2) content in soils and clays
Titanium bearing minerals are often used as index minerals for pedogenetic studies.
The mean value of TiO2 content in whole soils and clay shown in Fig 75.
The results of TiO2 contents in the studied soils vary from 0.56 to 1.74 percent with
a mean value of 1.05 percent. The highest mean value within the profile was found in Bhola
soil whereas the lowest TiO2 content was found in Barisal soil (Table 28). Similar results
were obtained in rice soils in Combodia, Indonesia, Malaysia, Phillipines and Tropical Asia
(Kyuma, 1978) and in some coastal floodplain soils in Bangladesh (Begum, 2004). Source
of this titanium is mostly titanium bearing primary minerals such as rutile, anatase, and
ilmenite in the parent materials.
The vertical distribution of TiO2 in soils from the surface downward follows an
irregular pattern (Figs. 76 and 77) in all the soil profiles. Slight depletion of TiO2 from the
surface horizons may also be noticed in some studied soils
Titanium in the clay fraction
The TiO2 content in clay fraction of the soils ranges from 0.88 to 2.11 percent with a
mean value of 1.47 percent (Table 28). TiO2 contents in the clay fraction are more than that
in the whole soil. This is because most of the TiO2 minerals occur in the clay fraction of the
soils. This is in accord with the findings of Robinson and Holmes (1924) ; Khan et al.
2010).
The highest mean value of titanium in clay fraction among the profiles is observed
in Pirojpur soils and the lowest mean value in Barisal soil. It may be mentioned here that
TiO2 in clay fractions may occur in two distinct forms- firstly in discrete oxide forms which
usually occur as clay sized and discrete titanium oxide minerals and secondly, titanium may
occur in the octahedral layers of clay minerals (Jackson and Sherman, 1953; Brain, 1976
and Hutton, 1977) because titanium can isomorphously replace aluminium in the octahedral
layer of clay lattice.
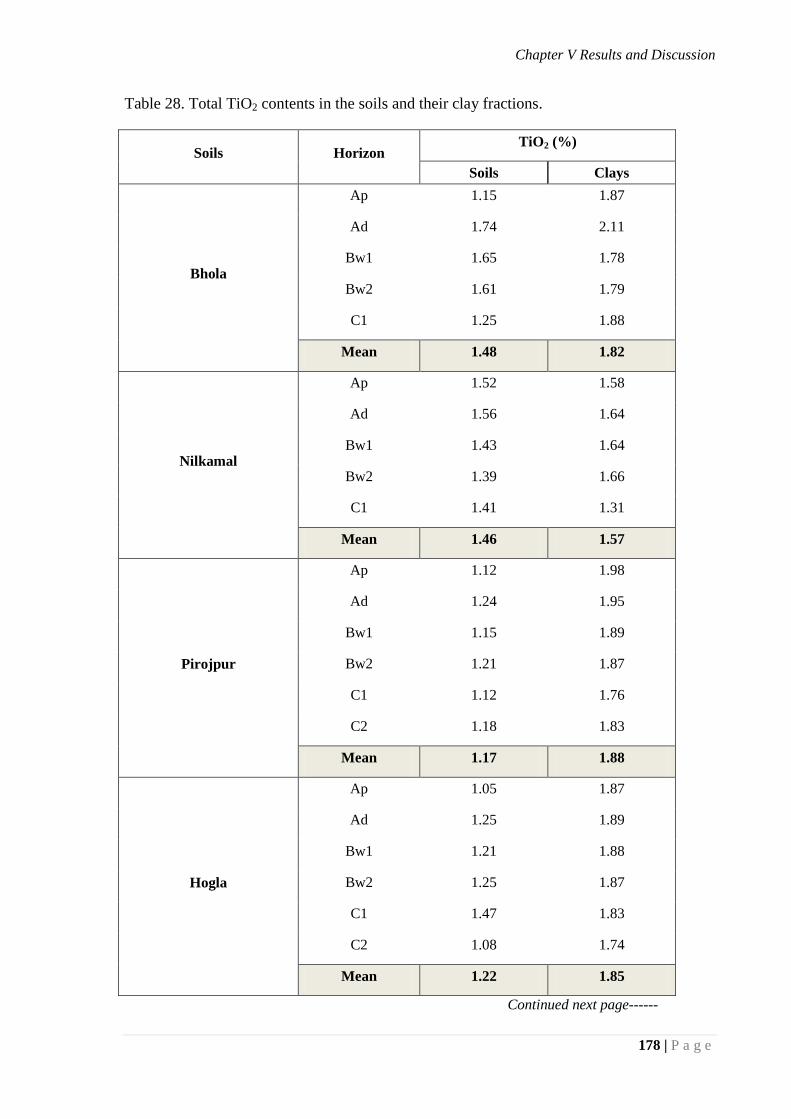
Chapter V Results and Discussion
178 | P a g e
Table 28. Total TiO2 contents in the soils and their clay fractions.
Soils Horizon TiO2 (%)
Soils Clays
Bhola
Ap 1.15 1.87
Ad 1.74 2.11
Bw1 1.65 1.78
Bw2 1.61 1.79
C1 1.25 1.88
Mean 1.48 1.82
Nilkamal
Ap 1.52 1.58
Ad 1.56 1.64
Bw1 1.43 1.64
Bw2 1.39 1.66
C1 1.41 1.31
Mean 1.46 1.57
Pirojpur
Ap 1.12 1.98
Ad 1.24 1.95
Bw1 1.15 1.89
Bw2 1.21 1.87
C1 1.12 1.76
C2 1.18 1.83
Mean 1.17 1.88
Hogla
Ap 1.05 1.87
Ad 1.25 1.89
Bw1 1.21 1.88
Bw2 1.25 1.87
C1 1.47 1.83
C2 1.08 1.74
Mean 1.22 1.85
Continued next page------
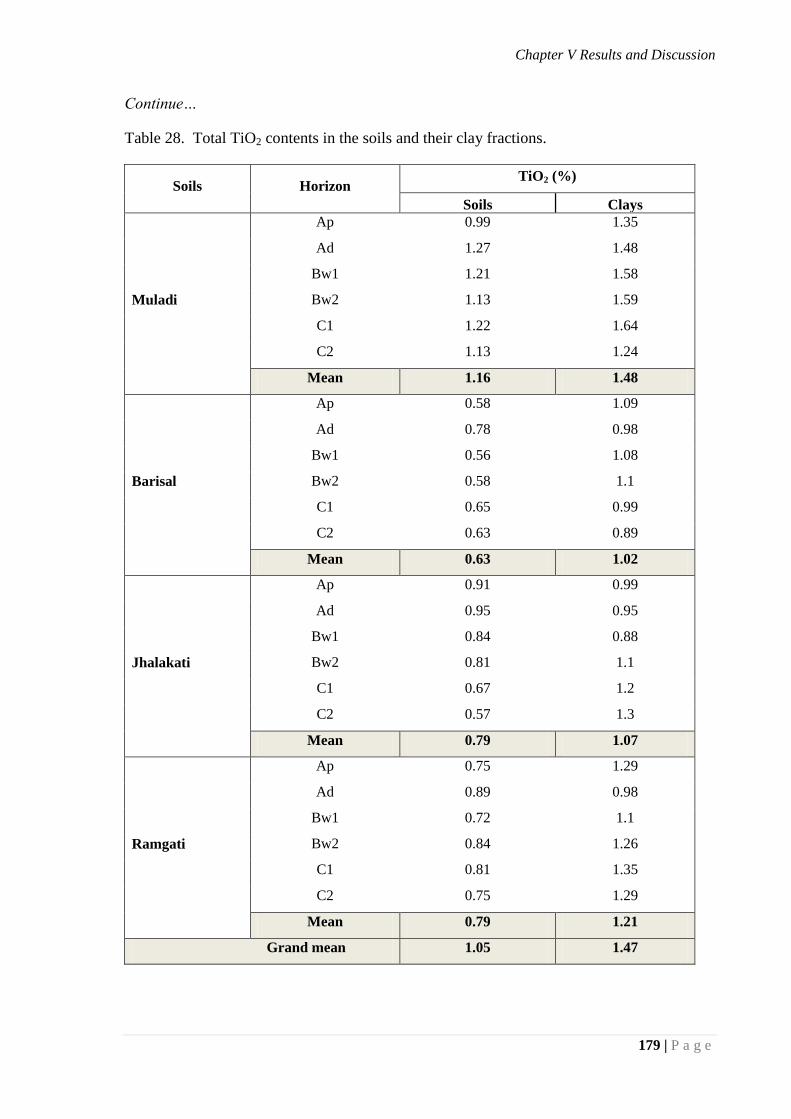
Chapter V Results and Discussion
179 | P a g e
Continue…
Table 28. Total TiO2 contents in the soils and their clay fractions.
Soils Horizon TiO2 (%)
Soils Clays
Muladi
Ap 0.99 1.35
Ad 1.27 1.48
Bw1 1.21 1.58
Bw2 1.13 1.59
C1 1.22 1.64
C2 1.13 1.24
Mean 1.16 1.48
Barisal
Ap 0.58 1.09
Ad 0.78 0.98
Bw1 0.56 1.08
Bw2 0.58 1.1
C1 0.65 0.99
C2 0.63 0.89
Mean 0.63 1.02
Jhalakati
Ap 0.91 0.99
Ad 0.95 0.95
Bw1 0.84 0.88
Bw2 0.81 1.1
C1 0.67 1.2
C2 0.57 1.3
Mean 0.79 1.07
Ramgati
Ap 0.75 1.29
Ad 0.89 0.98
Bw1 0.72 1.1
Bw2 0.84 1.26
C1 0.81 1.35
C2 0.75 1.29
Mean 0.79 1.21
Grand mean 1.05 1.47

Chapter V Results and Discussion
180 | P a g e
The irregular distribution of titanium oxide in the clay fraction indicates that the
parent material is the possible source of this element in the soils. The variation in titanium
content suggests heterogeneity and stratification of parent material in these soils (Smith and
Wilding, 1972; Sharma and Dev, 1985).
5.12 Mineralogical composition of clay fraction ( 2µm)
5.12.1 X-ray diffraction (XRD) analysis of clay fraction
The X-ray diffractograms (XRD) of clay fractions of the studied soils are presented
in Figures 78- 85. The quantity of clay minerals in the clay fraction was determined semi -
quantitatively based on peak heights and peak areas of the X-ray diffraction peaks (Johnson
et al. 1963, Egasira and Yasmin, 1990). Results of X-ray diffraction analysis are presented
in Table 33. Peaks are generally sharp, broad that indicating good crystallnity or large
crystal size of the minerals. Illite was the dominant mineral in the clay fraction of Muladi,
Barisal, Jhalakati and Ramgati soils whereas the other soils had mixed mineralogical
compositions consisting of mica, smectite, chlorite, kaolinite and trace amount of
vermiculite. A significant proportion of smctite was found in the clay fraction of Pirojpur
soil.
Fig 75. Graph shows the mean value of TiO2 in whole soil and clay
fraction of the soil under study.
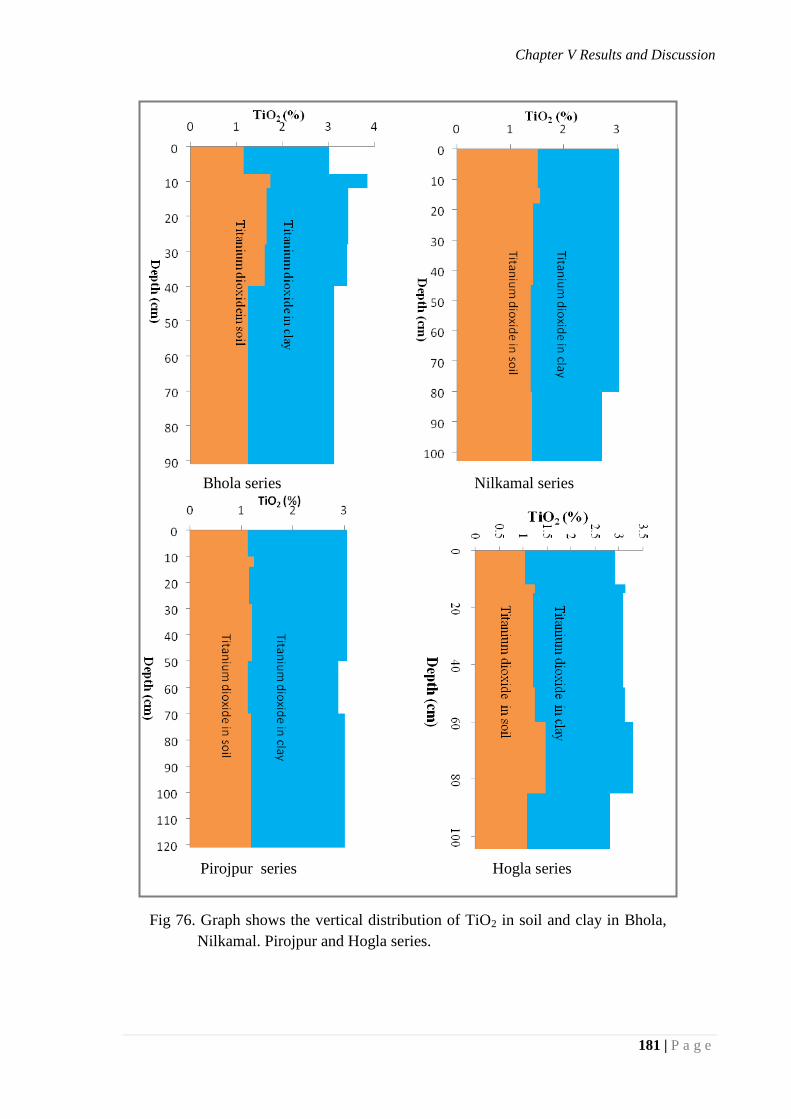
Chapter V Results and Discussion
181 | P a g e
Fig 76. Graph shows the vertical distribution of TiO2 in soil and clay in Bhola,
Nilkamal. Pirojpur and Hogla series.
Bhola series Nilkamal series
Pirojpur series
Hogla series
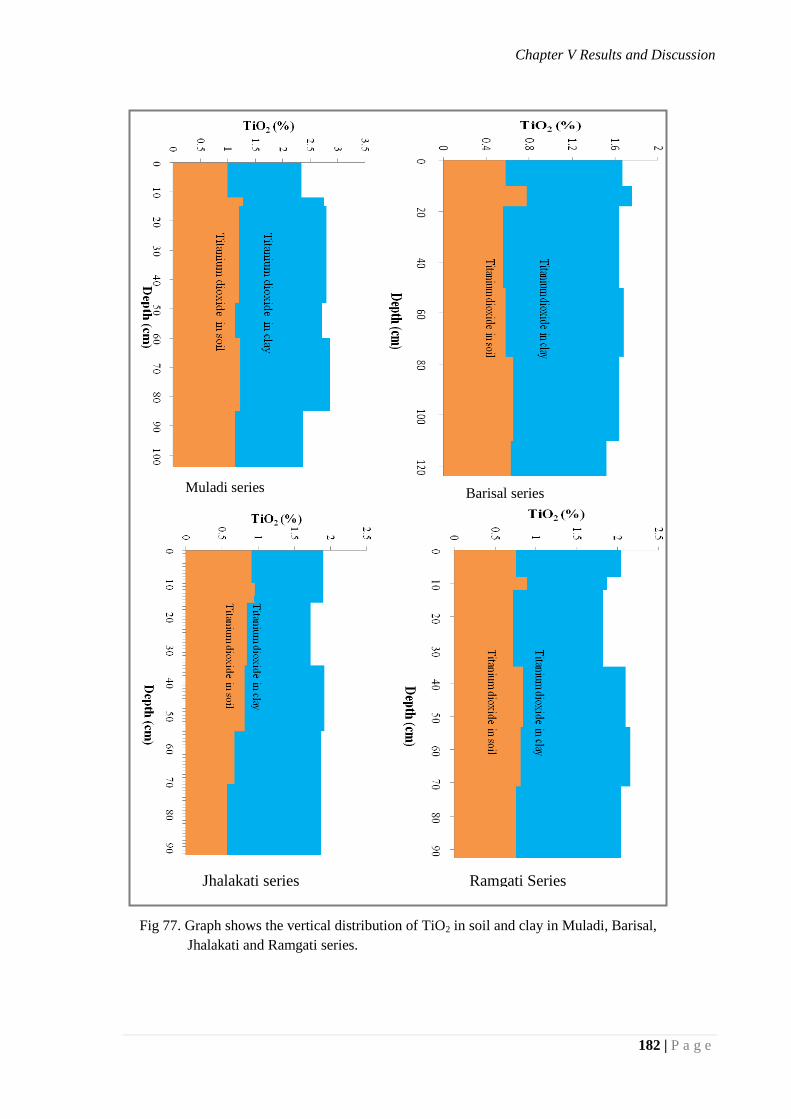
Chapter V Results and Discussion
182 | P a g e
Fig 77. Graph shows the vertical distribution of TiO2 in soil and clay in Muladi, Barisal,
Jhalakati and Ramgati series.
Muladi series Barisal series
Jhalakati series Ramgati Series
Chapter V Results and Discussion
183 | P a g e
This results are in accord with the findings of White (1985), Hassan and Razzaq
(1981), Hussain et al. (1989); Egashira and Yasmin, 1990; Alam et al. 1993; Moslehuddin
and Egashira, 1996)
Begum (1996) studied on some soils from the coastal area of Bangladesh (Bhola
district) and reported that presence of considerable quantity of smectite mineral in the clay
fraction of the soils there. Quartz was found in relatively smaller amounts but vermiculite
was not detected in these soils.
Moslehuddin et al. (1998a) studied the mineralogy of two soils of Meghna Estuarine
Floodplain soil and found that mica, smectite and chlorite present in good proportion with
small amounts of kaolinite and vermiculite minerals. They supposed that the soils of Young
Meghna Estuarine Floodplain were originated from the Ganges sediment mainly, with
admixture of the Brahamaputra (Jamuna) and Meghna sediments and assumed that these
regions have mica- smectite suite. They also opined that due to decalcification of Ganges
sediments and/ or admixture of the Brahamaputra and Meghna sediments, smectite may not
always be a dominant mineral and chlorite may be present in high proportions. Mica-
smectite suite and vermiculite were not found in the studied soils. Presence of high chlorite
along with less dominance of smectite indicates contribution of Meghna/ Old Brahamaputra
sediments over the Ganges sediments in these soils. Akter et al. (2015) found the similar
results and stated that variation in the mineralogical composition was supposed to be
attributed from the difference in the proportion of parent sediments from the major Rivers
of Bangladesh.
The presence of mica and vermiculite in the studied soils indicates that the
transformation of mica to vermiculite has taken place in some soil and some soils are not
due to the congenial atmosphere of weathering. Ali (1994) also indicated that this type of
transformation of minerals in the alluvial soils is differing likely. The transformation of
mica to vermiculite during pedogenesis has also been described by Jackson (1965) and
many investigators.
According to Eaqub (1985) the transformation of micas to expandable 2:1 minerals
may be represented by the following equation.
Mica Hydrous mica Illite Transitional minerals (Smectite, Vermiculite)
K content decreases (11.0 % K2O)
(5.5% K2O) 0.02 %( K2O)
Fanning and Keramidas (1977) pointed out that mica in most soils originate mainly
from soil parent materials and tend to weather to other minerals with time. They generally
are more prevalent in the clay mineralogy of younger and less weathered soils (Entisols,
Chapter V Results and Discussion
184 | P a g e
Inceptisols, and Alfisols). Also, Micas tend to occur more as discrete mica particles in the
less weathered soils, if such particles are present in the soil parent material, whereas in more
weathered materials the mica is more commonly interstratified with expansible 2:1
minerals that may also be partially chloritized ( Jackson et al. 1952 ; Jackson, 1964).
The clay minerals present in the studied soils appeared to be mainly inherited from
their parent materials, although some in situ transformations might possibly have taken
place (Ali, 1994; Saheed and Hussain, 1996). The above facts also indicate that the clay
minerals in the studied soil profiles under their existing pedochemical environment are quite
persistent and stable. The relatively high pH and high percent base saturation of the soils
under the present investigation appear to be congenial for thepr existence.
Saheed and Hussain (1992) reported that clay minerals in the floodplain soils of
Bangladesh have been derived exclusively from their parent materials. They commented
that neosynthesis of smectites is believed to be possible in the calcarious Gangetic alluvium
because the chemical environment is suitable for their formation.
Moslehuddin et al. (1996) also studied mineralogical composition of some paddy
soils of Bangladesh and noted that the clay fraction in the floodplain soils contained
relatively higher quantity of mica as compared to that of the terrace soils.
An admixture of mica, vermiculite, smectite, chlorite and kaolinite in the clay
fraction of the studied soils may be considered as a boon as the soils with such mixed clay
mineralogy will not show any extreme physical property. With such a combination of clay
mineralogical composition the soils are expected to demonstrate the physical properties
quite ideal for agricultural management.
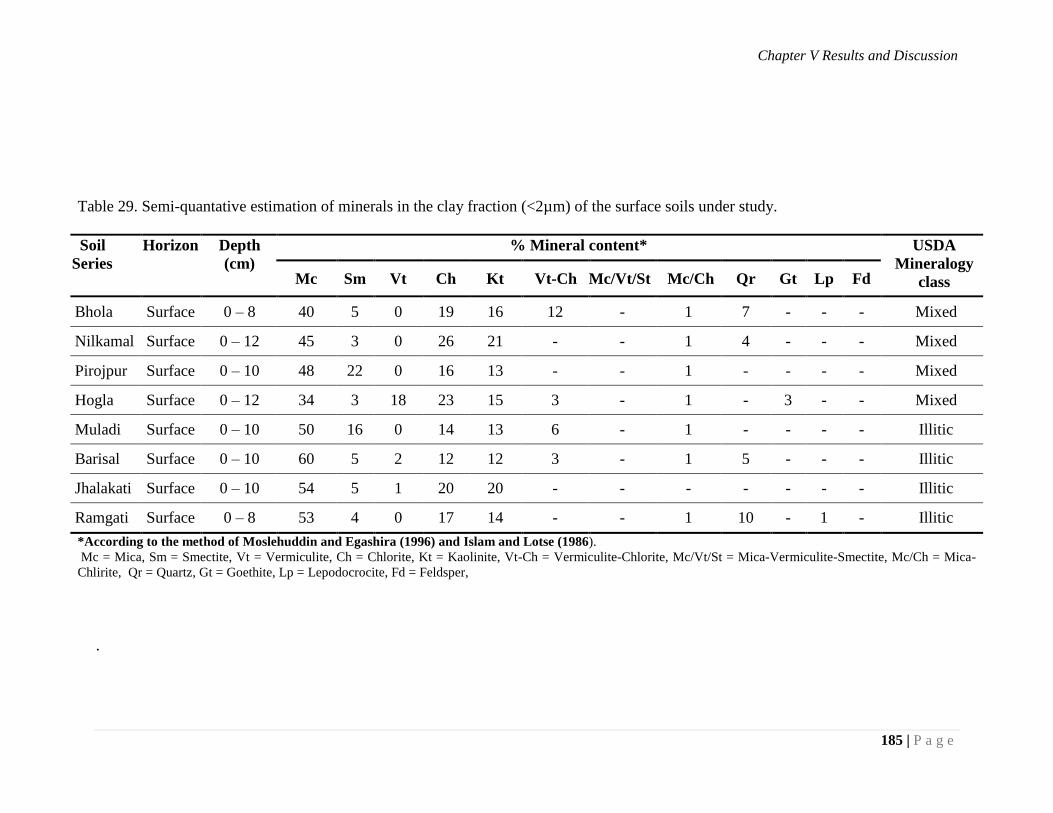
Chapter V Results and Discussion
185 | P a g e
Table 29. Semi-quantative estimation of minerals in the clay fraction (<2µm) of the surface soils under study.
Soil
Series
Horizon Depth
(cm)
% Mineral content* USDA
Mineralogy
class Mc Sm Vt Ch Kt Vt-Ch Mc/Vt/St Mc/Ch Qr Gt Lp Fd
Bhola Surface 0 – 8 40 5 0 19 16 12 - 1 7 - - - Mixed
Nilkamal Surface 0 – 12 45 3 0 26 21 - - 1 4 - - - Mixed
Pirojpur Surface 0 – 10 48 22 0 16 13 - - 1 - - - - Mixed
Hogla Surface 0 – 12 34 3 18 23 15 3 - 1 - 3 - - Mixed
Muladi Surface 0 – 10 50 16 0 14 13 6 - 1 - - - - Illitic
Barisal Surface 0 – 10 60 5 2 12 12 3 - 1 5 - - - Illitic
Jhalakati Surface 0 – 10 54 5 1 20 20 - - - - - - - Illitic
Ramgati Surface 0 – 8 53 4 0 17 14 - - 1 10 - 1 - Illitic
*According to the method of Moslehuddin and Egashira (1996) and Islam and Lotse (1986).
Mc = Mica, Sm = Smectite, Vt = Vermiculite, Ch = Chlorite, Kt = Kaolinite, Vt-Ch = Vermiculite-Chlorite, Mc/Vt/St = Mica-Vermiculite-Smectite, Mc/Ch = Mica-
Chlirite, Qr = Quartz, Gt = Goethite, Lp = Lepodocrocite, Fd = Feldsper,
.
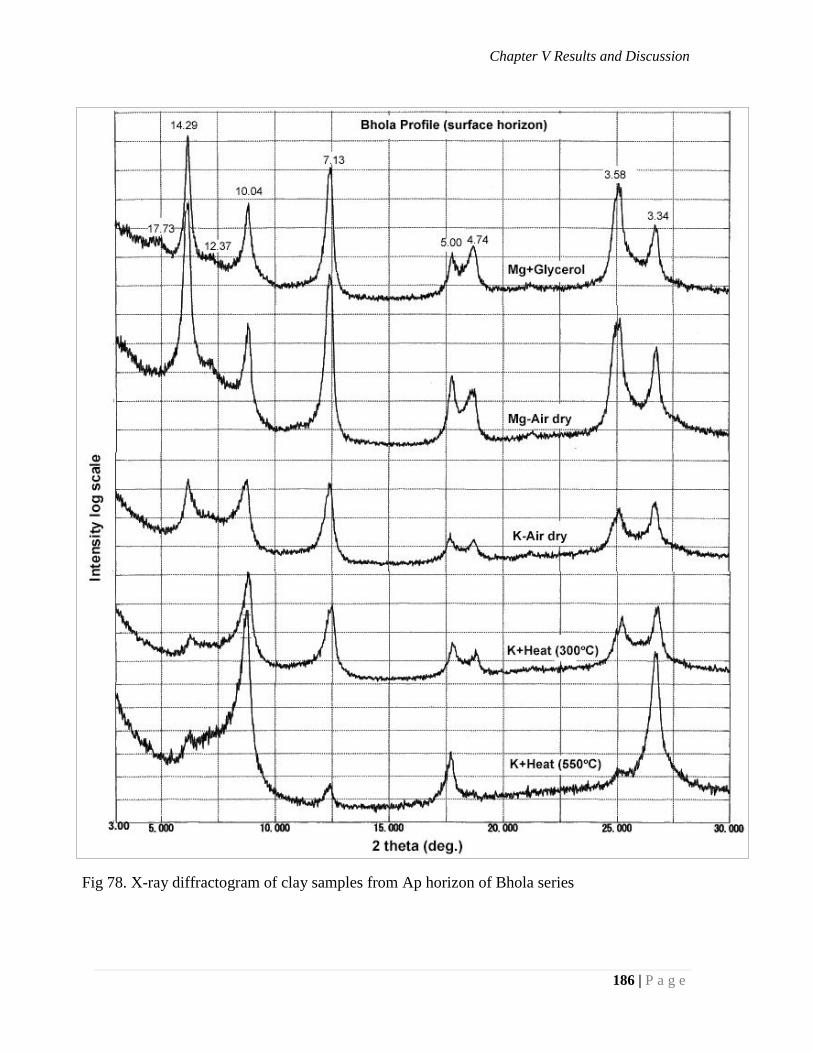
Chapter V Results and Discussion
186 | P a g e
Fig 78. X-ray diffractogram of clay samples from Ap horizon of Bhola series
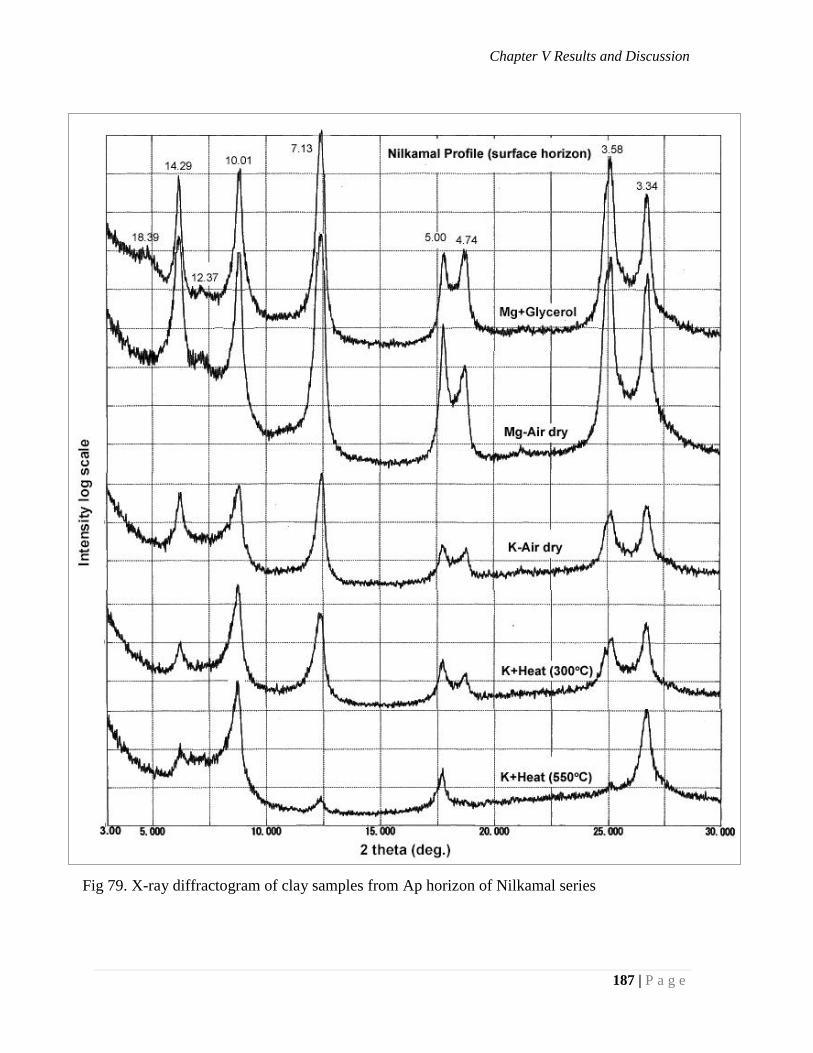
Chapter V Results and Discussion
187 | P a g e
Fig 79. X-ray diffractogram of clay samples from Ap horizon of Nilkamal series
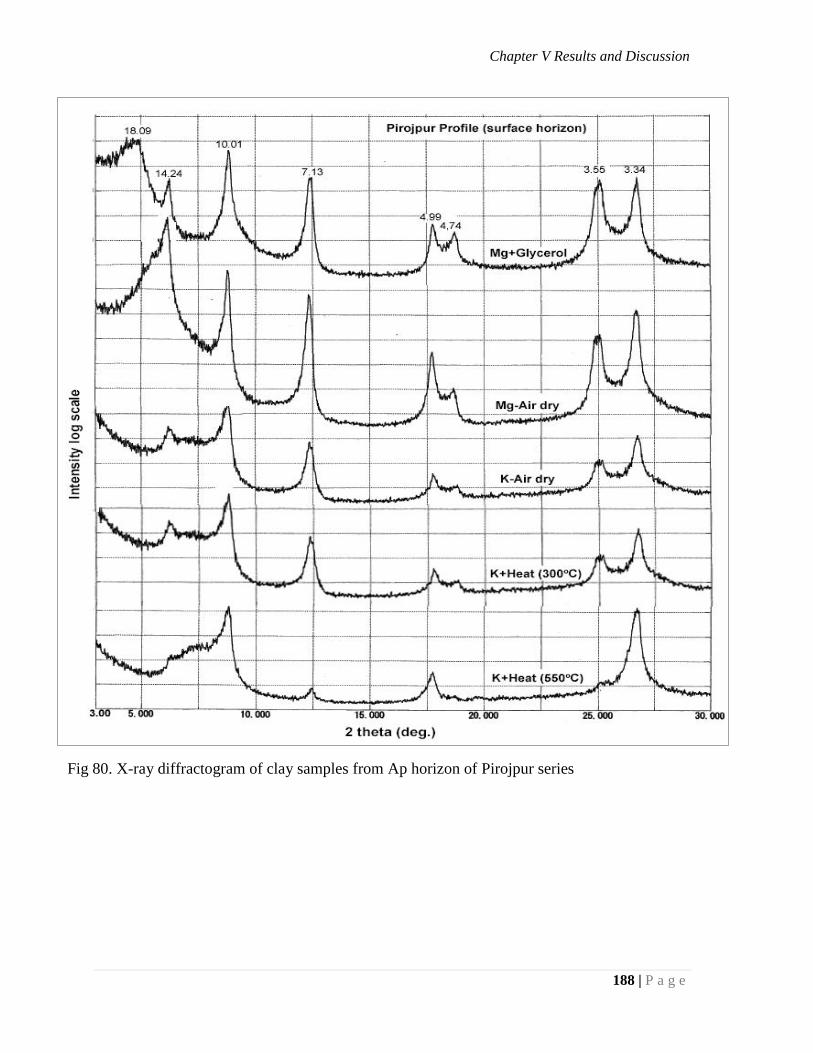
Chapter V Results and Discussion
188 | P a g e
Fig 80. X-ray diffractogram of clay samples from Ap horizon of Pirojpur series
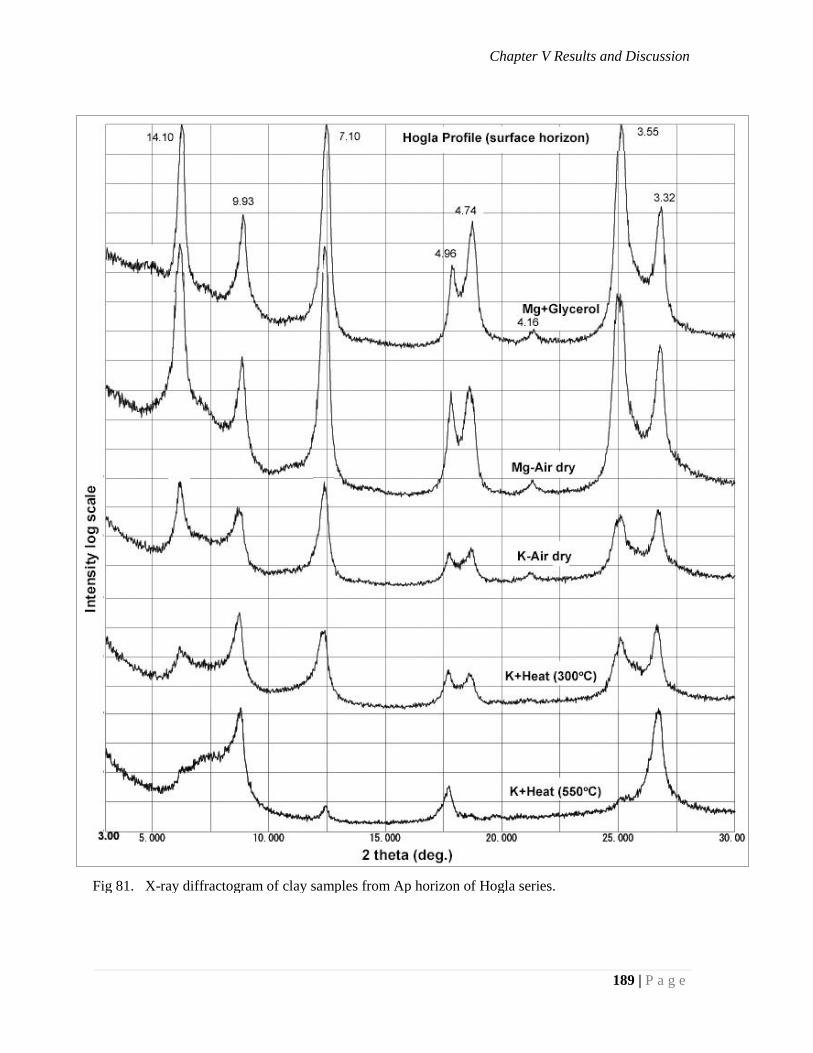
Chapter V Results and Discussion
189 | P a g e
Fig 81. X-ray diffractogram of clay samples from Ap horizon of Hogla series.
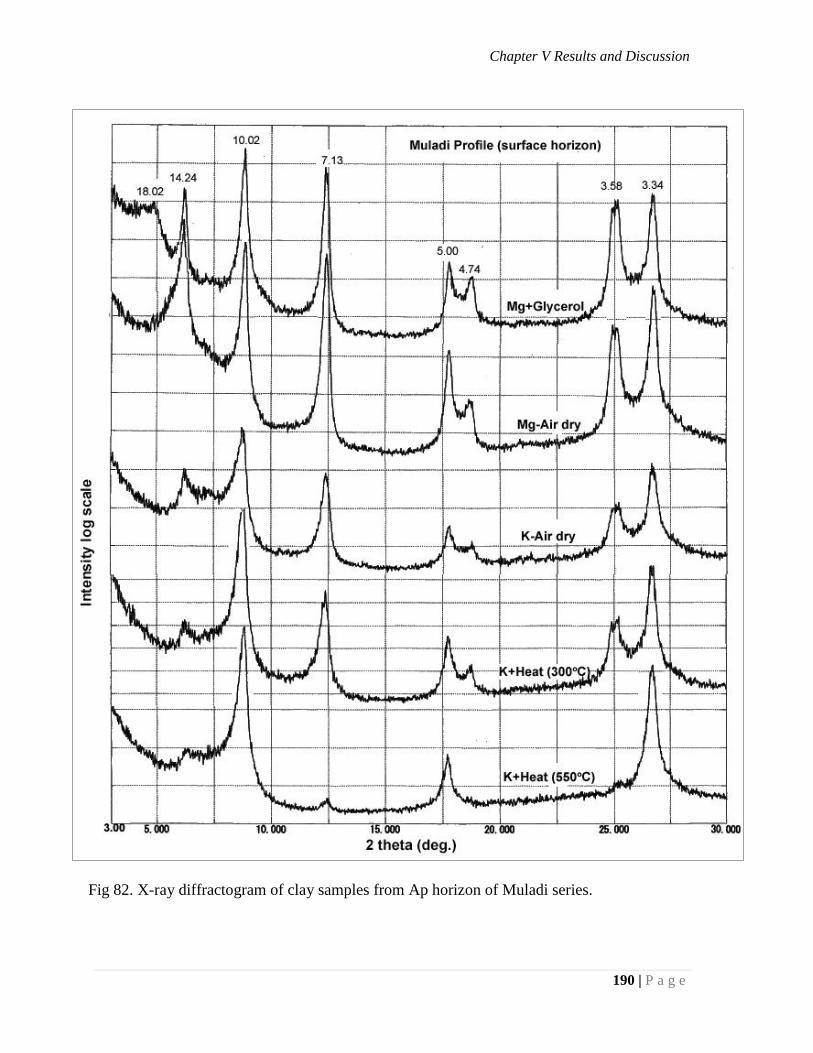
Chapter V Results and Discussion
190 | P a g e
Fig 82. X-ray diffractogram of clay samples from Ap horizon of Muladi series.
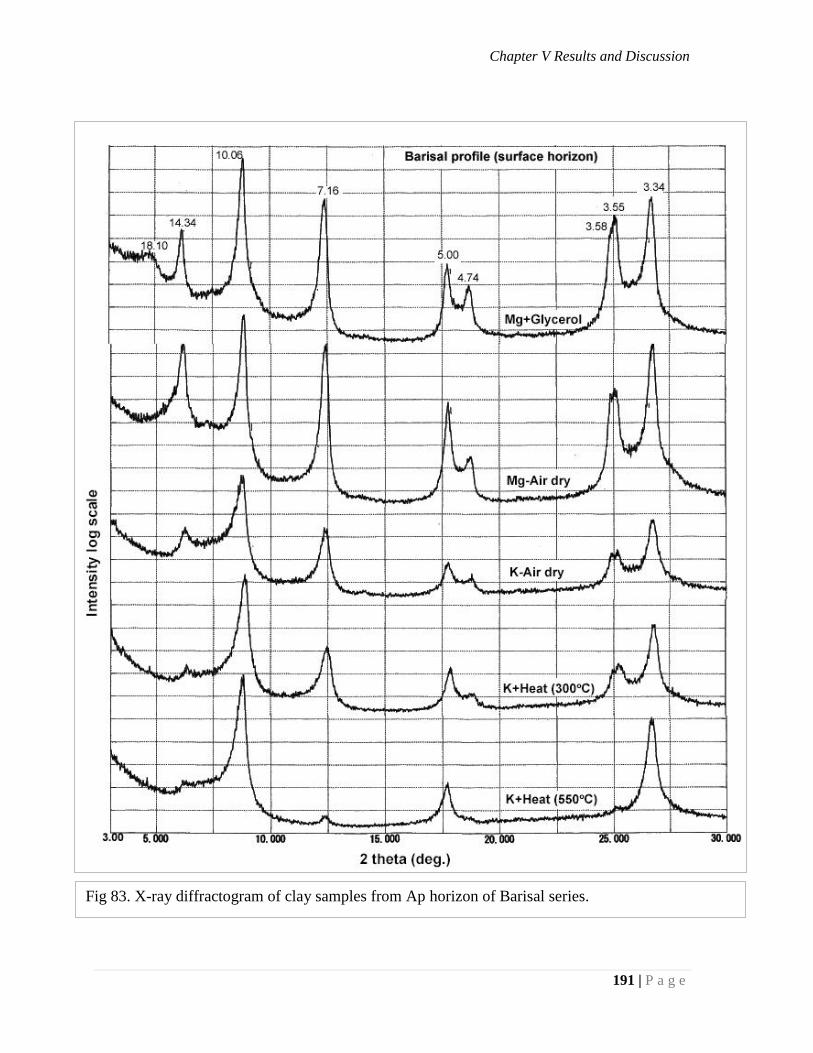
Chapter V Results and Discussion
191 | P a g e
Fig 83. X-ray diffractogram of clay samples from Ap horizon of Barisal series.
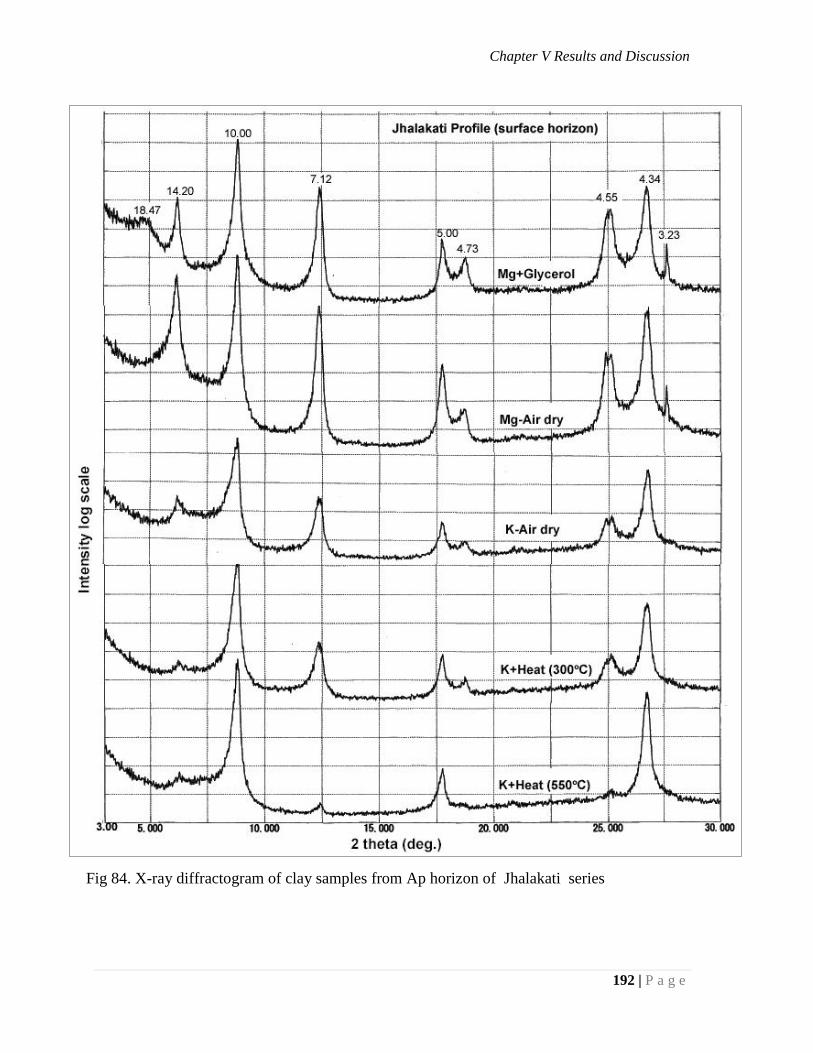
Chapter V Results and Discussion
192 | P a g e
Fig 84. X-ray diffractogram of clay samples from Ap horizon of Jhalakati series
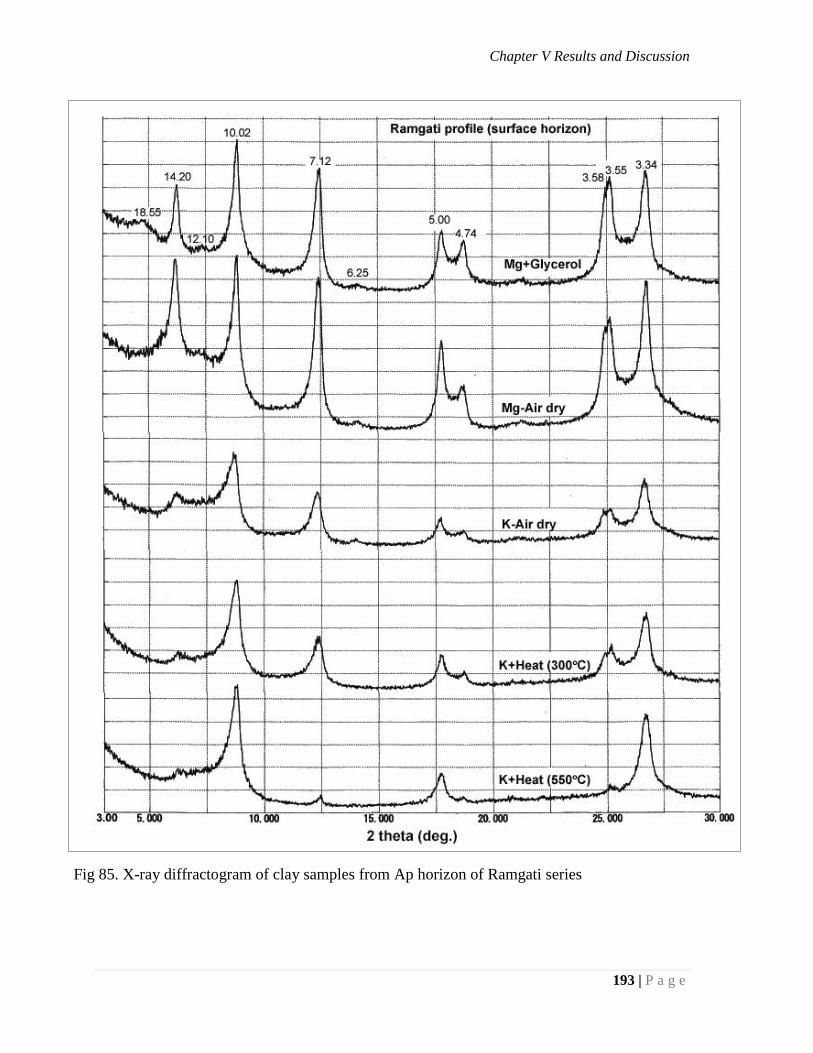
Chapter V Results and Discussion
193 | P a g e
Fig 85. X-ray diffractogram of clay samples from Ap horizon of Ramgati series
CHAPTER-6
GENESIS OF THE SOILS UNDER
INVESTIGATION
Chapter VI Genesis and classification
194 | P a g e
CHAPTER – 6
GENESIS AND CLASSIFICATION OF THE SOILS
6.1 Genesis of the soils
On the basis of information obtained from the field and laboratory studies, an
attempt has been made to look into the pedogenic processes that are operating in these soils
and also into their classification according to the USDA Soil Taxonomy and the other
system (WRB, 2015) of soil classification.
In consideration of the geological history, the area wherefrom the soils have
originated, may be considered to be of recent age. The environmental, morphological,
physical, chemical and mineralogical properties of these soils indicate clearly that the parent
material of the studied soils were alluvial deposits of mixed origin. Profile characteristics of
these soils indicate that their development did not proceed far. All the soils under
investigation appear to be weakly developed. This may be due to the short duration and the
annual siltation that take place during flooding period. The soils may, therefore, be
reasonably considered to be in tits incipient stage of development.
The parent materials and the prevailing environmental conditions like the poor
drainage and aquic moisture regime due to submergence during the rainy season are
probably the factors affecting the development of the soils and are responsible for the
formation of the morphological properties of the soils. Since the soils are at their youthful
stage presumably, the parent materials will play a dominant role in exhibiting the properties
of the soils. Since the soils are located in the basin and basin - margin and ridge sites and
are poorly drained, create a situation not conducive for normal soil development. The direct
consequence of poor internal drainage is the retardation of leaching and little alteration of
soil materials. Moreover, the soils have been under cultivation for a long time and thus
disturbed the normal pedological processes and helped in the mechanical translocation of
finer fractions downward forming the plough pan and the flood coatings. The finer fraction
blocked the pore space and restricted the movement of the products of weathering.
Seasonal submergence and drying set the condition of alternate oxidation –
reduction in the soils. The elements susceptible to oxidation- reduction conditions would
respond readily and eventually would impart certain characteristics like mottles to the soil.
The soil reactions (pH) closely follow the course of oxidation- reduction conditions as
because the soils contain considerable amount of Fe and Mn which are subject to change.
The grey tinges of the soils are probably due to the above said conditions. Another
interesting feature of these soils are the presence of mottling of yellow or brown colours
Chapter VI Genesis and classification
195 | P a g e
usually along the old root channels and pores. The horizons containing the variously
coloured mottling may be considered as evidence of weak type of gleization process.
In most of the soils, alternate wet and dry conditions produce vertical cracks leading
to big prism. With the passage of time, the horizontal cracks and combined effect of
flocculation, root penetration, organic matter addition and the biotic activity produces
blocky structure. Translocation of finer materials from the top through the cracks along with
the first flood water made the structural aggregate more conspicuous.
The development of coating along the ped faces, fissures and pores in the sub-soil
are the typical characteristics of these soils. These coatings are not equivalent to true clay
skins but are flood coatings as called by Brammer, 1971. They appear to have developed
rapidly from the materials that were taken down from the surface under flooded condition.
Plough pan is a soil layer compacted by tillage and occurs below 5 to 15 cm from
the surface of the soil depending on the normal depth of ploughing . It is mainly formed due
to continuous wetland rice cultivation (FAO, 1971; Brammer, 1979). It becomes thicker and
harder through continuous practice of transplanted rice cultivation. Plough pan was found to
develop 3 to 7 cm thick in the studied soils. The ploughpan prevent vertical water
percolation, restricts aeration as well as root penetration (Brammer, 1971).
The vertical distribution of sand, silt and clay of these soils support the assumption
that the parent materials of the soils were of mixed origin. The annual deposition of silts by
flooding affects the existing pedogenic processes by cumulization effect. The soil profiles
with weak to moderate prismatic to angular blocky structure suggest the formation of
altered B horizon (Cambic) in all the soils. However all the soils in the surface horizons
have massive structure.
In each soil profile, there is a trend of increasing pH with depth. Nevertheless, in all
the soils the surface horizons have acidic reaction. The surface soil acidification is due to
the alternate oxidation reduction cycles in the floodplain areas ( Brammer, 1971).
The colloidal complex of the soils is also well supplied with exchangeable metal
ions. The base saturation increases gradually with depth and calcium and magnesium
dominant the exchange complex. Exchangeable Ca++
/Mg++
ratio is less than 1. It may be
noted here that under hydromorphic conditions this ratio tends to be low (Joffe, 1968).
X-ray diffraction analysis indicates the dominance of non-expanding types of minerals in
the clay fraction. Cracking, as a result, is usually weak.
The silica-sesquioxide ratio in the clay fraction indicates the presence of a
considerable amount of 2:1 lattice type clay minerals which might be an admixture of a
variable amount of mica and illitic mica. Alteration of mica to illitic mica may be a common
Chapter VI Genesis and classification
196 | P a g e
pedochemical weathering processes in the soils under investigation. It is of interest to note
that a low to medium quantity of smetite has been detected in all the pedons.
Vertical distribution of clay in all the soil profiles indicates an impoverishment of
clay in the surface horizons. This low clay near the soil surface may be for two reasons. It
may be because of stratification or there may be destruction of clay near the surface because
of the ferolysis process. Quantity of chlorite is high in the surface horizon of this pedon.
From the characteristics discussed in the preceding paragraphs it appears that the
soils under investigation are likely to be generally designated as hydromorphic in nature.
However the absence of well developed gley horizons in these soils may lead to doubt about
the true hydromophic nature of these soils. Nevertheless, it may be worthwhile to mention
that the very weak gley horizons represented by the occurrence of mottles, low
exchangeable Ca++
/ Mg++
ratio, massive structure in the top soil and structurelessness in the
lowermost horizon of these soils also support this fact. Weak type of gleization seems to be
a process of soil formation in all these soils.
Hossain et al. (2011) suggests that gleization seems to be the dominant pedogenic
processes in the floodplain soils of Bangladesh.
Albretch (1941) reported that gleization occurs in the zone of soils, where the three
factors, such as high base saturation with ample calcium and magnesium, organic matter
infiltration and poor drainage operate jointly for anaerobiosis. This was later on supported
by many other authors (Bloomfield 1959; Nizamuddin et al. (2009b); Khan et al. (2012).
In conclusion it may be said that the soils developed under study show the necessary
marks of gleying in their body. Several rivers are passing through the coastal zone. These
rivers carry huge amount of sediments and water. Part of these sediments continuously
hampers the pedogenic processes of these soils. The groundwater fluctuates considerably
with the season in all the profiles. As groundwater influences strongly in the studied soils,
the groundwater gley soils are developed and gleization, therefore, is thought to be a
process of soil formation in them. Parent materials of mixed origin which are at their
incipient stage played a dominant role in the evolution of genetic processes that have taken
place in the studied soils.
6.2 Classification of the soils
An endeavor has been made in this section to classify the soils on the basis of the
available information. Relevant properties of these soils were matched with the criteria set
out in the USDA Soil Taxonomy (Soil Survey Staff 1975 and 2014). In the present
investigation, one of the important objectives was to classify the studied soils in the US Soil
Taxonomy. As evident from the results of morphological, physical, chemical and
mineralogical properties of the studied soil profiles as presented in chapter 4 and 5 revealed
Chapter VI Genesis and classification
197 | P a g e
that there was a variation in surface and sub-surface colors, texture, structure, pH, calcium
carbonate, exchangeable bases, base saturation percentage, effervescence, total analysis
results of whole soil and clay and clay mineralogical composition. The variation of the
above properties in the profiles was considered very important in differentiating the soils
into the various orders, suborders, great groups, subgroups, and families’ level of US Soil
Taxonomy. The studied soil series from the Ganges River Floodplain (Muladi), Young
Meghna Estuarine Floodplain (Bhola, Nilkamal) and Ganges River Tidal floodplain
(Pirojpur, Hogla, Barisal, Jhalakati, Ramgati) have been characterized on the basis of the
results presented in Table 30.
Results presented in the above table show that structures (prismatic to angular
blocky) have developed in the sub-soils of all the studied profiles which indicates the
destruction of alluvial stratification and their alteration. It has already been pointed out in
the former chapters that these soils are not bestowed with well formed structures in the top
soil. Burried horizons were found in the Pirojpur and Hogla soil. This indicates the two
sequence nature of the soil. Occurrence of variously colored mottles along root channels is
another persisting feature in all the soils. The leaching loss of CaCO3, exchangeable bases
and sesquioxides from the surface to the underlying horizons and the gradual decrease of
organic carbon from the upper layers to the lower layers proved alteration in these soil
profiles. Hence it was assumed that cambic B horizon has developed in all the studied
profiles. Hence, all the soils under study may be placed in the Inceptisols order (Soil Survey
Staff, 1975 and 1994).
Soils belonging to the Inceptisol order are subdivided into suborders on the basis of
soil moisture regime, and some other extreme physical and chemical properties. Since these
soils have developed under seasonally flooded conditions therefore the aquic soil moisture
regime occurs in these soils. At the suborder level all the soils are designated as Aquepts .
Considering the moisture regime as the basis, the soils belonging to Aquepts
suborder may be placed into the Endoaquepts great group because of endo saturation
At the sub group level the soils of Bhola, Nilkamal, Muladi, Barisal, Jhalakhati and
Ramgati series may be suit into the Typic Endoaquepts as they have 50% or more matrix
colour chroma ≤ 2 within 75 cm depth and have no extreme properties or irregular trend of
organic matter. The soils of Pirojpur and Hogla series may be designated as Fluventic
Endoaquepts due to their irregular trend of organic matter from top to bottom in the soil
profiles. Climatologically all the studied soils have “Hyperthermic” temperature regime
(Table 30).
On the basis of the soil reaction, most of the studied soils can be placed under the
nonacid class except Nilkamal and Muladi soil. Nilkamal and Muladi soils are calcareous
and alkaline in reaction.
Chapter VI Genesis and classification
198 | P a g e
Clay mineralogical study indicates that Muladi, Barisal, Jhalakati and Ramgati soils
have illitic mineralogy class as mica is the dominant clay minerals constituting more than
50 percent. On the other hand Bhola, Nilkamal, Pirojpur and Hogla soils have mixed
mineralogy class as they do not have more than 50 percent of any particular type of clay
mineral.
On the basis of particle size distribution in the profile the Pirojpur, Hogla and
Barisal series are classed as clayey while the Bhola, Nilkamal, Muladi, Jhalakati and
Ramgati series are classed as loamy.
Therefore, on the basis of texture, soil reaction, temperature regimes and clay
mineralogical composition the soils have been classed into six soil families of US Soil
Taxonomy (Table 31).
Soils of coastal zone of Bangladesh have not been classified earlier at the family
level of Soil Taxonomy because of lack of mineralogical data (SRDI Staff, 1965- 86).
Zijsvelt (1980) characterized the 476 soil series of Bangladesh into Taxonomic soil family
on the basis of assumptions as soils formed on the alluvia deposited by the rivers except the
Ganges having a mixed mineralogy while Gangetic alluvium assumed to have
montmorillonitic mineralogy. Soils formed on Tertiary hills and Pleistocene terraces
assumed to have kaolinitic type.
Lastly an attempt has been made to correlate the studied soils with the World
Reference Base (WRB) system of soil classification. The World Reference Base (WRB)
(WRB) is the international standard classification system endorsed by the International
Union of Soil Sciences (IUSS). According to WRB system, 2015 it may be stated that all
the studied soils may be classed into Gleysols Groups because these soils having gleyic
properties within 50 cm from the soil surface.
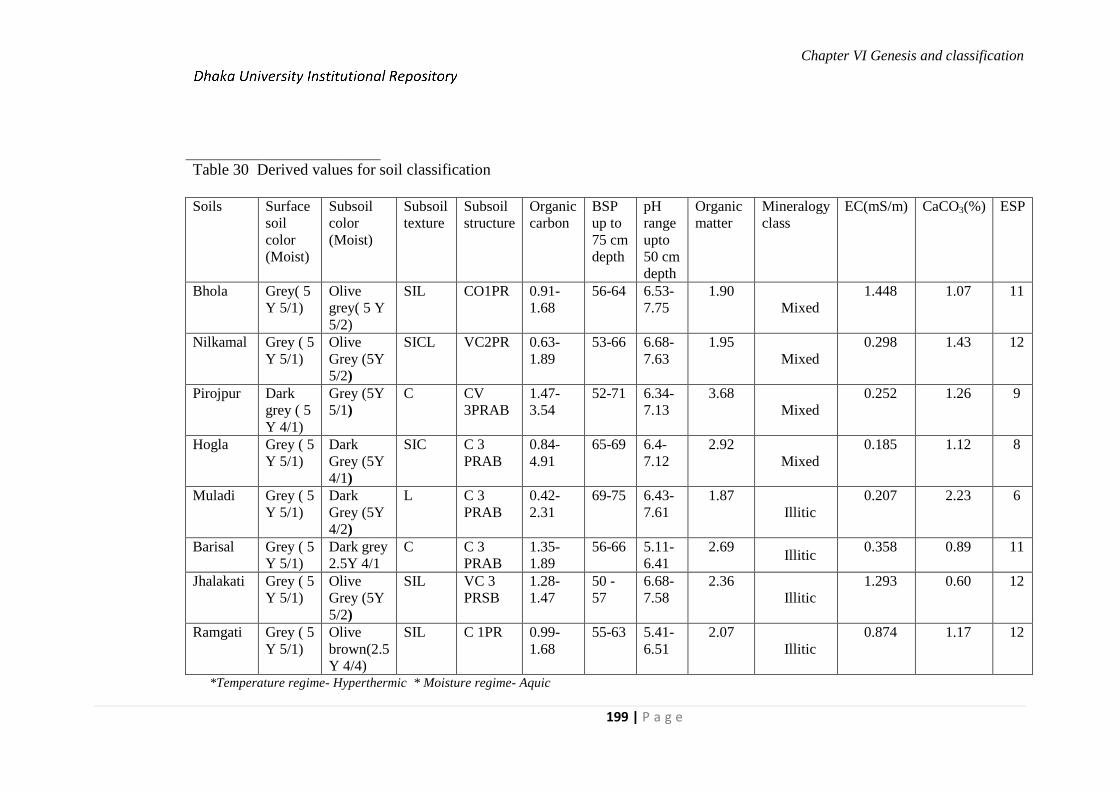
Chapter VI Genesis and classification
199 | P a g e
Table 30 Derived values for soil classification
Soils Surface
soil
color
(Moist)
Subsoil
color
(Moist)
Subsoil
texture
Subsoil
structure
Organic
carbon
BSP
up to
75 cm
depth
pH
range
upto
50 cm
depth
Organic
matter
Mineralogy
class
EC(mS/m) CaCO3(%) ESP
Bhola Grey( 5
Y 5/1)
Olive
grey( 5 Y
5/2)
SIL CO1PR 0.91-
1.68
56-64 6.53-
7.75
1.90
Mixed
1.448 1.07 11
Nilkamal Grey ( 5
Y 5/1)
Olive
Grey (5Y
5/2)
SICL VC2PR 0.63-
1.89
53-66 6.68-
7.63
1.95
Mixed
0.298 1.43 12
Pirojpur Dark
grey ( 5
Y 4/1)
Grey (5Y
5/1)
C CV
3PRAB
1.47-
3.54
52-71 6.34-
7.13
3.68
Mixed
0.252 1.26 9
Hogla Grey ( 5
Y 5/1)
Dark
Grey (5Y
4/1)
SIC C 3
PRAB
0.84-
4.91
65-69 6.4-
7.12
2.92
Mixed
0.185 1.12 8
Muladi Grey ( 5
Y 5/1)
Dark
Grey (5Y
4/2)
L C 3
PRAB
0.42-
2.31
69-75 6.43-
7.61
1.87
Illitic
0.207 2.23 6
Barisal Grey ( 5
Y 5/1)
Dark grey
2.5Y 4/1
C C 3
PRAB
1.35-
1.89
56-66 5.11-
6.41
2.69 Illitic
0.358 0.89 11
Jhalakati Grey ( 5
Y 5/1)
Olive
Grey (5Y
5/2)
SIL VC 3
PRSB
1.28-
1.47
50 -
57
6.68-
7.58
2.36
Illitic
1.293 0.60 12
Ramgati Grey ( 5
Y 5/1)
Olive
brown(2.5
Y 4/4)
SIL C 1PR 0.99-
1.68
55-63 5.41-
6.51
2.07
Illitic
0.874 1.17 12
*Temperature regime- Hyperthermic * Moisture regime- Aquic
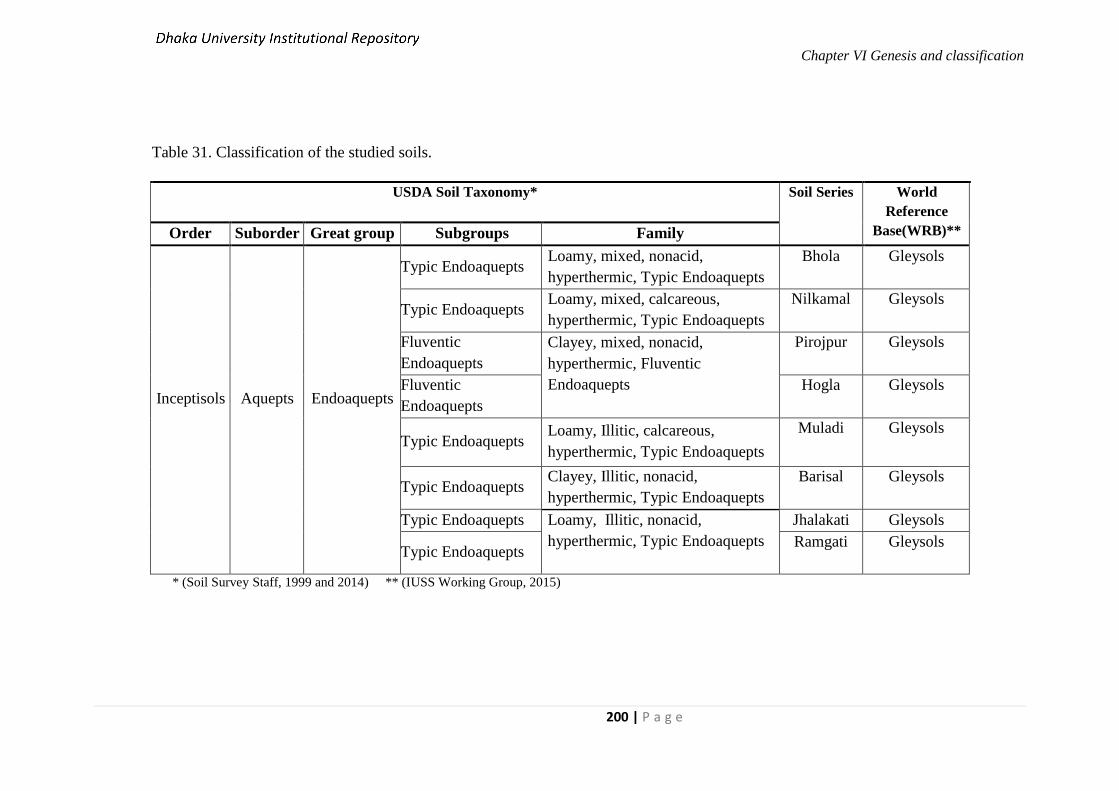
Chapter VI Genesis and classification
200 | P a g e
Table 31. Classification of the studied soils.
USDA Soil Taxonomy* Soil Series World
Reference
Base(WRB)** Order Suborder Great group Subgroups Family
Inceptisols
Aquepts
Endoaquepts
Typic Endoaquepts Loamy, mixed, nonacid,
hyperthermic, Typic Endoaquepts
Bhola Gleysols
Typic Endoaquepts Loamy, mixed, calcareous,
hyperthermic, Typic Endoaquepts
Nilkamal Gleysols
Fluventic
Endoaquepts
Clayey, mixed, nonacid,
hyperthermic, Fluventic
Endoaquepts
Pirojpur Gleysols
Fluventic
Endoaquepts
Hogla Gleysols
Typic Endoaquepts Loamy, Illitic, calcareous,
hyperthermic, Typic Endoaquepts
Muladi Gleysols
Typic Endoaquepts Clayey, Illitic, nonacid,
hyperthermic, Typic Endoaquepts
Barisal Gleysols
Typic Endoaquepts Loamy, Illitic, nonacid,
hyperthermic, Typic Endoaquepts
Jhalakati Gleysols
Typic Endoaquepts Ramgati Gleysols
* (Soil Survey Staff, 1999 and 2014) ** (IUSS Working Group, 2015)
CHAPTER-7
SUMMARY AND CONCLUSION

Chapter VII Summary and conclusion
201 | P a g e
CHAPTER – 7
SUMMARY AND CONCLUSION
Siltation pattern and pedogenesis in the coastal zone of Bangladesh were studied.
Suspended sediment load carried by the two rivers such as the Bishkhali and the Arial Khan
were measured.
Eight typical soil profile occurring in the coastal floodplain of Bangladesh, each
representing an extensive and established soil series: Bhola, Nilkamal, Pirojpur, Hogla Muladi,
Barisal, Jhalakati ,Ramgati along a transect from north to south were selected for pedogenitic
study. Pedogenic information about soils is a prerequisite for sound and sustainable land
management. Environmental settings and morphogenetic properties of the soils were studied in
the field. A total of 46 soil samples from typical genetic horizons of eight soil profiles were
collected for physical, chemical and mineralogical analyses.
A. Findings of coastal sediments may be summarized as follows:
The amounts of suspended sediment ranged from 4.10 to 13.06 kg/sq.m/month.
Sediment load is relatively higher in the wet season and lowerr in the dry season in the
Arial Khan river
Sediment load is higher in the dry season and lower in the wet season in the Bishkhali
river.
Siltation pattern varies with the season.
Silt is the dominant size fraction in the sediments of both the rivers.
Silt loam was the dominant textural class in the sediments of both the rivers.
pH of the sediments ranges from 7.7 to 8.03 and are slightly calcareous in nature.
Exchangeable Mg++
content was found higher among the exchangeable bases.
The SiO2 content in the suspended sediments of the rivers ranged from 60 to 61 percent.
The SiO2/R2O3 molar ratio in the suspended sediments indicates the presence of 2:1
type clay minerals.
B. The prominent morphological features of the soils may be summarized
as follows:
Grey matrix color is a characteristic feature of these soils. The top soils were generally
grey to dark grey in color (moist) with silt loam to silty clay textures except Pirojpur
and Barisal soils where it was clayey in the top soil.

Chapter VII Summary and conclusion
202 | P a g e
The sub-soils were generally grey to olive grey in color (moist) with silt loam to silty
clay textures except in Pirojpur and Barisal soils where it was clayey.
Flood coatings and variously colored mottles present in the sub-soil zone of all the soil
profiles.
Prismatic to sub-angular blocky structures were developed in the sub-surface horizons
of all the profiles whereas massive structure was found in the surface horizons.
Development of cambic horizon is the most notable morphogenetic feature in these
soils.
All the soil profiles showed abrupt to clear smooth horizon boundaries reflecting
rejuvenation in soil development.
Parent material of the soils is of alluvial origin with regular siltation from flooding
water of the coastal rivers. The attributes of parent material and the associated aquic soil
moisture regime dominantly influenced the genesis of these soils.
C. Some salient physical properties of the soils have been studied and the results
obtained therefore may be summarized as follows:
The sand contents in the studied soils ranged from 3 to 52 percent with the mean of 13
percent.
The silt contents in the studied soils ranged from 32 to 77 percent with the mean of 50
percent.
The clay contents in the studied soils ranged from 5 to 58 percent with the mean of 37
percent.
The irregular distribution pattern of sand, silt and clay as well as sand / silt ratio in all
the soil profiles reflected the heterogeneous nature of the parent materials from which
these soils havedeveloped.
Textural classes of the soils showed wide variation. The soils in ridge position are
concentrated silt loam to silty clay loam textural classes of textural triangle while the
basin soils are mostly silty clay to clay class of textural triangle.
Most of the soils showed higher bulk density in the Ad horizons due to compaction
resulting from ploughing for rice cultivation.
D. Results of chemical analysis of the soils under investigation may be summarized
as follows:
The pH (water) value of the studied soils ranged from 5.71 to 7.75 with a mean value of
6.97 indicating slightly acid to slightly alkaline in reaction. All ∆pH values were
Chapter VII Summary and conclusion
203 | P a g e
negative which ranged from -0.48 to -1.30 pH unit. The pH values in H2O and KCl
showed a significant positive correlation.
The electrical conductivity (EC) of all the studied soils ranged from 0.12 to 1.65 dS/m
with a mean value of 0.54 dS/m at 25○C in the 1:5 soil- water extract indicating non-
saline nature of the soils.
Organic matter content ranges from 0.72 to 8.46 percent with a mean value of 2.43
percent were detected in all the studied soils indicating moderate content and showed a
gradual decrease with depth except in Pirojpur and Hogla soils. The C/N ratio of the
soils varies from 8 to 17 with a mean value of 11. The vertical distribution pattern of
C/N ratio in the pedons is found irregular.
The total nitrogen content in the present soils ranges from 0.07 to 0.33 percent with a
mean value of 0.12 percent and showed a gradual decrease with depth except in the C2
horizon of Pirojpur and Hogla soils.
The cation exchange capacity of the soils under the present investigation ranges from
14.01 to 23.21 cmol kg-1
with a mean value of 17.22 cmol/ kg soil. A significant
positive correlation was found between CEC and percent clay content. Amount of
exchangeable Mg++
is around two times higher than the exchangeable Ca++
in all the
soils. Magnesium occupies around 58 percent of the total exchange sites among the
bases. The base saturation percent was also high (> 50%) in almost all the soils and
showed a tendency to increase with depth in the profiles.
Dithionate extractable free iron and manganese oxides were found low in all the studied
soils. Free Fe2O3 content had a significant positive correlation with the free MnO2
content.
Results of fusion analysis of soils have been presented. SiO2 was the most abundant
element in these soils. The other dominant elements were in decreasing order of
abundance: Al2O3 > Fe2O 3> MgO > CaO > K2O > TiO2> P2O5 > MnO2.
SiO2/R2O3 molar ratios throughout the profiles were non-uniform which indicates that
the soil parent materials were heterogeneous and were of mixed origin.
E. Mineralogical composition of the clay fraction of soils may be summarized as
follows:
Illite was the dominant mineral in the clay fraction of Muladi, Barisal, Jhalakati and
Ramgati soils whereas the other soils had mixed mineralogical compositions consisting of
mica, smectite, chlorite, kaolinite and trace amount of vermiculite. A significant proportion of
smectite was found in the clay fraction of Pirojpur soil.
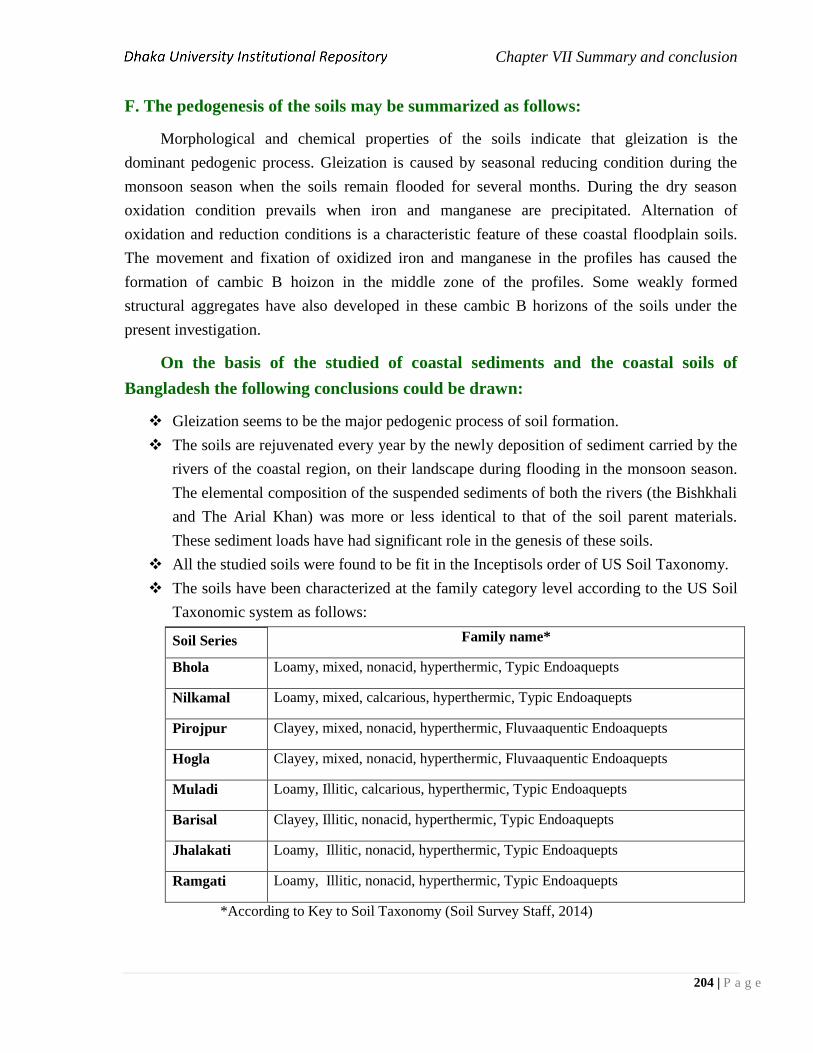
Chapter VII Summary and conclusion
204 | P a g e
F. The pedogenesis of the soils may be summarized as follows:
Morphological and chemical properties of the soils indicate that gleization is the
dominant pedogenic process. Gleization is caused by seasonal reducing condition during the
monsoon season when the soils remain flooded for several months. During the dry season
oxidation condition prevails when iron and manganese are precipitated. Alternation of
oxidation and reduction conditions is a characteristic feature of these coastal floodplain soils.
The movement and fixation of oxidized iron and manganese in the profiles has caused the
formation of cambic B hoizon in the middle zone of the profiles. Some weakly formed
structural aggregates have also developed in these cambic B horizons of the soils under the
present investigation.
On the basis of the studied of coastal sediments and the coastal soils of
Bangladesh the following conclusions could be drawn:
Gleization seems to be the major pedogenic process of soil formation.
The soils are rejuvenated every year by the newly deposition of sediment carried by the
rivers of the coastal region, on their landscape during flooding in the monsoon season.
The elemental composition of the suspended sediments of both the rivers (the Bishkhali
and The Arial Khan) was more or less identical to that of the soil parent materials.
These sediment loads have had significant role in the genesis of these soils.
All the studied soils were found to be fit in the Inceptisols order of US Soil Taxonomy.
The soils have been characterized at the family category level according to the US Soil
Taxonomic system as follows:
Soil Series Family name*
Bhola Loamy, mixed, nonacid, hyperthermic, Typic Endoaquepts
Nilkamal Loamy, mixed, calcarious, hyperthermic, Typic Endoaquepts
Pirojpur Clayey, mixed, nonacid, hyperthermic, Fluvaaquentic Endoaquepts
Hogla Clayey, mixed, nonacid, hyperthermic, Fluvaaquentic Endoaquepts
Muladi Loamy, Illitic, calcarious, hyperthermic, Typic Endoaquepts
Barisal Clayey, Illitic, nonacid, hyperthermic, Typic Endoaquepts
Jhalakati Loamy, Illitic, nonacid, hyperthermic, Typic Endoaquepts
Ramgati Loamy, Illitic, nonacid, hyperthermic, Typic Endoaquepts
*According to Key to Soil Taxonomy (Soil Survey Staff, 2014)
Chapter VII Summary and conclusion
205 | P a g e
This family level soil classification will be useful to soil scientists, agronomists, farm research
scientists and the agriculture extension workers involved in agricultural development as well as
agro-technology transfer programs for increasing agricultural production in the coastal regions
of Bangladesh. This will ultimately help the farmers in assessing the extent of deterioration in
the fertility of the soils and adaptation of proper soil and crop management practices in the
coastal region of Bangladesh.
CHAPTER-8
REFERENCES
Chapter VIII References
206 | P a g e
CHAPTER – 8
REFERENCES
Abbas, N. and Subramaniam. 1984. Erosion and sediment transport in the Ganges River
Basins (India). J. Hydrol. 69: 173-182.
Akter, K. F., Z. H. Khan, M. S. Hussain, A. R. Mazumder and M. A. Muzib. 2004.
Morphological and clay mineralogical characteristics of some seasonally flooded soils
of Bangladesh. J. Asiatic. Soc. Bangladesh, Sci. 30(2): 11-22.
Akter, K. F., Z. H. Khan, M. S. Hussain, A. R. Mazumder. 2011. Physico-chemical
characteristics of the seasonally flooded soils of Bangladesh and Their management
implications. Dhaka Univ. J. Bio. Sci. 20(2): 173-182.
Akter, F., Abu Zofar Mohammad Moslehuddin, Mohammad Abdul Kader, Md.
Mosharaf Hossain Sarker and Yuki Mori. 2015. Mineralogy of soils from different
Agro-ecological regions of Bangladesh: Region 18- Young Meghna Estuarine
Floodplain. J.Fac. Agr. Kyushu Univ., 60 (2) pp 457-462.
Alam, M.K., A.K.M.S. Hassan, M.R. Khan and J.W. Whitney. 1990. Geological map of
Bangladesh. Dhaka: Geol Survey of Bangladesh.
Alam, M.L., N.Miyauchi and S. Shinagawa. 1993. Study on clay mineralogical
characteristics of hill and terrace soils of Bangladesh.. Clay sci., 9: 109-121.
Albretch, N.M.A. 1941. Calcium saturation and anaerobic bacteria as possible factors in
gleization. Soil Sci., 61: 213.
Ali A.1989. Storm surges in the Bay of Bengal and some related problems.PhD
Dissertation, University of Reading, Reading. USA.
Ali, M. F. 1994. Effects of alternate wetting and drying cycles on pedogenic processes of
some representative Bangladesh soils. Ph.D. dissertation, University of Dhaka, Dhaka,
Bangladesh.
Amin, M; M.A. Rahman; S.M. Zaman; M.z. Hossain and M.S. Islam. 2008. Cropping
system in Coastal and Barind area. Paper presented in National workshop of Multiple
Cropping, held at BARc, Farmgate, Dhaka, on 23-24 April, 2008.
ASCE. 1990. Amrican Society of Civil Engineers. Agricultural salinity assessment and
management. ASCE Manuals and Reports on Engineering Practice no 71, New York,
N.Y. 10017, USA.
Anwar, J. 1989. Geology of Coastal area of Bangladesh and Recommendation for Resource
Development and Management. Publication of CARDMA, Dhaka, p 36-66.
Arduino, E., E. Barberis, F. Carraro, and M. G. Forao. 1984. Estimating relative ages
from iron-oxide/total iron ratios of soils in the western PO Valley, Italy. Geoderma. 33:
39-52.
Chapter VIII References
207 | P a g e
Arduino, E., E. Barberis, F. A. Marsan and M. Franchini. 1986. Iron oxides and clay
minerals within profiles as indicators of soil age in northern Italy. Geoderma. 37: 45-55.
Aramaki, K. 1996. Mineralogical composition of Main Bangladesh Soils. Graduation
Thesis, Faculty of agriculture, Kyushu University. 38 pp. (in Japanese).
Bangladesh Mateorological Department (BMD). 2012. A statistical year book of
Bangladesh. Ministry of Defence, Dhaka, Bangladesh.
BARC. 1991. Evaluation of physical parameters of various land development units in
Bangladesh for land use planning. Report of the Evaluation Committee on the BARC
Coordinated Research Project. pp27.
BARC, 1996. Workshop Proceedings on Climate Change and Global Agricultural Potential
held on 28, October, 1996. Soils Publication No. 42. Bangladesh Agricultural Research
Council. Dhaka, Bangladesh.
BARc, 1998. Land degradation situation in Bangladesh, December, 1998, BARC,
Farmgate, Dhaka, Bangladesh.
BARC. 2012. Fertilizer Recommendation Guide. Bangladesh Agricultural Research
Council. Farmgate, Dhaka.
Barua, D.K. 1991.The Coastline of Bangladesh- An Overview of Process and Forms.
Proceedings of 7th
Symposium on Coastal and Ocean Management, ASCE, Long
Beach, CA, USA, 8-12 July 1991, pp 2285-2301.
Begum, A. 1996. A pedogenic study of some soils from the Monpura Island in Bangladesh.
Master’s thesis. University of Dhaka, Bangladesh.
Begum, A., M.S. Hussain, S.M. Ullah, and F. Ottner, 2004. Morphological and
mineralogical features of some soils from the Manpura Island in Bangladesh. J. Asiat.
Soc. Bangladesh, Sci. 30(1): 17-28
Black, C.A. 1965. Methods of Soil Analysis. Part 1 and 2. Am. Soc. Agron., Madison,
Wisconsin.
Bloomfield. C. 1959. Discussion on Gleying. Newzealand Soil News. p. 39.
Blume, H. P., and U. Schwertmann. 1969. Genetic evaluation of the profile distribution of
aluminium, iron and manganese oxides. Soil Sci Soc. Am. Proc. 33: 438-444.
Bonner, F. T. and C. W. Relston. 1968. Oxidation-reduction potential of saturated forest
soils. Soil Sci. Soc. Amer. Proc. 32: 111-112.
Borchardt, G. A., F. D. Hole, and M. L. Jackson. 1968. Genesis of layer silicates in
representative soils in a glacial landscape of south eastern Wisconsin. Soil Sci. Soc.
Am. Proc. 32: 399-403.
Bouma, J. 1983. Hydrology and genesis of soils with aquic moisture regime. In:
Pedogenesis and Soil Taxonomy (Wilding. L. P., Smeck, N. E. and all. G. F. eds).
Elsevier, Amsterdam, p. 253-281.

Chapter VIII References
208 | P a g e
Bower, C.A. and J.T. Hatcher. 1962. Characterization of salt affected soils with respect to
sodium. Soil Sci. Vol. 93: 275-280.
Brady, N. C. 1994. The Nature and Properties of soils, 10th
Edition. MacMillan Publishers,
London.
Brammer, H. 1964. An outline of the Geology and Geomorphology of Bangladesh in
relation to soil development. Bangladesh J. Soil Sci. 1: 1-23.
Brammer, H. 1971. Bangladesh: Soil resources. Technical Report 3. FAO, Rome. 211 p
Brammer, H. and R. Brinkman. 1977. Surface-water gley soils in Bangladesh:
Environment, landforms and soil morphology. Geoderma. 17: 91-109.
Brammer, H. 1979. Ploughpans and tillage problems in Bangladesh Soils. Technical note.
Bangladesh Agri. Res. Council, Farmgate, Dhaka. 6p.
Brammer, H. 1996. The geography of the soils of Bangladesh. The University Press
Limited. Dhaka. p. 241-260.
Brammer, H. 2012. The physical geography of Bangladesh. The University Press Limited.
Dhaka. p. 3-195.
Brian, D. C. 1976. Titanium-rich soil clay. J. Soil Sci. 27: 68-70.
Brinkman, R. 1970. Ferrolysis : A hydromorphic soil forming process. Geoderma. 3: 199-
206.
Brinkman, R. 1977. Surface-water gley soils in Bangladesh: Genesis. Geoderma. 17: 111-
144.
Brooks, R.H., C.A. Bower and R.C. Reeve. 1956. The effect of various exchangeable
cations upon the physical condition of soils. Soil Sci. Soc. Am. Prac. 20 : 325-327.
Buol, S. W., F. D. Hole and R.J. Cracker. 1973. Soil Genesis and classification. Iowa
State University Press, Ames.
Buol, S. W., F. D. Hole and R. J. McCracken and R.J. Southard. 2001. Soil Genesis and
classification.5th
ed. Iowa State University Press, Ames, Iowa. pp. 527.
Burrows, W.C. and D. Kirkham. 1958. Measurement of field capacity with neutron
meter. Soil Sci. Soc. Amer. Proc.., 22.
Chapman, H.D. and P.E. Pratt. 1965. Methods of analysis for soils, plants and waters.
Univ. of Calif., Div. of Agric. Sci. p. 309.
Chakrapani. J. G. 2005. Factors controlling variations in river sediment loads. Current
Science, vol. 88, No. 4: 569-575.
Chatterjee. R. K. and R. C. Dalal. 1976. Mineralogy of Clay fraction of some profiles
from Bihar and West Bengal. J. Indian Soc. Soil. Sci. 24: 153-262.
Chowdhury, S. A., A. Islam, R. Mandal, S. Hoque, and S. Rahman. 1992 (June). Forms
of potassium in some soils of Bangladesh. Bangladesh J. Sci. Res. 10(1): 1-8.
Coleman, J.M. 1969. The Sediment Field of Major Rivers of the World. Water Resources
Research, Vol. 4 No. 4, 1968, pp26-59.
Chapter VIII References
209 | P a g e
CZPo, 2005. Coastal Zone Policy, Ministry of Water Resources, Government of the
People’s Republic of Bangladesh, Dhaka.
Daniel, R. B., J. F. Brasfield and F. F. Riecken. 1962. Distribution of sodium hydro
sulfite extractable manganese in Iowa soil profiles. Soil Sci. Soc. Am. Proc. 26: 75-80.
Daniel, R. B., E. E. Gamble and L. A. Nelson 1971. Relations between soil morphology
and water table levels on a dissected North Carolina coastal plain surface. Proc. Soil
Sci. Soc. Amer. 35 : 781-784.
Daniels. R. B., E. E. Gamble, and S. W. Buol. 1973. Oxygen content in the ground water
of some North Carolina Aquults and Udults. Field soil water regime. (Eds R. R. Bruce
et al.) Soil Sci. Soc. Am. Special Publications series No. 5. Soil Sci. Soc. Am.,
Madison. Wisconsin. pp. 153-166.
Das, D. K., B. Das and G. C. Naskar. 1974. Water retention and storage characteristics of
alluvial soils. J. Indian Soc. Soil Sci. 22: 379-382.
Datta, D.K. and V. Subramaniam. 1996. Texture and Mineralogy of Sediments from the
Ganges- Brahamaputra-Meghna river system in the Bengal Basin, Bangladeshand their
Environmental Implications. Environmental Geology, Vol. 30, No. 3, 1996, pp. 181-
188.
Day, P. R. 1965. Particle formation and particle size analysis. In: Methods of soil analysis
(eds. C.A. Black et. al.) American Society of Agronomy, Madison, Wisconsin, p. 545-567.
Deturck, P. and S. Somasiri. 1992. Rice soils of Sri Lanka with anthraquic features.
Proceedings of the Eighth International Soil Correlation Meeting (VIII ISCOM):
Characterization, Classification, and Utilization of Wet Soils.
Dewis, J and F. Fretas. 1970. Physical and chemical methods of soil and water analysis.
Appendix 8. F.A.O. of the United Nations, Rome.
Diwarker, D. P. S and R. N. Singh. 1992. Tal land soils of Bihar.I: Characterization and
Classification. J. Indian Soc. Soil Sci. 40: 496-504.
Diwakar, D. P. S. and R. N. Singh. 1992. Tal land soils of Bihar. III: Aggregation and
water retention characteristics. J. Indian Soc. Soil Sci., 40: 667-673.
Dolut A. K., I. Chandran and A. K. Nayak. 1987. Comparative studies on different forms
of aluminium using various extractions in relation to pedogenic processes in soil profile. J.
Indian. Soc. Soil Sci. 35: 103-108.
Dudal, R. 1965. The problem on the genesis and classification of rice (Paddy) soils. Pages
187-192 in V. A. Kovda and E. V. Lobova, ed. Geography and classification of Asian
soils. Nauka, Moscow.
Dudal, R., and F. R. Moormann. 1964. Major Soils of Southeast Asia. J. Trop. Geog.18:
54-80.
Chapter VIII References
210 | P a g e
Dudal, R and D.L. Bramao. 1965. Dark clay soils of tropical and sub-tropical regions.
FAO Agricultural development paper No. 83.
Eaqub, M. 1985. Recent findings of potassium effects on Sonatala silt loam soils of
Bangladesh. Potassium in agricultural soils. Soil Science Society of Bangladesh and
Bangladesh Agriculture Research Council ( Proceeding of the Internatioal Symposium
of soil). 223-235.
Edelman, C.H. and P.K.J. Vander Voorde. 1963. Important characteristics of alluvial
soils in the tropics. Soil Sci. Soc. Am. 95: 258-263.
EGIS, 1998. Environmental and Social Impact Assesment of Khulna – Jessore Drainage
Rehabiitation Project, Dhaka. Environment and GIS Project for Water Sector Planning.
Egashira, k. and M. Yasmin, 1990. Clay mineralogical composition of floodplain soils of
Bangladesh in relation to physiographic units. Bull. Inst.Trop. Agr. 10: 106-126.
Egashira, k., M. Tyoryo and T. Watanabe. 1994. Clay mineralogical composition of
paddy soils of Fukuoka prefecture: Chikugo- Sankan and Chikugo- heiya regions. Sci.
Bull, Faculty of Agr. Kyushu Univ.m, 49(1-2): 23-39.. Bull. Inst.Trop. Agr. 10: 106-
126.
Elahi, K.M. 1991. Riverbank Erosion, Flood Hazard and Population Displacement in
Bangladesh: an Overview, in Elahi, K.M. Ahamed, K.S. and Mafizuddin, M (eds),
Riverbank Erosion, Flood Hazard and Population Displacement in Bangladesh,
Dhaka: Riverbank Erosion impact Study, Jahagirnagar University.
Evans, C. V. and D. P. Franzmeier. 1986. Saturation, aeration and colour patterns in a
toposequence of soils in north-central Indiana. Soil Sci. Soc. Am. J. 50: 975-580.
Fanning, D.S. and V.Z. Keramidas. 1977. Micas. In : Dixon and S. B. Weed ( Editors).
Minerals in Soil Environments. P. 195-258. Soil Sci. Soc. Amer., Madison, Wisconsin.
Fanning, D.S., M.C. Rabenhorst, and M. L. Thompson. 1992. Micro-morphology of wet
soils in relation to classification. Proceeding of the 8th
Intl. Soil Correlation Meeting
(VIII ISCOM): Ed. J. M. Kimble. USDA Soil Conservation Service, National Soil
Survey Centre, Lincoin, NE. 106-122 pp.
FAO (Brammer, H). 1971. Soil Survey Project, Bangladesh Soil Resources. AGL: SF/
PAK 6, Tech. Rep. 3. FAO, Rome. 211 p.
FAO. 1977. Soil map of the world, Vol. vii (South Asia). Paris: UNESCO, 117pp.
FAO, 2006. Guidelines for soil description. Food and Agricultural Organization of the
United Nations, Rome.50 p.
FAO-UNDP.1988. Land Resources Appraisal of Bangladesh for Agricultural Development.
Report 2 and 3. Agroecological regions of Bangladesh. FAO, Rome.
Chapter VIII References
211 | P a g e
Ferdous, S., M.S. Hussain and M.J. Uddin. 2005. Characterization of some hydromorphic
soils from the Ganges delta in Bangladesh. J. Asiat. Soc. Bangladesh, Sci. 31(2): 37-
48.
Firoze, A. 2003. The Southwest Coastal Region: problems and potentials. The Daily Star.
Friday, July 25, 2003.
Gartels, R. M. and C. L. Christ. 1965. Solutions, minerals and equilibria. Harper and
Row, New York.
George, M. Schafer and N. Holoway Chuk. 1958. Characteristics of medium and fine
textured humic gley soils of Ohio.Soil. Sci. Soc. Amer. Proc. 22: 262.
Ghabru, S. K., R. J. S.Arnaud and A. R. Mermut. 1990. Association of DCB-Extractable
iron with minerals in coarse soil clays. J. Soil Sci.49: 113-120.
Ghimire, G.P.S. and B.K. Uprety. 1990. Causes and Effects of Siltation on the
Environment of Nepal. Environmentalist Spring , 1990, Vol. 10, Issue 1, pp 55-65.
Gotoh, S. and W. H. Patrick. 1974. Transformation of iron in waterlogged soils as
influenced by redox potential and pH. Soil Sci. Soc. Amer. Proc. 38: 66-71.
Graham, E.R.1953. Soil mineralogy as an index to the trace element status of some
Australian soils. Soil Sci. 75: 333-343.
Gupta, G. P. and V. K. Misra. 1970. A comparative study of the methods of estimation of
CEC in soils of Gwalior district. Indian J. Agric. Chem. 3: 97-100.
Habibullah, A. K. M., D. J. Gt.eenland and H. Brammer. 1971. Clay mineralogy of
some seasonally flooded soils of East Pakistan. J. Soil.Sci. 22: 179-190.
Hannan, M.A. 1995. Structure and related physical properties of some soils of Bangladesh.
Unpublished M.Sc. Thesis, Dipt. of Soil Sci., Univ. of Dhaka, Bangladesh. 138-152 p.
Hassan, M. M and M. A. Razzak. 1981. A preliminary evaluation of the clay mineralogy
of the Sundarban soils. Bano Bignan Patrika. 10: 1-6.
Hassan, M. K., A. S. M. Mohiuddin and M. J. Uddin. 2012. Characterization of some
representative soils from the Ganges floodplain of Bangladesh. Dhaka Univ. J. Biol.
Sci. 21(2): 201-205.
Hearly, W.B. 1959. Gley processes. Newzeland Soil News. P. 48.
Hossain, M.M. 1992. Total sediment load in the lower Ganges and Jamuna. J. Inst. Eng,
Bangladesh. 20: 1-8.
Hossain, M.M., Z.H. Khan and M.S. Hussain. 2011. Characterization and classification
of some intensively cultivated soils from the Ganges river floodplain of Bangladesh.
Dhaka Univ. J. Biol. Sci. 20(1): 71-80.
Huizing, H.G.J. 1970. Exploratory Survey of Soil Miosture Relations in East Pakistan
(Bangladesh) Soils. Soil Survey Project of Pakistan
Chapter VIII References
212 | P a g e
Huizing, H. G. J. 1971. A reconnaissance study of the mineralogy of some seasonally
flooded soils of East Pakistan. Geoderma. 6: 110-133.
Hussain, M.S. 1961. A pedogenic study of the soils of a portion of north Sylhet, East ,
Pakistan. M. Sc. Thesis, Dept. of Soil Science, Dhaka University. Dhaka.
Hussain, M. S. and L. D. Swindale. 1974. Physical and chemical properties of the Gray
Hydromorphic soils of the Hawaiian islands. Soil Sci. Soc. Amer. Proc. 38: 935-941.
Hussain, M. S. and A. K. M. E. Islam. 1979. Titanium content in the soils and clays rom
Bangladesh. Bangladesh. J. Soil Sci. 15: 173-182.
Hussain, M. S. and A. M. Chowdhury. 1980. Studies on some cracking clay soils from
Bangladesh: In. Physical and physico-chemical properties. Bangladesh Jour. Soil Sci.
16: 1-13.
Hussain, M. S. and A. M. Chowdhury. 1981. Studies on the cracking clay soils from
Bangladesh. In. Pedochemistry and genesis. Bangladesh Jour. Soil Sci. 17: 1-12.
Hussain, M.S., S. Rahman and M.A Mujib. 1982. Properties and genesis of some pedons
from the Tippera surface. The Dhaka Univ. Stud. B. 30: 57-67.
Hussain, M. S. and S. Rahman. 1983. Physico-chemical characteristics of some coastal
saline soils of Bangladesh. Bangladesh J. Soil Sci. 19: 21-30.
Hussain, M. S., K. Nahar., A. K. M. E. Islam and S. F. Elahi. 1989. A morphological and
clay mineralogical study of some soils from Bhola district in Bangladesh. Dhaka Univ.
Stud. (Part-E) 4: 93-104.
Hussain, M. S., S. Rahman, S. A. Ahad. A. S. M. Mohiuddin and A. R. Mazumder.
1992. Physical and chemical properties of four pedons from Bhola. Dhaka, Univ. J.
Biol. Sci. 1(1): 95-102.
Hussain, M. S., A.S.M. Mahiuddin and A.R. Mazumder. 1992. Ion composition of
exchangeable and soluble phases in some soils from the coastal areas of Bangladesh. J.
Asiat. Soc. Bangladesh, Sci. 18 (1) : 1-9. 200p.
Hussain, M. S. 1992. Soil classification with special reference to the soils of Bangladesh.
University of Dhaka. 200p.
Hussain, M. S., M. J. Uddin amd S. Ferdous. 2006. Morphology and mineralogy of some
hydromorphic soils from the Ganges delta in Bangladesh. J. Asia. Soc. Bangladesh,
Sci., 32(2): 257-268
Hussain, M.S., S. Rahman and M.A. Mujib. 2011. Properties and genesis of some
pedons from the Tippera surface. The Dhaka Univ.Stud.B. 30: 57-67.
Hussain, M.S. , M.J. Uddin and A.S.M. Mohiuddin. 2013. Assesment of soil quality in
Bangladesh with organic carbon as the indicator property. Dhaka Univ. J. Biol. Sci.
22(2): pp. 163-174.
Chapter VIII References
213 | P a g e
Hussain, M.S. , Z.H. Khan and M. Ibrahim.2014. Mineralogical composition of soils
from Urir Char- a tiny offshore island of Bangladesh. J. Asiat. Soc. Bangladesh, Sci: 39
(1) pp 95-104.
Hussain, M.S. , Z.H. Khan and M.M. Hasan. 2014. Potassium depletion in agricultural
soils of Bangladesh and its possible impacts on mineral alteration: some empirical
considerations. J. Asiat. Soc. Bangladesh, Sci: 40 (1) pp 157-161.
Hutton. J. T. 1977. Titanium and zirconium minerals, pp. 673-688. In: Dixon et al. (ed.)
Minerals in Soil Environments. Soil Sci. Soc. Amer. Madison. Wisconsin.
Iftekhar, U Ahmed, S. Akhter and Mainul Ahsan. 2004. Mineralogical characterization
of clay fraction of some Ganges floodplain soils. Bangladesh J. Soil Sci. 30(1-2): 71-78.
Islam, A. K. M. E. and E. G. Lotse. 1986. Quantitative mineralogical analysis of some
Bangladesh soils with X-ray, ion exchange and selective dissolution techniques. Clay
Minerals. 21: 31-42.
Islam,M.R. (ed), 2004. Where Land Meets the Sea: A Profile of the Coastal Zone of
Bangladesh, The University Press Limited, Dhaka
Islam, A.B.M.S., M.J. Uddin, M.S. Hussain and A.S.M. Mohiuddin. 2008. Agricultural
sustainability of some low land rice soils of the Chalan Beel area under lower Atrai
basin of Bangladesh. J. Agrofor. Environ. 2(2):61-66.
Islam, A.B.M.S., Z.H. Khan, and A.R Mazumder. 2014b. Pedogenesis and
Characterization of some soils from the Chalan beel of Bangladesh. J. Asiat. Soc.
Bangladesh Sci., 40(2): 271-281.
Jackson, M. L., Y. Hseung, R.B. Corey, E. J. Evans and R. C. Vander Heuvel. 1952.
Weathering of clay size minerals in soils and sediments. II. Chemical weathering of
layer silicates. Soil Sci. Soc. Am. Proc. 16: 3-6.
Jackson, M. L. and G. D. Sherman. 1953. Chemical weathering of minerals in soils. adv.
agron. 5: 221-318.
Jackson, M. L. 1964. Aluminum bonding in soils: A unifying principle in soil science. Soil
Sci. Soc. Amer. Proc. 27: 1-10.
Jackson, M. L. 1964. Chemical composition of soils. pp. 71-141. In. F. E. Bear (ed).
Chemistry of the Soil. Reinhold Publishing Corp., New York.
Jackson, M. L. 1965. Clay transformation in soil genesis during the Quaternary. Soil Sci.
99: 15-22.
Jackson, M. L. 1967. Soil Chemical Analysis. Prentice Hall of India Pvt. Ltd. New Delhi.
Jackson, M.L. 1975. Soil Chemical Analysis- Advanced course. Published by the author.
Deptt. of Soils. University of Wisconsin, Madison. 991 p.
Chapter VIII References
214 | P a g e
Jalal, A.C.K., H.N. Noor Faizul, B.Y. Kamaruzzaman, S Shahbuddin, M.Z. Alam, and
Jaswir Irwandi. 2009. Studies on Physico- chemical characteristics and sediment
environment along the coastal waters in Pulau Tuba, Langkawi, Malaysia. J. Aquatic
Ecosystem Health & Management, 12( 4): 350-357, 2009.
Jenny, H. 1941. Factors of Soil Formation, Mc Graw- Hill, New York.
Jenny, H. 1980. The soil resource. Springer-Verlag, New York.
Jha, S. N., L. K. Mishra, N.K. Jha, and S.N. Choudhary. 1984. Distribution of some
micronutrients in calcareous soil as influenced by physiography and soil characteristics.
J. Indian Soc. Soil. Sci. 32: 375-77.
Joffe, J.S. 1966. Pedology. Pedology Publications, New Branswick, New Jercy, 662p
Joffe, J. S. 1968. Pedology. Pedology publications, New Brunswick, New Jersey. pp. 662.
Johnson, L.T., P.R. Matelski and C. F. Engle. 1963. Clay mineral characterization of
modalsoil profiles in several Pennsylvania countries. Am. Proc. 27: 568-572.
Joshua, W. D. and M. Rahman. 1983. Physical properties of soils in the Ganges River
floodplain of Bangladesh. Strengthening of Soil Resource Development Institute.
FAO/UNDP Project. BGD/81/023. Department of Soil Survey, Dhaka.
Kader, A.M., Abu Zofar Mohammad Moslehuddin, Ahmed Mostafa Kamal and Yuki
Mori. 2015. Mineralogical composition of some selected paddy soils of Bangladesh. J.
Fac. Agr. Kyushu Univ., Vol 60 (2) pp 463-470.
Kamaruzzaman, B.Y., M.S. Noor Azhar., H. Norhizam and K.Y.S.Willison. 2006. The
temporal varation of organic carbon during the Pre-monson and Post-monsoon season
in Pahang Coastal water, Malaysia. Sainas Malaysia 6(1), 53-61.
Kanno, I. 1962. A new classification system of rice soils in Japan. Page 617-624. Joint
Mtg. Comm. IV. and V. Int. Soc. Soil Sci., New Zealand.
Karim, A. 1954. A mineralogical study of the colloidal fractions of some great soil groups
with particular reference to illites. J. Soil Sci. 5 : 1-5.
Karim, A. and A. Islam. 1956. A study of ion -exchange properties of silt. Soil Sci. 82:
433-436.
Karim, A. and M. Hussain. 1963. Distribution of titania in some East Pakistan soils. J.
Soil Sci. 6: 125-129.
Karim,Z., S.M. Saheed, A.B.M. Salauddin, M.K. Alam and A. Huq. 1982. Coastal
saline soils and their management in Bangladesh. Soils Publication No. 8, BARC. Pp:
33.
Karim. Z. 1984. Formation of aluminium substituted goethite in seasonally waterlogged
rice soils. Soil Sci. Soc. Amer. Jour. 48: 410-413
Chapter VIII References
215 | P a g e
Karim,Z., Hussain, S.G and Ahmed, M. 1990. Salinity Problems and crop intensification
in the coastal regions of Bangladesh. Soils Publication no. 8, BARC, p 33.
Karmanov, I. I. 1968. Soils of Burma, Part-1, Hydrophysical properties; Part-2.
Peculiarities of cultivated soils. In: V. Kovda and E. V. Loboval (Editors), Geography
and classification of the soils of Asia. Israel Program for Sci. Translation, Jerusalem,
p. 213-236.
Kawaguchi, K and K Kyuma. 1969 a. Lowland rice soils in Malaysia. Ntl. Sci. Ser. N- 5.
Centre for south-east Asian Studies. Kyoto University. 154 p.
Kawaguchi, K and K Kyuma. 1969 b. Lowland rice soils in Thailand. Ntl. Sci. Ser. N-
4. Centre for south-east Asian Studies. Kyoto University. 270 p.
Kawaguchi, K. and K. Kyuma. 1977. Paddy soils in tropical Asia. Monograph 10, Center
for Southeast Asian studies, University of Hawaii Press, Hawaii. 258 p.
Khan, D. H. 1954. A pedogenic study of the soils of a high land arc escarping the
Brahmaputra valley, East Pakistan (Bangladesh). M. Sc Thesis, Dept. of Soil Sci. Univ.
of Dhaka, Dhaka, Bangladesh.
Khan, H.R., S. Rahaman, M.S. Hussain and T. Adachi. 1993. Morphology and
characterization of an acid sulphate soils from mangrove floodplain area of
Bangladesh. Soil Phys. Cond. Plant Growth, Jpn. 68: 25-36.
Khan, Z. H. 1995. A genetic study of some Benchmark soils of Bangladesh. M.Sc. Thesis,
Dhaka University, Dhaka, Bangladesh.
Khan, Z. H., A. R. Mazumder, M. S. Hussain and S. M. Saheed. 1997. Chemical and
mineralogical properties of some Benchmark soils in the floodplains of Bangladesh.
Journal of the Indian Society of Soil Science 45 (2): 485-489.
Khan, Z. H. and F. Ottner. 2010. mineralogical composition of three soil series from the
Meghna floodplain soils of Bangladesh and the soil management implications.
Bangladesh J. Sci. Res. 23 (2): 1415-128.
Khan, Z. H., M. S. Hussain and F. Ottner. 2011. Bulk and clay mineralogical
composition of some benchmark soils of Bangladesh and their implications in
classification and management. Jour. Asiatic. Soc. Bangladesh, sci. 37: 23-34.
Khan, Z. H., M. S. Hussain and F. Ottner. 2012. Morphogenesis of three surface-water
gley soils from the Meghna floodplain of Bangladesh. Dhaka Univ. J. Biol. Sci.
21(2): 17-27.
Khan, Z. H., M. S. Hussain and M.M. Hassan. 2013. Potassium availability in relation to
mineralogy in some floodplain soils of Bangladesh. Dhaka Univ. J. Biol. Sci. 22(1):
79-83.
Kyuma, K. 1978. Soils and Rice. Mineral composition of Rice soils. The International Rice
Research Institute, Los Banos, Leguna, Philippines. p 219-235
Chapter VIII References
216 | P a g e
Kyuma, K. and K. Kawaguchi. 1966. Major soils of Southeast Asia and the classification
of soils under rice cultivation. Southeast Asia Stud. 4 : 290-312.
Kyuma, K., M. Mitsuchi and F. R. Moorman. 1988. Man-induced soil wetness: The
"anthraquic" soil moisture regime p. 138-146. Proceeding of the 9th International Soil
Classification Workshop. Properties, Classification and Utilization of Andosols and
Paddy Soils. Japan.
Landon, J. R. 1991. Booker Tropical Manual. Longman Scientific and Technical,
Longman Group. U.K. Ltd.
Lavti, D. L., A. P. Gandhi, and K. V. Paliwal. 1969. Contribution of clay and organic
matter in the cation exchange capacity of Rajsthan Soils. J. Indian Soc. Soil Sci. 17: 71-
74.
Laves, D. 1978. Potassium transformation in soil. Arch. Acker-u. Pflanzenbau u. Bodenk.
22(8): 521-528.
Mackintosh, E. E. and J. Van Der Hust. 1978. Soil drainage classes and water table
relations in medium and coarse textured soils in Southern Ontario. Can. J. Soil Sci. 58:
287-301.
Mall, J. and B. B. Mishra. 1994. Mineralogy of fine sand fractions of some non-
calcareous soils of north Bihar. J. Ind. Soc. Soil Sci. 42: 640-644.
Manalo, E. B. 1975. Agroclimatic Survey of Bangladesh. Vol-1. International Rice
Research Institute. Los Bons, Philippines. 361 p.
Mandal, L. N. 1960. Transformation of iron and manganese in water logged rice soils. Soil
Sci. 91: 121-126.
Martineli, A.L., J.E. Richey and A.H. Devol. 1992. Chemical and Mineralogical
composition of Amazon River floodplain sediments, Brazil. Applied Geochemistry,
Vol. 8. pp 391-402.
Matin, M. A. 1972. Genesis and pedochemical properties of some Vertisols in Bangladesh.
M.Sc. Thesis. Dept. of Soil Science. Univ. of Dhaka, Dhaka. p.5.
Mazumder, A. R. 1976. A study on some deep water rice soils of Bangladesh. M.Sc.
thesis. Dept. of Soil Science, University of Dhaka, Dhaka.
Mazumder, A. R. 1996. A pedogenic study of soils from the Brahmaputra floodplain. Ph.
D. Dissertation, University of Dhaka, Dhaka. 262 p.
Mazumder, A. R., Z. H. Khan and M. S. Hussain. 2010. Morphogenesis and
characterization of some representative soil profiles from the old Brahmaputra
floodplain in Bangladesh in relation to their agricultural use potential. Bangladesh J.
Sci. Res. 23 (1): 27-38.
Mc. Keague, J. A. 1965. A laboratory study of gleying. Can. Jour. Soil Sci. 45: 199-202.
Mc. keague, J. A. and J. H. Day. 1966. Dithionite and Oxalate extractable Fe and Al as
aids in differentiating various classes of soils. Can. J. Soil Sci. 46: 13-22.
Chapter VIII References
217 | P a g e
Meade, R.H. and R.S. Parker. 1984. Sediment in rivers of the United States. In national
Water Summary, US Geol Surv. Water Suppl. Pap., Vol. 2275, pp. 49-60.
Mehra, O.P. and M.L.Jackson. 1960. Iron oxide removal from soils and clays by
dithionate –citrate system buffered with sodium bicarbonate. Proc. 7th
Natl. Conf. on
Clays and Clay Minerals. Permangon press. New York. p. 317-327.
Mengel, K. and E. A. Kirkby. 1982. Principles of Plant Nutrition. International Potash
Institute. Bern, Switzerland. 655 p.
Milliman, J.D. and R.H. Meade. 1983. World-wide Delivery of River sediment to the
Oceans. J. of Geol., 91, pp 1-21
Mirabrlla, A and S. Carnicelli. 1992. Iron oxide mineralogy in red and brown soils
developed on calcarious rocks in central Italy. Geoderma, 55: 95-109.
Mitsuchi, M. 1974. Pedogenic charactelistics of paddy soils and ther significance in soil
classification (Japanese, English Summary). Bull. Natl. Inst. Agric. Sci. B 29: 29-115.
Morghan, J.P. and W.G. McIntire. 1959. Quaternary geology of the Bengal basin, east
Pakistan and India. Geol. Soc. Am. Bull. 70: 319-342.
Mokma, D.L.and D.L. Cremens. 1991. Relationships of saturation and B horizon color
patterns in sols of three hydrosequences in South-Central Mishigan, USA. Soil use and
management. Vol. 7, No. 1.
Moslehuddin, M.Z.A and Kazuhiko Egashira. 1996. Mineralogical Composition of some
Important Paddy Soils of Bangladesh. Bull. Inst. Trop. Agri. Kyushu Univ, Vol. 19 pp
33-54.
Moslehuddin, M.Z.A and Kazuhiko Egashira. 1997. Characterization of Smectites found
in Ganges Floodplain soil of Bangladesh. Clay Science, Vol. 10, pp 151-162.
Moslehuddin, M.Z.A., S.M. Saheed, and Kazuhiko Egashira. 1998a. Disappearing
Trend of Smectite in Ganges Floodplain soil of Bangladesh. Clay Science, Vol. 10, pp
349-362
Moslehuddin, M.Z.A., S.M. Saheed, and Kazuhiko Egashira.1998b. Mineralogical
Approach to Alternation of Different River Sediments in Meghna Floodplain Soils of
Bangladesh. Clay Science, 10 pp 375-384.
Moslehuddin, M.Z.A., M. Sultan Hossain, S.M. Saheed, and Kazuhiko Egashira. 1999.
Clay Mineral Distribution in Correspondence with Agro-ecological Region of
Bangladesh. Clay Science, 11 pp 83-94.
Mohr. E. G. J., F. A. van Baren, and J. van Schuylenborgh. 1972. Tropical soils. A
comprehensive study of their genesis. 3rd revised and enlarged ed. Mouto ichtiar Baru-
van Hoeve, The Hague-Paris-Djakarta. 481 p.
Moorman, F. R. and N. van Breeman. 1978. Rice: soil, water, and land. International
Rice Research Institute, Los Banos, Philippines. 185 p.
Chapter VIII References
218 | P a g e
Moorman, F.R. 1978. Morphology and Classification of soils on which rice is grown.
IRRI. Los Banos, Laguna, Philipines. p 255-272.
Moorman, F. R. 1980. The classification of "Paddy soils" as related to Soil Taxonomy. In:
Proc. of symp. on paddy Soil. Ed. by Institute of Soil Science, Academia Sinica,
Nanjing, The People's Republic of China.
Moslehuddin, A. Z. M. and K. Egashira.1996. Mineralogical composition of some
important paddy soils of Bangladesh. Commun. Soil Sci. and Plant Anal., 30(3-4): 329-
344.
MoWR, 2006. Coastal Development Strategy, Dhaka, Ministry of Water Resources,
Government of the People’s republic of Bangladesh.
Murthy, R. S., B. S. Mathur, and Raychaudhury. 1962. Genesis and classification of
some alluvial soils in the Ganges river plain of central Uttar Pradesh. Proc. Natl. Inst.
Sci. India, pt. A 28: 549-67.
Muzib, M. A.; M. S. Hussain and S. Rahman. 1969. Distribution of free iron and
manganese oxides in the soils of the Tippera surface, East Pakistan. Pak. J. Soil. Sci.
Vol. 5, No. 2.
NAP, 2006. National Action Programme (NAP) for combating desertification. DFepertment
of Environment, Ministry of Environment and Forest, Govt. of the People’s Republic
of Bangladesh. August, 2015.
Nahar, k. 1987. A study of some soils from the coastal belt of Bangladesh. M.Sc. thesis,
Dept. of Soil Science, University of Dhaka, Bangladesh.
Nishat,A.1989. Riview of present activities and state of art of the coastal area of
Bangladesh. In National workshop on coastal area resource development and
management( Part-II).p. 23-35.
Nizam Uddin, A. S. M., M. S. Hussain, M. J. Uddin, A. S. M. Mohiuddin and A. R.
Mazumder, 2009a. Characterization of some wetland soils of the Surman-Kushiyara
floodplain of Bangladesh. Dhaka Univ. J. Biol. Sci. 18(2): 99-110.
Nizam Uddin, A. S. M., M. S. Hussain, M. J. Uddin, A.S.M. Mohiuddin and A. R.
Mazumder, 2009b. Morphology and clay mineralogy of soils of the Surman-Kushiyara
floodplain of Bangladesh. Dhaka Univ. J. Biol. Sci. 18(1): 47-57
Okusami, T. A. and R. H. Rust. 1992. Occurrence, characteristics, and classification of
some hydromorphic soils from south Nigeria. In: J.M. Kimble (1992). Proceedings of
the 8th intl. Soil correlation meeting (VIII ISCOM); characterization, classification and
utilization of wet soils, USDA Soil conservation service,-National Soil Survey
Center, Lincoln, NE; p. 185-198.
Orlov, D. S. 1992. Manganese and iron in soil. In: Soil Chemistry. Oxford and IBM
Publishing Co. Pvt. Ltd. New Delhi.
Chapter VIII References
219 | P a g e
Otowa, M. 1973. Morphological changes of soils by paddy rice cultivation. Pages 381-383
in E. Schlichting and U. Schwertman. Ed. Oseudo- gly and gley. Verlog Chemic Gmb,
Weinheim.
Page, A.L.1982. Methods of Soil Analysis. Part 2. 2nd
. ed. American Society of
Agronomy.Inc. Soil Science Society of America, Madison, Wisconsin, USA.
Panaullah, G.M. 1984. Characteristics of six coastal saline soils of the Philipines in
relation to the growth and mineral nutrition of rice. Ph.D. Thesis, Los Banos.
University of Philippines.
Paramananthan, S. 1978. Rice soils of Malaysia. Soils and Rice. pp. 87-98. International
Rice Research Institute. Los Banos, Leguna, Philippines.
Pathak, S. R. and N. K. Pata1. 1980. Study of some physico-chemical characteristics of
salt affected soils of Kaiza district, Gujrat State. J. Indian Soc. Soil. Sci. 28: 31-37.
Pickering, E. W. and P. L. M. Veneman. 1984. Moisture regimes and morphological
characteristics in a hydro sequence in central Massachusetts. Soil Sci. Soc. Am. J. 48:
113-118.
Piper, C.S. 1966. Soil and Plant Analysis. The University of Adelide press. Adelide,
Australia.
Ponnamperuma, F. N. 1972. The chemistry of submerged soils. Adv. Agron. 24: 29-96.
Ponnamperuma, F.N. 1985. Chemical kinetics of wetland rice soil relative to soil fertility.
In: wetland soils: characterization, classification and utilization. International Rice
Research Institute, Los Banos, Laguna, Philippines. p. 71-89.
Quasem, A. 1956. A study of the soils of the Briand tract. East Pakistan. M.Sc. Thesis,
Department of Soil Science, Univ. of Dhaka.
Rahman, A.A. 1989. Bangladesh coastal environment and management. Paper presented at
the National weorkshop on Bangladeshcoastal area Resource Development and
Management Organized by CARDMA, Dhaka, Vol. 11. 139-153 pp.
Rahman, S. 1990. Study on the genesis and reclamation of some acid sulphate soils of
Bangladesh. Ph.D. Thesis, University of Dhaka, Dhaka.
Rahman, M. H., T. H. Khan and S. Hoque. 1992. Structural attributes of soils under rice
based cropping pattern in the Ganges Kobadak Project area of Bangladesh. J
Bangladesh J. Soil Sci. 23: 79-91.
Rahman, M.S. 2001. Chemical and mineralogical composition of major river sediments of
Bangladesh and their impact on genesis and nutrient status of soils. Ph. D. Dissertation,
University of Dhaka, Dhaka. 211 p.
Rahman, H.M., Abu Zofar Md. Moslehuddin, Dilip Kumar Saha, Iftekhar Uddin
Ahmed and Kazuhiko Egashira. 2005. Mineralogy of Soils from Different Agro-
ecological Regions of Bangladesh: Region 12- Low Ganges River floodplain. Clay
Science, 11 pp 321 - 326.
Chapter VIII References
220 | P a g e
Rahman, S.M., M.S. Hussain, S.M.A. Faiz and M.J. Uddin. 2009. Nature and Properties
of Water and Sediments of the Ganges and the Brahmaputra Rivers in Bangladesh. J.
Asiat. Soc. Bangladesh. Sci., 35(2): 113-122.
Reza , S.M., Abu Zofar Mohammad Moslehuddin, Md. Rafiqul Islam, Shaila sultana
Alam and Yuki Mori. 2013. Mineralogical Approach to Parent Material
Characterization of Soils from Agro-ecological Region 6, Lower Purnabhaba
Floodplain, in Bangladesh. J.Fac. Agr. Kyushu Univ., 58 (2) pp 433-437.
Robinson, W.O. and R.S. Holmes. 1924. The inorganic composition of some important
American soils. U.S. Dept. Agr. Bull. 1311.
Saheed, S. M. and M. S. Hussain. 1992. Wetland soils of Bangladesh. (J.M. Kimble ed.); ;
Characterization, Classification and Utilization of Wet soils. USDA, Soil conservation
service, USA. National soil survey centre. Lincoln, NE. p. 220-229.
Saheed, S. M. and M. S. Hussain. 1996. Pedology of the rice soils of Bangladesh In M.
rahman et al (Ed.). Biological Nitrogen Fixation Associated with Rice Production.
Kluwer Academic Publishers. London p. 71-79.
Salauddin, M and M. Ashikuzzaman. 2012. Nature and extent of population displacement
due to climate change triggered disasters in south-western coastal region of
Bangladesh. International J. of Climaic Change Strategic and Management, Vol. 4 No.
1, 2012, pp. 54-65.
Santos. M. C. D., R. J. Arnaud and D. W. Anderson. 1986. Quantitative evaluation of
pedogenic changes in Boralfs (Gray Luvisols) of east central Saskatchewan: Soil Sci.
Soc. Am. J. 50: 1013-1019.
Sarwar, M.G.M. 2005. Impacts of sea level rise on coastal zone of Bangladesh. Master’s
thesis of Environmental programme. Lunde University, Sweden.
Schulze, D.G. 1989. An introduction on soil mineralogy. In: Minerals in soil Environments.
J.B. Dixon and S.B. weed (Eds.). Soil Sci. Soc. Amer., Madison, Wisconsin. pp. 1-34
Schwertmann, U. and R. M. Taylor. 1977. Iron oxides. In: J. B. Dixon (ed). Minerals in
soil environment. Soil Sci. Soc. Am., Madison, Wis., pp. 145-180.
Sharma, P. K and G. Dev. 1985. Physiography-soil relationship in a transect in north-east
Punjab. J. Indian Soc. Soil Sci. 33: 604-612.
Siddiqui, M.U.H. 1989. Land Erosion and Accretion in the Coastal Area. Proceedings of
the national Workshop on Bangladesh Coastal Area Resource Development and
Management (Part II). Dhaka, 3-4 October, 1989. P. 139-150.
Sidhu, P.S., Raykuman and B.D. Sharma. 1994. Characteristics and classification of
Entisols in different soil moisture regimes of the Panjab. J. Ind. Soc. Soil. Sci., 42: 633-
640.
Chapter VIII References
221 | P a g e
Singh, V. N. and B. B. Mishra. 1994. Sodiumization of some Alfisols in toposequence
occuring in Indo-Gangetic plain of Bihar. J. Ind. Soc. Soil Sci. 42(4): 629-633.
Sinha, S. D., P. P. Tha and M. P. Singh. 1965. Studies on heavy textured soils of south
Bihar developed on alluvial sediments. J. Indian Soc. Soil. Sci. 13: 85-94.
Smith, H and L. D. Wilding. 1972. Some article. Soil Sci. Soc. Am. Proc. 36: 808
Soil Survey Staff. 1975. Soil Taxonomy : A basic system of soil classification for making
and interpreting soil surveys. US Department of Agriculture Handbook No. 436, US
Government Printing Office, Washington, D. C.
Soil Survey Staff. 1994. Keys to Soil Taxonomy. 6th edi. Soil Conservation Service,
USDA. Washington , D. C.
Soil Survey Staff. 1998. Soil Survey Manual. USDA Handbook No.18. US Govt. Printing
Office. Washington, D.C
Soil Survey Staff. 2003. Keys to Soil Taxonomy. 9th
Edi, United States Department of
agriculture, Washington, D.C.
Soil Survey Staff. 2014. Keys to Soil Taxonomy.12th
Edi, Natural Resource Conservation
Service, United States Department of agriculture, Washington, D.C.360 p.
Somani, L.L. 1991. Crop production with saline water. Agro Botanical Puublishers, Vyas
Nagar, India.
SRDI Staff. (1965-1986). Reconnaissance Soil Survey Report of different Districts of
Bangladesh. Soil Resource Development Institute (SRDI), Dhaka.
SRDI Staff. 1967. Reconnaissance soil survey of Barisal district of Bangladesh. Soil
Resource Development Institute (SRDI), Farmgate, Dhaka.
SRDI Staff. 2001. Soils Resources in Bangladesh: Assessment and Utilization. Soil
Resource Development Institute (SRDI), Ministry of Agriculture, Farmgate, Dhaka,
Bangladesh, p 105.
SRDI Staff. 2010. Saline Soils of Bangladesh. Soil Resource Development Institute
(SRDI), Ministry of Agriculture, Farmgate, Dhaka, Bangladesh.
Stoops, G and H. Eswaran, 1985. Morphological characteristics of wet soils: In: Wetland
Soils Characterization, Classification and Utilization. International Rice Research
Institute ( IRRI), Los Banos, Philipines. Pp. 177-189.
Strickling, E. 1956. Relationship of porosity to water stability. Soil Sci. 80: 331-335.
Szogi, A. A. and W. H. Hudnall. 1992. Classification of soils in Lausiana according to
“Endoaquic" and "epiaquic" concepts. Proc. 8th Intl. Soil Coffel. Meeting. Baton
Rouge. p. 271-278.
Tanaka, A. and S.Yoshida. 1970. Nutritional disorders of Rice plant in Asia. Int. Rice Res.
Inst. Tech. Bull. 10 : 51.
Taraqqi, A.K. and M.S. Hussain. 2007. Char Kukri Mukri: A pedological-edaphological
study. Nuclear. Sci. Application. 18: 60-67.
Chapter VIII References
222 | P a g e
Thawale, P. R, D. B. Matte, K. K. Thakare, V. S. Bhoyar and D. R. Kene. 1991.
Morphological feature and physico-chemical properties of soils of agricultural school
farm, Sawangi District, Nagpur. J. Soils and Crops. 1(2): 102-106.
Thorp. J. and G. D. Smith. 1949. Higher categories of soil classification-order, Suborder
and Great Soil Groups. Soil Sci. 67: 117.
Torrent, J. and W. D. Nettleton. 1979. A simple textural index for assessing chemical
weathering in soils. Soil Sci. Soc. Am. J. 43: 373-377.
Uhera, G., M.S. Nishina and G.y. Tsuji. 1979. The composition of Mckong River silt and
its possible role as a source of plant nutrient in Delta. The department of Agronomy
and Soil Science. College of tropical agriculture, University of Hawai, Honlulu, USA.
Umitsy, M.1993. Late Quaternary sedimentary environments and landforms in the Ganges
delta. Sediment Geol. 83: 177-186.
UN-ESCAP. 1988. Coastal environment management plan of Bangladesh. ESCAP office,
Dhaka.
USDA. 1951. Soil Survey Manual, Hand book, 18. 503 p.
USDA. 1975. Soil Taxonomy. Soil Survey Staff. Soil Conservation Service. Agricultural
Handbook No. 436.
USSL Staff, 1954. Diagnosis and Improvement of saline and alkali soils. USDA Handbook
no. 60, pp. 147.
Van Breemen, N. 1976. Genesis and Solution Chemistry of acid sulphate soils in Thailand.
Centre for agricultural publishing and documentation, Wageningen. The Netharlands.
Van Mensvoort, M. E., R. S. Lantin, R. Brinkman and N. Van Breemen. 1985.
Toxicities of wetland soils. In : Wetland Soils. Characterization, Classification and
Utilization. International Rice Research Institute. Los Banos, Leguna, Philippines.
Velayutham, M. and D. Raj. 1977. Available water capacity and its relationship with some
soil factors. J. Indian Soc. Soil Sci. 25: 439-441.
Walia, C. S. and G. S. Chamuah. 1992. Flood affected soils of Brahmaputra valley and
their suitability for land use planning. J. Indian Soc. Soil Sci. 40: 335-340.
Walkley ,A and I.A. Black. 1934. An examination of the Degtijareff method for
determining soil organic matter and a proposed modification of the chromic acid
titration method. Soil Sci. 37 : 29-38.
White, J. L. 1985. Clay mineralogy of some soils of Bangladesh. Consultant’s Report.
BARC, Dhaka, Bangladesh. 211p
Wiklander, l. 1965. Cation and anion exchange phenomena. In: F.E. Bear (ed). Chemistry
of the Soil. Reinold Publishing Corporation, New York. P. 163-205.
Wilding, L.P., N. E. Smeck and L.R. Drees. 1977. Silica in soils. : Quartz, Cristobalite,
Tridymite and opal. In. J.B. Dixon and S.B. Weed ( Editors). Minerals in Soil
Environments. Soil Sci. Soc. Am. Madison, Wisconsin, USA. P. 471-552.
Chapter VIII References
223 | P a g e
World Bank. 2001. Bangladesh: Climate Change and Sustainable Development, South
Asia Rural Development Team, World Bank Office, Dhaka.
World Reference Base (WRB). 2015. World Reference Base for Soil Resources. Food and
Agriculture Organization of the United Nations. Viale delle Terme di Caracalla, 00100
Rome, Italy.
Xing, B. and M.J. Dudas. 1992. Pedogenic properties of white clay soils of the three river
plain, Heilongjiang Province, People’s Republic of China. Geoderma. 54 : 187-221.
Zobeck, T. M. and A. Ritchie. 1984. Analysis of long-term water table depth records from
a hydrosequence of soils in central Ohio. Soil Sci. Soc. Am. J. 48: 119-135.
Zijevelt, N.F.W. 1980. Soil correlation tables for Bangladesh, FAO- UNDP Soil Survey
Interpretation Project, Soil Resource Development Institute, Dhaka, 64 p.
CHAPTER-9
APPENDICES
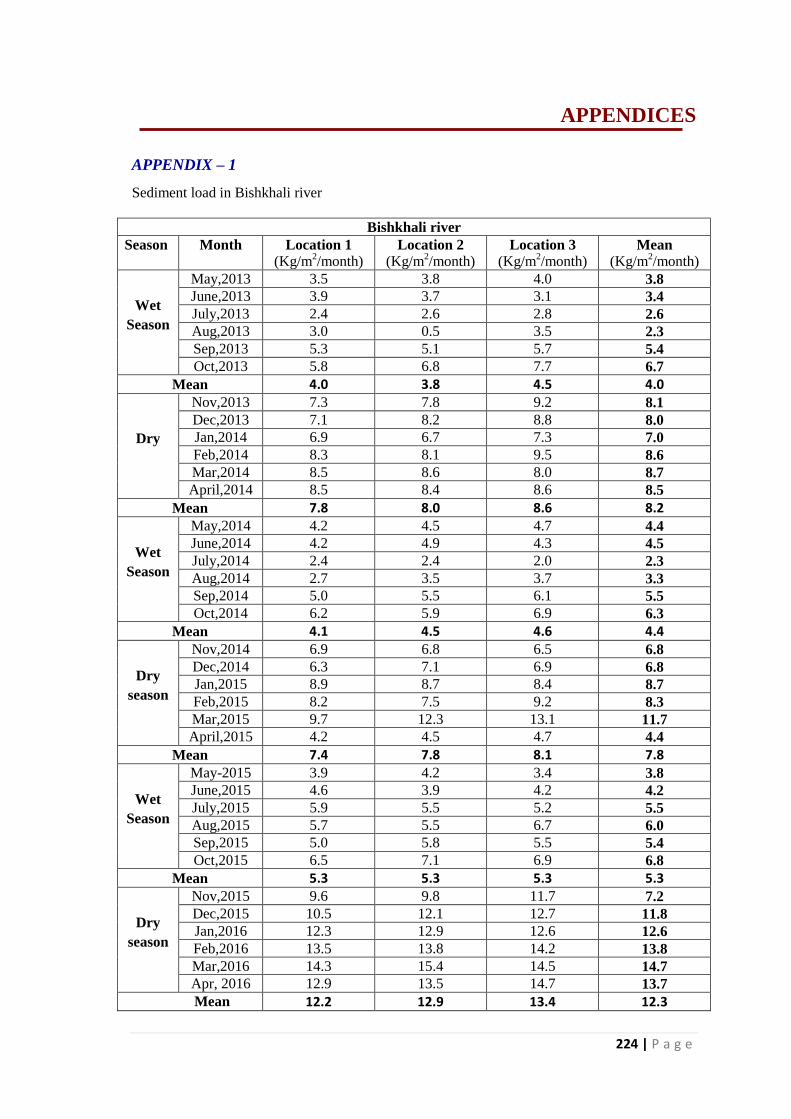
224 | P a g e
APPENDICES
APPENDIX – 1
Sediment load in Bishkhali river
Bishkhali river
Season Month Location 1
(Kg/m2/month)
Location 2
(Kg/m2/month)
Location 3
(Kg/m2/month)
Mean
(Kg/m2/month)
Wet
Season
May,2013 3.5 3.8 4.0 3.8
June,2013 3.9 3.7 3.1 3.4
July,2013 2.4 2.6 2.8 2.6
Aug,2013 3.0 0.5 3.5 2.3
Sep,2013 5.3 5.1 5.7 5.4
Oct,2013 5.8 6.8 7.7 6.7
Mean 4.0 3.8 4.5 4.0
Dry
Nov,2013 7.3 7.8 9.2 8.1
Dec,2013 7.1 8.2 8.8 8.0
Jan,2014 6.9 6.7 7.3 7.0
Feb,2014 8.3 8.1 9.5 8.6
Mar,2014 8.5 8.6 8.0 8.7
April,2014 8.5 8.4 8.6 8.5
Mean 7.8 8.0 8.6 8.2
Wet
Season
May,2014 4.2 4.5 4.7 4.4
June,2014 4.2 4.9 4.3 4.5
July,2014 2.4 2.4 2.0 2.3
Aug,2014 2.7 3.5 3.7 3.3
Sep,2014 5.0 5.5 6.1 5.5
Oct,2014 6.2 5.9 6.9 6.3
Mean 4.1 4.5 4.6 4.4
Dry
season
Nov,2014 6.9 6.8 6.5 6.8
Dec,2014 6.3 7.1 6.9 6.8
Jan,2015 8.9 8.7 8.4 8.7
Feb,2015 8.2 7.5 9.2 8.3
Mar,2015 9.7 12.3 13.1 11.7
April,2015 4.2 4.5 4.7 4.4
Mean 7.4 7.8 8.1 7.8
Wet
Season
May-2015 3.9 4.2 3.4 3.8
June,2015 4.6 3.9 4.2 4.2
July,2015 5.9 5.5 5.2 5.5
Aug,2015 5.7 5.5 6.7 6.0
Sep,2015 5.0 5.8 5.5 5.4
Oct,2015 6.5 7.1 6.9 6.8
Mean 5.3 5.3 5.3 5.3
Dry
season
Nov,2015 9.6 9.8 11.7 7.2
Dec,2015 10.5 12.1 12.7 11.8
Jan,2016 12.3 12.9 12.6 12.6
Feb,2016 13.5 13.8 14.2 13.8
Mar,2016 14.3 15.4 14.5 14.7
Apr, 2016 12.9 13.5 14.7 13.7
Mean 12.2 12.9 13.4 12.3
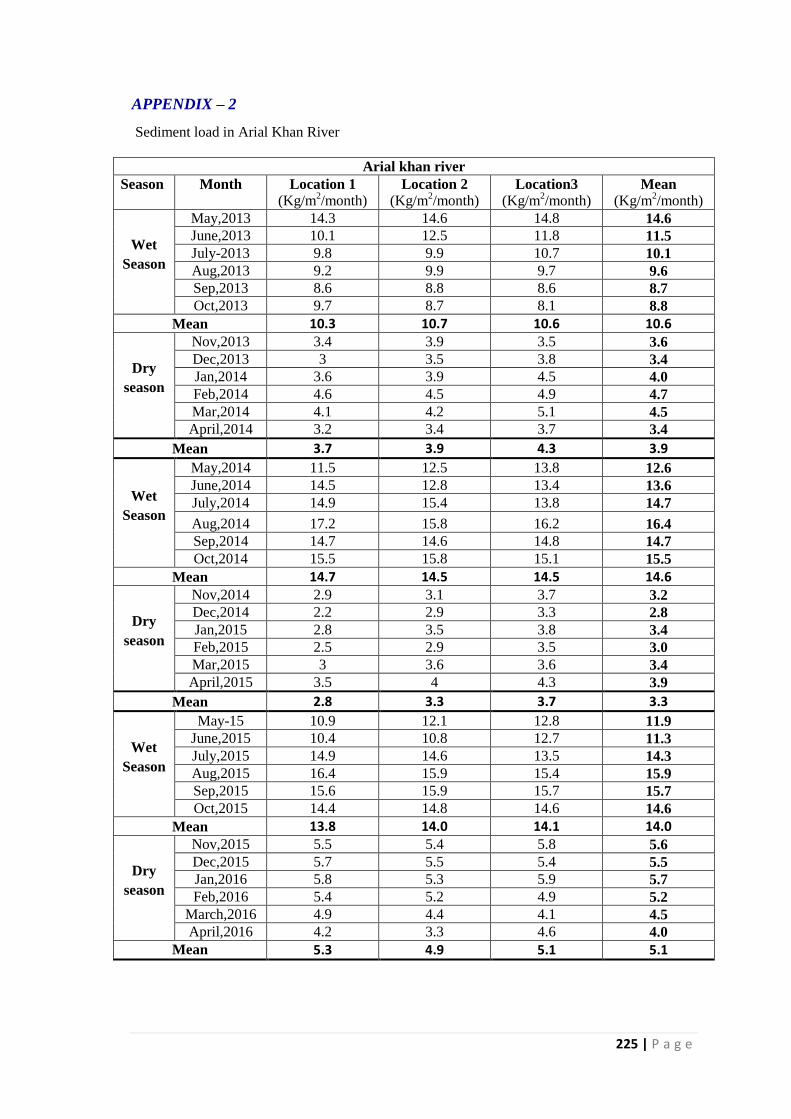
225 | P a g e
APPENDIX – 2
Sediment load in Arial Khan River
Arial khan river
Season Month Location 1
(Kg/m2/month)
Location 2
(Kg/m2/month)
Location3
(Kg/m2/month)
Mean
(Kg/m2/month)
Wet
Season
May,2013 14.3 14.6 14.8 14.6
June,2013 10.1 12.5 11.8 11.5
July-2013 9.8 9.9 10.7 10.1
Aug,2013 9.2 9.9 9.7 9.6
Sep,2013 8.6 8.8 8.6 8.7
Oct,2013 9.7 8.7 8.1 8.8
Mean 10.3 10.7 10.6 10.6
Dry
season
Nov,2013 3.4 3.9 3.5 3.6
Dec,2013 3 3.5 3.8 3.4
Jan,2014 3.6 3.9 4.5 4.0
Feb,2014 4.6 4.5 4.9 4.7
Mar,2014 4.1 4.2 5.1 4.5
April,2014 3.2 3.4 3.7 3.4
Mean 3.7 3.9 4.3 3.9
Wet
Season
May,2014 11.5 12.5 13.8 12.6
June,2014 14.5 12.8 13.4 13.6
July,2014 14.9 15.4 13.8 14.7
Aug,2014 17.2 15.8 16.2 16.4
Sep,2014 14.7 14.6 14.8 14.7
Oct,2014 15.5 15.8 15.1 15.5
Mean 14.7 14.5 14.5 14.6
Dry
season
Nov,2014 2.9 3.1 3.7 3.2
Dec,2014 2.2 2.9 3.3 2.8
Jan,2015 2.8 3.5 3.8 3.4
Feb,2015 2.5 2.9 3.5 3.0
Mar,2015 3 3.6 3.6 3.4
April,2015 3.5 4 4.3 3.9
Mean 2.8 3.3 3.7 3.3
Wet
Season
May-15 10.9 12.1 12.8 11.9
June,2015 10.4 10.8 12.7 11.3
July,2015 14.9 14.6 13.5 14.3
Aug,2015 16.4 15.9 15.4 15.9
Sep,2015 15.6 15.9 15.7 15.7
Oct,2015 14.4 14.8 14.6 14.6
Mean 13.8 14.0 14.1 14.0
Dry
season
Nov,2015 5.5 5.4 5.8 5.6
Dec,2015 5.7 5.5 5.4 5.5
Jan,2016 5.8 5.3 5.9 5.7
Feb,2016 5.4 5.2 4.9 5.2
March,2016 4.9 4.4 4.1 4.5
April,2016 4.2 3.3 4.6 4.0
Mean 5.3 4.9 5.1 5.1
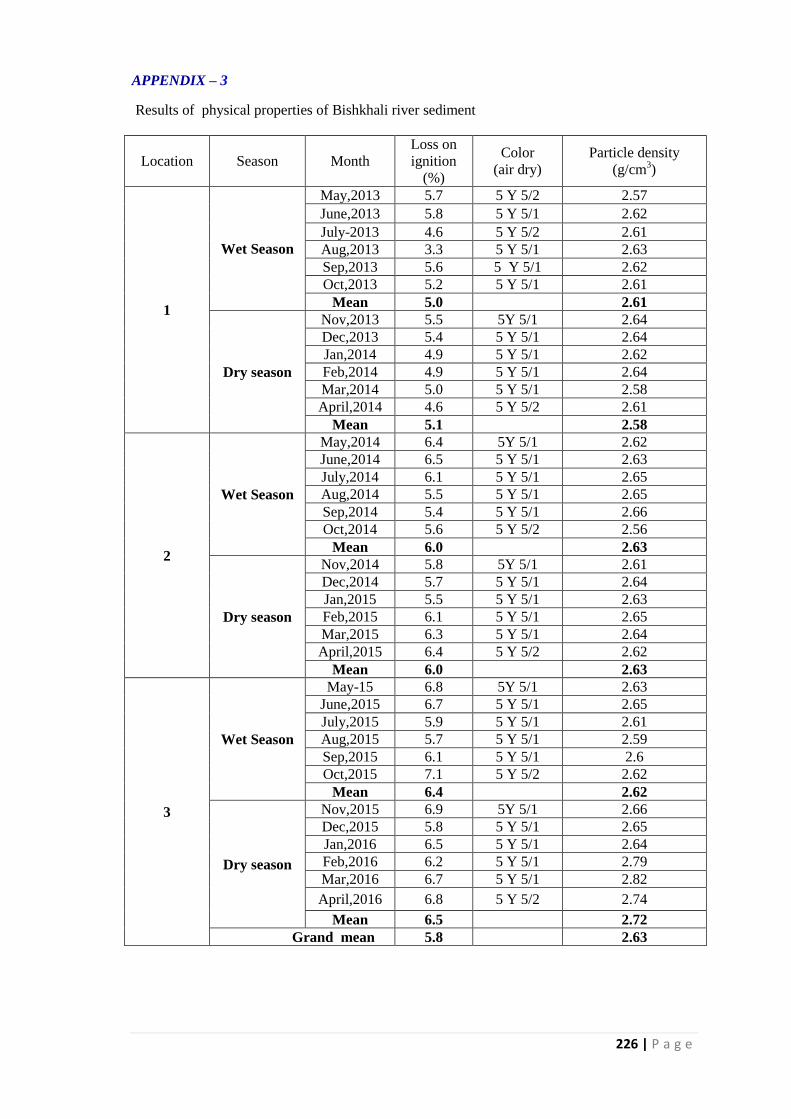
226 | P a g e
APPENDIX – 3
Results of physical properties of Bishkhali river sediment
Location Season Month
Loss on
ignition
(%)
Color
(air dry)
Particle density
(g/cm3)
1
Wet Season
May,2013 5.7 5 Y 5/2 2.57
June,2013 5.8 5 Y 5/1 2.62
July-2013 4.6 5 Y 5/2 2.61
Aug,2013 3.3 5 Y 5/1 2.63
Sep,2013 5.6 5 Y 5/1 2.62
Oct,2013 5.2 5 Y 5/1 2.61
Mean 5.0 2.61
Dry season
Nov,2013 5.5 5Y 5/1 2.64
Dec,2013 5.4 5 Y 5/1 2.64
Jan,2014 4.9 5 Y 5/1 2.62
Feb,2014 4.9 5 Y 5/1 2.64
Mar,2014 5.0 5 Y 5/1 2.58
April,2014 4.6 5 Y 5/2 2.61
Mean 5.1 2.58
2
Wet Season
May,2014 6.4 5Y 5/1 2.62
June,2014 6.5 5 Y 5/1 2.63
July,2014 6.1 5 Y 5/1 2.65
Aug,2014 5.5 5 Y 5/1 2.65
Sep,2014 5.4 5 Y 5/1 2.66
Oct,2014 5.6 5 Y 5/2 2.56
Mean 6.0 2.63
Dry season
Nov,2014 5.8 5Y 5/1 2.61
Dec,2014 5.7 5 Y 5/1 2.64
Jan,2015 5.5 5 Y 5/1 2.63
Feb,2015 6.1 5 Y 5/1 2.65
Mar,2015 6.3 5 Y 5/1 2.64
April,2015 6.4 5 Y 5/2 2.62
Mean 6.0 2.63
3
Wet Season
May-15 6.8 5Y 5/1 2.63
June,2015 6.7 5 Y 5/1 2.65
July,2015 5.9 5 Y 5/1 2.61
Aug,2015 5.7 5 Y 5/1 2.59
Sep,2015 6.1 5 Y 5/1 2.6
Oct,2015 7.1 5 Y 5/2 2.62
Mean 6.4 2.62
Dry season
Nov,2015 6.9 5Y 5/1 2.66
Dec,2015 5.8 5 Y 5/1 2.65
Jan,2016 6.5 5 Y 5/1 2.64
Feb,2016 6.2 5 Y 5/1 2.79
Mar,2016 6.7 5 Y 5/1 2.82
April,2016 6.8 5 Y 5/2 2.74
Mean 6.5 2.72
Grand mean 5.8 2.63
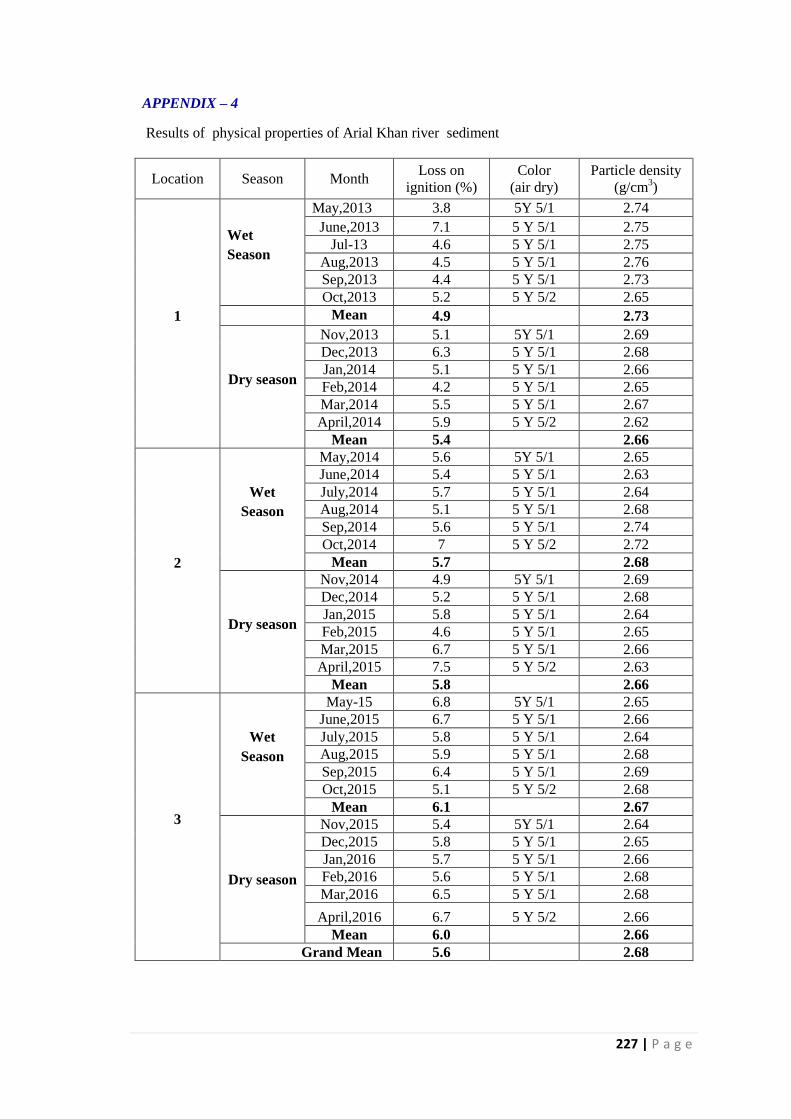
227 | P a g e
APPENDIX – 4
Results of physical properties of Arial Khan river sediment
Location Season Month Loss on
ignition (%)
Color
(air dry)
Particle density
(g/cm3)
1
Wet
Season
May,2013 3.8 5Y 5/1 2.74
June,2013 7.1 5 Y 5/1 2.75
Jul-13 4.6 5 Y 5/1 2.75
Aug,2013 4.5 5 Y 5/1 2.76
Sep,2013 4.4 5 Y 5/1 2.73
Oct,2013 5.2 5 Y 5/2 2.65
Mean 4.9 2.73
Dry season
Nov,2013 5.1 5Y 5/1 2.69
Dec,2013 6.3 5 Y 5/1 2.68
Jan,2014 5.1 5 Y 5/1 2.66
Feb,2014 4.2 5 Y 5/1 2.65
Mar,2014 5.5 5 Y 5/1 2.67
April,2014 5.9 5 Y 5/2 2.62
Mean 5.4 2.66
2
Wet
Season
May,2014 5.6 5Y 5/1 2.65
June,2014 5.4 5 Y 5/1 2.63
July,2014 5.7 5 Y 5/1 2.64
Aug,2014 5.1 5 Y 5/1 2.68
Sep,2014 5.6 5 Y 5/1 2.74
Oct,2014 7 5 Y 5/2 2.72
Mean 5.7 2.68
Dry season
Nov,2014 4.9 5Y 5/1 2.69
Dec,2014 5.2 5 Y 5/1 2.68
Jan,2015 5.8 5 Y 5/1 2.64
Feb,2015 4.6 5 Y 5/1 2.65
Mar,2015 6.7 5 Y 5/1 2.66
April,2015 7.5 5 Y 5/2 2.63
Mean 5.8 2.66
3
Wet
Season
May-15 6.8 5Y 5/1 2.65
June,2015 6.7 5 Y 5/1 2.66
July,2015 5.8 5 Y 5/1 2.64
Aug,2015 5.9 5 Y 5/1 2.68
Sep,2015 6.4 5 Y 5/1 2.69
Oct,2015 5.1 5 Y 5/2 2.68
Mean 6.1 2.67
Dry season
Nov,2015 5.4 5Y 5/1 2.64
Dec,2015 5.8 5 Y 5/1 2.65
Jan,2016 5.7 5 Y 5/1 2.66
Feb,2016 5.6 5 Y 5/1 2.68
Mar,2016 6.5 5 Y 5/1 2.68
April,2016 6.7 5 Y 5/2 2.66
Mean 6.0 2.66
Grand Mean 5.6 2.68
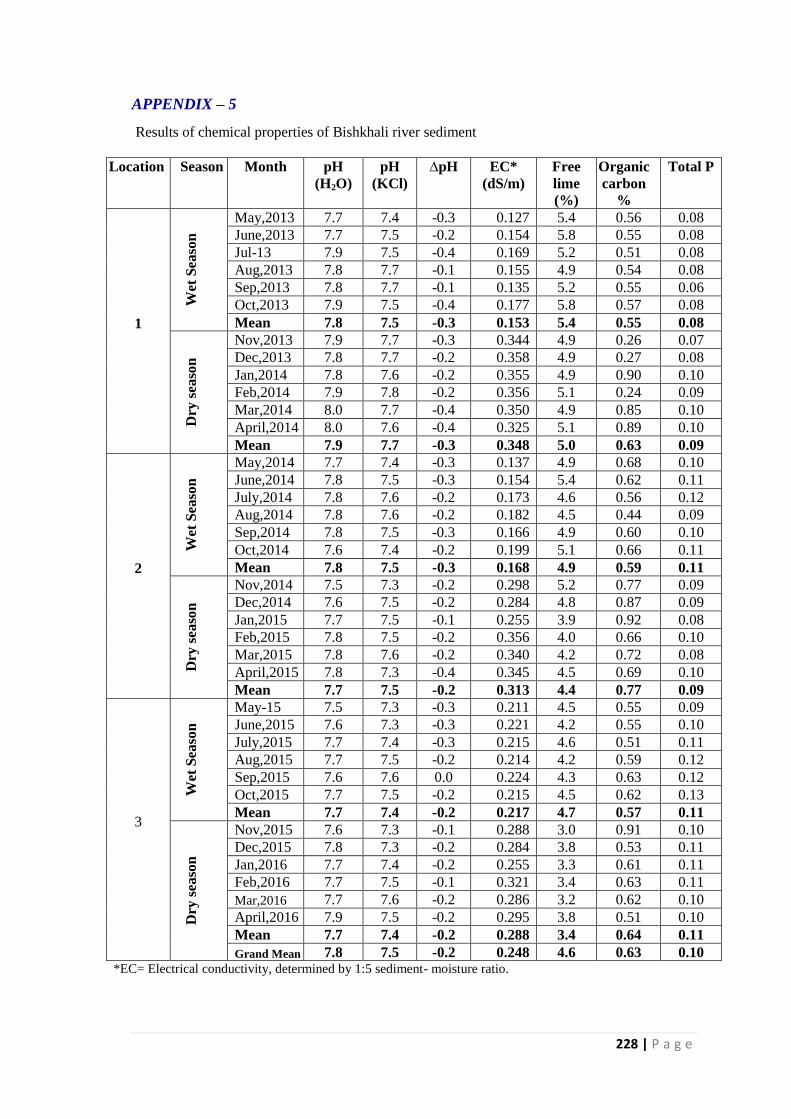
228 | P a g e
APPENDIX – 5
Results of chemical properties of Bishkhali river sediment
Location Season Month pH
(H2O)
pH
(KCl)
∆pH EC*
(dS/m)
Free
lime
(%)
Organic
carbon
%
Total P
1
Wet
Sea
son
May,2013 7.7 7.4 -0.3 0.127 5.4 0.56 0.08
June,2013 7.7 7.5 -0.2 0.154 5.8 0.55 0.08
Jul-13 7.9 7.5 -0.4 0.169 5.2 0.51 0.08
Aug,2013 7.8 7.7 -0.1 0.155 4.9 0.54 0.08
Sep,2013 7.8 7.7 -0.1 0.135 5.2 0.55 0.06
Oct,2013 7.9 7.5 -0.4 0.177 5.8 0.57 0.08
Mean 7.8 7.5 -0.3 0.153 5.4 0.55 0.08
Dry
sea
son
Nov,2013 7.9 7.7 -0.3 0.344 4.9 0.26 0.07
Dec,2013 7.8 7.7 -0.2 0.358 4.9 0.27 0.08
Jan,2014 7.8 7.6 -0.2 0.355 4.9 0.90 0.10
Feb,2014 7.9 7.8 -0.2 0.356 5.1 0.24 0.09
Mar,2014 8.0 7.7 -0.4 0.350 4.9 0.85 0.10
April,2014 8.0 7.6 -0.4 0.325 5.1 0.89 0.10
Mean 7.9 7.7 -0.3 0.348 5.0 0.63 0.09
2
Wet
Sea
son
May,2014 7.7 7.4 -0.3 0.137 4.9 0.68 0.10
June,2014 7.8 7.5 -0.3 0.154 5.4 0.62 0.11
July,2014 7.8 7.6 -0.2 0.173 4.6 0.56 0.12
Aug,2014 7.8 7.6 -0.2 0.182 4.5 0.44 0.09
Sep,2014 7.8 7.5 -0.3 0.166 4.9 0.60 0.10
Oct,2014 7.6 7.4 -0.2 0.199 5.1 0.66 0.11
Mean 7.8 7.5 -0.3 0.168 4.9 0.59 0.11
Dry
sea
son
Nov,2014 7.5 7.3 -0.2 0.298 5.2 0.77 0.09
Dec,2014 7.6 7.5 -0.2 0.284 4.8 0.87 0.09
Jan,2015 7.7 7.5 -0.1 0.255 3.9 0.92 0.08
Feb,2015 7.8 7.5 -0.2 0.356 4.0 0.66 0.10
Mar,2015 7.8 7.6 -0.2 0.340 4.2 0.72 0.08
April,2015 7.8 7.3 -0.4 0.345 4.5 0.69 0.10
Mean 7.7 7.5 -0.2 0.313 4.4 0.77 0.09
3
Wet
Sea
son
May-15 7.5 7.3 -0.3 0.211 4.5 0.55 0.09
June,2015 7.6 7.3 -0.3 0.221 4.2 0.55 0.10
July,2015 7.7 7.4 -0.3 0.215 4.6 0.51 0.11
Aug,2015 7.7 7.5 -0.2 0.214 4.2 0.59 0.12
Sep,2015 7.6 7.6 0.0 0.224 4.3 0.63 0.12
Oct,2015 7.7 7.5 -0.2 0.215 4.5 0.62 0.13
Mean 7.7 7.4 -0.2 0.217 4.7 0.57 0.11
Dry
sea
son
Nov,2015 7.6 7.3 -0.1 0.288 3.0 0.91 0.10
Dec,2015 7.8 7.3 -0.2 0.284 3.8 0.53 0.11
Jan,2016 7.7 7.4 -0.2 0.255 3.3 0.61 0.11
Feb,2016 7.7 7.5 -0.1 0.321 3.4 0.63 0.11
Mar,2016 7.7 7.6 -0.2 0.286 3.2 0.62 0.10
April,2016 7.9 7.5 -0.2 0.295 3.8 0.51 0.10
Mean 7.7 7.4 -0.2 0.288 3.4 0.64 0.11
Grand Mean 7.8 7.5 -0.2 0.248 4.6 0.63 0.10 *EC= Electrical conductivity, determined by 1:5 sediment- moisture ratio.
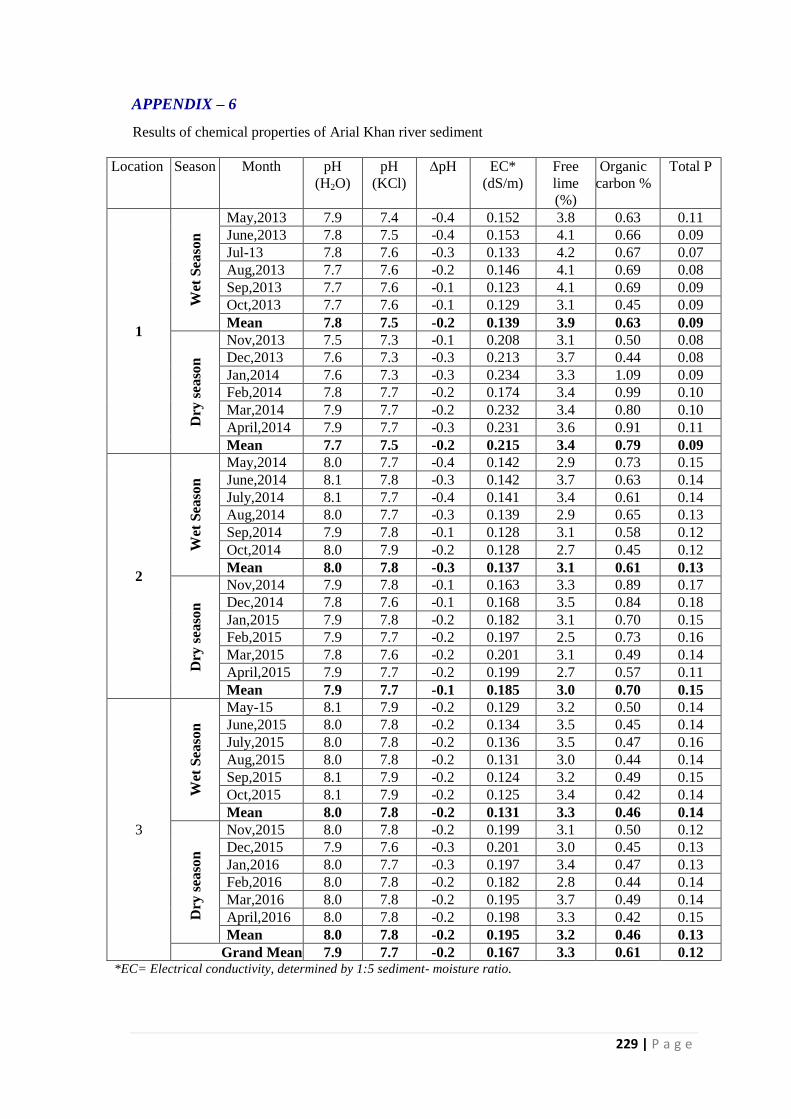
229 | P a g e
APPENDIX – 6
Results of chemical properties of Arial Khan river sediment
Location Season Month pH
(H2O)
pH
(KCl)
∆pH EC*
(dS/m)
Free
lime
(%)
Organic
carbon %
Total P
1
Wet
Sea
son
May,2013 7.9 7.4 -0.4 0.152 3.8 0.63 0.11
June,2013 7.8 7.5 -0.4 0.153 4.1 0.66 0.09
Jul-13 7.8 7.6 -0.3 0.133 4.2 0.67 0.07
Aug,2013 7.7 7.6 -0.2 0.146 4.1 0.69 0.08
Sep,2013 7.7 7.6 -0.1 0.123 4.1 0.69 0.09
Oct,2013 7.7 7.6 -0.1 0.129 3.1 0.45 0.09
Mean 7.8 7.5 -0.2 0.139 3.9 0.63 0.09
Dry
sea
son
Nov,2013 7.5 7.3 -0.1 0.208 3.1 0.50 0.08
Dec,2013 7.6 7.3 -0.3 0.213 3.7 0.44 0.08
Jan,2014 7.6 7.3 -0.3 0.234 3.3 1.09 0.09
Feb,2014 7.8 7.7 -0.2 0.174 3.4 0.99 0.10
Mar,2014 7.9 7.7 -0.2 0.232 3.4 0.80 0.10
April,2014 7.9 7.7 -0.3 0.231 3.6 0.91 0.11
Mean 7.7 7.5 -0.2 0.215 3.4 0.79 0.09
2
Wet
Sea
son
May,2014 8.0 7.7 -0.4 0.142 2.9 0.73 0.15
June,2014 8.1 7.8 -0.3 0.142 3.7 0.63 0.14
July,2014 8.1 7.7 -0.4 0.141 3.4 0.61 0.14
Aug,2014 8.0 7.7 -0.3 0.139 2.9 0.65 0.13
Sep,2014 7.9 7.8 -0.1 0.128 3.1 0.58 0.12
Oct,2014 8.0 7.9 -0.2 0.128 2.7 0.45 0.12
Mean 8.0 7.8 -0.3 0.137 3.1 0.61 0.13
Dry
sea
son
Nov,2014 7.9 7.8 -0.1 0.163 3.3 0.89 0.17
Dec,2014 7.8 7.6 -0.1 0.168 3.5 0.84 0.18
Jan,2015 7.9 7.8 -0.2 0.182 3.1 0.70 0.15
Feb,2015 7.9 7.7 -0.2 0.197 2.5 0.73 0.16
Mar,2015 7.8 7.6 -0.2 0.201 3.1 0.49 0.14
April,2015 7.9 7.7 -0.2 0.199 2.7 0.57 0.11
Mean 7.9 7.7 -0.1 0.185 3.0 0.70 0.15
3
Wet
Sea
son
May-15 8.1 7.9 -0.2 0.129 3.2 0.50 0.14
June,2015 8.0 7.8 -0.2 0.134 3.5 0.45 0.14
July,2015 8.0 7.8 -0.2 0.136 3.5 0.47 0.16
Aug,2015 8.0 7.8 -0.2 0.131 3.0 0.44 0.14
Sep,2015 8.1 7.9 -0.2 0.124 3.2 0.49 0.15
Oct,2015 8.1 7.9 -0.2 0.125 3.4 0.42 0.14
Mean 8.0 7.8 -0.2 0.131 3.3 0.46 0.14
Dry
sea
son
Nov,2015 8.0 7.8 -0.2 0.199 3.1 0.50 0.12
Dec,2015 7.9 7.6 -0.3 0.201 3.0 0.45 0.13
Jan,2016 8.0 7.7 -0.3 0.197 3.4 0.47 0.13
Feb,2016 8.0 7.8 -0.2 0.182 2.8 0.44 0.14
Mar,2016 8.0 7.8 -0.2 0.195 3.7 0.49 0.14
April,2016 8.0 7.8 -0.2 0.198 3.3 0.42 0.15
Mean 8.0 7.8 -0.2 0.195 3.2 0.46 0.13
Grand Mean 7.9 7.7 -0.2 0.167 3.3 0.61 0.12 *EC= Electrical conductivity, determined by 1:5 sediment- moisture ratio.
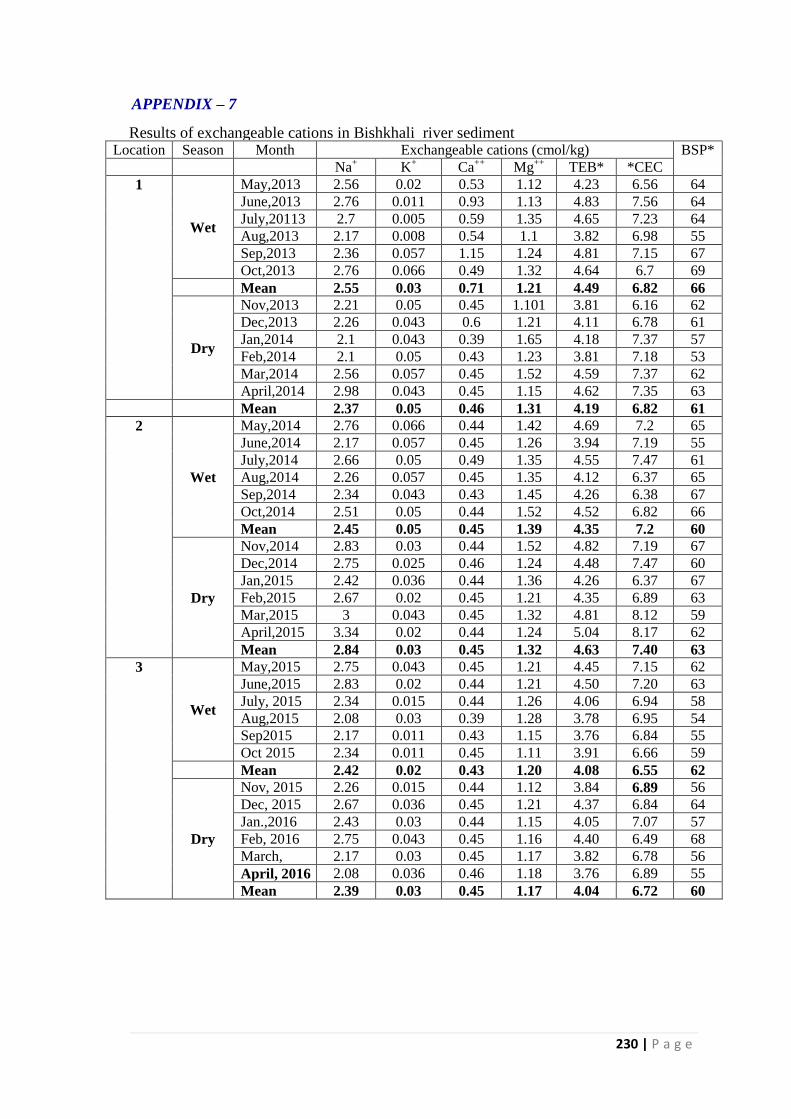
230 | P a g e
APPENDIX – 7
Results of exchangeable cations in Bishkhali river sediment
Location Season Month Exchangeable cations (cmol/kg) BSP*
Na+ K
+ Ca
++ Mg
++ TEB* *CEC
1
Wet
May,2013 2.56 0.02 0.53 1.12 4.23 6.56 64
June,2013 2.76 0.011 0.93 1.13 4.83 7.56 64
July,20113 2.7 0.005 0.59 1.35 4.65 7.23 64
Aug,2013 2.17 0.008 0.54 1.1 3.82 6.98 55
Sep,2013 2.36 0.057 1.15 1.24 4.81 7.15 67
Oct,2013 2.76 0.066 0.49 1.32 4.64 6.7 69
Mean 2.55 0.03 0.71 1.21 4.49 6.82 66
Dry
Nov,2013 2.21 0.05 0.45 1.101 3.81 6.16 62
Dec,2013 2.26 0.043 0.6 1.21 4.11 6.78 61
Jan,2014 2.1 0.043 0.39 1.65 4.18 7.37 57
Feb,2014 2.1 0.05 0.43 1.23 3.81 7.18 53
Mar,2014 2.56 0.057 0.45 1.52 4.59 7.37 62
April,2014 2.98 0.043 0.45 1.15 4.62 7.35 63
Mean 2.37 0.05 0.46 1.31 4.19 6.82 61
2
Wet
May,2014 2.76 0.066 0.44 1.42 4.69 7.2 65
June,2014 2.17 0.057 0.45 1.26 3.94 7.19 55
July,2014 2.66 0.05 0.49 1.35 4.55 7.47 61
Aug,2014 2.26 0.057 0.45 1.35 4.12 6.37 65
Sep,2014 2.34 0.043 0.43 1.45 4.26 6.38 67
Oct,2014 2.51 0.05 0.44 1.52 4.52 6.82 66
Mean 2.45 0.05 0.45 1.39 4.35 7.2 60
Dry
Nov,2014 2.83 0.03 0.44 1.52 4.82 7.19 67
Dec,2014 2.75 0.025 0.46 1.24 4.48 7.47 60
Jan,2015 2.42 0.036 0.44 1.36 4.26 6.37 67
Feb,2015 2.67 0.02 0.45 1.21 4.35 6.89 63
Mar,2015 3 0.043 0.45 1.32 4.81 8.12 59
April,2015 3.34 0.02 0.44 1.24 5.04 8.17 62
Mean 2.84 0.03 0.45 1.32 4.63 7.40 63
3
Wet
May,2015 2.75 0.043 0.45 1.21 4.45 7.15 62
June,2015 2.83 0.02 0.44 1.21 4.50 7.20 63
July, 2015
October,
2015
Nov, 2015
Dec, 2015
2.34 0.015 0.44 1.26 4.06 6.94 58
Aug,2015 2.08 0.03 0.39 1.28 3.78 6.95 54
Sep2015 2.17 0.011 0.43 1.15 3.76 6.84 55
Oct 2015 2.34 0.011 0.45 1.11 3.91 6.66 59
Mean 2.42 0.02 0.43 1.20 4.08 6.55 62
Dry
Nov, 2015 2.26 0.015 0.44 1.12 3.84 6.89 56
Dec, 2015 2.67 0.036 0.45 1.21 4.37 6.84 64
Jan.,2016 2.43 0.03 0.44 1.15 4.05 7.07 57
Feb, 2016 2.75 0.043 0.45 1.16 4.40 6.49 68
March,
2016
2.17 0.03 0.45 1.17 3.82 6.78 56
April, 2016 2.08 0.036 0.46 1.18 3.76 6.89 55
Mean 2.39 0.03 0.45 1.17 4.04 6.72 60
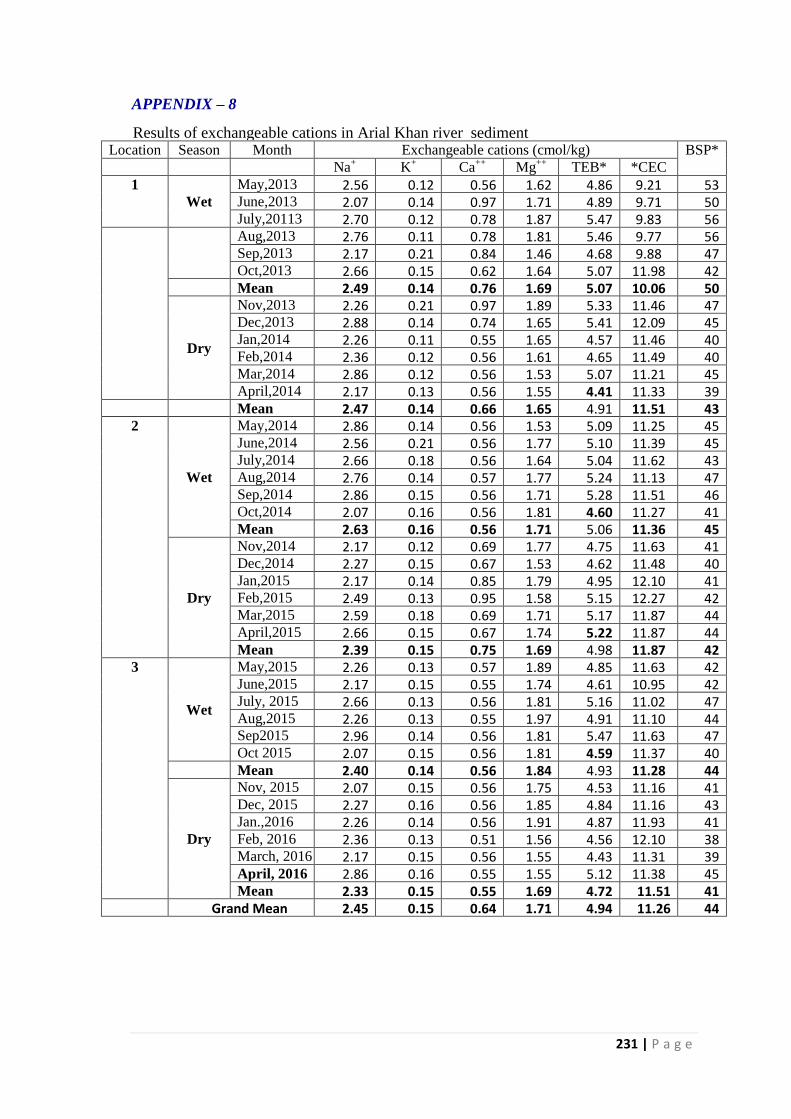
231 | P a g e
APPENDIX – 8
Results of exchangeable cations in Arial Khan river sediment
Location Season Month Exchangeable cations (cmol/kg) BSP*
Na+ K
+ Ca
++ Mg
++ TEB* *CEC
1
Wet
May,2013 2.56 0.12 0.56 1.62 4.86 9.21 53 June,2013 2.07 0.14 0.97 1.71 4.89 9.71 50 July,20113 2.70 0.12 0.78 1.87 5.47 9.83 56
Aug,2013 2.76 0.11 0.78 1.81 5.46 9.77 56 Sep,2013 2.17 0.21 0.84 1.46 4.68 9.88 47 Oct,2013 2.66 0.15 0.62 1.64 5.07 11.98 42
Mean 2.49 0.14 0.76 1.69 5.07 10.06 50
Dry
Nov,2013 2.26 0.21 0.97 1.89 5.33 11.46 47 Dec,2013 2.88 0.14 0.74 1.65 5.41 12.09 45 Jan,2014 2.26 0.11 0.55 1.65 4.57 11.46 40 Feb,2014 2.36 0.12 0.56 1.61 4.65 11.49 40 Mar,2014 2.86 0.12 0.56 1.53 5.07 11.21 45 April,2014 2.17 0.13 0.56 1.55 4.41 11.33 39
Mean 2.47 0.14 0.66 1.65 4.91 11.51 43 2
Wet
May,2014 2.86 0.14 0.56 1.53 5.09 11.25 45 June,2014 2.56 0.21 0.56 1.77 5.10 11.39 45 July,2014 2.66 0.18 0.56 1.64 5.04 11.62 43 Aug,2014 2.76 0.14 0.57 1.77 5.24 11.13 47 Sep,2014 2.86 0.15 0.56 1.71 5.28 11.51 46 Oct,2014 2.07 0.16 0.56 1.81 4.60 11.27 41 Mean 2.63 0.16 0.56 1.71 5.06 11.36 45
Dry
Nov,2014 2.17 0.12 0.69 1.77 4.75 11.63 41 Dec,2014 2.27 0.15 0.67 1.53 4.62 11.48 40 Jan,2015 2.17 0.14 0.85 1.79 4.95 12.10 41 Feb,2015 2.49 0.13 0.95 1.58 5.15 12.27 42 Mar,2015 2.59 0.18 0.69 1.71 5.17 11.87 44 April,2015 2.66 0.15 0.67 1.74 5.22 11.87 44 Mean 2.39 0.15 0.75 1.69 4.98 11.87 42
3
Wet
May,2015 2.26 0.13 0.57 1.89 4.85 11.63 42 June,2015 2.17 0.15 0.55 1.74 4.61 10.95 42 July, 2015
October,
2015
Nov, 2015
Dec, 2015
2.66 0.13 0.56 1.81 5.16 11.02 47 Aug,2015 2.26 0.13 0.55 1.97 4.91 11.10 44 Sep2015 2.96 0.14 0.56 1.81 5.47 11.63 47 Oct 2015 2.07 0.15 0.56 1.81 4.59 11.37 40
Mean 2.40 0.14 0.56 1.84 4.93 11.28 44
Dry
Nov, 2015 2.07 0.15 0.56 1.75 4.53 11.16 41 Dec, 2015 2.27 0.16 0.56 1.85 4.84 11.16 43 Jan.,2016 2.26 0.14 0.56 1.91 4.87 11.93 41 Feb, 2016 2.36 0.13 0.51 1.56 4.56 12.10 38 March, 2016 2.17 0.15 0.56 1.55 4.43 11.31 39 April, 2016 2.86 0.16 0.55 1.55 5.12 11.38 45 Mean 2.33 0.15 0.55 1.69 4.72 11.51 41
Grand Mean 2.45 0.15 0.64 1.71 4.94 11.26 44
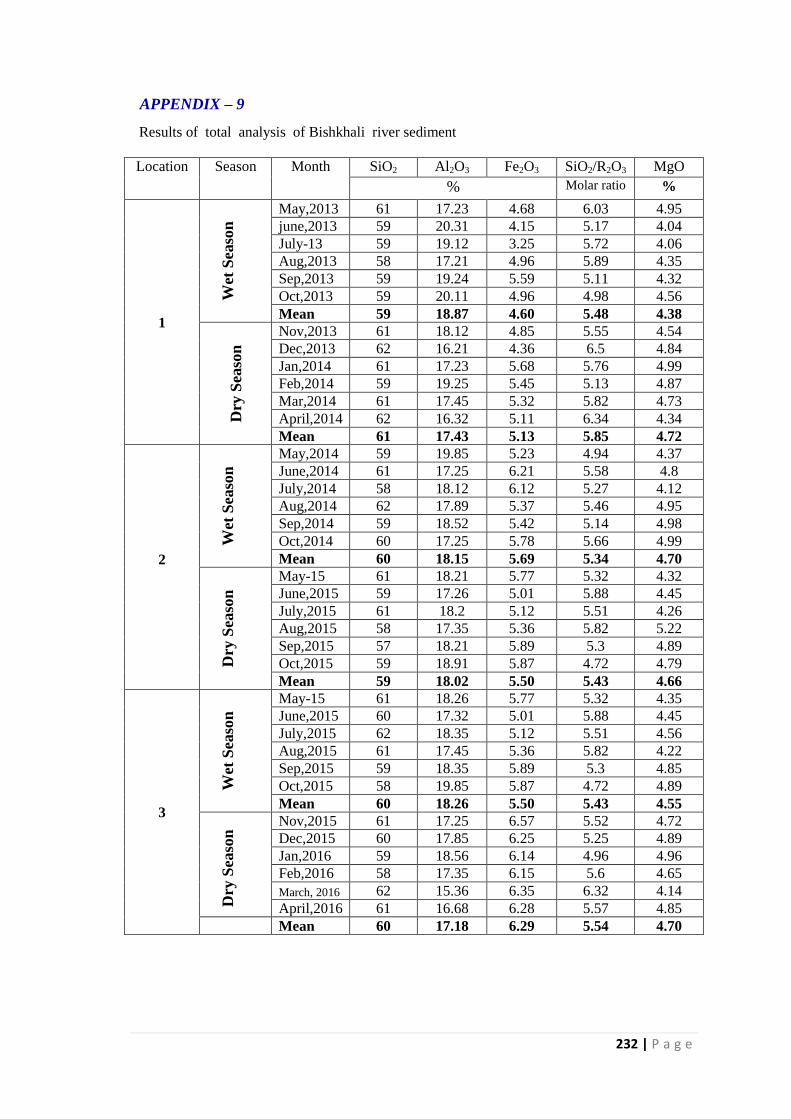
232 | P a g e
APPENDIX – 9
Results of total analysis of Bishkhali river sediment
Location Season Month SiO2 Al2O3 Fe2O3 SiO2/R2O3 MgO
% Molar ratio %
1
Wet
Sea
son
May,2013 61 17.23 4.68 6.03 4.95
june,2013 59 20.31 4.15 5.17 4.04
July-13 59 19.12 3.25 5.72 4.06
Aug,2013 58 17.21 4.96 5.89 4.35
Sep,2013 59 19.24 5.59 5.11 4.32
Oct,2013 59 20.11 4.96 4.98 4.56
Mean 59 18.87 4.60 5.48 4.38
Dry
Sea
son
Nov,2013 61 18.12 4.85 5.55 4.54
Dec,2013 62 16.21 4.36 6.5 4.84
Jan,2014 61 17.23 5.68 5.76 4.99
Feb,2014 59 19.25 5.45 5.13 4.87
Mar,2014 61 17.45 5.32 5.82 4.73
April,2014 62 16.32 5.11 6.34 4.34
Mean 61 17.43 5.13 5.85 4.72
2
Wet
Sea
son
May,2014 59 19.85 5.23 4.94 4.37
June,2014 61 17.25 6.21 5.58 4.8
July,2014 58 18.12 6.12 5.27 4.12
Aug,2014 62 17.89 5.37 5.46 4.95
Sep,2014 59 18.52 5.42 5.14 4.98
Oct,2014 60 17.25 5.78 5.66 4.99
Mean 60 18.15 5.69 5.34 4.70
Dry
Sea
son
May-15 61 18.21 5.77 5.32 4.32
June,2015 59 17.26 5.01 5.88 4.45
July,2015 61 18.2 5.12 5.51 4.26
Aug,2015 58 17.35 5.36 5.82 5.22
Sep,2015 57 18.21 5.89 5.3 4.89
Oct,2015 59 18.91 5.87 4.72 4.79
Mean 59 18.02 5.50 5.43 4.66
3
Wet
Sea
son
May-15 61 18.26 5.77 5.32 4.35
June,2015 60 17.32 5.01 5.88 4.45
July,2015 62 18.35 5.12 5.51 4.56
Aug,2015 61 17.45 5.36 5.82 4.22
Sep,2015 59 18.35 5.89 5.3 4.85
Oct,2015 58 19.85 5.87 4.72 4.89
Mean 60 18.26 5.50 5.43 4.55
Dry
Sea
son
Nov,2015 61 17.25 6.57 5.52 4.72
Dec,2015 60 17.85 6.25 5.25 4.89
Jan,2016 59 18.56 6.14 4.96 4.96
Feb,2016 58 17.35 6.15 5.6 4.65
March, 2016 62 15.36 6.35 6.32 4.14
April,2016 61 16.68 6.28 5.57 4.85
Mean 60 17.18 6.29 5.54 4.70
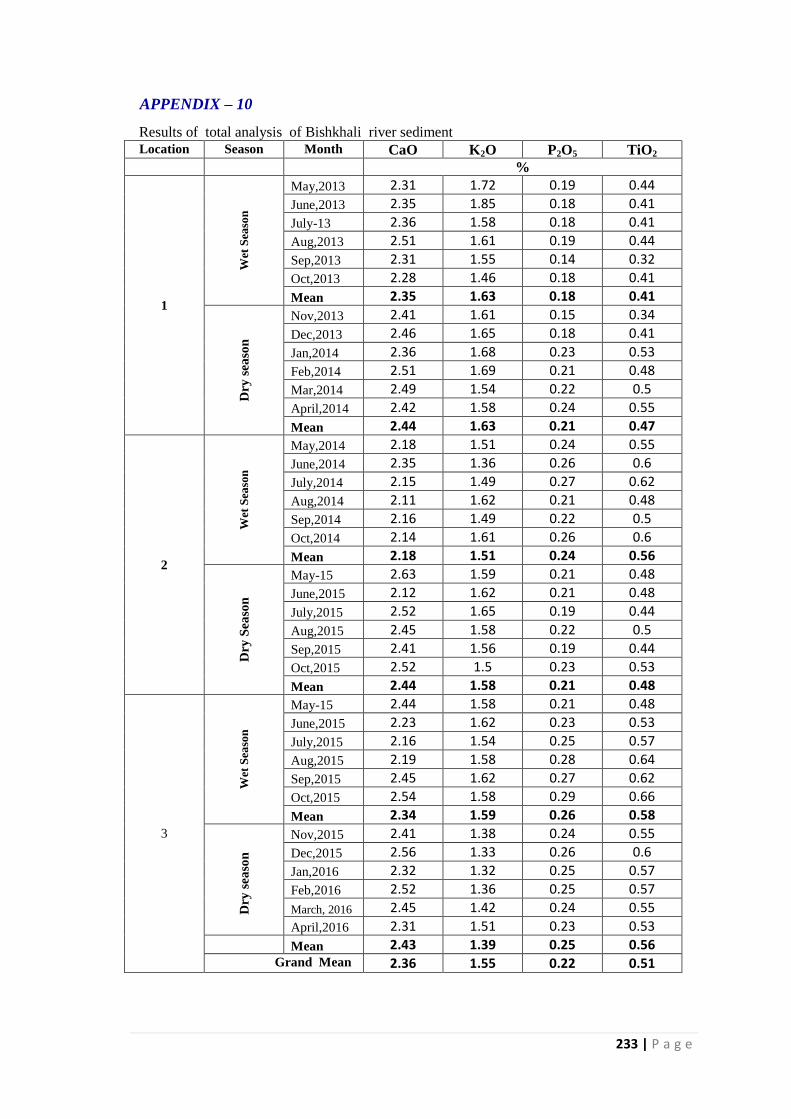
233 | P a g e
APPENDIX – 10
Results of total analysis of Bishkhali river sediment Location Season Month CaO K2O P2O5 TiO2
%
1
Wet
Sea
son
May,2013 2.31 1.72 0.19 0.44
June,2013 2.35 1.85 0.18 0.41
July-13 2.36 1.58 0.18 0.41
Aug,2013 2.51 1.61 0.19 0.44
Sep,2013 2.31 1.55 0.14 0.32
Oct,2013 2.28 1.46 0.18 0.41
Mean 2.35 1.63 0.18 0.41
Dry
sea
son
Nov,2013 2.41 1.61 0.15 0.34
Dec,2013 2.46 1.65 0.18 0.41
Jan,2014 2.36 1.68 0.23 0.53
Feb,2014 2.51 1.69 0.21 0.48
Mar,2014 2.49 1.54 0.22 0.5
April,2014 2.42 1.58 0.24 0.55
Mean 2.44 1.63 0.21 0.47
2
Wet
Sea
son
May,2014 2.18 1.51 0.24 0.55
June,2014 2.35 1.36 0.26 0.6
July,2014 2.15 1.49 0.27 0.62
Aug,2014 2.11 1.62 0.21 0.48
Sep,2014 2.16 1.49 0.22 0.5
Oct,2014 2.14 1.61 0.26 0.6
Mean 2.18 1.51 0.24 0.56
Dry
Sea
son
May-15 2.63 1.59 0.21 0.48
June,2015 2.12 1.62 0.21 0.48
July,2015 2.52 1.65 0.19 0.44
Aug,2015 2.45 1.58 0.22 0.5
Sep,2015 2.41 1.56 0.19 0.44
Oct,2015 2.52 1.5 0.23 0.53
Mean 2.44 1.58 0.21 0.48
3
Wet
Sea
son
May-15 2.44 1.58 0.21 0.48
June,2015 2.23 1.62 0.23 0.53
July,2015 2.16 1.54 0.25 0.57
Aug,2015 2.19 1.58 0.28 0.64
Sep,2015 2.45 1.62 0.27 0.62
Oct,2015 2.54 1.58 0.29 0.66
Mean 2.34 1.59 0.26 0.58
Dry
sea
son
Nov,2015 2.41 1.38 0.24 0.55
Dec,2015 2.56 1.33 0.26 0.6
Jan,2016 2.32 1.32 0.25 0.57
Feb,2016 2.52 1.36 0.25 0.57
March, 2016 2.45 1.42 0.24 0.55
April,2016 2.31 1.51 0.23 0.53 Mean 2.43 1.39 0.25 0.56 Grand Mean 2.36 1.55 0.22 0.51
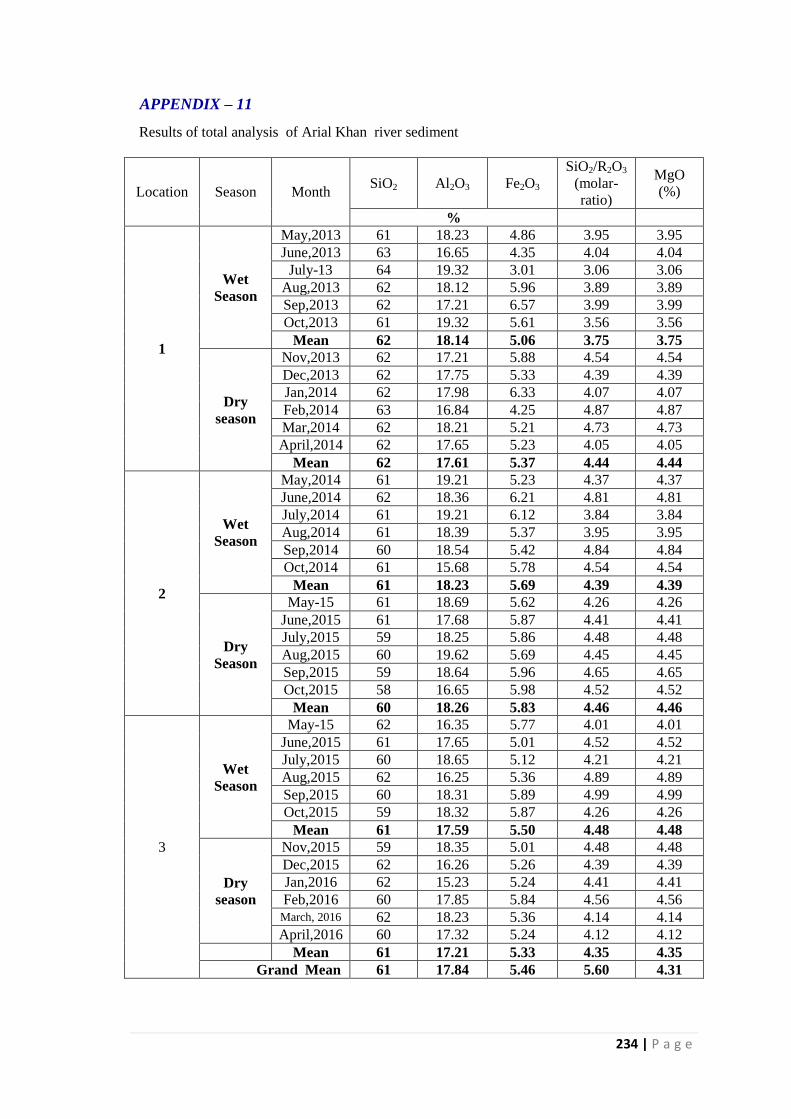
234 | P a g e
APPENDIX – 11
Results of total analysis of Arial Khan river sediment
Location Season Month SiO2 Al2O3 Fe2O3
SiO2/R2O3
(molar-
ratio)
MgO
(%)
%
1
Wet
Season
May,2013 61 18.23 4.86 3.95 3.95
June,2013 63 16.65 4.35 4.04 4.04
July-13 64 19.32 3.01 3.06 3.06
Aug,2013 62 18.12 5.96 3.89 3.89
Sep,2013 62 17.21 6.57 3.99 3.99
Oct,2013 61 19.32 5.61 3.56 3.56
Mean 62 18.14 5.06 3.75 3.75
Dry
season
Nov,2013 62 17.21 5.88 4.54 4.54
Dec,2013 62 17.75 5.33 4.39 4.39
Jan,2014 62 17.98 6.33 4.07 4.07
Feb,2014 63 16.84 4.25 4.87 4.87
Mar,2014 62 18.21 5.21 4.73 4.73
April,2014 62 17.65 5.23 4.05 4.05
Mean 62 17.61 5.37 4.44 4.44
2
Wet
Season
May,2014 61 19.21 5.23 4.37 4.37
June,2014 62 18.36 6.21 4.81 4.81
July,2014 61 19.21 6.12 3.84 3.84
Aug,2014 61 18.39 5.37 3.95 3.95
Sep,2014 60 18.54 5.42 4.84 4.84
Oct,2014 61 15.68 5.78 4.54 4.54
Mean 61 18.23 5.69 4.39 4.39
Dry
Season
May-15 61 18.69 5.62 4.26 4.26
June,2015 61 17.68 5.87 4.41 4.41
July,2015 59 18.25 5.86 4.48 4.48
Aug,2015 60 19.62 5.69 4.45 4.45
Sep,2015 59 18.64 5.96 4.65 4.65
Oct,2015 58 16.65 5.98 4.52 4.52
Mean 60 18.26 5.83 4.46 4.46
3
Wet
Season
May-15 62 16.35 5.77 4.01 4.01
June,2015 61 17.65 5.01 4.52 4.52
July,2015 60 18.65 5.12 4.21 4.21
Aug,2015 62 16.25 5.36 4.89 4.89
Sep,2015 60 18.31 5.89 4.99 4.99
Oct,2015 59 18.32 5.87 4.26 4.26
Mean 61 17.59 5.50 4.48 4.48
Dry
season
Nov,2015 59 18.35 5.01 4.48 4.48
Dec,2015 62 16.26 5.26 4.39 4.39
Jan,2016 62 15.23 5.24 4.41 4.41
Feb,2016 60 17.85 5.84 4.56 4.56 March, 2016 62 18.23 5.36 4.14 4.14
April,2016 60 17.32 5.24 4.12 4.12
Mean 61 17.21 5.33 4.35 4.35
Grand Mean 61 17.84 5.46 5.60 4.31
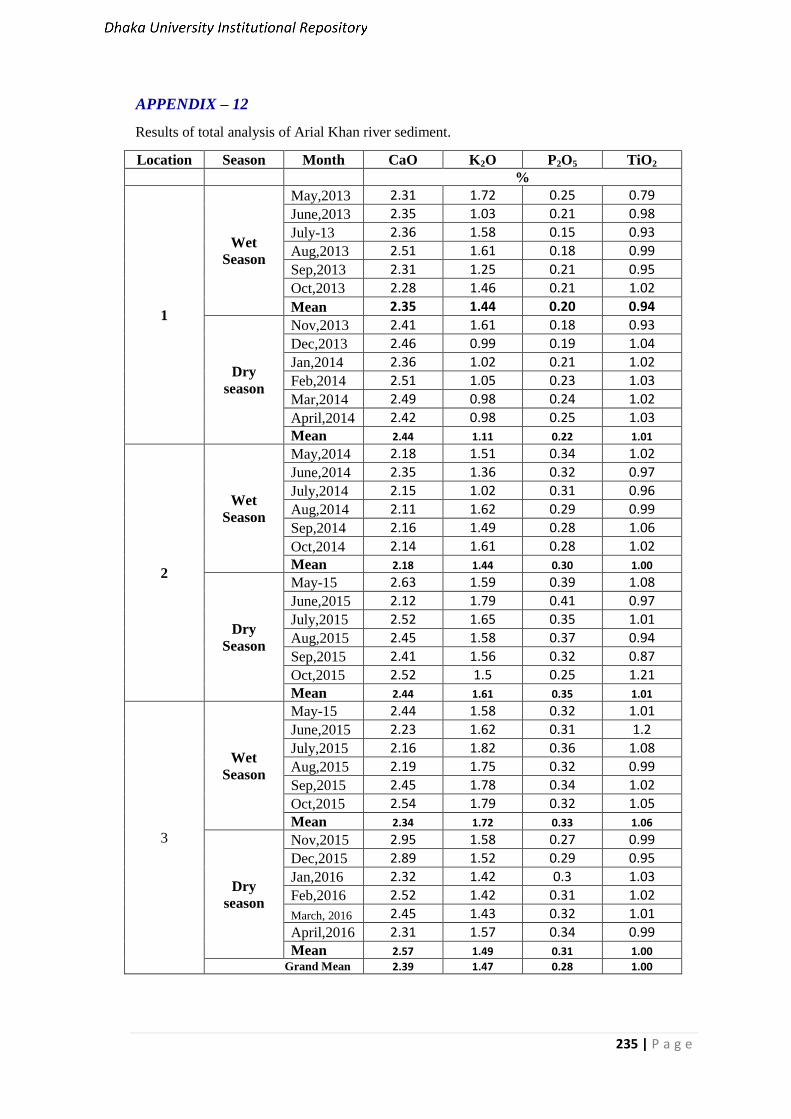
235 | P a g e
APPENDIX – 12
Results of total analysis of Arial Khan river sediment.
Location Season Month CaO K2O P2O5 TiO2
%
1
Wet
Season
May,2013 2.31 1.72 0.25 0.79
June,2013 2.35 1.03 0.21 0.98
July-13 2.36 1.58 0.15 0.93
Aug,2013 2.51 1.61 0.18 0.99
Sep,2013 2.31 1.25 0.21 0.95
Oct,2013 2.28 1.46 0.21 1.02
Mean 2.35 1.44 0.20 0.94
Dry
season
Nov,2013 2.41 1.61 0.18 0.93
Dec,2013 2.46 0.99 0.19 1.04
Jan,2014 2.36 1.02 0.21 1.02
Feb,2014 2.51 1.05 0.23 1.03
Mar,2014 2.49 0.98 0.24 1.02
April,2014 2.42 0.98 0.25 1.03
Mean 2.44 1.11 0.22 1.01
2
Wet
Season
May,2014 2.18 1.51 0.34 1.02
June,2014 2.35 1.36 0.32 0.97
July,2014 2.15 1.02 0.31 0.96
Aug,2014 2.11 1.62 0.29 0.99
Sep,2014 2.16 1.49 0.28 1.06
Oct,2014 2.14 1.61 0.28 1.02 Mean 2.18 1.44 0.30 1.00
Dry
Season
May-15 2.63 1.59 0.39 1.08
June,2015 2.12 1.79 0.41 0.97
July,2015 2.52 1.65 0.35 1.01
Aug,2015 2.45 1.58 0.37 0.94
Sep,2015 2.41 1.56 0.32 0.87
Oct,2015 2.52 1.5 0.25 1.21 Mean 2.44 1.61 0.35 1.01
3
Wet
Season
May-15 2.44 1.58 0.32 1.01
June,2015 2.23 1.62 0.31 1.2
July,2015 2.16 1.82 0.36 1.08
Aug,2015 2.19 1.75 0.32 0.99
Sep,2015 2.45 1.78 0.34 1.02
Oct,2015 2.54 1.79 0.32 1.05 Mean 2.34 1.72 0.33 1.06
Dry
season
Nov,2015 2.95 1.58 0.27 0.99
Dec,2015 2.89 1.52 0.29 0.95
Jan,2016 2.32 1.42 0.3 1.03
Feb,2016 2.52 1.42 0.31 1.02
March, 2016 2.45 1.43 0.32 1.01
April,2016 2.31 1.57 0.34 0.99
Mean 2.57 1.49 0.31 1.00
Grand Mean 2.39 1.47 0.28 1.00
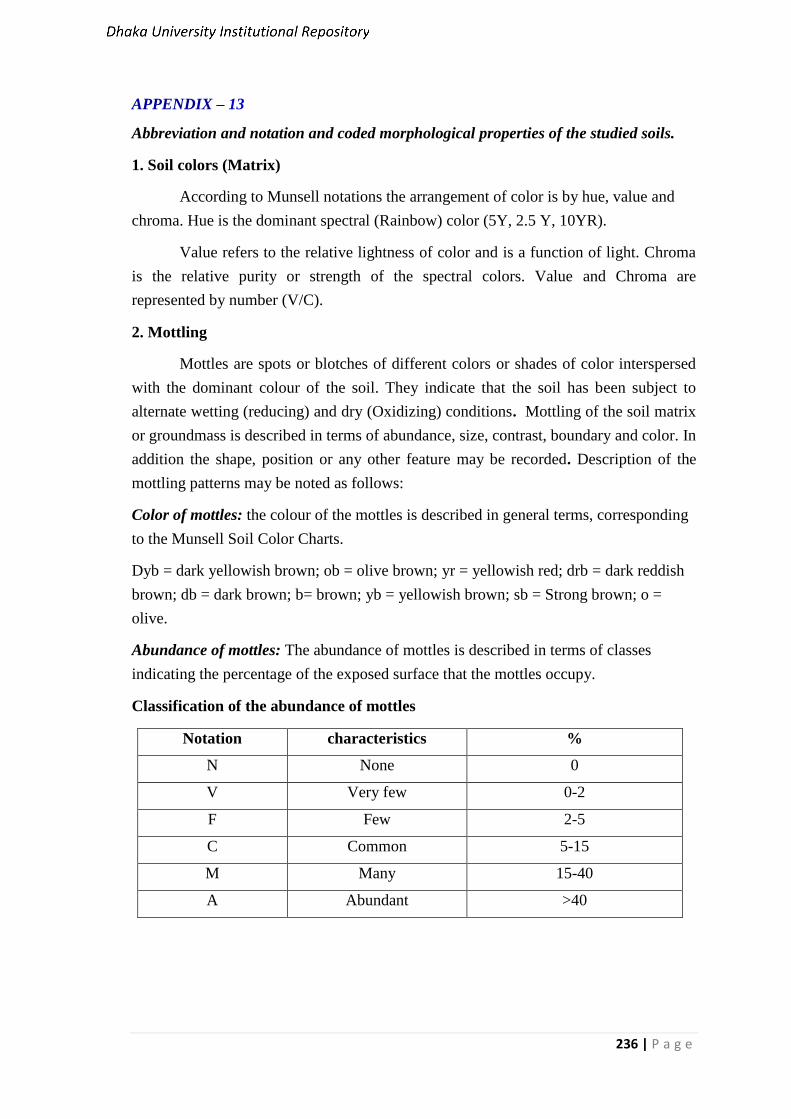
236 | P a g e
APPENDIX – 13
Abbreviation and notation and coded morphological properties of the studied soils.
1. Soil colors (Matrix)
According to Munsell notations the arrangement of color is by hue, value and
chroma. Hue is the dominant spectral (Rainbow) color (5Y, 2.5 Y, 10YR).
Value refers to the relative lightness of color and is a function of light. Chroma
is the relative purity or strength of the spectral colors. Value and Chroma are
represented by number (V/C).
2. Mottling
Mottles are spots or blotches of different colors or shades of color interspersed
with the dominant colour of the soil. They indicate that the soil has been subject to
alternate wetting (reducing) and dry (Oxidizing) conditions. Mottling of the soil matrix
or groundmass is described in terms of abundance, size, contrast, boundary and color. In
addition the shape, position or any other feature may be recorded. Description of the
mottling patterns may be noted as follows:
Color of mottles: the colour of the mottles is described in general terms, corresponding
to the Munsell Soil Color Charts.
Dyb = dark yellowish brown; ob = olive brown; yr = yellowish red; drb = dark reddish
brown; db = dark brown; b= brown; yb = yellowish brown; sb = Strong brown; o =
olive.
Abundance of mottles: The abundance of mottles is described in terms of classes
indicating the percentage of the exposed surface that the mottles occupy.
Classification of the abundance of mottles
Notation characteristics %
N None 0
V Very few 0-2
F Few 2-5
C Common 5-15
M Many 15-40
A Abundant >40
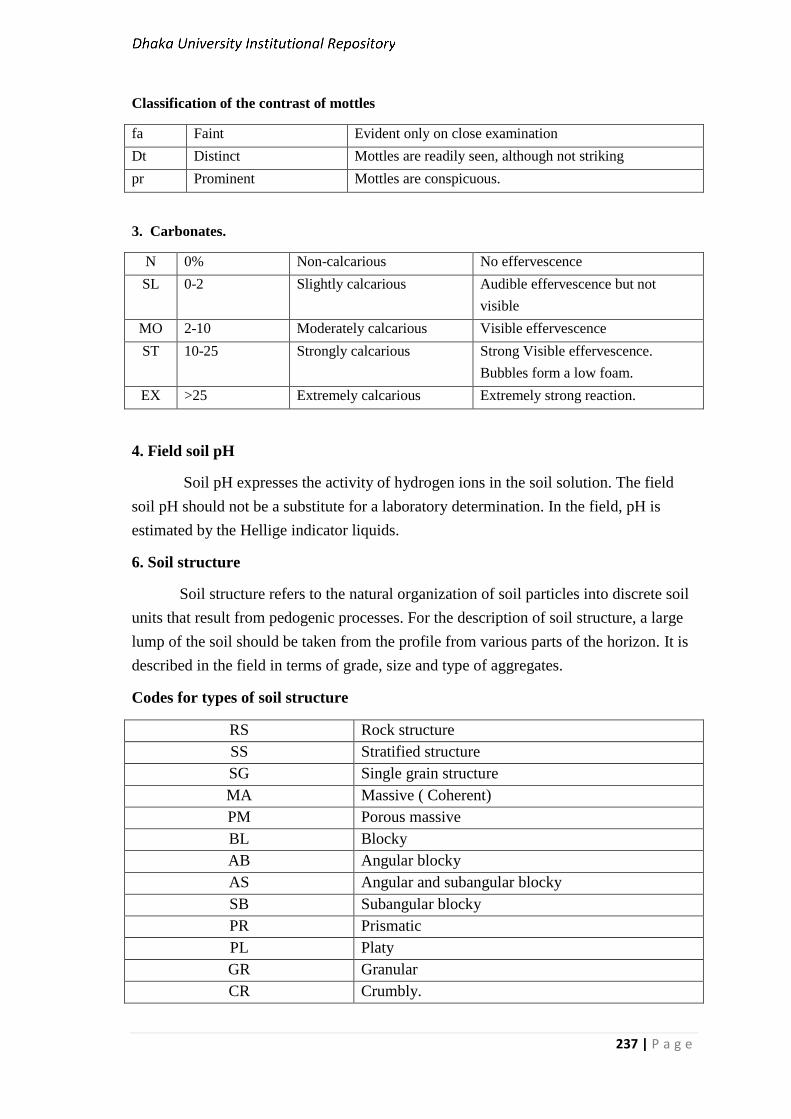
237 | P a g e
Classification of the contrast of mottles
fa Faint Evident only on close examination
Dt Distinct Mottles are readily seen, although not striking
pr Prominent Mottles are conspicuous.
3. Carbonates.
N 0% Non-calcarious No effervescence
SL 0-2 Slightly calcarious Audible effervescence but not
visible
MO 2-10 Moderately calcarious Visible effervescence
ST 10-25 Strongly calcarious Strong Visible effervescence.
Bubbles form a low foam.
EX >25 Extremely calcarious Extremely strong reaction.
4. Field soil pH
Soil pH expresses the activity of hydrogen ions in the soil solution. The field
soil pH should not be a substitute for a laboratory determination. In the field, pH is
estimated by the Hellige indicator liquids.
6. Soil structure
Soil structure refers to the natural organization of soil particles into discrete soil
units that result from pedogenic processes. For the description of soil structure, a large
lump of the soil should be taken from the profile from various parts of the horizon. It is
described in the field in terms of grade, size and type of aggregates.
Codes for types of soil structure
RS Rock structure
SS Stratified structure
SG Single grain structure
MA Massive ( Coherent)
PM Porous massive
BL Blocky
AB Angular blocky
AS Angular and subangular blocky
SB Subangular blocky
PR Prismatic
PL Platy
GR Granular
CR Crumbly.
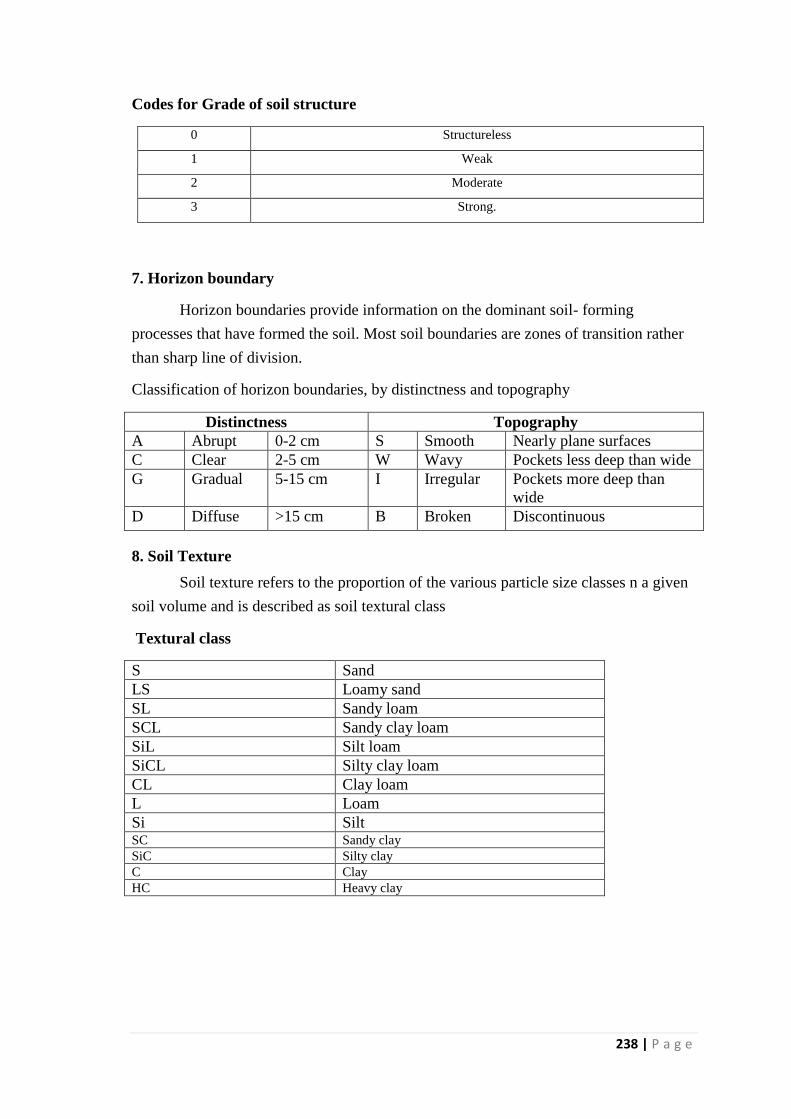
238 | P a g e
Codes for Grade of soil structure
0 Structureless
1 Weak
2 Moderate
3 Strong.
7. Horizon boundary
Horizon boundaries provide information on the dominant soil- forming
processes that have formed the soil. Most soil boundaries are zones of transition rather
than sharp line of division.
Classification of horizon boundaries, by distinctness and topography
Distinctness Topography
A Abrupt 0-2 cm S Smooth Nearly plane surfaces
C Clear 2-5 cm W Wavy Pockets less deep than wide
G Gradual 5-15 cm I Irregular Pockets more deep than
wide
D Diffuse >15 cm B Broken Discontinuous
8. Soil Texture
Soil texture refers to the proportion of the various particle size classes n a given
soil volume and is described as soil textural class
Textural class
S Sand
LS Loamy sand
SL Sandy loam
SCL Sandy clay loam
SiL Silt loam
SiCL Silty clay loam
CL Clay loam
L Loam
Si Silt SC Sandy clay
SiC Silty clay
C Clay
HC Heavy clay
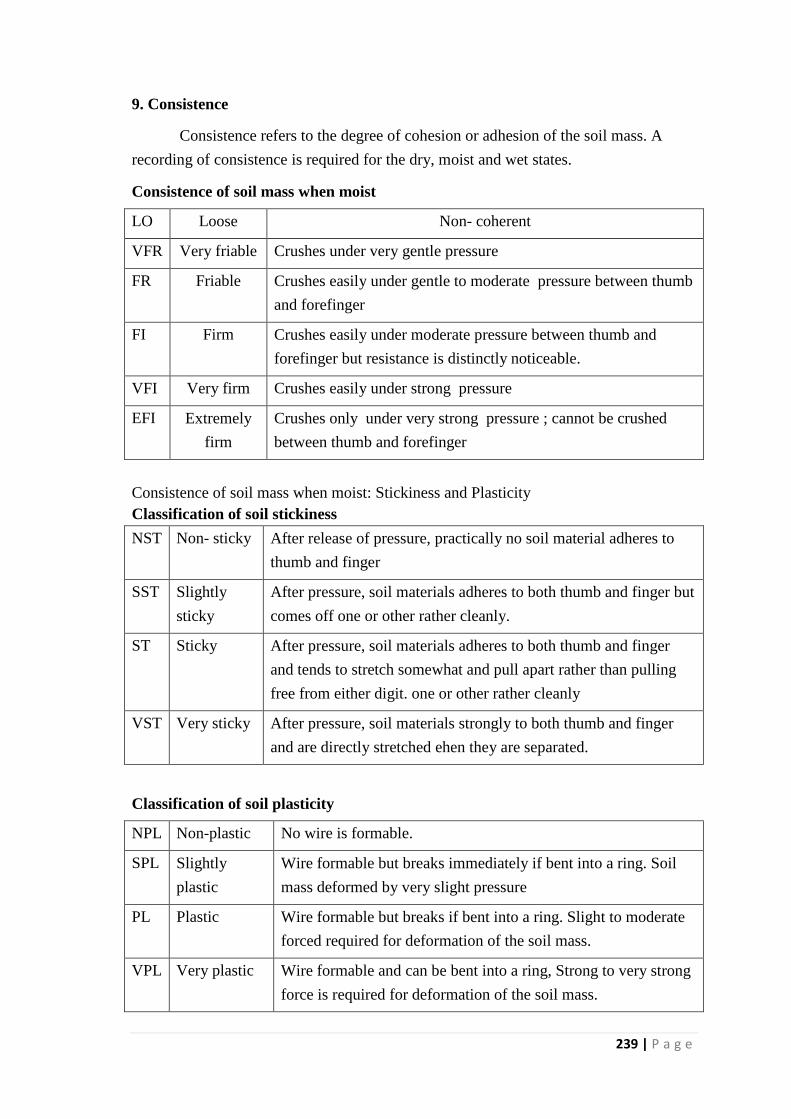
239 | P a g e
9. Consistence
Consistence refers to the degree of cohesion or adhesion of the soil mass. A
recording of consistence is required for the dry, moist and wet states.
Consistence of soil mass when moist
LO Loose Non- coherent
VFR Very friable Crushes under very gentle pressure
FR Friable Crushes easily under gentle to moderate pressure between thumb
and forefinger
FI Firm Crushes easily under moderate pressure between thumb and
forefinger but resistance is distinctly noticeable.
VFI Very firm Crushes easily under strong pressure
EFI Extremely
firm
Crushes only under very strong pressure ; cannot be crushed
between thumb and forefinger
Consistence of soil mass when moist: Stickiness and Plasticity
Classification of soil stickiness
NST Non- sticky After release of pressure, practically no soil material adheres to
thumb and finger
SST Slightly
sticky
After pressure, soil materials adheres to both thumb and finger but
comes off one or other rather cleanly.
ST Sticky After pressure, soil materials adheres to both thumb and finger
and tends to stretch somewhat and pull apart rather than pulling
free from either digit. one or other rather cleanly
VST Very sticky After pressure, soil materials strongly to both thumb and finger
and are directly stretched ehen they are separated.
Classification of soil plasticity
NPL Non-plastic No wire is formable.
SPL Slightly
plastic
Wire formable but breaks immediately if bent into a ring. Soil
mass deformed by very slight pressure
PL Plastic Wire formable but breaks if bent into a ring. Slight to moderate
forced required for deformation of the soil mass.
VPL Very plastic Wire formable and can be bent into a ring, Strong to very strong
force is required for deformation of the soil mass.
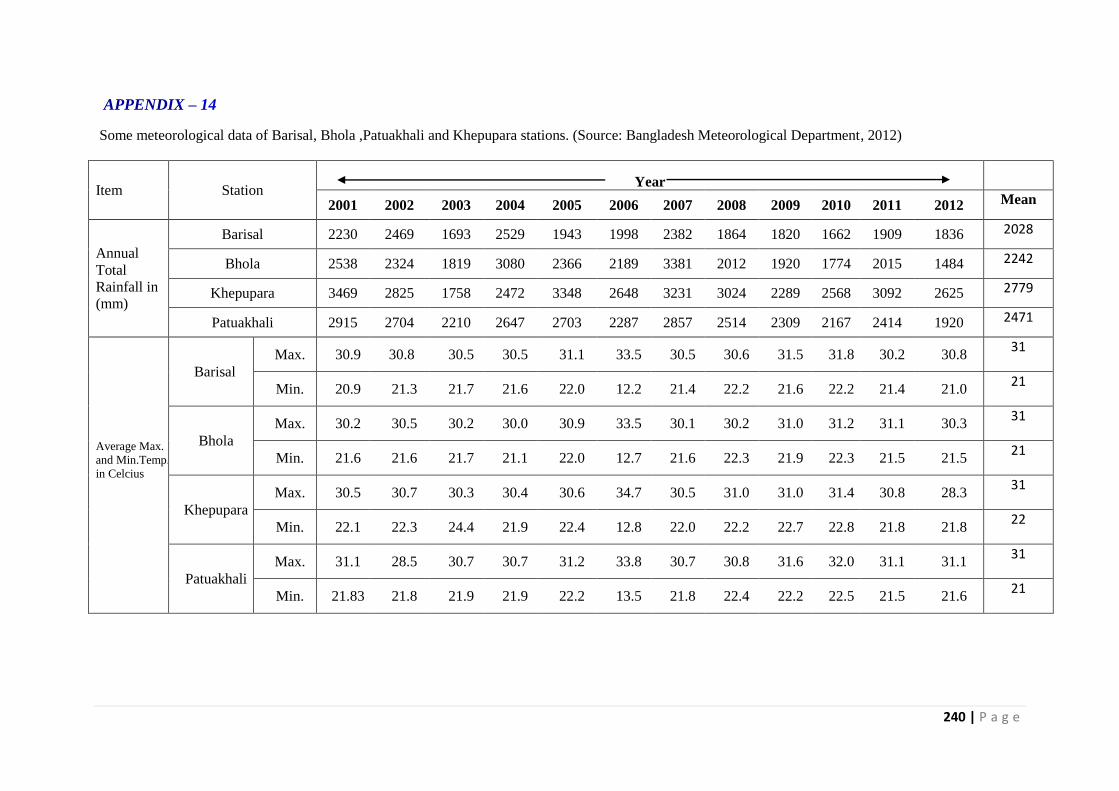
240 | P a g e
APPENDIX – 14
Some meteorological data of Barisal, Bhola ,Patuakhali and Khepupara stations. (Source: Bangladesh Meteorological Department, 2012)
Item Station Year
2001 2002 2003 2004 2005 2006 2007 2008 2009 2010 2011 2012 Mean
Annual
Total
Rainfall in
(mm)
Barisal 2230 2469 1693 2529 1943 1998 2382 1864 1820 1662 1909 1836 2028
Bhola 2538 2324 1819 3080 2366 2189 3381 2012 1920 1774 2015 1484 2242
Khepupara 3469 2825 1758 2472 3348 2648 3231 3024 2289 2568 3092 2625 2779
Patuakhali 2915 2704 2210 2647 2703 2287 2857 2514 2309 2167 2414 1920 2471
Average Max.
and Min.Temp.
in Celcius
Barisal
Max. 30.9 30.8 30.5 30.5 31.1 33.5 30.5 30.6 31.5 31.8 30.2 30.8 31
Min. 20.9 21.3 21.7 21.6 22.0 12.2 21.4 22.2 21.6 22.2 21.4 21.0 21
Bhola
Max. 30.2 30.5 30.2 30.0 30.9 33.5 30.1 30.2 31.0 31.2 31.1 30.3 31
Min. 21.6 21.6 21.7 21.1 22.0 12.7 21.6 22.3 21.9 22.3 21.5 21.5 21
Khepupara
Max. 30.5 30.7 30.3 30.4 30.6 34.7 30.5 31.0 31.0 31.4 30.8 28.3 31
Min. 22.1 22.3 24.4 21.9 22.4 12.8 22.0 22.2 22.7 22.8 21.8 21.8 22
Patuakhali
Max. 31.1 28.5 30.7 30.7 31.2 33.8 30.7 30.8 31.6 32.0 31.1 31.1 31
Min. 21.83 21.8 21.9 21.9 22.2 13.5 21.8 22.4 22.2 22.5 21.5 21.6 21
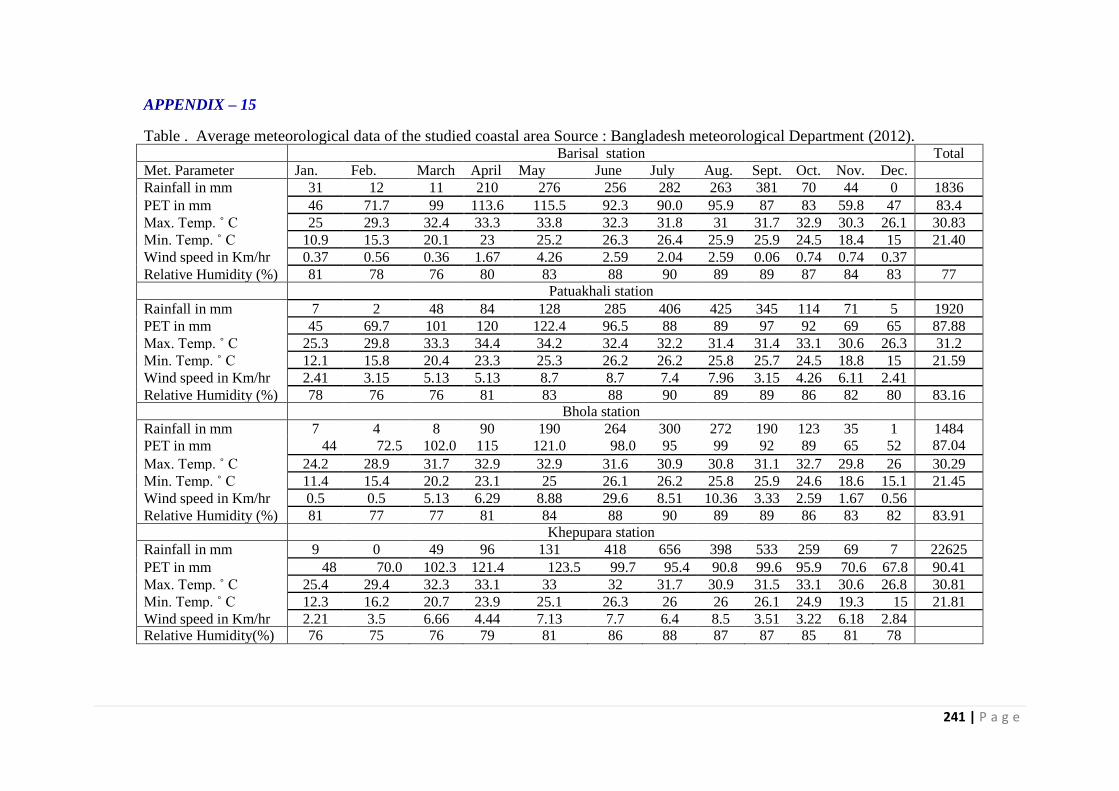
241 | P a g e
APPENDIX – 15
Table . Average meteorological data of the studied coastal area Source : Bangladesh meteorological Department (2012).
Barisal station Total
/Average Met. Parameter Jan. Feb. March April May June July Aug. Sept. Oct. Nov. Dec.
Rainfall in mm 31 12 11 210 276 256 282 263 381 70 44 0 1836
PET in mm 46 71.7 99 113.6 115.5 92.3 90.0 95.9 87 83 59.8 47 83.4
Max. Temp. ˚ C 25 29.3 32.4 33.3 33.8 32.3 31.8 31 31.7 32.9 30.3 26.1 30.83
Min. Temp. ˚ C 10.9 15.3 20.1 23 25.2 26.3 26.4 25.9 25.9 24.5 18.4 15 21.40
Wind speed in Km/hr 0.37 0.56 0.36 1.67 4.26 2.59 2.04 2.59 0.06 0.74 0.74 0.37
Relative Humidity (%) 81 78 76 80 83 88 90 89 89 87 84 83 77
Patuakhali station
Rainfall in mm 7 2 48 84 128 285 406 425 345 114 71 5 1920
PET in mm 45 69.7 101 120 122.4 96.5 88 89 97 92 69 65 87.88
Max. Temp. ˚ C 25.3 29.8 33.3 34.4 34.2 32.4 32.2 31.4 31.4 33.1 30.6 26.3 31.2
Min. Temp. ˚ C 12.1 15.8 20.4 23.3 25.3 26.2 26.2 25.8 25.7 24.5 18.8 15 21.59
Wind speed in Km/hr 2.41 3.15 5.13 5.13 8.7 8.7 7.4 7.96 3.15 4.26 6.11 2.41
Relative Humidity (%) 78 76 76 81 83 88 90 89 89 86 82 80 83.16
Bhola station
Rainfall in mm 7 4 8 90 190 264 300 272 190 123 35 1 1484
PET in mm 44 72.5 102.0 115 121.0 98.0 95 99 92 89 65 52 87.04
Max. Temp. ˚ C 24.2 28.9 31.7 32.9 32.9 31.6 30.9 30.8 31.1 32.7 29.8 26 30.29
Min. Temp. ˚ C 11.4 15.4 20.2 23.1 25 26.1 26.2 25.8 25.9 24.6 18.6 15.1 21.45
Wind speed in Km/hr 0.5 0.5 5.13 6.29 8.88 29.6 8.51 10.36 3.33 2.59 1.67 0.56
Relative Humidity (%) 81 77 77 81 84 88 90 89 89 86 83 82 83.91
Khepupara station
Rainfall in mm 9 0 49 96 131 418 656 398 533 259 69 7 22625
PET in mm 48 70.0 102.3 121.4 123.5 99.7 95.4 90.8 99.6 95.9 70.6 67.8 90.41
Max. Temp. ˚ C 25.4 29.4 32.3 33.1 33 32 31.7 30.9 31.5 33.1 30.6 26.8 30.81
Min. Temp. ˚ C 12.3 16.2 20.7 23.9 25.1 26.3 26 26 26.1 24.9 19.3 15 21.81
Wind speed in Km/hr 2.21 3.5 6.66 4.44 7.13 7.7 6.4 8.5 3.51 3.22 6.18 2.84 Relative Humidity(%) 76 75 76 79 81 86 88 87 87 85 81 78
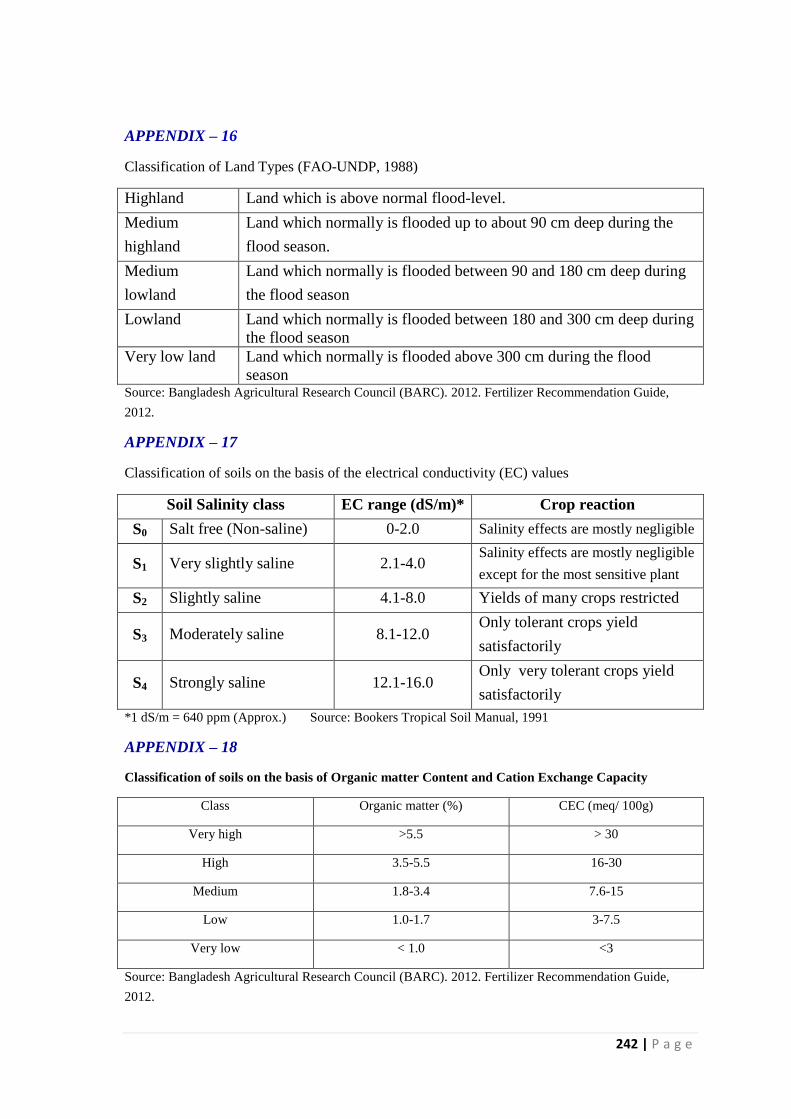
242 | P a g e
APPENDIX – 16
Classification of Land Types (FAO-UNDP, 1988)
Highland Land which is above normal flood-level.
Medium
highland
Land which normally is flooded up to about 90 cm deep during the
flood season.
Medium
lowland
Land which normally is flooded between 90 and 180 cm deep during
the flood season
Lowland Land which normally is flooded between 180 and 300 cm deep during
the flood season
Very low land Land which normally is flooded above 300 cm during the flood
season Source: Bangladesh Agricultural Research Council (BARC). 2012. Fertilizer Recommendation Guide,
2012.
APPENDIX – 17
Classification of soils on the basis of the electrical conductivity (EC) values
Soil Salinity class EC range (dS/m)* Crop reaction
S0 Salt free (Non-saline) 0-2.0 Salinity effects are mostly negligible
S1 Very slightly saline 2.1-4.0 Salinity effects are mostly negligible
except for the most sensitive plant
S2 Slightly saline 4.1-8.0 Yields of many crops restricted
S3 Moderately saline 8.1-12.0 Only tolerant crops yield
satisfactorily
S4 Strongly saline 12.1-16.0 Only very tolerant crops yield
satisfactorily
*1 dS/m = 640 ppm (Approx.) Source: Bookers Tropical Soil Manual, 1991
APPENDIX – 18
Classification of soils on the basis of Organic matter Content and Cation Exchange Capacity
Class Organic matter (%) CEC (meq/ 100g)
Very high >5.5 > 30
High 3.5-5.5 16-30
Medium 1.8-3.4 7.6-15
Low 1.0-1.7 3-7.5
Very low < 1.0 <3
Source: Bangladesh Agricultural Research Council (BARC). 2012. Fertilizer Recommendation Guide,
2012.
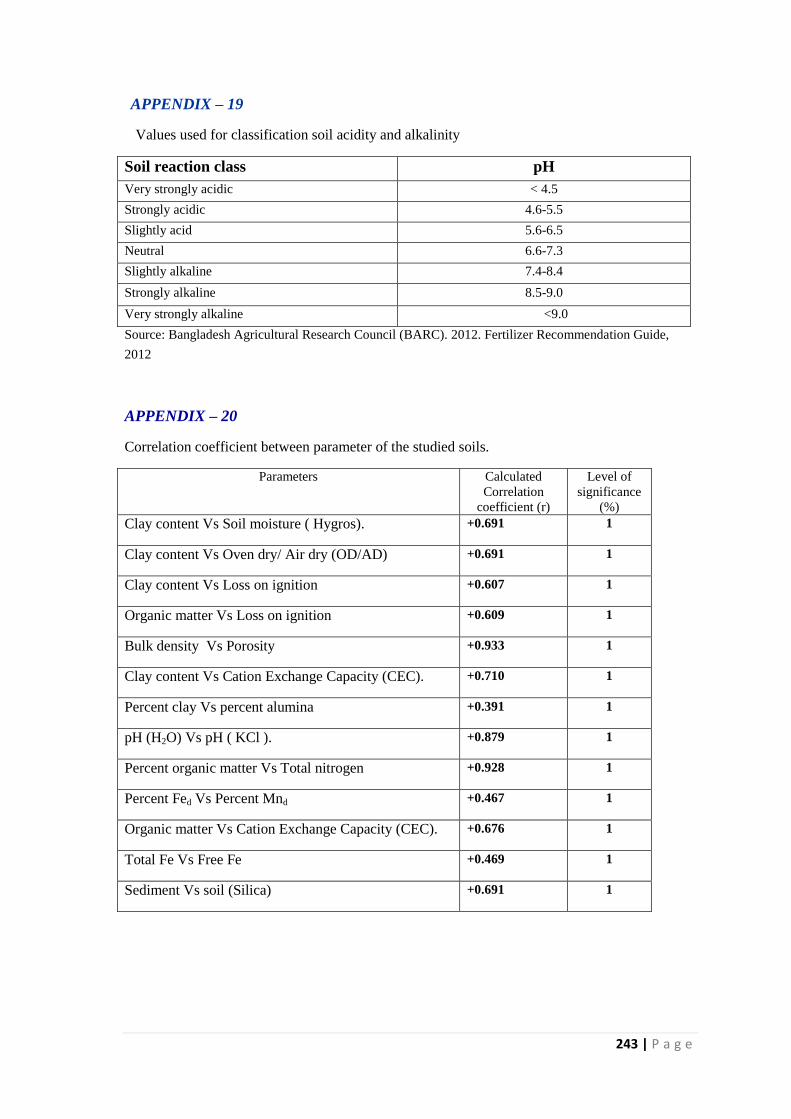
243 | P a g e
APPENDIX – 19
Values used for classification soil acidity and alkalinity
Soil reaction class pH
Very strongly acidic < 4.5
Strongly acidic 4.6-5.5
Slightly acid 5.6-6.5
Neutral 6.6-7.3
Slightly alkaline 7.4-8.4
Strongly alkaline 8.5-9.0
Very strongly alkaline <9.0
Source: Bangladesh Agricultural Research Council (BARC). 2012. Fertilizer Recommendation Guide,
2012
APPENDIX – 20
Correlation coefficient between parameter of the studied soils.
Parameters Calculated
Correlation
coefficient (r)
Level of
significance
(%)
Clay content Vs Soil moisture ( Hygros). +0.691 1
Clay content Vs Oven dry/ Air dry (OD/AD) +0.691 1
Clay content Vs Loss on ignition +0.607 1
Organic matter Vs Loss on ignition +0.609 1
Bulk density Vs Porosity +0.933 1
Clay content Vs Cation Exchange Capacity (CEC). +0.710 1
Percent clay Vs percent alumina +0.391 1
pH (H2O) Vs pH ( KCl ). +0.879 1
Percent organic matter Vs Total nitrogen +0.928 1
Percent Fed Vs Percent Mnd +0.467 1
Organic matter Vs Cation Exchange Capacity (CEC). +0.676 1
Total Fe Vs Free Fe +0.469 1
Sediment Vs soil (Silica) +0.691 1
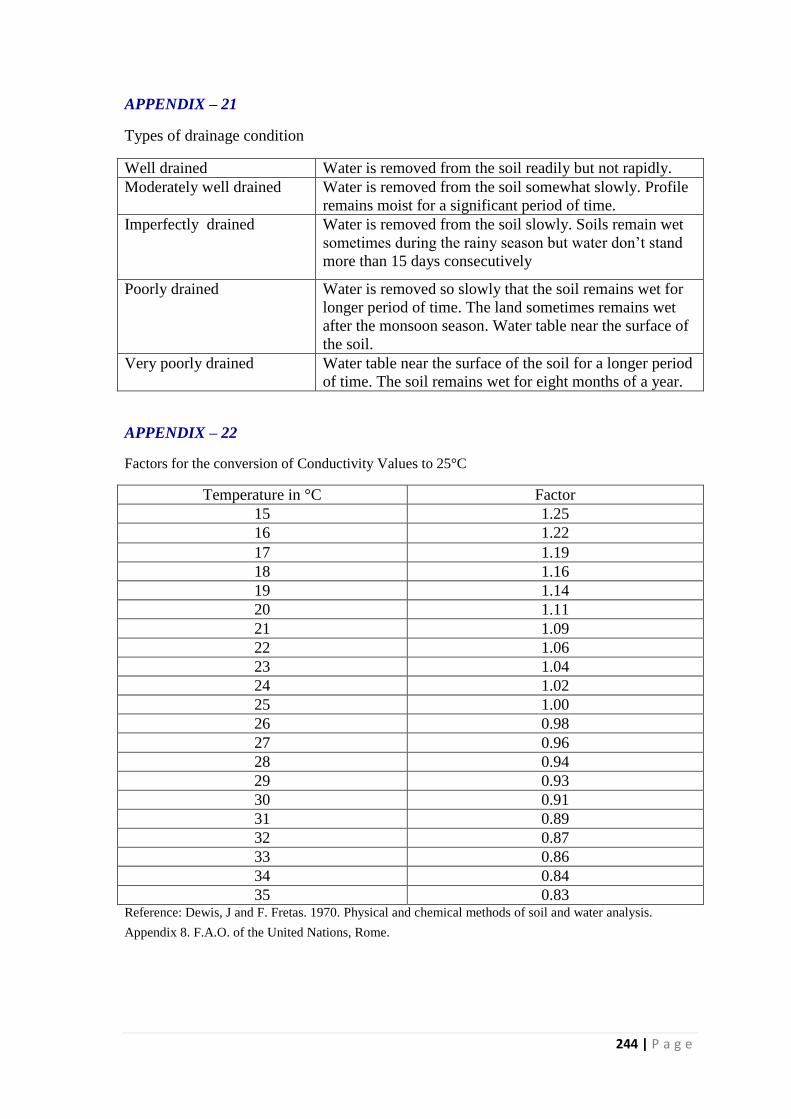
244 | P a g e
APPENDIX – 21
Types of drainage condition
Well drained Water is removed from the soil readily but not rapidly.
Moderately well drained Water is removed from the soil somewhat slowly. Profile
remains moist for a significant period of time.
Imperfectly drained Water is removed from the soil slowly. Soils remain wet
sometimes during the rainy season but water don’t stand
more than 15 days consecutively
Poorly drained Water is removed so slowly that the soil remains wet for
longer period of time. The land sometimes remains wet
after the monsoon season. Water table near the surface of
the soil.
Very poorly drained Water table near the surface of the soil for a longer period
of time. The soil remains wet for eight months of a year.
APPENDIX – 22
Factors for the conversion of Conductivity Values to 25°C
Temperature in °C Factor
15 1.25
16 1.22
17 1.19
18 1.16
19 1.14
20 1.11
21 1.09
22 1.06
23 1.04
24 1.02
25 1.00
26 0.98
27 0.96
28 0.94
29 0.93
30 0.91
31 0.89
32 0.87
33 0.86
34 0.84
35 0.83 Reference: Dewis, J and F. Fretas. 1970. Physical and chemical methods of soil and water analysis.
Appendix 8. F.A.O. of the United Nations, Rome.
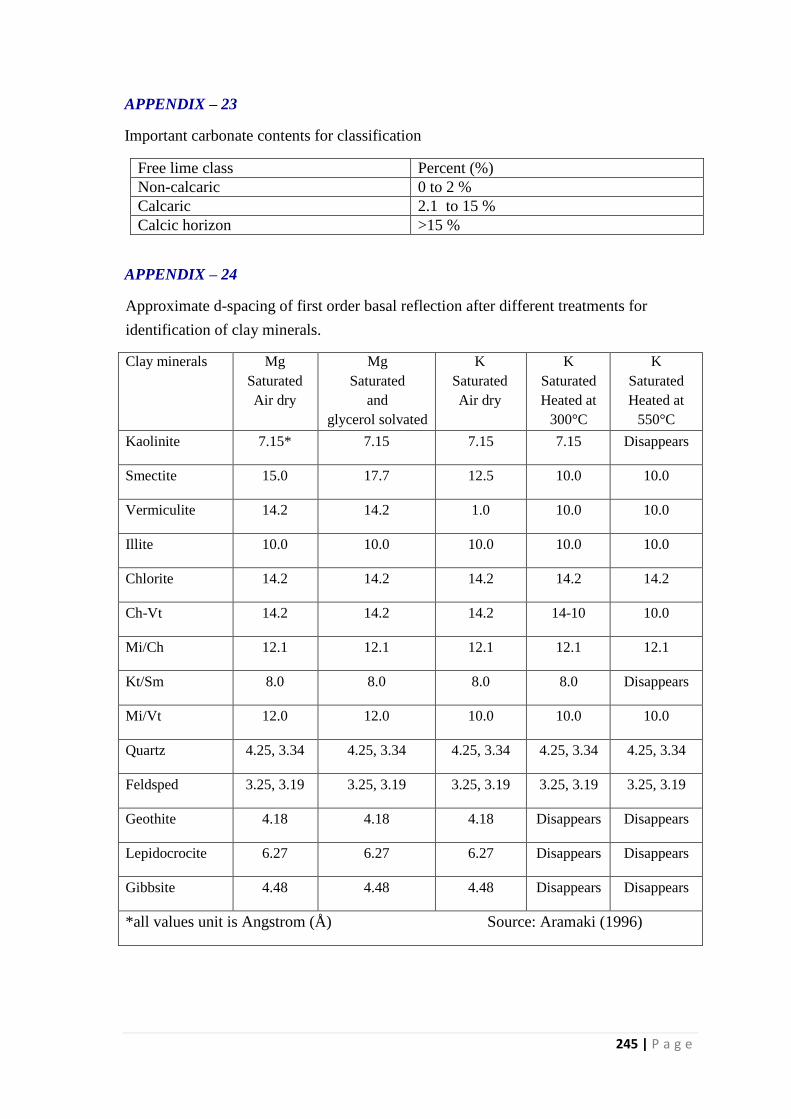
245 | P a g e
APPENDIX – 23
Important carbonate contents for classification
Free lime class Percent (%)
Non-calcaric 0 to 2 %
Calcaric 2.1 to 15 %
Calcic horizon >15 %
APPENDIX – 24
Approximate d-spacing of first order basal reflection after different treatments for
identification of clay minerals.
Clay minerals Mg
Saturated
Air dry
Mg
Saturated
and
glycerol solvated
K
Saturated
Air dry
K
Saturated
Heated at
300°C
K
Saturated
Heated at
550°C
Kaolinite 7.15* 7.15 7.15 7.15 Disappears
Smectite 15.0 17.7 12.5 10.0 10.0
Vermiculite 14.2 14.2 1.0 10.0 10.0
Illite 10.0 10.0 10.0 10.0 10.0
Chlorite 14.2 14.2 14.2 14.2 14.2
Ch-Vt 14.2 14.2 14.2 14-10 10.0
Mi/Ch 12.1 12.1 12.1 12.1 12.1
Kt/Sm 8.0 8.0 8.0 8.0 Disappears
Mi/Vt 12.0 12.0 10.0 10.0 10.0
Quartz 4.25, 3.34 4.25, 3.34 4.25, 3.34 4.25, 3.34 4.25, 3.34
Feldsped 3.25, 3.19 3.25, 3.19 3.25, 3.19 3.25, 3.19 3.25, 3.19
Geothite 4.18 4.18 4.18 Disappears Disappears
Lepidocrocite 6.27 6.27 6.27 Disappears Disappears
Gibbsite 4.48 4.48 4.48 Disappears Disappears
*all values unit is Angstrom (Å) Source: Aramaki (1996)
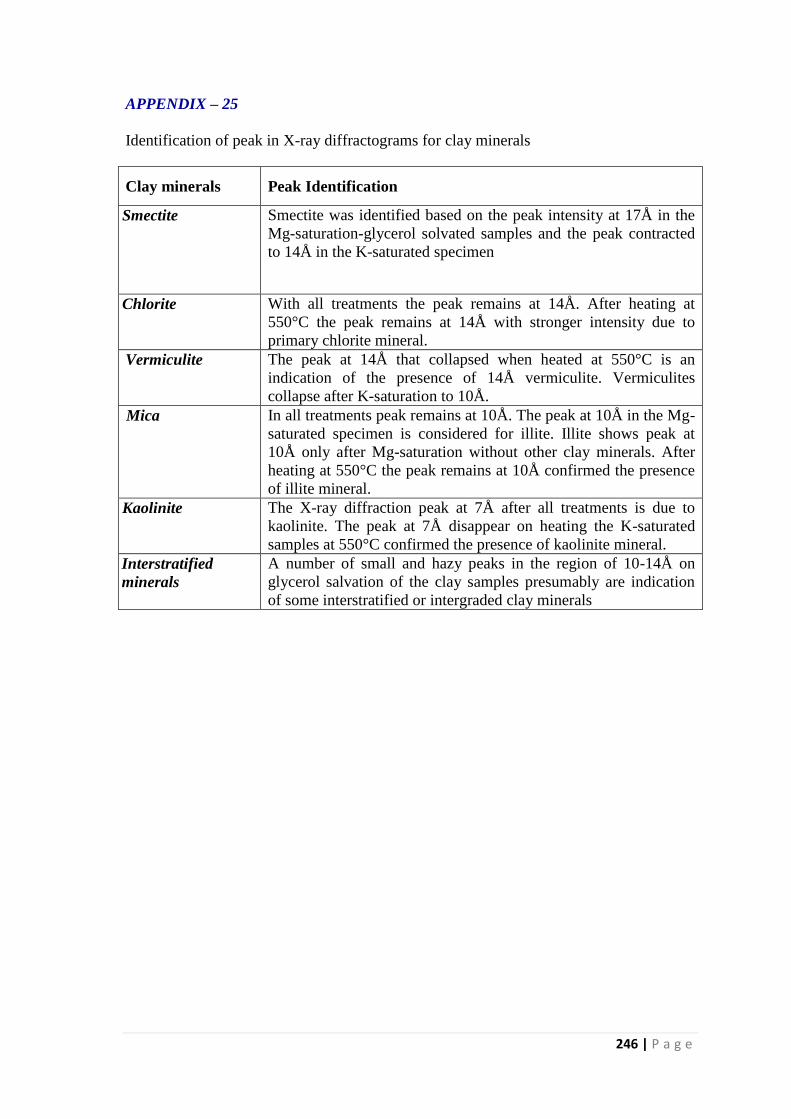
246 | P a g e
APPENDIX – 25
Identification of peak in X-ray diffractograms for clay minerals
Clay minerals Peak Identification
Smectite Smectite was identified based on the peak intensity at 17Å in the
Mg-saturation-glycerol solvated samples and the peak contracted
to 14Å in the K-saturated specimen
Chlorite With all treatments the peak remains at 14Å. After heating at
550°C the peak remains at 14Å with stronger intensity due to
primary chlorite mineral.
Vermiculite The peak at 14Å that collapsed when heated at 550°C is an
indication of the presence of 14Å vermiculite. Vermiculites
collapse after K-saturation to 10Å.
Mica In all treatments peak remains at 10Å. The peak at 10Å in the Mg-
saturated specimen is considered for illite. Illite shows peak at
10Å only after Mg-saturation without other clay minerals. After
heating at 550°C the peak remains at 10Å confirmed the presence
of illite mineral.
Kaolinite The X-ray diffraction peak at 7Å after all treatments is due to
kaolinite. The peak at 7Å disappear on heating the K-saturated
samples at 550°C confirmed the presence of kaolinite mineral.
Interstratified
minerals
A number of small and hazy peaks in the region of 10-14Å on
glycerol salvation of the clay samples presumably are indication
of some interstratified or intergraded clay minerals
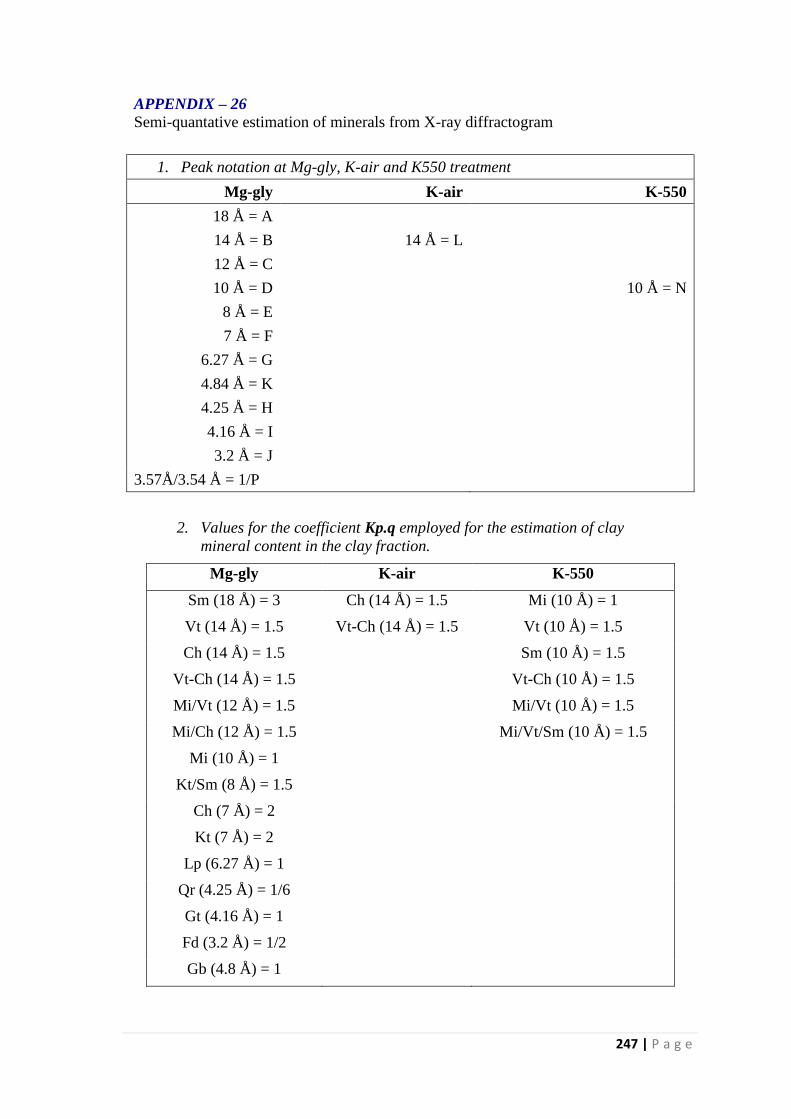
247 | P a g e
APPENDIX – 26
Semi-quantative estimation of minerals from X-ray diffractogram
1. Peak notation at Mg-gly, K-air and K550 treatment
Mg-gly K-air K-550
18 Å = A
14 Å = B 14 Å = L
12 Å = C
10 Å = D 10 Å = N
8 Å = E
7 Å = F
6.27 Å = G
4.84 Å = K
4.25 Å = H
4.16 Å = I
3.2 Å = J
3.57Å/3.54 Å = 1/P
2. Values for the coefficient Kp.q employed for the estimation of clay
mineral content in the clay fraction.
Mg-gly K-air K-550
Sm (18 Å) = 3 Ch (14 Å) = 1.5 Mi (10 Å) = 1
Vt (14 Å) = 1.5 Vt-Ch (14 Å) = 1.5 Vt (10 Å) = 1.5
Ch (14 Å) = 1.5 Sm (10 Å) = 1.5
Vt-Ch (14 Å) = 1.5 Vt-Ch (10 Å) = 1.5
Mi/Vt (12 Å) = 1.5 Mi/Vt (10 Å) = 1.5
Mi/Ch (12 Å) = 1.5 Mi/Vt/Sm (10 Å) = 1.5
Mi (10 Å) = 1
Kt/Sm (8 Å) = 1.5
Ch (7 Å) = 2
Kt (7 Å) = 2
Lp (6.27 Å) = 1
Qr (4.25 Å) = 1/6
Gt (4.16 Å) = 1
Fd (3.2 Å) = 1/2
Gb (4.8 Å) = 1
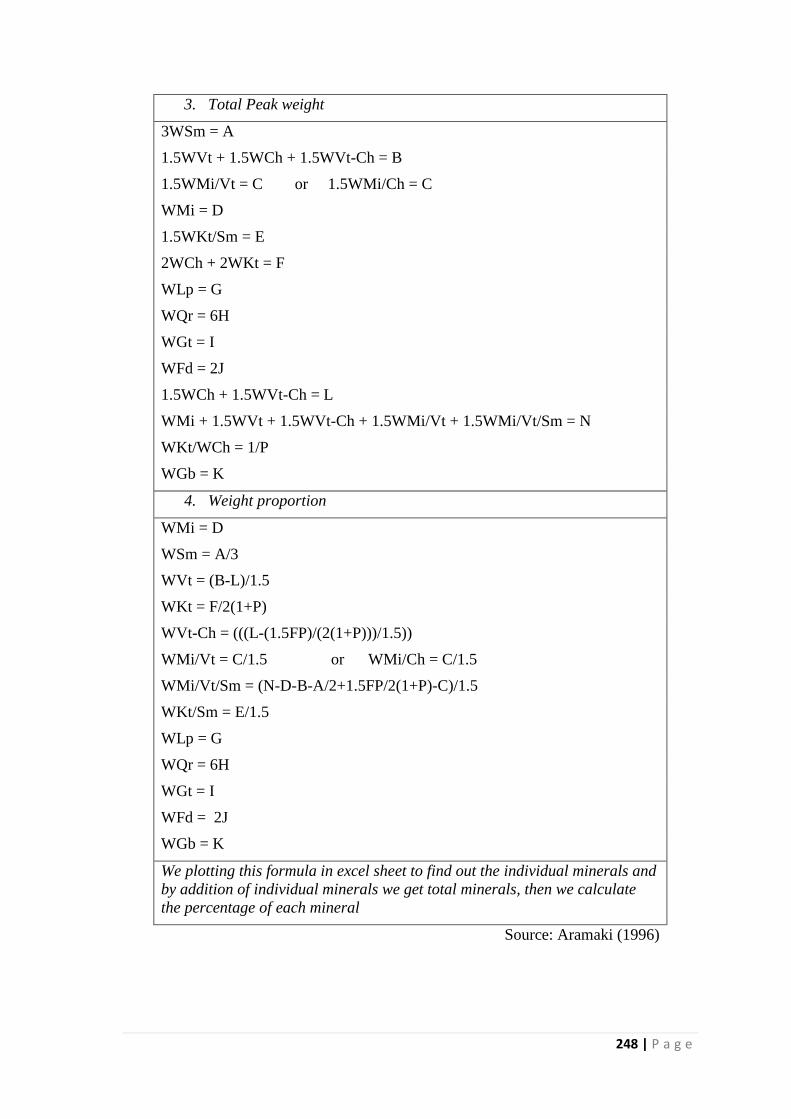
248 | P a g e
3. Total Peak weight
3WSm = A
1.5WVt + 1.5WCh + 1.5WVt-Ch = B
1.5WMi/Vt = C or 1.5WMi/Ch = C
WMi = D
1.5WKt/Sm = E
2WCh + 2WKt = F
WLp = G
WQr = 6H
WGt = I
WFd = 2J
1.5WCh + 1.5WVt-Ch = L
WMi + 1.5WVt + 1.5WVt-Ch + 1.5WMi/Vt + 1.5WMi/Vt/Sm = N
WKt/WCh = 1/P
WGb = K
4. Weight proportion
WMi = D
WSm = A/3
WVt = (B-L)/1.5
WKt = F/2(1+P)
WVt-Ch = (((L-(1.5FP)/(2(1+P)))/1.5))
WMi/Vt = C/1.5 or WMi/Ch = C/1.5
WMi/Vt/Sm = (N-D-B-A/2+1.5FP/2(1+P)-C)/1.5
WKt/Sm = E/1.5
WLp = G
WQr = 6H
WGt = I
WFd = 2J
WGb = K
We plotting this formula in excel sheet to find out the individual minerals and
by addition of individual minerals we get total minerals, then we calculate
the percentage of each mineral
Source: Aramaki (1996)
Copyright © 2022 FDOKUMEN