Pattern recogniti n in diagnostic 1mag1ng - WHO | World ...
220
WN 180 2001P A c.2 Pattern recogniti n in diagnostic • • 1mag1ng WORLD ATION GENEVA
-
Upload
khangminh22 -
Category
Documents
-
view
0 -
download
0
Transcript of Pattern recogniti n in diagnostic 1mag1ng - WHO | World ...
WN 180 2001PA c.2
Pattern recogniti n
in diagnostic • • 1mag1ng
WORLD ATION GENEVA
Pattern recognition in diagnostic imaging
Peter Carr MBChB, FFRad (D) SA, FRCR
Professor of Radiology Nelson R Mandela School of Medicine
University of Natal, Durban
South Africa
In collaboration with Wilfred Peh, Wong Siew Kune, Leonie Munro, William Rae, Fei Ling Thoo, Lai Peng Chan,
Lesley A. Goh, Lawrence Hadley, Malai Muttarak, Swee Tian Quek.
Medical Artist: Merle Conway
Photography: NV Chetty, S Ezikiel
Diagnostic Imaging and Laboratory Technology Essential Health Technologies
Health Technology and Pharmaceuticals WORLD HEALTH ORGANIZATION
GENEVA
WHO Library Cataloguing-in-Publication Data
Pattern recognition in diagnostic imaging; Peter Corr; in collaboration with Wilfred Peh ... [et al.]
!.Diagnostic imaging- methods 2.Pattern recognition 3.Radiography, Thoracic -methods 4.Musculoskeletal system -radiography. 5.Radiography, Abdominal-methods 6.Manuals I.Corr, Peter II.Peh, Wilfred.
ISBN 92 4 154632 8 (NLM classification: WN 180)
This publication is a reprint of material originally distributed as WHO/DIL/01.2
©World Health Organization 2001
Reprinted 2003 (Twice)
All rights reserved. Publications of the World Health Organization can be obtained from Marketing and Dissemination, World Health Organization, 20 Avenue Appia, 1211 Geneva 27, Switzerland (tel: +41 22 791 24 76; fax: +41 22 7914857; email: [email protected]). Requests for permission to reproduce or translate WHO publications - whether for sale or for noncommercial distribution - should be addressed to Publications, at the above address (fax: +41 22 791 4806; email: [email protected]).
The designations employed and the presentation of the material in this publication do not imply the expression of any opinion whatsoever on the part of the World Health Organization concerning the legal status of any country, territory, city or area or of its authorities, or concerning the delimitation of its frontiers or boundaries. Dotted lines on maps represent approximate border lines for which there may not yet be full agreement.
The mention of specific companies or of certain manufacturers' products does not imply that they are endorsed or recommended by the World Health Organization in preference to others of a similar nature that are not mentioned. Errors and omissions excepted, the names of proprietary products are distinguished by initial capital letters.
The World Health Organization does not warrant that the information contained in this publication is complete and correct and shall not be liable for any damages incurred as a result of its use.
Designed by minimum graphics in New Zeland Typeset by Best-set in Hong Kong Printed in Ma Ita By I nterpri nt Ltd.
iii
Contents
--JAN 200~
Preface v
Foreword vii
Definitions X
Part 1. Technique, quality control and radiation protection 1
Chapter 1. Image quality optimisation and control 3
Chapter 2. Radiation protection in radiological practice 16
Chapter 3. Contrast media in imaging 21
Chapter 4. Digital imaging and telemedicine 23
Part 2. Chest imaging patterns 27
Chapter 5. The normal chest radiograph 29
Chapter 6. Pulmonary infection 34
Chapter 7. Lung cancer 40
Chapter 8. Pulmonary hypertranslucency and cystic lungs 45
Chapter 9. Pleural and extra pleural disease 51
Chapter 10. Rib lesions 56
Chapter 11. Chest trauma 59
Chapter 12. Pulmonary AIDS 65
Chapter 13. Paediatric chest 68
Chapter 14. Cardiac disease 73
Chapter 15. Mediastinal masses 77
Chapter 16. Diaphragm lesions 79
Chapter 17. Pneumoconiosis 80
Part 3. Musculoskeletal patterns 83
Chapter 18. Approach to focal bone lesions 85
Chapter 19. Periosteal reactions 91
Chapter 20. Extremities trauma 99
Chapter 21. Fractures-classification, union, complications 114
Chapter 22. Spinal trauma 124
Chapter 23. Facial and pelvic trauma 133
Chapter 24. Bone infections 141

PATIERN RECOGNITION IN DIAGNOSTIC IMAGING
iv
Part 4. Gastrointestinal and urinary tract patterns 147
Chapter 25. Plain abdominal radiographs 149 Chapter 26. The acute abdomen 151
Chapter 27. Gastrointestinal contrast studies 159 Chapter 28. Paediatric abdomen 178 Chapter 29. Urinary tract imaging 183
Acknowledgements 205
Preface
As modern, high technology based diagnostic imaging is moving increasingly into therapeutic medicine, and molecular imaging is becoming daily routine, it is important to remember that thousands of hospitals and medical institutions worldwide do not even have possibilities to perform the most basic examinations. Today, few other areas of medicine experience such a rapidly growing gap between what might be technically possible, e.g., what can be done in highly developed, rich countries compared to what is the reality in many less fortunate areas of the world.
As the ultimate target for the World Health Organization is to provide Health For All, it is with great pleasure and sincere gratitude to Professor Carr, his staff and coauthors that this book on Pattern Recognition in Diagnostic Imaging is now being published and distributed. It aims in a simple, but precise way at assisting medical professionals doing a tremendous work to save lives and reduce suffering in countries where diagnostic imaging has not yet reached the stage of molecular imaging.
We would warmly recommend that this book should not be put on a shelf or into a locker, but be used by everybody whose obligation it is to prescribe, perform, or interpret simple, but often life-saving diagnostic imaging procedures especially in locations where the presence of qualified and fully trained specialists would be a rare exception.
The book is developed and published as a WHO Document under the umbrella of the Global Steering Group for Eduction and Training in Diagnostic Imaging. For further information, please contact:
Team for Diagnostic Imaging and Laboratory Technology, World Health Organization 20, Avenue Appia CH-1211 GENEVA 2 7, SWITZERLAND
Fax: +41 22 791 4836; e-mail: [email protected]
Geneva, 30 June 2001 Harald Ostensen, MD
v

Foreword
Imaging is currently being performed and interpreted by radiographers/technologists and primary care physicians/hospital medical officers in many developing countries. Many primary care physicians have had little or no training in the interpretation of images, both radiographic and sonographic. Radiographers are trained in producing images but often do not have the background in medicine to interpret images with confidence. This book seeks to bridge this gap by providing images of common pathologies seen in many developing countries in a pattern format. The pattern recognition format has been used successfully by both national and international radiographic societies to educate and train radiographers working in regions where radiology advice or services are unavailable.
We hope this book serves you well in your daily work which involves imaging.
Peter Corr Durban 2001
vii

Authors
Lai Peng Chan MBBS, FRCR Registrar, Department of Diagnostic Radiology, Singapore General Hospital, Singapore
Peter Corr MBChB, FFRad (D) SA, FRCR Professor of Radiology, Nelson R Mandela School of Medicine, University of Natal,
Durban, South Africa
Lesley A Goh MBBS, FRCR Registrar, Department of Diagnostic Imaging, Tan Tack Seng Hospital, Singapore
Lawrence Hadley MBChB, FRCS (Edin) Professor of Paediatric Surgery, Nelson R Mandela School of Medicine, University of
Natal, Durban, South Africa
Wong Siew Kune MBChB, FRCR Associate Consultant, Department of Diagnostic Radiology, Singapore General Hospital,
Singapore
Leonie Munro Nat Dip Radiography (D), MA (Unisa), Dip Public Admin-postgrad (UDW), Cert for trainers (Unisa)
Chief Tutor School of Radiography, King Edward VIII Hospital, Durban, South Africa
Malai Muttarak MD Professor of Radiology, Department of Radiology, Chiang Mai University Medical
School, Chiang Mai, Thailand
Wilfred C G Peh MBBS, MD, FRCR, FRCPE, FRCPG Senior Consultant, Department of Diagnostic Radiology, Singapore General Hospital,
Singapore
Swee Tian Quek MBBS, FRCR Consultant, Department of Diagnostic Imaging, National University of Singapore,
Singapore
William Rae MBChB (Wits) PhD (OFS) Senior Medical Physicist, Addington Hospital, Durban
Fei Ling Thoo MBBS, FRCR Consultant, Department of Radiology, Changi General Hospital, Singapore
ix
X
Definitions
ALARA keeping radiation dose 'as low as reasonably achievable'
AP anteroposterior means patient is facing the X-ray tube/beam (see PA)
Atelectasis radiographic pattern to describe (i) incomplete expansion of lungs at birth, or (ii) collapse of adult lung usually with limited re-expansion
Baud number of bytes transmitted in one second in telemedicine
Bit smallest unit of digital information
Byte a group of 8 bits used to transmit a value of character
Collapse radiographic pattern of partially or completely airless lung due to some form of obstruction
Consolidation a region of lung opacification following pneumonia with air bronchograms. Strictly a pathological term for lobar pneumonia.
CTR cardia-thoracic-ratio is the ratio of the measurement of widest transverse diameter of the heart on a chest radiograph versus the widest transverse ratio of the thoracic cage
Decubitus view patient lying on either left or right side and radiograph is taken using a horizontal X-ray beam at right angles to the cassette placed either behind the patient (PA decubitus) or in front of patient (AP decubitus)
DICOM a standard allowing interfacing of digital imaging devices with other digital devices
Digitise process to convert analogue data or images into digital data
Effusion fluid in a cavity, e.g. pleural cavity
FFD focal film distance, i.e. distance from source of X-ray beam to the film
Horizontal beam/shoot-through film taken using horizontal X-ray beam at right angles to the cassette; patient can be supine, prone, semi-erect, lateral
ISDN integrated system digital network
IVU intravenous urography
KUB plain-film-radiograph of abdomen; i.e. kidneys to bladder region
Lossless compression there is no alteration of original image after reconstruction in digital imaging
Osteopaenia decreased bone density on a radiograph.
PA posteroanterior view with X-ray beam entering from behind the patient and emerging through anterior part because patient is positioned facing cassette
Sclerosis increased bone density or opacity on the radiograph

PART 1
TECHNIQUE, QUALilY CONTROL AND RADIATION PROTECTION

CHAPTER 1
Image quality optimisation and control Leonie Munro
Introduction What is pattern recognition in imaging and what are the factors that impact on this recognition? Pattern recognition may be defined as being able to recognise normal anatomical and physiological appearances on an image and those variations of appearances, which may indicate pathology. This implies that certain criteria should be met, to be competent in pattern recognition. Firstly a person who performs pattern recognition should have a fair amount of expertise in medical imaging and knowledge of radiographic anatomy and normal variants so as to identify variations that may indicate pathology. This is the overarching aim of this book hence the many aspects of pattern recognition are fleshed out in the other chapters. This chapter concentrates on factors that impact on image quality. It is not easy to clearly define optimal image quality. In theory optimal image quality allows one to make accurate diagnosis. This is an ideal as we also should consider dose to patients in keeping with the ALARA principle (as low as reasonably achievable). There are times when an image is suboptimal but not unacceptable. In other words slight deviations in image quality may not have a significant impact for pattern recognition. Unacceptable images may cause one to miss a fracture or a destructive lesion. To repeat or not to repeat depends on the reasons for the examination and whether one can confidently perform pattern recognition to make a diagnosis. Such a decision is usually based on experience and a set procedure when evaluating images. Examples of unacceptable radiographs are included in this chapter to highlight the importance of optimal image quality. If an image is unacceptable then the radiation received by the patient has no benefit. Thus there are some important factors andjor basic tests that should be considered at all times.
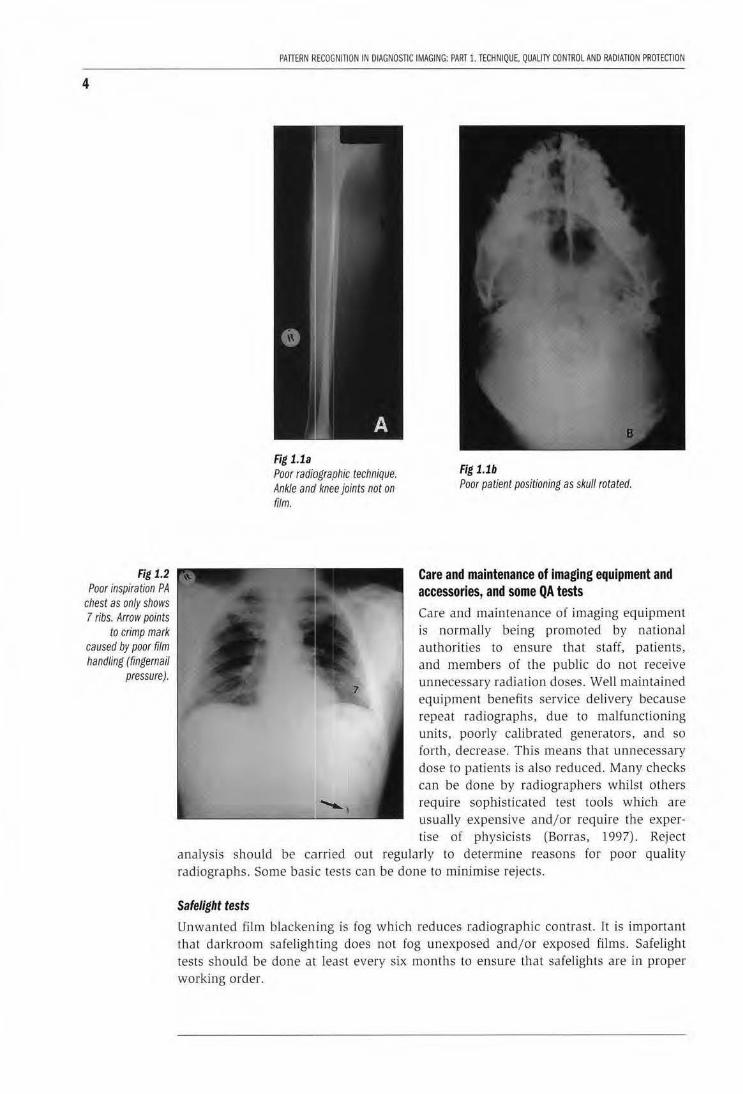
It would be difficult to confidently perform pattern recognition if the image quality of a dynamic image or hard copy is not of an acceptable standard. There is consensus that optimal image quality entails meeting medico-legal requirements, such as each image to contain the patient's details, date of examination, anatomical marker, and adequate visualisation of radiographic anatomy /signs. This means that patient positioning should be correct for each projection, that the images are not blurred and that optimal image density is visualised. Image quality thus depends on correct radiographic techniques being used for each projection, correct selection of exposure factors and use of suitable imaging systems which are of an optimal standard. Just to mention that it is usually necessary to do two projections/views, usually at right angles. The patient/area of interest should be in accordance with recommended projections to ensure that all relevant anatomical parts are visualised (fig 1.1a). For example in skull radiography the patient's head should be straight to allow one to comment of symmetry of the skull bones (fig 1.1 b). Chest radiographers should always be exposed on full inspiration to prevent incorrect diagnosis due to unacceptable radiography (fig 1.2). Apart from positioning criteria the following are considered to have an impact on image quality.
3
4
Fig 1.2 Poor inspiration PA
chest as only shows 7 ribs. Arrow points
to crimp mark caused by poor film handling (fingemail
pressure).
PATTERN ~:ECOGNITION IN DIAGNOSTIC IMAGING: PART l.lECHNIQUE, QUALITY CONTROL AND RADIATION PROTECTION
Fig 1.1a Poor radiographic technique. Ankle ana' knee joints not on film.
Fig 1.1b Poor patient positioning as skull rotated.
Care and maintenance of imaging equipment and accessories, and some QA tests Care and maintenance of imaging equipment is normally being promoted by national authorities to ensure that staff, patients, and members of the public do not receive unnecessary radiation doses. Well maintained equipment benefits service delivery because repeat radiographs, due to malfunctioning units, poorly calibrated generators, and so forth, decrease. This means that unnecessary dose to patients is also reduced. Many checks can be done by radiographers whilst others
""""'-1
require sophisticated test tools which are ------------L------' usually expensive and/or require the exper-tise of physicists (Borras, 1997) . Reject
analysis should be carried out regularly to determine reasons for poor quality radiographs. Some basic tests can be done to minimise rejects.
Safelight tests
Unwanted film blackening is fog which reduces radiographic contrast. It is important that darkroom safeligh ting does not fog unexposed and/or exposed films . Safelight tests should be done at least every six months to ensure that safelights are in proper working order.
CHAPTER 1. IMAGE QUALITY OPnMISATION AND CONTROl
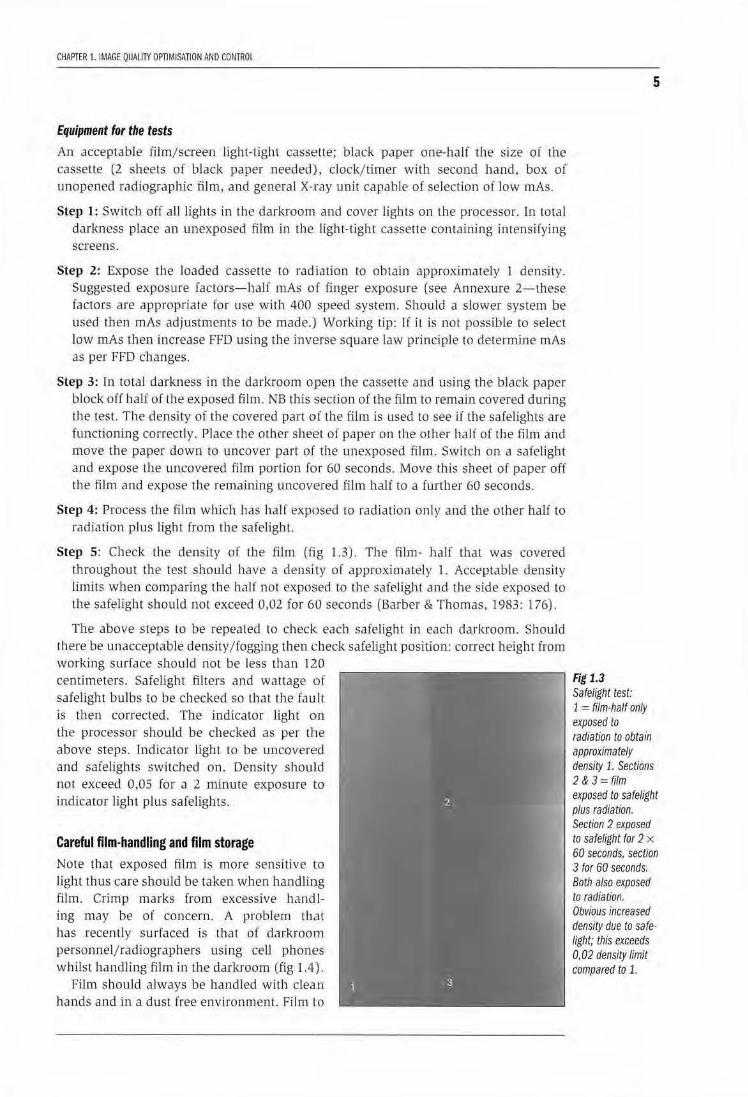
Equipment for the tests
An acceptable film/ screen light-tight cassette; black paper one-bali the size of the cassette (2 sheets of black paper needed), clock/timer witl:l second hand, box of unopened radiographic film , and genera l X-rray unit capable of selection of low n1As.
Step 1: Switch off all lights in the darkroom and cover lights on Lhe processor. ln total darkness place an unexposed film in the light-tight cassette containing intensifying screens.
Step 2: Expose the loaded cassette to radiation to obtain approximately 1 density. Suggested exposure factors-half mAs of finger exposure (see Annexure 2-lbese factors are appropriate for use with 400 speed system. Should a slower system be used then mAs adjustments to be made.ll Working tip: I[ it is not possible to select low mAs then increase FFD using the inv(?rse square law principle to determine mAs as per FFD changes.
Step 3: rn total darkness in the darkroom o;pen the cassette and using the black paper block off half of the exposed film . NB this section of the film to remain covered during the test. The density of the covered part of the film is used to see if the safelights are 'functioning correctly. Place the other sheet of paper on lJ1e other half of the film and move the paper down to uncover part of the unexposed film. Switch on a safelight and expose the uncovered film portion for 60 seconds. Move this sheet of paper off the film and expose the remaining uncoviered film half to a further 60 seconds.
Step 4: Process the film which has half exposed to railiation on ly and the other half to radiation plus light from the safeli.ght.
Step 5: Check the density of the film (fig 1.3). The film - half tbat was covered throughout the test should have a density of approximately 1. Acceptable density limits when comparing the half not exposed to the safelight and the side exposed to the safelight should not exceed 0,02 for 60 seconds (Ba rber & Thomas. 1983: 176).
The above steps to be repeated to check each safelight in each darkroom. Should there be unacceptable density/fogging then check safelight position: correct height from working surface shou ld not be less U1an 120 centimeters. Safelight filters and wat tage of safelight bulbs to be checked so that the fault is then corrected. The jndicator light on the processor should be checked as per the above steps. fndicator light to be uncovered and safelights switched on. Density shoulld not exceed 0,05 for a 2 minute exposure to indicator light plus safelights .
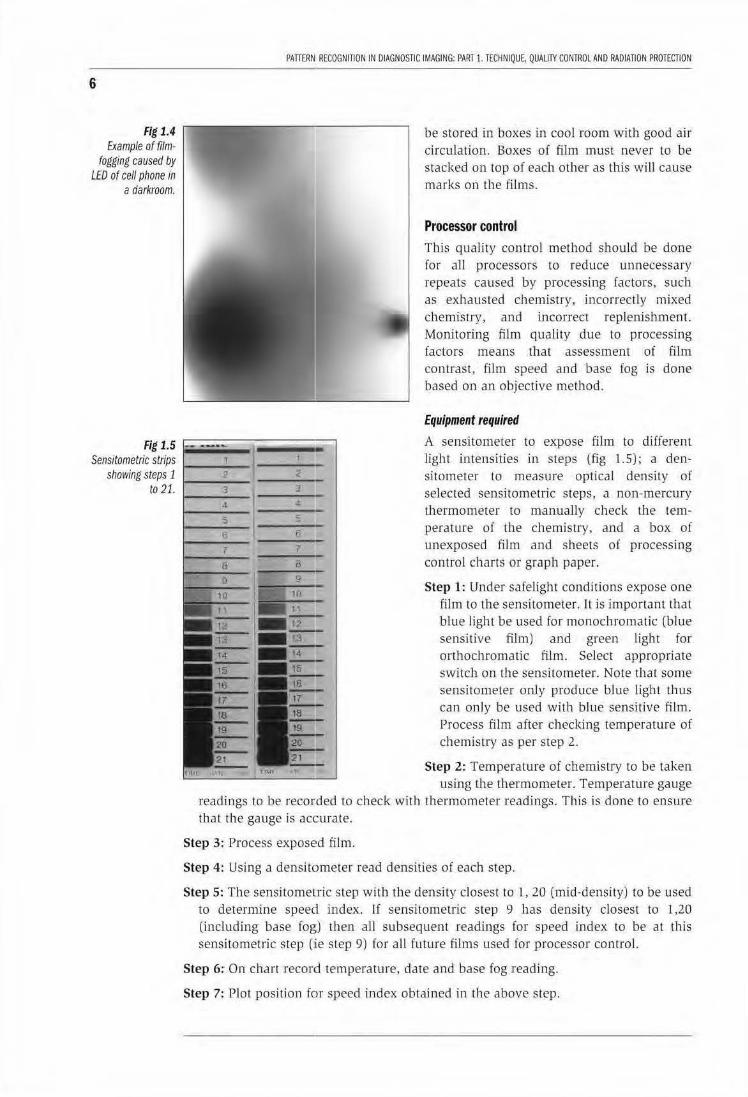
Careful film-handling and film storage Note that exposed film is more sensitive to light thus care should be taken when handlillg fi lm. Crimp marks from excessive handling may be of concern. A problem that has recently surfaced is lhal of darkroorn personnel/radiographers using ceU phont?s whilst handJing film in the darl<room (fig 1.4).
Film sbould always be handled with clea.n hands and in a dust free environmenl. Film to
Fig 1.3 Safeligflt test:
5
1 = film·ha/f only exposed to radiation to obtain approximately density 1. SecUons 2 & 3 = film exposed to safe/ight plus radiation. Section 2 exposed to safelight for 2 x 60 seconds, secuon 3 for 60 seconds. Both also exposed to radiation. Obvious increased density due to safe· light; this exceeds 0.02 density limit compared to 1.
6
Fig 1.4 Example of film
fogging caused by LED of cell phone in
a darkroom.
PATTERN RECOGNITION IN OIAGN05nC IMAGING: PART 1. TECfiNIQUE, QUALilY CONTROL AND RADIATION PROTECTION
be stored in boxes in cool room with good air circulation. Boxes of film must never to be stacked on top of each other as this will cause marks on Lhe films.
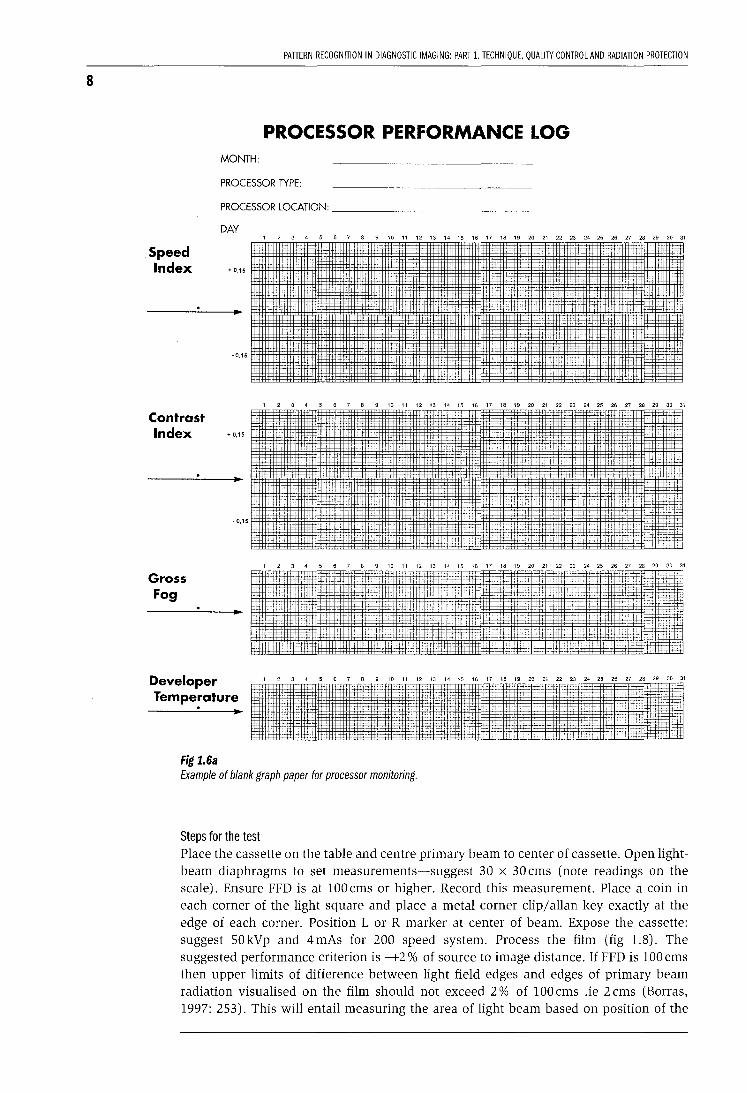
Processor control This quality control method shou ld be done for aJI processors to reduce unnecessary repeats caused by processing factors, sucb as exhausted chemistry, incorrectly mixed chemistry, and incorrect replenishment. Monitoring film quality due to processing factors means that assessment of film contrast, film speed and base fog is done based on an objective method.
Equipment required
A sensitometer to expose film to different light intensities in steps (fig 1.5); a densitometer to measure optical density of selected sensitometric steps, a non-mercury thermometer to manually check Lhe temperature of the chemistry, and a box of unexposed film and sheets oi processing control charts or graph paper.
Step 1: Under safelight conditions expose one film to the sensitometer. It is important that blue light be used for monochromatic (blue sensll1ve film) and green light for orthochromatic film. Select appropriate switch on the sensitometer. Note that some sensitometer only produce blue light thus can only be used with blue sensitive film. Process film after checking temperature of chemistry as per step 2.
Step 2: Temperature of chemistry to be taken using the thermometer. Temperature gauge
readings to be recorded to check with thermometer xeadings. Ibis is done to ensure that the gauge is accurate.
Step 3: Process exposed film.
Step 4: Using a densitometer read densities of each step.
Step 5: The sensitometric step with the density closest to l, 20 (mid-density) to be used to determine speed index. If sensitometric step 9 has density closest to 1,20 (including base fog) then all subsequent xeadings for speed index to be at this sensitometric step (:ie step 9) for all future films used for processor control.
Step 6: On chart record temperature, date and base fog reading.
Step 7: Plot position for speed index obtained in the above step.

CHAPTER 1. IMAGE QUALITY OPTIMISATION AND CONTROL
Step 8: For 5 consecutive days repeat the preceding steps to obtain average density at sensitometric step 9. This value will be the control speed index against which all future sensitometric films will be compared.
Step 9: Plot average speed index on chart/graph paper as obtained over the five days.
Step 10: Draw 2 lines above and below the speed index. One parallel line to be +0,15 of speed index and the other to be at -0, 15 from the speed index. Deviations outside these 2 lines means that there is an unacceptable processor problem. For example replenishment may have been decreased, the temperature may have decreased/ increased, and so forth.
NB: Base fog reading of each film, the date the test was done, and temperature of chemistry to be recorded on the chart. Working tip: Always do processor control at the same time.
Some firms supply pre-exposed sensitometric films but it is important to only use the film within a given period because with time film fog increases. If a densitometer is not available then do visual checks by placing the strips on an illuminator but ensure that all extraneous light is masked off and ambient (overhead) light switched off. Visual comparisons are a crude method but preferable to no checks at all. Some film suppliers have facilities to read film for customers. Suggestion: find out from film supplier whether such facilities are available. Arrangements could be made to post batches of film strips to the supplier. Recommendations: density readings to be written next to each sensitometric step on each film then this should allow one to compared with visual comparisons. However the proper method of processor control should where possible be used for valid objective testing to enhance processor control results which enables speedy problem solving (fig 1.6a, 1.6b).
• Film-screen contact test It is essential that images be obtained with good film-screen contact. Poor film-screen causes loss of information which may cause inaccurate pattern recognition. The filmscreen contact test tool is readily available but a bit expensive. To perform the test place the contact mesh tool (wire mesh encased in perspex) on the top of the suspect cassette containing an unexposed film. Centre to center of cassette, collimate to cover cassette. Make sure that table on which the cassette is placed and the central ray are at right angles. Expose the test tool using approximately 55-60 kVp and 4 mAs (for 200 speed system) and 100 ems Focal film distance. Process the film and view at a distance of 150-180 ems to evaluate the sharpness of the wire mesh. Poor contact is seen as a "blurred" outline (fig 1. 7). Poor film-screen contact usually occurs when a cassette gets dropped when excessive force is used during handling.
• Collimator-beam alignment test This test should be done at least every month to check proper alignment of collimator and primary beam as daily use of the collimator contributes to poor alignment of the light beam and primary beam. This in turn causes suboptimal positioning as it may be difficult to accurately centre as per routine techniques.
Equipment for the test 35 x 43 cassette or smaller lloaded with unexposed film. Four coinsjsteel washers and metal clips/allan keys. Lead markers (L & R).
7
8
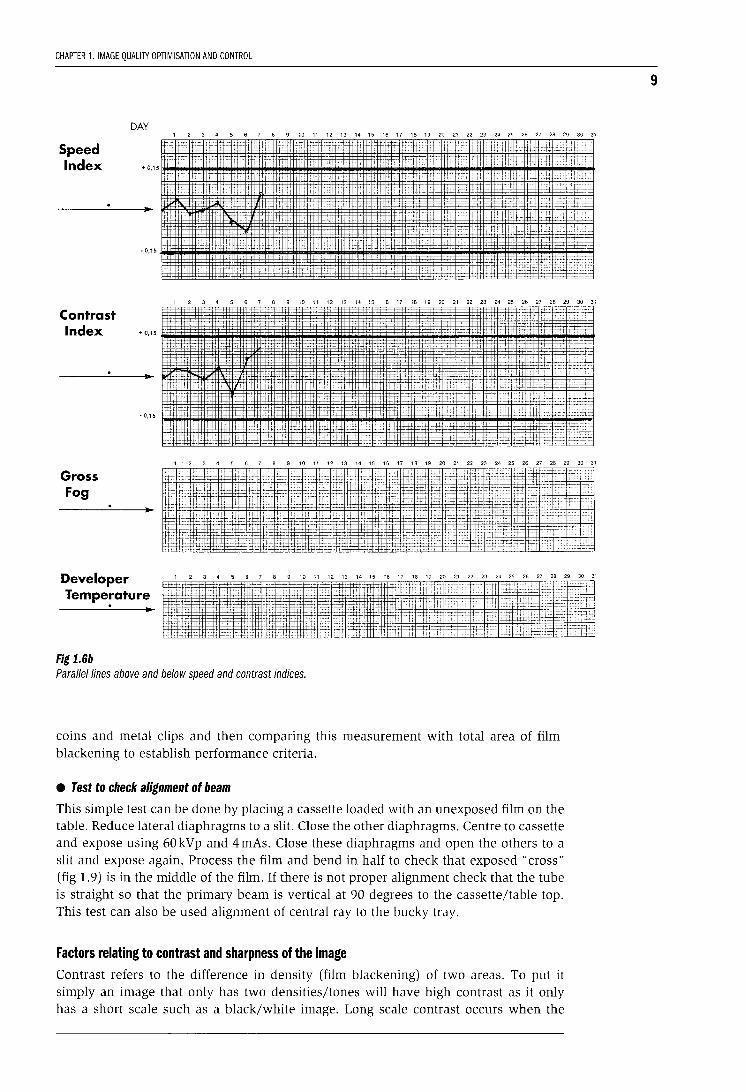
PATIERN RECOGNITION IN DIAGNOSTIC IMAGING: PART 1. TECHNIQUE, QUALITY CONTROL AND RADIATION PROTECTION
PROCESSOR PERFORMANCE LOG MONTH:
PROCESSOR TYPE:
PROCESSOR LOCATION: _____________ _
Speed Index
Contrast
DAY
+ 0,15
~ 0,15
Index .,,15
Gross Fog
-0,15
Developer Temperature
Fig 1.6a
, 2 3 4 5 6 7 8 9 10 11 12 13 14 15 16 17 18 19 20 21 22 23 24 25 26 27 28 29 30 31
1 2 3 4 5 6 7 8 9 10 11 12 13 14 15 16 17 18 19 20 21 22 23 24 25 26 27 28 29 30 31
1 2 3 4 5 6 7 8 9 10 11 12 13 14 15 16 17 18 19 20 21 22 23 24 25 26 27 28 29 30 31
T tt- ~ ' f-!J 1~ 1-r __,__. " _t- +:• _;-:: "l-t-i
t·.! it- J ~~;t+-·~· :J:-+
f,ji}f ~ ~ :r· i:i'~' oc
,-:-:: -;:-r:~ ::--:::• :i:+~
1 2 3 4 5 6 7 8 9 10 11 12 13 14 15 16 17 18 19 20 21 22 23 24 25 26 27 28 29 30 31
' l,l1
. !1;: :c:::
Example of blank graph paper for processor monitoring.
Steps for the test Place the cassette on the table and centre primary beam to center of cassette. Open lightbeam diaphragms to set measurements-suggest 30 x 30 ems (note readings on the scale). Ensure FFD is at 100 ems or higher. Record this measurement. Place a coin in each corner of the light square and place a metal corner clip/allan key exactly at the edge of each corner. Position L or R marker at center of beam. Expose the cassette: suggest SOkVp and 4mAs for 200 speed system. Process the film (fig 1.8). The suggested performance criterion is -+2% of source to image distance. If FFD is 100 ems then upper limits of difference between light field edges and edges of primary beam radiation visualised on the film should not exceed 2% of 100 ems .ie 2 ems (Borras, 1997: 253). This will entail measuring the area of light beam based on position of the
CHAPTER 1. IMAGE QUALITY OPTIMISATION AND CONTROL
DAY 1 2 3 4 5 6 7 8 9 10 11 12 13 14 15 16 17 18 19 20 21 22 23 24 25 26 27 28 29 30 31
Speed Index t~ -~ +
+ 0,15 r
1_::- '
• 0,15
. 'j
~ 'i: 't )::~ '4- _t;_j_J j> _:_; ++ r"-:;::t~~~ +-=~t-
-f-
---H- -:- :;j::i t- +
~ T 1-
-~ ti
1 2 3 4 5 6 7 8 9 10 11 12 13 14 15 16 17 18 19 20 21 22 23 24 25 26 27 28 29 30 31
Contrast Index + 0,15
·0,15
I : H
1 2 3 4 5 6 7 B 9 10 11 12 13 14 15 16 17 18 19 20 21 22 23 24 25 26 27 28 29 30 31
Gross Fog
Developer Tempe~ature
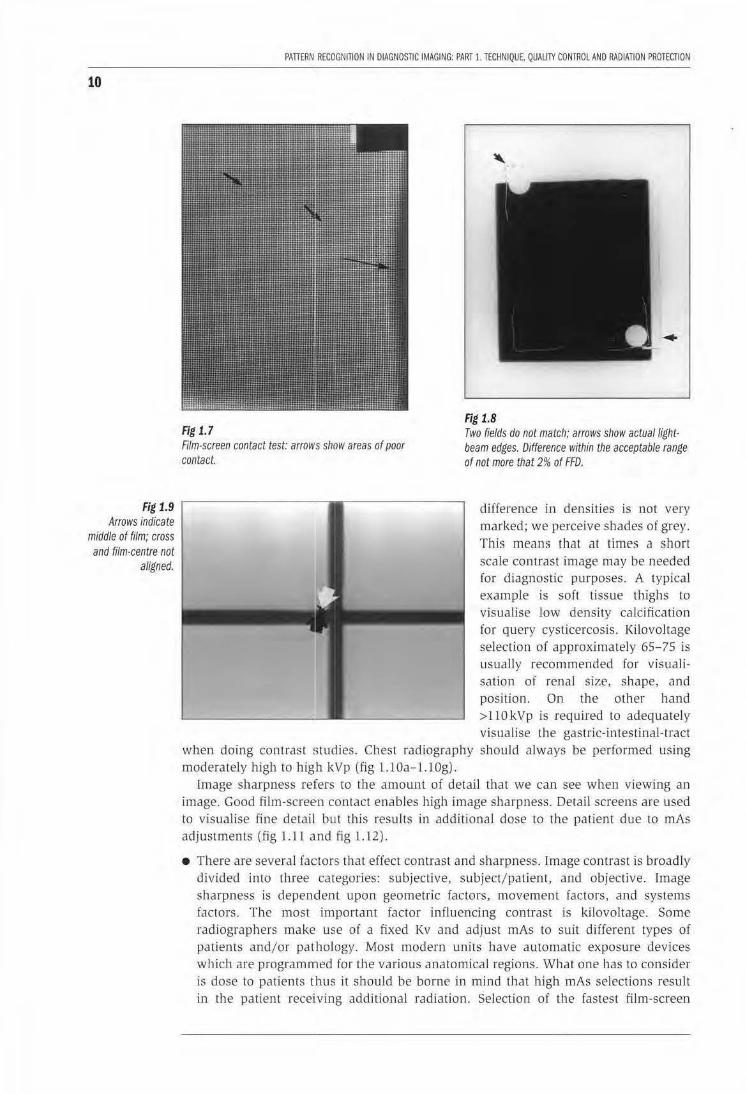
Fig 1.6b
·;rr .Cfui 4 ~if1
~'" r• ii211 f • ;+. · f+ ;- ' ·-~_r .;: <-t
. •t.J~J [nr:rmrl!illrER
1 2 3 4 5 6 7
·+. : t ' t: " :t;:: .. ,, '
' ' ::' l': ;_~ tk
_,___ 'j_-t
+· --: -...:-~:!
8 9 10 11 12 13 14 15
·+:· t:tt "
:~ ~l'rr:~rr fW iJf~ lr.§ 1":
Parallel lines above and below speed and contrast indices.
__ ; :cj::::tin'$ ~+:::~ 1'' ' l:t~'l'rc0 :
$ll£'±? :'t ii j um:~ i.e r : _, ' ,~, 1::: 1::: .: tc' -d'cr ,1. ··-- ___ ·::.
~ :;=., , <,m=gr A :rti~. ::: -- ·:·.: '"-r
16 17 18 19 20 21 22 23 24 25 26 27 28 29 30 31
'5 :~:_= ='" crt·• :~tr 'ci :~ (.;,; ·~~· : '~~ iri 1E: · :.rtf:frrfsL :G: it: ,:.;r ::: ;:; ::~£_
"-'"= : =.ld!Tii £~: ''1 ~ fffi ·~ :::;~ l:• ,.~ :.~ -=~t 1~4!1~-=:--t-~_t~-:r .;~" :~-:-~ -=~:: ~F~
coins and metal clips and then comparing this measurement with total area of filmblackening to establish performance criteria.
• Test to check alignment of beam
This simple test can be done by placing a cassette loaded with an unexposed film on the table. Reduce lateral diaphragms to a slit. Close the other diaphragms. Centre to cassette and expose using 60kVp and 4mAs. Close these diaphragms and open the others to a slit and expose again. Process the film and bend in half to check that exposed "cross" (fig 1.9) is in the middle of the film. If there is not proper alignment check that the tube is straight so that the primary beam is vertical at 90 degrees to the cassette/table top. This test can also be used alignment of central ray to the bucky tray.
Factors relating to contrast and sharpness of the image Contrast refers to the difference in density (film blackening) of two areas. To put it simply an image that only has two densities/tones will have high contrast as it only has a short scale such as a black/white image. Long scale contrast occurs when the
9
10
Fig 1.9 Arrows indicate
middle of film; cross and film-centre not
aligned_
PATIERN RECOGNITION IN DIAGNOSTIC IMAGING: PART 1. TECHNIQUE. QUAUlY CONTROL AND RADIATION PROTECTION
Fig 1]
Aim-screen contact test.- arrows show areas of poor contact.
Fig 1.8 Two fields do not match; arrows show actual tightbeam edges. Difference within the acceptable range of not more that 2% of FFD_
diiference in densities is nol very marked; we perceive shades of grey_
This means that at times a short scale contrast image may be needed for d iagnostic purposes_ A typical example is soft tissue thighs to visualise low density calcification for query cysticercosis_ Kilovoltage selection of approximately 65-75 is usually recommended for visualisation of renal size, shape, and position_ On the other hand >llOkVp is required to adequately visualise the gastric-intestinal-tract
when doing contrast studies_ Chest radiography should always be performed using moderately high to high k Vp (fig L1 Oa- l.lOg).
Image sharpness relfers to the amount of detail that we can see when viewing an image . Good film-screE'n contact enables high image sharpness_ Detail screens are used to visualise fine detail but this results in additional dose to the patient due to mAs adjustments (fig Lll and fig Ll2)_
• There are several factors that effect contrast and sharpness_ lmage contrast is broadly divided into three categories: subjective, subject/patient, and objective_ fmage sharpness is depen,dent upon geometric factors, movement factors, and systems factors. The most important factor influencing contrast is kilovoltage_ Some radiographers make use of a fixed Kv and adjust mAs to suit different types of patients and/or pathology. Most modern units have automatic exposure devices which are programmed for the various anatomical regions. What one has to consider is dose lo patients thus it should be borne in mind that high mAs selections result in the patient receiving additional radiation_ Selection of the fastest fi lm-screen

CHAPTER 1. IMAGE QUAUTY OPTIMISATION AND CONTROl
Fig 1.10a Lateral view of femur a bit over-penetrated for visualisation of soft tissue but image acceptable.
Fig 1.10b AP supine abdomen (control) of 10 year male patient for barium enema. Note lack of gonad protection. Exposure selection not based on ALARA as low kV and high mAs (70kVp, 40mAs) used.
Fig 1.10e
11
Fig 1.10c AE film of same patient; again no gonad protection and inappropriate exposure selection.
Too much mAs used for the chest hence lung markings not demonstrated.
Fig 1.10d Delayed AE of same patient. Radiograph taken by different radiographer who applied ALARA principles, gonad protection, 88 kV used and mAs decreased accordingly to 5 mAs. Note improved visualisation of large bowel patterns due to long-scale contrast image.
12
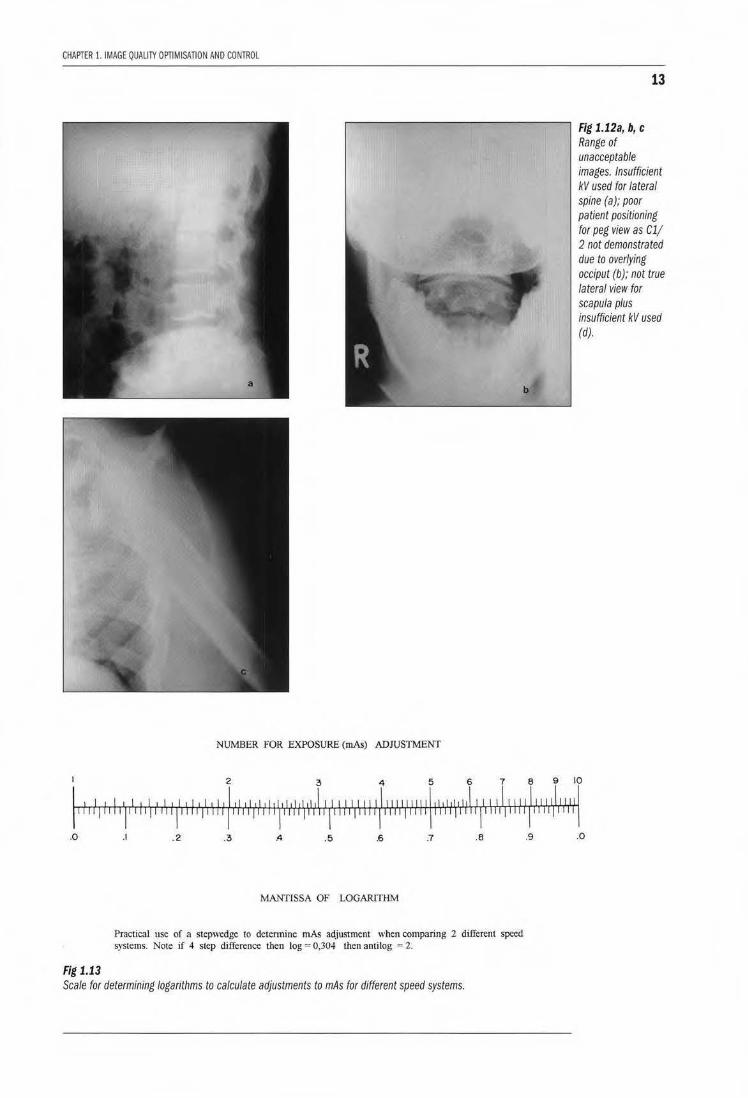
Fig 1.11 Example of different
densities of calibrated step·
wedge. Step-wedge of Right not same as the other two. Note ball-bearing
taped on step 8 to make it easy to
align similar density steps. On right step
4/5 aligned to match steps of the
other two. Right step-wedge of a
fast system thus if
PATTERN RECOGNITION IN DIAGNOSTIC IMAGING: PART 1. TECHNIQUE, QUALITY CONTROL AND RADIATION PROTECTION
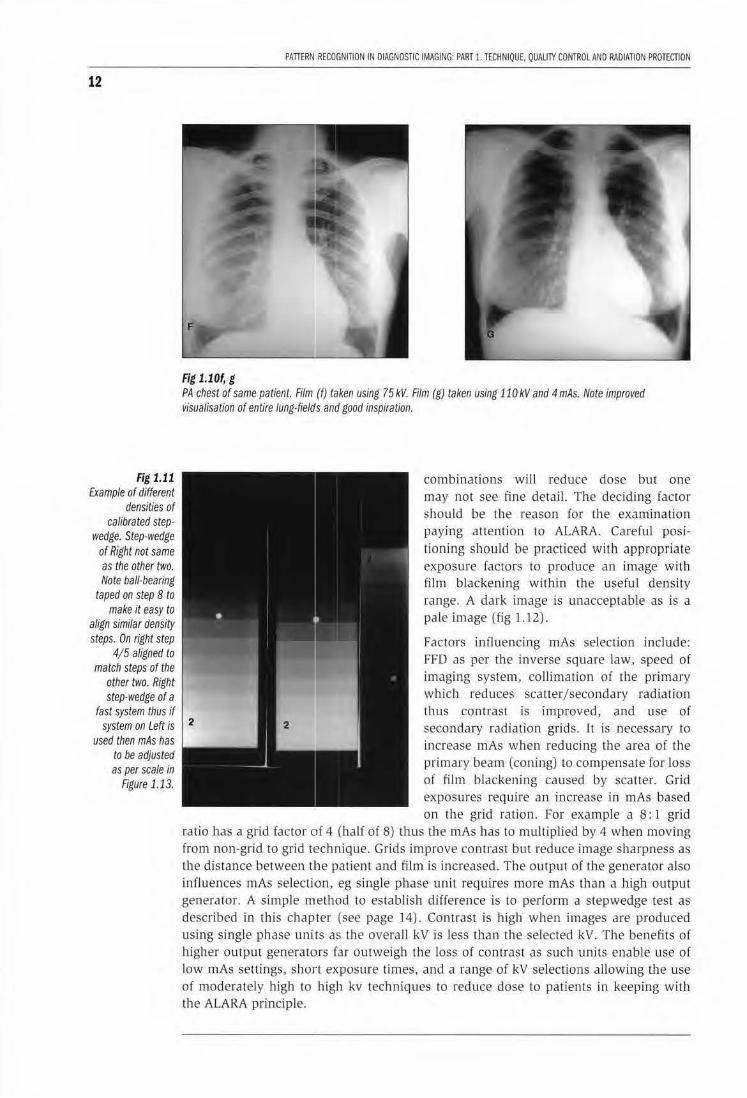
Fig 1.10f, g PA chest of same patient. Film (f) taken using 75 kV. Film (g) taken using 110 kV and 4 mAs. Note improved visualisation of entire lung-field's and good inspiration.
combinations will reduce dose bur one may not see fine detail. The deciding factor should be lhe reason for the examination paying attention to ALARA. Careful positioning should be practiced with appropriale exposure factors to produce an image with film blackening within the useful density range. A dark image is unacceptable as is a pa.le image (fig 1. l2).
Factors influencing mAs selection include:
system on Left is 2 used then mAs has
FFD as per th e inverse square law, speed of imaging system, collimation of the primary which reduces scatlerjsecondary radiation thus contrast is improved, and use of secondary radiation grids. It is necessary to increase mAs when reducing the area of the primary beam (coning1 to compensate for loss of film blackening caused by scatter. Grid exposures require an increase in mAs based on the grid ration. for example a 8: 1 grid
to be adjusted as per scale in
Figure 1.13.
ratio has a grid factor of 4 (half of 8) thus the mAs has to multiplied by 4 when moving from non-grid to grid tl=chnique. Grids improve contrast but reduce image sharpness as tl1e distance between tlhe patient and film is increased. The output of the generato r also influences mAs selecti•on, eg single phase unit requires more mAs than a high output generator. A simple method to establish difference is to perform a stepwedge test as described in this chapter (see page 14). Contrast is higJ1 when images are produced using single phase units as the overall kV is less than the selected kV. The benefits of higher output generators far outweigh the loss of contrast as such units enable use of low mAs settings, short exposure times, and a range of kV selections allowing the use of moderately high to high kv techn iques to reduce dose to patients in keeping with the ALARA principle.
CHAPTER 1. IMAGE QUAUlY OPTIMISATION AND CONTROl
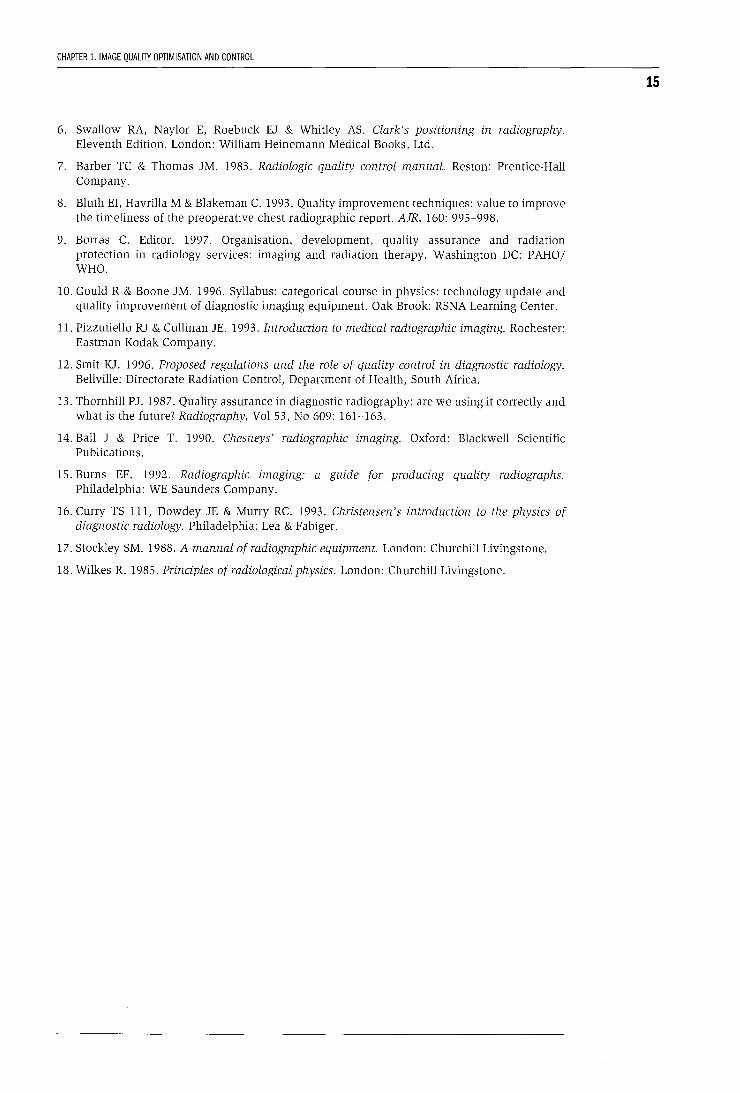
NUMBER FOR EXPOSURE (mAs) ADJUSTMENT
13
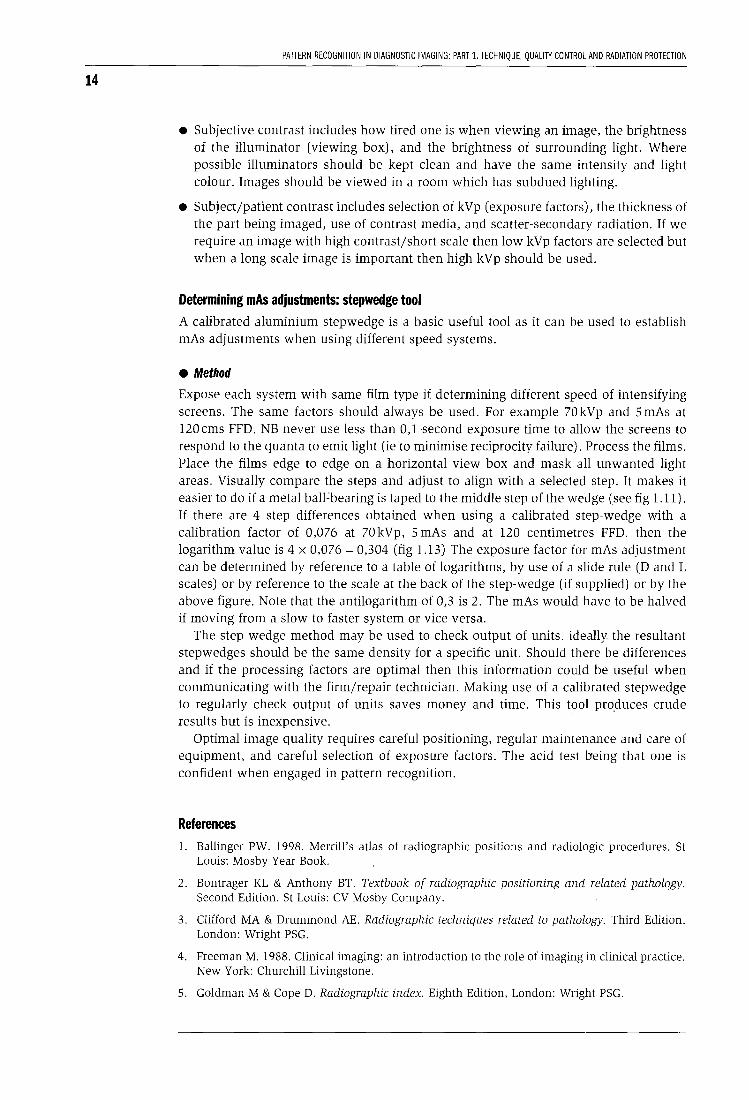
Fig 1.12a, b, c Range of unacceptable images. Insufficient kV used for lateral spine (a); poor patient positioning for peg view as Cl/ 2 not demonstrated due to overlying occiput (b); not true lateral view for scapula plus insufficient kV used (d).
I 2 3 4 5 6 7 8 9 10
I ' I I I ' I I I ' I I' ' I ,] ' I ' 1,, " " " I' " 'I " •I .I, I I I I ' 11'1 II II I II 1' \" " ,, ,I, I II I, I' ' I, " ,I II "I llllllllllllfl l 1"11 11 1 'l lrlllllr lllfijlllll ll iljl T'''ll'' 111rpnTII 'IIITIIIIIlii
.0 .2 .3 A .5 .6 .7 .8 .9 .0
Fig 1.13
MANTISSA OF LOGAR!Tlil\.1
Practical use of a stepwedge to determine mAs adjusrment when comparing 2 different speed systems. Note if 4 step difference then log ~ 0.304 then antilog = 2.
Scale for determining logarithms to calculate adjustments to mAs for different speed systems.
14
PAITERN RECOGNITION IN DIAGNOSTIC IMAGING: PART 1. TECHNIQUE, QUALITY CONTROL AND RADIATION PROTECTION
• Subjective contrast includes how tired one is when viewing an image, the brightness of the illuminator (viewing box), and the brightness of surrounding light. Where possible illuminators should be kept clean and have the same intensity and light colour. Images should be viewed in a room which has subdued lighting.
• Subject/patient contrast includes selection of kVp (exposure factors), the thickness of the part being imaged, use of contrast media, and scatter-secondary radiation. If we require an image with high contrast/short scale then low kVp factors are selected but when a long scale image is important then high kVp should be used.
Determining mAs adjustments: stepwedge tool A calibrated aluminium stepwedge is a basic useful tool as it can be used to establish mAs adjustments when using different speed systems.
• Method
Expose each system with same film type if determining different speed of intensifying screens. The same factors should always be used. For example 70 kVp and 5 mAs at 120cms FFD. NB never use less than 0,1-second exposure time to allow the screens to respond to the quanta to emit light (ie to minimise reciprocity failure). Process the films. Place the films edge to edge on a horizontal view box and mask all unwanted light areas. Visually compare the steps and adjust to align with a selected step. It makes it easier to do if a metal ball~bearing is taped to the middle step of the wedge (see fig 1.11). If there are 4 step differences obtained when using a calibrated step-wedge with a calibration factor of 0,076 at 70 kVp, 5 mAs and at 120 centimetres FFD. then the logarithm value is 4 x 0,076 = 0,304 (fig 1.13) The exposure factor for mAs adjustment can be determined by reference to a table of logarithms, by use of a slide rule (D and L scales) or by reference to the scale at the back of the step-wedge (if supplied) or by the above figure. Note that the antilogarithm of 0,3 is 2. The mAs would have to be halved if moving from a slow to faster system or vice versa.
The step wedge method may be used to check output of units. ideally. the resultant stepwedges should be the same density for a specific unit. Should there be differences and if the processing factors are optimal then this information could be useful when communicating with the firm/repair technician. Making use of a calibrated stepwedge to regularly check output of units saves money and time. This tool pro_duces crude results but is inexpensive.
Optimal image quality requires careful positioning, regular maintenance and care of equipment, and careful selection of exposure factors. The acid test being that one is confident when engaged in pattern recognition.
References l. Ballinger PW. 1998. Merrill's atlas of radiographic positions and radiologic procedures. St
Louis: Mosby Year Book.
2. Bontrager KL & Anthony BT. Textbook of radiographic positioning and related pathology. Second Edition. St Louis: CV Mosby Company.
3. Clifford MA & Drummond AE. Radiographic techniques related to pathology. Third Edition. London: Wright PSG.
4. Freeman M. 1988. Clinical imaging: an introduction to the role of imaging in clinical practice. New York: Churchill Livingstone.
5. Goldman M & Cope D. Radiographic index. Eighth Edition, London: Wright PSG.
CHAPTER 1. IMAGE QUALITY OPTIMISATION AND CONTROL
6. Swallow RA, Naylor E, Roebuck EJ & Whitley AS. Clark's positioning in radiography. Eleventh Edition. London: William Heinemann Medical Books, Ltd.
7. Barber TC & Thomas JM. 1983. Radiologic quality control manual. Reston: Prentice-Hall Company.
8. Bluth EI, Havrilla M & Blakeman C. 1993. Quality improvement techniques: value to improve the timeliness of the preoperative chest radiographic report. AIR, 160: 995-998.
9. Borras C. Editor. 1997. Organisation, development, quality assurance and radiation protection in radiology services: imaging and radiation therapy. Washington DC: PAHO/ WHO.
10. Gould R & Boone JM. 1996. Syllabus: categorical course in physics: technology update and quality improvement of diagnostic imaging equipment. Oak Brook: RSNA Learning Center.
11. Pizzutiello RJ & Cullinan JE. 1993. Introduction to medical radiographic imaging. Rochester: Eastman Kodak Company.
12. Smit KJ. 1996. Proposed regulations and the role of quality control in diagnostic radiology. Bellville: Directorate Radiation Control, Department of Health, South Africa.
13. Thornhill PJ. 1987. Quality assurance in diagnostic radiography: are we using it correctly and what is the future? Radiography, Vol 53, No 609: 161-163.
14. Ball J & Price T. 1990. Chesneys' radiographic imaging. Oxford: Blackwell Scientific Publications.
15. Burns EF. 1992. Radiographic imaging: a guide for producing quality radiographs. Philadelphia: WE Saunders Company.
16. Curry TS 111, Dowdey JE & Murry RC. 1993. Christensen's introduction to the physics of diagnostic radiology. Philadelphia: Lea & Fabiger.
17. Stockley SM. 1988. A manual of radiographic equipment. London: Churchill Livingstone.
18. Wilkes R. 1985. Principles of radiological physics. London: Churchill Livingstone.
15
16
CHAPTER 2
Radiation protection in radiological practice William Rae
X-ray production The radiation emitted from X-ray units while taking X-rays is photon radiation, and these photons are known as X-rays. They are generated when high energy electrons, accelerated by a high voltage potential difference, strike a target in the X-ray tube and their energy is converted to photons which radiate out from the target. The energy of the electrons, and hence the resultant photons, is expressed in terms of thousands of electron volts (ke V). Photon energies used in diagnostic radiology are in the range 20 ke V to 150 ke V. These photons have enough energy to cause ionisation, resulting in deposition of energy in the irradiated material. This energy deposition results in a reduction in the number of photons in the beam, and the beam is said to be "attenuated" by the absorbing material. The amount of energy absorbed differs for materials of different density or atomic composition. The differential absorption of X-rays between different structures, allows the creation of the contrast that is seen on X-ray films, and is diagnostically useful.
When a patient is exposed to an X-ray beam a large amount of radiation is also produced in other directions. Much of the radiation entering the patient is scattered and exits the patient in all directions. Some of the photon energy is lost during the scattering process, so the scattered photons are of a lower energy than the primary photons. For most radiographic procedures only about 1 to 10% of the primary beam emitted from the X-ray tube actually interacts with the detector system. (This excludes the photons absorbed by the casing and collimators of the X-ray tube). The rest of the energy is lost due to scatter or absorption in the patient. With newer, and more efficient, detector systems, less radiation is required to produce diagnostic quality images. This reduces exposure to the patient.
Biological effects of X-ray radiation The damaging (negative) effects of X-rays were noticed soon after their discovery. Early workers were initially unaware of the associated risks and thus took no precautions against being exposed to the X-ray beam whilst imaging patients. Skin damage and induced cancers were soon attributed to the extreme overexposures experienced by early radiation workers. As a result, efforts to understand and limit the negative biological effects have been made since the very early years of diagnostic radiology. Most of the information about the negative effects of radiation comes from nuclear power plant accidents, atomic explosions, radiotherapy patients, and radiation workers.
The biological effects of X-ray radiation are due to the ionisation that occurs when photon energy is deposited in living tissue. Intracellular water is ionised producing free radicals that can damage either the genetic material of the cell in the DNA of the chromosomes, or the intracellular organelles. The resultant effects are related to the amount of radiation absorbed by the tissues.
CHAPTER 2. RADIATION PROTECTION IN RADIOLOGICAL PRACTICE
Negative effects associated with X-ray radiation The intracellular damage that takes place after exposure results in two main categories of effects. Either the damage to the cells results in immediate effects, which may result in progressively worsening function and eventually cell death, or the damage to the cell's genetic content allows it to live and reproduce, but ultimately result in cancer after some delay period. The risk of seeing both these types of effects increases with increasing radiation exposure to the individual. The direct damage effects are only seen above some relatively high threshold level of exposure and they worsen as the dose increases. The chance of getting cancer though is low, but can be induced by low amounts of radiation. Cancer induction is an all or nothing effect, and there is a statistical chance that it will occur. The chance of occurrence is proportional to the amount of exposure.
Rapidly dividing cells are more sensitive to radiation effects, and the most sensitive tissues are thus gastrointestinal tract, gonads, bone marrow, and skin. The tissues most susceptible to radiation induced malignancy are bone marrow, bowel mucosa, breast tissue, gonads and lymphatic tissues.
The foetus is most susceptible to radiation at about 20 to 40 days post conception, and microcephaly and mental retardation are the most likely effects, followed by an increased incidence of cancer in childhood.
Quantification of radiation dose The amount of radiation delivered to an object (or person, or tissue) can be quantified as the energy (joules), deposited per unit mass (kilogram), of whatever is being exposed to the radiation. The specific SI unit for radiation dose is the gray (Gy), which is defined as one joule per kilogram. Different biological tissues respond differently to different types of radiation and to account for this a biological weighting factor is used. The SI unit of biologically effective dose is the sievert (Sv). This is also measured in terms of joules per kilogram, but accounts for the biological response of the particular tissue being irradiated.
Radiation protection regulations Regulations have been developed internationally over many years to control the amount of exposure that is allowed, and thus to minimise the incidence of radiation effects. The latest relevant publications are ICRP Publication 60, printed in 1990, and titled 1990 Recommendations of the International Commission on Radiological Protection, and the International Basic Safety Standards for Protection Against Ionizing Radiation and for Safety of Radiation Sources jointly published in 1996 by the WHO, IAEA and other international Organizations.
The "Aiara" principle
The guiding principle used in all these documents is that radiation doses to the public, and to people who work with radiation, must be kept As Low As Reasonably Achievable (ALARA principle). The effect of radiation at very low doses is still debated and the ALARA principle is adopted to avoid radiation exposure as much as possible, knowing that the risk of negative effects from small amounts of radiation approach those seen in the general public for those same negative effects.
Protection regulations
Equivalent dose is the sum of all doses from different types of radiation to an organ in an exposed person. Effective dose is the sum of the weighted equivalent doses, and is the
17
18
PATTERN RECOGNITION IN DIAGNOSTIC IMAGING: PART 1. TECHNIQUE, QUALITY CONTROL AND RADIATION PROTECTION
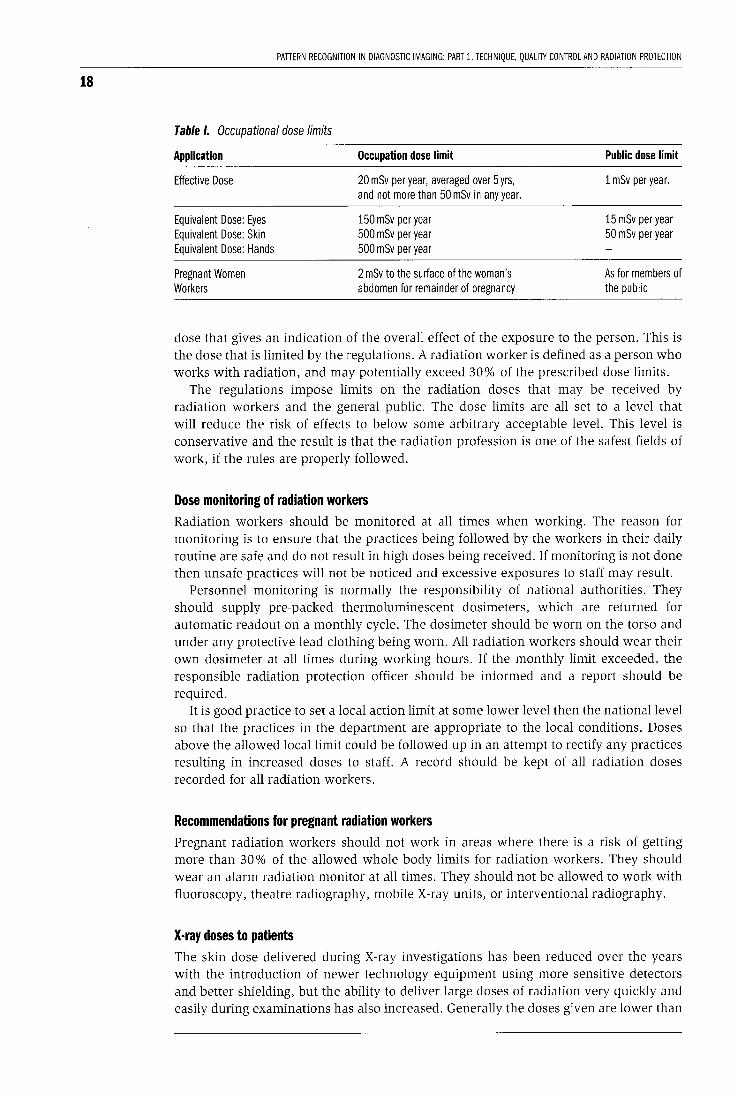
Table I. Occupational dose limits
Application
Effective Dose
Equivalent Dose: Eyes Equivalent Dose: Skin Equivalent Dose: Hands
Pregnant Women Workers
Occupation dose limit
20 mSv per year, averaged over 5 yrs, and not more than 50 mSv in any year.
150 mSv per year 500 mSv per year 500 mSv per year
2 mSv to the surface of the woman's abdomen for remainder of pregnancy
Public dose limit
1 mSv per year.
15 mSv per year 50 mSv per year
As for members of the public
dose that gives an indication of the overall effect of the exposure to the person. This is the dose that is limited by the regulations. A radiation worker is defined as a person who works with radiation, and may potentially exceed 30% of the prescribed dose limits.
The regulations impose limits on the radiation doses that may be received by radiation workers and the general public. The dose limits are all set to a level that will reduce the risk of effects to below some arbitrary acceptable level. This level is conservative and the result is that the radiation profession is one of the safest fields of work, if the rules are properly followed.
Dose monitoring of radiation workers Radiation workers should be monitored at all times when working. The reason for monitoring is to ensure that the practices being followed by the workers in their daily routine are safe and do not result in high doses being received. If monitoring is not done then unsafe practices will not be noticed and excessive exposures to staff may result.
Personnel monitoring is normally the responsibility of national authorities. They should supply pre-packed thermoluminescent dosimeters, which are returned for automatic readout on a monthly cycle. The dosimeter should be worn on the torso and under any protective lead clothing being worn. All radiation workers should wear their own dosimeter at all times during working hours. If the monthly limit exceeded, the responsible radiation protection officer should be informed and a report should be required.
It is good practice to set a local action limit at some lower level then the national level so that the practices in the department are appropriate to the local conditions. Doses above the allowed local limit could be followed up in an attempt to rectify any practices resulting in increased doses to staff. A record should be kept of all radiation doses recorded for all radiation workers.
Recommendations for pregnant radiation workers Pregnant radiation workers should not work in areas where there is a risk of getting more than 30% of the allowed whole body limits for radiation workers. They should wear an alarm radiation monitor at all times. They should not be allowed to work with fluoroscopy, theatre radiography, mobile X-ray units, or interventional radiography.
X-ray doses to patients The skin dose delivered during X-ray investigations has been reduced over the years with the introduction of newer technology equipment using more sensitive detectors and better shielding, but the ability to deliver large doses of radiation very quickly and easily during examinations has also increased. Generally the doses given are lower than
CHAPTER 2. RADIATION PROTECTION IN RADIOLOGICAL PRACTICE
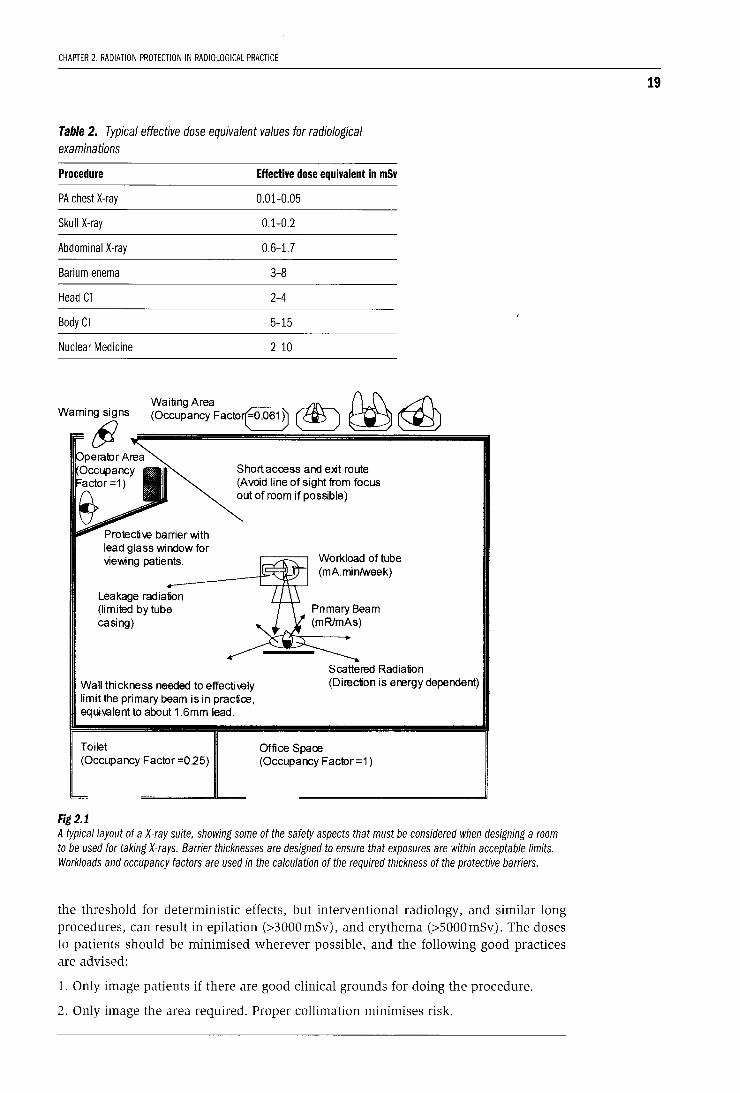
Table 2. Typical effective dose equivalent values for radiological examinations
Procedure Effective dose equivalent in mSv
PA chest X-ray 0.01-0.05
Skull X-ray 0.1-0.2
Abdominal X-ray 0.6-1.7
Barium enema 3-8
Head CT 2-4
Body CT 5-15
Nuclear Medicine 2-10
WaitingArea ~ n.J\ ,d\ (Occupancy Facto~ ~ ~ ~
Protectiw barrier with lead glass window for viewing patients.
Leakage radiation (limited by tube casing)
Short access and exit route (Avoid line of sight from focus out of room if possible)
Workload of tube (mA.minfweek)
Scattered Radiation
Wall thickness needed to effectiwly limit the primary beam is in practice, equivalent to about 1 .6mm lead.
(Direction is energy dependent)
Toilet (Occupancy Factor =0.25)
Fig 2.1
Office Space (Occupancy Factor =1)
A typical layout of a X-ray suite, showing some of the safety aspects that must be considered when designing a room to be used for taking X-rays. Barrier thicknesses are designed to ensure that exposures are within acceptable limits. Workloads and occupancy factors are used in the calculation of the required thickness of the protective barriers.
the threshold for deterministic effects, but interventional radiology, and similar long procedures, can result in epilation (>3000mSv), and erythema (>SOOOmSv). The doses to patients should be minimised wherever possible, and the following good practices are advised:
1. Only image patients if there are good clinical grounds for doing the procedure.
2. Only image the area required. Proper collimation minimises risk.
19
20
PATIERN RECOGNITION IN DIAGNOSTIC IMAGING: PART 1. TECHNIQUE, QUALITY CONTROL AND RADIATION PROTECTION
3. Gonadal shielding should be used in people of reproductive age.
4. Imaging of pregnant patients should be avoided when medically possible. If the last menstrual period has been missed then the patient should be assumed pregnant.
5. Minimise repeat examinations by using good radiographic practice.
6. Increase the focus skin distance to reduce the entrance dose.
In general the risk of radiation injury from X-ray examinations is far less important than the clinical benefit being derived from doing the examination. The availability of X-ray units has resulted in a marked increase in the medical radiation dose being delivered to the population as a whole. This medical exposure should be limited if possible.
X-ray suite design The design of a X-ray room takes into account the expected doses in the room and surrounding areas. The dose calculation takes into account occupancy, workload, X-ray energy, beam direction, shielding materials used, and other relevant factors.
Practical ways to minimise radiation doses Radiation dose increases with decreasing distance from the source (=l/distance2
}, time of exposure (=time), intensity of the radiation beam (=intensity), and the inverse of the thickness of any absorbers between the source and the exposed person (=exp-).lthickness).
To reduce the dose to radiation workers the following practices should be adhered to:
1. The distance from the source of the radiation must be increased as much as possible. One way to encourage this is to mark distances from the source on the floor of the X-ray room.
2. The time of exposure should be decreased, and workloads should be shared as much as possible. If it is not required to be present during exposure then leave the room.
3. Protective shields should be used and worn by workers during exposure. Standard lead aprons, lead gloves and thyroid shields substantially reduce the effective dose for most diagnostic examinations. Lead glass shields can also be used to protect the eyes.
4. The primary source of radiation should be collimated as much as possible. For example the smallest fields possible should be viewed when doing fluoroscopy.
5. Controlled access to areas where radiation exposure may be taking place is required. Suitable radiation warning signs should be displayed at entrances to rooms and on any radiation source.
If the above simple principles are applied and all attempts are made to keep the radiation doses to staff and patients "as low as reasonably achievable" (ALARA), then the risks from exposure to radiation in an X-ray department should be minimal.
CHAPTER 3
Contrast media in imaging Peter Carr
Purpose of contrast media Contrast media are used in imaging to opacify normal structures including the vascular system, collecting system of the kidneys and the lumen of the gastrointestinal system to obtain further diagnostic information about focal lesions in the body.
How do they work?
Vascular contrast media contain SO% by weight of molecular iodine which absorbs X-rays via the photoelectric effect and appears white on X-ray film. Oral agents consisting mainly of barium works on the same principle.
What are they?
Vascular contrast agents are iodinated organic compounds that are very hydrophilic and have a low lipid solubility and low binding affinity for proteins and membranes. Most agents have a molecular weight of less than 2000 (1). On intravascular injection they are rapidly distributed into the extravascular space but do not enter the intracellular spaces. They are rapidly excreted by normal kidneys some 90% within two hours. They do not cross the blood brain barrier.
What do I need to know to use them safely?
Vascular contrast media are not drugs like antibiotics and are pharmacologically inert. However even though they are very safe when injected intravenously or intraarterially, they can have side effects and complications. Before you use them you must be familiar with their side effects and how to manage them.
Side effects can be classified into allergic idiosyncratic reactions and non idiosyncratic reactions (1). Allergic reactions are the most serious and unpredictable reactions to contrast media. Reactions occur immediately or within 5 minutes of contrast injection. Patients with a history of allergy and atopy, for example hay fever or asthma, are 8 times more likely to have allergic reactions than non-allergic patients. These reactions are not dose dependent and are due to a release of vasoactive molecules such as histamine and kinins.
Non idiosyncratic contrast reactions are due to direct contrast toxicity which is dose dependent. Patients with renal failure or renal impairment from dehydration, diabetes or multiple myeloma are especially susceptible. Newborns and elderly patients are less able to excrete contrast media hence are more likely to have nephrotoxic complications.
Complications of contrast media Although idiosyncratic reactions are unpredictable, prevention is the best policy. Whenever a contrast injection is performed a resuscitation trolley should be close by in the same room. It must have an "Ambu bag" for ventilation, airways, ECG monitor, oxygen cylinder as well as the following drugs: adrenaline, hydrocortisone, IV fluids,
21
22
PATIERN RECOGNITION IN DIAGNOSTIC IMAGING: PART 1. TECHNIQUE, QUALI1Y CONTROL AND RADIATION PROTECTION
chlorpheniramine and bronchodilator spray. It is mandatory that the trolley is checked weekly and that all the drugs are in stock. Do not use intravenous contrast agents without being fully trained in cardiorespiratory resuscitation.
Complications
Complications are divided into: minor, intermediate, major or life threatening and death.
• Minor complications include nausea, facial flushing or a warm sensation and urticaria. These complications usually disappear within 15 minutes and only require reassurance. It the symptoms persist an injection of 10mg of an antihistamine intramuscularly, such as chlorpheniramine, should cure the allergic effects.
• Intermediate complications include bronchospasm and hypotension. These complications respond to reassurance and an inhaled bronchodilator such as salbutamol, intravenous hydrocortisone 100 mg bolus and intramuscular adrenaline 0.3-1.0 mls of 1 in 1000 solution.
• Severe life threatening reactions include seizures, severe bronchospasm and laryngeal oedema, pulmonary oedema and cardiovascular collapse. These reactions require urgent treatment. The airway must be secure and intravenous access established. Adrenaline 0.3-1.0 ml of a 1 in a 1000 solution by intravenous injection is the most effective drug to treat anaphylaxis. Death following contrast injection is extremely rare.
Reference
1. Grainger R. Intravascular Contrast Media. In: Diagnostic Radiology: A textbook of medical imaging. 1997. Eds Grainger R, Allison D. Churchill Livingstone, Edinburgh.
CHAPTER 4
Digital imaging and telemedicine Peter Carr
Digital imaging A digital image consists of a matrix of numbers or digits that when processed by a computer will produce an image on a monitor. Digital information is stored as bits, with 8 bits forming a byte that represents a value or character.
Digitization is the process of acquiring or converting analogue images into a digital format. Many imaging modalities acquire the image initially in this format, for example with CT, MR and ultrasound. All images today can be converted into digital format. The advantages of digital imaging are the ease of storing images and the ease of transmitting images and manipulating the images during image interpretation. You no longer have to rely on finding the radiographs! It is important to be aware of the disadvantages. Digital imaging hardware is expensive to purchase and to maintain. Long term storage of digital images is especially expensive. Given these challenges, there is no doubt that as computer processors and storage devices become less expensive, many hospitals in developing countries will use digital imaging in the future. Each medical image is stored as a file on the computer. The file can be compared to the X-ray packet of a conventional radiograph. The files vary greatly in their size or number of bytes they contain. Chest radiographs when in digital format consist of 2 Mbytes (2 million bytes) while an ultrasound or CT scan may be 10 times smaller at 200 Kbytes in size. Generally plain analogue radiographs when in digital format have much larger files than more modern imaging investigations, such as ultrasound or CT imaging.
Teleradiology and telemedicine Telemedicine is the electronic transmission of medical images from one site to another for interpretation and consultation. The concept of telemedicine is not new and was first used in the 1950s. However with the development of more reliable and cheaper electronic communication and computers, telemedicine is becoming more accessible to many developing countries.
Goals of telemedicine
The goals are threefold:
i. to provide consultation and interpretation of images in regions of need,
ii. to provide specialist services in hospitals without specialist support
iii. to promote educational opportunities for doctors working in rural hospitals.
Advantages and disadvantages
There are many advantages. Specialist advice is available without the patient having to travel to the regional or city hospital. Better utilization of specialist resources is made at the regional hospital. Travel and accommodation costs are reduced for patients who are less likely to be referred to the regional hospital after telemedical consultation.
23
24
PAITERN RECOGNITION IN DIAGNOSTIC IMAGING: PART 1. TECHNIQUE, QUALITY CONTROL AND RADIATION PROTECTION
Telemedicine can be used to provide continual medical education programmes to doctors working in rural areas. Disadvantages of telemedicine include: high initial capital costs of hardware, staff training, requires a good telecommunication network, and patient confidentiality is more difficult to maintain.
Applications in telemedicine
Telemedicine has been successfully used in radiology, ultrasound, surgery, opthalmology, pathology and dermatology. In imaging it has been used for plain radiographs, CT, MR, ultrasound, angiograms and nuclear medicine.
Image acquisition Analogue images such as radiographs have to be digitised using a digitiser which currently is the most expensive component of the system. Most radiographs such as a chest radiograph produce large files of up to 2MB in size which takes a few minutes to digitise. The data are usually compressed using a lossless algorithm to reduce the transmission time.
Image transmission Conventional telephone lines found in many developing countries have very slow transmission rates however but are inexpensive to transmit data (around 12 kbjsec). This means that a chest radiograph will take 3 minutes to transmit. Integrated services digital network (ISDN) lines which are available in certain countries are twenty times faster than conventional copper telephone lines, in the region of 256kb/sec. Satellite communication is obviously wireless technology and is very fast but very expensive and not freely available in many countries.
Image display To read images at the receiving station high resolution monitors are recommended. The American College of Radiology recommends 2000 x 2000 x 12 bit resolution as a standard (1). These monitors are very expensive and not freely available. The monitors must be sufficiently bright to see all levels of grey scale in medical images. Most images can be interpreted using 1000 x 1000 x 8 bit resolution which are much cheaper.
Image files Each image is kept in its own file. Static ultrasound, CT and MR images are relatively small compared to radiographs: 100 kilobytes versus 2 megabytes. The larger the file the longer transmission time.
Problems with teleradiology
Most teleradiology systems will have limited spatial resolution and subtle lesions in the lungs and fine bone fractures can easily be missed unless the original radiographs are reviewed later (2). As faster computer systems and digital telephone lines become available limited spatial resolution should become less of a problem. The high capital costs of equipment and limited opportunities to train health professionals in some countries are a barrier to the development of telemedicine services in some developing countries (3). WHO is looking into the development of telemedicine services as a way of providing imaging services to rural clinics and hospitals in developing countries.
CHAPTER 4. DIGITAL IMAGING AND TELEMEDICINE
LEARNING POINTS: DIGITAL IMAGING AND TELEMEDICINE
• Digital imaging is the process of acquiring, storing, transmitting and interpreting medical images in a digital format
• A digital format is when images are stored as a matrix of numbers or digits and can be processed by a computer to produce a medical image on the image
• Files contain an image in digital format
• Files are measured in the amount of digital data they contain in bytes
• Plain radiographs contain the largest amount of data while CT and ultrasound contain the least data
• Transmission of digital images depends on the transmission rate of the communication system used (in bauds)
• Good spatial resolution of the monitors is necessary to interpret images is extremely important
References 1. American College of Radiology: Telemedicine Standards, 1994. Reston, Virginia.
2. Corr P. Teleradiology in KwaZulu Natal: a pilot project. SAMJ, 1998;88:48-49.
3. Blignault I, Kennedy C. Training in Telemedicine. 1 Telemed Telecare, 1999;5:5112-4.
25


PART2
CHEST IMAGING PATTERNS

CHAPTER 5
The normal chest radiograph Peter Carr
Understanding the anawmy of the chest is critical in interpreting chest radiographs. Only by reading many normal chests will you be able to detect abnorma lities. Jt is important to develop a routine system and t:o keep to it.
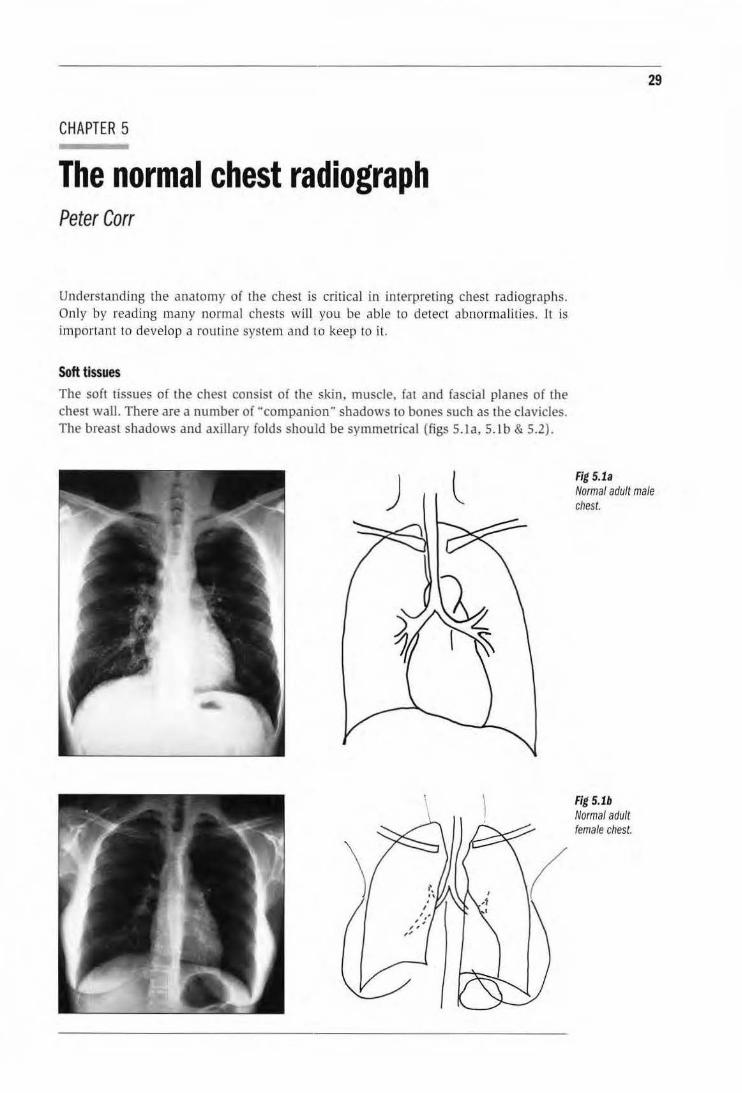
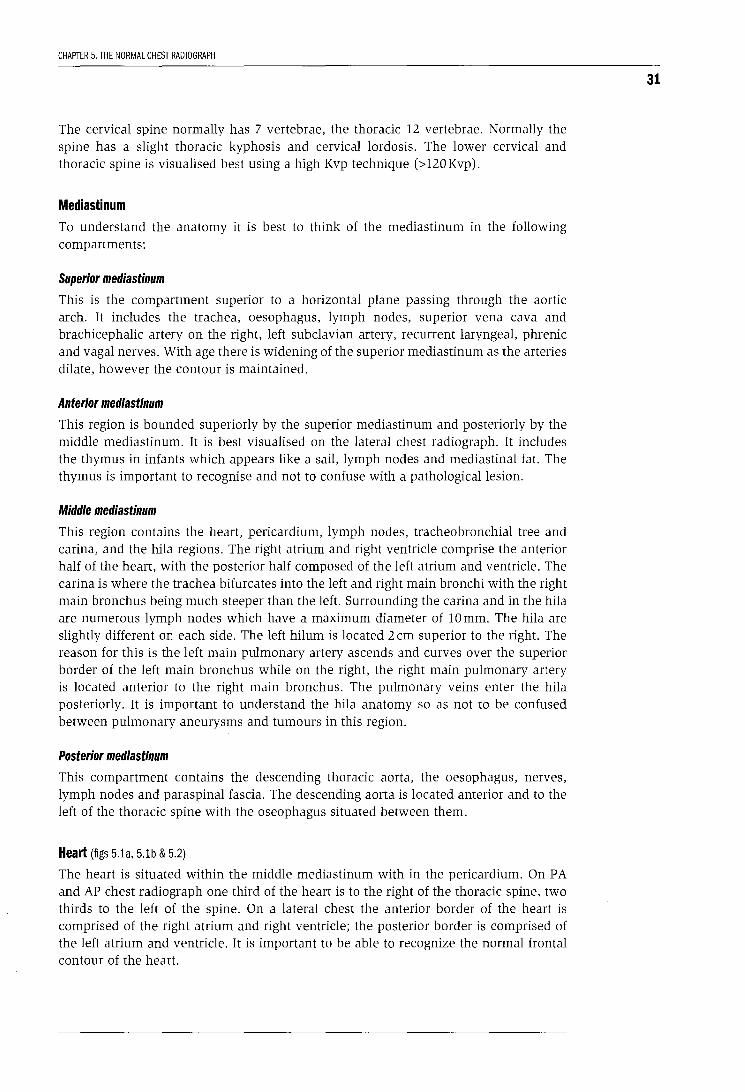
Soft tissues
The soft tissues of the chest consist of the skin, muscle. fat and fascial planes of the chest wall. There are a number of "companion" shadows to bones such as the clavicles. The breast shadows and axillary folds should be symmetrical (figs S. la, S.Jb & 5.2).
) l
29
Fig 5.1a Normal adult male chest.
Fig 5.1b Normal adult female chest.
30
Fig 5.2 Lateral adult chest.
Fig 5.3 Lateral sternum.
PATTERN RECOGNITION IN DIAGNOSTIC IMAGING: PART 2. CHEST IMAGING PATTERNS
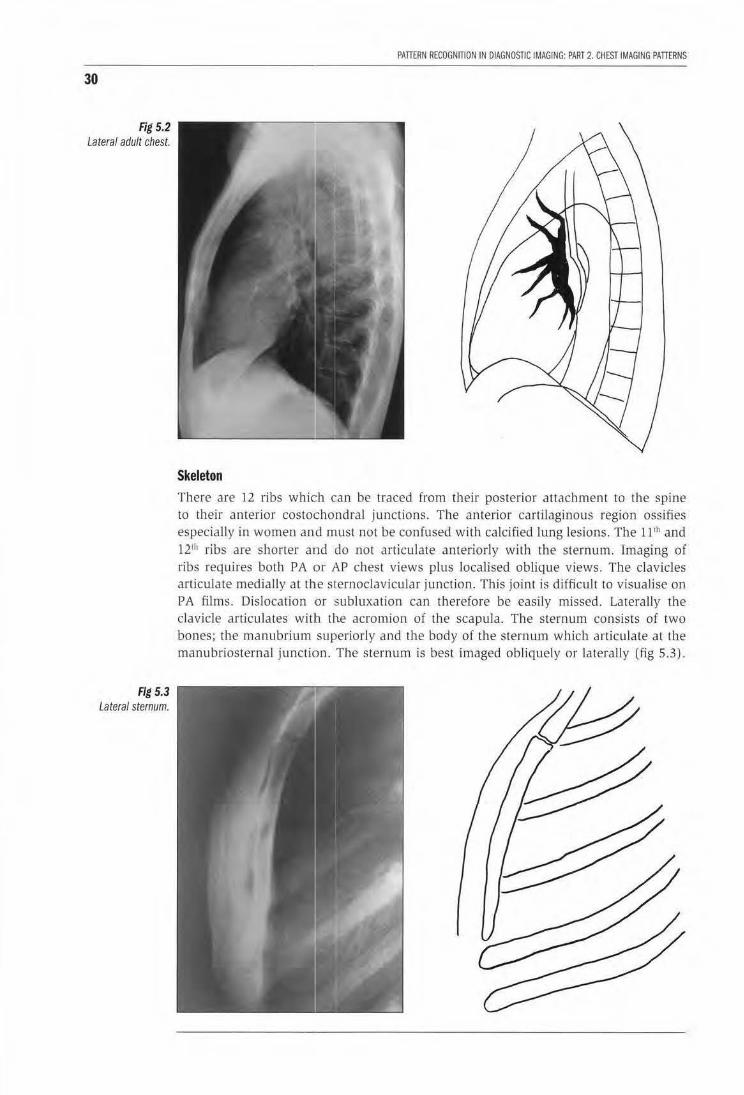
Skeleton There are 12 ribs which can be traced from their posterior attachment to the spine to their anterior costochondral junctions. The anterior cartilagino us region ossifies especially in women and must not be confused with calcified lung lesions. The ll 1h and 121h ribs are shorter and do not articulate anteriorly with the sternum. Imaging of ribs requires both PA or AP chest views plus localised oblique views. The clavicles articulate medially at the sternoclavicular junction. This joint is difficuJt to visualise on PA films. Dislocation or subluxation can therefore be easily missed. Laterally the clavicle articulates witlh the acromion of the scapula. The sternum consists of two bones; the manubrium superiorly and the body of the sternum which articulate at the manubriosternaJ junction. The sternum is best imaged obliquely or laterally (fig 5.3).
CHAPTER 5. THE NORMAL CHEST RADIOGRAPH
The cervical spine normally has 7 vertebrae, the thoracic 12 vertebrae. Normally the spine has a slight thoracic kyphosis and cervical lordosis. The lower cervical and thoracic spine is visualised best using a high Kvp technique (>120Kvp).
Mediastinum To understand the anatomy it is best to think of the mediastinum in the following compartments:
Superior mediastinum
This is the compartment superior to a horizontal plane passing through the aortic arch. It includes the trachea, oesophagus, lymph nodes, superior vena cava and brachicephalic artery on the right, left subclavian artery, recurrent laryngeal, phrenic and vagal nerves. With age there is widening of the superior mediastinum as the arteries dilate, however the contour is maintained.
Anterior mediastinum
This region is bounded superiorly by the superior mediastinum and posteriorly by the middle mediastinum. It is best visualised on the lateral chest radiograph. It includes the thymus in infants which appears like a sail, lymph nodes and mediastinal fat. The thymus is important to recognise and not to confuse with a pathological lesion.
Middle mediastinum
This region contains the heart, pericardium, lymph nodes, tracheobronchial tree and carina, and the hila regions. The right atrium and right ventricle comprise the anterior half of the heart, with the posterior half composed of the left atrium and ventricle. The carina is where the trachea bifurcates into the left and right main bronchi with the right main bronchus being much steeper than the left. Surrounding the carina and in the hila are numerous lymph nodes which have a maximum diameter of lOmm. The hila are slightly different on each side. The left hilum is located 2 em superior to the right. The reason for this is the left main pulmonary artery ascends and curves over the superior border of the left main bronchus while on the right, the right main pulmonary artery is located anterior to the right main bronchus. The pulmonary veins enter the hila posteriorly. It is important to understand the hila anatomy so as not to be confused between pulmonary aneurysms and tumours in this region.
Posterior mediastinum
This compartment contains the descending thoracic aorta, the oesophagus, nerves, lymph nodes and paraspinal fascia. The descending aorta is located anterior and to the left of the thoracic spine with the oseophagus situated between them.
Heart (figs 5.1a, 5.1b & 5.2)
The heart is situated within the middle mediastinum with in the pericardium. On P A and AP chest radiograph one third of the heart is to the right of the thoracic spine, two thirds to the left of the spine. On a lateral chest the anterior border of the heart is comprised of the right atrium and right ventricle; the posterior border is comprised of the left atrium and ventricle. It is important to be able to recognize the normal frontal contour of the heart.
31
32
PATIERN RECOGNITION IN DIAGNOSTIC IMAGING: PART 2. CHEST IMAGING PATIERNS
Lungs It is important to remember than the right lung with its three lobes, is different from the left with two lobes. The greater or oblique fissures separate the right upper and middle lobe from the lower lobe and the left upper from the lower lobe. The fissures are best seen on a lateral chest radiograph as thin white lines, the right fissure being steeper than the left. The lesser or horizontal fissure separates the right upper from the right middle lobe and extends from the right hilum to the chest wall. The pulmonary arteries and veins extend out from the hila and are visible to the outer one third of the lungs. The veins tend to be more lateral than the arteries but often cannot be distinguished apart on plain radiographs.
Diaphragm The diaphragm consists of three parts: the right hemidiaphragm, the central tendon, and the left hemidiaphragm. The right hemidiaphragm is 3 em superior to the left due to the presence of the liver inferiorly. The hemidiaphragms are muscles under control of the phrenic nerves. The diaphragm inserts peripherally into the costal margin and thoracic wall at the costophrenic angles. The diaphragm may be scalloped as a normal variant.
Pleura The pleura is a thick fibrous layer consisting of a parietal pleura and visceral pleura. The visceral pleura covers the lungs while the parietal pleura covers the inner surface of the chest wall. Usually the pleural space is a potential space only. The normal pleural surface cannot be visualised using radiographs.
Chest radiography Good radiographic technique is critical for producing diagnostic chest X-rays. Important points to remember are:
• Exposure factors-a high kV >120 technique is important to improve visualization of the soft tissue planes of the mediastinum and tracheobronchial tree. The pulmonary vessels are well visualised with this technique.
• Size and shape of the chest-exposures will vary depending on the size and shape of the chest.
• Good inspiration is critical. You should aim to visualise at least 11 ribs posteriorly above the diaphragm. Poor inspiration will result in difficulties in measuring heart size and assessing the lungs.
• Patient positioning-the P A position is best. AP and supine films will result in difficulties in assessing cardiac size and pulmonary vasculature. Check that the patient is not rotated by checking that the medial edges of the clavicles and the spine are equidistant.
Technique
The patient should stand erect with the anterior chest wall flat against the bucky 1 cassettte with the hands on the hips and the elbows rotated forwards, The X-ray tube should be more than 1m from the cassette and centred at the T3 level.
CHAPTER 5. THE NORMAL CHEST RADIOGRAPH
How to read a chest radiograph
Try to develop a systematic method and keep to it. Start peripherally and read towards the centre of the chest
1. Soft tissues: compare both sides. In females check both breasts shadows are present. Look for focal soft tissue calcification and subcutaneous gas.
2. Skeleton: count all ribs. Check for focal lesions such as metastases (lytic or sclerotic) and fractures. Check clavicles, shoulders, cervical and thoracic spines.
3. Lungs: compare both sides. Divide the lungs into three zones: upper, middle and lower and compare both sides.
4. Diaphragm: the right hemidiaphragm is 2 em superior to the left. Compare the shape and position. Look for free air beneath the diaphragm.
5. Hilar regions: the left is 2 em superior to the right. Check position, contour and density
6. Mediastinum: check the position with two thirds of the transverse diameter of the heart to the left of the spine and one third to the right. In the superior mediastinum the trachea should be central anterior to the thoracic spine.
7. Heart: check size (normally <50% CTR), position and contour.
8. Pleura: normally invisible. Check costophrenic angles for pleural fluid and pneumothorax.
Chest patterns Clinical information
To improve diagnostic specificity always take a relevant history from the patient. Ask the following questions:
How long have there been symptoms, such as cough?
Is there haemoptysis?
Is there chest pain?
Is there shortness of breath?
Important clinical information includes:
Does the patient have a fever?
Is the patient immunosuppressed or HIV positive?
Is the patient taking any drugs? eg. antibiotics or chemotherapy?
Is the patient exposed to any occupational dusts?
33
34
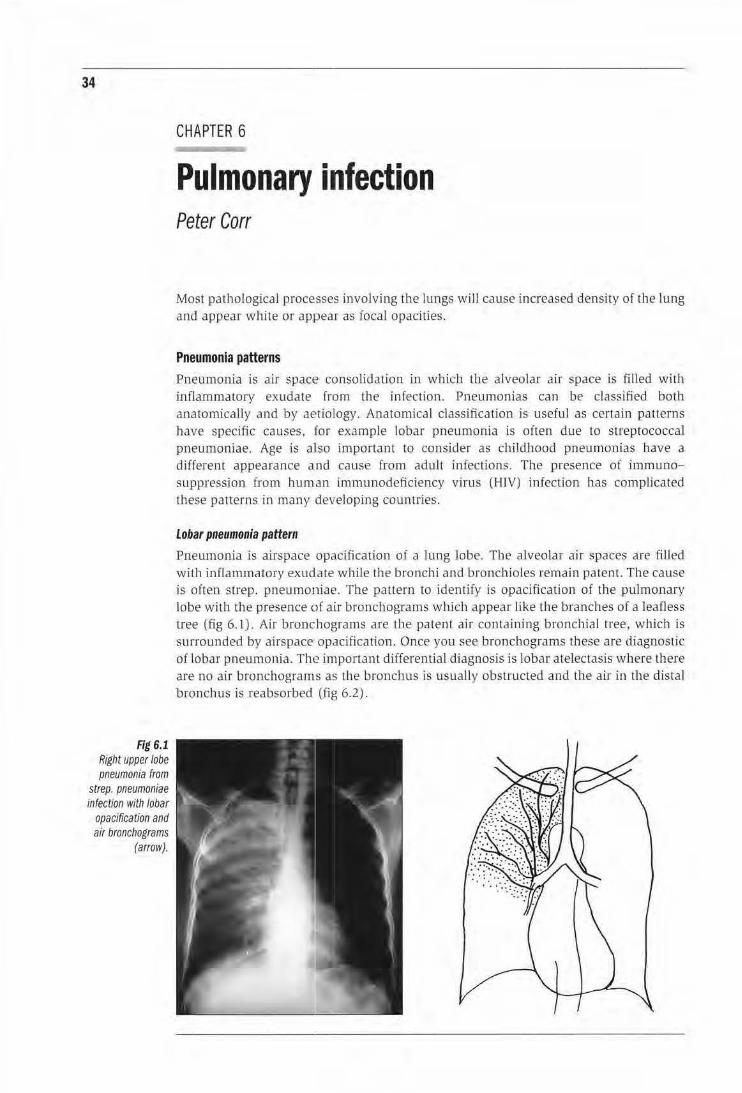
Fig 6.1 Right upper lobe pneumonia from
strep. pneumoniae infectfon with lobar
opacification and air bronchograms
(arrow).
CHAPTER 6
Pulmonary infection Peter Carr
Most pathological processes involving the lungs wi ll cause increased density of the lung and appear white or appear as focal opacities.
Pneumonia patterns Pneumonia is air space consolidation in which the alveolar air space is filled with inflammatory ex udate from the infection. Pneumonias ca n be classified both anatomically and by aetiology. Anatomical classification is useful as cenain patterns have specific causes, Jor example lobar pneumonia is often due to streptococcal pneumoniae. Age is aliso important to consider as child hood pneumonias have a different appearance and cause from adult infections. The presence of immunosuppression from lwman immunodeficiency virus (HIV) infection has complicated these patterns in many developing counrries.
Lobar pneumonia pattern
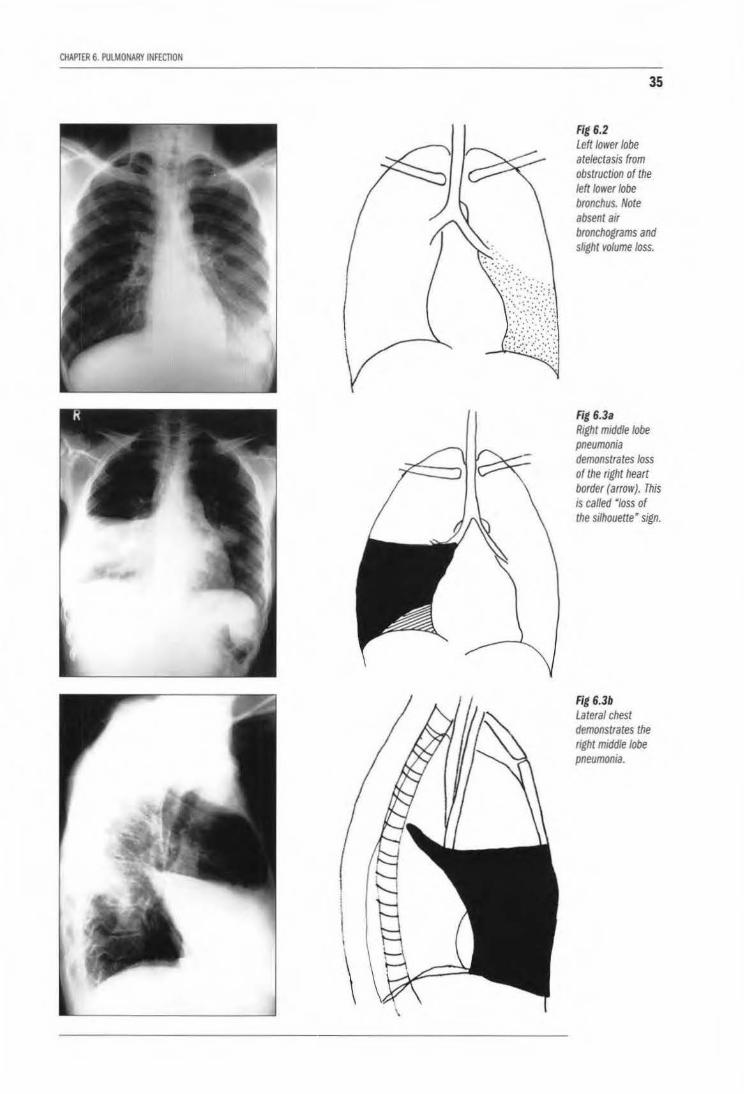
Pneumonia is airspace opacification o f a lung lobe. The alveolar air spaces are filled with inflammatory exudate while the bronchi and bronchioles remain patent. The cause is often strep. pneumoniae. The pattern to identify is opacificaHon of the pulmonary lobe with the presence of air bronchograms wh.ich appear like the branches of a leafless tree (fig 6.1). Ai r bronchograms are the patent air containing bronchial tree, which is surrounded by airspace opacification. Once you see bronchograms these are diagnostic of l6bar pneumonia. The importan t differential diagnosis is lobar atelectasis where there are no air bronchograms as the bronchus is usually obstructed and the air in the distal bronchus is reabsorbed (fig 6.2).
CHAPTER 6. PULMONARY INFECTION
i
\ I
\
35
Fig 6.2 Left/ower lobe atelectasis from obstruction of the left lower lobe bronchus. Note absent atr bronchograms and sltght volume loss.
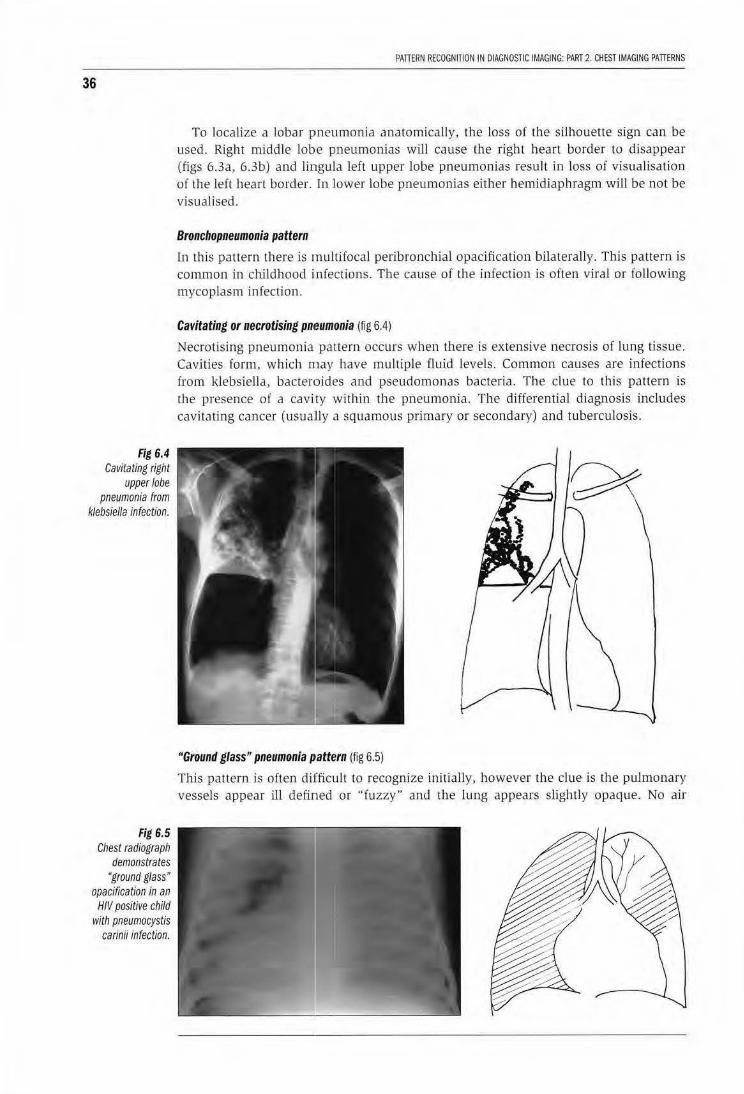
Fig 6.3a Rtght mtddle lobe pneumonia demonstrates loss of the right heart border (arrow). This is called Mloss of the stlhouette• sign.
Fig 6.3b Lateral chest demonstrates the aght mtddle lobe pneumonia.
36
Fig 6.4 Cavitating right
upper lobe pneumonia from
klebsiella infection.
Fig 6.5 Chest radiograph
demonstrates • ground glass •
opacification in an HIV positive child
with pneumocystis carinii infection.
PATTERN RECOGNITION IN DIAGNOSTIC IMAGING: PART 2. CHEST IMAGING PATTERNS
To localize a lobar P'neumonia anatomically, the loss of the silhouette sign can be used. Right middle lobe pneumonias will cause the right heart border to disappear (figs 6.3a, 6.3b) and lingula left upper lobe pneumonias result in loss of visualisation of the left heart border. In lower lobe pneumonias either hemidiaphragm will be not be visualised.
Bronchopneumonia pattern
In this pattern there is rnultifocal peribronchial opacification bilaterally. This pattern is common in childhood infections. The cause of the infection is often viraJ or following mycoplasm infection.
Cavitating or necrotising pmeumonia (fig 6.4)
Necrotising pneumonia pattern occurs when there is extensive necrosis of lung tissue. Cavities form, which may have multiple fluid levels. Common causes are infections from klebsiella, bacteroides and pseudomonas bacteria. The clue to this pattern is the presence of a cavity within the pneumonia. The differential diagnosis includes cavitating cancer (usually a squa mous primary or secondary) and tuberculosis.
"Ground glass" pneumonia P'attern (fig 6.5)
This pattern is often diJfficult to recognize initially, however the clue is the puJmonary vessels appear ill defined or "fuzzy" and the lung appears slightly opaque. No air

CHAPTER 6. PULMONARY INFECTION
bronchograms are found. This pattern is found in pneumocystis carinii pneumonia infect ions in patients who are immunosuppressed especially from AIDS, mycoplasma iniection and, viral infections.
Pulmonary tuberculosis patterns The appearance of pulmonary tuberculosis is changing in many developing countries with the spread of HIV I AIDS. It is therefore very important to establish whether the patient is immunosuppressed.
Primary pulmonary 18 pattern (fig 6.6)
This is usually a small focus of opacifica1tion in the lung (Chon focus) with hilar adenopathy and mediastinal adenopathy on the same side. Often the primary pulmonary focus is not detected only the h:ilar or mediastina.! adenopathy which may cause tracheobronchial airway compression in young children.
Secondary or post primary TB pattern (figs 6.7, 6.8)
In patients with normal immunity thjs pattern is:
cavitation-usually in the upper lobes or lung apices;
37
Fig 6.6 Chest radiograph of a child with primary tuberculosis. Note right hilar and para tracheal lymphadenopathy.
Fig 6.7 Chest radiograph in an adult with post primary or secondary tuberculosis demonstrates right upper lobe infiltrates With cavities which have spread to the right and left/ower Jobes.

38
Fig 6.8 Chest radiograph
demonstrates healed tuberculosis
with focal calcification in the left mid zone and
scarring in the right apex.
Fig 6.9 Chest radiograph of
a patient with miliary tuberculosis
demonstrates a micronodular
infiltrate in both lungs.
PATIERN RECOGNITION IN DIAGNOSTIC IMAGING: PART 2. CHEST IMAGING PATIERNS
small nodules/infiltrates in the upper lobes. The lesions heal by calcifying with fibrosis of the surrounding lung.
Miliary TB pattern (fig 6.9)
This is a very important pattern to detect as the disease is fata l if untreated. Patients often have non-specific symptoms and signs. Multiple small nodules 2- 5 mm in size are detected throughout bc•th lungs fro m blood borne spread of TB. It is therefore extremely important to exclude miliary tuberculosis in any patient with a miliary infi ltrate pattern. The differential diagnosis includes metastates in adu lts from melanoma, carcinoma of the prostate, pancreas and thyroid> pneumoconioses, sarcoid and lymphoma.

CHAPTER 6. PULMONARY INFECTION
LEARNING POINTS: PULMONARY INFECTIONS
• Lobar pneumonia: air bronchograms in the presence of lobar opacification.
• Broncho pneumonia: diffuse peribronchial opacification.
• Necrotising pneumonia: cavitation in the presence of pneumonia; can progress to a lung abscess.
• Ground glass opacification: in pneumocystis carinii pneumonia, mycoplasma, CMV infection.
• Primary PTB: focal pulmonary opacification and unilateral hilar adenopathy (Ghon focus).
• Secondary TB: upper lobe cavitation, nodular( acinar) infiltrates.
Reference
1. Chapman S, Nakielny R. (eds). In: Aids to Radiological Differential Diagnosis. 1995, Saunders, London.
39
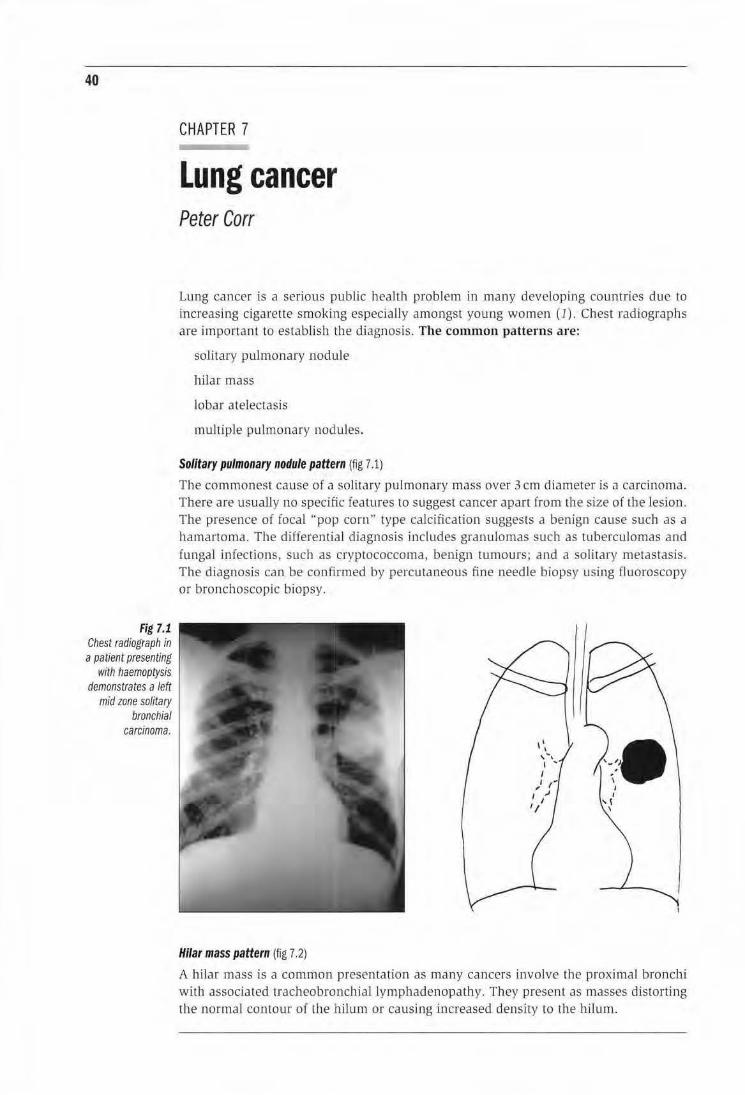
40
Fig 7.1 Chest radiograph in a patient presenting
with haemoptysis demonstrates a left
mid zone solitary bronchial
carcinoma.
CHAPTER 7
Lung cancer Peter Carr
Lung cancer is a serious public health problem in many developing countries due to increasing cigarette smoking especially amongst young women (1). Chest radiographs are important to estab li sh the diagnosis. The common patterns are:
soHtary pulmonary nodule
hilar mass
lobar atelectasis
multiple pulmonary nodules.
Solitary pulmonary nodule pattern (fig 7.1)
The commonest cause of a solitary pulmonary mass over 3 em diameter is a carcinoma. There are usually no specific features to suggest cancer apart from the size or the lesion. The presence of focal "pop corn" type calcification suggests a benign cause such as a hamartoma. The differential diagnosis includes granulomas such as tuberculomas and funga l infect ions, such as cryptococcoma, benign tumours; and a solitary metastasis. The diagnosis can be confirmed by percutaneous fine needle biopsy using fluoroscopy or bronchoscopic biopsy.
Hilar mass pattern (fig 7.2)
A hilar mass is a common presentation as many cancers involve the proximal bronchi with associated tracheo bronchial lymphadenopathy. They present as masses distorting the normal contour of the hilum or causing increased density to the hilum.
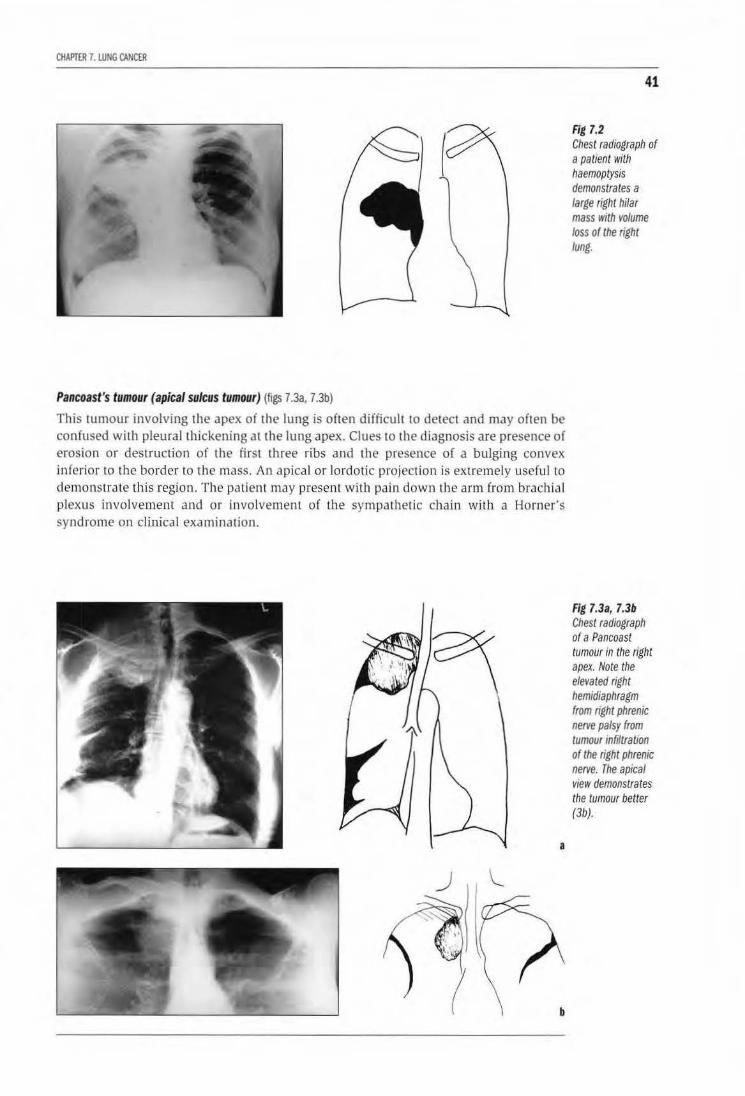
CHAPITR 7. WNG CANCER
Pancoast's tumour (apical sulcus tumour) (figs 7.3a. 7.3b)
This tumour involving the apex of the lung is often difficuh to detect and may often be confused with pleural thlckening at the lung apex. Clues to the diagnosis are presence of erosion or destruction of the first three ribs and the presence of a bulging convex inferior to the border to the mass. An apical or lordotic projection is extremel y usefu l to demonstrate this region. The patient may present with pain down the arm from brachial plexus involvement and or involvement of the sympa thetic chain with a Horner's syndrome on clinical examination.
a
41
Fig 7.2 Chest radiograph of a patient with haemoplysis demonstrates a large right hi/ar mass with volume loss of the right lung.
Fig 7.3a, 7.3b Chest radiograph of a Pancoast tumour in the right apex. Note the elevated right hemidiaphragm from right phrenic nerve palsy from tumour infiltration of the right phrenic nerve. The apical view demonstrates the tumour better (3b).
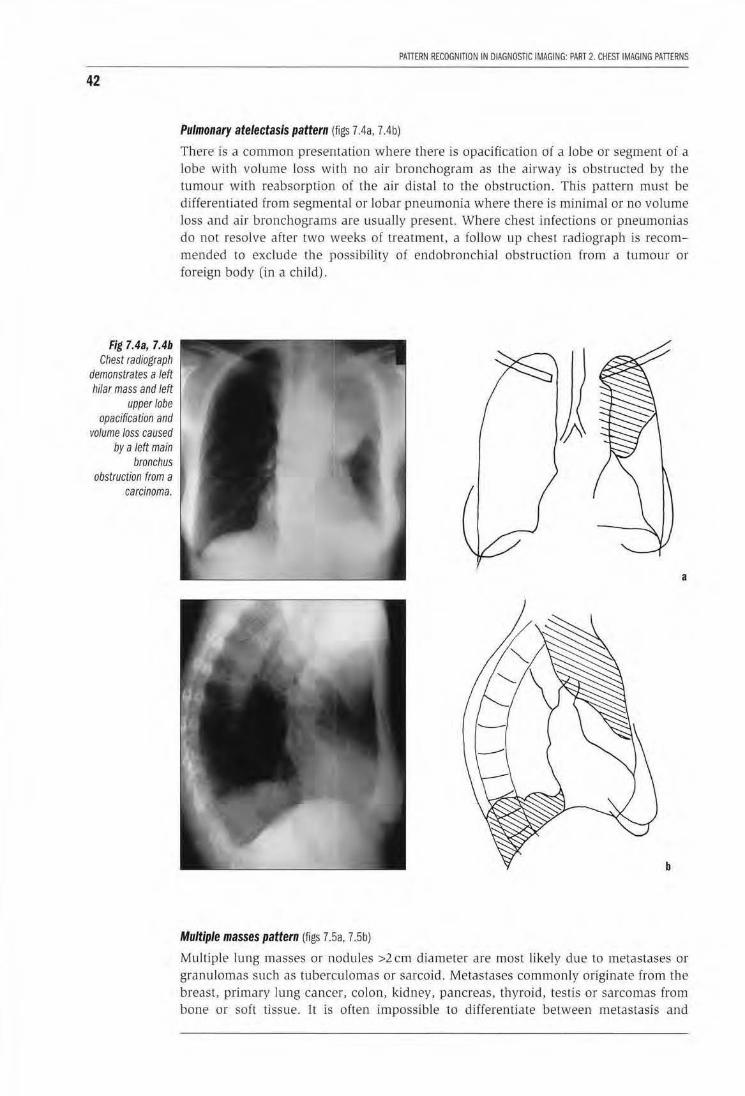
42
Fig 7.4a, 7.4b Chest radiograph
demonstrates a left hilar mass and left
upper lobe opacification and
volume loss caused by a left main
bronchus obstruction from a
carcinoma.
PATIERN RECOGNiiiON IN DIAGNOSTIC IMAGING: PART 2. CHEST IMAGING PATTERNS
Pulmonary atelectasis pattern (figs 7.4a, 7.4b)
There is a common presentation where there is opacification of a lobe or segment of a lobe with volume loss with no air bronchogram as the airway is obstructed by the tumour with reabsorption of the air distal to the obstruction. This patlern must be differentiated from segmental or lobar pneumonia where there is minimal or no volume loss and air bronchograms are usually present. Where chest infections or pneumonias do not resolve after two weeks of treatment, a follow up chest radiograph is recommended to exclude the possibility of endobronchial obstruction from a tumour or foreign body (in a child).
a
b
Multiple masses pattern (figs 7.5a, 7.5b)
Multiple lung masses or noduJes >2 em diameter are most likely due to metastases or granulomas such as tuberculomas or sarcoid. Metastases commonly originate from the breast, primary lung cancer, colon, kidney, pancreas, thyroid, testis or sarcomas from bone or soft tissue. It is often impossible to differentiate between metastasis and
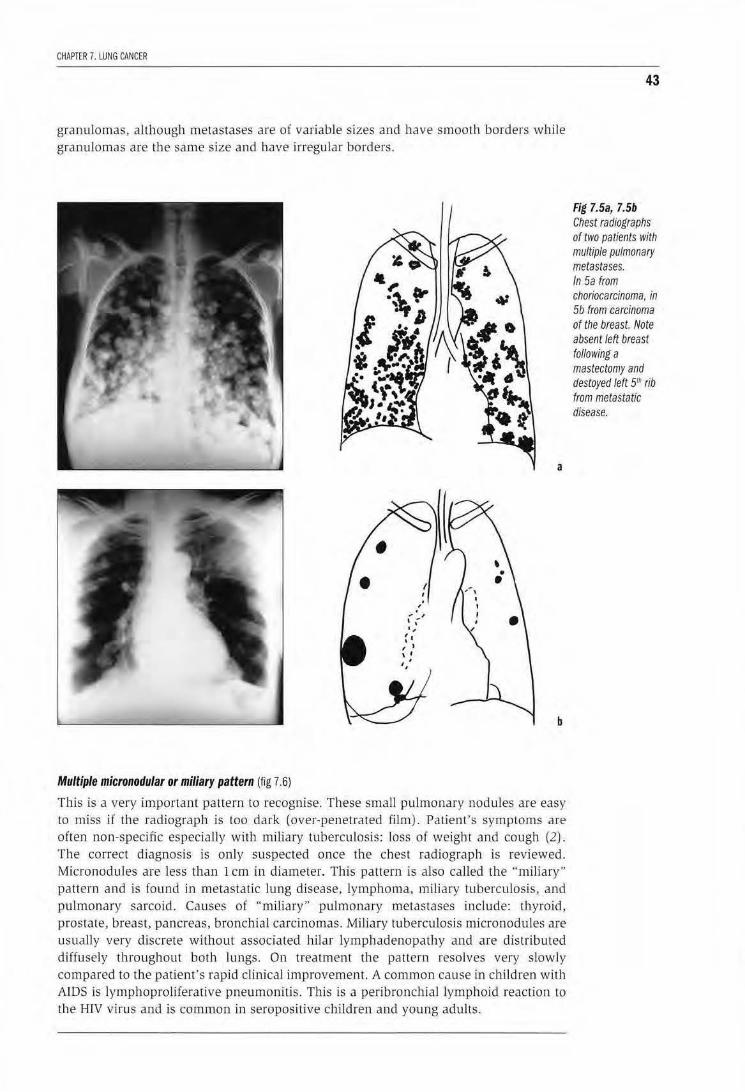
CHAPTER 7. LUNG CANCER
granulomas, although metastases are of variable sizes and have smooth borders wbj]e granulomas are the same size and have irregular borders.
a
b
Multiple micronodular or miliary pattern (fig 7.6)
This is a very important pattern to recognise. These small pulmonary nodules are easy to miss if the radiograph is too dark (over-penetrated film). Patient's symptoms are often non-specific especially with miliary tuberculosis: loss of weigh t and cough (2) . The correct diagnosis is only suspected once the chest radiograph is reviewed. Micronodules are less than l em in diameter. This pattern is also called the "miliary" pattern and is found in metastatic lung disease, lymphoma, miliary tuberculosis, and pulmonary sarcoid. Causes of "miliary" pulmonary metastases include: thyroid, prostate, breast, pancreas, bronchial carcinomas. Miliary tuberculosis micronodules are usually very discrete without associated hilar lymphadenopaU1y and are distribu ted diffusely throughout both lungs. On treatmen t the pattern resolves very slowly compared to the patient's rapid clinical improvement. A co mmon cause in children with AIDS is lymphoproliferative pneumonitis. This is a peribronch ial lymp hoid reaction to
the HIV virus and is common in seropositive children and young adults.
43
Fig 7.5a, 7.5b Chest radiographs of two patients with multiple pulmonary metastases. In 5a from choriocarcinoma. in 5b from carcinoma of the breast. Note absent/eft breast following a mastectomy and destoyed left 5rll rib from metastatic disease.
44
Fig 7.6 Chest radiograph of
a patient with multiple
micronodu/ar metastases.
PATTERN RECOGNITION IN DIAGNOSTIC IMAGING: PART 2. CHEST IMAGING PATTERNS
LEARNING POINTS: LUNG CANCER
• Solitary pulmonary nodule >3 em is most likely cancer. Other causes are tuberculomas, benign tumours
• Hllar mass is a common presentation for cancer.
• Pulmonary atelectasis is a common presentation; there is opacification of a segment or lobe with volume loss and absent bronchograms.
• Multiple masses: metastases and granulomas are commonest cause. Cancers are from breast, lung, thyroid, colon, kidney, pancreas, testis and soft tissue sarcoma.
• Micronodular or miliary infiltrates: metastatic disease and TB are common causes. Cancers originate from the thyroid, stomach, prostate, and melanomas.
References l. Combating the tobacco epidemic. In: World Health Report l 999. Geneva WHO.
2. Chapman S, Nakielny R. Jn: Aids to Radiological Differential Diagnosis. 1995_ Saunders. London .
3. Hussey G, Chishol m T . Kibel M. Miliary tuberculosis in chi ldren: a review o( 94 cases, Pediatr Infect Dis J. 199 1 ;l 0:832-6.
CHAPTER 8
Pulmonary hypertranslucency and cystic lungs Peter Corr
Hyperinflated lung pattern (figs 8.1 & 8.2)
Assessment of lung hyperinflation on chest radiograph is often difficult. Hyperinflat ion is present if the posterior margins of at least 11 ribs are detected above the diaphragm, which is flattened. An accurate assessment of airways obstruction requires lung
45
Fig 8.1 Chest radiograph of a patient with hyperinflation and upper lobe bulla from emphysema.
Fig 8.2 Chest radiograph in a patient with emphysema with recurrent chest infection. Note upper lobe bulla with mid zone opacification from pulmonary infection.
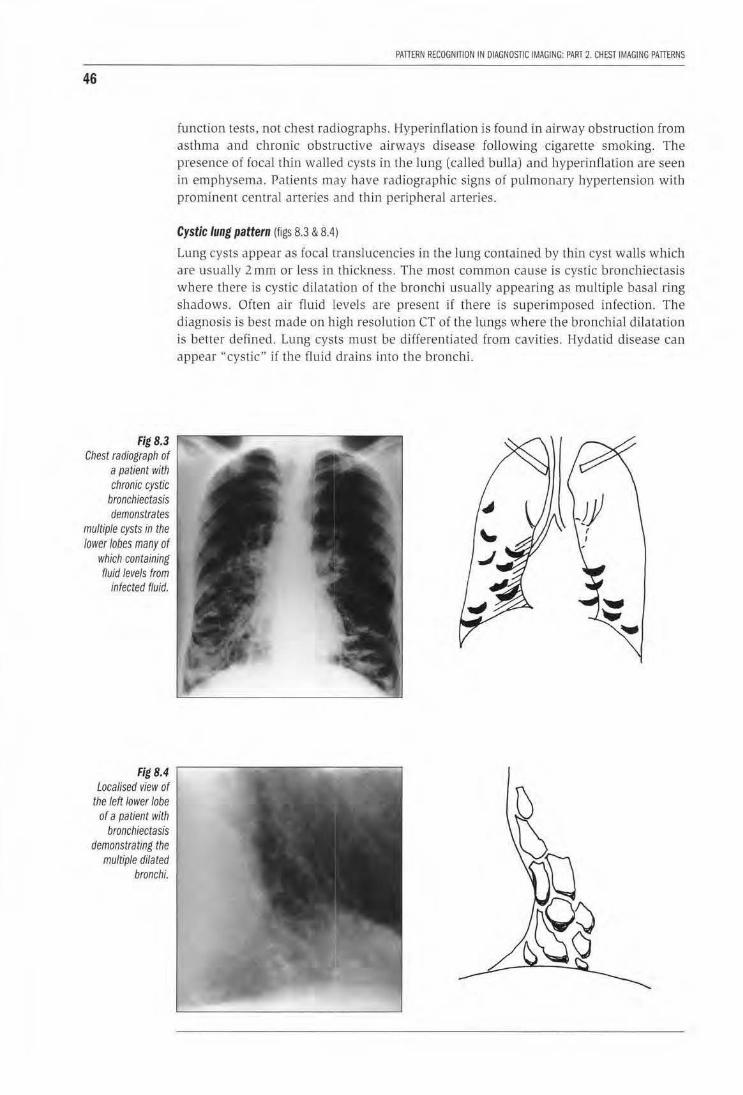
46
Fig 8.3 Chest radiograph of
a patient with chronic cystic
bronchiectasis demonstrates
multiple cysts in the lower lobes many of
which containing fluid levels from
infected fluid.
Fig 8.4 Localised view of
the left lower lobe of a patient with
bronchiectasis demonstrating the
multiple dilated bronchi.
PAlTERN RECOGNITION IN DIAGNOSTIC IMAGING: PART 2. CHEST IMAGING PAlTERNS
function tests, not chest radiographs. Hyperinflation is found in airway obstruction from asthma and chronic obstructive airways disease following cigaretre smoking. The presence of focal thin walled cysts in the lung (called bulla) and hyperinflation are seen in emphysema. Patients may have radiographic signs of pulmonary hypertension with prominent central arteries and th in peripheral arteries.
Cystic lung pattern (figs 8.3 & 8.4)
Lung cysts appear as focal translucencies in the lung contained by thin cyst walls which are usually 2 mm or less in thickness. The most common cause is cystic bronchiectasis where there is cystic dilatation of the bronchi usually appearing as multiple basal ring shadows. Often air fluid levels are present if there is superimposed infection. The diagnosis is best made on high resolution CT of the lungs where the bronchial dilatation is better defined. Lung cysts must be differentiated from cavi ties. Hydatid disease can appear "cystic" if the fluid drains into the bronchi.
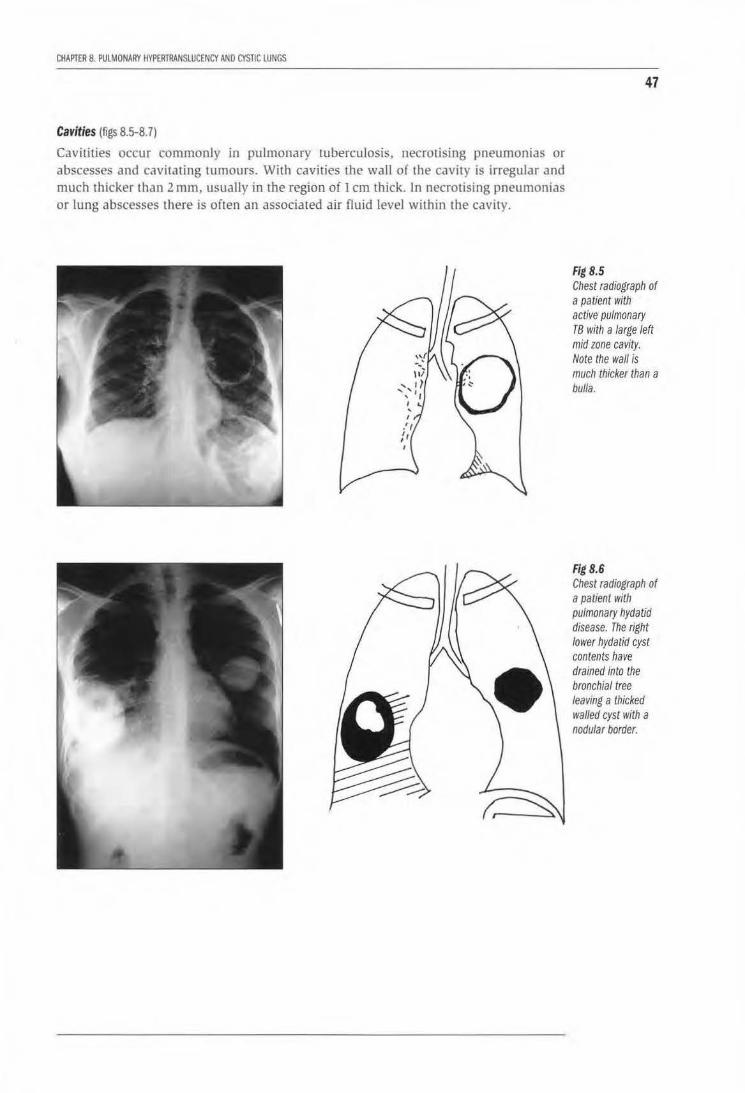
CHAPTER 8. PUlMONARY HYPERlRANSLUCENCY AND CYSTIC lUNGS
Cavities (figs 8.5-8. 7)
Cavitities occur commonly in pulmonary tuberculosis, necrousmg pneumonias or abscesses and cavita ting tumours. With cavities the wall of the cavity is irregular and much thicker than 2 mm, usually in the region of 1 em thick. In necrotising pneumonias or lung abscesses there is often an associated air fluid level within the cavity.
47
Hg8.5 Chest radiograph of a patient with active pulmonary T8 with a large left mid zone cavity. Note the wall is much thicker than a bulla.
Hg8.6 Chest radiograph of a patient with pulmonary hydatid disease. The right lower hydatid cyst contents have drained into the bronchial tree leaving a thicked walled cyst with a nodular border.
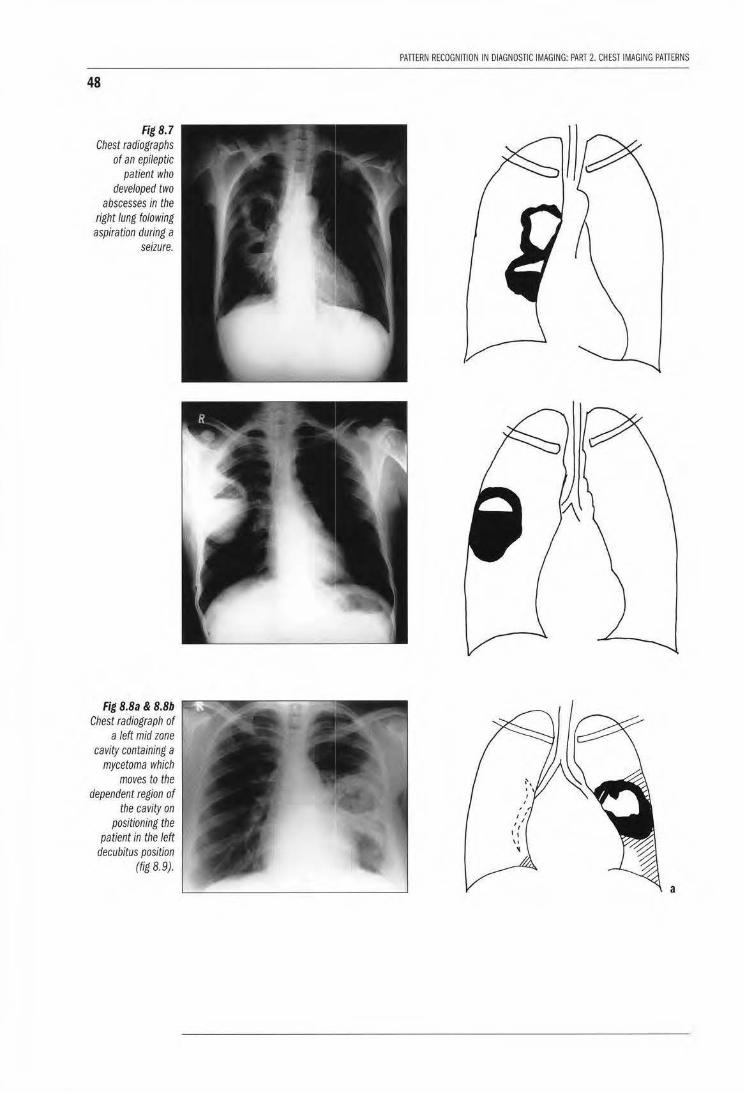
48
Fig 8.7 Chest radiographs
of an epileptic patient who
developed two abscesses in the
right lung to/owing aspiration during a
seizure.
Fig B.Ba & B.Bb Chest radiograph of
a left mid zone cavity containing a
mycetoma which moves to the
dependent region of the cavity on
positioning the patient in the left
decubitus position (fig 8.9).
PATIERN RECOGNITION IN DIAGNOSTIC IMAGING: PART 2. CHEST IMAGING PATIERNS
a
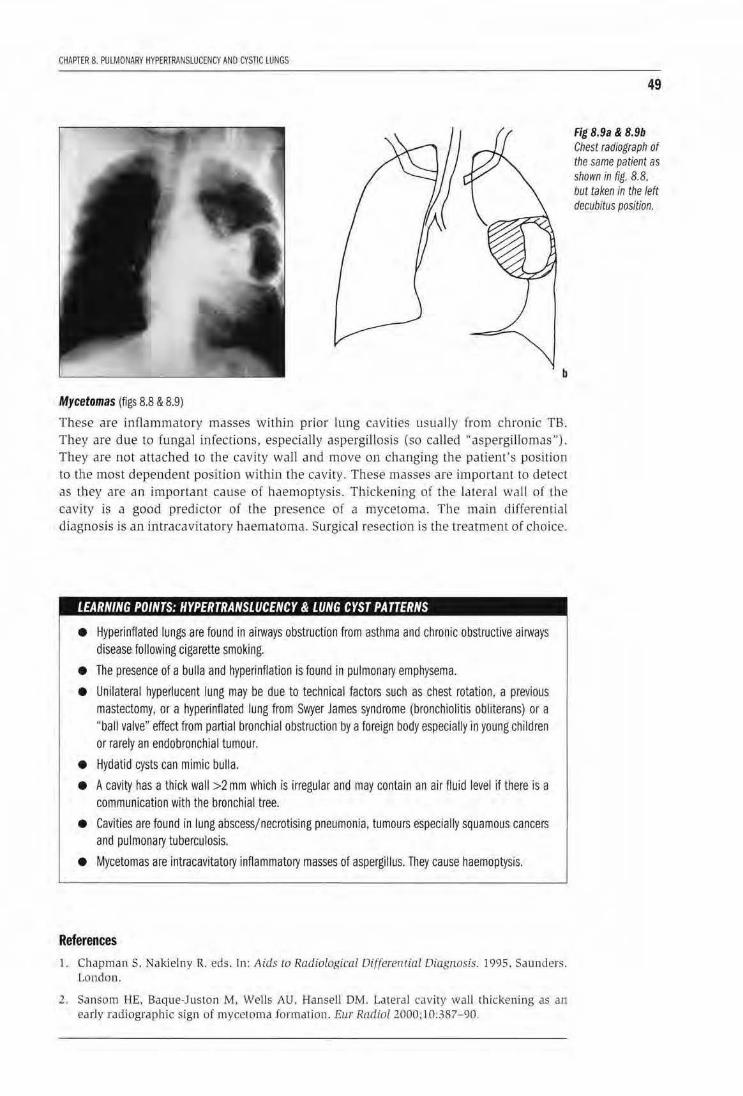
CHAPTER 8. PULMONARY HYPERTRANSLUCENCY AND CYSTIC LUNGS
b
Mycetomas (figs 8.8 & 8.9)
These are inflammatory masses within prior lung cavities usually from chronic TB. They are due to (ungal infections, especially aspergillosis (so ca!Jed .. aspergillomas''). They are not attached to the cavity wall and move on changing the patient's position to the most dependent position within the cavity. These masses are important to detect as they are an important cause of haemoptysis. Thickening of the lateral wal l of the cavity is a good predictor of the presence of a mycetoma. The main differential diagnosis is an intracavitatory haematoma. Surgical resection is the treatment of choice.
LEARNING POINTS: HYPERTRANSLUCENCY & LUNG CYST PATTERNS
• Hyperinflated lungs are found in airways obstruction from asthma and chronic obstructive airways disease following cigarette smoking.
• The presence of a bulla and hyperinflation is found in pulmonary emphysema.
• Unilateral hyperlucent lung may be due to technical factors such as chest rotation, a previous mastectomy, or a hypelinflated lung from Swyer James syndrome (bronchiolitis obliterans) or a "ball valve" effect from partial bronchial obstruction by a foreign body especially in young children or rarely an endobronchial tumour.
• Hydatid cysts can mimic bulla.
• A cavity has a thick wall >2 mm whicl1 is irregular and may contain an air fluid level if there is a communication with the bronchial tree.
• Cavities are found in lung abscessjnecrotlsing pneumonia, tumours especially squamous cancers and pulmonary tuberculosis.
• Mycetomas are intracavitatory inflammatory masses of aspergillus. They cause haemoptysis.
References 1. Chapman S. Nakielny R. eds. In: Aids to Radiological Oi{ferential Diagnosis. 1995. S,wnders.
London.
2. Sansom llE. Baque-Juston M, Wells AU. Hansell OM. LateraJ cavity wall thickening as aJl
early radiographic sign of mycetoma formation. Eur RadiaL 2000:10:387- 90.
49
Fig 8.9a & 8.9b Chest radiograph of the same patient as shown in fig. 8.8. but taken in the left decubitus position.

I tl
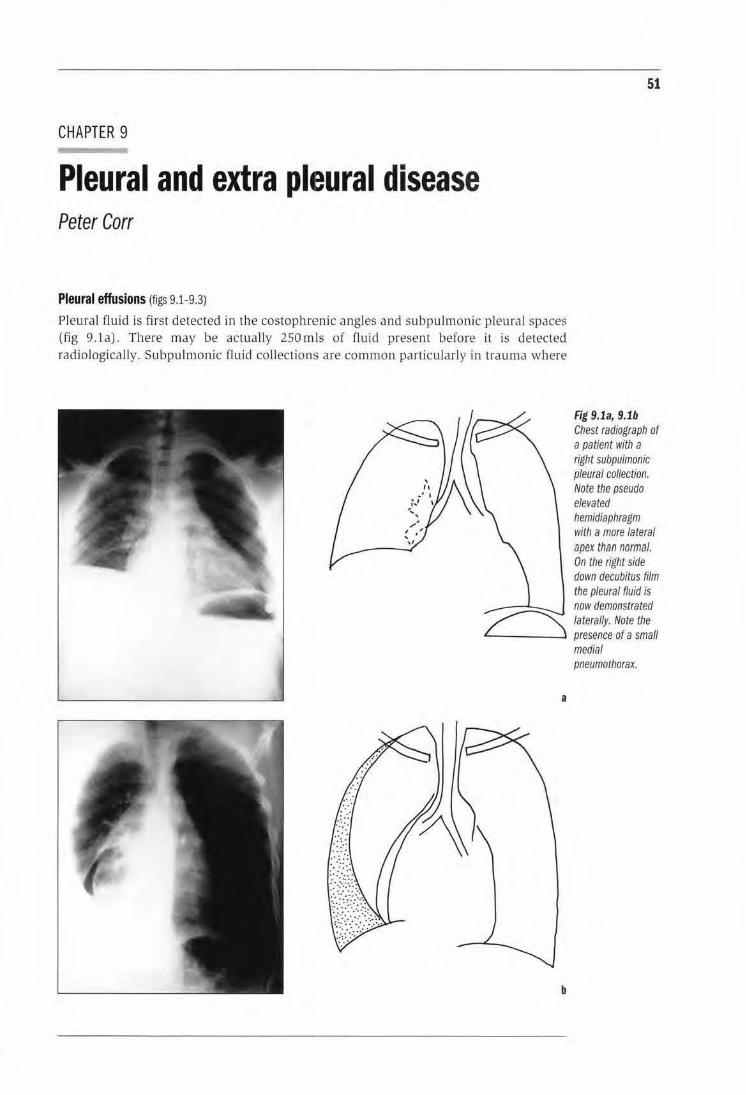
CHAPTER 9
Pleural and extra pheural disease Peter Carr
Pleural effusions (figs 9.1-9.3)
Pleural fluid is first detected in the costophrenic angles and subpulmonic pleural spaces (fig 9.la). There may be actua lly 250 mls of flu id present before it is detected radiologically. Subpulmonic fluid collections aTe common particularly in trauma where
51
Fig 9.1a, 9.1b Chest radiograph of a patient with a right subpulmonic pleural collection. Note the pseudo elevated hemidiaphragm with a more Ia teral apex than normal. On the right side down decubitus film the pleural fluid is now demonstrated
~ laterally. Note the L_____j ____ -' presence of a small
a
b
medial pneumothorax.

52
Fig 9.2a, 9.2b Chest radiograph of a patient in cardiac
failure demonstrating a "pseudomass• in
greater and lesser right fissures from
encysted pleural fluid.
PATIERN RECOGNITION IN DIAGNOSTIC IMAGING: PART 2. CHESTIMAGING PATIERNS
the apparent hemidiaphragm appears elevated and the apex is displaced laterally. To confirm the diagnosis a decubitus chest radiograph will detect the subpulmonic collection (fig 9.1b). Encysted collections are common due to pleura l adhesions and can appear like masses on radiograph. Fluid encysts in the fissures and can also appear as a pseudo mass (fig 9.2). The diagnosis becomes more evident on the lateral chest film where the fluid loculates in a ''aeroplane propeller" configuration. Common causes of pleural effusions are:
tuberculosis
malignancy (either primary or secondary cancer).
Ultrasound using a high frequency transducer (>5 MHz) will confirm the presence of fluid as opposed to a mass. Ultrasound is very useful to direct aspiration of encysted effusions.
a
b
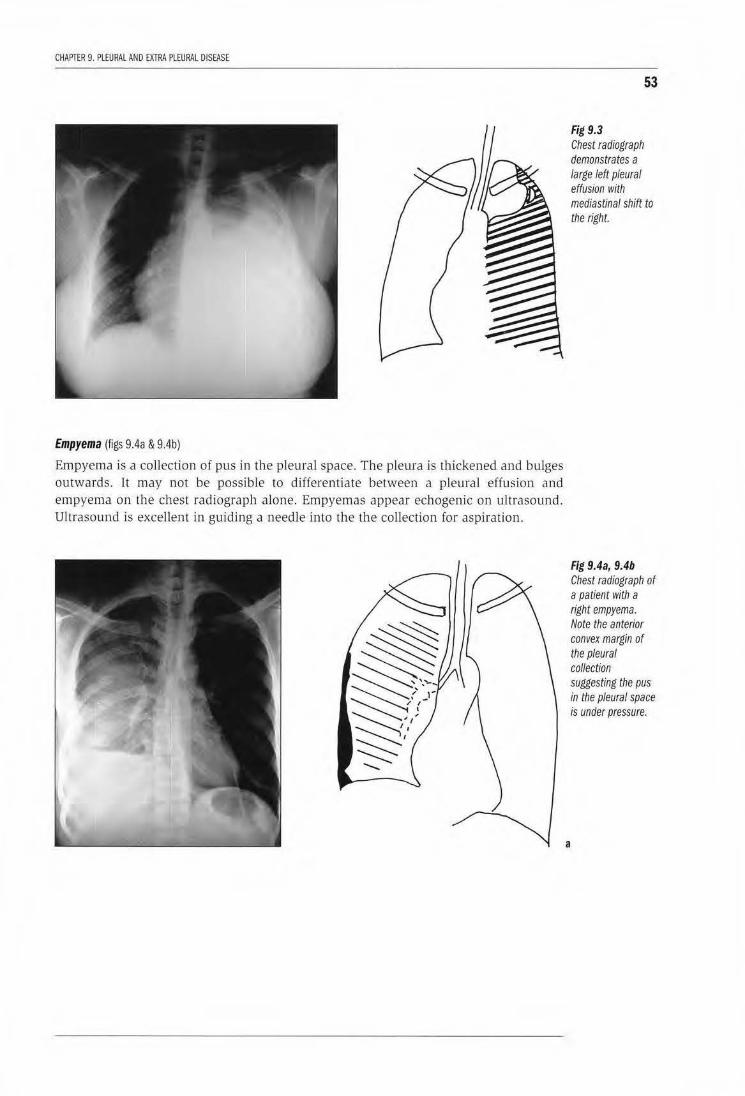
CHAPTER 9. PLEURAl AND EXTRA PLEURAl DISEASE
Empyema (figs 9.4a & 9.4b)
Empyema is a collection of pus in the pleural space. The pleura is thickened and bulges outwards. Tt may not be possible to differentiate between a pleural effusion and empyema on the chest radiograph alone. Empyemas appear echogenic on ultrasound. Ultrasound is excellent in guiding a needle into the the collection for aspiration.
53
Fig 9.3 Chest radiograph demonstrates a large left pleural effusion with mediastinal shift to the right.
Fig 9.4a, 9.4b Chest radiograph of a patient with a right empyema. Note the anterior convex margin of the pleural collection suggesting the pus in the pleural space is under pressure.
a
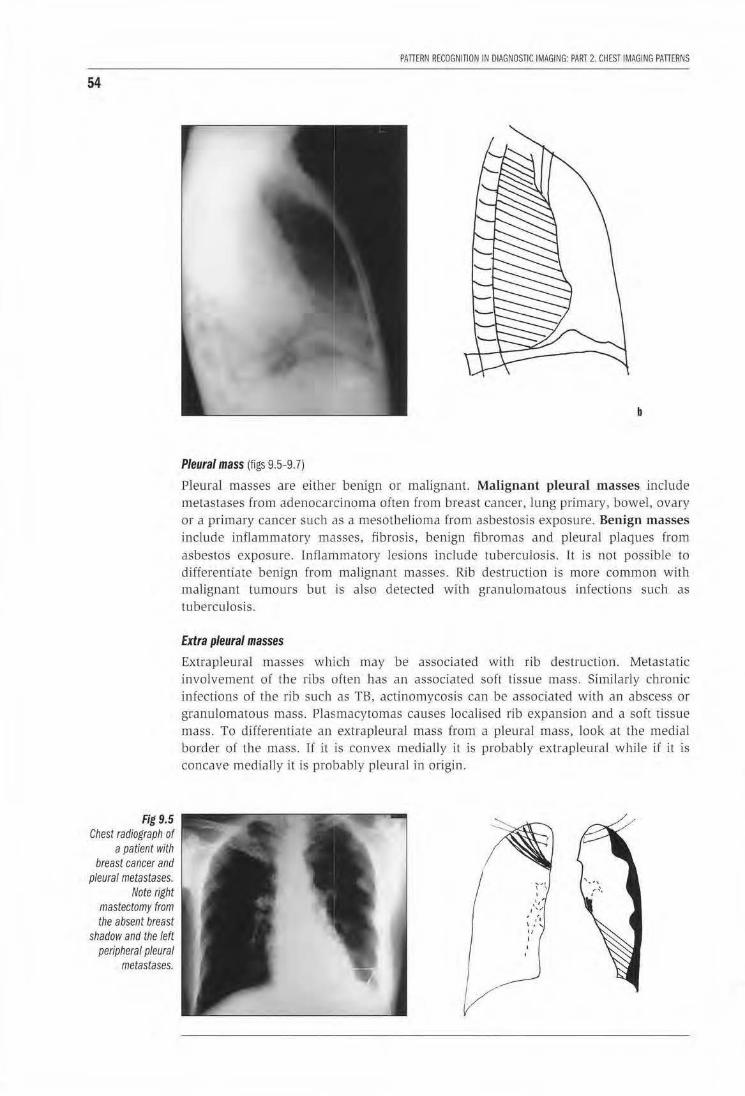
54
Fig 9.5 Chest radiograph of
a patient with breast cancer and
pleural metastases. Note right
mastectomy from the absent breast
shadow and the left peripheral pleural
metastases.
PATIERN RECOGNITION IN DIAGNOSTIC IMAGING: PART 2. CHEST IMAGING PATIERNS
b
Pleural mass (figs 9.5-9.7)
Pleural masses are either benign or malignant. Malignant pleural masses include metastases from adenocarcinoma often from breast cancer, lung primary, bowel, ovary or a primary cancer such as a mesothelioma from asbestosis exposure. Benign m asses include inflammatory masses, fibrosis, benign fibromas and pleural plaques from asbestos exposure. Inflammatory lesions include tuberculosis. It is not possible to differentiate benign from malignant masses. Rib destruction is more common with malignant tumours but is also detected with granulomatous infections such as tuberculosis.
Extra pleural masses
Extrapleural masses which may be associated witJ1 rib destruction. Metastatic involvement of the ribs often has an associated soft tissue mass. Similarly chronic infections of the rib such as TB, actinomycosis can be associated with an abscess or granulomatous mass. Plasmacytomas causes localised rib expansion and a soft tissue mass. To differentiate an extrapleural mass from a pleural mass, look at the medial border of the mass. If it is convex medially it is probab ly extrapleural while if it is concave medially it is probably pleural in origin.

CHAPTER 9. PLEURAl AND £XTRA PLEURAL DISEASE
LEARNING POINTS: PLEURAL DISEASE
• Subpulmonic effusions result in an apparent ele11ation of the hemidiaphragm, the diagnosis can be confirmed on an ipsilateral decubitus chest radiograph.
• Common causes of unilateral pleural effusioms are malignancy (primary and secondary) and tuberculosis.
• Encysted pleural collections resemble pleural masses; ultrasound can differentiate between a mass and fluid.
• Pleural masses are most commonly adenocarcinoma metastases, mesothelioma, inflammatory masses or benign fibromas.
• Extrapleural masses often have associated rib destruction.
Reference 1. Chapman S. Nakielny R. Aids to Radiological Di{{eremial Diagnosis. 1995 Saunders, London
55
Fig 9.6 Chest radiograph of a patient with a left pleural mesothelioma. Note mediastinal shift to the left and opacification of the left pleural space.
Fig 9.7 Chest radiograph of a patient with left lower zone pleural fibrosis following a haemothorax. Note the crowding of the left lower ribs and t/Je pleural calcification.

56
Fig 10.1 Chest radiograph of
a patient with multiple myeloma.
There is a soft tissue mass in the
right lower zone with destruction of
the lower right ribs. A /}'tic lesion in the
right clavicle is noted.
CHAPTER 10
Rib lesions Peter Corr
11 is aJways important to scan the bones of the chest fo r both (ocaJ and diffuse abnom1alities. Often the presence of bone lesions will suggest the correct diagnosis of the pulmonary abnormality.
Focal rib lesions Lytic lesions are usually due to tumours especially metastases or myeloma. They can be difficult to detect initia lly if the individual rib contours are not carefully traced out from posterior to anterior. The patterns of these lesions appear as if the ribs have been "erased" with a rubber eraser with an associated extrapleural soft tissue mass (fig 10.1). Bronchial carcinoma, especially Pancoast's tumour at the apical sulcus of the l.ung, invades Lhe pleura and overlying brachial plexus to cause early lytic destruction of the first and second ribs. Occasionaly pleural tuberculosis involves the overlying ribs. With myeloma it is particularly useful to assess other flat bones such as the clavicles and scapulae for similar lesions as tJJe presence of such lesions will suggest lbe diagnosis.
Sclerotic rib lesions in wh1ch bone density is increased are especial ly common with prostate and breast metastases. Occasionally all the ribs become diffusely sclerotic (fig 10.2) .
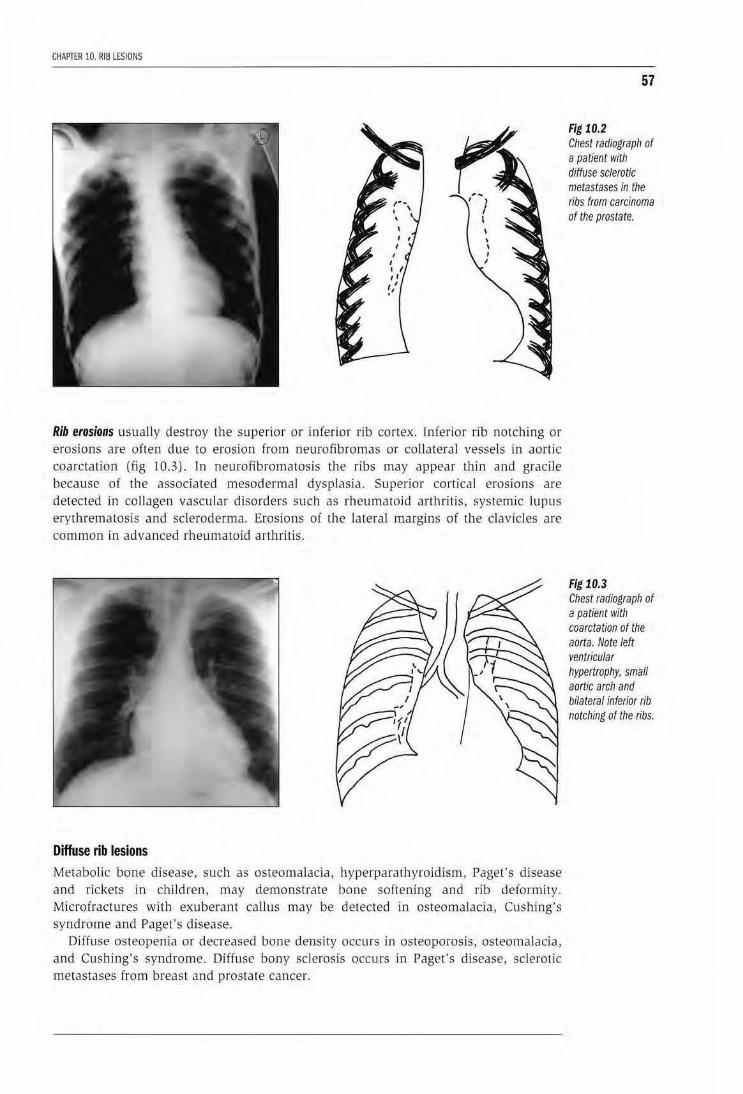
CHAPTER 10. RIB LESIONS
Rib erosions usually destroy the superior or inferior rib cortex. Inferior rib notching or erosions are often due to erosion from neurofibromas or coll ateral vessels in aortic coarctation (fig 10.3). ln neuro.fibromatosis the ribs may appear thin and gracile because of the associated mesodermal dysplasia. Superior cortical erosions are detected in collagen vascular disorders such as rheumatoid arthritis, systemic lupus eryth.rematosis and scleroderma. Erosions of the lateral margins of the clavicles are common in advanced rheu matoid arthritis.
Diffuse rib lesions Metabolic bone disease, such as osteomalacia, hyperparathyroidism, Paget's disease and rickets in ch ildren, may demonstrate bone softening and rib deformity. Microfractures with exuberant caUus may be detected in osteomalacia, Cushing's syndrome and Paget's disease.
Diffuse osteopenia or decreased bone density occurs in osteoporosis, osteomalacia, and Cushing's syndrome. Diffuse bony sclerosis occurs in Paget's d isease, sclero tic metastases from breast and prostate cancer.
57
Fig 10.2 Cllest radiograph of a patient with diffuse sclerotic metastases in the ribs from carcinoma of the prostate.
Fig 10.3 Chest radiograpll of a patient with coarctation of the aorta. Note left ventricular hypertrophy, small aortic arch and bilateral inferior rib notching of the ribs.
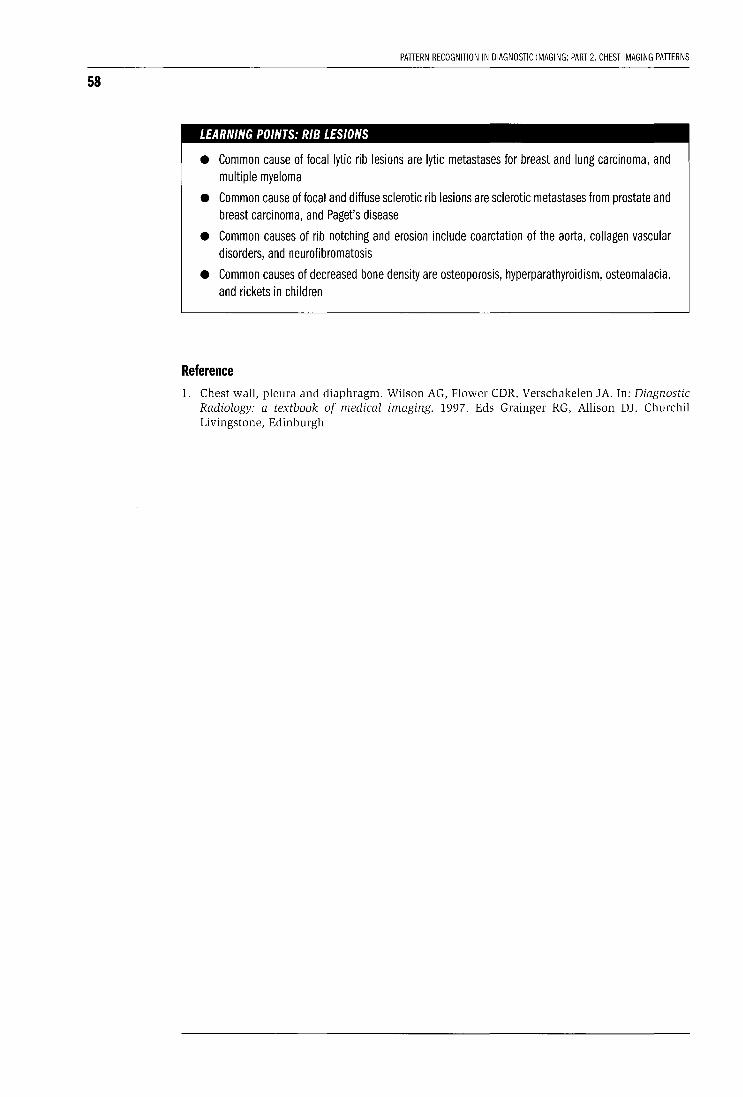
58
PAnERN RECOGNITION IN DIAGNOSTIC IMAGING: PART 2. CHEST IMAGING PAnERNS
LEARNING POINTS: RIB LESIONS
• Common cause of focal lytic rib lesions are lytic metastases for breast and lung carcinoma, and multiple myeloma
• Common cause of focal and diffuse sclerotic rib lesions are sclerotic metastases from prostate and breast carcinoma, and Paget's disease
• Common causes of rib notching and erosion include coarctation of the aorta, collagen vascular disorders, and neurofibromatosis
• Common causes of decreased bone density are osteoporosis, hyperparathyroidism, osteomalacia, and rickets in children
Reference 1. Chest wall, pleura and diaphragm. Wilson AG, Flower CDR, Verschakelen JA. In: Diagnostic
Radiology: a textbook of medical imaging. 1997. Eds Grainger RG, Allison DJ. Churchil Livingstone, Edinburgh
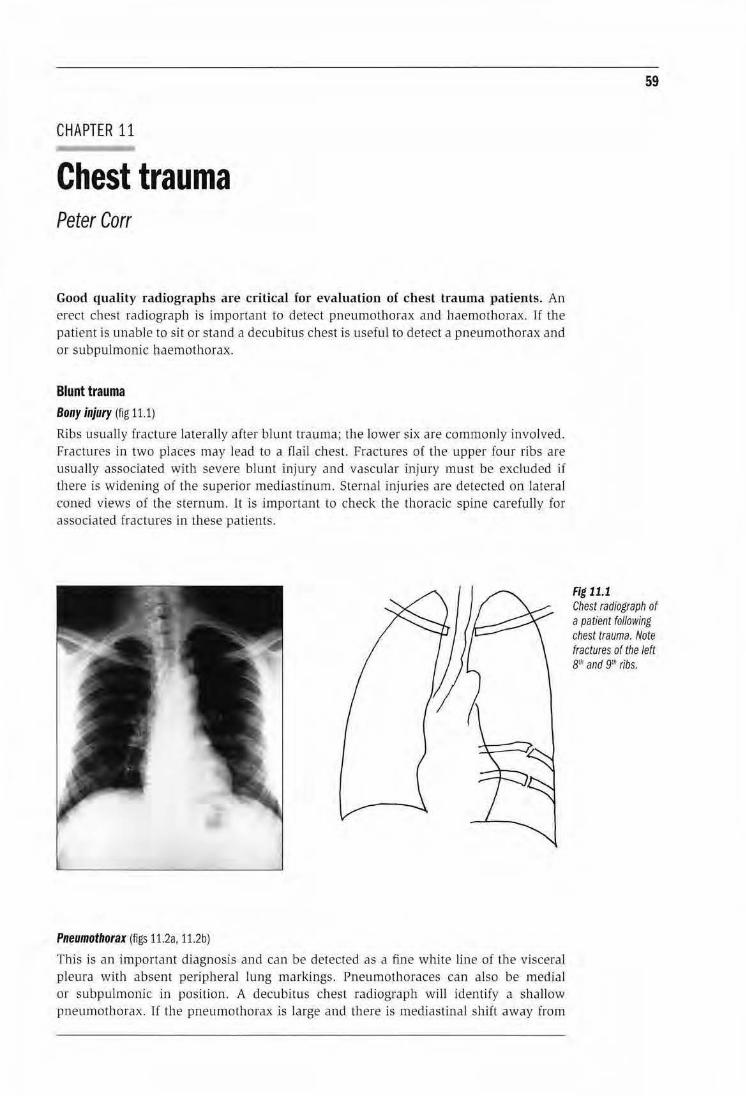
CHAPTER 11
Chest trauma Peter Carr
Good quality radiographs are critical for evaluation of chest trauma patients. An erect chest radiograph is important to detect pneumothorax and haemothorax. If the patient is unable to sit or stand a decubitus chest is usefu l to detect a pneumothorax and or subpulmonic haemothorax.
Blunt trauma Bony injury (fig 11.1)
Ribs usually fracture laterally after blunt trauma; the lower six are commonly involved. Fractures in two places may lead to a flail chest. Fractures o( the upper four ribs are usually associated with severe blunt injury and vascular injury must be excluded if there is widening of the superior mediastinum. Sternal injmies are detected on lateral coned views of the sternum. ll is important to check the thoracic spine carefully for associated fractures in these patients.
Pneumothorax (figs 11.2a, 11.2b)
This is an important diagnosis and can be detected as a fine white line of the visceral pleura with absent peripheral lung markings. Pneumothoraces can also be medial or subpulmonic. in position. A decubitus chest radiograph will identify a shallow pneumothorax. If the pneumothorax is large and there is mediastinal shift away from
59
Fig 11.1 Chest radiograph of a patient following chest trauma. Note fractures of the left BtJt and 9ril ribs.
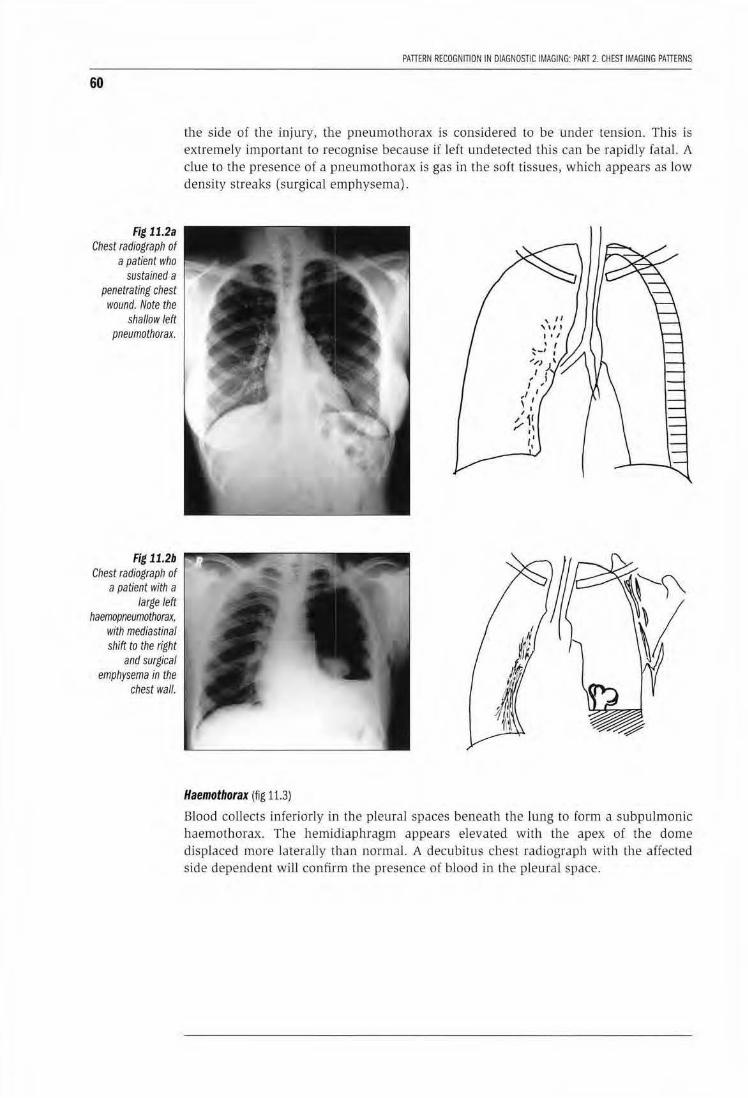
60
Fig 11.2a Chest radiograph of
a patient who sustained a
penetrating chest wound. Note the
shallow left pneumothorax.
Fig 11.2b Chest radiograph of
a patient with a large left
haemopneumothorax, with mediastinal shift to the right
and surgical emphysema in the
chest wall.
PAntRN RECOGNITION IN DIAGNOSTIC IMAGING: PART 2. CHEST IMAGING PATTERNS
the side of the injury, the pneumothorax is considered to be under tension. This is extremely important to recognise because H left undetected this can be rapidly fatal. A clue to the presence of a pneumothorax is gas in the soft tissues, which appears as low density streaks (surgical emphysema) .
Haemothorax (fig 11.3)
Blood collects inferiorly in the pleural spaces beneath the lung to form a subpulmonic haemothorax. The hemidiaphragm appears elevated with the apex of the dome displaced more laterally than normal. A decubitus chest radiograph with the affected side dependent will confirm the presence of blood in the pleural space.

CHAPTER 11. CHEST TRAUMA
Pulmonary lesions (fig 11.4)
Haematomas within the lungs appear as pu lmonary masses that resolve over days. They can be differentiated from other masses by reviewing serial radiographs. Contusion appears as opacification of the lu ngs .
Vascular injuries (figs 11.5a, 11.5b)
Aortic arch injuries are important to detect especially after deceleration injuries to the chest and mediastinum. The aorta tears transversely at the level of the ductus arteriosus. The important signs on the chest radiograph are:
• A widened mediastinum >Scm wide on an erect film
• Loss of the normal mediastinal outline
61
Fig 11.3 Chest radiograph of a patient with a right subpulmonic haemothorax. Note the "pseudo elevated" right hemidiaphragm.
Fig 11.4 Chest radiograph of a patient with a left upper lobe pulmonary haematoma following blunt trauma.

62
Fig 11.5 Chest radiograph of a patient following
blunt trauma to the sternum,
demonstrates a markedly widened
superior mediastinum with loss of the normal aortic arch outline
from a false aneurysm of the
aortic arch and a rupture of the left
hemidiaphragm and herniation of the
stomach in the chest. Fig 11.5b
demonstrates the false aneurysm of
the proximal descending aorta.
PATIERN RECOGNITION IN DIAGNOSTIC IMAGING: PART 2. CHEST IMAGING PATIERNS
b
• Fracture of the upper ribs
• Apical cap from haematoma
If these signs are present the patient should be transferred for aortography to confirm the diagnosis. It is important to measure the superior mediastinum on an erect chest radiograph if possible. Note a supine radiograph may falsely suggest a wide mediastinum.
Trauma to the tracheobronchial tree fnjury to the trachea or bronchi leads to a pneumomediastinum and pneumothorax and often a collapsed lung.
a
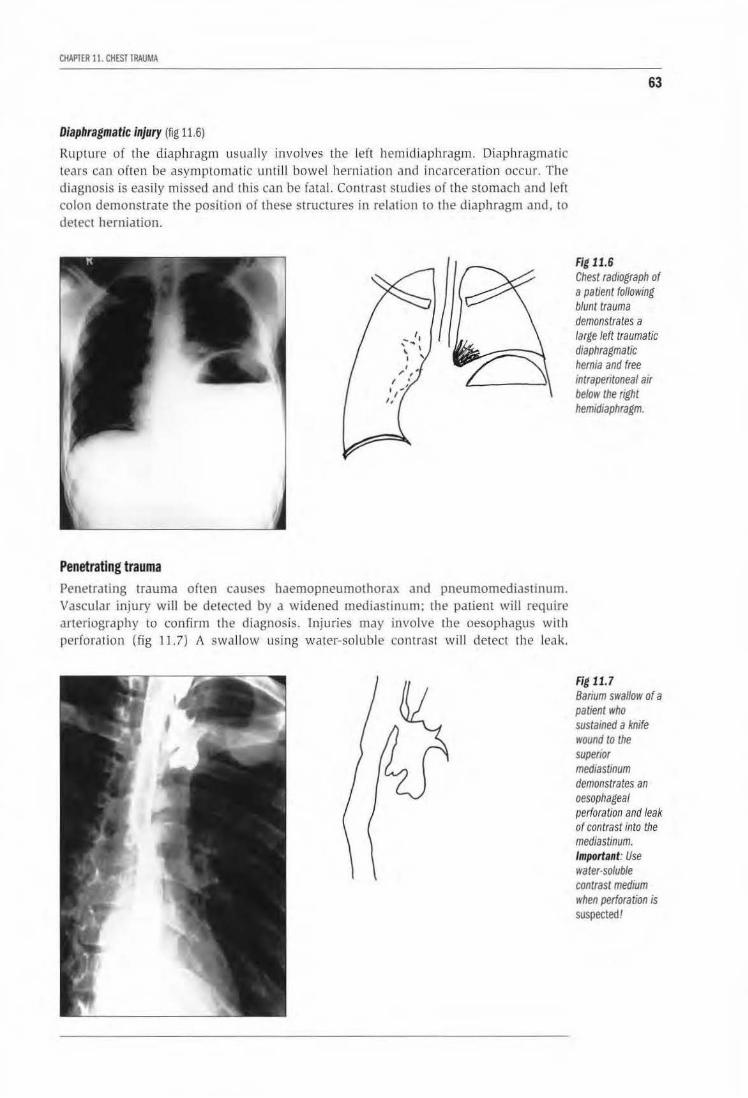
CHAPTER I I. CHEST TRAUMA
Diaphragmatic injury (fig 11.6)
Rupture of the diaphragm usually involves the left hemidiaphragm. Diaphragmatic tears can often be asymptomatic unt ill bowel herniation and incarceration occur. The diagnosis is easily missed and this can be fatal. Contrast studies of the stomach and left colon demonstrate the position or these structures in relation to the diaphragm and, to detect herniation.
Penetrating trauma Penetrating trauma often causes haemopneumothorax and pneumomediastinum. Vascular injury will be detected by a widened mediastinum; the patient will require Jrteriography to confirm th e diagnosis. Injuries may involve tbe oesophagus wilh perforation (Jig 1 1.7) A swJllow using water-soluble contrast wiJI detect the leak.
63
Fig 11.6 Chest radiograph of a patient following blunt trauma demonstrates a large left traumatic diaphragmatic hernia and free intraperitoneal air below the right hemidiaphragm.
Fig 11.7 Barium swallow of a patient who sustained a knife wound to the superior mediastinum demonstrates an oesophageal perforation and leak of contrast into the mediastinum. Important: Use water-soluble contrast medium when perforation is suspected!
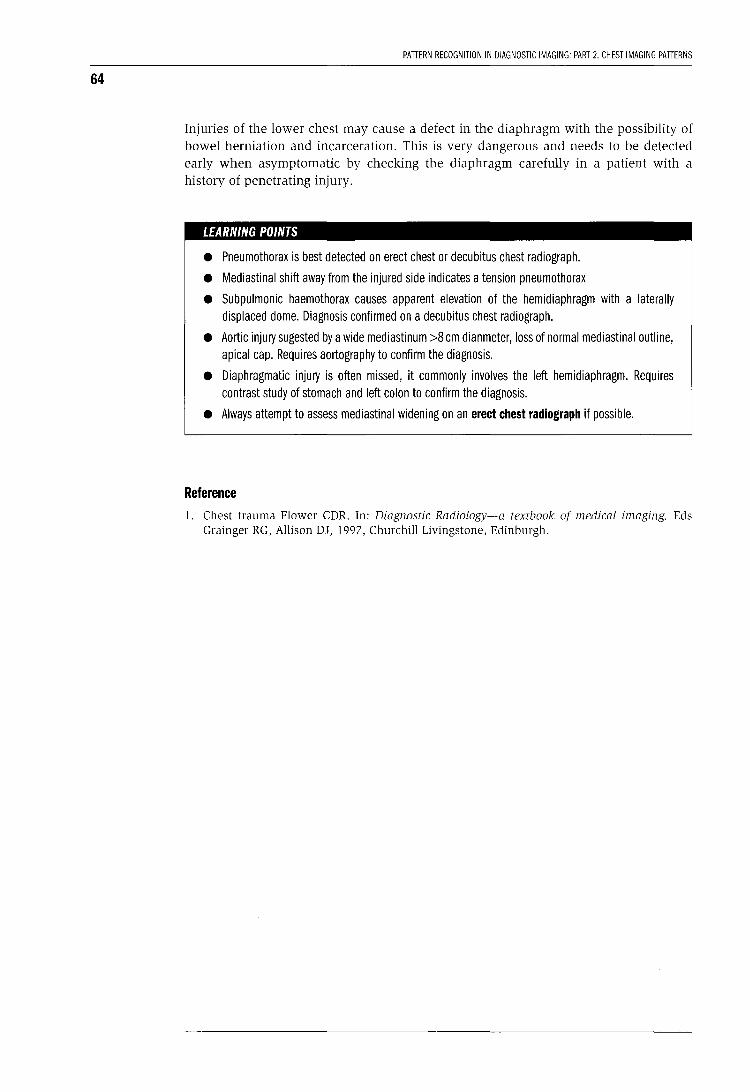
64
PATIERN RECOGNITION IN DIAGNOSTIC IMAGING: PART 2. CHEST IMAGING PATIERNS
Injuries of the lower chest may cause a defect in the diaphragm with the possibility of bowel herniation and incarceration. This is very dangerous and needs to be detected early when asymptomatic by checking the diaphragm carefully in a patient with a history of penetrating injury.
LEARNING POINTS
• Pneumothorax is best detected on erect chest or decubitus chest radiograph.
• Mediastinal shift away from the injured side indicates a tension pneumothorax
• Subpulmonic haemothorax causes apparent elevation of the hemidiaphragm with a laterally displaced dome. Diagnosis confirmed on a decubitus chest radiograph.
• Aortic injury sugested by a wide mediastinum >8 em dian meter, loss of normal mediastinal outline, apical cap. Requires aortography to confirm the diagnosis.
• Diaphragmatic injury is often missed, it commonly involves the left hemidiaphragm. Requires contrast study of stomach and left colon to confirm the diagnosis.
• Always attempt to assess mediastinal widening on an erect chest radiograph if possible.
Reference 1. Chest trauma Flower CDR. In: Diagnostic Radiology-a textbook of medical imaging. Eds
Grainger RG, Allison DJ, 1997, Churchill Livingstone, Edinburgh.
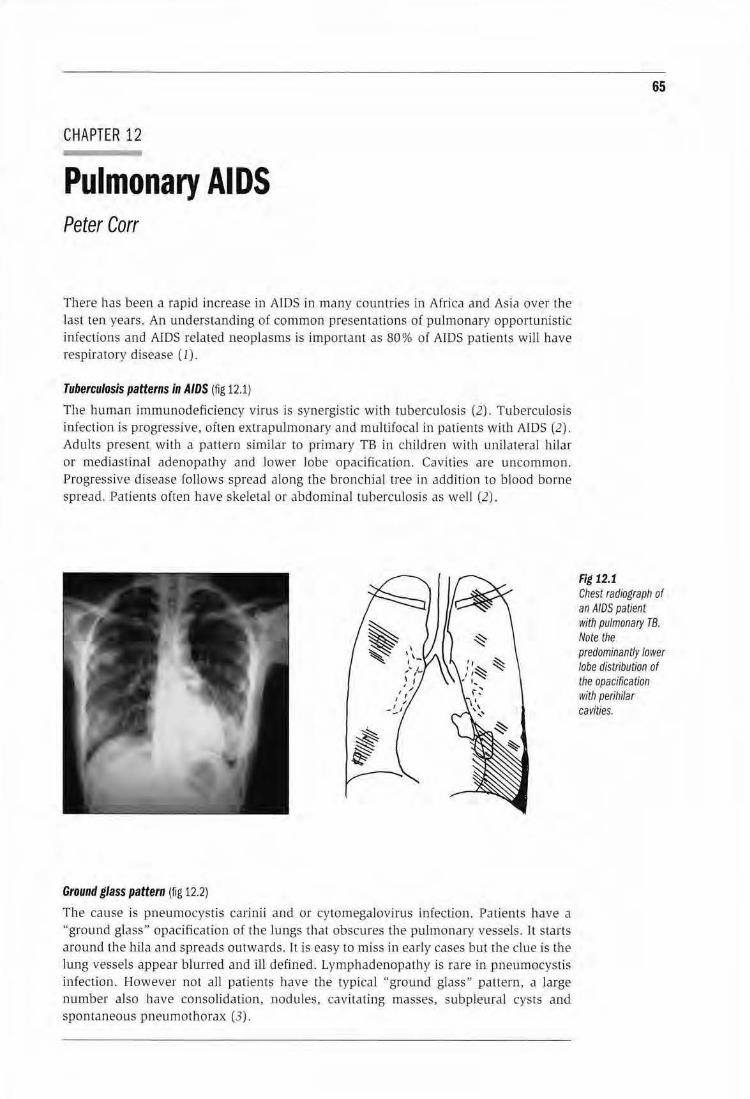
CHAPTER 12
Pulmonary AIDS Peter Corr
There has been a rapid increase in AJDS in many countries in AfricJ and Asia over the last ten years. An understanding of common presentations of pu lmonary opportunistic infecUons and AIDS related neoplasms is important as 80% of AIDS patients will have respiratory disease (1).
Tuberculosis patterns in AIDS (fig 12.1)
The hum an immunodeficiency virus is synergistic with tuberculosis (2). Tuberculosis infection is progressive, often extrapulmonary and multifocal in patients with AIDS (2). Adults present with a pattern similar to primary TB in children wi th unilateral hilar or mediastinal adenopathy and lower lobe opacification. Cavities are uncommon. Progressive disease follows spread alo ng the bronchial tree in addi tion to blood borne spread. Pa tients often have skeletal or abdominal tuberculosis as well (2).
Ground glass pattern (fig 12.2)
The cause is pneumocystis carinii and or cytomegalovirus infection. Patients have a "ground glass" opacification of the lungs that obscures the pulmonary vessels. ll starts arow1d the hila and spreads ourwards. It is easy to miss in early cases but the clue is the lung vessels appear blurred and ill defined. Lymphadenopathy is rare in pneumocystis inJection. However not all patients have the typical "ground glass" pattern, a large number also have co nsolidation, nodules, cavitating masses, subpleural cysts and spontaneous pneumothorax (3).
65
Fig 12.1 Chest radiograph of an AIDS paUent with pulmonary TB. Note the predominantly lower lobe distribution of the opacification with perihilar cavities.
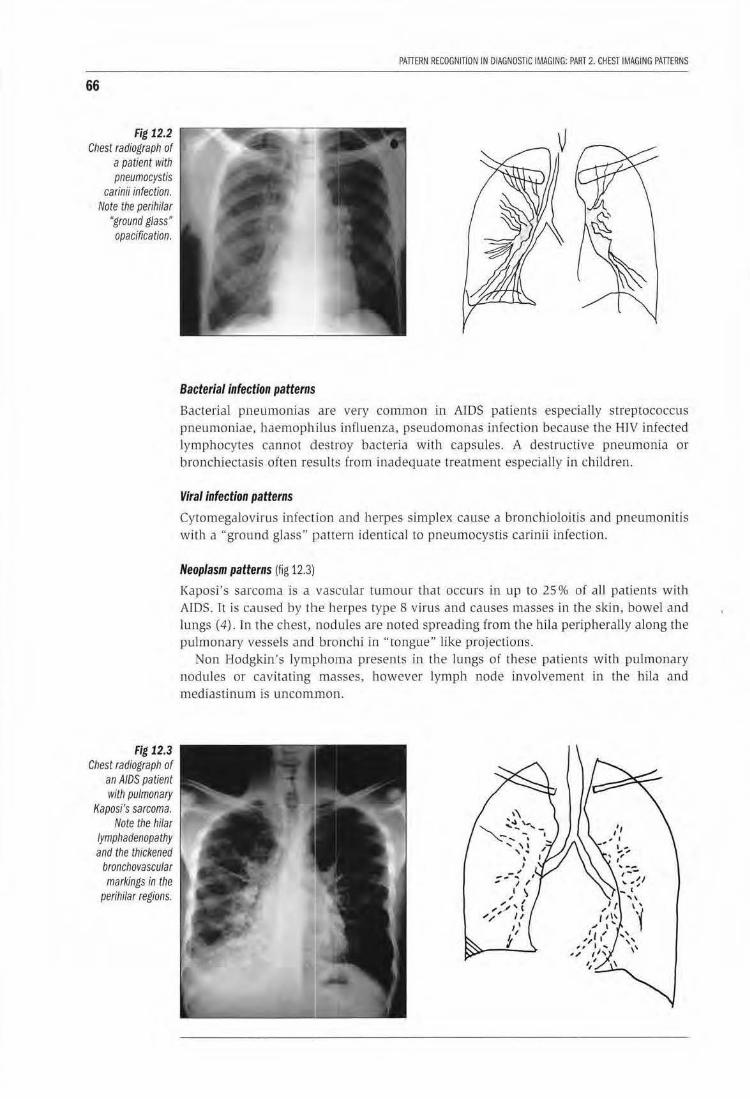
66
Fig 12.2 Chest radiograph of
a patient with pneumocystis
carinii infection. Note the perihilar
"ground glass" opacification.
Fig 12.3 Chest radiograph of
an AIDS patient with pulmonary
Kaposi's sarcoma. Note the hilar
lymphadenopathy and the thickened
bronchovascular markings in the
perihilar regions.
PATTERN RECOGNITION IN DIAGNOSTIC IMAGING: PART 2. CHEST IMAGING PATIERNS
Bacterial infection patterns
Bacterial pneumonias are very common in AiDS patients especially streptococcus pneumoniae, haemophilus in[luenza, pseudomonas infection because the HIV infected lymphocytes cannot destroy bacteria with capsules. A destructive pneumonia or bronchiectasis often results from inadequate treatment especially in children.
Viral infection patterns
Cytomegalovirus infection and herpes simplex cause a bronchioloitis and pneumonitis with a "ground glass" pattern identical to pneumocys tis carinii infection.
Neoplasm patterns (fig 12.3)
Kaposi's sarcoma is a vascular tumour that occurs in up to 25% of all patients with AIDS. It is caused by the herpes type 8 virus and causes masses in the skin, bowel and lungs ( 4). ln the chest, nodules are noted spreading from the hil a periphera lly along the pu lmonary vessels and bronchi in "tongue" like projections.
Non Hodgkin's lymphoma presents in the lungs of these patients with pulmonary nodu les or cavitating masses, however lymph node involvement in the hila and mediastinum is uncom mon.
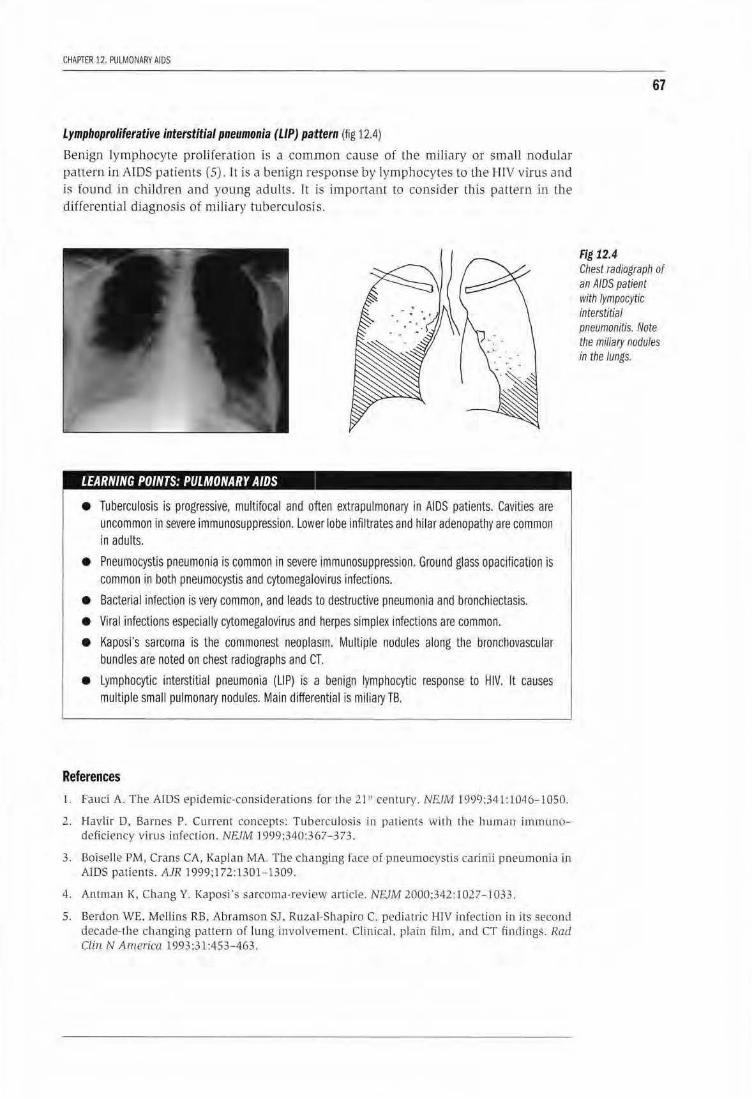
CHAPTER 12. PULMONARY AIDS
Lymphoproliferative interstitial pneumonia (LIP) pa:ttern {fig 12.4)
Benign lymphocyte prolifera tion is a common cause of th e miliary or small nodular pattern in ATDS patients (5). It is a benign response by lymphocytes to Lhe I-IIV virus and is found in chi ldren and young adults. It is important to consider this pallem in the differential diagnosis of miliary tuberculosis.
LEARNING POINTS: PULMONARY AIDS
• Tuberculosis is progressive, multifocal and often extrapulmonary in AIDS patients. Cavities are uncommon ln severe immunosuppression. Lower lobe infiltrates and hilar adenopathy are common in adults.
• Pneumocystis pneumonia is common in severe immunosuppression, Ground glass opacification is common in both pneumocystis and cytomegal•ovirus infections.
• Bacterial infection is very common, and leads to destructive pneumonia and bronchiectasis.
• Viral infections especially cytomegalovirus and herpes simplex infections are common.
• Kaposi's sarcoma is the commonest neoplasm. Multiple nodules along the broncllovascular bundles are noted on chest radiographs and CT.
• Lymphocytic interstitial pneumonia {UP) is .a benign lymphocytic response to HIV. It causes multiple small pulmonary nodules. Main differ•ential is miliary TB.
References
l. Faud A. The AIDS epidemic-considerations fo r the 21 " century. NR.IM 1999:341:1046-1050.
2.. J-lavlir D. Barnes P. Current concepts! Tuberculosis in paLien ts wit.h the human immunl'ldeficiency v'.irus infection. N£./M J 999;340:367- 3 73.
3. Boiselle PM, Crans CA, Kaplan MA.. The changing lace of pneumocystis cmin ii pneumoniu in AIDS patients. AJR 1999;172:1301-1309.
4. Ant man K. Chang Y. Kaposi's sarcoma-review article. NC..IM 2000;342 : I 027- J 033 .
5. Berdon WE. Mellins RB, Abramson SJ , Ruzal-Shapiro C. pediatric HIV infection in its second decade-the changing pattern of lung involvement. CHnica l. plain film. and CT find ings. Rad Clin N America 1993:31:453-463.
67
Fig 12.4 Chest radiograph of an AIDS patient with Jympocytic interstitial pneumonitis. Note the miliary nodules in the lungs.
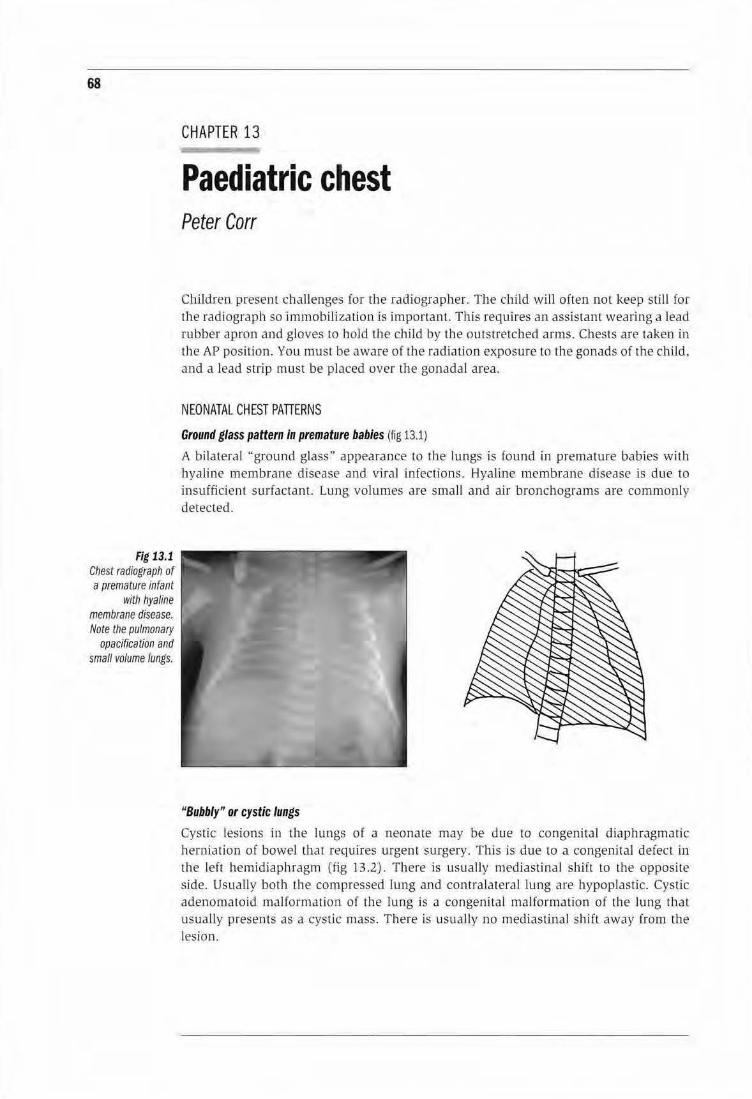
68
Fig 13.1 Chest radiograph of a premature infant
with hyaline membrane disease. Note the pulmonary
opacfffca tion and small volume lungs.
CHAPTER 13
Paediatric chest Peter Carr
Children present challenges for the radiographer. The child will often not keep still for the radiograph so Immobili zation is importan t. This requires an assistant wearing a lead rubber apron and gloves to hold the child by the outstretched anus. Chests are taken in the APposition. You must be aware of the radjation exposure to the gonads of the child. and a lead strip must be placed over the gonadal area.
NEONATAL CHEST PATIERNS
Ground glass pattern in premature babies (fig 13.1)
A bilateral '·ground glass" appearance to the lungs is found in premature babies with hyaline membrane disease and viral infections. Hyaline membrane disease is due to insufficient surfactant. Lung volumes are small and rur bronchograms are commonly detected .
"Bubbly" or cystic lungs
Cystic lesions in the lungs of a neonate may be due to congenital diaphragmatic herniation of bowel that requjres urgent surgery. This is due to a congenital defect in the left hemidiaph ragm (fig 13.2). There is usually mediastina l sbjft to the opposi te side. Usually both the compressed lung and contralateral lung are hypoplastic. Cystic adenomatoid malformation of the lung is a congenital malformation of the lung thal usual ly presents as a cystic mass. There is usually no mediastina l shifl away from the lesion .
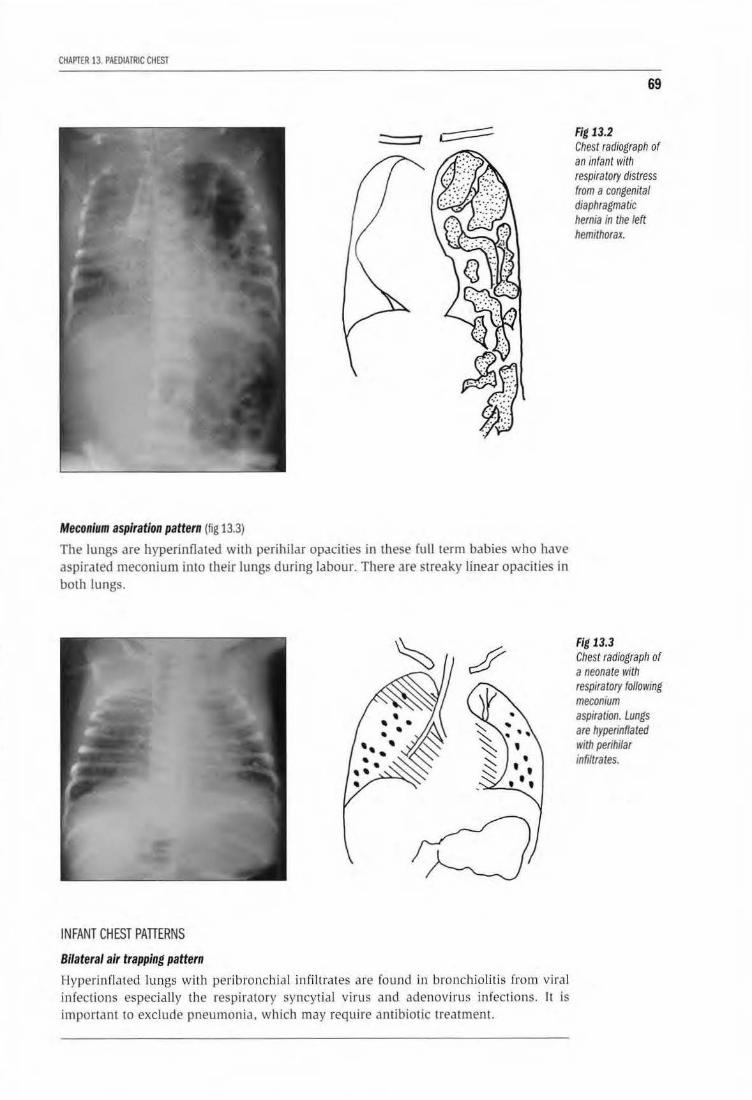
CHAPTER 13. PAEDIATRIC CHEST
Meconium aspiration pattern (fig 13.3)
The lungs are hyperinfla ted with perihilar opacities in these full term babies who have aspirated meconium into their lungs during labour. There are streaky linear opacities in both lungs.
INFANT CHEST PATTERNS
Bilateral air trapping pattern
Hyperin fla ted lungs with peribronch ial infiltrates are found in bronchiolitis from viral infections especially the respiratory syncytial virus and adenovirus infections. It is important to exclude pneumonia, which may require an ribiotic treatment.
69
Fig 13.2 Chest radiograph of an infant with respiratory distress from a congenital diaphragmatic hernia in the left hemithorax.
Fig 13.3 Chest radiograph of a neonate with respiratory following meconium aspiration. Lungs are hyperinflated with perihilar infiltrates.
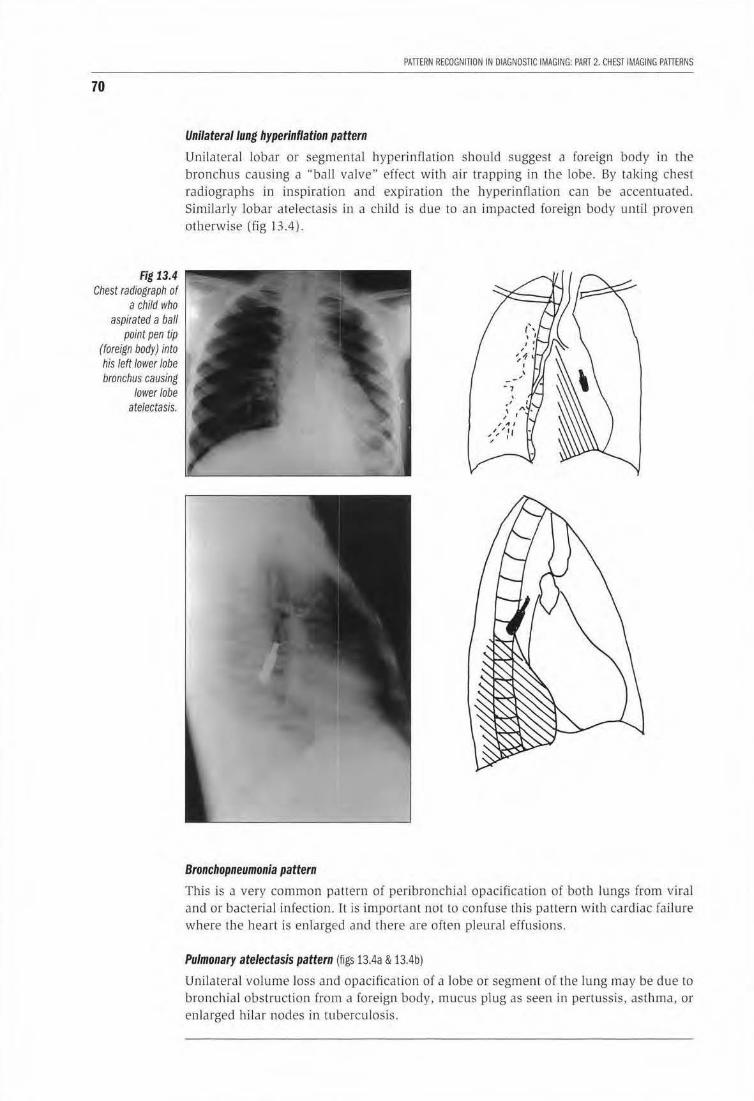
70
Fig 13.4 Chest radiograph of
a child who aspirated a ball
point pen tip (foreign body) into his left lower lobe bronchus causing
lower lobe atelectasis.
PATIERN RECOGNITION IN DIAGNOSTIC IMAGING: PART 2. CHEST IMAGING PATIERNS
Unilateral lung hyperinflation pattern
Un ilateral lobar or segmental hyperinflation should suggest a foreign body in the bronchus causing a '"ball valve" eifect with air trapping in the lobe. By taking chest radiographs in inspiration and expiration the hyperinflation can be accentuated. Similarly lobar atelectasis in a child is due to an impacted foreign body until proven otherwise (fig 13.4).
Bronchopneumonia pattern
This is a very common pattern of peribronchial opacification oi both lungs from viral and or bacterial infection. It is important not to confuse this pattern with cardiac failure where the heart is en larged and there are often pleural effusions.
Pulmonary atelectasis pattern (figs 13.4a & 13.4b)
Unilateral volume loss and opacification of a lobe or segment of the lung may be due to bronchia l obstruction from a foreign body, mucus plug as seen in pertussis, asthma, or enlarged hilar nodes in tuberculosis.
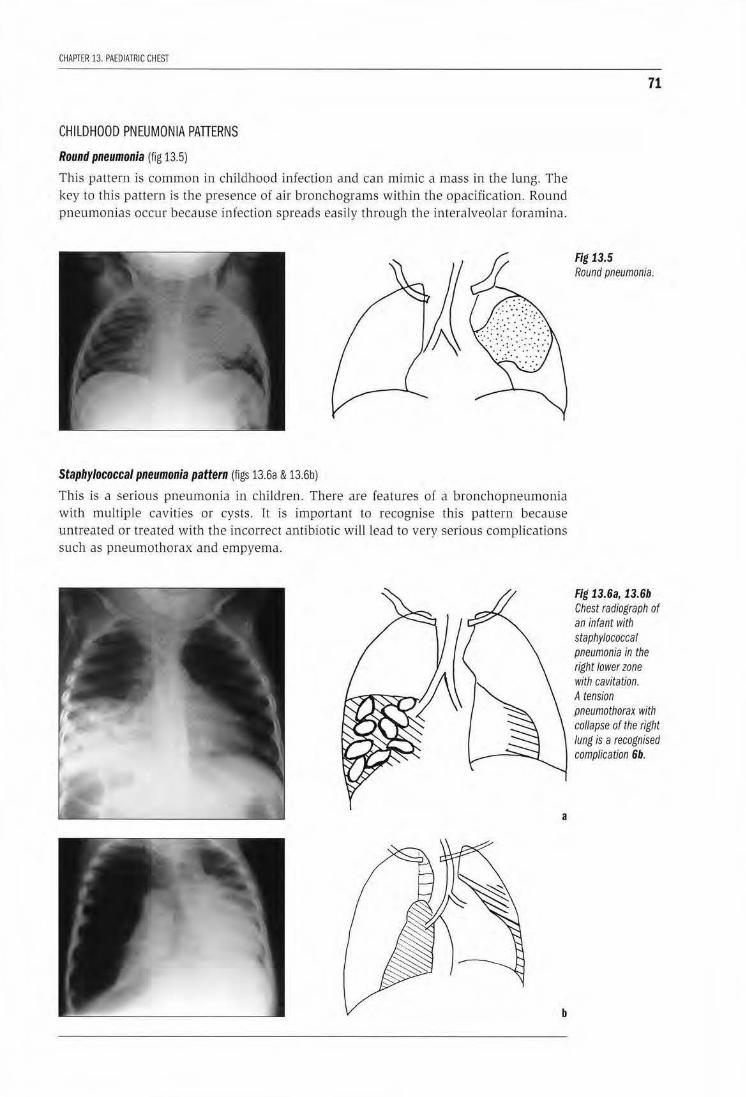
CHAPTER 13. PAEDIATRIC CHEST
CHILDHOOD PNEUMONIA PATTERNS
Round pneumonia (fig 13.5)
This pattern is common in child hood infection and can mimic a mass in the lung. The key to this pattern is the presence of air bronchograms within the opacification. Round pneumonias occur because infection spreads easily through the interalveolar foramina.
Staphylococcal pneumonia pattern (figs 13.6a & 13.6b)
This is a serious pneumonia in children . There are features of a bronchopneumonia with multiple cavities or cysts. It is important to recognise this pattern because untreated or treated with tl1e incorrect antibiotic will lead to very serious complications such as pneumothorax and empyema.
a
b
71
Fig 13.5 Round pneumonia.
Fig l3.6a, l 3.6b Chest radiograph of an infant with staphylococcal pneumonia in the right lower zone with cavitation. A tension pneumothorax with co/lapse of the right lung is a recognised complication 6b.
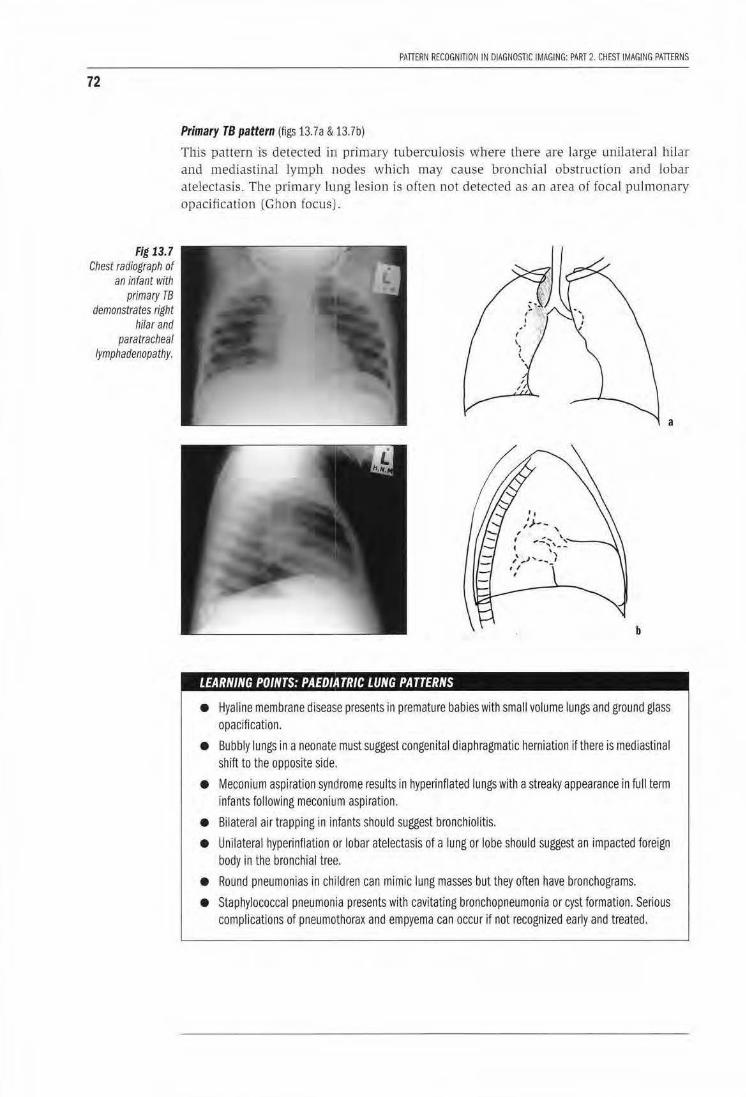
72
Fig 13.7 Chest radiograph of
an infant with primary TB
demonstrates right hilar and
para tracheal lymphadenopathy.
PAllERf>l RECOGNITION IN DIAGNOSTIC IMAGING: PART 2. CHEST IMAGING PAllERNS
Primary TB pattern (figs 13. 7a & 13.7b)
This pattern is detected in primary tuberculosis where th ere are large unilateral hilar and mediastinal lymph nodes wh ich may cause bronchial obstruction and lobar atelectasis. The primary lung lesion is often not detected as an area of focal pulmonary opacification (Ghon (ocusj .
a
b
LEARNING POINTS: PAEO/A TRIC LUNG PATTERNS
• Hyaline membrane disease presents in premature babies with small volume lungs and ground glass opacification.
• Bubbly lungs in a neonate must suggest congenital diaphragmatic herniation if there is mediastinal shift to the opposite side.
• Meconium aspiration syndrome results in hyperinflated lungs with a streaky appearance in full term infants following meconium aspiration.
• Bilateral air trapping in infants should suggest bronchiolitis.
• Unilateral hyperinflation or lobar atelectasis of a lung or lobe should suggest an impacted foreign body in the bronchial tree.
• Round pneumonias in children can mimic lung masses but they often have bronchograms.
• Staphylococcal pneumonia presents with cavitating bronchopneumonia or cyst formation. Serious complications of pneumothorax and empyema can occur if not recognized early and treated.
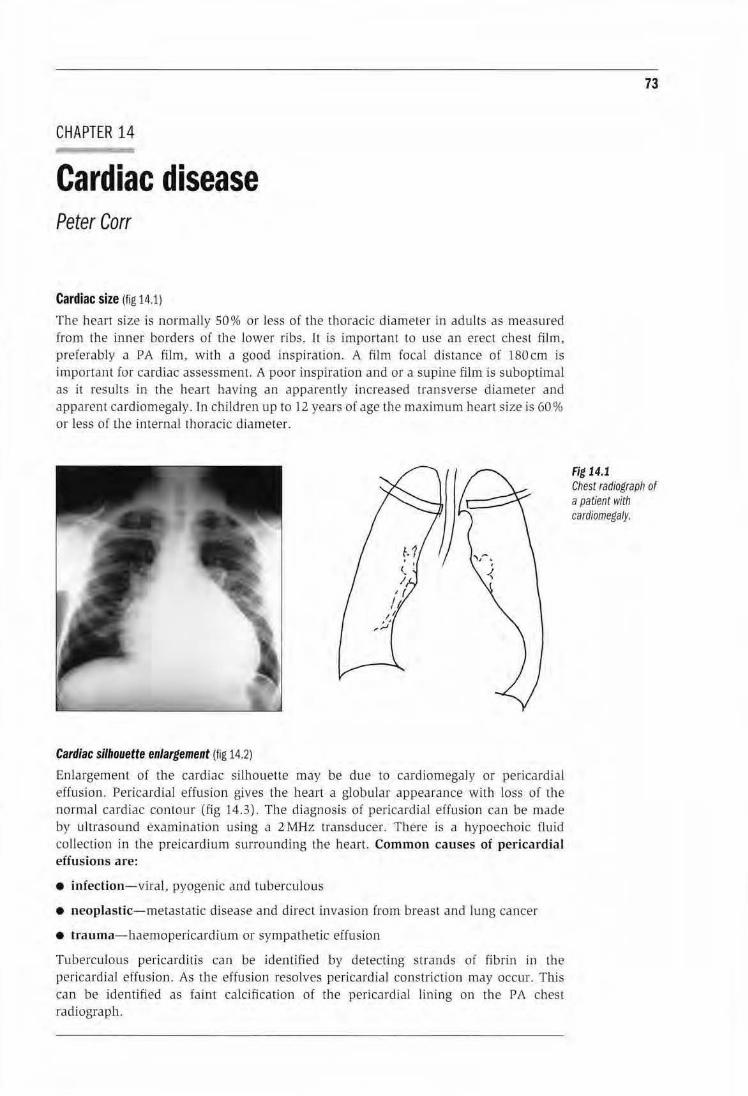
CHAPTER 14
Cardiac disease Peter Carr
Cardiac size (fig 14.1)
The heart size is normally SO% or less of t11e tJ1o racic diameter in adults as measured from the inner borders of the lower ribs. ll is important to use an erect chest film, preferably a PA film, with a good inspiration. A film focal distance of 180cm is important for cardiac assessment. A poor inspiration and or a supine film is suboptimal as it results in the heart having an apparently increased tramverse diameter and apparent cardiomegaly. In children up to 12 years of age the maximum heart size is 60% or less of the internal thoracic diameter.
Cardiac silhouette enlargement (fig 14.2)
Enlargement of the cardiac silhouette may be due to cardiornegaJy or perica rdia! effusion. Pericardia! effusion gives the hean a globular appearance with loss of the normal cardiac contour (fig 14.3). The diagnosis of pericardial effusion can be made by ultrasound examination using a 2MHz transducer. There is a hypoechoic fluid collection in the preicardium surrounding Lhe heart Common causes of pericardia! effusions are:
• infection-viral, pyogenic and tuberculous
• neoplastic-metastatic disease and direct invasion from breast and lung cancer
• trauma-haemopericardium or sympathetic effusion
Tuberculous pericarditis can be identified by detecting strands of fibr in in the pericardia! effusion. As the effusion resolves pericardia! constriction may occur. This can be identified as faint calcification of the pericardia! lining on the PA chest radiograph.
73
Fig 14.1 Chest radiograph or a paUent with cardfomegaly.
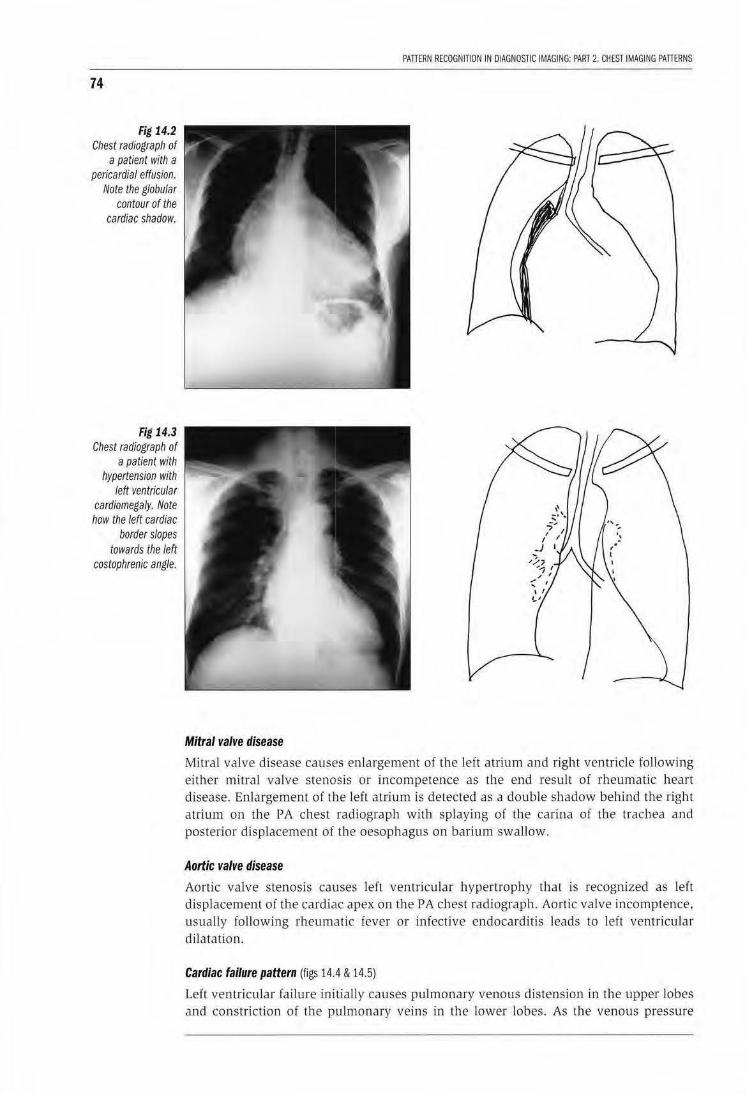
74
Fig 14.2 Chest radiograph of
a patient with a pericardia/ effusion.
Note the globular contour of the
cardiac shadow.
Fig 14.3 Chest radiograph of
a patient with hypertension with
left ventricular cardiomegaly. Note how the left cardiac
border slopes towards the left
costophrenic angle.
PATTERN RECOGNITION IN DIAGNOSTIC IMAGING: PART 2. CHEST IMAGING PATTERNS
Mitral valve disease
Mitral valve disease causes enlargement of the left atrium and right ventricle following either mitral valve stenosis or incompetence as the end result of rheumatic heart disease. Enlargement o( the left atrium is detected as a double shadow behind the right atrium on the PA chest radiograph with splaying of the carina of the trachea and posterior displacement of the oesophagus on barium swallow.
Aortic valve disease
Aortic valve stenosis causes left ventricular hypertrophy that is recognized as left displacement of the cardiac apex on the PA chest radiograph. Aortic valve incomptence, usually following rheumatic fever or infective endocarditis leads to left ventricular dilatation.
Cardiac failure pattern (figs 14.4 & 14.5)
Left ventricular failure initially causes pulmonary venous distension in the upper lobes and constriction of the pulmonary veins in the Lower lobes. As the venous pressure
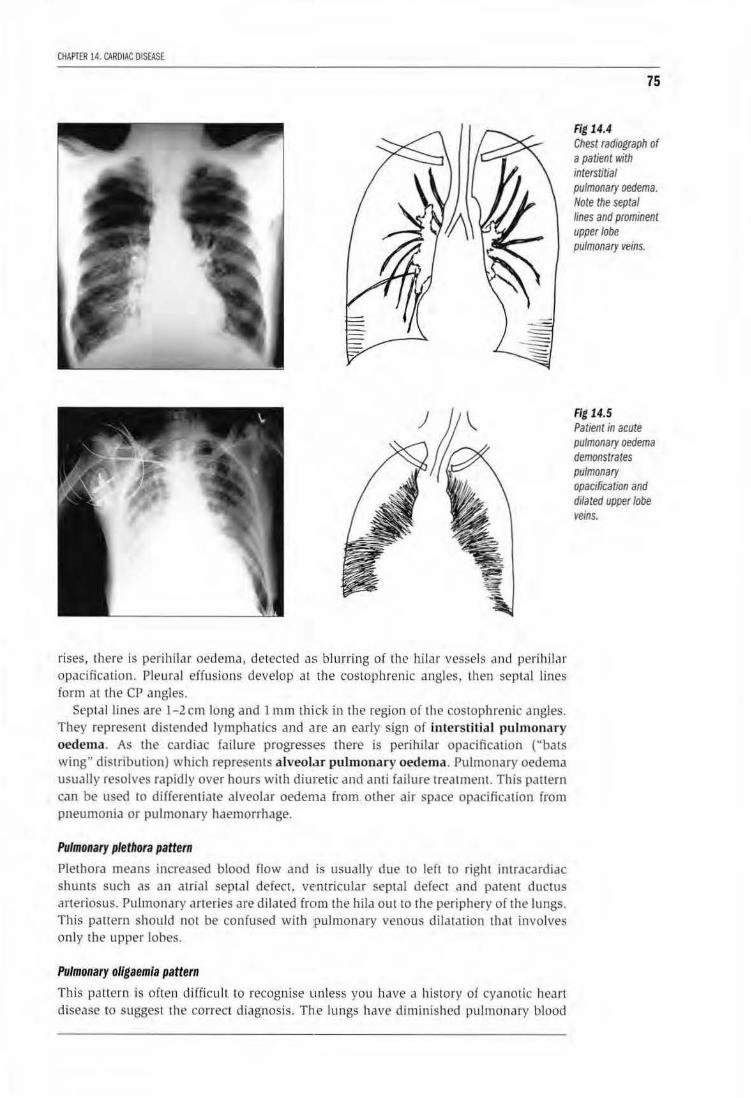
CHAPTER 14. CARDIAC DISEASE
rises, th ere is perihiJar oedema, detected as blurring of the hilar vessels aJ1d perihilar opacification. Pleura l effusions develop at the cosrophrenic angles, then septal lines form at the cr angles.
Septal lines are 1- 2 em long and 1 mm thick in the region of the costophrenic angles. They represent distended lymphatics and are an early sign of interstitial pul monary oedema. As Lhe cardiac failure progress•es there is perihilar opacification ("bats wing" distribution) which represents alveol.u pulmonary oedema. Pulmonary oedema usually resolves rapidly over hours with diuJietic and anti failure treatment. This pattern can be used to differentiate alveolar oedema from other air space opacification from pneumonia or pulmonary haemorrhage.
Pulmonary plethora pattern
Plethora means increased blood now and is usually due to left to right intracardiac shunts such as an atrial septal defect, ventricular septal defect and patent ductus arteriosus. Pulmonary arteries are dilated from the hila out to the periphery of the lungs. This paltern should not be confused with pulmonary venous dilatation thal involves on ly the upper lobes.
Pulmonary oligaemla pattern
This pallern is often difficult lo recognise unless you have a history of cyanotic heart disease to suggest the correct diagnosis. Th.e lungs have diminished pulmonary blood
75
Fig 14.4 Chest radiograph of a patient with interstitial pulmonary oedema. Note the septal lines and prominent upper lobe pulmonary veins.
Fig 14.5 Patient in acute pulmonary oedema demonstrates pulmonary opacification and dilated upper lobe veins.
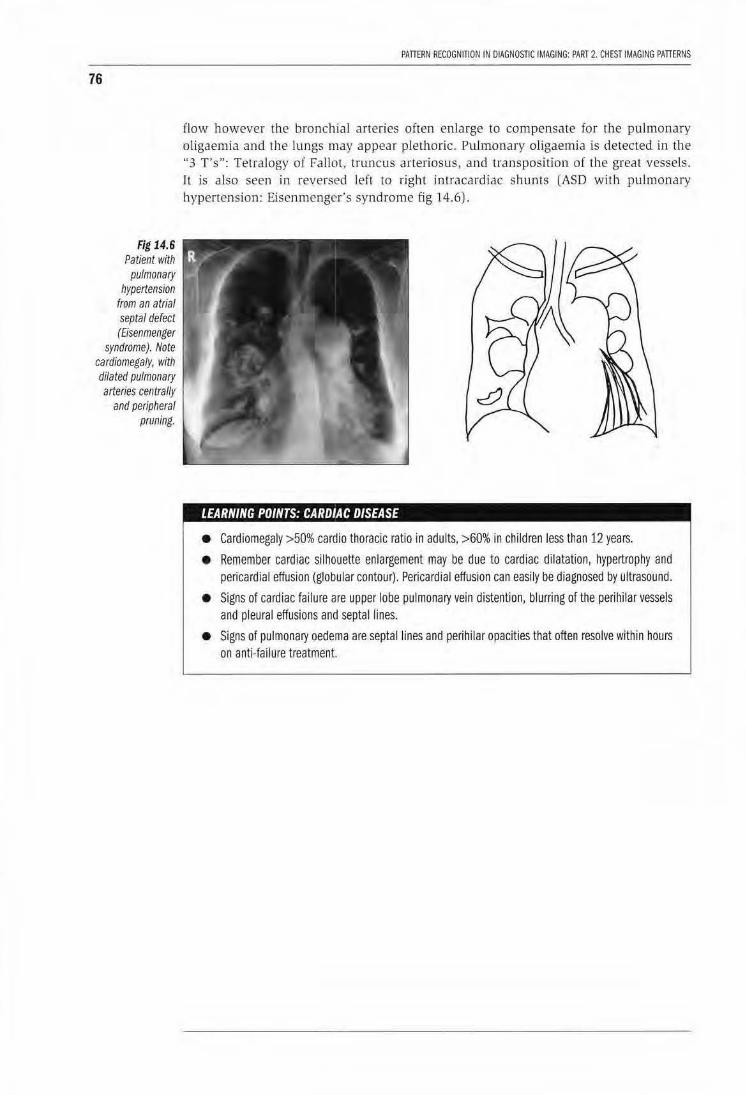
76
Fig 14.6 Patient with
pulmonary hypertension
from an atrial septal defect (Eisenmenger
syndrome). Note cardiomegaly, with dilated pulmonary arteries centrally
and peripheral pruning.
PATTERN RECOGNITION IN DIAGNOSTIC IMAGING: PART 2. CHEST IMAGING PATIERNS
flow however the bronchial arteries often enlarge to compensate for the pulmonary oligaemia and ihe lungs may appear plethoric. Pulmonary oligaemia is detected in the "3 T's": Tetralogy of Fallot, truncus arteriosus, and transposition of the great vessels. It is also seen in reversed left to right intracardiac shunts (ASD with pulmonary hypertension: Eisenmenger's syndrome fig 14.6) .
LEARNING POINTS: CARDIAC DISEASE
• Cardiomegaly >50% cardia thoracic ratio in adults, >60% in children less than 12 years.
• Remember cardiac silhouette enlargement may be due to cardiac dilatation, hypertrophy and pericardia! effusion (globular contour). Pericardia I effusion can easily be diagnosed by ultrasound.
• Signs of cardiac failure are upper lobe pulmonary vein distention, blurring of the perihilar vessels and pleural effusions and septal lines.
• Signs of pulmonary oedema are septal lines and perihilar opacities that often resolve within hours on anti-failure treatment.
CHAPTER 15
Mediastinal masses Peter Carr
The mediastinum can be divided into superior, anterior, middle, and posterior compartments.
Superior mediastinum The superior mediastinum is superior to the level of the aortic arch. Masses in this region include retrosternal thyroid masses and aneurysms of the ascending aorta and great vessels. Retrosternal goitres cause displacement of the trachea, extend inferiorly from the neck, and may have focal calcification within them. The diagnosis can be confirmed by ultrasound of the neck or by using A common cause of a superior mediastinal mass on the right is a dilated brachiocephalic artery in an elderly patient. Here the diagnosis can be easily confirmed by ultrasound. The important point to remember is that this is a normal aging phenomenon and not to do any further investigations on these patients.
Anterior mediastinum This region is between the heart and ascending aorta and the sternum and inferior to the aortic arch. It is best visualized on a well penetrated lateral chest radiograph. The region contains lymph nodes, the thymus in children and the thymic remnant in adults, and the pericardium. Masses include: enlarged lymph nodes, thymic masses, teratomas or dermoids, and aneurysms of the ascending aorta. Often it is not possible to differentiate between these masses on radiographs however if the mass has a lobulated contour it suggests enlarged lymph nodes. Focal calcification is detected in dermoids and teratomas. Linear calcification may be detected in aortic aneurysms from syphilis or Takayashu's disease.
Middle mediastinum This region is between the anterior and posterior mediastinum and contains the heart, great vessels, pulmonary vessels and lymph nodes. Masses in this region include: enlarged hilar and tracheobronchial lymph nodes, bronchogenic cysts, aortic arch aneurysms, and bronchial carcinomas.
Posterior mediastinum The posterior mediastinum extends from the middle mediastinum to the spine and paraspinal gutters. It includes the descending thoracic aorta, lymph nodes, nerves and the oesophagus. Masses in this region: neurogenic tumours, paravertebral masses, tuberculous abscesses, oesophageal tumours, hiatus hernia, and dilated oesophagus. It is very important when a posterior mediastinal mass is detected to clearly visualise the spine, so as to detect early bony destruction or erosion from tuberculosis or bony metastases.
77
78
PATTERN RECOGNITION IN DIAGNOSTIC IMAGING: PART 2. CHEST IMAGING PATTERNS
LEARNING POINTS: MEDIASTINAL MASSES
• Common superior mediastinum masses: retrosternal thyroid goitre, aneurysms of great vessels
• Common anterior mediastinum masses: 3T's teratomas or dermoids, retrosternal thyroid, thymoma and ascending aortic aneurysm
• Common middle mediastinum masses: lymphadenopathy, bronchogenic cysts, bronchial carcinoma
• Common posterior mediastinum masses: lymphadenopathy, neurogenic tumours, paraspinal abscess especially TB, oesophageal tumours
References 1. Chapman S, Nakielny R. Aids to Radiological Differential Diagnosis. 1995, Saunders, London.
2. Armstrong P. The Mediastinum. In: Diagnostic Radiology-Textbook of Medical Imaging. Grainger RG, Allison DJ. 3'd edition 1997 Churchill Livingstone, Edinburgh.
CHAPTER 16 -Diaphragm lesions Peter Carr
Diaphragmatic elevation Eventration is a congenital deficiency of the muscle in the hemidiaphragm usually the left, resulting in non-function and resultant elevation. The diagnosis is confirmed on fluoroscopy /screening when there is limited or no movement on deep inspiration and expiration. If fluoroscopy is unavailable perform one chest film using a double exposure in inspiration and an expiration at 50% normal mas, this will show movement of the diaphragm. Eventration must be distiguished from phrenic nerve palsy.
Phrenic nerve palsy results in paralysis of diaphragmatic movement on one side resulting in elevation of the hemidiaphragm and limited or paradoxical movement on deep inspiration and expiration. There are many causes, however the commonest causes is carcinoma of the bronchus.
Subphrenic masses, liver enlargement and abscesses will elevate the hemidiaphragm. On the chest radiograph with a liver or right subphrenic abscess, the right hemidiaphragm is elevated and its outline becomes "fuzzy" or ill-defined with associated linear atelectasis in the right lower lobe. This is a very important pattern to recognise as you need to perform an ultrasound examination of the right subphrenic space and liver to detect an abscess. Pseudo elevation is seen with subpulmonic pleural effusions and haemothoraces. The apex of the "elevated hemidiaphragm" is usually displaced more laterally that what is normally seen. A decubitus chest film with the affected side dependent will confirm the diagnosis.
Diaphragmatic injury is commonly missed especially following penetrating trauma. Injury is nine times more common on the left. The diagnosis can be difficult to make. On the left, detection of bowel loops above the hemidiaphragm or a soft tissue mass contiguous to the diaphragm is suspicious. A contrast study of the stomach and colon will confirm the diagnosis. If there is incarcerated bowel present is will be opacified by contrast above the diaphragm.
79
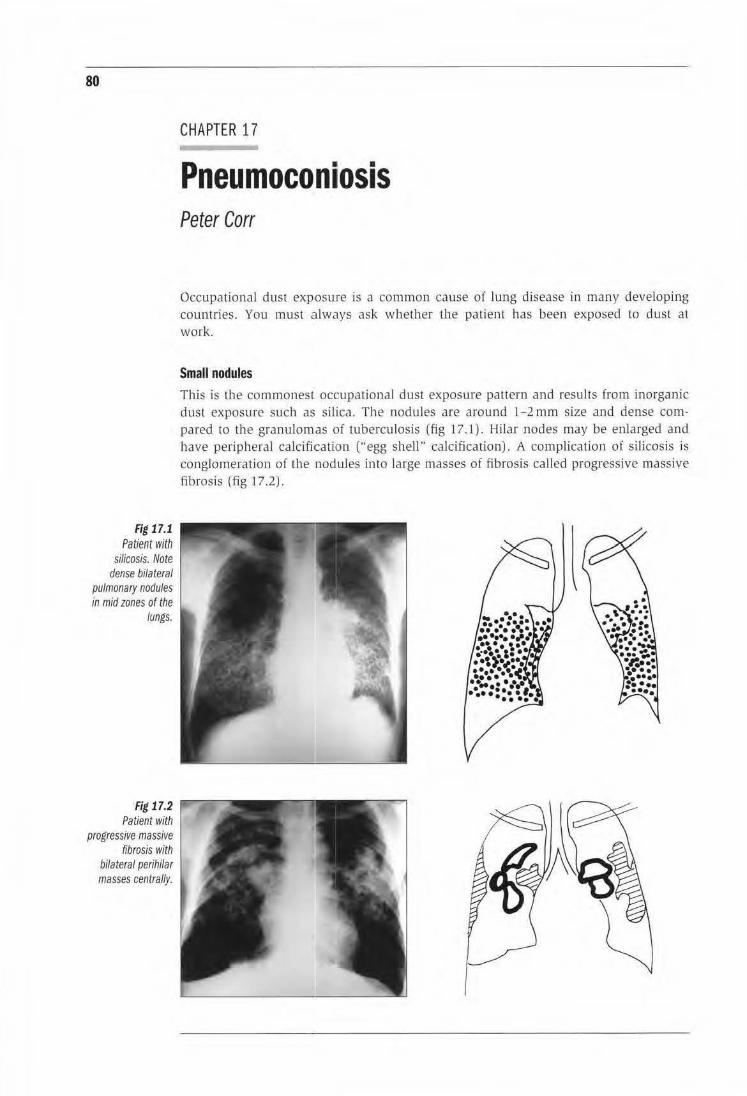
80
Fig 17.1 Patient with
silicosis. Note dense bilateral
pulmonary nodules in mid zones of the
lungs.
Fig 17.2 Patient with
progressive massive fibrosis with
bilateral perihilar masses centrally.
CHAPTER 17
Pneumoconiosis Peter Carr
Occupational dust exposure is a common cause of lung disease in many developing countries. You must always ask wbether the patient has been exposed to dust at work.
Small nodules This is the commonest occupational dust exposure pattern and results from inorganic dust exposure such as silica. The nodules are around 1-2 mm size and dense compared to the granulomas of tuberculosis (fig 17.1) . Hilar nodes may be enlarged and have peripheral calcifiiCation ("egg shell" calcification). A complication of silicosis is conglomeration of the nodules into large masses of fibrosis called progressive massive fibrosis (fig 17.2).
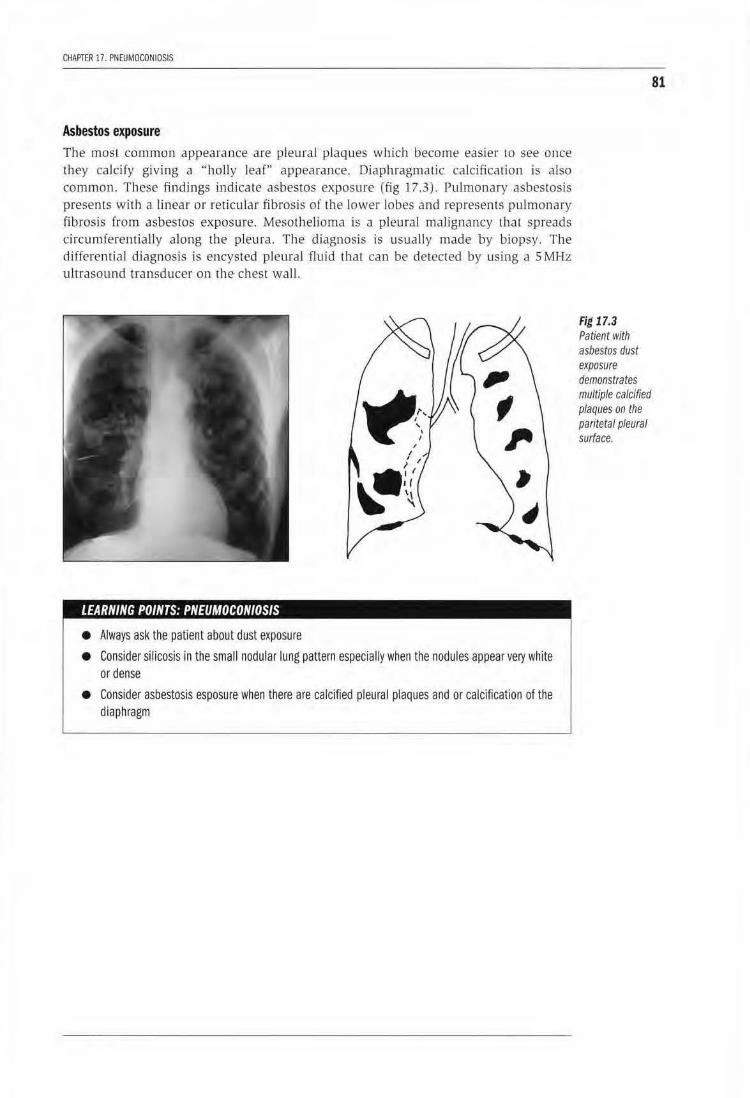
CHAPTER 17. PNEUMOCONIOSIS
Asbestos exposure The most common appearance are pleural plaques which become easier to see once they calcify giving a ''holly leaf" appearance. Diaphragmatic calcification is also common. These findings indicate asbestos exposure (fig 17.3). Pulmonary asbestosis presents with a linear or reticular fibrosis of the lower lobes and represents pulmonary fibrosis from asbestos exposure. Mesothelioma is a pleural malignancy that spreads circumferentially along the pleura. The diagnosis is usually made by biopsy. The differentia l diagnosis is encysted pleural fluid that can be detected by using a S MHz ultrasound transducer on the chest wall.
LEARNING POINTS: PNEUMOCONIOSIS
• Always ask the patient about dust exposure
• Consider silicosis in the small nodular lung pattern especially when the nodules appear very white or dense
• Consider asbestosis esposure when there are calcified pleural plaques and or calcification of the diaphragm
Fig 17.3 Patient with asbestos dust exposure demonstrates multiple calcified plaques on the pari/eta/ pleural surface.
81


PART3
MUSCULOSKELETAL PATTERNS

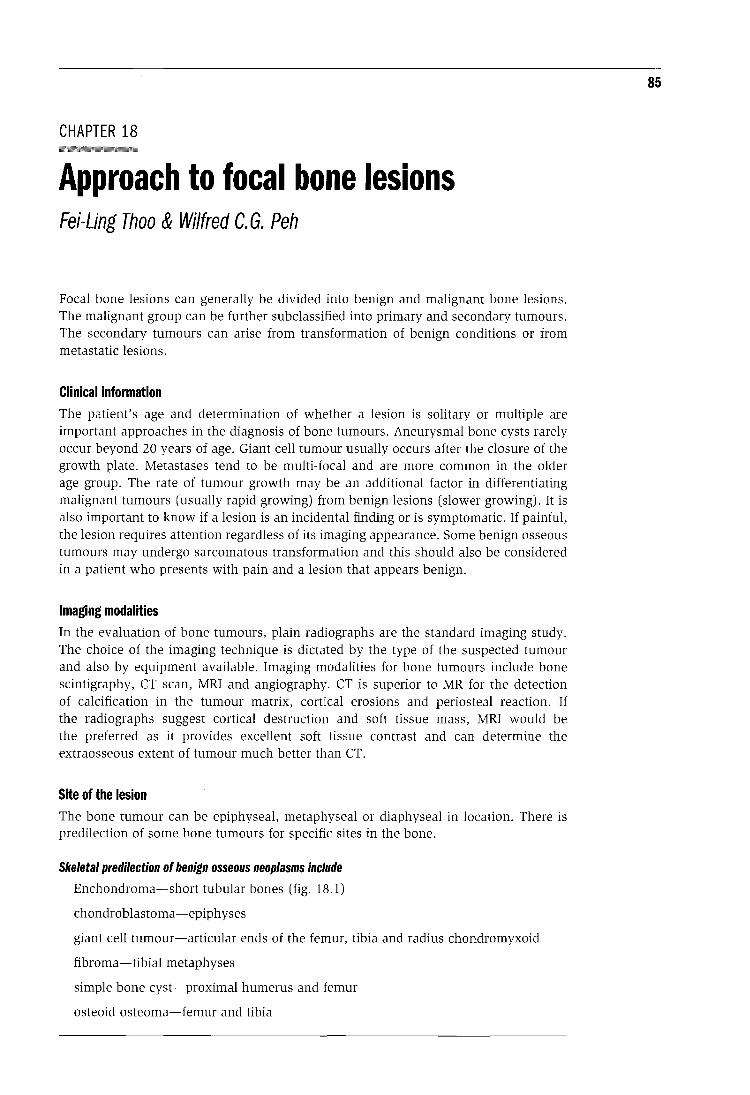
CHAPTER 18
Approach to focal bone lesions Fei-Ling Thoo & Wilfred C. G. Peh
Focal bone lesions can generally be divided into benign and malignant bone lesions. The malignant group can be further subclassified into primary and secondary tumours. The secondary tumours can arise from transformation of benign conditions or from metastatic lesions.
Clinical information The patient's age and determination of whether a lesion is solitary or multiple are important approaches in the diagnosis of bone tumours. Aneurysmal bone cysts rarely occur beyond 20 years of age. Giant cell tumour usually occurs after the closure of the growth plate. Metastases tend to be multi-focal and are more common in the older age group. The rate of tumour growth may be an additional factor in differentiating malignant tumours (usually rapid growing) from benign lesions (slower growing). It is also important to know if a lesion is an incidental finding or is symptomatic. If painful, the lesion requires attention regardless of its imaging appearance. Some benign osseous tumours may undergo sarcomatous transformation and this should also be considered in a patient who presents with pain and a lesion that appears benign.
Imaging modalities In the evaluation of bone tumours, plain radiographs are the standard imaging study. The choice of the imaging technique is dictated by the type of the suspected tumour and also by equipment available. Imaging modalities for bone tumours include bone scintigraphy, CT scan, MRI and angiography. CT is superior to MR for the detection of calcification in the tumour matrix, cortical erosions and periosteal reaction. If the radiographs suggest cortical destruction and soft tissue mass, MRI would be the preferred as it provides excellent soft tissue contrast and can determine the extraosseous extent of tumour much better than CT.
Site of the lesion The bone tumour can be epiphyseal, metaphyseal or diaphyseal in location. There is predilection of some bone tumours for specific sites in the bone.
Skeletal predilection of benign osseous neoplasms include
Enchondroma-short tubular bones (fig. 18.1)
chondroblastoma-epiphyses
giant cell tumour-articular ends of the femur, tibia and radius chondromyxoid
fibroma-tibial metaphyses
simple bone cyst-proximal humerus and femur
osteoid osteoma-femur and tibia
85
86
Fig 18.1 Shows fracture
through an enchondroma located in the
proximal phalanx of the little finger. The tubular bones of the
fingers are typical sites for
enchondroma.
PATTERN RECOGNinON IN DIAGNOSTIC IMAGING: PART 3. MUSCUlOSKELfTAL PATIERNS
Skeletal predilections for malignant osseous tumours include
chordoma-sacrum, cl ivus, C2
multiple myeloma-pelvis, spine and skull
parosteal osteosarcoma-posterior cortex of posterio r femur
chondrosarcoma-epiphyseal lesion of femur and humerus
adamantinoma-tib ia . fibu la
Lesions that have a predilection for flat bones such as the scapula body and the Uiac wing or tl1e diaphyses of long bones include Ewing sarcoma, lymphoma and Langerhans cell histiocytosis (eosinophiHc granuloma). Ewing sarcoma would be more likely in a you nger age group. Lymphoma can be seen in any age but peaks later Ln life. Langerhans cell histiocytosis can be seen at any age.
Borders of the lesion Slow growing lesions are usually benign and have sharply outlined sclerotic borders (narrow zone of transition). An example of a benign lesion (non ossifying fibroma) is shown in fig 18.2. Aggressive or maligna nt lesions typicalJy have indistinct borders (a wide zone of transition1 with either minima l or no reactive sclerosis (fig 18.3) . T his is seen in .fig 18.4 of a child wiLh osteogenic sarcoma. Treatment can al ter Lhe appearance of malignant bone LUmours; they may exhibit sclerosis as well as a narrow zone of transirion.
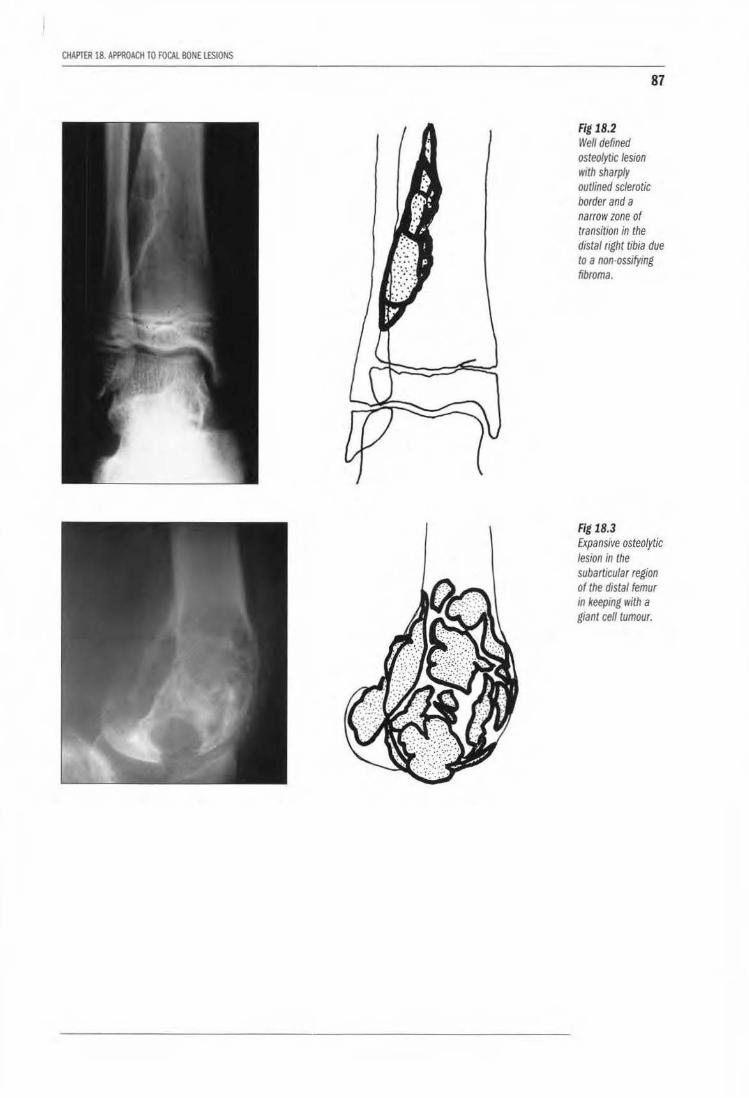
CHAPTER 18. AI'PROACll TO FOCAL BONE lESIONS
87
Fig 18.2 Well defined osteolytic lesion with sharply outlined sclerotic border and a narrow zone of transition in the distal right tibia due to a non-ossifymg fibroma.
Fig 18.3 Expansive osteolytic lesion in the subarticular region of the distal femur m keeping with a giant cell tumour.
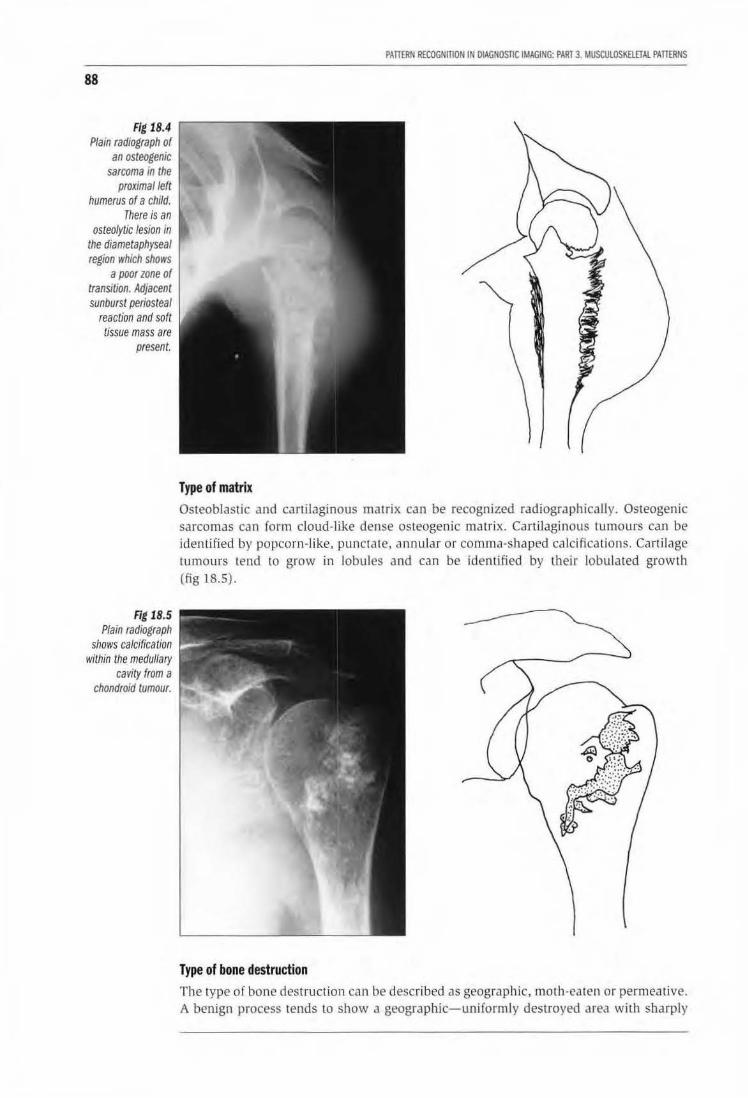
88
Fig 18.4 Plain radiograph of
an osteogenic sarcoma In the
proximal left humerus of a child.
There is an osteolytic lesion in
the diametaphyseal region which shows
a poor zone of transition. Adjacent sunburst periosteal
reaction and soft tissue mass are
present.
Fig 18.5 Plain radiograph
shows calcification within the medullary
cavity from a chondroid tumour.
PAITERN RECOGNITION IN OIAGN05nC IMAGING: PART 3 MUsaJlOSKElfTAl PATIERNS
Type of matrix Osteoblastic and cartilaginous matrix can be recognized radiographicaUy. Osteogenic sarcomas can form cloud-like dense osteogenic matrix. Cartilaginous tumours can be identified by popcorn-l ike, punctate, an nular or comma-shaped calcifications. Cartilage tumours tend to grow in lobules and can be iden tified by their lobulated growth (fig 18.5).
Type of bone destruction The type of bone destruction can be described as geographic, moth-eaten or permeative. A benign process tends to show a geographic-uniformly destroyed area with sharply
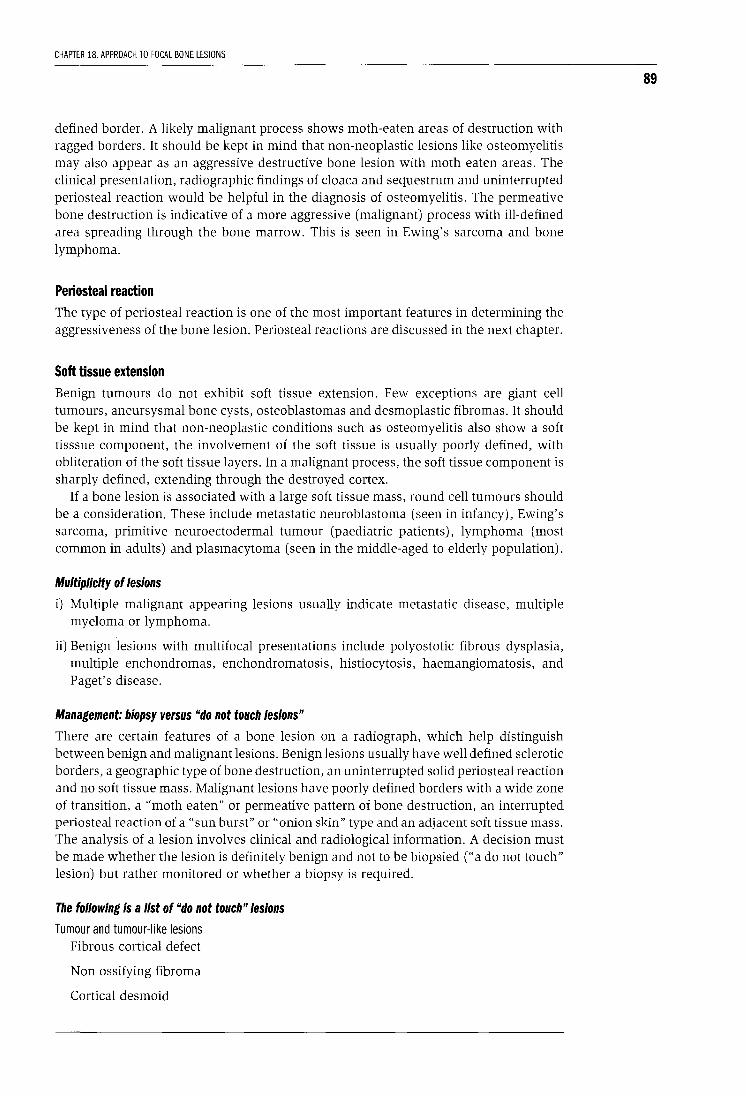
CHAPTER 18. APPROACH TO FOCAL BONE LESIONS
defined border. A likely malignant process shows moth-eaten areas of destruction with ragged borders. It should be kept in mind that non-neoplastic lesions like osteomyelitis may also appear as an aggressive destructive bone lesion with moth eaten areas. The clinical presentation, radiographic findings of cloaca and sequestrum and uninterrupted periosteal reaction would be helpful in the diagnosis of osteomyelitis. The permeative bone destruction is indicative of a more aggressive (malignant) process with ill-defined area spreading through the bone marrow. This is seen in Ewing's sarcoma and bone lymphoma.
Periosteal reaction The type of periosteal reaction is one of the most important features in determining the aggressiveness of the bone lesion. Periosteal reactions are discussed in the next chapter.
Soft tissue extension Benign tumours do not exhibit soft tissue extension. Few exceptions are giant cell tumours, aneursysmal bone cysts, osteoblastomas and desmoplastic fibromas. It should be kept in mind that non-neoplastic conditions such as osteomyelitis also show a soft tisssue component, the involvement of the soft tissue is usually poorly defined, with obliteration of the soft tissue layers. In a malignant process, the soft tissue component is sharply defined, extending through the destroyed cortex.
If a bone lesion is associated with a large soft tissue mass, round cell tumours should be a consideration. These include metastatic neuroblastoma (seen in infancy), Ewing's sarcoma, primitive neuroectodermal tumour (paediatric patients), lymphoma (most common in adults) and plasmacytoma (seen in the middle-aged to elderly population).
Multiplicity of lesions
i) Multiple malignant appearing lesions usually indicate metastatic disease, multiple myeloma or lymphoma.
ii) Benign lesions with multifocal presentations include polyostotic fibrous dysplasia, multiple enchondromas, enchondromatosis, histiocytosis, haemangiomatosis, and Paget's disease.
Management: biopsy versus "do not touch lesions"
There are certain features of a bone lesion on a radiograph, which help distinguish between benign and malignant lesions. Benign lesions usually have well defined sclerotic borders, a geographic type of bone destruction, an uninterrupted solid periosteal reaction and no soft tissue mass. Malignant lesions have poorly defined borders with a wide zone of transition, a "moth eaten" or permeative pattern of bone destruction, an interrupted periosteal reaction of a "sun burst" or "onion skin" type and an adjacent soft tissue mass. The analysis of a lesion involves clinical and radiological information. A decision must be made whether the lesion is definitely benign and not to be biopsied ("a do not touch" lesion) but rather monitored or whether a biopsy is required.
The following is a list of "do not touch" lesions
Tumour and tumour-like lesions Fibrous cortical defect
Non ossifying fibroma
Cortical desmoid
89

90
Solitary fibrous dysplasia
Pseudotumour of haemophilia
Intraosseus ganglion
PATTERN RECOGNITION IN DIAGNOSTIC IMAGING: PART 3. MUSCULOSKELETAL PATTERNS
Enchondroma of a short tubular bone
Non neoplastic processes Stress fracture
Avulsion fracture
Bone infarct
Bone island
Myositis ossificans
Degenerative or post traumatic cysts
Brown tumour of hyperparathyroidism
Discogenic vertebral sclerosis
LEARNING POINTS: FOCAL BONE LESIONS
• Helpful clinical data are:
(a) age of the patient
(b) duration of symptoms and
(c) growth rate of the tumour
• Key radiographic features:
(a) site of tumour
(b) border of the lesion
(c) type of matrix
(d) type of bone destruction
(e) type of periosteal reaction
(f) the presence of absence of soft tissue extension
• A lesion is slow growing (likely to be benign) when it shows:
(a) geographic bone destruction
(b) sclerotic margin
(c) solid, uninterrrupted periosteal reaction, or no periosteal response
(d) no soft tissue mass
• A lesion is aggressive (likely to be malignant) when it shows:
(a) poorly defined margins
(b) moth-eaten or permeative type of bone destruction
(c) interrupted periosteal reaction
(d) soft tissue mass
• A lesion is likely to represent a cartilage tumour when it shows:
(a) lobulation (endosteal scalloping)
(b) calcifications in the matrix
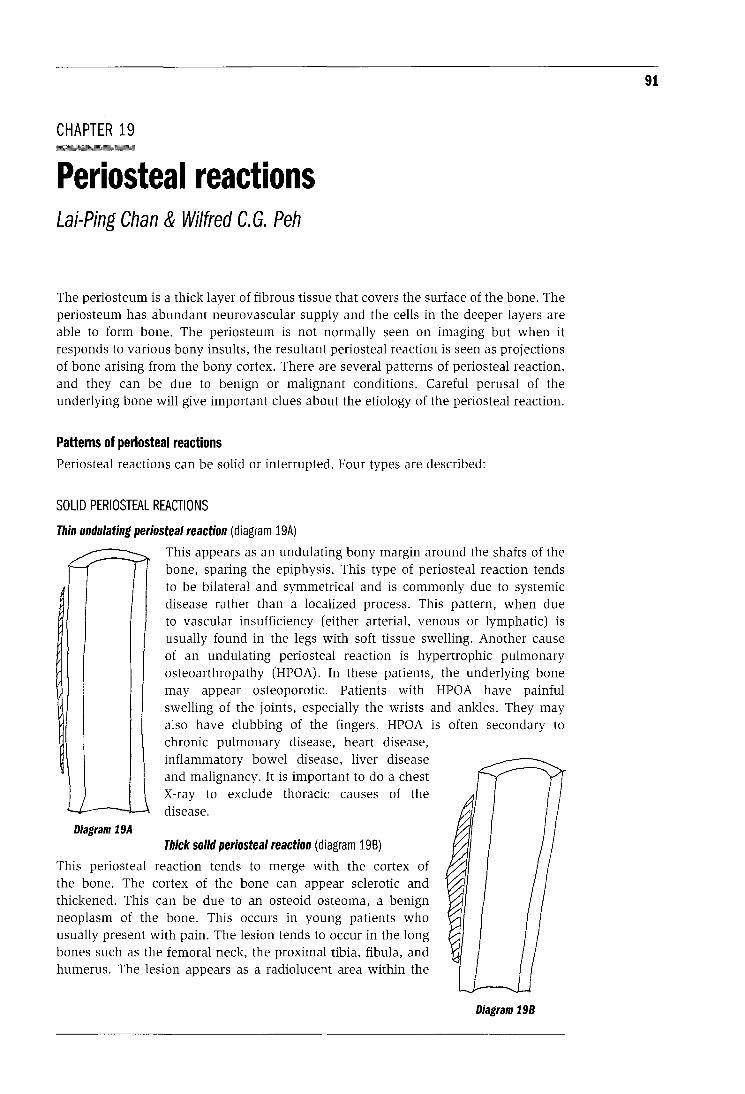
CHAPTER 19 -Periosteal reactions Lai-Ping Chan & Wilfred C. G. Peh
The periosteum is a thick layer of fibrous tissue that covers the surface of the bone. The periosteum has abundant neurovascular supply and the cells in the deeper layers are able to form bone. The periosteum is not normally s~en on imaging but when it responds to various bony insults, the resultant periosteal reaction is seen as projections of bone arising from the bony cortex. There are several patterns of periosteal reaction, and they can be due to benign or malignant conditions. Careful perusal of the underlying bone will give important clues about the etiology of the periosteal reaction.
Patterns of periosteal reactions Periosteal reactions can be solid or interrupted. Four types are described:
SOLID PERIOSTEAL REACTIONS
Thin undulating periosteal reaction (diagram 19A)
..._r -:.._ Y This appears as an undulating bony margin around the shafts of the • - bone, sparing the epiphysis. This type of periosteal reaction tends
to be bilateral and symmetrical and is commonly due to systemic disease rather than a localized process. This pattern, when due to vascular insufficiency (either arterial, venous or lymphatic) is usually found in the legs with soft tissue swelling. Another cause of an undulating periosteal reaction is hypertrophic pulmonary osteoarthropathy (HPOA). In these patients, the underlying bone may appear osteoporotic. Patients with HPOA have painful swelling of the joints, especially the wrists and ankles. They may also have clubbing of the fingers. HPOA is often secondary to chronic pulmonary disease, heart disease, inflammatory bowel disease, liver disease and malignancy. It is important to do a chest X-ray to exclude thoracic causes of the
_.. ...- disease. Diagram 19A
Thick solid periosteal reaction (diagram 198)
This periosteal reaction tends to merge with the cortex of the bone. The cortex of the bone can appear sclerotic and thickened. This can be due to an osteoid osteoma, a benign neoplasm of the bone. This occurs in young patients who usually present with pain. The lesion tends to occur in the long bones such as the femoral neck, the proximal tibia, fibula, and humerus. The lesion appears as a radiolucent area within the
Diagram 198
91

CHAPTER 18. APPROACH 10 FOCAL BONE lESIONS
defined border. A likely malignant process shows motJ1-eaten areas of destruction with ragged borders. It should be kept in mind that non-neoplastic lesions like osteomyelitis may also appear as an aggressive destructive bone lesion with moth eaten Jreas. The clinical presentation, radiographic findings of cloaca and sequestrum and uninterrupted periosteal reaction would be helpful in the diagnosis of osteomyelitis. The permeative bone destructiOn is indicative of a more aggressive (ma lignant) process with ill -defined area spreading through the bone marrow. This is seen in Ewing's sarcoma and bone lymphomJ.
Periosteal reaction The type or periosteal reaction is one of the most important fea tures in determining the aggressiveness of the bone lesion. Periosteal reactions are discussed in lhe nex t chapter.
Soft tissue extension Benign tumours do not e.xhibil soft tissue extension. Few t>xceptions are giant cell tumours. aneursysmal bone cysts. osteoblastomas and desmoplastic fibromas. ll should be kept in mind that non-neoplastic conditions such as osteomyelitis also show a sofl tisssue component. the involvement of the soft tissue is usually poorly defined. with obliteration of the soft tissue layers. In a malignant process, the soft tissue componem is sharply defined, extending through the destroyed conex.
If a bone lesion is associated with a large soft tissue mass. round cell tumours should be a consideration. These include metastatic neuroblastoma (seen m mfancy), Ewing's sarcoma. primitive neuroectodermal tumour (paediatric parit>nts). lymphoma (most common in adults) and plasmacytoma (seen in the middle-aged 10 elderly population) .
Multiplicity of lesions
I) Multiple malignant appearing lesions usually indicate metastatic disease. mullipl€' myeloma or lymphoma.
ill Benign lesions with multifocal presenta tions include polyostotic fibrous dysplnsia, multiple enchondromas, enchondromatosis, histiocytosis, haemangiomatosls, Jnd Pc1get 's disease.
Management: biopsy versus "do not touch lesions"
There are certain ieatures of a bone lesion on a radiograph, which he:>lp distinguish between benign and malignant lesions. Benign lesions usually have well dt?fined sclerotic borders, a geographic type or bone destruction, an urunterruptl'Ll solid periosu.•al reaction and no soft tissue mass. Malignant lesions have poorly defined borders with a wide zone of transition, a "moth eaten" or permeative pauern or bone destruction, an interrupted periosteal reaction of a "sun burst" or "onion skin" type and an adjacent soft tissue mass. The analysis o( a lesion involves clinical and radiological information. A decision must be made whether the lesion is definitely benign and not to be biopsied ("a do not touch ·• lesion) but rather monirored or whether a biopsy is required.
The following Is a list of "do not touch" lesions
Tumour and tumour-like lesions Fibrous cortical defect
Non ossifying fibroma
Cortical desmoid
89

90
Solita ry fibrous dysplasia
Pseudotumour of h.lemophilia
lntraosseus ganglio1n
PAnERN RECOGNIT10N IN DIAGNOSTIC IMAGING: PART 3. MUSCULOSKELETAL PATIERNS
Enchondroma of a short tubular bone
Non neoplastic processes Stress fracture
Avulsion fracture
Bone infarct
Bone island
Myosihs oss"ificans
Degenerative or posttraumatic cysts
Brown tumour of hyperparathyroidism
Discogenic vertebra I sclerosis
, • • I CAL BONE LESIONS
• Helpful cl inical data are:
(a) age of the patient
(b) duration of symptoms and
(c) growth rate of tt1e tumour
• Key radiographic feHtures:
(a) site of tumour
(b') border of the lesion
(c) type of matrix
(d) type of bone destruction
(e) type of periosteal reaction
(f) the presence of absence of soft tissue extension
• A lesion is slow growing (likely to be benign} when it shows:
(a) geographic bone destruction
(b) sclerotic margin
(c) solid, uninterrrupted periosteal reaction, or no periosteal response
(d) no soft tissue mass
• A lesion is .aggressive (likely to be malignant) when it shows:
(a} poorly defined nnargins
(b) moth-eaten or permeative type of bone destruction
(c) interrupted peritOsteal reaction
(d) soft tissue mass
• A lesion is liKely to represent a cartilage tumour when It shows:
(a) lobulation (endosteal scalloping)
(b) calcifications in the matrix
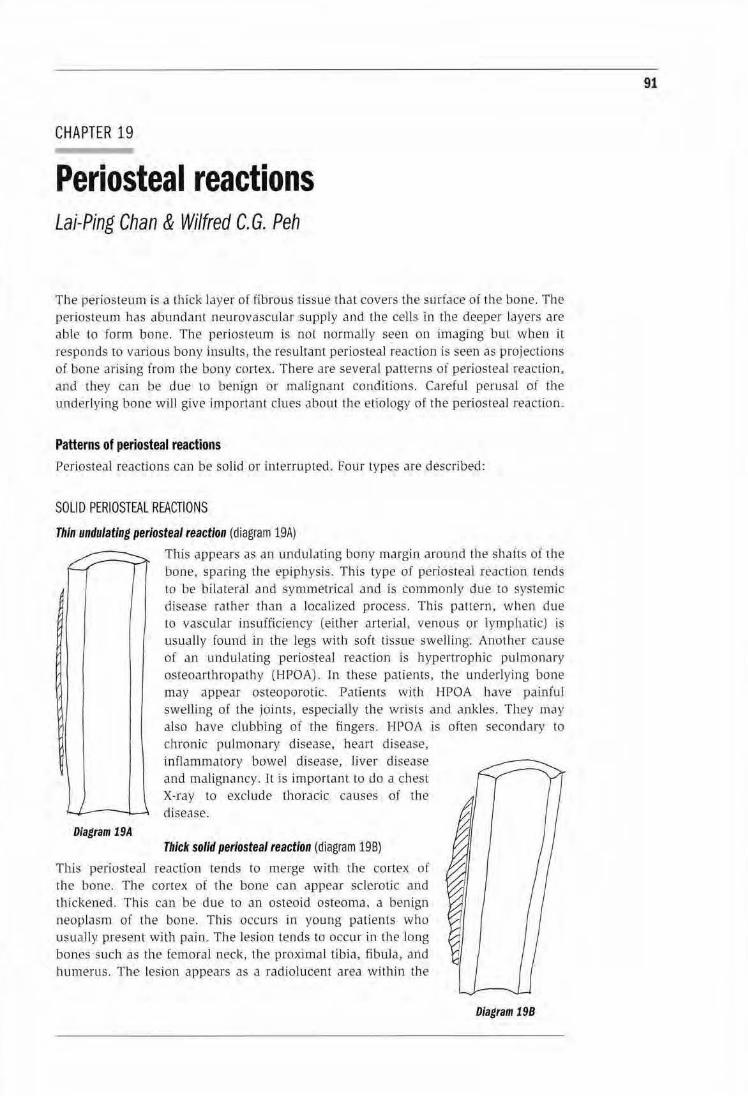
CHAPTER 19
Periosteal reactions Lai-Ping Chan & Wilfred C. G. Peh
The periosteum is a thick Jayer of fibrous tissue that covers the surface of the bone. The periosteum has abundant neurovascular supply and the cells in the deeper layers are able to form bone. The periosteum is nol normally seen on imaging but when it
responds to various bony insults, the resultant periosteal reaction is seen as projections of bone arising from the bony cortex. There Jre severaL patterns of periosteal reaction, and they can be due to benign or malignant conditions. Careful perusaL of the und erlying bone will give important clues about the etio logy of the periosteal reaction_
Patterns of periosteal reactions Periosteal reactions can be solid or interrupted. Four types are described:
SOLID PERIOSTEAL REACTIONS
Thin undulating periosteal reaction (diagram 19A)
Diagram 19A
This appears as an undultJting bony margin around the shafts of the bone, sparing the epiphysis. This type of periosteal reaction tends to be biLateral and symmetrical and is commonJy due to systemic disease rather than a localized process. This pattern, when due to vascular insufficiency (either arterial, venous or lymphatic) is usually found in the legs with soft tissue swelling. Another cause of an undulating periosteal reaction is hypertrophic pulmonary osteoarthropathy (HPOA). In these patien ts, the underlying bone may appear osteoporotic. Patients with HPOA have painful swelling of the joints, especially the wrists a nd ankles. They may also have clubbing of the fingers. HPOA is often secondary to chronic pulmonary djsease, heart disease, inflammatory bowel disease, Uver disease and malignancy. 1l :is important to do a chest X-ray to exclude thoracic causes of the disease.
Thick solid periosteal reaction (diagram 198)
This periosteal reaction tends to merge with the cortex of the bone. The cortex of the bone can appear sclerotic and thickened. This can be due to an osteoid osteoma. a benign neoplasm of the bone. This occurs in young patients who usually present- with pain . The lesion tends to occur in the long bo nes such as the femoral neck, the proximal tibia, fibuJa, and humerus. The- lesion appears as a radiolucent area within the
Diagram 198
91
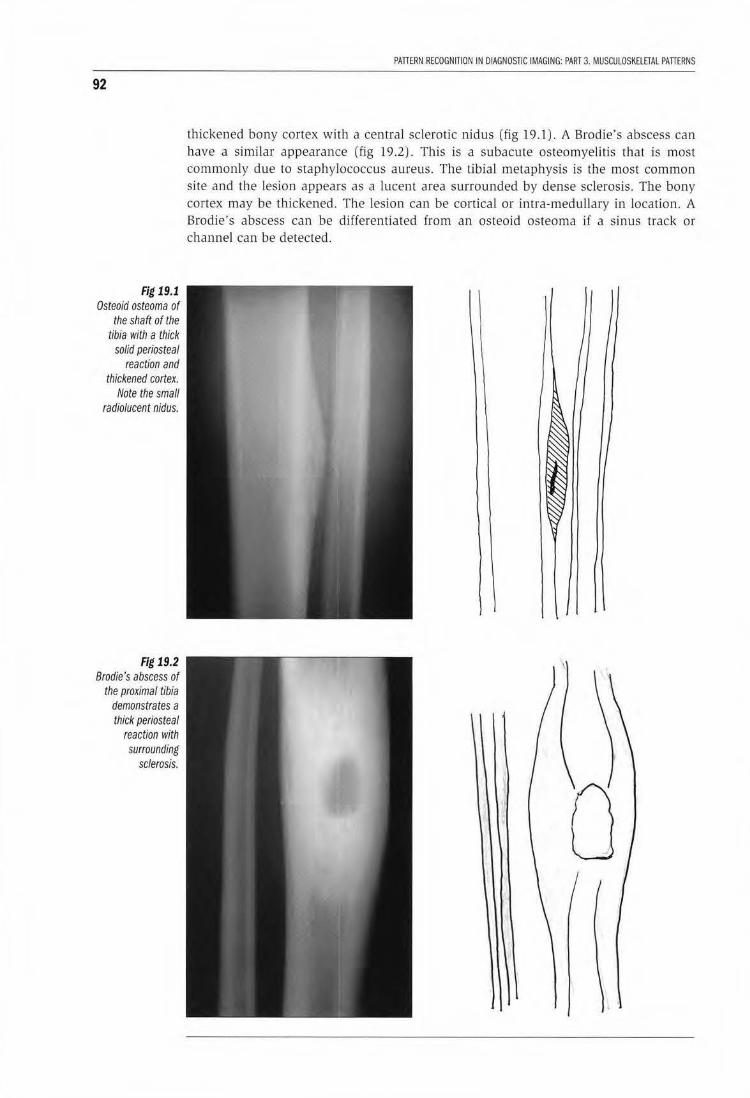
92
Fig 19.1 Osteoid osteoma of
the shaft of the tibia with a thick
solid periosteal reaction and
thickened cortex. Note the small
radiolucent nidus.
Fig 19.2 Brodie's abscess of
the proximal tibia demonstrates a thick periosteal
reaction with surrounding
sclerosis.
PATIERN RECOGNITION IN DIAGNOSTIC IMAGING: PART 3. MUSCULOSKElETAl PATIERNS
thickened bony cortex with a central sclerotic nidus (fig 19.1). A Brodie's abscess can have a similar appearance (fig 19.2). This is a subacute osteomyelitis that is most commonly due to staphylococcus aureus. The tibiaJ metaphysis is the most common site and the lesion appears as a lucent area surrounded by dense sclerosis. The bony cortex may be thickened. The lesion can be cortical or intra-medullary in location. A Brodie's abscess can be differentiated from an osteoid osteoma if a sinus track or channel can be detected.
0
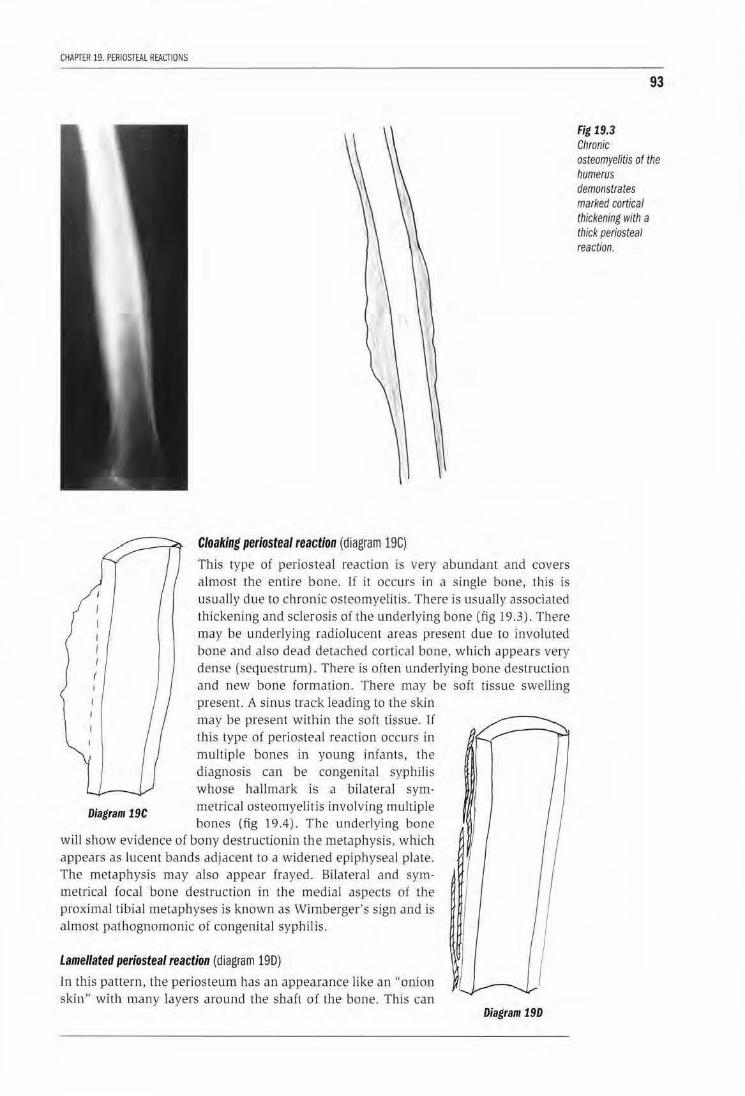
CHAPTER 19. PERIOSTEAL REACTIONS
Cloaking periosteal reaction (diagram 19C)
This type of periosteal reaction is very abundant and covers almost the enlire bone. ll it occurs in a single bone, this is usually due to chronic osteomyelitis. There is usually associated thickening and sclerosis of the underlying bone (fig 19.3). There may be underlying radiolucent areas present due to involuted bone and also dead detached cortical bone, wh ich appears very dense (sequestrum) .. There is often underlying bone destruction and new bone formation. There may be soft tissue swelling
Diagram 19C
present. A sinus track leading to the skin may be present within Lhe soft tissue. If this type of periosteal reaction occurs in muJtiple bones in young infants , the diagnosis can be congenital syphilis whose hal lmark is a bilateral symmetrical osteomyelitis involving multiple bones (fig 19.4). T he underlying bone
wi ll show evidence of bony destruclionin the metaphysis, which appears as lucent bands adjacent to a widened epiphyseal plate. The metaphysis may also appear frayed. Bilateral and symmetrical foca l bone destruction in the m1edial aspects of the proximal tibial metapbyses is known as Wirnberger's sign and is almost pathognomonic of congeni tal syph ilis.
Lamellated periosteal reaction (diagram 190)
Jn this pattern, the periosteum has an appearance like an "onion skin" with many layers a round the shaft of the bone. This can
Diagram 190
93
Fig 19.3 Chronic osteomyelitis of the humerus demonstrates marked cortical thickening with a thick periosteal reaction.
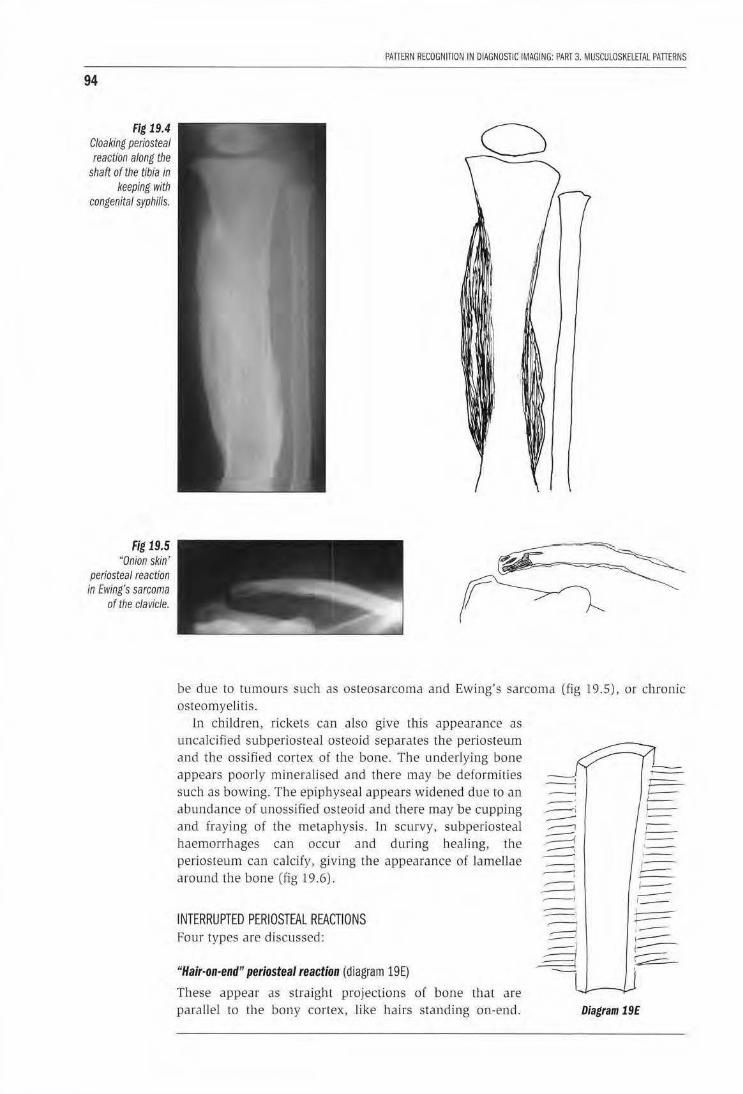
94
Fig 19.4 Cloaking periosteal reaction along the
shaft of the tiUa in keeping with
congenital syphilis.
Fig 19.5 "Onion skin'
periosteal reacuon in Ewing's sarcoma
of the clavicle.
PAffiRN RECOGNITION IN DIAGNOSTIC IMAGING: PART 3. MUSCULOSKElETAL PAffiRNS
be due to rumours such as osteosarcoma and Ewing's sarcoma osteomyelitis.
In children, rickets can also give this appearance as uncalci fied subperiosteal osteoid separates the periosteum and the ossified cortex of the bone. The underlying bone appears poorly mineralised and there may be deformities such as bowing. The epiphyseal appears widened due to an abundance of unossified osteoid and there may be cupping and fraying of the metaphysis. J n scurvy, subperiosteal haemorrhages can occur and during healing, the periosteum can calcify, giving the appearance of lamellae around the bone (fig 19 .6).
INTERRUPTED PERIOSTEAL REACTIONS Four types are discussed:
"Hair-on-end" periosteal reaction {diagram 19E)
These appear as straight projections of bone that are parallel to the bony cortex, Jjke hairs standing on-end.
(fig 19.5), or chronic
r==-t==-L---, __ -, ,.....-. , __ ~ 1--,_
Diagram 19E
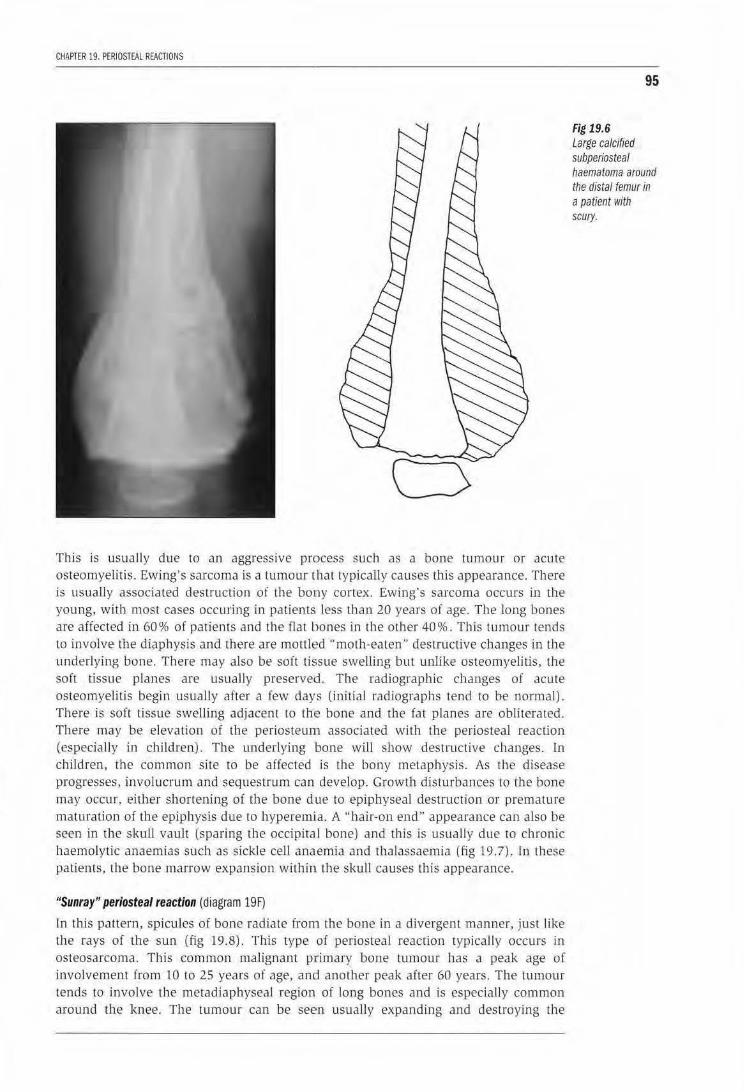
CHAPTER 19. PERIOSTEAL REACTIONS
This is usually due to an aggressive process such as a bone tumour or acute osteomyelitis. Ewing's sarcoma is a tumour that typically causes this appearance. There is usually associated destruction of the bony cortex . Ewing's sarcoma occurs in the young, with most cases occuring in patients, less than 20 years of age. The long bones are affected in 60% of patients and the flat bones in the other 40%. This tumour tends to involve the diaphysis and there are mottled ··moth-eaten'' destructive changes in the underlying bone. There may also be soft tissue swelling but unJjke osteomyelitis, the soft tissue planes are usually preserved. The radiographic changes of acute osteomyelitis begi,n usually after a few days (initial radiographs tend to be normal). There is so ft tissue swelling adjacent to th•e bone and U1e fat planes are ob literated. There may be eleva tion of tbe periosteum associated with Lne periosteal reaction (especially in children). The underlying bone will show destructive changes. In children, rhe common site to be affected is the bony metaphysis. As the disease progresses, involucrum and sequestrum can develop. Growth disturbances to the bone may occur. either shortening of the bone due to epiphyseal destruction or premature maturation of the epiphysis due to hyperemita. A ''hair-on end" appearance can also be seen in the skull vault (sparing the occipital bone) and this is usually due to chronic haemolytic anaemias such as sickle cell anaemia and thalassaemia (fig 19.7). ln lhese patients, the bone marrow expansion within the skull causes this appearaJlce.
"Sunray" periosteal reaction (diagram 19F)
ln this pattern, spicules of bone radiate from the bone in a divergent manner, just like the rays of the sun (fig 19.8). This type of periosteal reaction typically occurs in osteosarcoma. Th is common malignant p;rimary bone tumour has a peak age of involvement from 10 to 25 years of age, and another peak after 60 years. The tumour tends to involve tJ1e metadiaphyseal region of long bones and is especially common around the knee. The tumour can be seen usually expanding and destroying the
95
Fig 19.6 Large calcified subperiosteal haematoma around the distal femur in a patient with scury.
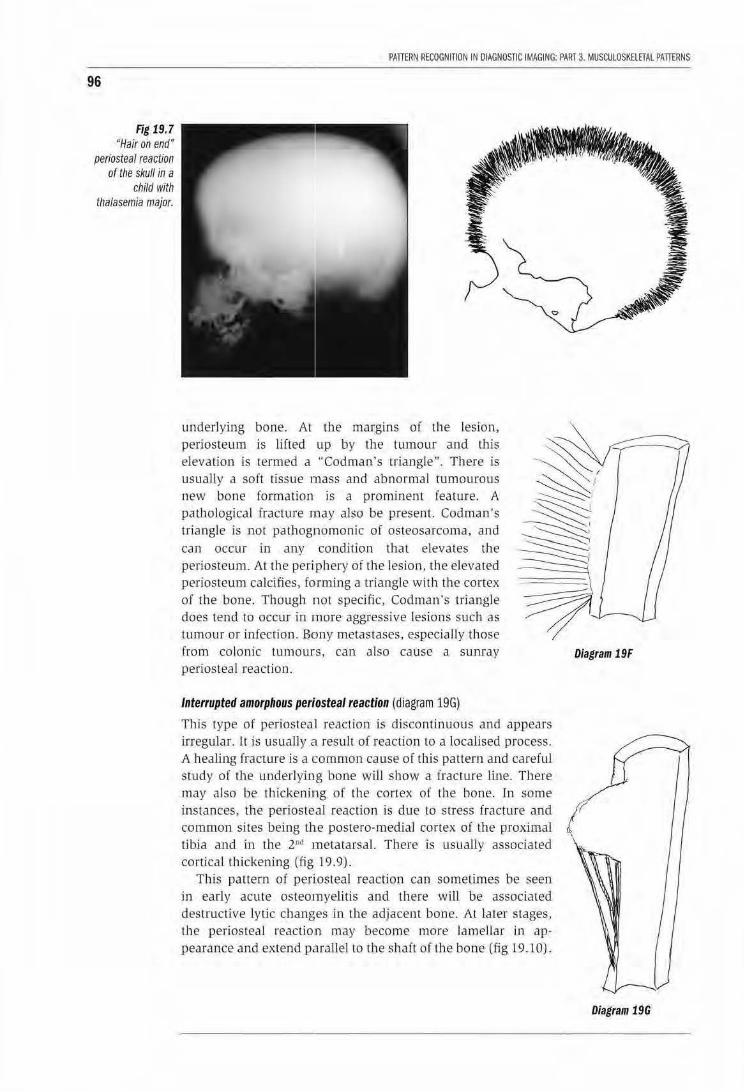
96
Fig 19.7 "Hair on end'
periosteal reaction of the skull in a
child with tha/asemia major.
PAnERN RECOGNITION IN DIAGNOSTIC IMAGING: PART 3. MUSCULOSKELETAl PATTERNS
underJyjng bone. At the margins of the lesion, periosteum is lifted up by the tumour and this elevation is termed a ··codman's triangle. There is usually a soft tissue mass and abnormal tumourous new bone forma tion is a prominent feature. A pathological fracture nnay also be present. Cadman's triangle is not pathognomonic of osteosarcoma, and
can occur in any condition th at elevates the periostewn. At the periphery of the lesion. the elevated periosteum calcifies, forming a triangle with the cortex of the bone. Though not specific, Cadman ·s triangle does tend ro occur in more aggressive lesions such as tumour or infecrion. Bony merastases, especially those from colonic tumours, can also ca use a slliliay periosteal reaction.
Diagram 19F
Interrupted amorphous periosteal reaction (diagram 19G)
This type of periosteal reaction is discontinuous and appears irregular. [t is usually a resu lt of reaction to a localised process.
A healing fracture is a common cause of this pattern and carefuJ swdy of rhe underlying bone will show a fracture line. There may also be tbickening of the cortex of lhe bone. ln some instances, the periosteal reaction is due to stress fracture and I common sites being the postero-medial cortex of Lhe proximaJ tibia and in the. 2"d metatarsal. There is usually associated cortical fhjckening (fig 19. 9).
This pattern of peri.osteal reaction can sometimes be seen in early acute osteomyelitis and there will be associated destructive lytic changes in the adjacent bone. At later s tages, tJ1e periosteal reaction may become more lamellar in appearance and extend parallel to the sha(t of the bone (fig 19.10).
Diagram 19G
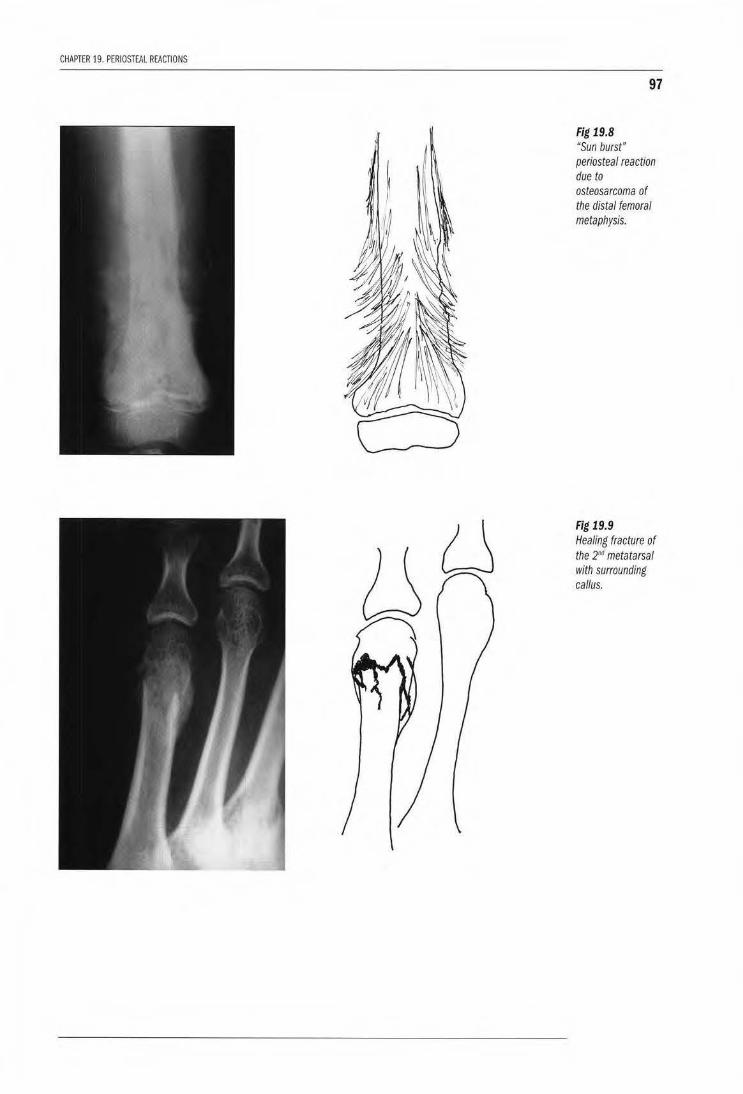
CHAPTER 19. PERIOSTEAL REACTIONS
97
Fig 19.8 "Sun burst" periosteal reaction due to osteosarcoma of the distal femoral metaphysis.
Fig 19.9 Healing fracture of the 2"d metatarsal with surrounding callus.
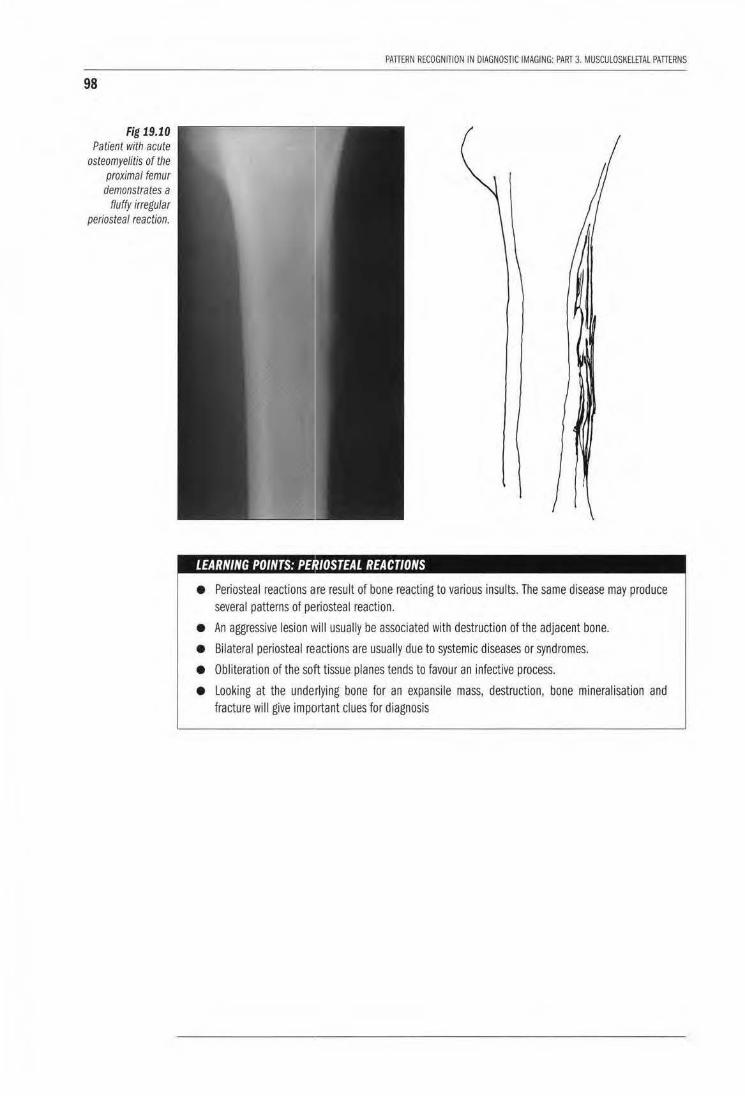
98
Fig 19.10 Patient with acute
osteomyelitis of the proximal femur demonstrates a
fluffy irregular periosteal reaction.
PAllERN RECOGNITION IN DIAGNOSTIC IMAGING: PART 3. MUSCUlOSKELETAL PATIERNS
• , ' I /OSTEAL REACTIONS
• Periosteal reactions are result of bone reacting to various insults. The same disease may produce several patterns of pe!riosteal reaction.
• An aggressive lesion wil l usually be associated with destruction of the adjacent bone.
• Bilateral periosteal reactions are usually due to systemic diseases or syndromes.
• Obliteration of the solft tissue planes tends to favour an infective process.
• Looking at the underlying bone for an expansile mass, destruction, bone mineralisation and fracture will give important clues for diagnosis
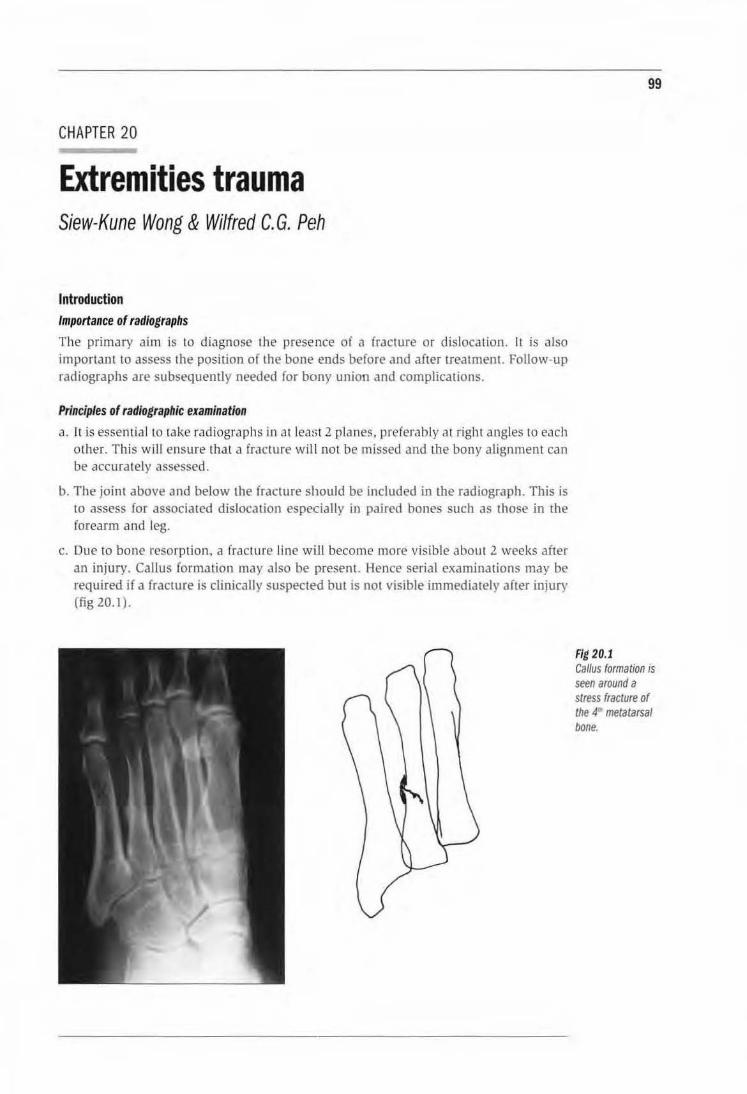
CHAPTER 20
Extremities trauma Siew-Kune Wong & Wilfred C. G. Peh
Introduction Importance of radiographs
The primary aim is to diagnose the presence of a frJcture or dislocation. It is also important to assess the position of the bone ends before and after treatment. Follow-up radiographs are subsequently needed for bony union and complications.
Principles of radiographic examination
a. It is essential to take radiographs in at least 2 planes, preferably at right angles to each other. This will ensure that a fracture will not be missed and the bony alignment can be accurately assessed.
b. The joint above and below the fracture should be included in the radiograph. This is to assess for associated dislocation especially in paired bones such as Lhose in rhe forearm and leg.
c. Due to bone resorption, a fracture line wii ll become more visible about 2 weeks after an injury. Callus formation may also be present. Hence serial examinations may be required if a fracture is clinically suspected but is not visible immediately after injury (fig 20.1 ).
99
Fig 20.1 Callus formation is seen around a stress fracture of the 4,. metatarsal bone.
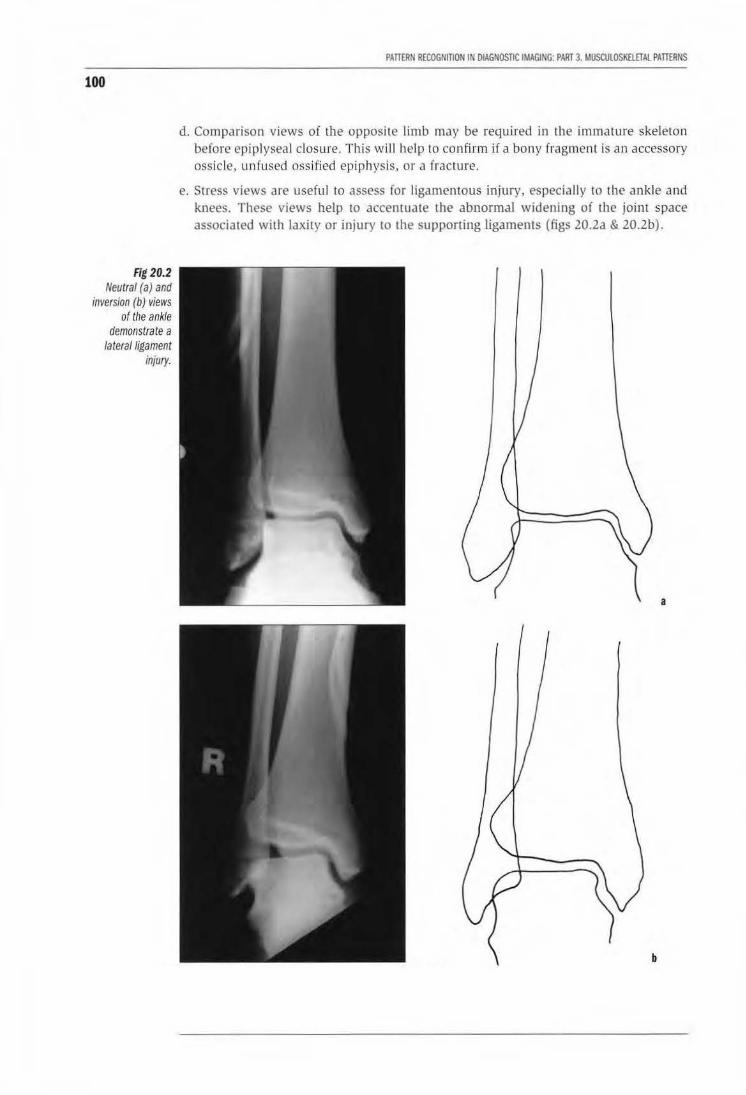
100
Fig 20.2 Neutral (a) and
inversion (b) views of the ankle
demonstrate a latera/ligament
injury.
PAnERN RECOGNffiON IN DIAGNOSTIC IMAGING: PART 3. MUSCULOSK£lETAl PATIERNS
d. Comparison views of the opposite limb may be required in the immaLUre skeleton before epiplyseal closure. This will help to confirm if a bony fragment is an accessory ossicle. unfused ossified epiphysis. or a fracture.
e. Stress views are useful to assess for liga mentous injury, especially to the ankle and knees. These views help ro accen tuate the abnormal widening of rhe joint space associated with laxity or injury to the supporting ligaments (figs 20.2a & 20.2b).
a
b
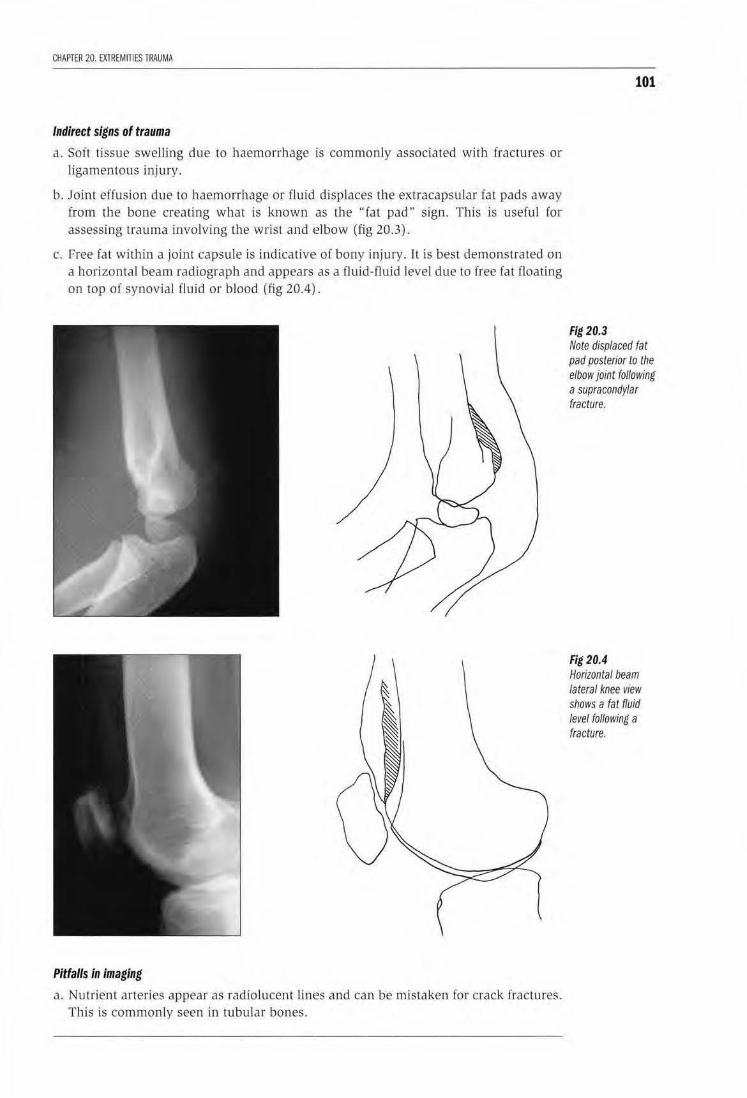
CHAPTER 20. EXlREMITIES TRAUMA
Indirect signs of trauma
a. Soft tissue swelling due to haemorrhage is commonly associated with fractures or ligamentous injury.
b. Joint effusion due to haemorrhage or flujd displaces the extracapsular fat pads away from the bone creating what is known as the "fat pad" sign. This is usefu l for assessing trauma involving the wrist and elbow (fig 20 .3).
c. Free fat within a joint capsule is indicative of bony injury. It is best demonstrated on a horizontal beam radiograph and appears as a fluid-fluid level due to free fat floating on top of synovial fluid or blood (fig 20.4).
Pitfalls in imaging
a. Nutrient arteries appear as radiolucent l in(~S and can be mistaken for crack fractures. Thjs is commonly seen in tubular bones.
101
Fig 20.3 Note displaced fat pad posterior to the elbow joint following a supracondylar fracture.
Fig 20.4 Horizontal beam lateral knee view shows a fat fluid level following a fracture.
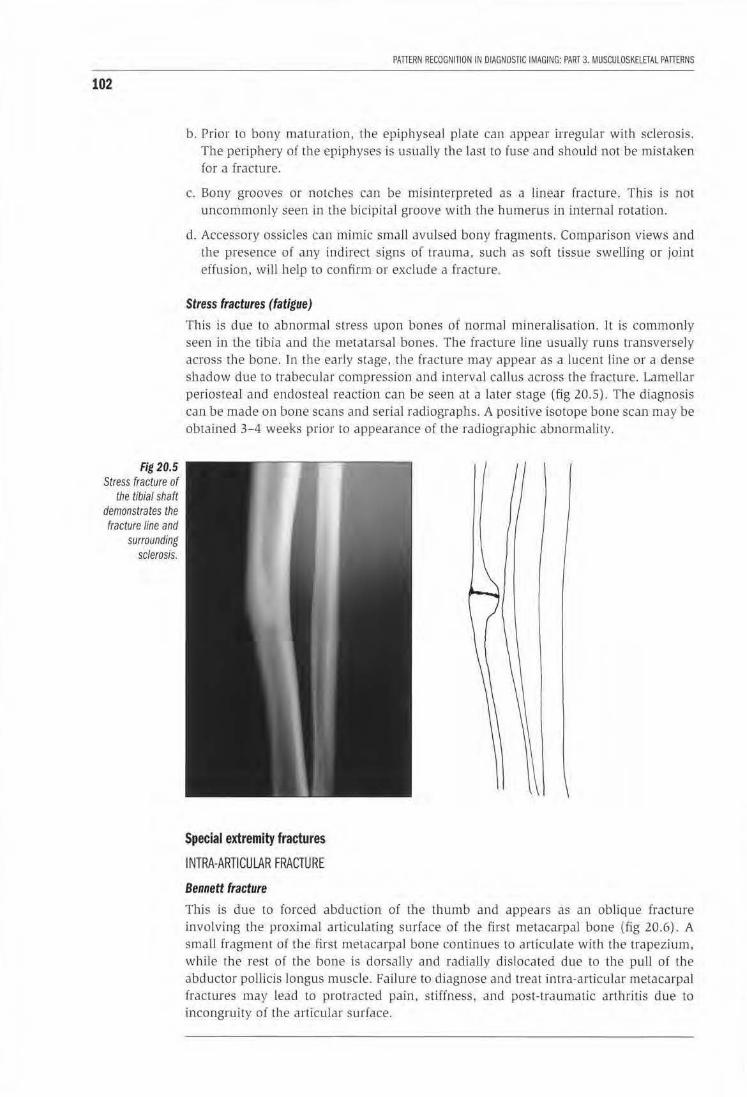
102
Fig 20.5 Stress fracture of
the tibial shaft demonstrates the fracture line and
surrounding sclerosis.
PATTERN RECOGNITION IN DIAGNOSTIC IMAGING: PART 3. MUSCUlOSKELETAL PATTERNS
b. Prior to bony maturation, the epiphyseal plate can appear irregular with sclerosis. The periphery of the epiphyses is usuaJiy the last to fuse and shou ld not be mis taken for a fracture.
c. Bony grooves or notches can be misinterpreted as a linear fracture. This is not uncommonly seen in the bicipital groove with the humerus in internal rotation.
d. Accessory ossicles can mimic smaU avulsed bony fragments. Comparison views and the presence of any indirect signs of trauma, such as soft tissue sweiJing or joint effusion, will help to confirm or exclude a fracture .
Stress fractures (fatigue)
This is due to abnormal stress upon bones of normal mineralisation. It is commonly seen in Lhe tibia and the metatarsal bones. The fracture line usually runs transversely across rhe bone. ln the early stage, rhe fracture may appear as a lucent line or a dense shadow due to trabecular compression and interval callus across the fracture. Lamellar periosteaJ and endosteal reaction can be seen at a later stage (fig 20.5). The diagnosis can be made on bone scans and serial radiographs. A positive isotope bone scan may be oblained 3-4 weeks prior to appearance of the radiographic abnormality.
Special extremity fractures
INTRA-ARTICULAR FRACTURE
Bennett fracture
This is due to forced abduction of the thumb and appears as an oblique fracrure involving the proximal articulating surface of the first metacarpal bone (fig 20.6). A smaU fragment of the first metacarpal bone continues to articulate with the trapezium. while the rest of the bone is dorsally and radially dislocated due to the pull of the abductor pollicis longus muscle. Failure to diagnose and treat intra·articular metacarpal fractures may lead to protracted pain. stiffness. and post- traumatic arthritis due to incongruity of lhe articular surface.
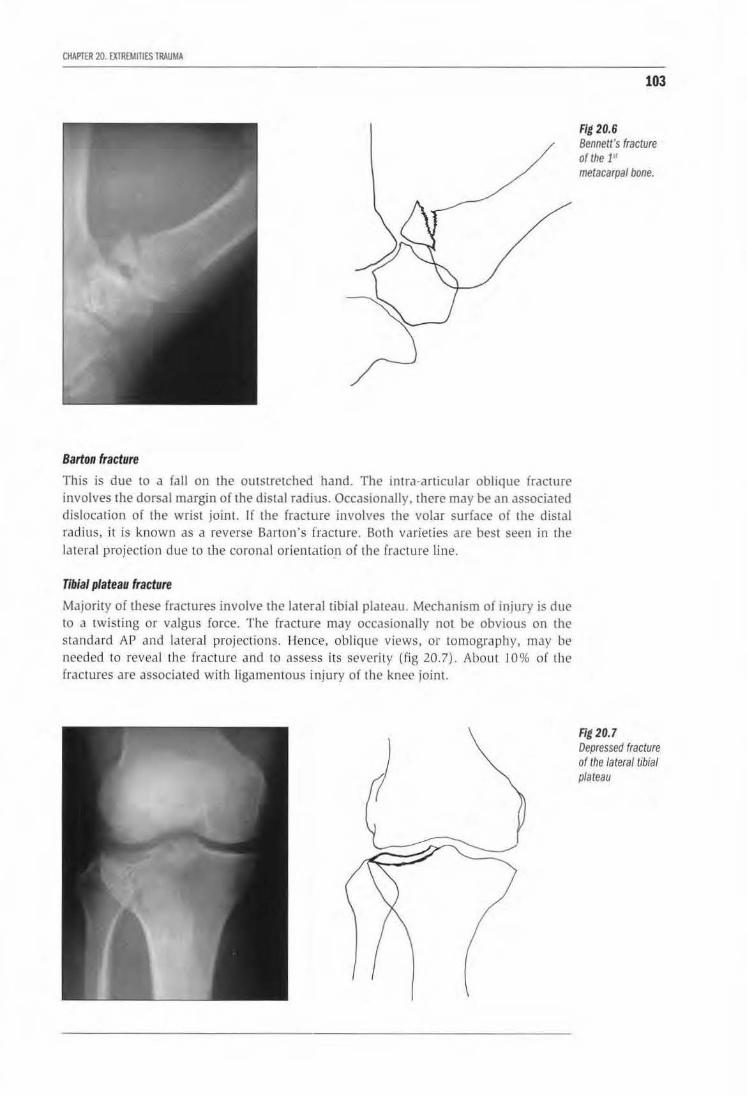
CHAPTER 20. EXTREMinES TRAUMA
Barton fracture
This is due to a fall on the outstretched hand. The irma-articular oblique fracture involves the dorsal margin of the distal radius. Occasionally, there may be an associated dislocation of the wrist joinl. If the fracture involves the volar surface of the distal rad ius, it is known as a reverse Barton's fracture. Both varieties are best seen in the lateral projection due to Lhe coronal orientation of the fracture line.
Tibial plateau fracture
Majority of these fractures involve the lateral tibial plateau. Mechanism of injury is due to a twisting or valgus force. The fracture may occasionally not be obvious on the standa rd AP and la teral projections. Hence, oblique views, or tomography, may be needed to reveal the fracture and to assess its severity {fig 20.7). Abou t 10% of the fractures are associated with ligamentous injury of the knee joint.
103
Fig 20.6 Bennett's fracture of the 1" metacarpal bone.
Fig 20.7 Depressed fracture of the lateral tibial plateau
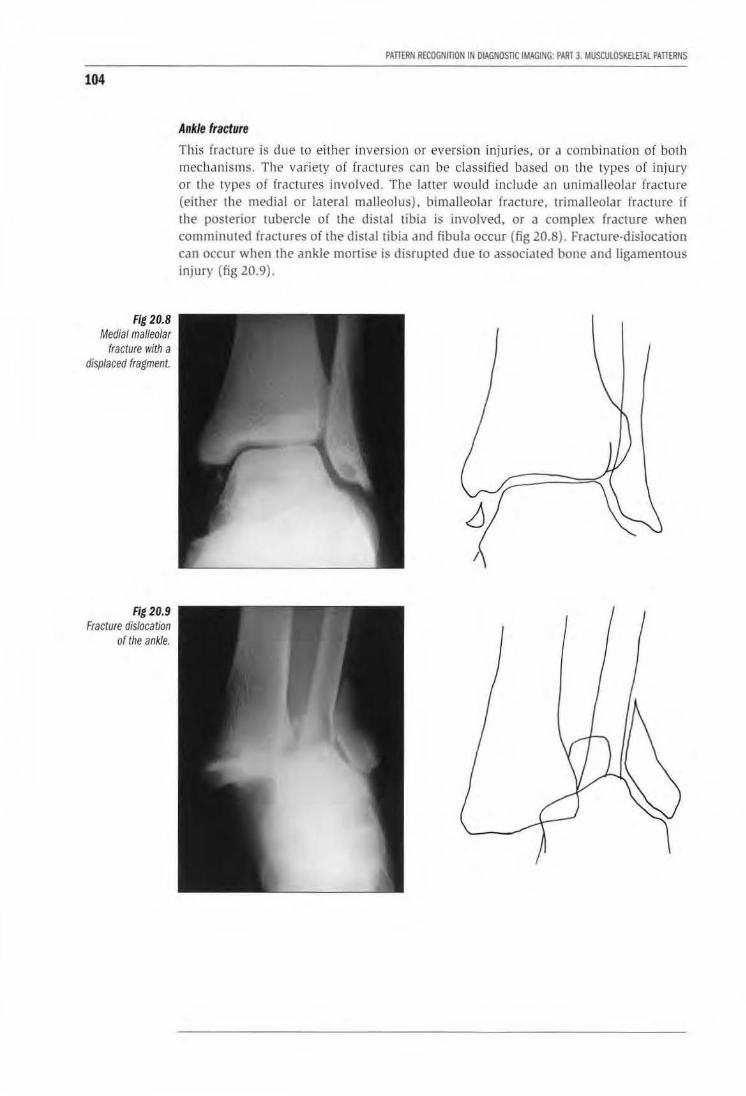
104
Fig 20.8 Medial malleolar
fracture with a displaced fragment.
Fig20.9 Fracture dislocation
of the ankle.
PAITERN RECOGNITION IN OIAGNOSnC IMAGING: PART 3. MUSCUlOSKElfTAL PAillRNS
Ankle fracture
This fracture is due to either inversion or eversion injuries, or a combination of both mechanisms. The variety of fractures can be classified based on the types of injury or the types of (ractures involved. The latter would include an unimalleolar fractu re (either the medial or lateral malleolus), bimalleolar fracture, trimalleolar fracture if the posterior tubercle of Lhe distal tibia is involved, or a complex fracture when comminuted (ractures oi the distal tibia and fibula occur (fig 20.8). Fracture-dislocation can occur when the ankle mortise is disrupted due to associated bone and ligamemous injury (fig 20.9).
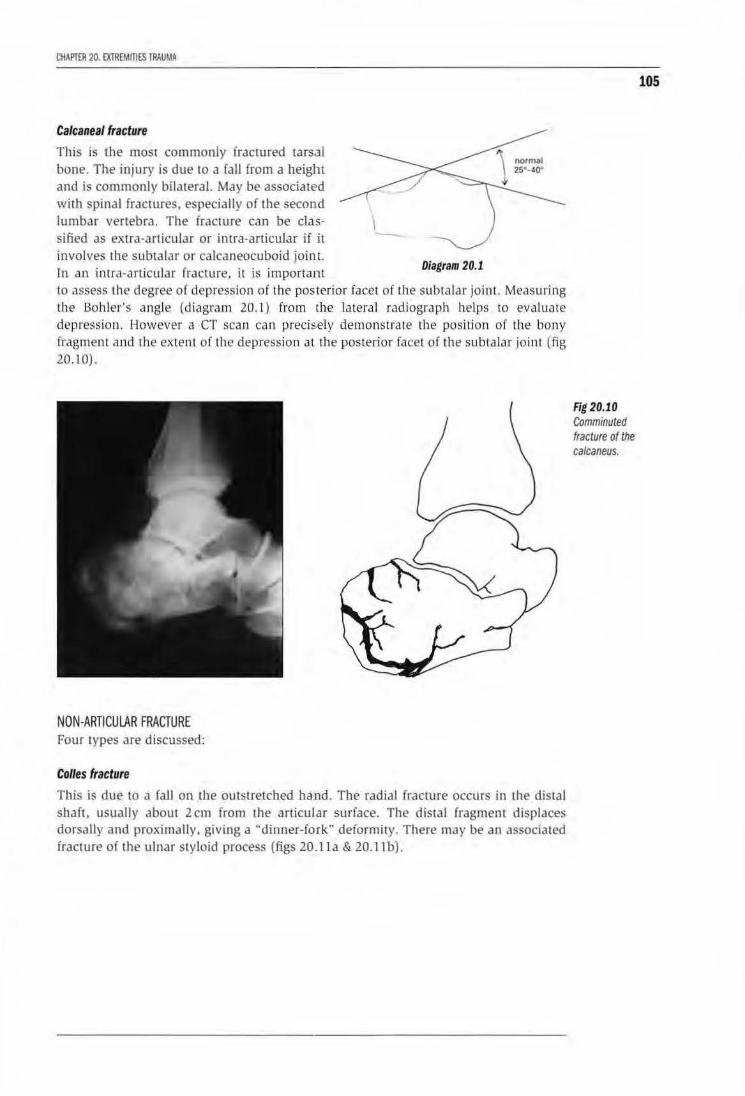
CHAI'IER 20. EXTREMITIES IRAUMA
Calcaneal fracture
This is the most commonly fractu red tarsal bone. The injury is due to a fall irom a height and is commonly bilatera l. May be associated wi1h spinal fractures. especially of the second lumbar vertebra. The fracture can be classified as extra-articu lar or intra-articular if it involves the subralar or calcaneocuboid joint. In an imra-articular fracture, it is important
-Diagram 20.1
to ttssess the degree of depression of the posterior facet of the subtalar joint. Measuring the Bohler's angle (diagram 20.1) from the lateral rad iograp h helps to evaluate depression. However a CT scan can precisely demonstrate the position of the bony fragment and the extent of the depression at the posterior facet of the subtalar joint (fig 20.10).
NON-ARTICULAR FRACTURE Four types are discussed:
Col/es fracture
This is due to a fall on the outstretched ha nd. Tbe radial fracLUre occurs in the distal shaft, usually about 2 em from the articular surface. The dista l fragment displaces dorsally and proximally. giving a ''dinner-fork" deformity. There may be an associated fracture of the ulnar styloid process (figs 20.lla & 20.11 b).
Fig 20.10 Comminuted fracture of the calcaneus.
105

106
Figs 20.11a & 20.11b
Colles fracture of the wrist in AP and
lateral views.
PAnERN RECOGtlmON ltl DIAGNOSTIC IMAGING· PART 3. MUSCUlDSKillTAL PATTERNS
a
b
Smith's fracture
This is usually due to a fall on the back of the hand or a direct blow 10 1he dorsum of the hand. The distal fragment is displaced ventrally with radial devialion of the hand giving a ·•garden spade" deformity (fig 20.l2).
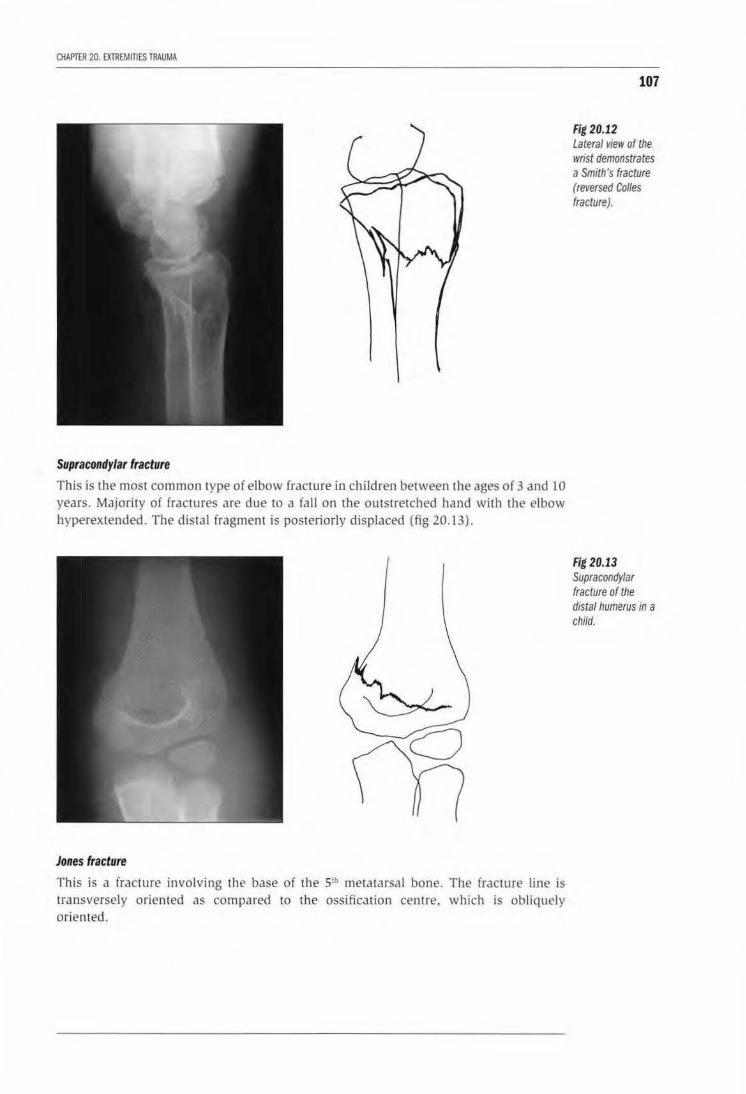
CHAPTER 20. EXTREMITIES TRAUMA
Supracondylar fracture
This is the most common type of elbow fracture in children between the ages of 3 and 10 years. Majority of fractures are due to a fall on the outstretched hand with the elbow hyperextended. The distal fragment is posteriorly displaced (fig 20.13).
Jones fracture
This is a fracture involving the base of the Slh metatarsal bone. The fracture line is transversely oriented as compared to the ossification centre, which is obliquely oriented.
107
Fig 20.12 Lateral view of the wrist demonstrates a Smith's fracture (reversed Colles fracture).
Fig 20.13 Supracondylar fracture of the distal humerus in a child.
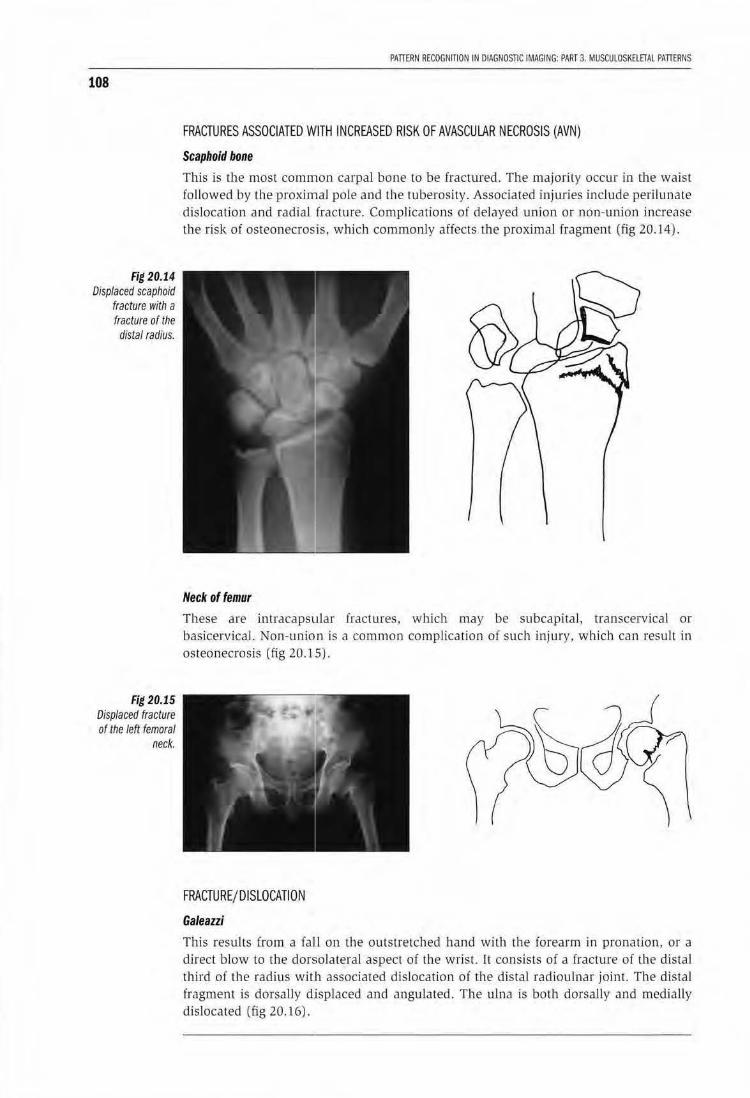
108
Fig 20.14 Displaced scaphoid
fracture with a fracture of the distal radius.
Fig 20.15 Displaced fracture of the left femoral
neck.
PATIERN RECOGNITION !N DIAGNOSTIC IMAGING: PART 3. MUSCULOSKElETAL PATIERNS
FRACTURES ASSOCIATED WITH INCREASED RISK OF AVASCUlAR NECROSIS (AVN)
Scaphoid bone
This is the most common carpal bone to be fractured. The majorily occur in lhe waist followed by the proximal pole and the tuberosity. Associated injuries include perilunate dislocation and radial fracture. Complications of delayed union or non-union increase the risk of osteonecrosis. which commonly affects the proximal fragment (Eig 20. l 4).
Neck of femur
These are intracapsular fractures. which may be subcapital, transcervical or basicervical. Non-union is a common complication of such injury, which can result in osteonecrosis (fig 20.15).
FRACTURE/ DISLOCATION
Galeazzi
This results from a faLl on the outstretched hand wiLh the forearm in pronation, or a direct blow to the dorsolateral aspect of the wrist. It consists of a fracture of the distal third of the radius with associated dislocation of the distal radioulnar joint. The distal fragment is dorsally d.isplaced and angulated. The ulna is both dorsally and medially dislocated (fig 20.16).
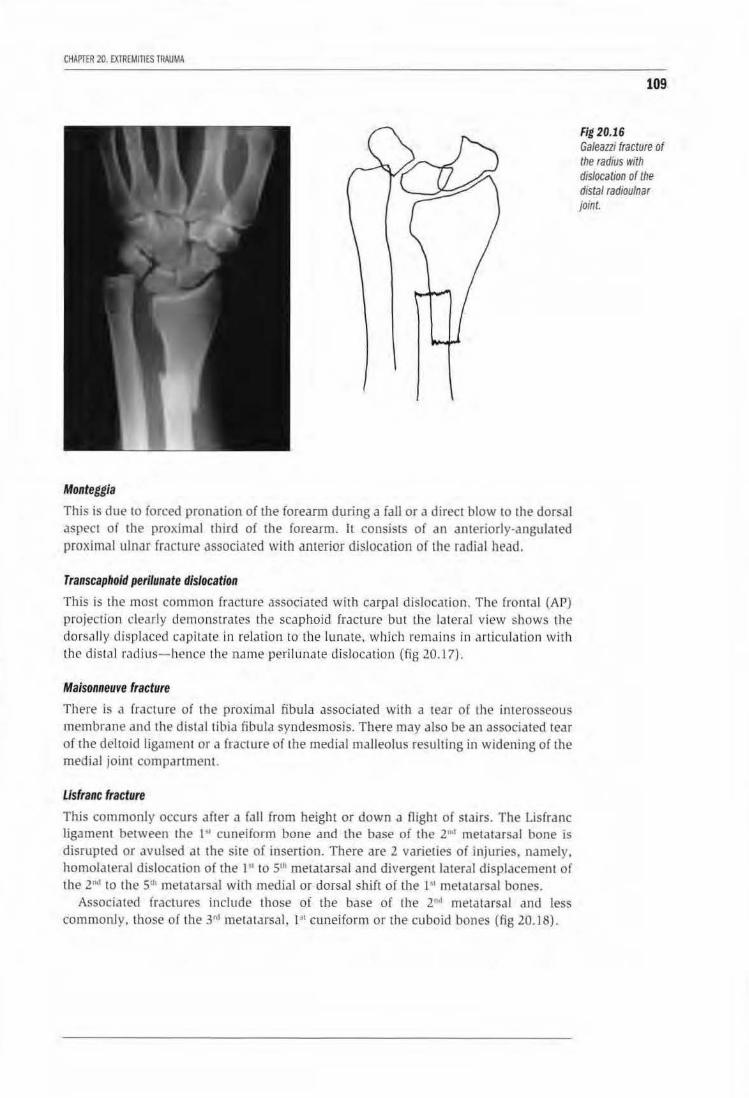
CHAPTER 20. EXTREMinES TRAUMA
Monteggia
This is due to forced pronation of the forearm during a faJI or a direct blow to the dorsal aspect of the proximal third of the forearm. lL consists of an anteriorly-angulated proximal ulnar fracture associated wilb anterior dislocation of the radial head.
Transcaphoid perilunate dislocation
This is the most common fracture associated with carpal dislocation . The frontal (AP) projection clearly demonstrates the scaphoid fracture but Lhe lateral view shows the dorsally displaced capitate in relation to the lu nate. which remains in articulation with the distal radius- hence the name perilunate dislocation (fig 20.17}.
Maisonneuve fracture
There is a fracture of the proximal fibula associated wi th a tear of the interosseous membrane and the dist.1llib ia fibula syndesmosis. There may also be an associated tear of the deltoid ligament or a fracture of the medial malleolus resulting in widening of the medial joint compartment.
Usfranc fracture
This commonly occurs after a (all from height or down a Oight of stairs. The Lisfranc ligament between the I'' cuneiform bone and the base of the 2"d metatarsal bone is disrupted or avulsed at the site of insertion. There are 2 varieties of injuries. namely, homolateral dislocation of the 1'1 to 5111 metatarsal and divergent lateral displacement of the 2"'' to the Sth metatarsal with medial or dorsal shift of the I'' metatarsal bones.
Associated fractures include those of the base of Lhe 2"'1 metatarsal and less commonly. those of the J •J metatarsal, I" cuneiform or the cuboid bones (fig 20.18).
109
Fig 20.16 Galeani fracture of the radius with dislocation of the distal radioulnar joint.
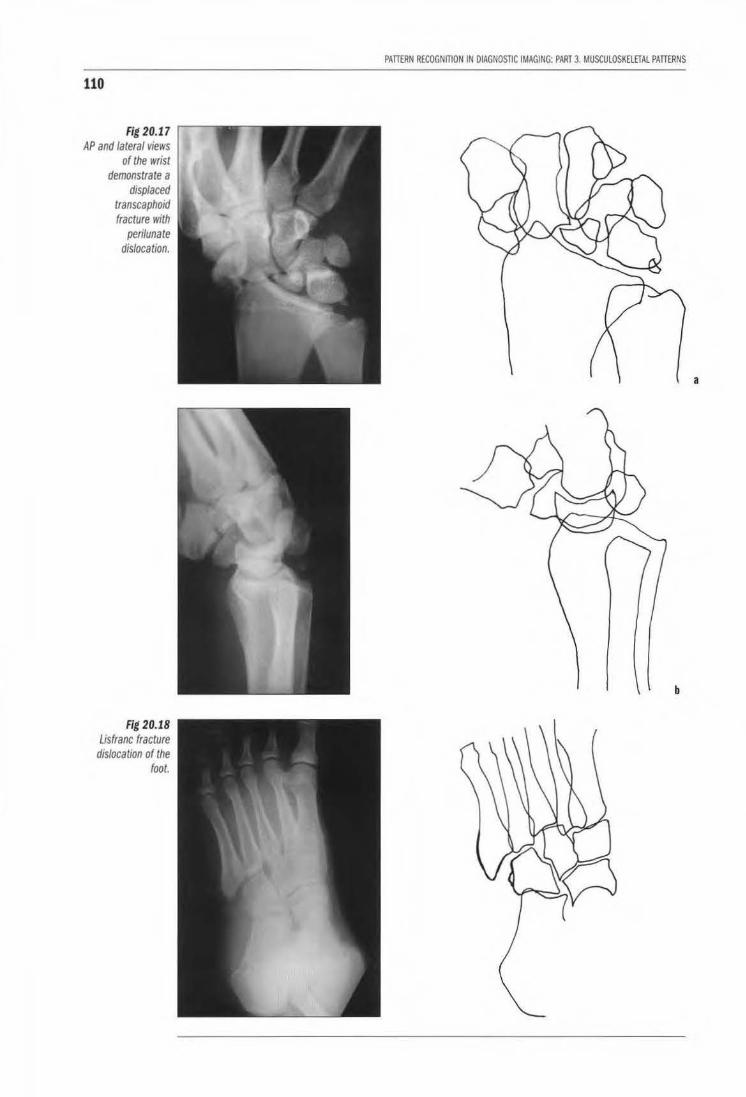
110
Fig 20.17 AP and lateral views
of the wrist demonstrate a
displaced transcaphoid fracture with
perilunate dislocation.
Fig 20.18 Usfranc fracture
dislocation of the foot.
PATI£RN RECOGNITION IN DIAGNOSTIC IMAGING: PART 3. MUSCULOSKElETAL PATIERNS
a
b
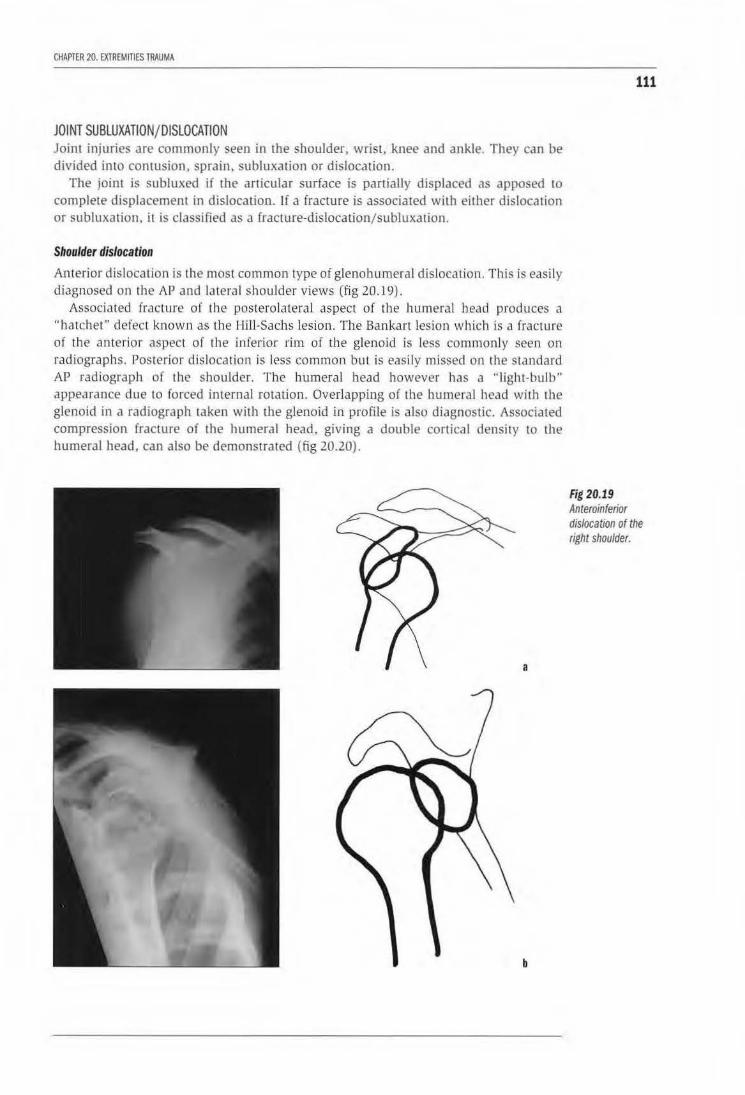
CHAPTER 20. EXTREMITIES TRAUMA
JOINT SUBLUXATION/DISLOCATION Joint injuries are commonly seen in the shoulder, wrist, knee and ankle. They can be divided into contusion, sprain, subluxation or dislocation.
The joint is subluxed if the articular surface is partially displaced as apposed to complete displacement in dislocation. If a fracture is associated with either dislocation or subluxation, it is classified as a fracture-dislocation/subluxation.
Shoulder dislocation
Anterior dislocation is the most common type of glenohumera l dislocation. This is easily diagnosed on the AP and lateral shoulder views (fig 20.19).
Associated fracture o( the postero lateral aspect of the humeral bead produces a "hatchet" defect known as the Hill-Sachs lesion. The Bankart lesion which is a fracture of the anterior aspect of the inferior rim of the glenoid is less commonly seen on radiographs. Posterior dislocation is less common but is easily missed on the standard AP radiograph of the shoulder. The humeral head however has a "'light-bulb" appearance due to forced internaJ rotation. Overlapping of the humeral head with the glenoid in a radiograph taken with the glenoid in profile is also diagnostic. Associated compression fracture of the humeral head, giving a double cortical density to the humeral head, can also be demonstrated (fig 20.20).
a
b
111
Fig 20.19 Anteroinferior dislocation of the right shoulder.
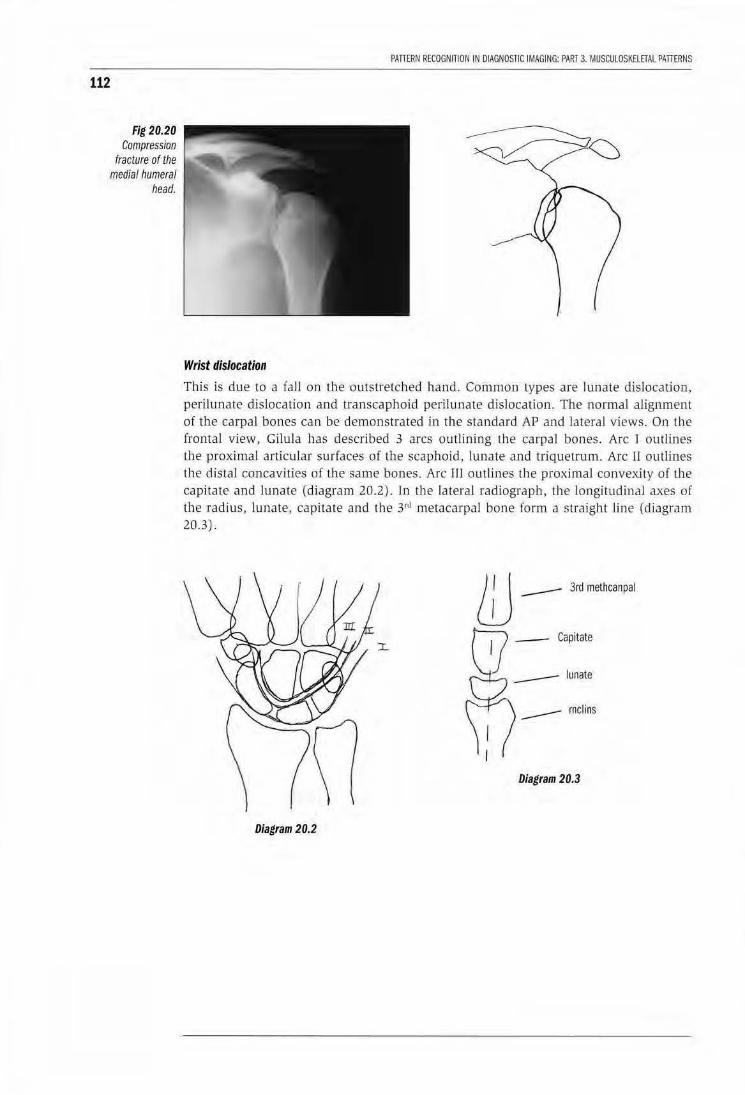
112
Fig 20.20 Compress;on
fracture of the medial humeral
head.
PATI£RN RECOGNITION IN DIAGNOSTIC IMAGING: PART 3. MUSCULOSKElETAL PATI£RNS
Wrist dislocation
This is due to a faJI on the outstretched hand. Common types are lunate dislocation. perilunate dislocation and transcaphoid peril unate dislocation. The normal alignment of the carpal bones can be demonstrated in the standard AP and lateral views. On the frontal view, Gilula has described 3 arcs outlining the carpal bones. Arc 1 outlines the proximal articular surfaces of the scaphoid, lunate and triquetrum. Arc II outlines the distal concavities of the same bones. Arc Til outli nes the proximal convexity of the capitate and lunate (diagram 20.2). In the lateral radiograph, the Jongjtudinal axes of the radius, lunate, capitate and the 3n1 metacarpal bone form a straight line (diagram 20.3) .
m --- 3RI m~hcanpal
-- rnclins
Diagram 20.3
Diagram 20.2
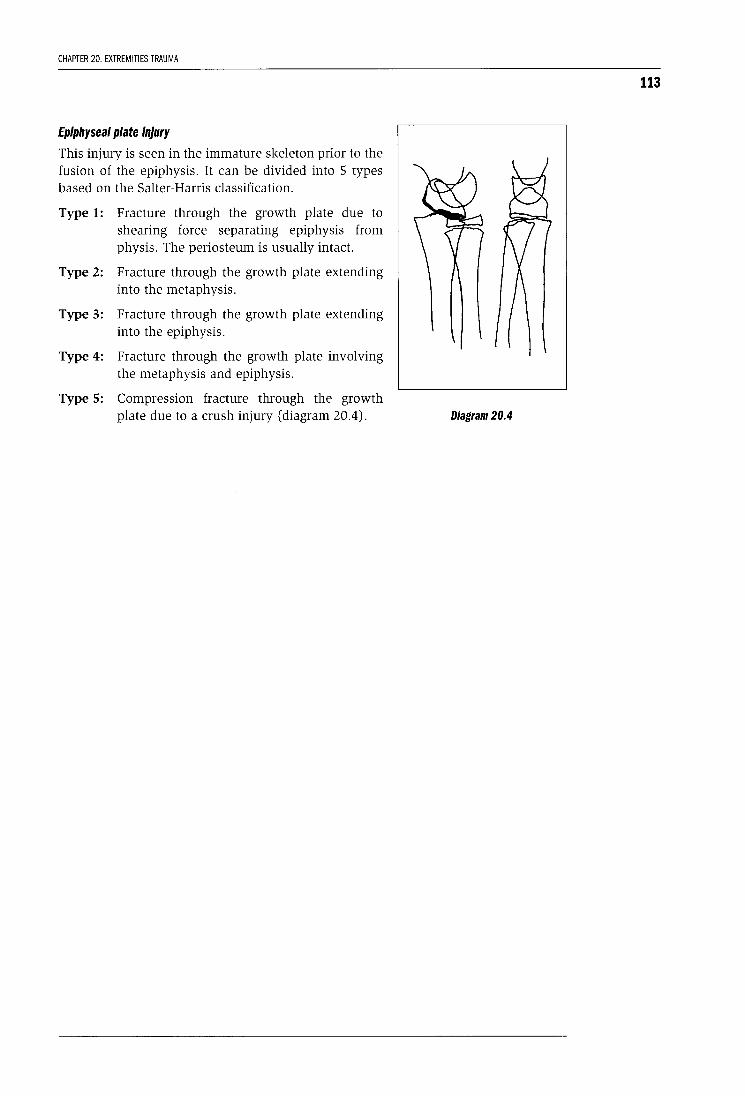
CHAPTER 20. EXTREMITIES TRAUMA
Epiphyseal plate injury
This injury is seen in the immature skeleton prior to the fusion of the epiphysis. It can be divided into 5 types based on the Salter-Harris classification.
Type 1: Fracture through the growth plate due to shearing force separating epiphysis from physis. The periosteum is usually intact.
Type 2: Fracture through the growth plate extending into the metaphysis.
Type 3: Fracture through the growth plate extending into the epiphysis.
Type 4: Fracture through the growth plate involving the metaphysis and epiphysis.
Type 5: Compression fracture through the growth plate due to a crush injury (diagram 20.4).
113
Diagram 20.4
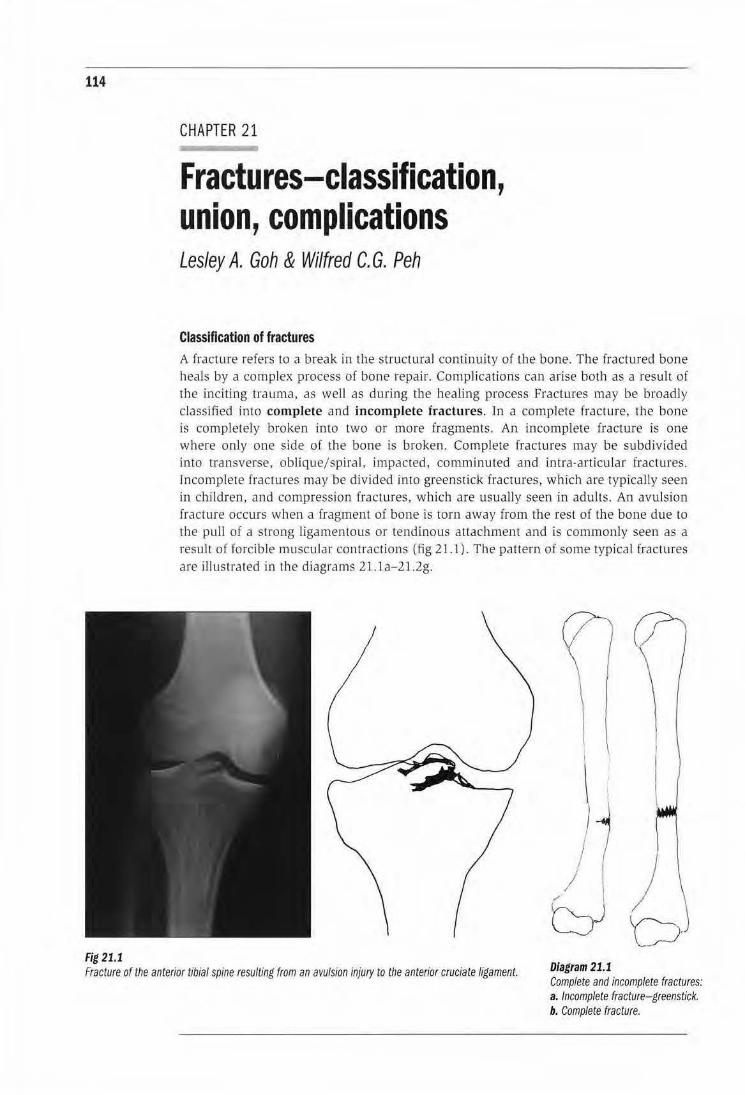
114
Fig 21.1
CHAPTER 21
Fractures-classification, union, complications Lesley A. Goh & Wilfred C. G. Peh
Classification of fractures A fracture refers to a break in the structural continuity of the bone. The fractured bone heals by a complex process of bone repair. Complications can arise both as a result of the inciting trauma, as well as during the healing process Fractures may be broadly classified into complete and incomplete fractures. Jn a complete fractme, the bone is completely broken into two or more fragments. An incomplete fracture is one where only one side of the bone is broken. Complete fractures may be subdivided into transverse, oblique/spiral, impacted, comminuted and intra-articu lar fractures. lncomplele fractures may be divided into greenstick fractures, which are typically seen in children, and compression (ractures, which are usually seen in adults. An avulsion fracture occurs when a fragment of bone is wrn away from the rest of the bone due to the pull of a strong ligamentous or tendinous attachment and is commonly seen as a result of forcible muscular contractions (fig 21.1). The pattern of some typical fractmes are illustrated in the diagrams 21 .1 a-21 .2g.
I j
/ "' l /
t::Yb Fracture of the anterior tibial spine resulting from an avulsion injury to the anterior cruciate ligament. Diagram 21.1
Complete and incomplete fractures: a. Incomplete fracture- greenstick. b. Complete fracture.
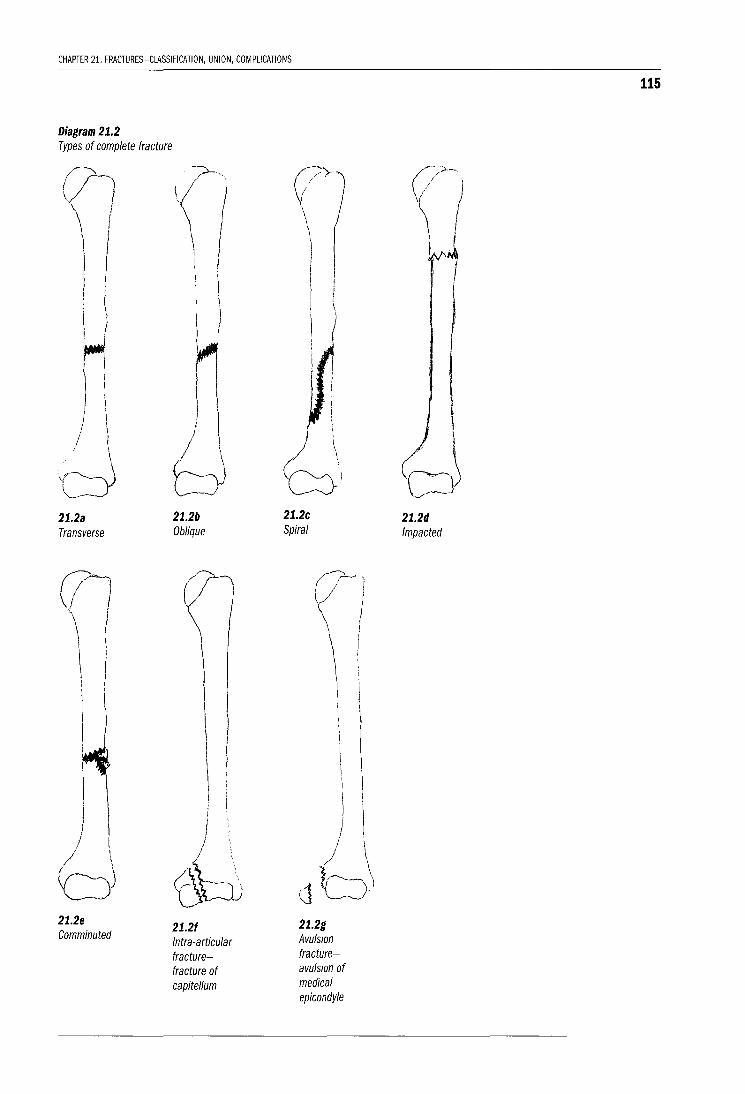
CHAPTER 21. FRACTURES-ClASSIFICATION, UNION, COMPLICATIONS
Diagram 21.2 Types of complete fracture
21.2a Transverse
\
!
d 21.2e Comminuted
21.2b Oblique
21.21 Intra-articular fracturefracture of capitellum
21.2c Spiral
21.2g Avulsion fractureavulsion of medical epicondyle
21.2d Impacted
115
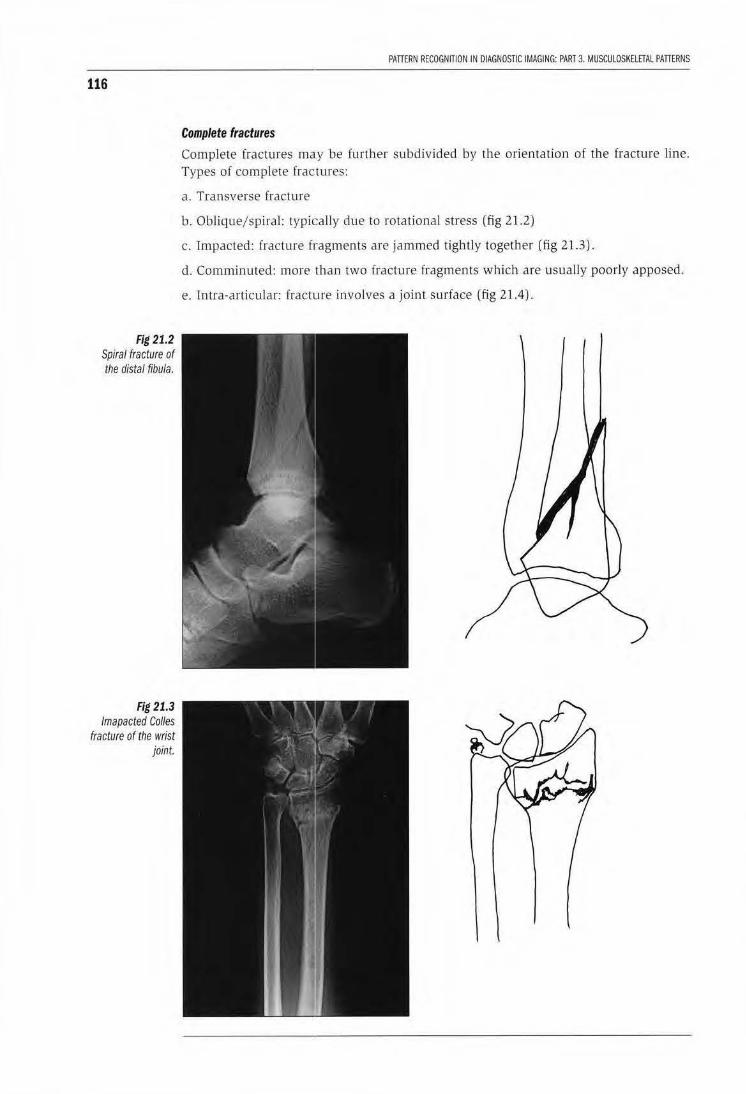
116
Fig 21.2 Spiral fracture of the distal fibula.
Fig 21.3 lmapacted Colles
fracture of the wrist joint.
PATTERN RECOGNITION IN DIAGNOSTIC IMAGING: PART 3. MUSCULOSKELETAL PATIERNS
Complete fractures
Complete fractures may be further subdivided by the orientation of the fracture line. Types of complete fractures:
a . Transverse fracture
b. Oblique/ spiral: typically due to rotational stress (fig 21.2)
c. Impacted: fracture fragments are jammed tightly together (fig 21.3).
d. Comminuted: more than two fracture fragments which are usually poorly apposed.
e. Intra-articular: fracture involves a joint surface (fig 21.4).

CHAPTUI 21. FRACTURES-ct.ASSIACAnON, UNION, COIAPUCAnONS
Incomplete fractures
The bone is incompletely divided in these fractures. Types of incomplete fractures are:
Greenstick fractures (fig 21.5) This type of fracture is commonly seen in children where the bone buckles due to its springy consistency. The periosteum is intact. These fractures are usually easy to reduce and heaJ well.
117
Fig 21.4 Intra-articular fracture of the proximal tibia extending to the lateral tibial condyle.
Fig 21.5 Greenstick fracture of the distal radius in a child. Note the fracture is incomplete and does not extend to the dorsal cortex.
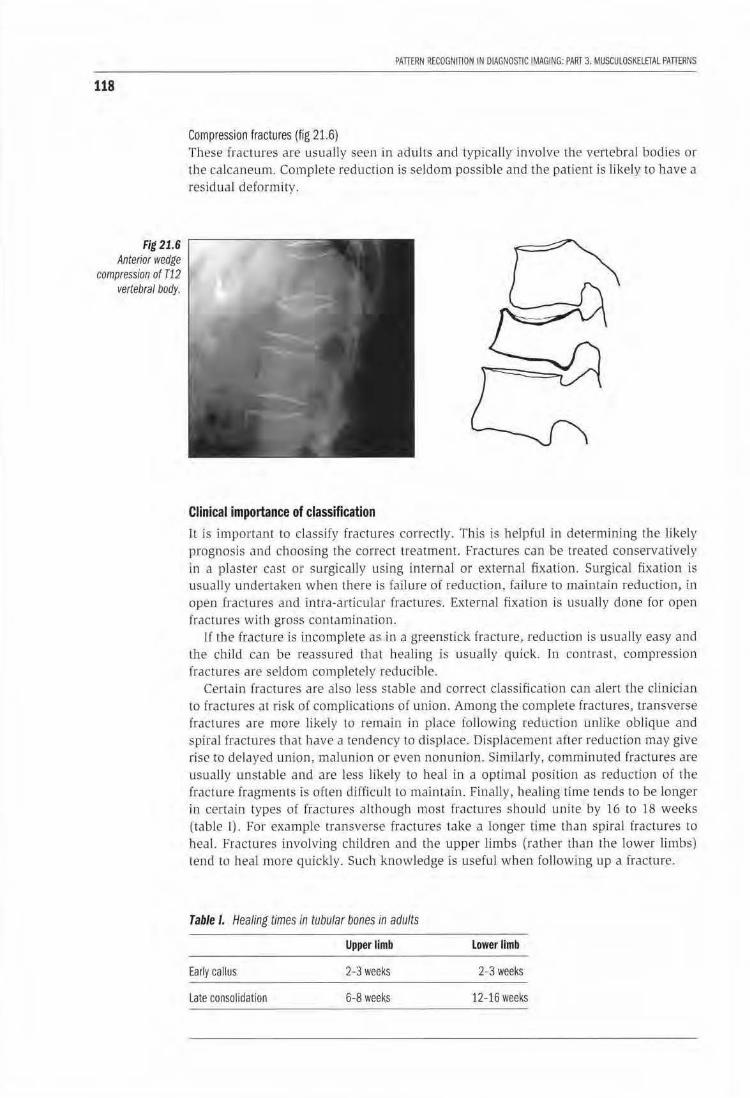
118
Fig 21.6 Anterior wedge
compression of T12 vertebral body.
PATTERN RECOGNITION IN DIAGNOSTIC IMAGING: PART 3. MUSCULOSKELETAL PATIERNS
Compression fractures (fig 21.6} These fractures are usuall y seen in adults and typfcal ly involve the vertebral boJies or the calcaneum. Complete reduction is seldom possib le and the patient is likely to have a residual deformity.
Clinical importance of classification lt is important to classify fractures correctly. This is helpful in determining the likely prognosis and choosing the correct treatment. Fractures can be treated conservatively ln a piC!ster cast or surgicall y using internal or external fixation. Surgical fixation is usually undertaken when there is failure of reduction. failure to maintain reduction, in open frac tures and intra-articular fractures. External fixation is usually done for open fractures with gross contamination.
1f lbe fracture js i_ocomplete as in a greenst ick fracture, reduction is usually easy and the ch.ild can be reassured that healing is usually quick. In contrast, compression fractures are seldom completely reducible.
Certain fractures are also less stable and correct classification can alen the clinician to fractures at risk of complications of union. Among the complete fractures, transverse fractures are more likely to remain in place following reduction unlike oblique and spiral fractures that have a tendency to displace. Displacement after reduction may give rise to delayed union, malunion or even nonunion. Simildrly, comminuted fractures are usually unstable and are less likely to heal in a optimal position as reduction of the fracture fragments ls often difficult to maintain. Finally, healing time Lends to be longer in certa in types of fractures although most fractures should unite by 16 to 18 weeks (table I). For example transverse fractures take a longer Lime than spiral fractures to heal. Fractures involving children and the upper limbs (rather than the lower limbs) tend to heal more quickly. Such knowledge is useful when following up a fracture.
Table I. Healing times in tubular bones in adults
Upper limb lower limb
Early callus 2-3 weeks 2-3 weeks
Late consolidation 6-8 weeks 12-16 weeks
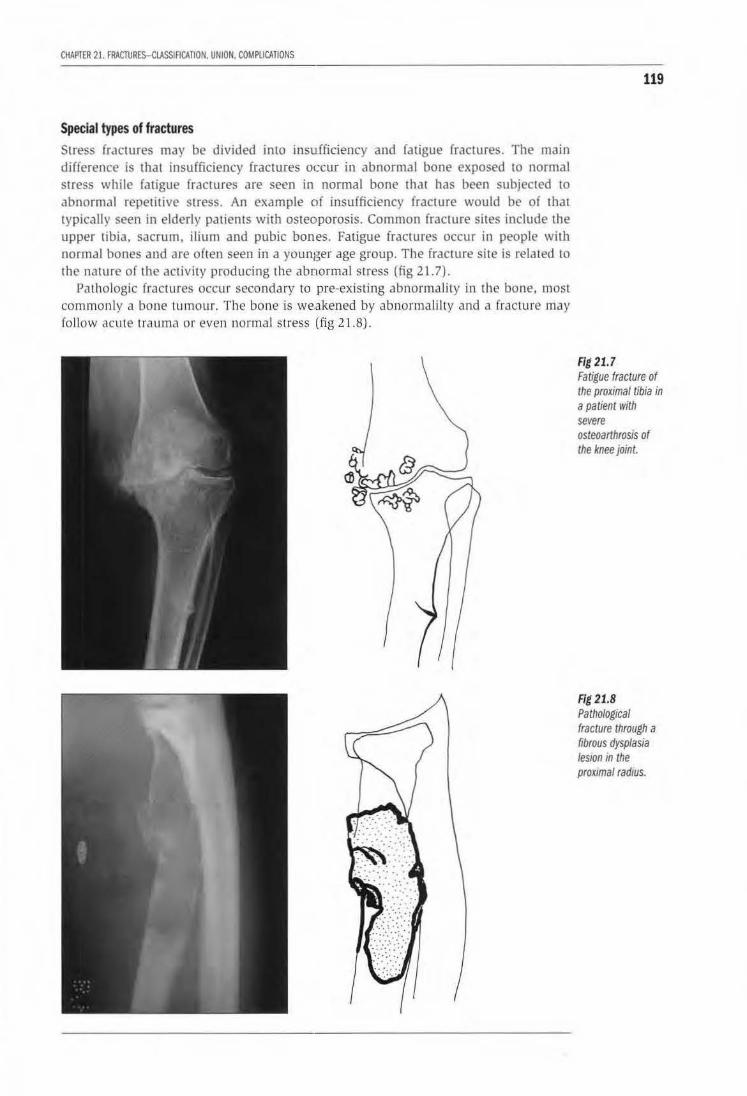
CHAPTER 21. FRACTURES-CLASSIACATION. UNION. COMPLICATIONS
Special types of fractures Stress fractures may be divided into insufficiency and fatigue fractures. The main difference is that insufficiency (racwres occur in abnormal bone exposed to normal stress while fatigue fractures are seen in normal bone that has been subjected to abnormal repetitive stress. An example of insufficiency fracture would be of that typically seen in elderly patients wilh osteoporosis. Common fracture sites include the upper tibia, sacrum, ilium and pubic bones. Fatigue fractures occur in people with normal bones and are often seen in a younger age group. The fracture site is related to the nature of the activity producing the abnormal SLress (fig 21.7).
Pathologic fractures occur secondary w pre-existing abnormality in the bone, most commonly a bone tumour. The bone is we.akened by abnormali lty and a fracture may fol low acute trauma or even normal stress (fig 21.8).
119
Fig 21.7 Fatigue fracture of the proximal tibia in a patient with severe osteoarthrosis of the knee joint.
Fig 21.8 Pathological fracture through a fibrous dysplasia les10n in the proximal radius.
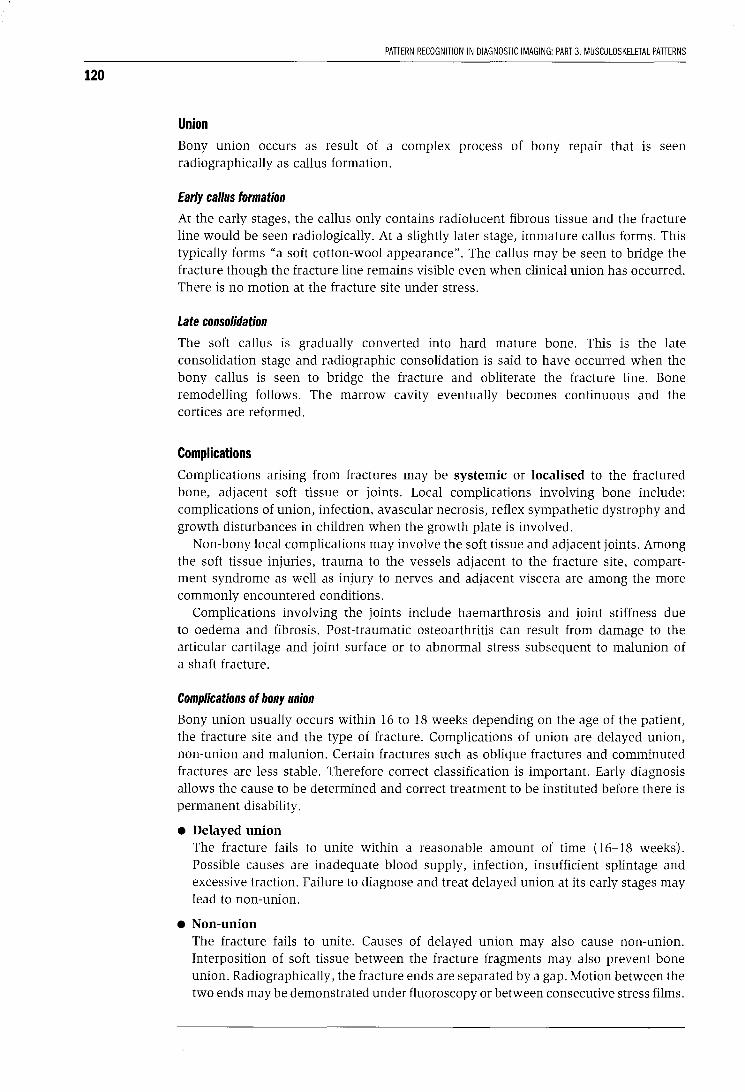
120
PATTERN RECOGNITION IN DIAGNOSTIC IMAGING: PART 3. MUSCULOSKELETAL PATTERNS
Union Bony union occurs as result of a complex process of bony repair that is seen radiographically as callus formation.
Early callus formation
At the early stages, the callus only contains radiolucent fibrous tissue and the fracture line would be seen radiologically. At a slightly later stage, immature callus forms. This typically forms "a soft cotton-wool appearance". The callus may be seen to bridge the fracture though the fracture line remains visible even when clinical union has occurred. There is no motion at the fracture site under stress.
Late consolidation
The soft callus is gradually converted into hard mature bone. This is the late consolidation stage and radiographic consolidation is said to have occurred when the bony callus is seen to bridge the fracture and obliterate the fracture line. Bone remodelling follows. The marrow cavity eventually becomes continuous and the cortices are reformed.
Complications Complications arising from fractures may be systemic or localised to the fractured bone, adjacent soft tissue or joints. Local complications involving bone include: complications of union, infection, avascular necrosis, reflex sympathetic dystrophy and growth disturbances in children when the growth plate is involved.
Non-bony local complications may involve the soft tissue and adjacent joints. Among the soft tissue injuries, trauma to the vessels adjacent to the fracture site, compartment syndrome as well as injury to nerves and adjacent viscera are among the more commonly encountered conditions.
Complications involving the joints include haemarthrosis and joint stiffness due to oedema and fibrosis. Post-traumatic osteoarthritis can result from damage to the articular cartilage and joint surface or to abnormal stress subsequent to malunion of a shaft fracture.
Complications of bony union
Bony union usually occurs within 16 to 18 weeks depending on the age of the patient, the fracture site and the type of fracture. Complications of union are delayed union, non-union and malunion. Certain fractures such as oblique fractures and comminuted fractures are less stable. Therefore correct classification is important. Early diagnosis allows the cause to be determined and correct treatment to be instituted before there is permanent disability.
• Delayed union The fracture fails to unite within a reasonable amount of time (16-18 weeks). Possible causes are inadequate blood supply, infection, insufficient splintage and excessive traction. Failure to diagnose and treat delayed union at its early stages may lead to non-union.
• Non-union The fracture fails to unite. Causes of delayed union may also cause non-union. Interposition of soft tissue between the fracture fragments may also prevent bone union. Radiographically, the fracture ends are separated by a gap. Motion between the two ends may be demonstrated under fluoroscopy or between consecutive stress films.
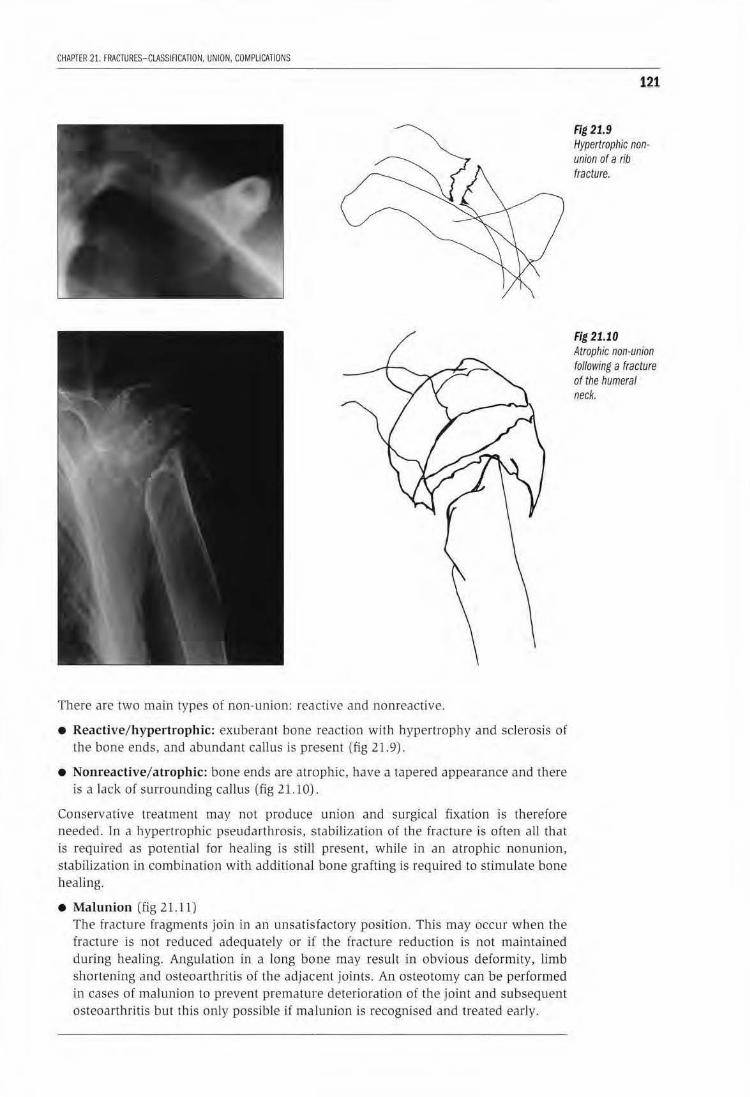
CHAPTER 21. FRACTURES-CLASSIACATION. UNION, COMPUCATIONS
There are two main types of non-union: reactive and nonreactive.
• Reactive/hypertrophic: exuberant bone reaction wiLh hypertrophy and sclerosis of the bone ends, and abundant callus is present (fig 21.9).
• Nonreactive/ atrophic: bone ends are atrophic, have a tapered appearance and there is a lack of surrounding callus (fig 21. 10).
Conservative treatment may not produce union and surgical fixation is therefore needed. In a hypertrophic pseudarthrosis, stabilization of the fract ure is often all that is required as potential for healing is still present, while in an atrophic nonunion, stabilizat ion in combination with additional bone grafting is required to stimulate bone healing.
• Malunion (fig 21. 11) The fractu re fragments join in an unsatisfactory posi tion . This may occur when the fracture is not reduced adequately or if the fracture reduction is not maintained during healing. Angulation in a long bone may result in obvious deformity, limb shortening and osteoarthritis of the adjacent joints. An osteotomy can be performed in cases of malunion lo prevent premature deterioration oi the joint and subsequent osteoarrhritis but this only possible if malunion is recogn ised and treated early.
121
Fig 21.9 Hypertrophic nonunion of a rib fracture.
Fig 21.10 Atrophic non-union following a fracture of the humeral neck.
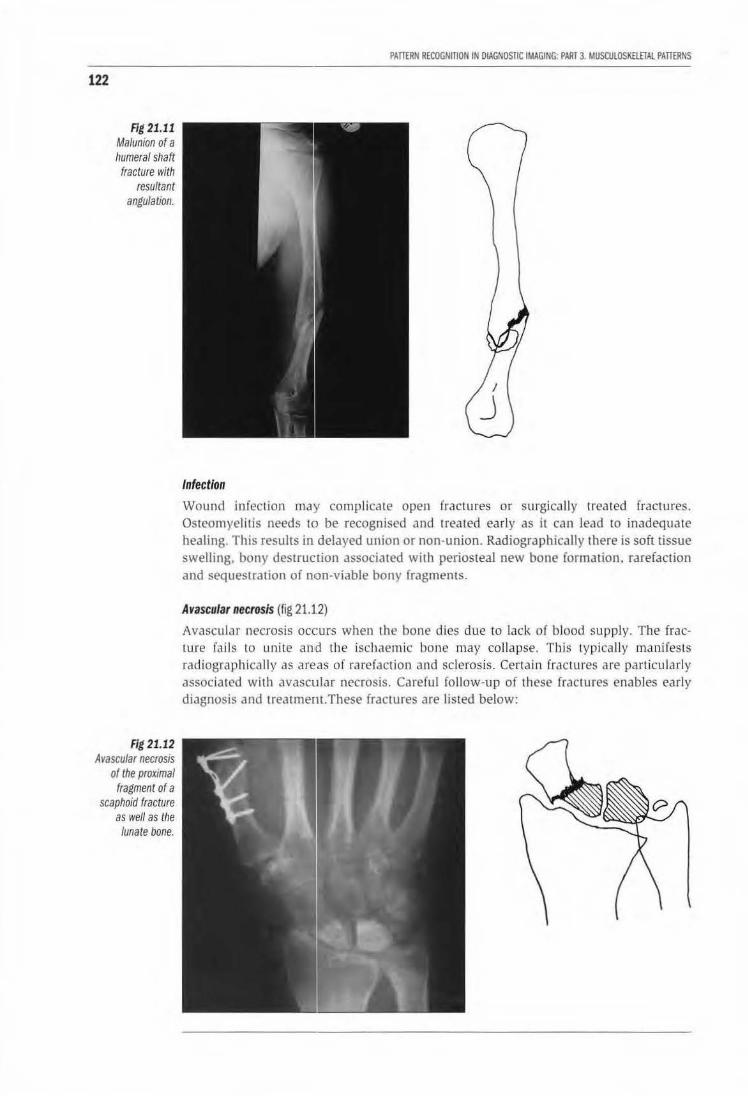
122
Fig 21.11 Malunion of a humeral shaft fracture with
resultant angulation.
Fig 21.12 Avascular necrosis
of the proximal fragment of a
scaphoid fracture as well as the
lunate bone.
PATTERN RECOGNmON IN DIAGNOSTIC IMAGING: PART 3 MUSCUlOSK£lETAl PATTERNS
Infection
Wound infection may complicate open fractures or surgically trea ted fractures. Osteomyelitis needs to be recognised and treated early as it can lead to inadequate healing. This results in delayed union or non-union. Radiographically there is soft tissue swelling, bony destruction associated with periosteal new bone formation, rarefaction and sequestration of non-viable bony fragments.
Avascular necrosis (fig 21.1.2)
Avascular necrosis occurs when th e bone dies due to lack of b lood supply. The fracture fails to unite and the ischaemic bone may collapse. T his typica lly manifests radiogr::~pbically as areas of rarefaction Jnd sclerosis. Certa in fractures are particularly associated with avascular necrosis. Carefu l follow-up of these fractures enables early diagnosis and treatmem.These fractures are listed below:

CHAPTER 21. FRACTURES-CLASSIFICATION, UNION, COMPLICATIONS
Site of fracture Femur-neck Scaphoid-waist Talus-neck Humerus-neck
Growth disturbances
Site of avascular necrosis Femur-head Scaphoid-proximal fracture fragment Talus-body Humerus-head
This is seen in children. Fractures which cross the epiphyseal growth plate may lead to abnormal growth. If only part of the growth plate is damaged then this may lead to asymmetrical growth, resulting in angulation. If the entire growth plate is involved, there may be premature fusion and cessation of growth resulting in limb length discrepancy.
LEARNING POINTS: FRACTURES
• Fractures-may be treated conservatively or surgically depends on the type of fracture, hence need for correct radiological classification
• Fracture-complete-transverse, oblique, spiral, impacted, comminuted -incomplete-greenstick, compression
• Complications-systemic -local-bone, soft tissue, joints
• Complications of union-delayed union (bone fails to unite in 16-18 weeks) -non-union (fails to unite) -malunion
Important to identify abnormal union and its cause (mechanical, blood supply, infection) and institute appropriate treatment promptly.
• Other local complications involving bone also benefit from early diagnosis and treatment. -infection -bony destruction, sequestra, soft tissue swelling -avascular necrosis -areas of patchy rarefaction and sclerosis
-typical sites -femoral head, scaphoid, talus -reflex sympathetic dystrophy -patchy, rapidly progressive rarefaction -growth disturbances -angulation, cessation of growth
123
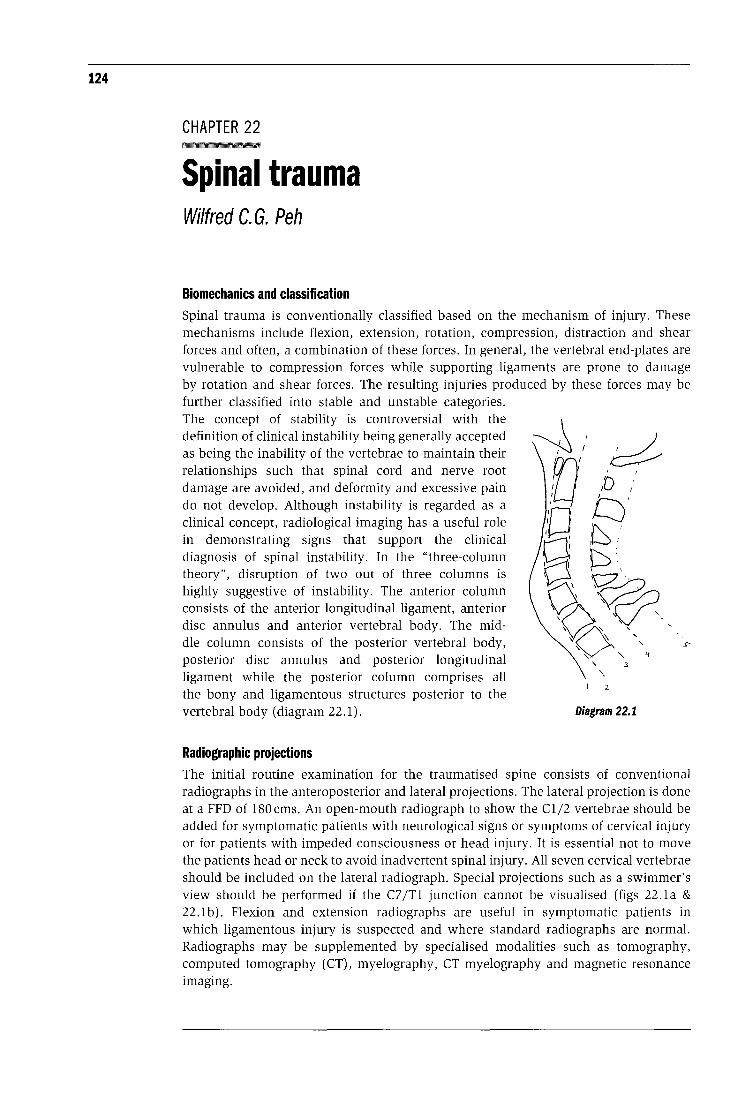
124
CHAPTER 22
Spinal trauma Wilfred C. G. Peh
Biomechanics and classification Spinal trauma is conventionally classified based on the mechanism of injury. These mechanisms include flexion, extension, rotation, compression, distraction and shear forces and often, a combination of these forces. In general, the vertebral end-plates are vulnerable to compression forces while supporting ligaments are prone to damage by rotation and shear forces. The resulting injuries produced by these forces may be further classified into stable and unstable categories. The concept of stability is controversial with the definition of clinical instability being generally accepted as being the inability of the vertebrae to maintain their relationships such that spinal cord and nerve root damage are avoided, and deformity and excessive pain do not develop. Although instability is regarded as a clinical concept, radiological imaging has a useful role in demonstrating signs that support the clinical diagnosis of spinal instability. In the "three-column theory", disruption of two out of three columns is highly suggestive of instability. The anterior column consists of the anterior longitudinal ligament, anterior disc annulus and anterior vertebral body. The middle column consists of the posterior vertebral body, posterior disc annulus and posterior longitudinal ligament while the posterior column comprises all the bony and ligamentous structures posterior to the vertebral body (diagram 22.1).
Radiographic projections
' \
2
3
Diagram 22.1
The initial routine examination for the traumatised spine consists of conventional radiographs in the anteroposterior and lateral projections. The lateral projection is done at a FFD of 180cms. An open-mouth radiograph to show the Cl/2 vertebrae should be added for symptomatic patients with neurological signs or symptoms of cervical injury or for patients with impeded consciousness or head injury. It is essential not to move the patients head or neck to avoid inadvertent spinal injury. All seven cervical vertebrae should be included on the lateral radiograph. Special projections such as a swimmer's view should be performed if the C7 /Tl junction cannot be visualised (figs 22.la & 22.lb). Flexion and extension radiographs are useful in symptomatic patients in which ligamentous injury is suspected and where standard radiographs are normal. Radiographs may be supplemented by specialised modalities such as tomography, computed tomography (CT), myelography, CT myelography and magnetic resonance imaging.
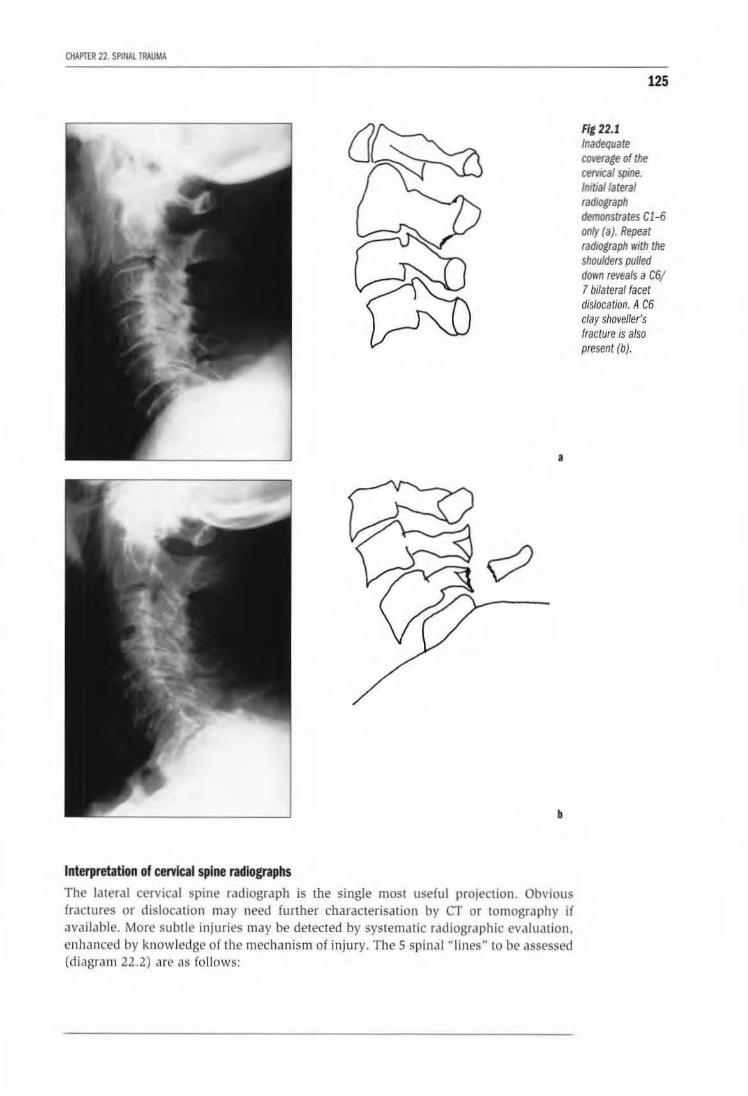
CHAPTER 22. SP1NAL TRAUMA
a
b
Interpretation of cervical spine radiographs
The lateral cervical spine radiograph is the single most useful projection. Obvious fractures or dislocation may need funber characterisation by CT or tomography if available. More subt le injuries may be detected by systematic radiographic eva luation, enhanced by knowledge of the mechanism of injury. The 5 spina l " lines" to be assessed (d iagram 22.2) arc «s follows:
125
Fit 22.1 Inadequate CtJverage of the cervteal spine. lmtiallateral radiograph demonstrates Cl-6 only (a). Repeat radiograph with the shoulders pulled down reveals a C6/ 7 bilateral facet dislocation. A C6 clay shoveller's fracture is also present (b).
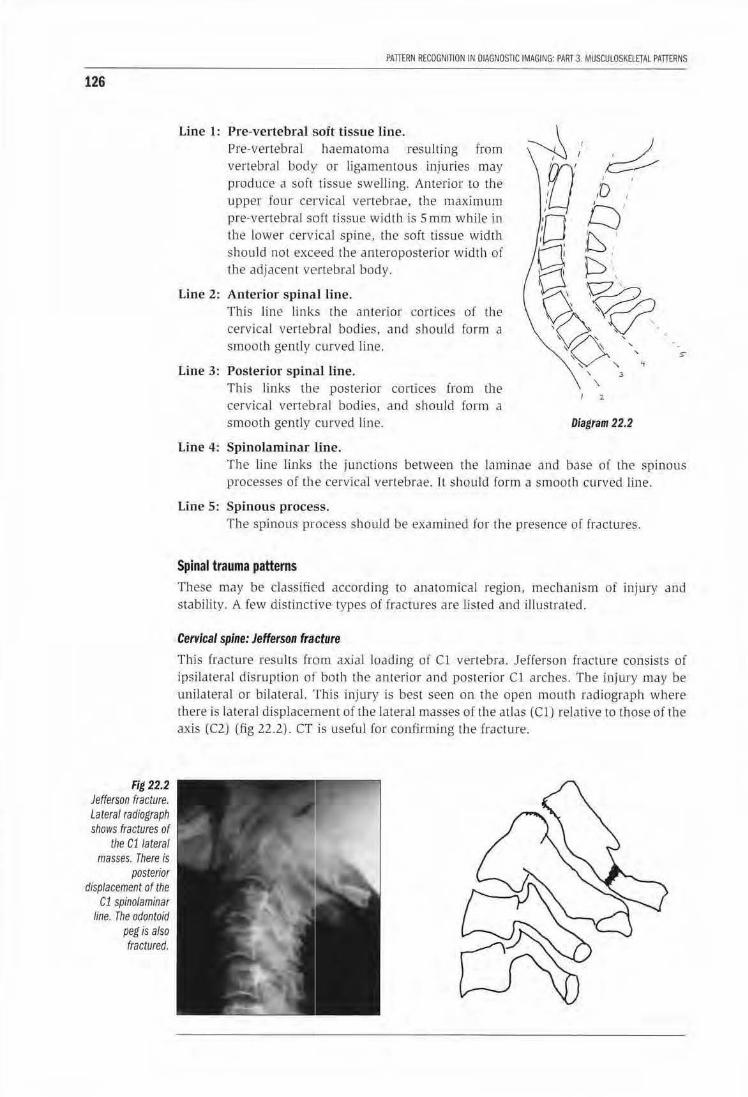
126
Fig 22.2 Jefferson fracture. Lateral radfograph shows fractures of
the C11ateral masses. There is
posterior displacement of the
C1 spinolaminar line. The odontoid
peg is also fractured.
PAITERN RECOGNITION IN DIAGNOSTIC IMAGING: PAIH3. MUSCULOSKELETALPAffiRNS
Line 1: Pre-vertebral soft tissue line. Pre-vertebral haemaloma resulting from vertebral body or ligamentous injuries may produce n soft tissue sweJJing. Anterior to the upper four cervical vertebrae, rhe maximum pre-vertebral soft tissue widlb is Sm.m while in the lower cervical spine. the soft tissue wid th should not exc·eed the anteroposterior width of the adjacent vertebraJ body.
Line 2: Anterior spina1l line. Th is line links the anterior cortices of the cervical vertebral bodies, and should fo rm a smooth gently curved line.
Line 3: Posterior spinal line. This links the posterior cortices from the cervka l vertebral bodies, and should fo rm a smooth gently curved line.
Line 4: Spinolaminar line.
' .3
l
Diagram 22.2
The line links the junctions between th e laminae and base of the spinous processes of the cervical vertebrae. I t should form a smoo th curved li.ne.
Line 5: Spinous process. The spinous process should be examined for the presence of fractures.
Spinal trauma patterns These may be classified according to anatomical region, mechanism of injury and stability. A few distinctive types of fractures are listed and illustrated.
Cervical spine: Jefferson fracture
This frac ture results from axial loading of Cl vertebra. Jefferson fracture consists of ipsilateral disruption of both the anterior and posterior Cl arches. The inJury may be unilateral or bilateral. This injury is best seen on the open mouth radiograph where there is lateral displacement of the lateral masses of the atlas (Cl) relative to those of the axis (C2) (fig 22.2). CT is useflil for confirming the fracrure.
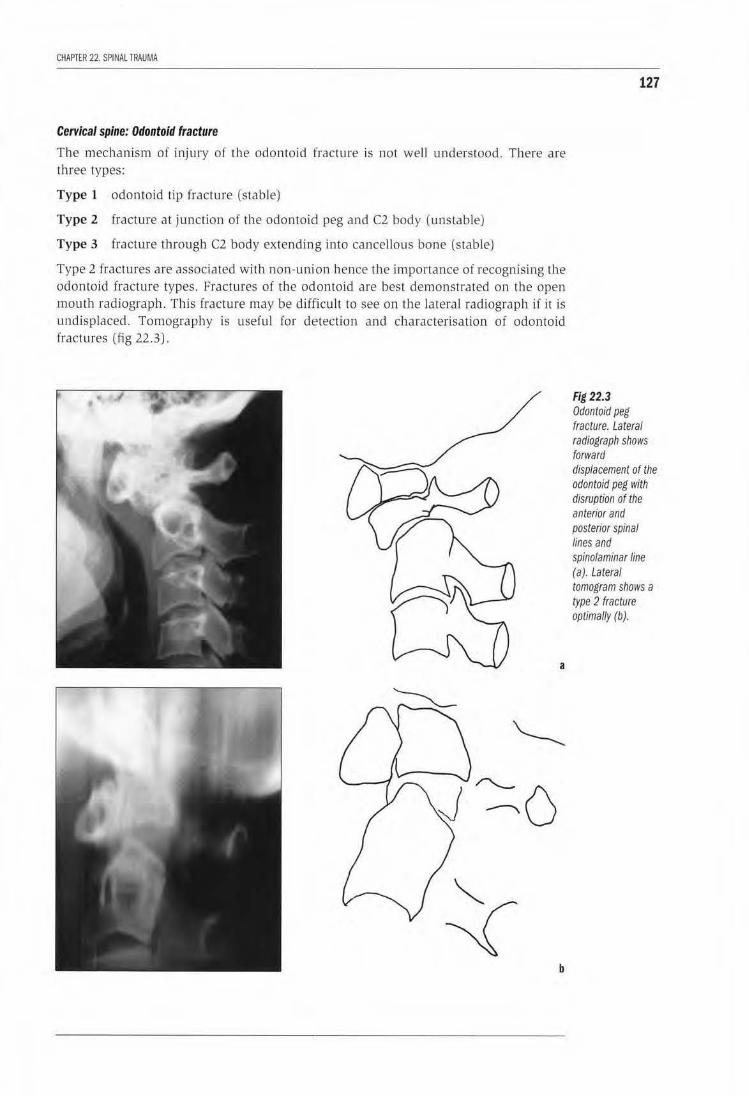
CHAPTER 22. SPINAL TRAUMA
Cervical spine: Odontoid fracture
Tile mechanism of injury of the odontoid fracture is not well understood. There are three types:
Type 1 odontoid tip fracture (stable)
Type 2 fracture at junction of the odontoid peg and C2 body (unstable)
Type 3 fracture through C2 body extending into cancellous bone (stable)
Type 2 fractures are associated with non-union hence the importance of recognising the odontoid fracture types. Fractures of the odontoid are best demonstrated on the open mouth radiograph. This fracture may be difficu lt to see on the lateral radiograph if it is undisplaced. Tomography is useful for detection and characterisation of odon toid [ractures (fig 22 .3).
a
b
127
Fig 22.3 Odontoid peg fracture. Lateral radiograph shows forward displacement of the odontoid peg with disruption of the anterior and posterior spinal Jines and spinolaminar line (a). Lateral tomogram shows a type 2 fracture optimally (b).
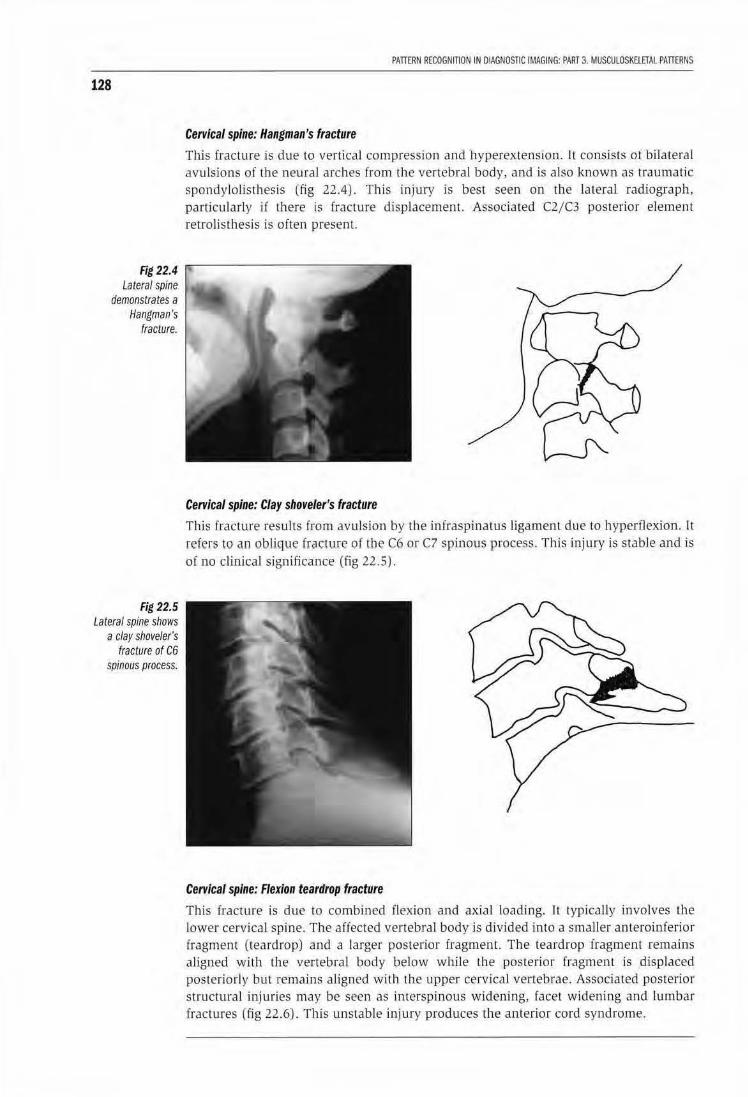
128
Fig 22.4 Lateral spine
demonstrates a Hangman's
fracture.
Fig 22.5 Lateral spine shows
a clay shoveler's fracture of C6
spinous process.
PATIERN RECOGNITION IN DIAGNOSTIC IMAGING: PART 3. MUSCULOSKELETAl PATIERNS
Cervical spine: Hangman's fracture
Thls fracture is due to vertical compression and hyperextension. It consists of bilateral avulsions of the neural arches from the vertebral body, and is also known as traumatic spondy lolisthesis (fig 22.4). This injury is best seen on the lateral radiograph, particularly if there is fracture displacement. Associated C2/C3 posterior element retrolisthesis is often present
Cervical spine: Clay shoveler's fracture
This fracture results from avu lsion by the infraspinatus ligament due to hyperflex:ion. It refers to an oblique fr"cture of the C6 or C7 spinous process. This injury is stable and is of no clinicaJ significance (fig 22.5).
Cervical spine: Flexion teardrop fracture
This fracture is due to combined flexion and axial loading. Il typically involves the lower cervical spine. The affected vertebral body is divided into a smaller anteroinferior fragment (teardrop) and a larger posterior fragment. The teardrop fragment remains aligned with the vertebral body below while the posterior fragment is displaced posteriorly but remains aligned with the upper cervical vertebrae. Associated posterior structura l injuries may be seen as interspinous widening, facet widening and lumbar fractu res (fig 22.6). This unstable injury produces the anterior cord syndrome.
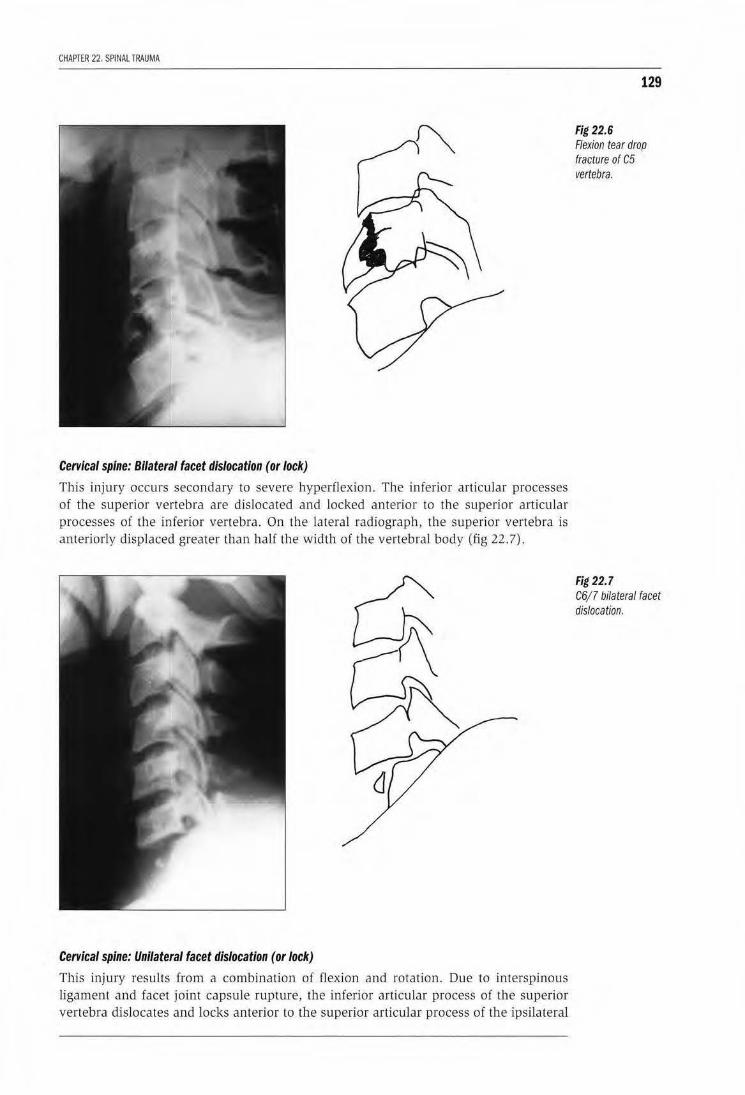
CHAPTER 22. SPINAl TRAUMA
Cervical spine: Bilateral facet dislocation (or lock)
This injury occurs secondary to severe hyper(lexion. The inferior articular processes of the superior vertebra are dislocated and locked anterior to the superior articular processes of the inferior vertebra . On the lateral radiograph, the superior vertebra is anteriorly displaced greater than half the width of the vertebral body (fig 22.7) .
Cervical spine: Unilateral facet dislocation (or lock)
This injury results from a combination of flexion and rotation. Due to interspinous ligament and facet joint capsule rupture, the inferior articular process of the superior vertebra dislocates and locks anterior to the superior articular process of the ipsilateral
129
Fig 22.6 Flexion tear drop fracture of C5 vertebra.
Fig 22.7 C6/7 bilateral facet dislocation.
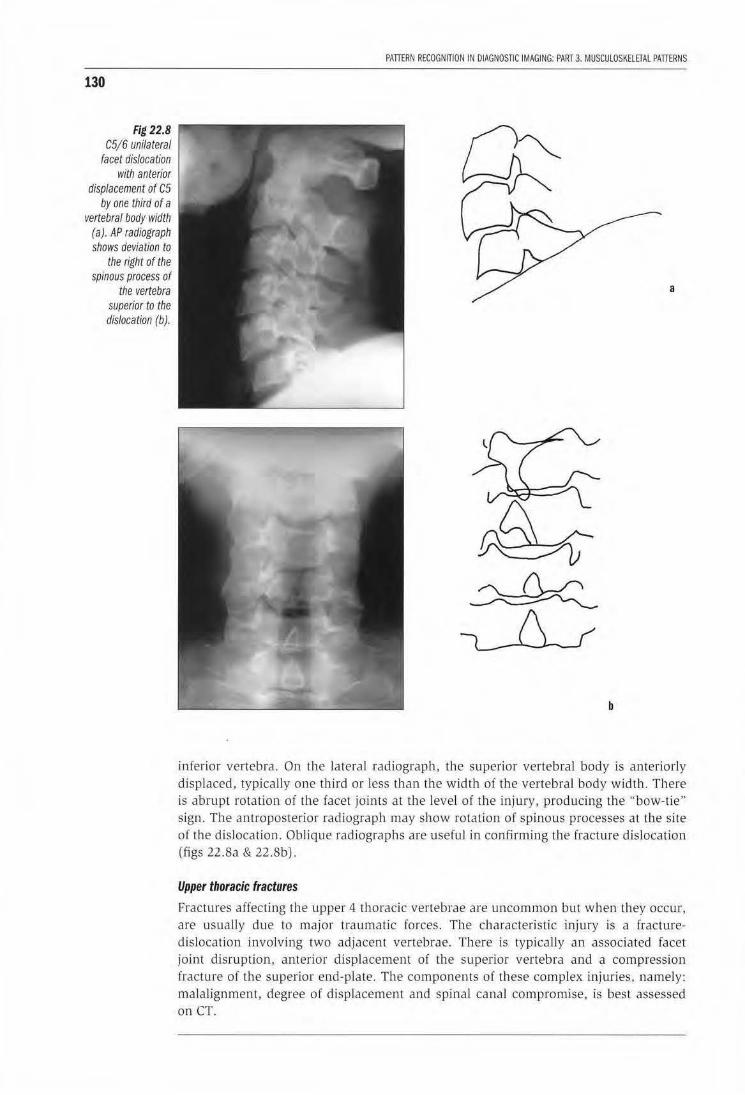
130
Fig 22.8 C5/6 unilateral
facet dislocation with anterior
displacement of C5 by one third of a
vertebral body width (a). AP radiograph shows deviation to
the right of the spinous process of
the vertebra superior to the dislocation (b).
PATIERN RECOGNITION IN DIAGNOSnC IMAGING: PART 3. MUSCULOSKElETAL PATIERNS
a
b
inferior vertebra. On the lateral radiograph, the superior vertebral body is anteriorly displaced, typically one thi rd or less than the w idth of t he vertebral body width . There is abrupt rotation of the facet joints at the level of the injury, producing the "bow-tie" sign. The antroposterior radiograph may show rotation of spinous processes at the site of the dislocation. Oblique radiographs are useful in confirming the fracture dislocation (figs 22.8a & 22.8b).
Upper thoracic fractures
Fractures affecting the upper 4 thoracic vertebrae are uncommon but when they occur, are usually due to major traumatic forces. The characteristic injury is a fracturedislocation involving two adjacent vertebrae. There is typically an associated facet joint disruption, anterior displacement of the superior vertebra and a compression fracture of the superior end-plate. The components of these complex injuries, namely: malalignment, degree of displacement and spinal canal compromise. is best assessed on CT.
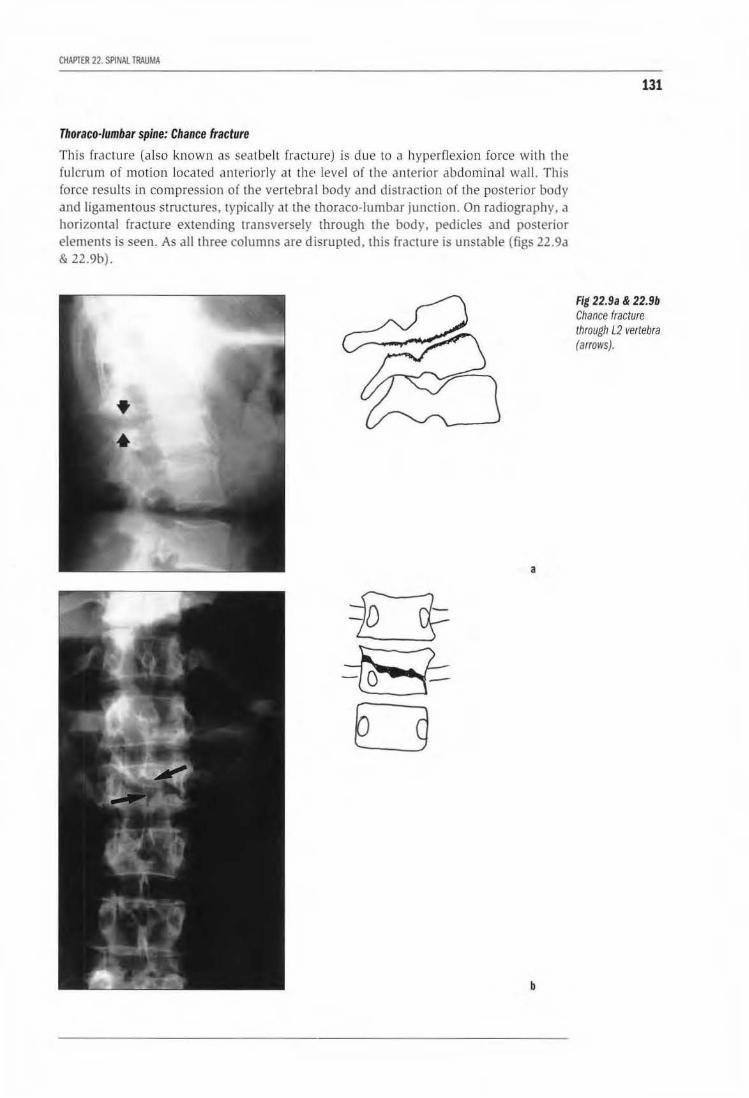
CHAPTER 22. SPINAL TRAUMA
Thoraco-lumbar spine: Chance fracture
This fracture (also known as seatbelt fracture) is due to a hyperflexion force with th e fulcrum of motion located anteriorly at the· level of the anterior abdominal wall. This force results in compression of the vertebral body and distraction of the posterior body and ligamentous structures, typica lly at the thoraco-lumbar junction. On radiography. a horizontal fracture extending transversely through the body, pedicles and posterior elements is seen. As all three columns are disrupted, this fracture is unstable (figs 22.9a & 22.9b).
a
b
131
Fig 22.9a & 22.9b Chance fracture through L2 vertebra (arrows).
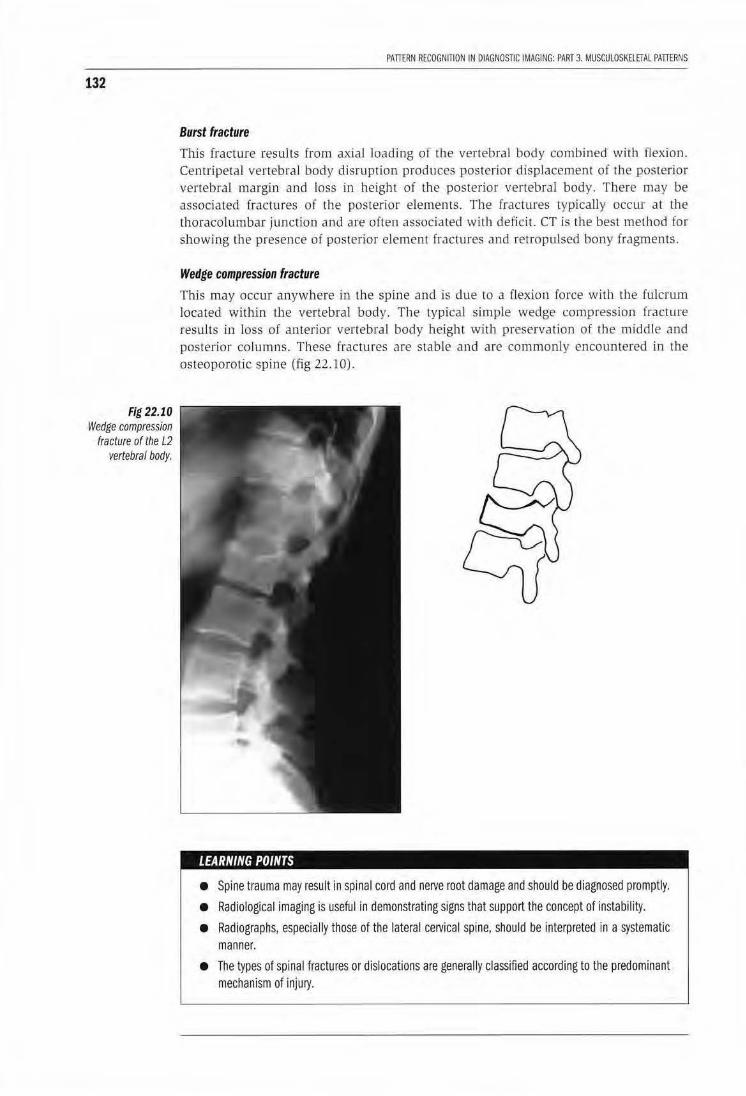
132
Fig 22.10 Wedge compression
fracture of the L2 vertebral body.
PATIERN RECOGNITION IN DIAGNOSTIC IMAGING: PART 3. MUSCULOSKELETAL PATIERNS
Burst fracture
This fracture results from axial loading of the vertebral body combined with flexion. Centripetal vertebral body disruption produces posterior displacement of the posterior vertebral margin and loss in height of the posterior vertebral body. There may be associated fractures of the posterior elements. The fractures typically occur at the thoracolumbar junction and are often associated with deficit. CT is the best method for showing the presence of posterior element fractures and retropulsed bony fragmems.
Wedge compression fracture
This may occur anywhere in the spine and is due to a flexion force with the fulcrum located within lbe vertebral bod y. The typical simple wedge compression fracture results in loss of anterior vertebral body height with preservation of the middle and posterior columns. These fractures are stable and are commonly encountered in the osteoporotic spine (fig 22.10).
LEARNING POINTS
• Spine trauma may result in spinal cord and nerve root damage and should be diagnosed promptly.
• Radiological imaging is useful in demonstrating signs that support the concept of instability.
• Radiographs, especially those of the lateral cervical spine, should be interpreted in a systematic manner.
• The types of spinal fractures or dislocations are generally classified according to the predominant mechanism of injury.
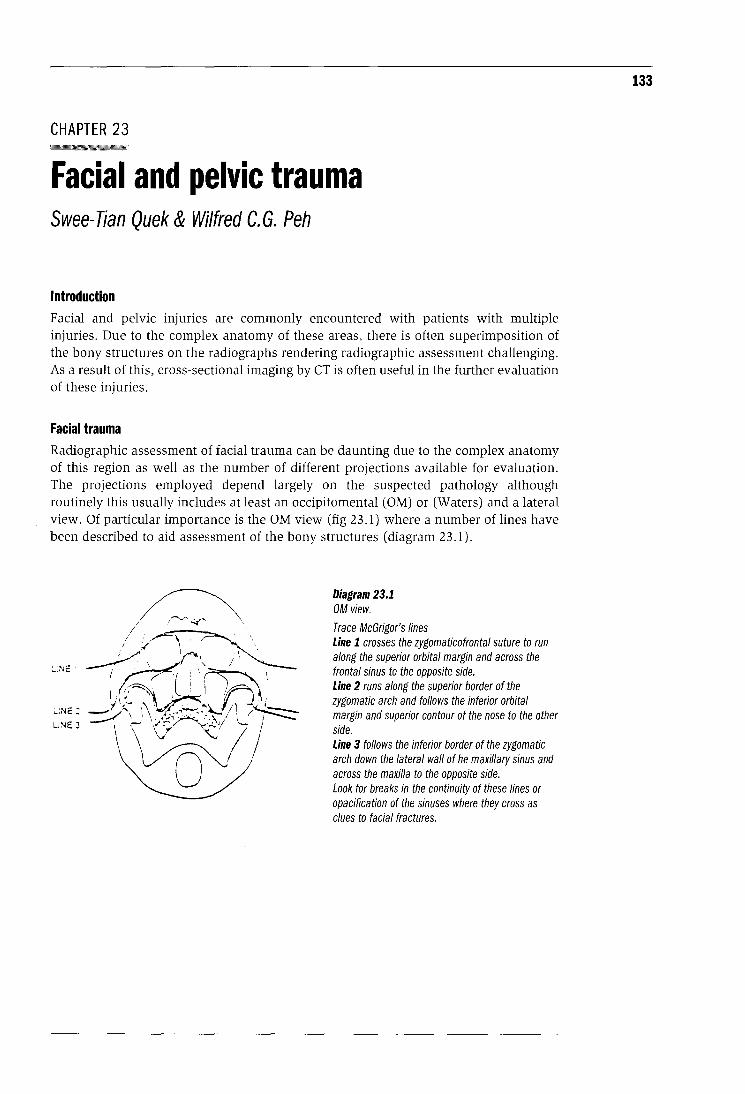
CHAPTER 23
Facial and pelvic trauma Swee-Tian Quek & Wilfred C. G. Peh
Introduction Facial and pelvic InJuries are commonly encountered with patients with multiple injuries. Due to the complex anatomy of these areas, there is often superimposition of the bony structures on the radiographs rendering radiographic assessment challenging. As a result of this, cross-sectional imaging by CT is often useful in the further evaluation of these injuries.
Facial trauma Radiographic assessment of facial trauma can be daunting due to the complex anatomy of this region as well as the number of different projections available for evaluation. The projections employed depend largely on the suspected pathology although routinely this usually includes at least an occipitomental (OM) or (Waters) and a lateral view. Of particular importance is the OM view (fig 23.1) where a number of lines have been described to aid assessment of the bony structures (diagram 23.1).
LINE:
LiNE J
Diagram 23.1 OM view.
Trace McGrigor's lines Line 1 crosses the zygomaticofrontal suture to run along the superior orbital margin and across the frontal sinus to the opposite side. Line 2 runs along the superior border of the zygomatic arch and follows the inferior orbital margin and superior contour of the nose to the other side. Line 3 follows the inferior border of the zygomatic arch down the lateral wall of he maxillary sinus and across the maxilla to the opposite side. Look for breaks in the continuity of these lines or opacification of the sinuses where they cross as clues to facial fractures.
133
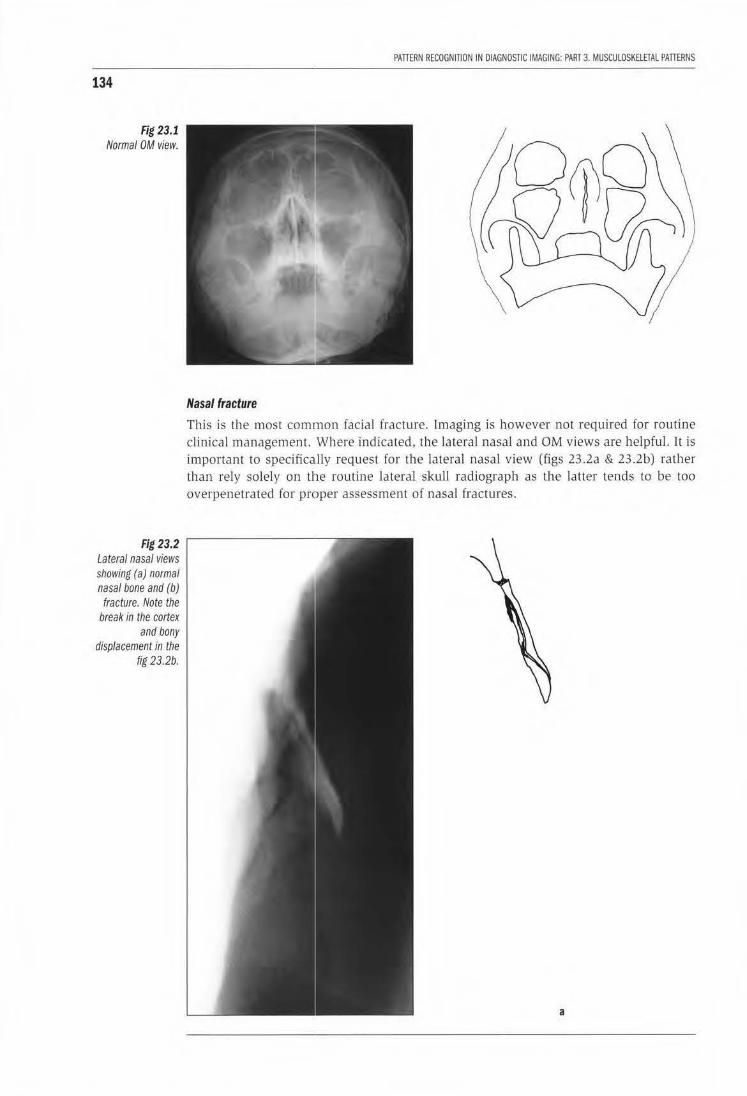
134
Fig 23.1 Normal OM view.
Fig 23.2 Lateral nasal views showing (a) normal nasal bone and (b) fracture. Note the
break in the cortex and bony
displacement in the fig 23.2b.
PATTERN RECOGNITION IN DIAGNOSTIC IMAGING: PART 3. MUSCULOSKELETAL PATTERNS
Nasal fracture
This is the most common facial fracture. Imaging is however not reqLLired for routine clinical management. Where indicated, the lateral nasal and OM views are helpful. It is important to specifically request for the lateral nasal view (figs 23.2a & 23.2b) rather than rely solely on the routine lateral s.l<ull radiograph as the latter tends to be too overpenetrated for proper assessment of nasal fractures.
a
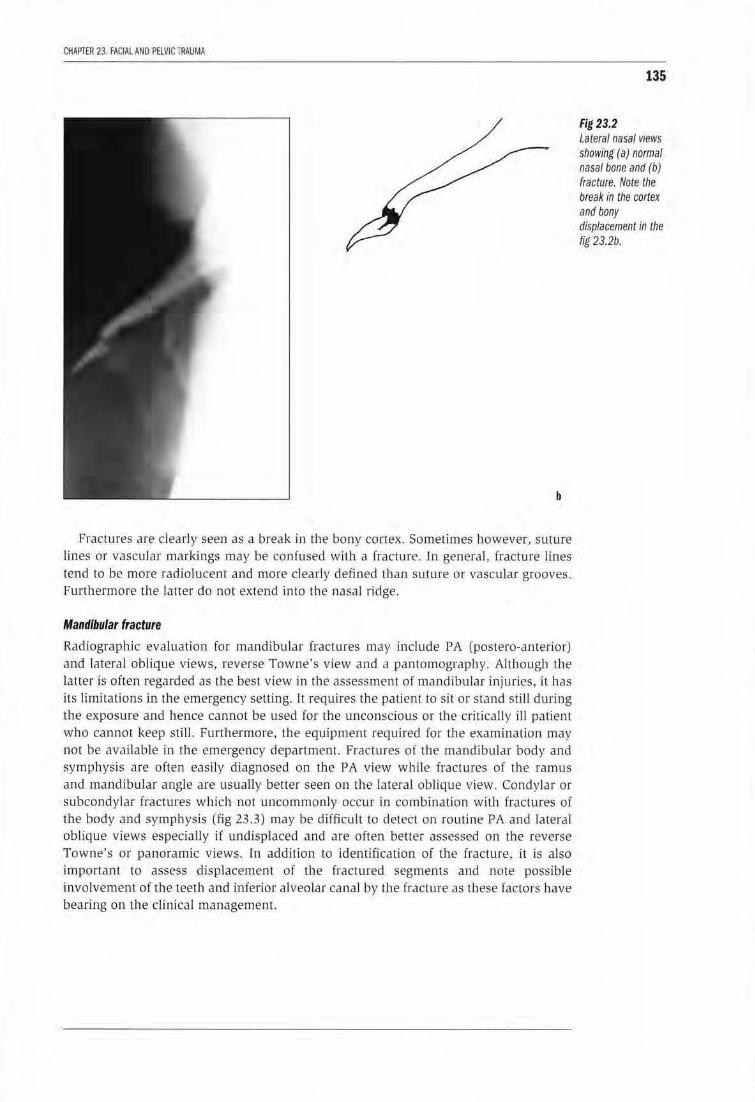
CHAPTER 23. FACIAL ANO PElVIC TRAUMA
b
Fractmes are clearly seen as a break in the bony cortex. Sometimes however, suture lines or vascular markings may be confused with a fracture. In general, fracture lines tend to be more ractiolucent and more clearly defined than suture or vascular grooves. Furthermore the latter do not extend into the nasa l ridge.
Mandibular fracture
Radiographic evaluation for mandibular fractures may include PA (postero-anterior) Jnd lateral oblique views, reverse Towne 's view and a pantomography. Although the latter is often regarded as the best view in the assessment of mandibular injuries , it has its limitations in the emergency setting. It requires the patient to sit or stand still during the exposure and hence cannot be used for the unconscious or the critically ill patient who cannot keep stili . Furthermore. the equipment required for the examination may not be available in the emergency department. Fractures of the mandibular body and symphysis are often easily diagnosed on the PA view whi le frac tures of the ramus and mandibular angle are usually better seen on the lateral oblique view. Condylar or subcond ylar fractures which not unconunonly occur in combinat ion with fractures of the body and symphysis (fig 23 .3) may be difficult to detect on routine PA and lateral oblique views especially if undisp laced and are often better assessed on the reverse Towne's or panoramic views . fn addition to identification of the fracture, it is also important to assess displacement of the fractured segments and note possible involvement of the teeth and inferior alveolar canal by the frac ture as these factors have bearing on the clinical management.
135
Fig 23.2 Lateral nasal views showing (a) normal nasal bone and (b) fracture. Note the break in the cortex and bony displacement in the fig 23.2b.
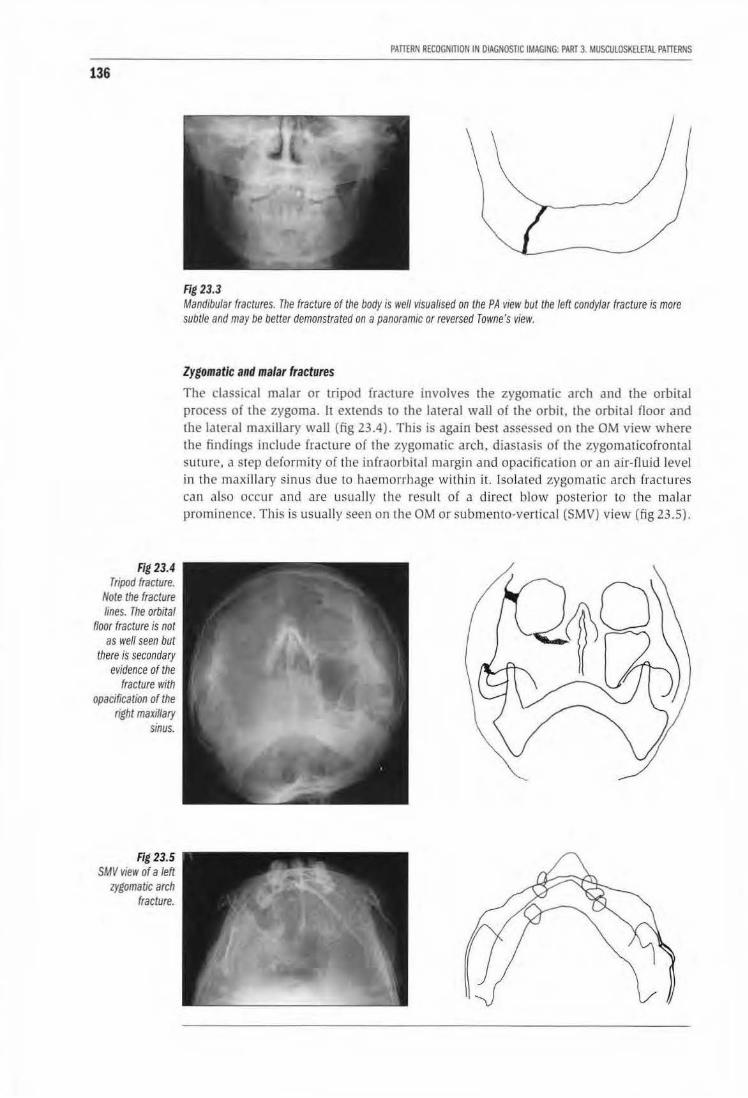
136
Fig 23.4 Tripod fracture.
Note the fracture lines. The orbital
floor fracture is not as well seen but
there is secondary evidence of the
fracture with opacification of the
right maxillary sinus.
Fig 23.5 SMV vieiV of a left
zygomatic arch fracture.
PATTERN RECOGNITION IN OIAGNOSTIC IMAGING: PART 3. MUSCULOSKHITAL PATTERNS
Fig 23.3 Mandibular fractures. The fracture of the body is well visualised on the PA view but the left condylar fracture is more subtle and may be better demonstrated on a panoramic or reversed Towne's view.
Zygomatic and malar fractures
The classical malar or tripod fracture involves the zygomatic arch and the orbital process of the zygoma. h extends to the lateral waJI of the orbit. the orbital floor and the lateral maxillary wall (fig 23.4). This is again best assessed on the OM view where the findings include fracture of the zygomatic arch, diastasis of the zygomaticofromal su ture, a step deformity of the infraorbita l margin and opacification or an air-fluid level in the maxillary sinus due lo haemorrhage within it. Isolated zygomatic arch fractures can also occur and are usually the result of a direct blow posterior to the malar prominence. This is usually seen on the OM or submento-vertical (SMV) view (fig 23.5).
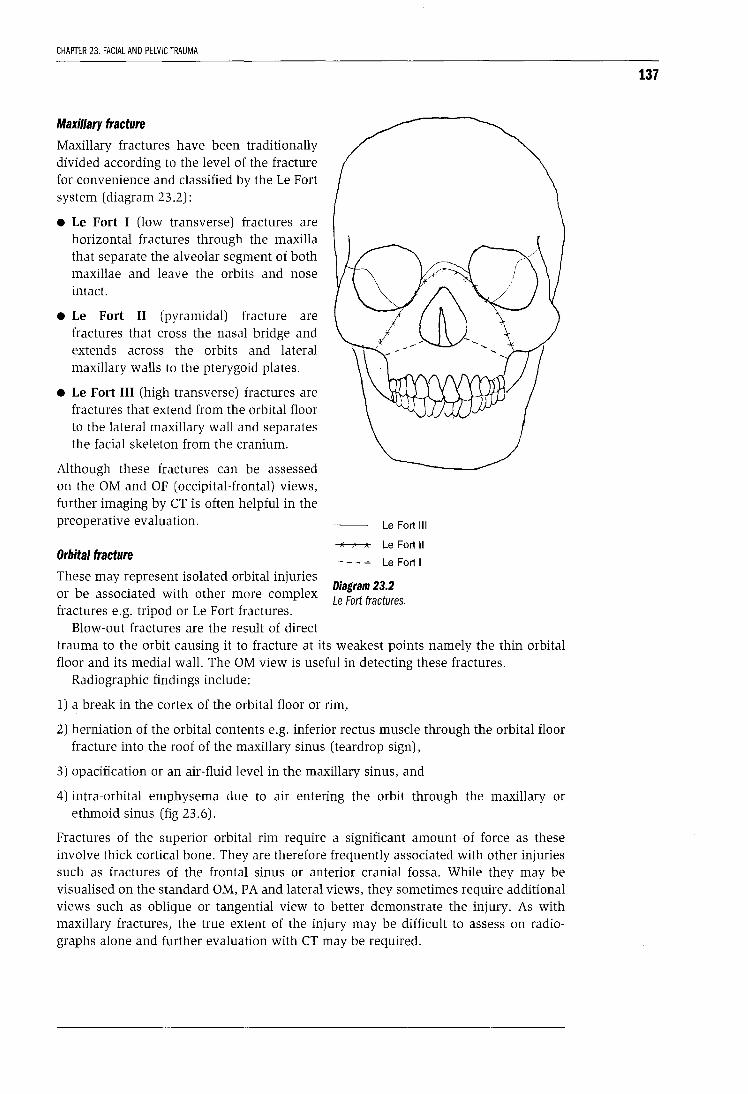
CHAPTER 23. FACIAL AND PELVIC TRAUMA
Maxillary fracture
Maxillary fractures have been traditionally divided according to the level of the fracture for convenience and classified by the Le Fort system (diagram 23.2):
• Le Fort I (low transverse) fractures are horizontal fractures through the maxilla that separate the alveolar segment of both maxillae and leave the orbits and nose intact.
• Le Fort II (pyramidal) fracture are fractures that cross the nasal bridge and extends across the orbits and lateral maxillary walls to the pterygoid plates.
• Le Fort III (high transverse) fractures are fractures that extend from the orbital floor to the lateral maxillary wall and separates the facial skeleton from the cranium.
Although these fractures can be assessed on the OM and OF (occipital-frontal) views, further imaging by CT is often helpful in the preoperative evaluation.
Orbital fracture
These may represent isolated orbital injuries or be associated with other more complex fractures e.g. tripod or Le Fort fractures.
Blow-out fractures are the result of direct
Le Fort Ill
Le Fort II
LeFort I
Diagram 23.2 Le Fort fractures.
trauma to the orbit causing it to fracture at its weakest points namely the thin orbital floor and its medial wall. The OM view is useful in detecting these fractures.
Radiographic findings include:
1) a break in the cortex of the orbital floor or rim,
2) herniation of the orbital contents e.g. inferior rectus muscle through the orbital floor fracture into the roof of the maxillary sinus (teardrop sign),
3) opacification or an air-fluid level in the maxillary sinus, and
4) intra-orbital emphysema due to air entering the orbit through the maxillary or ethmoid sinus (fig 23. 6).
Fractures of the superior orbital rim require a significant amount of force as these involve thick cortical bone. They are therefore frequently associated with other injuries such as fractures of the frontal sinus or anterior cranial fossa. While they may be visualised on the standard OM, P A and lateral views, they sometimes require additional views such as oblique or tangential view to better demonstrate the injury. As with maxillary fractures, the true extent of the injury may be difficult to assess on radiographs alone and further evaluation with CT may be required.
137
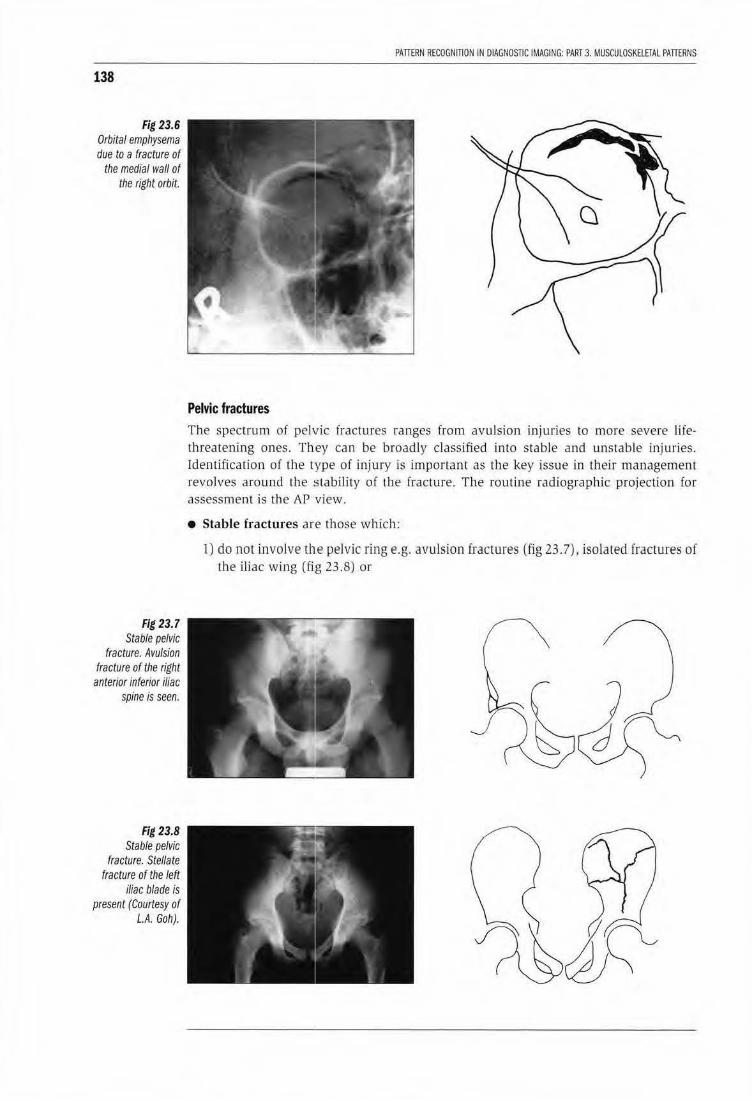
138
Fig 23.6 Orbital emphysema due to a fracture of
the medial wall of the right orbit.
Fig 23.7 Stable pelvic
fracture. Avulsion fracture of the right
anterior inferior iliac spine is seen.
Fig 23.8 Stable pelvic
fracture. Stellate fracture of the left
iliac blade is present (Courtesy of
L.A. Goh).
PATTERN RECOGNITION IN DIAGNOSTIC IMAGING: PART 3. MUSCULOSKE.lElAL PATTERNS
Pelvic fractures The spectrum of pelvic fractures ranges from avulsion injuries to more severe lifethreatening ones. They can be broadly classified into stable and unstable injuries. Identification of the type of injury is important as the key issue in their management revolves around the stability of the fracture . The routine radiographic projection for assessment is the AP view.
• Stable fractures are those which:
1) do not involve the pelvic ring e.g. avulsion fractures (fig 23. 7), isolated fractures of the iliac wing (fig 23.8) or
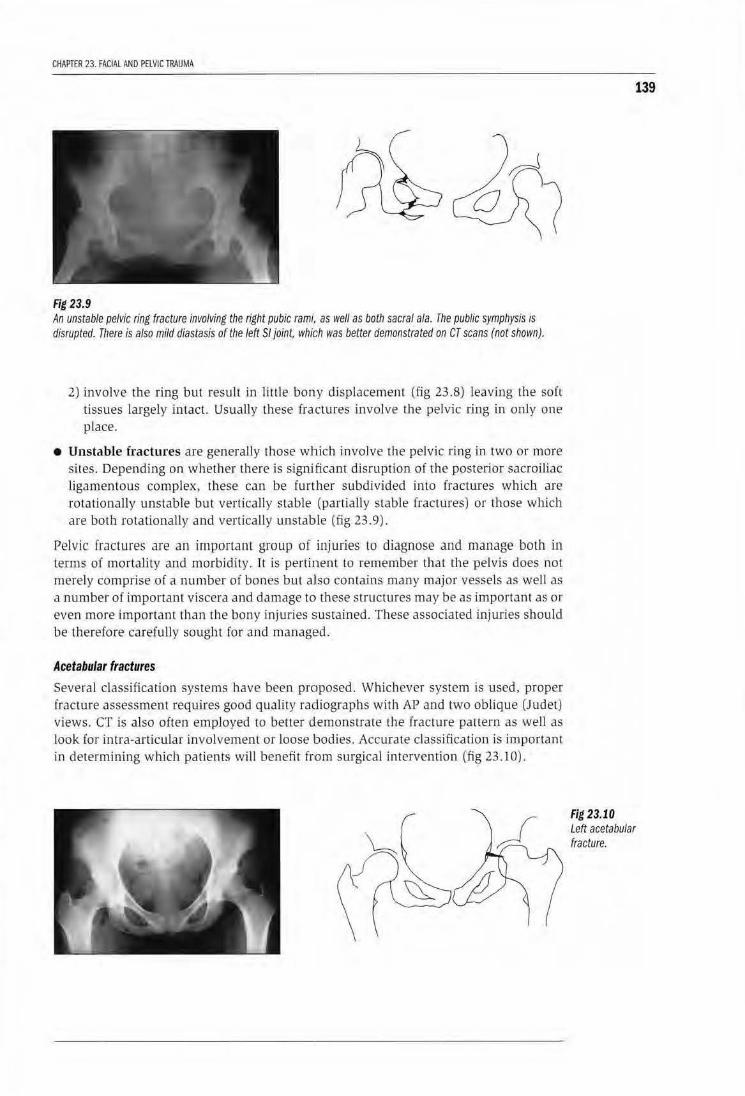
CHAPTER 23. FACIAL AND PELVIC TRAUMA
Fig 23.9 An unstable pelvic ring fracture involving the right pubic rami,, as well as both sacral ala. The public symphysis is disrupted. There is also mild diastasis of the left Sf joint, which was better demonstrated on CT scans (not shown).
2) Lnvolve the ring but result in litLie bony displacement (fig 23.8) leaving the ~ofl tissues largely intact. Usually these fractures involve the pelvic ring in only one place.
• Unstable fractures are generally those which involve the pelvic rLng in two or more sites. Depending on whether there is significant disruption of the posterior sacroiliac ligamentous complex, these can be fur ther subdjvided into fractures which are rotationally unstable but vertically stable (pa rtially stable fractures) or those which are both rotationally and vertically unstable (fig 23.9).
Pelvic fractures are an important group of injuries to diagnose and manage both in terms of mortality and morbidity. 1t is pertinent to remember that the pelvis does not merely comprise of a number of bones but aliso contains many major vessels as well as a number of important viscera and damage to these structures may be as important as or even more important than rhe bony injuries sustained. These associated injuries should be therefore carefully sought for and managed.
Acetabular fractures
Several classification systems have been proposed. Whichever system is used, proper fracture assessment requires good quality radiographs with AP and two ob lique (Judet) views. CT is also often employed m better demonstrate the fracture pattern as well as look for intra-articular involvement or loose bodies. Accurate classification is important in determining which patients will benefit fwm surgical intervention (fig 23.10).
139
Fig 23.10 Left acetabular fracture.

140
PAITERN RECOGNITION IN DIAGNOSTIC IMAGING: PART 3. MUSCULOSKELETAL PAITERNS
KEY LEARNING POINTS: FACIAL AND PELVIC FRACTURES
Facial fractures
• A number of projections are available. In general, the OM view is particularly useful.
• In the OM view, follow McGrigor's lines. Also look for fluid/ opacification of the sinuses and for intraorbital emphysema.
• Imaging nasal fractures is not usually required for clinical management
• CT is often useful in the further evaluation of the more complex fractures Remember the review areas on the OM skull radiograph.
Pelvic fractures
• Often associated with other injuries which must be actively sought for and managed
• Recognise stable fractures; everything else is unstable!
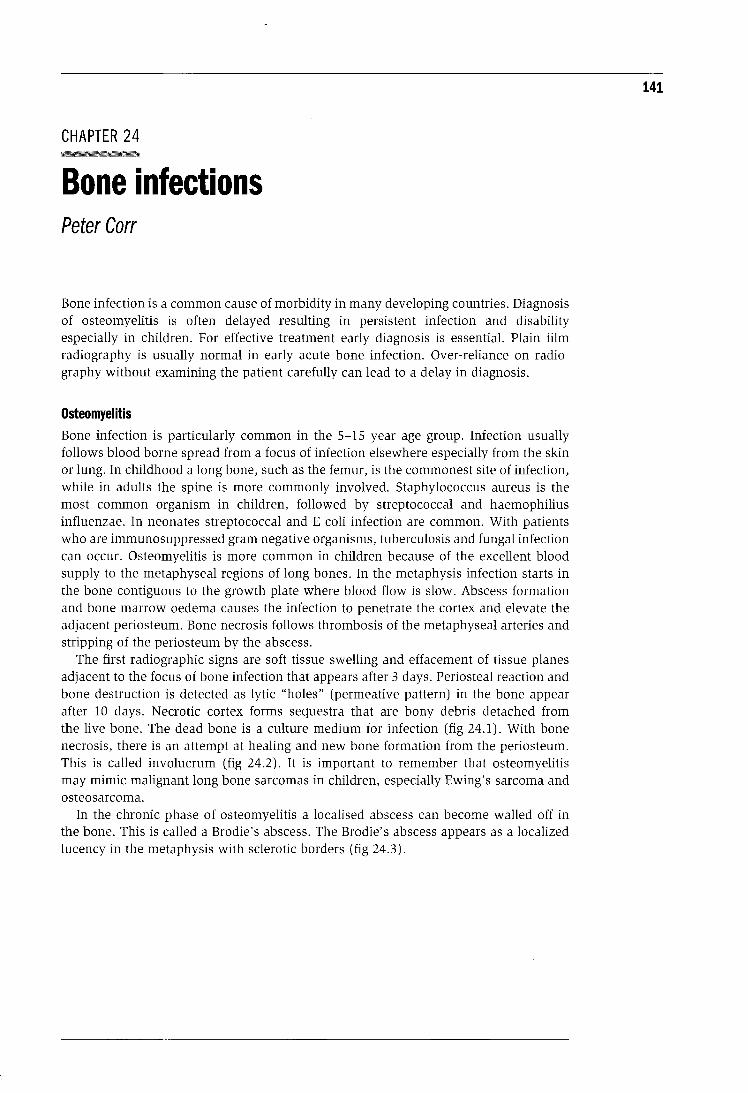
CHAPTER 24 --·---Bone infections Peter Carr
Bone infection is a common cause of morbidity in many developing countries. Diagnosis of osteomyelitis is often delayed resulting in persistent infection and disability especially in children. For effective treatment early diagnosis is essential. Plain film radiography is usually normal in early acute bone infection. Over-reliance on radiography without examining the patient carefully can lead to a delay in diagnosis.
Osteomyelitis Bone infection is particularly common in the 5-15 year age group. Infection usually follows blood borne spread from a focus of infection elsewhere especially from the skin or lung. In childhood a long bone, such as the femur, is the commonest site of infection, while in adults the spine is more commonly involved. Staphylococcus aureus is the most common organism in children, followed by streptococcal and haemophilius influenzae. In neonates streptococcal and E coli infection are common. With patients who are immunosuppressed gram negative organisms, tuberculosis and fungal infection can occur. Osteomyelitis is more common in children because of the excellent blood supply to the metaphyseal regions of long bones. In the metaphysis infection starts in the bone contiguous to the growth plate where blood flow is slow. Abscess formation and bone marrow oedema causes the infection to penetrate the cortex and elevate the adjacent periosteum. Bone necrosis follows thrombosis of the metaphyseal arteries and stripping of the periosteum by the abscess.
The first radiographic signs are soft tissue swelling and effacement of tissue planes adjacent to the focus of bone infection that appears after 3 days. Periosteal reaction and bone destruction is detected as lytic "holes" (permeative pattern) in the bone appear after 10 days. Necrotic cortex forms sequestra that are bony debris detached from the live bone. The dead bone is a culture medium for infection (fig 24.1). With bone necrosis, there is an attempt at healing and new bone formation from the periosteum. This is called involucrum (fig 24.2). It is important to remember that osteomyelitis may mimic malignant long bone sarcomas in children, especially Ewing's sarcoma and osteosarcoma.
In the chronic phase of osteomyelitis a localised abscess can become walled off in the bone. This is called a Brodie's abscess. The Brodie's abscess appears as a localized lucency in the metaphysis with sclerotic borders (fig 24.3).
141
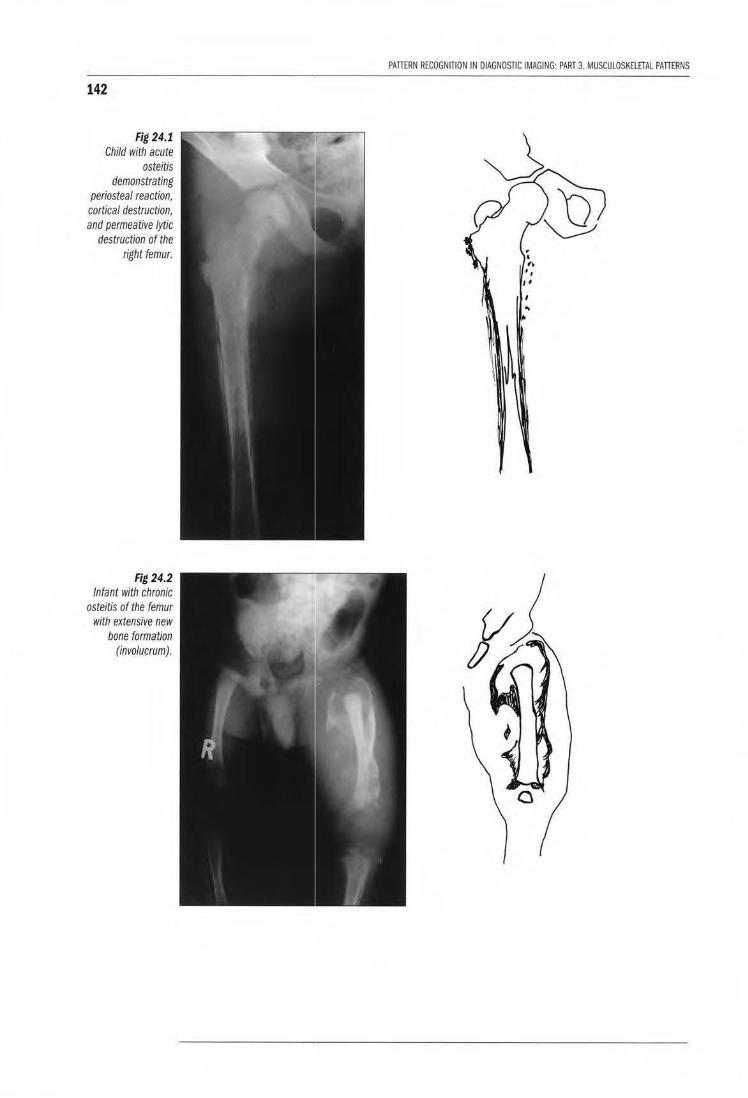
142
Fig 24.1 Child with acute
osteitis demonstrating
periosteal reaction, cortical destruction, and permeative lytic
destruction of the right femur.
Fig 24.2 Infant with chronic
osteitis of the femur with extensive new
bone formation (involucrum).
PAITERN RECOGNITION IN DIAGNOSTIC IMAGING: PART 3. MUSCULOSKElETAL PAITERNS
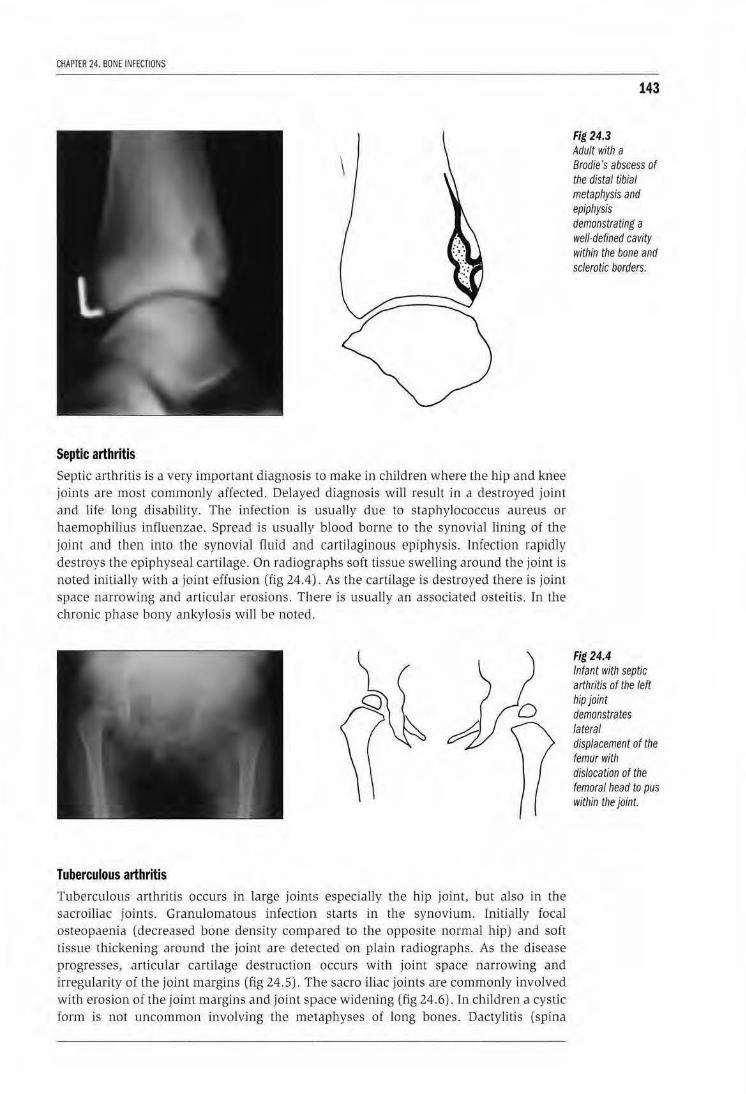
CHAPTER 24. BONE INFECTIONS
Septic arthritis
Septic arthritis is a very important d iagnosis to make in children where the hip and knee joints are most commonly affected. Delayed diagnosis will result in a destroyed joint and We long disability. The infection is usually due to staphylococcus aureus or haemophilius influenzae. Spread is usually blood borne to the synovial lining of the joint and then into the synovia] fluid and cartilaginous epiphysis. Infection rapidly destroys the epiphysea l cartilage. On radiographs soft tissue swelling around the joint is noted initially with a joint effusion (fig 24.4)1. As the cartilage is destroyed there is joint space narrowing and articular erosions. Th1ere is usually an associated osteitis. rn the chronic phase bony ankylosis will be noted.
Tuberculous arthritis Tuberculous arlbritis occurs in large joints especially the hip joint, but also in the sacroiliac joints. Granulomatous infecriom starts in the synovium. Lnitially focal osteopaenia (decreased bone density compared to the opposite normal bjp) and soft tissue thickening around the joint are detected on plain radiographs. As the disease progresses, articular cartilage destruction occurs with joint space narrowing and irregularity of the joint margins (fig 24.5). Tllle sacro iliac joints are commonly involved with erosion of the joint margins and joint space widening (fig 24.6) . ln chLldren a cystic form is not uncommon involving the metaphyses of long bones. Dactylitis (spina
143
Fig 24.3 Adult with a Brodie's abscess of the distal tibial metaphysis and epiphysis demonstrating a well-defined cavity within the bone and sclerotic borders.
Fig 24.4 Infant with septic art/Jritis of the left hip joint demonstrates lateral displacement of the femur with dislocation of the femoral head to pus within the joint.
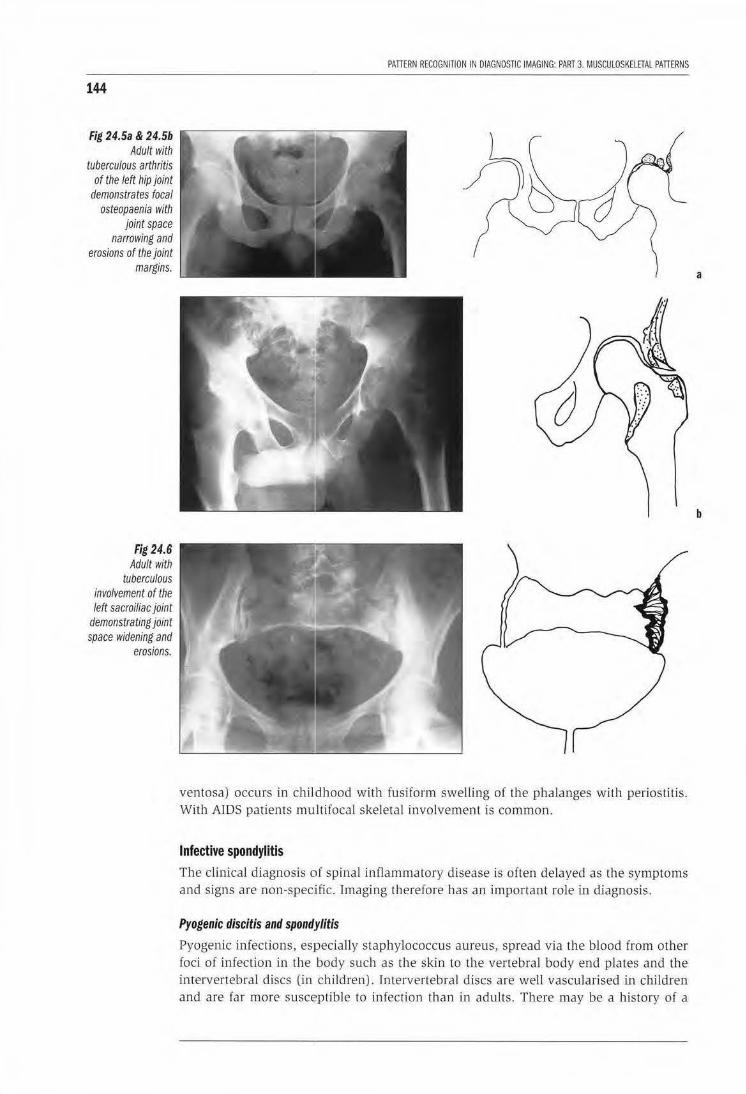
144
Fig 24.5a & 24.5b Adult with
tuberculous arthritis of the left hip joint
demonstrates focal osteopaenia with
joint space narrowing and
erosions of the joint margins.
Fig 24.6 Adult with
tuberculous involvement of the left sacroiliac joint
demonstrating joint space widening and
erosions.
PATIERN RECOGNITION IN DIAGNOSTIC IMAGING: PART 3. MUSCULOSKELETAL PATIERNS
ventosa) occurs in childhood with fusiform swelling ot the phalanges witJ1 periostitis. With AIDS patients mu ltifocal skeletal involvement is common.
Infective spondylitis
The clinical diagnosis of spinal inflammatory d isease is often delayed as the symptoms and signs are non-specific. Imaging therefore has an important ro le in diagnosis.
Pyogenic discitis and spond.rlitis
Pyogenic infections, es]pecially staphylococcus aureus, spread via the blood from ot her foci of infection in the body such as the skin to the vertebral body end plates and the intervertebral discs (in children). Intervertebral discs are well vascularised in children and are far more susceptible to infection than in adults. There may be a history of a
a
b
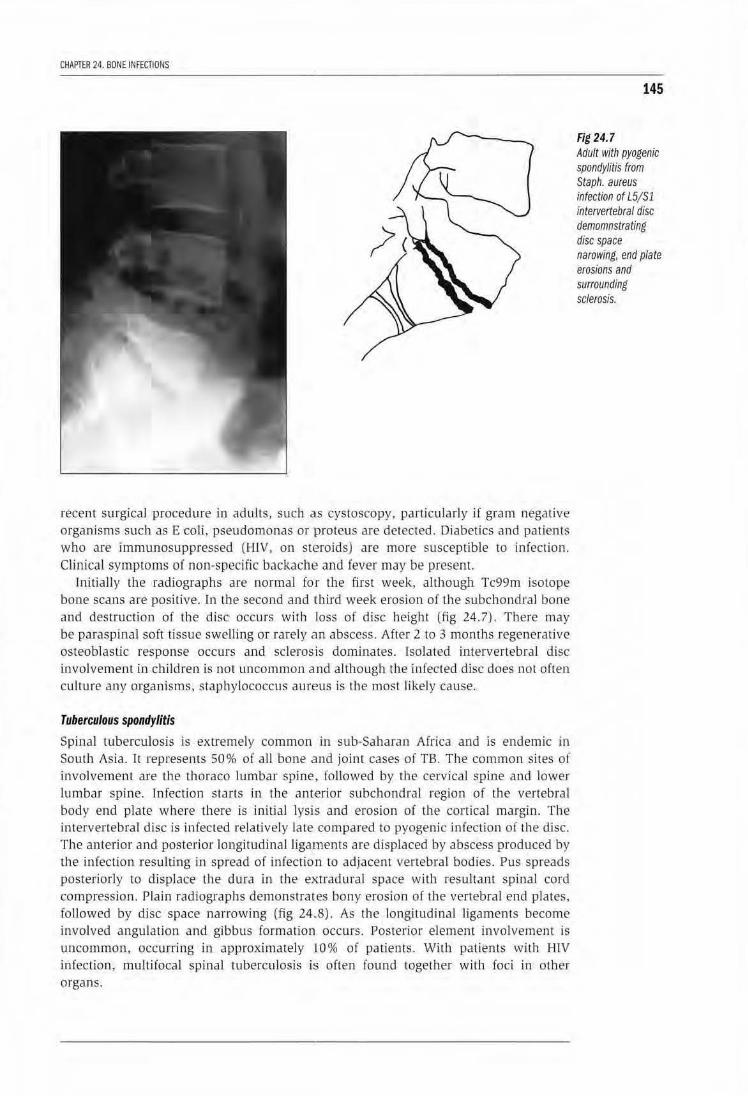
CHAPTER 24. BONE INFECTIONS
recent surgical procedure in adults, such diS cystoscopy, particularly if gram negative organ.isms such as E coli, pseudomonas or !Proteus are detected. Diabetics and patients who are immunosuppressed (HlV, on sH~roids) are more susceptible to infection. Clinical symptoms of non-specific backachE! and fever may be present.
Initially the radiographs are normal for the first week, although Tc99m isotope bone scans are positive. In the second and tthird week erosion of the subchondral bone and destruction of the djsc occurs with Joss of disc height lfig 24. 7). There may be paraspinal soft t issue swelling or rarely an abscess. After 2 to 3 months regenerative osteoblastic response occurs and sclerosis dominates. Isolated intervertebral disc involvement in children is not uncommon and although the infected disc does not often culture any organisms, staphylococcus aureus is the most likely cause.
Tuberculous spondylitis
Spinal tuberculosis is extremely common in sub-Sal1aran Africa and is endemic in South Asia. It represents 50% of all bone and joint cases of TB. The common sites of involvement are the thoraco lumbar spine, followed by rhe cervical spine and lower lumbar spine. lnfection starts in the ant·erior subchondral region of the vertebral body end plate w here there is initial lysis and erosion of the cortical margin. The intervertebral d isc is infected relatively late compared to pyogenic infection of the disc. The anterior and posterior longitudinal ligaments are displaced by abscess produced by the infection resulting in spread of infection to adjacenr vertebral bodies. Pus spreads posteriorly to displace the dura in the e)uradural space with resultant spinal cord compression. Plain radiographs demonstrates bony erosion of the vertebra l end plates. followed by disc space narrowing (fig 24 .. 8). As the longitudinal ligaments become involved angu lation and gibbus formation occurs. Posterior element involvement is uncommon, occurring in approximately ·10% of patients. With patients with HlV infection , multifocal spinal tuberculosis is often found together with foci in other organs.
145
Fig 24.7 Adult witll pyogenic spondylitis from Staph. aureus infection of L5/ Sl intervertebral disc demomnstrating disc space narowing, end Plate erosions and surrounding sclerosis.
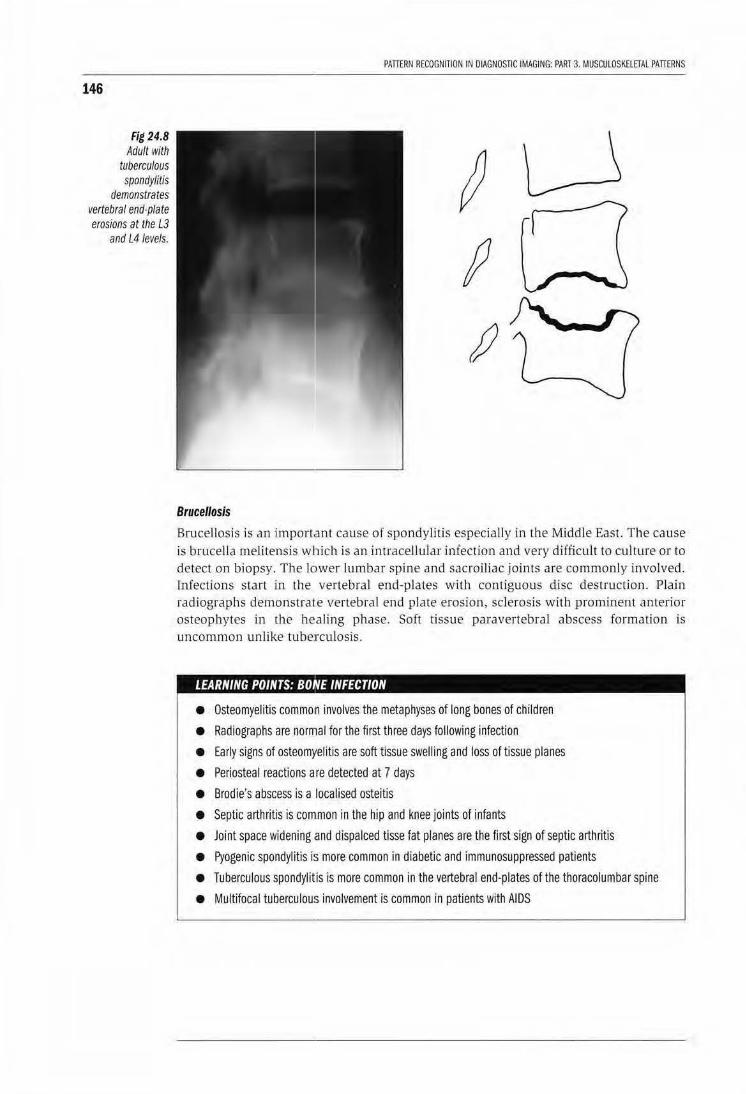
146
Fig 24.8 Adult with
tuberculous spondylitis
demonstrates vertebral end-plate erosions at the L3
and L4 levels.
PATTERN RECOGNITION IN DIAGNOSTIC IMAGING: PART 3. MUSCULOSKELETAL PAnERNS
Brucellosis
Brucellosis is an import.ant cause of spondylitis especially in the Middle East. The cause is brucella melitensis which is an intracellular infection and very difficult to culture or to detect on biopsy. The lower lumbar spine and sacroiliac joints are commonly involved. Infections start in the vertebral end-plates with contiguous disc destruction. Plain radiographs demonstrate vertebral end plate erosion, sclerosis with prominent anterior osteophytes in the healing phase. Soft tissue paravertebral abscess formation is uncommon unlike tubercu losis.
. ' 'I :I E INFECTION
• Osteomyelitis commo'n involves the metaphyses of long bones of children
• Radiographs are normal for the first three days following infection
• Early signs of osteomyelitis are soft tissue swelling and loss of tissue planes
• Periosteal reactions are detected at 7 days
• Brodie's abscess is a localised osteitis
• Septic arthritis is comtmon in the hip and knee joints of infants
• Joint space widening ,and dispalced tisse fat planes are the first sign of septic arthritis
• Pyogenic spondylitis is more common in diabetic and immunosuppressed patients
• Tuberculous spondylitis is more common in the vertebral end-plates of the thoracolumbar spine
• Multifocal tuberculous involvement is common in patients with AIDS

PART4
GASTRO I NT EST I NAL AND URINARY TRACT PATTERNS

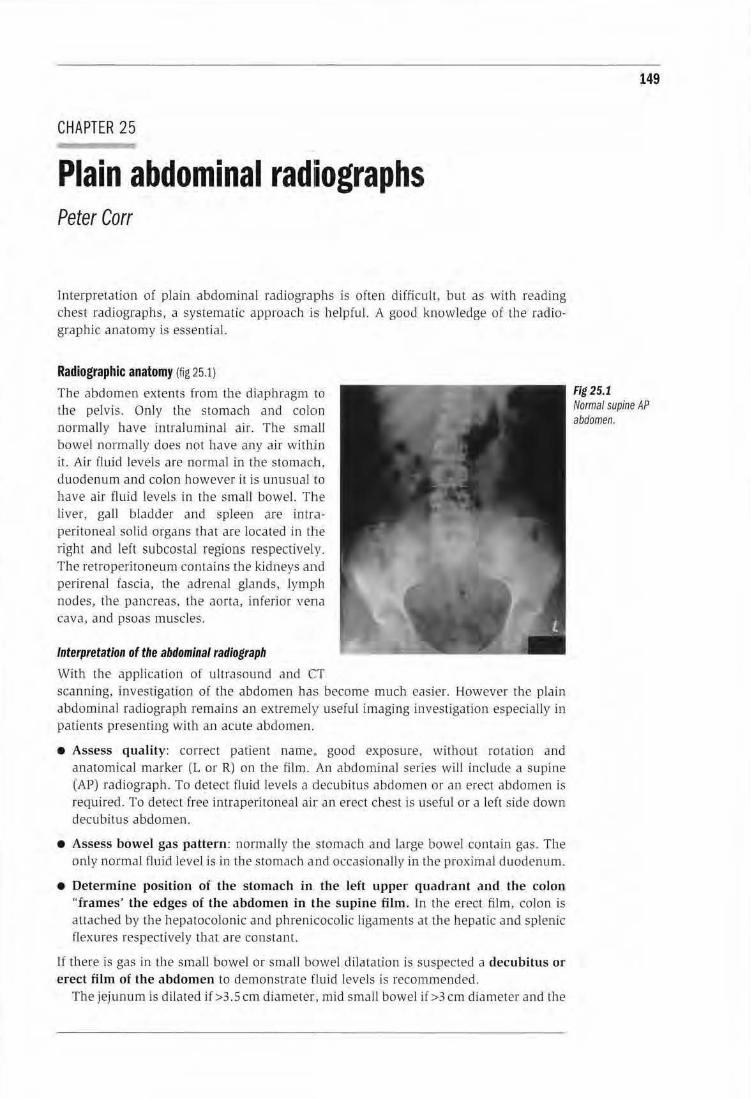
CHAPTER 25
Plain abdominal radiiographs Peter Carr
Interpretation of plain abdominal racliograJPhs is often difficuiL. but as with reading chest radiographs, a systematic approach i:s helpful. A good knowledge of the radiographic anatomy is essential.
Radiographic anatomy (fig 25.1)
The abdomen extents from the diaphragm to Lhe pelvis. Only the stomach and colon normally have inrraluminal air. The smclll bowel normally does not have any air witbiin it. Air fluid levels are normal in the stomaclh. duodenum and colon however it is unusual 1to have air fluid levels in the small bowel. The liver, gaJl bladder and spleen are intr.aperitoneal solid o rgans that are located in the right and left su bcostaJ regions respectively. The ret roperitoneum conta ins the kidneys and perirenal fascia, the adrenal glands, lymph nodes, the pancreas. the aorta, inferior vena cava. and psoas muscles.
Interpretation of the abdominal radiograph
With ll1e application of ultrasound and CT s~Anning, investigation of the abdomen has become much easier. However th e plain abdomina l radiograph remains an extTemely useful imaging investigation especially in patients presenring wi th an acute abdomen.
• Assess quality: correct patient name.. good exposure, without rotation and anatomical marker (L or R) on the film. An abdominal series will include a supine (AP) radiograph. To detect fluid levels a decubitus abdomen or an erect abdomen is required. To detect free intraperitoneal air an erect chest is useful or a left side down decubitus abdomen.
• Assess bowel gas pattern : normJ.Ily the stomach a nd large bowel contain gas. The only normal fluid level is in the stomach and occasionally in the proximal duodenum.
• Determine position of the stomach in the left upper quadrant a nd the colon "frames' the edges of the abdomen in the supine film. ln the erect film, colon is attached by the hepatocolonic and phrenicocolic ligaments at Lhe hepatic and splenic flexu res respectively that are constant.
If there is gas in the smaJl bowel or small bowel dilaration is suspecred a decubitus or erect film of the abdomen to demonslrate fluid levels is recommended.
The jejunu m is dilated if>3.5 em diameter, mid sma ll bowel if >3 em diameter and the
149
Fig 25.1 Normal supine AP abdomen.
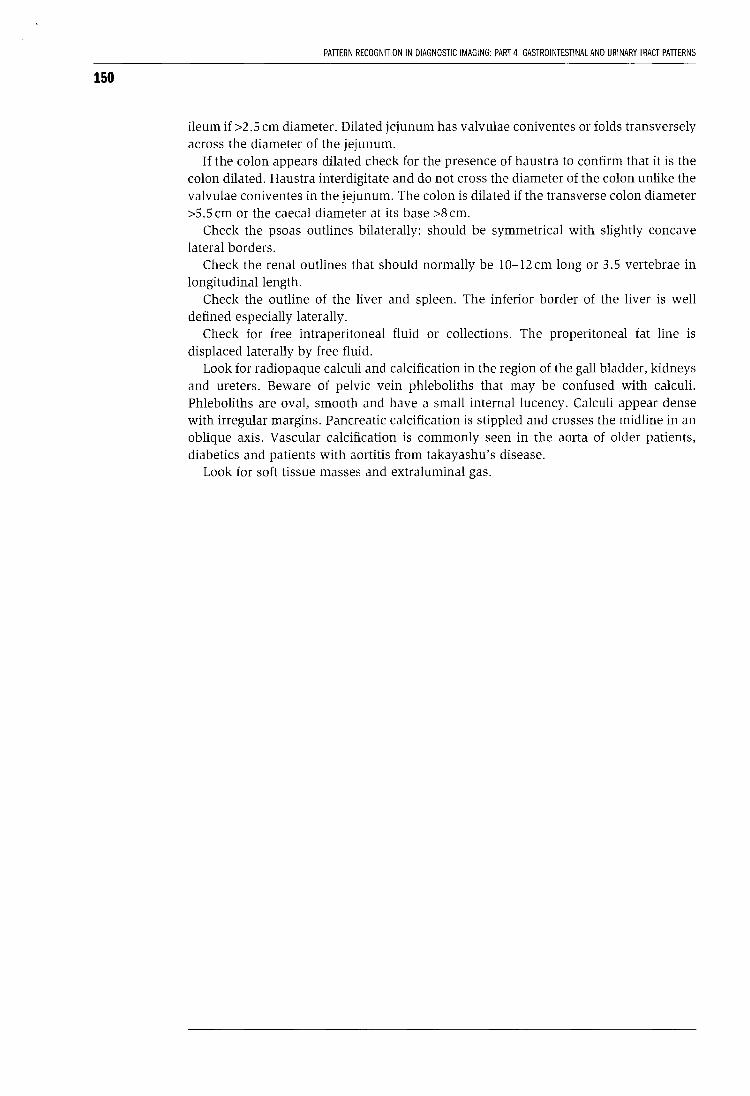
150
PATTERN RECOGNITION IN DIAGNOSTIC IMAGING: PART 4. GASTROINTESTINAL AND URINARY TRACT PATTERNS
ileum if >2.5 em diameter. Dilated jejunum has valvulae coniventes or folds transversely across the diameter of the jejunum.
If the colon appears dilated check for the presence of haustra to confirm that it is the colon dilated. Haustra interdigitate and do not cross the diameter of the colon unlike the valvulae coniventes in the jejunum. The colon is dilated if the transverse colon diameter >5.5 em or the caecal diameter at its base >8 em.
Check the psoas outlines bilaterally: should be symmetrical with slightly concave lateral borders.
Check the renal outlines that should normally be 10-12cm long or 3.5 vertebrae in longitudinal length.
Check the outline of the liver and spleen. The inferior border of the liver is well defined especially laterally.
Check for free intraperitoneal fluid or collections. The properitoneal fat line is displaced laterally by free fluid.
Look for radiopaque calculi and calcification in the region of the gall bladder, kidneys and ureters. Beware of pelvic vein phleboliths that may be confused with calculi. Phleboliths are oval, smooth and have a small internal lucency. Calculi appear dense with irregular margins. Pancreatic calcification is stippled and crosses the midline in an oblique axis. Vascular calcification is commonly seen in the aorta of older patients, diabetics and patients with aortitis from takayashu's disease.
Look for soft tissue masses and extraluminal gas.
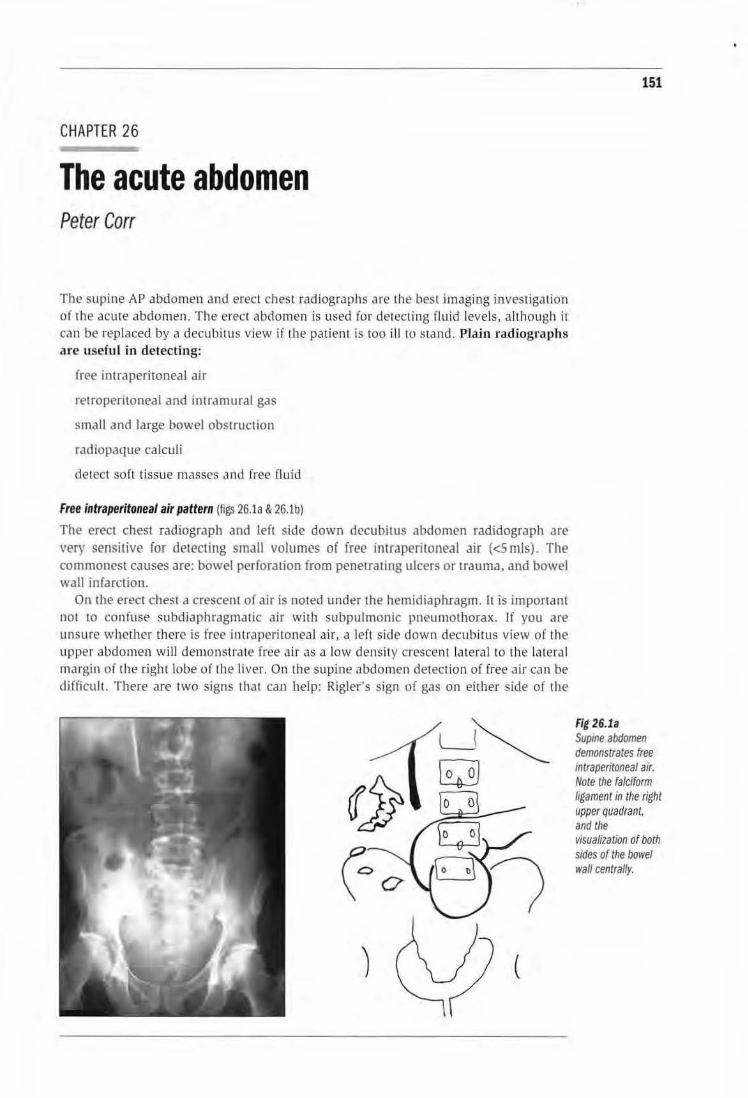
CHAPTER 26
The acute abdomen Peter Carr
The supine AP abdomen and erect chest radiographs are the best imaging investiga tion of the acu te abdomen. The erect abdomen is used for detecting fluid levels, although it can be replaced by a decubitus view if the patient is too ill to stand. PJain radiographs are useful in detecting:
free intraperitoneal air
retroperitoneal and intramural gas
small and large bowel obstruction
radiopaque calculi
detect soft tissue masses and free fl uid
Free Intraperitoneal air pattern (figs 26.1a & 26.1b)
The erect chest radiograph and left side down decubitus abdomen radidograph are very sensitive for detecting small volumes of free intraperitoneal air (<5 mls). The commonest causes are: bowel perforation from penetrating ulcers or trauma, and bowel wall infarction.
On the erect chest a crescent of air is noted under the hemidiaphragm. rt is important not to confuse subdiaphragmatic air wi th subpulmonic pneumothorax. lf you are unsure whether there is free intraperitoneal air, a left side down decubitus view of the upper abdomen wi ll demo nstrate free air as a low density crescen t lateral to the latera l margin of the right lobe of the livE-r. On the supine abdomen detection of [ree air can be difficult. There are two signs that can help: Rigler's sign of gas on either side of the
151
Fig 26.1a Supine abdomen demonstrates free mtraperitonea/ air. Note the falciform ligament in the right upper quadrant, and the VIsualization of both sides of the bowel wall centrally.
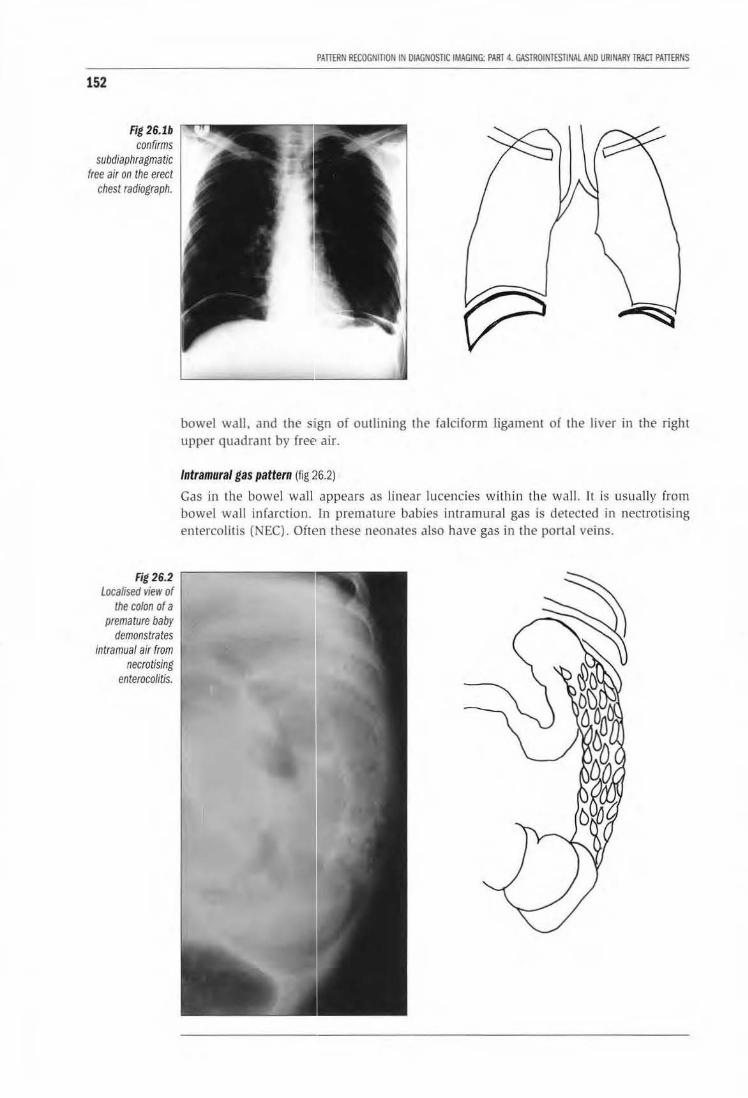
152
Fig 26.lb confirms
subdiaphragmatic free air on the erect
chest radiograph.
Fig 26.2 Localised vie•v of
the colon of a premature baby
demonstrates intramual air from
necrotising enterocolitis.
PATIERN RECOGNITION IN DIAGNOSTIC IMAGING: PART 4. GASTROINTESTINAL AND URINARY TRACT PATTERNS
bowel wall, and the sign of outlining the falciform ligament of the liver in the right upper quadrant by freE· air.
Intramural gas pattern {fig 26.2)
Gas in the bowel wall appears as linear lucencies within the wall. It is usually from bowel wall infarction. In premature babies intramural gas is detected in nectrotising emercolitis (NEC). Often these neonates also have gas in the portal veins.
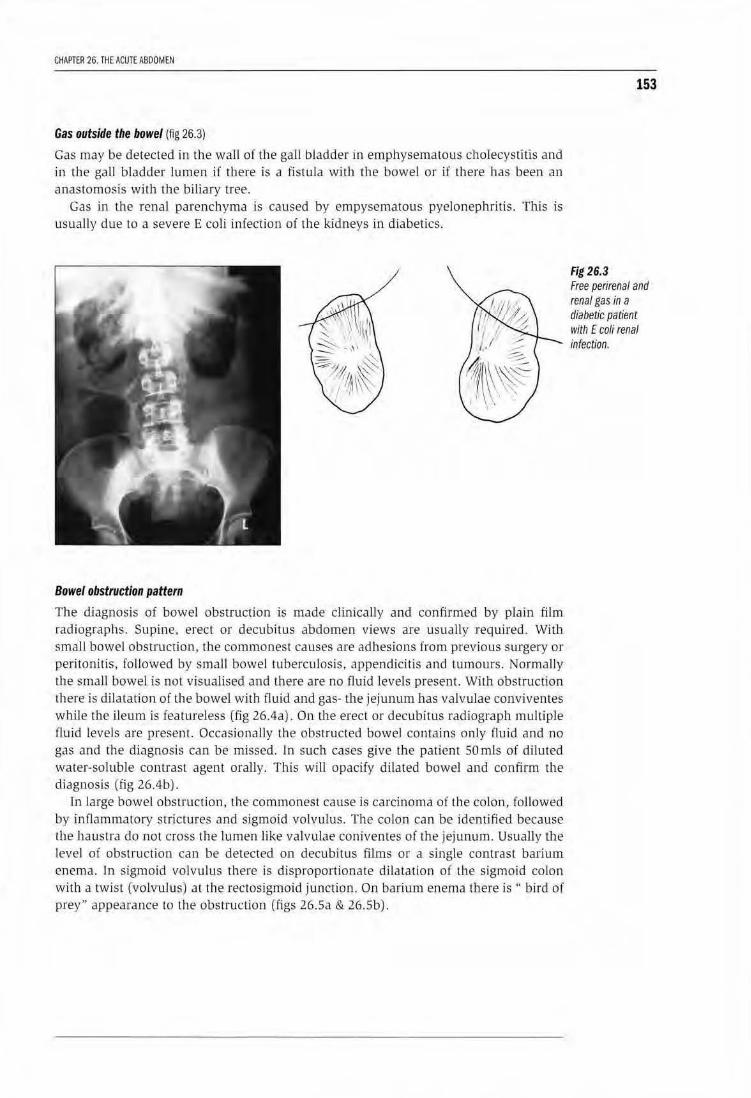
CHAPTER 26. THE ACUTE ABDOMEN
Gas outside the bowel (fig 26.3)
Gas may be detected in the wall of the gall bladder in emphysematous cholecystitis and in the gall bladder lumen if there is a fistula with the bowel or iJ there has been an anastomosis with the biliary tree.
Gas in the renal parenchyma is caused by empysematous pyelonephritis. This is usually due to a severe E coli infection of the kidneys in diabetics.
Bowel obstruction pattern
The diagnosis of bowel obstruction is made clinica lly and confirmed by plain film radiographs. Supine, erect or decubitus abdomen views are usually required. With small bowel obstruction, the commonest causes are adhesions from previous surgery or peritonitis, followed by small bowel tuberculosis, appendicitis and tumours. NormaJJy the small bowel is not visualised and there are no fluid levels present. With obstruction there is dilatation of the bowel wHh fluid and gas- the jejtmum has valvulae conviventes whHe the ileum is featureless (fig 26.4a). On the erect or decubitus radiograph multiple (luid levels are present. Occasionally the obstructed bowel contains on ly fluid and no gas and the diagnosis can be missed. In such cases give the patient 50mls of diluted water-soluble contrast agent oralJy. This will opacify dilated bowel and confirm tbe diagnosis (fig 26.4b) .
In large bowel obstruction, the commonest cause is carcinoma of the colon, followed by inflammatory strictures and sigmoid volvulus. The colon can be identified because the haustra do not cross the lumen like valvulae coniventes of the jejunum. Usually the level of obstruction can be detected on decubitus films or a single contrast barium enema. In s igmoid volvulus there is disproportionate dilatation of the sigmoid colon with a twist (volvulus) at theJectosigmoid junction. On barium enema there is'' bird of prey" appearance to the obstruction (figs 26.5a & 26.5b).
153
Fig 26.3 Free perirenal and renal gas in a diabetic patient with E coli renal infection.
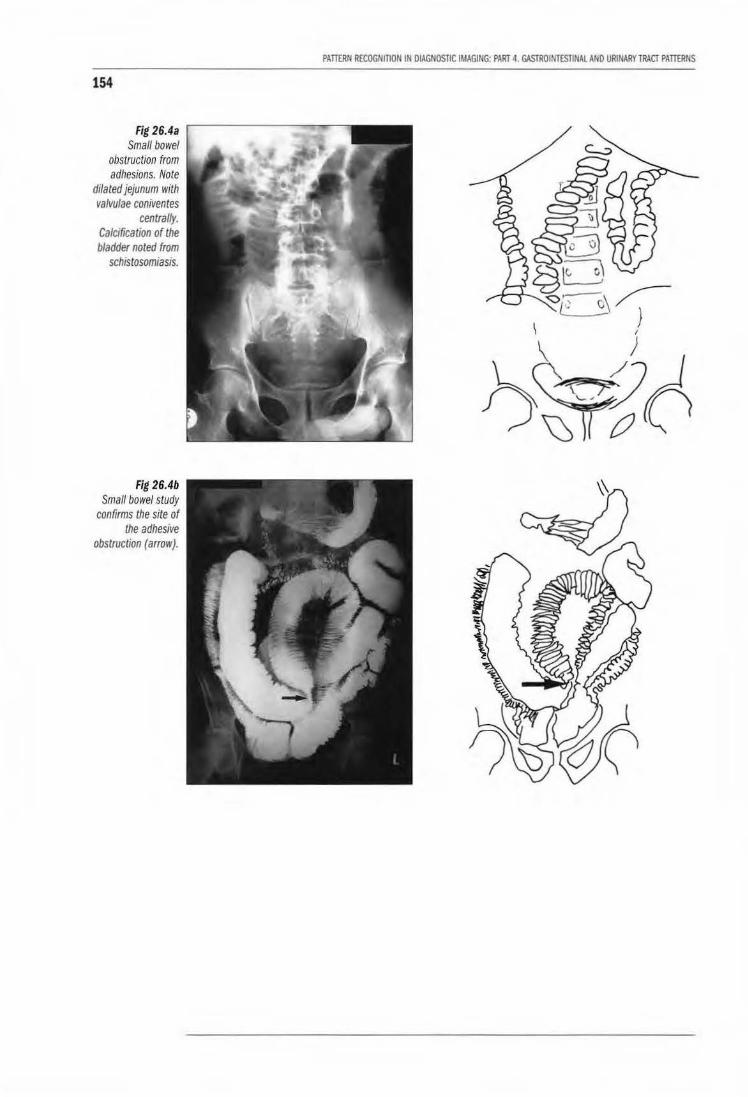
154
Fig 26.4a Small bowel
obstruction from adhesions. Note
dilated jejunum with valvulae coniventes
centrally. Calcification of the bladder noted from
schistosomiasis.
Fig 26.4b Small bowel study
confirms the site of the adhesive
obstruction (arrow).
PAllERN RECOGNITION IN DIAGNOSTIC IMAGING: PART 4. GASTROINTESTINAL AND URINARY lRACT PATIERNS
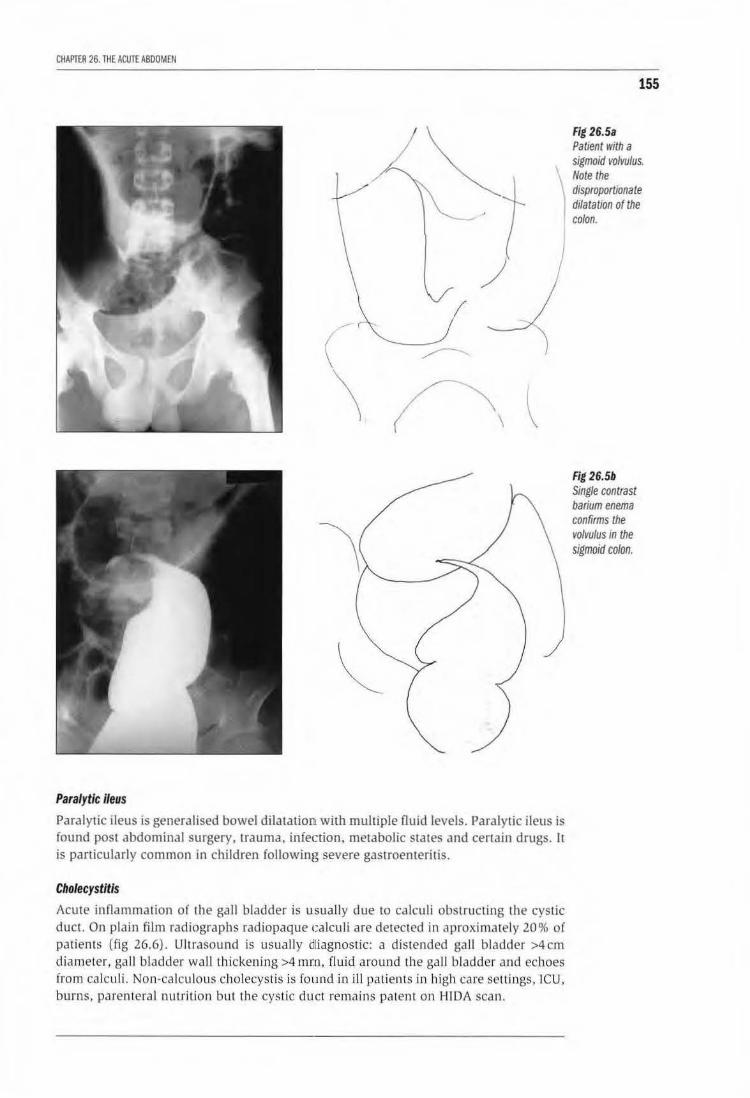
CHAPTER 26. THE ACUTE ABDOMEN
\ \
155
Fig 26.5a Patient with a sigmoid volvulus. Note the
) disproportionate dilatation of the colon.
Paralytic ileus
Paralytic ileus is generalised bowel dilatation with multiple Ouid levels. Paralytic ileus is found post abdominal surgery, trauma, infection, metabolic states and cenain drugs. It is panicularly common in children following severe gastroenteritis.
Cholecystitis
Acute inflammation of the gall bladder is usually due to ca lculi obstructing the cystic duct. On plain film radiographs radiopaque calculi are detected in aproxima tely 20% of patients (fig 26.6). Ultrasound is usuall y dliagnostic: a distended gaJI bladder >4cm diameter, ga ll bladder wall thickening >4 mr:n, fluid around the ga ll bladder and echoes from calculi. Non-ca lculous cholecystis is found in ill patien ts in high care settings , !CU. burns, parenteral nutrition but the cystic duct remains patent on HIDA scan.
Fig 26.5b Single contrast barium enema confirms the volvulus in the sigmoid colon.
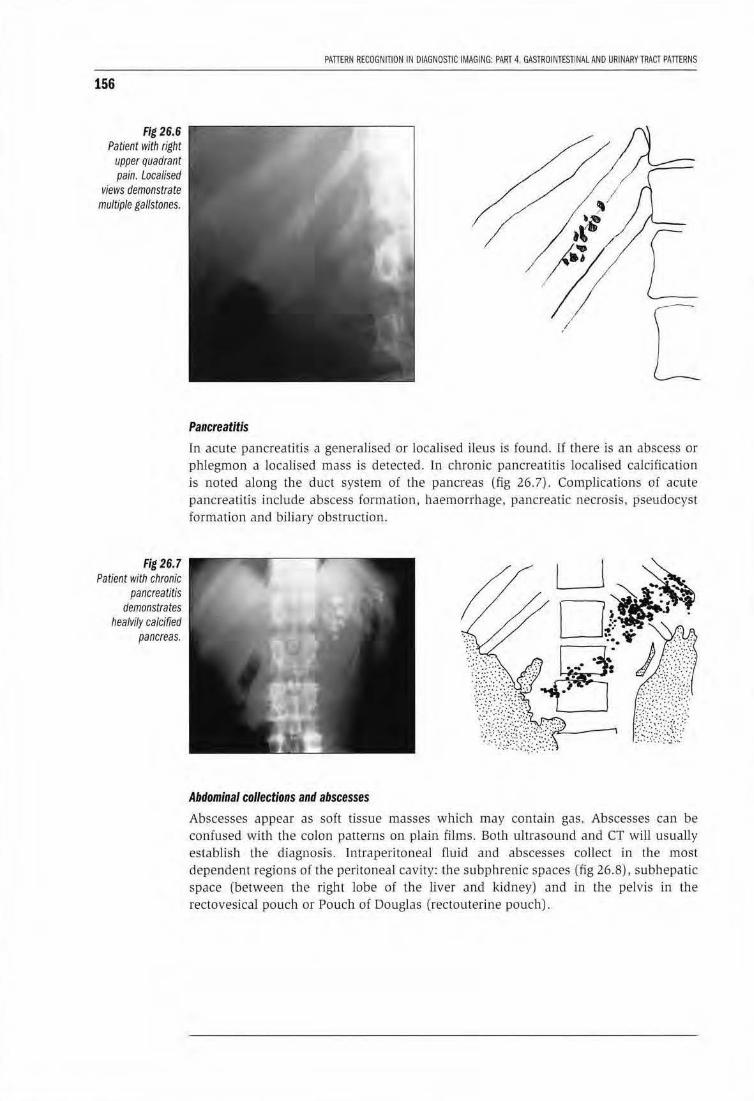
156
Fig 26.6 Patient with right
upper quadrant pain. Localised
views demonstrate multiple gallstones.
Fig 26.7 Patient with chronic
pancreatitis demonstrates
healvi/y calcified pancreas.
PATIERN RECOGNITION IN DIAGNOSTIC IMAGI NG: PART 4. GASTROINTESTINAL AND URINARYlRACT PATIERNS
Pancreatitis
[ [
In acute pancreatitis a generalised or localised ileus is found. If there is an abscess or phlegmon a localised mass is detected. In chronic pancreatitis locaUsed calcification is noted along the duct system of the pancreas (fig 26.7). Complications of acute pancreati tis include abscess formation. haemorrhage. pancreatic necrosis, pseudocyst formation and biliary obstruction.
Abdominal collections and abscesses Abscesses appear as soft tissue masses which may contain gas. Abscesses can be confused with the colon patterns on plain films. Both ultrasound and CT will usually establish the diagnosis. Intraperitoneal fluid and abscesses collect in the most dependent regions of the peritoneal cavity: tb e subphrenic spaces (fig 26.8), subhepatic space (between the right lobe of the liver and kidney) and in the pelvis in the rectovesical pouch or Pouch of Douglas (rectouterine pouch).
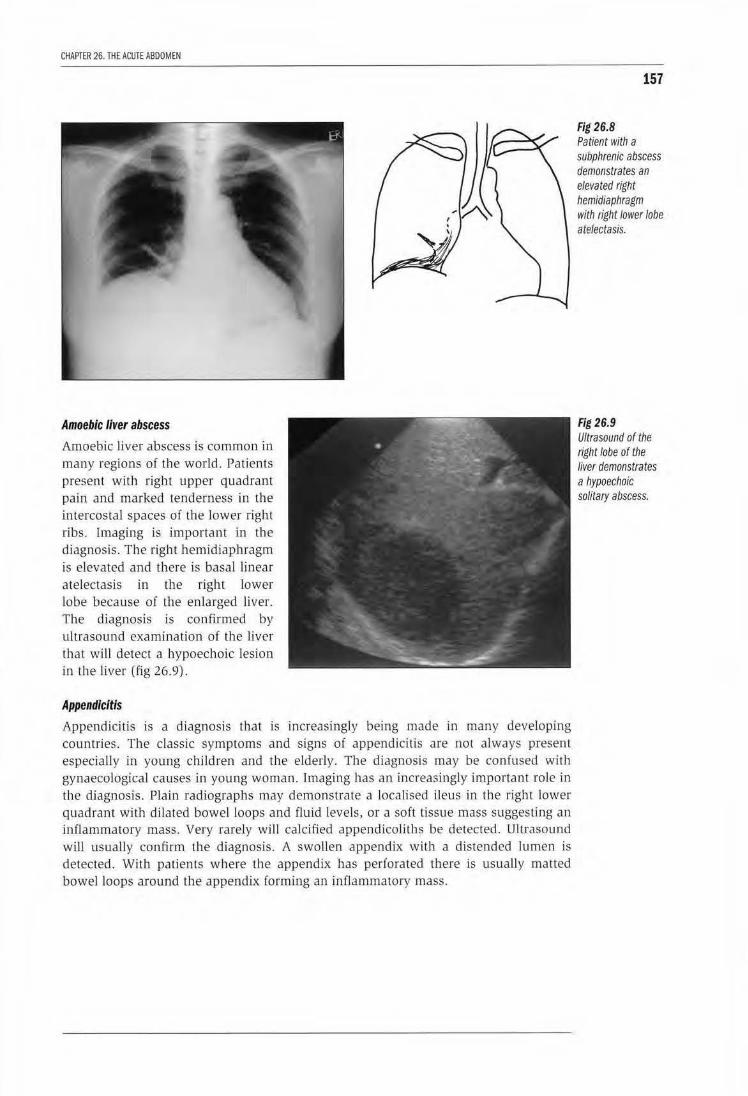
CHAPTER 26. THE ACUTE ABDOMEN
Amoebic liver abscess
Amoebic liver abscess is common in many regions of the world. Patients present with right upper quadrant pain and marked tenderness in the intercostal spaces of the lower right ribs. [maging is important in the diagnosis. The right hemidiaphragm is elevated and there is basal linear a telectasis in the right lower lobe because of the enlarged liver. The diagnosis is confirmed by ultrasound examination of the liver that will detect a hypoechoic lesion in the liver (fig 26.9).
Appendicitis
Appendici tis is a diagnosis that is increasingly being made in many developing countries. The classic symptoms and signs of appendicitis are not always present especia lly in young children and the elderly. The diagnosis may be confused with gynaecological causes in young woman. Imaging has an increasingly important role in the diagnosis. Plain radiographs may demonstrate a localised ileus in the right lower quadrant with di lated bowel loops and fluid levels, or a soft tissue mass suggesting an inflammatory mass. Very rarely will calcified appendico li ths be detected. Ultrasound will usually confirm the diagnosis. A swollen appendix with a distended lumen is detected. With patients where the appendix has perforated there is usually matted bowel loops around the appendix forming an inflam matory mass.
157
Fig 26.8 Patient with a subphrenic abscess demonstrates an elevated right hemidiaphragm with right lower lobe atelectasis.
Fig 26.9 Ultrasound of the right lobe of the liver demonstrates a hypoechoic solitary abscess.

158
PATTERN RECOGNITION IN DIAGNOSTIC IMAGING: PART 4. GASTROINTESTINAL AND URINARY TRACT PATTERNS
LEARNING POINTS: ACUTE ABDOMEN
• In suspected perforation, the supine abdomen and erect chest film or left side down decubitus abdomen are the most sensitive investigation to detect free air.
• Intramural gas usually indicates bowel wall infarction.
• Gas in the perirenal tissues and kidneys is found in acute renal infections in diabetics.
• In suspected small bowel obstruction the supine abdomen is more sensitive than the erect film. Beware of fluid filled dilated loops with no fluid levels; give the patient a water soluble contrast agent to confirm the diagnosis. Common causes: adhesions, inflammatory bowel disease.
• In suspected large bowel obstruction the supine abdomen and decubitus abdominal radiographs are especially sensitive. If unsure of the site of obstruction perform a dilute 1:6 single contrast barium enema to demonstrate the site of obstruction. Common causes: carcinoma, inflammatory disease, volvulus. In volvulus there is disproportionate bowel dilatation.
Reference 1. FieldS. The Abdomen. In: Diagnostic Radiology: a textbook of medical imaging, 1997. Eds
Grainger RG, Allison DJ. Publisher: Churchill Livingstone, Edinburgh.

CHAPTER 27
Gastrointestinal contrast studies Peter Corr
Contrast media
Barium sulphate The most common orJI contrast used in the gastJointestinJI tract is barium sulphate. It is an inert powder U1a1 is reconstituted into a suspension with water. Barium is saft' 10 use for many investigations except:
• when there is a suspicion of bowel perforation
• when there is a likelihood of aspiration of barium into the lungs
• in the presence of complete bowel obstruction
Non·ionic water soluble contrast media These agents are especially useful in detecting bowel perforation and when there is total oesophageal or bowel obstruction. Non-ionic constrast agents that are iso osmolar are the preferred agents in neonJtes and very ill infants.
Barium swallow (fig 27 .1)
A b<uium swallow is indicated with patients with dysphagia or suspected oesophageal reflux. If total oesophageal obstruction from oesophageal cancer is suspected it is best to
Fig 27.1 Normal barium swallow.
159
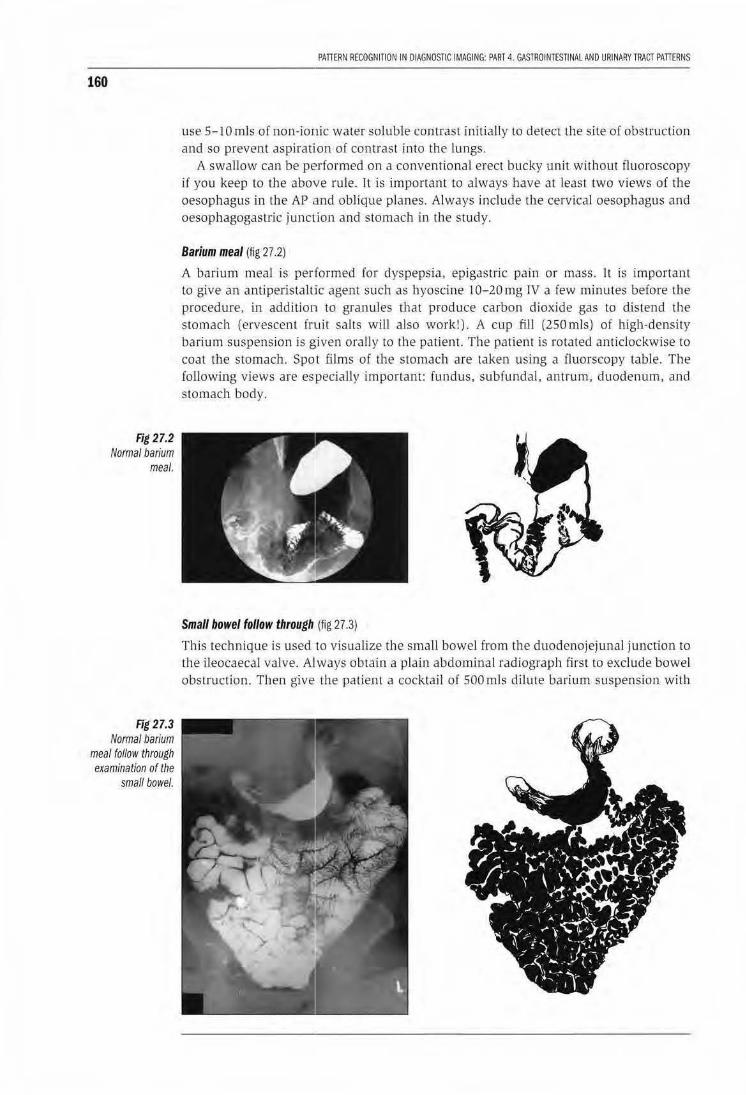
160
Fig 27.2 Normal barium
meal.
Fig 27.3 Normal barium
meal follow through examination of the
small bowel.
PAnERN RECOGNITION IN DIAGNOSTIC IMAGING: PART 4. GASTROINTESTINAl AND URINARY TRACT PAnERNS
use S-1 0 mls of non-ionic water soluble contrast initia lly to detect the site of obstruction and so prevent aspiration of contrast into the lungs.
A swallow can be performed on a conventional erect bucky unit withoul fluoroscopy if you keep to the above rule. rt is important w always have at least two views of the oesophagus in Lhe AP and oblique planes. Always include U1e cervical oesophagus and oesophagogastric junction and stomach in the study.
Barium meal (fig 27.2)
A bariLUn meal is performed for dyspepsia, epigastric pain or mass. It is important to give an antiperistaltic agent such as hyoscine 10-20 mg rv a few minutes before the procedure, in addition to granuJes that produce carbon dioxide gas to distend the stomach (ervescent fwit salts will also work!). A cup fill (250mls) of high-density barium suspension is given orally to tl1e patient. The patient is rotated anticlockwise to coat the stomach. Spot films of the stomach are taken using a Cluorscopy table. The following views are especiaJ ly important: fundus, subfundal, antrum, duodenum, and stomach body.
Small bowel follow through (fig 27.3)
This technique is used to visualize the small bowel from the duodenojejunal junction to the ileocaecal valve. Always obtain a plain abdominal radiograph firsl to exclude bowel obstruction. Then give the patient a cocktail of SOOmls dilute ba rium suspension with
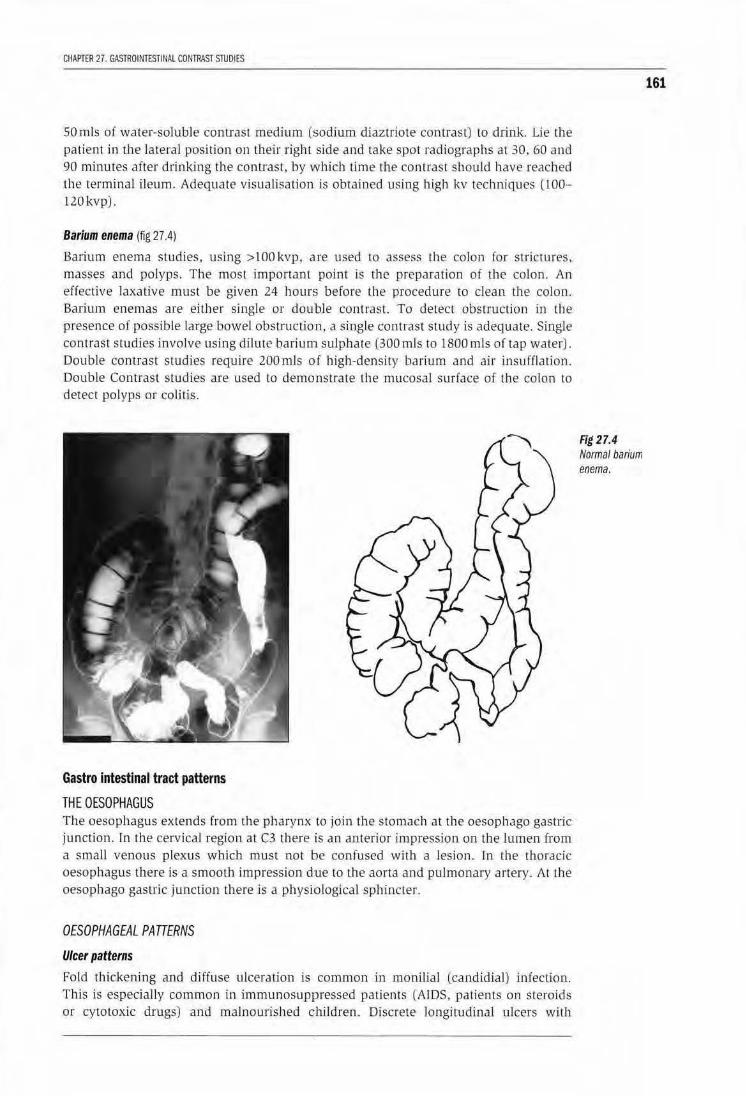
CHAPTER 27. GASTROINTESHNAl CONTRAST STUDIES
SOmis of water-soluble contrast medium (sodium diaztriote contrast) to drink. Lie the patient in tbe lateral position on their right side and take spot radiographs at 30, 60 and 90 minutes after drinking the contrast, by which time the cont rast should have reached the terminal ileum. Adequate visualisation is ob tained using high kv techniques (l00-120kvp).
Barium enema (fig 27.4)
Baiium enema studies, using >100kvp, a.re used to assess t.he colon for s tric tures. masses and polyps. The most imponant point is the preparation of the colon. An effective laxative must be given 24 hours before lhe procedure to clean the colon. Barium enemas are either single or double contrast. To detect obstruction in the presence of possible large bowel obstruction . a single contrast study is adequate. Single contrast studies involve using dilute barium sulphate (300 mls to 1800 mls of tap water). Double contrast studies require 200mls of high-densi ty barium and air insufflation. Double Contrast studies are used to demonstrate the mucosal surface of the co lon to detect polyps or colitis.
Gastro intestinal tract patterns
THE OESOPHAGUS The oesophagus extends from the pharynx to join the stomach at the oesophago gastric junction. fn Lbe cervical region at C3 there is an anterior impression on the lumen from a small venous ple.>..'Us which must not be confused with a lesion. In the thoracic oesophagus there is a smoolh impression due to the aorta and pulmonary artery. At the oesophago gastric junction there is a physiological sphincter.
OESOPHAGEAL PATTERNS
Ulcer patterns
Fold thickening and diffuse ulceration is common in monilial tcandidial) infection. This is especially common in immunosuppressed paLients [AIDS, patients on steroids or cytotoxic d.rugs) and malnourished children . Discrete longitudinal ulcers wi th
Fig 27.4 Normal barium enema.
161
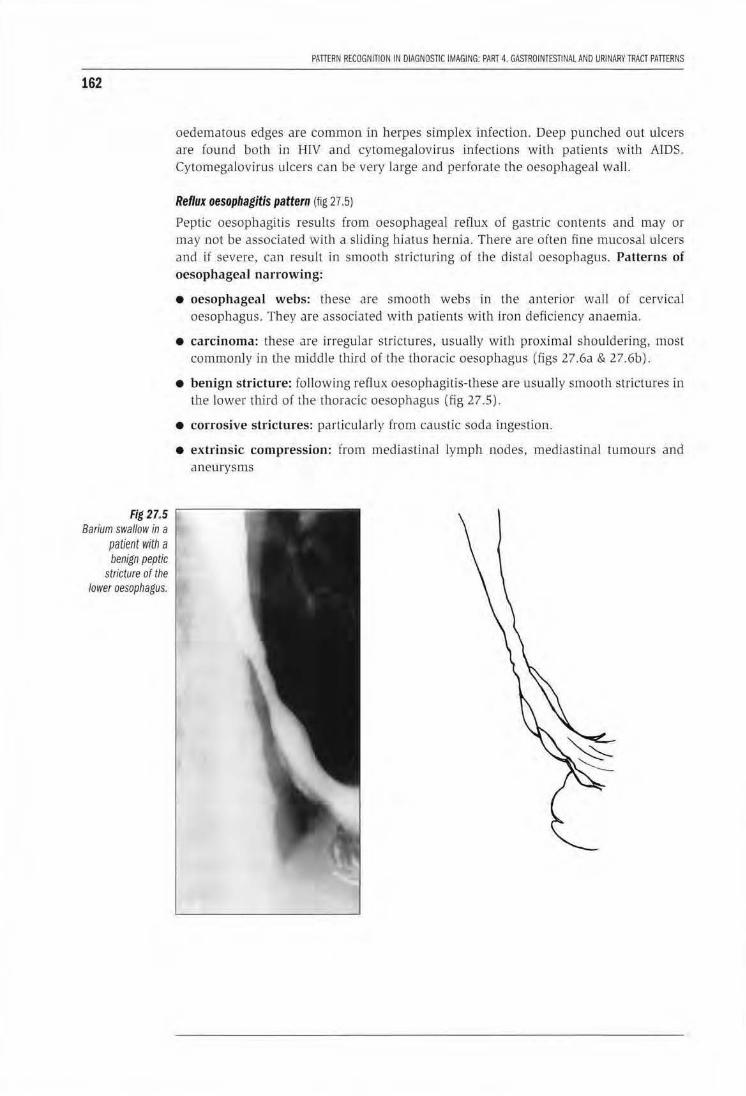
162
Fig 27.5 Barium swallow in a
patient with a benign peptic
stricture of the lower oesophagus.
PATIERN flECOGNITION IN DIAGNOSTIC IMAGING: PART 4. GASTROINTESTINAL AND URINARY TRACT PATTERNS
oedematous edges are common in herpes simplex infection. Deep punched out ulcers are found both in HlV and cytomegalov irus infections with patients with AJDS. Cytomegalovirus ulcers can be very large and perforate the oesophageal wall.
Reflux oesophagitis pattern (fig 27 .5)
Peptic oesophagitis results from oesophageal reflux of gastric contents and may or may not be associated with a sliding hiatus hernia. There are often fine mucosal ulcers and if severe, can result in smooth stricturing of the distal oesophagus. Patterns of oesophageal narrowing:
• oesophageal webs: these are smooth webs in Lhe a11terior wall of cervical oesophagus. They are associated with patiems with Iron deficiency anaemia.
• carcinoma: these are irregular strictures, usually with proximal shouldering, most commonly in the middle third of the thoracic oesophagus (figs 27.6a & 27.6b).
• benign stricture: fo llowing reflux oesophagitis-these are usually smooth strictures in the lower third of the thoracic oesophagus (fig 27 .5).
• corrosive strictures: particularly from causlic soda ingestion.
• extrinsic compression: from mediastinal lymph nodes , mediastinal tumours and aneurysms
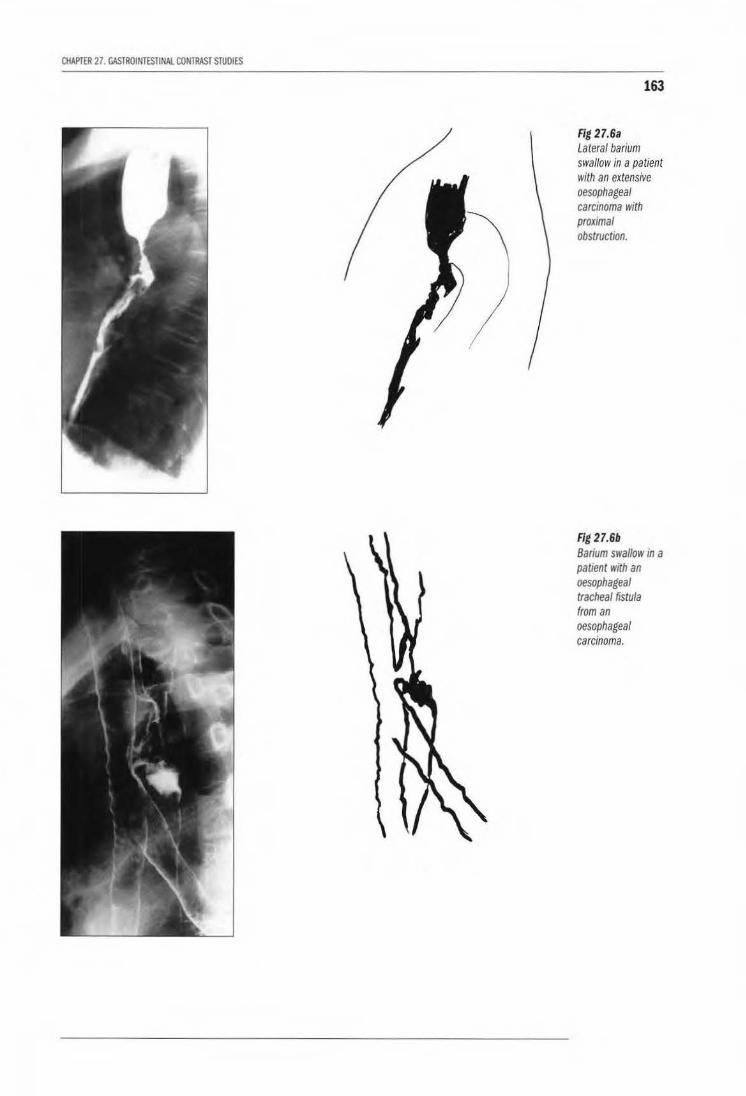
CHAPTER 27. GASTROINT£ST1NALCOHTRAST STUDIES
163
Fig 27.6a Lateral barium swallow in a patient with an extensive oesophageal carcinoma with proximal obstruction.
Fig 27.6b Barium swallow in a pat1ent with an oesophageal tracheal fistula from an oesophageal carcinoma.
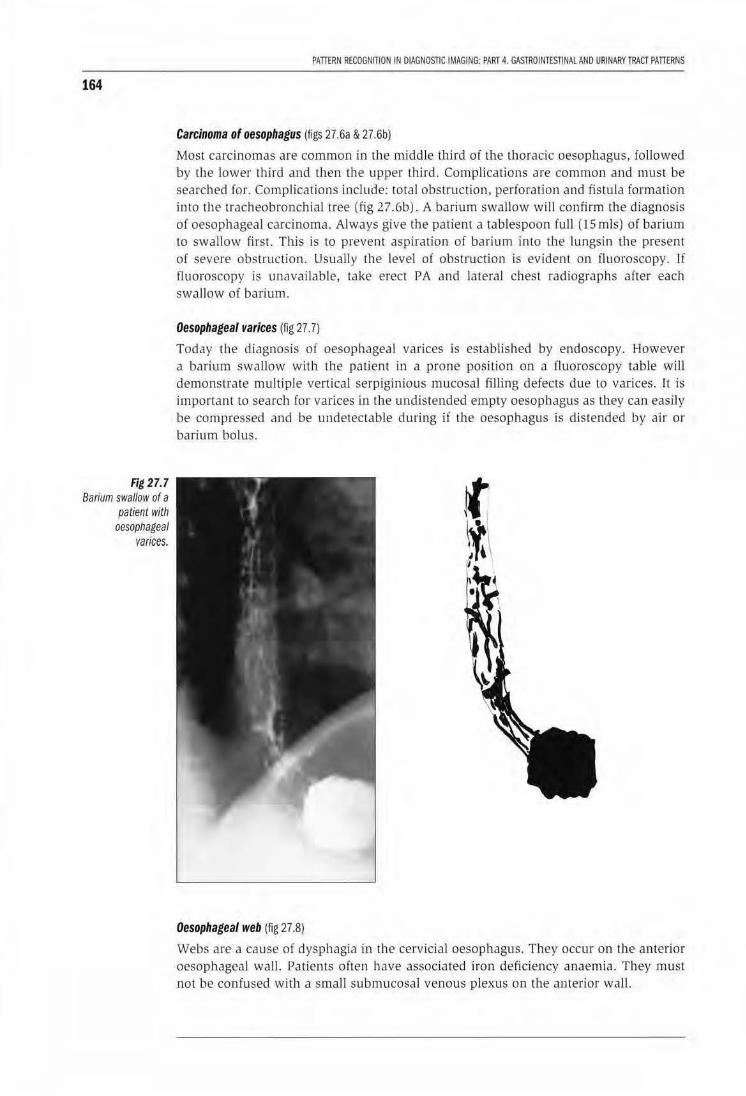
164
Fig 27.7 Barium swallow of a
patient with oesophageal
varices.
PATTERN RECOGNITION IN DIAGNOSTIC IMAGING: PART 4. GASTROINTESnNAL AND URINARY TRACT PATTERNS
Carcinoma of oesophagus (figs 27.6a & 27.6b}
Most carcinomas are common in the middle third of the thoracic oesophagus, followed by the lower third and then Lhe upper third. Complications are common and must be searched for. Complications include: total obstruction, perforation and fistu la formation into the tracheobronchial tree (fig 27.6b). A barium swallow will confirm the diagnosis of oesophageal carcinoma. Always give the patient a tablespoon full (15 mls) of barium to swallow first. This is to prevent aspiration of barium into U1e lungsin the present of severe obstruction. Usually the level ol obstruction is evident on fluoroscopy. lf fluoroscopy is unavailable, take erect PA and lateral chest radiographs after each swallow of barium.
Oesophageal varices (fig 27. 7)
Today the diagnosis of oesophageal varices is established by endoscopy. However a barium swallow with the patient in a prone position on a fluoroscopy table will demonstrate multiple vertical serpiginious mucosal filJing defects due to varices. It is important to search for varices in the undistended empty oesophagus as they can easily be compressed and be undetectable during ii the oesophagus is distended by air or barium bolus.
Oesophageal web (fig 27.8)
Webs are a cause of dysphagia in the cervicia l oesophagus. They occur on the anterior oesophageal wall. Patients ofLen have associaLed iron deficiency anaemia. They must not be confused with a small submucosal venous plexus on the anterior wall.
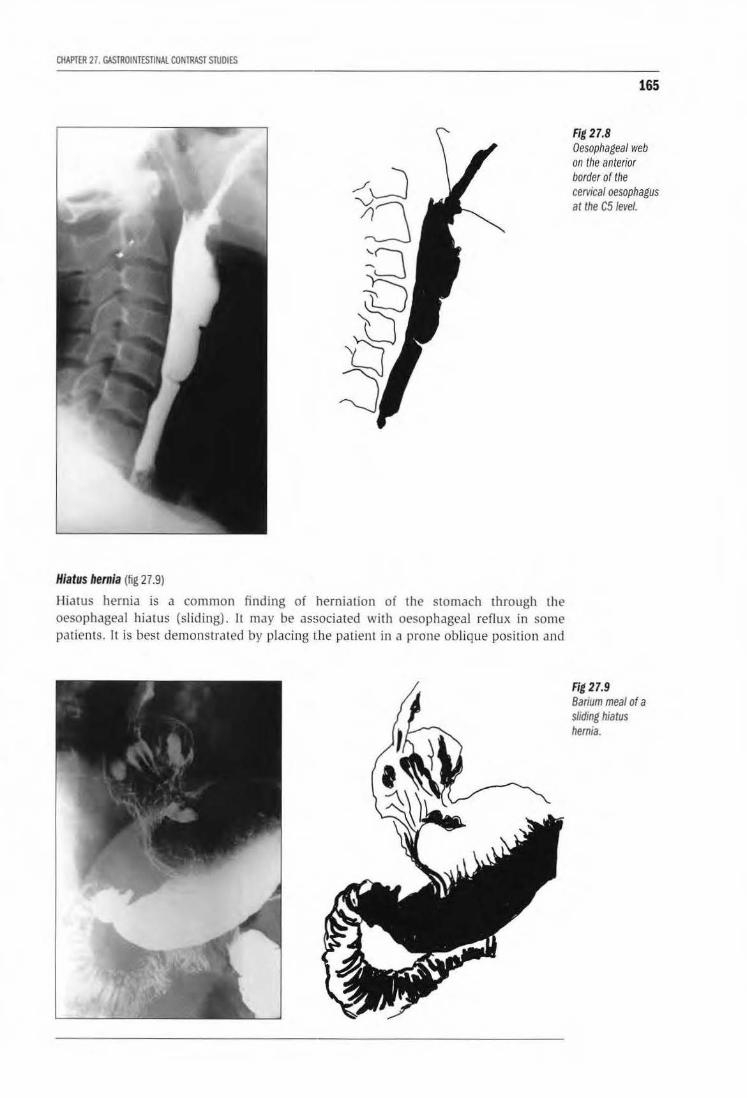
CHAPTER 27. GASTROINTESTINAL CONTRAST STUDIES
Hiatus hernia (fig 27.9)
Hiatus hernia is a common finding of herniation of the stomach through the oesophageal hiatus (sliding). ll may be associated with oesophageal reflux in some patients. 1l is best demonstrated by placing the patient in a prone oblique position and
165
Fig 27.8 Oesophageal web on the anterior border of the cervical oesophagus at the C51evel.
Fig 27.9 Banum meal of a sliding hiatus hernia.
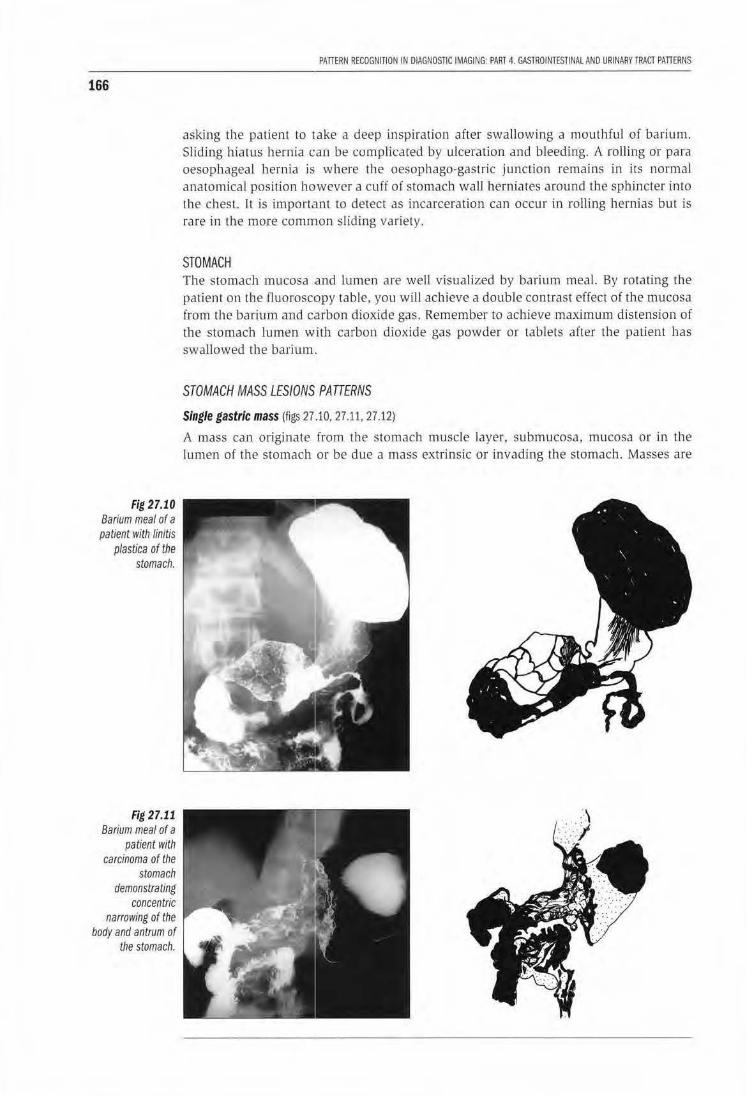
166
Fig 27.10 Barium meal of a patient with linitis
p/astica of the stomach.
Fig 27.11 Barium meal of a
patient with carcinoma of the
stomach demonstrating
concentric narrowing of the
body and antrum of the stomach.
PATTERN RECOGNITION IN DIAGNOSTIC IMAGING: PARl 4. GASlROINTESTINAl AND URINARY TRACT PATTERNS
asking the patient to take a deep inspiration after swallowing a mouthful of barium. Slicting hiarus hernia can be complicated by ulceration and bleeding. A rolling or para oesophageal hernia is where the oesophago-gastric junction remains in its normal anatomical position ho·wever a cuff of stomach wall herniates around the sphincter into the chest. lt is important w detect as incarceration can occur in rolling hernias but is rare in the more common sliding variety.
STOMACH The stomach mucosa and lumen are well visualized by barium meal. By rotating the patient on the fluoroscopy table , you will achieve a double contrast effect of the mucosa from the barium and c.arbon dioxide gas. Remember to achjeve maximum distension of the stomach lumen with carbon dioxide gas powder or tablets afler the patient has swallowed the barium.
STOMACH MASS LESIONS PATTERNS
Single gastric mass (figs 27 .10, 27.11, 27.12)
A mass can originate from the stomach muscle layer. submucosa, mucosa or in the lumen of the stomach or be due a mass extrinsic or invading the swmach. Masses are
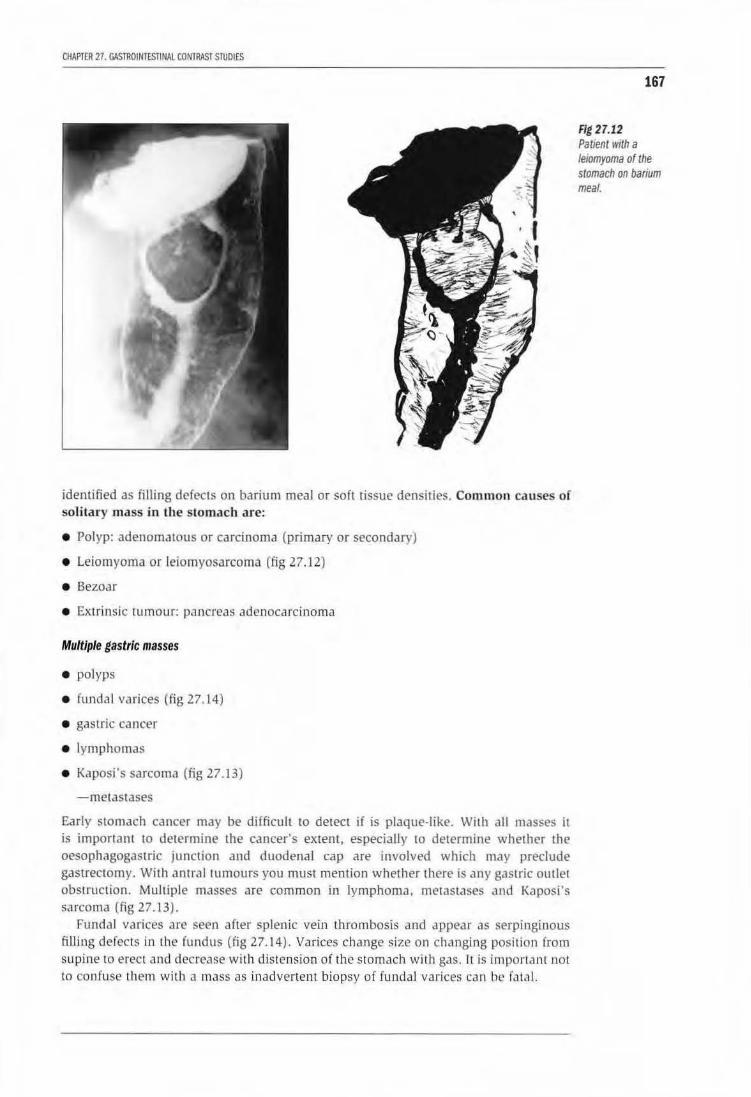
CHAPTER 27. GASmOtNlESTINAl CONIRASl STUDIES
identified as filling defects on barium meal or soft tissue densities. Common causes of solitary mass in the stomach are:
• Polyp: adenomatous or carcinoma (primary or secondary)
• Leiomyoma or leiomyosarcoma (fig 27 .12)
• Bezoar
• Extrinsic tumour: pancreas adenocarcinoma
Multiple gastric masses
• polyps
• fundal varices {fig 27.1.4)
• gastric cancer
• lymphomas
• Kaposi"s sarcoma (fig 27.13)
-metastases
Early stomach cancN may be difficult to detect if is plaque-like. With all masses it is important to determine the cancer's extent, especially to determine whether the oesophagogastric junction and duodenal cap are involved which may preclude gastrectomy. With antral tumours you must mention whether there is any gastric outlet obstruction. Multiple masses are common in lymphoma, metastases and Kaposi's sarcoma (fig 27.13).
Fundal varices are seen after splenic vein thrombosis and appear as serpinginous filling defects in the fundus (fig 27.14). Varices change size on changing position from supine to erect and decrease with distension of the stomach with gas. It is important not to confuse them with il mass as inadvertent biopsy of fundal varices can be fa tJI ..
167
Fig 27.12 PatJent 1vtth a leiomyoma of the stomach on barium meal.
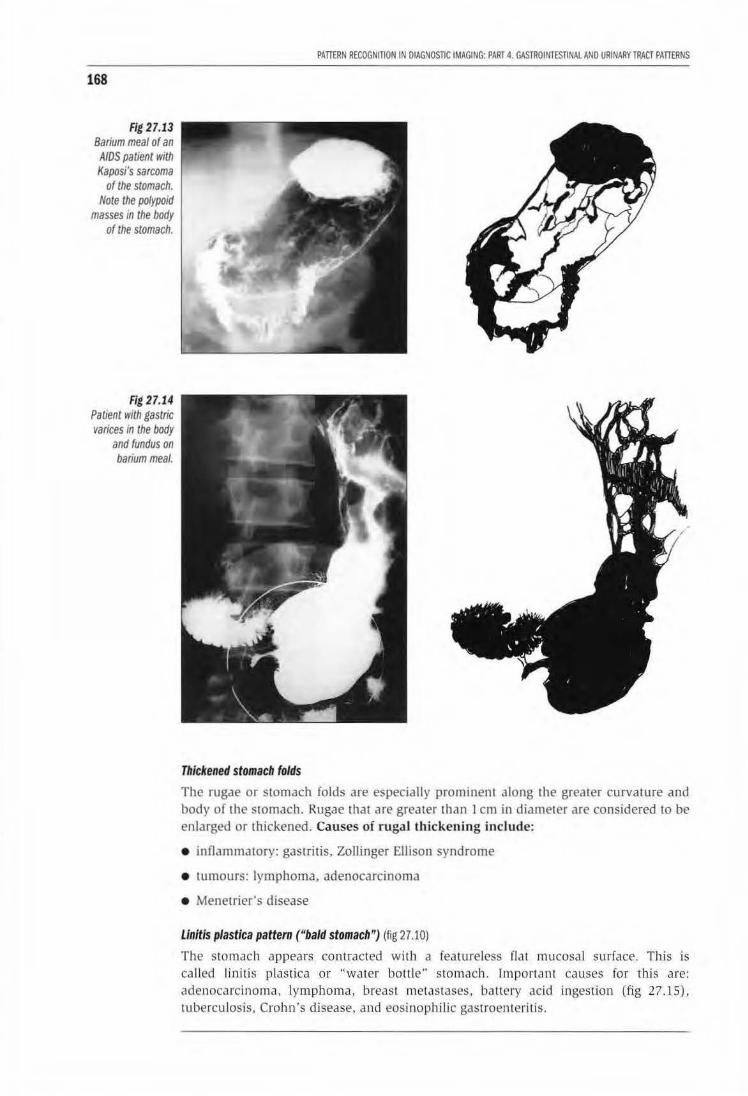
168
Fig 27.13 Barium meal of an
AIDS patient with Kaposi's sarcoma
of the stomach. Note the polypoid
masses in the body of the stomach.
Rg 27.14 Patient with gastric varices m the body
and fundus on barium meal.
PATTERN RECOGNITION IN DIAGNOSTIC IMAGING: PART 4. GASTROINTESTINAL AND URINARY TRACT PATIERNS
Thickened stomach folds
The rugae or stomach folds are especially prominent along the greater curvalure and body of the stomach. Rugae rhat are greater than 1 em in diameter are considered to be enlarged or thickened. Causes of rugal thickening include:
• innammatory: gastritis, Zollinger Ellison syndrome
• tumours: lymphoma, adenocarcinoma
• Menetrier's disease
Linitis plastica pattern ("bald stomach") (fig 27.10)
The stomJch appears contracted wi th a featureless flat mucosal surface. This is ca lled linitis plastica or "water bolt le'· stomach. Important causes for this are: adenocarcinoma, lymphoma, breast metastases, battery acid ingestion (fig 27.15). tuberculosis, Crohn's disease, and eosinophilic gastroenLeritis.
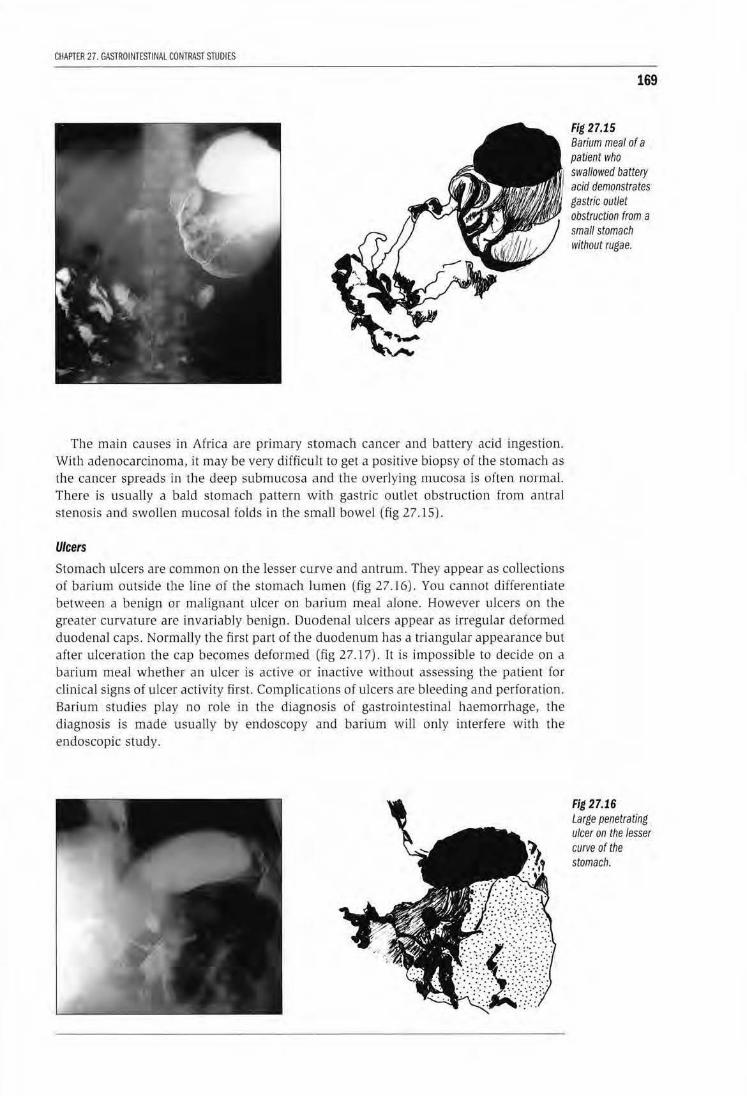
CHAPTER 27. GASTROINTESTINAL CONTRAST STUDIES
The main causes in Africa are primary sltomach cancer and battery acid ingestion. With adenocarcinoma, it may be very difficult to get a positive biopsy of the stomach as lhe cancer spreads in the deep submucosa and the overlying mucosa is often normal. There is usually a bald sromach pattern with gastric outlet obstruction from antral stenosis and swollen mucosal folds in the small bowel lfig 27. 15).
Ulcers
Stomach ulcers are common on the lesser cu.rve and antrum. They appear as collections of barium outside the line of the stomach lumen (fig 27.16). You cannot differentiate between a benign or malignant ulcer on barium meal alone. However ulcers on the greater curvature are invariably benign. Duodenal ulcers appear as irregular deformed duodenal caps. Normally the first part of the duodenum has a triangular appearance but after ulceration the cap becomes deformed (fig 27.17). It is impossible to decide on a barium meal whether an ulcer is active or inactive without assessing the patient for clinical signs of ulcer activity first. Cornplicat'ions of ulcers are bleeding and perforation. Barium studies play no role in the diagn,osis of gastrointestinal haemorrhage, the diagnosis is made usually by endoscopy and barium will only interfere with the endoscopic study.
169
Fig 27.15 Barium meal of a patient who swallowed battery acid demonstrates gastric outlet obstruction from a small stomach without rugae.
Fig 27.16 Large penetrating ulcer on the lesser cuNe of the stomach.
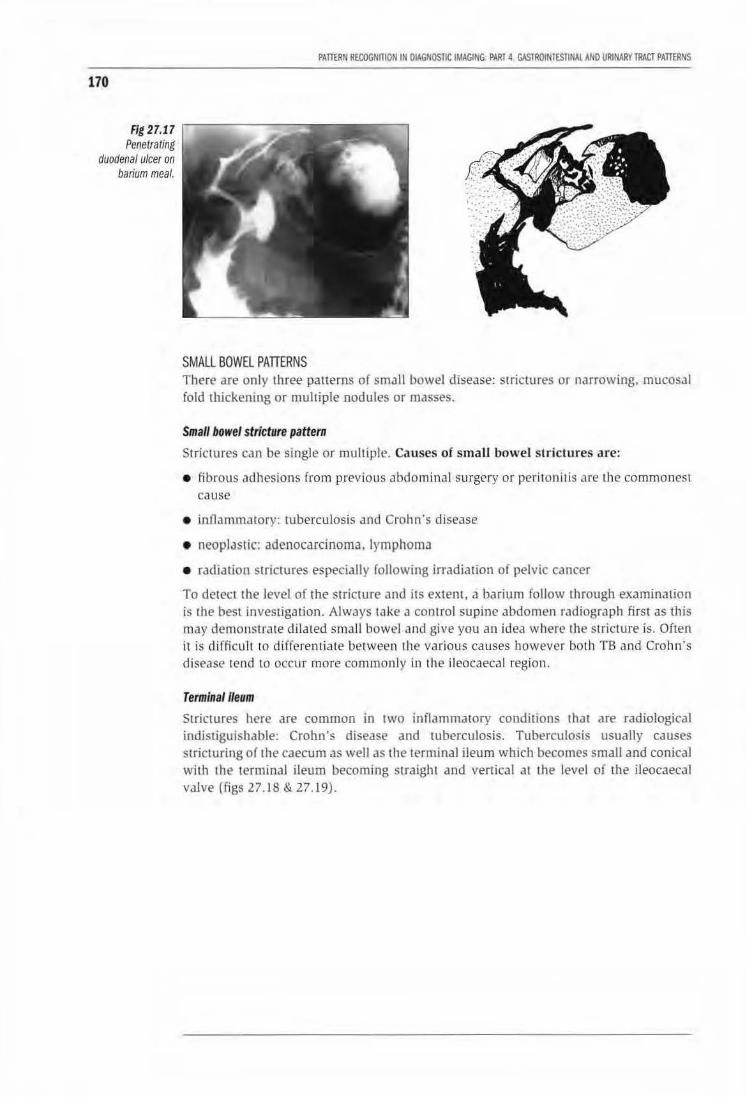
170
Fig 27.17 Penetrating
dtJodenalt.Jicer on barium meal.
PATlERN R£COGNntON IN DIAGNOSTIC IMAGING: PART 4. GASTROIN1£Sl1N4l AND URINARY TRACT PATIERNS
SMALL BOWEL PATIERNS There are only lhree patterns of small bowel disease: strictures or narrowing, mucosal fold thickening or multiple nodules or masses.
Small bowel stricture pattern
Strictures can be single or multiple. Causes of small bowel strictures are:
• fibrous ad hesions from previous abdominal surgery or peritonitis are the commonest cause
• inilarnmatory: tuberculosis and Crohn's disease
• neopldstic: adenocarcinoma. lymphoma
• radiation strictures especially following irradiation of pelvic cancer
To detect the level of the stricture and its extent, a barium follow through examination is the best investigation. Always take a control supine abdomen radiogrilph first as this may demonstrate dilated smaJI bowel am1 give you an idea where the stricture is. Often it is difficult 10 differentiate between the various causes however both TB and Crohn's disease tend to occur more commonly in the ileocaecal region.
Terminal ileum
Strictures here are common in two inrlammatory conditions that are radiological indistiguishable: Crohn's disease and tuberculosis. Tuberculosis usually causes strictu ring of the caecum as well as the terminal ileum which becomes small and conical with the terminal ileum becoming straight and vertical at the level of the ileocaecal valve {figs 27.18 & 27.19).
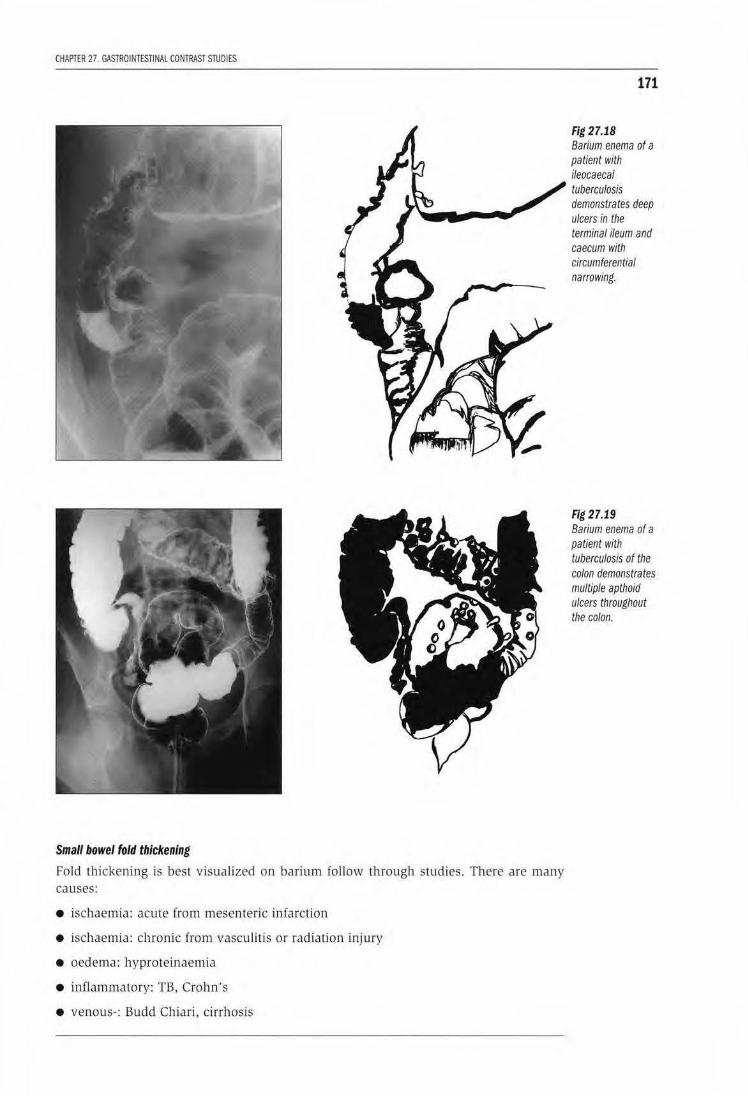
CHAPTER 27. GASTROINTESTINAL CONTRAST STUDI ES
Small bowel fold thickening
Fold thickening is best visualized on barium follow through studies. There are man y causes:
• ischaemia: acute from mesenteric infarction
• ischaemia: chronic from vasculitis or radiation injury
• oedema: hyproteinaemia
• inflammatory: TB, Crohn' s
• venous-: Budd Chiari, cirrhosis
171
Fig 27.18 Barium enema of a patient with ileocaecal tuberculosis demonstrates deep ulcers in the terminal ileum and caecum with circumferential narrowing.
Fig 27.19 Barium enema of a paUent with tuberculosis of the colon demonstrates multiple apthoid ulcers throughout the colon.
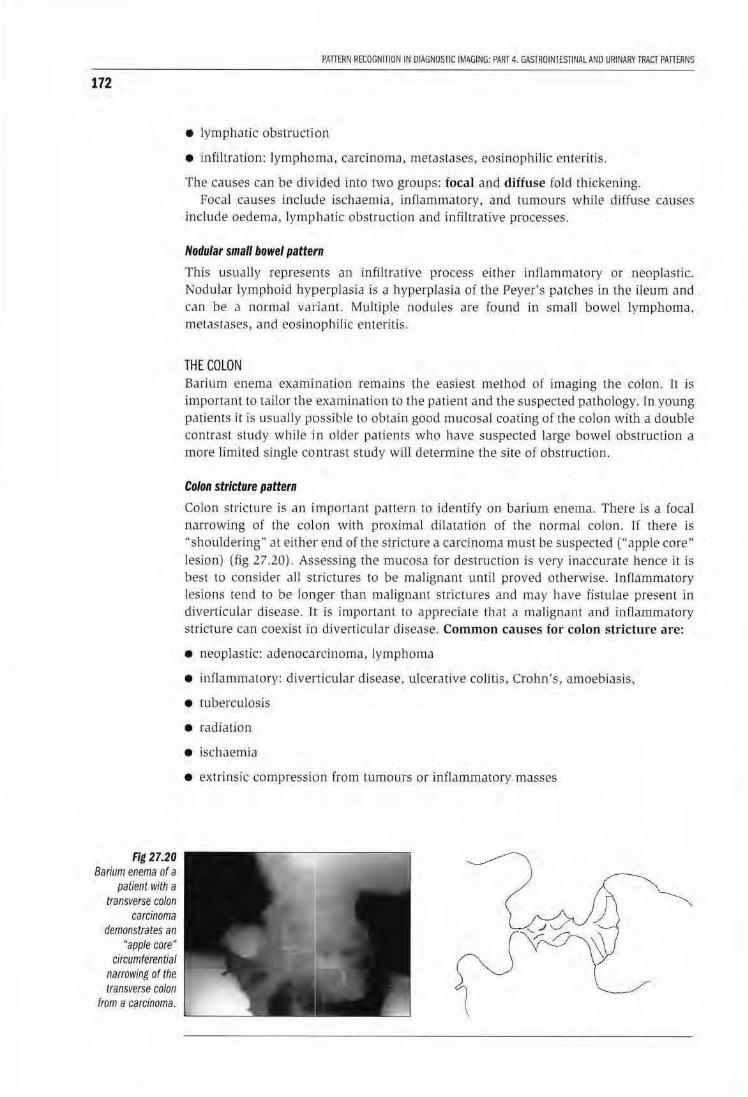
172
Fig 27.20 Barium enema of a
patient with a transverse colon
carcinoma demonstrates an
'·apple core • circumferential
narrowing of the transverse colon
from a carcinoma.
PATIERN RECOGNITION IN DIAGNOSfiC IMAGING: PART 4. GASTROINTESTINAL AND URINARY TRACT PAITERNS
• lymphatic obstruction
• infiltration: lymphoma, carcinoma, metastases, eosinophilic enteritis.
The causes can be divided into two groups: focal and diifuse fold thickening. Focal causes include ischaemia, inflammatory, and tumours while di[fuse causes
include oedema, lymphatic obstruction and infiltrative processes.
Nodular small bowel patteJrn
This usually represents an infiltrative process either inflammatory or neoplastic. Nodular lymphoid hyperp lasia is a hyperplasia of the Peyer's patches in the ileum and can be a normal variant. Multiple nodules are found in small bowel lymphoma, metastases, and eosinophilic enteritis.
THE COLON Barium enema exami nation remains the easiest method of imaging the colon. 1t is important to tailor the examina tion to the patient and the suspected pathology. In young patiems it is usually possible to obtain good mucosa l coating of the co lon with a double contrast study while in older patients who ha.ve suspected large bowel obstrucUon a more limited single contrast study will determine the site of obstruction.
Colon stricture pattern
Colon stricture is an important pattern to identify on barium enema. There is a focal narrowing of lhe colon with proximal dilatation of the normal colon. I[ there is "shouldering" at either end of the s tricture a carcinoma must be suspected ("apple core" lesion) (fig 27.20). As·sessing the mucosa for destruction is very inaccurate hence it is best to consider all strictures to be malignant unti l proved otherwise. Inflammatory lesions tend to be longer than malignant strictures and may have fistu lae present in diverticular disease. Jlt is important to appreciate that a malignant and in[iammarory stricture can coexist in diverticular disease. Common causes for colon stricture are:
• neoplastic: adenocarcinoma, lymphoma
• inflammatory: diverticular disease, ulcerat ive colitis, Crohn's , amoebiasis,
• tubercu losis
• radia tion
• ischaemia
• extrinsic compression from lumours or jnflammatory masses
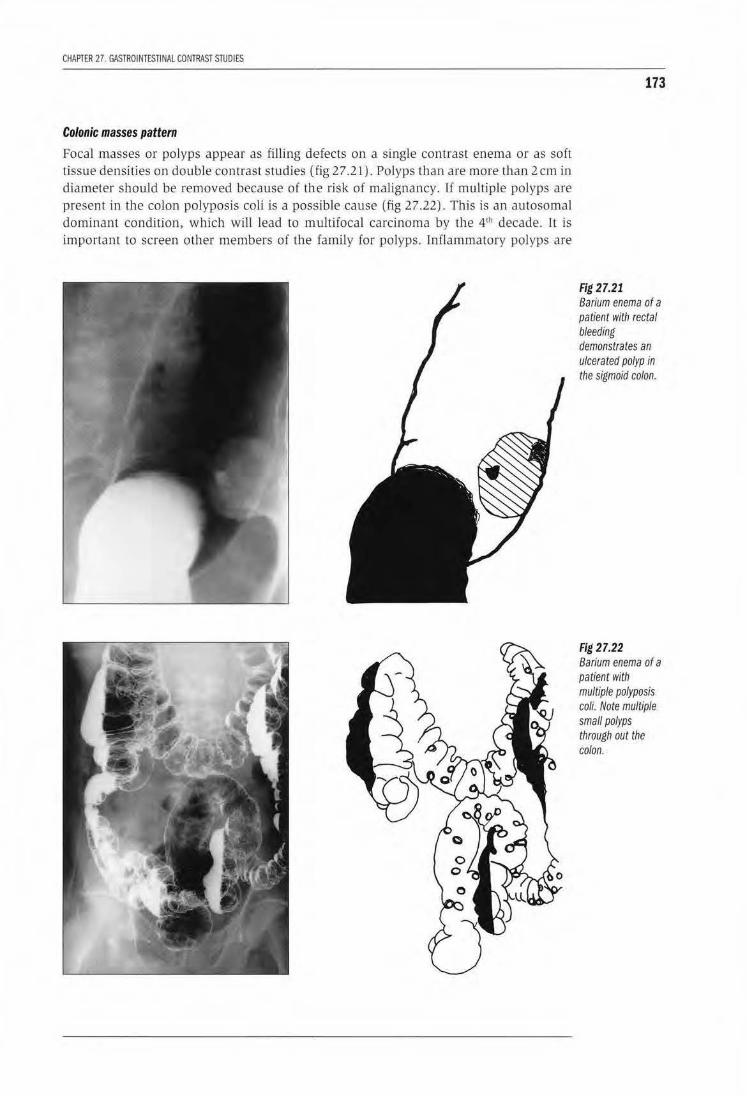
CHAPTER 27. GASTROINTESTINAl CONTRAST STUDIES
Colonic masses pattern Focal masses or po lyps appear as fil ling defects on a single contrast enema or as soft tissue densities on double contrast studies (fig 27 .21). Polyps than are more than 2 em in diameter should be removed because of the risk of malignancy. If multiple polyps are present in the colon polyposis coli is a possible cause (fig 27.22). This is an autosomal dominant condition, which will lead to multifocal carcinoma by the 4'h decade. It is important to screen other members of the family for polyps. lnflammatory polyps are
173
Fig 27.21 Barium enema of a patient with rectal bleeding demonstrates an ulcerated polyp in the sigmoid colon.
Fig 27.22 Barium enema of a patient with multiple polyposis coif. Note multiple small polyps through out the colon.
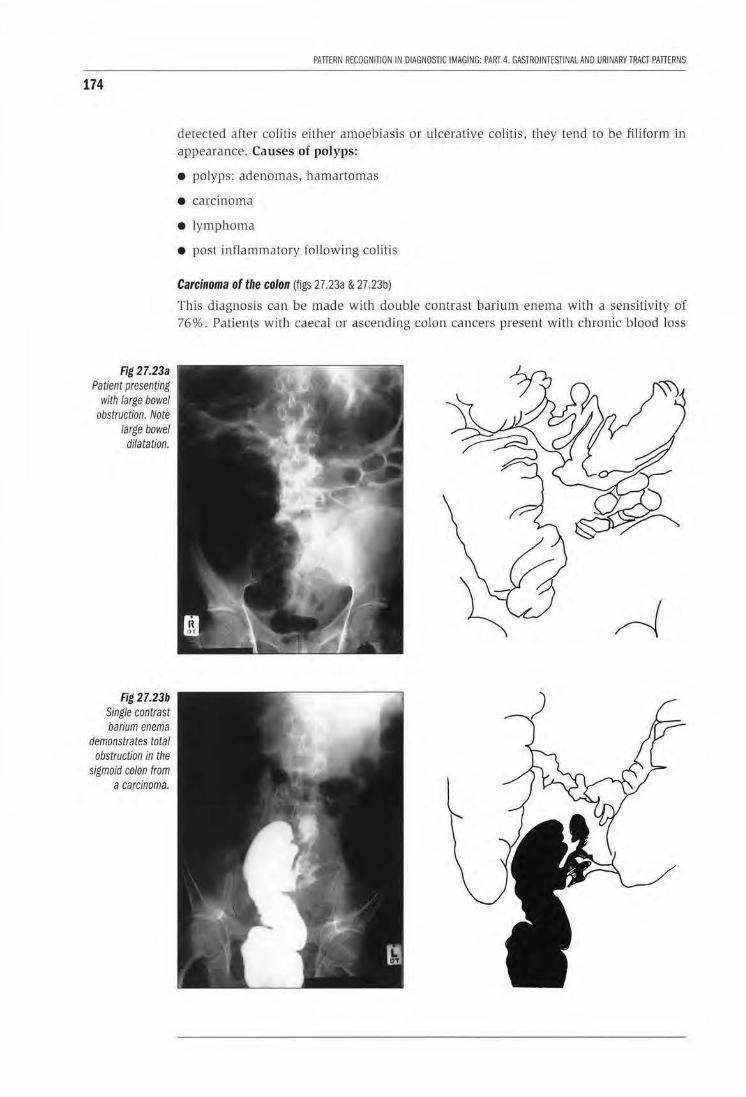
174
Fig 27.23a Patient presenting
with large bowel obstruction. Note
large bowel dilatation.
Fig 27.23b Single contrast barium enema
demonstrates total obstruction in the
sigmoid colon from a carcinoma.
PATTERN RECOGNITION IN DIAGNOSTIC IMAGING: PART 4. GASTROINTESTINAL AND URINARYTRACT PATTERNS
detected after colitis either amoebiasis or ulcerative colitis, they tend to be filiform in appearance. Causes of polyps:
• polyps: adenomas, hamartomas
• carcinoma
• lymphoma
• post inflammatory following colitis
Carcinoma of the colon (figs 27.23a & 27.23b)
This diagnosis can be made with double contrast barium enema with a sensitivity of 76%. Patients wi th caecal or ascending colon cancers present with chronic blood loss
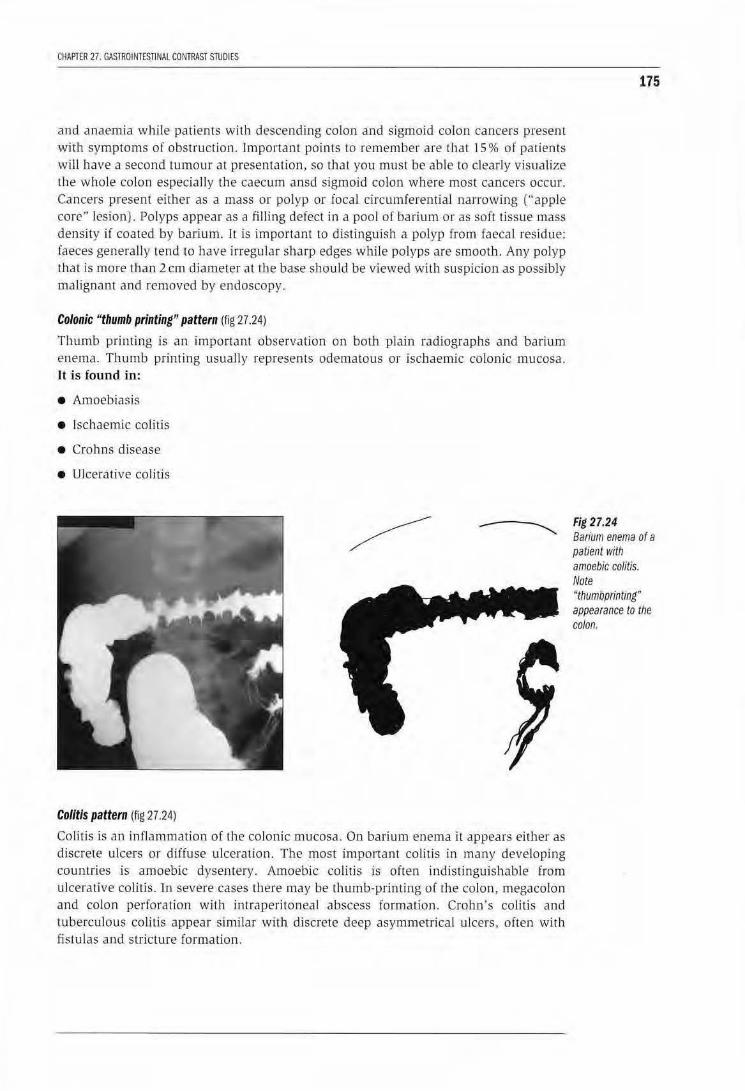
CHAPTER 27. GASTROINTESTINAl CONTRAST STUDIES
and anaemia while patients with descending colon and sigmoid colon cancers present with symptoms of obst ruction. Jmponanl points to remember are that 15 % of patients will have a second tumour at presentation, so that you must be able to clearly visualize the whole colon especiall y the caecum ansd sigmoid colon where most cancers occm. Cancers present either as a mass or polyp or focal circumferential narrowing ("apple core" lesion). Po lyps appear as a filling defect in a pool o( barium or as soft tissue mass density if coated by barium. It is important to distinguish a polyp from faecal residue: faeces generally tend to have irregular sharp edges while polyps are smooth. Any polyp that is more tllan 2 em diameter at ll1e base shou ld be viewed with suspicion as possibly malignant and removed by endoscopy.
Colonic "thumb printing'' pattern (fig 27 .24)
Thumb printing is an important observation on both p lain radiographs and barium enema. Thumb printing usually represents edematous or ischaemic colo nic mucosa. It i s found in:
• Amoebiasis
• lschaemic colitis
• Crohns disease
• Ulcerative colitls
Colitis pattern (fig 27.24}
Colitis is an inflammation of the colonic mucosa. On barium enema it appears either as discrete ulcers or diffuse ulceration. The most important colitis in many developing countries is amoebic dysentery. Am oebic colitis is often indistinguishable from ulcerative colitis. In severe cases there may be thumb-printing of the colon, megaco lon and colon perforation with intraperitoneal abscess formation. Crohn's colitis and tuberculous colitis appear similar with discrete deep asymmetrical ulcers, often wi th fistulas and stricture formation.
175
Fig 27.24 Barium enema of a patient with amoebic colitis. Note "thumbprinting· appearance to the colon.
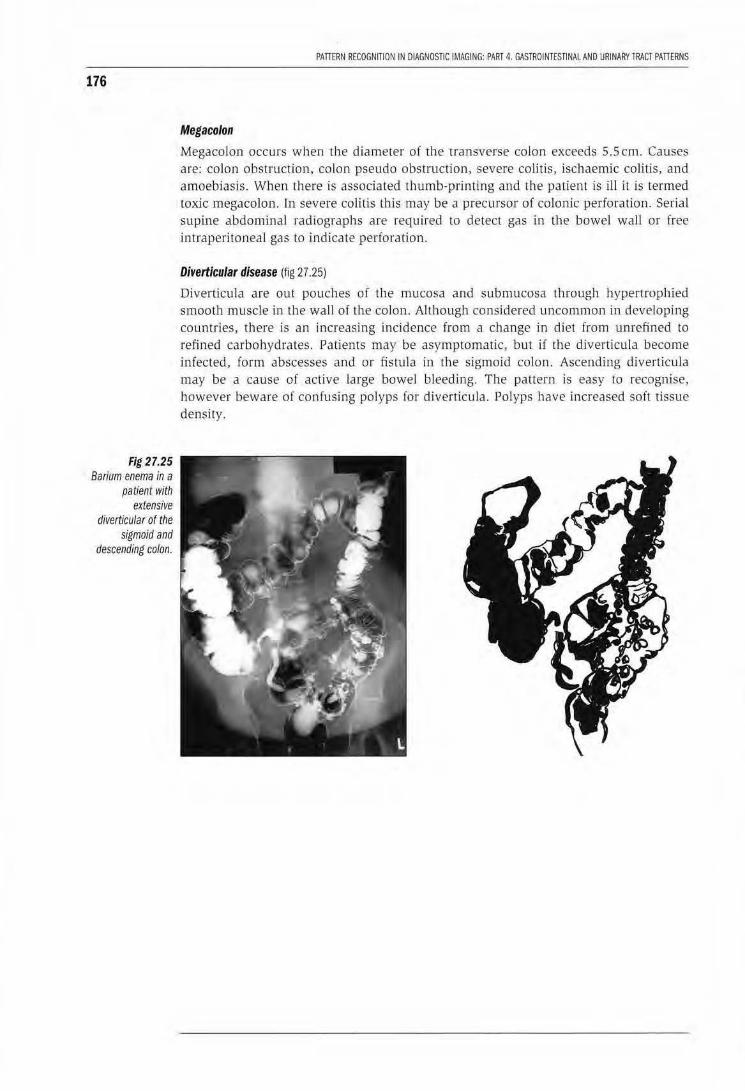
176
Fig 27.25 Barium enema in a
patient with extensive
diverticular of the sigmoid and
descending colon.
PATTERN RECOGNITION IN DIAGNOSTIC IMAGING: PART 4. GASTROINTESTINAL AND URINARY rRACT PATIERNS
Megacolon
Megaco lon occurs when the diameter of th e transverse colon exceeds 5.5 em. Causes are: colon obstruction, colon pseudo obstruction, severe colitis, ischaemic colitis, and amoebiasis. When there is associ.ated thum b-printing and the patient is ill it is termed toxic megacolon. fn severe colitis this may be a precursor of colonic perforation. Serial supine abdominal radiographs are requi red to detect gas in the bowel wall or free intraperitoneal gas to indica te per(oration.
Diverticular disease (fig 27 .25)
Diverticula are out pouches or the mucosa and submucosa th rough hypertrophied smoo th muscle in the wall of the colon. Although considered uncommon in developing countries, there is an increasing incidence from a change in diet from unrefined to refined carbohydrates. Patients may be asymptomatic, but if the diverticula become infected, form abscesses and or fistula in the sigmoid colon. Ascending diverticula may be a cause of active large bowel bleeding. The pattern is easy to recognise, however beware of co nfusing polyps for diverticu la. Polyps have increased soft tissue density.
CHAPTER 27. GASTROINTESTINAL CONTRAST STUDIES
LEARNING POINTS: GASTROINTESTINAL CONTRAST STUDIES
• Common oesophageal strictures are from oesophageal carcinoma and following peptic oesophagitis
• Complications of oesophageal carcinoma are: tracheal oseophageal fistula, perforation with mediastinitis, aspiration and total obstruction
• Important causes of oesophagitis in AIDS patients are monilial oesophagitis, herpes simplex, CMV and HIV infections
• Causes of a solitary gastric mass are: polyps- adenomas, carcinomas, leiomyomas or sarcomas, bezoars,and extrinsic tumours (pancreas) invading the wall
• Causes of multiple gastric masses are: polyps, fundal varices, adenocarcinoma, lymphomas, Kaposi's sarcoma and metastases.
• Causes of gastric fold thickening: gastritis, Zollinger Ellison syndrome, lymphoma, Menetrier's disease
• Causes of a "bald stomach" linitis plastica; adenocarcinoma, lymphoma, metastases, battery acid ingestion
• Causes of small bowel strictures: fibrous adhesions, inflammatorty-TB, Crohn's, tumoursadenocarcinoma, lymphoma, ischaemicjradiation damage
• Causes of colon strictures are: tumours-adenocarcinoma, lymphoma, metastases, inflammatorydiverticular, amoebiasis Crohn's, TB, ulcerative colitis, ischaemiajradiation, extrinsic compression by tumours
• Causes of colon polyps: adenomas, hamartomas, carcinoma, lymphoma, post inflammatory
• Causes of "thumb printing" of the colon: amoebiasis, ischaemic colitis, Crohn's, ulceratice colitis
Reference 1. Chapman S, Nakielny R. Aids to Radiological Differential Diagnosis. 1995, Saunders, London.
177
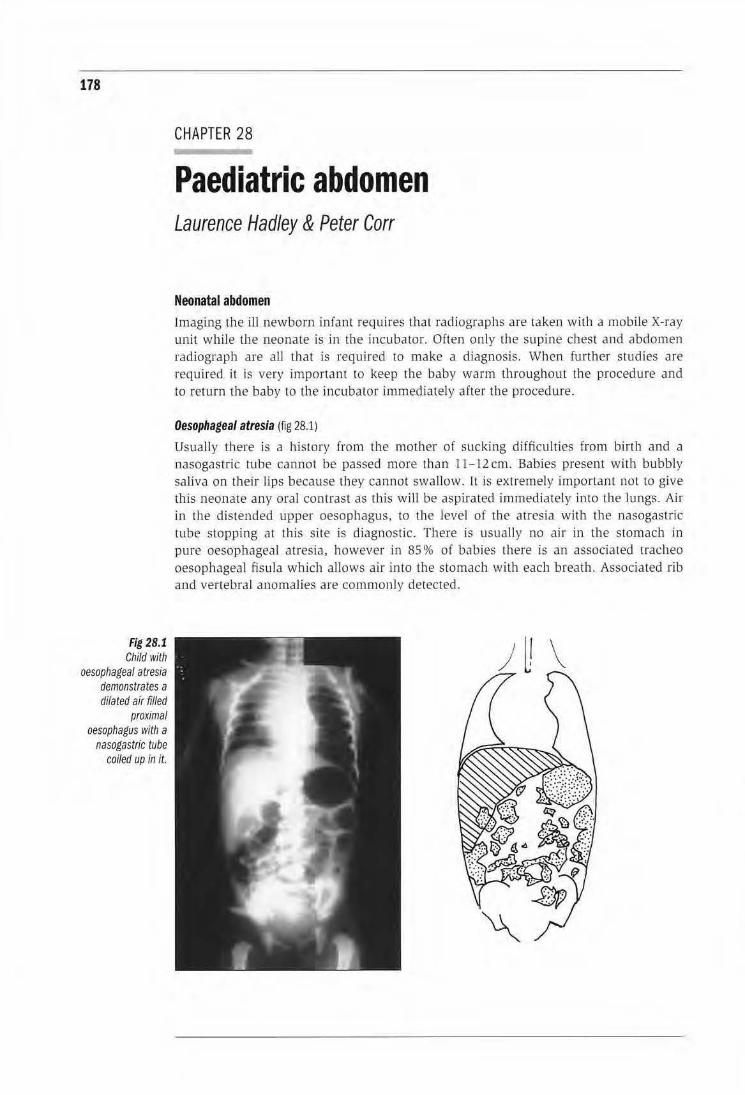
178
fig 28.1 Child with
oesopl1agea/ atresia demonstrates a dilated air filled
proximal oesophagus with a
nasogastric tube coiled up in it.
CHAPTER 28
Paediatric abdomen Laurence Hadley & Peter Carr
Neonatal abdomen Imaging the ill newborn infant requires that radiographs are taken with a mobLle X-ray unit while tbe neonate is in the incubator. Often only the supine chest and abdomen radiograph are all that is required to make a diagnosis. When further studies are required it is very important to keep the baby warm throughout the procedure and to return the baby to the incubator immediately after the procedure.
Oesophageal atresia (fig 28.1)
Usually there is a history from the mol.ber or sucking difficulties from birth and a nasogastTic tube cannot be passed more than ll - 12cm. Babies present with bubbly saliva on their Ups because they cannot swallow. It is extremely importan t not to give this neonate any oral contrast as this w ill be aspirated immediately into the lungs. Air in the distended upper oesophagus, to the level of the atresia with the nasogastric tube stoppirrg at this site is diagnostic. There is usually no air in tl1e stomach in pure oesophageal atresia, however in 85% of babies there is an associated trachea oesophageal fis ula which allows air into the stomach with each breath. Associated rib and vertebral anomalies are commonly detected.
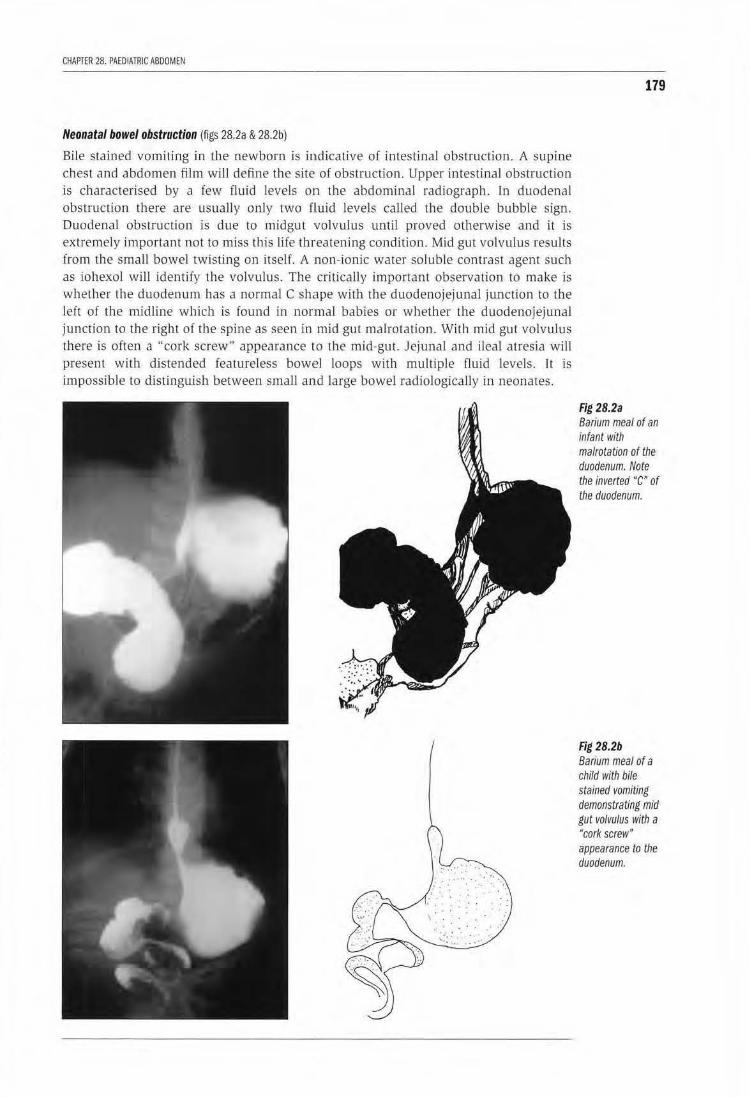
CflAP'fER 28. PAEDIATRIC ABDOMEN
Neonatal bowel obstruction (figs 28.2a & 28.2b)
Bile stained vomiting in the newborn is indicative of intestinal obstruction. A supine chest and abdomen film will define the site of obstruction. Upper intestinal obstruction is characterised by a few fluid levels on the abdominal radiograph. In duodenal obstruction there are usually only two flluid levels called the double bubble sign. Duodenal obstruction is due to midgut volvulus until proved otherwise and it is extremely important not to miss this life threatening condition. Mid gut volvulus results from the small bowel twisting on itself. A .non-ionic water soluble contrast agent such as iohexol will identify the volvulus. The critically important observation to make is whether the duodenum has a normal C shape with the duodenojejunal junction to the left of the midline which is found in normal babies or whether the duodenojejunal junction to the right of tJ1e spine as seen in mid gut malrotation. With mid gut volvu lus there is often a "cork screw" appearance to the mid-gut. Jejunal and ileal atresia will present with distended featureless bowel loops with multiple fluid levels. rt is impossible to distinguish between smal l and large bowel radiologically in neonates.
179
Fig 28.2a Barium meal of an infant with malrotation of the duodenum. Note the inverted "C" or the duodenum.
Fig 28.2b Barium meal of a child with bile stained vomiting demonstrating mid gut volvulus with a "cork screw" appearance to the duodenum.
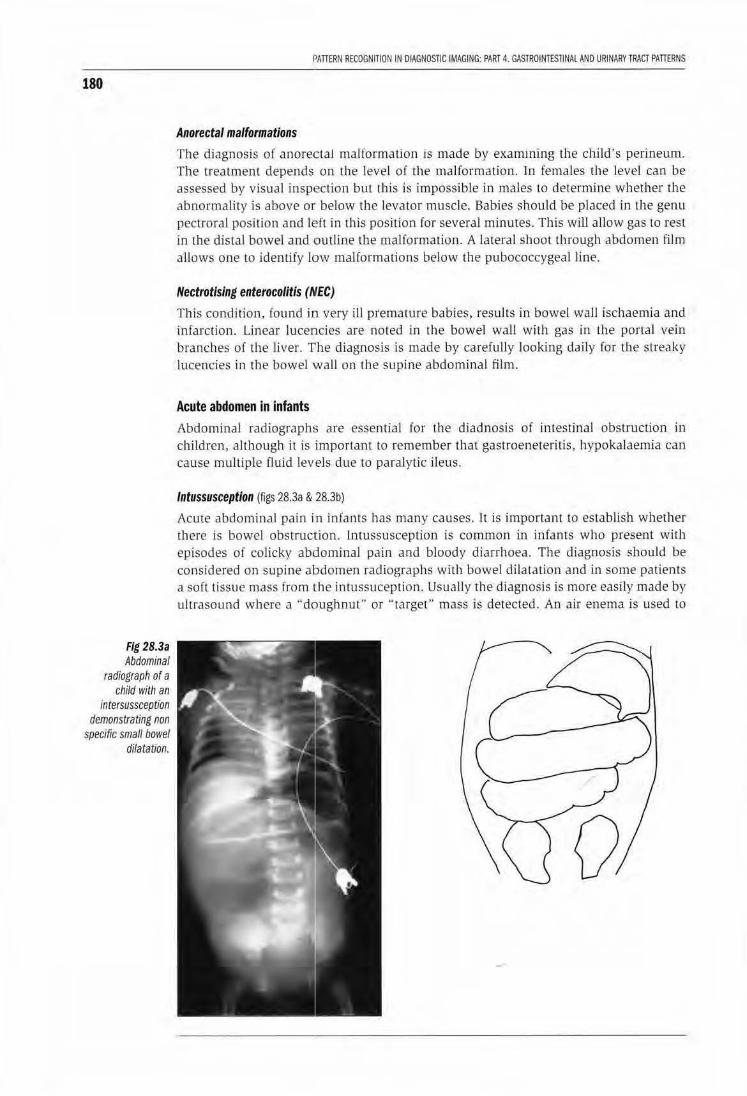
180
Fig 28.3a Abdominal
radiograph or a child with an
intersussception demonstrating non
specific small bowel dilatation.
flAlTERN RECOGNITION IN DIAGNOSTIC IMAGING: PART 4. GASTROINTESTINAl AND URINARY TRACT PAlTERNS
Anorectal malformations
Tbe diagnosis of anorectal malformation is made by examming the child's perineum. The treatment depends on the level of the malformation. Jn females tlJe level can be assessed by visual inspection but this is impossible in males to determh1e whether the abnormality is above or below the levator muscle. Babies should be placed in the genu pectroral position and IE?ft in this position for several minutes. This wiU allow gas to rest in the distal bowel and outline the ma lformation. A lateral shoot through abdomen film allows one to identiiy low malformations below the pubococcygeal line.
Nectrotising enterocolitis (!IIEC)
This condition, found in. very ill premalUre babies, resuJts in bowel waJI ischaemia and infarction. Linear lucencies are noted in the bowel wall with gas in the portal vein branches of the liver. The diagnosis is made by carefully looking daily for the streaky lucencies in the bowel waJJ on tlJe supine abdominal film.
Acute abdomen in infants Abdominal radiograph:; are essential for the diadnosis of intestinal obstruction in children, although it is important to remember rhal gastroeneteritis, hypokalaemia can cause multiple fluid levels due to paralytic ileus.
Intussusception (figs 28.3a & 28.3b)
Acute abdominal pain in infants has many causes. It is important to establish whether there is bowel obstruc1tion. Intussusception is common in infants who present with episodes of colicky abdominaJ pain and bloody diarrhoea. The diagnosis should be considered on supine abdomen radiographs with bowel dilatation and in some patients a soft tissue mass from the intussuception. UsuaJly the diagnosis is more easily made by ultrasound where a "doughnut" or "target" mass is detected. An air enema is used to
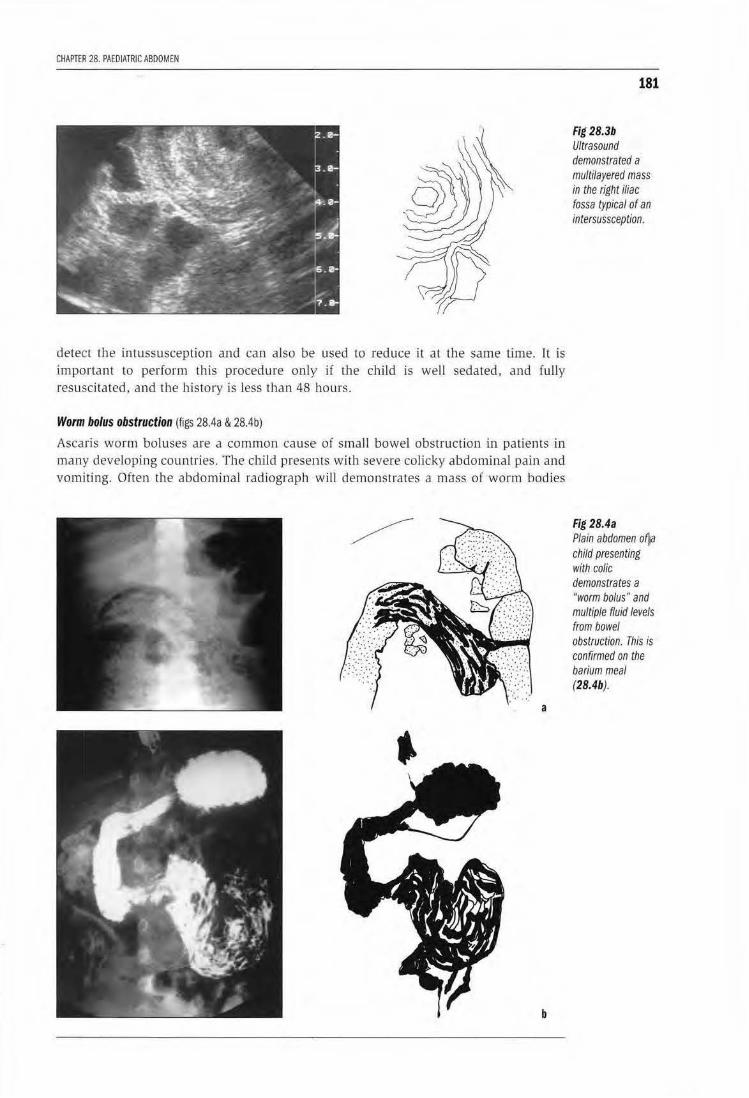
CHAPTER 28. PAEDIATRIC ABDOMEN
detect the intussusception and can also be used to reduce it at the same Lime. It is important to perform this procedure only if lhe child is well sedated, and fuUy resuscitated, and the history is less than 48 hours.
Worm bolus obstruction (figs 28.4a & 28.4b)
Ascaris worm boluses are a common cause· of small bowel obstruction in patients in many developing countries. The child presents with severe colicky abdominal pain and vomiting. Often the abdominal rad iograph wiU demonstrates a mass of worm bodies
a
b
181
Fig28.3b Ultrasound demonstrated a multilayered mass in the right iliac fossa typical of an intersussception.
Fig 28.4a Plain abdomen of)a child presenting with colic demonstrates a "worm bolus" and multiple fluid levels from bowel obstruction. This is confirmed on the barium meal (28.4b).
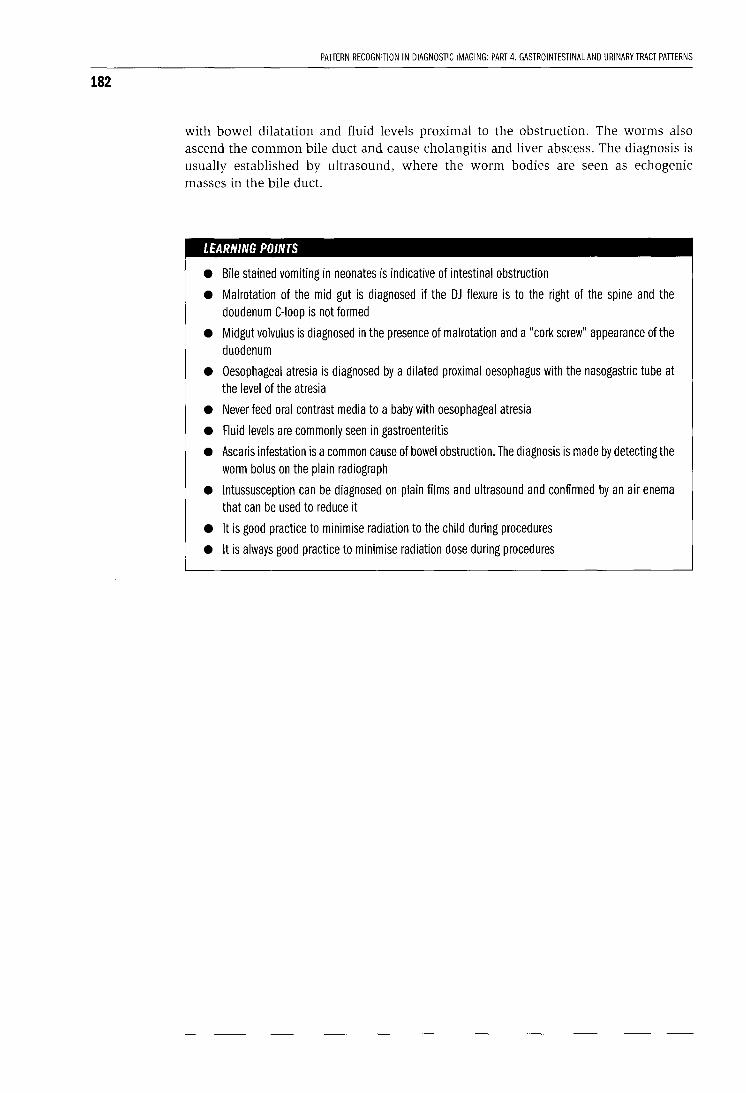
182
PATTERN RECOGNITION IN DIAGNOSTIC IMAGING: PART 4. GASTROINTESTINAL AND URINARY TRACT PATTERNS
with bowel dilatation and fluid levels proximal to the obstruction. The worms also ascend the common bile duct and cause cholangitis and liver abscess. The diagnosis is usually established by ultrasound, where the worm bodies are seen as echogenic masses in the bile duct.
LEARNING POINTS
• Bile stained vomiting in neonates is indicative of intestinal obstruction
• Malrotation of the mid gut is diagnosed if the DJ flexure is to the right of the spine and the doudenum C-loop is not formed
• Midgut volvulus is diagnosed in the presence of malrotation and a "cork screw" appearance of the duodenum
• Oesophageal atresia is diagnosed by a dilated proximal oesophagus with the nasogastric tube at the level of the atresia
• Never feed oral contrast media to a baby with oesophageal atresia
• Fluid levels are commonly seen in gastroenteritis
• Ascaris infestation is a common cause of bowel obstruction. The diagnosis is made by detecting the worm bolus on the plain radiograph
• Intussusception can be diagnosed on plain films and ultrasound and confirmed by an air enema that can be used to reduce it
• It is good practice to minimise radiation to the child during procedures
• It is always good practice to minimise radiation dose during procedures
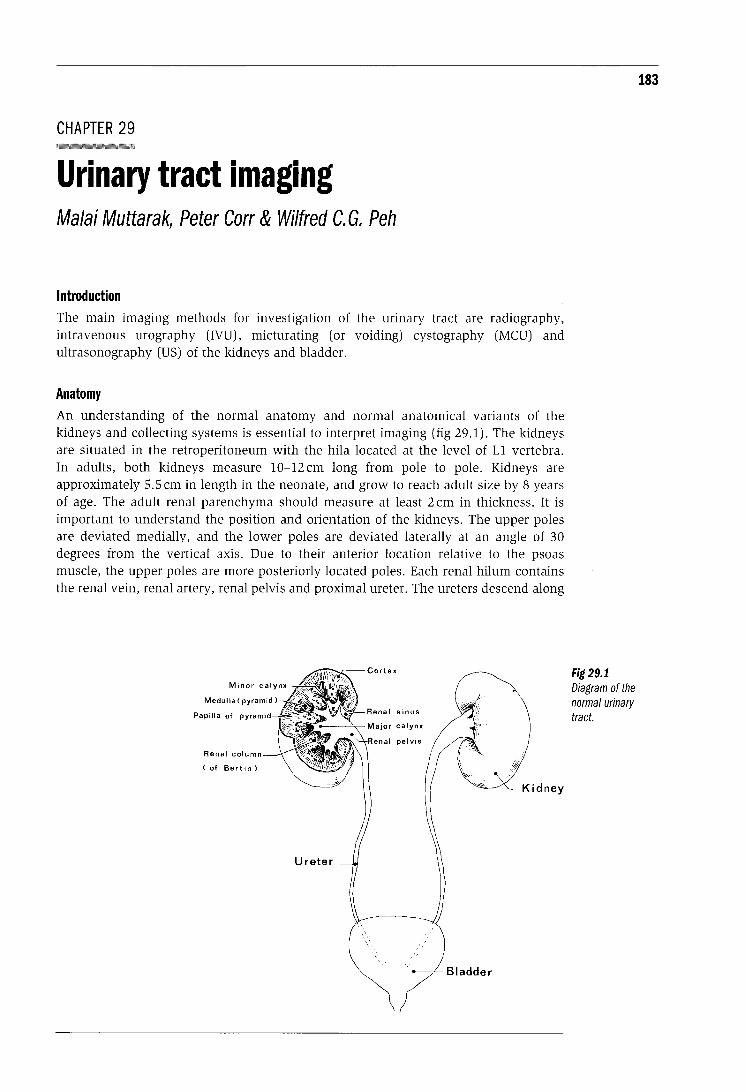
CHAPTER 29
Urinary tract imaging Malai Muttarak, Peter Carr & Wilfred C. G. Peh
Introduction The main imaging methods for investigation of the urinary tract are radiography, intravenous urography (IVU), micturating (or voiding) cystography (MCU) and ultrasonography (US) of the kidneys and bladder.
Anatomy An understanding of the normal anatomy and normal anatomical variants of the kidneys and collecting systems is essential to interpret imaging (fig 29.1). The kidneys are situated in the retroperitoneum with the hila located at the level of L1 vertebra. In adults, both kidneys measure 10-12 em long from pole to pole. Kidneys are approximately 5.5 em in length in the neonate, and grow to reach adult size by 8 years of age. The adult renal parenchyma should measure at least 2 em in thickness. It is important to understand the position and orientation of the kidneys. The upper poles are deviated medially, and the lower poles are deviated laterally at an angle of 30 degrees from the vertical axis. Due to their anterior location relative to the psoas muscle, the upper poles are more posteriorly located poles. Each renal hilum contains the renal vein, renal artery, renal pelvis and proximal ureter. The ureters descend along
Renal column
(of Bertin)
Fig 29.1 Diagram of the normal urinary tract.
183

184
PATTERN RECOGNITION IN DIAGNOSTIC IMAGING: PART 4. GASTROINTESTINAL AND URINARY TRACT PATTERNS
a line linking the tips of the transverse processes of the lumbar vertebrae, and insert into the bladder at the ureterovesical junctions. The bladder is an extraperitoneal pelvic organ situated anterior to the uterus in females and to the rectum in males. The male urethra is divided, from proximally to distally, into prostatic, membranous and bulbar portions. The female urethra is a much shorter structure. Due to the complex embryology of the urinary tract, there are a number of normal anatomical variants, which should not be confused with pathological conditions. Recognition of these variants is therefore important (table I).
Table I. Variants and developmental anomalies of the urinary tract
Anomalies in number -Renal agenesis (single kidney) -Supernumerary kidney
Anomalies in size -Hypoplasia -Hyperplasia
Fusion anomalies -Horseshoe kidney -Cross ectopy with fusion
Anomalies in position -Ectopic kidney (sacral or pelvic kidney) -Cross ectopy without fusion
Other anomalies -Foetal lobulation -Large column of Bertin -Ureteropelvic obstruction -Duplication of renal pelvis and ureter -Retrocaval ureter -Ureterocoele -Aberrant renal arteries
"KUB" film The imaging examination of the urinary tract should start with a conventional radiograph of the kidney, ureter and bladder, which is commonly called a "KUB" film. It is essential the KUB film be taken before any intravenous contrast agent is injected so as not to obscure calcified structures.
Technique
Careful radiographic technique in obtaining a KUB is important. The patient is placed in a supine position. The radiograph should be exposed soon after the patient has voided and at the end of full expiration. Upper margins of the radiograph should include the suprarenal area, while the lower margin should include the pubic rami (fig 29.2). For good visualisation of the renal outlines exposure factors of 70-80 Kvp for an adult patient are required.
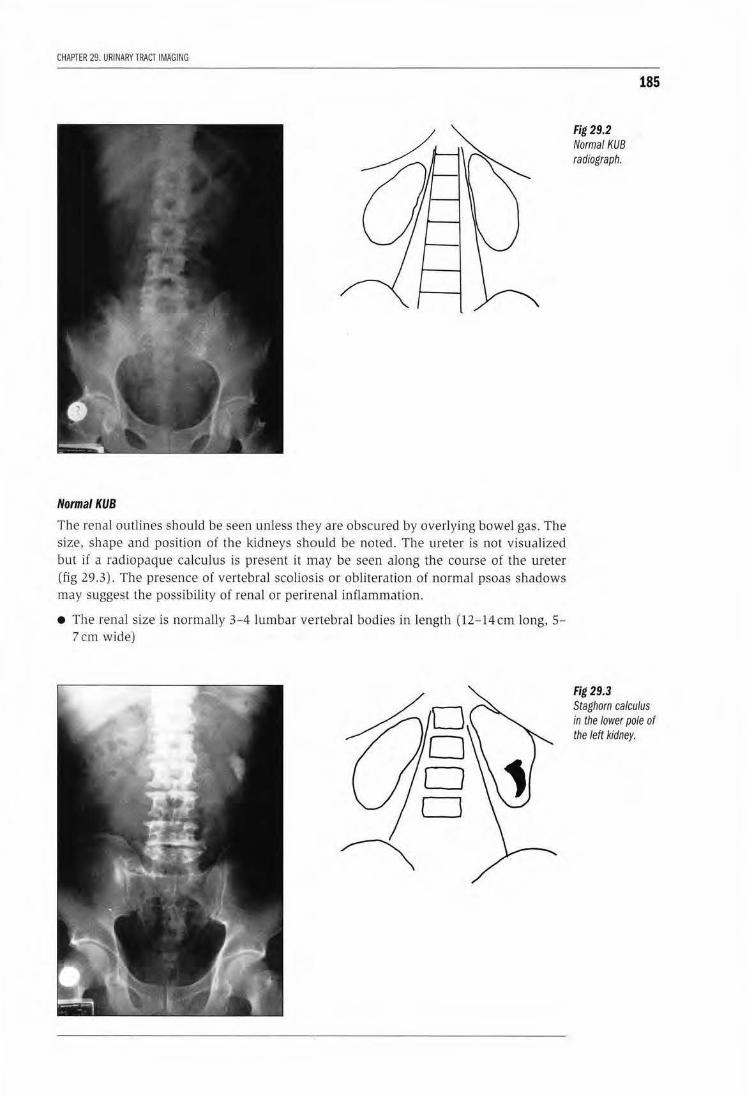
CHAPTER 29. URI NARY TRACT IMAGING
Normal KUB
The renal outlines should be seen unless they are obscured by overlying bowel gas. The size, shape and position of the kidneys should be noted. The ureter is not visualized but if a radiopaque calculus is present it may be seen along the course of the ureter (fig 29.3). The presence of vertebral scoliosis or obliteration oi normal psoas shadows may suggest the possibility of renal or perirenal i11flammation.
• The renal size is norma lly 3-4 lumbar vertebral bodies in length (12-14cm long, 5-7 em wide)
Fig 29.2 Normal KUB radiograph.
Fig 29.3
185
Staghorn calculus in the lower pole of the left kidney.
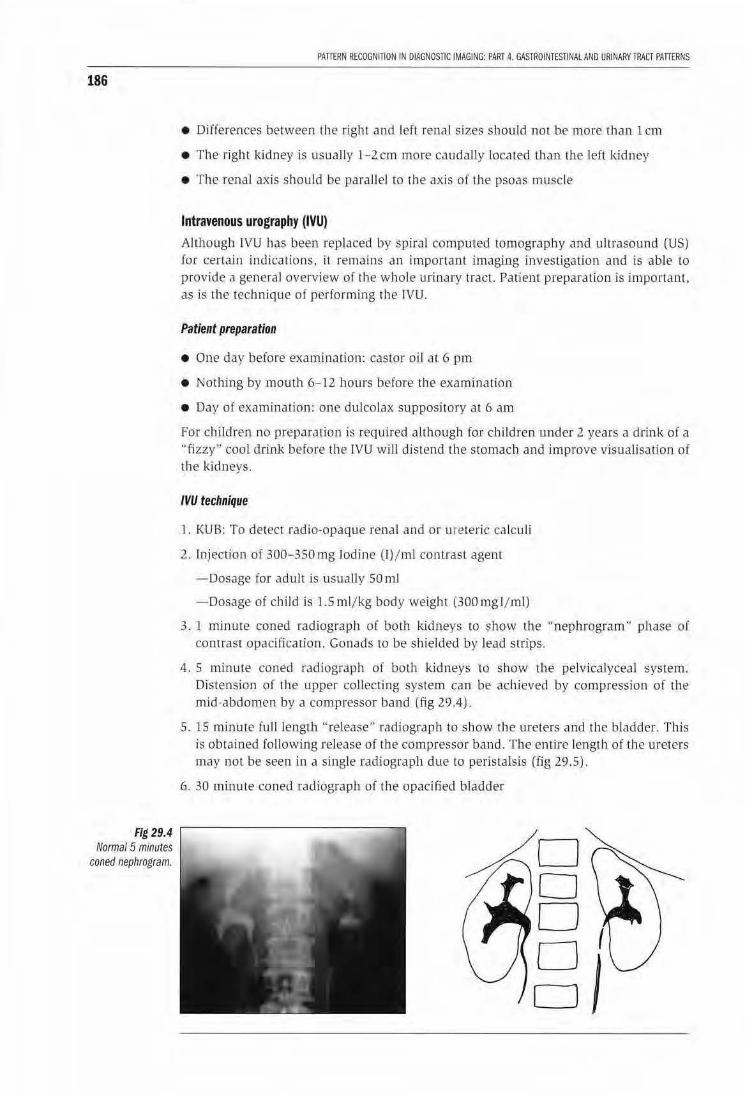
186
Fig 29.4 Normal 5 minutes
coned nephrogram.
PATifRN RECOGNITION IN DIAGNOSTIC IMAGING: PART 4. GASTROINTESTINAL AND URINARYTRACT PATTERNS
• Differences between UJe right and left renal sizes should not be more than l em
• The right l<idney is usually l-2.cm more caudally loca ted than the left kidney
• The renal axis should be parallel to the axis of tbe psoas muscle
Intravenous urography (IVU) Allhougl,l IVU has been replaced by spiral computed tomography and ultrasound (US) for certain indications, it remains an important imaging investigation and is able to provide J general overview of the whole urLnary tract. PatienT preparation is important. as is the technique of performing rhe lVU.
Patient preparation
• One day before examh1a.tion: castor oil at 6 pm
• Nothing by mouth 6-12 l1ours before the examinat ion
• Day of examination: one dulcolax supposi tory at 6 am
For children no preparation is required although for children under 2 years a drink of a "fizzy" cool drink before the IVU wiJl distend the stomach and improve visualisation of the l<idneys.
IVU technique
1. KUB: To detect radio-opaque renal and or ute teric ca lculi
2. Injection of :300- 350 mg Iodine (1)/ml contrast agent
-Dosage for adult ls usually SOmJ
-Dosage of child is LSml/kg body weight (300mgl/ml)
3. l minute coned radiograph of both kidneys to show the "nephrogram'' phase or contrast opacifi.ca rion. Gonads w be shielded by lead strips.
4. 5 minute coned radiograph of both kidneys to show the pelvicalyceal system. Distension of the upper collecting system can be achieved by compression of the mid-abdomen by a compressor band (fig 29.4) "
5. 15 minute full length "release" radiograp h to sh ow the ureters and the bladder. This is obtained following release of the compressor band. The ent ire length of the ureters may not be seen in a single radiograph due to peristalsis (fig 29.5).
6. 30 m inute coned radiograph of the opacified bladder
CHAPTER 29. URINARY TRACT IMAGING
187
\ Fig 29.5 Norma/15 minutes Mpost release' KUB demonstrating the
"'- ureters. --
7. Post-micturition full length radiograph to show the kidneys, ureter and fully or partially emptied bladder.
Indications
I. Suspected congenital anomalies
2. Persistent urinary tract infection
3. Renal col ic
4. Haematuria
5. Renal trauma
6. Rena l, ureteric or pelvic tumours
Contralndications
1. Renal failure. This is a relative contraindication as renal excretion of contrast is delayed.
2. Hypersensitivity or allergy to contrast agent
NEPHROGRAPHIC PATTERNS
Unilateral small smooth kidney (fig 29.6)
The kidney is similar in shape and outline to a nom1al one. However, it is more than 2cm shorter in length compared to U1e normal contralateral kidney (table II). In renal artery stenosis, the collecting system is normal; while a dilated collecting system is seen in post-obst ru ctive atrophy.
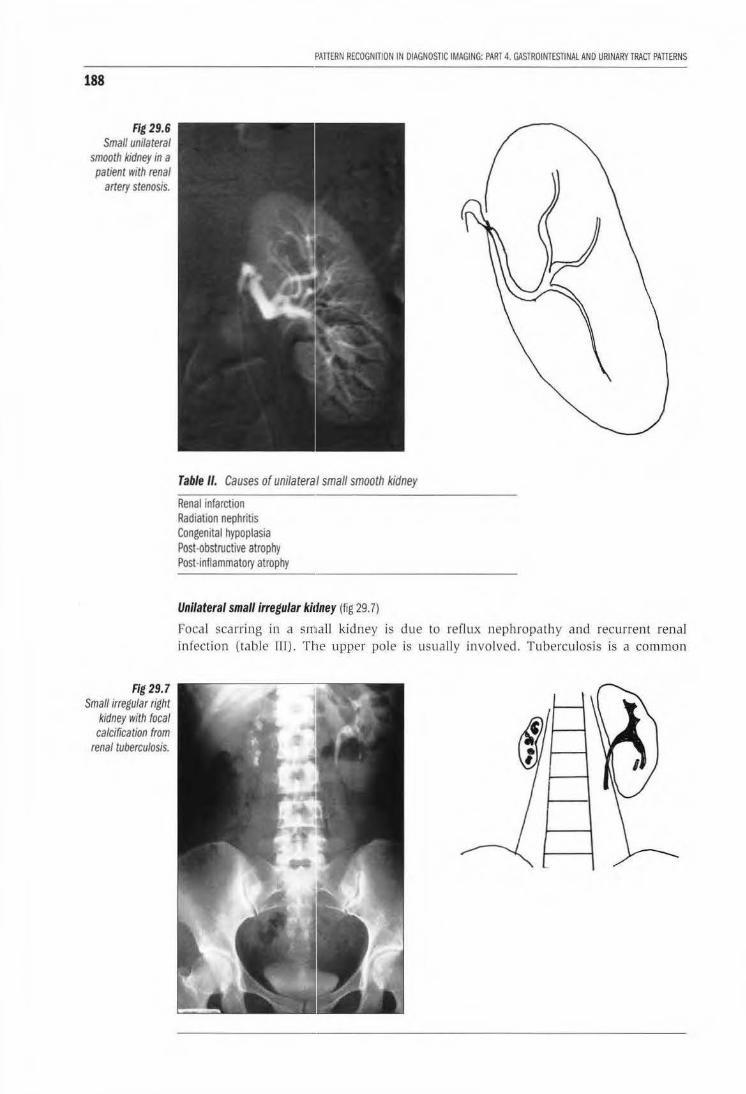
188
Fig 29.6 Small unilateral
smooth kidney in a patient IVith renal
artery stenosis.
Fig 29.7 Small irregular right
kidney with focal calcification from
renal tuberculosis.
PATIERN RECOGNiliON IN DIAGNOSTIC IMAGING: PART 4. GASTROINTESTINAl AND URINARY TRACT PATIERNS
Table II. Causes of unilateral small smooth kidney
Renal infarction Radiation nephritis Congenital hypoplasia Post·obstructive atrophy Post·inflammatol)' atrophy
Unilateral small irregular ki1fney (fig 29. 7)
Focal scarring in a small kidney is due to reflux nephropathy and recurrent renal infection (table III). The upper pole is usually involved. Tuberculosis is a common
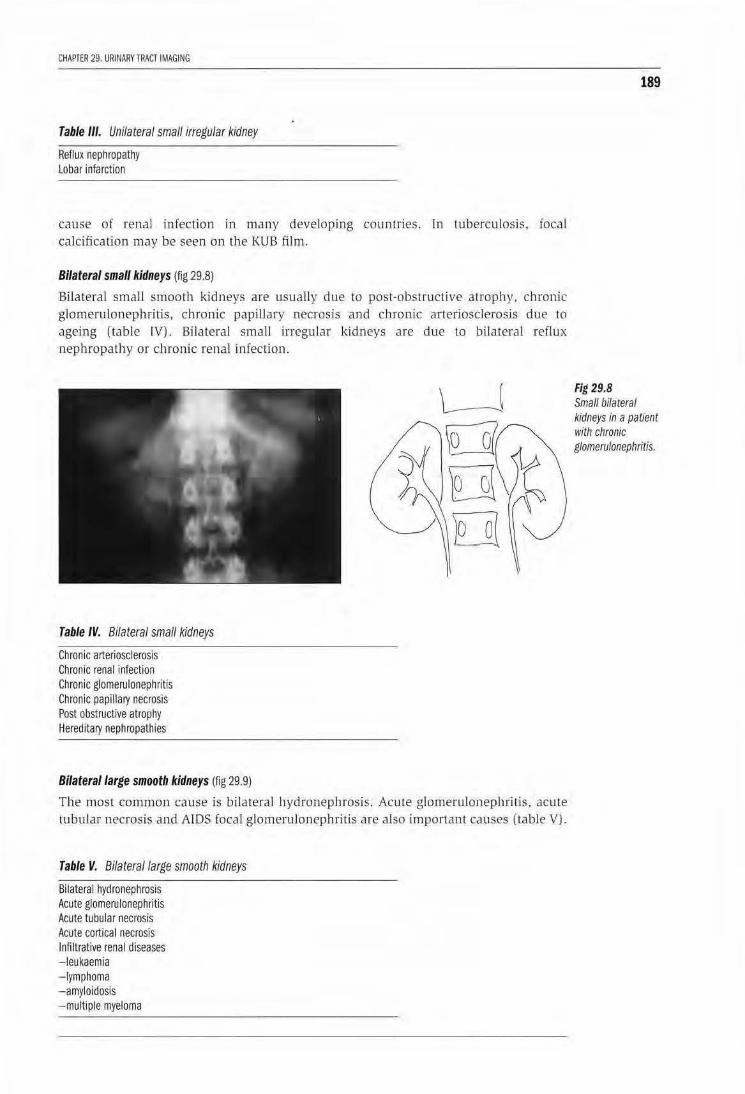
CHAPlER 29. URINARY TRACT IMAGING
Table Ill. Unilateral small irregular kidney
Reflux nephropathy lobar infarction
cause of renal infection in many developing counu·ies. In tuberculosis. focal calcification may be seen on the KUB film.
Bilateral small kidneys (fig 29.8)
Bilateral small smooth kidneys are usually due to post-obsLructive atrophy. chronic glomerulonephritis, chronic papillary necrosis and chronic arteriosclerosjs due to ageing (table IV). Bilateral small irregu lar kidneys are due to bilateral reflux nephropathy or chronic renal infection.
Table IV. Bilateral small kidneys
Chronic arteriosclerosis Chronic renal infection Chronic glomerulonephritis Chronic papillafY necrosis Post obstructive atrophy HereditaJY nephropathies
Bilateral large smooth kidneys {fig 29.9)
The most common cause is bilatera l hydronephrosis. Acute glomerulonephritis, acute tubular necrosis and ATDS foca l glomerulonephritis are also irnponant causes (table VJ.
Table V. Bilateral large smooth kidneys
Bilateral hydronephrosis Acute glomerulonephritis Acute tubular necrosis Acute cortical necrosis Infiltrative renal diseases - leukaemia - lymphoma -amyloidosis -multiple myeloma
189
Fig 29.8 Small bilateral kidneys in a patient with chronic glomerulonephritis.
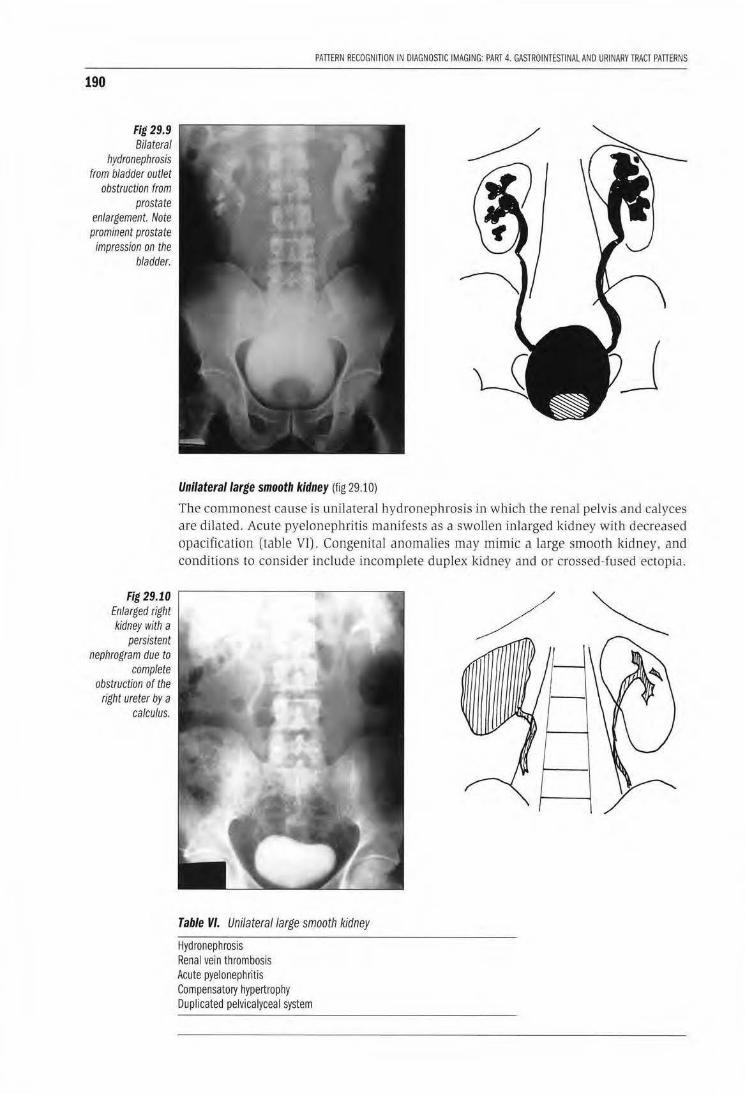
190
Fig 29.9 Bilateral
hydronephrosis from bladder outlet
obstruction from prostate
enlargement. Note prominent prostate impression on the
bladder.
Fig 29.10 Enlarged right kidney with a
persistent nephrogram due to
complete obstruction of the
right ureter by a calculus.
PAlTERN RECOGNITION IN DIAGNOSTIC IMAGING: PART 4. GASTROINTESTINAL AND URINARY TRACT PAITERNS
Unilateral large smooth kidney (fig 29.10)
The commonest cause is unilateral hydronephrosis in which the renal pelvis and calyces are dilated . Acute pyelonephritis manifests as a swollen inlarged kidney with decreased opacification (table VT). Congen ital anomalies may mimic a large smooth kidney, and conditions to co nsider include incomplete duplex kidney and or crossed-fused ectopia.
Table VI. Unilateral large smooth kidney
Hydronephrosis Renal vein thrombosis Acute pyelonephritis Compensatory hypertrophy Duplicated pelvicalyceal system
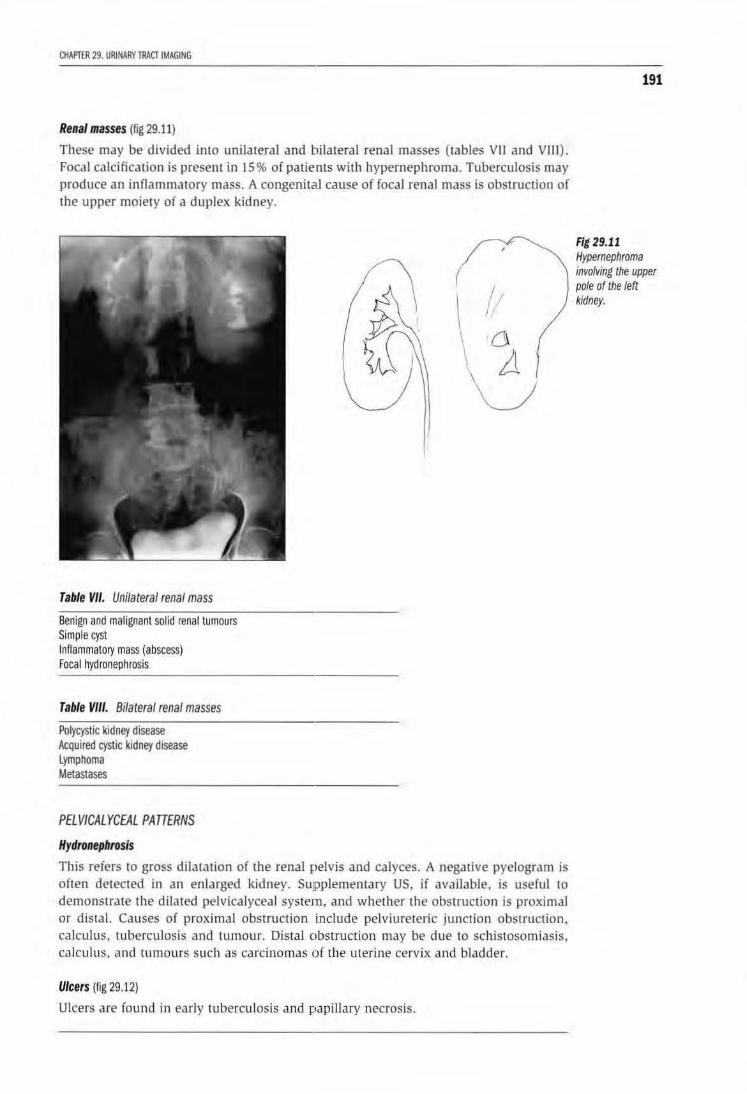
CHAPTER 29. URINARY TRACT IMAGING
Renal masses (fig 29.11)
These may be divided into unilateraJ and bilateral renal masses (tables VII and VJJI). Focal calcification is present in 15% of patients with hypernephroma. Tuberculosis may produce an inflammatory mass. A congenital cause of focal renal mass is obstruction of the upper moiety of a duplex kidney.
Table VII. Unilateral renal mass
Benign and malignant solid renal tumours Simple cyst Inflammatory mass (abscess) Focal hydronephrosis
Table VIII. Bilateral renal masses
Polycystic kidney disease Acquired cystic kidney disease lymphoma Metastases
PELVICALYCEAL PATTERNS
Hydronephrosis
This refers to gross dilatation of the renal pelvis and calyces. A negative pyelogram is often detected in an enlarged kidney. SuJPplementary US, if available, is useful to demonstrate the dilated pelvicalyceal system, and whether the obstruction is proximal or distal. Causes of proximal obstruction include pelviurereric junction obstruction, calcu lus. tuberculosis and tumour. Distal obstruction may be due to schistosomiasis, calcu lus, and tumours such as carcinomas of the uterine cervix and bladder.
Ulcers (fig 29.12)
Ulcers are found in early tuberculosis and papiJlary necrosis.
191
Fig 29.11 Hypernephroma involving the upper pole of the left kidney.
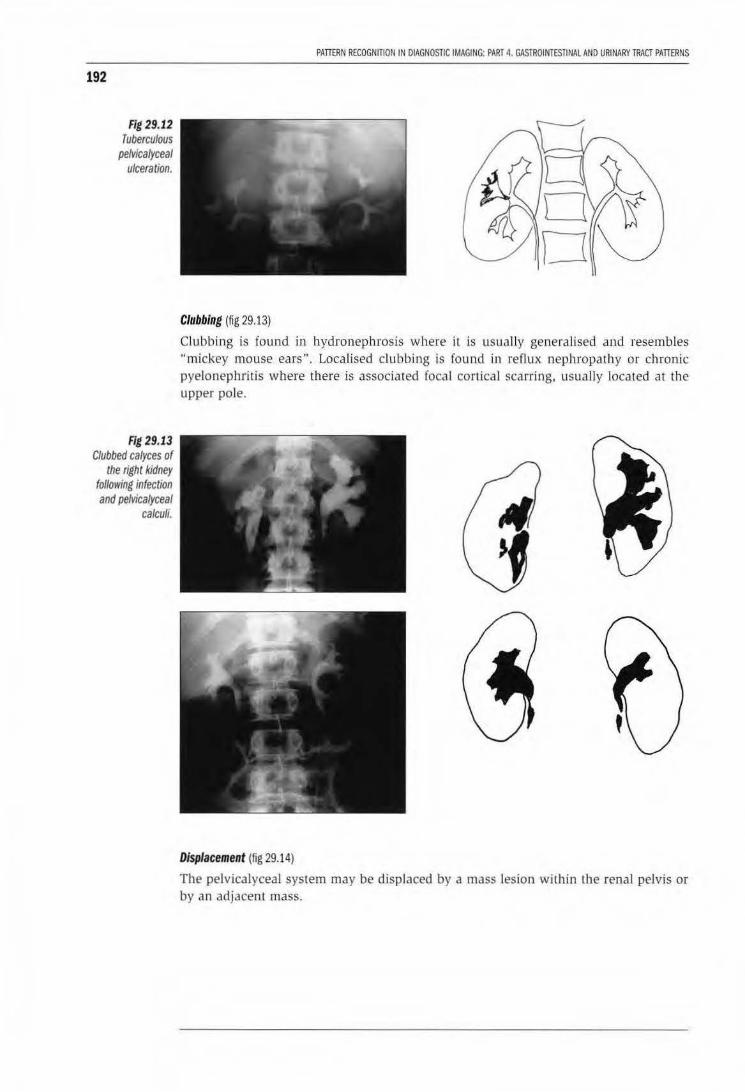
192
Fig 29.12 Tuberculous
pelvicalyceal ulceration.
Fig 29.13 Clubbed calyces of
the right kidney following infection and pefvicalyceal
calculi.
PAITERN RECOGNITION IN DIAGNOSTIC IMAGING: PART 4. GASTROINTESTINAL AND URINARY TRACT PATifRNS
Clubbing (fig 29.13)
Clubb ing is found in hydronephrosis where it is usua lly generaHsed and resembles "mickey mouse ears". LocaHsed clubbing is found in reflux nephropathy or chronic pyelonephritis where there is associated focal cortical scarring, usually located at the upper po le.
Displacement (fig 29.14)
The pelvicalyceal system may be displaced by a mass lesion within the renal pelvis or by an adjacent mass.
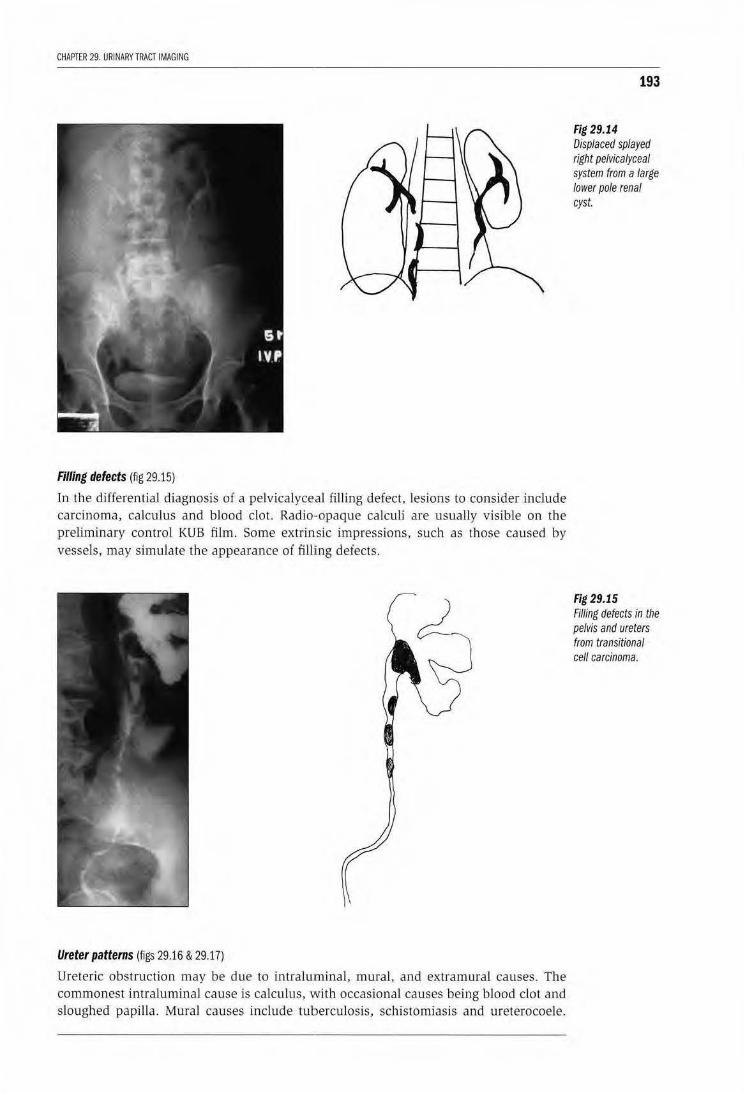
CHAPTER 29. URINARY TRACT IMAGING
Filling defects (fig 29.15)
In the differential diagnosis of a pelvicalyceal filling defect, lesions to consider include carcinoma, calculus and blood clot. Radio·opaque calculi are usual.ly visible on the preliminary control KUB film. Some extrinsic impressions, such as those caused by vessels, may simulate the appearance of filling defects.
Ureter patterns (figs 29.16 & 29.17)
Ureteric obstruction may be due to intraluminal, muraJ, and extramural causes. The commonest intralumina l cause is calculus, with occasional causes being blood clot and sloughed papilla. Mural causes include tuberculosis, schistomiasis and ureterocoele.
193
Fig 29.14 Displaced splayed right pelvicalyceal system from a large lower pole renal cyst.
Fig 29.15 Filling defects in the pelvis and ureters from transitional cell carcinoma.
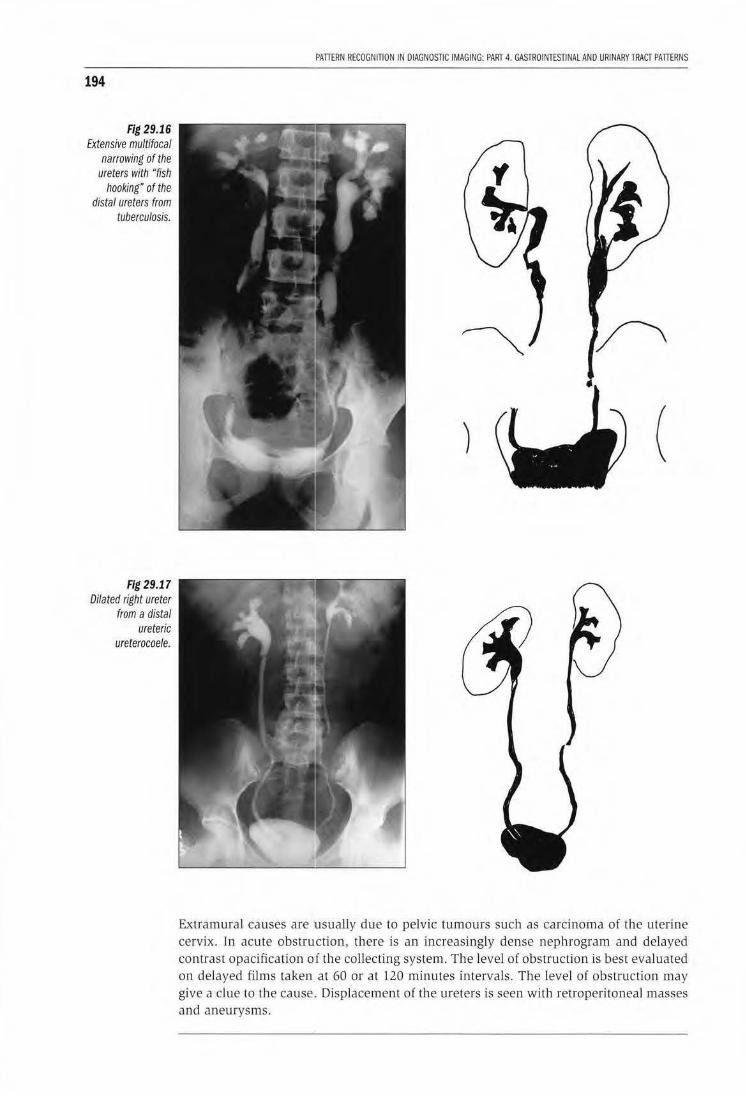
194
Fig 29.16 Extensive multifocal
narrowing of the ureters with "fish
hooking" of the distal ureters from
tuberculosis.
Fig 29.17 Dilated right ureter
from a distal ureteric
ureterocoele.
PATIERN RECOGNITION IN DIAGNOSTIC IMAGING: PART 4. GASTROINTESTINAL AND URINARY TRACT PATIERNS
(
Extramural causes are 'usually due to pelvic tumours such as carcinoma of the uterine cervix. In acute obstruction, there is an increasingly dense nephrogram and delayed contrast opacification of the collecting system. The level of obstruction is best evaluated on delayed films taken at 60 or at 120 minutes intervals. The level of obstruction may give a clue to the cause .. Displacement of the ureters is seen with retroperitoneal masses and aneurys ms.
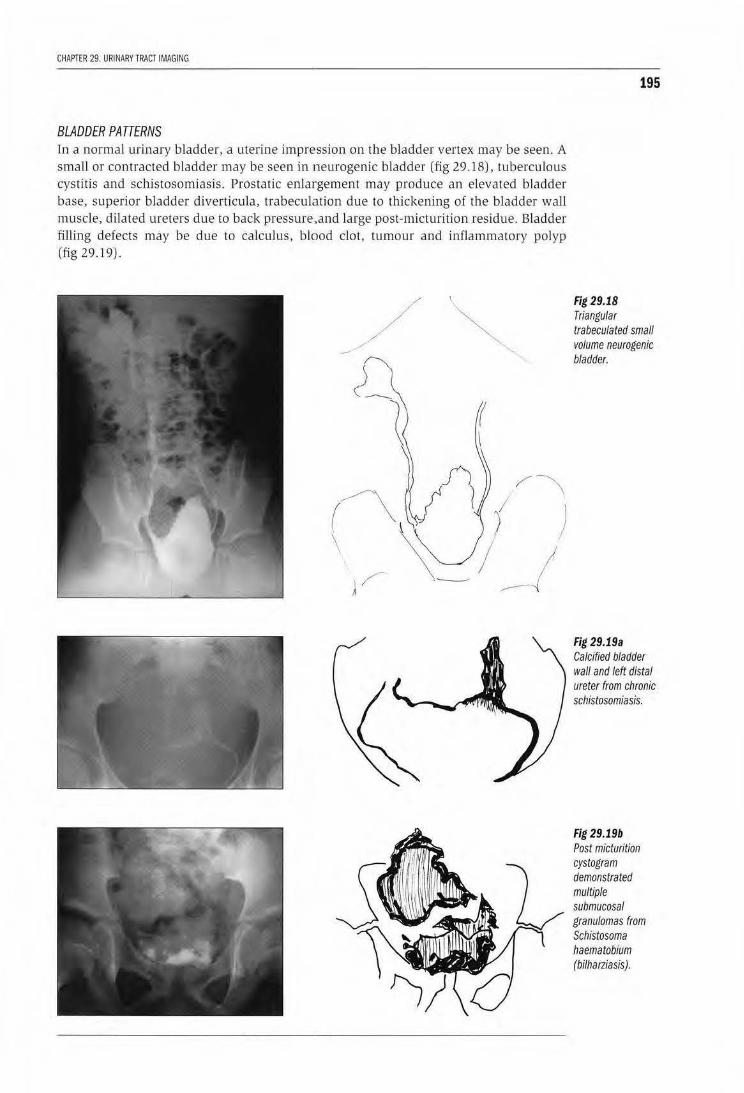
CHAPTER 29 URINARY TRACT IMAGING
BLADDER PATTERNS ln a normal urinary bladder, a uterine impression on the bladder vertex may be seen. A small or contracted bladder may be seen in neurogenic bladder (fig 29.18), tuberculous cystitis and schistosomiasis. Prostatic enlargement may produce an elevated bladder base, superior bladder diverticula, trabeculation due to thickening of the bladder wall muscle, dilated ureters due to back pressure.,and large post-micturition residue. Bladder fiJ!ing defects may be due to calculus, blood clot, tumour and inflammatory polyp (fig 29.19).
/
195
Fig 29.18 Triangular trabeculated small volume neurogenic bladder.
Fig 29.19a Calcified bladder wall and left distal ureter from chronic schistosomiasis.
Fig 29.19b Post micturition cystogram demonstrated multiple submucosal granulomas from Schistosoma haematobium (bilharziasis).
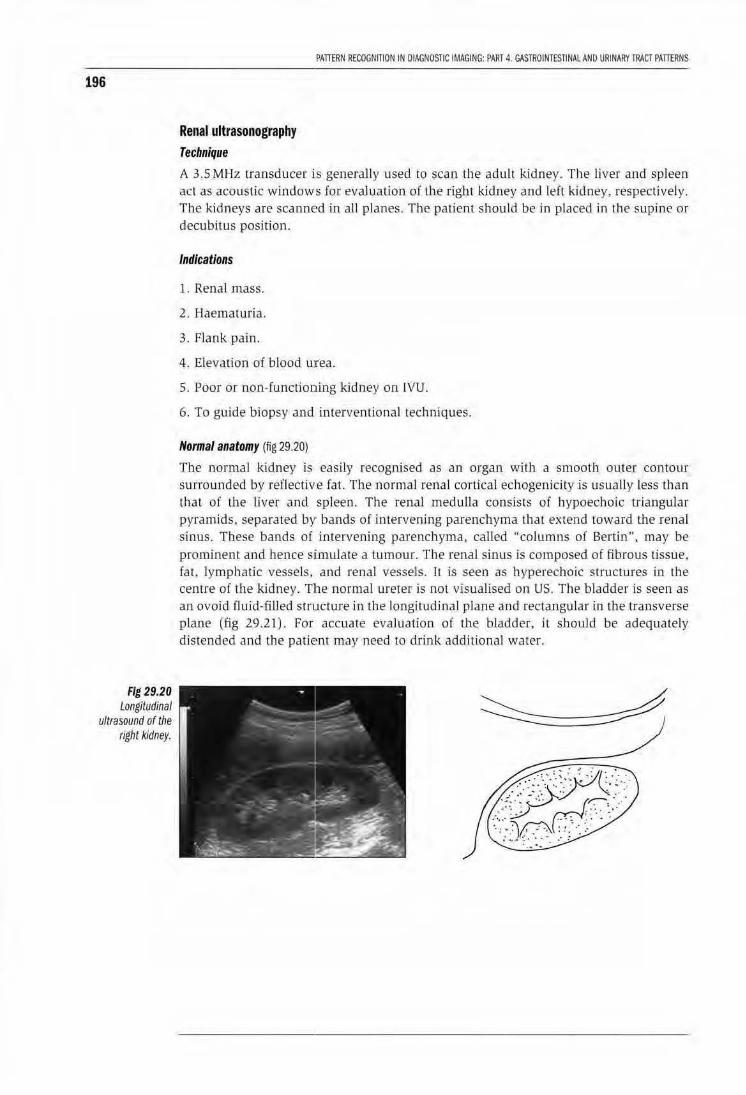
196
Fig 29.20 Longitudinal
ultrasound of the right kidney.
Renal ultrasonography Technique
PATIERN RECOGNiliON IN DIAGNOSTIC iMAGING: PART 4. GASTROINTESTINAL AND URINARY TRACT PATIERNS
A 3.5 MHz transducer is generally used to scan the adult kidney. The liver and spleen act as acoustic windows for evaluation of the right kidney and left kidney, respectively. The kidneys are scanned in all planes. The patient should be in p laced in the supine or decubitus position.
Indications
1. Renal mass.
2. Haematuria.
3. Flank pain.
4. Elevation of blood u:rea.
5. Poor or non-functioning kidney on IVU.
6. To guide biopsy and interventional techniques.
Normal anatomy (fig 29.20)
The normal kidney is easily recognLsed as an organ with a smooth outer contour surrow1ded by reflective fat. The normal renal cortical echogenicity is usua lly less than that of the liver and spleen. The renal meduJJa consists of hypoechoic triangular pyramids. separated by· bands of intt>rvening parenchyma that extend toward the renal sinus. These bands of Lntervening parenchyma, cal led "columns of Bertin", may be prominent and hence SJimulate a tumour. The renal sinus js composed of fibrous lissue, fat, lymphatic vessels, and renal vessels. It is seeo as hyperechoic structures in the cenrre of the kidney. Tlhe normal ureter is not visualised on US. The bladder is seen as an ovoid fluid-filled structure in the longitudinal plane and rectangu lar intbe transverse plane (fig 29.21) . For accuate evaluation of the bladder, it should be adequately distended and the patient may need to drink additional wa ter.
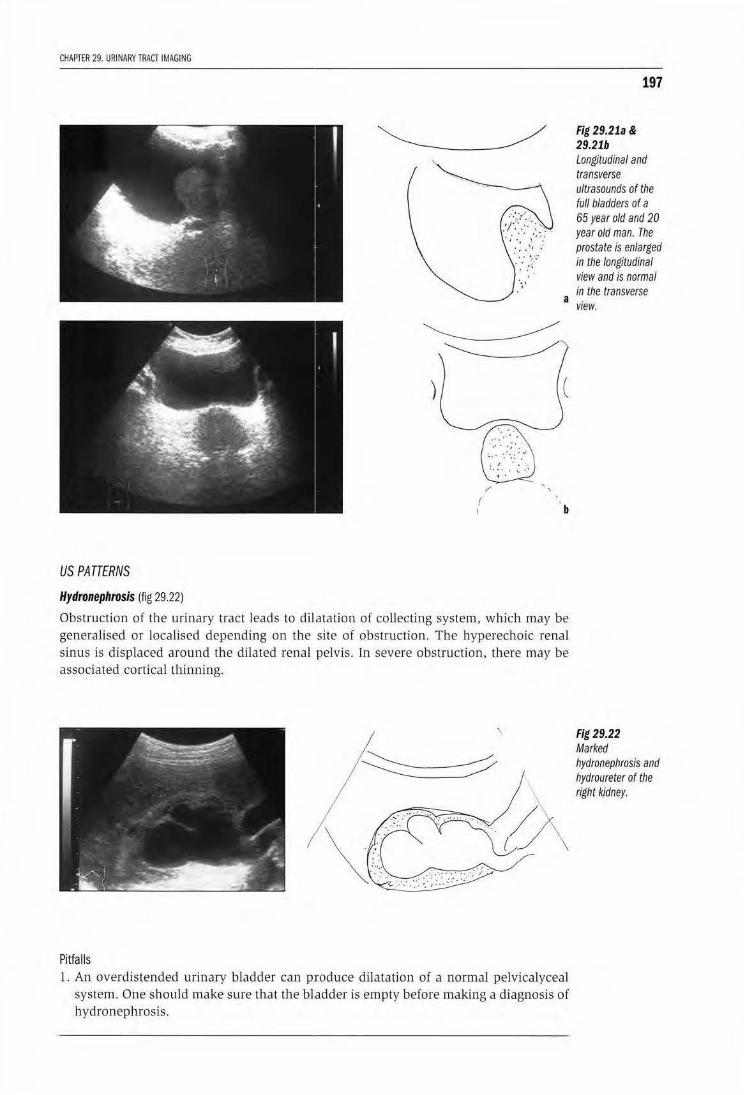
CHAPTER 29. URINARY TRACT IMAGING
197
Fig 29.21a & 29.21b Longitudinal and transverse ultrasounds of the full bladders of a 65 year old and 20 year old man. The prostate is enlarged in the longitudinal view and is normal in the transverse
a view~
~ ) (
f b
US PATTERNS
Hydronephrosis (fig 29.22)
Obstruction of the urinary tract leads to dilatation of collecting system, which may be generalised or localised depending on the site of obstruction. The byperechoic renal sinus is displaced around the dilated renal pelvis. In severe obstruction, there may be associated cortical thinning.
I
Pitfalls 1. An overdistended urinary bladder can p.roduce dilatation of a normal pelvicalyceal
system. One should make sure that the bladder is empty before making a diagnosis of hydronephrosis.
Fig 29.22 Marked hydronephrosis and hydroureter of the right kidney.
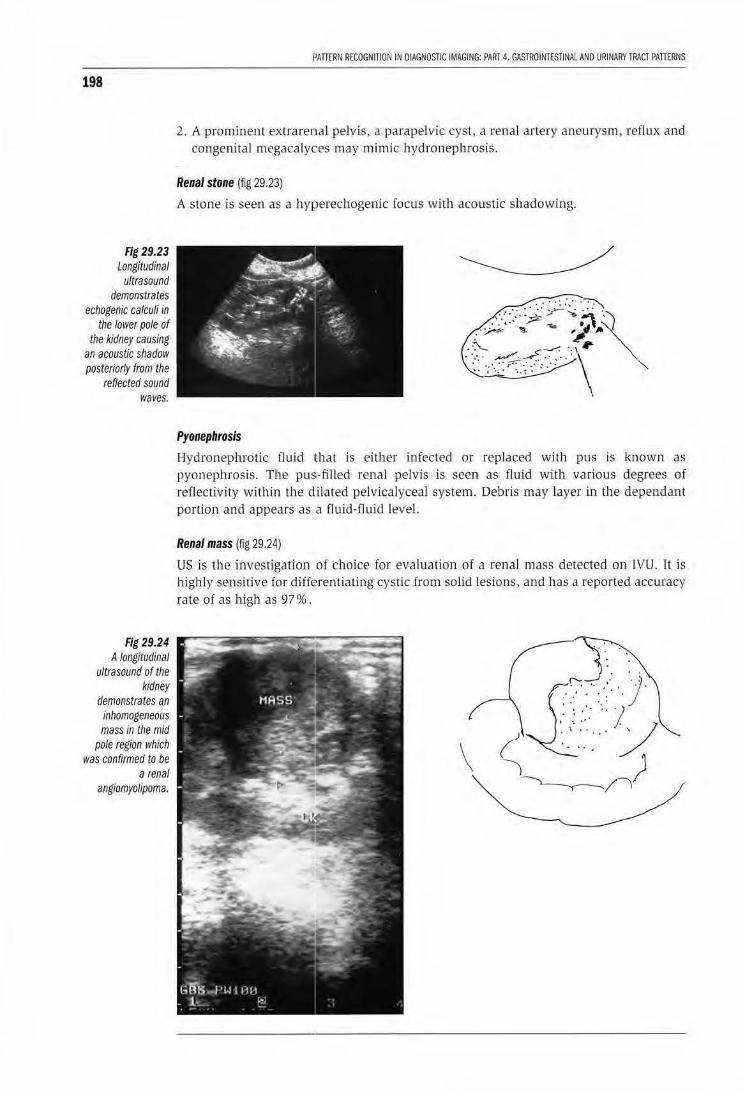
198
Fig 29.23 Longitudinal
ultrasound demonstrates
echogenic calculi in the lower pole of
the kidney causing an acoustic shadow posteriorly from the
reflected sound waves.
Fig 29.24 A longitudinal
ultrasound of the kidney
demonstrates an inhomogeneous mass in the mid
pole region which was confirmed to be
a renal angiomyolipoma.
PATTERN RECOGNITION IN DIAGNOSTIC IMAGING: PART 4. GASTROINTESTINAL AND URINARY TRACT PATTERNS
2. A prominent extrarenal pelvis, a parapelvic cyst, a renal artery aneurysm, reflux and congenital megacalyces may mimic hydronephrosis.
Renal stone (fig 29.23)
A stone is seen as a hyperechogenic focus with acoustic shadowing.
.::' ::. ~~· _;:-:~ ·.-:-:: .. ,.. _,;.- ~ ~"\ : . './-* '!!l. ~ '/.. ,. ,,
.::'>..... .,..-. ··\ · • ':. ·~~-:: •' .·.· \ ... · ... ···: .· .. : .' · "
".. 1 • • • • • ~ •
Pyonephrosis
Hydronephrotic fluid 1that is either infected or replaced with pus is known as pyonephrosis. The pus-filled renal pelvis is seen as fluid with various degrees of reilectivity within the dilated pelvicalyceal system. Debris may layer in the dependant portion and appears as a fluid -fluid level.
Renal mass (fig 29.24}
US is the investigation of choice for evaluation of a renal mass detected on IVU. It is highly sensitive for differentiating cystic from solid lesions, and has a reported accuracy rate of as high as 97%.
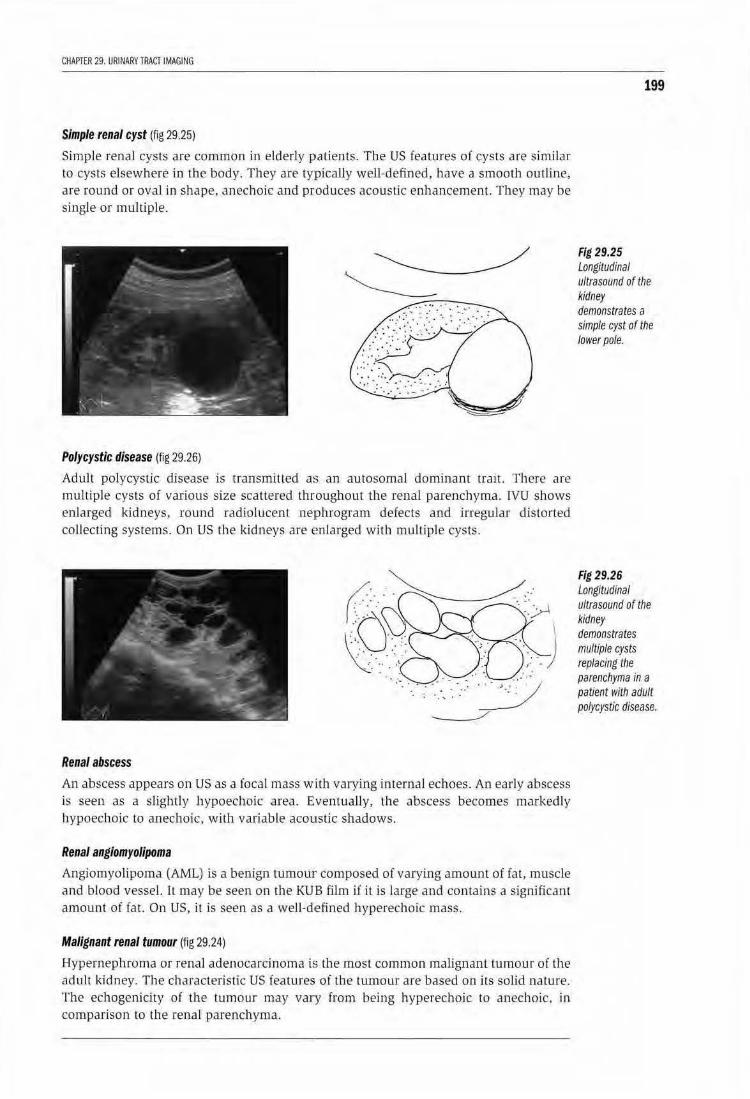
CHAPTER 29. URINARY TRACT IMAGING
Simple renal cyst (fig 29.25)
Simple renal cysts are common in elderly P'atients. The US features of cysts are similar to cysts elsewhere in the body. They are typically well-defined, have a smooth outline, are round or ova] in shape, anechoic and produces acoustic enhancement. They may be single or multiple.
Polycystic disease (fig 29.26)
Adult polycystic disease is transmilled a:; an autosomal dominant trait. There are multiple cysts of various size scattered throughout lhe renal parenchyma. IVU shows enlarged kidneys, round radiolucent neJPhrogram defects and irreg-ular distorted collecting systems. On US the kidneys are Emlarged with multiple cysts.
Renal abscess
An abscess appears on US as a focal mass with varying internal echoes. An early abscess is seen as a slightly hypoechoic area. Eventually, the abscess becomes markedly hypoechoic to anechoic, with variable acoustic shadows.
Renal angiomyolipoma
Angiornyollpoma (AML) is a benign tumour composed of varying amount of fat, muscle and blood vessel. 1l may be seen on the KU B film if it is large and contains a signjficanr amount of fat. On US, it is seen as a welJ-d,efined hyperechoic mass.
Malignant renal tumour (fig 29.24)
Hypernephroma or renal adenocarcinoma is the most common malignant tumour of the adult lddney. The characteristic US features of the twnour are based on its solid nature. The echogenicity of the tumour may vary from being hyperechoic to anechoic. in comparison to the renal parenchyma.
199
Fig 29.25 Longitudinal ultrasound of the kidney demonstrates a simple cyst of the lower pole.
Fig 29.26 LongitUdinal ultrasound of the kidney demonstrates multiple cysts replacing the parenchyma in a patient With adult polycystic disease.
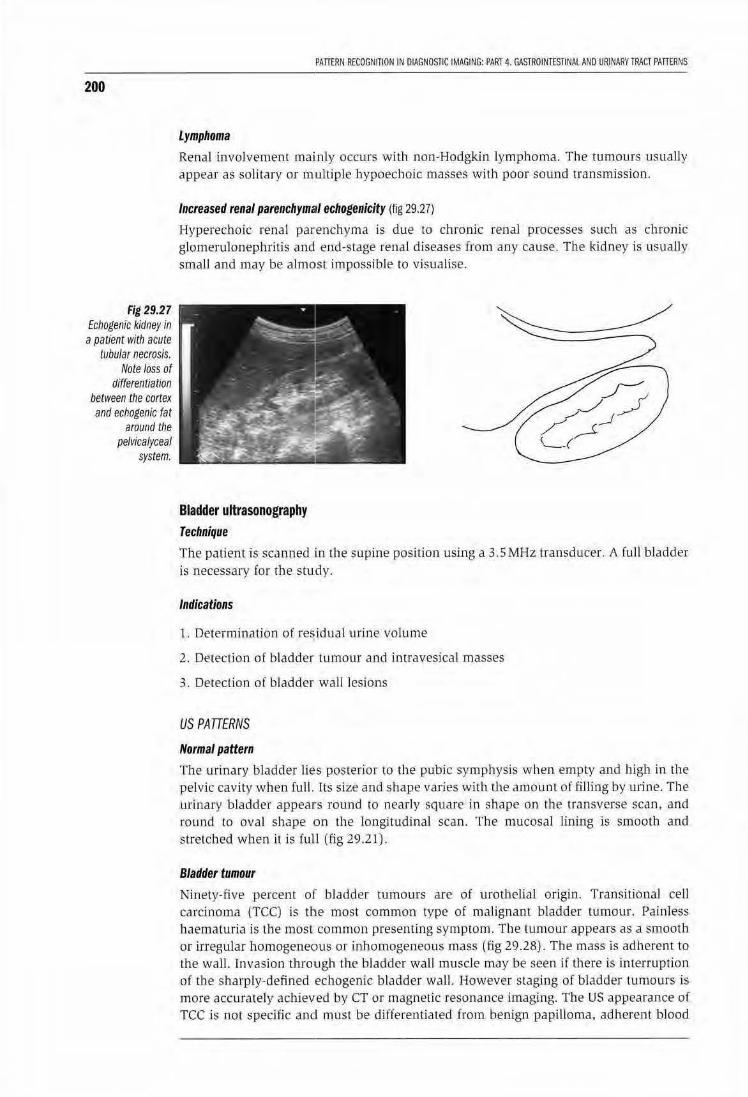
200
Fig 29.27 Echogenic kidney in a patient with acute
tubular necrosis. Note loss of
differentiation between the cortex and echogenic fat
around the pelvica/yceal
system.
PAnERN RECOGNITION IN OIAGNOSJ[C IMAGING: PART 4. GASTROINTESTINAl AND URINARY TRACT PAnERNS
Lymphoma
Renal involvement mainly occurs wilh non-Hodgkin Lymphoma. The tumours usually appear as solitary or multiple hypoechoit masses with poor sound transmission.
Increased renal parenchym~rl echogenicity (fig 29.27)
.Hyperecboic renal parenchyma is due to chronic renal processes such as chronic glomerulonephritis and end-stage renal diseases from any cause. The kidney is usually small and may be almost impossible to visualise.
Bladder ultrasonography Technique
The patient is scanned in the supine position using a 3.5MHz transducer. A full bladder is necessary for the study.
Indications
1. Determination of residual urine volume
2. Detection of bladder tumour and imravesical masses
3. Detection of bladder wall lesions
US PATTERNS
Normal pattern
The urinary bladder lies posterior to the pubic symphysis when empty and high in the pelvic cavity when full. Its size and shape varies with the amount of filling by urine. The urinary bladder appears round w nearly square in shape on the transverse scan, and round to oval shape on the longitudinal scan. The mucosal lining is smooth and stretched when it is full (og 29.21).
Bladder tumour
Ninety-five percent of bladder tumours are of urothelial ongm. Transitional cell carcinoma (ICC) is the most common type of malignant bladder lumour. Painless haematuria is the most common presenting symptom. The tumour appears as a smoot h or irregular homogeneous or inhomogeneous mass (fig 29.28). The mass is adherent to lhe wall. Invasion throlllgh lhe bladder wall muscle may be seen if there is interruption of the sharply-defined echogenic bladder wall. However staging of bladder tumours is more accurately acbieved by CT or magnetic resonance imaging. The US appearance of TCC is not specific and must be differentiated from benjg:tl papilloma, adherent blood
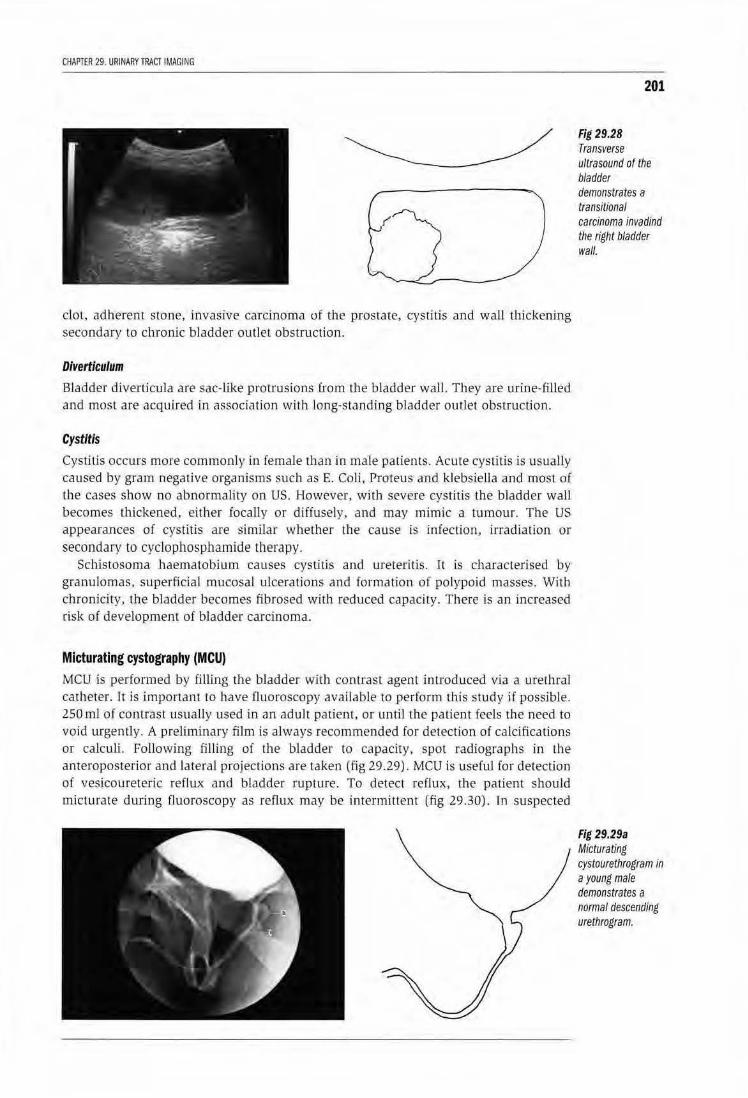
CHAPTER 29. URINARY TRACl iMAGING
clot, adherent stone, invasive carcinoma of the prostate, cystitis and wall thickening secondary lo chronic bladder outlet obstruction.
Diverticulum
Bladder diverticula are sac-like protrusions from the bladder waJl. They are urine-filled and most are acqtdred in association with long-standing bladder outlet obstruction.
Cystitis
Cystitis occms more commonly in female than in male pari.ents. Acu te cystitis is usually caused by gram negative organisms such as E. Coli, Proteus and klebsiella and most of the cases show no abnormality on US. However, with severe cystitis the bladder wall becomes Lllickened, either locally or diffusely. and may mimic a tumour. The US appearances of cystitis are similar whether the cause is infection, irradiation or secondary to cyclophosphamide therapy.
Schistosoma haematobium causes cystitis and ureteritis. It is characterised by granulomas, superficiaJ mucosal ukerations and formation of polypoid masses. With chronkity, the bladder becomes fibrosed with reduced capacity. There is an increased risk of development of bladder carcinoma.
Micturating cystography (MCU)
MCU is performed by filling the bladder with contrast agent introduced via a urethral catheter. It is important to have fluoroscopy available to perform this study if possible . 250m! of contrast usually used in an adult patient, or until the patient feels the need to void urgently. A preliminary film is aJways recommended for detection of calcifications or calculi. Following fi lling of the bladder to capacity, spot radiographs in the anteroposterior and lateral projections a.re taken (fig 29.29). MCU is useful for detection of vesicoureteric reflux and bladder rupture. To detect reflux, the patient should mjcturate dllfing (luoroscopy as reflux may be intermittent (fig 29.30) . In suspected
201
Fig 29.28 Transverse ultrasound of the bladder demotJstrates a transitional carcinoma invadind the right bladder wall.
Fig 29.29a Micturating cystourethrogram In a young male demonstrates a normal descending urethrogram.
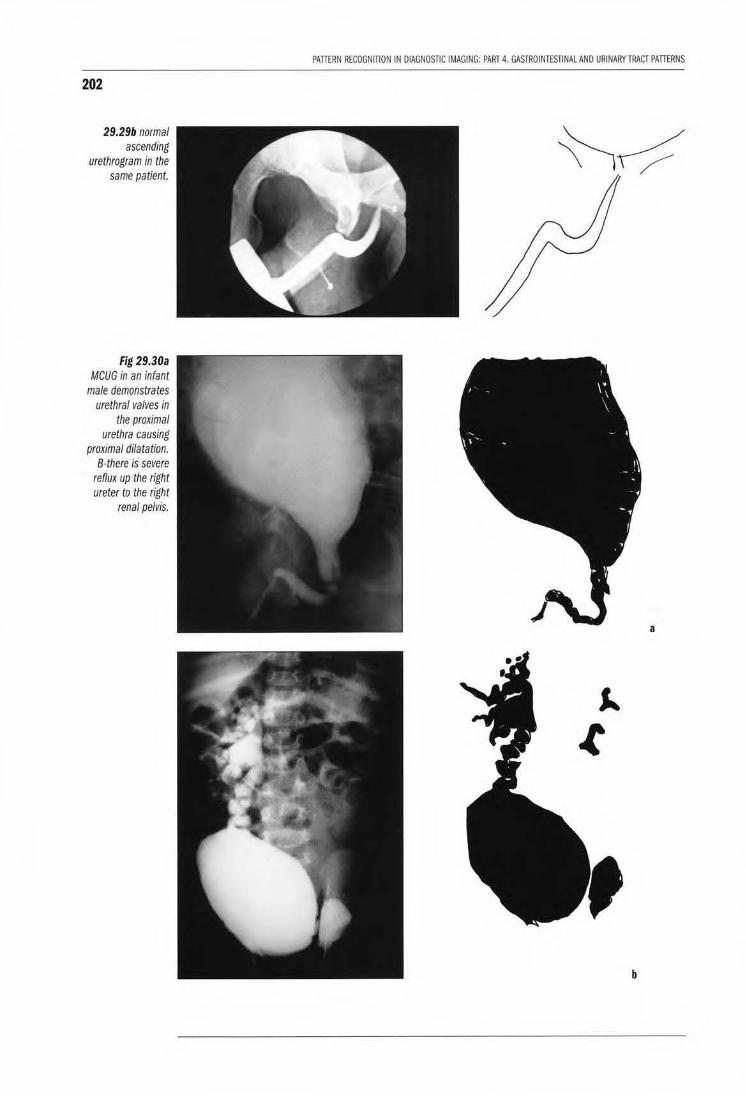
202
29.29b normal ascending
urethrogram in the same patient.
Fig 29.30a MCUG in an infant
male demonstrates urethral valves in
the proximal urethra causing
proximal dilatation. 8-there is severe
reflux up the right ureter to the right
renal pelvis.
PATIERN RECOGNITION IN DIAGNOSTIC IMAGING: PART 4. GASTROINTESTINAL AND URINARY TRACT PATIERNS
a
b
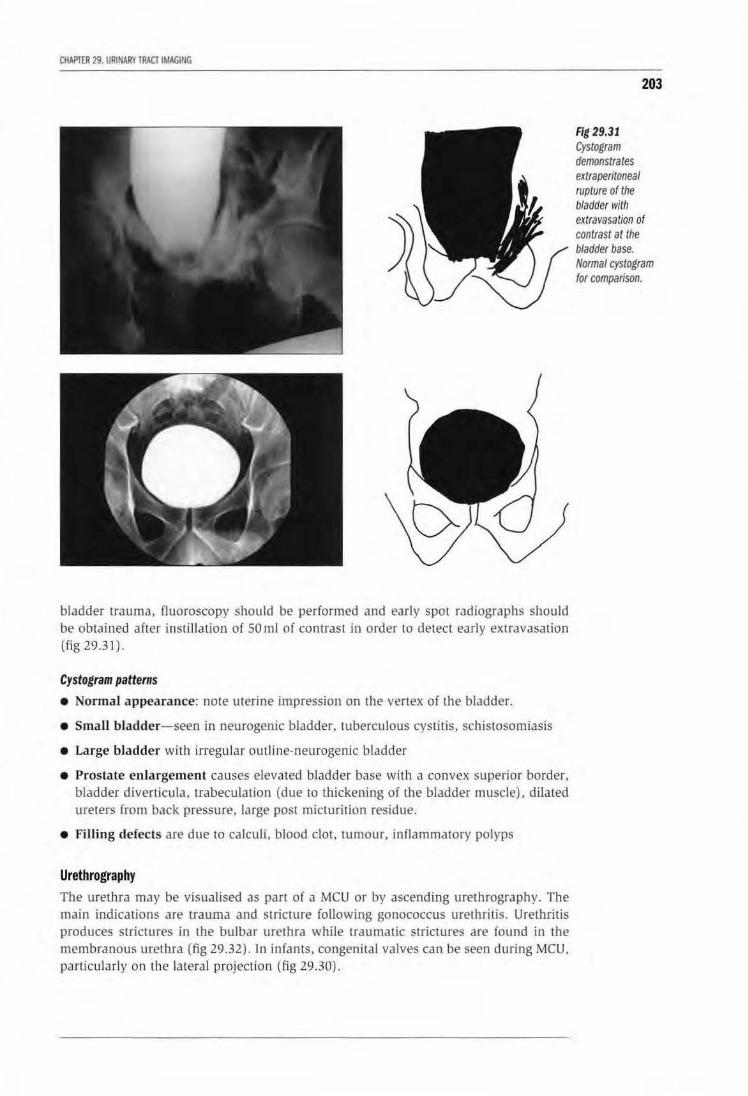
CHAPIIR 29. URINARY TRACT IMAGING
bladder trawna, fluoroscopy should be performed and early spot radiographs should be obtajned after instillation of SO ml of contrast in order to detect early extravasation (fig 29.31).
Cystogram patterns • Normal appearance: note uterine impression on the vertex of the bladder.
• Small bladder-seen in neurogenic bladder, tuberculous cystitis, schistosomiasis
• Large bladder with irregular outline-neurogenic bladder
• Prostate enlargement causes elevated bladder base with a convex superior border, bladder diverticula, trabeculation (due to thickening of the bladder muscle), dilated ureters from back pressure, large post micturition residue.
• Filling defects are due to calculi, blood clot, tumour, inflammatory polyps
Urethrography The urethra may be visualised as pan of a MCU or by ascending urethrography. The main indications are trauma and stricture following gonococcus urethritis. Urethritis produces strictures in the bulbar urethra while traumatic srrictures are found in the membranous urethra (fig 29 .32) . In infants, congenital valves can be seen during MCU, particularly on the lateral projection (fig 29.30) .
Fig 29.31 Cystogram demonstrates extraperitoneal rupture of the bladder with
203

204
Fig 29.32 Ascending
urethrogram demonstrates a
gonococcal stricture of the proximal bulbar urethra.
PATIERN RECOGNITION IN DIAGNOSTIC IMAGING: PART 4. GASTROINTESTINAL AND URINARY TRACT PATTERNS
LEARNING POINTS: URORAOIOLOGY
• Always remember to ask for a control KUB before an IVU or cystogram study to detect radiopaque calculi.
• Congenital anomalies of the kidneys and ureters are common.
• Adult kidney size is from 12-14 em in length.
• Kidneys are considered small if less than 9cm ln length in adults.
• More than 2 em difference in longitudinal height between both kidneys is significant.
• Always consider renovascular disease if one kidney Is 2 em smaller than the other and the contour is smootn.
• A small kidney with an irregular border is usually due to reflux nephropathy or tuberculosis.
• Bilateral small kidneys are due to chronic renal disease such as chrohic glomerulonephritis, papillary necrosis or chronic arteriosclerotic disease.
• Commonest cause for a large unilateral kidney is hydronephrosis or acute pyelonephritis. Ultrasound will confirm hydronephrosis.
• Common causes of renal"masses" are renal cysts, hypernephromas, renal abscess or inflammatory masses.
• Common causes of ureteric obstruction are-calculi, tuberculosis, pelvic tumours especially carcinoma of the cervix.
• A small contracted bladder is seen in neurogenic lesions. tuberculosis and schistosomiasis.
• Bladder filling defects are due to calculi, blood clot, tumour or inflammatory polyps.
• Commonest cause of a Urethral stricture is gonococcocal urethritis and pelvic trauma.

Acknowledgements
Thank you to Leonie Munro for proof reading and Marianne Singh for organizing the manuscript.
205

ISBN 92-4-154632-8
9 789241 546324