Land Suitability Analysis for Mangrove Restoration in Muara ...
Upload
khangminh22Category
view
3download
0
International Journal of
Geo-Information
Article
Land Suitability for Coffee (Coffea arabica) Growingin Amazonas, Peru: Integrated Use of AHP,GIS and RS
Rolando Salas López * , Darwin Gómez Fernández , Jhonsy O. Silva López ,Nilton B. Rojas Briceño , Manuel Oliva , Renzo E. Terrones Murga , Daniel Iliquín Trigoso ,Elgar Barboza Castillo and Miguel Ángel Barrena Gurbillón
Instituto de Investigación para el Desarrollo Sustentable de Ceja de Selva (INDES-CES),Universidad Nacional Toribio Rodríguez de Mendoza (UNTRM), Chachapoyas 01001, Peru;[email protected] (D.G.F.); [email protected] (J.O.S.L.); [email protected] (N.B.R.B.);[email protected] (M.O.); [email protected] (R.E.T.M.); [email protected] (D.I.T.);[email protected] (E.B.C.); [email protected] (M.Á.B.G.)* Correspondence: [email protected]; Tel.: +51-956-715-497
Received: 7 October 2020; Accepted: 11 November 2020; Published: 13 November 2020�����������������
Abstract: Peru is one of the world’s main coffee exporters, whose production is driven mainly by fiveregions and, among these, the Amazonas region. However, a combined negative factor, including,among others, climate crisis, the incidence of diseases and pests, and poor land-use planning, have ledto a decline in coffee yields, impacting on the family economy. Therefore, this research assessesland suitability for coffee production (Coffea arabica) in Amazonas region, in order to support thedevelopment of sustainable agriculture. For this purpose, a hierarchical structure was developed basedon six climatological sub-criteria, five edaphological sub-criteria, three physiographical sub-criteria,four socio-economic sub-criteria, and three restrictions (coffee diseases and pests). These wereintegrated using the Analytical Hierarchy Process (AHP), Geographic Information Systems (GIS)and Remote Sensing (RS). Of the Amazonas region, 11.4% (4803.17 km2), 87.9% (36,952.27 km2) and0.7% (295.47 km2) are “optimal”, “suboptimal” and “unsuitable” for the coffee growing, respectively.It is recommended to orient coffee growing in 912.48 km2 of territory in Amazonas, which presents“optimal” suitability for coffee and is “unsuitable” for diseases and pests. This research aims tosupport coffee farmers and local governments in the region of Amazonas to implement new strategiesfor land management in coffee growing. Furthermore, the methodology used can be applied to assessland suitability for other crops of economic interest in Andean Amazonian areas.
Keywords: agricultural zoning; AHP-GIS; caficulture; EMC; land suitability; site selection
1. Introduction
In February 2020, world coffee exports (arabicas and robustas) reached 11.11 million bags (60 kg),higher than the 10.83 million bags exported in February 2019 [1]. Brazil is the world’s leading coffeeproducer and exporter, boasting 2.1 million coffee-growing hectares and an average yield of 22 bagsper hectare [2]. Peru, as a coffee exporter, stands in 12th place worldwide and 3rd place in SouthAmerica [1]. Coffee is grown on approximately 425,416 ha in Peru, in 17 regions, employing morethan 223,482 families [3]. The leading regions in Peruvian coffee production are Pasco, Cajamarca,San Martín, Junín and Amazonas, having an average annual yield of 1081 kg/ha, 1046 kg/ha, 969 kg/ha,792 kg/ha and 705 kg/ha, respectively [4]. Although in February 2020, Peru exported 100,000 bags ofcoffee, 13,000 bags less than in February 2019 [5], Amazonas maintains the same production.
ISPRS Int. J. Geo-Inf. 2020, 9, 673; doi:10.3390/ijgi9110673 www.mdpi.com/journal/ijgi

ISPRS Int. J. Geo-Inf. 2020, 9, 673 2 of 21
The decrease in coffee production around the world will be further accentuated in the future,mainly due to climate change [6]. The agricultural sectors of Latin America and the Caribbean are themost affected by climate change due to their high vulnerability [7]. For its part, the cultivation of coffeeis sensitive to alterations and adverse climatic conditions, which interfere in the phenological processof coffee [8]. In addition, under climate change scenarios the incidence of diseases and pests can bemuch higher [9,10]. Another problem of the coffee activity is the deficient planning of the territory toestablish potential lands for the cultivation of coffee. As a consequence, small producers cut downforests each year to install new coffee plots, causing disturbances in the ecosystem [11].
Therefore, one of the main alternatives for self-sufficiency agriculture consists in identifying landsuitability for subsequent distribution on various types of sustainable agriculture [12,13]. The suitabilityanalyses are based on the integration of Geographic Information Systems (GIS), Remote Sensing (RS)and Multicriteria Evaluation (MCE) techniques [14]. These analyses must be constantly updatedin order to have more information on climate conditions and ensure the return on investments ofproducers [15]. The most widely used MCE technique is known as the Analytical Hierarchy Process(AHP) [16]. The AHP is used to solve complex decision-making processes, in which multiple criteria,sub-criteria and scenarios are involved, which are structured in hierarchies and the relative importancefor each hierarchical group is weighed [16].
The integration of AHP, GIS and RS has been applied in various studies of land suitability,including, among others, wheat [17–19], coffee [20–23], maize [24,25], and other crops [26,27]. However,this integration requires environmental, socioeconomic and other criteria, as well as suitabilitythresholds that define the crop’s optimal development. For this purpose, a group of experts providesinformation regarding coffee production, additionally; this group defines the importance of thecriteria and sub-criteria, and unifies the information to be used in the analysis [28]. Specifically,for land suitability analysis on coffee, climatological, soil, physiographic and social criteria have beenused [15,20,23,29]. In particular no studies, to our knowledge, have considered these techniques forland suitability on coffee in Peru, though, there is a report using only GIS and RS integration [30].Likewise, in the Amazonas region, studies on land-use planning for agriculture are still few, however,it is worth mentioning the study on the Capacity for Increased Land Use (ILU) of the Ecological andEconomic Zoning (ZEE), which focused mainly on crops in general [31].
This research analyses land suitability for coffee growing in the Amazonas region, in north-eastern(NE) Peru. For this purpose, (i) the criteria and sub-criteria that influence coffee development wereidentified and evaluated, (ii) the importance of the criteria and sub-criteria was hierarchized andweighted, (iii) the layers for each sub-criterion were elaborated, which (iv) were overlapped accordingto their weight of importance, including the study restrictions. The integration of the AHP, GIS and RS,allows an efficient analysis of land suitability and aims to guide the appropriate land-use management.In addition, it is intended to provide a methodological framework of potential application for crops ofeconomic interest in Andean Amazonian areas.
2. Materials and Methods
2.1. Study Area
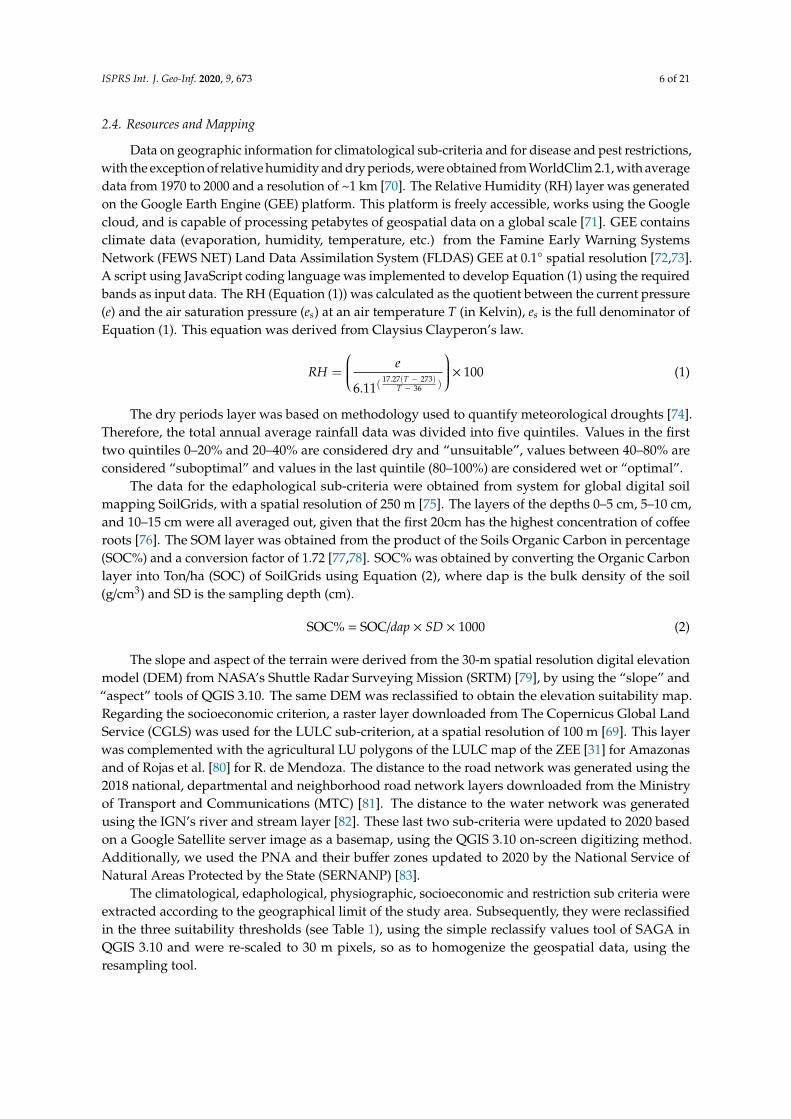
The Amazonas region is located in the north-eastern part of Peru (Figure 1, 3◦0′–7◦2′ S,and 77◦0′–78◦42′ W). It covers an area of 42,050.38 km2 of rugged territory, covered mainly bythe Amazon rainforest; the altitude ranges from 120 to 4400 m a.s.l and has a dominant warmhumid climate. It also comprises two very marked sectors: The first sector, in the Andes, has anaverage annual temperature range between 7.4 and 19.8 ◦C, and the second sector, in the high jungle,has an average annual maximum temperature of 34.6 ◦C and a minimum of 10 ◦C. The region hasentisol, inceptisol and ultisol soils [31,32]. Amazonas is one of the regions in the country withthe greatest biophysical and sociocultural diversity, is notable for its agricultural activity (e.g., rice,coffee, cocoa, potatoes, yucca, bananas, etc.) and extensive cattle farming, and has an average of

ISPRS Int. J. Geo-Inf. 2020, 9, 673 3 of 21
8.3% illiteracy of agricultural producers [31]. Amazonas has a total population of 379,384 inhabitants(9.6 inh./km2) [33] and is made up of the provinces of Bongará (3020.99 km2), Chachapoyas (4507.01 km2),Condorcanqui (17,873.82 km2), Bagua (5861.16 km2), Luya (3100.36 km2), Utcubamba (3972.83 km2)and Rodríguez de Mendoza (3714.24 km2). These last four provinces are the main coffee producers,with approximately 34,000–42,744 hectares, producing around 25,000 tons per year, and with averageyields ranging from 700 to 1250 kg/ha [31,34].
ISPRS Int. J. Geo-Inf. 2020, 9, x FOR PEER REVIEW 3 of 21
km2), Bagua (5861.16 km2), Luya (3100.36 km2), Utcubamba (3972.83 km2) and Rodríguez de Mendoza (3714.24 km2). These last four provinces are the main coffee producers, with approximately 34,000–42,744 hectares, producing around 25,000 tons per year, and with average yields ranging from 700 to 1250 kg/ha [31,34].
Figure 1. Geographical location of the Amazonas region, Peru.
2.2. Methodological Scheme
Figure 2 shows an analysis of coffee land suitability in Amazonas. In summary, (i) it identified and evaluated the climatological, soil, physiographic and socio-economic criteria as well as sub-criteria which influence on coffee growth, and (ii) it elaborated the layers with suitability thresholds for each sub-criterion, whilst also looking at (iii) the importance of the criteria and sub-criteria, which was prioritized and weighted using Pairwise Comparison Matrices (PCMs), and (iv) the maps were overlapped based on the importance weights, and finally (v) the suitability map was restricted to the conditions regarding coffee diseases and pests (restrictions).
Figure 1. Geographical location of the Amazonas region, Peru.
2.2. Methodological Scheme
Figure 2 shows an analysis of coffee land suitability in Amazonas. In summary, (i) it identifiedand evaluated the climatological, soil, physiographic and socio-economic criteria as well as sub-criteriawhich influence on coffee growth, and (ii) it elaborated the layers with suitability thresholds for eachsub-criterion, whilst also looking at (iii) the importance of the criteria and sub-criteria, which wasprioritized and weighted using Pairwise Comparison Matrices (PCMs), and (iv) the maps were

ISPRS Int. J. Geo-Inf. 2020, 9, 673 4 of 21
overlapped based on the importance weights, and finally (v) the suitability map was restricted to theconditions regarding coffee diseases and pests (restrictions).
ISPRS Int. J. Geo-Inf. 2020, 9, x FOR PEER REVIEW 4 of 21
Use of weighted overlay
Identification and selection of criteria
Classification according to thresholds
RC<10%
Potential coffee suitability map
Establishment of suitability thresholds for each sub criteria
Obtaining maps Obtaining weights
Yes
Weight(W):WixFi & WixCi
∑Wi=1
Consistency matrix
Process
Decision
Results
Database
Final coffee suitability map
Review
No
Climatological Edaphological Physiographic SocioeconomicExpert opinion
Restrictions
Data collection and processing
Figure 2. Flow chart of the methodology used for the analysis of the suitability of the territory for coffee growing in the Amazonas region, Peru.
2.3. Identification and Selection of Criteria, Sub-Criteria and Restrictions
Based on a bibliographic review, the main criteria and sub-criteria that determine the development of coffee growing in Peru and the world were identified [35–38]. For a detailed description of Arabica coffee and its cultivation, see Kuit et al. [39]. A hierarchy, therefore, was constructed based on 4 criteria (climatological, edaphological, physiographic and socioeconomic) which in turn are broken down into 18 sub-criteria (Figure 3). Accordingly, as Climatological sub-criteria, we have considered the following sub-criteria: average annual temperature, annual mean minimum temperature, annual mean maximum temperature, mean annual rainfall, relative humidity and dry periods; as Edaphological sub-criteria, pH, Texture, Stoniness, Soil Organic Matter (SOM) and Cation Exchange Capacity (CEC); in the same way, as Physiographic sub-criteria: Elevation, Terrain slope and Terrain aspect; and finally, as Socioeconomic sub-criteria: Land Use/Land Cover (LULC), distance to the road network, distance to the water network and Protected Natural Areas (PNA). Furthermore, to apply a principle of prevention, the map of potential land suitability was restricted by layers of the most common diseases and pests of coffee growing in Amazonas [40]. Such layers were based on optimal temperature for the development of coffee leaf rust (Hemileia vastatrix), coffee berry borer (Hypothenemus hampei) and leaf spot (Cercospora coffeicola).
Figure 2. Flow chart of the methodology used for the analysis of the suitability of the territory forcoffee growing in the Amazonas region, Peru.
2.3. Identification and Selection of Criteria, Sub-Criteria and Restrictions
Based on a bibliographic review, the main criteria and sub-criteria that determine the developmentof coffee growing in Peru and the world were identified [35–38]. For a detailed description of Arabicacoffee and its cultivation, see Kuit et al. [39]. A hierarchy, therefore, was constructed based on 4 criteria(climatological, edaphological, physiographic and socioeconomic) which in turn are broken downinto 18 sub-criteria (Figure 3). Accordingly, as Climatological sub-criteria, we have considered thefollowing sub-criteria: average annual temperature, annual mean minimum temperature, annual meanmaximum temperature, mean annual rainfall, relative humidity and dry periods; as Edaphologicalsub-criteria, pH, Texture, Stoniness, Soil Organic Matter (SOM) and Cation Exchange Capacity (CEC);in the same way, as Physiographic sub-criteria: Elevation, Terrain slope and Terrain aspect; and finally,as Socioeconomic sub-criteria: Land Use/Land Cover (LULC), distance to the road network, distance tothe water network and Protected Natural Areas (PNA). Furthermore, to apply a principle of prevention,the map of potential land suitability was restricted by layers of the most common diseases andpests of coffee growing in Amazonas [40]. Such layers were based on optimal temperature for thedevelopment of coffee leaf rust (Hemileia vastatrix), coffee berry borer (Hypothenemus hampei) and leafspot (Cercospora coffeicola).

ISPRS Int. J. Geo-Inf. 2020, 9, 673 5 of 21
ISPRS Int. J. Geo-Inf. 2020, 9, x FOR PEER REVIEW 5 of 21
Climatological Edaphological Physiographic Socioeconomic
- Optimal (3) - Suboptimal (2) - Unsuitable (1)
Land suitability for coffee (Coffea arabica) growing
Second hierarchyCriteria
Alternatives
Restrictions
ClassificationFirst hierarchyGoal
Ann
ual m
ean
max
tem
pera
ture
Ann
ual m
ean
min
tem
pera
ture
Rel
ativ
e hu
mid
ity
Mea
n an
nual
rain
fall
Ave
rage
ann
ual t
empe
ratu
re
Dry
per
iods
Ston
ines
s
Text
ure
Cat
ion
Exch
ange
Cap
acity
(CE
C)
Soil
Org
anic
Mat
ter
(SO
M)
pH
Asp
ect
Slop
e
Elev
atio
n
Dis
tanc
e to
the
road
net
wor
k
Dis
tanc
e to
the
wat
er n
etw
ork
Prot
ecte
d N
atur
al A
reas
(PN
A)
Land
Use
/Lan
d C
over
(LU
LC)
Cer
cosp
ora
coffe
icol
a
Hyp
othe
nem
us h
ampe
i
Hem
ileia
vas
tatr
ix
Third hierarchySub criteria
Figure 3. Hierarchical structure of criteria and sub-criteria considered in the analysis of coffee suitability in the Amazonas region, Peru.
The sub-criteria were reclassified and weighted, according to suitability thresholds of the territory, in three categories [20]: “Optimal” (3), “Suboptimal” (2) and “Unsuitable” (1) (Table 1). We considered the same categories for the restrictions; the “optimal” category for diseases or pests resulted in being “unsuitable” for coffee.
Table 1. Sub-criteria suitability thresholds (requirements) and restrictions for coffee growing in the Amazonas region, Peru.
Sub-Criteria/Criteria Optimal (3) Suboptimal (2) Unsuitable (1) Adapted from Climatological
Average annual temperature (°C) 18–23 15–18; 23–26 >26; <15 [20–22,41,42] Annual mean min temperature (°C) > 18 10–18 <10 [43,44] Annual mean max temperature (°C) < 25 25–30 >30 [45]
Mean annual rainfall (mm) 1600–1800 1100–1600; 1800–2000 <1100; >2000 [4,46–49] Relative humidity (%) 70–90 65–70 <65; >90 [22,42]
Dry periods (%) 80–100 40–80 0–40 [50] Edaphological
pH 5–6.5 4.5–5; 6.5–7.5 <4.5; >7.5 [4,51,52]
Texture (texture class) 1 L, SCL, SiCL CL, SL, SC, SiL, SiC
S, C, Si, LS [53,54]
Stoniness (%) 0–6 6–15 <15 [55,56] SOM (%) > 3 2–3 <2 [4,57]
CEC (cmol+/Kg) > 25 15–25 <15 [58] Physiographic
Elevation (m a.s.l.) 1400–1800 900–1400; 1800–2500 <900; >2500 [4,20,23] Terrain slope (%) 0–12 12–25 >25 [59,60]
Terrain aspect N, NE, NW E, W S, SW, SE [61] Socioeconomic
LULC 2 40 20 30, 50, 60, 80, 90, 112, 114, 116, 122, 124, 126
[62,63]
Distance to water network (km) 0–1 1–5 > 5 [62,63] Distance to road network (km) 0–2 2–5 > 5 [62,63]
PNA Out Buffer zone Within [64] Annual mean temperature conditions (°C) for diseases and pests
Coffee leaf rust (H. vastatrix) 22–26 17–22 <17; >26 [65,66] Coffee berry borer (H. hampei) >21 18–21 <19 [67]
Leaf spot (C. coffeicola) 22–30 19–22 <19; >30 [68] 1 L: Loam, SCL: Sandy clay loam, SiCL: Silty clay loam, CL: Clay loam, SL: Sandy loam, SC: Sandy clay, SiL: Silt loam, SiC: Silty clay, S: Sand, C: Clay, Si: Silt, LS: Loamy sand. 2 LULC typologies correspond to the Copernicus Global Land Map [69]: 40: Cropland, 20: Shrubs, 30: Herbaceous
Figure 3. Hierarchical structure of criteria and sub-criteria considered in the analysis of coffee suitabilityin the Amazonas region, Peru.
The sub-criteria were reclassified and weighted, according to suitability thresholds of the territory,in three categories [20]: “Optimal” (3), “Suboptimal” (2) and “Unsuitable” (1) (Table 1). We consideredthe same categories for the restrictions; the “optimal” category for diseases or pests resulted in being“unsuitable” for coffee.
Table 1. Sub-criteria suitability thresholds (requirements) and restrictions for coffee growing in theAmazonas region, Peru.
Sub-Criteria/Criteria Optimal (3) Suboptimal (2) Unsuitable (1) Adapted From
Climatological
Average annual temperature (◦C) 18–23 15–18; 23–26 >26; <15 [20–22,41,42]Annual mean min temperature (◦C) >18 10–18 <10 [43,44]Annual mean max temperature (◦C) <25 25–30 >30 [45]
Mean annual rainfall (mm) 1600–1800 1100–1600; 1800–2000 <1100; >2000 [4,46–49]Relative humidity (%) 70–90 65–70 <65; >90 [22,42]
Dry periods (%) 80–100 40–80 0–40 [50]
Edaphological
pH 5–6.5 4.5–5; 6.5–7.5 <4.5; >7.5 [4,51,52]
Texture (texture class) 1 L, SCL,SiCL CL, SL, SC, SiL, SiC S, C, Si, LS [53,54]
Stoniness (%) 0–6 6–15 <15 [55,56]SOM (%) >3 2–3 <2 [4,57]
CEC (cmol+/Kg) >25 15–25 <15 [58]
Physiographic
Elevation (m a.s.l.) 1400–1800 900–1400; 1800–2500 <900; >2500 [4,20,23]Terrain slope (%) 0–12 12–25 >25 [59,60]
Terrain aspect N, NE, NW E, W S, SW, SE [61]
Socioeconomic
LULC 2 40 20 30, 50, 60, 80, 90, 112,114, 116, 122, 124, 126 [62,63]
Distance to water network (km) 0–1 1–5 >5 [62,63]Distance to road network (km) 0–2 2–5 >5 [62,63]
PNA Out Buffer zone Within [64]
Annual mean temperature conditions (◦C) for diseases and pests
Coffee leaf rust (H. vastatrix) 22–26 17–22 <17; >26 [65,66]Coffee berry borer (H. hampei) >21 18–21 <19 [67]
Leaf spot (C. coffeicola) 22–30 19–22 <19; >30 [68]1 L: Loam, SCL: Sandy clay loam, SiCL: Silty clay loam, CL: Clay loam, SL: Sandy loam, SC: Sandy clay, SiL: Silt loam,SiC: Silty clay, S: Sand, C: Clay, Si: Silt, LS: Loamy sand. 2 LULC typologies correspond to the Copernicus GlobalLand Map [69]: 40: Cropland, 20: Shrubs, 30: Herbaceous vegetation, 50: Urban/built up, 60: Bare/sparse vegetation,80: water bodies, 90: Herbaceous wetland, and >100: all the forests.
ISPRS Int. J. Geo-Inf. 2020, 9, 673 6 of 21
2.4. Resources and Mapping
Data on geographic information for climatological sub-criteria and for disease and pest restrictions,with the exception of relative humidity and dry periods, were obtained from WorldClim 2.1, with averagedata from 1970 to 2000 and a resolution of ~1 km [70]. The Relative Humidity (RH) layer was generatedon the Google Earth Engine (GEE) platform. This platform is freely accessible, works using the Googlecloud, and is capable of processing petabytes of geospatial data on a global scale [71]. GEE containsclimate data (evaporation, humidity, temperature, etc.) from the Famine Early Warning SystemsNetwork (FEWS NET) Land Data Assimilation System (FLDAS) GEE at 0.1◦ spatial resolution [72,73].A script using JavaScript coding language was implemented to develop Equation (1) using the requiredbands as input data. The RH (Equation (1)) was calculated as the quotient between the current pressure(e) and the air saturation pressure (es) at an air temperature T (in Kelvin), es is the full denominator ofEquation (1). This equation was derived from Claysius Clayperon’s law.
RH =
e
6.11(17.27(T − 273)
T − 36 )
× 100 (1)
The dry periods layer was based on methodology used to quantify meteorological droughts [74].Therefore, the total annual average rainfall data was divided into five quintiles. Values in the firsttwo quintiles 0–20% and 20–40% are considered dry and “unsuitable”, values between 40–80% areconsidered “suboptimal” and values in the last quintile (80–100%) are considered wet or “optimal”.
The data for the edaphological sub-criteria were obtained from system for global digital soilmapping SoilGrids, with a spatial resolution of 250 m [75]. The layers of the depths 0–5 cm, 5–10 cm,and 10–15 cm were all averaged out, given that the first 20cm has the highest concentration of coffeeroots [76]. The SOM layer was obtained from the product of the Soils Organic Carbon in percentage(SOC%) and a conversion factor of 1.72 [77,78]. SOC% was obtained by converting the Organic Carbonlayer into Ton/ha (SOC) of SoilGrids using Equation (2), where dap is the bulk density of the soil(g/cm3) and SD is the sampling depth (cm).
SOC% = SOC/dap × SD × 1000 (2)
The slope and aspect of the terrain were derived from the 30-m spatial resolution digital elevationmodel (DEM) from NASA’s Shuttle Radar Surveying Mission (SRTM) [79], by using the “slope” and“aspect” tools of QGIS 3.10. The same DEM was reclassified to obtain the elevation suitability map.Regarding the socioeconomic criterion, a raster layer downloaded from The Copernicus Global LandService (CGLS) was used for the LULC sub-criterion, at a spatial resolution of 100 m [69]. This layerwas complemented with the agricultural LU polygons of the LULC map of the ZEE [31] for Amazonasand of Rojas et al. [80] for R. de Mendoza. The distance to the road network was generated using the2018 national, departmental and neighborhood road network layers downloaded from the Ministryof Transport and Communications (MTC) [81]. The distance to the water network was generatedusing the IGN’s river and stream layer [82]. These last two sub-criteria were updated to 2020 basedon a Google Satellite server image as a basemap, using the QGIS 3.10 on-screen digitizing method.Additionally, we used the PNA and their buffer zones updated to 2020 by the National Service ofNatural Areas Protected by the State (SERNANP) [83].
The climatological, edaphological, physiographic, socioeconomic and restriction sub criteria wereextracted according to the geographical limit of the study area. Subsequently, they were reclassifiedin the three suitability thresholds (see Table 1), using the simple reclassify values tool of SAGA inQGIS 3.10 and were re-scaled to 30 m pixels, so as to homogenize the geospatial data, using theresampling tool.

ISPRS Int. J. Geo-Inf. 2020, 9, 673 7 of 21
2.5. Multiple Criteria Evaluation (MCE) and Analytical Hierarchy Process (AHP)
A PCM was constructed to compare and weight the criteria to each other for each hierarchicalgroup (see Figure 3), and, in addition, a PCM was constructed to compare and weight diseases andpests. The construction of the aforementioned PCMs was based on the weighting scale proposed bySaaty [84] (Table 2). For each set of criteria, a group of 10 coffee growing experts assigned a weightedvalue. This group of experts was made up of national and international researchers in coffee cultivation,as well as professionals from the agricultural coffee cooperatives in the region.
Table 2. Weighting scale for pair comparison matrices based on Saaty [84].
1/9 1/8 1/7 1/6 1/5 1/4 1/3 1/2 1 2 3 4 5 6 7 8 9
Minimal Very weak Weak Slightly weak Equalimportance
Moderate Strong Very strong Extreme
Least important Most important
The PCM provided by the expert group were processed (for an example of PCM matrix processing,see [85]), which allows to us to obtain the weight of importance of each of the criteria and sub-criteria;the sum of weights should always be 1 per hierarchical group [85]. Because the PMCs of the expertsmay have inconsistencies, the inconsistency values that may be acceptable are calculated using theConsistency Ratio (CR) [84]. Therefore, it was considered that in a PCM, the highest eigenvalue (λmax)is always greater than or equal to the number of rows and columns (n) of the PCM, therefore we cancalculate the Consistency Index (CI) using Equation (4) [86]. Then, CR is calculated as the quotientbetween the CI and the Random Consistency Index (RI) [84]. The RI values are conditioned by the “n”value of the matrix, shown in Table 3.
CI = (λmax − n)/(n − 1) (3)
Table 3. RI values based on the “n” of the matrix according to Saaty [86].
n 1 2 3 4 5 6 7 8 9 10
RI 0 0 0.58 0.9 1.12 1.24 1.32 1.41 1.45 1.49
In order for the consistency of the matrix to be considered as acceptable, the CR must be lessthan 0.1; otherwise, the AHP may give erroneous results unless the assigned values in Table 1 arere-examined by the coffee-growing experts [87–90]. All of the above calculations were performed usingthe Easy AHP plugin in QGIS 2.8. Thereafter, each weighting (importance) of the sub-criteria wasmultiplied by its respective weight, obtaining a local score, which was multiplied by the weight ofeach criteria (climatological, edaphological, physiographic and socioeconomic) to obtain the globalscore and identify the most important criteria. We proceeded using a similar method for diseases andpests of coffee growing.
2.6. Obtaining Sub-Models and Suitability Model for Coffee Growing
With the weighted weights calculated and the reclassified maps, the ArcMap 10.5 Weighted Overlaytool was used to obtain the sub-models of climatological, edaphological, physiographic, socioeconomicand disease and pest suitability. At the same time, the first four sub-models were integrated withthe same tool to generate the final suitability model for coffee cultivation. This final model wasthen overlaid with the disease and pest sub-model to identify the territory with these phytosanitaryrestrictions. Furthermore, the “optimal” plots for coffee, which at the same time are “unsuitable” and“suboptimal” for diseases and pests, were counted according to their area: 0.5–1 ha, 1–2 ha, 2–3.5 ha,3.5–5 ha and >5 ha. These ranges were established considering that coffee cultivation in the Amazonasregion is practiced mainly in plots < 1 ha (family and subsistence agriculture) [91]. Plots < 0.5 ha wereconsidered insufficient to be economically viable. Finally, to validate the final suitability model, it was

ISPRS Int. J. Geo-Inf. 2020, 9, 673 8 of 21
compared with the spatial distribution of the coffee areas of the ZEE (Figure 1) [31] and with farmsgeoreferenced by the coffee cooperatives and by the Research Institute for the Sustainable Developmentof Ceja de Selva (INDES-CES) of the Toribio Rodríguez National University of Mendoza (UNTRM).For this, it was assumed that the distribution of current coffee areas is the result of a historical andtechnical selection for the best possible available area [20].
3. Results
3.1. Criteria Weighting for the Analysis of Land Suitability
Table 4 shows the weightings obtained for each sub-criterion, based on the estimates of 10 coffeegrowing experts. The most important sub-criteria for establishing coffee growth were elevation (13.27%),followed by LULC (8.18%). On the other hand, the least important were relative humidity (3.16%) andannual mean minimum temperature (2.69%). When taking the criteria into account, we found that thefollowing sub-criteria obtained the highest value for each criterion group: average annual temperature(22.37%), pH (29.22%), elevation (53.06%) and LULC (32.72%), whereas, the lowest weightings weregiven to the annual mean minimum temperature (10.76%), SOM (16.32%), aspect of the land (22.75%)and distance to water network (20.22%). Regarding restrictions, H. Vastatrix was the most important(46.7%), followed by H. hampei (32.0%) and C. coffeicola (21.2%).
Table 4. General weighting of criteria and sub-criteria for land suitability analysis regarding coffeegrowing in the Amazonas region, Peru.
Criterion Weight (%) Rank Sub-Criterion Rank Weight (%) StandardizedWeight (%)
StandardizedRank
Climatological 28.31 2
Average annual temperature 1 22.37 5.59 5Annual mean min temperature 6 10.76 2.69 18Annual mean max temperature 4 15.28 3.82 16
Mean annual rainfall 2 21.4 5.35 9Relative humidity 5 12.65 3.16 17
Dry periods 3 17.56 4.39 13
Edaphological 25.03 3
pH 1 29.22 7.31 3Texture 2 19.06 4.77 11
Stoniness 4 16.60 4.15 14SOM 5 16.32 4.08 15CEC 3 18.80 4.70 12
Physiographic 18.31 4Elevation 1 53.06 13.27 1
Slope 2 24.18 6.05 5Aspect 3 22.75 5.69 6
Socioeconomic 28.35 1
LULC 1 32.72 8.18 2Distance to water network 4 20.22 5.06 10Distance to road network 3 21.94 5.49 8
PNAs 2 25.12 6.28 4
Coffee diseasesand pests
H. vastatrix 1 46.70 46.70H. hampei 2 32.00 32.00
C. coffeicola 3 21.20 21.20
3.2. Sub-Criteria Maps Generated According to Land Suitability Thresholds
Figure 4 shows the reclassified maps for each of the climatological, edaphological, physiographicand socioeconomic sub-criteria, according to suitability thresholds (Table 1). Meanwhile, Figure 5presents the land’s suitability for diseases and pests. Furthermore, Table 5 provides the areas foreach sub-criteria suitability threshold and diseases and pests. Accordingly, the sub-criteria with thegreatest “high suitability” area in relation to their criteria group included: relative humidity (81.8%),SOM (92.8%), aspect of the land (43.9%) and PNA (70.9%). Conversely, the ones with the largest“not suitable” area were: rainfall (59.0%), CEC (25.2%), elevation (55.6%) and LULC (76.4%). Hence,the SOM is the sub-criterion that most favours coffee growth, while the LULC is in fact the sub-criterionthat most restricts the territory. Regarding restrictions, H. vastatrix has the largest area (56.6%) that issuitable for its development in Amazonas; on the contrary, H. hampei has the smallest area (37.6%).

ISPRS Int. J. Geo-Inf. 2020, 9, 673 9 of 21
ISPRS Int. J. Geo-Inf. 2020, 9, x FOR PEER REVIEW 9 of 21
Figure 4. Suitability map of the climatological (a–f), edaphological (g–k), physiographic (l–n) and socioeconomic (o–r) sub-criteria for coffee growth in the Amazonas region, Peru.
Figure 4. Suitability map of the climatological (a–f), edaphological (g–k), physiographic (l–n) andsocioeconomic (o–r) sub-criteria for coffee growth in the Amazonas region, Peru.ISPRS Int. J. Geo-Inf. 2020, 9, x FOR PEER REVIEW 10 of 21
Figure 5. Suitability maps for coffee diseases and pests in the Amazonas region, Peru.
Table 5. Suitability area for sub-criteria and restrictions for coffee growing in the Amazonas region, Peru.
Criteria Sub-Criteria Unsuitable (1) Suboptimal (2) Optimal (3) km2 % km2 % km2 %
Climatological
Average annual temperature 11,288.36 26.8% 18,820.54 44.8% 11,941.44 28.4% Annual mean min
temperature 15,327.46 36.5% 16,004.79 38.1% 10,718.09 25.5%
Annual mean max temperature 6560.06 15.6% 18,396.65 43.7% 17,093.63 40.7%
Mean annual rainfall 24,823.10 59.0% 14,909.98 35.5% 2317.26 5.5% Relative humidity 961.53 2.3% 6691.22 15.9% 34,397.59 81.8%
Dry periods 17,030.31 40.5% 15,581.36 37.1% 9438.67 22.4%
Edaphological
pH 1952.54 4.6% 15,700.48 37.3% 24,397.35 58.1% Texture 5220.09 12.4% 3206.76 7.6% 33,623.52 80.0%
Stoniness 2508.18 6.0% 14,451.71 34.4% 25,090.48 59.7% SOM 323.33 0.8% 2724.96 6.5% 39,002.08 92.8% CEC 10,587.31 25.2% 18,945.12 45.1% 12,517.94 29.8%
Physiographic Elevation 23,272.66 55.6% 14,455.07 34.5% 4322.61 10.3%
Slope 11,601.59 27.7% 17,004.65 40.6% 13,444.10 32.1% Aspect 13,846.48 33.1% 9824.54 23.5% 18,379.31 43.9%
Socioeconomic
LULC 32,124.14 76.4% 969.22 2.3% 8957.02 21.3% Distance to water network 1043.89 2.5% 14,035.28 33.4% 26,971.21 64.1% Distance to road network 29,454.62 70.0% 5208.86 12.4% 7386.86 17.6%
PNAs 6005.71 14.3% 6246.28 14.9% 29,798.38 70.9%
Coffee diseases and pests
H. vastatrix 11,972.41 28.5% 6287.24 15.0% 23,790.69 56.6% H. hampei 15,287.29 36.4% 10,933.68 26.0% 15,829.36 37.6%
C. coffeicola 14,147.37 33.6% 6570.14 15.6% 21,332.83 50.7%
3.3. Suitability Sub-Model (Criteria) Maps
With the weighted overlap of sub-criteria, the suitability sub-models were generated for each hierarchical group (Figure 6). The results demonstrate that the edaphological sub-model (60.75%) has the largest “optimal” area for coffee cultivation in Amazonas (Table 6). Nevertheless, the climatological sub-model (3.43%) has the smallest “optimal” area. Most importantly, 37.64% (15,859.40 km2) of Amazonas is not suitable for coffee cultivation, due to its “optimal” conditions for the development of diseases and pests.
Figure 5. Suitability maps for coffee diseases and pests in the Amazonas region, Peru.

ISPRS Int. J. Geo-Inf. 2020, 9, 673 10 of 21
Table 5. Suitability area for sub-criteria and restrictions for coffee growing in the Amazonas region, Peru.
Criteria Sub-CriteriaUnsuitable (1) Suboptimal (2) Optimal (3)
km2 % km2 % km2 %
Climatological
Average annual temperature 11,288.36 26.8% 18,820.54 44.8% 11,941.44 28.4%Annual mean min temperature 15,327.46 36.5% 16,004.79 38.1% 10,718.09 25.5%Annual mean max temperature 6560.06 15.6% 18,396.65 43.7% 17,093.63 40.7%
Mean annual rainfall 24,823.10 59.0% 14,909.98 35.5% 2317.26 5.5%Relative humidity 961.53 2.3% 6691.22 15.9% 34,397.59 81.8%
Dry periods 17,030.31 40.5% 15,581.36 37.1% 9438.67 22.4%
Edaphological
pH 1952.54 4.6% 15,700.48 37.3% 24,397.35 58.1%Texture 5220.09 12.4% 3206.76 7.6% 33,623.52 80.0%
Stoniness 2508.18 6.0% 14,451.71 34.4% 25,090.48 59.7%SOM 323.33 0.8% 2724.96 6.5% 39,002.08 92.8%CEC 10,587.31 25.2% 18,945.12 45.1% 12,517.94 29.8%
PhysiographicElevation 23,272.66 55.6% 14,455.07 34.5% 4322.61 10.3%
Slope 11,601.59 27.7% 17,004.65 40.6% 13,444.10 32.1%Aspect 13,846.48 33.1% 9824.54 23.5% 18,379.31 43.9%
Socioeconomic
LULC 32,124.14 76.4% 969.22 2.3% 8957.02 21.3%Distance to water network 1043.89 2.5% 14,035.28 33.4% 26,971.21 64.1%Distance to road network 29,454.62 70.0% 5208.86 12.4% 7386.86 17.6%
PNAs 6005.71 14.3% 6246.28 14.9% 29,798.38 70.9%
Coffee diseasesand pests
H. vastatrix 11,972.41 28.5% 6287.24 15.0% 23,790.69 56.6%H. hampei 15,287.29 36.4% 10,933.68 26.0% 15,829.36 37.6%
C. coffeicola 14,147.37 33.6% 6570.14 15.6% 21,332.83 50.7%
3.3. Suitability Sub-Model (Criteria) Maps
With the weighted overlap of sub-criteria, the suitability sub-models were generated for eachhierarchical group (Figure 6). The results demonstrate that the edaphological sub-model (60.75%) hasthe largest “optimal” area for coffee cultivation in Amazonas (Table 6). Nevertheless, the climatologicalsub-model (3.43%) has the smallest “optimal” area. Most importantly, 37.64% (15,859.40 km2) ofAmazonas is not suitable for coffee cultivation, due to its “optimal” conditions for the development ofdiseases and pests.ISPRS Int. J. Geo-Inf. 2020, 9, x FOR PEER REVIEW 11 of 21
Figure 6. Suitability map (a) Climatological, (b) Edaphological, (c) Physiographic, (d) Socioeconomic, and (e) Coffee growing diseases and pests in the Amazonas region, Peru.
Table 6. Suitability area of sub-model for coffee cultivation in the Amazonas region, Peru.
Criteria Unsuitable (1) Suboptimal (2) Optimal (3)
km2 % km2 % km2 % Climatological 5821.57 13.84 34,787.52 82.73 1441.25 3.43 Edaphological 195.94 0.47 16,306.93 38.78 25,547.50 60.75 Physiographic 10,844.19 25.79 28,027.54 66.65 3178.6 7.56 Socioeconomic 7951.14 18.91 25,819.26 61.40 8278.79 19.69
Coffee diseases and pests 11,972.41 28.47 14,248.57 33.88 15,829.40 37.64
3.4. Land Suitability Models for Coffee Growing
With the weighted superposition of climatological, edaphological, physiographic and socioeconomic sub-models, we generated the model of land suitability for coffee growing (Figure 7a). In fact, in Amazonas, 11.4% (4803.17 km2), 87.9% (36,952.27 km2) and 0.7% (295.47 km2) are “optimal”, “suboptimal” and “unsuitable”, respectively, for coffee growing (Table 7). At the provincial level, Rodríguez de Mendoza (1130.93 km2), Bagua (913.99 km2) and Condorcanqui (913.90 km2) present the largest areas with “optimal” suitability for coffee growing, while Luya (295.73 km2) and Chachapoyas (282.70 km2) present the least “optimal” areas. Then, with the weighted superposition of the territory suitability model for coffee growing (Figure 7a) and the suitability sub-model for diseases and pests (Figure 6e), the territory suitability model for coffee cultivation with restrictions was generated (Figure 7b). It was found that, 7.6% (1208.18 km2), 18.6% (2628.00 km2) and 8.0% (966.92 km2) of the “optimal”, “suboptimal” and “unsuitable” territory, respectively, for the development of diseases and pests, is “optimal” for growing coffee. At the provincial level, Condorcanqui (10,217.15 km2) and Bagua (4059.37 km2) present the largest areas with “optimal” suitability for the development of diseases and pests, while Luya (71.38 km2) and Chachapoyas (15.83 km2) present the least “optimal” areas. Of the territory of the Amazonas region, 6.25% (2628.00 km2) is considered “very optimal”, since it has “optimal” suitability for coffee and “suboptimal” suitability for diseases and pests, while 2.30% (966.92 km2) is considered “excellent”, since it has “optimal” suitability for coffee and is “unsuitable” for diseases and pests.
Figure 6. Suitability map (a) Climatological, (b) Edaphological, (c) Physiographic, (d) Socioeconomic,and (e) Coffee growing diseases and pests in the Amazonas region, Peru.

ISPRS Int. J. Geo-Inf. 2020, 9, 673 11 of 21
Table 6. Suitability area of sub-model for coffee cultivation in the Amazonas region, Peru.
CriteriaUnsuitable (1) Suboptimal (2) Optimal (3)
km2 % km2 % km2 %
Climatological 5821.57 13.84 34,787.52 82.73 1441.25 3.43Edaphological 195.94 0.47 16,306.93 38.78 25,547.50 60.75Physiographic 10,844.19 25.79 28,027.54 66.65 3178.6 7.56Socioeconomic 7951.14 18.91 25,819.26 61.40 8278.79 19.69
Coffee diseases and pests 11,972.41 28.47 14,248.57 33.88 15,829.40 37.64
3.4. Land Suitability Models for Coffee Growing
With the weighted superposition of climatological, edaphological, physiographic andsocioeconomic sub-models, we generated the model of land suitability for coffee growing (Figure 7a).In fact, in Amazonas, 11.4% (4803.17 km2), 87.9% (36,952.27 km2) and 0.7% (295.47 km2) are “optimal”,“suboptimal” and “unsuitable”, respectively, for coffee growing (Table 7). At the provincial level,Rodríguez de Mendoza (1130.93 km2), Bagua (913.99 km2) and Condorcanqui (913.90 km2) present thelargest areas with “optimal” suitability for coffee growing, while Luya (295.73 km2) and Chachapoyas(282.70 km2) present the least “optimal” areas. Then, with the weighted superposition of the territorysuitability model for coffee growing (Figure 7a) and the suitability sub-model for diseases and pests(Figure 6e), the territory suitability model for coffee cultivation with restrictions was generated(Figure 7b). It was found that, 7.6% (1208.18 km2), 18.6% (2628.00 km2) and 8.0% (966.92 km2) of the“optimal”, “suboptimal” and “unsuitable” territory, respectively, for the development of diseases andpests, is “optimal” for growing coffee. At the provincial level, Condorcanqui (10,217.15 km2) and Bagua(4059.37 km2) present the largest areas with “optimal” suitability for the development of diseasesand pests, while Luya (71.38 km2) and Chachapoyas (15.83 km2) present the least “optimal” areas.Of the territory of the Amazonas region, 6.25% (2628.00 km2) is considered “very optimal”, since ithas “optimal” suitability for coffee and “suboptimal” suitability for diseases and pests, while 2.30%(966.92 km2) is considered “excellent”, since it has “optimal” suitability for coffee and is “unsuitable”for diseases and pests.
Table 7. Area of the suitability model for coffee growing and percentage of area that is covered by thesuitability of the restrictions, according to provinces in Amazonas region, Peru.
Province/Region Suitability for Growing CoffeeArea (%) Covered by the Suitability of the Restrictions
Optimal (3) Suboptimal (2) Unsuitable (1)
level km2 % km2 % km2 % km2 %
Bagua
Optimal (3) 913.99 15.6 640.02 15.8 268.82 19.1 5.15 1.3Suboptimal (2) 4935.27 84.2 3419.35 84.2 1140.62 80.9 375.26 95.6Unsuitable (1) 11.95 0.2 0.00 0.0 0.00 0.0 11.95 3.0
Total 5861.20 100.0 4059.37 100.0 1409.44 100.0 392.35 100.0
Bongará
Optimal (3) 539.96 17.9 10.54 6.2 173.22 15.0 356.20 21.0Suboptimal (2) 2465.92 81.6 159.78 93.8 982.27 85.0 1323.87 78.1Unsuitable (1) 15.12 0.5 0.00 0.0 0.00 0.0 15.12 0.9
Total 3020.99 100.0 170.32 100.0 1155.49 100.0 1695.18 100.0
Chachapoyas
Optimal (3) 282.70 6.3 0.00 0.0 20.63 5.4 262.07 6.4Suboptimal (2) 4199.83 93.2 15.83 100.0 359.14 94.6 3824.76 93.0Unsuitable (1) 24.58 0.5 0.00 0.0 0.00 0.0 24.58 0.6
Total 4507.11 100.0 15.83 100.0 379.77 100.0 4111.40 100.0
Condorcanqui
Optimal (3) 913.90 5.1 378.96 3.7 534.89 7.2 0.0Suboptimal (2) 16,795.54 94.0 9836.85 96.3 6854.64 92.7 104.05 39.7Unsuitable (1) 164.43 0.9 1.34 0.0 4.82 0.07 158.27 60.3
Total 17,873.87 100.0 10,217.15 100.0 7394.36 100.0 262.32 100.0

ISPRS Int. J. Geo-Inf. 2020, 9, 673 12 of 21
Table 7. Cont.
Province/Region Suitability for Growing CoffeeArea (%) Covered by the Suitability of the Restrictions
Optimal (3) Suboptimal (2) Unsuitable (1)
level km2 % km2 % km2 % km2 %
Luya
Optimal (3) 295.73 9.5 0.74 1.0 250.81 38.3 44.18 1.9Suboptimal (2) 2800.44 90.3 70.63 99.0 403.76 61.7 2326.01 98.0Unsuitable (1) 4.22 0.1 0.00 0.0 0.04 0.0 4.18 0.2
Total 3100.39 100.0 71.38 100.0 654.61 100.0 2374.36 100.0
Rodríguez deMendoza
Optimal (3) 1130.93 30.4 26.81 27.7 817.78 48.5 286.33 14.8Suboptimal (2) 2557.60 68.9 70.02 72.3 868.90 51.5 1618.45 83.8Unsuitable (1) 25.94 0.7 0.00 0.0 0.00 0.0 25.94 1.3
Total 3714.47 100.0 96.83 100.0 1686.68 100.0 1930.72 100.0
Utcubamba
Optimal (3) 725.96 18.3 151.11 12.9 561.85 39.5 13.01 0.9Suboptimal (2) 3197.67 80.5 1022.06 87.1 862.30 60.5 1313.27 95.5Unsuitable (1) 49.24 1.2 0.15 0.0 0.00 0.0 49.09 3.6
Total 3972.87 100.0 1173.32 100.0 1424.15 100.0 1375.36 100.0
Total ForAmazonas
Optimal (3) 4803.17 11.4 1208.18 7.6 2628.00 18.6 966.92 8.0Suboptimal (2) 36,952.27 87.9 14,594.52 92.3 11,471.63 81.3 10,885.68 89.7Unsuitable (1) 295.47 0.7 1.49 0.01 4.86 0.03 289.11 2.4
Total 42,050.40 100.0 15,804.19 100.0 14,104.50 100.0 12,141.71 100.0ISPRS Int. J. Geo-Inf. 2020, 9, x FOR PEER REVIEW 12 of 21
Figure 7. Suitability map of the territory for coffee production: (a) without restrictions and (b) with restrictions due to diseases and pests in the Amazonas region, Peru.
Table 7. Area of the suitability model for coffee growing and percentage of area that is covered by the suitability of the restrictions, according to provinces in Amazonas region, Peru.
Province/Region Suitability for Growing Coffee
Area (%) Covered by the Suitability of the Restrictions Optimal (3) Suboptimal (2) Unsuitable (1)
level km2 % km2 % km2 % km2 %
Bagua
Optimal (3) 913.99 15.6 640.02 15.8 268.82 19.1 5.15 1.3 Suboptimal (2) 4935.27 84.2 3419.35 84.2 1140.62 80.9 375.26 95.6 Unsuitable (1) 11.95 0.2 0.00 0.0 0.00 0.0 11.95 3.0
Total 5861.20 100.0 4059.37 100.0 1409.44 100.0 392.35 100.0
Bongará
Optimal (3) 539.96 17.9 10.54 6.2 173.22 15.0 356.20 21.0 Suboptimal (2) 2465.92 81.6 159.78 93.8 982.27 85.0 1323.87 78.1 Unsuitable (1) 15.12 0.5 0.00 0.0 0.00 0.0 15.12 0.9
Total 3020.99 100.0 170.32 100.0 1155.49 100.0 1695.18 100.0
Chachapoyas Optimal (3) 282.70 6.3 0.00 0.0 20.63 5.4 262.07 6.4
Suboptimal (2) 4199.83 93.2 15.83 100.0 359.14 94.6 3824.76 93.0
Figure 7. Suitability map of the territory for coffee production: (a) without restrictions and (b) withrestrictions due to diseases and pests in the Amazonas region, Peru.
Of the “very optimal” and “excellent” territory for coffee cultivation, 0.3% (3.17 km2) and0.1% (2.52 km2), respectively, have plots with areas < 0.5 ha, so they are not large enough to beeconomically viable (Table 8). In addition, 75.05–98.90% of both “very optimal” and “excellent” plotshave surfaces > 10 ha, in all provinces.

ISPRS Int. J. Geo-Inf. 2020, 9, 673 13 of 21
Table 8. Area of “very optimal” (VO) and “excellent” (Ex) plots for coffee, according to provinces inthe Amazonas region, Peru.
Province/Region Suitability0.5–1 ha 1–2 ha 2–3.5 ha 3.5–5 ha 5–10 ha >10 ha
km2 % km2 % km2 % km2 % km2 % km2 %
Bagua Ex 0.02 0.3 0.09 1.7 0.0 0.0 0.08 1.5 0.16 3.0 4.82 93.6VO 0.42 0.2 0.52 0.2 0.4 0.1 0.52 0.2 1.88 0.7 264.72 98.5
Bongará Ex 0.76 0.2 1.53 0.4 0.95 0.3 0.82 0.2 2.99 0.8 348.61 97.9VO 0.18 0.1 0.56 0.3 0.47 0.3 0.45 0.3 0.98 0.6 170.52 98.4
Chachapoyas Ex 2.90 1.1 5.41 2.1 4.12 1.6 3.66 1.4 6.85 2.6 237.46 90.6VO 0.16 0.8 0.35 1.7 0.58 2.8 0.46 2.2 1.31 6.4 17.72 85.9
Condorcanqui Ex 0.00 0.0 0.00 0.0 0.00 0.0 0.00 0.0 0.00 0.0 0.00 0.0VO 2.07 0.4 3.70 0.7 6.95 1.3 8.86 1.7 16.59 3.1 495.58 92.7
Luya Ex 1.40 3.2 2.76 6.3 1.76 4.0 1.16 2.6 3.13 7.1 33.16 75.1VO 0.41 0.2 1.29 0.5 0.97 0.4 0.93 0.4 2.12 0.8 245.07 97.7
Rodríguez deMendoza
Ex 0.45 0.2 0.83 0.3 1.76 0.6 1.58 0.6 4.58 1.6 277.15 96.8VO 0.29 0.0 0.78 0.1 1.36 0.2 1.82 0.2 4.11 0.5 808.79 98.9
UtcubambaEx 0.22 1.7 0.36 2.8 0.28 2.2 0.26 2.0 0.41 3.1 11.28 86.7VO 0.98 0.2 4.67 0.8 3.19 0.6 3.04 0.5 6.43 1.1 543.28 96.7
Total forAmazonas
Ex 5.75 0.6 10.99 1.1 8.86 0.9 7.56 0.8 18.11 1.9 912.48 94.4VO 4.51 0.2 11.88 0.5 13.90 0.5 16.08 0.6 33.43 1.3 2545.68 96.9
The results of the validation show that there is a close correspondence between the patterns of theareas modeled as “optimal” for the cultivation of coffee and the coffee areas of the ZEE and the farmsgeoreferenced by the coffee cooperatives and by the INDES-CES of the UNTRM (Figure 8).ISPRS Int. J. Geo-Inf. 2020, 9, x FOR PEER REVIEW 14 of 21
Figure 8. Current coffee growing areas and land suitability modeled in the Amazonas region, Peru.
4. Discussions
Differentiating from previous studies of the suitability of the territory for the growing coffee [15,20–23,29,30,55,92], this study included a greater number of sub-criteria. Furthermore, only three [21,29,92] of the previous studies integrated AHP to rank and weigh the importance of the sub-criteria. In studies of the suitability of the territory for coffee growing, other crops [24–26] or agriculture in general [13,62,63], it is common to consider groups of climatological, edaphological, physiographic and socioeconomic criteria. However, this study included one group of criteria, that is, the most incidental disease and pest restrictions for coffee. These restrictions allow greater precision in determining the territory highly suitable for growing coffee in Amazonas region. It should be noted that the criteria used in the analysis of the suitability of the territory depend on the focus of the research and the availability of spatial data. For example, future studies may include cost–benefit, productivity, crop rate of return, costs of the land use changes, population benefited by the crop, or other economic sub-criteria [93]. However, the main problem lies in the lack of spatial data for the sub-criteria. In Peru, specifically in the Amazonas region, computer resources are scarce, even more so when it comes to specific studies of biological, environmental and social criteria at detailed local scales [94].
In terms of the development of coffee growing in Amazonas, our study shows that socio-economic (28.35%) and climatological (28.31%) criteria play a major role in coffee growing, followed
Figure 8. Current coffee growing areas and land suitability modeled in the Amazonas region, Peru.

ISPRS Int. J. Geo-Inf. 2020, 9, 673 14 of 21
4. Discussions
Differentiating from previous studies of the suitability of the territory for the growingcoffee [15,20–23,29,30,55,92], this study included a greater number of sub-criteria. Furthermore,only three [21,29,92] of the previous studies integrated AHP to rank and weigh the importance ofthe sub-criteria. In studies of the suitability of the territory for coffee growing, other crops [24–26] oragriculture in general [13,62,63], it is common to consider groups of climatological, edaphological,physiographic and socioeconomic criteria. However, this study included one group of criteria, that is,the most incidental disease and pest restrictions for coffee. These restrictions allow greater precision indetermining the territory highly suitable for growing coffee in Amazonas region. It should be notedthat the criteria used in the analysis of the suitability of the territory depend on the focus of the researchand the availability of spatial data. For example, future studies may include cost–benefit, productivity,crop rate of return, costs of the land use changes, population benefited by the crop, or other economicsub-criteria [93]. However, the main problem lies in the lack of spatial data for the sub-criteria. In Peru,specifically in the Amazonas region, computer resources are scarce, even more so when it comes tospecific studies of biological, environmental and social criteria at detailed local scales [94].
In terms of the development of coffee growing in Amazonas, our study shows that socio-economic(28.35%) and climatological (28.31%) criteria play a major role in coffee growing, followed byedaphological (25.03%) and physiographic (18.31%) criteria. However, for Mighty [21] and y Rono andMundia [29], climatological criteria are the most important, followed by edaphological, socioeconomicand physiographic criteria. In contrast, although Ochoa et al. [92] they did not analyse socioeconomiccriteria, in their study, the edaphological criteria are the most important, followed by the physiographicand climatological criteria. In fact, the number and the different sub-criteria used by each group ofcriteria, the local reality and the experience of the experts, contributed to differentiating the importanceof the criteria. Of course, in our study, the slightly greater importance of the socio-economic criteria overthe climatological and edaphological criteria concerning Amazonas may be due to the conservationistapproach of the experts. Indeed, of the socio-economic sub-criteria, foremost were LULC (32.72%)and PNA (25.12%). Therefore, both are important here, as agriculture (mainly coffee and cocoa) andlivestock farming have driven the greatest changes in LULC, making the region one of the most affectedby deforestation [80,95]. In this context, public and private PNAs have been the main strategy for insitu conservation, highlighting that Amazonas is also one of the regions to record the highest numberof PNAs [83].
In relation to climatological sub-criteria, the average annual temperature (22.37%) is the highest,followed by rainfall (21.4%); in a similar way, for Mighty [21] and Rono and Mundia [29], the temperatureis the most important climatological sub-criterion; for their part, Ochoa et al. [92] state that precipitationis the most important. In fact, coffee crops are highly sensitive to climate, especially to the temperatureat which they are grown [96,97]. Additionally, in this type of study, the suitability models are generatedunder current environmental conditions and must be constantly updated, since climate change isa factor that influences the patterns of climatological sub-criteria [15]. This is important for theagricultural sector in Latin America and the Caribbean because it is one of the most affected by climatechange [7].
With regard to the edaphological sub-criteria, Akinci et al. [13] identified soil type as the mostdecisive factor for agriculture in general, and stoniness and drainage as the least important. Similarly,in our study (coffee growing), for edaphological sub-criteria, soil pH (29.22%) is indeed the mostimportant, being followed by texture (19.06%); this also agrees with Ochoa et al. [92]. Conversely,for Rono and Mundia [29], soil pH is the least important. In fact, soil pH is key for the assimilation ofnutrients by the plant, due to the fact that the availability of nutrients varies according to the levels ofacidity; more importantly, in very high acidity, some minerals turn out to be toxic for the plants [51].
According to Rono and Mundia [29], elevation is the most important of the physiographicsub-criteria; conversely, Ochoa et al. [92] consider slope to be the most important; however, Mighty [21]consider that there is no significant difference (0.10%) between elevation and slope. In our study,

ISPRS Int. J. Geo-Inf. 2020, 9, 673 15 of 21
of course, elevation was the most important (53.06%), followed by slope (24.18%) and aspect (22.75%).In addition, like Lara et al. [20], we integrated the aspect of the terrain as a physiographic sub-criterion,because to the fact that the aspect influences sunlight reception and temperature variations at themicroclimate level [61]. In two locations in Costa Rica, Avelino et al. [98] found that crops on theeasterly-facing slopes produced better quality coffee. The experts, therefore, highlighted the elevationfrom the point of view of coffee quality, because Duicela et al. [99], determined that the coffeevarieties grown at higher elevation present higher organoleptic quality. This altitudinal factor has alsocontributed to the migration of coffee plantations to higher lands, and consequently more deforestationin the main coffee provinces of the region [80].
Regarding the socio-economic criteria, the distance to roads (21.94%) and distance to the waternetwork (20.22%) have no significant difference (0.43%) for this study, closely related to the findingspresented by Mighty [21] (1.40%). Definitely, in our study, the coffee experts prioritize the proximity toa road rather than a water body, in view of the fact that Amazonas has a privileged location in terms ofwater resources, while it lacks good road access and transportation for the arrival of inputs and theoutput of the product to the markets.
In the Amazonas region, the area modeled as “excellent” (912.48 km2) for coffee cultivation is113.5% greater than the area reported in the last national agricultural census of 2012 (427.44 km2 [34]).Although the areas modeled as “excellent” for coffee cultivation are in line with the reference spatialdistribution for validation (coffee areas in the ZEE [31] and geo-referenced farms), there are large“excellent” areas not considered in the ZEE and there are also some georeferenced farms that are notlocated in “excellent” areas. This is due to the fact that the ZEE is an old reference map (2010) and tothe lack of a national (or regional) map of the current distribution of coffee. Additionally, Lara et al. [20]indicate that some validation plantations may be located in less suitable areas as agricultural practicessuch as planting shade trees improve the suitability of the land when temperatures drop, but coffeeplantations should not be located in completely unsuitable areas.
Suitability maps for coffee diseases and pests showed that some areas of Condorcanqui, Bagua,Utcubamba, Luya and Rodriguez de Mendoza have ideal development conditions for coffee leafrust, coffee berry borer and berry blotch. These provinces (except Condorcanqui) match thosereported by the National Agrarian Health Service (SENASA), where they are constantly evaluating andapplying control measures for these diseases and pests [40]. Due to this coincidence with SENASA,our temperature-based analysis is reliable. Unfortunately, diseases and pests depend largely on otherfactors such as relative humidity, photoperiod, elevation, percentage of shade, etc. [65–68]. Therefore,in future research it is recommended to consider all factors in order to improve the precision in theevaluation of land suitability. Additionally, we suggest using thematic layers with better spatialresolution, given that diseases and pests depend on microclimates [100,101], not well represented inlayers with ~1 km resolution such as those in WorldClim.
The methodology used in this research is based on the integration of AHP, GIS and RS in order toanalyze land suitability for coffee growing; the same can be applied not only to other coffee-growingareas, but also to other crops that have nutritional, economic and environmental importance, adjustingthem to their local reality. Furthermore, these approaches have been influential in the field because ofland suitability analyses identifying areas in which a crop is suitably developed, thus contributing tonot over-exploiting the soil resource and consequently to a sustainable agriculture practice.
5. Conclusions
For the development of coffee growing in Amazonas region, the most important criteria aresocioeconomic and climatological, followed by edaphological and physiographic. The edaphologicalsub-model has the largest “optimal” area for coffee cultivation in Amazonas region, while the sub-modelwith the smallest “optimal” area is the climatological one. In Amazonas, 11.4% (4803.17 km2),87.9% (36,952.27 km2) and 0.7% (295.47 km2) of the territory presented suitability “optimal”,“suboptimal” and “unsuitable” characteristics, respectively, for coffee growing. It was found that,

ISPRS Int. J. Geo-Inf. 2020, 9, 673 16 of 21
8.0% (966.92 km2), 18.6% (2628.00 km2) and 7.6% (1208.18) present “unsuitable”, “suboptimal” and“optimal” territory, respectively, for the development of diseases and pests, is “optimal” for growingcoffee. It is recommended to orient coffee growing in 912.48 km2 of territory in Amazonas, which has“excellent” suitability for coffee.
The integrated use of AHP, GIS and RS allowed the proper identification of areas with potentialfor coffee cultivation in Amazonas region and aims to guide the proper management of the territory.In addition, a methodological framework of potential application is provided for crops of economicinterest in the Andean Amazon areas.
Author Contributions: Conceptualization, Rolando Salas López, Darwin Gómez Fernández, Jhonsy O. Silva Lópezand Elgar Barboza Castillo; Data curation, Rolando Salas López, Darwin Gómez Fernández, Jhonsy O. Silva López,Nilton B. Rojas Briceño, Renzo E. Terrones Murga and Daniel Iliquín Trigoso; Formal analysis,Rolando Salas López, Darwin Gómez Fernández, Jhonsy O. Silva López and Nilton B. Rojas Briceño;Funding acquisition, Rolando Salas López, Manuel Oliva and Miguel Ángel Barrena Gurbillón; Investigation,Rolando Salas López, Darwin Gómez Fernández, Jhonsy O. Silva López, Nilton B. Rojas Briceño andElgar Barboza Castillo; Methodology, Rolando Salas López, Darwin Gómez Fernández, Jhonsy O. Silva López,Nilton B. Rojas Briceño and Elgar Barboza Castillo; Project administration, Rolando Salas López, Manuel Olivaand Miguel Ángel Barrena Gurbillón; Resources, Rolando Salas López and Manuel Oliva; Software,Rolando Salas López, Darwin Gómez Fernández, Jhonsy O. Silva López, Nilton B. Rojas Briceño,Renzo E. Terrones Murga, Daniel Iliquín Trigoso and Elgar Barboza Castillo; Supervision, Rolando Salas López,Manuel Oliva and Miguel Ángel Barrena Gurbillón; Validation, Nilton B. Rojas Briceño, Manuel Oliva andDaniel Iliquín Trigoso; Visualization, Manuel Oliva and Miguel Ángel Barrena Gurbillón; Writing—originaldraft, Rolando Salas López, Darwin Gómez Fernández, Jhonsy O. Silva López and Nilton B. Rojas Briceño;Writing—review and editing, Rolando Salas López, Darwin Gómez Fernández, Jhonsy O. Silva López,Nilton B. Rojas Briceño, Manuel Oliva, Renzo E. Terrones Murga, Daniel Iliquín Trigoso, Elgar Barboza Castillo andMiguel Ángel Barrena Gurbillón. All authors have read and agreed to the published version of the manuscript.
Funding: This work was carried out with the support of the Public Investment Project GEOMATICA (SNIP N◦.312235), executed by the Research Institute for Sustainable Development in Highland Forests (INDES-CES) of theNational University Toribio Rodríguez de Mendoza de Amazonas (UNTRM).
Acknowledgments: The authors acknowledge and appreciate the support of the Research Institute for SustainableDevelopment in Highland Forests (INDES-CES) of the National University Toribio Rodríguez de Mendoza deAmazonas (UNTRM). They also express thanks to the group of experts who developed the matrices (L.M.G.R.,S.A.Q.Ch., S.T.L.E., S.G.Ch–Q., J.E.V.G., L.G.B.R., R.V.V., E.E.M., E.P.V., W.S., E.Q.P, A.M.Q., and J.E.J.V.), and theassociations (Cooperativa Agraria Rodriguez De Mendoza—COOPARM, Cooperativa Agraria Ecológica Cafetalerade Lonya Grande—CECAFE, Cooperativa Agraria Cafetalera Laguna de los Cóndores—COOPLDC, Asociaciónde Productores Integral y Sostenible de Amazonas—APRYSA, Asociación de Productores Agropecuarios LaPrimavera—APALP) and the group of professionals (H.Y.Q.D, E.M.R., S.M.R.Ch., N.Y.R.C., A.R.P., J.R.R., A.Ch.J.,and N.A.G.F) who contributed georeferenced coffee farms.
Conflicts of Interest: The authors declare no conflict of interest.
References
1. ICO. Trade Statistics-February 2020. Available online: http://www.ico.org/ (accessed on 2 April 2020).2. dos Anjos, F.; Belik, W.; Velleda-Caldas, N. La caficultura en Brasil: Evolución, situación actual y nuevos
retos cara al futuro. Mundo Agrar. 2011, 12, 28.3. MINAGRI. El Café Peruano. Available online: http://minagri.gob.pe/portal/485-feria-scaa/10775-el-cafe-
peruano (accessed on 16 April 2020).4. MINAGRI. Requerimientos Agroclimáticos del Cultivo de Café: Ficha Técnica N◦ 11; Ministerio de Agricultura y
Riego: Lima, Perú, 2019.5. ICO. Exports of Coffee by Exporting Countries. Available online: http://www.ico.org/trade_statistics.asp?
section=Statistics (accessed on 2 April 2020).6. Pham, Y.; Reardon-Smith, K.; Mushtaq, S.; Cockfield, G. The impact of climate change and variability on
coffee production: A systematic review. Clim. Chang. 2019, 156, 609–630. [CrossRef]7. PNUMA. La agricultura, vulnerable al cambio climático. In Boletín El PNUMA en América Latina y el Caribe;
PNUMA: Ciudad de Panamá, Panamá, 2014; Volume 2.

ISPRS Int. J. Geo-Inf. 2020, 9, 673 17 of 21
8. CEPAL; CAC-SICA. Impactos Potenciales del Cambio Climático Sobre el Café en Centroamérica 2014;Comisión Económica para América Latina y el Caribe y Consejo Agropecuario Centroamericano delSistema de la Integración Centroamericano: Ciudad de México, México, 2014.
9. Arizpe, N.; Orellana, R.; Conde, E.; Hernández, J.; Villers, M. Impacts of climatic change on coffee floweringand fruit development in Veracruz, Mexico. Interciencia 2009, 34, 322–329.
10. Jaramillo, J.; Chabi-Olaye, A.; Kamonjo, C.; Jaramillo, A.; Vega, F.E.; Poehling, H.-M.; Borgemeister, C.Thermal Tolerance of the Coffee Berry Borer Hypothenemus hampei: Predictions of Climate Change Impacton a Tropical Insect Pest. PLoS ONE 2009, 4, e6487. [CrossRef]
11. Rojas S., Á.; Hartman U., K.; Almonacid M., R. El impacto de la producción de café sobre la biodiversidad,la transformación del paisaje y las especies exóticas invasoras. Ambient. Desarro. 2012, 16, 93–104.
12. Chen, J. GIS-based multi-criteria analysis for land use suitability assessment in City of Regina.Environ. Syst. Res. 2014, 3, 13. [CrossRef]
13. Akinci, H.; Özalp, A.Y.; Turgut, B. Agricultural land use suitability analysis using GIS and AHP technique.Comput. Electron. Agric. 2013, 97, 71–82. [CrossRef]
14. Malczewski, J. GIS-based multicriteria decision analysis: A survey of the literature. Int. J. Geogr. Inf. Sci.2006, 20, 703–726. [CrossRef]
15. Sediyama, G.C.; Ferreira De Melo Junior, J.C.; Rosa, A.; Santos, D.; Ribeiro, A.; Heil Costa, M.; Hamakawa, P.J.;Nogueira Da Costa, J.M.; Cláudio Costa, L. Climatologial zoning for arabic coffee (Coffea arabica L.) in thestate of Minas Gerais, Brazil. Rev. Bras. Agrometeorol. 2001, 9, 501–509.
16. Saaty, T.L. How to make a decision: The analytic hierarchy process. Eur. J. Oper. Res. 1990, 48, 9–26.[CrossRef]
17. Mendas, A.; Delali, A. Integration of MultiCriteria Decision Analysis in GIS to develop land suitability foragriculture: Application to durum wheat cultivation in the region of Mleta in Algeria. Comput. Electron. Agric.2012, 83, 117–126. [CrossRef]
18. Dedeoglu, M.; Dengiz, O. Generating of land suitability index for wheat with hybrid system aproach usingAHP and GIS. Comput. Electron. Agric. 2019, 167, 105062. [CrossRef]
19. Bagherzadeh, A.; Gholizadeh, A. Modeling land suitability evaluation for wheat production by parametricand TOPSIS approaches using GIS, northeast of Iran. Model. Earth Syst. Environ. 2016, 2, 1–11. [CrossRef]
20. Lara Estrada, L.; Rasche, L.; Schneider, U.A. Modeling land suitability for Coffea arabica L. in CentralAmerica. Environ. Model. Softw. 2017, 95, 196–209. [CrossRef]
21. Mighty, M.A. Site suitability and the analytic hierarchy process: How GIS analysis can improve thecompetitive advantage of the Jamaican coffee industry. Appl. Geogr. 2015, 58, 84–93. [CrossRef]
22. Arango-Argoti, M.A. Zonificación Agroecológica del Café en Puerto Rico y Análisis Estructural y deComposición de Especies Arbóreas Presentes en el Agroecosistema Cafetero. Master’s Thesis, Departmentof Crops and Agro-Environmental Sciences, College of Agricultural Sciences, Universidad de Puerto Rico,Recinto de Mayagüez (RUM), Mayagüez, Puerto Rico, 2007.
23. González González, H.A.; Hernández Santana, J.R. Zonificación agroecológica del Coffea arabica en elmunicipio Atoyac de Álvarez, Guerrero, México. Investig. Geogr. 2016, 2016, 105–118. [CrossRef]
24. Pilevar, A.R.; Matinfar, H.R.; Sohrabi, A.; Sarmadian, F. Integrated fuzzy, AHP and GIS techniques for landsuitability assessment in semi-arid regions for wheat and maize farming. Ecol. Indic. 2020, 110, 105887.[CrossRef]
25. Tashayo, B.; Honarbakhsh, A.; Akbari, M.; Eftekhari, M. Land suitability assessment for maize farming usinga GIS-AHP method for a semi-arid region, Iran. J. Saudi Soc. Agric. Sci. 2020, 19, 332–338. [CrossRef]
26. Ostovari, Y.; Honarbakhsh, A.; Sangoony, H.; Zolfaghari, F.; Maleki, K.; Ingram, B. GIS and multi-criteriadecision-making analysis assessment of land suitability for rapeseed farming in calcareous soils of semi-aridregions. Ecol. Indic. 2019, 103, 479–487. [CrossRef]
27. Ali, S.; Techato, K.; Taweenkun, J.; Gyawali, S. Assessment of land use suitability for natural rubber usingGIS in the U-tapao River basin, Thailand. Kasetsart J. Soc. Sci. 2020, 41, 110–117. [CrossRef]
28. Store, R.; Kangas, J. Integrating spatial multi-criteria evaluation and expert knowledge for GIS-based habitatsuitability modelling. Landsc. Urban Plan. 2001, 55, 79–93. [CrossRef]

ISPRS Int. J. Geo-Inf. 2020, 9, 673 18 of 21
29. Rono, F.; Mundia, C.C. GIS Based Suitability Analysis for Coffee Farming in Kenya. Int. J. Geomat. Geosci.2016, 6, 1722–1733.
30. Lipa Quisbel, G.H.; Goyzueta Hancco, Y. Zonificación y Modelamiento Agroecológico Para el Cultivo decafé (Coffea Arábica l.) Utilizando la Tecnología de SIG y Teledetección en el CIP Tambopata–Sandia–Puno.Bachelor’s Thesis, Escuela Profesional de Ingeniería Agronómica, Ciencias de la Ingeniería, UniversidadNacional Del Antiplano, Puno, Perú, 2018.
31. GRA; IIAP. Zonificación Ecológica y Económica (ZEE) del Departamento de Amazonas; Gobierno Regional deAmazonas (GRA) and Instituto de Investigaciones de la Amazonía Peruana (IIAP): Iquitos, Perú, 2010.
32. MINAGRI. Región de Amazonas; Ministerio de Agricultura y riego: Lima, Perú, 2009.33. INEI. Resultados definitivos de los Censos Nacionales 2017: Amazonas. In Censos Nacionales 2017: XII de
Población, VII de Vivienda y III de Comunidades Indígenas; INEI: Lima, Perú, 2017; pp. 1–11347.34. Díaz Vargas, C.; Carmen Willems, M. Línea de Base del Sector Cafe en el Perú. Documento de Trabajo; PNUD y
PROMPERÚ: Lima, Perú, 2017.35. Moran-Centen, J.C.; Benavides-González, Á. Diagnóstico de suelos en cultivos de café (Coffea arabica L.),
maíz (Zea mays L.) y frijol (Phaseolus vulgaris L.), comunidad de Santa Julia, El Crucero, Managua. La Calera2015, 15, 26–30. [CrossRef]
36. Jiménez-Torres, A.; Massa-Sánchez, P. Producción de café y variables climáticas: El caso de Espíndola,Ecuador. Economía 2015, 15, 117–137.
37. García Lópéz, J.C.; Posada Suárez, H.E.; Salazar Villareal, F.A. Factores de producción que influyen en larespuesta de genotipos de coffea arabica L. Bajo diversas condiciones ambientales de Colombia. Cenicafé2015, 66, 30–57.
38. Arcilla-Pulgarín, J. Factores que determinan la productividad del cafetal. In Sistemas de producción de café enColombia; Arcilla, P.J., Farfán, V.F., Moreno, B.A., Salazar, G.L.F., Hincapié, G.E., Eds.; Cenicafé: Chinchiná,Colombia, 2007; pp. 62–86. ISBN 9789589819302.
39. Kuit, M.; Jasen, D.M.; Van Thiet, N. Manual for Arabica Cultivation; Tan Lam Agricultural Product Joint StockCompany: Khe Sanh, Vietnam, 2004.
40. SENASA. Monitoreo de Plagas en Café por Constantes Lluvias en la Región Amazonas.Available online: https://www.senasa.gob.pe/senasacontigo/senasa-monitoreo-de-plagas-en-cafe-por-constantes-lluvias-en-la-region-amazonas/ (accessed on 1 September 2020).
41. de Camargo, M.B.P. The impact of climatic variability and climate change on arabic coffee crop in Brazil.Bragantia 2010, 69, 239–247. [CrossRef]
42. Astigarra, A. ¿Cómo Afecta el Clima en la Producción del Café? Available online: http://www.amcce.org.mx/
letras-de-cafe/post/como-afecta-el-clima-en-la-produccion-del-cafe (accessed on 16 April 2020).43. Rena, A.; Barros, R.; Maestri, M.; Söndahl, M. Coffe. In Handbook of Environmental Physiology of Fruit Crops;
Schaffer, B., Andersen, P., Eds.; CRC Press: Boca Raton, FL, USA, 1994; pp. 101–122.44. Ortoloni, A. Parâmetros Climáticos ea Cafeicultura; Instituto Brasileiro do Café; Grupo Executivo de
Racionalizaçao da Cafeicultura: Río de Janeiro, Brasil, 1970.45. Descroix, F.; Snoeck, J. Environmental Factors Suitable for Coffee Cultivation. In Coffee: Growing, Processing,
Sustainable Production: A Guidebook for Growers, Processors, Traders, and Researchers; Wiley-VCH Verlag GmbH& Co. KGaA: Weinheim, Germany, 2004; pp. 164–177. ISBN 9783527307319.
46. García-Benavides, J. Clima agrícola del cafeto (C. Arabica) y zonas potenciales en los andes de Venezuela.Agron. Trop. 1968, 18, 57–85.
47. Descroix, F.; Wintgens, J.N. Establishing a Coffee Plantation. In Coffee: Growing, Processing, SustainableProduction: A Guidebook for Growers, Processors, Traders, and Researchers; Wiley-VCH Verlag GmbH & Co.KGaA: Weinheim, Germany, 2004; pp. 178–245, ISBN 9783527307319.
48. Carvajal, J.F. Cafeto Cultivo y Fertilización, 2nd ed.; Instituto Internacional de la Potasa: Bema, Suiza, 1984.49. Alegre, C. Climates et caféiers d’Arabie. Agronomie Tropicale 1959, 14, 23–58.50. Haarer, A.E. Modern Coffee Production; Leonard Hill Limited London: London, UK, 1956.51. Sadeghian, S. La acidez del suelo una limitante común para la producción de café. In Avances Técnicos
Cenicafé; Centro Nacional de Investigaciones de Café: Caldas, Colombia, 2016.52. Willson, K.C. Climate and Soil. In Coffee: Botany Biochemistry and Production of Beans an Beverage; Clifford, M.N.,
Willson, K.C., Eds.; Springer: New York, NY, USA, 1985; pp. 97–107.

ISPRS Int. J. Geo-Inf. 2020, 9, 673 19 of 21
53. Rosas Arellano, J.; Escamilla Prado, E.; Ruiz Rosado, O. Relación de los nutrimentos del suelo con lascaracterísticas físicas y sensoriales del café orgánico. Terra Latinoam. 2008, 26, 375–384.
54. USDA. Keys to Soil Taxonomy, 12th ed.; Natural Resources Conservation Service: Washington, DC, USA, 2014;ISBN 016085427X.
55. Rojas, O. Determinación del potencial agroecológico para el cultivo del café (Coffea arabica) en Costa Rica.Turrialba 1990, 40, 1–7.
56. Mesa, N. Selección de Suelos Para el Cafeto; Instituto Cubano del Libro: La Habana, Cuba, 1974; p. 51.57. Molina, E. El análisis de suelo y su Interpretación; Amino Grow Internacional: San Pedro, Costa Rica, 2011.58. Verheye, W. Management of agricultural land: Chemical and fertility aspects. Encycl. Life Suport Syst. 2017,
4, 1–32.59. Alvarado-Soto, M.; Rojas-Cuberto, G. El Cultivo y Beneficiado del Café, 1st ed.; Universidad Estatal a Distancia:
San José, Costa Rica, 2007.60. Nzeyimana, I.; Hartemink, A.E.; Geissen, V. GIS-based multi-criteria analysis for Arabica coffee expansion in
Rwanda. PLoS ONE 2014, 9, e107449. [CrossRef] [PubMed]61. Toranzo, J. ¿Cómo orientar una plantación? Frutic. Divers. 2007, 53, 42–46.62. Pramanik, M.K. Site suitability analysis for agricultural land use of Darjeeling district using AHP and GIS
techniques. Model. Earth Syst. Environ. 2016, 2, 1–14. [CrossRef]63. Yalew, S.G.; van Griensven, A.; Mul, M.L.; van der Zaag, P. Land suitability analysis for agriculture in the
Abbay basin using remote sensing, GIS and AHP techniques. Model. Earth Syst. Environ. 2016, 2, 1–14.[CrossRef]
64. MINAM. Ley N◦ 26834–Ley de Áreas Naturales Protegidas; Ministerio del Ambiente: Lima, Perú, 2017.65. Georgiou, S.; Imbach, P.; Anzueto, F.; del Carmen, C.; Avelino, J. Indicadores Meteorológicos y Climáticos de la
Roya del Café; CATIE, ANACAFE, CIRAD, PROMECAFE: Costa Rica, 2014.66. Leguizamón-Caycedo, J.; Orozco-Gallego, L.; Gómez-Gómez, L. Periodos de incubación (Pi) y de latencia
(PL) de la roya del cafeto en la zona cafetera central de Colombia. Cenicafé 1998, 49, 325–339.67. Miguel-Chuaire, L.C. La broca del Café, un Insecto Que se Desarrolla de Acuerdo con la Temperatura y la Altitud;
Cenicafé: Manizales, Colombia, 2010; ISSN 2145-9053.68. Ángel-Calle, C.A. Mancha de hierro. In Enfermedades del cafeto en Colombia; Gil-Vallejo, L.F., Castro
Caicedo, B.L., Cadena Gómez, G., Eds.; Cenicafé: Medellín, Colombia, 2003; p. 224. ISBN 958-97218-5-0.69. Buchhorn, M.; Smets, B.; Bertels, L.; Lesiv, M.; Tsendbazar, N.-E.; Herold, M.; Fritz, S. Copernicus Global
Land Service: Land Cover 100 m: Epoch 2015: Globe. Available online: https://zenodo.org/record/3243509#.Xxrb254zaUk (accessed on 10 May 2020).
70. Fick, S.E.; Hijmans, R.J. WorldClim 2: New 1-km spatial resolution climate surfaces for global land areas. Int.J. Climatol. 2017, 37, 4302–4315. [CrossRef]
71. Gorelick, N.; Hancher, M.; Dixon, M.; Ilyushchenko, S.; Thau, D.; Moore, R. Google Earth Engine:Planetary-scale geospatial analysis for everyone. Remote Sens. Environ. 2017, 202, 18–27. [CrossRef]
72. McNally, A. NASA/GSFC/HSL FLDAS Noah Land Surface Model L4 Global Monthly Climatology 0.1 × 0.1Degree (MERRA-2 and CHIRPS); Goddard Earth Sciences Data and Information Services Center (GES DISC):Greenbelt, MD, USA, 2018.
73. McNally, A.; Arsenault, K.; Kumar, S.; Shukla, S.; Peterson, P.; Wang, S.; Funk, C.; Peters-Lidard, C.D.;Verdin, J.P. A land data assimilation system for sub-Saharan Africa food and water security applications.Sci. Data 2017, 4, 1–19. [CrossRef]
74. Marcos V., Ó. Sequía: Definiciones, tipologías y métodos de cuantificación. Investig. Geográficas 2001,26, 59–80. [CrossRef]
75. Hengl, T.; Mendes de Jesus, J.; Heuvelink, G.B.M.; Ruiperez Gonzalez, M.; Kilibarda, M.; Blagotic, A.;Shangguan, W.; Wright, M.N.; Geng, X.; Bauer-Marschallinger, B.; et al. SoilGrids250m: Global gridded soilinformation based on machine learning. PLoS ONE 2017, 12, e0169748. [CrossRef]
76. Gómez-González, R.; Palma-López, D.J.; Obrador-Olan, J.J.; Ruiz-Rosado, O. Densidad radical y tipos desuelos en los que se produce café (Coffea arabica L.) en Chiapas, México. Ecosistemas y Recur. Agropecu. 2018,5, 203–215. [CrossRef]
77. Hoyle, F. Managing Soil Organic Matter: A Practical Guide; Paterson, J., Ed.; Grains Research and DevelopmentCorporation: Kingston, Australia, 2013; ISBN 9781921779565.

ISPRS Int. J. Geo-Inf. 2020, 9, 673 20 of 21
78. Ingram, J.S.I.; Fernandes, E.C.M. Managing carbon sequestration in soils: Concepts and terminology.Agric. Ecosyst. Environ. 2001, 87, 111–117. [CrossRef]
79. Farr, T.G.; Rosen, P.A.; Caro, E.; Crippen, R.; Duren, R.; Hensley, S.; Kobrick, M.; Paller, M.; Rodriguez, E.;Roth, L.; et al. The Shuttle Radar Topography Mission. Rev. Geophys. 2007, 45, 1–33. [CrossRef]
80. Rojas Briceño, N.B.; Barboza Castillo, E.; Maicelo Quintana, J.L.; Oliva Cruz, S.M.; Salas López, R.Deforestación en la Amazonía peruana: Índices de cambios de cobertura y uso del suelo basado enSIG. Boletín Asoc. Geógrafos Españoles 2019, 81, 1–34. [CrossRef]
81. MTC. Descarga de Datos Espaciales-Transporte Terrestre por Carretera. Available online: https://portal.mtc.gob.pe/estadisticas/descarga.html (accessed on 6 September 2020).
82. MINEDU. Descarga de Información Espacial del MED. Available online: http://sigmed.minedu.gob.pe/
descargas/ (accessed on 6 September 2020).83. SERNANP. Visor de las Áreas Naturales Protegidas. Available online: http://geo.sernanp.gob.pe/visorsernanp/
(accessed on 6 September 2020).84. Saaty, T.L. A scaling method for priorities in hierarchical structures. J. Math. Psychol. 1977, 15, 234–281.
[CrossRef]85. Hossain, M.S.; Das, N.G. GIS-based multi-criteria evaluation to land suitability modelling for giant
prawn (Macrobrachium rosenbergii) farming in Companigonj Upazila of Noakhali, Bangladesh.Comput. Electron. Agric. 2010, 70, 172–186. [CrossRef]
86. Saaty, R.W. The analytic hierarchy process-what it is and how it is used. Math. Model. 1987, 9, 161–176.[CrossRef]
87. Saaty, T.L. The Analytical Hierarchy Process; McGraw Hill: New York, NY, USA, 1980.88. Chen, Y.; Yu, J.; Khan, S. Spatial sensitivity analysis of multi-criteria weights in GIS-based land suitability
evaluation. Environ. Model. Softw. 2010, 25, 1582–1591. [CrossRef]89. Temiz, I.; Calis, G. Selection of Construction Equipment by using Multi-criteria Decision Making Methods.
Procedia Eng. 2017, 196, 286–293. [CrossRef]90. Chakraborty, S.; Banik, D. Design of a material handling equipment selection model using analytic hierarchy
process. Int. J. Adv. Manuf. Technol. 2006, 28, 1237–1245. [CrossRef]91. Leiva E., S.T. Sostenibilidad de las Fincas Cafetaleras a Través del Manejo Integrado de la Broca del Café
(Hipotenemus hampei) en el Distrito de Huambo, Rodríguez de Mendoza, Amazonas. Master’s Thesis,MAestría en Gestión para el Desarrollo Sustentable, Universidad Nacional Toribio Rodríguez de Mendozade Amazonas, Chachpoyas, Amazonas, 2016.
92. Ochoa, P.A.; Chamba, Y.M.; Arteaga, J.G.; Capa, E.D. Estimation of suitable areas for coffee growth using aGIS approach and multicriteria evaluation in regions with scarce data. Appl. Eng. Agric. 2017, 33, 841–848.[CrossRef]
93. Duc, T.T. Using GIS and AHP technique for land-use suitability analysis. In Proceedings of the InternationalSymposium on Geoinformatics for Spatial Infrastructure Development in Earth and Allied Sciences; Japan-VietnamGeoinformatics Consortium Institute for Environment and Resources: Ho Chi Minh, Vietnam, 2006; pp. 1–6.
94. Calle-Yunis, C.R.; Salas-López, R.; Oliva-Cruz, S.M.; Barboza-Castillo, E.; Silva-López, J.O.; Iliquín-Trigoso, D.;Rojas-Briceño, N.B. Land suitability for sustainable aquaculture of rainbow trout (Oncorhynchus mykiss) inmolinopampa (Peru) based on RS, GIS, and AHP. ISPRS Int. J. Geo-Inf. 2020, 9, 28. [CrossRef]
95. GEOBOSQUES. Bosque y Perdida de Bosque. Available online: http://geobosques.minam.gob.pe/geobosque/
view/perdida.php (accessed on 25 September 2020).96. Jaramillo Robledo, Á.; Guzmán-Martínez, O. Relación entre la temperatura y crecimiento en Coffea arabica
L., variedad Caturra. Cenicafé 1984, 57–65.97. Montoya, E.; Jaramillo, Á. Efecto De La Temperatura En La Producción De Café. Cenicafé 2016, 67, 58–65.98. Avelino, J.; Barboza, B.; Araya, J.C.; Fonseca, C.; Davrieux, F.; Guyot, B.; Cilas, C. Effects of slope exposure,
altitude and yield on coffee quality in two altitudeterroirs of Costa Rica, Orosi and Santa María de Dota.J. Sci. Food Agric. 2005, 85, 1869–1876. [CrossRef]
99. Guambi, L.A.D.; Cedeño, S.R.V.; Talledo, D.S.F. Calidad organoléptica de cafés arábigos en relación a lasvariedades y altitudes de las zonas de cultivo, Ecuador. Rev. Iberoam. Tecnol. Postcosecha 2017, 18, 67–77.

ISPRS Int. J. Geo-Inf. 2020, 9, 673 21 of 21
100. Liebig, T.I. Abundance of Pests and Diseases in Arabica Coffee Production Systems in Uganda-Ecological Mechanismsand Spatial Analysis in the face of Climate Change; Doktorarbeit, Gartenbauwissenschaften, Universität Hannover:Hanovre, Germany, 2017.
101. Villarreyna, A.R.A. Efecto de la Sombra Sobre las Plagas y Enfermedades, a Través del Microclima, Fenología yEstado Fisiológico del Cafeto. Available online: https://agritrop.cirad.fr/581152/ (accessed on 8 October 2019).
Publisher’s Note: MDPI stays neutral with regard to jurisdictional claims in published maps and institutionalaffiliations.
© 2020 by the authors. Licensee MDPI, Basel, Switzerland. This article is an open accessarticle distributed under the terms and conditions of the Creative Commons Attribution(CC BY) license (http://creativecommons.org/licenses/by/4.0/).
Copyright © 2022 FDOKUMEN