A Land Suitability Assessment for Sugarcane Cultivation in ...
159
A Land Suitability Assessment for Sugarcane Cultivation in Angola - Bioenergy Implications By Leena S Ackbar Submitted as the dissertation component (which counts for 50 % of the degree) in partial fulfilment of the requirements for the degree of Master of Science (coursework) Environmental Sciences in the School of Environmental Sciences, University of KwaZulu-Natal, Durban, 4041, South Africa December 2007
-
Upload
khangminh22 -
Category
Documents
-
view
1 -
download
0
Transcript of A Land Suitability Assessment for Sugarcane Cultivation in ...

A Land Suitability Assessment for Sugarcane
Cultivation in Angola - Bioenergy Implications
By
Leena S Ackbar
Submitted as the dissertation component (which counts for 50 % of the degree) in
partial fulfilment of the requirements for the degree of Master of Science
(coursework) Environmental Sciences in the School of Environmental Sciences,
University of KwaZulu-Natal, Durban, 4041, South Africa
December
2007
i
Abstract
Bioenergy is a source of clean, renewable energy and is seen as a promising endeavor
in mitigating and abating climate change. Its use brings various social, environmental
and economic benefits and particularly for Africa, bioenergy offers opportunities to
improve energy security and reduce dependence on foreign exchange earnings, which
would bring Africa’s poor closer to a secure energy future. A predominant source of
bioenergy supply is in the form of specific bioenergy crops, of which sugarcane,
sweet sorghum and maize are examples. This study focused on the cultivation of
sugarcane for bioenergy purposes and aimed to delimit areas suitable for cane
cultivation in Angola. Sugarcane was selected as the bioenergy feedstock due to its
variety of by-products which includes bioethanol for gasoline blending and bagasse
for electricity cogeneration. Due to its high agricultural productivity, sugarcane was
the favoured bioenergy feedstock. Angola was selected as the study area due to its
large areas of non-forest agricultural land which affords significant capacity for
bioenergy production.
Geographic Information Systems was used as the key tool in identifying areas suitable
for sugarcane cultivation. As this study serves to promote social, economic and
environmental sustainability, areas which are currently under food production,
protected areas as well as areas of biological significance were filtered out from the
study area. The areas identified following this step was an indication of areas which
are potentially available and suitable to grow sugarcane without environmental
constraints. However, in order to determine the viability of establishing sugarcane
farms at the areas identified, a further selection process was conducted, considering
the non-biophysical factors influencing sugarcane production. These included
proximity to roads, transport infrastructure, areas greater than 10 000 hectares and
population data. This inspection resulted in three areas being selected as potentially
suitable for sugarcane cultivation. The selected areas cover 0.9% of the study area,
covering 10 614 km2 of land. Although this may be a small percentage of the study
area, potentially suitable areas are concentrated in eight provinces in the south, central
and northern regions. In addition, as this study focussed on irrigated agriculture, slope
and proximity to rivers were analysed as these are the two main considerations
influencing irrigation at the selected areas. Results indicate that Angola’s irrigation
ii
potential is largely unexploited and due to the vast network of rivers flowing through
the country, irrigated agriculture appears encouraging. An analysis of Angola’s
transport infrastructure highlights concern over the poor condition of roads which
may be an impediment in establishing sugarcane farms at the suggested areas.
However, processing capacity at each of the selected areas appears encouraging as
each of the selected areas has the potential to house a minimum of three mills in its
manufacturing phase. Furthermore, the large population base at each of the selected
areas, a low HIV prevalence rate and an unemployment level of 50%, indicates a great
likelihood of available workforce for each of the selected areas. These findings
suggest that Angola has a considerable capacity for agricultural expansion, especially
into bioenergy which is a promising endeavour in uplifting the social welfare of its
citizens as well as a sound financial and development option contributing to the
sustainable development of the country.
Several recommendations have emanated from the results obtained in the study of
which includes the encouragement of establishing international cooperations between
Angola, the North and Brazil in order to bring scientific, technical and agronomic
expertise into the country for bioenergy development.

iii
PREFACE
The work described in this dissertation was carried out in the School of
Environmental Sciences, University of KwaZulu-Natal, Durban, from February 2007
to December 2007, under the supervision of Dr. Helen Kerr Watson.
This study represents original work by the author and has not otherwise been
submitted in any form for any degree or diploma to any other University. Where use
has been made of the work of others, it has been duly acknowledged in the text.
Leena S Ackbar

iv
TABLE OF CONTENTS
Chapter 1: Introduction 1.1.Introduction 1 1.2.Motivation for study 1-3 1.3.Motivation for choice of biomass feedstock - Sugarcane 3-5 1.4.Motivation for study area - Angola 5-7 1.5.Aim of the study 7 1.6.Objectives of the study 7-8 1.7.Structure of the thesis 8-9 Chapter 2: Background on Biomass and Bioenergy 2.1.Introduction 10-11 2.2.Biomass and biomass energy 11-13 2.3.The transition from traditional to modern bioenergy 13-14 2.3.1. The Role of Modern Bioenergy in mitigating Climate Change 14-16 2.4. Forms of Modern Bioenergy Use 16 2.4.1. Biofuels 16 2.4.1.1. Bioethanol 17-18 2.4.1.2. Biodiesel 18 2.4.1.3. Biomethanol 19 2.4.2. Biogas 19 2.4.3. Electricity Cogeneration 19-20 2.5. Sugarcane as a bioenergy crop 20-21 2.5.1. Bioethanol 21 2.5.1.1. Ethanol production 21-22 2.5.2. Electricity cogeneration 22-23 2.5.3. Vinasse 23 2.5.4. Household-Gel-fuel 23-24 2.6. Bioenergy implications for Africa 24-26 2.7. Negative impacts of Bioenergy 26 2.7.1. Land use 26-27 2.7.2. Loss of biodiversity and deforestation 27-28 2.7.3. Potential GHG emissions 28-29 2.7.4. Soil erosion 29 2.7.5. Water use and water contamination 29-30 2.8. Conclusion 30 Chapter 3: Ecology of Sugarcane 3.1 Introduction 31 3.2. Origin of Sugarcane 31 3.3. Ecology 32 3.3.1. Latitude, Altitude and Terrain Requirements 32 3.3.2. Soil 32 3.3.2.1. Physical Requirements 33 3.3.2.2. Chemical Requirements 33 3.3.2.2.1. Nutrients 33-34 3.3.2.2.2. pH and Salinity 34

v
3.4.Climatic Requirements 34 3.4.1. Temperature 34-35 3.4.2. Insolation 35 3.4.3. Water Requirements 35 3.4.3.1. Rainfall 35-36 3.4.3.2. Irrigation 36-37 3.4.4. Relative Humidity 37 3.5. Sugarcane Growth 37 3.5.1. Germination and Establishment 37-38 3.5.2. Stem Elongation 38 3.5.3. Maturation and Ripening 38 3.5.4. Harvesting 38-39 3.6. Cultivation 39 3.6.1. Cane Variety 39 3.6.2. Land preparation, Fertilisers and Water supply 39-40 3.6.3. Transportation to the mill 40 3.6.4. Weeds, pests and disease control 40-41 3.7. Sugar production 41 3.8. By-products of cane processing 41 3.8.1. Bagasse 41 3.8.2. Filter cake 42 3.8.3. Molasses 42 3.8.4. Cane trash 42 3.9. The non-biophysical considerations in sugarcane management 42-43 3.9.1. Sugarcane Harvesting 43-44 3.9.2. Sugarcane transport – infrastructure considerations 44 3.9.2.1. Intraplantation transport 45 3.9.2.2. Inter-area transport 45-46 3.10. Conclusion 46 Chapter 4: Description of Study Area-Angola 4.1. Introduction 47 4.2. Geography 47-49 4.3. Climate 50 4.4. Vegetation 50 4.5. Angola’s agriculture sector 51-52 4.6. Minerals and Natural Resources 52-53 4.7. Population characteristics 53 4.8. Organisations 53 4.9. Environmental Agreements and Environmental Overview 53-54 4.10. Angola’s Power Industry 54-55 4.11. Transport – road, rail and the agricultural sector 55-56 4.12. Irrigation and irrigation potential 56-58 4.13. Conclusion 58-59 Chapter 5: Methodology 5.1. Introduction 60 5.2. Methodological Approach – A Land Suitability Assessment 60-61 5.3. Intended Land Use 61-62

vi
5.4. Overview of methodology 62-64 5.5. Tools for Evaluation 64 5.5.1 Geographic Information Systems 64-65 5.5.2. Remote Sensing 65 5.6. Assumptions and limitations regarding the data and project 66-68 5.7. Data sources 68 5.7.1. Land cover 68-70 5.7.2. Protected areas 70-72 5.7.3. Roads, Railroads and Rivers 72 5.7.4. Digital Elevation Model (DEM) and Population Data 72 5.8. Steps in methodology 72 5.8.1. Phase I 72-73 5.8.2. Phase II 73-74 5.8.3. Phase III 74 5.9. Verification of areas suitable for sugarcane cultivation using Google Earth®
74-75
5.10. Conclusion 75 Chapter 6: Results and Discussion 6.1. Introduction 77 6.2. Seasonal Land Cover Regions 77-79 6.3. Protected Areas 80-85 6.4. Global Land Cover 86-94 6.5. Terrain constraints 95-97 6.6. Selected Areas 97-99 6.6.1. Selected Area 1 100-102 6.6.2. Selected Area 2 103-105 6.6.3. Selected Area 3 106-108 6.7. Population 109-111 6.8. Proximity to rivers and percent slope – implications for irrigation 112-117 6.9. Conclusion 118 Chapter 7: Conclusion and Recommendations 7.1. Key findings 119-122 7.2. Recommendations 122-123 References 124-143 APPENDIX A: Map of Biomes of Angola 144 APPENDIX B: Map of Distribution of Roads in Angola 145 APPENDIX C: Map of Railroads in Angola 146 APPENDIX D: Map of Permanent Rivers in Angola 147 APPENDIX E: Map of Cities in Angola 148

vii
List of Figures
Figure 2.1. Global primary energy consumption 12
Figure 2.2. Primary energy consumption in sub-Saharan Africa 12
Figure 4.1. Geographic location of Angola 49
Figure 5.1. Flow diagram summarising Phases I, II, and III 76
Figure 6.1. Distribution of SLCR pixels in Angola 79
Figure 6.2. Area occupied by each protected area category in Angola 81
Figure 6.3. Distribution of SLCR pixels within IUCN protected areas 84
Figure 6.4. Distribution of SLCR pixels after filtering out protected areas 85
Figure 6.5. Distribution of SLCR pixels within Global Land Cover
classes
89
Figure 6.6. Distribution of SLCR pixels after removing areas overlapping
with Global Land Cover classes
94
Figure 6.7. Distribution of SLCR pixels after filtering out slopes greater
than 16%
96
Figure 6.8. Three selected areas suitable for sugarcane cultivation 98
Figure 6.9. Proximity to railroads in Selected Area 1 101
Figure 6.10. Proximity to roads in Selected Area 1 102
Figure 6.11. Proximity to railroads in Selected Area 2 104
Figure 6.12. Proximity to roads in Selected Area 2 105
Figure 6.13. Proximity to railroads in Selected Area 3 107
Figure 6.14. Proximity to roads in Selected Area 3 108
Figure 6.15. Population by province 111
Figure 6.16. Proximity to rivers in Selected Area 1 114
Figure 6.17. Proximity to rivers in Selected Area 2 115
Figure 6.18. Proximity to rivers in Selected Area 3 116
Figure 6.19. Terrain variation in the study area as per percent slope 117

viii
List of Tables
Table 2.1. World ethanol production for the year 2005 18
Table 3.1. Irrigation requirements of sugarcane during each growth phase 36
Table 3.2. Phases of sugarcane growth 37
Table 6.1. Area of overlapping SLCR pixels filtered out of protected areas 81
Table 6.2. Area occupied by each land cover class in Angola and number
of overlapping SLCR pixels filtered from each class
88
Table 6.3. Area of each of the selected suitable areas and provinces in
which they are located
99
Table 6.4. Population of each province within the selected area 109
Table 7.1. Estimated bioethanol productivity potential for Angola,
extrapolated from Brazilian productivity figures
120

ix
ACKNOWLEDGEMENTS
The author wishes to extend her gratitude to the following in acknowledgement of
their contribution to this study:
• First and foremost, I thank the Almighty for granting me the strength and
guidance to pursue my dreams. Without the Almighty, none of this would be
possible.
• My parents, Mr. and Mrs. Ackbar, God Bless you! Thank you for making my
academic career such an enjoyable journey. It is through your love and support
that I have managed to achieve the goals I have set in life.
• The National Research Foundation (NRF) for financial assistance.
• Dr. Helen Watson, my supervisor, for insightful discussions and the constant
motivation and affirmation. Thank you for making this year such a joy.
• Dr. Carel Bezuidenhout and Dr. Neil Lecler, for providing me with essential
information which facilitated progress in my study.
• COMPETE, for their generous contribution to software and hardware
requirements of this project.
• Mr. Frank Sokolic, for all his assistance with GIS, especially at times when GIS
proved too moody to handle.
• My dear friend, Diana Sibanda, a heartfelt thanks to you for your constant
encouragement and for always calming me down when the stress levels got too
high.
• And a special thanks to Dr. Fethi Ahmed, for his insight, motivation and
willingness to assist at all times.

1
Chapter 1
Introduction
1.1 Introduction
The following sections serve to provide an introduction to the study by outlining the
motivation for the study, choice of biomass feedstock and the study area. The chapter
also includes aims and objectives of the study and provides an outline of the structure of
the thesis.
1.2. Motivation for study
Environmental awareness is on the increase, framed by threats of climate change and its
multitude of adverse impacts upon Planet Earth. Contemporary environmental issues are
therefore often related to the phenomenon of Global warming, related to emissions of
greenhouse gases (GHG), mainly carbon dioxide (CO2) produced from the burning of
fossil fuels (Kartha et al., 2005; de Vries et al., 2007; Demirbas and Demirbas, 2007;
Mathews, 2007a; Mathews. 2007b). Logically, the most obvious endeavor to curb global
warming would be to reduce GHG and the burning of fossil fuels, however, as obvious as
this may seem, growing demand from the energy, transport and industrial sector places
heavy constraints on such options. The transport sector is the major consumer of
petroleum fuels and is likely to suffer badly as a result of increasing petroleum prices, the
finite petroleum reserves and the increasing number of petroleum-based vehicles
worldwide (Demirbas, 2007).
However, amidst Earth’s finite systems and finite resources, there exist infinite
possibilities to assist in the transition to a more environmentally friendly future and at the
same time meeting growing energy demands. As a result, much attention has been
directed towards renewable energy resources, more specifically the use of biomass, as an
alternative to non-renewable fossil fuels, which is fast approaching its life span. Biomass
energy or bioenergy is one potential use of biomass, which is the use of plant and other
organic matter (converted by the process of photosynthesis), to provide energy services
such as heat, light and motive power (Kartha et al., 2005). Plant biomass can be used to

2
absorb carbon dioxide released during the burning of fossil fuels, or it can be transformed
into a modern form of energy. In this form, modern bioenergy can be used to produce
energy carriers such as electricity, liquid and gaseous fuels (Hall and House, 1995).
In addition to its ability to mitigate climate change, several reasons account for the
gaining popularity of bioenergy. As outlined by de Vries et al., (2007), the risk of energy
supply insecurity and the prospect of non-renewable resource depletion such as oil and
gas, foster concerns which can be subdued by renewable energy potentials. Although
several new fossil fuel reserves have recently been found in Africa, access to the reserves
is often correlated with conflict. Thus, coupled with this, the economic viability and
various social and environmental benefits of bioenergy, make it one of the main
renewable energy resources (Hall and House, 1995).
Biofuels, which is a form of modern bioenergy, is promoted as being a viable substitute
to fossil fuels, such as petroleum fuels. Its main quest would be to reduce carbon and
sulphur emissions, thereby reducing atmospheric carbon dioxide levels. Its potential for
rural development, energy security, foreign exchange savings and socio-economic issues
related to the rural sector, gives further incentive for its use (Cadenas and Carbezudo,
1998).
According to Cadenas and Carbezudo (1998), the are four broad categories of potential
biomass feedstocks: (1) organic or industrial wastes; (2) agricultural crop residues and
wastes including manure, straw, bagasse and forestry waste, (3) existing uncultivated
vegetation and (4) energy plantations, which involve energy crops such as sugarcane,
maize or sweet sorghum. Sugarcane in particular has been noted as an efficient biomass
feedstock, both for its agricultural residues which are produced in abundance, and its use
as a dedicated energy crop. For example, ethanol is produced from sugarcane which can
be used as a gasoline blend or substitute (Blume, 1985). Interestingly, ethanol was
already considered as an acceptable automotive fuel as the first FORD automobile made
during 1908-1926 could run on either petrol or ethanol (Bucheit, 2002; Kovarik, 2003;
Johnson and Rosillo-Calle, 2007). However, when crude oil began being cheaply

3
extracted, it was more profitable for cars to run on oil rather than ethanol. But soon this
reasoning was reversed, sparked by rising oil prices in the 1970s. Interest was then
directed towards alternate sources of fuel and as a result bioethanol gained new
importance (Blume, 1985).
In addition to sugarcane, ethanol can be produced from other sugar crops, including
sweet sorghum (Sorghum spp,), from starchy crops such as cassava (Manibot esculenta),
corn (Zea Mays L.), potato (Solanum tuberosum) and babassu palm (Orbingnya martiana
MART.) and from celluloses (Blume, 1985). However, for the purpose of this study,
sugarcane has been selected as the preferred biomass feedstock for the production of
energy.
1.3. Motivation for choice of biomass feedstock - Sugarcane
The variety of by-products produced from sugarcane makes it one of the most valuable
agricultural resources, and its use as an energy source categorises it as an efficient
bioenergy crop (Blume, 1985). Among its variety of uses, sugarcane is an efficient
producer of ethanol using cane juice, bagasse and molasses, and amongst tropical energy
crops, ranks first in terms of agricultural productivity and yield of ethanol per hectare
sugarcane (Blume, 1985). It also has the most positive energy balance, as bagasse, the
fibrous residue of cane left after the extraction of juice, can profitably be used as fuel in
the industrial phase of ethanol production, whilst additional fuel is required when
processing cassava (Blume, 1985).
Additionally, bagasse, can be used for electricity cogeneration, as in the case of Mauritius
(Gabra and Kjellström, 1995; Deepchand, 2001). In 1988, the sugar industry in the
country exported electricity to the public grid accounting for 19% of the island’s
requirements, with 13% of this originating from bagasse (Deepchand, 2001). Ten years
later, in 1998, close to 25% of the country’s electricity was generated from the sugar
industry (Deepchand, 2001). This study will therefore focus on sugarcane cultivation for
bioenergy purposes, addressing biofuels, electricity cogeneration and a variety of other
high-value end products, which will be discussed in later chapters.

4
The production of bioenergy from sugarcane has been greatly exploited in several
countries, but more so in Brazil which is heralded as the greatest producer of bioethanol
from sugarcane and electricity cogeneration from bagasse (Blume, 1985; Mathews,
2007b). Its National Alcohol Program (PROÁCOOL) established in 1975 gave new
importance to the sugar industry. Coupled with its National Sugarcane Improvement
Program (PLANALSUCAR) it took advantage of the low price of sugar in the world
market as an incentive to start its alcohol program. By June 1981, its success was
eminent, reflected by the 375 000 automobiles using ethanol as fuel, however, that was
only the beginning. Currently Brazil produces nearly 20 billion litres of ethanol per year
and the number of flex-fuel vehicles which can run on both ethanol and gasoline
represents 73% of new cars sold in 2006 (Mathews, 2007b; Xavier, 2007). But what
about the rest of the world? In order to achieve the desired 5% reduction in GHG
emissions by 2012 as stipulated by the Kyoto Protocol, a global initiative most definitely
has to be sought.
According to Mathews (2007b), currently the world consumes petro-oil at the rate of
approximately 84 million barrels per day, and the OECD is responsible for consuming
half of this oil, of which 58 percent is used for transport. This vast amount of non-
renewable energy is what eventually needs to be replaced by alternate fuels. But do these
countries, often termed the ‘North’, have the capacity to meet such demands? According
to Claude Mandil, the head of the International Energy Agency, and sister organisation to
the OECD, the North faces the problem of land availability, and the disturbances to the
markets for corn and grain (the principle feedstocks in the US) and to sugarbeet, the
principal feedstock in the EU, would be far too great (Mathews, 2007b). In other words,
there is an utter infeasibility of the North to produce such a biofuel output (Mathews,
2007b). As a result, the OECD has to direct its efforts to finding solutions in the South,
more specifically developing countries which has untapped bioenergy potential.
In order to meet the energy demands of the OECD, the South would have to replicate
what Brazil currently achieves 18 times over, within the next decade (Mathews, 2007b).

5
This would require the South to have 72 million hectares of land placed under biofuel
cultivation, a land area size equivalent to that of Chile. But is this land area available?
According to the Food and Agricultural Organisation’s (FAO) Terrastat database (2003),
in just the African countries that signed up for the ‘Green OPEC’1, there are 379 million
hectares of potentially arable land available, of which only 43 million are utilised. In
addition, if the whole of sub-Saharan Africa, South Asia, Southeast Asia, Latin and
Central America are added, then over 2 billion hectares of potentially arable land is
available, which is well in excess of the calculated capacity of the OECD (Mathews,
2007b). Thus, these figures have directed significant attention towards developing
countries, such as Africa, in realising a transition towards global use of alternate energy
sources.
1.4. Motivation for study area - Angola
Studies are now aimed at finding suitable areas in arid and semi-arid regions of Africa
and Latin/South America for biomass production for energy. This study forms part of one
such study carried out through the Competence Platform on Energy Crop and
Agroforestry Systems for Arid and Semi-arid Ecosystems (COMPETE). It is a South-
South-European Union cooperation which focuses on Africa (COMPETE, 2005). For this
study, Angola has been selected as the study area upon which a land suitability
assessment will conducted.
Generally, land suitability studies have tended to exclude countries facing political
instability such as Angola and the Democratic Republic of Congo, and have thus,
focussed on areas where bioenergy crop cultivation appears most encouraging (Watson
and Garland, 2004; Baijnath, 2005). One such study is a land suitability assessment by
Baijnath (2005) for sugarcane cultivation in Malawi, Mozambique, Tanzania and
1 An organisation which unites 15 non-oil producing African countries, aimed at making African countries less dependent on oil by replacing it with biofuels. The organisation is dubbed the 'Pays Africans Non-Producteurs de Pétrole' (PANPP) (http://biopact.com/2007/05/senegal-and-brazil-sign-biofuel.html). A list of these countries are given in ‘A closer look at Africa’s ‘Green OPEC’ at http://biopact.com/2006/08/closer-look-at-africas-green-opec.html

6
Zambia. The study analysed these four Southern African countries in terms of land
available to delimit suitable areas for sugarcane cultivation. The political situation facing
countries like Angola and the Democratic Republic of Congo discouraged investigations
into delimiting suitable areas for sugarcane cultivation, and thus, were not considered as a
study area. However, as would be described in this section, there are several reasons
supporting the expansion of bioenergy crop cultivation in Angola, making it one of the
countries which make Africa’s future sustainable bioenergy production so large
(population (Van Den Berg and Rademakers, 2007).
Angola was delimited as the study area due to the large areas of non-forest agricultural
land available for the cultivation of energy crops even after meeting its needs for food,
fiber, feed and fuel wood for its growing population (Van Den Berg and Rademakers,
2007). Angola has a total of 88 million hectares of suitable land for agriculture, and
currently only 3.6 million hectares are used for crop growth (Van Den Berg and
Rademakers, 2007). By the year 2050, its is projected that Angola would have enough
land available for the sustainable production of roughly 5.945 Ej of net energy per year,
after meeting the requirements of its growing population (Van Den Berg and
Rademakers, 2007). Angola is therefore suggested to be the next ‘biofuel superpower’
(Van Den Berg and Rademakers, 2007). As it is estimated that only 15% of Angola’s
population have access to electric power (www.esri-africa.com), the potential of using
electricity cogenerated from bagasse may serve as an incentive for bioenergy
implementation. Furthermore, as Angola is in the process of rebuilding its infrastructure
that was damaged by the 27 years of civil war, bioenergy has the potential to be a sound
financial and development option contributing to the sustainable development of the
country.
Specifically, the Angolan government sees renewable, clean energy as a promising
endeavour to address the basic development needs of low-income populations. In 2001, at
the Commission on Sustainable Development, Angola’s Minister of Energy, Luis Filipe
da Silva said that in developing countries poverty was mainly concentrated in rural areas
where energy is predominantly provided by firewood and other forms of biomass, which

7
is also the case for Angola. The main source of energy in rural areas are conventional
hydro and fossil fuels which are environmentally harmful and a strong limiting factor in
rural areas (Commission on Sustainable Development, 2001). Therefore, improving
access to cleaner forms of energy, such as bioenergy, becomes a critical endeavour in
freeing the poor, especially women from subsistence farming (Commission on
Sustainable Development, 2001). The minister further added that in Angola, there is
undoubtedly a need and demand for energy services, and especially post-civil war when
the country’s economy is growing, energy demands are projected to dramatically
increase. Angola’s socio-economic and energy situation emphasises the necessity of
introducing non-polluting energy sources. By introducing bioenergy, in addition to
energy security, it would provide access to energy services without adverse health and
environmental impacts and would provide income-generating activities for the poor,
which could alleviate poverty. Therefore, the introduction of bioenergy, will facilitate the
journey to sustainable development by improving environmental conditions, the social
welfare and standard of living in the country.
In addition, as 85% of Angola’s labour force is involved in agriculture, it would seem
plausible to begin an economic transformation and social upliftment in this very sector,
facilitated by bioenergy crop cultivation.
1.5. Aim of the study
The aim of this study is to delimit areas suitable for sugarcane cultivation for bioenergy
purposes in the sub-Saharan country Angola.
1.6. Objectives of the study
In order to meet the proposed aim, the following objectives have been outlined:
1. To delimit protected areas and areas currently used for food production which will be
excluded from any further analysis
2. Use of a Digital Elevation Model to identify slopes posing a constraint to sugarcane
cultivation

8
In addition to the objectives stated above, for the results to be of significant use to land
use planning, a non-biophysical component will be addressed in this study. Specifically,
the areas identified by following objectives 1 and 2 will be analysed to determine
practical implications and viability of establishing a sugarcane farm at the selected areas.
This involves the consideration of infrastructure requirements such as roads and railroads.
Population data is also included in these considerations. The non-biophysical
considerations constitute a broader discussion of each of the selected areas in terms of the
surrounding social and physical contexts. Demographic considerations include
HIV/AIDS prevalence rates and level of education.
The non-biophysical considerations are an essential component to this study as an area
may be biologically and geographically suitable for sugarcane production, but it may not
have the necessary infrastructure and labour support for its implementation.
Furthermore, the study addressed irrigated agriculture and thus, assesses distances to
water sources and slope.
Therefore a third and fourth objective is added to this study:
3. Critically analyse and determine viability of bioenergy crop production in the
identified areas in the framework of non-biophysical conditions
4. Calculate distance from agricultural area to water source and slope (%) from
agricultural area to water source
1.7. Structure of the thesis
The thesis is divided into 7 chapters. Chapter 1 provides an introduction to the study
outlining aims and objectives. The background to the study is covered in Chapters 2 and
3, with Chapter 2 providing an overview on biomass and biomass energy as well as
bioenergy implications for Africa. Chapter 3 highlights the ecological requirements for
successful sugarcane cultivation, concluding on an overview of the infrastructural and
social considerations in sugarcane production. The study area is described in Chapter 4,
paying attention to its location, geography and the state of agriculture in the country.

9
Chapter 5 provides an overview of the methodology undertaken in the study. The
theoretical approach, data sources, and a detailed description of the analysis are provided
in this chapter. The results of the study are presented in Chapter 6. A discussion of the
results obtained is also included in this chapter. The thesis culminates with Chapter 7
which provides a conclusion to the study also including recommendations that emanated
from the study.

10
Chapter 2 Background on Biomass and Biomass Energy
2.1. Introduction
Energy derived from biomass has been used for thousands of years ever since people
used wood for fire, to cook food or to keep warm (Demirbas and Demirbas, 2007).
Traditionally, wood has been the largest biomass resource, which is still reflected in
many countries of the developing world. It is estimated that almost half of the energy
used in the African continent is in the form of fuelwood (Demirbas and Demirbas, 2007).
Furthermore, in developing countries, biomass is a major energy source, accounting for
more than 90% of the total rural energy supplies (Hall and House, 1995; Demirbas and
Demirbas, 2007). As these areas have no access to modern forms of energy, biomass
resources becomes the most appropriate means to supply the basic energy requirements
for cooking and heating in rural households (Demirbas and Demirbas, 2007). However,
biomass consumed in these forms, constitute the traditional use of bioenergy, bearing
both social and environmental costs. Implications such as indoor and outdoor pollution,
physical and mental health problems and forest and soil degradation are some of the
problems associated with the traditional use of biomass, particularly observed in the
developing regions of the world (Barnes, 2006). These costs are a heavy price to pay,
especially when continual use and its implications are projected into the future. The
World Health Organisation (WHO) ranks indoor air pollution, a result of burning
unrefined biomass, as the 8th top health risk worldwide, killing 1.6 million infants, young
children and women each year (Barnes, 2006; Kammen, 2006).
Traditional biomass usage in its unprocessed form is characterised by low efficiency and
in conjunction with the various associated social, health and environmental insults, much
attention has been directed to new technological innovations in bioenergy. As such,
cleaner, high efficiency, renewable energy sources has gained political importance,
heralded as being the key facilitator for economic and social development in developing
countries. This chapter will provide a background on biomass and bioenergy, delving into
its variety of uses and implications within the energy sector. Departing from a global

11 focus, bioenergy will be analysed in the developing world context, outlining the
importance of collaboration between the North and South in current global energy
demands.
2.2. Biomass and biomass energy
Biomass energy refers to the energy that can be derived from biomass. Biomass, in its
simplest form is any organic material of biological origin that has stored sunlight in the
form of chemical energy (photosynthetically derived) (Demirbas and Demirbas, 2007).
Most of the standing biomass is in the form of woody forest materials, with most land
biomass being composed mainly of cellulose, hemicellulose and lignin (Klass, 2004).
Essentially, all biomass is produced by green plants by the process of photosynthesis, and
predominant biomass sources include wood, wood waste, straw, manure and sugarcane
(Hall et al., 1993). Secondary and tertiary forms include many forest and farm
commodities and various byproducts of agricultural, forestry, manufacturing and day-to-
day living in a developed urban society (Alexander, 1985).
Biomass has several uses which can often be summarised in terms of the 4Fs: Food,
Feed, Fibre and Fuel (Johnson and Rosillo-Calle, 2007). Within this broad categorisation,
some of its uses include: a source of material for shelter, role in nutrient cycles and
functional synergies, ecosystem functions and integrity, and provision of local business
opportunities. However, its use as a renewable energy source makes it the focus of
contemporary energy discussions and warrants it greater global attention. As an energy
source, biomass can be used by either burning it directly or converting into liquid, solid
or gaseous fuels using conversion technologies such as fermentation, bacterial digestion
and gasification, respectively (Hall and House, 1995). Globally, biomass accounts for
11% of total primary energy consumption (Figure 2.1.) and in developing countries it is
the number one energy source (Johnson and Rosillo-Calle, 2007).

12
Figure 2.1. Global primary energy consumption (Johnson and Rosillo-Calle, 2007)
However, in developing countries it is often the traditional use of biomass that dominates,
such as the burning of wood, agricultural residues and dung. Specifically, an
overwhelming 85% of biomass energy is consumed as solid fuels in traditional uses for
cooking, heating and lighting, which is a very inefficient use of biomass, utilising only 5-
15% of the actual energy (Hall and House, 1995; Johnson and Rosillo-Calle, 2007). In
sub-Saharan Africa, dependence on traditional biomass accounts for over 61% of primary
energy consumption (Figure 2.2.) (Johnson and Rosillo-Calle, 2007).
Figure 2.2. Primary energy consumption in sub-Saharan Africa (Johnson and
Rosillo-Calle, 2007)
13%3%
61%
1%
21%1%
Oil Natural Gas Renewables Hydro Coal Nuclear
35%
3%11%7%
22%
22%
Oil Other Renewables Biomass Nuclear Coal Natural Gas
13 More than 2 billion people lack access to modern energy services and as a result rely
heavily on traditional biomass fuels (UNDP, 2004). This dependence fosters various
social, health and environmental implications, and can be considered as a catalyst for the
socio-economic situation which many individuals in developing countries have to endure.
Basic services such as health and education require electricity and reliable energy, which
means that those 2 billion people who lack access to modern energy will also be deprived
of such services. Furthermore, the possibility for commercial enterprise which requires
modern energy, is drastically reduced due to a lack of lighting, labour-saving devices and
telecommunications, further adding to the dire socio-economic situation. The situation is
further exacerbated due to dependence on traditional biomass systems which has other
implications for rural livelihood, often associated with the task of collecting biomass for
consumption. Specifically, women and children spend arduous hours every day trekking
over large distances to gather wood for fuel, time which could rather be used for creating
income generating opportunities and educating children (Goldemberg et al., 2004).
Shifting from traditional to modern bioenergy therefore becomes an essential move to aid
social and economic upliftment.
2.3. The transition from traditional to modern bioenergy
According to Hall and House (1995), if biomass is used more efficiently, it can supply a
considerable range and diversity of fuels at both small and large scales and can form part
of a matrix of fuel sources, which would offer increased flexibility of fuel supply and
energy security. This could further reduce the dependency on oil imports, keeping
expenditure within the local economy, which in addition can free land that was
previously needed to grow crops for foreign currency earnings. Land could then be used
for bioenergy plantations, which would play a role in local decentralisation, assisting
communities to remain self-sufficient in energy, thereby promoting sustainable
development. Furthermore, as growing biomass is labour intensive, it brings with it
opportunities of job creation together with providing energy to promote other rural
industries. Reflecting upon these numerous benefits, the shift to modern bioenergy for
developing countries would then be an attractive transition.
14 Globally, modern bioenergy can also deliver a variety of benefits. It provides higher
quality energy services that are more versatile and efficient than traditional bioenergy,
delivering well-controlled energy services (Leach and Johnson, 1999). Like all other
renewables, modern bioenergy can make a valuable contribution to climate mitigation
and in the overall transition towards sustainable energy sources. Modern bioenergy is
suggested to have two main advantages over other renewables, which makes it the
favoured choice in the strive towards a cleaner, environmentally friendly future. First,
biomass is stored energy or ‘available energy on demand’ which can be drawn on at any
time, unlike other renewables such as daily or seasonal intermittent solar, wind and hydro
sources “whose contributions are constrained by the high costs of energy storage”
(Kartha et al., 2005; Johnson and Rosillo-Calle, 2007). Second, biomass also has the
capacity to produce all forms of energy carriers for modern economies such as electricity,
gas, liquid fuels and heat, whereas energy from solar, wind, wave and hydro are limited
to electricity and in some cases heat (Johnson and Rosillo-Calle, 2007). It can also serve
similar ends by replacing traditional cooking fuels with cleaner, smokeless and efficient
liquid and gas alternatives based on renewables rather than fossil fuels (Kartha et al.,
2005)
Among the multitude of advantages and opportunities associated with modern bioenegy,
undoubtedly its potential in being an alternate to fossil energy and mitigating rising CO2
levels accounts for the enthusiasm observed worldwide.
2.3.1. The Role of Modern Bioenergy in mitigating Climate Change
Two global environmental initiatives were responsible for stimulating interest in
renewables (Karekezi, 2002). First, the United Nations Conference on Environment and
Development (UNCED) held in Rio de Janeiro, Brazil in 1992 which resulted in Agenda
21, a document which sought to operationalise the concept of sustainable development.
Second, the conference also provided the venue for the signing of the United Nations
Framework Convention on Climate Change (UNFCCC), and within both initiatives,
renewables were perceived as an important option for mitigating and abating GHG
emissions (Socolow, 1992; cited in Karekezi, 2002, p1059). But, the alarm bells of

15 climate change are ringing louder in 2007, with a dawning awareness that Planet Earth
faces a crisis of unprecedented magnitude (Mathews, 2007a). There seems to be a
consensus that there is at most 10 to 20 years within which major changes have to be
made to reduce GHG to avoid a man-made catastrophe (Mathews, 2007a). Furthermore,
the Kyoto Protocol, adopted in 1997 at the third Conference of Parties (COP 3), shares
the principles, objectives and institutions of UNFCCC, has set legally-binding targets for
developed countries to limit or reduce GHG by at least 5% from 1990 levels in the 2008-
2012 commitment period (Atkinson, n.d.).
So what is the role of modern bioenergy in all of this? By identifying energy use as the
main source of GHG emissions, driven by increasing fossil fuel demands, the role of
bioenergy in mitigating climate change becomes apparent. First, bioenergy is a source of
clean, renewable energy which can be used as an alternate to fossil fuels (Blume, 1985;
Hall and House, 1995; Demirbas and Demirbas, 2007; Mathews, 2007a; Mathews,
2007b). Combustion of biomass as a fuel source results in no net release of carbon
emissions and when used instead of fossil fuels, carbon emissions from the displaced
fossil fuels are avoided as well as other associated pollutants like sulphur (Hall and
House, 1995). Second, there is undoubtedly an interlinking connection that forms
between modern bioenergy, fossil fuels and climate mitigation. Replacing fossil fuels
with forms of modern bioenergy such as biomass-derived fuels (e.g. bioethanol,
biodiesel), will not only facilitate a transition to a low carbon energy future but will also
be key in meeting growing energy demands owing to its significant environmental and
economic potential. The majority of the world’s energy needs are supplied by
petrochemical sources, coal and natural gases, and with the exception of hydroelectricity
and nuclear fusion energy, all of these resources are finite (Demirbas and Demirbas,
2007). Furthermore, increasing pressure is placed upon finding alternate resources,
preferably renewable, as at current usage rates existing non-renewable resources will be
consumed shortly (Srivastava and Prasad, 2000). The rapid decrease in finite stocks of
fossil energy, peaking oil prices, growing dependence on fossil fuels, especially the
transport sector and the accumulation of associated GHG during combustion, has
therefore stimulated much interest in biomass-derived fuels. Overall, because modern

16 bioenergy is a renewable resource, has the capacity to reduce levels of GHG, and can be
used as an alternate to fossil fuels, it has fundamental potential in meeting global energy
demands coupled with opportunities for economic and environmental development.
2.4. Forms of Modern Bioenergy Use
Modern bioenergy boasts a diversity of uses and applications, both at large and small
scales. At large scales, biomass utilisation encompasses direct combustion for process
heat, ethanol production, gasification, heat cogeneration, biogas production and
briquetting. However, the best-known large-scale biomass energy systems are electricity
co-generation and the production of ethanol as a substitute for petroleum (Marrison and
Larson, 1996). At small scales, the importance of bioenergy systems lies in the large
number of end users that these systems serves (Karekezi, 2002). At this level, importance
lies in biofuelled cookstoves which meet the bulk of cooking, heating and lighting needs
of most rural households in Africa as well as charcoal and biogas (Karekezi, 2002). Its
use can further be extended to the industrial sector with environmental and economic
benefits, and can be scaled down within individual households providing social and
health uplifltment. This section aims to provide an overview of the most common and
widely used forms of modern bioenergy, outlining the associated social, environmental
and economic benefits that its use can deliver.
2.4.1. Biofuels
Biofuels refer to liquid or gaseous fuels that are predominantly or exclusively produced
from biomass (Demirbas, 2007; Demirbas and Demirbas, 2007). Some of these fuels can
be directed to the transport sector, such as bioethanol or biodiesel as a substitute for
petroleum fuels, whereas bio-oils can be used to generate heat, power and/or used in the
production of chemicals (Demirbas and Demirbas, 2007). Biofuels are considered as
offering many benefits which include sustainability, reduction in GHG emissions,
regional development, improvements in social structure and agriculture as well security
of energy supply (Demirbas and Demirbas, 2007). However, considering the high
demand for petroleum products worldwide, its use as a petroleum substitute appears to be
its most fundamental application.

17 2.4.1.1. Bioethanol
Bioalcohols and biodiesel, are the two forms of liquid biofuels that appear to be central in
delivering substitutes to petro-fuels (Demirbas and Demirbas, 2007). As a bioalcohol,
bioethanol is the most widely used liquid fuel as it can be used as a gasoline blend or
complete petroleum substitute. Bioethanol is fermented from sugars, starches or
cellulosic biomass (Demirbas and Demirbas, 2007). As bioethanol is a renewable liquid
fuel, coupled with its capacity to reduce environmental pollution, it becomes an important
resource in reducing the consumption of crude oil and mitigating climate change.
Specifically, if bioethanol is used to drive a light duty vehicle, the net CO2 emission
would be less than 7% of that from the same car using petroleum fuel (Bergeron, 1996).
It may seem that bioethanol is a recent discovery because it is a “modern” fuel, however,
surprisingly, use of bioethanol as an alternate to petroleum fuel has been as early as 1880.
Henry Ford originally designed the Ford Model T, a car produced between 1903-1926 to
run completely on ethanol. Likewise, the inventor of the combustion engine, Nikolaus
August Otto, designed his first invention to run on ethanol (Bucheit, 2002; Kovarik,
2003). However, when crude oil began being cheaply extracted, cars began using fuels
from oil and ethanol therefore took to the sideline. But the oil embargo stirred up in the
1970s, characterised by a sharp rise in oil prices confirmed that industrialised and highly-
developed nations were too dependent on fossil energy. Coupled with knowledge that
fossil fuel sources are finite, attention was directed towards renewable energy resources.
Only then did the potential of ethanol, as an automotive fuel, gain importance.
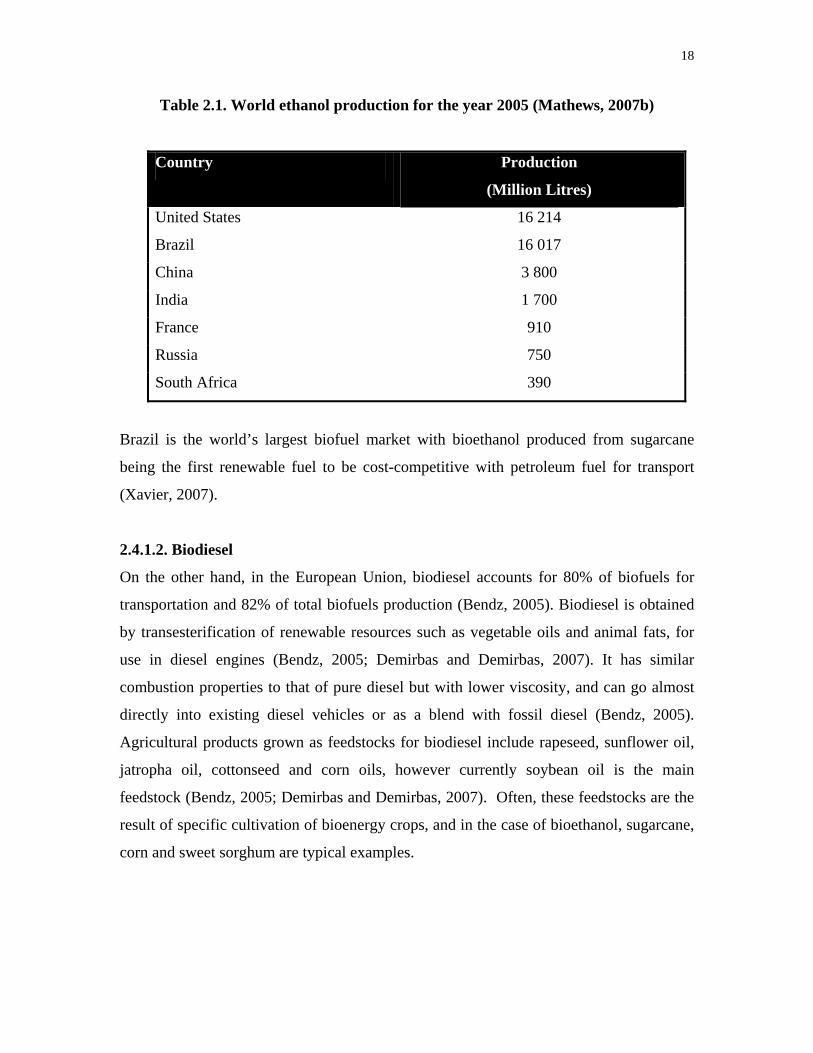
Currently the world produces 48 billion litres of ethanol per a year, with world
production in 2005 being dominated by Brazil and the U.S. (Mathews, 2007b).
18
Table 2.1. World ethanol production for the year 2005 (Mathews, 2007b)
Country Production
(Million Litres)
United States 16 214
Brazil 16 017
China 3 800
India 1 700
France 910
Russia 750
South Africa 390
Brazil is the world’s largest biofuel market with bioethanol produced from sugarcane
being the first renewable fuel to be cost-competitive with petroleum fuel for transport
(Xavier, 2007).
2.4.1.2. Biodiesel
On the other hand, in the European Union, biodiesel accounts for 80% of biofuels for
transportation and 82% of total biofuels production (Bendz, 2005). Biodiesel is obtained
by transesterification of renewable resources such as vegetable oils and animal fats, for
use in diesel engines (Bendz, 2005; Demirbas and Demirbas, 2007). It has similar
combustion properties to that of pure diesel but with lower viscosity, and can go almost
directly into existing diesel vehicles or as a blend with fossil diesel (Bendz, 2005).
Agricultural products grown as feedstocks for biodiesel include rapeseed, sunflower oil,
jatropha oil, cottonseed and corn oils, however currently soybean oil is the main
feedstock (Bendz, 2005; Demirbas and Demirbas, 2007). Often, these feedstocks are the
result of specific cultivation of bioenergy crops, and in the case of bioethanol, sugarcane,
corn and sweet sorghum are typical examples.

19 2.4.1.3. Biomethanol
Biomethanol is also another possible replacement for conventional motor fuels
(Demirbas, 2007). It was previously used to power automobiles before the introduction of
inexpensive gasoline, with synthetically produced methanol widely used as a motor fuel
in Germany during the World War. Biomethanol is currently produced worldwide by
conversion derived from syngas, natural gas, refinery off gas, coal or petroleum
(Demirbas and Demirbas, 2007).
2.4.2. Biogas
Biogas production is a biomass energy technology that uses organic matter, such as
animal wastes, sewage sludge or any biodegradable feedstock to produce biogas in an
anaerobic environment (Johnson and Rosillo-Calle, 2007). Dedicated energy crops can
also be used as feedstocks, such as cassava, maize or wheat. Biogas mainly comprises
methane as well as carbon dioxide which can be used for electricity generation (Johnson
and Rosillo-Calle, 2007). In India over a million biogas plants have been installed and in
China about 25 million people rely on biogas digesters for cooking and lighting (Hall and
House, 1995). Specifically, methane gas can be used directly for heating or cooking or it
can be used for electricity production (Johnson and Rosillo-Calle, 2007). Biogas can also
be used for transport applications in a compressed form as natural gas and further be
upgraded (cleaned of impurities) and then fed into natural gas pipelines (Johnson and
Rosillo-Calle, 2007). Biogas as transport fuel is commonly used in fleet vehicles and
busses in cities such as Stockholm and in the midwestern region of the U.S.
2.4.3. Electricity Cogeneration
Undoubtedly, Mauritius serves as the prime example of extensive cogeneration using
sugarcane bagasse (by-product of sugarcane processing) as the biomass feedstock.
Cogeneration produces both process heat and electricity, allowing the country to generate
close to 25% of its electricity in this manner (Deepchand, 2001). Potential benefits of
cogeneration appear to be indirect, which include increased incomes for smallholder
sugar farmers as in the case of Mauritius (Karekezi, 2002). Electricity cogeneration from
sugarcane residues delivers several sustainable opportunities forming a major part of the

20 sugar and power industries. Further opportunities are evident through energy conversion
and efficiency measures by minimising the amount of cogenerated energy utilised in cane
processing and exporting this energy to the national grid (Deepchand, 2005).
2.5. Sugarcane as a bioenergy crop
From the preceeding sections, it can be summarised that bioenergy supplies can be
divided into two broad categories: (1) Organic municipal waste and residues from the
food and materials sector, and (2) specific bioenergy crops cultivated for the production
of bioenergy (Demirbas, 2007). The latter is of particular significance to this study as this
study focuses on sugarcane cultivation for bioenergy purposes. Sugarcane, a tropical
perennial grass, has been isolated as the crop of choice due to its high tonnage yields,
high photosynthetic efficiency, lowest production cost and best energy balance in
comparison with other crops. Furthermore, in addition to sugar, sugarcane processing
produces multiple products and co-products with a diversity of applications that can be
exploited even outside the bioenergy sector. For example, cane trash, the tops and leaves
left after cane harvesting, can be used as animal feed and for soil conservation
(Mungaroo et al., 2007). Other miscellaneous products include rum, which forms part of
a highly profitable alcohol industry, as well as vinegar and perfumes (Alexander, 1985;
Mungaroo et al., 2007).
As a bioenergy crop, its remarkable physiological, anatomical and agronomic features,
makes it an integral biomass resource, with massive bioenergy generating potential
(Alexander, 1985). Specifically, there are two discrete biomass products from sugarcane;
lignocellulose and fermentable solids with potential numerous subproducts from each
(Alexander, 1985). Lignocellulose which forms 70% of the plant can be used to produce
several fuel products such as methanol, boiler fuel, and ethanol as well as industrial
feedstocks and glucose syrup (Alexander, 1985). Fermentable solids constitutes the
remainder of the plant which in addition to producing sugar, is the feedstock for ethanol
production (Alexander, 1985). Bagasse and molasses are two such biomass products that
has extensively been used in the energy sector, i.e. for electricity cogeneration and
ethanol production, respectively. Cane trash, not a direct by product of sugarcane

21 processing, rather a residue of cane cultivation is also used in conjunction with bagasse as
a renewable energy resource (Dellepiane et al., 2003). Considering the points discussed,
sugarcane undoubtedly is one of the most efficient bioenergy crops. Reflecting upon
current energy trends characterised by depletion of fossil fuel stocks especially petroleum
fuels for the transport sector, increasing worldwide energy demands and the negative
environmental impacts associated with fossil fuel combustion, sugarcane as a bioenergy
crop then gains new importance. This section will therefore discuss sugarcane as a
bioenergy crop, particularly for ethanol production and cogeneration.
2.5.1. Bioethanol
Ethanol can be produced from other crops such as corn, sweet sorghum and cassava, but
sugarcane is much superior to other crops with regards to efficient ethanol production
(Blume, 1985). For example, corn, a temperate crop, requires twice as much land for
cultivation to produce the same volume of ethanol that can be produced from sugarcane,
because it is a low yielding crop (Xavier, 2007). It has a much worse energy balance and
does not have the environmental benefits of cane-based ethanol (Johnson and Matsika,
2006). Furthermore, if ethanol is produced in large quantities from low-yielding crops, it
could have negative environmental impacts and may generate more GHG emissions than
do petroleum fuels (Xavier, 2007). In some cases where the factory is fired from coal-
based sources, the energy and carbon balance can be negative compared to petrol (Farrel
et al., 2006). In addition, for export markets the most efficient feedstocks are needed
which then makes sugarcane the favoured ethanol feedstock (Johnson and Matsika,
2006).
2.5.1.1. Ethanol production
For ethanol production, sugarcane is prepared in the first stage in the same way as for
sugar production (Blume, 1985). The cane is washed and crushed followed by a
separation of the juice and fibre known as bagasse. The process of crushing involves
shredding the cane and crushing it through several horizontal rollers to extract the juice.
Subsequent steps are aimed at purifying the juice, followed by centrifugation to
crystallise the sucrose, separating it from the ethanol. If only ethanol is to be produced,

22 centrifugation is omitted and the cane juice is only purified. However, if ethanol and
sugar are to be produced, all processing steps are needed including several rounds of
centrifuging, which yields another byproduct called molasses. Ethanol can then be made
from the molasses or cane juice or a mixture of both (Blume, 1985; Johnson and Matsika,
2006).
According to John and Matsika (2006), there are opportunity costs involved for a sugar
producer who also makes ethanol. Specifically, when sugar prices are high, a producer
who is capable of making both sugar and ethanol can use molasses as a feedstock for
ethanol because the extraction from sugarcane is to be maximised. Conversely, when
sugar prices are low, the producer can use high grades of feedstock (molasses and cane
juice) as they contain more fermentable sugars, increasing the yield of ethanol
production.
2.5.2. Electricity cogeneration
Among agricultural residues, sugarcane waste as a renewable energy resource is
significant because it is produced in abundance (Dellepiane et al., 2003). One such
residue previously mentioned is bagasse. It is the fibrous residue remaining after cane is
crushed for juice extraction and after drying it is used to generate steam and power
(Blume, 1985). Bagasse has always been the major source of combustible produced from
sugarcane processing to meet the energy requirements of further processing pathways
(Deepchand, 2001). It affords the sugarcane factory to be self sufficient in meeting its
energy needs (Deepchand, 2001). All sugarcane factories use bagasse to generate steam
to drive the factory equipment and turbo-alternators to produce electricity which powers
the electric motors in the factory (Deepchand, 2001). In a number of cases where the
factory is being operated efficiently, bagasse may be available in surplus. This then can
be used to generate electricity which can be sold to the national grid. Such is the situation
in Mauritius, where bagasse cogenerated electricity currently provides 20% of the energy
and 25% of the country’s electricity needs (Mungaroo et al., 2007). Utilising bagasse in
this manner also delivers environmental benefits by displacing emissions from fossil
fuels and alleviating GHG emissions.

23 In addition to bagasse, cane trash also called barbojo in Latin America, is another
residual fuel available to all sugar factories (Gabra and Kjellström, 1995; Dellepiane et
al., 2003). Its main use is as a blanketing effect on soil which improves weed and erosion
control, retention of moisture in the upper level, as well as adding organic matter and
important minerals (Gabra and Kjellström, 1995). However, after satisfying these soil
requirements, excess cane trash can be collected and used as a fuel source. This would
represent a better option as burning of cane trash results in the release of a high level of
atmospheric pollutants (Dellepiane et al., 2003). It has been suggested that cane trash
represents a fuel resource of the same magnitude as bagasse (Gabra and Kjellström,
1995).
2.5.3. Vinasse
Stillage or vinasse is a byproduct of ethanol production and is produced in large volumes.
Specifically, each litre of ethanol produced is accompanied by 10-15 litres of vinasse
(Johnson and Rosillo-Calle, 2007). It contains unconverted sugars, non-fermented
carbohydrates, dead yeast and a variety of organic compounds, which overall is a
potentially valuable input for further bioenergy production as well as for other uses such
as fertilisers (Cortez et al., 1998; cited in Johnson and Rosillo-Calle, 2007, pp24). The
organic components can be used for biogas production through anaerobic digestion to
produce methane. Another possible use is recycling it in the fermentation process, in
which it could be partly used to dilute the sugarcane juice or molasses. Thus, as opposed
to disposing vinasse which has potentially harmful environmental implications due to its
high biological oxygen demand, it can be further processed for bioenergy production.
2.5.4 Household Gel-fuel
As outlined, sugarcane is used to produce ethanol as fuel, neat or blended with gasoline,
however in addition to exporting for foreign fuel markets, other opportunities for rural
and urban markets exist. One such opportunity is the production of gel-fuels from
ethanol, as an alternate to paraffin (Chemical Technology, 2005). It is a safe and clean
renewable cooking fuel that is promoted in several African countries (Ultria, 2004).
Because it is a clean fuel, it reduces or altogether eliminates the health impacts caused by

24 indoor air pollution associated with the traditional use of biomass and coal (Goldemberg
et al., 2004).
2.6. Bioenergy implications for Africa
Although a number of sub-Saharan African countries have significant unexploited
reserves of fossil fuels, the prospects for major increases in fossil fuel supply are
constrained due to the unequal distribution of reserves (Karekezi, 2002). It is estimated
that over 80% of sub-Saharan Africa’s oil reserves are in Angola and Nigeria, with 90%
of the region’s coal reserves being located in South Africa (World Energy Council,
1992). However, on the other hand, renewable energy resources are relatively well
distributed in the region, with the potential to provide enormous opportunities that will
bring an “environmentally sound and secure energy future for Africa’s poor closer to
reality” (Davidson and Karekezi, 1992).
Amongst all major world regions sub-Saharan Africa has the largest bioenergy potential,
after accounting for food production and resource constraints (Smeets et al., 2004;
Mathews, 2007b). This high potential is a result of the large areas of available cropland
and the low productivity of existing agricultural production systems (Johson and Matsika,
2006). Specifically, the Food and Agricultural Organisation (FAO) Terrastat database
(2003) indicates that 1.1 billion hectares of potentially arable land in sub-Saharan Africa,
of which 158 million hectares was under cultivation in 1994, and by extrapolation would
mean that 197 million are under cultivation today (Mathews, 2007b). Essentially, this
leaves over 900 million hectares in Africa being available for biomass cover including
the cultivation of dedicated bioenergy crops.
In industrialised countries, concerns over energy security and the necessity for reduction
in GHG emissions, drives the need to find alternatives to petrofuels, such as biofuels
(Mathews, 2007a; Mathews 2007b). However, it is not feasible for these industrialised
countries or the North, as they are commonly referred to, to produce sufficient biofuel
output to meet their growing energy requirements (Mathews, 2007b). As the head of the
International Energy Agency, Claude Mandil puts it, “the energetics are against it, the

25 land availability is against it, and the disturbances to the markets for corn and grain (the
principal feedstocks in the U.S.), and to sugarbeet, the principal feedstock in the EU,
would be far too great” (cited in Mathews, 2007b, pg. 3554). Therefore, due its large
bioenergy potential, Africa, referred to as the South, becomes an attractive investment.
According to Mathews (2007b), a Biopact between the North and South could drive
industrial development and “spell an end to poverty”. However, whether the South opts
to negotiate a Biopact with the North, there are still several benefits for the South in
investing in renewable energy technologies. These include health improvement, reduced
regional emissions and creation of rural livelihoods as well as advantages arising from
reduced dependence on imported sources of energy (Johnson and Matsika, 2006).
Furthermore, as millions of people in sub-Saharan Africa lack access to energy or at least
a reliable source of energy, an expansion of renewable energy sources such as bioenergy
becomes key in bringing reliable energy to the rural and urban poor (Lefhoko, 2005).
Fortunately, there is already some experience in Southern Africa with bioenergy,
particularly in Malawi and Zimbabwe with ethanol blending (Johnson and Matsika,
2006). Zimbabwe began its programme in 1980 and blended ethanol with petrol until
1992, when a severe drought brought production of sugar and ethanol to a standstill
(Johnson and Matsika, 2006). Eventually, due to a lack of government support, ethanol
blending was phased out, however there is a possibility that due to the recent phasing out
of leaded petrol, ethanol blending programmes may be revived. In Malawi, ethanol
production began in 1982 and has continued uniterrupted. Currently, the Democratic
Republic of Congo and South Africa are the largest producers of biofuel crops (Johnson
and Rosillo-Calle, 2007). With the advent of Ethanol Africa, by 2008, South Africa
would be producing 500 000 litres ethanol every day, using maize as a feedstock
(AfricaFiles, 2007). In addition it will also produce other byproducts such as ethanol gel
and DDGS which has a high protein content suited to stockfeed that can replace imported
soyabean cake.

26 However, as already outlined, there exists potential for further expansion and investment
in the bioenergy sector. The vast numbers of existing cane-producing industries in
Southern Africa and vast tracks of available uncultivated land, confirms the great
potential for subsequent bioenergy production in the region (Karekezi and Kithyoma,
2003). Overall, Southern Africa has a high share of population engaged in agriculture,
significant amount of land potentially available for alternative uses and plentiful biomass
resources which create significant opportunities for increasing biomass use in the region
as well as the potential for exports (Johnson and Rosillo-Calle, 2007). The best summary
of Africa’s bioenergy potential is provided by chief executive of Ethanol Africa, Johan
Hoffman: “Africans have the potential to become the Arabs of the biofuel industry”, and
“Africa has the potential to provide energy for the world-who is going to supply the
growing economies of China and India? We already know there is a finite amount of oil
left in the Earth, and it is being used in enormous quantities and will soon be gone.”
(AfricaFiles, 2007).
2.7. Negative impacts of Bioenergy
Despite the multitude of benefits associated with bioenergy, there are still concerns
arising from increased bioenergy use. For a bioenergy programme to be sustainable, the
negative impacts have to minimised or at best all together avoided.
2.7.1 Land use
One of the central conflict areas in cultivating bioenergy crops is the issue of land use.
According to Fritsche et al., (2006), depending on its spatial distribution and cultivation
practices, bioenergy cropping could result in the loss of habitats and the endangerment or
extinction of rare species, obstruction of migration patterns, degradation of soils and
water bodies. Therefore, the land-use effects of bioenergy cropping systems must be
considered with reference to current land use. Furthermore, a critical argument
concerning land use is that of competition between the use of land for food production
and bioenergy crop cultivation. This conflict has sparked the ‘food versus fuel’ debate
(Alexander, 1985; Cornland et al., 2001; Kartha et al., 2005; Fritsche et al., 2006).
However, on the contrary bioenergy crops could be a means of alleviating poverty and

27 improving food security through income generation. An important note is that global
food production is sufficient to feed all individuals, but distribution of food is uneven (a
result of unequal economies and power struggles) which is the central cause of poverty
(Addison, 2005; cited in Baijnath, 2005, pp 41).
What supporters of the ‘food versus fuel’ debate do not take into consideration is the
possibility of using marginal or abandoned land for cultivation (Smeets et al., 2004;
Kartha et al., 2005). For example, in Brazil cultivation of sugarcane for bioethanol has
expanded to degraded or poor land, mainly extensive pastures (Pinto et al., 2001).
Furthermore, many biofuels are produced from residues of bioenergy crop processing,
after the ‘feed’ portion of the crop has been extracted (Baijnath, 2005). This is the case of
sugarcane cultivation, such that bioethanol is produced from the byproducts of cane
processing like molasses and bagasse.
In order to avoid these negative impacts, the present study, therefore aims to exclude
areas currently under cultivation for food and protected areas. In addition, it is further
based on the arable land available in the study area (Angola) after food production,
calculated by Van Den Berg and Rademakers (2007) using the United Nation’s
population projections and FAO food demand estimates for 2030 and 2050.
2.7.2. Loss of biodiversity and deforestation
Apart from land use, it is suggested that conflicts between biodiversity and bioenergy
crop cultivation are also possible (Fritsche et al., 2006). There is a significant risk that
unless controls are put into place, the increasing demand for fuels will result in damage to
biodiversity rich habitats (Birdlife International, 2005; Fritsche et al., 2006). This is the
case for soy expansion in South America which is driven by exports to Europe and other
industrialised countries which could potentially severely reduce biodiversity in the
Cerrado area (Kaltner et al., 2005). However, unlike soy expansion, sugarcane expansion
in Brazil provides reassurance for concerns over biodiversity loss, as it is cultivated on
degraded or poor land and not on new uncultivated land (Kaltner et al., 2005).
28 Furthermore, the implementation and acceptance of biofuels faces several critics, arguing
on several issues ranging from the overall sustainability of biofuels to its impact on
global climate change. Deforestation features highly amongst these issues, with the
central focus being the palm oil industry. Palm oil is used to make biodiesel and biofuel-
critics have accused the industry of large-scale deforestation (Friends of the Earth, 2004;
Brown and Jacobson, 2005). As a result some have even tagged biofuels as ‘deforestation
diesel’ (ORC, 2007). Malaysia and Indonesia face heavy criticism, with some suggesting
that “many thousands of square miles of tropical rainforest have been cleared for oil
plantations” (Brown and Jacobson, 2005). However, these criticisms have not gone down
lightly, with the oil-palm industry claiming to having established plantations on land
already used for agriculture. Specifically, Malaysia has responded to criticisms by stating
that oil palms in Malaysia are mainly established on old agricultural land and previously
logged-over forest land (Malaysian Palm Oil Council, 2006). Furthermore Malaysia
boasts sustainable forest management which enables extraction of certified timber.
Irrespective of closed circle arguments, loss of biodiversity and deforestation should be
avoided at all costs. Controls such as international certification schemes are means of
ensuring that bioenergy crops are not causing environmental destruction and biodiversity
loss in those regions (Birdlife International, 2005). This would encourage sustainable
cultivation practices, and mitigate or avoid the negative impacts placed upon biodiversity
rich habitats.
2.7.3. Potential GHG emissions
One of the benefits encouraging interest in bioenergy is its potential to reduce GHG
emissions since its use is carbon-neutral. However, cultivation of bioenergy crops may
actually contribute to GHG emissions! (Fritsche et al., 2006). Specifically, the overall
balance of GHG emissions from bioenergy supply depends on the effective use of
byproducts from bioenergy conversion and processing which could offset some of the
GHG emissions. At the same time, nitrous oxide (N2O) emissions, both from fertiliser
applications and the production of fertilisers could partially offset CO2 neutrality
(Fritsche et al., 2006). Also, if fossil fuels are utilised in bioenergy production and

29 downstream processing, especially if coal is used to process energy, net GHG savings
may be reduced.
Sugarcane cultivation for bioenergy purposes appears to offset these detrimental effects.
First, cane processing produces several byproducts, which are directed for further
bioenergy use, thereby in actuality reducing GHG emissions. Second, with the exception
of the first generation ethanol production, bagasse, rather than coal, is used to process
energy.
2.7.4. Soil erosion
It has been suggested that increases in annual bioenergy crops could lead to further soil
erosion as a result of the overuse of irrigation, agrochemicals and heavy harvesting
equipment which can degrade fertile soils (Fritsche et al., 2006). By contrast, appropriate
bioenergy farming systems could be operated on degraded land, as in the case of
sugarcane in Brazil, which could increase soil carbon and restoring land for sustainable
use. Furthermore, perennial bioenergy crops, such as sugarcane, could improve soils and
reduce erosion on arable land currently in use by creating year-round soil coverage
(Fritsche et al., 2006)
2.7.5. Water use and water contamination
Water use becomes a serious problem in agricultural practices, especially in regions
where water is scarce and highly variable throughout the year (Fritsche et al., 2006). If a
crop requires irrigation to supplement water requirements from rainfall, i.e. an increase in
irrigated land, it could lead to water scarcity, a lowering of water tables and reduced
water levels in rivers and lakes. In addition, concerns are also fostered over potential
contamination of water sources by agrochemicals (pesticides and fertilisers) applied
during cultivation.
Excessive water consumption has been a major concern in sugarcane cultivation. It is
estimated that 1500 to 3000 litres of water is used to produce just 1kg of sugar and in the
milling and processing phase, 3 to 10 m3 of water is required to wash every ton of cane

30 (Clay, 2005). This leads to overexploitation of water resources bearing cumulative
impacts associated with expanded production. In order to avoid this, Clay (2005) suggests
that the goal should be of increased efficiency, that is “more crop per drop”. One way is
to improve technology, and/or the introduction of more water efficient cane varieties.
Within the milling and processing phase, recycling of water, which is already being done
in mills, will alleviate some of the water concerns associated with cane cultivation.
Water use is especially relevant in the Southern African context as global climate change
models suggests that rainfall much over this region will decrease and become more
erratic (Hulme et al., 2001). Thus, due to the effects of climate change there is a growing
concern about future agricultural water requirements and water availability (Fischer et
al., 2002).
2.8. Conclusion
The several advantages of bioenergy spans social, economic and physical sectors, thereby
making it a highly attractive source of renewable energy. Specifically, the potential
opportunities associated with its implementation are particularly relevant in the
developing world, especially social upliftment and employment generation. The
preceding sections have served to provide an overview of bioenergy, both globally and in
a developing world context. In this chapter sugarcane has been introduced as a bioenergy
crop. The next chapter will outline the ecology of sugarcane as the ecological
considerations are those which would be included in the land suitability analysis for
sugarcane cultivation.

31
Chapter 3
Ecology of Sugarcane 3.1. Introduction
The previous section introduced sugarcane as a bioenergy crop and outlined its several
applications. However, for the purpose of this study, to delimit areas suitable for
sugarcane cultivation, sugarcane in its ecological sense has to be addressed. This chapter
therefore serves to give an account of sugarcane and its ecology, as these are the factors
against which available land will be assessed and deemed suitable for sugarcane growth.
3.2 Origin of Sugarcane
Sugarcane has been known for at least 2000 years and in ancient times was referred to as
‘honey produced from reeds’ as described by Theophrastus, whilst Discorides described
it as ‘honey with the consistency of salt which could be crunched between the teeth’
(Sharpe, 1998). Sugarcane is thought to have originated in the Pacific Islands or
Southeast Asia, most probably in New Guinea some 17 000 years ago and subsequently
spread through India (Mukerjee, 1957; Alexander, 1985; Schwartz, 2004). The Arabs
were responsible for much of its spread as they took it into Egypt during their conquests
in 641 AD and it further spread by this means to Cyprus, Syria, Crete and Spain
(Purseglove, 1979).
Sugarcane belongs to the genus Saccharum L. and is classified as a grass, therefore a
member of the Gramineae family, tribe Andropogonoae (Alexander, 1985, Sharpe,
1998). Six species are included in the classification of sugarcane: officinarum,
spontaneum, barberi, sinense, edule and robustum, all of which grow in tropical and sub-
tropical environments (Tarimo and Takamura, 1998). According to Mukherjee (1957), of
these, the cultivated canes include three species: (1) The noble canes belonging to
Saccharum officinarum L.; (2) S. barberi Jesw known as the North Indian canes and (c)
S. sinensis which are the Chinese canes and the Pansahi group of Indian canes.

32
3.3 Ecology
3.3.1. Latitude, Altitude and Terrain Requirements Sugarcane is most suited for tropical climates and is grown primarily in tropical regions
(Sharpe, 1998). According to Duke (1983), sugarcane requires a hot, humid climate,
alternating with dry periods. Most of the world’s sugarcane is grown at latitudes between
33°N and 33°S, with yield decreasing rapidly as cane is moved above latitudes of 30
(Griffee, 2000). Additionally, elevation is an essential factor determining sugarcane
growth success and typically the crop is cultivated on land that is up to 1600m above sea
level (Griffee, 2000). At higher altitudes the growth cycle has been observed to be longer.
Furthermore, much success is noted with cultivation at low elevations or slightly sloping
land (Duke, 1983). In conjunction with biophysical requirements, there appears to be
non-biophysical impacts of sugarcane’s terrain requirements, as suggested by Sys et al.,
(1993). Specifically, level terrain appears important in commercial farming with steep
slopes posing constraints on mechanical cultivation. Steeper slopes are cultivated by
peasants or small-scale farmers and as a result labour costs will be higher. Hence, Griffee
(2000) adds that productivity of sugarcane cultivated on flat land is higher compared to
cultivation on hillsides.
3.3.2. Soil
As a result of its versatility, sugarcane can be grown successfully under a wide range of
soil conditions (Fauconnier, 1993, cited in Cornland et al., 2001, pp 33). According to
Tarimo and Takamura (1998), sugarcane is a heavy feeder crop and requires soils to have
optimum properties, including both physical and chemical characteristics. It is suggested
that the physical properties of the soil are more critical than the chemical characteristics,
such that porosity, depth, bulk density, permeability and moisture retention, are more
crucial to successful sugarcane production (Cornland et al., 2001). This is a result of the
ease with which chemical properties can be modified, either by adding fertilisers or
nutrients to the soil, whereas variables such as porosity are intrinsic and thus, cannot be
modified (Cornland, et al., 2001).

33
3.3.2.1 Physical Requirements
For successful sugarcane cultivation, soils should be well-structured, aerated and granular
in structure (Sys et al., 1993). This would ensure that the soil would have efficient water
storage (approximately 150mm water content) and drainage characteristics, thereby
avoiding viruses, diseases and bacterial infections associated with poorly drained and
water-logged soils (Schulze et al., 1997). The ideal soil type would therefore be loam
composed of adequate proportions of clay, sand and silt (Sys et al., 1993). In addition,
sugarcane grows better on deep, fertile soils, with the optimal depth for cane cultivation
being in excess of 1m (Schulze et al., 1997).
3.3.2.2 Chemical Requirements
3.3.2.2.1. Nutrients
The key macronutrients essential to optimum cane growth are Nitrogen (N), Phosphorous
(P), Potassium (K).
N is the essential nutrient for vegetative growth and is recommended to be
applied in the form of urea at 130 kg N/hectares (ha) (Cornland et al., 2001).
However, FAO AGL (2002) suggests that for 100 ton/ha sugarcane, N be
added at the level of 100-200 kg N/ha. Application of N should be carefully
monitored as excess N can potentially depress the sugar content of the juice
(Cornland et al., 2001).
P is essential for cane growth, with deficiencies retarding development of the
root system. To obtain a yield of 100 ton/ha sugarcane, it is recommended that
P be applied at the level of 20-90 kg P/ ha (FAO AGL, 2002). It is suggested
that P be placed close to the plant because of low mobility in the soil
(Cornland et al., 2001).
K plays an important role in counteracting the effects of N on the sucrose
content of the cane juice. It should be applied in the form of Potassium
chloride at a concentration of 80 kg K/ha, and K in excess of this would add to
the K reservoir of the soil (Cornland et al., 2001).

34
In addition to these, the levels of Calcium (Ca) and Magnesium (Mg) should be
monitored to avoid potential growth retardation, reduction in resistance to diseases and
even plant death (Sys et al., 1993). It is important to note that prior to applying
macronutrients according to the levels suggested above, soil nutrient analyses should be
conducted to avoid over-fertilising. Soils in different geographical regions under different
conditions would exhibit varying amount of the essential N, P and K.
3.3.2.2.2. pH and Salinity
The pH of the associated chemical environment influences the solubility of some
nutrients, therefore soil pH regulation becomes essential for successful cane growth
(Cornland et al., 2001). There is a potential for certain nutrients such as toxic Aluminium,
to become more soluble at low pH with the risk of leaching down through the soil profile
in the water supply (Cornland, et al., 2001). The optimum pH range for sugarcane is 6.0-
7.5 but sugarcane being as versatile as it is, can tolerate a pH range of 4.5-8.5 (Blume,
1985; Tarimo and Takamura, 1998; Cornland et al., 2001). Soil acidity should therefore
be monitored and regulated, as low pH may affect microbial activity within the soil,
hence affecting nutrient cycling (Cornland et al., 2001).
Coupled with this, cane can moderately tolerate saline conditions. It has been observed
that crop yields decrease with increasing salinity, therefore for there to be no impact on
cane yields, it is suggested that the electrical conductivity of the soil solution should be
less than 2.0 dS/m (Griffee, 2000; FAO AGL, 2002).
3.4 Climatic Requirements
3.4.1. Temperature
According to Tarimo and Takamura (1998) like all other tropical cereal grasses,
sugarcane requires an optimum temperature for effective germination of sett, tiller
elongation, photosynthate mobilisation and ripening. The minimum mean air temperature
for active growth is 20°C, with growth arresting when temperatures fall below 15°C and
exceed 38°C (Blume, 1985; Tarimo and Takamura, 1998; Cornland et al., 2001).
Specifically, temperature requirements for each phase of the growth cycle are:

35
Germination – above 8.5°C (Grifee, 2000), optimum 27-33°C (Tarimo and
Takamura, 1998). Schulze et al., (1997) has suggested an optimum of 22 –
32°C. Germination is slow at soil temperatures below 18°C and increasingly
rapid up to 35°C (Bull, 2000)
Sprouting and Rooting – above 20°C
Stalk elongation – optimum of 23°C (Tarimo and Takamura, 1998)
Ripening (phase at which sucrose level increases) – optimum range of 10-
20°C (Griffee, 2000).
3.4.2. Insolation
Sunshine or insolation is another important factor to consider when growing sugarcane.
Levels of light intensity affect photosynthetic rate, which has some influence on crop
yields (Cornland et al., 2001). According to Griffee (2000), the greater the solar
radiation, greater the cane production, as high levels of radiation are important in the
rapid growth phase and in the ripening period to ensure high levels of sucrose in cane.
The optimum radiation requirement is in excess of 2 200 hours sunshine/annum with the
minimum being 1200 hours per annum (Blume, 1985; Sys et al., 1993). In addition, solar
radiation enhances the absorption of mineral nutrients during the day and equally
dependent upon insolation is water absorption (Tarimo and Takamura, 1998).
3.4.3. Water Requirements
3.4.3.1 Rainfall
Although sugarcane is a drought tolerant crop, it nevertheless is a highly water
demanding crop, especially during the peak growing phase (Hunsigi, 1993; cited in
Cornland et al., 2001, pp 34). Adequate available moisture is essential throughout the
growing period as vegetative growth, including cane growth is directly proportional to
the amount of water transpired (FAO AGL, 2002). The crop requires a mean annual
rainfall supply of 1200 – 1500mm, evenly distributed throughout the growing season
(Blume, 1985; Tarimo and Takamura, 1998, FAO AGL, 2002). Specifically, a mean
annual rainfall of 850mm, optimally 1300mm (ideally 120mm per month) should be

36
followed by a dry, but sunny and frost free winter ripening and harvesting period
(Schulze et al., 1997).
3.4.3.2 Irrigation
If rainfall is insufficient (less than 800mm/annum) then supplementary irrigation
becomes essential to meet growth requirements (Watson and Garland, 2004; Tarimo and
Takamura, 1998). As each development phase of sugarcane has different growth
requirements, the frequency and depth of irrigation should vary with the growth periods
of the crop (FAO AGL, 2002). Preferred irrigation applications for each growth phase is
summarised in Table 3.1.
Table 3.1. Irrigation requirements of sugarcane during each growth phase (FAO
AGL, 2002)
Growth Phase Irrigation Requirement
Emergence & establishment of young
seedlings
Light, frequent applications
Early vegetative phase Early flush of tillers - this furnishes
shoots of approximately the same age
Stem elongation & early yield formation Intervals between irrigation applications
can be extended but depth of water
should be increased*
Ripening period Irrigation levels are extended or
altogether stopped when it is necessary to
bring the crop into maturity
Yield formation Irrigation intervals extended or halted**
*Adequate water supply during this period of active growth is essential as with adequate
water supply this period is reached earlier and total cane height is greater.
** Frequent irrigation will accelerate flowering which reduces sugar production,
therefore to increase yield irrigation intervals are extended or halted.

37
In general, irrigation allows producers to grow high-volume crops that would otherwise
not be possible due to low rainfall (Dumler and Rogers, 2006). Specifically, average crop
yields are higher under irrigated conditions compared to rainfed agriculture (Siebert et
al., 2005). In the arid region, irrigation is a prerequisite for crop production, whereas in
the semi-arid and humid areas, irrigation serves to increase yields and attenuate the
effects of drought.
3.4.4. Relative Humidity
According to Schulze et al., (1997), a relative humidity of less than 70% is required
during the maturity and harvesting phases. It is in these phases at which relative humidity
is most crucial, as diseases become more prevalent with higher humidities (Baijnath,
2005).
3.5. Sugarcane Growth
Depending on the variety, the growing period of sugarcane, from planting to maturity,
spans one to two years (Cornland et al., 2001). The stages in the cane growth cycle are
germination, establishment, stem elongation, maturation and ripening. The time it takes
to complete each phase is summarised in Table 3.2., according to FAO AGL (2002):
Table 3.2. Phases of sugarcane growth
Phase Period (days)
Germination & Establishment 10 - 30
Stem elongation 150 - 350
Maturation (yield formation) 70 - 200
Ripening 50 - 70
3.5.1 Germination and Establishment
Sugarcane is usually produced from cuttings called setts, which are stalks cut into shorter
segments (Tarimo and Takamura, 1998, Willcox et al., 2000). Whole stalks can also be
used as planting material (Willcox et al., 2000). To achieve a high percentage of

38
germination, the setts are planted within a few days of harvesting and under optimal
conditions, setts germinate within two weeks of planting. During the initial stages of
germination, a flush of roots is produced which is important in maintaining the moisture
in the sett. The shoots grow from underground nodes and the axillary buds on the nodes
give rise to tillers (Tarimo and Takamura, 1998).
3.5.2. Stem Elongation
Early cane growth is characterised by stem elongation during which the fibre content of
the stem is high (Bull, 2000). Breeding of modern cane varieties implies that the plant top
is very heavy and consequently is prone to logging. As a response, stems curve again to
grow upright.
3.5.3. Maturation and Ripening
During this phase, overall growth rate declines, and sucrose content increases
approximately 120d after planting (Bull, 2000). Following stem elongation, each
internode operates as an individual unit, it completes cell elongation and cell wall
thickening and fills with sucrose. This sucrose can then be translocated to support further
growth and tillering when conditions are not favourable for photosynthesis (Bull, 2000).
As the stem matures, sucrose content continues to increase, and is the phase of yield
formation (FAO AGL, 2002).
3.5.4. Harvesting
After a 12-18 month growth cycle, sugarcane is harvested by cutting the stems close to
the ground (Bull, 2000). The remaining underground plant material, called the ratoon
(root system), will resprout and develop into a new plant. A maximum of four ratoon
crops (can be more than four as is the case in Southern Africa) are grown before
ploughing out the crop and replanting, as ratoon crops accumulate damage from
harvesting, weed control and possible pests and diseases, which result in yield reduction
(Bull, 2000).

39
There are three primary methods of sugarcane harvesting: (1) manual, (2) semi-
mechanised, and (3) fully mechanised (Cornland et al., 2001). In poorer countries or rural
areas, manual harvesting is the method employed due to financial constraints, whereas
semi-mechanised and mechanised harvesting operations have become more popular in
wealthier, developed countries. Semi-mechanised harvesting implies that the cane is cut
manually but loaded mechanically. With manual harvesting, the cane is first burned to
clear out weeds, animals and debris that could potentially complicate cutting. With
mechanical harvesting, the cane can usually be cut green, which results in a significant
quantity of biomass leftover, called cane trash (Cornland et al., 2001). Cane trash is a
significant biomass resource, and can be used to generate bioenergy (Dellepiane et al.,
2003).
3.6. Cultivation
To cultivate sugarcane, several factors have to be addressed which include having to
choose the cane variety, preparing the land for cane growth, managing weeds and pests,
and supplying the crop with an ample supply of fertilisers and water. The capacity and
resources to meet these requirements for cane cultivation will influence the location and
feasibility of a commercial sugarcane plantation.
3.6.1. Cane Variety
Choosing the cane variety is an important factor in cane production, as it will determine
the potential yield of a plantation as well as resistance to pests and disease (Cornland et
al., 2001). The specific variety chosen will be depend on the climatic, ecological and
economic conditions (Cornland et al., 2001).
3.6.2 Land preparation, Fertilisers and Water supply
The land selected for cane growth would require immense preparation prior to planting.
Clearing of the land, soil preparation, leveling and grading of the land, weed and insect
control, ploughing and irrigation, are steps undertaken to prepare the land for cultivation
(Alexander, 1985; Blume, 1985). Following planting, the addition of fertilisers assists in
meeting the plant’s nutrient requirements during growth and development and improving

40
crop yields (Blume, 1985). As sugarcane is a highly water demanding crop, adequate
water supply is required throughout the growing period. If rainfall cannot meet the crop’s
water requirements, irrigation then becomes essential if mean annual rainfall is less than
800mm (Watson and Garland, 2004).
3.6.3. Transportation to the mill
The quality of sugarcane starts to deteriorate immediately following harvesting, and it is
suggested that to avoid loss of sugar content, it is essential to avoid long delays between
harvesting and milling of the cane (Cornland et al., 2001). These delays further decrease
overall profitability of sugarcane production. It has been recommended that generally
distances of 50-80 km be the limits for a mill supply area (Baijnath, 2005; Tomlinson,
2005; cited in Grimmet, 2005, p11).
3.6.4. Weeds, pests and disease control
For the first three months of growth, sugarcane requires a weed-free environment, as
weeds can drastically reduce yields (Cornland et al., 2001). Weeds compete with
sugarcane for water and nutrients and harbour pests which affects sugarcane productivity
(Cornland et al., 2001). Depending on the type of weed, conditions and degree of
infestation, manual, mechanical or chemical methods can be used to control weeds. In
addition to weeds, pests also pose a threat to sugarcane growth and development.
Globally, the major sugarcane pests are, moth borers, froghoppers, termites, white grubs
and rodents which can be controlled and eliminated using agricultural methods without
applying chemicals (Cornland et al., 2001).
Sugarcane is susceptible to an estimated 100 diseases, caused by various biological
agents including bacteria, fungi and viruses (Hunsigi, 1993). The most important diseases
are smut, downy mildew, ratoon stunting disease, red rot, leaf scald, and sugarcane
mosaic virus because they are systemic (already present within the cane stalk) (SASEX,
1980; Cornland et al., 2001). Disease control in sugarcane is achieved by selecting
resistant varieties and establishing these varieties in the sugarcane plantation (SASEX,

41
1980). Other treatments include long hot-water treatments (50°C at 3 hours) for ratoon
stunting disease and short hot-water treatments (50°C for 30 minutes) (SASEX, 1980).
3.7. Sugar production
About 200 countries grow sugarcane primarily as a source of sugar with a world sucrose
production of 55 million ton/year (FAOSTAT, 2001). To produce sugar from sugarcane,
cane juice is initally extracted from the cane through cutting, crushing and washing. The
juice is then dried into crystals through an evaporation process using steam as a heat
carrier (Gabra and Kjellström, 1995). Specifically, the juice is clarified by heating in the
presence of lime which filters out some impurities and arrests sucrose decay to glucose
and fructose. Following this, the cane juice is concentrated by evaporation to produce a
syrup (Mackintosh, 2000). The syrup undergoes multiple rounds of crystallisation to
extract the sucrose. It is then boiled, and upon cooling the sucrose crystallises out of the
syrup. Centrifugation is used to separate the sucrose by crystallisation from the remaining
liquid called molasses.
3.8. By-products of cane processing
Chapter 2 discussed the various bioenergy applications of sugarcane and its byproducts,
therefore this section serves only to briefly summarise the main agricultural residues of
sugarcane processing.
3.8.1 Bagasse
According to Blume (1985), about 13% of the sucrose in the cane is lost during
processing with the production of several by-products. One such by-product is bagasse,
which is the fibrous portion of sugarcane that remains after the juice has been extracted
(Blume, 1985; Gabra and Kjellström, 1995; Deepchand, 2001). Due to its calorific value,
19 250 KJ/kg, bagasse has been traditionally used as boiler fuels in the mill to generate
steam at high pressure and temperature (Blume, 1985; Deepchand, 2001). Excess energy
can be directed to the electricity grid, a prime example being Mauritius in which 20% of
the country’s current energy needs originate from bagasse (Deepchand, 2001).

42
3.8.2. Filter cake
During sugar production, the impurities filtered out by clarification with lime, produces
the second by-product termed filter-cake (Blume, 1985). The filter cake is used as a
fertiliser in the cane fields (Blume, 1985).
3.8.3 Molasses
Molasses is the thick syrup residue left after sucrose has been removed from the clarified
sugar juice (Blume, 1985). It has a broad spectrum of uses, which includes serving as a
raw material for animal feeds, a fertiliser, and used as a feedstock in the production of
ethanol (Blume, 1985).
3.8.4. Cane trash
The material leftover in the field after harvesting such as the tops and leaves of plants is
termed cane trash (Gabra and Kjellström, 1995). Although not a direct by-product of cane
processing, cane trash also known as barbojo, can be used as a source of residual fuel
(Gabra and Kjellström, 1995). In a study conducted by Dellepiane et al. (2003), it was
shown that biogas obtained from bagasse and barbojo can be used in electrical power
generation.
3.9. The non-biophysical considerations in sugarcane management
The ultimate aim of successful sugarcane cultivation should culminate with effectively
managed sugarcane harvesting and delivery. To an experienced grower, the concern is
not the production of high tonnages but rather getting this high tonnage harvested
(Alexander, 1985). Thus, the main harvest objectives are:
a) To cut and remove the sugarcane tonnages from the field, in an economic manner, i.e.
removal without damage to the seed bed, and;
b) To perform this step in such a manner that the harvested cane is acceptably clean
(free of soil, adhering mud and other objects which can impair its milling) for its
subsequent role as a biomass feedstock (Alexander, 1985).

43
Following harvesting, the most important component in sugarcane management would be
its delivery to its agricultural and manufacturing phase, i.e. the mill (Alexander, 1985).
As previously outlined in section 3.6.3, timeous transportation to the mill has
implications for sugarcane quality and is a critical phase in the successful cycle of
sugarcane production.
This study incorporates the logistics of the above-mentioned aspects into the land
suitability assessment, in order to provide a general idea of the viability of establishing a
sugarcane farm at the resultant suitable areas. This section therefore serves to provide an
understanding of the logistics that frame sugarcane harvest and delivery. As the several
practices of harvesting have been outlined previously, harvesting will be considered in
terms of labour contribution
3.9.1. Sugarcane Harvesting
As this study promotes social and economic development in the study area, manual
harvesting is promoted due to its high labour requirement. This would undoubtedly create
economic and employment opportunities, alleviating Angola’s extensive unemployment
situation.
Manpower or labour in sugarcane harvesting, especially for the purpose of bioenergy, is
considered most effective in “filling the gaps” created where machines are ineffective or
incapable of performing satisfactory work (Alexander, 1985). Furthermore, a trained
labourer has several associated advantages over mechanised cultivation (Alexander,
1985). These include:
- individual stem selection
- persistent clean cutting at a predetermined height
- stripping away of trash
- clean topping at a predetermined height
- piling stems in uniform alignment without contamination with soil or mud

44
In addition to these, the human cane cutter, is a preferred option when cane stands are
prevented by circumstance from being harvested mechanically. Some of these
circumstances include excessively high tonnage, excessively poor conditions caused by
lodging or secondary rooting, as well as excessively steep or rough terrain (Alexander,
1985).
However, when considering manual sugarcane harvesting, it is essential to note that it is
undoubtedly a labour-intensive option (for example, hand cutting), and as a result the
physical state of the available labour force is critical consideration. Specifically the level
and nature of human inputs is an important factor influencing the suitability of land for
agricultural activity (FAO-IIASA, 2007). Factors such as health and education status are
included in this consideration. For example the prevalence of HIV/AIDS surrounding the
area selected for sugarcane farming would be an indication of how healthy the labour
force is. If there is a high prevalence of HIV/AIDS there is an indication of high rates of
turnover in terms of workforce, and that current workforce may not possess the desired
physical capacities for manual harvesting. Another factor to consider is the level of
education of the surrounding population, as those individuals with a high level of
education would not necessarily partake in such labor-intensive positions. A high level of
education, such as matriculation or a university degree would afford employment
opportunities at sector specific and skilled positions.
3.9.2 Sugarcane transport – infrastructure considerations
According to Alexander (1985), transportation of sugarcane is dictated by the physical
proximity of the sugarcane farm (agricultural phase) to the mill (manufacturing phase),
with an ideal physical layout for an energy cane enterprise being the centralised location
of the mill surrounded by the agricultural area. The are two fundamental types of cane
transportation situations, which is characterised by intraplantation and inter-area
transport.

45
3.9.2.1. Intraplantation transport
Intraplantation transport is a highly localised cane movement scenario and, transportation
scenarios of this nature would utilise an internal road or rail network to transport
harvested biomass. What makes this scenario attractive is the capacity to load a carrier
unit in the field, deliver the load directly to the mill and return to the mill for another
load, such that this trip can be repeated several times daily. This feature of intraplantation
transport reduces costs especially in terms of fuel savings, and equipment expenditures.
Additional advantages include greater carrier efficiency (tons/carrier day), reduced sugar
and biomass losses and reduced vulnerability of feedstock supply (Alexander, 1985).
3.9.2.2. Inter-area transport
This transportation scenario transports harvested biomass already hauled from the field in
one carrier to another carrier, to a milling site located a long distance away from the
agricultural area. Justifying the use of inter-area transport for sugarcane is the poor
economics of hauling by highway, and as a result the use of rail transport becomes
necessary.
In practice, the choice of transportation scenario is highly dependent on costings,
harvesting, loading and milling receiving facilitiies (i.e. proximity to agricultural area)
(de Beer, 1998). As a result, there is no universally applicable means to determine which
transportation scenario is most cost effective and practical at a particular site.
However, it can be undoubtedly stated that land productivity is dependent on services
provided by transportation networks (FAO, 1985). Consequently, there is a requirement
for an efficient road and railway transport infrastructure. In many instances, a properly
maintained rail system offers the most cost-effective mode of transport, especially when
considering delivery of high-tonnages over long-distances. Trains are highly effective in
transporting large amounts of materials and products to distribution centres, where goods
can be offloaded on to trucks (Nierengarten, 2007). However, for rail transport
specifically, the cost of installing a new rail system usually makes this option less
attractive (de Beer, 1998). According to de Beer (1998), an alternative would be to keep

46
only the main lines with tractor-trailer rigs which could bring the cane to appropriate
sidings.
Ethanol, a by-product of sugarcane processing also features in the cane transport cycle.
As it is a highly flammable liquid, it requires the safest mode of transport. Rail transport,
in such a case is considered the safest means of transporting ethanol (Richards, 2006).
Furthermore, due to its corrosive nature, unlike other gasoline products, ethanol cannot
be pumped through underground pipelines (Nierengarten, 2007). However, although rail
transport provides the most practical means of transporting ethanol, other options such as
transport by truck may also be exploited. It is beyond the scope of this project to
determine which transport mode is most cost effective for both sugarcane and ethanol,
and will therefore include both rail and road infrastructure as a delivery option.
3.10. Conclusion
Due to its remarkable physiological, anatomical and agronomic features, sugarcane as a
bioenergy crop is an integral bioenergy resource. With its establishment as a bioenergy
crop, it offers a wide range of by-products, including sugar, which has a variety of
applications. These have been outlined in the preceding sections, including an account of
the ecological requirements for successful sugarcane growth. The following chapter gives
a description of the study area.

47
Chapter 4 Description of Study Area – Angola
4.1. Introduction
Since its independence from Portugal in 1975, civil war was the norm in Angola. The
bitter rivalry between the ruling Popular Movement for the Liberation of Angola (MPLA)
and the rebel group, the National Unit for the Total Independence of Angola (UNITA),
fuelled anger, destruction and infrastructure breakdown. However, with the death of
Unita leader Jonas Savimbi in 2002, a ceasefire was signed to end the conflict that
spanned 27 years. Post-civil war Angola has several challenges that lies ahead; rebuilding
its nation and infrastructure, and setting a path towards sustainable development. With its
vast array of natural resources and capacity for rehabilitation, there exists much hope in
the country’s endeavour towards post-conflict reconstruction. This chapter will give a
profile of Angola, beginning with a general profile of the country, moving towards an
energy-centred focus.
4.2. Geography
Angola is located in Southern Africa, bordering the Atlantic Ocean between Namibia and
Democratic Republic of the Congo and is made up of 18 provinces (Figure 4.1.) (CIA,
2007). With a total area of 1 246 700 km2 and a population of 15,94 million (2006
estimate) it is estimated to be five times the size of the United Kingdom (FAO, 2006;
CIA, 2007). The country can be divided into four major physiographic regions (FAO
Mapping Information Systems, 2007):
(1) a low lying coastal plain, with a width varying from 25 km in the South to 100 to 200
km in the North
(2) The central highlands or Angolan plateau, covering almost two-thirds of the country
(Funk and Wagnalls, 2006). It has an average height between 1000 and 1300 m
dominated by several mountain chains. It includes the Serra Moco, the highest point
in the country (2620 m). this region is also one of the main sources of water for
Southern Africa

48
(3) The Northern foothills of the highlands toward the Congo basin, where most of the
country’s closed forests are found. The remainder of the forests being located in
Eastern Cabinda
(4) The Eastern and Southern foothills of the highlands towards the central depression of
Southern Africa and the Kalahari basin

49
Figure 4.1. Location of Angola in Africa and Angola’s provinces
hg
Moxico
Bie
Huila
Uige
Cuando Cubango
Malanje
Cunene
Lunda Norte
Lunda Sul
Namibe
Zaire
Bengo
Cuanza Sul
BenguelaHuambo
Cuanza Norte
Cabinda
Luanda
24°0'0"E
24°0'0"E
22°0'0"E
22°0'0"E
20°0'0"E
20°0'0"E
18°0'0"E
18°0'0"E
16°0'0"E
16°0'0"E
14°0'0"E
14°0'0"E
12°0'0"E
12°0'0"E
10°0'0"E
10°0'0"E
4°0'0"S 4°0'0"S
6°0'0"S 6°0'0"S
8°0'0"S 8°0'0"S
10°0'0"S 10°0'0"S
12°0'0"S 12°0'0"S
14°0'0"S 14°0'0"S
16°0'0"S 16°0'0"S
18°0'0"S 18°0'0"S
20°0'0"S 20°0'0"S
22°0'0"S 22°0'0"S
24°0'0"S 24°0'0"S
26°0'0"S 26°0'0"S
28°0'0"S 28°0'0"S
−
D_WGS_1984
0 1,400 2,800 4,200 5,600700Kilometers

50
4.3. Climate
Climatic conditions vary widely in Angola, from humid tropical lowlands in the north
and northeast to desert on the southern coast bordering Namibia (Kyle, 1997). Angola has
a tropical climate with alternating wet and dry seasons, conditions ideal for sugarcane
cultivation. The wet, hot season is from November to April, and the dry, cool season is
from May to October. Temperature in the coastal region is moderated by the offshore,
cool Benguela current which subsequently reduces precipitation. The coastal areas are
therefore much dryer with an average annual rainfall of less than 100mm (Kyle, 1997).
The highest mean annual rainfall in Angola is seen in the North, approximately 1500mm,
but reduces as one moves towards the South to 750mm (Funk and Wagnalls, 2006). The
central highlands have large areas with an annual rainfall of 1500-2000mm (Kyle, 1997).
4.4. Vegetation
Extending from the country’s capital, Luanda, to Namibia is a dry coastal strip. Angola
has well-watered agricultural highlands, with savanna dominating the far-East and South
and dense tropical rain forests are encountered as one moves towards the North and the
Cabinda exclave (Nations Online, 2007). There are arid seaward plains between Sumbe
and the mouth of the Cunene River (IWMI, 2006). Most of the interior plateau in the
south and east of Angola is dominated by savannas of varying density, with closed forests
occurring at lower levels in the river valleys tributary to the Zaire River (IWMI, 2006).
On the higher valley sides, forests are backed by savannas. In Cabinda, the littoral
vegetation is mainly grassy savanna which transitions into dense forests on the low hills.
As Angola is one of the wettest countries in Southern Africa, it is well endowed with a
variety of wetland vegetation. The interior is characterised by dambos and extensive
swamps and marshes, riparian strip swamps occur along some of the major rivers (IWMI,
2006). Strips of tall swampy forests are found along the rivers flowing into the Zaire
Basin in North Luanda. Abundant mangroves occur in Cabinda and Cuanza floodplains,
Mussulo Restinga, Lucula, Lucunga and M’bridge river-mouths with a total surface area
of 700-1250 km2 (UNEP, 2007). Thus, from the overview provided on Angola’s
vegetation, it can be seen that Angola is a country of great ecological diversity.

51
4.5. Angola’s agriculture sector
Angola’s agriculture is predominantly a family-labour activity for small-holder
subsistence peasants such that 85% of the population is dependent on agricultural
production (FAO, 2006; CIA, 2007). In most rural areas, except in the south where
livestock predominates, agricultural crop production is the main source of livelihood
(FAO, 2006). However, at present Angola is only using 3.6 million hectares of its total
land area to grow crops (Johnson and Rosillo-Calle, 2007; Van Den Berg and
Rademakers, 2007). This equates to only 2.9% of its total land area, which suggests the
considerable scale of available land resources in comparison to the current low levels of
land utilisation (Johnson and Rosillo-Calle, 2007). Van Den Berg and Rademakers
(2007) further suggest that Angola has 88 million hectares of land that is potentially
suitable for agriculture which is equivalent to approximately 71% of the country.
However, it is likely that this estimate includes savannas which are inherently unsuitable
for cropping and should only be used as rangeland (Watson, 2007; pers. comm.).
Angola is a potentially agriculturally rich country, with fertile soils, a favourable climate
and a mass of 57.6 million hectares of agricultural land2 (FAO, 2006; Johnson and
Rosillo-Calle, 2007). Its leading subsistence crop is cassava or manioc, with an annual
production of 369 000 tons (Funk and Wagnalls, 2006).
There are three main agro-ecological regions in Angola which correspond to the main
climatic and geographical features of the country (Kyle, 1997; FAO, 2006; UNEP, 2007):
1. The humid northern region in which cassava, tropical crops (peanuts, palm oil, castor
oil), coffee and cotton are predominant
2. The sub-humid central region which is suitable for maize, sisal, sunflower and wheat
3. The semi-arid southern region which is mainly for grazing and the cultivation of
sorghum and wheat
2 Agricultural areas are those which include temporary and permanent pastures and temporary and permanent crops. They also include grasslands and other areas (Johnson and Rosillo-Calle, 2007).

52
In the central plateau, potatoes are also an important crop and rice is grown over large
areas in the north. Sugarcane is growing in the coastal flats near Luanda (UNEP, 2007).
Historically, in Angola the most important cash crop has been coffee which grows in the
provinces Uige, Malange, Cuanza Norte and as far south as Humbo and Bie. Other major
crops include, corn, sugarcane, sweet potatoes, banana, millet, beans, palm products and
sisal, however the major export crop is coffee (Funk and Wagnalls, 2006; CIA, 2007).
4.6. Minerals and Natural Resources
Angola is a country that is rich in minerals and natural resources, with oil being its
greatest resource. Oil production and its supporting activities contribute approximately to
half its GDP and its sale accounts for 90% of government revenues (CIA, 2007; Clough,
2007). After Nigeria, Angola is sub-Saharan Africa’s second largest producer of oil
(Clough, 2007). Proven oil reserves have tripled in the last seven years, and its crude oil
production has more than quadrupled over the past twenty years (EIA, 2005; Clough,
2007). From 280 000 barrels of oil per day (bbl/d) in 1986, Angola currently produces on
average 1.25 million bbl/d, and in 2008 oil production is expected to rise to an astounding
2 million bbl/d.
However, despite Angola being potentially rich due to oil export revenue, much of this
revenue is mortgaged through repayment of earlier oil-backed loans and is not available
in the short term (Eggington, 2006). Furthermore, as Angola is rebuilding its
infrastructure, there are heavy demands for investment of government funds in various
sectors in the country. The energy sector is seen as essential to improving the country’s
socio-economic situation, and thus, investments into areas such as bioenergy appears
attractive. Specifically, the production of bioethanol from sugarcane is a means of
decreasing dependence on foreign exchange earnings, and has enormous potential in
making Angola energy self-sufficient. The potential contribution of bioenergy to energy
security and socio-economic upliftment has been discussed in Chapter 1, section 1.4.
Diamonds remain the second most important mineral in Angola with earnings from
exports making up 7% of government revenue (Clough, 2007). Other important minerals

53
and natural resources include, iron ore, natural gas, phosphates, copper, feldspar, gold,
bauxite and uranium (Funk and Wagnalls, 2006; CIA, 2007). Overall, its main mineral
exports are crude oil, diamonds, refined petroleum products and gas (CIA, 2007).
4.7. Population characteristics
The majority of the Angolan population is overwhelmingly rural, with only one-third of
the population living in urban areas (Funk and Wagnalls, 2006). The country faces
extensive unemployment, such that half of the population is unemployed and an
estimated 70% of the population lives below the poverty line (less that $2 a day) (CIA,
2007). The total labour force is estimated at 6.3 million of which 85% are engaged in
agriculture (2007 estimate) (CIA, 2007). Education in Angola has improved with the
government pledging a campaign to drastically reduce the illiteracy rate. Their efforts
were reflected by the increase in percentage literacy from a mere 42% in 1990 to 67.4%
in 2007 (CIA, 2007). HIV/AIDS is another issue affecting the Angolan population. It is
estimated that the HIV prevalence rate is 3.7% and between 200 000 to 450 000 people
are living with HIV/AIDS (2007 estimate) (UNAIDS, 2007). However, this is very low
compared to other African countries. Angola is considered to have the lowest HIV/AIDS
prevalence rate in the Southern African region, for example compared with South Africa
which has a prevalence rate of 21.5%, Mozambique (16.2%) and Namibia (21.3%) (FAO,
2006).
4.8. Organisations
Angola is a member of the Southern African Development Community, the Common
Market for Eastern and Southern Africa (COMESA) which is a 20 member organisation
working to liberalise trade and promote regional integration and the African Union
(Clough, 2007). In addition, on 1 January 2007, Angola became the twelfth member of
the Organisation of Petroleum Exporting Countries (EIA, 2007).
4.9. Environmental Agreements and Environmental Overview
Angola is party to Biodiversity, Climate Change, Desertification, Law of the Sea, Marine
Dumping, Ozone Layer Protection, Ship Pollution (signed, but not ratified) (CIA, 2007;

54
EIA, 2007). Annually, it emits 19.7 million metric tons of carbon dioxide, of which oil
contributes 35% and natural gas contributing 7% (EIA, 2007). Angola faces several
environmental issues such as deforestation of its tropical rainforests in response to both
international demand for timber and domestic demand as use for fuel. Between 1990 and
2000, Angola has lost approximately 2% of its total forest area (WRI, 2003). Other
environmental issues include, desertification, soil erosion contributing to water pollution
and siltation of rivers and inadequate supplies of potable water (EIA, 2007).
The SADC has a biofuels initiative which is line with its Regional Indicative Strategic
Plan (RISDP) (Takavarasha et al., 2005). As Angola is a member of SADC, such an
initiative is an encouraging means of support to biofuels implementation in the country.
More comprehensive biofuel policies are underway in the SADC region through revision
of current energy policies and strategy to include the biofuels sector.
4.10. Angola’s Power Industry
Only 15% of Angola’s population has access to electric power, however, this may not be
a reliable supply of power as blackouts occur frequently. As a result, energy security is a
major concern for the country. The country’s electricity generating capacity as of 2003
was 0.7 gigawatts, which is split between thermal (oil and gas-fired) and hydroelectric
units. However, hydroelectric facilities generate more than two-thirds of the country’s
electricity (EIA, 2007). Angola’s electricity generation during 2003 was 1.9 billion
kilowatt-hours with consumption being 1.8 billion kilowatt-hours (EIA, 2007).
Three separate systems are used to supply electricity throughout the country (Clough,
2007):
(1) Northern System which supplies the provinces Luanda, Bengo, Cuanza Norte,
Malange and Cuanza Sul
(2) Central System which supplies the provinces of Benguela, Huambo and parts of Bie
(3) Southern System which supplies to Huila and Namibe provinces

55
The government, however, aims to link these three systems to create a national grid
through the South African Power Pool (SAPP).
As mentioned, the country’s major electricity producers are hydroelectric facilities,
however, as a result of the civil war, out of the six facilities only three are functional. The
Matala Dam on the Cunene River is the main source of electricity in south-west Angola,
with Northern Angola receiving electricity from the Cambambe dam on the Kwanza
River, the Mabubas Dam on the Dande River and diesel generators (Clough, 2007). In
addition, in north-east Angola, a 24-MW dam is being built on the Tchicapa River
(Clough, 2007). A Brazilian construction company, Odebrecht, has partially completed
an additional hydroelectric facility at Capanda on the Kwanza River which could nearly
double Angola’s electricity generating capacity.
By further rehabilitating the country’s hydropower stations, Angola intends to restore the
productive capacity of its state-owned electric utility, Empresa Nacional de Electricidade
(ENE). In November 2003, together with the national utilities of five countries, BPC
(Botswana), Eskom (South Africa), NamPower (Namibia) and SNEL (DRC), Angola’s
ENE formed the Westcor Power Project to provide low-cost and environmentally friendly
electricity to ensure the economic development of the region (EIA, 2005).
4.11. Transport - road, rail and the agricultural sector
Road or rail transport is a means of delivering goods and supplies to the agricultural area
as well as delivering agricultural products to the processing phase, which may be located
a distance away from the agricultural phase. Furthermore accessibility to roads is a means
of facilitating marketing of agricultural produce, which is especially relevant in Angola.
A 2006 special report on the crop and food supply situation in Angola produced by the
FAO has made extensive acknowledgement of the poor condition of Angola’s road
network. Consequently, the poor conditions have had several implications for food
security for some of Angola’s provinces. For example, even though the marketing and
market situation in Angola has improved over the last four years, hindering its proper
functioning are serious infrastructural impediments characterised chiefly by the poor

56
condition of roads and transport. In 2006, it was possible to achieve good yield of
potatoes in the Planalto central (central region) but due to poor transport infrastructure,
by the time the produce gets to Luanda, it cannot compete in terms of price with imported
potatoes from Brazil (FAO, 2006). In Malanje, located in northern Angola, the condition
of the roads posed a major constraint to the movement of commodities from production
areas to markets (FAO, 2006). In contrast, in some regions, good road conditions has
been a driving force for the acceptable movement of commodities from the production
areas to the markets. This is the case noted in Cuanza Sul, located in the central region of
Angola, in which the prices of maize, beans, groundnuts and cassava are low and
affordable to the majority of households. Some of the best roads in the country are
located in Namibe (southern region) which facilitates exceptional marketing of produce
from small-scale commercial riverside cultivation.
The are three main railroads in Angola (appendix) (SARA, 2003),
1. Benguela railway running from the Benguela province which is an essential lifeline
for commercialisation (SARA, 2003).
2. Luanda railway located in Luanda province
3. Mocamedes located in Lubango in the Huila province
Needless to say both road and rail infrastructure in Angola have been damaged by the
nearly three decades of civil war. As a result, Anglola’s Transportation Policy Strategies
ranks investments in road and rail infrastructure high among the list of investment
priorities (Kuvingua, 2004). In 2006, it was reported that a US$4 billion program, backed
by Chinese loans, to repair road and rail infrastructure had been completed (Esipisu,
2006). In addition, in 2006, Angola launched the next phase of rail refurbishment and in
some cases building of new sections to open transport routes to the Congo, Zambia,
Zimbabwe and Botswana (Esipisu, 2006).
4.12. Irrigation and irrigation potential
As this study is concerned with irrigated agriculture in Angola, specifically the
cultivation of sugarcane, an overview of the irrigation scenario in the country would

57
prove useful in understanding its potential for irrigation as well as the several challenges
it faces. Angola has a vast network of permanent rivers flowing through the country
which offers enormous opportunities for irrigation (FAO, 2006). Many farmers living
close to streams make use of these water sources for supplementary irrigation, however
there is a great shortage of structure irrigation works in the country. According to 2003
data, the overall potential area for irrigation was estimated at 6.7 million hectares of
which 3.7 million hectares are potentially covered by small irrigation schemes and
lowland irrigation (NEPAD-FAO, 2005). In 2004, the total effectively land irrigated was
estimated to be 64 750 hectares.
According to 2005 data, there are three main types of irrigation systems co-existing in the
country (NEPAD-FAO, 2005).
1. Large to medium scale irrigation systems fully or partly equipped with water
control works (approximately 100 000 hectares of land irrigated this way)
• Occupy various river floodplains in the humid and dry coastal zone and in the
southern temperate zones
• Used in the production of the country’s cash crops which includes sugarcane
• Initial projects were set up in Luanda, Bengo, Benguela, Namibe, Cuanza Sul and
Huila but new projects have been established extending to Cunene, Malanje and
Moxico
• Supports large to medium-scale farmers with plots varying from 15 to 50 hectares,
and small-scale farmers with plots of 3 to 4 hectares
2. Small-scale gravity or pumped systems
• Represents most important part of national irrigated area and is found in the central
Plateau covering Huambo and Bie
• Used to produce maize, vegetables and fruits
• Supports small-holder commercial farmers

58
3. Lowlands and depressions utilising water conservation farming practices
• Found in vast areas in central and east Angola where rains are sufficient but
unequally distributed
• Limited amounts of vegetables are produced in these areas
Due to the several years of conflict, existing irrigation systems and the installation of new
systems were neglected. Thus, in order to ensure and promote development of the
country’s social and economic infrastructures, the Government of Angola aims to
rehabilitate the country’s irrigation systems. Rehabilitation is expected to play a critical
role in attaining food security in the short- to medium-term (NEPAD-FAO, 2005). This,
essentially, would underpin revival and expansion of Angola’s agricultural sector. Further
advantages are envisioned for the long-term which includes increased incomes for small-
holder and commercial farmers since the same land would be cropped more than once
annually. Commercial farmers could further benefit by having an opportunity to offer
contracted services such as operation maintenance of irrigation equipment and combined
harvesting. Reduction in poverty, job creation for farm labour and availability of more
food staples are seen as added advantages to the rehabilitation of the country’s irrigation
systems (NEPAD-FAO, 2005).
4.13. Conclusion
With its enormous resource of oil, natural gas and diamonds and the availability of
agricultural land and adequate rainfall, Angola is potentially a wealthy country. However,
it still remains one of the poorest countries in the world, reflecting the heavy toll of
colonialism and 27 years of civil war. Performance outside the minerals sector has not yet
achieved its full potential due to the lack of institutional capacity and the challenging
business environment, and as a result has left most Angolans without a sustainable
income (World Bank, 2006). Its has been suggested that in order for Angola to take full
advantage of its natural resources, it would have to implement government reforms and
reduce corruption (CIA, 2007). However, the introduction of cleaner forms of energy,
such as bioethanol or bagasse-cogenerated electricity is another promising endeavour to
promote income-generating activities. At a 2001 meeting at the Commission on

59
Sustainable Development, cleaner energy was seen as the key to improving the welfare of
the people and the standard of living, without environmental degradation. Bioenergy
programs have the potential to take Angola to its full potential, by making use of the vast
amounts of available non-forested agricultural land. The country has the capacity to meet
the food, feed and fuel requirements of its growing population and will still have
adequate land available for bioenergy implementation (Van Den Berg and Rademakers,
2007). This capacity projects Angola to be the world’s next biofuel superpower, with the
potential for social, economic and environmental upliftment.
Therefore, currently, Angola shows the greatest potential in assisting the world to meet
its energy requirements. As fossil fuel resources are finite and is fast becoming depleted,
the world is turning towards sources of renewable energy. Angola, therefore, makes
Africa’s future sustainable bioenergy production so large, and with bioenergy, the
country’s export potential in 2050 is estimated to be around 6 exajoules per year, the
equivalent of 2.7 million barrels of oil per day. In addition to facilitating the world’s
energy needs, renewable energy resources is also imperative to meeting Angola’s energy
needs, as oil demand and consumption is projected to increase as infrastructure is
refurbished and expanded (Clough, 2007). Furthermore, with only 15% of the country
having access to electric power, electricity generated from bioenergy (electricity
cogeneration), is a further incentive for bioenergy implementation.

60
Chapter 5
Methodology
5.1. Introduction The previous sections provided the background that forms the theoretical framework that
underlies this study as well as a description of the study area. This chapter will provide an
overview of the methodological approach taken in this study to identify suitable areas for
sugarcane cultivation, the tools used to evaluate the study area for suitability as well as
the steps taken to produce the results.
5.2. Methodological Approach – A Land Suitability Assessment
As population numbers are steadily increasing so is the demand placed upon food and
fuel. This increasing demand places pressure on land availability, leading to intensive
grazing and cropping of land in areas which are less suited to such uses and which are
also ecologically more fragile (FAO, n.d.). Therefore, in order to preserve Earth’s natural
resources and sustainably provide food and fuel, land use planning becomes critical. The
landmark FAO (1976) publication, A Framework for Land Evaluation, asserts that land
suitability assessments or land suitability evaluations constitutes a crucial aspect of land
use planning, by assessing the fitness of a given type of land for a specific use. The
framework was developed to assess potentialities as well as limits of the world’s land
resources for development, and for the past 30 years has served as the internationally
accepted methodology for land evaluation (FAO, 2007). Initial land evaluations were
primarily carried out for land use planning and land development projects, however, as
the scope and purpose of land evaluations have changed during the past 30 years, the
FAO (2007) suggests a revision of the original framework. Land evaluations have
evolved to solving conflicting demands on limited land resources and requires more
participatory methods to be used in agricultural development.
The 2007 suggested revision of the original framework still shares the basic principles of
the 1976 publication. Of these, the framework asserts that land evaluations should take
into account the biophysical, economic, social and political context as well as the

61
environmental concerns associated with evaluating a land area for a specific land use
(FAO, 1976; FAO, 2007). The current study drew from the principles outlined in the
1976 publication and the modifications of the suggested revised framework. Specifically,
the approach taken in this study involved assessing the study area using biophysical
parameters to establish its suitability for sugarcane cultivation. This produced a series of
maps that were discussed in a broad socio-economic context.
Land evaluations may be conducted in either physical or economic terms, with physical
evaluations assessing the suitability of a land using physical (biophysical) characteristics
such as soil type, rainfall and water availability (FAO, 2007). In the original framework,
such evaluations were referred to as qualitative, however this is a misnomer because
many physical land evaluations are actually carried out in quantitative terms such as the
Agro-ecological zoning methodology, which is used to define suitability, production
potential and environmental impacts of a land to a particular land use (FAO, 2007). As
such this study is a quantitative evaluation, which involves filtering out protected areas,
analysing land cover classes, calculating proximity to roads, railroads and rivers as well
as filtering out steep slopes. However, the study also included a few qualitative
judgments, by selecting major areas suitable for sugarcane cultivation based on
purposively selected criteria.
As it was beyond the scope of the study, an economic land evaluation which involves
precise calculations of the economic costs and returns of the area placed under cultivation
was not carried out. Furthermore, the intensity of the study is concerned with a broad
inventory of natural resources at the national and regional level (FAO, 1976).
5.3. Intended land use
According to the FAO (1976), a suitability evaluation involves relating land mapping
units to specific types of land use. Therefore, in a land suitability assessment it is critical
to define the use that is intended for that land. Two major types of land use have been
outlined (FAO, 1976):

62
(1) A major kind of land use, which is a major subdivision of rural land use such as
rainfed or irrigated agriculture. This type of land use is usually considered in
qualitative land evaluation studies at the reconnaissance level.
(2) A land utilisation type, which is a kind of land use defined in a degree of detail
greater than (1). It is usually used in quantitative land evaluation studies and are
described in much detail and precision as the purpose of study requires. It consists of
a list of technical specifications in a given physical, social and economic setting. It
takes into consideration if the current environment would be modified, e.g. by
irrigation schemes or is intended to remain in the present condition. Examples of land
utilisation types includes, market orientation (either commercial or small-scale
production), labour intensity and infrastructure requirements.
Further to this description, the intended use for the land in this study appears to fall
somewhere between the two classifications. The intended use of the land is at a
commercial production level considering irrigated agriculture. The consideration includes
infrastructure requirements, however it does not include labour intensity as such, but
rather an analysis of population data for an indication of available workforce.
5.4. Overview of methodology
This study employed the techniques of Geographic Information Systems (GIS) and
Remote Sensing (RS) to evaluate land for the purpose of sugarcane cultivation for
bioenergy. The project took an evolutionary approach to the methodology, whereby the
methodological procedure was continuously developed and refined throughout the course
of the project. The initial step in the methodology was the identification of areas suitable
for sugarcane cultivation in the study area. This was achieved by using remotely sensed
data which identified areas suitable for sugarcane cultivation based on the spectral
signature of sugarcane in the electromagnetic spectrum. However, the dataset does not
consider current land use and protected areas, and therefore additional datasets including
global land cover and protected areas had to be overlain with the initial dataset to filter
out overlapping areas. Areas that were filtered out were, protected areas, croplands
indicating areas currently under cultivation, as well as areas which would prove

63
biologically and agriculturally unsuitable for cane growth such as salt hardpans and
mangroves. For a complete list of filtered land cover classes, the reader is referred to
Chapter 6, section 6.3.
The remaining areas were then analysed in a broad socio-economic context using
population characteristics and proximity to transport infrastructure (road and rail). This
step gave an indication of the viability of establishing an area for sugarcane cultivation,
as transport infrastructure is an indication of land quality (FAO, 2007). An efficient
transport network is essential for transporting cultivated cane to the mill, as well as
transporting farming goods and agricultural produce into and out of the cultivated area.
Population data is an indication of the workforce available to the selected agricultural
areas.
As the study is based on identifying suitable areas for irrigated agriculture, the
identification of water sources, was essential. Irrigated agriculture is gaining an
increasing importance especially in the light of global climate change where rainfall
patterns are predicted to decrease and become erratic (Hulme et al., 2001). Thus,
irrigation would prove a more reliable means of meeting crop water requirements.
However, prior to considering irrigated agriculture, factors such as slope, soil type and
distance to water source require consideration. These factors will influence the cost and
type of irrigation system installed and hence have a bearing on the overall value of the
irrigated land (Dumler and Rogers, 2006; Lecler, 2007; pers. comm.). More specifically,
the factors to consider when deciding on an irrigation system are (Dumler and Rogers,
2006):
- Available capital
- Available labour during the growing season
- Well capacity
- Topography of the field
- Soil type
- Pumping cost, and

64
- In which type of irrigation system do management expertise have the most knowledge
and experience
However, this study does not provide an inventory of the economics associated with
irrigation and thus, only considers distance to water sources (which has implications for
pumping costs) and topography of the field in terms of percent slope. Dr. Neil Lecler, a
senior research engineer at the South African Sugar Research Institute (2007, pers.
comm.) suggested that these calculations would best assist a stake-holder in deciding
what are the constraints and costs as per their specific circumstances. There is no definite
threshold (in terms of distance to water source and slope) at which irrigation is either
‘feasible’ or ‘not feasible’, rather it is up to a stake-holder’s specific circumstances that
decides on the constraints to irrigation (Lecler, 2007; pers. comm.)
5.5. Tools for Evaluation
5.5.1. Geographic Information Systems
Geographic information systems (GIS) is a technological framework that enables analysis
and manipulation of spatial data. It can provide information on relationships and trends
between spatial features in a geographic area. GIS is therefore defined as a “computer-
based system for the capture, storage, retrieval, analysis and display of spatial data”
(Skidmore, 2002). Its spatial analytical capabilities makes it a convenient tool for land
suitability analysis, presenting results in the form of maps and reports which can be
meaningful to a local user (Boonyanuphap et al., 2004). GIS proves useful in meeting the
objectives of a land suitability assessment, such as constructing geographical databases
for land suitability, assessing land suitability as well as the selection of new areas for crop
plantations. For these reasons several land suitability studies have employed GIS as the
main data processing and analytical tool (Schulze et al., 1997; Ghaffari et al., 2000;
Bezuidenhout and Gers, 2002; Rasheed et al., 2003; Boonyanuphap et al., 2004; FAO,
2004a).
In this study, the GIS software used was ESRI® ArcMap™ (version 9.2). It provides a
multitude of analytical procedures, with the ability to process and display both raster and

65
vector datasets successfully. Remotely sensed data such as land cover maps, and Digital
Elevation Models (DEM) are examples of raster datasets, which are characterised by grid
cells of uniform size. On the other hand, vector datasets include point, line or polygon
features such as population nodes, rivers, and land parcels.
5.5.2. Remote Sensing
Remote sensing is collectively referred to as the collection and interpretation of
information about an object or area without being in physical contact with that object
(Campbell, 1996; Sanderson, 2003). This involves the use of platforms such as aircrafts
and satellites utilising different portions of the electromagnetic (EM) spectrum to gather
information about the natural environment. The physical basis underlying remote sensing
is concerned with the EM spectrum and the way in which emitted illumination interacts
with the surface of objects. Therefore, the central hypothesis of remote sensing is that
radiation reflected from a surface of an object carries information about that object and
the state of its surface (Myneni et al., 1995). The reflectance of radiation from different
objects varies over the range of wavelengths in the EM spectrum which helps in
differentiating between land covers, e.g. soil, water and vegetation (Sanderson, 2003).
Different surface materials reflect radiation differently and this is referred to as the
spectral signature of the object. Therefore, a material can be identified by its unique
spectral response in the EM spectrum. Vegetation for example, can be distinguished from
other land cover types due to its characteristically high reflectance in the near infrared
region and much lower reflectance in the visible region of the EM spectrum. In addition,
there exists a difference in reflectance in the near infrared and visible region between
vegetation types, which is exploited in vegetation or crop identification.
This study utilises this feature of remote sensing in identifying areas suitable for
sugarcane cultivation as well as assessing land cover types in the study area.

66
5.6. Assumptions and limitations regarding the data and project
It is imperative to provide a list of assumptions regarding the project, as these inevitably
influenced the way in which the results were interpreted. Data limitations are also
included so as to highlight concerns with the data used in the project.
1. Railroads - It is assumed in this study, that railroads within each site could be
dedicated to loading agricultural produce and processed material (including ethanol).
Specifically, trains may stop at designated points at a distance from the agricultural
area to load sugarcane and other by-products. Use of the rail line could be shared
between transporting passengers or for other uses perhaps once or twice a week
passing through the selected areas, with the remainder of the week dedicated to
transporting sugarcane and its by-products. Similar situations pertain to the uMfolozi
flats and Felixton (Watson, 2007; pers. comm.) and thus, such an assumption may
prove practical.
2. Existing sugarcane farms – The precise geographic locations of existing sugarcane
farms in the study area are not known. It is assumed that existing farms are included
in the cropland fraction of the GLC 2000 land cover database and as noted in section
5.4. were filtered out. Makenete (2007), estimated that 9 500 hectares of land were
under sugarcane cultivation in the country in 2004.
3. The factor of climate change has not been explicitly addressed in this study, thus it is
assumed that the areas identified as suitable for sugarcane cultivation pertain to
current climatic scenarios.
4. As it was beyond the scope of the project, land tenure and land reform have not been
addressed.
5. Land mines – During the civil war landmines restricted agriculture in certain areas.
They impose a constraint on the expansion of cropped area, such as in Bimbi in
Huambo (FAO, 2006). However, the FAO (2006) reports that there has been a
continuing clearing of landmines, which has led to the slight expansion of cropped
area. Areas with landmines have not been addressed in this study and thus, it is
assumed that landmines are not an issue in the selected areas. This may be a very

67
naïve assumption, however due to the lack of such data it is not feasible to factor this
into the land suitability assessment.
6. Legislation concerning water use for irrigation has not been dealt with. However, it is
known that notwithstanding the Land Law and Water Law, no specific policy, law or
legislation has been drafted for the field of irrigation; as per 2005 data (NEPAD-
FAO, 2005).
7. Reliability of data
• GLC 2000 - It is acknowledged that all data carries a level of uncertainty. For
example, the study area is noted for its abundant mangroves in Cabinda and
Cuanza floodplains, Mussulo Restinga, Lucula, Lucunga and M’bridge river-
mouths with a total surface area of 700-1250 km2 (UNEP, 2007). However, this
vast expanse of mangroves was not identified in the GLC 2000 dataset. It is likely
that the mangroves were not shown by the GLC 2000 because they are not a
dominant surface in the pixel distribution, as they may occupy a long narrow strip
rather than dense broad areas. It is possible that the final assessment of suitable
areas may overlap with mangroves, and the necessity of a site visit becomes
essential in verifying the accuracy of the resulting suitable areas. The resolution
of the GLC 2000 dataset is 1 km2, which may be considered as coarse, and thus,
narrow strips of mangroves or vegetation are likely to feature in datasets of higher
resolution. However, as this study was conducted on a broad level with the study
area spanning the whole of Angola, coarse resolution imagery was considered as
more than sufficient in narrowing down Angola’s vast expanse of agricultural
land to areas that are suitable for sugarcane cultivation.
• Protected areas - Following perusal of the protected area site details in Angola
using the UNEP-WCMC world database on protected areas website
(http://sea.unep-wcmc.org/wdpa), a few discrepancies became apparent in the
WDPA 2006 database. The site details listed on the website are a 2007 update and
identify an additional three protected areas in Angola which are not listed and
shown in the WDPA 2006 database. These include the Namibe Partial Reserve,
Mucosso Hunting Reserve and the Illheu dos Passaros Integral Nature Reserve
68
which collectively adds a further 29 606 km2 to the national protected areas. It is
likely that these areas will be included in the WDPA 2007 database. However, all
analyses and calculations have been made according to the protected areas listed
in the WDPA 2006 database.
5.7. Data sources
All datasets used in this study were in digital format and are available in the public
domain with the exception of the ESRI® Data & Maps 2006 media kit. It is imperative to
note that high resolution and accurate data for the African continent is difficult to obtain,
however, as this study analyses suitability across the Angolan country, data of 1 km2 is
considered adequate. Such resolution may not be considered as high, however when
assessing suitability on a broad scale such as county level, coarse resolution data is
adequate. In general, the accuracy and precision of results most definitely varies with the
quality of data. In comparison to previous studies (Schulze et al., 1997; FAO, 2004a) the
data used in this study affords a higher level of confidence in the accuracy of the results
obtained. Specifically, resolution of data used by Shulze et al., (1997) in identifying
areas climatically suitable for sugarcane cultivation in South Africa was 2 km2, whilst the
FAO (2004a) used much coarser resolution data (10 km2) which makes it difficult to
pinpoint areas suitable for sugarcane expansion as each pixel of the dataset represents an
area of 10 km2. As such, comparatively, the data used in the present study is considered
as sufficient. Furthermore, considering the datasets available in the public domain, the
GLC 2000 dataset is undoubtedly the best option.
5.7.1. Land cover
Sustainable land management requires an assessment of the current land cover of the area
of interest and as such land cover information becomes an essential tool for development
planning and management of the territory (FAO, 2002a). It gives an indication of the
current coverage of a particular area, and in addition to the types of vegetation that may
cover a certain area, land cover types such as cities, water bodies and built up areas are
also included. Sustainable land management is made possible by land cover information

69
by avoiding the cultivation or development in areas which are already under use for a
specific purpose or are of biological and ecological significance.
Remote sensing provides the most cost-effective and accurate means to obtain global land
cover information. In addition, satellite remote sensing records information in various
wavelengths which provides accurate information on ground conditions (FAO, 2002a).
Two land cover databases were used in this study to identify potentially suitable areas for
sugarcane cultivation as well as to remove areas of overlap between suitable areas for
sugarcane cultivation and specific land cover types (areas which are agriculturally
unsuitable and unavailable for sugarcane cultivation). The International Geosphere
Biosphere Programme (IGBP) 1 km2 Land Cover Product (1997) raster land cover
dataset was produced by the U.S. Geological Survey's (USGS) Earth Resources
Observation System (EROS) Data Centre, the Joint Research Centre of the European
Commission (JRC) and the University of Nebraska-Lincoln. Data was derived from 1km2
Advanced Very High Resolution Radiometer (AVHRR) with a temporal resolution
spanning a twelve month period (April 1992-March 1993) to delineate seasonal land
cover regions (SLCR) for the African continent. The database forms part of the
MIOMBO network (1996) which aimed at compiling data from the international and
regional communities and making them available to the regional community at large. In
order to delineate seasonal land cover regions, the MIOMBO network conducted a
multitemporal unsupervised classification of NDVI (normalised difference vegetation
index). This classification was used to identify natural groupings of pixels with similar
NDVI properties. The NDVI is a vegetation index using the characteristic high
reflectance of vegetation in the near-infrared region of EM spectrum and low reflectance
in the red region (Sanderson, 2003). The IGPB database provided the starting point of
this project by indicating areas that are potentially suitable for sugarcane cultivation.
A previous study conducted by Baijnath (2005) examined the extent to which the
MIOMBO dataset accurately represented existing sugarcane cultivated areas. The
MIOMBO dataset was overlain with the Bezuidenhout and Gers (2002) and Schulze et
al., (1997) datasets to examine how accurately it represented existing sugarcane
cultivated in South Africa. Following this analysis, it was found that with the exception

70
of a few additional areas near Tzaneen, Volksrust, Louis Trichardt and Ermelo; the
MIOMBO dataset overlapped with the datasets. The analysis resulted in an 88%
correlation between the MIOMBO dataset and areas where sugarcane is currently grown
in South Africa. By using the example of South Africa it was assumed that other areas
identified in the MIOMBO dataset were also potentially suitable for sugarcane
cultivation. Baijnath (2005) further interrogated the areas represented by the MIOMBO
dataset by using climatic, rainfall and soils data, as well as altitude. This was done for the
countries Malawi, Mozambique, Tanzania and Zambia, and based on these biophysical
characteristics it was verified that the areas identified as potentially suitable for sugarcane
cultivation by the MIOMBO dataset were indeed suitable.
Following Baijnath’s (2005) verification, it was not necessary in this study to further
analyse the potentially suitable areas (identified by the MIOMBO dataset) in terms of
climate, rainfall and soil data.
The Global Land Cover Project 2000 (GLC 2000) was used to remove areas of overlap
between suitable areas (SLCR) and specific land cover types. The land cover
classification was produced by the Global Vegetation Monitoring Unit of the European
Commission Joint Research Centre for the year 2000 at a spatial resolution of 1 km2. The
aim of the project was to provide accurate baseline land cover information to the
International Conventions on Climate Change, the Convention to Combat Desertification,
the Ramsar Convention and the Kyoto Protocol. Data was recorded using the vegetation
sensor on board the SPOT4 satellite, and was classified using the Land Cover
Classification System (LCCS) produced by the FAO (Di Gregorio and Jansen, 2000). The
GLC 2000 dataset was supplemented by the Global Built-up Areas (2006) dataset, which
is a set of vector polygons delineating urban sprawls of the major cities and towns of the
world.
5.7.2. Protected areas
The IUCN definition of a protected area developed at the IVth World Congress on
National Parks and Protected Areas in 1992 is:

71
“An area of land and/or sea especially dedicated to the protection and maintenance
of biological diversity, and of natural and associated cultural resources, and
managed through legal or other effective means.” (UNEP-WCMC, 2006).
Identifying protected areas is seen as a major tool in protecting biodiversity and
conserving species and ecosystems as they provide a range of goods and services which
are essential to the sustainable use of natural resources (UNEP-WCMC, 2006).
Information on protected areas is therefore crucial in enabling a wide range of
conservation and development activities (UNEP-WCMC, 2006). There is wide variation
in the types of protected areas and degree of protection, often influenced by a country’s
national needs and priorities. Sites may be protected on an international level recognised
by international conventions or agreements such as Biosphere Reserves, RAMSAR and
World Heritage Sites (UNEP-WCMC, 2006). Sites may also be protected at the national
level, which maybe uncategorised, or categorised using the six protected area IUCN
management categories (I-VI) which identifies strict nature reserves, wilderness areas,
national parks, natural monuments, Habitat or Species Management Areas, Protected
Landscape or Seascape Managed Resource Protected Areas (UNEP-WCMC, 2006).
Uncategorised protected areas at the National level are those areas which are not assigned
IUCN classification and a designated status, and may include those areas which are being
proposed for protection or areas with incomplete or inaccurate information (WDPA,
2006). Protected areas without categories does in no way reduce the importance of those
areas (Chape et al., 2003).
This study used the 2006 World Database on Protected Areas released at the 8th
Conference of the Parties to the Convention on Biological Diversity (CBD) in March
2006. It is a vector dataset provided as a set of GIS layers with a nominal scale of
1:1 000 000 with various national scales. It is the most recent documentation of protected

72
areas and according to UNEP-WCMC (2006), it is “the most complete compilation of
protected areas data available”.
5.7.3. Roads, Railroads and Rivers
The roads and railroads polyline vector datasets were obtained from the BioGeomancer
Project (2005-2007) which is a worldwide collaboration of natural history and geospatial
experts. The primary goal of the project is to “maximize the quality and quantity of
biodiversity data that can be mapped in support of scientific research, planning,
conservation, and management” (http://www.biogeomancer.org/). The rivers, polyline vector dataset was obtained from the GIS Library of the Southern
African Humanitarian Information Management (2003-2005). Specifically, contribution
to the Angolan dataset was made by The Angolan Demining Unit and UNDP-CNIDAH
(National Inter-Sectoral Commission for Demining and Humanitarian Assistance).
5.7.4. Digital Elevation Model (DEM) and Population data
Elevation and population data was obtained from The ESRI® Data & Maps 2006 media
kit which is a set of data available with ESRI® ArcGIS 9.2. Elevation data is represented
as a 30 Arc seconds global DEM (GTOPO30) developed by the United States Geological
Survey Earth Resources Observation System (EROS) Data Centre in 1996. It has a spatial
resolution of 1 km2. Population data is represented by a State-Province layer and is a
symbolized and labeled display presentation of the World administrative units data set.
5.8. Steps in methodology
The methodology followed in this study was largely GIS-based. In order to impart a
systematic assessment of all datasets, the methodology followed a three phase process as
shown in Figure 5.1.
5.8.1 Phase I
Following the acquisition of relevant datasets, the initial phase entailed the selection and
overlaying of specific land cover types. By use of the raster calculator, a feature of the
Spatial Analyst extension, pixels corresponding to the spectral signature of sugarcane

73
(SLCR pixels) were selected from the IGBP 1km2 Land Cover Product dataset. The result
formed the basis of the analysis upon which further datasets were overlain and filtered
against. Similarly, specific land cover types were selected from the GLC 2000 land cover
dataset which included bare rock, cities, closed deciduous forest, cropland > 50%,
irrigated crops, tree crops, evergreen lowland forest and waterbodies. The land cover
types, global built-up areas and the SLCR pixels were overlain and areas of overlap were
removed from the distribution of SLCR pixels. The remaining SLCR pixels were then
overlain with the WDPA 2006 protected areas vector dataset. By means of the ‘select by
location’ and ‘Data management’ tools, SLCR pixels that overlapped with the protected
areas layer were subsequently removed. This ensured that the remaining distribution of
SLCR pixels which fell within unsuitable, unavailable and protected areas were removed
and not included in any further analysis. A further selection process was conducted by
filtering out SLCR pixels which were located in areas with slopes greater than 16%. This
was achieved by using the Spatial Analyst extension of ArcMap™. The remaining
distribution of SLCR pixels from Phase I was subject to reselection in Phase II.
5.8.2 Phase II
This phase constituted reselection of SLCR pixels using non-biophysical factors. Phase II
resulted in the selection of three suitable regions within the study area which was selected
by overlaying the roads with the SLCR pixels. Using a purposive3 sampling method,
pixels which were in close proximity to primary roads and areas greater than 10 000
hectares were selected as suitable. Primary roads were chosen due to the infrastructural
capacity it offers to transport goods into and out of the suitable area to major cities.
Intraplantation transport would make use of the secondary and tertiary roads, which is
well distributed in Angola (c.f. Appendix B). The choice of primary roads affords an area
the option of using either intraplantation or inter-area transport. As it is not the aim of the
project to determine which transportation scenario is most cost-effective and practical for
3 Purposive sampling, is a sampling method used to select subjects or areas based on some characteristic, i.e. sampling with a predefined purpose (Patton, 1990). This sampling method is popular in qualitative research, and is categorised by various types. One type of purposive sampling, which is employed in this study, is criterion purposive sampling which selects samples based on some criterion (Patton, 1990). In this study proximity to roads and areas greater than 10 000 hectares were the criteria in selecting areas suitable for sugarcane cultivation, that would prove most viable.

74
the selected areas, areas are given an option of using either scenario, hence the criterion
of proximity to primary roads. The threshold area of at least 10 000 hectares is seen as
most feasible for establishing sugarcane farms on a commercial level (Watson, 2007;
pers. comm.). Pixels falling outside these criteria were excluded from any further
consideration.
5.8.3 Phase III
The resulting distribution of SLCR pixels from Phase II were analysed in a broad socio-
economic context. This was achieved by inspecting the three selected areas in terms of
distance to roads, railroads and rivers. Additionally, the overall topography was assessed
by calculating slope (in percentage) from the DEM using the Spatial Analyst extension.
The distance of each point to the roads, railroads and rivers was calculated by means of a
spatial join between the SLCR points and the target layers. By using this function, each
pixel was given all the attributes of the point in the target layer being joined that is closest
to it, i.e. the distance from each point was calculated to the nearest road, railroad and
river. Prior to the analysis, the raster SLCR pixels were converted to vector points, purely
for simplicity of analysis.
The final step in Phase III involved interrogation of population information of each of the
selected areas. This constituted the social context surrounding each of the selected areas
and gave an indication of the potential work force available to the selected areas.
5.9. Verification of areas suitable for sugarcane cultivation using Google Earth®
The author of the present study, commissioned a study using Google Earth®, to verify
the suitability of the areas identified as potentially suitable for sugarcane, by the
MIOMBO dataset, in the study area. Google Earth®, a product of Google®, is a virtual
globe GIS program that combines satellite imagery, maps and 3D flights through cities
and several tourists locations (Schele, 2007). The level of detail viewed using this
application is considered to be at street level, thus, it is possible to view individual
settlements, areas under agriculture and forested areas (http://earth.google.com).
However, an inherent limitation of the application is the subjectivity which the analyst
75
has to impose in order to interpret the images. For example, it is possible to view land
that is under agriculture, but it is not possible to distinguish between vegetation types
(Schele, 2007).
Schele (2007) used 130 180 hectares from the MIOMBO dataset, representing land that is
suitable for sugarcane cultivation in Angola. This distribution had already undergone a
series of filtering steps using protected areas and GLC 2000. Thus, these areas were
identified by the author of the present study as being suitable for sugarcane cultivation
without environmental constraints. Of these areas, 90 pixels (9000 hectares) were
randomly selected and analysed using Google Earth®. Results from Schele’s (2007)
study show that several ‘suitable areas’ are in fact located directly on what appears to be
human habitation. Findings indicate that out of a total of 130 180 hectares of land as
identified as suitable for sugarcane cultivation, only 65 580 hectares did not fall on
inhabited areas and was thus considered as most suitable for sugarcane cultivation.
Results from the study conducted by Schele (2007) undoubtedly emphasise the
importance of high resolution data and field verification of the suggested areas.
Nonetheless, areas identified as suitable using the methodology outlined above served to
effectively narrow down Angola’s vast expanse of agricultural land to areas which would
be most suitable for sugarcane cultivation.
5.10. Conclusion
The present chapter outlined the methodology employed in the land suitability analysis. It
further highlighted relevant assumptions about the project and limitations regarding the
data used. A detailed inventory of the steps followed in the analysis is also provided. The
following chapter presents and discusses the results obtained using the specified
methodology.

76
Data AcquisitionGIS Datasets
Identification of Study Area (Angola)
Selection of suitable areasCriteria: proximity to roads, areas > 10 000 ha
SLCR pixels
OVERLAY
Roads
Reselection
Removeoverlapping
areas
Selection
OVERLAY
IGBP
GLC2000
SLCRpixels
SLCR pixels(sugarcane)
Global Built-up areas
Land cover types
Protected Areas
Slopes > 16%
Socio-economicConsiderations
Indication of theviability of placing anarea under sugarcane
cultivation
SelectedArea 1
SelectedArea 2
SelectedArea 3
• Overlay: DEM, railroads &river
• Calculated distance to roads,railroads & rivers
• Population data
Phase IPhase IIPhase III
Figure 5.1. Flow diagram summarising Phases I, II, and III

77

77
Chapter 6 Results and Discussion
6.1. Introduction
The previous chapter outlined the methodological approach and methodology followed to
yield results for the land suitability assessment for sugarcane. The following sections in
this chapter present the results obtained and provides a discussion of these results.
Specifically, the areas which are suitable for sugarcane cultivation without environmental
constraints will be shown. This will be followed by the presentation of selected areas
suitable for sugarcane cultivation based on non-biophysical considerations.
6.2. Seasonal Land Cover Regions
From the Miombo Network IGBP 1 km2 Land Cover Product, areas that were identified
as sugarcane were extracted. The resulting distribution of pixels are an indication of areas
likely to be under sugarcane cultivation or under vegetation with similar phenology and
production levels as sugarcane. As such these SLCR pixels are areas which are
potentially suitably for sugarcane cultivation.
In Angola, 1.3% (16 262 km2) of the total land area was identified as being potentially
suitable for sugarcane cultivation (Figure 6.1.). It may appear that only a small area of
Angola is suitable for sugarcane cultivation, however, considering that the amount of
land required for cultivation on a commercial level is 100 km2 (10 000 hectares), the
identified suitable areas indicate a potential 162 commercial ventures. Thus, the areas
identified as being suitable for sugarcane cultivation are indeed promising for
commercial cultivation.
Distribution of pixels within the study area is not uniform, with an aggregation of suitable
areas in the more westerly provinces of Bengo, Cuanza Norte, Cuanza Sul, Humbo, Bie,
Huila and Cuando Cubango. (The reader is referred to Chapter 4, Figure 4.1. for a better
understanding on the location of Angola’s provinces). The reason for this is possibly due
to the type of biomes that exist in those regions. Interestingly, SLCR pixels are mainly

78
distributed in the Tropical and Subtropical Grasslands, Shrubs and Savannas, as well as
the Montane Grasslands and Shrublands terrestrial biomes (Appendix A).
The Tropical and Subtropical Grasslands, Shrubs and Savannas biome occurs in the
semi-arid to semi-humid climate of tropical and subtropical regions and is well known for
its predominant grasslands. Furthermore, it is also well suited for perennial plants such as
sugarcane. The Montane Grasslands and Shrublands biome is another grassland biome
also containing shrublands found in the tropical, subtropical and temperate regions of the
world (WWF, 2007). As sugarcane is most suited to tropical climates, the distribution of
SLCR pixels in these regions is understandable (Sharpe, 1998). Based on this initial
distribution of SLCR pixels, it can be seen that the Miombo Network IGBP 1 km2 Land
Cover Product has included vegetation of similar production levels and phenology to
sugarcane in this classification. Therefore, the results are in agreement with the
suggestions of Sys et al., (1993), that it is possible that other C4 plants which have growth
production levels similar to sugarcane were also included among this initial distribution
of SLCR pixels.

79
Figure 6.1. Distribution of SLCR pixels in Angola
hg Luanda
24°0'0"E
24°0'0"E
22°0'0"E
22°0'0"E
20°0'0"E
20°0'0"E
18°0'0"E
18°0'0"E
16°0'0"E
16°0'0"E
14°0'0"E
14°0'0"E
12°0'0"E
12°0'0"E
6°0'0"S 6°0'0"S
8°0'0"S 8°0'0"S
10°0'0"S 10°0'0"S
12°0'0"S 12°0'0"S
14°0'0"S 14°0'0"S
16°0'0"S 16°0'0"S
18°0'0"S 18°0'0"S
20°0'0"S 20°0'0"S
22°0'0"S 22°0'0"S
24°0'0"S 24°0'0"S
LegendSLCR pixels
−
D_WGS_1984
0 100 200 300 40050Kilometers

80
6.3. Protected Areas
It is estimated that protected areas cover more than 12% of the world’s land area. These
include areas of “extraordinary species and ecosystems, irreplaceable examples of
cultural and natural heritage, and refuges of peace and spirituality” (Wells and McShane,
2004). As such, protected areas become the foundation of managing and conserving the
world’s biodiversity as well as the numerous market and non-market benefits provided by
these natural systems (Bruner et al., 2004). This imperative was echoed by the 1987
Brundtland report, “Our Common Future”, in which the conservation of species and
ecosystems featured highly amongst its list of priorities (Westley et al., 1998). This
popular report therefore, became the start of a paradigm shift towards the concept of
sustainability, and as such the designation of protected areas have no doubt played a
critical role towards realising this shift.
In order to uphold and promote the concept of sustainability in this project, SLCR pixels
which were located in protected areas were removed from the initial distribution and
excluded from any further suitability analyses. Further reasons for removing overlapping
SLCR pixels with protected areas are highlighted in Chapter 5, section 5.6.2. According
to the 2006 WDPA database, 7.9% (98 510 km2) of Angola’s total land area is protected.
Figure 6.2. shows that of this total area, national parks, partial/integral nature reserves
and habitat/species management areas constitute 81 810 km2, which constitutes
categories II, VI and V respectively.

81
Figure 6.2. Area occupied by each protected area category in Angola
The remainder of the protected areas (16 700 km2) is occupied by the Coutada da Pública
da Luengue Hunting Reserve located in the south-eastern province of Cuando Cubango
(Figure 6.3.) (http://sea.unep-wcmc.org/wdpa). Table 6.1. shows that 2310 km2 SLCR
pixels currently located in protected areas were filtered out. This reduced the total area
potentially suitable for sugarcane cultivation by 14%. Figure 6.3. shows the spatial
distribution of protected areas within Angola and the distribution of SLCR pixels after
removing overlapping areas is presented in Figure 6.4.
Table 6.1. Area of overlapping SLCR pixels filtered out of protected areas
Protected Area Area of filtered SLCR pixels (km2)
National Areas (Categorised I-VI) 1692
National Areas (Uncategorised) 618
Total 2310
It is imperative to manage the use of protected areas especially in relation to population
pressure and cultivation. Undoubtedly, expanding population places pressures upon
National areas (Categorised I-VI) National areas (Uncategorised)0
20000
40000
60000
80000
100000
Area (km2)

82
protected areas and this is thought to be instigated to a large extent by the need for
agricultural expansion (Madulu, 2001). It is suggested that this expansion of agriculture
for commodity production is an integral cause of habitat conversion (Niesten et al.,
2005). This trend is particularly noted in developing countries where areas dedicated to
soybean, oil palm, cocoa and coffee have doubled over the past three decades (Verweij
and de Man, 2005). Coupled with growing agricultural demand as a result of booming
population growth, protection measures therefore become essential, especially in regions
of high biodiversity. This is particularly relevant in Angola, as post-civil war the country
is in a state of rebuilding its infrastructure of which agricultural expansion is an essential
contribution. Furthermore, agriculture in the country is mainly rural, a family-labour
activity for smallholder subsistence peasants with 85% of the population engaged in
agriculture (FAO, 2006; CIA, 2007). Thus, population growth coupled with agricultural
expansion makes it even more imperative to efficiently manage Angola’s protected areas.
For these reasons, SLCR pixels which fell within protected areas were not considered, as
cultivation within those areas would indeed refute sustainability.
Where such linkages between the environment and population occur, it becomes
imperative in incorporating demographic considerations into the management and land
use plans of protected areas (Madulu, 2001). Specifically, by using the example of the
Swagaswaga Game Reserve (SGR) in Tanzania it can be seen how essential such
considerations are.
With Tanzania’s population increasing at a rate of 3% annually, total population is
expected to double from 30 million to 60 million by the year 2020 (PRB, 1997; cited in
Mwamfupe, 1998, pg. 3). Population growth has increased the need for resources such as
land for cultivation and grazing consequently leading to deforestation and encroachment
of protected areas. Particularly, the reality of this pressure has become evident in SGR.
The SGR combines the former Songa Forest Reserve, Simbo, Swagaswaga and Handa
forests as well as other adjacent forests (Madulu, 2001). The main objectives of
protecting the reserve are avoiding soil erosion on hill slopes and protecting pasture and

83
habitat of various wildlife species found in that area. The main economic activity
conducted in villages adjacent to the SGR is subsistence crop cultivation with finger
millet as the main crop. The local community surrounding SGR are aware of the
restricted activities within the reserve such as tree felling, illegal hunting, illegal logging,
however, even though cultivation is the most destructive human activity in the game
reserve, it is not regarded as restricted by the local people. The main reason for this is that
cultivation inside the game reserve is seen as a survival strategy during drought years and
as such becomes an essential means of supporting rural livelihood (Madulu, 2001).
According to Mwamfupe (1998), such encroachments into protected areas is seen as an
act of desperation. However a means by which to promote sustainable use is the
encouragement of collaborative participation between the political sector and local
communities. As sustainable development has to be both people-centred and conservation
based, for effective protected area management and expansion, a balance between the two
has to be established.
According to the FAO-IIASA (2007) study, ‘Mapping biophysical factors that influence
agricultural production and rural vulnerability’ the Coutada da Pública da Luengue
Hunting Reserve (Figure 6.3.) in the Angolan province Cuando Cubango is a protected
area which has been mapped as being an area where agriculture is likely. Since 618 km2
of SLCR pixels were filtered out from this area (Table 6.1.), the considerations
mentioned in this section become of particular significance in the management and
sustainable use of the nature reserve. Cuando Cubango is considered as one of Angola’s
least developed provinces as it still bears the scars of war (CAAEI, 2007). The population
in this province is mainly engaged in agriculture and animal husbandry, and due to
population growth and need for additional agricultural land, encroachment into the
reserve is possible (FAO, 2006).

84
Figure 6.3. Distribution of SLCR pixels within IUCN protected areas
−
0 120 240 360 48060Kilometers
LegendSLCR pixels
National protected areas (Uncategorised)
National protected areas (Categorised I-VI)D_WGS_1984
Coutada da Pública da Luengue

85
Figure 6.4. Distribution of SLCR pixels after filtering out protected areas
LegendSLCR pixels
−
0 0.9 1.8 2.7 3.60.45Kilometers
D_WGS_1984

86
6.4. Global Land Cover
SLCR pixels which overlapped with land cover types that are considered unsuitable for
sugarcane cultivation were removed. The basis of these land cover types being
considered unsuitable is solely on ecological grounds, such that some land cover types
such as swamps and salt hardpans are considered too moist and too saline for sugarcane
cultivation, respectively. Land cover types such as croplands > 50%, closed deciduous
forests, evergreen lowland forests, cities, built-up areas and waterbodies are areas which
are considered unavailable for sugarcane cultivation. These areas are considered
unavailable for cultivation from a sustainability viewpoint. Specifically, the ‘food versus
fuel’ debate (discussed in Chapter 2) makes it essential to identify and highlight areas of
current crop cultivation so as to not encroach upon already existing cropland for
bioenergy purposes. Furthermore, the contentious issue of oil palm induced deforestation
in SouthEast Asia (discussed in Chapter 2), makes it imperative to designate forests as
unavailable for sugarcane cultivation for bioenergy purposes.
Land cover classes filtered out in this study are listed in Table 6.2. which also shows the
area and percentage occupied by each class in the study area and the area of overlapping
SLCR pixels in each land cover class. The distribution of SLCR pixels overlapping with
the chosen land cover classes is shown in Figure 6.5. A total of 33.6% of Angola was
filtered out as ecologically unsuitable and unavailable for sugarcane cultivation,
corresponding to the land cover classes listed in Table 6.2. The land cover occupying the
largest area in Angola (322 403 km2) are the closed deciduous forests which are located
in the central to eastern region. In conjunction with the evergreen lowland forest, sub-
montane and montane forests the total filtered out forest cover is equivalent to 344 214
km2, equating to 28% of the country’s total land area. However, perusal of the literature
reveals several sources that indicate that forests cover a much larger area of Angola.
Examples of these sources are FAO (2002b), Global Forest Watch (2007) and Johnson
and Rosillo-Calle (2007), which indicate that 697 560 km2, approximately 56% of the
country’s total land area is covered by forests. The difference between the forest area
identified in this study and those identified by those authors is likely to be due to how
forests are defined. Specifically, the FAO define forests as “Land spanning more than 0.5

87
hectares with trees higher than 5 meters and a canopy cover of more than 10 percent, or
trees able to reach these thresholds in situ” (FAO, 2004b). On the other hand, the GLC
2000 defines forests (including closed deciduous and evergreen lowland forests) with a
tree canopy cover greater than 70% and a height greater than 5m (European Commission
Joint Research Centre, 2003). By comparing the two definitions it can be understood why
there is such a difference in the reported forest areas in Angola. Furthermore, the GLC
uses a higher resolution data of 1 km2 whereas for example, the FAO (2002b) uses a
much lower resolution data. Owing to the higher resolution of the GLC 2000 land cover
database, it is likely that all SLCR pixels which were located in forest areas have been
removed. However, it is acknowledged that with higher resolution data (for example 1m,
2.5m, 5m, or 10m), accuracy of filtering out overlapping areas would be greatly
increased.
The Angolans consider their forests as a treasured natural resource providing both wood
and non-wood products. It has socio-economic value and underlying significance for the
welfare of the people and to the national economy (EC-FAO, 1999). In addition to
production of timber, forests have provided other products which are used daily for food,
medicinal and other purposes (EC-FAO, 1999). These include honey, wax, medicinal
plants and bushmeat. Thus, ensuring that cultivation for bioenergy purposes does not
instigate deforestation is a critical sustainability concern, especially since one of the main
environmental concerns in Angola is deforestation which is occurring at an annual rate of
0.2% (FAO, 2002b). Forests, in general provide other essential functions which included
mitigating climate change (by reflecting less heat back into the atmosphere), coastal
protection and acting as air-pollution filters (FAO, 2005a).

88
Table 6.2. Area occupied by each land cover class in Angola and number of
overlapping SLCR pixels filtered from each class
Land cover type Area occupied in
Angola (km2)
Percentage occupied of
total land area (%)
SLCR pixels filtered
in each class (km2)
Bare rock 5 716 0.42 0
Built-up areas 160 (*28) 0.01 7
Closed deciduous
forest
322 403 25.8 1610
Cropland > 50% 52 429 4.2 766
Cities 194 0.02 0
Evergreen lowland
forest
21 671 1.7 216
Montane forest 115 0.01 0
Salt hardpans 159 0.01 0
Sandy desert and
dunes
23 499 1.9 0
Stoney desert 4 393 0.4 0
Submontane forest 25 0.002 0
Swamp bushland and
grassland
6 831 0.55 16
Water bodies 365 0.03 0
Total 418 960 33.6 2 615
* number of built-up areas

89
Figure 6.5. Distribution of SLCR pixels within Global Land Cover classes
−
D_WGS_1984
0 1 2 3 40.5Kilometers
LegendSLCR pixelsBare rockBuilt up areasCitiesClosed Decidious ForestCropland > 50%Evergreen Lowland Forest
Montane ForestSalt hardpansSandy Desert and DunesStoney DesertSubmontane ForestSwamp bushland and grasslandWaterbodies

90
In addition, several ecological reasons supported the removal of overlapping SLCR pixels
with the chosen forest land cover classes. For example, the GLC 2000 defines montane
and sub-montane forests as “forests occurring at greater than 1000m above mean sea
level”. Considering the environmental factors influencing successful sugarcane
cultivation, reasons for excluding pixels which overlapped with montane and sub-
montane forests becomes clear. Altitude is one such factor which influences the growth
cycle of sugarcane, and therefore sugarcane is typically cultivated up to 1600m above sea
level. Even though there is a common range of 600m between the two definitions,
altitudes in excess of 1600m would prove not suitable for sugarcane cultivation.
However, it is not clear why forest areas would have areas with a spectral signature
equivalent to sugarcane, unless there are open patches in these areas supporting tall
grasses or reeds, or vegetation with similar phenology to that of sugarcane. It is
recommended that Google Earth® be used to investigate this phenomenon further.
Out of the several forest land cover classes, SLCR pixels (1610 km2) only overlapped
with closed deciduous forests and evergreen lowland forests (216 km2).
The second largest land cover class occupying Angola is that of croplands > 50%.
Currently, not more than 40 000 km2 (4 million hectares) of land are under crop
cultivation in Angola (Johnson and Rosillo-Calle, 2007; Makenete, 2007; Van Den Berg
and Rademakers, 2007); however the GLC 2000 land cover database has identified
52 429 km2 of cropland in Angola. This area exceeds the current area under cultivation
by a minimum of 10 000 km2. The European Commission Joint Research Centre (2003),
producers of the GLC 2000 land cover database, has acknowledged the difficulties
associated with the detection and mapping of agricultural systems in Africa using
remotely sensed data. Specifically, fields are small, and mixed savanna and fallows
“preclude a reliable mapping at a spatial resolution of 1 km2” (European Commission
Joint Research Centre, 2003). On the other hand, it is further suggested that, “the low
intensification level of agricultural techniques induces spectral or temporal properties of
agriculture close to the surrounding vegetation” (European Commission Joint Research
Centre, 2003). Thus, it is possible that the croplands identified by the GLC 2000, may

91
include areas which are not in reality under crop cultivation and may account for the
10 000 km2 cropland excess.
Another possible reason for this excess is that the cropland land cover class may have
included agricultural areas which constitutes 576 000 km2 (57.6 million hectares) in
Angola (Johnson and Rosillo-Calle, 2007). It is important to note that there exists a
difference between cultivated and agricultural areas; agricultural areas includes
temporary and permanent pastures and temporary and permanent crops whereas
cultivated areas exclude temporary and permanent pastures (Johnson and Rosillo-Calle,
2007). Since the European Commission Joint Research Centre (2003) defines croplands >
50% as areas of intensive cultivation with over 50% cultures or pastures, it is more than
likely that this land cover class includes a small portion of agricultural areas, thereby
accounting for the 10 000 km2 excess.
Out of the four agricultural land cover classes identified by the GLC 2000 (croplands >
50%, tree crops, irrigated crops and croplands mixed with open vegetation), only
croplands > 50% were identified in the study area, occupying 4.2% of the total land area.
A total of 766 km2 of SLCR pixels were found overlapping with croplands and were
subsequently removed. As previously mentioned, SLCR pixels are likely to include areas
under sugarcane cultivation, however, by filtering out overlapping SLCR pixels with the
cropland land cover class, most of the pixels corresponding to areas under sugarcane
cultivation would have been removed.
In addition, 16 km2 SLCR pixels were also found overlapping with swamp bushland and
grassland. This land cover class was considered not suitable for sugarcane growth as it
often has standing water in depressions due to the nature of its topography. Furthermore,
due to excessive water, swamp bushlands and grassland may prove harmful to sugarcane
yield production (Griffee, 2000).
Built-up areas made up the remaining overlapping pixels with 7 km2 overlapping SLCR
pixels. It is interesting to note that no pixels overlapped with the cities land cover class

92
identified by the GLC 2000. For this reason, the global built-up areas database had to be
used as supplementary information on cities and built-up areas in the study area. The
underlying reason for removing overlapping SLCR pixels with cities and built-up areas
was to ensure that areas identified as suitable for sugarcane cultivation did not include
areas of human settlements. However, the inclusion of rural settlements would have
proven to be a more accurate representation of human settlements. Due to the lack of
such data at the level of the study area, this was excluded from the analysis. Therefore it
is possible that a percentage of SLCR pixels may actually fall within areas of human
settlements, which would require verification by higher resolution, higher precision and
up-to-date data.
In general, it has been acknowledged that there exists inherent challenges to the mapping
of urban and rural populations (FAO, 2005b). Some of the major challenges include a
lack of standard definitions of what constitutes an urban or rural area and the criteria used
to distinguish between the two. Imprecision of datasets currently available for
determining the location of human settlements (e.g. GLC 2000) is another challenge. In
addition, statistical information on population distributions varies on a country basis and
therefore lacks comparability (FAO, 2005b).
Other land cover classes included in the filtering process using the GLC 2000 included
bare rock, stoney desert, salt hardpans and water bodies. None of the SLCR pixels
overlapped in these land cover classes. However, the reason for excluding overlapping
pixels in these classes are related to ecological considerations, such that bare rock and
stoney desert are areas of erratic or inexistant rainfall (European Commission Joint
Research Centre, 2003). As such, conditions in these areas would prove too harsh for
sugarcane growth which is a highly water demanding crop (Hunsigi, 1993; cited in
Cornland et al., 2001, pp 34). Since sugarcane can tolerate only moderately saline
conditions, salt hardpans may prove too dry and saline for sugarcane. It has been noted
that as salinity increases, crop yields tend to decrease (Griffee, 2000).

93
The distribution of SLCR pixels after removing overlapping areas with the chosen land
cover classes is shown in Figure 6.6. A total of 2615 km2 of SLCR pixels were filtered
out due to overlap with the chosen land cover types. This further reduced the distribution
of areas potentially suitable to sugarcane cultivation by 30% (11 337 km2).
Since SLCR pixels were not located in most of the land cover classes, it further verifies
that both the GLC 2000 and MIOMBO datasets are indeed reliable. Specifically, as the
MIOMBO SLCR pixels are equivalent to the spectral signature of sugarcane, it has been
verified by these results that one would not expect to find a spectral signature of a surface
equivalent to sugarcane or similar grasses in bare rock, salt hardpans, sandy desert and
dunes, stoney desert, submontane forests, etc. The fact that SLCR pixels were filtered out
from built-up areas may reflect age differences of datasets such that it is likely that those
built-up areas were constructed after the MIOMBO dataset was used to identify seasonal
land cover regions (SLCR).

94
Figure 6.6. Distribution of SLCR pixels after removing areas overlapping with
Global Land Cover classes
LegendSLCR pixels
−
D_WGS_1984
0 1 2 3 40.5Kilometers

95
6.5. Terrain constraints
It is well established that sloping terrain poses more difficulties to cultivation than flat
land (Sys et al., 1991; Eldridge, 2004; FAO-IIASA, 2007). In addition, sloping terrain is
subject to higher rates of water run-off and soil erosion, and in general it is understood
that steeper the slope, the greater is the constraint to productivity potential (FAO-IIASA,
2007). According to Sys et al., (1991), this element of landform plays an essential role
especially when considering mechanised cultivation. Those authors suggest that for
slopes steeper than 20%, mechanisation becomes impossible and for slopes less than 20%
there still exists variations in productivity according to variations in slope. It is further
suggested by Navas and Machin (1997, cited in Ghaffari et al., 2000, pg. 7) that in order
to avoid machinery induced soil erosion and other problems derived from the use of
machinery, only land with slopes below 8º (equivalent to 17,8%) should be used.
However, these constraints can be relieved by some extent by the use of terraces, but an
associated increase in the likelihood of soil erosion should be expected (Sys et al., 1993;
FAO-IIASA, 2007).
For the reasons outlined a threshold slope value of areas 16% and greater was considered
as unsuitable for sugarcane cultivation. Slope in percent in the context of land suitability
studies is the “rise in elevation in meters over a range of 100m” (FAO-IIASA, 2007).
SLCR pixels distributed in land with slopes greater than 16% were filtered out. Only
58 km2 of SLCR pixels occurred in slopes greater than 16% and these were mainly
located in the northern region of the country. As this is a relatively small number of
overlapping pixels, it is difficult to compare the distribution of SLCR pixels after
removing overlapping areas with Figure 6.6. Figure 6.7. shows the distribution of SLCR
pixels after filtering out protected areas, global land cover classes and slopes greater than
16%. As a result of the several filtering steps in the analysis, the initial distribution of
SLCR pixels (Figure 6.1.) has been reduced by 30% with the final distribution of areas
potentially suitable for sugarcane cultivation being 11 279 km2.

96
Figure 6.7. Distribution of SLCR pixels after filtering out slopes greater than 16%
LegendSLCR pixels
−
D_WGS_1984
0 1 2 3 40.5Kilometers

97
However, despite the disadvantages associated with cultivation on steep slopes, there
may be cases in which such cultivation becomes necessary. Often as a result of
population pressures especially in rural areas which practice small scale farming,
cultivation on steep slopes is one means by which to increase the amount of land
available for farming. The most important factor to be controlled in such conditions is
soil erosion (Eldridge, 2004). In the case of sugarcane farming this can be achieved by
adopting reduced tillage and zero tillage farming systems, and by retaining a burnt cane
trash blanket on the soil surface (Eldridge, 2004). Intercropping may also prove to be a
useful measure in controlling soil erosion as it assists in binding the soil thereby reducing
soil erosion (Alexander, 1985; Blume, 1985).
6.6. Selected Areas
The areas identified in Figure 6.7. are suitable for sugarcane cultivation based only on
biophysical considerations, i.e. they are an indication of potentially suitable areas for
sugarcane cultivation only in terms of where it is best to grow sugarcane without
environmental constraints. However, in order to determine the viability of establishing
sugarcane farms at the areas identified, a further selection process was needed, taking
into account non-biophysical considerations involved in sugarcane production, as
outlined in Chapter 3. Proximity to roads was an obvious criterion, due to the transport
requirements of sugarcane farms. Specifically, areas which were in close proximity to
primary roads were selected as being most viable for establishing a sugarcane farm.
Reasons substantiating the choice of criteria have been outlined in Chapter 5. In
conjunction with proximity to roads, a criterion of areas greater than 10 000 hectares
resulted in the exclusion of 665 km2 of SLCR pixels.
As the aim of this project was to identify areas suitable for sugarcane cultivation (and not
specific sites), following this final filtering of SLCR pixels, three areas with a combined
area of 10 614 km2, were identified as being suitable for sugarcane cultivation. The
selected areas are shown in Figure 6.8. and the area occupied by each selected area and
the provinces in which it is located is listed in Table 6.3.

98
Figure 6.8. Three selected areas suitable for sugarcane cultivation
LegendPrimary RoadSLCR pixels
−
D_WGS_1984
0 0.7 1.4 2.1 2.80.35Kilometers
Selected Area 1
Selected Area 2
Selected Area 3

99
Table 6.3. Area of each of the selected suitable areas and provinces in which they
are located
Selected area SLCR pixels (km2) Region Province
1 1 258 South Huila, Cunene
2 8 397 Central Cuanza Sul, Bie, Huambo
3 959 North Luanda, Bengo, Cuanza Norte
Total 10 614
The areas selected cover a large expanse, spreading over two provinces at minimum in all
three selected areas. It is likely that these areas will be reduced to individual provinces
following a complete land evaluation of the selected areas. This would include assessing
the areas in terms of the surrounding social, economic and physical context as well as the
availability of local and export markets, costs and benefits of input as well assessments of
land tenure (FAO, 1976). Specifically, surveys at the semi-detailed or intermediate level
would prove more meaningful by incorporating more specific aims and a feasibility study
of the development project (FAO, 1976).
Proximity to transport infrastructure was further analysed at the level of each of the
selected areas to establish distance from the agricultural area to both roads and railroads.
Even though, not considered explicitly in this study, distances to transport infrastructure
can be used in determining best possible locations of the manufacturing phase (i.e. mill)
of a sugarcane farm or most cost-effective and practical means of reaching existing mills.
Figures 6.9 through 6.14. gives a description of each of the selected areas with respect to
distance to roads and railroads. Pixels in white indicate the closest proximity to the
relevant transport infrastructure (road or rail).
The reader is urged to refer to the detailed maps provided in the Appendix for a better
understanding of the locations of roads, railroads and cities in Angola.

100
6.6.1. Selected Area 1
The selected area is located in the southern region of the country and has 1 258 km2 of
land potentially suitable for sugarcane cultivation. Passing through the area is the
Mocamedes railway (Figure 6.9.) which travels from Namibe to Cuanda Cubango. The
Mocamedes would serve as a means of transporting high bulk produce and goods into
and out of the agricultural area to major cities. In the agricultural area, the closest
proximity to the railroad is in the northern region located in the Huila province. Based on
this, it can be suggested that tractor-trailer rigs should bring the cultivated material and
goods to this region for loading. Selected area 1 also has a good distribution of primary
roads surrounding it (Figure 6.10.). Specifically, located on the western, nothern and
eastern periphery are two major roads which lead to Lubango, which is the nearest major
city.

101
Dis
tanc
e to
Rai
lroad
(km
)2.
11 -
20.0
020
.01
- 40.
0040
.01
- 60.
0060
.01
- 80.
0080
.01
- 100
.00
100.
01 -
120.
0012
0.01
- 14
0.00
Rai
lroad
−
025
5075
100
12.5
Kilo
met
ers
D_W
GS_
1984
Figure 6.9. Proximity to railroads in Selected Area 1

102
Figure 6.10. Proximity to roads in Selected Area 1
Dis
tanc
e to
Roa
d (k
m)
0.01
- 10
.00
10.0
1 - 2
0.00
20.0
1 - 3
0.00
30.0
1 - 4
0.00
40.0
1 - 5
0.00
50.0
1 - 6
0.00
60.0
1 - 7
0.00
Prim
ary
road
−
025
5075
100
12.5
Kilo
met
ers
D_W
GS_
1984

103
6.6.2. Selected Area 2
The selected area is located in the central region of the country and has 8 397 km2 of land
which is potentially suitable for sugarcane cultivation. It is the largest of the three
selected areas, spanning three provinces. Passing through the area is the Benguela railway
(Figure 6.11.) in the southern region of the selected area and the Luanda railway in the
north. The area is situated in proximity to several major roads (Figure 6.12.) leading to
cities Kunto, Ngunza, Huambo and Benguela. However, despite the generous distribution
of road and rail transport infrastructure in this area, it is not certain as to the operational
functionality of these systems because the central region of Angola is noted for its poor
transport conditions (FAO, 2006).
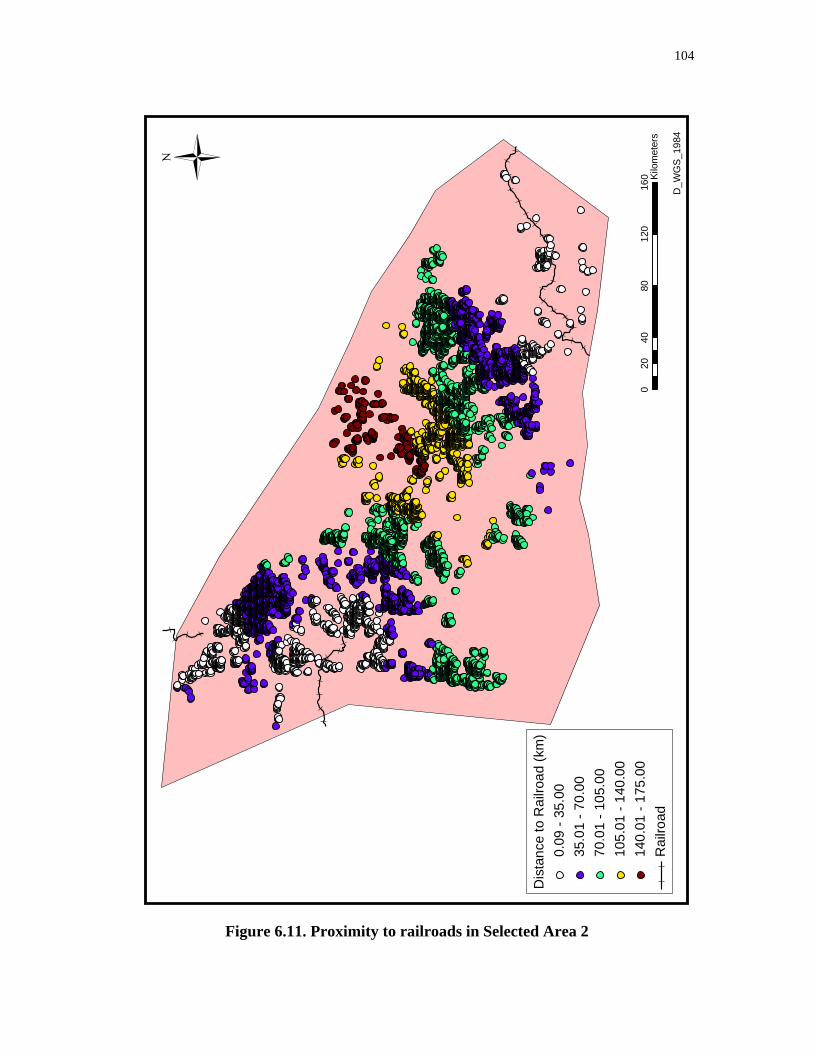
104
Figure 6.11. Proximity to railroads in Selected Area 2
−
D_W
GS_
1984
Dis
tanc
e to
Rai
lroad
(km
)0.
09 -
35.0
035
.01
- 70.
0070
.01
- 105
.00
105.
01 -
140.
0014
0.01
- 17
5.00
Rai
lroad
040
8012
016
020
Kilo
met
ers

105
Figure 6.12. Proximity to roads in Selected Area 2
−
D_W
GS_
1984
Dis
tanc
e to
Roa
d (k
m)
0.00
- 15
.00
15.0
1 - 3
0.00
30.0
1 - 4
5.00
45.0
1 - 6
0.00
60.0
1 - 7
5.00
Prim
ary
road
040
8012
016
020
Kilo
met
ers
106
6.6.3 Selected Area 3
The selected area is located in the northern region of the country and is characterised by
959 km2 of land potentially suitable for sugarcane cultivation. Passing through the central
and southern parts of area is the Luanda railway (Figure 6.13.). There are several major
roads passing through the area (Figure 6.14.) which facilitates access to the cities
Ndalatando, Caxito, Luanda and Malanje. However, similar to selected area 2, the poor
condition of the roads in this region poses a major constraint to the movement of
commodities from production areas to markets (FAO, 2006).
The emphasis on using road and rail infrastructure in assessing the viability of
establishing sugarcane farms at the selected areas is motivated by the link between food
security and transport infrastructure. The FAO (2006) considers the improvement of road
networks in Angola as a crucial factor in achieving full agricultural potential as roads
provide a means of marketing agricultural produce without transport losses and
prohibitive transport costs. The condition of Angola’s transport infrastructure has been
discussed in Chapter 4 and the reader is referred to this chapter for a better understanding.
It is possible that the condition of Angola’s transport infrastructure would be a limiting
factor in establishing a sugarcane farm at the selected areas. However, regeneration of the
country’s current infrastructure network is a top priority for the Government of Angola,
and as such the limitation caused by poor transport infrastructural conditions may in the
future be greatly reduced. The Ministry of Transportation has emphasised that the main
objective of infrastructure refurbishment is to “guarantee the integrated functioning of all
modes of transportation” and to guarantee a suitable system of urban transportation in the
principle cities (Kuvingua, 2004). As this was a statement made in the year 2004, it is
likely that road and rail upgrades have already been made. In 2006, large loans by the
Chinese government has sped up the process of building roads and railways.

107
Figure 6.13. Proximity to railroads in Selected Area 3
−
Dis
tanc
e to
Rai
lroad
(km
)0.
12 -
20.0
020
.01
- 40.
0040
.01
- 60.
0060
.01
- 80.
0080
.01
- 100
.00
Rai
lroad
030
6090
120
15Ki
lom
eter
sD
_WG
S_1
984

108
Figure 6.14. Proximity to roads in Selected Area 3
−
Dis
tanc
e to
Roa
d (k
m)
0.11
- 15
.00
15.0
1 - 3
0.00
30.0
1 - 4
5.00
45.0
1 - 6
0.00
60.0
1 - 7
5.00
Prim
ary
Roa
d0
3060
9012
015
Kilo
met
ers
D_W
GS_
1984

109
6.7. Population
With a total population of 15.94 million, Angola’s population density sits at just under 13
people per square kilometer. Population and population density of each of the provinces
located in the selected areas are listed in Table 6.4. The distribution of population in each
province is shown in Figure 6.15.
Table 6.4. Population of each province within the selected area
Selected Area Province Population Population density
(persons/km2)*
Total
population
Huila 971 599 12.3 1
Cunene 259 391 3
123 099 0
Cuanza Sul 727 861 13
Bie 125 782 4 17
2
Huambo 170 393 2 5
368 961 7
Luanda 182 132 9 651
Bengo 185 599 5
3
Cuanza Norte 422 629 18
242 985 7
*Figures derived from data source for population figures (see Chapter 5)
From Table 6.4. and Figure 6.15. with the exception of Cunene, Huambo and Bengo, it
can be seen that each of the selected areas has access to a large population base,
demonstrated by population density figures. In selected area 1, which is located in the
southern region, individuals in these regions use market activities, occasional labour, sale
of livestock, charcoal and firewood, as well as growing of vegetables in the lowlands as a
coping strategy in times of food insecurity (FAO, 2006). Extrapolating from this, the
proposed selected areas for sugarcane cultivation is a means of agricultural expansion,
and thus, would provide an additional source of livelihood for people in this region. The
north-central region, in which selected area 2 is located, offers the greatest livelihood
options with agriculture and trade dominating (FAO, 2006). Thus, it is more than likely
that there is a great deal of individuals with agricultural skills which may prove to be a
viable workforce for the selected area 2.

110
Extrapolating from national statistics, Angola’s HIV/AIDS prevalence rate is only 3.9%,
which is low compared to the rest of the southern African region (as outlined in Chapter
4). However, another health risk is affecting the health status of the Angolan population,
i.e. cholera. Due to the constrained living and sanitation conditions and inappropriate
hygiene practices, the country witnessed an epidemic of cholera from April 2006 (WHO,
2007). The outbreak is thought to have originated in Luanda, which is densely populated
(as shown in Table 6.4.), and spread through the country by means of road and sea. Daily
incidence rate reached a peak of 950 cases and 3092 related deaths last year. Currently,
the outbreak has diminished, however there are still some cases occurring in Luanda,
Malanje and Benguela (WHO, 2007).
Considering that the majority of the Angolan labour force is engaged in agriculture and
that the country faces extensive unemployment, an expansion of the agricultural sector
would undoubtedly create economic opportunities for the population. In retrospect, due to
the devastating economic situation which Angolan’s face, it is more than likely that a
substantial portion of the population in each of the selected areas can be considered as an
available work force.
Various demographic changes take place in rural areas which contributes to labour
availability (FAO, 2007). These include migration of individuals to cities for higher wage
or the increase in the number of children going to school, thereby increasing education
levels. Both these demographic trends will reduce the amount of labour available for
farming operations (FAO, 2007). Therefore, more meaningful results could have been
obtained if data on demographic changes in Angola were available, as well as if
population centres and distances of these centres from the selected areas were known.

111
Figure 6.15. Population by province
Moxico
Bie
Huila
Cuando Cubango
Uige
Malanje
Cunene
Lunda Norte
Lunda Sul
Namibe
Zaire
Bengo
Cuanza Sul
Benguela
Huambo
Cuanza Norte
Cabinda
Luanda
LegendPopulation by Province
128578 - 185599185600 - 259391259392 - 422629422630 - 12578241257825 - 1821329
−
D_WGS_1984
0 0.8 1.6 2.4 3.20.4Kilometers
Selected Area 1
Selected Area 2
Selected Area 3

112
6.8. Proximity to rivers and percent slope – implications for irrigation
Each of the selected areas were characterised in terms of proximity to rivers and percent
slope. Figures 6.16. to 6.18 characterised each of the selected areas in terms of proximity
to the nearest river. Figure 6.19. shows the percent slope of the entire study area. From
the results, it can be seen that each of the selected areas are covered by a vast network of
rivers (Appendix D) which makes irrigation a feasible option. The option of irrigation is
especially attractive in selected areas 1 and 2, as they area located in the dryer regions of
the country. Specifically, in the four southern most provinces, Huila, Cunene, Namibe
and Cuando Cubango, average annual rainfall is below 500-1000mm and therefore
irrigation becomes necessary in these provinces. This is particularly relevant for
sugarcane cultivation which requires an average annual rainfall supply of 1200-1500mm
(Blume, 1985; Tarimo and Takamura, 1998; FAO AGL, 2002). Thus, rainfed agriculture
in this region is not a feasible option. Specifically, in the cropping period in years 2005
and 2006, due to poor distribution of rainfall, rainfed agriculture suffered considerable
losses in yield in the central region of the country, the northern parts of the Huila
province and Cuanza Sul (FAO, 2006).
Loss in crop yields often translates into issues of food security, where a reduction in the
amount of crops available decreases food security in the relevant regions. A means by
which to avoid such yield losses and improve food security is to move Angolan
agriculture from rainfed into dryland farming, thereby increasing dependence on
irrigation systems. Furthermore, in a broader socio-economic context, investments in
irrigation systems, is seen as means of job creation, market opportunities for small-scale
farmers and increased income due to higher attainable crop yields (FAO, 2006).
In terms of irrigation engineering, distance to water source is a factor which influences
irrigation economics especially in terms of pumping costs (Dumler and Rogers, 2006).
Thus, Figures 6.16. to 6.18 can be used in estimating pumping costs associated with the
irrigation system in question as per the stake-holder’s specific circumstances.

113
Terrain variations were only accessed in terms of percent slope which is represented in
Figure 6.19. As previously mentioned in Chapter 5, there appears not to be a definite
threshold value at which irrigation becomes constrained. However, the FAO-IIASA
(2007) have identified slopes greater than 8% to be severely constrained for non-terraced
land with gravity irrigation, and for land with sprinkler irrigation, slopes greater than
16% becomes severely constrained. The results generated in this section serve to assist a
stake-holder in the decision-making process of choice of irrigation systems and costs
associated. From Figure 6.19.4 it can be seen that selected area 1 has slopes ranging from
0 - 3.78%, selected area 2 has slopes ranging from 0-17.10% and selected area 3 has
slopes ranging from 0-8.44%.
It is acknowledged that in order to generate a better understanding of the terrain
variations in the selected area, an accurate assessment of variation in terrain of areas
located in close proximity to rivers is required, however, this was beyond the scope of
this study. In conjunction with the factors outlined in Chapter 5, this would be a more
meaningful contribution to estimating costs involved in establishing a particular irrigation
system.
4 Slope classes were generated by the natural break define method in ArcMap.

114
Figure 6.16. Proximity to rivers in Selected Area 1
−
Dis
tanc
e to
Riv
er (k
m)
0.02
- 10
.00
10.0
1 - 2
0.00
20.0
1 - 3
0.00
30.0
1 - 4
0.00
40.0
1 - 5
0.00
50.0
1 - 6
0.00
Riv
er0
2550
7510
012
.5Ki
lom
eter
s
D_W
GS
_198
4

115
Figure 6.17. Proximity to rivers in Selected Area 2
−
D_W
GS
_198
4
Dis
tanc
e to
Riv
er (k
m)
0.00
- 10
.00
10.0
1 - 2
0.00
20.0
1 - 3
0.00
30.0
1 - 4
0.00
40.0
1 - 5
0.00
50.0
1 - 6
0.00
Riv
er0
4080
120
160
20Ki
lom
eter
s

116
Figure 6.18. Proximity to rivers in Selected Area 3
−
Dis
tanc
e to
rive
r (km
)0.
09 -
8.04
8.05
- 14
.86
14.8
7 - 2
2.07
22.0
8 - 2
9.65
29.6
6 - 3
6.37
Riv
er0
3060
9012
015
Kilo
met
ers
D_W
GS
_198
4

117
Figure 6.19. Terrain variation in the study area as per percent slope
LegendSlope (%)
0 - 1.331.34 - 3.783.79- 8.448.45 - 17.10> 17.10
−
WGS_1984_UTM_Zone_33S
Selected Area 1
Selected Area 2
Selected Area 3
0 100 200 300 40050Kilometers

118
6.9. Conclusion
This chapter has presented and discussed the findings of the analyses performed. It is
clear that there exists great potential for establishing sugarcane farms due to the large
areas identified. Furthermore, Angola’s unexploited irrigation potential and vast river
network makes irrigated agriculture an attractive option. The following chapter represents
the conclusion of the project as a whole and includes recommendations emanating from
the study.

119
Chapter 7
Conclusion and Recommendations
The previous chapter presented and discussed the results of the land suitability
assessment for sugarcane cultivation in Angola. This chapter serves to provide a
conclusion of the project as a whole, in terms of key findings, objectives met and
recommendations.
7.1. Key findings
In the study, all objectives as outlined in Chapter 1 have been met. Results indicate that
Angola has enormous potential for bioenergy production. Specifically, following several
filtering steps, the total land area that is suitable for sugarcane cultivation in Angola is
10 614 km2. As mentioned in Chapter 5, due to the lack of reliable data, it is uncertain as
to where existing sugarcane farms are located. However, it is known that currently the
area under crops is 4 million hectares, of which 9 500 hectares (95 km2) were under
sugarcane cultivation in 2004 (Makenete, 2007). It is likely that these areas were filtered
out during filtering of areas which overlapped with the cropland land cover class. Thus,
from the results obtained, an additional 10 614 km2 of land has been identified which
could potentially be placed under sugarcane cultivation. Since, commercial sugarcane
farming requires areas of 10 000 hectares (100 km2) and greater, the identified suitable
areas would provide at minimum 106 such ventures.
Even though, the aim of the project was not to identify specific sites at which sugarcane
farms could be adopted, results from this study have served to narrow down Angola’s
57.6 million hectares of agricultural land to areas which would be most suitable for
sugarcane cultivation. It is acknowledged that the accuracy of these suitable areas has the
potential to be greatly increased, as outlined in Chapter 5.
In addition to identifying potentially suitable areas for sugarcane cultivation, a broad
assessment of the transport infrastructure surrounding each area has been made. This
included road and rail transport which is essential to delivering goods and farmer’s

120
supplies into the agricultural area as well as delivering agricultural produce to the
manufacturing phase (mill or distilleries). Interestingly, the identified selected areas
appear to be large enough to house individual mills in close vicinity to their agricultural
phase. For example, drawing from his experience in Brazil, Bezuidenhout (2007, pers.
comm.) has suggested that it is possible for four mills to be built in selected area 1.
Specifically, for sugarcane growing under irrigation, yield on average is 100 tons/hectare,
with each mill have the processing capacity of 3 million tons. As selected area 1 covers
an area of 1 258 km2, four5 mills would be required to process the agricultural produce
from this area. As such, processing capacity at each of the selected areas appears
encouraging as each of the selected areas has the potential to house a minimum of three
mills.
By further extrapolating from productivity figures in Brazil, a 2004 productivity index
estimates that 135 litres of ethanol is produced per ton of sugarcane (Martines-Filho et
al., 2006). Since 10 614 km2 of land was identified in this study as being suitable for
sugarcane, this land area has the potential to produce 106 million tons of sugarcane and
an astounding 14 329 million litres of ethanol (Table 7.1.). This astounding productivity
potential could place Angola as the world’s third largest producer of ethanol! Comparing
this figure to world ethanol production in 2005, where the U.S. and Brazil produced
16 214 million and 16 017 million litres of ethanol, respectively, it indeed affirms the
suggestion made by Van den Berg and Rademakers (2007) that Angola is set to be the
world’s next biofuel ‘superpower’.
Table 7.1. Estimated bioethanol productivity potential for Angola, extrapolated
from Brazilian productivity figures
Land area (km2)* Tons of sugarcane Litres of bioethanol 0.01 100 13 500
10 614 106 140 000 14 329 million *1 km2 is equivalent to 100 hectares
5 This value was arrived at by taking the suitable land area of selected area 1 and multiplying it by the average yield. This gave a value of yield in tons/hectare which was divided by 3 million. The resulting value was taken as a general indication of the number of mills it would take to process produce from this area, as it is beyond the scope of the study to suggest precise locations for mills.

121
Furthermore, calculating proximity to rivers in each of the selected areas revealed a vast
network of rivers in each of the areas, demonstrating the high irrigation potential that
exists in the country. In conjunction with slope (%) calculations, these figures can prove
useful to a stake-holder’s decision-making process as per options in irrigation systems
and economics involved. In Angola, investments in irrigation systems would ensure long-
term development. Such technological advancements are considered key in the
development of Angola’s agricultural sector, which has associated benefits for both
small- and large-scale farmers. These advantages and benefits have been discussed in
detail in Chapter 4.
It is imperative to remember that the areas identified were for the cultivation of sugarcane
for bioenergy purposes. Thus, in this light sugarcane is considered as a bioenergy crop
with the capacity to produce several bioenergy products which includes bioethanol, such
that its cultivation is not solely for the production of sugar. These areas therefore have an
added advantage in terms of bioenergy products which could be a means of uplifting
social welfare, and the creation of rural livelihoods. These suitable areas can help turn
marginalised farmers into commercial producers (Makenete, 2007). Furthermore, such
bioenergy crop plantations can be rotated with higher-value cash crops. In the case of
sugarcane, there are further opportunities involved for a producer who is capable for
making both sugar and bioethanol (as discussed in Chapter 3).
Specifically, the Government of Angola sees clean, renewable energy as a promising
endeavor to address the basic development needs of low-income populations. Angola’s
Minister of Energy has outlined that improving access to cleaner forms of energy,
becomes critical in freeing the poor, especially women from subsistence farming
(Commission on Sustainable Development, 2001). There is undoubtedly also a need for
energy services in Angola such as electric power, as only 15% of the Angolan population
have access to electric power (www.esri-africa.com). As outlined in Chapter 3, bagasse-
cogenerated electricity affords the sugarcane factory to be sufficient in meeting its energy
requirements, and in a case in which the factory is being operated efficiently, excess
bagasse may be available. This can be used to generate electricity which could be sold to

122
the national grid. This can prove to be a great endeavor in meeting Angola’s energy
needs, not to mention the additional energy and environmental benefits associated with
other sugarcane bioenergy products, such as household gel-fuel.
7.2. Recommendations
Several recommendations have emanated from this project and these are listed below:
1. The potential value of Google Earth® in verifying whether identified areas are
uninhabited has been demonstrated in this study. It is recommended that this
application be used to verify availability of land in future land suitability assessments.
2. The inclusion of existing sugarcane farms in the study is crucial in rendering the
suitability assessment more reliable and accurate. As shown by Baijnath (2005), the
MIOMBO SLCR pixels have included some of the areas which are under sugarcane
cultivation. Adopting such an approach would ensure that areas identified as suitable
for sugarcane cultivation would not include land currently under sugarcane
cultivation.
3. It is suggested that, prior to establishing sugarcane farms at the suggested areas,
results from this study should be supplemented with an economic evaluation, taking
into account detailed costs and benefits associated with the development project.
Assessments of suggested areas in terms of the surrounding social, economic and
physical context as well as the availability of local and export markets, costs and
benefits of input, as well assessments including land tenure, should also be made
(FAO, 1976). Specifically, surveys at the semi-detailed or intermediate level would
prove more meaningful by incorporating more specific aims and a feasibility study of
the development project (FAO, 1976).
4. Due to the scope of this study, the potential for irrigated agriculture was broadly
addressed by assessing distance to water source and slope. Results have shown that
Angola has an unexploited irrigation potential and thus, it is recommended that in
order to fully realise this potential, in addition to recommendation 3, a more detailed

123
land evaluation mainly focussing on irrigated agriculture be conducted. An evaluation
of this nature may follow the FAO’s (1985) document Guidelines: Land evaluation
for irrigated agriculture. In addition to the results obtained in this study, such an
evaluation may further prove beneficial to a land developer in terms of deciding the
best irrigation method for a particular land area, as well as costs of inputs and outputs
and relating these to the surrounding environmental, social and political context
(FAO, 1985).
5. Laws and legislation pertaining to land use, land tenure and use of water for irrigation
have not been addressed in this study. An understanding of the laws pertaining to
these would prove beneficial in estimating the feasibility and laws regulating the
establishment of sugarcane farms at the suggested areas.
6. It is further recommended that in order to facilitate best farming practices and highest
yield attainable, study trials should be conducted as to which sugarcane variety would
be successful in each of the suggested areas.
7. Results from this study showed that Angola has enormous bioenergy productivity
potential, and to assist in fully realising this potential, it is urged that an international
cooperation be established between Angola and the North. This would bring
scientific, technical and agronomic expertise into the country for bioethanol
production. A cooperation should also be established with Brazil, which is the
world’s leading producer of ethanol from sugarcane. As suggested by Makenete
(2007) a trilateral cooperation between Africa, the European Union (EU) and Brazil
could prove highly beneficial for all three stake-holders. Specifically, the EU could
bring financial and technical resources and Brazil could bring scientific and technical
expertise for bioethanol production. Africa on the other hand would be the biofuel
producer which could lift marginalised farmers out of poverty and can export its
produce to the EU.

124
References
Addison, K. (2005). Food or Fuel? Online:
http://www.journeytoforever.org/biofuel_food_html, Accessed: 27 June 2007
AfricaFiles (2007). South Africa: Ethanol-boon or bust? By IRIN, Online:
http://www.africafiles.org, Accessed: 9 July 2007
Alexander, A.G. (1985). The Energy Cane Alternative. Elsevier Publishing Company,
Amsterdam, 436pp
Atkinson, B. (n.d.). The CDM, Kyoto Protocol and the Sugar, Ethanol and Bio-Fuels
Industry. Online: http://www.agrinergy.com/Atkinson.pdf, Accessed: 29 June 2007
Baijnath, S. (2005). Identification of Areas Suitable for Sugarcane Cultivation in
Southern Africa - Ethanol Production Implications. Unpubl., Masters Thesis, University
of KwaZulu-Natal, Durban, South Africa
Barnes, D.F. (2006). Clean Household Energy and Indoor Air Pollution. Integrated
Environmental Strategies, Energy and Water Department, The World Bank, US-Japan
Bilateral Workshop on Climate Change, March 22-23, 2006
Bendz, K. (2005). EU-25-Oilseeds and Products-Biofuels situation in the European
Union. USDA Foreign Agricultural Service, GAIN Report-E35058, 11pp
Bergeron, P. (1996). Environmental Impacts of bioethanol. In: Wyman, C.H. (Ed)
Handbook on bioethanol: production and utilisation, Taylor and Francis, Washington
DC, pp 163-178

125
Bezuidenhout, C.N., Gers, C. (2002). Homogenous Climate Zones for the South African
Sugar Industry: Preliminary Boundaries, Proceedings of the South African Sugar
Technologists’ Association, 76:601-605.
Bezuidenhout, C.N. (2007). Personal communications. SASRI Senior Research Fellow,
School of Bioresources Engineering and Environmental Hydrology, University of
KwaZulu-Natal, Pietermaritzburg, South Africa
BirdLife International (2005). A BirdLife International position paper on Bioenergy use
in the EU. Online: www.birdlife.org/eu/pdfs/2006/2005_bioenergy_position.pdf,
Accessed: 30 June 2007
Blume, H. (1985). Geography of Sugarcane. Verlag Dr. Albert Bartens, Berlin, pp 1-21
Boonyanuphap, J., Wattanchaiyingcharoen, D., Sakurai, K. (2004). GIS-based land
suitability assessment for Musa (ABB group) plantation. J. Appl. Hort,. 6(1):3-10
Brown, E., Jacobson, M. (2005). CRUEL OIL, How Palm oil Harms Health, Rainforest
& Wildlife. Centre for Science in the Public Interest, Washington DC, 48pp. Online:
http://www.cspinet.org/new/pdf/palm_oil_final_5-27-05.pdf, Accessed: 2 November
2007
Bruner, A.G., Gulliso, R.E., Balmford, A. (2004). Financial Costs and Shortfalls of
Managing and Expanding Protected-Area Systems in Developing Countries. BioScience,
54(12):1119-1126
Bucheit, J.K. (2002). History of Ethanol Production, Rural Enterprise and Alternative
Agriculture Development Initiative Project, 2002 (12):1
Bull, T. (2000). The Sugarcane Plant. In: Hogarth, M., Allsopp, P. (Eds) Manual of Cane
Growing, Bureau of Sugarcane Experimental Stations, Indooroopilly, Australia, pp 71-83

126
CAAIE (Centro Angolano De Altos Estudos Internacionais) (2007). The province of
Kuando Kubango. Angolan Centre for Advanced International Studies. Online:
http://www.caaei.org/kk.html, Accessed: 3 August 2007
Cadenas, A., Cabezudo, S. (1998). Biofuels as sustainable technologies: perspectives for
less developed countries. Technol Forecasting Social Change, 58:83-103
Campbell, J.B. (1996). Introduction to Remote Sensing, 2nd Edition, Taylor and Francis,
London, 622pp
Chape, S., Blyth, S., Fish, L., Fox, P. and Spalding, M. (2003). 2003 United Nations List
of Protected Areas, The World Conservation Union, Switzerland, 44pp
Chemical Technology (2005). Fuel bio-ethanol in South Africa-Opportunities and Risk.
September issue, pp 18-19
CIA (Central Intelligence Agency) (2007). The World Fact Book. Online:
https://www.cia.gov/library/publications/the-world-factbook/geos/ao.html, Accessed: 2
July 2007
Clay, J. (2005). Sugarcane Production and the Environment. WWF-US, Better Sugar
Meeting, 21 June 2005. Online:
http://www.bettersugarcane.org/assetsgeneral/claysugarcaneimpacts.pdf, Accessed: 29
June 2007
Clough, D. (2007). Energy Profile of Angola. Online:
http://www.eoearth.org/article/Energy_profile_of_Angola, Accessed: 30 March 2007
Commision on Sustainable Development (2001). Access to Clean Energy Key to
Sustainable Development, Commission Told. Ninth Session, 11th Meeting. Online:
www.un.org/news/Press/docs/2001/envdev574.doc.htm, Accessed: 5 July 2007

127
COMPETE (2005). Competence Platform on Energy Crop and Agroforestry Systems for
Arid and Semi-arid Ecosystems-Africa. Caller Identifier: FP6-2004-INCO-DEV-3
Cornland, D., Johnson, F.X., Yamba, F., Chidumayo, E.N., Morales, M.M.,
Kalumiana, O., Mtonga-Chidumayo, S.B. (2001). Sugarcane Resources for Sustainable
Development: A Case Study in Luena, Zambia. Stockholm Environment Institute,
Stockholm, 94pp
Cortez, L., Griffin, M., Scaramucci, J.A., Scandiffio, M.A.G., Branbeck, O.A. (1998).
Considerations on the Worldwide Use of Bioethanol as a Contribution for Sustainability.
Management of Environmental Quality: An International Journal, 14 (4)
Davidson, O., Karakezi, S. (1992). A New, Environmentally Sound Energy Strategy for
the Development of Sub-Saharan Africa. Working paper No. 4, AFREPREN, Nairobi,
21pp
de Beer, A.G. (1998). Sugarcane harvesting and handling systems. International Sugar
Journal, 100(1190E):48-52
de Vries, B.J.M., van Vuuren, D.P., Hoogwijk, M.M. (2007). Renewable energy sources:
Their global potential for the first-half of the 21st century at a global level: An integrated
approach. Energy Policy, 35(2007):2590-2610
Deepchand, K. (2001). Bagasse-Based Cogeneration in Mauritius-A Model for Eastern
and Southern Africa. AFREPREN occassional paper No.2, 37pp
Deepchand, K. (2005). Sugar Cane Bagasse Energy Cogeneration, Lessons from
Mauritius. Paper presented to the Parliamentarian Forum on Energy Legislation and
Sustainable Development, Cape Town, South Africa, 5-7 October 2005, 18pp

128
Dellepiane, D., Bosio, B, Arato, E. (2003). Clean energy from sugarcane waste:
feasibility study of an innovative application of bagasse and barbojo. Journal of Power
Sources, 122(2003):47-56
Demirbas, A. (2007). Progress and recent trends in biofuels. Progress in Energy and
Combustion Science, 33(2007):1-18
Demirbas, A.H., Demirbas, I. (2007). Importance of rural bioenergy for developing
countries. Energy Conversion and Management, doi:10.1016/j.enconman.2007.03.005
Di Gregorio, A., Jansen, L.J.M. (2000). Land Cover Classification System, concepts and
user manual. Food and Agriculture Organisation of the United Nations, Rome, 179pp
Duke, J.A. (1983). Handbook of Energy Crops. Unpublished, Online:
http://www.hort.purdue.edu/newcrop/duke_energy/Saccharum_officinarum.html,
Accessed: 2 July 2007
Dumler, T.J., Rogers, D.H. (2006). Irrigation Capital Requirement and Energy Costs.
Farm Management Guide, Department of Agricultural Economics, Kansas State
University Agricultural Experiment Station and Cooperative Extension Service, Kansas
State University, 4pp
EC-FAO (1999). Non-wood Forest Products Statistics-Angola. EC-FAO Partnership
Programme (1998-2000), Project GCP/INT/679/EC, 29pp. Online:
http://www.fao.org/docrep/008/ae214e/ae214300. HTM, Accessed: 27 October 2007
EIA (Energy Information Administration) (2005). Country Analysis Briefs-Southern
African Development Community. Online: http://www.eia.doe.gov/emeu/cabs/sadc.html ,
Accessed: 30 March 2007

129
EIA (Energy Information Administration) (2007). Country Analysis Briefs-Angola.
Online: http://www.eia.doe.gov/emeu/cabs/Angola/pdf.pdf, Accessed: 29 June 2007
Eggington, A. (2006). Technology and Angola’s Energy Future. IEA open Bulletin
Interview, International Energy Agency. Online:
http://www.iea.org/impagr/cip/pdf/AngolaInterviewIssue37.pdf, Accessed: 1 December
2007
Eldridge, S. (2004). Soil management for sugarcane. NSW Department of Primary
Industries, NSW Agriculture, Richmond. Online:
http://www.dpi.nsw.gov.au/__data/assets/pdf_file/0004/167125/soil-mgt-sugarcane.pdf,
Accessed: 31 October 2007
Esipisu, M. (2006). Chinese billions fuel repair of roads in Angola. Article in
AfricaNews, Namibian. Online:
http://www.namibian.com.na/2006/June/africa/0630470F15.html, Accessed 4 November
2007
European Commission Joint Research Centre (2003). A Land Cover Map of Africa. EUR
20665 EN, ISBN:92-894-5370-2, 56pp
FAO (Food and Agriculture Organisation) (n.d.). Land evaluation for development. Land
and Water Development Division, AGL, 35pp. Online:
http://www.fao.org/docrep/u1980e/u1980e00.htm, Accessed: 10 October 2007
FAO (Food and Agriculture Organisation) (1976). A Framework for Land Evaluation,
Soils Bulletin 32, Food and Agriculture Organisation, Rome, 72pp.

130
FAO (Food and Agriculture Organisation) (1985). Guidelines: Land evaluation for
irrigated agriculture. FAO soils bulletin 55, Soils Resources, Management and
Conservation Service, FAO Land and Water Development Division,
Rome. Online: http://www.fao.org/docrep/X5648E/x5648e00.HTM, Accessed: 2
November 2007
FAO (Food and Agriculture Organisation) (2002a). Preparation of a Land Cover
Database Through Remote Sensing and GIS-Pilot Study in Bulgaria. Remote Sensing for
Decision-Makers Series N.21, 6pp. Online:
ftp://ftp.fao.org/docrep/fao/004/y3642e/y3642E00.pdf, Accessed: 25 October 2007
FAO (Food and Agriculture Organisation) (2002b). Global Forest Resources Assessment
2000. Main report, 512pp. Online: http://fao.org.docrep/004/y1997E/y1997e00.HTM,
Accessed: 5 November 2007
FAO (Food and Agriculture Organisation) (2004a). Crop Suitability Assessment. Online:
www.fao.org/ag/agl/agll/cropsuit.asp, Accessed 20 September 2007
FAO (Food and Agriculture Organisation) (2004b). Global Forest Resources Assessment
Update 2005, Terms and Definitions (Final Version). Forestry Department, Rome, 36pp.
Online: http://www.fao.org/docrep/007/ae156e/ae156e00.htm, Accessed: 2 December
2007
FAO (Food and Agriculture Organisation) (2005a). Global Forest Resources Assessment
– Progress towards sustainable forest management. Rome, 147pp. Online:
http://www.fao.org/docrep/008/a0400e/a0400e00.htm, Accessed: 7 November 2007 FAO (Food and Agriculture Organisation) (2005b). Mapping global urban and rural
population distributions. Poverty Mapping, Rome, 24pp. Online:
http://www.fao.org/docrep/009/a0310e/a0310e00.htm, Accessed: 4 November 2007

131
FAO (Food and Agriculture Organisation) (2006). Special Report, FAO/WFP Crop and
Food Supply Assessment Mission to Angola. World Food Programme, Rome, 35pp.
Online: ftp://ftp.fao.org/docrep/fao/009/j8081e/j8081e00.pdf, Accessed: 4 November,
2007
FAO (Food and Agriculture Organisation) (2007). Land evaluation – Towards a revised
framework. Land and Water Discussion Paper 6, Food and Agriculture Organisation of
the United Nations, Rome, 124pp
FAO (Food and Agriculture Organisation) AGL (Agriculture Land and Water Division)
(2002). Crop Water Management. Online:
http://www.fao.org/ag/agl/aglw/cropwater/sugarcane.stm#requirements, Accessed: 23
July 2007
FAO-IIASA (Food and Agriculture Organisation-International Institute for Applied
Systems) (2007). Mapping biophysical factors that influence agricultural production and
rural vulnerability. Poverty Mapping, Rome, 93pp. FAO (Food and Agriculture Organisation) Mapping Information Systems (2007). Online:
http://www.fao.org/countryprofiles/index.asp?lang=en&ISO3=AGO, Accessed: 1 July
2007
FAO (Food and Agriculture Organisation) STAT (2001). Food and Agriculture
Organisation Statistics Division. Online:
http://faostat.fao.org/site/336/DesktopDefault.aspx?PageID=336, Accessed: 3 July 2007
FAO (Food and Agriculture Organisation) Terrastat Database (2003). Terrastat Land
resource potential and constraints statistics at country and regional level. Online:
http://www.fao.org/ag/agl/agll/terrastat/, Accessed: 5 June 2007
Farrel, A.E., Plevin, R.J., Turner, B.T., Jones, A.D., O’Hare, M., Kammen, D.M. (2006).
Ethanol can contribute to energy and environmental goals. SCIENCE, 311:506-508

132
Fauconnier, R. (1993). Sugar Cane. Macmillan/CTA, London, UK, 120pp
Fischer, G., van Velthuizen, H., Shah, M., Nachtergaele, F. (2002). Global Agro-
ecological Assessment for Agriculture in the 21st century: Methodology and Results.
International Institute for Applied Systems Analysis, Laxenburg, Austria, 155pp
Friends of the Earth (2004). Greasy palms - palm oil, the environment and big business.
Friends of the Earth England, Wales and Northern Ireland, 28pp. Online:
http://www.foe.co.uk/resource/reports/greasy_palms_summary.pdf, Accessed: 3
November 2007
Fritsche, U.R., Hünecke, K., Herman, A., Schulze, F., Wiegman, K. (2006).
Sustainability Standards for bioenergy. WWF, Germany, Frankfurt am Main, 80pp.
Online: wwf.de/fileadmin/fm-wwf/.../Sustainability_Standards_for_Bioenergy.pdf,
Accessed: 5 July 2007
Funk and Wagnalls® (2006). New Encyclopedia. World Almanac Education Group, A
WRC Media Company
Gabra, M., Kjellström, B. (1995). A Pre-feasibility Assessment of the Potential of Cane
Residues for Cogeneration in the Sugar Industry - Working Paper. Energy, Environment
and Development Series - No. 41, Stockholm Environment Institute, 52pp
Ghaffari, A., Cook, H.F., Lee, H.C. (2000). Integrating climate, soil and crop
information: a land suitability study using GIS. 4th International Conference of
Integrating GIS and Environmental Modeling (GIS/EM4 No. 129): Problems, Prospects
and Research Needs, Canada, September 2-8, 2000, 10pp
Global Forest Watch (2007). Linking Forest and people, Indonesia: overview. Online:
http://www.globalforestwatch.org/English/indonesia/overview.htm, Accessed: 31
October 2007

133
Goldemberg, J., Johansson, T.B., Reddy, A.K.N., Williams, R.H. (2004). A global clean
cooking fuel initiative. Energy for Sustainable Development, VIII (3):5-12
Griffee, P. (2000). Ecology of Sugarcane. Online:
www.ecoport.org/EP.exe$EntFull?ID=1884, Accessed: 15 June 2007
Grimett, F.H. (2005). An Assessment of the Economic Feasibility of Small-Scale
Sugarcane Production, in Terms of Transport to the Mill in Central Zululand. Honours
Thesis, University of KwaZulu-Natal, Durban, South Africa
Hall, D.O., Rosillo-Calle, F., Williams, R.H., Woods, J. (1993). Biomass energy supply
and prospects. In: Johanssom, T.B., Kelly, H., Reddy, A.K.N., Williams, R.H. (Eds)
Renewable energy: sources for fuel and electricity. Island Press, Washington DC,
pp 593-651
Hall, D.O., House, J.I. (1995). Biomass: a modern and environmentally acceptable fuel.
Solar Energy Materials and Solar Cells, 38 (1995):521-542
Hulme, M., Doherty, R., Ngara, T., New, M. and Lister, D. (2001) African climate
change: 1900-2100. Climate Research, 17:145-168
Hunsigi, G. (1993). Production of Sugar Cane: Theory and Practice (Advanced Series in
Agricultural Sciences). Springer-Verlag, Berlin, 245pp
IWMI (International Water Management Institute) (2006). Region 5, Angola. 25pp.
Online: http://www.iwmi.cgiar.org/wetlands/pdf/Africa/Region5/ANGOLA.pdf,
Accessed: 31 October 2007
Johnson, F.X., Matsika, E. (2006). Bio-energy trade and regional development: the case
of bioethanol in southern Africa. Energy for Sustainable Development, X (1), pp 42-53
134
Johnson F.X., Rosillo-Calle, F. (2007). Biomass, Livelihoods and International Trade.
SEI Climate Energy Report 2007-01, Stockholm Environment Institute, Stockholm,
Sweden, 69pp
Kaltner, F.J., Azevudo, G.F., Campos, I.A., Mundim, A.O.F. (2005). Liquid Biofuels for
Transportation in Brazil-Potential and Implications for Sustainable Agriculture and
Energy in the 21st Century. Submitted Report (2nd Draft), Study Commissioned by the
German Technical Cooperation (GTZ), 130pp
Kammen, D.M. (2006). Bioenergy in Developing Countries: Experiences and Prospects.
International Food Policy Research Institute (IFPRI), Focus 14, Brief 10 of 12, 2pp.
Online: http://www.ifpri.org/2020/focus/focus14/focus14_10.pdf, Accessed: 7 May 2007
Karekezi, S. (2002). Renewables in Africa-meeting the energy needs of the poor. Energy
Policy, 30(2002):1059-169
Karekezi, S., Kithyoma, W. (2003). Renewable Energy in Africa: Prospects and Limits,
Report Prepared for The Workshop for African Energy Experts on Operationalising the
New Partnership for Africa’s Development Energy Initiative, Senegal, 25pp
Kartha, S., Leach, G. and Rajan, S.C. (2005). Advancing Bioenergy for Sustainable
Development: Guideline for Policymakers and Investors (Volumes I-IIII). Stockholm
Environment Institute, Stockholm, 159pp
Klass, D. (2004). Biomass for renewable energy and fuels. Encyclopedia of Energy,
Vol.1, 193-212. Elsevier Inc., New York
Kovarik, W. (2003). Ethyl: The 1920s Environmental Conflict over Leaded Gasoline and
Alternative Fuels. Proceedings of the American Society for Environmental History
Annual Conference, Providence, 26-30 March 2003

135
Kuvingua, J.J. (2004). Angola – Transportation: Policy, Strategy and Investments.
Angola Forum, Director of GEPE Minsitry of Transportation, Luanda. Online:
http://www.caaei.org/transportes.ppt, Accessed: 30 October 2007
Kyle, S. (1997). Development of Angola’s Agricultural Sector. Agroalimentaria (4),
36pp
Leach, G., Johnson, F. (1999). Modern Bioenergy-an Overview of its Prospects and
Potential. Renewable Energy for Development, 12 (4):2-3
Lecler, N. (2007). Personal communications. Senior Research Engineer (Agriculture and
Water Resources), South African Sugarcane Research Institute, Mount Edgecombe,
South Africa
Lefhoko, D. (2005). The Role of SADC Parliamentarians in Strengthening Energy
Cooperation and Regional Integration. Parliamentarian Forum on Energy Legislation and
Sustainable Devleopment, 5-7 October 2005, Cape Town, South Africa,17pp
Mackintosh, D. (2000). Sugar Milling. In: Hogarth, M., Allsopp, P. (Eds) Manual of
Cane Growing, Bureau of Sugarcane Experimental Stations, Indooroopilly, Australia, pp
396-377
Madulu, N.F. (2001). Population Dynamics and Sustainable Conservation of Protected
Areas in Tanzania: The case of Swagaswaga Game Reserve in Kondoa District. Institute
of Resource Assessment, University of Dar es Salaam, Tanzania, 20pp
Makenete, A. (2007). The potential of Biofuels for Africa. Presentation at the IPC
workshop, Zambia. Online:
http://www.agritrade.org/events/speeches/zambia/Makenete.pdf, Accessed: 15 October
2007

136
Malaysian Palm Oil Council (2006). Oil Palm…tree of life. MPOC Official Report 3,
Malaysian Oil Palm Council (MPOC), Malaysia, 18pp
Marrison, C.I., Larson, E.D. (1996). A preliminary estimate of the biomass energy
production potential in Africa for 2025. Biomass and Bioenergy, 10(5-6): 337-351
Martines-Filho, J., Burnquist, H.L., Vian, C.E.F. (2006). Bioenergy and the Rise of
Sugarcane-Based Ethanol in Brazil. CHOICES, 2nd Quarter, 21(2):91-96
Mathews, J. (2007a). Seven steps to curb global warming. Energy Policy, 35
(2007):4247-4259
Mathews, J.A. (2007b). Biofuels: What a Biopact between North and South could
achieve. Energy Policy, 35(2007):3550-3570
Mukherjee, S.K. (1957). Origin and Distribution of Sacharrum. Botanical Gazette,
199 (1): 55-61
Mungaroo, R., Ramdoyal, K., Lau, A.F. (2007). Unleashing the Bioenergy Potential form
the sugarcane biomass. Proceedings of International Field Workshop on “Renewable
Energy for Sustainable Development in Africa”, Mauritius, 18-21 June 2007
Mwamfupe, D. (1998). Demographic Impacts on Protected areas in Tanzania and options
for action. IUCN, Parks, 8(1):3-14
Myneni, R.B., Maggion, S., Iaquinta, J., Privette, J.L., Gobron N., Pinty, B., Kimes, D.S.,
Verstraete, M.M., Williams, D.L. (1995). Optical Remote Sensing of Vegetation:
Modeling, Caveats, and Algorithms. Remote Sens. Environ, 51:169-188
Nations Online (2007). Angola-Country Profile. Online:
http://www.nationsonline.org/oneworld/, Accessed: 23 June 2007

137
Navas, A., Machin, J. (1997). Assessing erosion risks in the gypsiferous stepped of Littigi
NE Spain. An approach using GIS. Journal of Arid Environments, 37(3):433-411
NEPAD-FAO (2005). Government of the Republic of Angola, Support to NEPAD-
CAADP Implementation, Volume II of VI. Bankable Investment Project Profile, Irrigation
Rehabilitation and Sustainable Water Resources Management, 33pp
Nierengarten, K. (2007). Why is the Railroad Industry So Interested in the Ethanol
Debate? Our Ethanol Debate. Online:
http://medialab.blogs.com/our_ethanol_debate/2007/03/why_is_the_rail.html, Accessed:
3 November 2007
Niesten, E.T. Rice, R.E., Ratay, S.M., Paratore, K. (2005). Commodities and
Conservation: The Need for Greater Habitat Protection in the Tropics. Centre for
Applied Biodiversity Science at Conservational International, 38pp. Online:
http://science.conservation.org/portal/server.pt/gateway/PTARGS_0_124186_93744_0_0
_18/Commodities%20&conservation.pdf, Accessed: 1 November 2007
ORC (Organic Research Centre) (2007). Deforestation diesel. Online:
http://www.efrc.co.uk/index.php, Accessed: 2 November 2007
Patton, M.Q. (1990). Qualitative Evaluation and research methods. Second edition, Sage
Publications, Newbury Park, CA, 532pp
Pinto, L.F.G., Bernades, S.B., Sparovek, G. (2001). Feasability of Agroforestry for
Sugarcane Production and Soil Conservation in Brazil. In: Scott, D., Mohtar, R.,
Steinhardt, G. (Eds) Sustaining the Global Farm. Selected Papers from the 10th
International Soil Conservation Organisation Meeting, pp 317-320
PRB (1997). 1997 World Population Data Sheet. Population Reference Bureau,
Washington DC

138
Purseglove, J.W. (1979). Tropical Crops: Monocotyledons. Longmann Group Ltd.,
London, 607pp
Rasheed, S., Vidhya, R., Venugopal, K. (2003). Agro-Land suitability assessment for
Rice and Sugarcane using Remote sensing and GIS synergism. Map India, Soil and
Agriculture Session 2003
Richards, G. (2006). The Virginian-Pilot: The Safest Route from the Corn Field to the
Factory. Citizens for Rail Safety Inc. Online:
http://www.citizensforrailsafety.org/in_the_news.php?id=9, Accessed: 5 November 2007
Sanderson, R. (2003). Introduction to Remote Sensing. New Mexico State University,
38pp
SARA (South African Railway Association) (2003). REHABILITATION AND
INTEGRATION OF ANGOLAN RAILWAYS INTO SADC NETWORK A
PRIORITY:SARA. Publications and Papers, Newsletters. Online:
http://www.sararail.org/site/angola.html, Accessed: 28 October 2007
SASEX (1980). Sugarcane Diseases in South Africa. Bulletin No.9, 24pp
Schele, C. (2007). Bio fuels for Africa ─ A Google Earth® supported approach to control
the suitability for sugar cane in the Republic of Angola. Third year research project,
School of Environmental Sciences, Universtiy of KwaZulu Natal, Durban, South Africa,
14pp
Schulze, R.E., Maharaj, M., Lynch, S.D., Howe, B., Melvil-Thomson, B. (1997). South
African Atlas of Agrohydrology and Climatology. Water Research Commision Report,
TT82/96, 276pp

139
Schwartz, S.B. (2004). Tropical Babylons-Sugar and the Making of the Atlantic World,
1450 –1680. The University of North Carolina Press, United States of America, 347pp
Sharpe, P. (1998). Sugarcane: Past and Present. Ethnobotanical Leaflets, Southern
Illinois University, Carbondale. Online: http://www.siu.edu/~ebl/leaflets/sugar.htm,
Accessed: 23 June 2007
Siebert, S., Döll, P., Hoogeveen, J., Faures, J.M., Frenken, K., Feick, S. (2005).
Development and validation of the global map of irrigation areas. Hydrology and Earth
System Sciences, 9:535-547
Skidmore, A. (2002). Environmental Modelling with GIS and Remote Sensing. Taylor &
Francis Inc, New York, 268pp
Smeets, E., Faaij, A., Lewandowski, I. (2004). A Quickscan of the Global Bio-energy
Potentials to 2050: An Analysis of the Export in Relation to the Underlying Factors.
Copernicus Institute Report, NWS-E-2004-109, Utrecht, Netherlands, 67pp
Socolow, R.H. (1992). Environment-Respectful Global Development of the Energy
System. Princeton, Centre for Energy and Environmental Studies
Srivastava, A., Prasad, R. (2000). Triglycerides-based diesel fuels. Renewable
Sustainable Energy Review, 4:111-133
Sys, I.C., van Ranst, E., Debaveye, I.J. (1991). Land Evaluation. Part I-III, Agricultural
Publications, General Administration for Development Cooperation, Brussels, 199pp.
Sys, I.C., van Ranst, E., Debaveye, I.J., Beernaert, F. (1993). Land Evaluation. Part I-III,
Agricultural Publications, General Publications for Development Cooperation, Brussels,
718pp

140
Takavarasha, T., Uppal, J., Hongo, H. (2005). Feasibility Study for the Production and
Use of BIOFUEL In the SADC Region. Southern African Development Community
Secretariat, Gaborone, Botswana, 110pp
Tarimo, A.J.P., Takamura, Y.T. (1998). Sugarcane production, processing and marketing
in Tanzania. African Study Monographs, 19(1):1-11
Tomilinson, D. (2005). Corporate Affairs Development Manager, Illovo Sugar Limited,
P.O. Box 194, Durban, 4000, South Africa
Ultria, B.E. (2004). Ethanol and gelfuel: clean renewable cooking fuels for poverty
alleviation in Africa. Energy for Sustainable Development. VIII (3):107-114
UNAIDS (2007). Uniting the World Against AIDS. Joint United Nations Programme on
HIV/AIDS. Online: http://www.unaids.org/en/Regions_Countries/Countries/angola.asp,
Accessed: 29 June 2007
UNDP (United Nations Development Programme) (2004). World Energy Assessment.
New York, ISBN: 92-1-12617-8, Online: www.undp.org/energy, Accessed: 15 July 2007
UNEP (United Nations Environment Program) (2007). Country Environmental Profile
Information System, Angola. Online: http://countryprofiles.unep.org/countries/AO,
Accessed: 14 September 2007
UNEP-WCMC (2006). World Database on Protected Areas Report. UNEP World
Conservation Monitoring Centre, Supported by the European Commission, 16pp
UNEP-WCMC (2007). Parks, protected areas and world heritage. United Nations
Environmental Programme, World Concervation Monitoring Centre. Online:
http://www.unep-wcmc.org/protected_areas/protected_areas.htm, Accessed: 3 October
2007

141
Van Den Berg, J., Rademakers, L. (2007). Biofuels ‘superpower’ Angola soon to be self-
sufficient in food production. Online: http://biopact.com/2007_01_31_archive.html
Accessed: 30 March 2007
Verweij, P.A., de Man, M. (2005). We cannot afford more biodiversity loss: the urgency
of protected area financing. Copernicus Institute for Sustainable Development and
Innovation, Department of Science, Technology and Society, University of Utrecht, The
Netherlands, 69pp
Watson, H.K., Garland, G.G. (2004). Agronomic, Harvesting and Delivery of Sugar Cane
in Southern Africa – Progress Report. In: Watson, H.K., Garland, G.G., Dercas, N.,
Griffee, P., Johnson, F.X., and Purchase, B. (2007):1. Thematic Report on Agriculture:
Agronomy, Land Resources, Harvesting and Delivery. Cane Resources Network of
Southern Africa (CARENSA) Report to European Commission, Contract ICA-4-2001-
10103.
Watson, H. (2007). Personal communications. Senior Lecture, School of Environmental
Sciences, University of KwaZulu Natal, Durban, South Africa
WDPA (2006). The World Database on Protected Areas Consortium. Online:
http://glcf.umiacs.umd.edu/data/wdpa/wdpa_info/english/DB_NatOAsPolys.html,
Accessed: 5 August 2007
Wells, M.P., McShane, T.O. (2004). Integrating Protected Area Management with Local
Needs and Aspirations. Royal Swedish Academy of Sciences, Ambio, 33(8):513-519
Westley, F., Seal, U., Byers, O., Ness, D. (1998). People and habitat protection. IUCN,
Parks, 8 (1):13-26
WHO (World Health Organisation) (2007). Cholera Country Profile – Angola. Global
Task Force on Cholera, 2pp
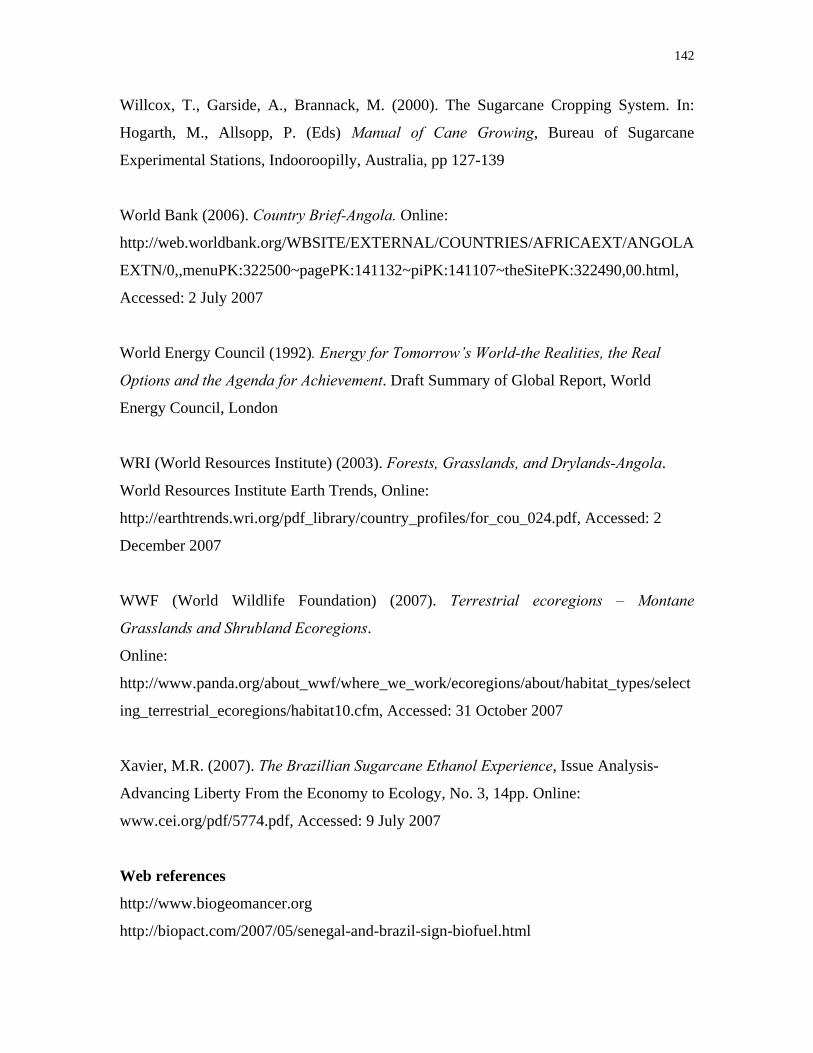
142
Willcox, T., Garside, A., Brannack, M. (2000). The Sugarcane Cropping System. In:
Hogarth, M., Allsopp, P. (Eds) Manual of Cane Growing, Bureau of Sugarcane
Experimental Stations, Indooroopilly, Australia, pp 127-139
World Bank (2006). Country Brief-Angola. Online:
http://web.worldbank.org/WBSITE/EXTERNAL/COUNTRIES/AFRICAEXT/ANGOLA
EXTN/0,,menuPK:322500~pagePK:141132~piPK:141107~theSitePK:322490,00.html,
Accessed: 2 July 2007
World Energy Council (1992). Energy for Tomorrow’s World-the Realities, the Real
Options and the Agenda for Achievement. Draft Summary of Global Report, World
Energy Council, London
WRI (World Resources Institute) (2003). Forests, Grasslands, and Drylands-Angola.
World Resources Institute Earth Trends, Online:
http://earthtrends.wri.org/pdf_library/country_profiles/for_cou_024.pdf, Accessed: 2
December 2007
WWF (World Wildlife Foundation) (2007). Terrestrial ecoregions – Montane
Grasslands and Shrubland Ecoregions.
Online:
http://www.panda.org/about_wwf/where_we_work/ecoregions/about/habitat_types/select
ing_terrestrial_ecoregions/habitat10.cfm, Accessed: 31 October 2007
Xavier, M.R. (2007). The Brazillian Sugarcane Ethanol Experience, Issue Analysis-
Advancing Liberty From the Economy to Ecology, No. 3, 14pp. Online:
www.cei.org/pdf/5774.pdf, Accessed: 9 July 2007
Web references
http://www.biogeomancer.org
http://biopact.com/2007/05/senegal-and-brazil-sign-biofuel.html

143
http://earth.google.com
http://www.esri-africa.com/events/eapic2004/countryoverviews.html
http://sea.unep-wcmc.org/wdpa
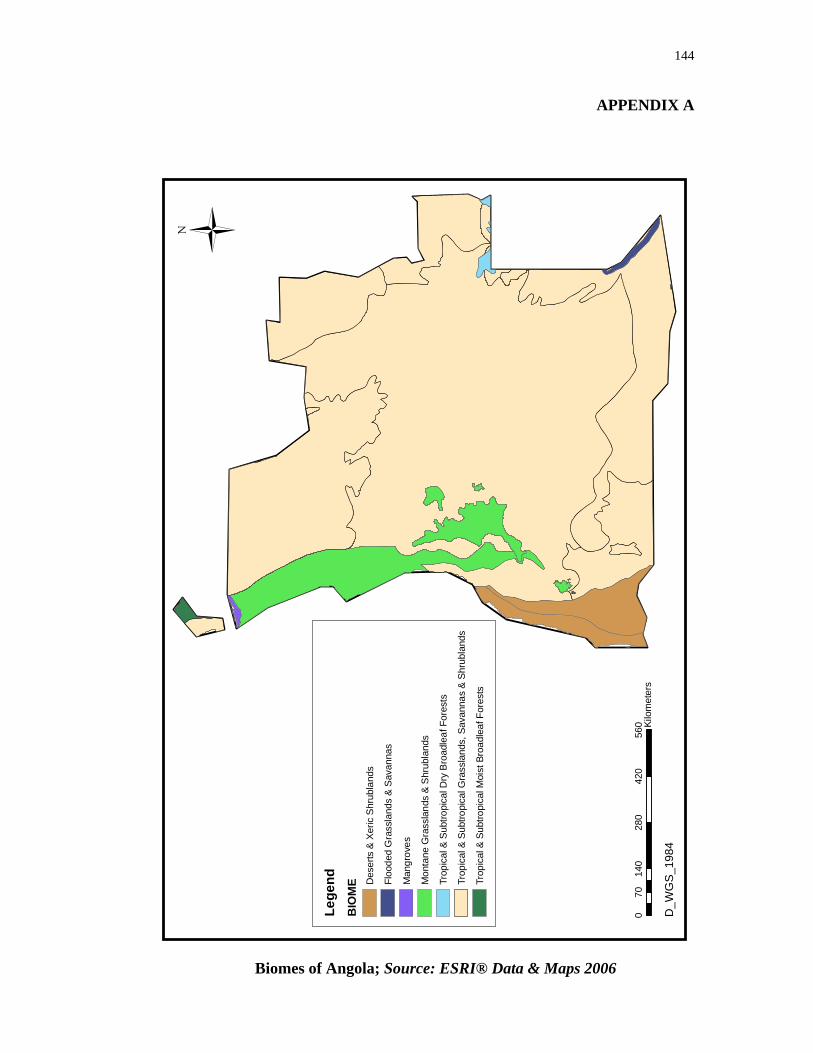
144
APPENDIX A
−
D_W
GS
_198
4
Lege
ndB
IOM
E Des
erts
& X
eric
Shr
ubla
nds
Floo
ded
Gra
ssla
nds
& S
avan
nas
Man
grov
es
Mon
tane
Gra
ssla
nds
& S
hrub
land
s
Trop
ical
& S
ubtro
pica
l Dry
Bro
adle
af F
ores
ts
Trop
ical
& S
ubtro
pica
l Gra
ssla
nds,
Sav
anna
s &
Shr
ubla
nds
Trop
ical
& S
ubtro
pica
l Moi
st B
road
leaf
For
ests
014
028
042
056
070
Kilo
met
ers
Biomes of Angola; Source: ESRI® Data & Maps 2006

145
APPENDIX B
−
LegendRoad description
Trail
Primary Route
Secondary Route
Unknown
0 110 220 330 44055Kilometers
D_WGS_1984
Distribution of Roads in Angola
146
APPENDIX C
LegendRailroad
−
D_WGS_1984
0 0.7 1.4 2.1 2.80.35Kilometers
Mocamedes railway
Luanda railway
Benguela railway
Railroads in Angola

147
APPENDIX D
LegendRiver
−
D_WGS_1984
0 0.75 1.5 2.25 30.375Kilometers
Permanent Rivers in Angola

148
APPENDIX E
Cities in Angola; Source: ESRI® Data & Maps 2006
Uige
Kuito
Luena
Namibe
Huambo
Onjiva
Ngunza
LuandaLucapa
Lubango
Cabinda
MalangeSaurimo
Benguela
Menongue
Ndalatando
Mbanza Congo
−
D_WGS_1984
0 130 260 390 52065Kilometers