GIS Based Multi-Criteria Land Suitability Assessment for ...
33
GIS Based Multi-Criteria Land Suitability Assessment for Future Urban Development in The Country Park Peripheries of Hong Kong Anutosh Das 1*, 2 , Lee Ming Wai Vivian 1 , Wong Yui Hin Isaac 1 , Tang Yuen Ting Kitty 1 , Sayeed Aziz 1 1 Department of Urban Planning and Design, The University of Hong Kong (HKU), Hong Kong. 2 Department of Urban & Regional Planning, Rajshahi University of Engineering & Technology (RUET), Bangladesh. Abstract In recent years, land supply in Hong Kong has fallen sharply and fails to keep pace with the growth of population and number of households. Land shortage becomes urgent and dire. With the inadequate provision of residential land, housing supply is also adversely affected. Insufficient housing supply leads to surging property and rental price in the private market. According to the Rating and Valuation Department (RVD), the overall private domestic price index peaked in June 2017 at 336.1. Keen housing demand is also observed in the private rental market. RVD statistics showed that the domestic rental index also reached the peak at 183.6 in June 2017 and the vacancy rate of about 3.8% as at the end-2016, which is much lower than the average vacancy rate of 5% from 1996 to 2015 (Development Bureau, 2017). In addition, there is soaring housing demand in public housing. As at the end-December 2021, the average waiting time for general applicants was 5.7 years, which is nearly double of the Housing Authority’s target for providing the first flat offer to general applicants at around three years on average (Housing Authority, 2021). Identifying and securing sufficient land to meet both current and anticipated pressing housing demand becomes a key challenge of the government. In the light of this, the government has established a dedicated task force (Task Force on Land Supply) in September 2017 and appointed 30 professionals from different disciplines, such as planning, engineering, academia and think tank, to take a Marco-review on the land supply sources, look for feasible options as well as consider the pros and cons of various options. Preprints (www.preprints.org) | NOT PEER-REVIEWED | Posted: 13 July 2021 doi:10.20944/preprints202107.0294.v1 © 2021 by the author(s). Distributed under a Creative Commons CC BY license.
-
Upload
khangminh22 -
Category
Documents
-
view
2 -
download
0
Transcript of GIS Based Multi-Criteria Land Suitability Assessment for ...

GIS Based Multi-Criteria Land Suitability Assessment for Future Urban
Development in The Country Park Peripheries of Hong Kong
Anutosh Das1*, 2, Lee Ming Wai Vivian1, Wong Yui Hin Isaac1, Tang Yuen Ting Kitty1 ,
Sayeed Aziz1
1Department of Urban Planning and Design, The University of Hong Kong (HKU), Hong Kong.
2Department of Urban & Regional Planning, Rajshahi University of Engineering & Technology
(RUET), Bangladesh.
Abstract
In recent years, land supply in Hong Kong has fallen sharply and fails to keep pace with the growth of
population and number of households. Land shortage becomes urgent and dire. With the inadequate
provision of residential land, housing supply is also adversely affected.
Insufficient housing supply leads to surging property and rental price in the private market. According to
the Rating and Valuation Department (RVD), the overall private domestic price index peaked in June 2017
at 336.1. Keen housing demand is also observed in the private rental market. RVD statistics showed that
the domestic rental index also reached the peak at 183.6 in June 2017 and the vacancy rate of about 3.8%
as at the end-2016, which is much lower than the average vacancy rate of 5% from 1996 to 2015
(Development Bureau, 2017).
In addition, there is soaring housing demand in public housing. As at the end-December 2021, the average
waiting time for general applicants was 5.7 years, which is nearly double of the Housing Authority’s target
for providing the first flat offer to general applicants at around three years on average (Housing Authority,
2021).
Identifying and securing sufficient land to meet both current and anticipated pressing housing demand
becomes a key challenge of the government. In the light of this, the government has established a dedicated
task force (Task Force on Land Supply) in September 2017 and appointed 30 professionals from different
disciplines, such as planning, engineering, academia and think tank, to take a Marco-review on the land
supply sources, look for feasible options as well as consider the pros and cons of various options.
Preprints (www.preprints.org) | NOT PEER-REVIEWED | Posted: 13 July 2021 doi:10.20944/preprints202107.0294.v1
© 2021 by the author(s). Distributed under a Creative Commons CC BY license.

1
18 land supply options were worked out for the public to make choices in the public engagement exercise.
Among the 18 choices, the development area on the Periphery of Country Parks was regarded as one of the
land supplies sources. This option does not only include the Hong Kong Housing Society’s studies on
developing Two Pilot Areas on the Periphery of Tai Lam and Man On Shan Country Parks, but also include
developing more areas on the periphery of Country Parks.
The proposed option received overwhelming attention from the public and aroused debates in various
perspectives. Its ecological value, recreational value, financial viability and even legitimacy were discussed.
However, spatial analysis on the suitability of having residential development in Country Parks has not
been conducted. Therefore, in this study, multi criteria GIS analysis is conducted to evaluate the geographic
suitability of Hong Kong Country Parks for residential purpose with the consideration of various criteria.
Keywords: Land Suitability Analysis, Multi Criteria Analysis, Country Park Periphery, Future Urban
Development.
1. Study Background
1.1. Introduction & History of Country Parks
To effectively protect Hong Kong’s countryside and retain venues for outdoor activities, Country
Parks were designated in accordance with the Country Park Ordinance (Cap.208) in 1976.
Nowadays, a total of 24 Country Parks and 22 special areas, which accounted for 44,312 hectares
(ha) of Hong Kong’s total land area, have been designated for the purposes of nature conservation,
countryside recreation and outdoor education (Development Bureau and Environmental Bureau,
2017).
The Country Park Ordinance provides a legal framework on the development restriction of Country
Parks. Under Section 10 of the Country Park Ordinance, no new development shall be carried out
within the area of the proposed Country Park unless the Agriculture, Fisheries and Conservation
Department (AFCD) has given prior approval. Moreover, existing land use which reduces the
enjoyment of the parks would require rectification under Section 16.
However, the gradual urban sprawl in these 40 years has blurred the separation between urban and
rural that generated development pressure on Country Parks. Precedent developments were found
in Country Parks since 1992 and the Country Parks boundary have been modified twice by the
government for alternative public uses.
The first modification happened in 1992. Around 18 ha of the Clear Water Bay Country Park were
converted into part of the Southeast New Territories Landfill. In 1995, 2 ha of land were excised
from the Tai Lam Country Park for the development of Route 3's approach road (Legislative
Council Secretariat, 2016). This has suggested the possibility to further amend Country Park
boundaries for housing development.
Preprints (www.preprints.org) | NOT PEER-REVIEWED | Posted: 13 July 2021 doi:10.20944/preprints202107.0294.v1

2
1.2. Study Goals and Objectives
The study goal of this study is to explore the potential for residential development on the Country
Park Periphery and opportunities in other conservation areas. Meanwhile, three research questions
are set to guide the analysis:
1. Where are the possible developable sites in Country Park Periphery?
2. To what extent does the development of Country Park contribute to the long-term land
supply for residential development?
3. Are there other conservation areas with higher potential for large scale residential
development?
2. Literature Review and Study Methodology
2.1. Land use suitability assessment
Land use suitability assessment has been widely recognized throughout the world as a powerful
planning and decision-making tool towards future urban development. It primarily aims at detecting
the most suitable land or spatial location for a specific future land use and to estimate the potential
of land for alternative land uses considering a broad and complex set of specific indicators,
preferences, or requirements. The Geographic Information System (GIS) based land suitability
assessment have been broadly applied in different context in real world, e.g., choosing the best
optimum site for the public and private sector amenity facilities (Church, 2002; Eastman et al.,
1993), land suitability for agricultural activities (Cambell et al., 1992; Kalogirou, 2002), regional
planning (Janssen and Rietveld, 1990), evaluation of landscape and planning (Miller et al., 1998).
Table 2.1.1 summarizes different tools, techniques, data and criteria used for land suitability
analysis from available grey literatures.
Following the focus of this research, different literatures have supported the extensive application
of urban residential land-use suitability analysis in urban planning and management to improve the
overall setting of urban residential areas. Optimum locations with high accessibility and proximity
to nearby road networks, major physical infrastructure and free from environmental pollution are
always preferred for urban residential development. Hence, urban residential land suitability
analysis concerns about identifying the best potential sites for future urban residential development
principally comprising a wide array of factors, i.e., safety, comfort, and convenience measures. The
subsequent section will summarize the commonly adopted tools and methods used in land
suitability analysis and will try to comprehend the input from different available literatures input
has been taken from to shape the land suitability assessment methodology, assessment criteria,
specific indicators as well as identifying attributes for the indicators for this particular research.
Preprints (www.preprints.org) | NOT PEER-REVIEWED | Posted: 13 July 2021 doi:10.20944/preprints202107.0294.v1

3
Table 2.1.1 : Different Tools, Techniques, Data And Criteria Used for Land Suitability Analysis from
Grey Literature (Source: Adapted from Liu et al., 2014)
Author Tools or Techniques
Used Land Suitability Criteria Field of Application
Akinci et al., (2013) Analytical Hierarchy
Process (AHP)
Land use and different soil parameters i.e., soil groups,aspect,
elevation, depth, erosion and slope Agricultural Use
Bandyopadhyay et
al., (2009)
Analytical Hierarchy
Process (AHP) LULC, soil type, organic matter, soil depth and slope Agricultural Use
Bojorquez-Tapia et
al., (2001)
GIS-based Multivariate
Model
Vegetation, land cover, soil type, landforms, elevation,
major roads and urban areas Land use Suitability
Cengiz and Akbulak (2009)
Analytical Hierarchy
Process (AHP)
Distance to road and limiting soil factors, Soil depth, land-
use capability class, erosion hazard, slope, elevation, distance
to source of water,
Land use Suitability
Chandio et al.,
(2011)
Analytical Hierarchy
Process (AHP) and
Weighted Linear
Combination (WLC)
Available land, land value and population density Public Parks
Chandio and Matori
(2011)
Percent Correct Match
(PCM)
Accessibility, topography, LULC and economic factors
Hillside development Hillside Development
Feizizadeh and
Blaschke (2012)
Analytical Hierarchy
Process (AHP)
Elevation, slope, aspect, soil fertility, soil pH, temperature,
precipitation and groundwater Agricultural Use
Foshtomi et al.,
(2011)
Square Root and Storied
Method
Soil depth, texture, EC, OC, PH, N, P, K and Cation exchange
capacity Tea plantation
Garcia et al., (2014) Analytical Hierarchy
Process (AHP)
Accessibility, security, needs of the agricultural product
warehouse, acceptance, and costs
Agricultural Product
Warehouse Location
Suitability
Jafari and Zaredar
(2010)
Analytical Hierarchy
Process (AHP)
Slope, elevation, LULC, erosion, climate, soil hydrology, soil
depth, soil structure, soil texture, vegetation types and density,
rainfall, temperature, distance from population centers and
distance from surface water
Rangeland
Management
Joerin et al., (2001) Outranking Multi-
criteria Analysis
Homogeneity Index
Impacts on a nature reserve, landscape, water table, air
pollution, noise, accessibility, climate, landslide, distance to
localities and public facilities
Land use Planning
Preprints (www.preprints.org) | NOT PEER-REVIEWED | Posted: 13 July 2021 doi:10.20944/preprints202107.0294.v1

4
Kalogirou (2002) Boolean Classification
Method
Soil mechanics, toxicities, slope, and flood erosion hazard,
rooting condition, water level and drainage
Farming Land
Suitability
Liu et al., (2014)
Urban Development
Land-use Suitability
Mapping (UDLSM) &
Multi-criteria Evaluation
(MCE)
Multi-disciplinary scientific theories related to physical, socio-
economical, and ecological attributes Urban Development
Luan et al., (2014)
GIS Based Multi
Criteria Decision
Analysis (MCDA)
Factors are related to the topography and geology, socio-
economic feasibility, ecological restrictions, and prohibitive
constraints
Urban Development
Mustafa et al.,
(2011) MCDA Approach Soil depth, texture, EC, OC, pH, N, P, K, ECP
Farming Land
Suitability
Olayeye et al.,
(2008) Index Productivity
Soil depth, temperature, slope, rainfall, humidity, drainage,
texture, EC, OC, pH, N, P, K and cation exchange capacity
Farming (Rice) Land
Suitability (Irrigated
Lowland)
Shalaby et al.,
(2006)
Square Root and Storied
Method
LULC, texture, CaCo3, CaSO4, EC, ECP, organic matter,
soil depth, slope and drainage Crop (Perennial)
Wang (1994) GIS based- Artificial
Neural Networks
Slope, depth, moisture, aeration, fertility, texture, salinity,
temperature, and accessibility Agricultural Use
Zolekar and Bhagat
(2015)
Multi-criteria Land
Suitability Analysis
Slope, soil depth, erosion, moisture, water holding capacities,
texture, and availability of nutrient
Agriculture Use in
Hilly Zone
2.1.1. Commonly Used Multi-criteria Decision Analysis
Geographical Information System (GIS) based Multi-Criteria Decision Analysis (GIS-MCDA) is
the most widely used tool in different literatures to evaluate the land-use suitability for future urban
development. This approach utilises a wide range of methods for the construction of decision
problems as well as for weighting and ranking alternative decisions (Montgomery et al., 2016;
Ozkan et al., 2019; Vladica et al., 2017). Scholars employed different models in determining the
weighting and scoring of respective criteria (Malczewski, 2006; Liao et al., 2019; Park et al., 2011).
Regarding the selection of specific criteria or indicators for land use suitability analysis, historically
it has evolved from the sole use of only physical factors to including ecological and economic-
cultural factors. Nowadays, land suitability indicators are comprehensively selected for research
taking cumulative and parallel input from land-use suitability principles, local experimental data
Preprints (www.preprints.org) | NOT PEER-REVIEWED | Posted: 13 July 2021 doi:10.20944/preprints202107.0294.v1
5
relating the factors to land-use suitability, as well as national and regional guidelines and
international experts’ knowledge (McHarg, 1969; Nguyen et al., 2015; Steiner et al., 2000).
Similar to the scope and aim of this particular research, Liu et al., (2014) and Luan et. al., (2021)
in their research on land suitability assessment for urban development have identified land
suitability factors from four broad key categories i.e., the condition of the topography and geology,
the socio-economic feasibility, the ecological impact, and prohibitive factors. The factors are
further subdivided into specific criteria. In their research, the topographic and geologic factors
include terrain elevation and slope. Socio-economic factors considered the land use type, proximity
to roads, etc. Soil erosion and desertification sensitivity, together with the importance towards
water conservation and biodiversity are included in the ecological factors. Lastly, prohibitive
factors include distance to earthquake fault zones.
Furthermore, to build a flexible land suitability preference aggregation structure, these factors can
be grouped into mandatory or non-mandatory groups, when necessary, under logic scoring of
preference (LSP) method. A scoring and ranking system embedding criterion can be used to rank
each factor’s suitability level to eliminate the influence of dimension with lowest score being the
least suitable and highest score being the most suitable option for urban development (Dujmovic,
1979; Dujmovic et al., 2009; Dujmovic & De Tre, 2011).
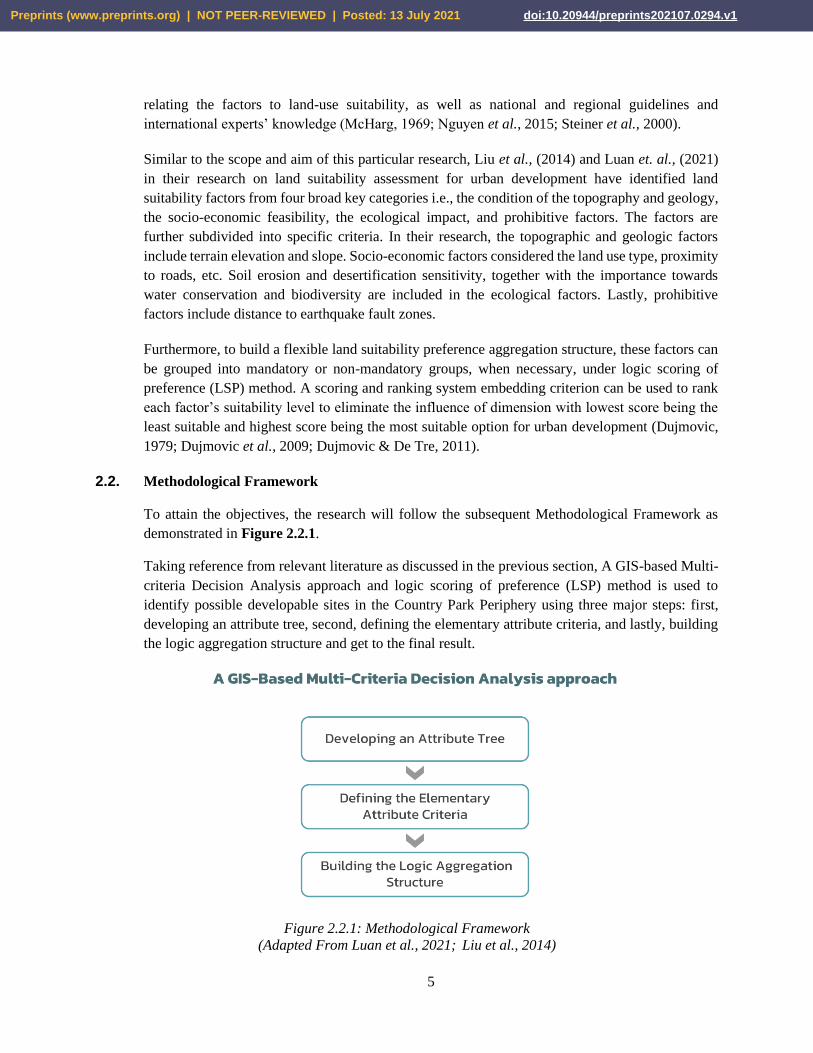
2.2. Methodological Framework
To attain the objectives, the research will follow the subsequent Methodological Framework as
demonstrated in Figure 2.2.1.
Taking reference from relevant literature as discussed in the previous section, A GIS-based Multi-
criteria Decision Analysis approach and logic scoring of preference (LSP) method is used to
identify possible developable sites in the Country Park Periphery using three major steps: first,
developing an attribute tree, second, defining the elementary attribute criteria, and lastly, building
the logic aggregation structure and get to the final result.
Figure 2.2.1: Methodological Framework
(Adapted From Luan et al., 2021; Liu et al., 2014)
Preprints (www.preprints.org) | NOT PEER-REVIEWED | Posted: 13 July 2021 doi:10.20944/preprints202107.0294.v1

6
Following the above framework, an assessment factor system of land use suitability is developed
in the first step. Afterwards, it standardizes all the suitability factors according to the criteria. The
required databases were collected from different open data portals, governmental websites, and
satellite images sources. The detailed data sources are summarized in Table 2.2.1. For the analysis
requirement, some databases such as Country Park Boundaries, Water Gathering Ground,
Ecological Important Stream, SSSI and Conservation Areas which are currently unavailable in
suitable format required manual digitization.
Table 2.2.1: Detailed Source of Required Database
(Source: Author, 2021)
Database Source of Database
Outline Zoning Plan (iB5000)
Hong Kong Open Data Portals
1. HK open data Portal (https://data.gov.hk/en/)
2. Open Geo-Spatial Data in HK
(https://opendata.esrichina.hk/)
3. Hong Kong Geodata Store
(https://geodata.gov.hk/gs/)
Railway Station & Road Network (iC5000)
Country Park Boundaries
Terrain Height (DTM)
Slope (DTM)
Old & Valuable Trees GOVHK (2021), “Nature Conservation: Register of Old &
Valuable Trees”
Declared Monuments & Historic Buildings Antiquities and Monuments Office (AMO), HKSAR (2021)
Ecological Important Streams Agriculture, Fisheries and Conservation Department (AFCD),
HKSAR (2021a)
Priority Sites for Enhanced Conservation Agriculture, Fisheries and Conservation Department (AFCD),
HKSAR (2021b)
Water Gathering Grounds Water Supplies Department (WSD), HKSAR (2021)
Satellite Images of Land Cover
USGS (Landsat Data: LANDSAT C1 Level 1 Data, LANDSAT
8 OLI/TIRS)
Preprints (www.preprints.org) | NOT PEER-REVIEWED | Posted: 13 July 2021 doi:10.20944/preprints202107.0294.v1

7
2.2.1. Assessment Criteria
Three broad sets of suitability indicators related to the topography and geology, proximity
to major infrastructures and ecological / archaeological restrictions are considered to evaluate the
land-use suitability taking reference from similar research of Liu et al., (2014) and Luan et. al.,
(2014). Figure 2.2.2 demonstrates how a multi-criteria decision-making approach is adopted
concerning urban residential development land suitability analysis.
Secondly, attributes for the specific suitability indicators are identified taking reference
from different relevant available standards and guidelines from grey literature with consideration
on local contexts. Considering the ecological impact and technical feasibility, the topography and
geology indicator set consists of the terrain height, slope, and manmade slope. The proximity to
infrastructure indicator set includes distance from major roads and railway stations. Ecological /
Archaeological indicator set constitutes Ecological important streams, conservation areas,
Reservoir, Land Cover, water gathering ground, Declared Heritages as well as old and valuable
trees.
Figure 2.2.2: Multi-criteria Concerning Urban Residential Development Land Suitability
(Source: Author, 2021)
Given the maximum technical difficulties that could be overcome and the tolerable impacts of a
development on the environment, the above-mentioned indicators are classified into 2 categories,
which are the Prohibitive (No-go) and Preferential (scoring system) as demonstrated in Figure
2.2.3. To exemplify, if the Slope is more than 25 degrees or the site is within 100 meters of an
ecological important stream, the site would be eliminated from further study. On the contrary, if
Preprints (www.preprints.org) | NOT PEER-REVIEWED | Posted: 13 July 2021 doi:10.20944/preprints202107.0294.v1

8
the attributes of the specific indicators falls below the prohibitive range, for example the slope is
less than 25 degree and the site is away from at least 100 meter of an ecological important stream,
the indicators will go through a further scoring system to assess the land suitability. Special
considerations are required for some indicators to be included in the land suitability assessment
process.
Figure 2.2.3: Land Suitability Assessment Criteria for Residential Development
(Reference Standards & Guidelines: 1 Luan et al., 2021; 2 Liu et al., 2014;3 Sing Tao Daily report, 2013; 4AFCD, 2021; 5 WSD, 2021; 6 HKPSG,2019; 7 AMO, HKSAR, 2021; 8 GOVHK, 2021)
Furthermore, to assist decision makers to rank the results, a scoring system is used to quantify the
opportunity and constraint levels ranging from 1 to 5 (Table 2.2.3). The scoring system is built
according to relevant literature and local guidelines (i.e., Hong Kong Planning Standards and
Guidelines) with a proper understanding of each factor's intrinsic properties and its impact on land
suitability for housing development. The Slope and elevation score assignment is based on the
parameters adopted in Liu et al., (2004) for studies in China. The proximity to transport
infrastructure score took reference of the parameters suggested in the Hong Kong Planning
Standards and Guidelines (HKPSG), in which activity nodes generators and attractors should
preferably locate within 500m and 1,000m distance. While it is only a recommended distance
between major nodes and transport infrastructures, the scoring system extends up to 1,500m for a
broader brush evaluation. Here, a higher score indicates a higher degree of opportunity or lower
degree of constraint for development. The resultant score is classified into 5 levels with level 1 is
the least preferred and level 5 is the most preferred option for land suitability.
Preprints (www.preprints.org) | NOT PEER-REVIEWED | Posted: 13 July 2021 doi:10.20944/preprints202107.0294.v1

9
Figure 2.2.3: Scoring Table
(Source: Author, 2021)
2.2.2. The Three Study Scenarios
Due to the absence of definition for Country Park Periphery, we explored 3 different scenarios in
this study. For the first scenario, only the Country Park Periphery, which is a 600m buffer area
away from the Country Park Boundaries has been considered. The total area under scenario 1 covers
nearly 20% of the total area of Hong Kong. The adopted standard for 600-meter buffer has been
referenced from the Government’s research on residential development near the Tai Lam Country
Park.
For the second scenario, both the Country Park area and 600-meter peripheral buffer region is
considered, and it constitutes nearly 67% of the total area of HK.
Finally, the third scenario considered other opportunities building on the foundation of scenario 2.
Lands for conservation purposes which are zoned as green belt and other areas that are not covered
by Outline Zoning Plans (OZP) are included (OZP Excluded Area). Yet, lands that are zoned as
other than Country Park or green belt uses in OZP would be excluded from scenario 3. Scenario 3
covers 65% of Hong Kong total area.
Preprints (www.preprints.org) | NOT PEER-REVIEWED | Posted: 13 July 2021 doi:10.20944/preprints202107.0294.v1

10
Figure 2.2.2.1 Indicative Maps for the 3 Scenarios
(Source: Author, 2021)
Preprints (www.preprints.org) | NOT PEER-REVIEWED | Posted: 13 July 2021 doi:10.20944/preprints202107.0294.v1

11
3. Study Process
The spatial analysis is conducted based on the Study Area (Figure 3.1.1) which is created as the
Union result of Scenario 1 & 3. After going through the study process, final results of each
Scenarios could be clipped accordingly. Overall speaking, the prohibitive (No-go) areas will first
be eliminated from the Study Area, followed by the preferential scoring system and the special
considerations.
Figure 3.1.1: Study Area
3.1. Prohibitive (No-go) Areas
Figures 3.1.2 - 3.1.4 document the elimination of Prohibitive (No-go) areas. First, the areas located
more than 1,500m away from Major Roads and Junctions are eliminated. As road networks are
usually only connected up to the peripheral areas of Country Parks, only the peripheral belt remains.
Second, ecological no-go areas which are: Reservoirs, Conservation Areas, Special Areas, Ramsar
Site, Enhanced Conservation Areas Land Cover (Water) and Ecological Important Streams are
eliminated. As many of the other conservation areas such as “Site of Special Scientific Interest
(SSSI)”, “Coastal Protection Area”, “Conservation Areas” are included in the OZP, it has been
excluded from the Study Area during earlier procedures. Third, slope and elevation that are not
suitable for housing development would be eliminated which result in the remaining areas as shown
in Figure 3.1.4.
Preprints (www.preprints.org) | NOT PEER-REVIEWED | Posted: 13 July 2021 doi:10.20944/preprints202107.0294.v1

12
Figure 3.1.2: Prohibitive (No-go) Areas (Excluding >1,500m away from Major Road and
Junctions)
(Source: Author, 2021)
Figure 3.1.3: Prohibitive (No-go) Areas (Ecological)
(Source: Author, 2021)
Preprints (www.preprints.org) | NOT PEER-REVIEWED | Posted: 13 July 2021 doi:10.20944/preprints202107.0294.v1

13
Figure 3.1.4: Prohibitive (No-go) Areas (Topographic & Geological)
(Source: Author, 2021)
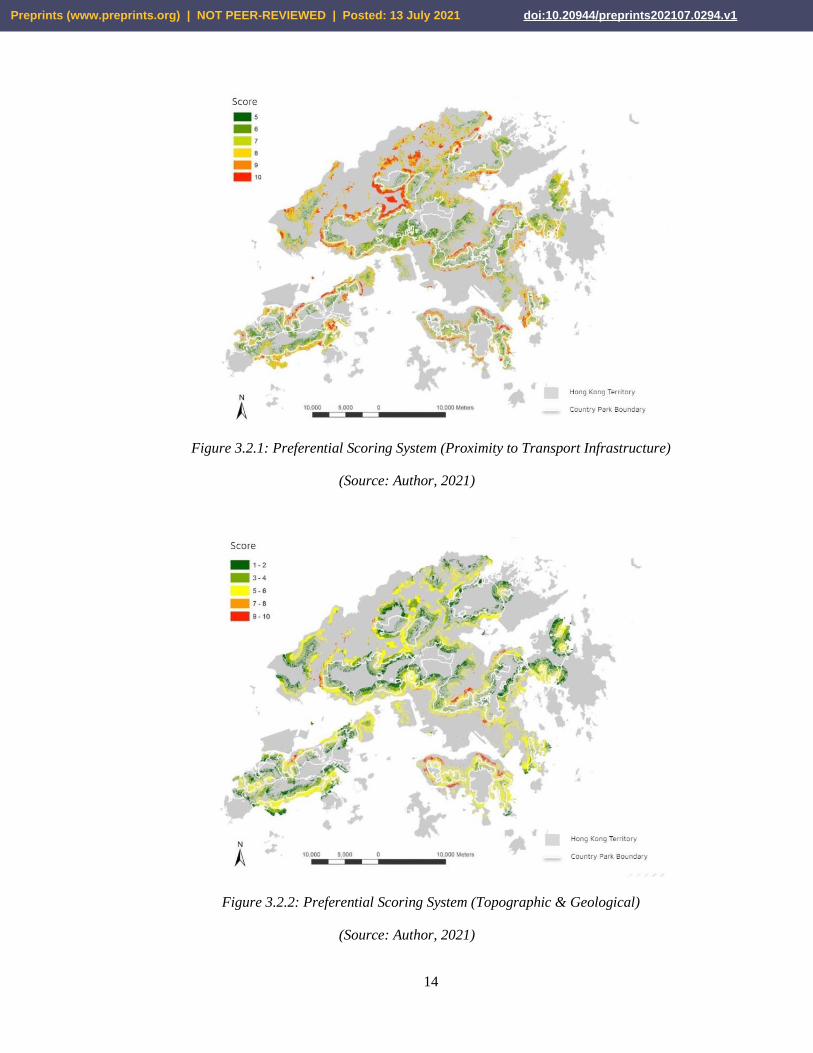
3.2. Preferential Scoring System
Figures 3.2.1 - 3.2.2 document the scoring procedures according to the proximity to transport
infrastructures (Major Road and Junction, Railway Station) and topographic & geological
considerations (Slope and Elevation).
Preprints (www.preprints.org) | NOT PEER-REVIEWED | Posted: 13 July 2021 doi:10.20944/preprints202107.0294.v1
14
Figure 3.2.1: Preferential Scoring System (Proximity to Transport Infrastructure)
(Source: Author, 2021)
Figure 3.2.2: Preferential Scoring System (Topographic & Geological)
(Source: Author, 2021)
Preprints (www.preprints.org) | NOT PEER-REVIEWED | Posted: 13 July 2021 doi:10.20944/preprints202107.0294.v1

15
3.3. Special Considerations
Special considerations are some of the factors considered by the planning authority in individual
development proposals. This part serves as preliminary assessment of potential sites detailed in
Section 4.3.
First, the potential sites will be checked against the list of Declared Monument, Historic Buildings
and Old & Valuable Trees. If these features are identified within potential sites, technical
assessments would be required to measure the impact. Mitigation measures are also required to
ensure minimal adverse impacts. While development of these sites are still possible, it would
require more complex procedures.
Second, the area of Water Gathering Grounds are also taken into consideration. Water Gathering
Grounds are currently protected by the Country Park Ordinance and contribute to the local yield of
water supply, detailed examination on its impact towards water management strategies should be
conducted before the development of these sites.
Third, land cover classification should also be reviewed. It is to note that even though land cover
is not the determining factor for site selection, as developing non-vegetated areas would have less
landscape and visual impact, these areas would have a higher priority.
Figure 3.3.1: Declared Monument, Historic Buildings and Old & Valuable Trees
(Source: Author, 2021)
Preprints (www.preprints.org) | NOT PEER-REVIEWED | Posted: 13 July 2021 doi:10.20944/preprints202107.0294.v1

16
Figure 3.3.2: Water Gathering Ground
(Source: Author, 2021)
Figure 3.3.3: Land Cover Classification
(Source: Author, 2021)
Preprints (www.preprints.org) | NOT PEER-REVIEWED | Posted: 13 July 2021 doi:10.20944/preprints202107.0294.v1

17
3.4. Identification of Potential Sites
Given the non-uniform scoring pattern, it is expected that a potential site would consist of areas
with varied performances in topographical & geological aspects, as well as proximity to
infrastructure. Identification of the site would require further processing of data to average the
scoring within an aggregated area (Figure 3.4.1). In such, the raster format has been converted into
vector and processed into 30m x 30m grids through the Grid Index Features function (Figure
3.4.2). This step intends to leverage on the varied size of vector shapes. The grids could also be
clipped against the shape file of different scenarios. Afterwards, the Summarize within function
could be adopted to calculate the mean score within each grid. With a new shape file created based
on grids scoring of 14 or above, the Aggregate Polygon tool could be adopted with the minimum
site area as 0.5ha (Figure 3.4.2). The final step would be to apply the Summarize Within function
to obtain the mean score of each aggregated polygon. Results could be sorted based on the size and
the scoring of the site to fulfill different land use requirements.
Figure 3.4.1: Overview of potential sites identification
Figure 3.4.2: Demonstration of potential sites identification
Preprints (www.preprints.org) | NOT PEER-REVIEWED | Posted: 13 July 2021 doi:10.20944/preprints202107.0294.v1

18
4. Results Analysis
4.1. Overall Suitability Results
After conducting the analysis through the study process outlined in Section 3, the following results
were produced (Figure 4.1.1). The map shows the suitability scoring for the remaining areas, after
the elimination of prohibitive (No-go) areas from the Study Area. The suitability scoring is divided
into 5 tiers based on the natural breaks classification, a score between 16-20 indicates the highest
suitability, which are the areas shown in red below. It was observed that areas with highest
suitability are out of the Country Park boundaries (grey lines in the figure), questioning the
suitability of land supply from Country Parks for residential development. Further discussions
would be presented in the following sections.
Figure 4.1.1: Overall Scoring Map
(Source: Author, 2021)
Table 4.1.1 summarized the results from the map above, showing the breakdown of the areas by
the scenarios and by the suitability tiers. It is to note that the area presented in the table was
calculated by aggregating all the areas with scores falling within the same score range tier. The
minimum developable size of each individual site would be considered in the next step.
Preprints (www.preprints.org) | NOT PEER-REVIEWED | Posted: 13 July 2021 doi:10.20944/preprints202107.0294.v1

19
Table 4.1.1: Breakdown of the areas in each tier of suitability for the 3 scenarios
Scenario 1 Scenario 2 Scenario 3
Score Area (ha) % Area (ha) % Area (ha) %
1-4 1891.841 8.56 10880.45 14.71 13697.25 19.09
5-8 3827.48 17.30 9940.559 13.43 13623.7 18.99
9-12 2983.603 13.49 9407.356 12.71 13332.25 18.58
13-15 1623.56 7.35 2218.163 3.00 6156.447 8.58
16-20 52.53083 0.24 53.74656 0.07 580.6527 0.81
Subtotal 10379.01 46.94 32500.27 43.92 47390.3 66.05
Prohibitive
(No-go) 2094.35 9.47 31850.2 43.05 24364.6 33.95
Excluded 9640 43.59 9640 13.03 N/A N/A
Total 22113.36 100 73990.47 100 71754.9 100
(Source: Author, 2021)
Apart from the breakdown of the areas and percentages for respective score ranges, the figures for
prohibitive (No-go) areas and excluded areas are also presented. As mentioned in Section 3, the
Study Area is created through the union of Scenario 1 & 3. The 600m buffer areas away from the
Country Park Boundaries, which is the Country Park Periphery, might overlap with the existing
developed areas. Thus, these developed areas are excluded from scoring based on their zonings,
which are those zoned as other than Country Park and green belt uses. The explanation for
prohibitive areas could be referred to Section 3.1.
Looking into the prohibitive areas, both the figures for the area and percentage surge when
switching the analysis from Scenario 1 to 2. The figures remain at a similar level in Scenario 3.
With the inclusion of Country Parks, the portion of prohibitive areas has dramatically increased;
whereas the inclusion of green belts and OZP Excluded Areas did not cause an increase to the
prohibitive areas. It could be argued that most of the ecological sensitive areas and areas with steep
slopes are located within the extent of Country Parks. As mentioned, development should not occur
Preprints (www.preprints.org) | NOT PEER-REVIEWED | Posted: 13 July 2021 doi:10.20944/preprints202107.0294.v1

20
in these areas, thus posing a question to the suitability of land within Country Parks for development
once again.
Across the three scenarios, areas with the highest suitability (scores ranging from 16-20) remain as
an extremely small portion for each scenario, suggesting that suitable land for development is
limited from the territory scale. However, when comparing the actual figures for areas with the
highest suitability, the area increased by nearly ten fold in Scenario 3 while remaining about the
same for Scenario 1 and 2. Even if the analysis was expanded into Country Parks (Scenario 1 to 2),
there is not a significant increase for the land that is suitable for development. The inherited
constraints within Country Parks, steep slopes and the lack of essential road networks, have led to
the low suitability at the moment. On the other hand, the significant increase in the actual area of
suitable lands in Scenario 3 indicates that the inclusion of green belts and other conservation areas
brought additional opportunities for development. Green belts might be a more prosperous option
for land supply when compared to Country Parks. It is important to note that the current analysis
was based on the criteria set out in Section 2.2.1, which the lands beyond 1,500m from road
networks are not considered. However, some of the areas within Country Parks match the above
description and are excluded from the analysis. This is to ensure that preferential sites could be
identified as vehicular access is crucial for any kind of development. As a result, upon the expansion
of road networks in the future, the areas within Country Parks could be reconsidered; which the
highly suitable areas might increase. Section 5.1, as a sensitive analysis illustrated the scenarios in
which the criteria of road networks and accessibility were removed.
4.2. Examination of Developable Sites
As mentioned, Table 4.1.1 only aggregated all the areas without considering the minimum size for
development. The criteria of 0.5 ha was thus added and neighbouring areas were aggregated to
form land parcels with an area of at least 0.5 ha. This parameter is referenced to the recent public
housing development in Tseung Kwan O on lands zoned as green belt (Sai Kung District Council,
2019). The aggregated land parcels with an average score of 14 or above were chosen for further
analysis and further classified in different sizes (Table 4.2.1).
Preprints (www.preprints.org) | NOT PEER-REVIEWED | Posted: 13 July 2021 doi:10.20944/preprints202107.0294.v1

21
Table 4.2.1: Breakdown of Developable Sites
Scenario 1 Scenario 2 Scenario 3
Area (ha) No. of Land Parcels No. of Land Parcels No. of Land Parcels
0.5 - 1 6 6 17
1 - 3 5 5 24
3 - 5 1 1 6
5 - 10 1 1 12
>10 0 0 6
Total 13 13 65
Area (ha) 26.7 26.7 272.2
No. of Flats1 19,426 19,426 179,256
Population2 54,394 54,394 501,918
(Source: Author, 2021)
From the table, most of the land parcels identified in Scenarios 1 & 2 are rather small with 6 land
parcels having a total area of 0.5 - 1 ha, which are only suitable for single residential tower
development. Large sites, land parcels with an area above 10 ha, could only be identified in
Scenario 3, where green belts and OZP Excluded Areas are considered. These large sites allow
comprehensive development and may result in better planning outcomes, creating more well-
structured neighborhoods. Among the 6 large land parcels identified in Scenario 3, 94% of the areas
1 The number of flats was estimated based on this equation:
[Site area x Plot Ratio x 0.9 (assuming some of the areas not to be used as flats)] / 45 (average flat size in m2)]
Average flat size varies with the plot ratio, the value of 45m2 is adopted for sites with higher
Density and 60m2 is adopted for sites with lower density 2 The population number was estimated by assuming the average household size is 2.8
Preprints (www.preprints.org) | NOT PEER-REVIEWED | Posted: 13 July 2021 doi:10.20944/preprints202107.0294.v1

22
are zoned as green belt, 5.7% are currently not covered by OZPs and only a mere 0.3% are Country
Park areas. Thus, green belt areas once again perform as a better option for being the land supply
for residential development when compared to Country Parks.
The estimated number of flats and population figures echo with the argument that there are greater
development potential for green belt areas. As the land parcels remain unchanged for Scenario 1 &
2, so do the estimated number of flats and population. No matter which scenario, only the Country
Park Periphery or adding Country Park areas, are considered, the results are the same. Considering
areas within Country Parks would not result in an increase of developable sites and estimated
number of flats. However, the preliminary analysis showed that if green belts and other areas are
considered, the developable sites could accommodate 9 times more of the population than the
original estimation. The development potential of green belt areas should not be neglected.
4.3. Selected Potential Sites
Among the developable sites of the three scenarios, 6 sites were selected to be discussed
below where preliminary development parameters were proposed.
4.3.1. Sites from Scenario 1 & 2
The first site scores the highest with an average score of 14.7 which is located at Tuen Mun Lam
Tei. The site is around 8.12 ha and falls within an area zoned Green Belt on the Lam Tei and Yick
Yuen OZP (S/TM-LTYY/10). It is near the Siu Hong MTR station and is located 300m from a
public housing estate (Fu Tai Estate). It is proposed that the site could be rezoned to R(A) with a
plot ratio 5, which 8,120 units could be provided to accommodate around 22,700 people.
Location Lam Tei, Tuen Mun
Average Score 14.7
Area (ha) 8.12
Plot Ratio 5
Existing &
Recommended Zoning GB → R(A)
No. of Flats approx. 8120
Projected Population 22,700
Figure 4.3.1.1: A Site located in Lam Tei
The second site is a land parcel located at the northern east of Chi Lok Fa Yuen that is close to
Tuen Mun Town Centre, which also falls within an area zoned Green Belt on the Tuen Mun OZP
(S/TM/35). Given the surrounding low-density development, the site is proposed to be rezoned to
R(A) with a plot ratio of 4.
Preprints (www.preprints.org) | NOT PEER-REVIEWED | Posted: 13 July 2021 doi:10.20944/preprints202107.0294.v1

23
Location Tuen Mun
Average Score 14.56
Area (ha) 1.21
Plot Ratio 4
Existing &
Recommended Zoning GB → R(A)
No. of Flats approx. 700
Projected Population 1,960
Figure 4.3.1.2: A Site located in Tuen Mun
The third selected site is located at the western side of Cheung Muk Tau Village in Wu Kai Sha. It
is zoned as Green Belt on the Ma On Shan OZP (S/MOS/23). Although the site is located next to
the village, as the Government is proposing an amendment of plan next to the selected site from
Green Belt to Residential (Group A) with a plot ratio of 6.8 (Town Planning Board, 2020), the
selected site will have a similar development density.
Location Wu Kai Sha, Sha Tin
Average Score 15.19
Area (ha) 0.73
Plot Ratio 5
Existing &
Recommended Zoning GB → R(A)
No. of Flats approx. 730
Projected Population 2,044
Figure 4.3.1.3: A Site located in Wu Kai Sha
4.3.2. Sites from Scenario 3
As mentioned in Section 4.2, large land parcels could be identified in Scenario 3. Thus some of the
larger land parcels were selected to be showcased below.
The first site is a 27.9 hectares site located at Tong Yan San Tsuen, Yuen Long, besides the Yuen
Long South Development. The site is zoned Green Belt on the Tong Yan San Tsuen OZP (S/YL-
TYST/13). Large scale comprehensive development could be proposed on the site and it is
estimated that 28,000 housing units can be provided to accommodate around 78,400 persons.
Preprints (www.preprints.org) | NOT PEER-REVIEWED | Posted: 13 July 2021 doi:10.20944/preprints202107.0294.v1

24
Location Tong Yan San Tsuen,
Yuen Long
Average Score 14.29
Area (ha) 27.9
Plot Ratio 6.5
Existing &
Recommended Zoning GB → R(A)
No. of Flats approx. 28,000
Projected Population 78,400
Figure 4.3.2.1: A Site located in Yuen Long
The second site is located at Wong Kong Shan, Fanling. The site falls within an area zoned Green
Belt on the Fanling / Sheung Shui OZP (S/FSS/24). It is close to Fanling Town Centre and within
a walkable distance from the MTR station.
Location Wong Kong Shan,
Fanling
Average Score 14.1
Area (ha) 4.64
Plot Ratio 6.5
Existing &
Recommended Zoning GB → R(A)
No. of Flats approx. 5,300
Projected Population 14,840
Figure 4.3.2.2: A Site located in Fanling
The last site is located at Kwu Tung, Lok Ma Chau, besides the Kwu Tung New Development Area
(NDA). The site falls within an area zoned Green Belt on the San Tin OZP (S/YL-ST/8). Given the
surrounding low density development and the overall planning principle adopted in Kwu Tung
NDA, it is proposed that the site could be rezoned to Residential (Group B) with a plot ratio of 3.
Preprints (www.preprints.org) | NOT PEER-REVIEWED | Posted: 13 July 2021 doi:10.20944/preprints202107.0294.v1

25
Location Kwu Tung, Lok Ma
Chau
Average Score 14.27
Area (ha) 4.03
Plot Ratio 3
Existing &
Recommended Zoning GB → R(B)
No. of Flats approx. 1,600
Projected Population 4,480
Figure 4.3.2.3: A Site located in Kwu Tung
5. Discussion
5.1. Explorative Option within Country Parks upon expansion of road network
As mentioned in Section 2.2.1, areas with proximity to Major Road and Junction larger than 1500m
were excluded in previous analysis. To examine the long-term potential of developing within
Country Park boundaries upon the expansion of road network, analysis on the topography and
elevation of sites within the boundaries have been examined. After thorough examination, only two
potential sites have land parcels with relatively high slope and elevation scores which are more
suitable for development as housing sites. These two sites are 19.1 ha Wong Shek Site located
within Sai Kung East Country Park and 18.2 ha Yi O Site located within Lantau South Country
Park (Figure 5.1.1). However, the Wong Shek site is within the Pak Tam Chung Barrier while the
Yi O Site is within the Lantau Closed Road Area in which special permits are required for vehicular
access. With reference to Legislative Council Questions (2020), the road closure is intended to
control the number of vehicles for natural conservation purposes. This reveals the relatively high
conservation value of these two sites within the Country Park area in which residential development
bringing in a large population might not be suitable.
Preprints (www.preprints.org) | NOT PEER-REVIEWED | Posted: 13 July 2021 doi:10.20944/preprints202107.0294.v1

26
Figure 5.1.1: Wong Shek and Yi O Site within Country Park Boundaries
While the 2 sites with suitable topography and elevation is not suitable for residential development,
bringing in other technical and socio-political factors, it is expected that areas within the Country
Park Boundaries have very limited potential for cost-efficient and sustainable residential
development.
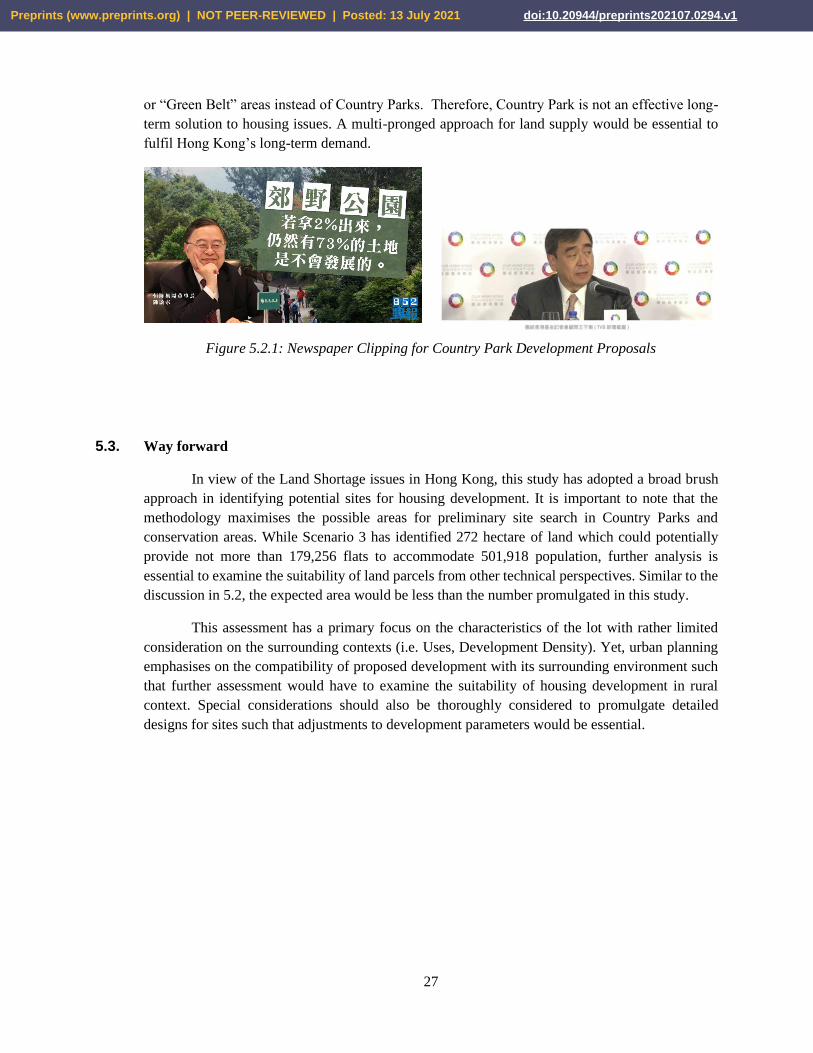
5.2. The Discourse of “Country Park as a long-term solution to housing issue”
In recent years, there are emerging debates on developing Country Parks to resolve housing issues.
While the Hong Kong 2030+ pinpointed the challenges to develop Country Parks and conservation
areas, some significant figures in the society proposed Country Park as the solution to Land
Shortage issues. Most recommendations emphasize on developing 3% of the total Country Park
areas to fulfill the 1,200 ha of shortfall identified by the Taskforce for Land Supply (2018).
Although Country Parks cover three-quarters of Hong Kong’s land, our preliminary assessment
illustrates that not more than 26.7 ha of land would be suitable for development. This gave rise to
not more than 19,400 flats accommodating a total population of 54,000. With the total housing
supply target by 2027/28 as 460,000 (Taskforce for Land Supply, 2018), it is estimated that housing
development within Country Parks and its periphery could only contribute to not more than 4.2%
of the target. After taking into the consideration of land use compatibility and site reduction factor,
it is expected that the actual provision will fall short of the expected number.
While the 3% proposal sounds promising, the public should not be misled by the suggestions as
they lack considerations on the physical and technical constraints of Country Parks. Moreover, this
study pinpointed the potential to identify sites from other conservation zones such as OZP excluded
Preprints (www.preprints.org) | NOT PEER-REVIEWED | Posted: 13 July 2021 doi:10.20944/preprints202107.0294.v1
27
or “Green Belt” areas instead of Country Parks. Therefore, Country Park is not an effective long-
term solution to housing issues. A multi-pronged approach for land supply would be essential to
fulfil Hong Kong’s long-term demand.
Figure 5.2.1: Newspaper Clipping for Country Park Development Proposals
5.3. Way forward
In view of the Land Shortage issues in Hong Kong, this study has adopted a broad brush
approach in identifying potential sites for housing development. It is important to note that the
methodology maximises the possible areas for preliminary site search in Country Parks and
conservation areas. While Scenario 3 has identified 272 hectare of land which could potentially
provide not more than 179,256 flats to accommodate 501,918 population, further analysis is
essential to examine the suitability of land parcels from other technical perspectives. Similar to the
discussion in 5.2, the expected area would be less than the number promulgated in this study.
This assessment has a primary focus on the characteristics of the lot with rather limited
consideration on the surrounding contexts (i.e. Uses, Development Density). Yet, urban planning
emphasises on the compatibility of proposed development with its surrounding environment such
that further assessment would have to examine the suitability of housing development in rural
context. Special considerations should also be thoroughly considered to promulgate detailed
designs for sites such that adjustments to development parameters would be essential.
Preprints (www.preprints.org) | NOT PEER-REVIEWED | Posted: 13 July 2021 doi:10.20944/preprints202107.0294.v1

28
References
Agriculture, Fisheries and Conservation Department (AFCD), HKSAR, 2021a. “Ecologically
Important Streams”, Retrieved From:
https://www.afcd.gov.hk/english/conservation/con_wet/streams_rivers_hk/Con_NSR/
Ecologically_Important_Streams.html
Agriculture, Fisheries and Conservation Department (AFCD), HKSAR, 2021b. “List of Priority
Sites for Enhanced Conservation”, Retrieved From:
https://www.afcd.gov.hk/english/conservation/con_nncp/con_nncp_list/con_nncp_list.html
Akinci, H., Ozalp, A.Y., Turgut, B., 2013. Agriculture land use suitability analysis using GIS and
AHP technique. Comput. Electron. Agric. 97, 71–82.
An, P., Moon, W.M. and Bonham-Carter, G.F., 1994. Uncertainty management in integration of
exploration data using the belief function. Nonrenewable Resources, 3(1), pp.60-71.
Antiquities and Monuments Office (AMO), HKSAR, 2021. “Declared Monuments, Historical
Buildings”, Retrieved From: https://www.amo.gov.hk/en/main.php
Bandyopadhyay, S., Jaiswal, R.K., Hegde, V.S., Jayaraman, V., 2009. Assessment of land
suitability potentials for agriculture using a remote sensing and GIS based approach. Int. J. Rem.
Sens. 30 (4), 879–895.
Bojan, K., Kristina, Š., Vladica, C., Nemanja, K. and Nemanja, P., 2017. A reinterpretation of the
geological map of northwestern part of Lece Volcanic Complex. In 13th Workshop on Alpine
Geological Studies, Zlatibor Mts (p. 55).
Bojorquez-Tapia, L.A., Diaz-Mondragon, S., Ezcurra, E., 2001. GIS-based approach for
participatory decision making and land suitability assessment. Int. J. Geogr. Inform. Sci. 15 (2),
129–151.
Brail, R.K. and Klosterman, R.E., 2001. Planning support systems: Integrating geographic
information systems, models, and visualization tools. ESRI, Inc..
Collins, A.R., Dusinska, M. and Horská, A., 2001. Detection of alkylation damage in human
lymphocyte DNA with the comet assay. Acta Biochimica Polonica, 48(3), pp.611-614.
Cengiz, T., Akbulak, C., 2009. Application of analytical hierarchy process and geographic
information systems in land-use suitability evaluation: a case study of Dumrek village. Int. J.
Sustain. Develop. World Ecol. 16 (4), 286–294.
Chandio, I.A., Matori, A.N., 2011. GIS-based multi-criteria decision analysis of land suitability for
hillside development. Int. J. Environ. Sci. Develop. 2 (6), 468–473
Chandio, I.A., Matori, A.N., Lawal, D.U., Sabri, S., 2011. GIS-based land suitability analysis using
AHP for public parks planning in Larkana City. Mod. Appl. Sci. 5 (4), 177–189.
Preprints (www.preprints.org) | NOT PEER-REVIEWED | Posted: 13 July 2021 doi:10.20944/preprints202107.0294.v1

29
Dujmovic, I., Mangano, K., Pekmezovic, T., Quattrocchi, C., Mesaros, S., Stojsavljevic, N.,
Nicoletti, F. and Drulovic, J., 2009. The analysis of IL-1 beta and its naturally occurring inhibitors
in multiple sclerosis: The elevation of IL-1 receptor antagonist and IL-1 receptor type II after
steroid therapy. Journal of neuroimmunology, 207(1-2), pp.101-106.
Eastman, J.R. and Fulk, M., 1993. Long sequence time series evaluation using standardized
principal components. Photogrammetric Engineering and remote sensing, 59(6).
Feizizadeh, B. and Blaschke, T., 2012. Land suitability analysis for Tabriz County, Iran: a multi-
criteria evaluation approach using GIS. Journal of Environmental Planning and Management,
56(1), pp.1-23.
Foshtomi, M.D., Norouzi, M., Rezaei, M., Akef, M., Akbarzadeh, A., 2011. Qualitative and
economic land suitability evaluation for Tea in sloping area of Guilan, Iran. J. Biol. Environ. Sci.
5 (15), 135–146.
Garcia, J.L., Alvarado, A., Blanco, J., Jimenez, E., Maldonado, A.A., Cortés, G., 2014. Multi-
attribute evaluation and selection of sites for agricultural product warehouses based on an analytic
hierarchy process. Comput. Electron. Agric. 100, 60–69.
GOVHK (2021), “Nature Conservation: Register of Old & Valuable Trees”, Retrieved from:
https://www.gov.hk/en/residents/environment/conservation/regoldvaluetree.htm
Hong Kong Planning Standards and Guidelines (HKPSG), HKSAR , 2019. “Chapter 08:Internal
Transport Facilities”, Retrieved from:
https://www.pland.gov.hk/pland_en/tech_doc/hkpsg/full/pdf/ch8.pdf
Hopkins, L.D., 1977. Methods for generating land suitability maps: a comparative evaluation.
Journal of the American Institute of Planners, 43(4), pp.386-400.
Hong Kong SAR, Development Bureau, 2017. Task Force on Land Supply - Demand for Land.
Retrieved from: https://www.devb.gov.hk/filemanager/en/content_1054/Paper_02_2017.pdf.
Hong Kong SAR, Development Bureau ,2017. Task Force on Land Supply - Developing Country
Parks. Retrieved from:
https://www.devb.gov.hk/filemanager/en/content_1054/Paper_11_2017.pdf
Hong Kong SAR, Development Bureau, Task Force on Land Supply, 2018. Striving for Multi-
pronged Land Supply - Report of the Task Force on Land Supply. Retrieved from:
https://www.devb.gov.hk/filemanager/en/content_1171/Report%20(Eng).pdf.
Hong Kong SAR, Hong Kong Housing Authority, 2021. Number of Applications and Average
Waiting Time for Public Rental Housing. Retrieved from:
https://www.housingauthority.gov.hk/en/about-us/publications-and-statistics/prh-applications-
average-waiting-time/
Preprints (www.preprints.org) | NOT PEER-REVIEWED | Posted: 13 July 2021 doi:10.20944/preprints202107.0294.v1

30
Hong Kong SAR, Legislative Council Secretariat, 2016. Country parks and protected areas in
Hong Kong. Retrieved from: https://www.legco.gov.hk/research-publications/english/essentials-
1617ise06-country-parks-and-protected-areas-in-hong-kong.htm
Jafari, S. and Zaredar, N., 2010. Land Suitability Analysis using Multi AttributeDecision Making
Approach. International journal of environmental science and development, 1(5), p.441.
Janssen, R. and Rietveld, P., 1990. Multicriteria analysis and geographical information systems: an
application to agricultural land use in the Netherlands. In Geographical information systems for
urban and regional planning (pp. 129-139). Springer, Dordrecht.
Joerin, F., Theriault, M., Musy, A., 2001. Using GIS and outranking multi-criteria analysis for land-
use suitability assessment. Int. J. Geogr. Inform. Sci. 15 (2), 153–174.
Kalogirou, S., 2002. Expert systems and GIS: an application of land suitability evaluation.
Computers, environment and urban systems, 26(2-3), pp.89-112.
Kendall, J.M., Sala-Newby, G., Ghalaut, V., Dormer, R.L. and Cambell, A.K., 1992. Engineering
the Ca2+-activated photoprotein aequorin with reduced affinity for calcium. Biochemical and
biophysical research communications, 187(2), pp.1091-1097.
Liao, Y., Wang, J., Jaehnig, E.J., Shi, Z. and Zhang, B., 2019. WebGestalt 2019: gene set analysis
toolkit with revamped UIs and APIs. Nucleic acids research, 47(W1), pp.W199-W205.
Liu, R., Zhang, K., Zhang, Z. and Borthwick, A.G., 2014. Land-use suitability analysis for urban
development in Beijing. Journal of environmental management, 145, pp.170-179.
Luan, C., Liu, R. and Peng, S., 2021. Land-use suitability assessment for urban development using
a GIS-based soft computing approach: A case study of Ili Valley, China. Ecological Indicators,
123, p.107333.
Malczewski, J., 2006. GIS‐based multicriteria decision analysis: a survey of the literature.
International journal of geographical information science, 20(7), pp.703-726.
McHarg, I.L., 1969. Design with nature (pp. 7-17). New York: American Museum of Natural
History.
Moreno, D. and Seigel, M., 1988, November. A GIS approach for corridor siting and environmental
impact analysis. In GIS/LIS (Vol. 88, pp. 507-514).
Mustafa, A.A., Singh, M., Sahoo, R.N., Ahmed, N., Khanna, M., Sarangi, A., 2011. Land suitability
analysis for different crops: a multi-criteria decision making approach using remote sensing and
GIS. Researcher 3 (12), 61–84.
Myers, R.H., Montgomery, D.C. and Anderson-Cook, C.M., 2016. Response surface methodology:
process and product optimization using designed experiments. John Wiley & Sons.
Preprints (www.preprints.org) | NOT PEER-REVIEWED | Posted: 13 July 2021 doi:10.20944/preprints202107.0294.v1
31
Olayeye, A.O., Akinbols, G.E., Marake, V.M., Molete, S.F., Mapheshoane, B., 2008. Soil in
suitability evaluation for irrigated lowland rice culture in South-western Nigeria: management
implications for sustainability. Commun. Soil Sci. Plant Anal. 39, 2920–2938.
Ramya, S. and Devadas, V., 2019. Integration of GIS, AHP and TOPSIS in evaluating suitable
locations for industrial development: A case of Tehri Garhwal district, Uttarakhand, India. Journal
of Cleaner Production, 238, p.117872.
Park, H.M., 2011. Practical guides to panel data modeling: a step-by-step analysis using stata.
Public Management and Policy Analysis Program, Graduate School of International Relations,
International University of Japan, 12, pp.1-52.
Pereira, J.M. and Duckstein, L., 1993. A multiple criteria decision-making approach to GIS-based
land suitability evaluation. International journal of geographical Information science, 7(5),
pp.407-424.
Sai Kung District Council, 2019. Site Formation and Infrastructure Works for Public Housing
Developments at Tseung Kwan O. Retrieved from:
https://www.districtcouncils.gov.hk/sk/doc/2016_2019/sc/dc_meetings_doc/16988/SK_2019_150
pr_TC.pdf?fbclid=IwAR3r8ifDULbu_mO3aFcM6ForEnUxpFJ3VmMdo7stvXzsDeWotjqfO7xfb
M8
Segre, D., Vitkup, D. and Church, G.M., 2002. Analysis of optimality in natural and perturbed
metabolic networks. Proceedings of the National Academy of Sciences, 99(23), pp.15112-15117.
Shalaby, A., Ouma, Y.O., Tateishi, R., 2006. Land suitability assessment for perennial crops using
remote sensing and geographic information systems: a case study in North-western Egypt. Arch.
Agron. Soil Sci. 52 (3), 243–261.
Sing Tao Daily report (February 13, 2013), “Geotechnical Office: Building a house on a large
slope is feasible”, Sing Tao Daily.
Store, R. and Kangas, J., 2001. Integrating spatial multi-criteria evaluation and expert knowledge
for GIS-based habitat suitability modelling. Landscape and urban planning, 55(2), pp.79-93.
Task Force on Land Supply, 2018. “Land for Hong Kong: Our Home, Our Say!”. Retrieved
From: https://www.devb.gov.hk/filemanager/en/content_1051/Land_Supply_En_Booklet.pdf
The Government of the HKSAR, 2020. “LCQ: Closed roads in South Lantau”, Press Releases.
Retrieved From:
https://www.info.gov.hk/gia/general/202012/16/P2020121600216.htm?fontSize=1
Town Planning Board, 2020). “DRAFT MA ON SHAN OUTLINE ZONING PLAN NO. S/MOS/23”.
Retrieved From:
https://www2.ozp.tpb.gov.hk/plan/ozp_plan_notes/en/S_MOS_23_e.pdf#nameddest=Amend
Preprints (www.preprints.org) | NOT PEER-REVIEWED | Posted: 13 July 2021 doi:10.20944/preprints202107.0294.v1

32
Wang, F., 1994. The use of artificial neural networks in a geographical information system for
agricultural land-suitability assessment. Environ. Plan. A 26 (2), 265–284.
Water Supplies Department (WSD), HKSAR, 2021. “Water Resources”, Retrieved From:
https://www.wsd.gov.hk/en/core-businesses/water-resources/local-yield/index.html
Yip, C.S., 2019. Ex-commissioner for Census and Statistics: Developing 3% of Country Park Areas
to relieve Housing Affordability Issues. Ming Pao Finance. Retrieved From:
https://www.mpfinance.com/fin/dailyp2.php?node=1572463256656&issue=20191031
Zolekar, R. B., & Bhagat, V. S., 2015. Multi-criteria land suitability analysis for agriculture in hilly
zone: Remote sensing and GIS approach. Computers and Electronics in Agriculture, 118, 300-321.
Preprints (www.preprints.org) | NOT PEER-REVIEWED | Posted: 13 July 2021 doi:10.20944/preprints202107.0294.v1