GIS based spatial distribution mapping and suitability evaluation of groundwater quality for...
11
ORIGINAL ARTICLE GIS based spatial distribution mapping and suitability evaluation of groundwater quality for domestic and agricultural purpose in Kaithal district, Haryana state, India Sanjay Kumar Goyal • B. S. Chaudhary • Omvir Singh • G. K. Sethi • Praveen K. Thakur Received: 30 July 2009 / Accepted: 11 January 2010 / Published online: 4 February 2010 Ó Springer-Verlag 2010 Abstract Groundwater is a major resource for meeting huge domestic and agricultural requirements of Kaithal district in Haryana. Therefore, evaluation of its quality in terms of suitability for domestic and agricultural sectors is necessary for sustainable management of the resource. The present study has analyzed pre- and post-monsoon physico- chemical data of groundwater samples from bore wells spread over the entire district. Spatial distribution maps were generated for hydrogen ion concentration, total dis- solved solids, total hardness, electrical conductivity, sodium adsorption ratio, residual sodium carbonate and percent sodium using the geographic information system. Furthermore, the study area was demarcated into different groundwater quality zones for domestic and agricultural use by applying various national and international stan- dards. It was observed from the study that the groundwater was predominantly hard, alkaline and saline in nature. However, it was within safe limits for domestic use. Fur- ther, it was also experienced from the analysis that in about two-third parts of the district, groundwater was in desirable-to-permissible quality class for agricultural use but hazardous for soil as well as for crops in the remaining part. Also, a moderation in water quality was observed after the monsoon season, which can be attributed to a possible dilution due to groundwater recharge. Keywords Groundwater quality Kaithal GIS Spatial distribution Domestic India Introduction The demand for fresh water has increased significantly throughout the world due to population growth, socioeco- nomic development, technological and climatic changes (Alcamo et al. 2007). Groundwater is a replenishable resource which is used for domestic, agricultural and industrial purposes in most parts of the world. The suitability of groundwater for a particular use depends upon its quality, which is determined by solutes and gases dissolved as well as matter suspended or floating in it (Todd and Mays 2005). The lack of clean drinking water is adversely affecting the general health and life expectancy of the people in many developing countries (Nash and McCall 1995). Moreover, poor water quality for irrigation is a constant threat to crop yield as well as soil physical conditions (Ayers and Westcot 1994; Patel et al. 2004; Marechal et al. 2006).Therefore, groundwater quality plays a major role in planning water supply, water quality management, public health manage- ment, and environmental management. Various investigations have shown that groundwater is highly susceptible to pollution from natural as well as anthropogenic factors (Kovar and Krasney 1995; Appelo and Postma 1996; Jain and Sharma 2000). In India, there has been deterioration in groundwater quality due to over- S. K. Goyal (&) B. S. Chaudhary Department of Geophysics, Kurukshetra University, Kurukshetra 136119, India e-mail: [email protected] O. Singh Department of Geography, Kurukshetra University, Kurukshetra 136119, India G. K. Sethi M.L.N. College, Yamuna Nagar 135003, India P. K. Thakur Indian Institute of Remote Sensing, Dehradun 248001, India 123 Environ Earth Sci (2010) 61:1587–1597 DOI 10.1007/s12665-010-0472-z
Transcript of GIS based spatial distribution mapping and suitability evaluation of groundwater quality for...
ORIGINAL ARTICLE
GIS based spatial distribution mapping and suitability evaluationof groundwater quality for domestic and agricultural purposein Kaithal district, Haryana state, India
Sanjay Kumar Goyal • B. S. Chaudhary •
Omvir Singh • G. K. Sethi • Praveen K. Thakur
Received: 30 July 2009 / Accepted: 11 January 2010 / Published online: 4 February 2010
� Springer-Verlag 2010
Abstract Groundwater is a major resource for meeting
huge domestic and agricultural requirements of Kaithal
district in Haryana. Therefore, evaluation of its quality in
terms of suitability for domestic and agricultural sectors is
necessary for sustainable management of the resource. The
present study has analyzed pre- and post-monsoon physico-
chemical data of groundwater samples from bore wells
spread over the entire district. Spatial distribution maps
were generated for hydrogen ion concentration, total dis-
solved solids, total hardness, electrical conductivity,
sodium adsorption ratio, residual sodium carbonate and
percent sodium using the geographic information system.
Furthermore, the study area was demarcated into different
groundwater quality zones for domestic and agricultural
use by applying various national and international stan-
dards. It was observed from the study that the groundwater
was predominantly hard, alkaline and saline in nature.
However, it was within safe limits for domestic use. Fur-
ther, it was also experienced from the analysis that in about
two-third parts of the district, groundwater was in
desirable-to-permissible quality class for agricultural use
but hazardous for soil as well as for crops in the remaining
part. Also, a moderation in water quality was observed
after the monsoon season, which can be attributed to a
possible dilution due to groundwater recharge.
Keywords Groundwater quality � Kaithal � GIS �Spatial distribution � Domestic � India
Introduction
The demand for fresh water has increased significantly
throughout the world due to population growth, socioeco-
nomic development, technological and climatic changes
(Alcamo et al. 2007). Groundwater is a replenishable
resource which is used for domestic, agricultural and
industrial purposes in most parts of the world. The suitability
of groundwater for a particular use depends upon its quality,
which is determined by solutes and gases dissolved as well
as matter suspended or floating in it (Todd and Mays 2005).
The lack of clean drinking water is adversely affecting the
general health and life expectancy of the people in many
developing countries (Nash and McCall 1995). Moreover,
poor water quality for irrigation is a constant threat to crop
yield as well as soil physical conditions (Ayers and Westcot
1994; Patel et al. 2004; Marechal et al. 2006).Therefore,
groundwater quality plays a major role in planning water
supply, water quality management, public health manage-
ment, and environmental management.
Various investigations have shown that groundwater is
highly susceptible to pollution from natural as well as
anthropogenic factors (Kovar and Krasney 1995; Appelo
and Postma 1996; Jain and Sharma 2000). In India, there
has been deterioration in groundwater quality due to over-
S. K. Goyal (&) � B. S. Chaudhary
Department of Geophysics, Kurukshetra University,
Kurukshetra 136119, India
e-mail: [email protected]
O. Singh
Department of Geography, Kurukshetra University,
Kurukshetra 136119, India
G. K. Sethi
M.L.N. College, Yamuna Nagar 135003, India
P. K. Thakur
Indian Institute of Remote Sensing, Dehradun 248001, India
123
Environ Earth Sci (2010) 61:1587–1597
DOI 10.1007/s12665-010-0472-z

exploitation of groundwater, indiscriminate use of chemi-
cals in agriculture, and untreated effluents from industrial
and domestic sectors (Palaniswami and Ramulu 1994;
Datta et al. 2000). Therefore, the evaluation and analysis of
chemical composition of groundwater is necessary to
determine its suitability for different uses. Heath (1998)
classified the suitability of groundwater for domestic use
on the basis of hydrogen ion concentration (pH), total
dissolved solids (TDS) and total hardness (TH). Numerous
studies (Richards 1954; Wilcox 1955; Lloyd and Heathcote
1985) have determined the suitability of irrigation water
from its sodium adsorption ratio (SAR), residual sodium
carbonate (RSC), electrical conductivity (EC) and percent
sodium (PS).
Geographic information system (GIS) is an efficient and
effective tool in solving problems where spatial data are
important. Therefore, it is widely used for assessment of
water quality and developing solutions for water resources
related problems (Chaudhary et al. 1996).
Kaithal district of Haryana, India, is an agriculture
dominated area. The general cropping pattern of the district
is rice–wheat. Due to limited availability of surface water,
huge irrigation requirements for paddy are met largely by
drawing water from aquifers. Moreover, there is indis-
criminate use of chemical fertilizers and pesticides to
increase production. Owing to prevailing conditions, there
is growing concern for the quality of groundwater thus
making it necessary to evaluate its suitability for sustain-
able management of this precious resource.
Objectives
The study has been carried out with the following main
objectives:
1. To assess the pre-monsoon (June) and post-monsoon
(October) groundwater quality.
2. To demarcate the study area into different groundwater
quality suitability zones for domestic as well as
agricultural use conforming to the latest quality
standards.
3. To study the effect of monsoon recharge on ground-
water quality.
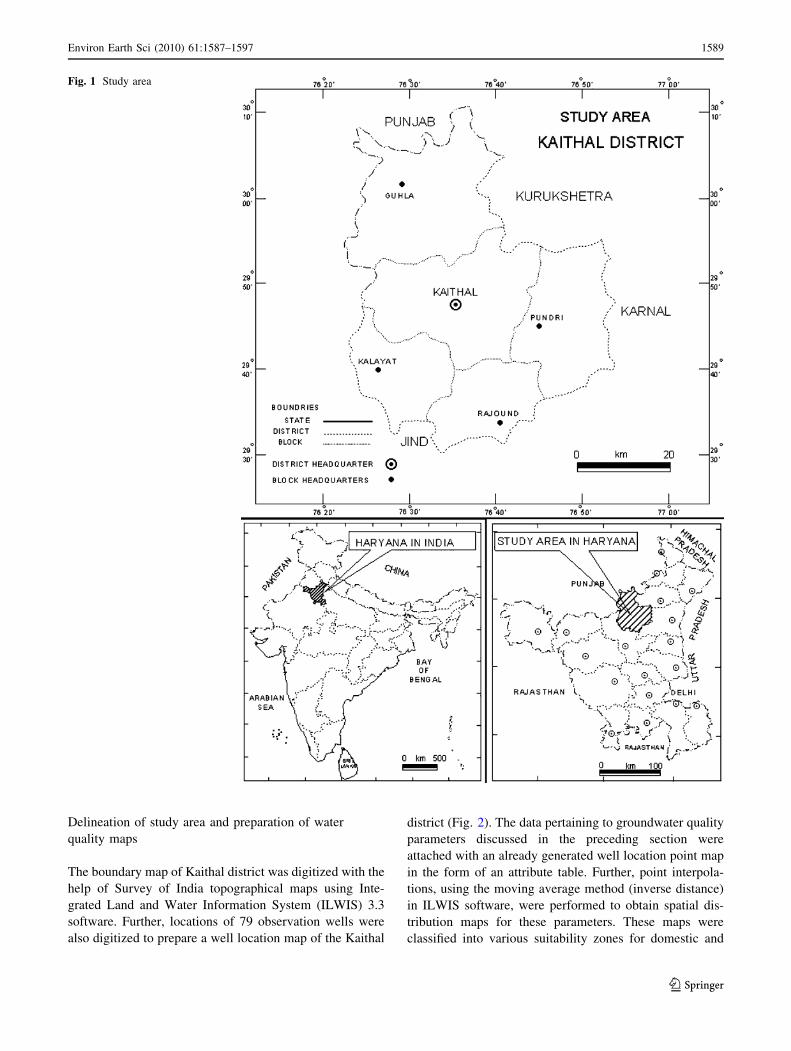
Study area
The Kaithal district forms a part of the upper Ghaggar
basin in the vast Indo-Gangetic alluvial plain. The district
is located between 29�320 to 30�120N latitude and 76�080 to
76�450E longitude and covers an area of about 2,284 km2
(Fig. 1). The general elevation of the area ranges from 217
to 252 m above mean sea level showing a gentle slope
from northeast to southwest. The climate of the district is
sub-tropical monsoon type. The temperature starts rising
from March and continues till June end. May and June are
the hottest months with the daily maximum temperature at
about 40�C. During winters, the temperature starts
decreasing by the middle of November. January is the
coldest month. The average annual rainfall in the district is
about 528 mm and almost 80% of the total annual rainfall
occurs during the monsoon period (July–September). The
net irrigated area in the district in 2007–2008 was
1,331 km2, out of which, 521 km2 (40%) was irrigated by a
network of distributaries and minors of the Western Jam-
una Canal (WJC) and 1,852 km2 (60%) by tube wells. The
average density of tube wells in the district in 2007–2008
was more than 25 tube wells per km2, putting high pressure
on the groundwater resources of the district (State statis-
tical abstract 2009).
Materials and methods
Collection of data and determination of groundwater
quality parameters
Periodic groundwater quality data [pH, EC, TDS,
(Ca2? ? Mg2?), Na?, HCO3-
, CO32- and Cl-] for 79
observation wells in Kaithal district pertaining to pre- and
post- monsoon for the year 2007 were obtained from
Groundwater Cell, Department of Agriculture, Kurukshe-
tra. Other collateral data related to quality standards
(national and international), groundwater depth etc. were
collected from published literature. Further, total hardness
(TH), sodium adsorption ratio (SAR), residual sodium
carbonate (RSC) and percent sodium (PS) were calculated
from ionic concentrations (meq/l) of (Ca2? ? Mg2?), Na?,
HCO3-, CO3
2- and Cl- using the following standard
procedures.
TH ¼ CaþMgð Þ � 50 ð1Þ
SAR ¼ Naffiffiffiffiffiffiffiffiffiffiffiffiffiffiffiffiffiffiffiffiffiffiffiffiffiffiffi
ðCaþMgÞ=2p ð2Þ
PS ¼ Naþ K
CaþMgþ Naþ K� 100 ð3Þ
RSC ¼ CO3 þ HCO3
� �
� CaþMgð Þ ð4Þ
The suitability of groundwater for domestic use was
determined on the basis of pH, TH and TDS and by
comparing them with the Bureau of Indian Standards (BIS)
recommendations. Further, groundwater suitability for
irrigation was classified in terms of EC, SAR, RSC and
PS by applying United States Salinity Laboratory (USSL),
and European Economic Community (EEC) criteria.
1588 Environ Earth Sci (2010) 61:1587–1597
123
Delineation of study area and preparation of water
quality maps
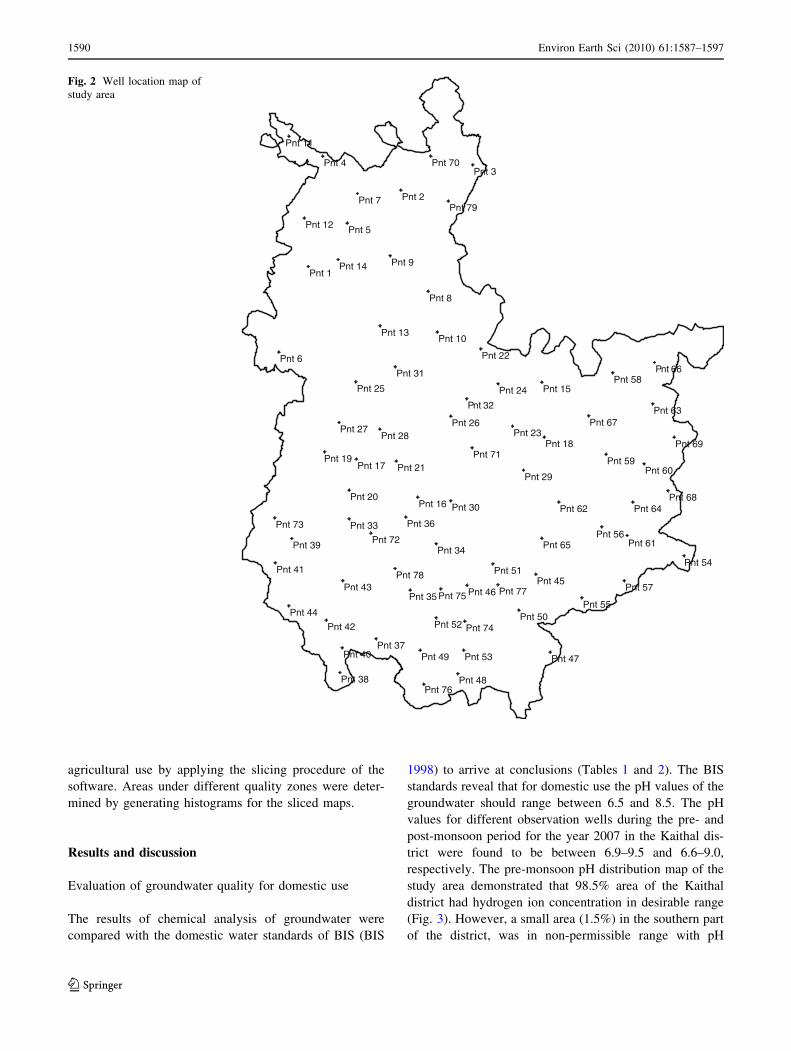
The boundary map of Kaithal district was digitized with the
help of Survey of India topographical maps using Inte-
grated Land and Water Information System (ILWIS) 3.3
software. Further, locations of 79 observation wells were
also digitized to prepare a well location map of the Kaithal
district (Fig. 2). The data pertaining to groundwater quality
parameters discussed in the preceding section were
attached with an already generated well location point map
in the form of an attribute table. Further, point interpola-
tions, using the moving average method (inverse distance)
in ILWIS software, were performed to obtain spatial dis-
tribution maps for these parameters. These maps were
classified into various suitability zones for domestic and
Fig. 1 Study area
Environ Earth Sci (2010) 61:1587–1597 1589
123
agricultural use by applying the slicing procedure of the
software. Areas under different quality zones were deter-
mined by generating histograms for the sliced maps.
Results and discussion
Evaluation of groundwater quality for domestic use
The results of chemical analysis of groundwater were
compared with the domestic water standards of BIS (BIS
1998) to arrive at conclusions (Tables 1 and 2). The BIS
standards reveal that for domestic use the pH values of the
groundwater should range between 6.5 and 8.5. The pH
values for different observation wells during the pre- and
post-monsoon period for the year 2007 in the Kaithal dis-
trict were found to be between 6.9–9.5 and 6.6–9.0,
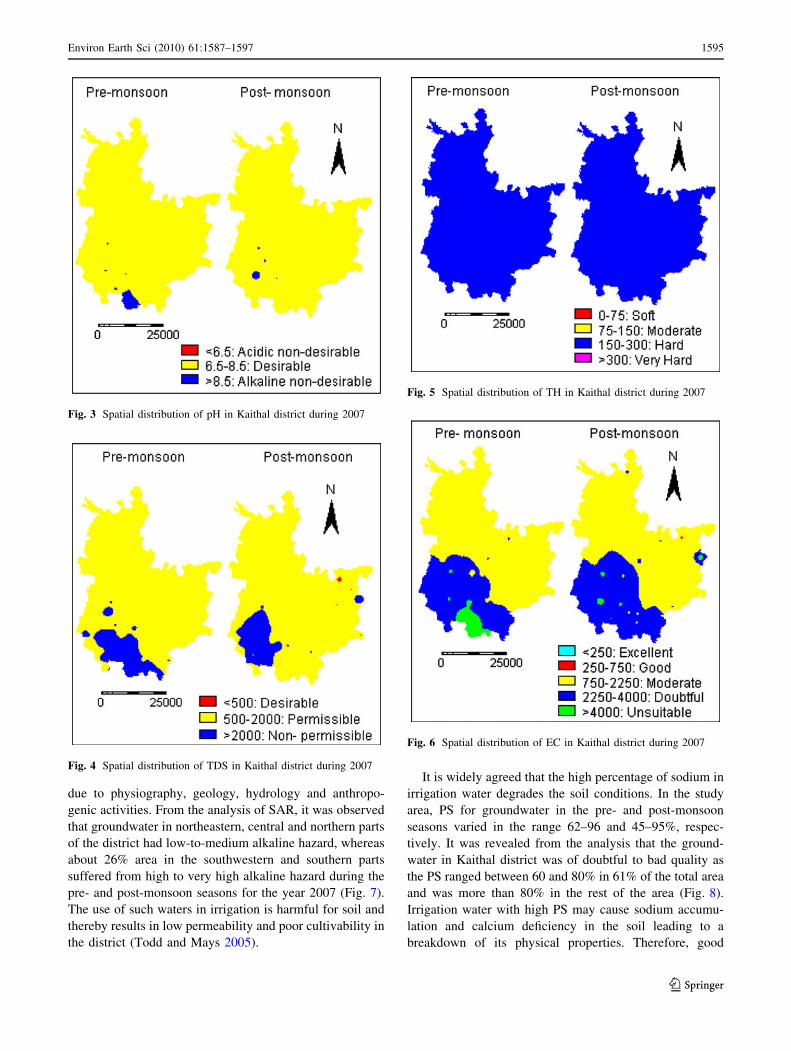
respectively. The pre-monsoon pH distribution map of the
study area demonstrated that 98.5% area of the Kaithal
district had hydrogen ion concentration in desirable range
(Fig. 3). However, a small area (1.5%) in the southern part
of the district, was in non-permissible range with pH
Pnt 1
Pnt 2
Pnt 3Pnt 4
Pnt 5
Pnt 6
Pnt 7
Pnt 8
Pnt 9
Pnt 10
Pnt 11
Pnt 12
Pnt 13
Pnt 14
Pnt 15
Pnt 16
Pnt 17
Pnt 18
Pnt 19
Pnt 20
Pnt 21
Pnt 22
Pnt 23
Pnt 24Pnt 25
Pnt 26Pnt 27
Pnt 28
Pnt 29
Pnt 30
Pnt 31
Pnt 32
Pnt 33
Pnt 34
Pnt 35
Pnt 36
Pnt 37
Pnt 38
Pnt 39
Pnt 40
Pnt 41
Pnt 42
Pnt 43
Pnt 44
Pnt 45Pnt 46
Pnt 47
Pnt 48
Pnt 49
Pnt 50
Pnt 51
Pnt 52
Pnt 53
Pnt 54
Pnt 55
Pnt 56
Pnt 57
Pnt 58
Pnt 59Pnt 60
Pnt 61
Pnt 62
Pnt 63
Pnt 64
Pnt 65
Pnt 66
Pnt 67
Pnt 68
Pnt 69
Pnt 70
Pnt 71
Pnt 72
Pnt 73
Pnt 74
Pnt 75
Pnt 76
Pnt 77
Pnt 78
Pnt 79
Fig. 2 Well location map of
study area
1590 Environ Earth Sci (2010) 61:1587–1597
123
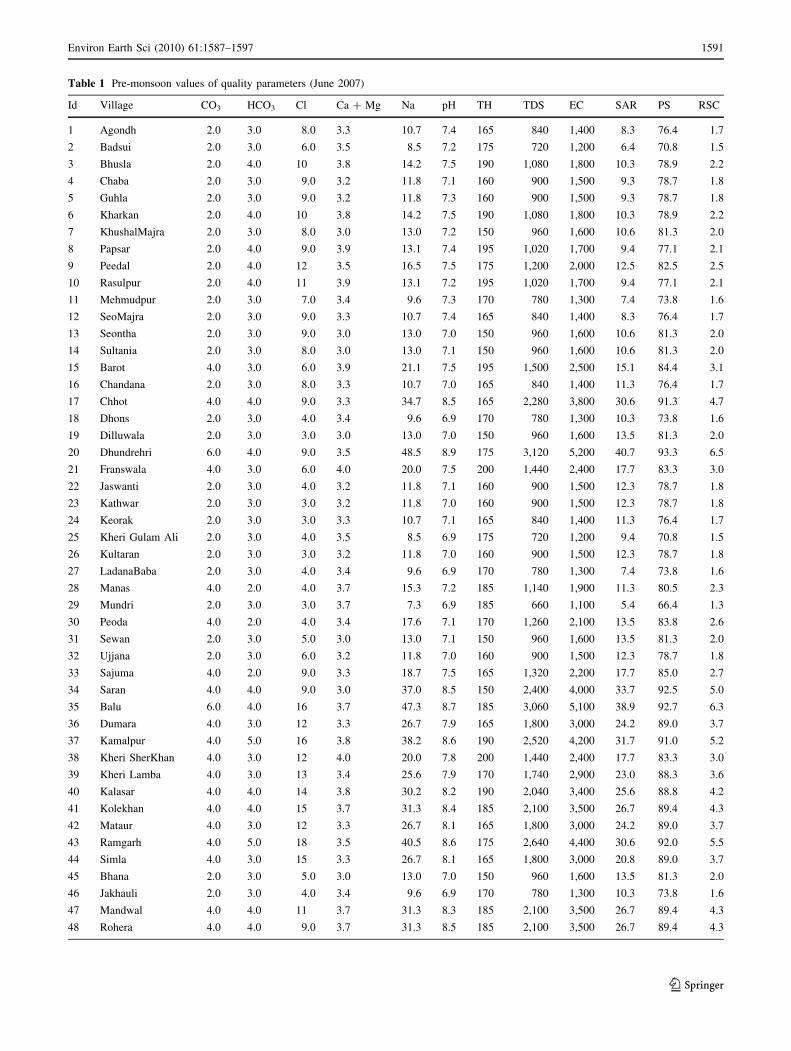
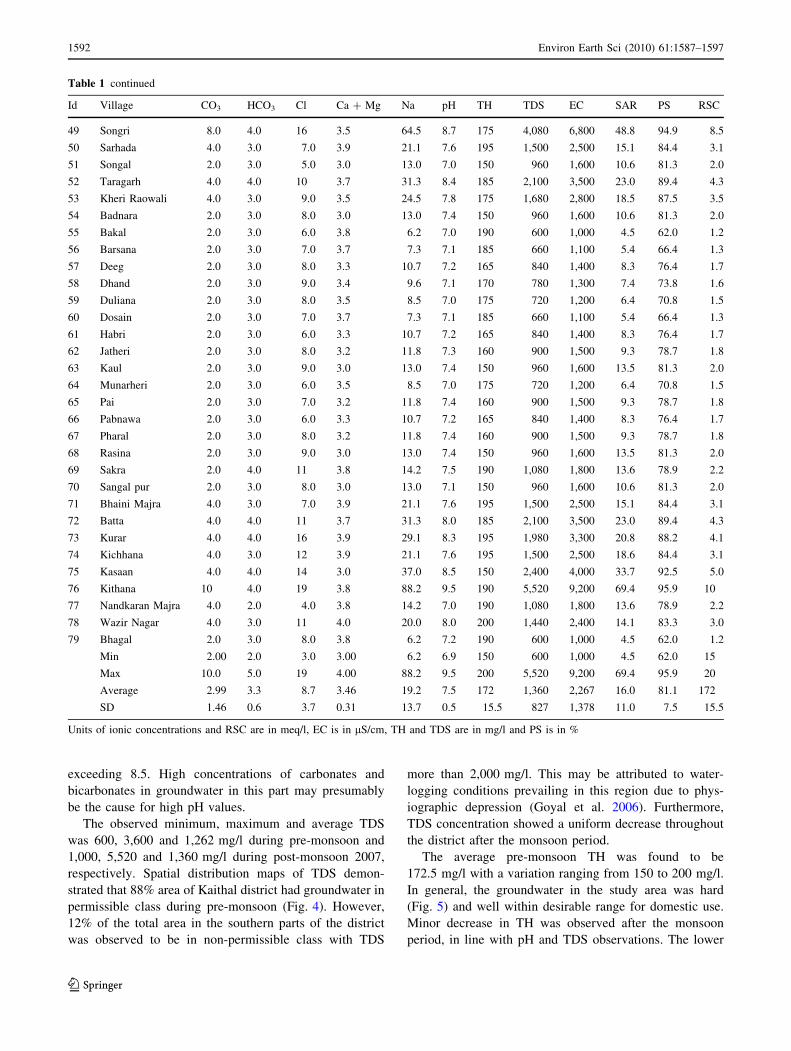
Table 1 Pre-monsoon values of quality parameters (June 2007)
Id Village CO3 HCO3 Cl Ca ? Mg Na pH TH TDS EC SAR PS RSC
1 Agondh 2.0 3.0 8.0 3.3 10.7 7.4 165 840 1,400 8.3 76.4 1.7
2 Badsui 2.0 3.0 6.0 3.5 8.5 7.2 175 720 1,200 6.4 70.8 1.5
3 Bhusla 2.0 4.0 10 3.8 14.2 7.5 190 1,080 1,800 10.3 78.9 2.2
4 Chaba 2.0 3.0 9.0 3.2 11.8 7.1 160 900 1,500 9.3 78.7 1.8
5 Guhla 2.0 3.0 9.0 3.2 11.8 7.3 160 900 1,500 9.3 78.7 1.8
6 Kharkan 2.0 4.0 10 3.8 14.2 7.5 190 1,080 1,800 10.3 78.9 2.2
7 KhushalMajra 2.0 3.0 8.0 3.0 13.0 7.2 150 960 1,600 10.6 81.3 2.0
8 Papsar 2.0 4.0 9.0 3.9 13.1 7.4 195 1,020 1,700 9.4 77.1 2.1
9 Peedal 2.0 4.0 12 3.5 16.5 7.5 175 1,200 2,000 12.5 82.5 2.5
10 Rasulpur 2.0 4.0 11 3.9 13.1 7.2 195 1,020 1,700 9.4 77.1 2.1
11 Mehmudpur 2.0 3.0 7.0 3.4 9.6 7.3 170 780 1,300 7.4 73.8 1.6
12 SeoMajra 2.0 3.0 9.0 3.3 10.7 7.4 165 840 1,400 8.3 76.4 1.7
13 Seontha 2.0 3.0 9.0 3.0 13.0 7.0 150 960 1,600 10.6 81.3 2.0
14 Sultania 2.0 3.0 8.0 3.0 13.0 7.1 150 960 1,600 10.6 81.3 2.0
15 Barot 4.0 3.0 6.0 3.9 21.1 7.5 195 1,500 2,500 15.1 84.4 3.1
16 Chandana 2.0 3.0 8.0 3.3 10.7 7.0 165 840 1,400 11.3 76.4 1.7
17 Chhot 4.0 4.0 9.0 3.3 34.7 8.5 165 2,280 3,800 30.6 91.3 4.7
18 Dhons 2.0 3.0 4.0 3.4 9.6 6.9 170 780 1,300 10.3 73.8 1.6
19 Dilluwala 2.0 3.0 3.0 3.0 13.0 7.0 150 960 1,600 13.5 81.3 2.0
20 Dhundrehri 6.0 4.0 9.0 3.5 48.5 8.9 175 3,120 5,200 40.7 93.3 6.5
21 Franswala 4.0 3.0 6.0 4.0 20.0 7.5 200 1,440 2,400 17.7 83.3 3.0
22 Jaswanti 2.0 3.0 4.0 3.2 11.8 7.1 160 900 1,500 12.3 78.7 1.8
23 Kathwar 2.0 3.0 3.0 3.2 11.8 7.0 160 900 1,500 12.3 78.7 1.8
24 Keorak 2.0 3.0 3.0 3.3 10.7 7.1 165 840 1,400 11.3 76.4 1.7
25 Kheri Gulam Ali 2.0 3.0 4.0 3.5 8.5 6.9 175 720 1,200 9.4 70.8 1.5
26 Kultaran 2.0 3.0 3.0 3.2 11.8 7.0 160 900 1,500 12.3 78.7 1.8
27 LadanaBaba 2.0 3.0 4.0 3.4 9.6 6.9 170 780 1,300 7.4 73.8 1.6
28 Manas 4.0 2.0 4.0 3.7 15.3 7.2 185 1,140 1,900 11.3 80.5 2.3
29 Mundri 2.0 3.0 3.0 3.7 7.3 6.9 185 660 1,100 5.4 66.4 1.3
30 Peoda 4.0 2.0 4.0 3.4 17.6 7.1 170 1,260 2,100 13.5 83.8 2.6
31 Sewan 2.0 3.0 5.0 3.0 13.0 7.1 150 960 1,600 13.5 81.3 2.0
32 Ujjana 2.0 3.0 6.0 3.2 11.8 7.0 160 900 1,500 12.3 78.7 1.8
33 Sajuma 4.0 2.0 9.0 3.3 18.7 7.5 165 1,320 2,200 17.7 85.0 2.7
34 Saran 4.0 4.0 9.0 3.0 37.0 8.5 150 2,400 4,000 33.7 92.5 5.0
35 Balu 6.0 4.0 16 3.7 47.3 8.7 185 3,060 5,100 38.9 92.7 6.3
36 Dumara 4.0 3.0 12 3.3 26.7 7.9 165 1,800 3,000 24.2 89.0 3.7
37 Kamalpur 4.0 5.0 16 3.8 38.2 8.6 190 2,520 4,200 31.7 91.0 5.2
38 Kheri SherKhan 4.0 3.0 12 4.0 20.0 7.8 200 1,440 2,400 17.7 83.3 3.0
39 Kheri Lamba 4.0 3.0 13 3.4 25.6 7.9 170 1,740 2,900 23.0 88.3 3.6
40 Kalasar 4.0 4.0 14 3.8 30.2 8.2 190 2,040 3,400 25.6 88.8 4.2
41 Kolekhan 4.0 4.0 15 3.7 31.3 8.4 185 2,100 3,500 26.7 89.4 4.3
42 Mataur 4.0 3.0 12 3.3 26.7 8.1 165 1,800 3,000 24.2 89.0 3.7
43 Ramgarh 4.0 5.0 18 3.5 40.5 8.6 175 2,640 4,400 30.6 92.0 5.5
44 Simla 4.0 3.0 15 3.3 26.7 8.1 165 1,800 3,000 20.8 89.0 3.7
45 Bhana 2.0 3.0 5.0 3.0 13.0 7.0 150 960 1,600 13.5 81.3 2.0
46 Jakhauli 2.0 3.0 4.0 3.4 9.6 6.9 170 780 1,300 10.3 73.8 1.6
47 Mandwal 4.0 4.0 11 3.7 31.3 8.3 185 2,100 3,500 26.7 89.4 4.3
48 Rohera 4.0 4.0 9.0 3.7 31.3 8.5 185 2,100 3,500 26.7 89.4 4.3
Environ Earth Sci (2010) 61:1587–1597 1591
123
exceeding 8.5. High concentrations of carbonates and
bicarbonates in groundwater in this part may presumably
be the cause for high pH values.
The observed minimum, maximum and average TDS
was 600, 3,600 and 1,262 mg/l during pre-monsoon and
1,000, 5,520 and 1,360 mg/l during post-monsoon 2007,
respectively. Spatial distribution maps of TDS demon-
strated that 88% area of Kaithal district had groundwater in
permissible class during pre-monsoon (Fig. 4). However,
12% of the total area in the southern parts of the district
was observed to be in non-permissible class with TDS
more than 2,000 mg/l. This may be attributed to water-
logging conditions prevailing in this region due to phys-
iographic depression (Goyal et al. 2006). Furthermore,
TDS concentration showed a uniform decrease throughout
the district after the monsoon period.
The average pre-monsoon TH was found to be
172.5 mg/l with a variation ranging from 150 to 200 mg/l.
In general, the groundwater in the study area was hard
(Fig. 5) and well within desirable range for domestic use.
Minor decrease in TH was observed after the monsoon
period, in line with pH and TDS observations. The lower
Table 1 continued
Id Village CO3 HCO3 Cl Ca ? Mg Na pH TH TDS EC SAR PS RSC
49 Songri 8.0 4.0 16 3.5 64.5 8.7 175 4,080 6,800 48.8 94.9 8.5
50 Sarhada 4.0 3.0 7.0 3.9 21.1 7.6 195 1,500 2,500 15.1 84.4 3.1
51 Songal 2.0 3.0 5.0 3.0 13.0 7.0 150 960 1,600 10.6 81.3 2.0
52 Taragarh 4.0 4.0 10 3.7 31.3 8.4 185 2,100 3,500 23.0 89.4 4.3
53 Kheri Raowali 4.0 3.0 9.0 3.5 24.5 7.8 175 1,680 2,800 18.5 87.5 3.5
54 Badnara 2.0 3.0 8.0 3.0 13.0 7.4 150 960 1,600 10.6 81.3 2.0
55 Bakal 2.0 3.0 6.0 3.8 6.2 7.0 190 600 1,000 4.5 62.0 1.2
56 Barsana 2.0 3.0 7.0 3.7 7.3 7.1 185 660 1,100 5.4 66.4 1.3
57 Deeg 2.0 3.0 8.0 3.3 10.7 7.2 165 840 1,400 8.3 76.4 1.7
58 Dhand 2.0 3.0 9.0 3.4 9.6 7.1 170 780 1,300 7.4 73.8 1.6
59 Duliana 2.0 3.0 8.0 3.5 8.5 7.0 175 720 1,200 6.4 70.8 1.5
60 Dosain 2.0 3.0 7.0 3.7 7.3 7.1 185 660 1,100 5.4 66.4 1.3
61 Habri 2.0 3.0 6.0 3.3 10.7 7.2 165 840 1,400 8.3 76.4 1.7
62 Jatheri 2.0 3.0 8.0 3.2 11.8 7.3 160 900 1,500 9.3 78.7 1.8
63 Kaul 2.0 3.0 9.0 3.0 13.0 7.4 150 960 1,600 13.5 81.3 2.0
64 Munarheri 2.0 3.0 6.0 3.5 8.5 7.0 175 720 1,200 6.4 70.8 1.5
65 Pai 2.0 3.0 7.0 3.2 11.8 7.4 160 900 1,500 9.3 78.7 1.8
66 Pabnawa 2.0 3.0 6.0 3.3 10.7 7.2 165 840 1,400 8.3 76.4 1.7
67 Pharal 2.0 3.0 8.0 3.2 11.8 7.4 160 900 1,500 9.3 78.7 1.8
68 Rasina 2.0 3.0 9.0 3.0 13.0 7.4 150 960 1,600 13.5 81.3 2.0
69 Sakra 2.0 4.0 11 3.8 14.2 7.5 190 1,080 1,800 13.6 78.9 2.2
70 Sangal pur 2.0 3.0 8.0 3.0 13.0 7.1 150 960 1,600 10.6 81.3 2.0
71 Bhaini Majra 4.0 3.0 7.0 3.9 21.1 7.6 195 1,500 2,500 15.1 84.4 3.1
72 Batta 4.0 4.0 11 3.7 31.3 8.0 185 2,100 3,500 23.0 89.4 4.3
73 Kurar 4.0 4.0 16 3.9 29.1 8.3 195 1,980 3,300 20.8 88.2 4.1
74 Kichhana 4.0 3.0 12 3.9 21.1 7.6 195 1,500 2,500 18.6 84.4 3.1
75 Kasaan 4.0 4.0 14 3.0 37.0 8.5 150 2,400 4,000 33.7 92.5 5.0
76 Kithana 10 4.0 19 3.8 88.2 9.5 190 5,520 9,200 69.4 95.9 10
77 Nandkaran Majra 4.0 2.0 4.0 3.8 14.2 7.0 190 1,080 1,800 13.6 78.9 2.2
78 Wazir Nagar 4.0 3.0 11 4.0 20.0 8.0 200 1,440 2,400 14.1 83.3 3.0
79 Bhagal 2.0 3.0 8.0 3.8 6.2 7.2 190 600 1,000 4.5 62.0 1.2
Min 2.00 2.0 3.0 3.00 6.2 6.9 150 600 1,000 4.5 62.0 15
Max 10.0 5.0 19 4.00 88.2 9.5 200 5,520 9,200 69.4 95.9 20
Average 2.99 3.3 8.7 3.46 19.2 7.5 172 1,360 2,267 16.0 81.1 172
SD 1.46 0.6 3.7 0.31 13.7 0.5 15.5 827 1,378 11.0 7.5 15.5
Units of ionic concentrations and RSC are in meq/l, EC is in lS/cm, TH and TDS are in mg/l and PS is in %
1592 Environ Earth Sci (2010) 61:1587–1597
123

Table 2 Post-monsoon values of quality parameters (Oct 2007)
Id Village CO3 HCO3 Cl Ca ? Mg Na pH TH TDS EC SAR PS RSC
1 Agondh 2.0 3.0 5.0 3.5 8.5 7.0 175 720 1,200 6.4 70.8 1.5
2 Badsui 2.0 3.0 4.0 3.7 7.3 7.0 185 660 1,100 5.4 66.4 1.3
3 Bhusla 2.0 3.0 5.0 3.2 11.8 7.1 160 900 1,500 9.3 78.7 1.8
4 Chaba 2.0 3.0 4.0 3.9 5.1 7.0 195 540 900 3.7 56.7 1.1
5 Gulha 2.0 3.0 4.0 3.8 6.2 6.9 190 600 1,000 4.5 62.0 1.2
6 Kharkan 2.0 4.0 10 3.8 14.2 7.5 190 1,080 1,800 10.3 78.9 2.2
7 KhushalMajra 2.0 3.0 6.0 3.0 13.0 7.1 150 960 1,600 10.6 81.3 2.0
8 Papsar 2.0 4.0 9.0 3.9 13.1 7.4 195 1,020 1,700 9.4 77.1 2.1
9 Peedal 2.0 4.0 6.0 3.8 14.2 7.4 190 1,080 1,800 10.3 78.9 2.2
10 Rasulpur 2.0 4.0 11 3.9 13.1 7.2 195 1,020 1,700 9.4 77.1 2.1
11 Mehmudpur 2.0 3.0 4.0 3.8 6.2 7.1 190 600 1,000 4.5 62.0 1.2
12 SeoMajra 2.0 3.0 4.0 3.3 10.7 7.0 165 840 1,400 8.3 76.4 1.7
13 Seontha 2.0 3.0 9.0 3.0 13.0 7.0 150 960 1,600 10.6 81.3 2.0
14 Sultania 2.0 3.0 3.0 3.3 10.7 7.1 165 840 1,400 8.3 76.4 1.7
15 Barot 4.0 3.0 2.0 3.9 21.1 7.5 195 1,500 2,500 15.1 84.4 3.1
16 Chandana 2.0 4.0 4.0 3.8 14.2 7.0 190 1,080 1,800 13.6 78.9 2.2
17 Chhot 4.0 4.0 2.0 3.3 34.7 8.5 165 2,280 3,800 30.6 91.3 4.7
18 Dhons 2.0 3.0 5.0 3.3 10.7 6.9 165 840 1,400 11.3 76.4 1.7
19 Dilluwala 2.0 3.0 4.0 3.4 9.6 7.0 170 780 1,300 10.3 73.8 1.6
20 Dhundrehri 6.0 4.0 2.0 3.8 46.2 8.9 190 3,000 5,000 37.7 92.4 6.2
21 Franswala 4.0 3.0 3.0 3.3 26.7 7.5 165 1,800 3,000 24.2 89.0 3.7
22 Jaswanti 2.0 3.0 4.0 3.5 8.5 7.1 175 720 1,200 6.4 70.8 1.5
23 Kathwar 2.0 3.0 4.0 3.2 11.8 7.0 160 900 1,500 12.3 78.7 1.8
24 Keorak 2.0 3.0 5.0 3.4 9.6 7.1 170 780 1,300 10.3 73.8 1.6
25 Kheri Gulam Ali 2.0 3.0 6.0 3.7 7.3 7.1 185 660 1,100 8.4 66.4 1.3
26 Kultaran 2.0 3.0 4.0 3.7 7.3 7.0 185 660 1,100 5.4 66.4 1.3
27 LadanaBaba 2.0 3.0 4.0 3.8 6.2 6.9 190 600 1,000 4.5 62.0 1.2
28 Manas 4.0 3.0 3.0 3.7 23.3 7.2 185 1,620 2,700 17.1 86.3 3.3
29 Mundri 2.0 3.0 5.0 3.5 8.5 6.9 175 720 1,200 6.4 70.8 1.5
30 Peoda 4.0 3.0 3.0 3.9 21.1 7.1 195 1,500 2,500 15.1 84.4 3.1
31 Sewan 2.0 3.0 3.0 3.2 11.8 7.5 160 900 1,500 12.3 78.7 1.8
32 Ujjana 2.0 3.0 4.0 3.4 9.6 7.0 170 780 1,300 10.3 73.8 1.6
33 Sajuma 4.0 4.0 9.0 3.3 34.7 7.5 165 2,280 3,800 30.6 91.3 4.7
34 Saran 4.0 3.0 3.0 3.9 21.1 8.5 195 1,500 2,500 18.6 84.4 3.1
35 Balu 6.0 4.0 2.0 3.7 47.3 8.9 185 3,060 5,100 38.9 92.7 6.3
36 Dumara 4.0 3.0 4.0 3.3 26.7 8.5 165 1,800 3,000 24.2 89.0 3.7
37 Kamalpur 4.0 5.0 5.0 3.8 38.2 8.6 190 2,520 4,200 31.7 91.0 5.2
38 Kheri SherKhan 4.0 3.0 4.0 3.9 21.1 8.4 195 1,500 2,500 18.6 84.4 3.1
39 Kheri Lamba 4.0 4.0 2.0 3.7 31.3 8.2 185 2,100 3,500 26.7 89.4 4.3
40 Kalasar 4.0 4.0 3.0 3.7 31.3 8.2 185 2,100 3,500 26.7 89.4 4.3
41 Kolekhan 4.0 3.0 5.0 3.0 29.0 8.1 150 1,920 3,200 26.9 90.6 4.0
42 Mataur 4.0 4.0 2.0 3.9 29.1 8.3 195 1,980 3,300 24.6 88.2 4.1
43 Ramgarh 4.0 5.0 3.0 3.0 45.0 9.0 150 2,880 4,800 40.4 93.8 6.0
44 Simla 4.0 3.0 10 3.2 27.8 7.9 160 1,860 3,100 25.3 89.7 3.8
45 Bhana 2.0 2.0 3.0 3.3 2.7 6.7 165 360 600 2.1 45.0 0.7
46 Jakhauli 4.0 3.0 2.0 3.9 21.1 6.9 195 1,500 2,500 15.1 84.4 3.1
47 Mandwal 4.0 2.0 3.0 3.0 21.0 7.2 150 1,440 2,400 17.2 87.5 3.0
48 Rohera 4.0 4.0 2.0 3.9 29.1 7.8 195 1,980 3,300 20.8 88.2 4.1
Environ Earth Sci (2010) 61:1587–1597 1593
123
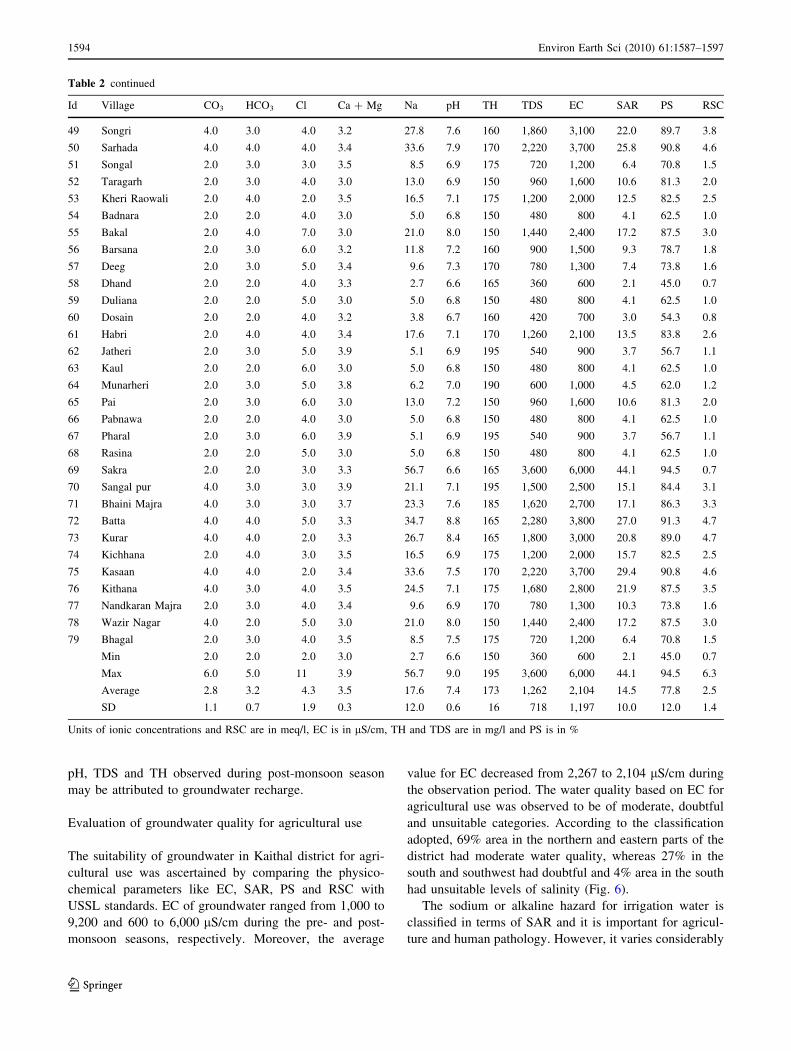
pH, TDS and TH observed during post-monsoon season
may be attributed to groundwater recharge.
Evaluation of groundwater quality for agricultural use
The suitability of groundwater in Kaithal district for agri-
cultural use was ascertained by comparing the physico-
chemical parameters like EC, SAR, PS and RSC with
USSL standards. EC of groundwater ranged from 1,000 to
9,200 and 600 to 6,000 lS/cm during the pre- and post-
monsoon seasons, respectively. Moreover, the average
value for EC decreased from 2,267 to 2,104 lS/cm during
the observation period. The water quality based on EC for
agricultural use was observed to be of moderate, doubtful
and unsuitable categories. According to the classification
adopted, 69% area in the northern and eastern parts of the
district had moderate water quality, whereas 27% in the
south and southwest had doubtful and 4% area in the south
had unsuitable levels of salinity (Fig. 6).
The sodium or alkaline hazard for irrigation water is
classified in terms of SAR and it is important for agricul-
ture and human pathology. However, it varies considerably
Table 2 continued
Id Village CO3 HCO3 Cl Ca ? Mg Na pH TH TDS EC SAR PS RSC
49 Songri 4.0 3.0 4.0 3.2 27.8 7.6 160 1,860 3,100 22.0 89.7 3.8
50 Sarhada 4.0 4.0 4.0 3.4 33.6 7.9 170 2,220 3,700 25.8 90.8 4.6
51 Songal 2.0 3.0 3.0 3.5 8.5 6.9 175 720 1,200 6.4 70.8 1.5
52 Taragarh 2.0 3.0 4.0 3.0 13.0 6.9 150 960 1,600 10.6 81.3 2.0
53 Kheri Raowali 2.0 4.0 2.0 3.5 16.5 7.1 175 1,200 2,000 12.5 82.5 2.5
54 Badnara 2.0 2.0 4.0 3.0 5.0 6.8 150 480 800 4.1 62.5 1.0
55 Bakal 2.0 4.0 7.0 3.0 21.0 8.0 150 1,440 2,400 17.2 87.5 3.0
56 Barsana 2.0 3.0 6.0 3.2 11.8 7.2 160 900 1,500 9.3 78.7 1.8
57 Deeg 2.0 3.0 5.0 3.4 9.6 7.3 170 780 1,300 7.4 73.8 1.6
58 Dhand 2.0 2.0 4.0 3.3 2.7 6.6 165 360 600 2.1 45.0 0.7
59 Duliana 2.0 2.0 5.0 3.0 5.0 6.8 150 480 800 4.1 62.5 1.0
60 Dosain 2.0 2.0 4.0 3.2 3.8 6.7 160 420 700 3.0 54.3 0.8
61 Habri 2.0 4.0 4.0 3.4 17.6 7.1 170 1,260 2,100 13.5 83.8 2.6
62 Jatheri 2.0 3.0 5.0 3.9 5.1 6.9 195 540 900 3.7 56.7 1.1
63 Kaul 2.0 2.0 6.0 3.0 5.0 6.8 150 480 800 4.1 62.5 1.0
64 Munarheri 2.0 3.0 5.0 3.8 6.2 7.0 190 600 1,000 4.5 62.0 1.2
65 Pai 2.0 3.0 6.0 3.0 13.0 7.2 150 960 1,600 10.6 81.3 2.0
66 Pabnawa 2.0 2.0 4.0 3.0 5.0 6.8 150 480 800 4.1 62.5 1.0
67 Pharal 2.0 3.0 6.0 3.9 5.1 6.9 195 540 900 3.7 56.7 1.1
68 Rasina 2.0 2.0 5.0 3.0 5.0 6.8 150 480 800 4.1 62.5 1.0
69 Sakra 2.0 2.0 3.0 3.3 56.7 6.6 165 3,600 6,000 44.1 94.5 0.7
70 Sangal pur 4.0 3.0 3.0 3.9 21.1 7.1 195 1,500 2,500 15.1 84.4 3.1
71 Bhaini Majra 4.0 3.0 3.0 3.7 23.3 7.6 185 1,620 2,700 17.1 86.3 3.3
72 Batta 4.0 4.0 5.0 3.3 34.7 8.8 165 2,280 3,800 27.0 91.3 4.7
73 Kurar 4.0 4.0 2.0 3.3 26.7 8.4 165 1,800 3,000 20.8 89.0 4.7
74 Kichhana 2.0 4.0 3.0 3.5 16.5 6.9 175 1,200 2,000 15.7 82.5 2.5
75 Kasaan 4.0 4.0 2.0 3.4 33.6 7.5 170 2,220 3,700 29.4 90.8 4.6
76 Kithana 4.0 3.0 4.0 3.5 24.5 7.1 175 1,680 2,800 21.9 87.5 3.5
77 Nandkaran Majra 2.0 3.0 4.0 3.4 9.6 6.9 170 780 1,300 10.3 73.8 1.6
78 Wazir Nagar 4.0 2.0 5.0 3.0 21.0 8.0 150 1,440 2,400 17.2 87.5 3.0
79 Bhagal 2.0 3.0 4.0 3.5 8.5 7.5 175 720 1,200 6.4 70.8 1.5
Min 2.0 2.0 2.0 3.0 2.7 6.6 150 360 600 2.1 45.0 0.7
Max 6.0 5.0 11 3.9 56.7 9.0 195 3,600 6,000 44.1 94.5 6.3
Average 2.8 3.2 4.3 3.5 17.6 7.4 173 1,262 2,104 14.5 77.8 2.5
SD 1.1 0.7 1.9 0.3 12.0 0.6 16 718 1,197 10.0 12.0 1.4
Units of ionic concentrations and RSC are in meq/l, EC is in lS/cm, TH and TDS are in mg/l and PS is in %
1594 Environ Earth Sci (2010) 61:1587–1597
123
due to physiography, geology, hydrology and anthropo-
genic activities. From the analysis of SAR, it was observed
that groundwater in northeastern, central and northern parts
of the district had low-to-medium alkaline hazard, whereas
about 26% area in the southwestern and southern parts
suffered from high to very high alkaline hazard during the
pre- and post-monsoon seasons for the year 2007 (Fig. 7).
The use of such waters in irrigation is harmful for soil and
thereby results in low permeability and poor cultivability in
the district (Todd and Mays 2005).
It is widely agreed that the high percentage of sodium in
irrigation water degrades the soil conditions. In the study
area, PS for groundwater in the pre- and post-monsoon
seasons varied in the range 62–96 and 45–95%, respec-
tively. It was revealed from the analysis that the ground-
water in Kaithal district was of doubtful to bad quality as
the PS ranged between 60 and 80% in 61% of the total area
and was more than 80% in the rest of the area (Fig. 8).
Irrigation water with high PS may cause sodium accumu-
lation and calcium deficiency in the soil leading to a
breakdown of its physical properties. Therefore, good
Fig. 3 Spatial distribution of pH in Kaithal district during 2007
Fig. 4 Spatial distribution of TDS in Kaithal district during 2007
Fig. 5 Spatial distribution of TH in Kaithal district during 2007
Fig. 6 Spatial distribution of EC in Kaithal district during 2007
Environ Earth Sci (2010) 61:1587–1597 1595
123
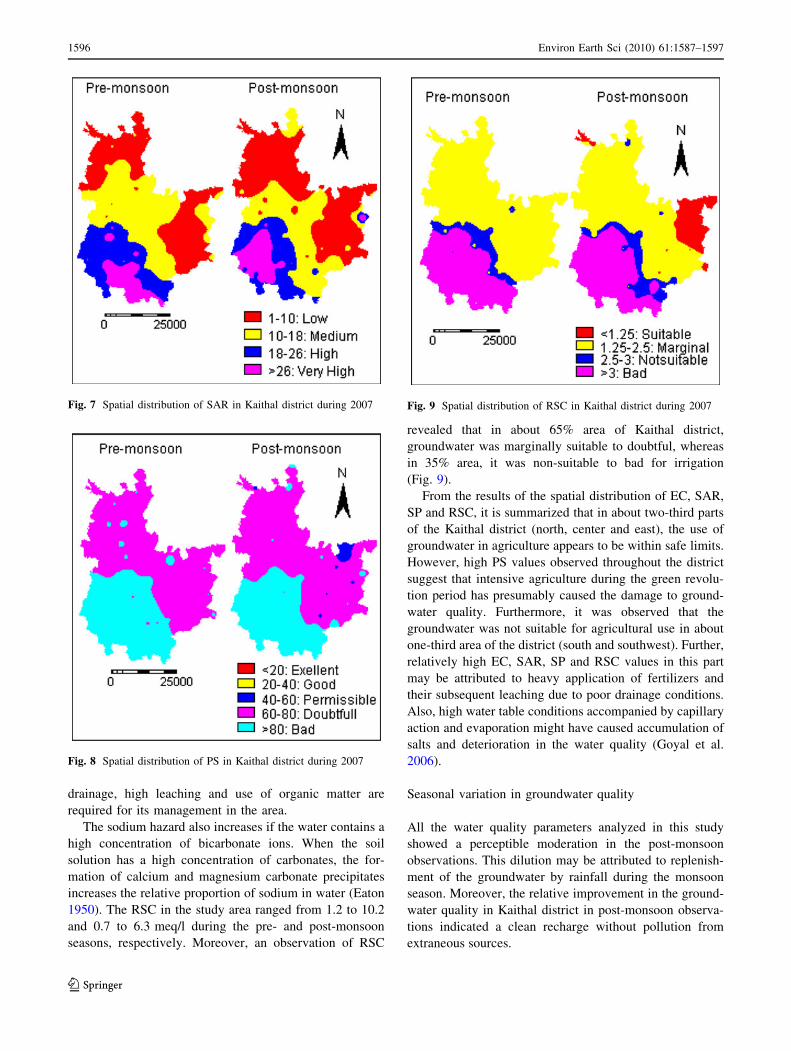
drainage, high leaching and use of organic matter are
required for its management in the area.
The sodium hazard also increases if the water contains a
high concentration of bicarbonate ions. When the soil
solution has a high concentration of carbonates, the for-
mation of calcium and magnesium carbonate precipitates
increases the relative proportion of sodium in water (Eaton
1950). The RSC in the study area ranged from 1.2 to 10.2
and 0.7 to 6.3 meq/l during the pre- and post-monsoon
seasons, respectively. Moreover, an observation of RSC
revealed that in about 65% area of Kaithal district,
groundwater was marginally suitable to doubtful, whereas
in 35% area, it was non-suitable to bad for irrigation
(Fig. 9).
From the results of the spatial distribution of EC, SAR,
SP and RSC, it is summarized that in about two-third parts
of the Kaithal district (north, center and east), the use of
groundwater in agriculture appears to be within safe limits.
However, high PS values observed throughout the district
suggest that intensive agriculture during the green revolu-
tion period has presumably caused the damage to ground-
water quality. Furthermore, it was observed that the
groundwater was not suitable for agricultural use in about
one-third area of the district (south and southwest). Further,
relatively high EC, SAR, SP and RSC values in this part
may be attributed to heavy application of fertilizers and
their subsequent leaching due to poor drainage conditions.
Also, high water table conditions accompanied by capillary
action and evaporation might have caused accumulation of
salts and deterioration in the water quality (Goyal et al.
2006).
Seasonal variation in groundwater quality
All the water quality parameters analyzed in this study
showed a perceptible moderation in the post-monsoon
observations. This dilution may be attributed to replenish-
ment of the groundwater by rainfall during the monsoon
season. Moreover, the relative improvement in the ground-
water quality in Kaithal district in post-monsoon observa-
tions indicated a clean recharge without pollution from
extraneous sources.
Fig. 7 Spatial distribution of SAR in Kaithal district during 2007
Fig. 8 Spatial distribution of PS in Kaithal district during 2007
Fig. 9 Spatial distribution of RSC in Kaithal district during 2007
1596 Environ Earth Sci (2010) 61:1587–1597
123

Conclusion
From the study, it is concluded that the groundwater in
Kaithal district is hard, alkaline and saline in nature.
Therefore, in the major part of the district, the groundwater
has low public acceptability for domestic use as compared
to canal-based water supply. However, no health-based
concerns were perceived in groundwater use for drinking
and other domestic purposes. For irrigation, groundwater in
67% area of the district was of permissible to good quality
and was found to be suitable in the northern, eastern and
central parts. Relatively high EC, SAR, SP and RSC values
in the remaining parts seem to be the result of heavy
application of fertilizers and their subsequent leaching
under poor drainage conditions. Strict regulations are
needed to be implemented to reduce the risk of ground-
water contamination by fertilizers and pesticides. Further, a
moderation effect was observed in the quality of the
groundwater during the monsoon season. The observed
dilution in quality is attributed to the recharge by rainfall in
the study area. Moreover, GIS was found to be an effective
and efficient tool in handling problems pertaining to vari-
ous quality parameters in their spatial extent. Finally,
spatial distribution maps generated through this investiga-
tion for various quality parameters will be helpful for
planners and policy makers in suggesting remedial mea-
sures in a holistic way for sustainable water management in
the study area.
Acknowledgments The authors are thankful to The Groundwater
Cell, Government of Haryana for providing necessary data on
groundwater quality. The training in GIS applications imparted by the
Indian Institute of Remote Sensing, Dehradun, India, is also gratefully
acknowledged. The first author also thanks the University Grants
Commission, New Delhi, India for the grant of teacher fellowship to
undertake the study.
References
Alcamo J, Florke M, Marker M (2007) Future long-term changes in
global water resources driven by socio-economic and climatic
changes. Hydrol Sci J 52(2):247–275
Appelo CAJ, Postma D (1996) Geochemistry, groundwater and
pollution. A. A. Balkema, Rotterdam, 1212 p
Ayers RS, Westcot DW (1994) Water quality for agriculture. FAO
Irrigation and Drainage Paper 29, Rev. 1, pp 1–130
BIS (1998) Characteristics for Drinking Water, IS, 10500, New Delhi
Chaudhary BS, Kumar M, Roy AK, Ruhal DS (1996) Applications of
RS and GIS in groundwater investigations in Sohna block,
Gurgaon district, Haryana, India. International Archives of
Photogrammetry and Remote Sensing, 31, B-6, Vienna, Austria.
pp 18–23
Datta SP, Biswas DR, Saharan N, Ghosh SK, Rattan RK (2000) Effect
of long-term application of sewage effluents on organic carbon,
bio-available phosphorus, potassium and heavy metals status of
soils and uptake of heavy metals by crops. J Indian Soc Soil Sci
48:836–839
Eaton FM (1950) Significance of carbonates in irrigation water. Soil
Sci 69:123–133
Goyal SK, Sethi GK, Chaudhary BS (2006) Integrated groundwater
studies in Kaithal district of Haryana, using remote sensing and
GIS. Proceedings of National Conference on Environmental
Conservation. Sept 1–3, Pilani, India, pp 745-751
Heath RC (1998) Basic ground-water hydrology, USGS water-supply
paper 2220, Denver, CO, 1998
Jain CK, Sharma MK (2000) Regression analysis of groundwater
quality of Sagar district, Madhya Pradesh. Indian J Environ
Health 42(4):159–168
Kovar K, Krasney J (eds) (1995) Groundwater quality: remediation
and protection. IAHS Publ. 225, pp 257-261
Lloyd JW, Heathcote JA (1985) Natural inorganic hydrochemistry in
relation to groundwater—an introduction. Clarendon Press,
Oxford, p 296
Marechal JC, Dewandel B, Ahmed S, Galeazzi L, Zaidi FK (2006)
Combined estimation of specific yield and natural recharge in a
semi-arid groundwater basin with irrigated agriculture. J Hydrol
329:281–293
Nash H, McCall GJH (eds) (1995) Groundwater quality. In: 17th
Special Report. Chapman and Hall, London
Palaniswami C, Ramulu US (1994) Effects of continuous irrigation
with paper factory effluent on soil properties. J Indian Soc Soil
Sci 42:139–140
Patel KP, Pandya RR, Maliwal GL, Patel KC, Ramani VP, George V
(2004) Heavy metal content of different effluents and their
relative availability in soils irrigated with effluent waters around
major industrial cities of Gujarat. J Indian Soc Soil Sci 52:89–94
Richards LA (ed) (1954). Diagnosis and improvement of saline and
alkali soils, USDA Handbook no. 60, Washington, 160 pp
Statistical abstract (2009). State statistical abstract, Haryana (2007–
08), Govt. of Haryana Publication no. 910, Chandigarh, India
Todd DK, Mays LW (2005) Groundwater Hydrology, 3rd edn. Wiley,
New York, pp 329–358
Wilcox LV (1955) Classification and use of irrigation waters, USDA
Circular No. 969, pp 19
Environ Earth Sci (2010) 61:1587–1597 1597
123