Haryana Development Report
306
-
Upload
khangminh22 -
Category
Documents
-
view
0 -
download
0
Transcript of Haryana Development Report

5LIST OF TABLES
Core Committee
HAR
YANA
(i) Dr. (Mrs.) Syeda Hameed Chairperson
Member,
Planning Commission, New Delhi
(ii) Smt. Manjulika Gautam Member
Senior Adviser (SP-N),
Planning Commission, New Delhi
(iii) Principal Secretary (Planning Department) Member
Government of Haryana, Chandigarh
(iv) Prof. Shri Bhagwan Dahiya Member (Co-opted)
Director,
Institute of Development Studies,
Maharshi Dayanand University, Rohtak
(v) Dr. V.N. Attri Member (Co-opted)
Professor,
Deptt. of Economics,
Kurukshetra University, Kurukshetra
(vi) Shri J.P. Vijay Member Secretary
Director (SP-N)
Planning Commission, New Delhi
Coordinator
• Prof. S.B. Dahiya, Director, Institute of Development Studies, M.D. University, Rohtak.
Research Team at Institute of Development Studies, Maharshi Dayanand University, Rohtak.
• Prof. B.K. Vashist, Department of Economics, Kurukshetra University, Kurukshetra.
• Prof. Indira Dhull, Dean, Faculty of Education, M.D. University, Rohtak.
• Prof. Ravinder Vinayak, Dean, Faculty of Commerce, M.D. University, Rohtak.
• Prof. Narender Kumar, Department of Commerce, M.D. University, Rohtak.
• Dr. Kavita Chakravarty, Department of Economics, M.D. University, Rohtak.
• Dr. Shalini Singh, Department of Psychology, M.D. University, Rohtak.
• Dr. Nandita Rathi, Head, Department of Management Studies, PDM College of Engineering, Bahadurgarh.
• Dr. Anju Dabas, Institute of Development Studies, M.D. University, Rohtak.
• Dr. Suman Chauhan, Department of Geography, Kurukshetra University, Kurukshetra.
• Dr. Ombir Singh, Department of Economics, M.D. University, Rohtak.
Research Team at Kurukshetra University, Kurukshetra
• Prof. V.N. Attri, Department of Economics, Kurukshetra University, Kurukshetra.
• Prof. Manjula Chaudhary, Department of Tourism, Kurukshetra University, Kurukshetra.
• Dr. Neeera Varma, Department of Economics, Kurukshetra University, Kurukshetra.
• Dr. Ashok Kumar, Department of Economics, Kurukshetra University, Kurukshetra.
• Dr. Sanjeev Bansal, Department of Economics, Kurukshetra University, Kurukshetra.
• Dr. S.S. Boora, Department of Tourism, Kurukshetra University, Kurukshetra.
• Dr. Manjusha Sharma Department of Public Administration, Kurukshetra University, Kurukshetra.
• Dr. O.P. Bohra, National Institute of Public Finance & Policy, New Delhi.
Editor
• Prof. C.M. Sharma, Professor of English and Dean Academic Affairs, M.D. University, Rohtak.
Research Team
mik/;{k;kstuk vk;ksx
HkkjrDEPUTY CHAIRMANPLANNING COMMISSIONINDIA
,e. ,l. vkgyqokfy;k
MONTEK SINGH AHLUWALIA
MESSAGE
One of the important Tenth Plan initiatives of the Planning
Commission was to sponsor the preparation of State Development
Reports with much of the work being done by reputed national level
institutes. This exercise was undertaken in recognition of the fact that
economic circumstances and performance in individual States’s
varied considerably and it was necessary to examine development
challenges for individual States in the light of State specific
constraints and circumstances. The basic idea is to produce quality
reference documents on development profiles of individual States
and the possible strategies for accelerating growth, and reducing
poverty and inequality.
The Haryana Development Report reviews Haryana’s
experience and highlights issues critical for the State’s development
in the years ahead. I hope its publication will stimulate debate on
growth strategies appropriate for Haryana. I am sure the road map
indicated in the report will stimulate a broader awareness of the
critical policy issues facing the State and will assist the State to
move to a higher growth path and to achieve all round human and
economic development.
(Montek Singh Ahluwalia)
;k stuk H kou] l aln ekx Z ] ub Z fnYyh & 110001 n wj H k ki % 23096677 ] 23096688 Q SDl % 23096699Yojana Bhawan, Parliament Street, New Delhi : 110001 Phones: 23096677, 23096688 Fax : 23096699 E-mail : [email protected]
eq[; eU=h] gfj;k.kkp.Mhx<A
CHIEF MINISTERHARYANA,
CHANDIGARH
HkwisUnz flag gqM~Mk
BHUPINDER SINGH HOODA
MESSAGE
The preparation of ‘State Development Report of Haryana’ is the
result of the praise worthy initiative taken up by the Planning
Commission, Govt. of India. Haryana has a creditable record of all-
round development. It set the trend by adopting the green revolution
strategy during mid-sixties which has made the State No.2 in the
Country in food-grain production. During the last forty two years,
Haryana has transformed itself from a backward Socio-economic
State an vibrant economically progressive State one.
Today, Haryana is not only the granary of India exporting large
quantities of food-grains to other States but is also the hub for
producing a wide range of industrial products.
This progress has been well chronicled in the Development
Report of the State. Our State Government is committed for all-round
development of all regions and all people of the State. However, I do
belive that we have a long road to travel before we can claim to have
fulfilled Mahatma Gandhi’s prayer to wipe the last tear from the
poorest of the poor. Our Government is committed to making the
growth process more socially inclusive.
The State Development Report is an important instrument for
strengthening the pace of development of the State. This report
provides a subtle synthesis among the development indicators of all
sectors. I compliment the talented team of Dr. S.B. Dahiya, Prof. of
HARYANA DEVELOPMENT REPORT10
Economics, MDU, Rohtak and Dr. V.N. Attro, Prof. of Economics,
Kurukshetra University, Kurukshetra for their pains taking effort in
preparing the First State Development Report of Hayana. I also
acknowledge the supporting work done by officers and staff of the
Planning Department and the Economic and Statistical Organisation.
(Bhupinder Singh Hooda)
11LIST OF TABLES
lnL;;kstuk vk;ksx
;kstuk Hkou
ubZ fnYyh&110 001MEMBER
PLANNING COMMISSIONYOJANA BHAWAN
NEW DELHI-110 001
MkW. lbZnk gehn
Dr. Syeda Hameed
FOREWORD
In keeping with the Central Plan Scheme of the “50th Year Initiative forPlanning”, the Planning Commission has been preparing DevelopmentReports for each State. The SDRs are an attempt to compile qualityreference document on the profile and strategy for accelerating the pace ofdevelopment in the respective States.
The Haryana State Development Report (HSDR) has been prepared bythe Planning Commission with the assistance of the Institute of DevelopmentStudies, Maharshi Dayanand University, Rohtak and Deptt. of Economics,Kurukshetra University, Kurukshetra in partnership with the Government ofHaryana. A Core Committee reviewed the dimensions of the variousdevelopmental issues and helped to chart out the scope and coverage of theSDR for Haryana in association with the State Government and the Institute ofDevelopment Studies, Maharshi Dayanand University, Rohtak and Deptt. ofEconomics, Kurukshetra University, Kurukshetra.
I am sure this Report will serve as a resource material not only for theState and Central Government but also for all the non-governmentalorganisations working in Haryana.
New Delhi
(SYEDA HAMEED)
nwjHkki % 23096570 QSDl % 23096571Telephone: 23096570 Fax : 23096571, E-mail: [email protected]
Contents
Core Committee. . . . . . . . . . . . . . . . . . . . . . . . . . . . . . . . . . . . . . . . . . . . . . . 5
Message from Deputy Chairman, Planning Commission. . . . . . . . . . . . . . . . . 7
Message from Chief Minister, Haryana. . . . . . . . . . . . . . . . . . . . . . . . . . . . . . 9
Foreword by Member, Planning Commission. . . . . . . . . . . . . . . . . . . . . . . . 11
Contents . . . . . . . . . . . . . . . . . . . . . . . . . . . . . . . . . . . . . . . . . . . . . . . . . . . 13
List of Tables . . . . . . . . . . . . . . . . . . . . . . . . . . . . . . . . . . . . . . . . . . . . . . . 15
Acknowledgements. . . . . . . . . . . . . . . . . . . . . . . . . . . . . . . . . . . . . . . . . . . . 19
Executive Summary. . . . . . . . . . . . . . . . . . . . . . . . . . . . . . . . . . . . . . . . . . . 21
1. Haryana: Development Profile. . . . . . . . . . . . . . . . . . . . . . . . . . . 31
IntroductionAggregate/Sectoral/Per Capita SDP—Trend and Comparative AnalysisAgriculture and Allied ActivitiesConclusion
2. Resource Assessment. . . . . . . . . . . . . . . . . . . . . . . . . . . . . . . . . . 131
Analysis of Status and Prospects of Natural ResourcesNatural ResourcesHuman Resources (Skill Base)Fiscal Resources (Finance Base)Conclusion
3. Identification of Critical Issues and
the Newly Emerging Areas. . . . . . . . . . . . . . . . . . . . . . . . . . . . . 193
IntroductionSectoral Issues for Sustainable DevelopmentDevelopmental Issues in Upcoming Areas
4. Policy Directions. . . . . . . . . . . . . . . . . . . . . . . . . . . . . . . . . . . . . 223
Achievement of Projected Growth Targets (Aggregates and Sectoral)Optimum Use of Natural ResourcesSustainable Development and Gainful Employment of Human ResourcesIT and Employment
HAR
YANA
HARYANA DEVELOPMENT REPORT14
Management of Fiscal HealthIdeal Mix of Public/Private Sectors PartnershipMarket MechanismImprovement in Plan Implementation and Delivery MechanismSlums in HaryanaSelf-Sustained Development of Urban Local Bodies
5. State Perspectives for 2012. . . . . . . . . . . . . . . . . . . . . . . . . . . . 265
Haryana in National Perspective (With Reference to MonitorableTargets Specified in the National 10th Plan Document)Projection of Gross State Domestic Product and its Sectoral CompositionEquitable Regional DevelopmentReoriented Development of Agriculture and Allied ActivitiesRural InfrastructureIndustries—Small, Medium and LargeTertiary SectorScience and Technology and EnvironmentHuman Resource DevelopmentUrban DevelopmentPovertyEmploymentFiscal Perspective
6. Conclusions and Recommendations. . . . . . . . . . . . . . . . . . . . . 299
ConclusionsRecommendations
References. . . . . . . . . . . . . . . . . . . . . . . . . . . . . . . . . . . . . . . . . . . . . 309
. . .CONTD . . . .
15LIST OF TABLES
List of Tables
1.1 Trends in Rates of Growth in Net State DomesticProduct at Current Prices (Per cent per annum) . . . . . . . . . 31
1.2 Growth Rate During Tenth Five-Year Plan:Target and Achievement (at constant1993-94 prices) (in Per cent) . . . . . . . . . . . . . . . . . . . . . . . . 32
1.3 Trends in Rates of Growth in Net State DomesticProduct at Current Prices—Decades of Sixtiesand Seventies (Per cent per annum) . . . . . . . . . . . . . . . . . . 32
1.4 Growth Rate of SDP at Constant Prices(Per cent per annum) . . . . . . . . . . . . . . . . . . . . . . . . . . . . . . 33
1.5 Composition of Gross State Domestic Productby Broad Sectors (Per cent) . . . . . . . . . . . . . . . . . . . . . . . . . 33
1.6 Annual Growth Rates of Gross State DomesticProduct by Broad Sectors at Constant(1999-2000) Prices (Per cent) . . . . . . . . . . . . . . . . . . . . . . . 33
1.7 Sectoral Composition of SDP (Per cent) . . . . . . . . . . . . . . . 34
1.8 Sectoral Growth Rates of SDP(Per cent per annum) . . . . . . . . . . . . . . . . . . . . . . . . . . . . . . 34
1.9 Trends in Rates of Growth in Per Capita Incomeat Current Prices (Per cent per annum) (Rupees) . . . . . . . . 35
1.10 Trends in Rates of Growth in Per Capita NSDPat Current Prices—Decades of Sixties andSeventies (Per cent per annum) . . . . . . . . . . . . . . . . . . . . . . 36
1.11 Growth Rate of Per Capita SDP at 1993-94prices (Per cent per annum) . . . . . . . . . . . . . . . . . . . . . . . . . 36
1.12 Per Capita Net State Domestic Product atCurrent Prices (Rupees) . . . . . . . . . . . . . . . . . . . . . . . . . . . 37
1.13 Land Use Pattern in Haryana Thousand Hectares) . . . . . . . 38
1.14 Expenditure on Agriculture and Allied Activitiesunder Five-Year/Annual Plans in Haryana . . . . . . . . . . . . . . 38
1.15 Land Holdings in Haryana: 2000-2001 . . . . . . . . . . . . . . . . 38
1.16 Net Sown and Cropped Area in Haryana(Area in 1000 hectares) . . . . . . . . . . . . . . . . . . . . . . . . . . . . 39
1.17 Area Under Principal Crops (000 Hects) . . . . . . . . . . . . . . 39
1.18 Area under High Yielding Varieties ofFoodgrains in Haryana (000 Hectares) . . . . . . . . . . . . . . . . 40
1.19 Percentage of Gross Area Sown Under FoodgrainCrops and Commercial Crops to Total CroppedArea in Haryana (Area in 00 hectares) . . . . . . . . . . . . . . . . 41
1.20 Agricultural Production in Haryana (000 tonnes) . . . . . . . . 41
1.21 Index Numbers of Agriculture in Haryana(Base: Triennium ending 1981-82=100) . . . . . . . . . . . . . . 41
1.22 Index Numbers of Agricultural Production inHaryana (Base: Triennium ending 1981-82=100) . . . . . . . 42
1.23 Procurement of Wheat (Lakh tonnes) . . . . . . . . . . . . . . . . . 43
1.24 Procurement of Rice (Lakh tonnes) . . . . . . . . . . . . . . . . . . 43
1.25 Average Yield of Principal Crops(Kgs. Per hectare) . . . . . . . . . . . . . . . . . . . . . . . . . . . . . . . . 43
1.26 State and Region-wise Levels and Growth ofCrop Yield (At 1990-93 Constant Prices) . . . . . . . . . . . . . . 44
1.27 Percentage of Area Irrigated and Sown . . . . . . . . . . . . . . . . 44
1.28 Consumption of Fertilisers . . . . . . . . . . . . . . . . . . . . . . . . . 45
1.29 Fertiliser Consumption in Haryana(Nutrients) (In Tonnes) . . . . . . . . . . . . . . . . . . . . . . . . . . . 45
1.30 Per Hectare Fertiliser Consumption of NPKFertilisers during 2004-05 and 2005-06 (in Kg.)(Based on 2004-05 Provisional Gross CroppedArea) (Kgs.) . . . . . . . . . . . . . . . . . . . . . . . . . . . . . . . . . . . . . 46
1.31 Live Stock and Poultry in Haryana . . . . . . . . . . . . . . . . . . . . 47
1.32 Veterinary Institutions in Haryana . . . . . . . . . . . . . . . . . . . . 47
1.33 Staff of Veterinary Institutions in Haryana . . . . . . . . . . . . . 48
1.34 Per Capita Availability of Milk Per Day in Haryana . . . . . . . 48
1.35 Procurement of Milk, Number of MilkPlants and Milk Chilling Centres in Haryana . . . . . . . . . . . 49
1.36 Production of Milk, Eggs and Wool in Haryana . . . . . . . . . 49
1.37 Location of Fishery Seed Farms in Haryana(in Hectares) . . . . . . . . . . . . . . . . . . . . . . . . . . . . . . . . . . . . 52
1.38 Expenditure on Rural Development Under FiveYear/Annual Plans in Haryana (Rs. in Crore) . . . . . . . . . . . 53
1.39 How Well are the Villages Equipped:Ranking for the Large States . . . . . . . . . . . . . . . . . . . . . . . . 54
1.40 Headcount Ratio of Poor by Major States(in Per cent) . . . . . . . . . . . . . . . . . . . . . . . . . . . . . . . . . . . . . 58
1.41 Absolute Number of Poor (in Millions) . . . . . . . . . . . . . . . 58
1.42 Headcount Ratio of Very Poor by Major States(In Per cent) . . . . . . . . . . . . . . . . . . . . . . . . . . . . . . . . . . . . . 59
1.43 Percentage Distribution of Poor Personsacross the Major States (In Per cent) . . . . . . . . . . . . . . . . . 60
HAR
YANA
HARYANA DEVELOPMENT REPORT16
1.44 Expenditure on Irrigation and Flood Control underFive-Year/Annual Plans in Haryana (Rs. Crore) . . . . . . . . . 63
1.45 Length of Operating Canals and Distributaries:1966-2001 (in Miles) . . . . . . . . . . . . . . . . . . . . . . . . . . . . . . 64
1.46 Net Area Under Irrigation in Haryana . . . . . . . . . . . . . . . . . 64
1.47 Tubewells and Pumping Sets . . . . . . . . . . . . . . . . . . . . . . . . 65
1.48 Expenditure on Energy under Five-Year/Annual Plans in Haryana . . . . . . . . . . . . . . . . . . . . . . . . . . . 66
1.49 L.T. and 11 K.V. Lines in Haryana (Circuit Kilometre) . . . . 67
1.50 Installed Generation Capacity and PowerAvailability in Haryana . . . . . . . . . . . . . . . . . . . . . . . . . . . . . 68
1.51 Percentage Consumption of ElectricPower—Purposewise . . . . . . . . . . . . . . . . . . . . . . . . . . . . . . 69
1.52 Annual Per Capita Consumption ofElectricity in India during the Year2004-05 (State-wise) (In KWH) . . . . . . . . . . . . . . . . . . . . 70
1.53 Per Capita Consumption of Electricity (KwH) . . . . . . . . . . 71
1.54 Scores Assigned to the States/ElectricityDepartment in June 2006 . . . . . . . . . . . . . . . . . . . . . . . . . . 72
1.55 Expenditure on Transport under Five-Year/Annual Plans in Haryana (Rs. Crore) . . . . . . . . . . . . . . . . . 74
1.56 Length of National highways, State Roads andLocal Roads in Haryana from 1966-67 to 2001-02.Maintained by PWD (B&R) (Length in K.M.)Construction of Railway Over Bridges . . . . . . . . . . . . . . . . 75
1.57 Length of National Highways (As on31st March) (In Km) . . . . . . . . . . . . . . . . . . . . . . . . . . . . . . 76
1.58 Total and Surfaced Length of Roads in India(State-wise) (As on 31st March) (In Km.) . . . . . . . . . . . . 77
1.59 Bharat Nirman—Physical Targets for New Connectivity(Length in Kilometres, Habitations in Numbers) . . . . . . . 79
1.60 Bharat Nirman Physical Targets for Upgradation(Length in Kilometers) . . . . . . . . . . . . . . . . . . . . . . . . . . . . 80
1.61 NSP: State Profile for Haryana Statusof Connectivity . . . . . . . . . . . . . . . . . . . . . . . . . . . . . . . . . . . 81
1.62 Rail Route-length, Absolute Increase, Share and Per centIncrease (Arranged in Rank Order of % Increase) . . . . . . . 82
1.63 Railway Density in Km. (Per ’000sq. km. ofarea) (arranged in Rank Order of 2001) . . . . . . . . . . . . . . . 82
1.64 Multilateral TFP in Registered Manufacturing Sector acrossIndian States (1980-81 to 1999-2000, averages) . . . . . . . . 83
1.65 Index of Industrial Production in Haryana . . . . . . . . . . . . . 86
1.66 Annual Index of Industrial ProductionBase Year 1993-94=100 . . . . . . . . . . . . . . . . . . . . . . . . . . . 87
1.67 Year wise Status of Large and Medium Units:1990-91 to 2005-06 . . . . . . . . . . . . . . . . . . . . . . . . . . . . . . . 87
1.68 Year wise Growth of SSI Units in Haryana . . . . . . . . . . . . . 88
1.69 Industrial Production in Haryana . . . . . . . . . . . . . . . . . . . . . 88
1.70 Expenditure Incurred on Educational Institutionsby Type of Education in Haryana (Rs. in crore) . . . . . . . . . 89
1.71 Expenditure on Education (Revenue + Capital)in Rs. crore . . . . . . . . . . . . . . . . . . . . . . . . . . . . . . . . . . . . . . 90
1.72 Percentage Change in the Expenditure on Education(Revenue + Capital) Over the Previous Year . . . . . . . . . . . 91
1.73 Share of Education in State’s TotalExpenditure (Per cent) . . . . . . . . . . . . . . . . . . . . . . . . . . . . . 91
1.74 State’s share in Total Expenditure on Education of MajorStates (Per cent) . . . . . . . . . . . . . . . . . . . . . . . . . . . . . . . . . . 92
1.75 Number of Recognised Institutions in Haryana . . . . . . . . . 92
1.76 Classification of Colleges in Haryana . . . . . . . . . . . . . . . . . 93
1.77 Number of Scholars (as well as Scheduled-CasteScholars*) in Recognised Schools in Haryana . . . . . . . . . . . 93
1.78 Number of Students in Schools ofHaryana (Classwise) . . . . . . . . . . . . . . . . . . . . . . . . . . . . . . 94
1.79 Percentage of School-going children . . . . . . . . . . . . . . . . . . 94
1.80 Gross Enrolment Ratio in ClassesI-V, VI-VIII and I-VIII . . . . . . . . . . . . . . . . . . . . . . . . . . . . . 95
1.81 Intake Capacity in Degree Courses in EngineeringDepartmentwise . . . . . . . . . . . . . . . . . . . . . . . . . . . . . . . . . 97
1.82 Classification of Recognised High/Senior SecondarySchools by Management in Haryana . . . . . . . . . . . . . . . . . . 98
1.83 Classification of Recognised Middle Schools byManagement in Haryana . . . . . . . . . . . . . . . . . . . . . . . . . . . 98
1.84 Classification of Recognised Primary(Including pre-Primary/Balwari) Schoolsby Management in Haryana . . . . . . . . . . . . . . . . . . . . . . . . . 98
1.85 State-Wise Literacy Rates (1951-2001)(In Per cent) . . . . . . . . . . . . . . . . . . . . . . . . . . . . . . . . . . . . . 99
1.86 Literacy Rates for Male and Female—1961, 1981 and2001 (Arranged in Rank Order of 2001 for Female) . . . . . 99
1.87 Hospitals, Dispensaries and Health Centresin Haryana . . . . . . . . . . . . . . . . . . . . . . . . . . . . . . . . . . . . 101
1.88 Number of Medical (Allopathic) Institutionsin Haryana—Rural and Urban . . . . . . . . . . . . . . . . . . . . . 101
1.89 Ayurvedic, Unani and Homeopathic Institutionsand their Staff in Haryana . . . . . . . . . . . . . . . . . . . . . . . . 104
1.90 Medical Staff in Haryana (As on 31st December) . . . . . 104
1.91 Beds Available in Haryana (As on 31st December) . . . . 106
1.92 Number of Family Welfare Clinics in Haryana . . . . . . . . 106
1.93 State-Wise Infant Mortality Rate . . . . . . . . . . . . . . . . . . . 108
1.94 State-wise Life Expectancy at Birth(Rank as in 1993-97) . . . . . . . . . . . . . . . . . . . . . . . . . . . . 109
1.95 Malnutrition among Indian Children belowThree Years (Per cent) . . . . . . . . . . . . . . . . . . . . . . . . . . . 112
1.96 Rural-Urban Differentials in ChildMalnutrition (Per cent) . . . . . . . . . . . . . . . . . . . . . . . . . . 112
1.97 Children of 12-23 Months Fully Immunised(BCG, Measles and Three Doses Each ofPolio/DPT) (Per cent) . . . . . . . . . . . . . . . . . . . . . . . . . . . 113
1.98 Children Aged 6-35 Months Who AreAnaemic (Per cent) . . . . . . . . . . . . . . . . . . . . . . . . . . . . . 113
1.99 Trends in Anaemia among children and Womenin selected States . . . . . . . . . . . . . . . . . . . . . . . . . . . . . . . 113
17LIST OF TABLESList of Tables
1.100 Human Development Index 1981, 1991, and2001 (Arranged in Rank order of 1991) . . . . . . . . . . . . . 115
1.101 Decadal Growth of Population in HaryanaSince 1901 . . . . . . . . . . . . . . . . . . . . . . . . . . . . . . . . . . . . 115
1.102 Percentage Decadal Growth of Population(Arranged in Rank order of 1991-2001) . . . . . . . . . . . . . 115
1.103 District Wise Sex Ratio Since 1901 . . . . . . . . . . . . . . . . 116
1.104 Sex Ratio (Female per thousand Male) in India(Arranged in Rank Order of 2001) . . . . . . . . . . . . . . . . . 117
1.105 Total Fertility Rates, 1998 and Projected TotalFertility Rates, 2007 . . . . . . . . . . . . . . . . . . . . . . . . . . . . . 117
1.106 Religion Wise Population of Haryana (Per cent) . . . . . . . 118
1.107 Distribution of Population of Haryanaby Age Groups, 2001 . . . . . . . . . . . . . . . . . . . . . . . . . . . . 118
1.108 Age Specific Sex Ratio—India, States andUnion Territories: 2001 . . . . . . . . . . . . . . . . . . . . . . . . . . 119
1.109 Proportion of Child Population in Age-Groups0-4, 5-9 and 0-9 Years to Total Population byresidence—Person: India, States and UnionTerritories, 1991-2001 . . . . . . . . . . . . . . . . . . . . . . . . . . . 120
1.110 Young, Old and Total Dependency Ratio by Residence –India, States and Union Territories: 1991-2001 . . . . . . . 122
1.111 Trends in Urbanisation in Haryana, 1901-2001 . . . . . . . 123
1.112 Urban Population in India and States/Union Territories: 2001 . . . . . . . . . . . . . . . . . . . . . . . . . . 124
1.113 Share of Agriculture Sector to Gross StateDomestic Product of Districts of Haryana andPer Capita income of Districts at Constant(1993-94) Prices: 2002-03 (Provisional) . . . . . . . . . . . . 124
1.114 Gross Area Irrigated and Total Cropped Area byDistricts in Haryana during 2004-05 (Hectares) . . . . . . 125
1.115 Number of Registered Factories and WorkersEmployed in Haryana—July 2006 (Provisional) . . . . . . . 125
1.116 District wise status of Large and Medium Unitsin Haryana: As on 31 March 2006 . . . . . . . . . . . . . . . . . . 126
1.117 Ranking of Districts by Percentage of UrbanPopulation 1991 and 2001 . . . . . . . . . . . . . . . . . . . . . . . . 126
1.118 Data on Houses, Household Amenities and Assets . . . . 127
1.119 Population Data Sheet, 2001 . . . . . . . . . . . . . . . . . . . . . . 127
1.120 District Wise Literacy Rate, 2001 . . . . . . . . . . . . . . . . . . 128
1.121 Tehsil of Haryana Cross-classified by Levels ofSex-ratio and Literacy Rate . . . . . . . . . . . . . . . . . . . . . . . 128
1.122 Ranking of Districts based on Composite Index ofSocio-Economic Development . . . . . . . . . . . . . . . . . . . . 129
2.1 Haryana: Work Participation Rate by District,2001 (in Per cent) . . . . . . . . . . . . . . . . . . . . . . . . . . . . . . 147
2.2 Occupational Distribution of Persons on the LiveRegister of Employment Exchanges in Haryana(As on 31st December) . . . . . . . . . . . . . . . . . . . . . . . . . . 148
2.3 Employment in the Organised Sector inHaryana (As on 31st March) . . . . . . . . . . . . . . . . . . . . . . 149
2.4 Haryana: Agricultural Workers as Percentage of TotalWorking Population by District, 2001(Agricultural+Cultivators) . . . . . . . . . . . . . . . . . . . . . . . 150
2.5 Haryana: Cultivators as Percentage of Total WorkingPopulation by District, 2001 . . . . . . . . . . . . . . . . . . . . . . 150
2.6 Haryana: Agricultural Labourers as Percentage of TotalWorking Population by District, 2001 . . . . . . . . . . . . . . . 151
2.7 Haryana: Non-Agricultural Workers as Percentageof Total Working Population by District,2001 (in Per cent) . . . . . . . . . . . . . . . . . . . . . . . . . . . . . . 152
2.8 Haryana: Household Industries Workers asPercentage of Total Working Populationby District, 2001 (in Per cent) . . . . . . . . . . . . . . . . . . . . . 153
2.9 Haryana: Other Workers as Percentage of Total WorkingPopulation by District, 2001 (in Per cent) . . . . . . . . . . . . 153
2.10 Haryana: Marginal Workers as Percentage of Total WorkingPopulation by District, 2001 (in Per cent) . . . . . . . . . . . . 154
2.11 Growth in Workforce for Major States 1991-2001(Census Based) (Main Workers) . . . . . . . . . . . . . . . . . . . 155
2.12 Employment Shares (Percentage) by Industrial Sectors(Usual Principal Status) . . . . . . . . . . . . . . . . . . . . . . . . . 156
2.13 Unemployment Rates in Different States (1999-2000) . 156
2.14 Currently Daily Status Unemployment Rate amongthe Youth (Age 15-29) for Each State and UnionTerritory (1999-2000) . . . . . . . . . . . . . . . . . . . . . . . . . . . 157
2.15 Per 1000 Distribution of Rural Persons by Broad Usual(Principal and Subsidiary) Activity . . . . . . . . . . . . . . . . . 158
2.16 Per 1000 Distribution of Urban Persons by Broad Usual(Principal and Subsidiary) Activity . . . . . . . . . . . . . . . . . 158
2.17 Details of Revenue Receipts of Haryana State from1990-91 to 2006-07 (Rs. Lakh) . . . . . . . . . . . . . . . . . . . 160
2.18 Details of Revenue Expenditure in Haryana: 1990-91 to2006-07 (Rs. Lakh) . . . . . . . . . . . . . . . . . . . . . . . . . . . . . 164
2.19 Details of Capital Receipts of the State Haryanafrom 1990-91 to 2006-07 (Rs. Lakh) . . . . . . . . . . . . . . . 170
2.20 Details of Capital Expenditure of Haryana StateFrom 1990-91 to 2006-07 . . . . . . . . . . . . . . . . . . . . . . . . 173
2.21 Haryana’s Surplus/Deficit on Revenue Account andCapital Account (Rs. Crore) . . . . . . . . . . . . . . . . . . . . . . 180
2.22 Over-all Surplus/Deficit of Haryana (Rs. Crore) . . . . . . 180
2.23 Haryana’s Gross Fiscal Deficit and PrimaryDeficit (Rs. Crore) . . . . . . . . . . . . . . . . . . . . . . . . . . . . . 181
2.24 Financing of Gross Fiscal Deficit in Haryana . . . . . . . . . 182
2.25 Composition of Outstanding Liabilities of Haryana . . . . 182
2.26 Own Tax and Non-Tax Revenue of Haryana(Rs. Crore) . . . . . . . . . . . . . . . . . . . . . . . . . . . . . . . . . . . . 183
2.27 Haryana’s Interest Payments (Rs. Crore) . . . . . . . . . . . . 183
2.28 Haryana’s Share in Transfer of Resourcesfrom the Centre (Rs. Crore) . . . . . . . . . . . . . . . . . . . . . . 184
2.29 Fiscal Indicators of State of Haryana(1993-94 to 2006-07) . . . . . . . . . . . . . . . . . . . . . . . . . . . 185
2.30 Fiscal Indicators—2002-03 to 2004-05(Average) (Per cent) . . . . . . . . . . . . . . . . . . . . . . . . . . . . . 186
2.31 Fiscal Indicators—2005-06 (RE) (Per cent) . . . . . . . . . . 187
2.32 Expenditure on Wages and Salary (Rs. Crore) . . . . . . . . 188
HARYANA DEVELOPMENT REPORT18
2.33 Indices of Fiscal Self Reliance and Improvement(FSRI) given by Eleventh Finance Commission . . . . . . . 189
2.34 Indices of Fiscal Self Reliance and Improvement(FSRI) given by Twelfth Finance Commission . . . . . . . . 190
2.35 Component Indices for the Fiscal PerformanceIndex (FPI) . . . . . . . . . . . . . . . . . . . . . . . . . . . . . . . . . . . . 190
2.36 Composite Fiscal Performance Index (FPI) . . . . . . . . . . 191
3.1 Growth Rates of change in Share by Industry toSDP in Haryana: 1993-94 to 2005-06 . . . . . . . . . . . . . . . 193
3.2 Tourist Trends (Actual and Projected) in Haryanafrom 1986-87 to 2011-12 (In Lakh) . . . . . . . . . . . . . . . . 199
3.3 Occupancy Percentage of Haryana TourismComplexes: 1986-87 to 1996-97 . . . . . . . . . . . . . . . . . . . 199
3.4 Financial Results of Haryana TourismCorporation (HTC) . . . . . . . . . . . . . . . . . . . . . . . . . . . . . 200
3.5 The Status of Accommodation in Haryana . . . . . . . . . . . 201
3.6 World Exports of Chemicals as ManufacturedGoods (Billion US $ and Percentage Change) . . . . . . . . . 210
3.7 Haryana’s Exports: 1996-97 to 1998-1999(Rs. in Lakh) . . . . . . . . . . . . . . . . . . . . . . . . . . . . . . . . . . 211
3.8 District/Corporation wise Export From HaryanaDuring the Year 1996-97 to 1998-99(Amount Rs. in Lakh) . . . . . . . . . . . . . . . . . . . . . . . . . . . 211
3.9 District-wise Distribution of NGOs inHaryana in 2000 . . . . . . . . . . . . . . . . . . . . . . . . . . . . . . . . 221
4.1 Fiscal, Revenue and Primary Deficit of HaryanaState (Per cent of GSDP) . . . . . . . . . . . . . . . . . . . . . . . . . 238
4.2 Trends in State Finances (Per cent of GSDP) . . . . . . . . . 238
4.3 Expenditure Analysis of Haryana State Finance . . . . . . . 239
4.4 Composition of Revenue Expenditure inHaryana (Per cent of Total RE) . . . . . . . . . . . . . . . . . . . . 239
4.5 Composition of Capital Expenditure in Haryana(Per cent of Total CE) . . . . . . . . . . . . . . . . . . . . . . . . . . . 240
4.6 Composition of Revenue Receipts(Per cent of total RR) . . . . . . . . . . . . . . . . . . . . . . . . . . . 240
4.7 Tax Buoyancy in Haryana: 93-94 to 2002-03 . . . . . . . . . 241
4.8 Dependency Ratio of Haryana State Finance . . . . . . . . . . 242
4.9 Ratio of Public Debt to Gross State DomesticProduct in Haryana . . . . . . . . . . . . . . . . . . . . . . . . . . . . . . 242
4.10 Equity Index of States in India . . . . . . . . . . . . . . . . . . . . 243
4.11 Efficiency Index of States in India . . . . . . . . . . . . . . . . . . 244
4.12 State-wise Sustainable Fiscal Deficit forTenth Plan (as % GSDP) . . . . . . . . . . . . . . . . . . . . . . . . . 245
4.13 Statewise Urban Population, Population of Cities/TownsReporting Slums & Slum Population in Slum Areas . . . 251
4.14 Slum Population in Million Plus Cities . . . . . . . . . . . . . . 252
4.15 Percentage of Slum Population to totalPopulation in Haryana . . . . . . . . . . . . . . . . . . . . . . . . . . . 254
4.16 Slum Population, Sex Ratio and Literacy in Haryana . . . 254
4.17 Growth of Urban Population and number ofTowns in Haryana . . . . . . . . . . . . . . . . . . . . . . . . . . . . . . 260
4.18 Composition of Urban Local Bodies in Haryana . . . . . . . 261
4.19 Revenue Composition of Urban Local Bodiesin Haryana (Rs. Crore) . . . . . . . . . . . . . . . . . . . . . . . . . . 262
5.1 Projected Composition of Gross State Domestic Productby Broad Sectors at Constant (1993-94) Prices . . . . . . . 268
5.2 Projected Shares of Broad Sectors . . . . . . . . . . . . . . . . . . 268
5.3 Correlation Matrix (a) . . . . . . . . . . . . . . . . . . . . . . . . . . . 269
5.4 Estimated Investment Requirementsfor Primary Sector . . . . . . . . . . . . . . . . . . . . . . . . . . . . . . 269
5.5 Correlation Matrix (b) . . . . . . . . . . . . . . . . . . . . . . . . . . . 270
5.6 Estimated Investment Requirementsfor Secondary Sector . . . . . . . . . . . . . . . . . . . . . . . . . . . . 270
5.7 Estimated Investment Requirementsfor Tertiary Sector . . . . . . . . . . . . . . . . . . . . . . . . . . . . . . 270
5.8 Total Investments Required for Eleventh Planand Expected Capital Expenditure by theState at Constant Prices (Base 1993-94) . . . . . . . . . . . . 270
5.9 Total Investments Required and Expected CapitalExpenditure by the State for sustainable growthof primary, secondary and tertiary sectors atcurrent prices for Eleventh Plan . . . . . . . . . . . . . . . . . . . . 270
5.10 Gender Disparities in Haryana . . . . . . . . . . . . . . . . . . . . . 292
5.11 Urbanisation Trends in Haryana . . . . . . . . . . . . . . . . . . . 292
5.12 Percentage of Population Below Poverty Line(Arranged in Decreasing Order of 1999-2000) . . . . . . . 293
5.13 Poverty and per capita rural consumptionin Punjab (including Haryana) . . . . . . . . . . . . . . . . . . . . . 293
5.14 Average per Capita Real Consumption and PovertyLevels of Indian States (1990-91 to 1993-94) . . . . . . . . 294
5.15 Projected Poverty Ratios for Haryana . . . . . . . . . . . . . . . 295
5.16 Growth in Workforce for Major States 1991-2001(Main Workers) . . . . . . . . . . . . . . . . . . . . . . . . . . . . . . . . 295
5.17 Percentage Change in Percentage Share inEmployment 1987-88 to 1999-2000) . . . . . . . . . . . . . . . 295
5.18 Per cent Distribution of Employment byIndustrial Sectors . . . . . . . . . . . . . . . . . . . . . . . . . . . . . . . 296
5.19 Share of Haryana in Total Labour Migratedfrom India . . . . . . . . . . . . . . . . . . . . . . . . . . . . . . . . . . . . 296
5.20 Current Daily Status Unemployment Ratesfor Haryana (1999-2000) . . . . . . . . . . . . . . . . . . . . . . . . 296
5.21 Per 1000 Distribution of Rural Persons by BroadUsual (Principal and Subsidiary) Activity . . . . . . . . . . . . 296
5.22 Per 1000 Distribution of Urban Persons by BroadUsual (Principal and Subsidiary) Activity . . . . . . . . . . . . 296
5.23 Occupational Distribution of Persons on the LiveRegister of Employment Exchanges in Haryana(As on 31st December; 2003) . . . . . . . . . . . . . . . . . . . . . 297
5.24 Work Participation Rate by Economic Activityin Haryana . . . . . . . . . . . . . . . . . . . . . . . . . . . . . . . . . . . . 297
The first meeting of the Core Committee on State
Development Report-Haryana was held on July 15, 2003
under the Chairmanship of Shri Som Pal, Member,
Planning Commission. Shri Mantreshwar Jha, Principal
Advisor (SP-N) Planning Commission, Shri Chander
Singh, Principal Secretary (Planning), Government of
Haryana and Shri J.P. Vijay, Deputy Advisor (SP-N),
Planning Commission were the other participants of the
meeting. In this meeting it was decided that State
Government would prepare a chapter format keeping in
view the problems and development prospects of Haryana.
Thereafter, in a meeting of state government officials held
on September 12, 2003 under the Chairmanship of
Financial Commissioner and Principal Secretary to
Government of Haryana, Planning Department, the task of
preparing the State Development Report of Haryana was
assigned to Maharshi Dayanand University, Rohtak and
Kurukshetra University, Kurukshetra. The second meeting
of the Core Committee was held on December 10, 2003
under the Chairmanship of Shri Som Pal. The third
meeting of the Core Committee was held on March 23,
2004 under the Chairmanship of Dr. D.N. Tiwari,
Member, Planning Commission. Smt. Meenakshi Anand
Choudhary, Principal Advisor (SP-S), Planning
Commission, Prof. S.B. Dahiya, Director, Institute of
Development Studies, Maharshi Dayanand University,
Rohtak, Dr. V.N. Attri, Professor of Economics,
Kurukshetra University, Kurukshetra and Shri T.P.
Biswas, Director (SP-N), Planning Commission were
the other participants of the meeting. In this meeting
the chapter format for State Development Report of
Haryana was approved.
The fourth meeting of the Core Committee on State
Development Report-Haryana was held on 1st September
2004 under the Chairpersonship of Dr. (Ms.) Syeda
Hameed, Member, Planning Commission. Smt. Kasturi
Gupta Menon, Principal Advisor (SP-N), Planning
Commission, Smt. Promila Issar, Principal Secretary
(Planning), Government of Haryana, Shri Ranvir Gupta,
Economic and Statistical Advisor, Government of
Haryana, Prof. S.B. Dahiya and Prof. V.N. Attri were
the other participants of the meeting. In this meeting
the terms of references/the chapter design for the study
was modified and finalised. Prof. S.B. Dahiya was
appointed Coordinator for preparation of the State
Development Report-Haryana.
Chapters 1, 2 and sections 5.1, 5.2.2, 5.2.3, 5.2.9,
5.2.10, 5.2.11 and 5.2.13 of Chapter 5 were assigned to
the Institute of Development Studies, Maharshi
Dayanand University, Rohtak and Chapters 3, 4 and
sections 5.2.1, 5.2.4, 5.2.5, 5.2.6, 5.2.7, 5.2.8 and
5.2.12 of Chapter 5 were assigned to Department of
Economics, Kurukshetra University, Kurukshetra
The work for the preparation of the State Development
Report started in April, 2005 under the overall guidance of
Dr. (Ms.) Syeda Hameed. The first draft of the Report was
completed in April, 2006 and the same was submitted to
the Planning Department, Government of Haryana and the
Planning Commission, Government of India for peer
review. The first seminar on the Report was held on June
30, 2006 at Haryana Niwas, Chandigarh under the
Chairpersonship of Dr. (Ms.) Syeda Hameed. In this
seminar Chief Secretary, Principal Secretaries and other
officials of Government of Haryana participated. The
participants made certain suggestions for improvement of
the Report. The second seminar on “Declining Sex Ratio:
Problems and Challenges” was held at Maharshi Dayanand
University, Rohtak under the Chairpersonship of Dr.
(Ms.) Syeda Hameed, Member, Planning Commission on
March 25, 2007. After incorporating the suggestions of
the Planning Department and that of Government of
Haryana the final draft of the State Development Report-
Acknowledgements
HAR
YANA
HARYANA DEVELOPMENT REPORT20
Haryana was submitted to the State Government in
August 2007 and to the Planning Commission in
December 2007. In a meeting of the Core Committee held
on February 25, 2008 the State Development Report–
Haryana was finalised and the final draft for publication
was submitted to the Planning Commission on March 17,
2008.
The process of preparing the State Development
Report began with the then Member, Planning
Commission Shri Som Pal who shared his deep insight
and wide range of experience while chairing the first two
meetings of the officials and members of the team.
Thereafter, it was Dr. D.N. Tiwari who replaced Shri Som
Pal and chaired the third meeting of the
Core Committee. Soon after that Dr. (Ms.) Syeda Hameed
became the Chairperson of the Core Committee and as a
matter of fact Dr. (Ms.) Syeda Hameed and her colleagues
have spent considerable time in going through the report
and making some valuable suggestions which have been
incorporated as desired.
May I avail of this opportunity to express my sincere
thanks to Shri Som Pal, Dr. D.N. Tiwari, Dr. (Ms.)
Syeda Hameed, Shri Mantreshwar Jha, Smt. Meenakshi
Anand Choudhary, Smt. Kasturi Gupta Menon, Shri
Chander Singh, Smt. Promila Issar, Shri T.P. Biswas,
Shri J.P. Vijay and Shri Ranvir Gupta for their valuable
suggestions and to all the members of the research
team for their significant contribution in preparing the
State Development Report-Haryana.
I thankfully acknowledge the contribution made by
Dr. Jitender Prasad and Dr. R.S. Hooda of Haryana State
Remote Sensing and Application Centre (HSRSAC), Hisar
in writing Chapter 2.1.1 of the report. Mr. Joginder Kumar
deserves our special thanks for secretarial assistance.
I, on behalf of both the universities, would like to
thank the Planning Commission and the Government of
Haryana for having given us this opportunity to prepare
the report.
Shri Bhagwan Dahiya
Director
Institute of Development Studies
Maharshi Dayanand University, Rohtak
Executive Summary
HAR
YANA
The State of Haryana came into existence on 1st of
November 1966. Since then it has been achieving an all
round development. Its importance lies in the fact that 30
per cent of its total area, comprising the districts of
Faridabad, Mewat, Gurgaon, Rewari, Jhajjar, Rohtak,
Sonipat and Panipat, falls into the National Capital Region
(NCR) of India. Differently stated, 40 per cent of the total
area of the National Capital Region (NCR) is that of
Haryana State. The NCR area of the State needs to be
extended to the radius of 125 kilometres or so from the
border of Delhi State and within this area a world class
infrastructure needs to be created.
In the sixties, Haryana progressed rapidly with a
growth rate of 5.5 per cent per annum against the all-
India’s growth rate of 3.0 per cent. In the seventies,
while the national average of annual economic growth
picked up from 3.0 per cent in the sixties to 3.6 per
cent, the average annual rate of growth of Haryana
declined from 5.5 per cent to 4.8 per cent. Haryana
progressed rapidly during the 1980s with an average
annual growth rate of 6.68 per cent as against all-
India’s growth rate of 5.60 per cent. In the 1990s,
Haryana grew at an average annual rate of 6.71 per cent
as against all-India’s growth rate of 6.03 per cent per
annum. It is interesting to note that during the overall
period from 1980-81 to 1990-2000, Haryana recorded
the highest growth rate of 7.80 per cent per annum in
the country as against all-India’s growth rate of 5.66
per cent per annum. In the years 2000-01, 2001-02,
2002-03, 2003-04, 2004-05 and 2005-06 the rate of
growth in the State has been 6.8, 5.4, 5.0, 8.6, 8.4 and
8.5 per cent, respectively.
The State of Haryana achieved the fastest
acceleration in secondary sector growth during 1980s
with an average annual growth rate of 15 per cent.
However, in the 1990s, this annual growth rate
declined to 8.37 per cent. During the period 1981-2000,
as a whole, the fastest acceleration in the secondary
sector growth in India took place in Haryana with an
average annual growth rate of 12.58 per cent. In the
years 2000-01, 2001-02, 2002-03, 2003-04, 2004-05 and
2005-06 the rate of growth in the secondary sector has
been 5.7, 5.7, 4.1, 7.7, 8.1 and 8.3 per cent,
respectively.
As regards the tertiary sector, in the 1980s Haryana
had an average annual growth rate of 7.49 per cent. In the
subsequent decade of 1990s, it increased to a growth
rate of 8.38 per cent. In the years 2000-01, 2001-02,
2002-03, 2003-04, 2004-05 and 2005-06 the rate of
growth in the tertiary sector has been 11.4, 9.3, 10.0,
8.9, 11.8 and 12 per cent, respectively.
Haryana’s per capita SDP at constant prices (1993-
94) increased significantly during the 1980s and 1990s.
In the 1980s, it grew by an annual average rate of 4.12
per cent as against all-India’s rate of 3.36 per cent. In
the 1990s, it grew by 4.42 per cent per annum as
against all-India’s rate of 4.07 per cent. It is interesting
to note that since 2002-03, with the exception of such
small States as Goa, Delhi, and Pondicherry, Haryana
has been recording the highest per capita NSDP in the
country. In the years 2000-01, 2001-02, 2002-03, 2003-
2004 and 2004-05 the rate of growth in the State has
been 4.1, 2.7, 3.4, 7.1 and 7.1 per cent, respectively.
The economy of the State has undergone major
structural changes. There has been a shift from the
primary sector to secondary and tertiary sectors. At
constant (1993-94) prices, the share of primary sector has
declined from 42.5 per cent during 1993-94 to 28.2 per
cent during 2004-05. The share of secondary sector has
increased from 26.2 per cent to 27.4 per cent over the
same period. Likewise, the share of tertiary sector has
increased from 31.3 per cent to 44.4 per cent.
HARYANA DEVELOPMENT REPORT22
The high rate of economic growth in the State has
been accompanied by a reduction in poverty. There has
been an appreciable decline in the percentage of
population below the poverty line from over 35 per cent
in the 1970s to less than 9 per cent in the late 1990s.
An encouraging trend that emerged between 1993-94 and
1999-2000 in the State is that rural poverty decreased
much faster than urban poverty. The population below
the poverty line in rural Haryana has significantly
declined from 28.02 per cent in 1993-94 to 8.27 per
cent in 1999-2000 as against all-India’s average figure
of 27.09 per cent. There have been improvements in the
social indicators as well. The literacy rate has increased
from almost 26 per cent in 1971 to 68 per cent in 2001.
The agricultural production index in Haryana has
increased from 106.37 in 1980-81 to 243.42 in 2004-05.
Apparently, the increase in production was due almost
entirely to increase in yield. The yield index almost
doubled over this period. Whereas the non-food grains
index increased from 104.72 to 318.73, the index of food
grains increased from 107.02 to only 217.72, over the
period 1980-2005. And, within food grains, the index of
cereals grew up sharply from 103.89 to 245.20 and of
pulses declined steeply from 125.54 to 27.50 over this
period. As a result of higher production of food grains
the State of Haryana is one of the largest contributors
of food grains to the central pool. In 2005-06, the
contribution of Haryana in the procurement of wheat was
30.60 per cent of the total procurement made in the
country and it was next only to Punjab whose share was
60.90 per cent. Similarly, Haryana has also been
significantly contributing to the procurement of rice in
the country. Whereas the all-India average yield per
hectare in respect of wheat and rice during 2003-04 was
2713 and 2077 kilograms respectively, in Haryana the
corresponding yield was 3935 and 2749 kilograms.
Haryana is emerging very fast as one of the leading
States in the field of horticulture. The main thrust is
being given for the development on floriculture and
mushroom apart from fruits and vegetables. In 1990-91,
the area under fruits stood at 12,640 hectares producing
99.8 thousand tonnes. These figures increased to 24,071
hectares and 247.6 thousand tonnes, during 2004-05.
Likewise, during this period the area under vegetables
increased from 55360 hectares in 1990-91 to 2.08 lakh
hectares in 2004-05, and the production increased from
8.02 lakh tonnes to 27.67 lakh tonnes. The area under
floriculture has also increased from 50 hectares in 1990-
1991 to 4810 hectares in 2004-05. This period also
witnessed remarkable growth in mushroom production
which increased from 850 tonnes to 6163 tonnes.
In order to improve the conditions of farmers, the
State economy needs to be diversified with progressive
shift of population from agriculture to secondary and
tertiary sectors; policy of corporatisation of agriculture
through contract farming be introduced; and big
corporation in agro-business be involved. The farming
community needs to be involved through cooperative
activities in agriculture production, processing and
marketing. In order to eliminate poverty in the State an
accelerated growth rate (GSDP) of about 10 per cent is
required
To realise Haryana State’s full share of Ravi-Beas
water the Satluj-Yamuna Link (SYL) canal needs to be
completed at the earliest. Necessary steps need to be
taken for the conservation and better management of
surface water, rainwater harvesting, recharging of
groundwater and improvement of sub-soil water level in
the State. Steps should also be taken to popularise drip
irrigation system particularly for quality improvement and
early ripening of horticultural produce. Necessary steps
need to be taken to bring the entire sown area under
irrigation
Since the existing paddy-wheat rotation in the
agriculture sector in the State is causing degradation in
soil fertility and further fall in the groundwater level,
there is an urgent need for crop diversification in the
State. The cultivation of Jatropha and the setting up of
Jatropha based bio-diesel units in the State should be
given priority. The State should also promote agro-
based industries. Efforts should be made to set up
public investment in extended agriculture in terms of
accelerating the switch from cereals to oilseeds, pulses,
horticulture, floriculture, fishery, bee keeping, and
cultivation of medicinal and energy plants.
The livestock sector, by contributing milk, eggs and
meat to the food basket, plays a critical role in fulfilling
the animal protein requirement of the people. Livestock is
one of the important components of primary sector of the
economy and there still exists a substantial scope for
growth in this sector. Haryana is the milk pail of India
and is famous for its breed of “Hariana Cows” and
“Murrah Buffaloes”. The State Government is laying
emphasis on increasing the production capacity of the
animal through genetic improvement of the animals.
Great stress is being laid on the improvement of breed of
the cattle and buffaloes to increase the milk yield through
artificial insemination with exotic and other improved
semen.
Salt affected land, scrub land, waterlogged land, barren
land and sandy area constitute the main wasteland in the
EXECUTIVE SUMMARY 23
State. The majority of salt-affected lands are associated
with waterlogged areas. These are mainly spread over the
central and southern parts of the State. Absence of natural
drainage outlet and use of poor quality groundwater for
agriculture purpose render highly fertile soils salt affected.
Barren lands are generally associated with Aravali ranges.
Land becomes barren with scrub due to loss of soil
fertility caused by waterlogging and poor quality of
groundwater. Sandy areas in the form of sand dunes are
mainly located in areas bordering Rajasthan State. Arid
climate with no irrigation facilities rendered the soil
unproductive with development of barren sand dunes.
About 70 per cent area of the State has marginal to
saline groundwater.
Accurate mapping of groundwater zones as per their
suitability for domestic, irrigation and industrial uses is
highly desirable for proper management of groundwater
resources and to safeguard human beings from consump-
tion of poor quality groundwater. To check further
deterioration in the quality of groundwater in the State
regular monitoring of their chemical quality is necessary.
Canal water is main source of irrigation as well as
domestic supplies to the State. The availability of water
from both the sources, that is, surface and sub-surface,
is much below the requirement. Whereas the supply of
surface water is more or less constant with a small
variation depending upon water level in the Bhakra and
Pong reservoirs and the flow of water in river Yamuna,
the availability of sub-surface water is declining due to
more withdrawal than its recharging. Canal irrigated area
in Haryana in 2004-05 has been 48 per cent of the total
net area irrigated. The share of tubewells in total irrigated
area has been increasing continuously. It was 50.5 per
cent of total net area irrigated in 2004-05. The area
under irrigation, as percentage of gross area sown was
84 per cent in 2004-05.
Being an alluvial formation, the State has very little
mineral wealth. Iron ore, limestone and slate are the
only three principal minerals economically exploited at
present. Other minerals are lime, kankar, china clay,
dolomite, quartz and silica. Limestone and kankar are
used in cement manufacturing. The Geological Survey
of India has estimated the resources of crystalline
limestone to be of the order of 17.5 million tonnes.
Slate is found in the Rewari, Mohindergarh and
Gurgaon districts. The iron ore reserves are of the order
of five million tonnes. The ore is of high grade, varying
from 50 per cent to 65 per cent in iron contents.
The proximity of villages to the administration
centres enhances their growth potential. The
inconveniences, if any, faced by the villagers are readily
reported and consequently the probability of
introducing corrective measures is usually higher. The
access to various places of the economy determines
substantially the performance and efficiency of the
government. Absence of access signifies prevalence of a
self-reliant village economy having little development
opportunities and low growth potential. Increasing
access augments the possibility of diversification and
higher growth. The villages located in Haryana are most
effectively connected with rest of the economy. The
infrastructure level of the villages, both social and
physical, is extremely important in the realisation of
development potential. In this regard Haryana is among
the best performing large States.
Infrastructure in the State, be it irrigation, power,
roads, dry ports, airports or any other sector, needs the
massive overdose of restructuring and investments. In
order to bridge the demand-supply gap of electricity
necessary steps need to be taken to set up power
generation plants. Steps need to be taken for the
electrification and construction of new rail tracks and ring
rail along the Kundli-Manesar-Palwal (KMP) expressway
in the State. There is a necessity for four laning of all the
State and national highways passing through the State,
and strengthening and widening of all link roads in the
State. Special emphasis should also be given for the
construction of fly overs and rail over bridges. Airports
and dry ports need to be set up and developed in the
State.
The State should take necessary steps for the metro
rail links from Delhi to Faridabad, Delhi to Gurgaon,
Delhi to Bahadurgarh, Delhi to Kharkhoda and Delhi to
Sonipat. Kharkhoda town, which is only few kilometers
from Delhi, needs to be fully developed as a modern
residential and industrial town. Kharkhoda is full of
development potentials.
At the time of formation of the State in 1966, Haryana
had only 162 large and medium units. By June 2006,
this number has grown to 1290. At present, these
units are operating with capital investment of more
than Rs.220 billion, employing more than 2 lakh
persons and producing goods worth Rs.12,800 crore.
The export which was only Rs.4.5 crores in 1966 has
crossed Rs.20,000 crores in 2004-05. During the period
August 1991-May 2001, as many as 206 fully export-
oriented units were established in Haryana alone which
constituted 5.59 per cent of the total such units in the
country. Industrial Model Township, Manesar near
Gurgaon has already become the destination of many
HARYANA DEVELOPMENT REPORT24
multinational companies. The area between Kundli and
Sonipat town falls under a highly industrialised zone. A
multi-functional complex is also being developed at
Kundli. It is in this complex that export promotion
industrial park, food park, cold chain complex have
been developed by the HSIDC. Industrial Growth Centre
at Bawal has also emerged as the destination of
multinational companies.
Haryana’s index of industrial production is far above
the all-India average. Haryana currently produces 75 per
cent of passenger cars, 60 per cent of tractors, 70 per cent
of motor cycles and 50 per cent of refrigerators
manufactured in the country. About 25 per cent of India’s
total production of sanitary-ware is from Haryana. One
out of every four bicycles in the country is
manufactured here. The progress of industry in the
recent decade saw some new milestones emerging with
the remarkable performance by industrial units engaged
in the production of motor cycles, scooters, mopeds,
cars, etc. As a result, the industrial production almost
doubled over the recent 10 year period.
The growth of small industries in the State has also
been phenomenal. Their number has increased from
4500 in 1966 to 80,000 today. They are producing
goods worth Rs.4500 crores per annum while
generating employment for 8.7 lakh persons. Twenty
per cent of the country’s total export of scientific
instruments, 60 per cent of the demand of ammunition
boxes of the country’s defence forces and 60 per cent of
the total needs of woollen blankets of the Indian army
are met by small units of Haryana. Haryana’s small
scale sector also enjoys the reputation of manufacturing
the largest number of electrical mixies and gas stoves
in the country. Engineering goods, chemicals, software,
handloom products, agro-based lamps, scientific
instruments, leather products, automobiles and tractors
are exported from Haryana.
The State Government formulated a new industrial
policy in June 2005. The basic objective of the policy is
to develop and promote industries and to create
employment opportunities in the manufacturing and
service sector. This policy has three pronged strategy.
The first is to develop infrastructure, the second is to
provide incentives and concessions to the industry in
backward/rural areas in order to check exodus of rural
population to the urban areas and the third is to
simplify the rules and regulations making investment
procedure easy and hassle free.
Under the Government of India schemes, three
cluster development projects, Panipat for textiles,
Gurgaon for automobiles and faridabad for light
engineering are under consideration. Government is
considering to set up Central Institute of Plastic and
Engineering Technology in collaboration with the
Government of India to promote and develop plastic
industry in Haryana. State Government has approached
the Government of India, Ministry of Food Processing
for establishing National Institute for Food Technology
Management besides one mega food park in Haryana.
This will boost agro-based food processing industry in
the State. Also, in the private sector the first irradiation
food park has been set up at Bahalgarh in district
Sonipat. This food park would prove a boon for
exporters and the farmers as the agricultural products,
food items, vegetables, fruits, onions, potatoes, pulses,
basmati rice, wheat flour and other edible products
would be preserved by using irradiation technology.
In an excellent recent study Veeramani and Goldar
(2005) place various States under three distinct
categories of investment climate (IC) scenarios for the
purpose of determining total factor productivity (TFP)
estimates in the manufacturing sector in these States.
The TFP estimates have been based on both value-added
function as well as gross output function. In this
study, Haryana has been classified under the ‘good
investment climate’ category along with States like
Gujarat, Andhra Pradesh, Karnataka and Punjab. It is
satisfying to note that Haryana occupied no less than
second position for most part of the period, 1980-81 to
1999-2000, in respect of TFP performance. This
adequately brings out the extent of efficiency prevailing
in the manufacturing sector of the State.
The State of Haryana has been able to attract sizable
investment from multinational companies, large
business houses, foreign investors, non-resident
Indians and small scale entrepreneurs. Haryana is an
investor friendly State and offers a rich reservoir of
skilled, motivated and relatively low cost manpower
with a good infrastructure and harmonious industrial
relations. The State has about 1000 projects with
foreign technical financial collaboration.
Since tertiary sector holds the promise of being the
major source of employment generation, it should be
endeavour of the State policy to accord special priority to
the fullest exploration of its employment potential. The
performance of the tertiary sector has been quite
satisfactory during the Tenth Plan period. It recorded a
growth rate of 10 per cent in 2002-03, 8.9 per cent in
2003-04 and 11.8 per cent in 2004-05 which is quite close
to the targeted growth rate of 10.3 per cent fixed under
EXECUTIVE SUMMARY 25
the Plan. Given the vast growth potential of this
sector, it appears quite within the reach of the State to
push this rate to above 12 per cent by 2012 which
incidentally happens to be the nearest proximation of
the highest rate fixed under the Tenth Plan for
Karnataka, the top leading State in this respect. There
is a need to take necessary steps to boost the service
sector including information technology, biotechnology
and tourism.
Rates of literacy among the population have risen
considerably in Haryana. The 2001 census recorded
literacy rates of 67.91 per cent, as compared to 55.85 per
cent in 1991. In 2001, the male literacy rate was 79.3 per
cent which was 48.2 per cent in 1981 as against it, the
female literacy rate was 56.3 per cent which was just 22.3
per cent in 1981. The gap between male and female rates
has therefore narrowed down from 25.9 per cent in 1981
to 23.0 per cent in 2001.
The gross enrolment ratio in classes I-V was 75.25
per cent and in classes VI-VIII it was 65.51 per cent in
2003-2004. The percentage of school going girls in the
age group of 6-11 years has been 77.31 per cent in
2003-04. In the case of boys it is 73.53 per cent. The
percentage of school going girls in the age group of 11–
14 years has been 62.40 per cent in 2003-04. In case of
boys it is 68.24 per cent over the same period. In the
year 2003-04, Haryana’s gross enrolment ratio of
children in the age group of 6-14 years was only 71.51
as against India’s 84.91.
By the year 2004-05, the system of higher education
had expanded substantially to include in its ambit a total
of 202 colleges of which 60 were government colleges and
142 non-government colleges. In these colleges the over
all enrolment of boys has been 53.45 per cent and that of
girls 46.55 per cent. The faculty in these colleges
consisted of 53.87 per cent male teachers and 46.13 per
cent female teachers. These statistics adequately bring out
the fact that over time women education has been
accorded the priority it deserved.
Technical manpower is essential input for
industrialisation, modernisation, promotion of trade and
business. Technical manpower is also required for
research and development. Technically qualified persons
can also set their own business and get self-employed. By
the end of year 2001-02, there were 29 degree level
engineering institutions and 29 diploma/post-diploma
level institutions. In 2004-05, there were 124
institutions offering engineering/MBA/MCA/BHM and
CT and M.Tech Programmes with an annual intake of
18,834 students. The number of polytechnics was 38
with annual intake capacity of 8640 students. The
intake capacity in degree courses in engineering
colleges in the state was 10,631 students.
The number of scholars in recognised colleges for
general education has increased from 75,863 in 1980-81
to 1,99,761 in 2002-03. The number of girls students
in these colleges has increased from 22,319 in 1980-81
to 90,754 in 2002-03.
Highly specialised courses at post-graduate/under
graduate/diploma level need to be introduced in emerging
areas like nano science and technology, VLSI design and
embedded systems, integrated product design and
manufacturing, print and graphic communication, optical
engineering, product design, mechotronics and aircraft
maintenance engineering, etc.
The Human Development Index (HDI) for the country
as a whole has improved from 0.302 in 1981 to 0.472 in
2001. The HDI for Haryana has improved from 0.360 in
1981 to 0.509 in 2001. As per HDI, the Haryana was
ranked at 15 in 1981, 16 in 1991 and 5 in 2001.
A reduction of gender inequality in access to
resources and opportunities leads to an increase in the
rate of economic growth, which, in turn, is poverty
reducing. This is because of the fact that greater gender
equality enables women to take up income earning
opportunities, and participate in the growth process.
Gender disparities are very closely associated with
poverty levels. For example, improving women’s access
to education or land in rural areas is likely to lead a
significant increase in agricultural productivity. In
addition, lower gender disparities increase women’s
power to allocate family resources. This benefits
children’s health and education, inducing a reduction
in inter-generational poverty. Furthermore, gender
equality in access to education helps to reduce infant
mortality and fertility. Significant steps have been taken
in this direction in Haryana and its women are much
more empowered now than in the 1960s or 1970s. The
State has been implementing various schemes for the
socio-economic advancement and development of
women in the State to eliminate all types of
discrimination against women and the girl child and
ensure empowerment and gender justice for them. But
the declining sex ratio in the State is of particular
concern.
Improvement in the health status of the population
has been one of the major thrust areas in social
development programmes of the State. This was to be
achieved through improving access to health services
HARYANA DEVELOPMENT REPORT26
with special focus on under developed and under
privileged sections of the society. The infant mortality
rate (IMR) is considered to be a sensitive indicator of
not only the health status of the population but also
the level of human development in the context of
education, economic conditions, nutrition etc. Poverty,
malnutrition, a decline in breast feeding and inadequacy
or lack of sanitation are all associated with high infant
mortality. High infant mortality and high fertility are
related concepts. Haryana has registered declining
infant mortality rates over the period 1971-2001. But
there is cause for concern over the higher IMR for
female children than for male children in Haryana.
Life expectancy at birth or longevity is an overall
indicator of the economic and social well-being of the
people. As a society advances, the life expectancy of its
people also increased. Haryana is one of the top four
States, after Kerala, Punjab and Maharashtra, in this
regard.
Haryana is one of the few States in India whose
decadal growth rate of population has showed almost a
negligible change over the last three decades. It is a
matter of great concern for the State and requires an
in-depth analysis of its socio-economic genesis.
A total fertility rate (TFR) of 2.1 is considered to be
the replacement level of fertility, which needs to be
achieved in all States for population stabilisation. In
case of Haryana, the TFR was 3.3 in 1998 which is
much higher than most of the States in the country.
The sex ratio in Haryana during the past hundred
years has remained between 835 on the lowest side and
870 on the highest side. In 1901, the sex ratio in the
State was 867. It was the same in 1971 and increased
to 870 in 1981 but declined marginally to 865 in 1991
and again to 861 in 2001. In 2001, it was 867 in rural
Haryana as against the urban sex ratio of 847. The sex
ratio of child population in the age group of 0-6 in
rural Haryana was 824 as against 809 in urban areas.
The decline in the sex ratio during the last decade in
Haryana is a matter of serious concern and demands
urgent necessary action
The sharply declining sex ratio in the State is a
matter of serious concern. It is important to identify
the specific areas of the State where the problem is
particularly alarming. It needs to be tackled with
appropriate, effective and sustainable measures. This
problem cannot be approached simply in terms of
raising literacy rates and providing pecuniary incentives.
The Census 2001 data on sex ratio and literacy rates
pertaining to 67 tehsils of Haryana brings out the fact
that sex ratio and literacy rate are rather inversely
related. For instance, the sex ratio has been recorded
the highest in respect of tehsils of Punahana (910) and
Ferozepur Jhirka (902) even as these have the lowest
literacy rates, 37.58 per cent and 40.61 per cent,
respectively. As we come across areas (tehsils) of
population having increasing levels of sex ratio, these
areas tend to include low literacy areas in an increasing
proportion, and high literacy areas in a decreasing
proportion. This intriguing phenomenon needs to be
intensively probed to find out the underlying reasons.
In Haryana total dependency ratio in 2001 was 770
which was much higher (886) in 1991. In case of
young, it was 637 and for old 133 in 2001 and the
respective figures in 1991 were 741 and 145. This
means that the young as well as old dependency ratio
in the State has decreased.
The total work participation rate of Haryana in the
year 2001 was 39.62 per cent, of which 42.93 per cent
was in rural areas and 31.49 per cent in urban areas.
Agricultural workers constituted 51.29 per cent of the
total working population. Cultivators constituted 36.03
per cent of the total working population. Agricultural
labour constituted 15.27 per cent of the total working
population. The percentage of non-agricultural workers
in the total working population was 48.71. This
percentage was 35.17 in rural areas and 94.07 in urban
areas. It clearly shows that in rural areas people are
mostly dependent on agricultural activities while in
urban areas people are mostly dependent on non-
agricultural activities.
Not many people are employed in household
industries. In 2001, only 2.56 per cent of the total
working population was engaged in household
industries. In rural areas this percentage was 2.17 and
in urban areas it was 3.88.
In Haryana there are a sizeable number of other
workers who earn their livelihood by working in the
occupations other than mentioned above. Their
percentage in the year 2001 was 46.15 of the total
working population of Haryana. In rural areas, this
percentage was 33.00 and in urban areas, it was 90.19.
Marginal workers as per cent of total population of
the State stood at 10.10 per cent in 2001. This
percentage was higher in rural areas (12.86) as
compared to urban areas (3.33).
Among all States the maximum growth in the
workforce took place in the State of Haryana (2.83 per
cent) followed by the State of Punjab (2.53 per cent). The
all-India average in this regard has been 0.81 per cent.
EXECUTIVE SUMMARY 27
In 1987-88, in Haryana, the per cent shares of
primary, secondary and tertiary sectors in total
employment were 58.90, 12.70 and 28.40, respectively,
as against the corresponding all-India average figures of
58.82, 10.85 and 30.33. This position has altered in
favour of the tertiary sector over the subsequent period.
Twelve years later, in 1999-2000, the per cent shares in
employment of primary, secondary and tertiary sectors
stood at 45.15, 12.45 and 42.40, respectively, in
Haryana and at 52.43, 10.87 and 36.71, respectively, at
the all-India level. Apparently, whereas in 1987-88, the
contribution of tertiary sector in Haryana was below the
national average. This position changed fast to not only
far exceed the average all-India level but also placed
Haryana among the top ranking States by enabling it
move up from twelfth to sixth rank. This is a
particularly impressive performance when we observe
that among the three top ranking States are the smaller
States of Delhi, Tripura and Pondicherry. Among the
major States, Haryana (42.40 per cent) had only Kerala
(49.76 per cent) and Punjab (43.22 per cent) ahead of it
in this regard.
Haryana with less than 5 per cent unemployment
rate may be ranked among the low level unemployment
States particularly when we compare it with States like
Kerala (19 to 22 per cent), West Bengal (10 to 17 per
cent), Tamil Nadu (9 to 13 per cent), Assam (7 to 12
per cent) and Bihar (7 to 10 per cent).
The process of sustainable development in Haryana
should be pursued in the framework of public-private
partnership mechanism. The PPP model is the way to
achieve sustainable development in Haryana and the
new state policy initiatives are the pointer(s) in the
same direction.
The sector shift in Haryana has been constantly
moving in favour of tertiary sector vis-à-vis secondary and
primary sectors. In 2002-03, the composition of Gross
State Domestic Project (GSDP) in Haryana by industry
was 29.50 per cent in primary, 31.10 per cent in
secondary and 42.40 per cent in tertiary sector. The
projected composition of SDP in 2011-12 would be 19.97
per cent, 30.69 per cent and 49.34 per cent respectively
in primary, secondary and tertiary sectors. The most
emerging challenge for the State is to provide productive
and gainful employment to all its inhabitants. This can be
achieved by reoriented development of agriculture and
allied activities such as contract farming, organic farming,
diversification of agriculture, agro-forestry and agro-based
industries. Having varied agro-climatic conditions, and
strategic location near NCR, Haryana can be one of the
most competitive centres of agro-based industries in the
State. Floriculture, mushroom, herbal medicines, cereal
based industry, cotton based industry and forest
produce based industries, etc. may be easily developed
in the State provided imaginative policy initiatives
related with finance, energy, marketing and market-
oriented institutions are introduced.
To achieve the overall reorientation of agriculture in
Haryana, application of latest technology and adoption of
latest marketing techniques along with sound financial
management for meeting the agriculture requirements of
State and knowledge of WTO trading regime i.e. rules
related with SPS, certification and standardisation of
agriculture products are needed to be adopted by the
government.
The performance of tertiary sector in Haryana during
the 10th Plan period has been more than satisfactory. On
the basis of assumption of per capita income at constant
prices it will increase at a rate of 7 per cent in Haryana
during the period from 2006-07 to 2011-12. The share
of tertiary sector in SDP of Haryana will reach up to
29.34 per cent by the year 2012. The growth in the
tertiary sector needs to be carefully examined as there is
dearth of studies indicating a positive link between
overall growth and growth of the tertiary sector. All
that can be said is that with an increase in the share of
tertiary sector in the SDP, the productivity should also
be increased otherwise the growth in the tertiary sector
in the economy will appear as a “bubble” which can
vanish at any time.
Haryana has made tremendous economic
development. The search for more avenues of economic
development is on the agenda of the State government.
Tourism forms a part of such an agenda. But isolated
growth of tourism has prevented tourism to grow as a
significant economic activity. Intensive and extensive
work plan to utilise the cultural and commercial
character of the region for tourism is the need of the
time. The further strengthening of Highway tourism,
proper grooming and marketing of its three major
festivals, that is, Surajkund, Kartik and Geeta Jayanti
festivals, a planned, professional and comprehensive
development of Kurukshetra and Morni Hills,
development of spots exclusively for recreation and
pleasure can contribute significantly to the State’s
economy.
The IT Kiosks can be instrumental in providing a
wide range of useful services to the farmers related with
agricultural and allied activities and to rural poor and
downtrodden sections of the society. The IT Kiosk
HARYANA DEVELOPMENT REPORT28
programme for Haryana should have three broad
components i.e. (i) electronic delivery of services,
(ii) computer literacy, and (iii) broadband connectivity
upto villages by 2007. These Kiosks should deliver all
types of services such as agriculture, health, education,
etc. Strict quality standards should be established for
providing easy, timely, cost-effective and reliable service
to the IT Kiosk users.
Balanced regional development of different parts of
the State, extension of the benefits of economic
progress to the less developed regions and widespread
diffusion of industries are among the major aims of
planned development. Successive Five Year Plans seek
to realise these aims. Balanced regional development, as
far as possible, must go together with fast economic
growth if the latter has to be really meaningful. In
striving for such a balance, certain inherent difficulties
have to be met. Sometimes the sense of lagging behind
in development may be due to inadequate or tardy
development of specific fields such as agriculture,
irrigation, power, industry, employment, education, etc.
This is the case with Haryana also where there are
regions which are less developed than others. There are
regional disparities in the State as regards irrigation.
Recently the State government has declared 88 areas in
the State as industrially backward.
There are regional disparities in the industrial
development of various parts of the State. While in 2003
there were 2567 registered working factories employing
1,86,638 workers in Faridabad district, there were only 60
such factories employing 4,250 workers in Mahendragarh
district. The lowest number of industrial workers is in
Kaithal district where 124 factories employed 2,710
workers. Similarly in Kurukshetra district, 3,163
workers are employed in 164 working factories, in
Fatehabad 3,723 workers are employed in 117 factories.
On the other hand, more than one lakh people are
employed in 1,031 factories in Gurgaon district and
about 40,000 workers are employed in 1238 factories in
Yamuna Nagar district. In Panipat district, 35,813
workers are employed in 741 factories, in Sonipat
district, 29,440 workers are employed in 528 factories
and in Karnal district, 27,879 workers are employed in
449 factories.
Another indicator of regional disparities is the
percentage of urban population. In Faridabad district,
55.63 per cent population live in urban areas, followed by
Panchkula (44.47 per cent), Panipat (40.51 per cent) and
Yamuna Nagar (40 per cent) districts. On the other
hand the urban population of Mahendragarh district is
only 13.46 per cent followed by Fatehabad (17.63 per
cent), Rewari (17.82 per cent), Bhiwani (18.97 per cent)
and Kaithal (19.36 per cent) districts.
In the area of financial management, Haryana is one
of the best managed States in the country. The notable
feature of State finances is that Haryana is the first State
in the country which has not availed of overdraft even for
a single day during 2003-04 and 2004-05. The 12th
Finance Commission of India has also commended the
performance of Haryana in the areas of revenue growth,
expenditure checking and reduction of deficit
indicators. The State has been focusing on the
development of infrastructure in urban as well as rural
areas out of its own resources.
As regards the deficit position, Haryana has, on the
whole, performed much better as compared to most other
States. With its GFD/GSDP ratio equal to just 1.8 per
cent, it stands at the top among all States. Similarly, with
regard to PD/GSDP ratio, it is the only State which has a
negative value for this ratio. As regards the other deficit
ratios, the State occupies fifth position on the basis of
RD/GSDP ratio and seventh position on the RD/RR ratio
criterion. In sharp contrast to these achievements, it
stands among the bottom three States when compared on
the RD/GFD ratio basis. Its revenue deficit position is a
matter of serious concern and requires greater, concerted
action particularly on the expenditure side of the revenue
account.
As regards the State’s own tax and non-tax revenue
position, it ranks among the top six states on the
ONTR/GSDP ratio criterion, and bottom four states on
the OTR/GSDP ratio basis. On the whole, considering
both own tax and non-tax revenue together, the State
figures among the top four states which is a measure of
its relatively satisfactory performance in the direction of
achieving self-reliance in resource generation.
In respect of non-developmental expenditure, the
State may be said to be among the top five states which
are spending a relatively lesser proportion of their
GSDP for non-developmental purposes. But as regards
developmental expenditure, the State’s performance is
highly disappointing as it ranks among the two states
at the bottom. The same is true in respect of social
sector expenditure and capital outlay as well where it
has all States ahead of it.
Haryana figures among the top three states showing
excellent performance on the basis of Debt/GSDP ratio.
It is ranked among the top seven states which are
spending a relatively lesser proportion of their revenue
EXECUTIVE SUMMARY 29
receipts for interest payments as compared to other
states.
The large share of wages and salary (31.6 per cent)
in total revenue expenditure of Haryana is one of the
primary factors underlying the downward rigidity in
revenue expenditures. This expenditure needs to be
curtailed sufficiently in order to put revenue account in
good shape.
In Haryana, the expenditure on education stands at
13.7 per cent. The State stands at the sixth position in the
country in this regard. Education is one of the most
important areas towards which development expenditure
must be directed in sufficiently large amount.
The expenditure on medical and public health and
family welfare shows that all States, taken together,
spend on average 3.6 per cent of their aggregate
disbursements on medical and public health and family
welfare, but Haryana is spending only 2.8 per cent,
which is much less than the average level. It is
disappointing to note that in the area of medical and
pubic health and family welfare, the State stands at the
second place from bottom ahead of only Gujarat in this
regard.
The indices of fiscal self reliance and improvement
given by 11th Finance Commission and the 12th Finance
Commission shows that during the period 1990-1999
Haryana was placed at 11th rank. But during the period
1993-2003, Haryana attained the first rank in the
country. This shows excellent performance by the State
in achieving fiscal self-reliance and improvement.
There is an urgent need for bringing down the
revenue expenditure of the State. For instance, the
revenue deficit as a percentage of GFD and revenue
receipts (RR) stood at 43.1 and 9.4, respectively in
2003-04 (BE). In this case, a one per cent reduction in
revenue expenditure (RE) may be expected to induce a
decline of as much as five per cent points in the RD/
GFD ratio. In other words, RE as a percentage of RR if
brought down from 9.4 to 8.3 amounts to bringing
down the RD/GFD ratio from 43.1 to 38.1.
But still there is much more growth potential in
Haryana than has been achieved to date.
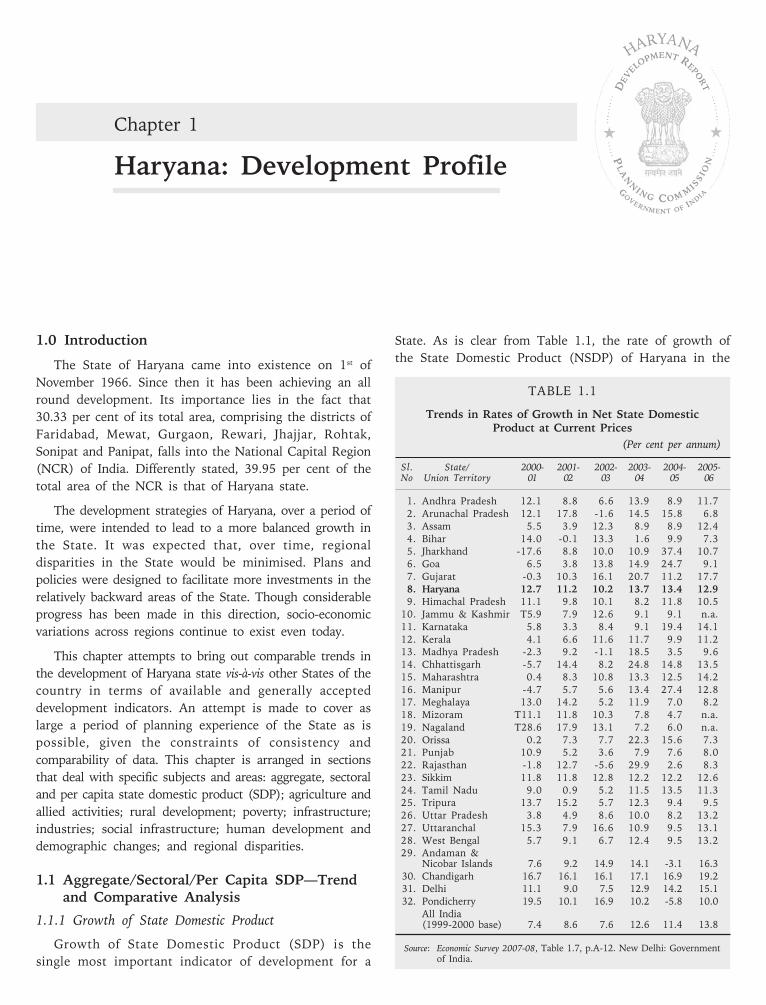
1.0 Introduction
The State of Haryana came into existence on 1st of
November 1966. Since then it has been achieving an all
round development. Its importance lies in the fact that
30.33 per cent of its total area, comprising the districts of
Faridabad, Mewat, Gurgaon, Rewari, Jhajjar, Rohtak,
Sonipat and Panipat, falls into the National Capital Region
(NCR) of India. Differently stated, 39.95 per cent of the
total area of the NCR is that of Haryana state.
The development strategies of Haryana, over a period of
time, were intended to lead to a more balanced growth in
the State. It was expected that, over time, regional
disparities in the State would be minimised. Plans and
policies were designed to facilitate more investments in the
relatively backward areas of the State. Though considerable
progress has been made in this direction, socio-economic
variations across regions continue to exist even today.
This chapter attempts to bring out comparable trends in
the development of Haryana state vis-à-vis other States of the
country in terms of available and generally accepted
development indicators. An attempt is made to cover as
large a period of planning experience of the State as is
possible, given the constraints of consistency and
comparability of data. This chapter is arranged in sections
that deal with specific subjects and areas: aggregate, sectoral
and per capita state domestic product (SDP); agriculture and
allied activities; rural development; poverty; infrastructure;
industries; social infrastructure; human development and
demographic changes; and regional disparities.
1.1 Aggregate/Sectoral/Per Capita SDP—Trendand Comparative Analysis
1.1.1 Growth of State Domestic Product
Growth of State Domestic Product (SDP) is the
single most important indicator of development for a
State. As is clear from Table 1.1, the rate of growth of
the State Domestic Product (NSDP) of Haryana in the
Chapter 1
Haryana: Development Profile
HAR
YANA
TABLE 1.1
Trends in Rates of Growth in Net State DomesticProduct at Current Prices
(Per cent per annum)
Sl. State/ 2000- 2001- 2002- 2003- 2004- 2005-No Union Territory 01 02 03 04 05 06
1. Andhra Pradesh 12.1 8.8 6.6 13.9 8.9 11.72. Arunachal Pradesh 12.1 17.8 -1.6 14.5 15.8 6.83. Assam 5.5 3.9 12.3 8.9 8.9 12.44. Bihar 14.0 -0.1 13.3 1.6 9.9 7.35. Jharkhand -17.6 8.8 10.0 10.9 37.4 10.76. Goa 6.5 3.8 13.8 14.9 24.7 9.17. Gujarat -0.3 10.3 16.1 20.7 11.2 17.78. Haryana 12.7 11.2 10.2 13.7 13.4 12.99. Himachal Pradesh 11.1 9.8 10.1 8.2 11.8 10.5
10. Jammu & Kashmir T5.9 7.9 12.6 9.1 9.1 n.a.11. Karnataka 5.8 3.3 8.4 9.1 19.4 14.112. Kerala 4.1 6.6 11.6 11.7 9.9 11.213. Madhya Pradesh -2.3 9.2 -1.1 18.5 3.5 9.614. Chhattisgarh -5.7 14.4 8.2 24.8 14.8 13.515. Maharashtra 0.4 8.3 10.8 13.3 12.5 14.216. Manipur -4.7 5.7 5.6 13.4 27.4 12.817. Meghalaya 13.0 14.2 5.2 11.9 7.0 8.218. Mizoram T11.1 11.8 10.3 7.8 4.7 n.a.19. Nagaland T28.6 17.9 13.1 7.2 6.0 n.a.20. Orissa 0.2 7.3 7.7 22.3 15.6 7.321. Punjab 10.9 5.2 3.6 7.9 7.6 8.022. Rajasthan -1.8 12.7 -5.6 29.9 2.6 8.323. Sikkim 11.8 11.8 12.8 12.2 12.2 12.624. Tamil Nadu 9.0 0.9 5.2 11.5 13.5 11.325. Tripura 13.7 15.2 5.7 12.3 9.4 9.526. Uttar Pradesh 3.8 4.9 8.6 10.0 8.2 13.227. Uttaranchal 15.3 7.9 16.6 10.9 9.5 13.128. West Bengal 5.7 9.1 6.7 12.4 9.5 13.229. Andaman &
Nicobar Islands 7.6 9.2 14.9 14.1 -3.1 16.330. Chandigarh 16.7 16.1 16.1 17.1 16.9 19.231. Delhi 11.1 9.0 7.5 12.9 14.2 15.132. Pondicherry 19.5 10.1 16.9 10.2 -5.8 10.0
All India(1999-2000 base) 7.4 8.6 7.6 12.6 11.4 13.8
Source: Economic Survey 2007-08, Table 1.7, p.A-12. New Delhi: Governmentof India.
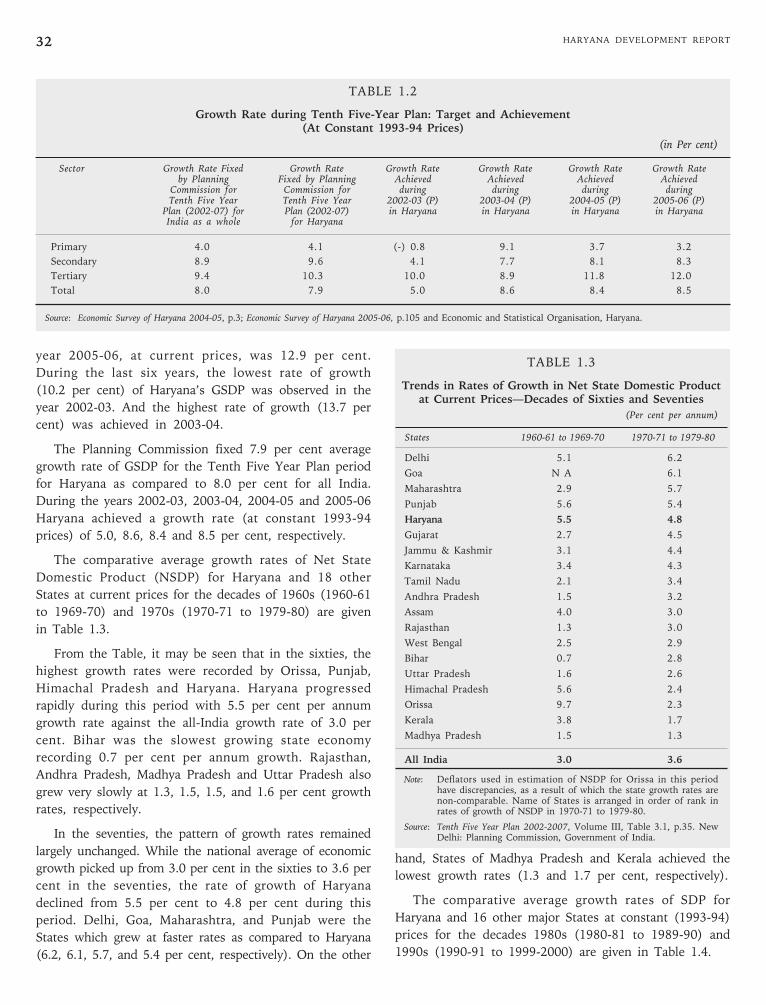
HARYANA DEVELOPMENT REPORT32
TABLE 1.3
Trends in Rates of Growth in Net State Domestic Productat Current Prices—Decades of Sixties and Seventies
(Per cent per annum)
States 1960-61 to 1969-70 1970-71 to 1979-80
Delhi 5.1 6.2
Goa N A 6.1
Maharashtra 2.9 5.7
Punjab 5.6 5.4
Haryana 5.5 4.8
Gujarat 2.7 4.5
Jammu & Kashmir 3.1 4.4
Karnataka 3.4 4.3
Tamil Nadu 2.1 3.4
Andhra Pradesh 1.5 3.2
Assam 4.0 3.0
Rajasthan 1.3 3.0
West Bengal 2.5 2.9
Bihar 0.7 2.8
Uttar Pradesh 1.6 2.6
Himachal Pradesh 5.6 2.4
Orissa 9.7 2.3
Kerala 3.8 1.7
Madhya Pradesh 1.5 1.3
All India 3.0 3.6
Note: Deflators used in estimation of NSDP for Orissa in this periodhave discrepancies, as a result of which the state growth rates arenon-comparable. Name of States is arranged in order of rank inrates of growth of NSDP in 1970-71 to 1979-80.
Source: Tenth Five Year Plan 2002-2007, Volume III, Table 3.1, p.35. NewDelhi: Planning Commission, Government of India.
TABLE 1.2
Growth Rate during Tenth Five-Year Plan: Target and Achievement(At Constant 1993-94 Prices)
(in Per cent)
Sector Growth Rate Fixed Growth Rate Growth Rate Growth Rate Growth Rate Growth Rateby Planning Fixed by Planning Achieved Achieved Achieved Achieved
Commission for Commission for during during during duringTenth Five Year Tenth Five Year 2002-03 (P) 2003-04 (P) 2004-05 (P) 2005-06 (P)
Plan (2002-07) for Plan (2002-07) in Haryana in Haryana in Haryana in HaryanaIndia as a whole for Haryana
Primary 4.0 4.1 (-) 0.8 9.1 3.7 3.2
Secondary 8.9 9.6 4.1 7.7 8.1 8.3
Tertiary 9.4 10.3 10.0 8.9 11.8 12.0
Total 8.0 7.9 5.0 8.6 8.4 8.5
Source: Economic Survey of Haryana 2004-05, p.3; Economic Survey of Haryana 2005-06, p.105 and Economic and Statistical Organisation, Haryana.
year 2005-06, at current prices, was 12.9 per cent.
During the last six years, the lowest rate of growth
(10.2 per cent) of Haryana’s GSDP was observed in the
year 2002-03. And the highest rate of growth (13.7 per
cent) was achieved in 2003-04.
The Planning Commission fixed 7.9 per cent average
growth rate of GSDP for the Tenth Five Year Plan period
for Haryana as compared to 8.0 per cent for all India.
During the years 2002-03, 2003-04, 2004-05 and 2005-06
Haryana achieved a growth rate (at constant 1993-94
prices) of 5.0, 8.6, 8.4 and 8.5 per cent, respectively.
The comparative average growth rates of Net State
Domestic Product (NSDP) for Haryana and 18 other
States at current prices for the decades of 1960s (1960-61
to 1969-70) and 1970s (1970-71 to 1979-80) are given
in Table 1.3.
From the Table, it may be seen that in the sixties, the
highest growth rates were recorded by Orissa, Punjab,
Himachal Pradesh and Haryana. Haryana progressed
rapidly during this period with 5.5 per cent per annum
growth rate against the all-India growth rate of 3.0 per
cent. Bihar was the slowest growing state economy
recording 0.7 per cent per annum growth. Rajasthan,
Andhra Pradesh, Madhya Pradesh and Uttar Pradesh also
grew very slowly at 1.3, 1.5, 1.5, and 1.6 per cent growth
rates, respectively.
In the seventies, the pattern of growth rates remained
largely unchanged. While the national average of economic
growth picked up from 3.0 per cent in the sixties to 3.6 per
cent in the seventies, the rate of growth of Haryana
declined from 5.5 per cent to 4.8 per cent during this
period. Delhi, Goa, Maharashtra, and Punjab were the
States which grew at faster rates as compared to Haryana
(6.2, 6.1, 5.7, and 5.4 per cent, respectively). On the other
hand, States of Madhya Pradesh and Kerala achieved the
lowest growth rates (1.3 and 1.7 per cent, respectively).
The comparative average growth rates of SDP for
Haryana and 16 other major States at constant (1993-94)
prices for the decades 1980s (1980-81 to 1989-90) and
1990s (1990-91 to 1999-2000) are given in Table 1.4.
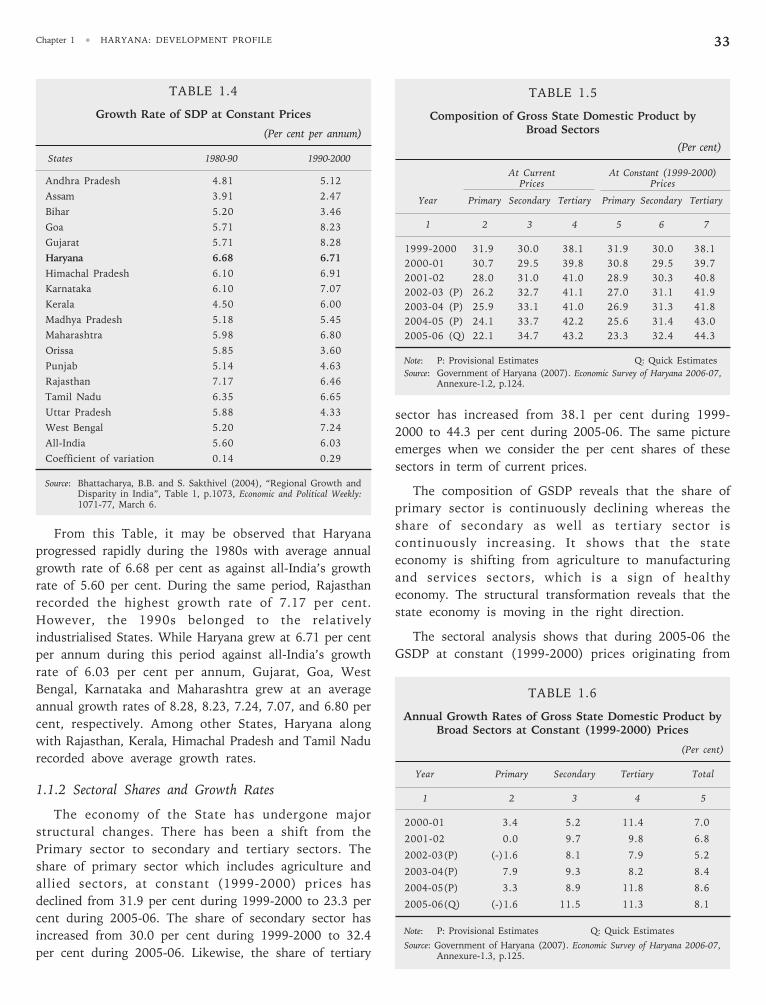
Chapter 1 • HARYANA: DEVELOPMENT PROFILE 33
TABLE 1.4
Growth Rate of SDP at Constant Prices
(Per cent per annum)
States 1980-90 1990-2000
Andhra Pradesh 4.81 5.12
Assam 3.91 2.47
Bihar 5.20 3.46
Goa 5.71 8.23
Gujarat 5.71 8.28
Haryana 6.68 6.71
Himachal Pradesh 6.10 6.91
Karnataka 6.10 7.07
Kerala 4.50 6.00
Madhya Pradesh 5.18 5.45
Maharashtra 5.98 6.80
Orissa 5.85 3.60
Punjab 5.14 4.63
Rajasthan 7.17 6.46
Tamil Nadu 6.35 6.65
Uttar Pradesh 5.88 4.33
West Bengal 5.20 7.24
All-India 5.60 6.03
Coefficient of variation 0.14 0.29
Source: Bhattacharya, B.B. and S. Sakthivel (2004), “Regional Growth andDisparity in India”, Table 1, p.1073, Economic and Political Weekly:1071-77, March 6.
From this Table, it may be observed that Haryana
progressed rapidly during the 1980s with average annual
growth rate of 6.68 per cent as against all-India’s growth
rate of 5.60 per cent. During the same period, Rajasthan
recorded the highest growth rate of 7.17 per cent.
However, the 1990s belonged to the relatively
industrialised States. While Haryana grew at 6.71 per cent
per annum during this period against all-India’s growth
rate of 6.03 per cent per annum, Gujarat, Goa, West
Bengal, Karnataka and Maharashtra grew at an average
annual growth rates of 8.28, 8.23, 7.24, 7.07, and 6.80 per
cent, respectively. Among other States, Haryana along
with Rajasthan, Kerala, Himachal Pradesh and Tamil Nadu
recorded above average growth rates.
1.1.2 Sectoral Shares and Growth Rates
The economy of the State has undergone major
structural changes. There has been a shift from the
Primary sector to secondary and tertiary sectors. The
share of primary sector which includes agriculture and
allied sectors, at constant (1999-2000) prices has
declined from 31.9 per cent during 1999-2000 to 23.3 per
cent during 2005-06. The share of secondary sector has
increased from 30.0 per cent during 1999-2000 to 32.4
per cent during 2005-06. Likewise, the share of tertiary
TABLE 1.5
Composition of Gross State Domestic Product byBroad Sectors
(Per cent)
At Current At Constant (1999-2000)Prices Prices
Year Primary Secondary Tertiary Primary Secondary Tertiary
1 2 3 4 5 6 7
1999-2000 31.9 30.0 38.1 31.9 30.0 38.1
2000-01 30.7 29.5 39.8 30.8 29.5 39.7
2001-02 28.0 31.0 41.0 28.9 30.3 40.8
2002-03 (P) 26.2 32.7 41.1 27.0 31.1 41.9
2003-04 (P) 25.9 33.1 41.0 26.9 31.3 41.8
2004-05 (P) 24.1 33.7 42.2 25.6 31.4 43.0
2005-06 (Q) 22.1 34.7 43.2 23.3 32.4 44.3
Note: P: Provisional Estimates Q: Quick Estimates
Source: Government of Haryana (2007). Economic Survey of Haryana 2006-07,Annexure-1.2, p.124.
sector has increased from 38.1 per cent during 1999-
2000 to 44.3 per cent during 2005-06. The same picture
emerges when we consider the per cent shares of these
sectors in term of current prices.
The composition of GSDP reveals that the share of
primary sector is continuously declining whereas the
share of secondary as well as tertiary sector is
continuously increasing. It shows that the state
economy is shifting from agriculture to manufacturing
and services sectors, which is a sign of healthy
economy. The structural transformation reveals that the
state economy is moving in the right direction.
The sectoral analysis shows that during 2005-06 the
GSDP at constant (1999-2000) prices originating from
TABLE 1.6
Annual Growth Rates of Gross State Domestic Product byBroad Sectors at Constant (1999-2000) Prices
(Per cent)
Year Primary Secondary Tertiary Total
1 2 3 4 5
2000-01 3.4 5.2 11.4 7.0
2001-02 0.0 9.7 9.8 6.8
2002-03(P) (-)1.6 8.1 7.9 5.2
2003-04(P) 7.9 9.3 8.2 8.4
2004-05(P) 3.3 8.9 11.8 8.6
2005-06(Q) (-)1.6 11.5 11.3 8.1
Note: P: Provisional Estimates Q: Quick Estimates
Source: Government of Haryana (2007). Economic Survey of Haryana 2006-07,Annexure-1.3, p.125.
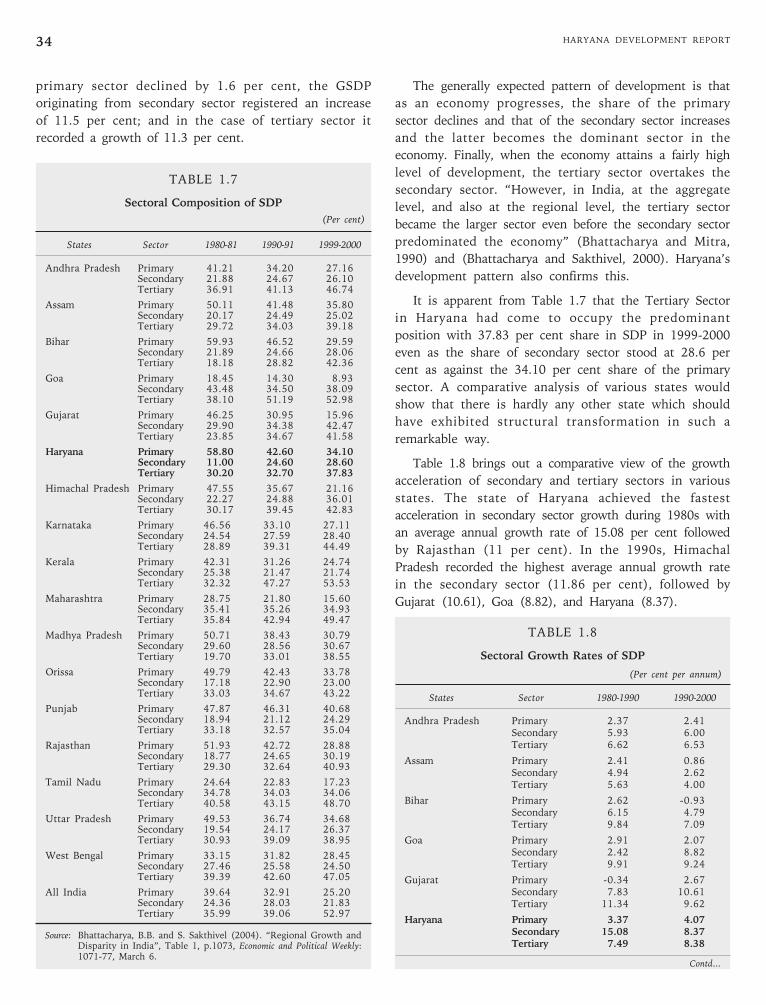
HARYANA DEVELOPMENT REPORT34
The generally expected pattern of development is that
as an economy progresses, the share of the primary
sector declines and that of the secondary sector increases
and the latter becomes the dominant sector in the
economy. Finally, when the economy attains a fairly high
level of development, the tertiary sector overtakes the
secondary sector. “However, in India, at the aggregate
level, and also at the regional level, the tertiary sector
became the larger sector even before the secondary sector
predominated the economy” (Bhattacharya and Mitra,
1990) and (Bhattacharya and Sakthivel, 2000). Haryana’s
development pattern also confirms this.
It is apparent from Table 1.7 that the Tertiary Sector
in Haryana had come to occupy the predominant
position with 37.83 per cent share in SDP in 1999-2000
even as the share of secondary sector stood at 28.6 per
cent as against the 34.10 per cent share of the primary
sector. A comparative analysis of various states would
show that there is hardly any other state which should
have exhibited structural transformation in such a
remarkable way.
Table 1.8 brings out a comparative view of the growth
acceleration of secondary and tertiary sectors in various
states. The state of Haryana achieved the fastest
acceleration in secondary sector growth during 1980s with
an average annual growth rate of 15.08 per cent followed
by Rajasthan (11 per cent). In the 1990s, Himachal
Pradesh recorded the highest average annual growth rate
in the secondary sector (11.86 per cent), followed by
Gujarat (10.61), Goa (8.82), and Haryana (8.37).
TABLE 1.8
Sectoral Growth Rates of SDP
(Per cent per annum)
States Sector 1980-1990 1990-2000
Andhra Pradesh Primary 2.37 2.41Secondary 5.93 6.00Tertiary 6.62 6.53
Assam Primary 2.41 0.86Secondary 4.94 2.62Tertiary 5.63 4.00
Bihar Primary 2.62 -0.93Secondary 6.15 4.79Tertiary 9.84 7.09
Goa Primary 2.91 2.07Secondary 2.42 8.82Tertiary 9.91 9.24
Gujarat Primary -0.34 2.67Secondary 7.83 10.61Tertiary 11.34 9.62
Haryana Primary 3.37 4.07Secondary 15.08 8.37Tertiary 7.49 8.38
Contd...
primary sector declined by 1.6 per cent, the GSDP
originating from secondary sector registered an increase
of 11.5 per cent; and in the case of tertiary sector it
recorded a growth of 11.3 per cent.
TABLE 1.7
Sectoral Composition of SDP
(Per cent)
States Sector 1980-81 1990-91 1999-2000
Andhra Pradesh Primary 41.21 34.20 27.16Secondary 21.88 24.67 26.10Tertiary 36.91 41.13 46.74
Assam Primary 50.11 41.48 35.80Secondary 20.17 24.49 25.02Tertiary 29.72 34.03 39.18
Bihar Primary 59.93 46.52 29.59Secondary 21.89 24.66 28.06Tertiary 18.18 28.82 42.36
Goa Primary 18.45 14.30 8.93Secondary 43.48 34.50 38.09Tertiary 38.10 51.19 52.98
Gujarat Primary 46.25 30.95 15.96Secondary 29.90 34.38 42.47Tertiary 23.85 34.67 41.58
Haryana Primary 58.80 42.60 34.10Secondary 11.00 24.60 28.60Tertiary 30.20 32.70 37.83
Himachal Pradesh Primary 47.55 35.67 21.16Secondary 22.27 24.88 36.01Tertiary 30.17 39.45 42.83
Karnataka Primary 46.56 33.10 27.11Secondary 24.54 27.59 28.40Tertiary 28.89 39.31 44.49
Kerala Primary 42.31 31.26 24.74Secondary 25.38 21.47 21.74Tertiary 32.32 47.27 53.53
Maharashtra Primary 28.75 21.80 15.60Secondary 35.41 35.26 34.93Tertiary 35.84 42.94 49.47
Madhya Pradesh Primary 50.71 38.43 30.79Secondary 29.60 28.56 30.67Tertiary 19.70 33.01 38.55
Orissa Primary 49.79 42.43 33.78Secondary 17.18 22.90 23.00Tertiary 33.03 34.67 43.22
Punjab Primary 47.87 46.31 40.68Secondary 18.94 21.12 24.29Tertiary 33.18 32.57 35.04
Rajasthan Primary 51.93 42.72 28.88Secondary 18.77 24.65 30.19Tertiary 29.30 32.64 40.93
Tamil Nadu Primary 24.64 22.83 17.23Secondary 34.78 34.03 34.06Tertiary 40.58 43.15 48.70
Uttar Pradesh Primary 49.53 36.74 34.68Secondary 19.54 24.17 26.37Tertiary 30.93 39.09 38.95
West Bengal Primary 33.15 31.82 28.45Secondary 27.46 25.58 24.50Tertiary 39.39 42.60 47.05
All India Primary 39.64 32.91 25.20Secondary 24.36 28.03 21.83Tertiary 35.99 39.06 52.97
Source: Bhattacharya, B.B. and S. Sakthivel (2004). “Regional Growth andDisparity in India”, Table 1, p.1073, Economic and Political Weekly:1071-77, March 6.
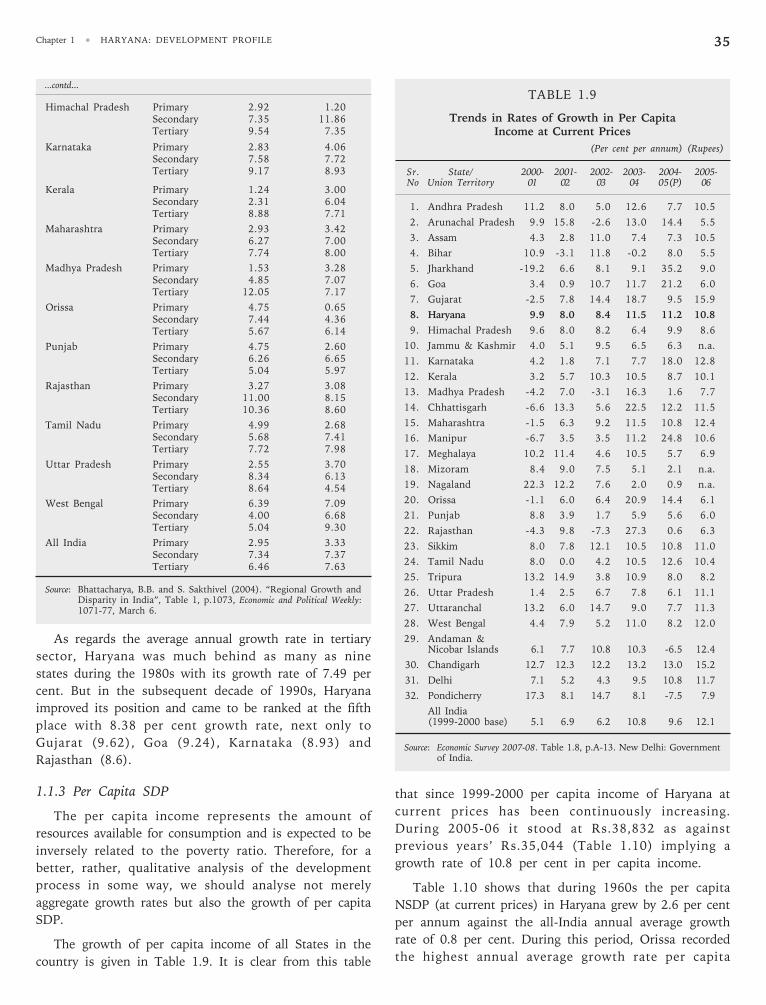
Chapter 1 • HARYANA: DEVELOPMENT PROFILE 35
...contd...
Himachal Pradesh Primary 2.92 1.20Secondary 7.35 11.86Tertiary 9.54 7.35
Karnataka Primary 2.83 4.06Secondary 7.58 7.72Tertiary 9.17 8.93
Kerala Primary 1.24 3.00Secondary 2.31 6.04Tertiary 8.88 7.71
Maharashtra Primary 2.93 3.42Secondary 6.27 7.00Tertiary 7.74 8.00
Madhya Pradesh Primary 1.53 3.28Secondary 4.85 7.07Tertiary 12.05 7.17
Orissa Primary 4.75 0.65Secondary 7.44 4.36Tertiary 5.67 6.14
Punjab Primary 4.75 2.60Secondary 6.26 6.65Tertiary 5.04 5.97
Rajasthan Primary 3.27 3.08Secondary 11.00 8.15Tertiary 10.36 8.60
Tamil Nadu Primary 4.99 2.68Secondary 5.68 7.41Tertiary 7.72 7.98
Uttar Pradesh Primary 2.55 3.70Secondary 8.34 6.13Tertiary 8.64 4.54
West Bengal Primary 6.39 7.09Secondary 4.00 6.68Tertiary 5.04 9.30
All India Primary 2.95 3.33Secondary 7.34 7.37Tertiary 6.46 7.63
Source: Bhattacharya, B.B. and S. Sakthivel (2004). “Regional Growth andDisparity in India”, Table 1, p.1073, Economic and Political Weekly:1071-77, March 6.
As regards the average annual growth rate in tertiary
sector, Haryana was much behind as many as nine
states during the 1980s with its growth rate of 7.49 per
cent. But in the subsequent decade of 1990s, Haryana
improved its position and came to be ranked at the fifth
place with 8.38 per cent growth rate, next only to
Gujarat (9.62), Goa (9.24), Karnataka (8.93) and
Rajasthan (8.6).
1.1.3 Per Capita SDP
The per capita income represents the amount of
resources available for consumption and is expected to be
inversely related to the poverty ratio. Therefore, for a
better, rather, qualitative analysis of the development
process in some way, we should analyse not merely
aggregate growth rates but also the growth of per capita
SDP.
The growth of per capita income of all States in the
country is given in Table 1.9. It is clear from this table
TABLE 1.9
Trends in Rates of Growth in Per CapitaIncome at Current Prices
(Per cent per annum) (Rupees)
Sr. State/ 2000- 2001- 2002- 2003- 2004- 2005-No Union Territory 01 02 03 04 05(P) 06
1. Andhra Pradesh 11.2 8.0 5.0 12.6 7.7 10.5
2. Arunachal Pradesh 9.9 15.8 -2.6 13.0 14.4 5.5
3. Assam 4.3 2.8 11.0 7.4 7.3 10.5
4. Bihar 10.9 -3.1 11.8 -0.2 8.0 5.5
5. Jharkhand -19.2 6.6 8.1 9.1 35.2 9.0
6. Goa 3.4 0.9 10.7 11.7 21.2 6.0
7. Gujarat -2.5 7.8 14.4 18.7 9.5 15.9
8. Haryana 9.9 8.0 8.4 11.5 11.2 10.8
9. Himachal Pradesh 9.6 8.0 8.2 6.4 9.9 8.6
10. Jammu & Kashmir 4.0 5.1 9.5 6.5 6.3 n.a.
11. Karnataka 4.2 1.8 7.1 7.7 18.0 12.8
12. Kerala 3.2 5.7 10.3 10.5 8.7 10.1
13. Madhya Pradesh -4.2 7.0 -3.1 16.3 1.6 7.7
14. Chhattisgarh -6.6 13.3 5.6 22.5 12.2 11.5
15. Maharashtra -1.5 6.3 9.2 11.5 10.8 12.4
16. Manipur -6.7 3.5 3.5 11.2 24.8 10.6
17. Meghalaya 10.2 11.4 4.6 10.5 5.7 6.9
18. Mizoram 8.4 9.0 7.5 5.1 2.1 n.a.
19. Nagaland 22.3 12.2 7.6 2.0 0.9 n.a.
20. Orissa -1.1 6.0 6.4 20.9 14.4 6.1
21. Punjab 8.8 3.9 1.7 5.9 5.6 6.0
22. Rajasthan -4.3 9.8 -7.3 27.3 0.6 6.3
23. Sikkim 8.0 7.8 12.1 10.5 10.8 11.0
24. Tamil Nadu 8.0 0.0 4.2 10.5 12.6 10.4
25. Tripura 13.2 14.9 3.8 10.9 8.0 8.2
26. Uttar Pradesh 1.4 2.5 6.7 7.8 6.1 11.1
27. Uttaranchal 13.2 6.0 14.7 9.0 7.7 11.3
28. West Bengal 4.4 7.9 5.2 11.0 8.2 12.0
29. Andaman &Nicobar Islands 6.1 7.7 10.8 10.3 -6.5 12.4
30. Chandigarh 12.7 12.3 12.2 13.2 13.0 15.2
31. Delhi 7.1 5.2 4.3 9.5 10.8 11.7
32. Pondicherry 17.3 8.1 14.7 8.1 -7.5 7.9
All India(1999-2000 base) 5.1 6.9 6.2 10.8 9.6 12.1
Source: Economic Survey 2007-08. Table 1.8, p.A-13. New Delhi: Governmentof India.
that since 1999-2000 per capita income of Haryana at
current prices has been continuously increasing.
During 2005-06 it stood at Rs.38,832 as against
previous years’ Rs.35,044 (Table 1.10) implying a
growth rate of 10.8 per cent in per capita income.
Table 1.10 shows that during 1960s the per capita
NSDP (at current prices) in Haryana grew by 2.6 per cent
per annum against the all-India annual average growth
rate of 0.8 per cent. During this period, Orissa recorded
the highest annual average growth rate per capita
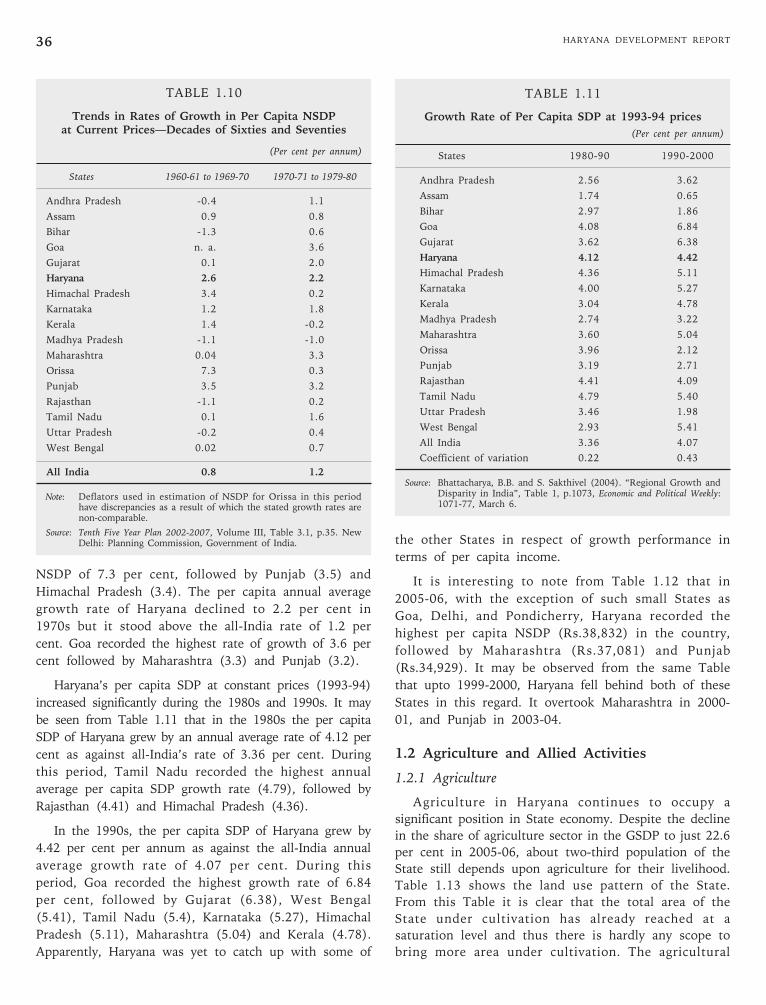
HARYANA DEVELOPMENT REPORT36
TABLE 1.10
Trends in Rates of Growth in Per Capita NSDPat Current Prices—Decades of Sixties and Seventies
(Per cent per annum)
States 1960-61 to 1969-70 1970-71 to 1979-80
Andhra Pradesh -0.4 1.1
Assam 0.9 0.8
Bihar -1.3 0.6
Goa n. a. 3.6
Gujarat 0.1 2.0
Haryana 2.6 2.2
Himachal Pradesh 3.4 0.2
Karnataka 1.2 1.8
Kerala 1.4 -0.2
Madhya Pradesh -1.1 -1.0
Maharashtra 0.04 3.3
Orissa 7.3 0.3
Punjab 3.5 3.2
Rajasthan -1.1 0.2
Tamil Nadu 0.1 1.6
Uttar Pradesh -0.2 0.4
West Bengal 0.02 0.7
All India 0.8 1.2
Note: Deflators used in estimation of NSDP for Orissa in this periodhave discrepancies as a result of which the stated growth rates arenon-comparable.
Source: Tenth Five Year Plan 2002-2007, Volume III, Table 3.1, p.35. NewDelhi: Planning Commission, Government of India.
NSDP of 7.3 per cent, followed by Punjab (3.5) and
Himachal Pradesh (3.4). The per capita annual average
growth rate of Haryana declined to 2.2 per cent in
1970s but it stood above the all-India rate of 1.2 per
cent. Goa recorded the highest rate of growth of 3.6 per
cent followed by Maharashtra (3.3) and Punjab (3.2).
Haryana’s per capita SDP at constant prices (1993-94)
increased significantly during the 1980s and 1990s. It may
be seen from Table 1.11 that in the 1980s the per capita
SDP of Haryana grew by an annual average rate of 4.12 per
cent as against all-India’s rate of 3.36 per cent. During
this period, Tamil Nadu recorded the highest annual
average per capita SDP growth rate (4.79), followed by
Rajasthan (4.41) and Himachal Pradesh (4.36).
In the 1990s, the per capita SDP of Haryana grew by
4.42 per cent per annum as against the all-India annual
average growth rate of 4.07 per cent. During this
period, Goa recorded the highest growth rate of 6.84
per cent, followed by Gujarat (6.38), West Bengal
(5.41), Tamil Nadu (5.4), Karnataka (5.27), Himachal
Pradesh (5.11), Maharashtra (5.04) and Kerala (4.78).
Apparently, Haryana was yet to catch up with some of
TABLE 1.11
Growth Rate of Per Capita SDP at 1993-94 prices
(Per cent per annum)
States 1980-90 1990-2000
Andhra Pradesh 2.56 3.62
Assam 1.74 0.65
Bihar 2.97 1.86
Goa 4.08 6.84
Gujarat 3.62 6.38
Haryana 4.12 4.42
Himachal Pradesh 4.36 5.11
Karnataka 4.00 5.27
Kerala 3.04 4.78
Madhya Pradesh 2.74 3.22
Maharashtra 3.60 5.04
Orissa 3.96 2.12
Punjab 3.19 2.71
Rajasthan 4.41 4.09
Tamil Nadu 4.79 5.40
Uttar Pradesh 3.46 1.98
West Bengal 2.93 5.41
All India 3.36 4.07
Coefficient of variation 0.22 0.43
Source: Bhattacharya, B.B. and S. Sakthivel (2004). “Regional Growth andDisparity in India”, Table 1, p.1073, Economic and Political Weekly:1071-77, March 6.
the other States in respect of growth performance in
terms of per capita income.
It is interesting to note from Table 1.12 that in
2005-06, with the exception of such small States as
Goa, Delhi, and Pondicherry, Haryana recorded the
highest per capita NSDP (Rs.38,832) in the country,
followed by Maharashtra (Rs.37,081) and Punjab
(Rs.34,929). It may be observed from the same Table
that upto 1999-2000, Haryana fell behind both of these
States in this regard. It overtook Maharashtra in 2000-
01, and Punjab in 2003-04.
1.2 Agriculture and Allied Activities
1.2.1 Agriculture
Agriculture in Haryana continues to occupy a
significant position in State economy. Despite the decline
in the share of agriculture sector in the GSDP to just 22.6
per cent in 2005-06, about two-third population of the
State still depends upon agriculture for their livelihood.
Table 1.13 shows the land use pattern of the State.
From this Table it is clear that the total area of the
State under cultivation has already reached at a
saturation level and thus there is hardly any scope to
bring more area under cultivation. The agricultural
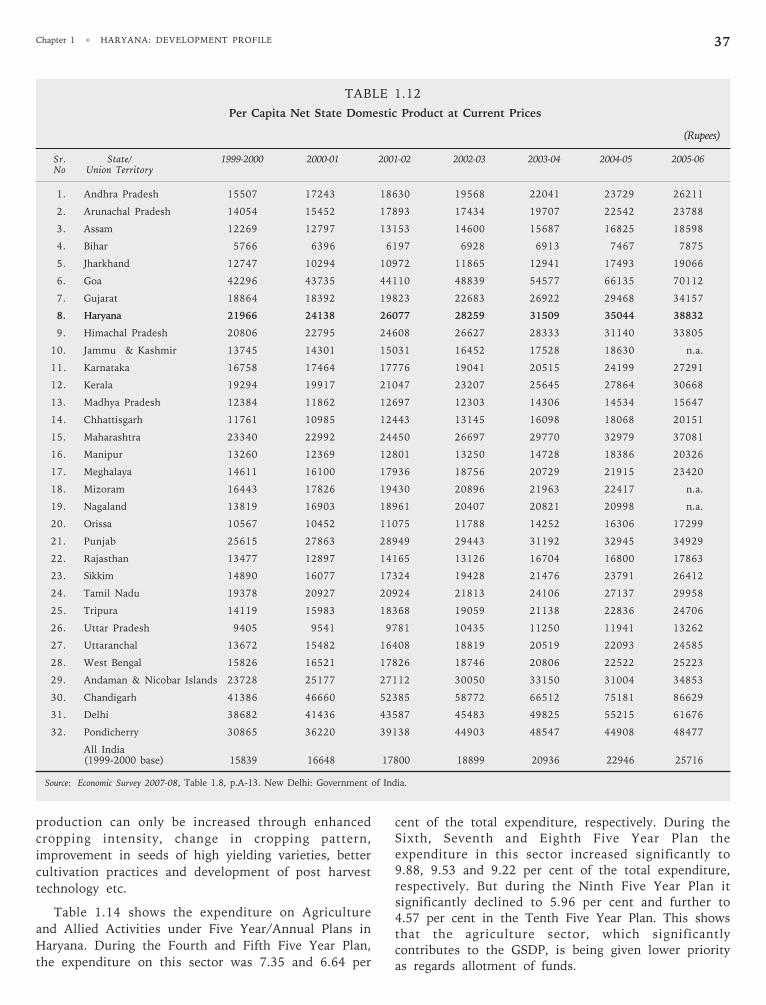
Chapter 1 • HARYANA: DEVELOPMENT PROFILE 37
TABLE 1.12
Per Capita Net State Domestic Product at Current Prices
(Rupees)
Sr. State/ 1999-2000 2000-01 2001-02 2002-03 2003-04 2004-05 2005-06No Union Territory
1. Andhra Pradesh 15507 17243 18630 19568 22041 23729 26211
2. Arunachal Pradesh 14054 15452 17893 17434 19707 22542 23788
3. Assam 12269 12797 13153 14600 15687 16825 18598
4. Bihar 5766 6396 6197 6928 6913 7467 7875
5. Jharkhand 12747 10294 10972 11865 12941 17493 19066
6. Goa 42296 43735 44110 48839 54577 66135 70112
7. Gujarat 18864 18392 19823 22683 26922 29468 34157
8. Haryana 21966 24138 26077 28259 31509 35044 38832
9. Himachal Pradesh 20806 22795 24608 26627 28333 31140 33805
10. Jammu & Kashmir 13745 14301 15031 16452 17528 18630 n.a.
11. Karnataka 16758 17464 17776 19041 20515 24199 27291
12. Kerala 19294 19917 21047 23207 25645 27864 30668
13. Madhya Pradesh 12384 11862 12697 12303 14306 14534 15647
14. Chhattisgarh 11761 10985 12443 13145 16098 18068 20151
15. Maharashtra 23340 22992 24450 26697 29770 32979 37081
16. Manipur 13260 12369 12801 13250 14728 18386 20326
17. Meghalaya 14611 16100 17936 18756 20729 21915 23420
18. Mizoram 16443 17826 19430 20896 21963 22417 n.a.
19. Nagaland 13819 16903 18961 20407 20821 20998 n.a.
20. Orissa 10567 10452 11075 11788 14252 16306 17299
21. Punjab 25615 27863 28949 29443 31192 32945 34929
22. Rajasthan 13477 12897 14165 13126 16704 16800 17863
23. Sikkim 14890 16077 17324 19428 21476 23791 26412
24. Tamil Nadu 19378 20927 20924 21813 24106 27137 29958
25. Tripura 14119 15983 18368 19059 21138 22836 24706
26. Uttar Pradesh 9405 9541 9781 10435 11250 11941 13262
27. Uttaranchal 13672 15482 16408 18819 20519 22093 24585
28. West Bengal 15826 16521 17826 18746 20806 22522 25223
29. Andaman & Nicobar Islands 23728 25177 27112 30050 33150 31004 34853
30. Chandigarh 41386 46660 52385 58772 66512 75181 86629
31. Delhi 38682 41436 43587 45483 49825 55215 61676
32. Pondicherry 30865 36220 39138 44903 48547 44908 48477
All India(1999-2000 base) 15839 16648 17800 18899 20936 22946 25716
Source: Economic Survey 2007-08, Table 1.8, p.A-13. New Delhi: Government of India.
production can only be increased through enhanced
cropping intensity, change in cropping pattern,
improvement in seeds of high yielding varieties, better
cultivation practices and development of post harvest
technology etc.
Table 1.14 shows the expenditure on Agriculture
and Allied Activities under Five Year/Annual Plans in
Haryana. During the Fourth and Fifth Five Year Plan,
the expenditure on this sector was 7.35 and 6.64 per
cent of the total expenditure, respectively. During theSixth, Seventh and Eighth Five Year Plan theexpenditure in this sector increased significantly to9.88, 9.53 and 9.22 per cent of the total expenditure,respectively. But during the Ninth Five Year Plan itsignificantly declined to 5.96 per cent and further to4.57 per cent in the Tenth Five Year Plan. This showsthat the agriculture sector, which significantlycontributes to the GSDP, is being given lower priorityas regards allotment of funds.
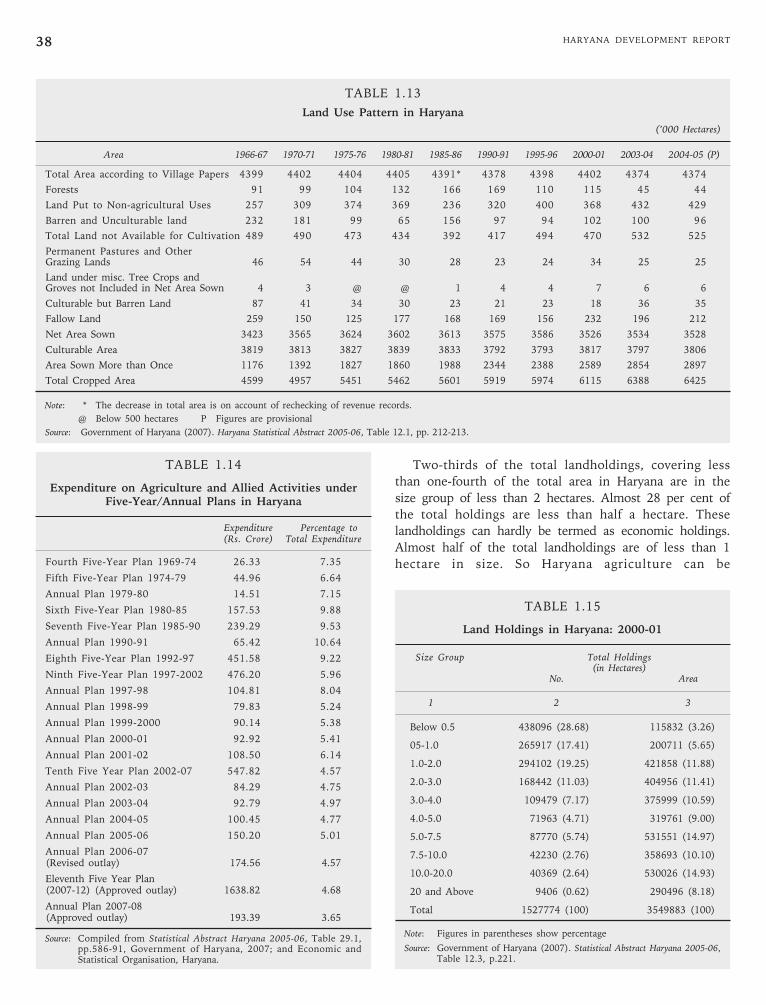
HARYANA DEVELOPMENT REPORT38
TABLE 1.13
Land Use Pattern in Haryana
(’000 Hectares)
Area 1966-67 1970-71 1975-76 1980-81 1985-86 1990-91 1995-96 2000-01 2003-04 2004-05 (P)
Total Area according to Village Papers 4399 4402 4404 4405 4391* 4378 4398 4402 4374 4374
Forests 91 99 104 132 166 169 110 115 45 44
Land Put to Non-agricultural Uses 257 309 374 369 236 320 400 368 432 429
Barren and Unculturable land 232 181 99 65 156 97 94 102 100 96
Total Land not Available for Cultivation 489 490 473 434 392 417 494 470 532 525
Permanent Pastures and OtherGrazing Lands 46 54 44 30 28 23 24 34 25 25
Land under misc. Tree Crops andGroves not Included in Net Area Sown 4 3 @ @ 1 4 4 7 6 6
Culturable but Barren Land 87 41 34 30 23 21 23 18 36 35
Fallow Land 259 150 125 177 168 169 156 232 196 212
Net Area Sown 3423 3565 3624 3602 3613 3575 3586 3526 3534 3528
Culturable Area 3819 3813 3827 3839 3833 3792 3793 3817 3797 3806
Area Sown More than Once 1176 1392 1827 1860 1988 2344 2388 2589 2854 2897
Total Cropped Area 4599 4957 5451 5462 5601 5919 5974 6115 6388 6425
Note: * The decrease in total area is on account of rechecking of revenue records.
@ Below 500 hectares P Figures are provisional
Source: Government of Haryana (2007). Haryana Statistical Abstract 2005-06, Table 12.1, pp. 212-213.
TABLE 1.14
Expenditure on Agriculture and Allied Activities underFive-Year/Annual Plans in Haryana
Expenditure Percentage to(Rs. Crore) Total Expenditure
Fourth Five-Year Plan 1969-74 26.33 7.35
Fifth Five-Year Plan 1974-79 44.96 6.64
Annual Plan 1979-80 14.51 7.15
Sixth Five-Year Plan 1980-85 157.53 9.88
Seventh Five-Year Plan 1985-90 239.29 9.53
Annual Plan 1990-91 65.42 10.64
Eighth Five-Year Plan 1992-97 451.58 9.22
Ninth Five-Year Plan 1997-2002 476.20 5.96
Annual Plan 1997-98 104.81 8.04
Annual Plan 1998-99 79.83 5.24
Annual Plan 1999-2000 90.14 5.38
Annual Plan 2000-01 92.92 5.41
Annual Plan 2001-02 108.50 6.14
Tenth Five Year Plan 2002-07 547.82 4.57
Annual Plan 2002-03 84.29 4.75
Annual Plan 2003-04 92.79 4.97
Annual Plan 2004-05 100.45 4.77
Annual Plan 2005-06 150.20 5.01
Annual Plan 2006-07(Revised outlay) 174.56 4.57
Eleventh Five Year Plan(2007-12) (Approved outlay) 1638.82 4.68
Annual Plan 2007-08(Approved outlay) 193.39 3.65
Source: Compiled from Statistical Abstract Haryana 2005-06, Table 29.1,pp.586-91, Government of Haryana, 2007; and Economic andStatistical Organisation, Haryana.
TABLE 1.15
Land Holdings in Haryana: 2000-01
Size Group Total Holdings(in Hectares)
No. Area
1 2 3
Below 0.5 438096 (28.68) 115832 (3.26)
05-1.0 265917 (17.41) 200711 (5.65)
1.0-2.0 294102 (19.25) 421858 (11.88)
2.0-3.0 168442 (11.03) 404956 (11.41)
3.0-4.0 109479 (7.17) 375999 (10.59)
4.0-5.0 71963 (4.71) 319761 (9.00)
5.0-7.5 87770 (5.74) 531551 (14.97)
7.5-10.0 42230 (2.76) 358693 (10.10)
10.0-20.0 40369 (2.64) 530026 (14.93)
20 and Above 9406 (0.62) 290496 (8.18)
Total 1527774 (100) 3549883 (100)
Note: Figures in parentheses show percentage
Source: Government of Haryana (2007). Statistical Abstract Haryana 2005-06,Table 12.3, p.221.
Two-thirds of the total landholdings, covering less
than one-fourth of the total area in Haryana are in the
size group of less than 2 hectares. Almost 28 per cent of
the total holdings are less than half a hectare. These
landholdings can hardly be termed as economic holdings.
Almost half of the total landholdings are of less than 1
hectare in size. So Haryana agriculture can be
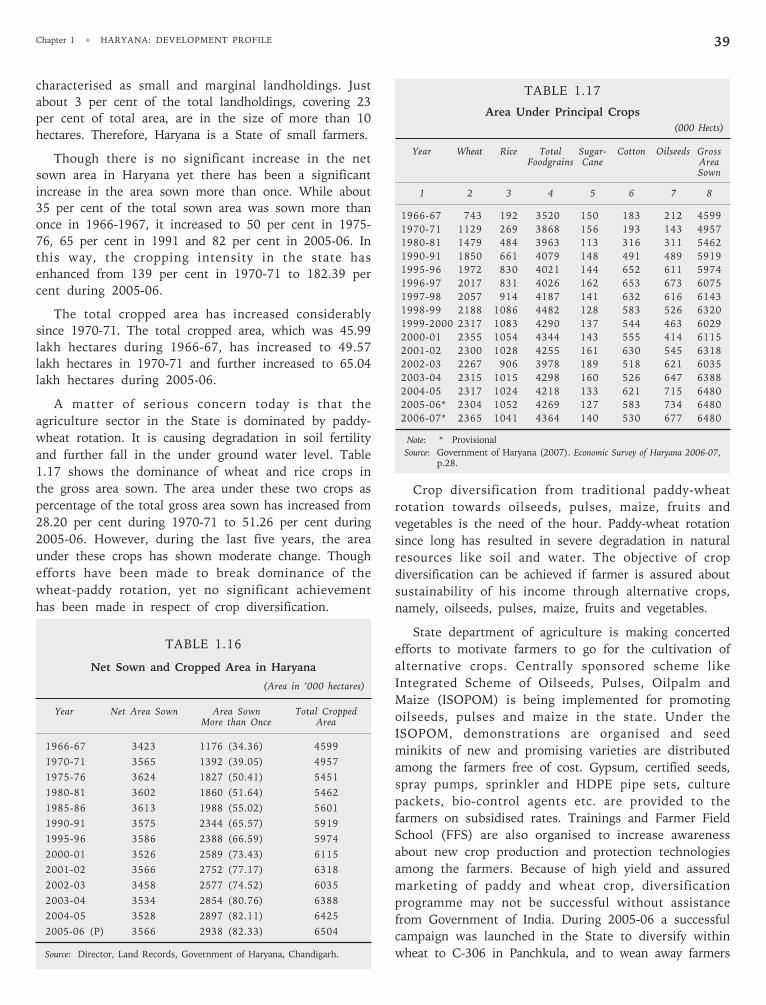
Chapter 1 • HARYANA: DEVELOPMENT PROFILE 39
TABLE 1.16
Net Sown and Cropped Area in Haryana
(Area in ’000 hectares)
Year Net Area Sown Area Sown Total CroppedMore than Once Area
1966-67 3423 1176 (34.36) 4599
1970-71 3565 1392 (39.05) 4957
1975-76 3624 1827 (50.41) 5451
1980-81 3602 1860 (51.64) 5462
1985-86 3613 1988 (55.02) 5601
1990-91 3575 2344 (65.57) 5919
1995-96 3586 2388 (66.59) 5974
2000-01 3526 2589 (73.43) 6115
2001-02 3566 2752 (77.17) 6318
2002-03 3458 2577 (74.52) 6035
2003-04 3534 2854 (80.76) 6388
2004-05 3528 2897 (82.11) 6425
2005-06 (P) 3566 2938 (82.33) 6504
Source: Director, Land Records, Government of Haryana, Chandigarh.
characterised as small and marginal landholdings. Just
about 3 per cent of the total landholdings, covering 23
per cent of total area, are in the size of more than 10
hectares. Therefore, Haryana is a State of small farmers.
Though there is no significant increase in the net
sown area in Haryana yet there has been a significant
increase in the area sown more than once. While about
35 per cent of the total sown area was sown more than
once in 1966-1967, it increased to 50 per cent in 1975-
76, 65 per cent in 1991 and 82 per cent in 2005-06. In
this way, the cropping intensity in the state has
enhanced from 139 per cent in 1970-71 to 182.39 per
cent during 2005-06.
The total cropped area has increased considerably
since 1970-71. The total cropped area, which was 45.99
lakh hectares during 1966-67, has increased to 49.57
lakh hectares in 1970-71 and further increased to 65.04
lakh hectares during 2005-06.
A matter of serious concern today is that the
agriculture sector in the State is dominated by paddy-
wheat rotation. It is causing degradation in soil fertility
and further fall in the under ground water level. Table
1.17 shows the dominance of wheat and rice crops in
the gross area sown. The area under these two crops as
percentage of the total gross area sown has increased from
28.20 per cent during 1970-71 to 51.26 per cent during
2005-06. However, during the last five years, the area
under these crops has shown moderate change. Though
efforts have been made to break dominance of the
wheat-paddy rotation, yet no significant achievement
has been made in respect of crop diversification.
Crop diversification from traditional paddy-wheat
rotation towards oilseeds, pulses, maize, fruits and
vegetables is the need of the hour. Paddy-wheat rotation
since long has resulted in severe degradation in natural
resources like soil and water. The objective of crop
diversification can be achieved if farmer is assured about
sustainability of his income through alternative crops,
namely, oilseeds, pulses, maize, fruits and vegetables.
State department of agriculture is making concerted
efforts to motivate farmers to go for the cultivation of
alternative crops. Centrally sponsored scheme like
Integrated Scheme of Oilseeds, Pulses, Oilpalm and
Maize (ISOPOM) is being implemented for promoting
oilseeds, pulses and maize in the state. Under the
ISOPOM, demonstrations are organised and seed
minikits of new and promising varieties are distributed
among the farmers free of cost. Gypsum, certified seeds,
spray pumps, sprinkler and HDPE pipe sets, culture
packets, bio-control agents etc. are provided to the
farmers on subsidised rates. Trainings and Farmer Field
School (FFS) are also organised to increase awareness
about new crop production and protection technologies
among the farmers. Because of high yield and assured
marketing of paddy and wheat crop, diversification
programme may not be successful without assistance
from Government of India. During 2005-06 a successful
campaign was launched in the State to diversify within
wheat to C-306 in Panchkula, and to wean away farmers
TABLE 1.17
Area Under Principal Crops
(000 Hects)
Year Wheat Rice Total Sugar- Cotton Oilseeds GrossFoodgrains Cane Area
Sown
1 2 3 4 5 6 7 8
1966-67 743 192 3520 150 183 212 4599
1970-71 1129 269 3868 156 193 143 4957
1980-81 1479 484 3963 113 316 311 5462
1990-91 1850 661 4079 148 491 489 5919
1995-96 1972 830 4021 144 652 611 5974
1996-97 2017 831 4026 162 653 673 6075
1997-98 2057 914 4187 141 632 616 6143
1998-99 2188 1086 4482 128 583 526 6320
1999-2000 2317 1083 4290 137 544 463 6029
2000-01 2355 1054 4344 143 555 414 6115
2001-02 2300 1028 4255 161 630 545 6318
2002-03 2267 906 3978 189 518 621 6035
2003-04 2315 1015 4298 160 526 647 6388
2004-05 2317 1024 4218 133 621 715 6480
2005-06* 2304 1052 4269 127 583 734 6480
2006-07* 2365 1041 4364 140 530 677 6480
Note: * Provisional
Source: Government of Haryana (2007). Economic Survey of Haryana 2006-07,p.28.
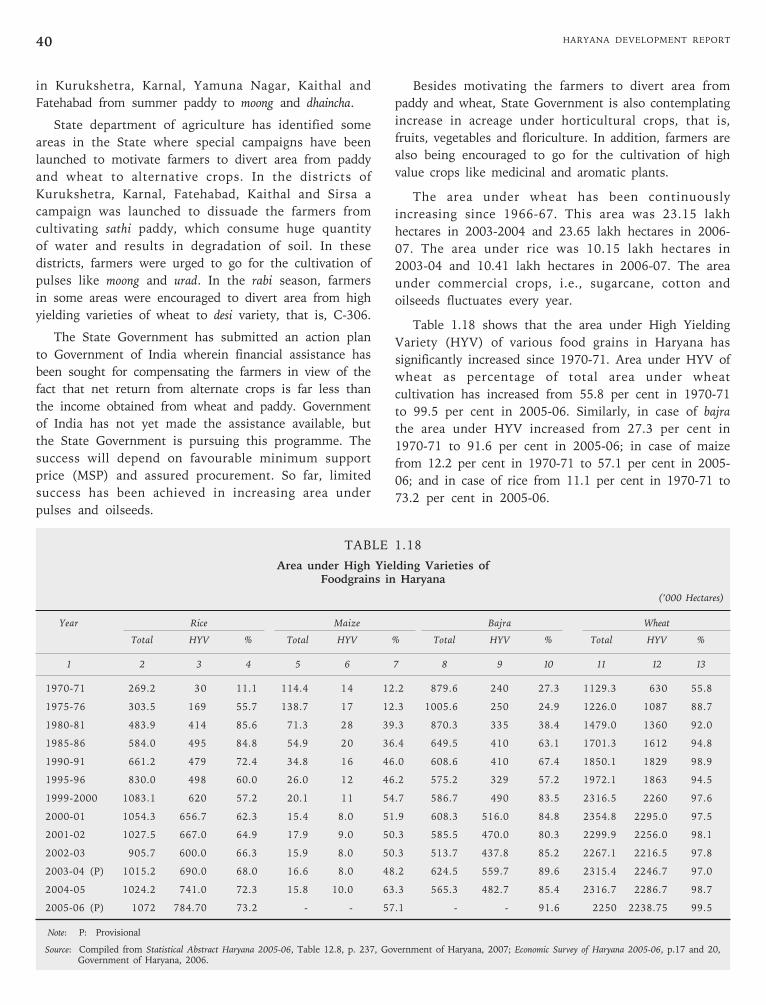
HARYANA DEVELOPMENT REPORT40
in Kurukshetra, Karnal, Yamuna Nagar, Kaithal and
Fatehabad from summer paddy to moong and dhaincha.
State department of agriculture has identified some
areas in the State where special campaigns have been
launched to motivate farmers to divert area from paddy
and wheat to alternative crops. In the districts of
Kurukshetra, Karnal, Fatehabad, Kaithal and Sirsa a
campaign was launched to dissuade the farmers from
cultivating sathi paddy, which consume huge quantity
of water and results in degradation of soil. In these
districts, farmers were urged to go for the cultivation of
pulses like moong and urad. In the rabi season, farmers
in some areas were encouraged to divert area from high
yielding varieties of wheat to desi variety, that is, C-306.
The State Government has submitted an action plan
to Government of India wherein financial assistance has
been sought for compensating the farmers in view of the
fact that net return from alternate crops is far less than
the income obtained from wheat and paddy. Government
of India has not yet made the assistance available, but
the State Government is pursuing this programme. The
success will depend on favourable minimum support
price (MSP) and assured procurement. So far, limited
success has been achieved in increasing area under
pulses and oilseeds.
TABLE 1.18
Area under High Yielding Varieties ofFoodgrains in Haryana
(’000 Hectares)
Year Rice Maize Bajra Wheat
Total HYV % Total HYV % Total HYV % Total HYV %
1 2 3 4 5 6 7 8 9 10 11 12 13
1970-71 269.2 30 11.1 114.4 14 12.2 879.6 240 27.3 1129.3 630 55.8
1975-76 303.5 169 55.7 138.7 17 12.3 1005.6 250 24.9 1226.0 1087 88.7
1980-81 483.9 414 85.6 71.3 28 39.3 870.3 335 38.4 1479.0 1360 92.0
1985-86 584.0 495 84.8 54.9 20 36.4 649.5 410 63.1 1701.3 1612 94.8
1990-91 661.2 479 72.4 34.8 16 46.0 608.6 410 67.4 1850.1 1829 98.9
1995-96 830.0 498 60.0 26.0 12 46.2 575.2 329 57.2 1972.1 1863 94.5
1999-2000 1083.1 620 57.2 20.1 11 54.7 586.7 490 83.5 2316.5 2260 97.6
2000-01 1054.3 656.7 62.3 15.4 8.0 51.9 608.3 516.0 84.8 2354.8 2295.0 97.5
2001-02 1027.5 667.0 64.9 17.9 9.0 50.3 585.5 470.0 80.3 2299.9 2256.0 98.1
2002-03 905.7 600.0 66.3 15.9 8.0 50.3 513.7 437.8 85.2 2267.1 2216.5 97.8
2003-04 (P) 1015.2 690.0 68.0 16.6 8.0 48.2 624.5 559.7 89.6 2315.4 2246.7 97.0
2004-05 1024.2 741.0 72.3 15.8 10.0 63.3 565.3 482.7 85.4 2316.7 2286.7 98.7
2005-06 (P) 1072 784.70 73.2 - - 57.1 - - 91.6 2250 2238.75 99.5
Note: P: Provisional
Source: Compiled from Statistical Abstract Haryana 2005-06, Table 12.8, p. 237, Government of Haryana, 2007; Economic Survey of Haryana 2005-06, p.17 and 20,Government of Haryana, 2006.
Besides motivating the farmers to divert area from
paddy and wheat, State Government is also contemplating
increase in acreage under horticultural crops, that is,
fruits, vegetables and floriculture. In addition, farmers are
also being encouraged to go for the cultivation of high
value crops like medicinal and aromatic plants.
The area under wheat has been continuously
increasing since 1966-67. This area was 23.15 lakh
hectares in 2003-2004 and 23.65 lakh hectares in 2006-
07. The area under rice was 10.15 lakh hectares in
2003-04 and 10.41 lakh hectares in 2006-07. The area
under commercial crops, i.e., sugarcane, cotton and
oilseeds fluctuates every year.
Table 1.18 shows that the area under High Yielding
Variety (HYV) of various food grains in Haryana has
significantly increased since 1970-71. Area under HYV of
wheat as percentage of total area under wheat
cultivation has increased from 55.8 per cent in 1970-71
to 99.5 per cent in 2005-06. Similarly, in case of bajra
the area under HYV increased from 27.3 per cent in
1970-71 to 91.6 per cent in 2005-06; in case of maize
from 12.2 per cent in 1970-71 to 57.1 per cent in 2005-
06; and in case of rice from 11.1 per cent in 1970-71 to
73.2 per cent in 2005-06.
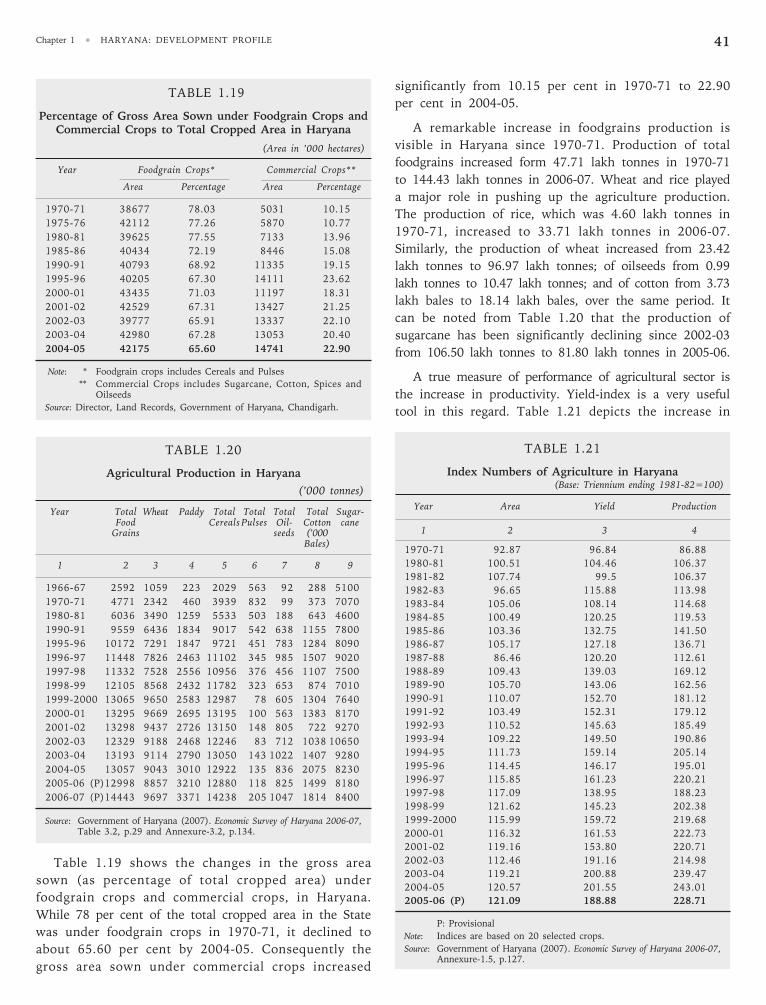
Chapter 1 • HARYANA: DEVELOPMENT PROFILE 41
Table 1.19 shows the changes in the gross area
sown (as percentage of total cropped area) under
foodgrain crops and commercial crops, in Haryana.
While 78 per cent of the total cropped area in the State
was under foodgrain crops in 1970-71, it declined to
about 65.60 per cent by 2004-05. Consequently the
gross area sown under commercial crops increased
TABLE 1.21
Index Numbers of Agriculture in Haryana(Base: Triennium ending 1981-82=100)
Year Area Yield Production
1 2 3 4
1970-71 92.87 96.84 86.88
1980-81 100.51 104.46 106.37
1981-82 107.74 99.5 106.37
1982-83 96.65 115.88 113.98
1983-84 105.06 108.14 114.68
1984-85 100.49 120.25 119.53
1985-86 103.36 132.75 141.50
1986-87 105.17 127.18 136.71
1987-88 86.46 120.20 112.61
1988-89 109.43 139.03 169.12
1989-90 105.70 143.06 162.56
1990-91 110.07 152.70 181.12
1991-92 103.49 152.31 179.12
1992-93 110.52 145.63 185.49
1993-94 109.22 149.50 190.86
1994-95 111.73 159.14 205.14
1995-96 114.45 146.17 195.01
1996-97 115.85 161.23 220.21
1997-98 117.09 138.95 188.23
1998-99 121.62 145.23 202.38
1999-2000 115.99 159.72 219.68
2000-01 116.32 161.53 222.73
2001-02 119.16 153.80 220.71
2002-03 112.46 191.16 214.98
2003-04 119.21 200.88 239.47
2004-05 120.57 201.55 243.01
2005-06 (P) 121.09 188.88 228.71
P: Provisional
Note: Indices are based on 20 selected crops.
Source: Government of Haryana (2007). Economic Survey of Haryana 2006-07,Annexure-1.5, p.127.
TABLE 1.19
Percentage of Gross Area Sown under Foodgrain Crops andCommercial Crops to Total Cropped Area in Haryana
(Area in ’000 hectares)
Year Foodgrain Crops* Commercial Crops**
Area Percentage Area Percentage
1970-71 38677 78.03 5031 10.15
1975-76 42112 77.26 5870 10.77
1980-81 39625 77.55 7133 13.96
1985-86 40434 72.19 8446 15.08
1990-91 40793 68.92 11335 19.15
1995-96 40205 67.30 14111 23.62
2000-01 43435 71.03 11197 18.31
2001-02 42529 67.31 13427 21.25
2002-03 39777 65.91 13337 22.10
2003-04 42980 67.28 13053 20.40
2004-05 42175 65.60 14741 22.90
Note: * Foodgrain crops includes Cereals and Pulses
** Commercial Crops includes Sugarcane, Cotton, Spices andOilseeds
Source: Director, Land Records, Government of Haryana, Chandigarh.
TABLE 1.20
Agricultural Production in Haryana
(’000 tonnes)
Year Total Wheat Paddy Total Total Total Total Sugar-Food Cereals Pulses Oil- Cotton cane
Grains seeds (’000Bales)
1 2 3 4 5 6 7 8 9
1966-67 2592 1059 223 2029 563 92 288 5100
1970-71 4771 2342 460 3939 832 99 373 7070
1980-81 6036 3490 1259 5533 503 188 643 4600
1990-91 9559 6436 1834 9017 542 638 1155 7800
1995-96 10172 7291 1847 9721 451 783 1284 8090
1996-97 11448 7826 2463 11102 345 985 1507 9020
1997-98 11332 7528 2556 10956 376 456 1107 7500
1998-99 12105 8568 2432 11782 323 653 874 7010
1999-2000 13065 9650 2583 12987 78 605 1304 7640
2000-01 13295 9669 2695 13195 100 563 1383 8170
2001-02 13298 9437 2726 13150 148 805 722 9270
2002-03 12329 9188 2468 12246 83 712 1038 10650
2003-04 13193 9114 2790 13050 143 1022 1407 9280
2004-05 13057 9043 3010 12922 135 836 2075 8230
2005-06 (P)12998 8857 3210 12880 118 825 1499 8180
2006-07 (P)14443 9697 3371 14238 205 1047 1814 8400
Source: Government of Haryana (2007). Economic Survey of Haryana 2006-07,Table 3.2, p.29 and Annexure-3.2, p.134.
significantly from 10.15 per cent in 1970-71 to 22.90
per cent in 2004-05.
A remarkable increase in foodgrains production is
visible in Haryana since 1970-71. Production of total
foodgrains increased form 47.71 lakh tonnes in 1970-71
to 144.43 lakh tonnes in 2006-07. Wheat and rice played
a major role in pushing up the agriculture production.
The production of rice, which was 4.60 lakh tonnes in
1970-71, increased to 33.71 lakh tonnes in 2006-07.
Similarly, the production of wheat increased from 23.42
lakh tonnes to 96.97 lakh tonnes; of oilseeds from 0.99
lakh tonnes to 10.47 lakh tonnes; and of cotton from 3.73
lakh bales to 18.14 lakh bales, over the same period. It
can be noted from Table 1.20 that the production of
sugarcane has been significantly declining since 2002-03
from 106.50 lakh tonnes to 81.80 lakh tonnes in 2005-06.
A true measure of performance of agricultural sector is
the increase in productivity. Yield-index is a very useful
tool in this regard. Table 1.21 depicts the increase in
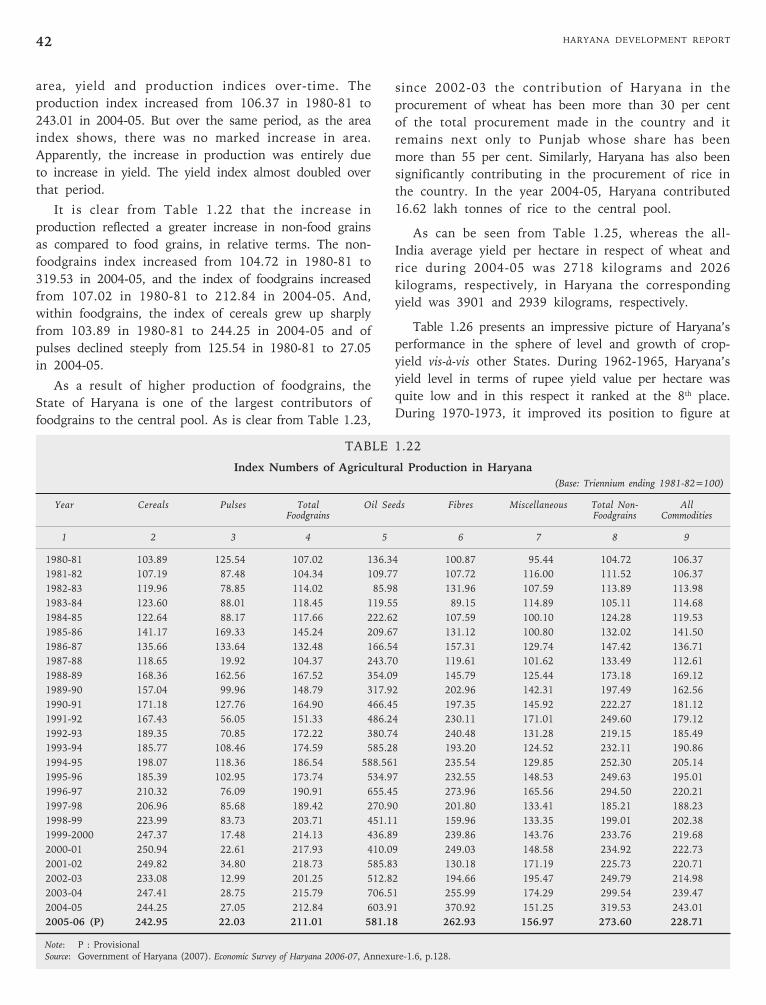
HARYANA DEVELOPMENT REPORT42
TABLE 1.22
Index Numbers of Agricultural Production in Haryana
(Base: Triennium ending 1981-82=100)
Year Cereals Pulses Total Oil Seeds Fibres Miscellaneous Total Non- AllFoodgrains Foodgrains Commodities
1 2 3 4 5 6 7 8 9
1980-81 103.89 125.54 107.02 136.34 100.87 95.44 104.72 106.37
1981-82 107.19 87.48 104.34 109.77 107.72 116.00 111.52 106.37
1982-83 119.96 78.85 114.02 85.98 131.96 107.59 113.89 113.98
1983-84 123.60 88.01 118.45 119.55 89.15 114.89 105.11 114.68
1984-85 122.64 88.17 117.66 222.62 107.59 100.10 124.28 119.53
1985-86 141.17 169.33 145.24 209.67 131.12 100.80 132.02 141.50
1986-87 135.66 133.64 132.48 166.54 157.31 129.74 147.42 136.71
1987-88 118.65 19.92 104.37 243.70 119.61 101.62 133.49 112.61
1988-89 168.36 162.56 167.52 354.09 145.79 125.44 173.18 169.12
1989-90 157.04 99.96 148.79 317.92 202.96 142.31 197.49 162.56
1990-91 171.18 127.76 164.90 466.45 197.35 145.92 222.27 181.12
1991-92 167.43 56.05 151.33 486.24 230.11 171.01 249.60 179.12
1992-93 189.35 70.85 172.22 380.74 240.48 131.28 219.15 185.49
1993-94 185.77 108.46 174.59 585.28 193.20 124.52 232.11 190.86
1994-95 198.07 118.36 186.54 588.561 235.54 129.85 252.30 205.14
1995-96 185.39 102.95 173.74 534.97 232.55 148.53 249.63 195.01
1996-97 210.32 76.09 190.91 655.45 273.96 165.56 294.50 220.21
1997-98 206.96 85.68 189.42 270.90 201.80 133.41 185.21 188.23
1998-99 223.99 83.73 203.71 451.11 159.96 133.35 199.01 202.38
1999-2000 247.37 17.48 214.13 436.89 239.86 143.76 233.76 219.68
2000-01 250.94 22.61 217.93 410.09 249.03 148.58 234.92 222.73
2001-02 249.82 34.80 218.73 585.83 130.18 171.19 225.73 220.71
2002-03 233.08 12.99 201.25 512.82 194.66 195.47 249.79 214.98
2003-04 247.41 28.75 215.79 706.51 255.99 174.29 299.54 239.47
2004-05 244.25 27.05 212.84 603.91 370.92 151.25 319.53 243.01
2005-06 (P) 242.95 22.03 211.01 581.18 262.93 156.97 273.60 228.71
Note: P : ProvisionalSource: Government of Haryana (2007). Economic Survey of Haryana 2006-07, Annexure-1.6, p.128.
area, yield and production indices over-time. The
production index increased from 106.37 in 1980-81 to
243.01 in 2004-05. But over the same period, as the area
index shows, there was no marked increase in area.
Apparently, the increase in production was entirely due
to increase in yield. The yield index almost doubled over
that period.
It is clear from Table 1.22 that the increase in
production reflected a greater increase in non-food grains
as compared to food grains, in relative terms. The non-
foodgrains index increased from 104.72 in 1980-81 to
319.53 in 2004-05, and the index of foodgrains increased
from 107.02 in 1980-81 to 212.84 in 2004-05. And,
within foodgrains, the index of cereals grew up sharply
from 103.89 in 1980-81 to 244.25 in 2004-05 and of
pulses declined steeply from 125.54 in 1980-81 to 27.05
in 2004-05.
As a result of higher production of foodgrains, the
State of Haryana is one of the largest contributors of
foodgrains to the central pool. As is clear from Table 1.23,
since 2002-03 the contribution of Haryana in the
procurement of wheat has been more than 30 per cent
of the total procurement made in the country and it
remains next only to Punjab whose share has been
more than 55 per cent. Similarly, Haryana has also been
significantly contributing in the procurement of rice in
the country. In the year 2004-05, Haryana contributed
16.62 lakh tonnes of rice to the central pool.
As can be seen from Table 1.25, whereas the all-
India average yield per hectare in respect of wheat and
rice during 2004-05 was 2718 kilograms and 2026
kilograms, respectively, in Haryana the corresponding
yield was 3901 and 2939 kilograms, respectively.
Table 1.26 presents an impressive picture of Haryana’s
performance in the sphere of level and growth of crop-
yield vis-à-vis other States. During 1962-1965, Haryana’s
yield level in terms of rupee yield value per hectare was
quite low and in this respect it ranked at the 8th place.
During 1970-1973, it improved its position to figure at
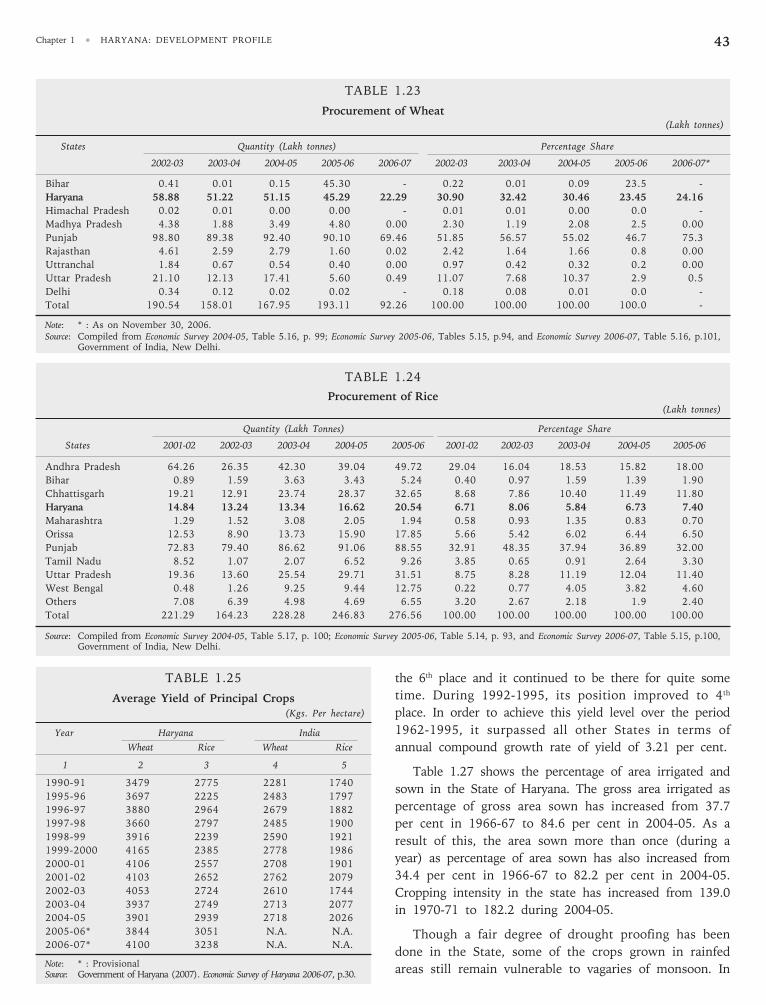
Chapter 1 • HARYANA: DEVELOPMENT PROFILE 43
TABLE 1.24
Procurement of Rice(Lakh tonnes)
Quantity (Lakh Tonnes) Percentage Share
States 2001-02 2002-03 2003-04 2004-05 2005-06 2001-02 2002-03 2003-04 2004-05 2005-06
Andhra Pradesh 64.26 26.35 42.30 39.04 49.72 29.04 16.04 18.53 15.82 18.00
Bihar 0.89 1.59 3.63 3.43 5.24 0.40 0.97 1.59 1.39 1.90
Chhattisgarh 19.21 12.91 23.74 28.37 32.65 8.68 7.86 10.40 11.49 11.80
Haryana 14.84 13.24 13.34 16.62 20.54 6.71 8.06 5.84 6.73 7.40
Maharashtra 1.29 1.52 3.08 2.05 1.94 0.58 0.93 1.35 0.83 0.70
Orissa 12.53 8.90 13.73 15.90 17.85 5.66 5.42 6.02 6.44 6.50
Punjab 72.83 79.40 86.62 91.06 88.55 32.91 48.35 37.94 36.89 32.00
Tamil Nadu 8.52 1.07 2.07 6.52 9.26 3.85 0.65 0.91 2.64 3.30
Uttar Pradesh 19.36 13.60 25.54 29.71 31.51 8.75 8.28 11.19 12.04 11.40
West Bengal 0.48 1.26 9.25 9.44 12.75 0.22 0.77 4.05 3.82 4.60
Others 7.08 6.39 4.98 4.69 6.55 3.20 2.67 2.18 1.9 2.40
Total 221.29 164.23 228.28 246.83 276.56 100.00 100.00 100.00 100.00 100.00
Source: Compiled from Economic Survey 2004-05, Table 5.17, p. 100; Economic Survey 2005-06, Table 5.14, p. 93, and Economic Survey 2006-07, Table 5.15, p.100,Government of India, New Delhi.
TABLE 1.23
Procurement of Wheat(Lakh tonnes)
States Quantity (Lakh tonnes) Percentage Share
2002-03 2003-04 2004-05 2005-06 2006-07 2002-03 2003-04 2004-05 2005-06 2006-07*
Bihar 0.41 0.01 0.15 45.30 - 0.22 0.01 0.09 23.5 -
Haryana 58.88 51.22 51.15 45.29 22.29 30.90 32.42 30.46 23.45 24.16
Himachal Pradesh 0.02 0.01 0.00 0.00 - 0.01 0.01 0.00 0.0 -
Madhya Pradesh 4.38 1.88 3.49 4.80 0.00 2.30 1.19 2.08 2.5 0.00
Punjab 98.80 89.38 92.40 90.10 69.46 51.85 56.57 55.02 46.7 75.3
Rajasthan 4.61 2.59 2.79 1.60 0.02 2.42 1.64 1.66 0.8 0.00
Uttranchal 1.84 0.67 0.54 0.40 0.00 0.97 0.42 0.32 0.2 0.00
Uttar Pradesh 21.10 12.13 17.41 5.60 0.49 11.07 7.68 10.37 2.9 0.5
Delhi 0.34 0.12 0.02 0.02 - 0.18 0.08 0.01 0.0 -
Total 190.54 158.01 167.95 193.11 92.26 100.00 100.00 100.00 100.0 -
Note: * : As on November 30, 2006.Source: Compiled from Economic Survey 2004-05, Table 5.16, p. 99; Economic Survey 2005-06, Tables 5.15, p.94, and Economic Survey 2006-07, Table 5.16, p.101,
Government of India, New Delhi.
TABLE 1.25
Average Yield of Principal Crops(Kgs. Per hectare)
Year Haryana India
Wheat Rice Wheat Rice
1 2 3 4 5
1990-91 3479 2775 2281 1740
1995-96 3697 2225 2483 1797
1996-97 3880 2964 2679 1882
1997-98 3660 2797 2485 1900
1998-99 3916 2239 2590 1921
1999-2000 4165 2385 2778 1986
2000-01 4106 2557 2708 1901
2001-02 4103 2652 2762 2079
2002-03 4053 2724 2610 1744
2003-04 3937 2749 2713 2077
2004-05 3901 2939 2718 2026
2005-06* 3844 3051 N.A. N.A.
2006-07* 4100 3238 N.A. N.A.
Note: * : ProvisionalSource: Government of Haryana (2007). Economic Survey of Haryana 2006-07, p.30.
the 6th place and it continued to be there for quite some
time. During 1992-1995, its position improved to 4th
place. In order to achieve this yield level over the period
1962-1995, it surpassed all other States in terms of
annual compound growth rate of yield of 3.21 per cent.
Table 1.27 shows the percentage of area irrigated and
sown in the State of Haryana. The gross area irrigated as
percentage of gross area sown has increased from 37.7
per cent in 1966-67 to 84.6 per cent in 2004-05. As a
result of this, the area sown more than once (during a
year) as percentage of area sown has also increased from
34.4 per cent in 1966-67 to 82.2 per cent in 2004-05.
Cropping intensity in the state has increased from 139.0
in 1970-71 to 182.2 during 2004-05.
Though a fair degree of drought proofing has been
done in the State, some of the crops grown in rainfed
areas still remain vulnerable to vagaries of monsoon. In
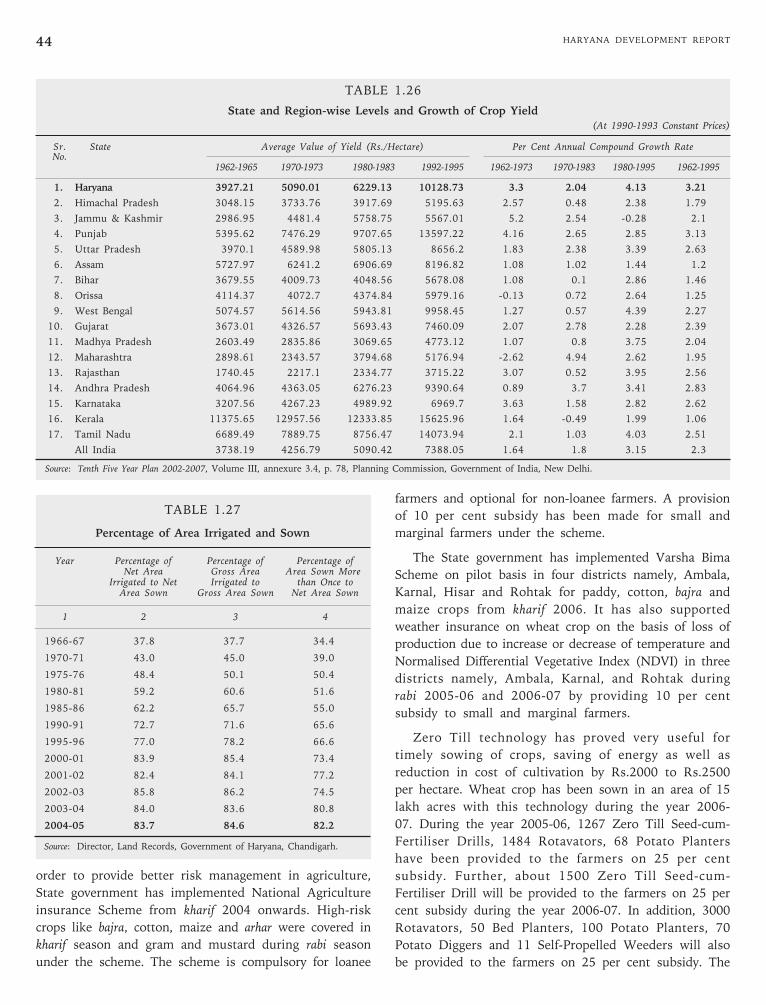
HARYANA DEVELOPMENT REPORT44
order to provide better risk management in agriculture,
State government has implemented National Agriculture
insurance Scheme from kharif 2004 onwards. High-risk
crops like bajra, cotton, maize and arhar were covered in
kharif season and gram and mustard during rabi season
under the scheme. The scheme is compulsory for loanee
farmers and optional for non-loanee farmers. A provision
of 10 per cent subsidy has been made for small and
marginal farmers under the scheme.
The State government has implemented Varsha Bima
Scheme on pilot basis in four districts namely, Ambala,
Karnal, Hisar and Rohtak for paddy, cotton, bajra and
maize crops from kharif 2006. It has also supported
weather insurance on wheat crop on the basis of loss of
production due to increase or decrease of temperature and
Normalised Differential Vegetative Index (NDVI) in three
districts namely, Ambala, Karnal, and Rohtak during
rabi 2005-06 and 2006-07 by providing 10 per cent
subsidy to small and marginal farmers.
Zero Till technology has proved very useful for
timely sowing of crops, saving of energy as well as
reduction in cost of cultivation by Rs.2000 to Rs.2500
per hectare. Wheat crop has been sown in an area of 15
lakh acres with this technology during the year 2006-
07. During the year 2005-06, 1267 Zero Till Seed-cum-
Fertiliser Drills, 1484 Rotavators, 68 Potato Planters
have been provided to the farmers on 25 per cent
subsidy. Further, about 1500 Zero Till Seed-cum-
Fertiliser Drill will be provided to the farmers on 25 per
cent subsidy during the year 2006-07. In addition, 3000
Rotavators, 50 Bed Planters, 100 Potato Planters, 70
Potato Diggers and 11 Self-Propelled Weeders will also
be provided to the farmers on 25 per cent subsidy. The
TABLE 1.26
State and Region-wise Levels and Growth of Crop Yield(At 1990-1993 Constant Prices)
Sr. State Average Value of Yield (Rs./Hectare) Per Cent Annual Compound Growth RateNo.
1962-1965 1970-1973 1980-1983 1992-1995 1962-1973 1970-1983 1980-1995 1962-1995
1. Haryana 3927.21 5090.01 6229.13 10128.73 3.3 2.04 4.13 3.21
2. Himachal Pradesh 3048.15 3733.76 3917.69 5195.63 2.57 0.48 2.38 1.79
3. Jammu & Kashmir 2986.95 4481.4 5758.75 5567.01 5.2 2.54 -0.28 2.1
4. Punjab 5395.62 7476.29 9707.65 13597.22 4.16 2.65 2.85 3.13
5. Uttar Pradesh 3970.1 4589.98 5805.13 8656.2 1.83 2.38 3.39 2.63
6. Assam 5727.97 6241.2 6906.69 8196.82 1.08 1.02 1.44 1.2
7. Bihar 3679.55 4009.73 4048.56 5678.08 1.08 0.1 2.86 1.46
8. Orissa 4114.37 4072.7 4374.84 5979.16 -0.13 0.72 2.64 1.25
9. West Bengal 5074.57 5614.56 5943.81 9958.45 1.27 0.57 4.39 2.27
10. Gujarat 3673.01 4326.57 5693.43 7460.09 2.07 2.78 2.28 2.39
11. Madhya Pradesh 2603.49 2835.86 3069.65 4773.12 1.07 0.8 3.75 2.04
12. Maharashtra 2898.61 2343.57 3794.68 5176.94 -2.62 4.94 2.62 1.95
13. Rajasthan 1740.45 2217.1 2334.77 3715.22 3.07 0.52 3.95 2.56
14. Andhra Pradesh 4064.96 4363.05 6276.23 9390.64 0.89 3.7 3.41 2.83
15. Karnataka 3207.56 4267.23 4989.92 6969.7 3.63 1.58 2.82 2.62
16. Kerala 11375.65 12957.56 12333.85 15625.96 1.64 -0.49 1.99 1.06
17. Tamil Nadu 6689.49 7889.75 8756.47 14073.94 2.1 1.03 4.03 2.51
All India 3738.19 4256.79 5090.42 7388.05 1.64 1.8 3.15 2.3
Source: Tenth Five Year Plan 2002-2007, Volume III, annexure 3.4, p. 78, Planning Commission, Government of India, New Delhi.
TABLE 1.27
Percentage of Area Irrigated and Sown
Year Percentage of Percentage of Percentage ofNet Area Gross Area Area Sown More
Irrigated to Net Irrigated to than Once toArea Sown Gross Area Sown Net Area Sown
1 2 3 4
1966-67 37.8 37.7 34.4
1970-71 43.0 45.0 39.0
1975-76 48.4 50.1 50.4
1980-81 59.2 60.6 51.6
1985-86 62.2 65.7 55.0
1990-91 72.7 71.6 65.6
1995-96 77.0 78.2 66.6
2000-01 83.9 85.4 73.4
2001-02 82.4 84.1 77.2
2002-03 85.8 86.2 74.5
2003-04 84.0 83.6 80.8
2004-05 83.7 84.6 82.2
Source: Director, Land Records, Government of Haryana, Chandigarh.
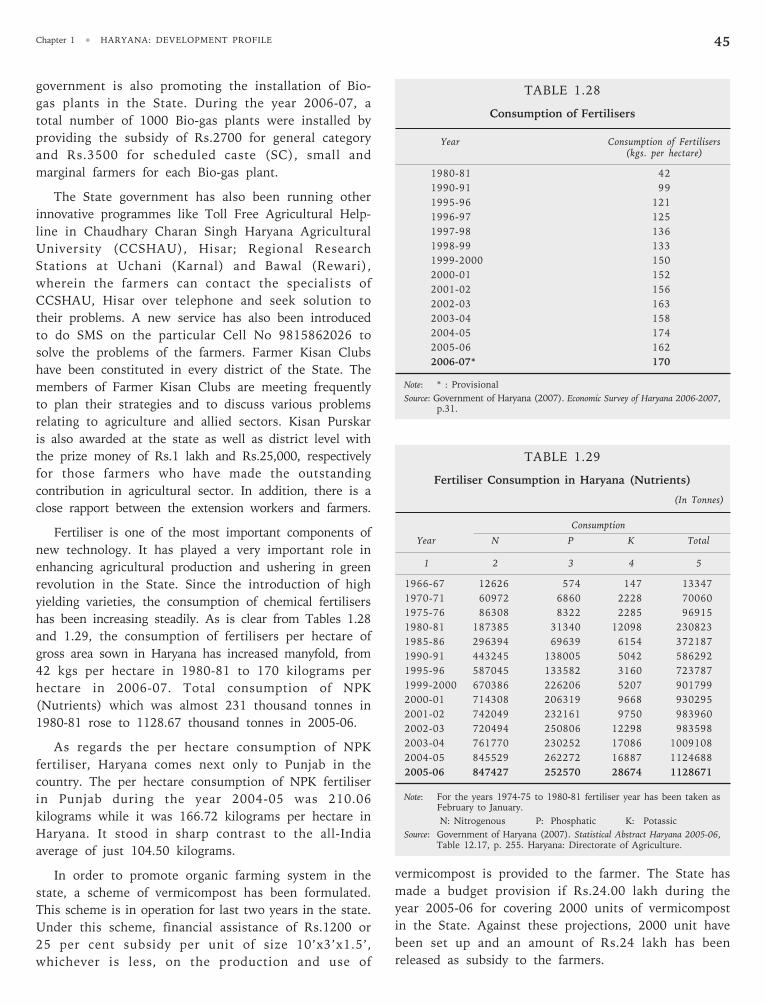
Chapter 1 • HARYANA: DEVELOPMENT PROFILE 45
government is also promoting the installation of Bio-
gas plants in the State. During the year 2006-07, a
total number of 1000 Bio-gas plants were installed by
providing the subsidy of Rs.2700 for general category
and Rs.3500 for scheduled caste (SC), small and
marginal farmers for each Bio-gas plant.
The State government has also been running other
innovative programmes like Toll Free Agricultural Help-
line in Chaudhary Charan Singh Haryana Agricultural
University (CCSHAU), Hisar; Regional Research
Stations at Uchani (Karnal) and Bawal (Rewari),
wherein the farmers can contact the specialists of
CCSHAU, Hisar over telephone and seek solution to
their problems. A new service has also been introduced
to do SMS on the particular Cell No 9815862026 to
solve the problems of the farmers. Farmer Kisan Clubs
have been constituted in every district of the State. The
members of Farmer Kisan Clubs are meeting frequently
to plan their strategies and to discuss various problems
relating to agriculture and allied sectors. Kisan Purskar
is also awarded at the state as well as district level with
the prize money of Rs.1 lakh and Rs.25,000, respectively
for those farmers who have made the outstanding
contribution in agricultural sector. In addition, there is a
close rapport between the extension workers and farmers.
Fertiliser is one of the most important components of
new technology. It has played a very important role in
enhancing agricultural production and ushering in green
revolution in the State. Since the introduction of high
yielding varieties, the consumption of chemical fertilisers
has been increasing steadily. As is clear from Tables 1.28
and 1.29, the consumption of fertilisers per hectare of
gross area sown in Haryana has increased manyfold, from
42 kgs per hectare in 1980-81 to 170 kilograms per
hectare in 2006-07. Total consumption of NPK
(Nutrients) which was almost 231 thousand tonnes in
1980-81 rose to 1128.67 thousand tonnes in 2005-06.
As regards the per hectare consumption of NPK
fertiliser, Haryana comes next only to Punjab in the
country. The per hectare consumption of NPK fertiliser
in Punjab during the year 2004-05 was 210.06
kilograms while it was 166.72 kilograms per hectare in
Haryana. It stood in sharp contrast to the all-India
average of just 104.50 kilograms.
In order to promote organic farming system in the
state, a scheme of vermicompost has been formulated.
This scheme is in operation for last two years in the state.
Under this scheme, financial assistance of Rs.1200 or
25 per cent subsidy per unit of size 10’x3’x1.5’,
whichever is less, on the production and use of
TABLE 1.28
Consumption of Fertilisers
Year Consumption of Fertilisers(kgs. per hectare)
1980-81 42
1990-91 99
1995-96 121
1996-97 125
1997-98 136
1998-99 133
1999-2000 150
2000-01 152
2001-02 156
2002-03 163
2003-04 158
2004-05 174
2005-06 162
2006-07* 170
Note: * : Provisional
Source: Government of Haryana (2007). Economic Survey of Haryana 2006-2007,p.31.
TABLE 1.29
Fertiliser Consumption in Haryana (Nutrients)
(In Tonnes)
Consumption
Year N P K Total
1 2 3 4 5
1966-67 12626 574 147 13347
1970-71 60972 6860 2228 70060
1975-76 86308 8322 2285 96915
1980-81 187385 31340 12098 230823
1985-86 296394 69639 6154 372187
1990-91 443245 138005 5042 586292
1995-96 587045 133582 3160 723787
1999-2000 670386 226206 5207 901799
2000-01 714308 206319 9668 930295
2001-02 742049 232161 9750 983960
2002-03 720494 250806 12298 983598
2003-04 761770 230252 17086 1009108
2004-05 845529 262272 16887 1124688
2005-06 847427 252570 28674 1128671
Note: For the years 1974-75 to 1980-81 fertiliser year has been taken asFebruary to January.
N: Nitrogenous P: Phosphatic K: Potassic
Source: Government of Haryana (2007). Statistical Abstract Haryana 2005-06,Table 12.17, p. 255. Haryana: Directorate of Agriculture.
vermicompost is provided to the farmer. The State has
made a budget provision if Rs.24.00 lakh during the
year 2005-06 for covering 2000 units of vermicompost
in the State. Against these projections, 2000 unit have
been set up and an amount of Rs.24 lakh has been
released as subsidy to the farmers.
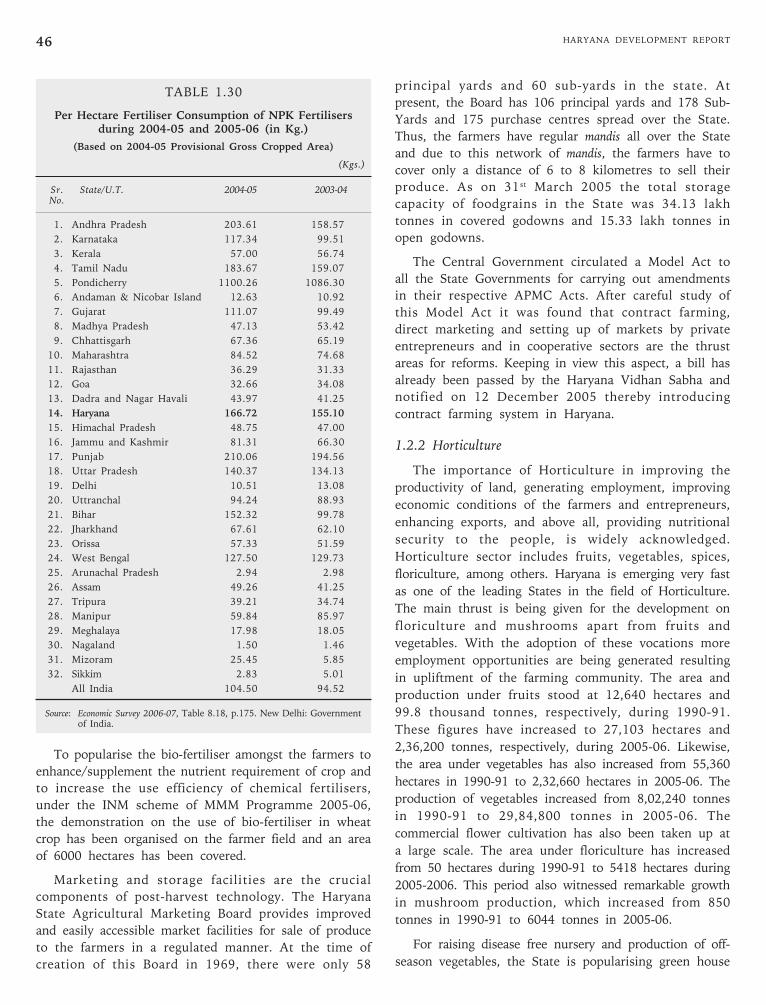
HARYANA DEVELOPMENT REPORT46
TABLE 1.30
Per Hectare Fertiliser Consumption of NPK Fertilisersduring 2004-05 and 2005-06 (in Kg.)
(Based on 2004-05 Provisional Gross Cropped Area)
(Kgs.)
Sr. State/U.T. 2004-05 2003-04No.
1. Andhra Pradesh 203.61 158.57
2. Karnataka 117.34 99.51
3. Kerala 57.00 56.74
4. Tamil Nadu 183.67 159.07
5. Pondicherry 1100.26 1086.30
6. Andaman & Nicobar Island 12.63 10.92
7. Gujarat 111.07 99.49
8. Madhya Pradesh 47.13 53.42
9. Chhattisgarh 67.36 65.19
10. Maharashtra 84.52 74.68
11. Rajasthan 36.29 31.33
12. Goa 32.66 34.08
13. Dadra and Nagar Havali 43.97 41.25
14. Haryana 166.72 155.10
15. Himachal Pradesh 48.75 47.00
16. Jammu and Kashmir 81.31 66.30
17. Punjab 210.06 194.56
18. Uttar Pradesh 140.37 134.13
19. Delhi 10.51 13.08
20. Uttranchal 94.24 88.93
21. Bihar 152.32 99.78
22. Jharkhand 67.61 62.10
23. Orissa 57.33 51.59
24. West Bengal 127.50 129.73
25. Arunachal Pradesh 2.94 2.98
26. Assam 49.26 41.25
27. Tripura 39.21 34.74
28. Manipur 59.84 85.97
29. Meghalaya 17.98 18.05
30. Nagaland 1.50 1.46
31. Mizoram 25.45 5.85
32. Sikkim 2.83 5.01
All India 104.50 94.52
Source: Economic Survey 2006-07, Table 8.18, p.175. New Delhi: Governmentof India.
To popularise the bio-fertiliser amongst the farmers to
enhance/supplement the nutrient requirement of crop and
to increase the use efficiency of chemical fertilisers,
under the INM scheme of MMM Programme 2005-06,
the demonstration on the use of bio-fertiliser in wheat
crop has been organised on the farmer field and an area
of 6000 hectares has been covered.
Marketing and storage facilities are the crucial
components of post-harvest technology. The Haryana
State Agricultural Marketing Board provides improved
and easily accessible market facilities for sale of produce
to the farmers in a regulated manner. At the time of
creation of this Board in 1969, there were only 58
principal yards and 60 sub-yards in the state. At
present, the Board has 106 principal yards and 178 Sub-
Yards and 175 purchase centres spread over the State.
Thus, the farmers have regular mandis all over the State
and due to this network of mandis, the farmers have to
cover only a distance of 6 to 8 kilometres to sell their
produce. As on 31st March 2005 the total storage
capacity of foodgrains in the State was 34.13 lakh
tonnes in covered godowns and 15.33 lakh tonnes in
open godowns.
The Central Government circulated a Model Act to
all the State Governments for carrying out amendments
in their respective APMC Acts. After careful study of
this Model Act it was found that contract farming,
direct marketing and setting up of markets by private
entrepreneurs and in cooperative sectors are the thrust
areas for reforms. Keeping in view this aspect, a bill has
already been passed by the Haryana Vidhan Sabha and
notified on 12 December 2005 thereby introducing
contract farming system in Haryana.
1.2.2 Horticulture
The importance of Horticulture in improving the
productivity of land, generating employment, improving
economic conditions of the farmers and entrepreneurs,
enhancing exports, and above all, providing nutritional
security to the people, is widely acknowledged.
Horticulture sector includes fruits, vegetables, spices,
floriculture, among others. Haryana is emerging very fast
as one of the leading States in the field of Horticulture.
The main thrust is being given for the development on
floriculture and mushrooms apart from fruits and
vegetables. With the adoption of these vocations more
employment opportunities are being generated resulting
in upliftment of the farming community. The area and
production under fruits stood at 12,640 hectares and
99.8 thousand tonnes, respectively, during 1990-91.
These figures have increased to 27,103 hectares and
2,36,200 tonnes, respectively, during 2005-06. Likewise,
the area under vegetables has also increased from 55,360
hectares in 1990-91 to 2,32,660 hectares in 2005-06. The
production of vegetables increased from 8,02,240 tonnes
in 1990-91 to 29,84,800 tonnes in 2005-06. The
commercial flower cultivation has also been taken up at
a large scale. The area under floriculture has increased
from 50 hectares during 1990-91 to 5418 hectares during
2005-2006. This period also witnessed remarkable growth
in mushroom production, which increased from 850
tonnes in 1990-91 to 6044 tonnes in 2005-06.
For raising disease free nursery and production of off-
season vegetables, the State is popularising green house
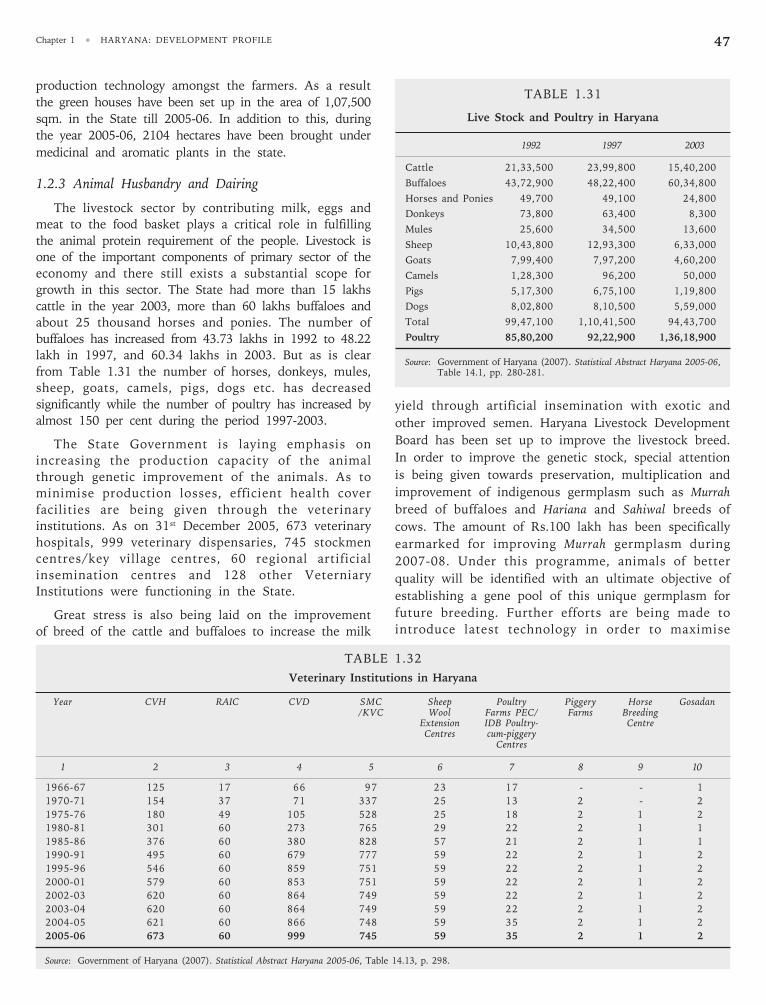
Chapter 1 • HARYANA: DEVELOPMENT PROFILE 47
production technology amongst the farmers. As a result
the green houses have been set up in the area of 1,07,500
sqm. in the State till 2005-06. In addition to this, during
the year 2005-06, 2104 hectares have been brought under
medicinal and aromatic plants in the state.
1.2.3 Animal Husbandry and Dairing
The livestock sector by contributing milk, eggs and
meat to the food basket plays a critical role in fulfilling
the animal protein requirement of the people. Livestock is
one of the important components of primary sector of the
economy and there still exists a substantial scope for
growth in this sector. The State had more than 15 lakhs
cattle in the year 2003, more than 60 lakhs buffaloes and
about 25 thousand horses and ponies. The number of
buffaloes has increased from 43.73 lakhs in 1992 to 48.22
lakh in 1997, and 60.34 lakhs in 2003. But as is clear
from Table 1.31 the number of horses, donkeys, mules,
sheep, goats, camels, pigs, dogs etc. has decreased
significantly while the number of poultry has increased by
almost 150 per cent during the period 1997-2003.
The State Government is laying emphasis on
increasing the production capacity of the animal
through genetic improvement of the animals. As to
minimise production losses, efficient health cover
facilities are being given through the veterinary
institutions. As on 31st December 2005, 673 veterinary
hospitals, 999 veterinary dispensaries, 745 stockmen
centres/key village centres, 60 regional artificial
insemination centres and 128 other Veterniary
Institutions were functioning in the State.
Great stress is also being laid on the improvement
of breed of the cattle and buffaloes to increase the milk
yield through artificial insemination with exotic and
other improved semen. Haryana Livestock Development
Board has been set up to improve the livestock breed.
In order to improve the genetic stock, special attention
is being given towards preservation, multiplication and
improvement of indigenous germplasm such as Murrah
breed of buffaloes and Hariana and Sahiwal breeds of
cows. The amount of Rs.100 lakh has been specifically
earmarked for improving Murrah germplasm during
2007-08. Under this programme, animals of better
quality will be identified with an ultimate objective of
establishing a gene pool of this unique germplasm for
future breeding. Further efforts are being made to
introduce latest technology in order to maximise
TABLE 1.32
Veterinary Institutions in Haryana
Year CVH RAIC CVD SMC Sheep Poultry Piggery Horse Gosadan/KVC Wool Farms PEC/ Farms Breeding
Extension IDB Poultry- CentreCentres cum-piggery
Centres
1 2 3 4 5 6 7 8 9 10
1966-67 125 17 66 97 23 17 - - 1
1970-71 154 37 71 337 25 13 2 - 2
1975-76 180 49 105 528 25 18 2 1 2
1980-81 301 60 273 765 29 22 2 1 1
1985-86 376 60 380 828 57 21 2 1 1
1990-91 495 60 679 777 59 22 2 1 2
1995-96 546 60 859 751 59 22 2 1 2
2000-01 579 60 853 751 59 22 2 1 2
2002-03 620 60 864 749 59 22 2 1 2
2003-04 620 60 864 749 59 22 2 1 2
2004-05 621 60 866 748 59 35 2 1 2
2005-06 673 60 999 745 59 35 2 1 2
Source: Government of Haryana (2007). Statistical Abstract Haryana 2005-06, Table 14.13, p. 298.
TABLE 1.31
Live Stock and Poultry in Haryana
1992 1997 2003
Cattle 21,33,500 23,99,800 15,40,200
Buffaloes 43,72,900 48,22,400 60,34,800
Horses and Ponies 49,700 49,100 24,800
Donkeys 73,800 63,400 8,300
Mules 25,600 34,500 13,600
Sheep 10,43,800 12,93,300 6,33,000
Goats 7,99,400 7,97,200 4,60,200
Camels 1,28,300 96,200 50,000
Pigs 5,17,300 6,75,100 1,19,800
Dogs 8,02,800 8,10,500 5,59,000
Total 99,47,100 1,10,41,500 94,43,700
Poultry 85,80,200 92,22,900 1,36,18,900
Source: Government of Haryana (2007). Statistical Abstract Haryana 2005-06,Table 14.1, pp. 280-281.
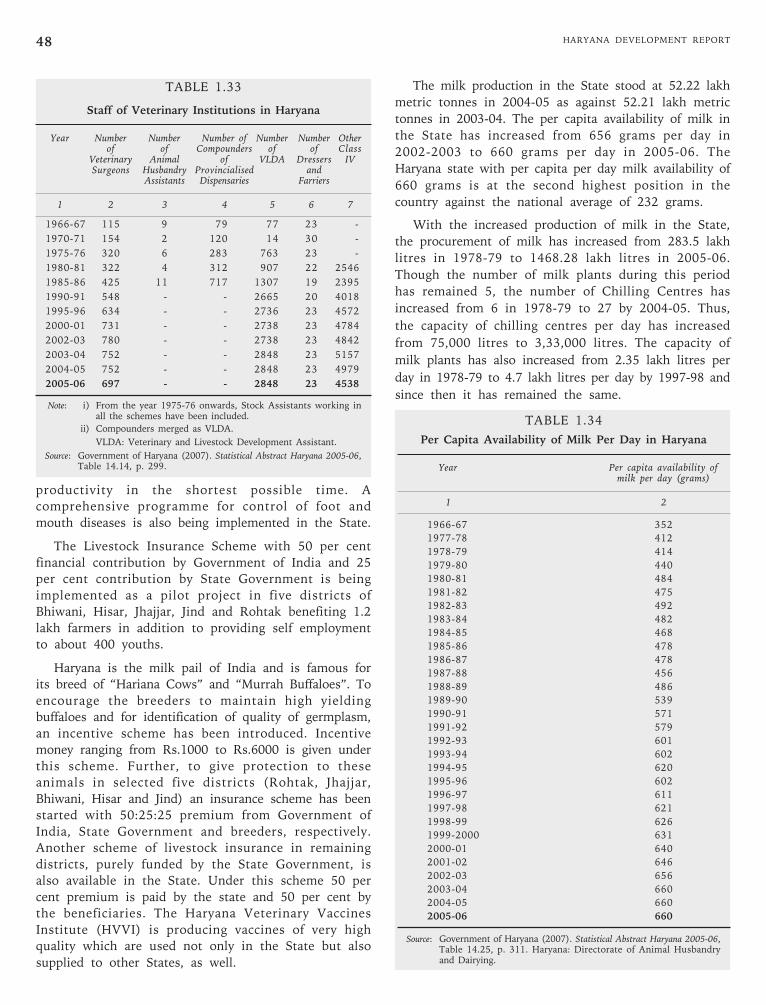
HARYANA DEVELOPMENT REPORT48
productivity in the shortest possible time. A
comprehensive programme for control of foot and
mouth diseases is also being implemented in the State.
The Livestock Insurance Scheme with 50 per cent
financial contribution by Government of India and 25
per cent contribution by State Government is being
implemented as a pilot project in five districts of
Bhiwani, Hisar, Jhajjar, Jind and Rohtak benefiting 1.2
lakh farmers in addition to providing self employment
to about 400 youths.
Haryana is the milk pail of India and is famous for
its breed of “Hariana Cows” and “Murrah Buffaloes”. To
encourage the breeders to maintain high yielding
buffaloes and for identification of quality of germplasm,
an incentive scheme has been introduced. Incentive
money ranging from Rs.1000 to Rs.6000 is given under
this scheme. Further, to give protection to these
animals in selected five districts (Rohtak, Jhajjar,
Bhiwani, Hisar and Jind) an insurance scheme has been
started with 50:25:25 premium from Government of
India, State Government and breeders, respectively.
Another scheme of livestock insurance in remaining
districts, purely funded by the State Government, is
also available in the State. Under this scheme 50 per
cent premium is paid by the state and 50 per cent by
the beneficiaries. The Haryana Veterinary Vaccines
Institute (HVVI) is producing vaccines of very high
quality which are used not only in the State but also
supplied to other States, as well.
The milk production in the State stood at 52.22 lakh
metric tonnes in 2004-05 as against 52.21 lakh metric
tonnes in 2003-04. The per capita availability of milk in
the State has increased from 656 grams per day in
2002-2003 to 660 grams per day in 2005-06. The
Haryana state with per capita per day milk availability of
660 grams is at the second highest position in the
country against the national average of 232 grams.
With the increased production of milk in the State,
the procurement of milk has increased from 283.5 lakh
litres in 1978-79 to 1468.28 lakh litres in 2005-06.
Though the number of milk plants during this period
has remained 5, the number of Chilling Centres has
increased from 6 in 1978-79 to 27 by 2004-05. Thus,
the capacity of chilling centres per day has increased
from 75,000 litres to 3,33,000 litres. The capacity of
milk plants has also increased from 2.35 lakh litres per
day in 1978-79 to 4.7 lakh litres per day by 1997-98 and
since then it has remained the same.
TABLE 1.33
Staff of Veterinary Institutions in Haryana
Year Number Number Number of Number Number Otherof of Compounders of of Class
Veterinary Animal of VLDA Dressers IVSurgeons Husbandry Provincialised and
Assistants Dispensaries Farriers
1 2 3 4 5 6 7
1966-67 115 9 79 77 23 -
1970-71 154 2 120 14 30 -
1975-76 320 6 283 763 23 -
1980-81 322 4 312 907 22 2546
1985-86 425 11 717 1307 19 2395
1990-91 548 - - 2665 20 4018
1995-96 634 - - 2736 23 4572
2000-01 731 - - 2738 23 4784
2002-03 780 - - 2738 23 4842
2003-04 752 - - 2848 23 5157
2004-05 752 - - 2848 23 4979
2005-06 697 - - 2848 23 4538
Note: i) From the year 1975-76 onwards, Stock Assistants working inall the schemes have been included.
ii) Compounders merged as VLDA.
VLDA: Veterinary and Livestock Development Assistant.
Source: Government of Haryana (2007). Statistical Abstract Haryana 2005-06,Table 14.14, p. 299.
TABLE 1.34
Per Capita Availability of Milk Per Day in Haryana
Year Per capita availability ofmilk per day (grams)
1 2
1966-67 352
1977-78 412
1978-79 414
1979-80 440
1980-81 484
1981-82 475
1982-83 492
1983-84 482
1984-85 468
1985-86 478
1986-87 478
1987-88 456
1988-89 486
1989-90 539
1990-91 571
1991-92 579
1992-93 601
1993-94 602
1994-95 620
1995-96 602
1996-97 611
1997-98 621
1998-99 626
1999-2000 631
2000-01 640
2001-02 646
2002-03 656
2003-04 660
2004-05 660
2005-06 660
Source: Government of Haryana (2007). Statistical Abstract Haryana 2005-06,Table 14.25, p. 311. Haryana: Directorate of Animal Husbandryand Dairying.
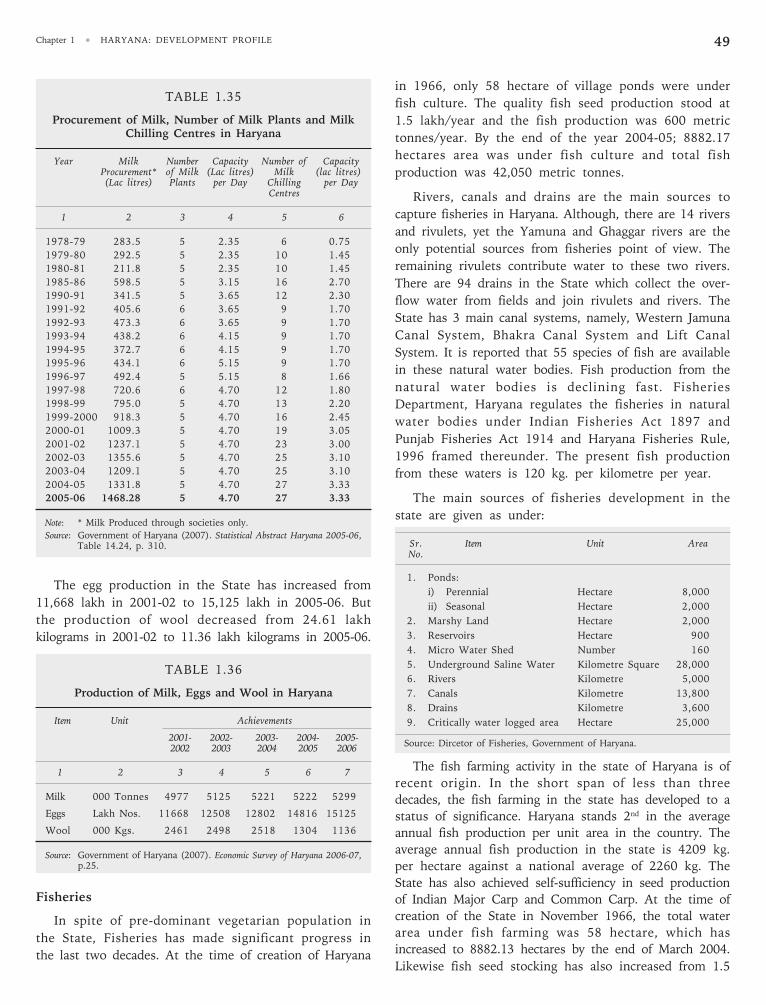
Chapter 1 • HARYANA: DEVELOPMENT PROFILE 49
TABLE 1.35
Procurement of Milk, Number of Milk Plants and MilkChilling Centres in Haryana
Year Milk Number Capacity Number of CapacityProcurement* of Milk (Lac litres) Milk (lac litres)(Lac litres) Plants per Day Chilling per Day
Centres
1 2 3 4 5 6
1978-79 283.5 5 2.35 6 0.75
1979-80 292.5 5 2.35 10 1.45
1980-81 211.8 5 2.35 10 1.45
1985-86 598.5 5 3.15 16 2.70
1990-91 341.5 5 3.65 12 2.30
1991-92 405.6 6 3.65 9 1.70
1992-93 473.3 6 3.65 9 1.70
1993-94 438.2 6 4.15 9 1.70
1994-95 372.7 6 4.15 9 1.70
1995-96 434.1 6 5.15 9 1.70
1996-97 492.4 5 5.15 8 1.66
1997-98 720.6 6 4.70 12 1.80
1998-99 795.0 5 4.70 13 2.20
1999-2000 918.3 5 4.70 16 2.45
2000-01 1009.3 5 4.70 19 3.05
2001-02 1237.1 5 4.70 23 3.00
2002-03 1355.6 5 4.70 25 3.10
2003-04 1209.1 5 4.70 25 3.10
2004-05 1331.8 5 4.70 27 3.33
2005-06 1468.28 5 4.70 27 3.33
Note: * Milk Produced through societies only.
Source: Government of Haryana (2007). Statistical Abstract Haryana 2005-06,Table 14.24, p. 310.
The egg production in the State has increased from
11,668 lakh in 2001-02 to 15,125 lakh in 2005-06. But
the production of wool decreased from 24.61 lakh
kilograms in 2001-02 to 11.36 lakh kilograms in 2005-06.
TABLE 1.36
Production of Milk, Eggs and Wool in Haryana
Item Unit Achievements
2001- 2002- 2003- 2004- 2005-2002 2003 2004 2005 2006
1 2 3 4 5 6 7
Milk 000 Tonnes 4977 5125 5221 5222 5299
Eggs Lakh Nos. 11668 12508 12802 14816 15125
Wool 000 Kgs. 2461 2498 2518 1304 1136
Source: Government of Haryana (2007). Economic Survey of Haryana 2006-07,p.25.
Fisheries
In spite of pre-dominant vegetarian population in
the State, Fisheries has made significant progress in
the last two decades. At the time of creation of Haryana
in 1966, only 58 hectare of village ponds were under
fish culture. The quality fish seed production stood at
1.5 lakh/year and the fish production was 600 metric
tonnes/year. By the end of the year 2004-05; 8882.17
hectares area was under fish culture and total fish
production was 42,050 metric tonnes.
Rivers, canals and drains are the main sources to
capture fisheries in Haryana. Although, there are 14 rivers
and rivulets, yet the Yamuna and Ghaggar rivers are the
only potential sources from fisheries point of view. The
remaining rivulets contribute water to these two rivers.
There are 94 drains in the State which collect the over-
flow water from fields and join rivulets and rivers. The
State has 3 main canal systems, namely, Western Jamuna
Canal System, Bhakra Canal System and Lift Canal
System. It is reported that 55 species of fish are available
in these natural water bodies. Fish production from the
natural water bodies is declining fast. Fisheries
Department, Haryana regulates the fisheries in natural
water bodies under Indian Fisheries Act 1897 and
Punjab Fisheries Act 1914 and Haryana Fisheries Rule,
1996 framed thereunder. The present fish production
from these waters is 120 kg. per kilometre per year.
The main sources of fisheries development in the
state are given as under:
Sr. Item Unit AreaNo.
1. Ponds:
i) Perennial Hectare 8,000
ii) Seasonal Hectare 2,000
2. Marshy Land Hectare 2,000
3. Reservoirs Hectare 900
4. Micro Water Shed Number 160
5. Underground Saline Water Kilometre Square 28,000
6. Rivers Kilometre 5,000
7. Canals Kilometre 13,800
8. Drains Kilometre 3,600
9. Critically water logged area Hectare 25,000
Source: Dircetor of Fisheries, Government of Haryana.
The fish farming activity in the state of Haryana is of
recent origin. In the short span of less than three
decades, the fish farming in the state has developed to a
status of significance. Haryana stands 2nd in the average
annual fish production per unit area in the country. The
average annual fish production in the state is 4209 kg.
per hectare against a national average of 2260 kg. The
State has also achieved self-sufficiency in seed production
of Indian Major Carp and Common Carp. At the time of
creation of the State in November 1966, the total water
area under fish farming was 58 hectare, which has
increased to 8882.13 hectares by the end of March 2004.
Likewise fish seed stocking has also increased from 1.5
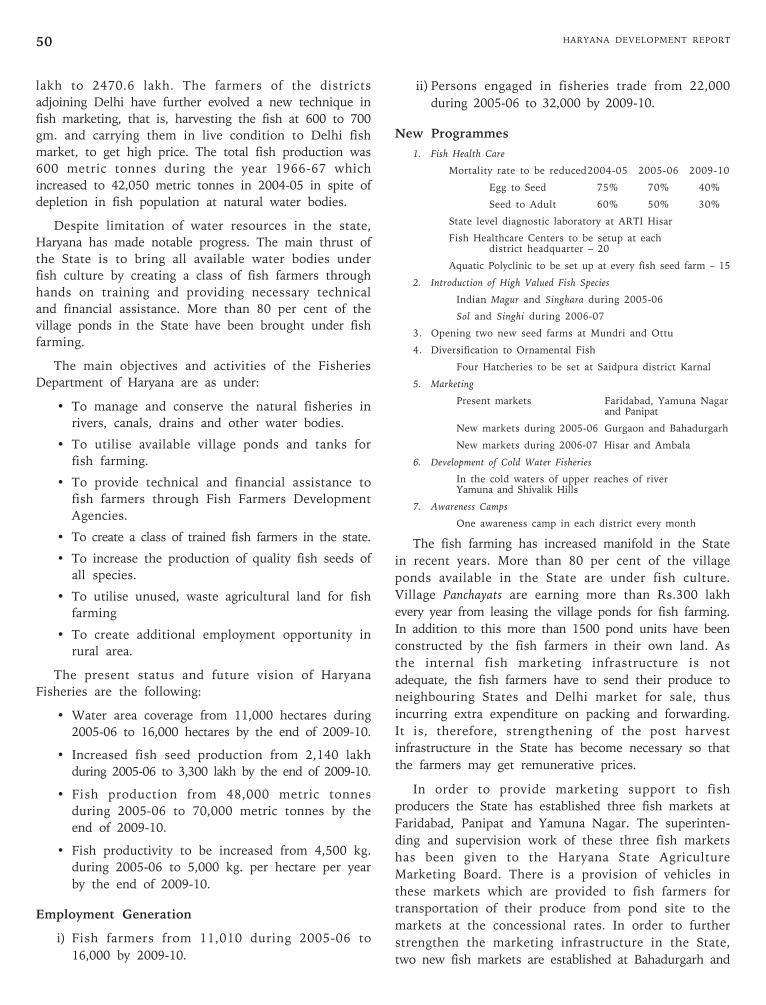
HARYANA DEVELOPMENT REPORT50
lakh to 2470.6 lakh. The farmers of the districts
adjoining Delhi have further evolved a new technique in
fish marketing, that is, harvesting the fish at 600 to 700
gm. and carrying them in live condition to Delhi fish
market, to get high price. The total fish production was
600 metric tonnes during the year 1966-67 which
increased to 42,050 metric tonnes in 2004-05 in spite of
depletion in fish population at natural water bodies.
Despite limitation of water resources in the state,
Haryana has made notable progress. The main thrust of
the State is to bring all available water bodies under
fish culture by creating a class of fish farmers through
hands on training and providing necessary technical
and financial assistance. More than 80 per cent of the
village ponds in the State have been brought under fish
farming.
The main objectives and activities of the Fisheries
Department of Haryana are as under:
• To manage and conserve the natural fisheries in
rivers, canals, drains and other water bodies.
• To utilise available village ponds and tanks for
fish farming.
• To provide technical and financial assistance to
fish farmers through Fish Farmers Development
Agencies.
• To create a class of trained fish farmers in the state.
• To increase the production of quality fish seeds of
all species.
• To utilise unused, waste agricultural land for fish
farming
• To create additional employment opportunity in
rural area.
The present status and future vision of Haryana
Fisheries are the following:
• Water area coverage from 11,000 hectares during
2005-06 to 16,000 hectares by the end of 2009-10.
• Increased fish seed production from 2,140 lakh
during 2005-06 to 3,300 lakh by the end of 2009-10.
• Fish production from 48,000 metric tonnes
during 2005-06 to 70,000 metric tonnes by the
end of 2009-10.
• Fish productivity to be increased from 4,500 kg.
during 2005-06 to 5,000 kg. per hectare per year
by the end of 2009-10.
Employment Generation
i) Fish farmers from 11,010 during 2005-06 to
16,000 by 2009-10.
ii) Persons engaged in fisheries trade from 22,000
during 2005-06 to 32,000 by 2009-10.
New Programmes
1. Fish Health Care
Mortality rate to be reduced2004-05 2005-06 2009-10
Egg to Seed 75% 70% 40%
Seed to Adult 60% 50% 30%
State level diagnostic laboratory at ARTI Hisar
Fish Healthcare Centers to be setup at eachdistrict headquarter – 20
Aquatic Polyclinic to be set up at every fish seed farm – 15
2. Introduction of High Valued Fish Species
Indian Magur and Singhara during 2005-06
Sol and Singhi during 2006-07
3. Opening two new seed farms at Mundri and Ottu
4. Diversification to Ornamental Fish
Four Hatcheries to be set at Saidpura district Karnal
5. Marketing
Present markets Faridabad, Yamuna Nagarand Panipat
New markets during 2005-06 Gurgaon and Bahadurgarh
New markets during 2006-07 Hisar and Ambala
6. Development of Cold Water Fisheries
In the cold waters of upper reaches of riverYamuna and Shivalik Hills
7. Awareness Camps
One awareness camp in each district every month
The fish farming has increased manifold in the State
in recent years. More than 80 per cent of the village
ponds available in the State are under fish culture.
Village Panchayats are earning more than Rs.300 lakh
every year from leasing the village ponds for fish farming.
In addition to this more than 1500 pond units have been
constructed by the fish farmers in their own land. As
the internal fish marketing infrastructure is not
adequate, the fish farmers have to send their produce to
neighbouring States and Delhi market for sale, thus
incurring extra expenditure on packing and forwarding.
It is, therefore, strengthening of the post harvest
infrastructure in the State has become necessary so that
the farmers may get remunerative prices.
In order to provide marketing support to fish
producers the State has established three fish markets at
Faridabad, Panipat and Yamuna Nagar. The superinten-
ding and supervision work of these three fish markets
has been given to the Haryana State Agriculture
Marketing Board. There is a provision of vehicles in
these markets which are provided to fish farmers for
transportation of their produce from pond site to the
markets at the concessional rates. In order to further
strengthen the marketing infrastructure in the State,
two new fish markets are established at Bahadurgarh and
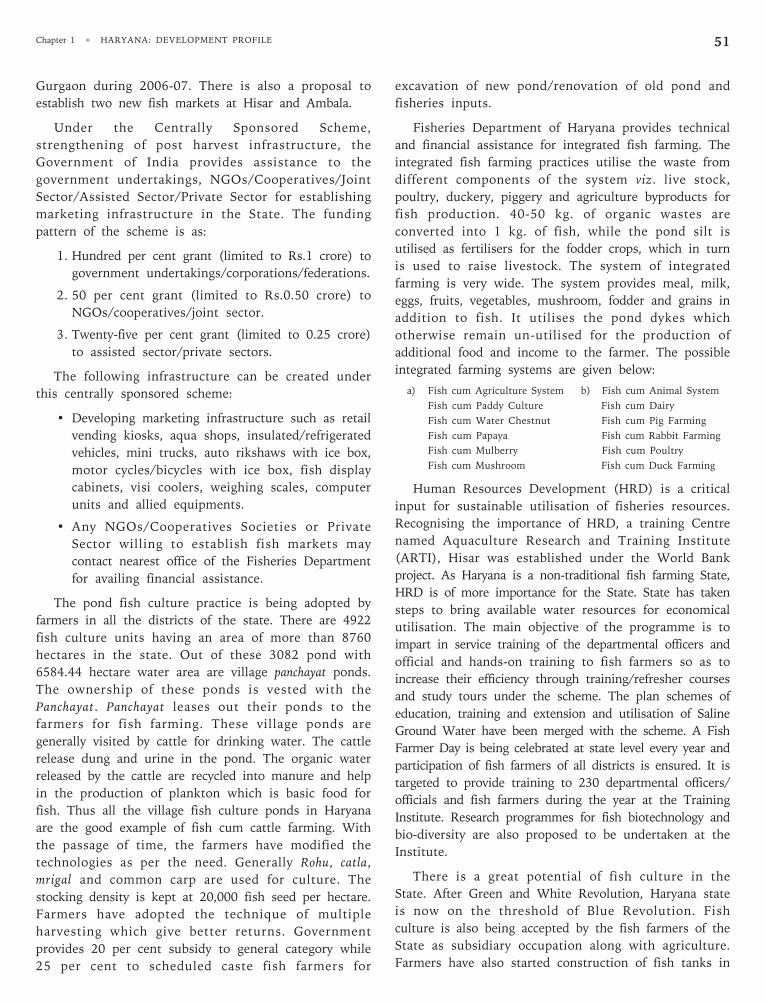
Chapter 1 • HARYANA: DEVELOPMENT PROFILE 51
Gurgaon during 2006-07. There is also a proposal to
establish two new fish markets at Hisar and Ambala.
Under the Centrally Sponsored Scheme,
strengthening of post harvest infrastructure, the
Government of India provides assistance to the
government undertakings, NGOs/Cooperatives/Joint
Sector/Assisted Sector/Private Sector for establishing
marketing infrastructure in the State. The funding
pattern of the scheme is as:
1. Hundred per cent grant (limited to Rs.1 crore) to
government undertakings/corporations/federations.
2. 50 per cent grant (limited to Rs.0.50 crore) to
NGOs/cooperatives/joint sector.
3. Twenty-five per cent grant (limited to 0.25 crore)
to assisted sector/private sectors.
The following infrastructure can be created under
this centrally sponsored scheme:
• Developing marketing infrastructure such as retail
vending kiosks, aqua shops, insulated/refrigerated
vehicles, mini trucks, auto rikshaws with ice box,
motor cycles/bicycles with ice box, fish display
cabinets, visi coolers, weighing scales, computer
units and allied equipments.
• Any NGOs/Cooperatives Societies or Private
Sector willing to establish fish markets may
contact nearest office of the Fisheries Department
for availing financial assistance.
The pond fish culture practice is being adopted by
farmers in all the districts of the state. There are 4922
fish culture units having an area of more than 8760
hectares in the state. Out of these 3082 pond with
6584.44 hectare water area are village panchayat ponds.
The ownership of these ponds is vested with the
Panchayat. Panchayat leases out their ponds to the
farmers for fish farming. These village ponds are
generally visited by cattle for drinking water. The cattle
release dung and urine in the pond. The organic water
released by the cattle are recycled into manure and help
in the production of plankton which is basic food for
fish. Thus all the village fish culture ponds in Haryana
are the good example of fish cum cattle farming. With
the passage of time, the farmers have modified the
technologies as per the need. Generally Rohu, catla,
mrigal and common carp are used for culture. The
stocking density is kept at 20,000 fish seed per hectare.
Farmers have adopted the technique of multiple
harvesting which give better returns. Government
provides 20 per cent subsidy to general category while
25 per cent to scheduled caste fish farmers for
excavation of new pond/renovation of old pond and
fisheries inputs.
Fisheries Department of Haryana provides technical
and financial assistance for integrated fish farming. The
integrated fish farming practices utilise the waste from
different components of the system viz. live stock,
poultry, duckery, piggery and agriculture byproducts for
fish production. 40-50 kg. of organic wastes are
converted into 1 kg. of fish, while the pond silt is
utilised as fertilisers for the fodder crops, which in turn
is used to raise livestock. The system of integrated
farming is very wide. The system provides meal, milk,
eggs, fruits, vegetables, mushroom, fodder and grains in
addition to fish. It utilises the pond dykes which
otherwise remain un-utilised for the production of
additional food and income to the farmer. The possible
integrated farming systems are given below:
a) Fish cum Agriculture System b) Fish cum Animal System
Fish cum Paddy Culture Fish cum Dairy
Fish cum Water Chestnut Fish cum Pig Farming
Fish cum Papaya Fish cum Rabbit Farming
Fish cum Mulberry Fish cum Poultry
Fish cum Mushroom Fish cum Duck Farming
Human Resources Development (HRD) is a critical
input for sustainable utilisation of fisheries resources.
Recognising the importance of HRD, a training Centre
named Aquaculture Research and Training Institute
(ARTI), Hisar was established under the World Bank
project. As Haryana is a non-traditional fish farming State,
HRD is of more importance for the State. State has taken
steps to bring available water resources for economical
utilisation. The main objective of the programme is to
impart in service training of the departmental officers and
official and hands-on training to fish farmers so as to
increase their efficiency through training/refresher courses
and study tours under the scheme. The plan schemes of
education, training and extension and utilisation of Saline
Ground Water have been merged with the scheme. A Fish
Farmer Day is being celebrated at state level every year and
participation of fish farmers of all districts is ensured. It is
targeted to provide training to 230 departmental officers/
officials and fish farmers during the year at the Training
Institute. Research programmes for fish biotechnology and
bio-diversity are also proposed to be undertaken at the
Institute.
There is a great potential of fish culture in the
State. After Green and White Revolution, Haryana state
is now on the threshold of Blue Revolution. Fish
culture is also being accepted by the fish farmers of the
State as subsidiary occupation along with agriculture.
Farmers have also started construction of fish tanks in
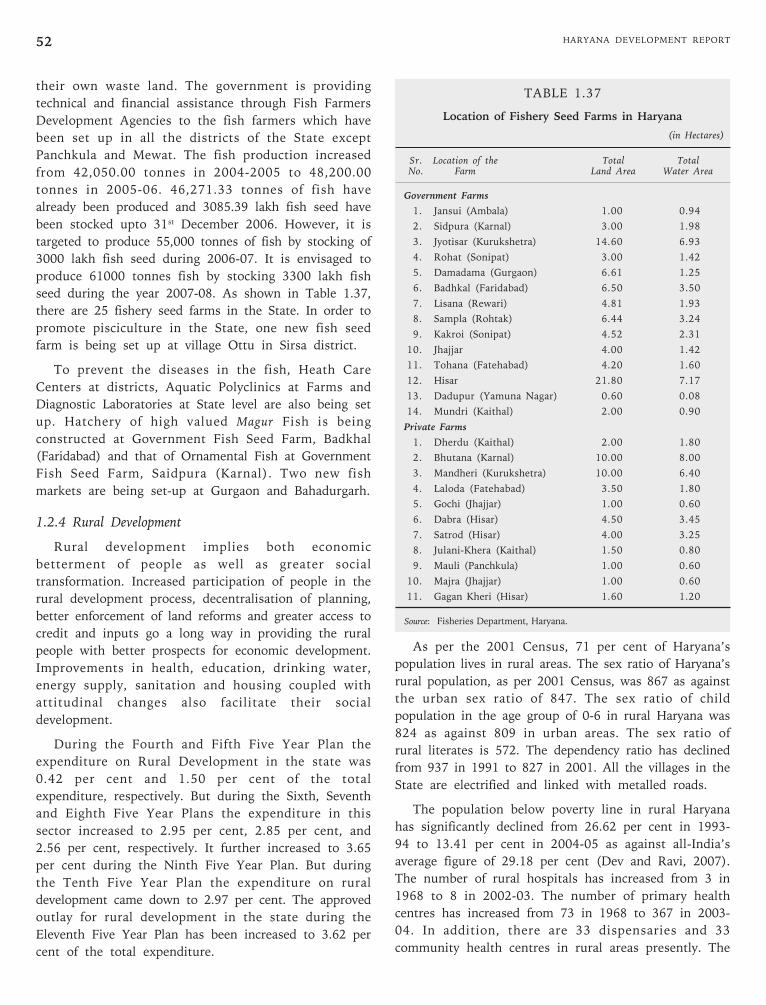
HARYANA DEVELOPMENT REPORT52
their own waste land. The government is providing
technical and financial assistance through Fish Farmers
Development Agencies to the fish farmers which have
been set up in all the districts of the State except
Panchkula and Mewat. The fish production increased
from 42,050.00 tonnes in 2004-2005 to 48,200.00
tonnes in 2005-06. 46,271.33 tonnes of fish have
already been produced and 3085.39 lakh fish seed have
been stocked upto 31st December 2006. However, it is
targeted to produce 55,000 tonnes of fish by stocking of
3000 lakh fish seed during 2006-07. It is envisaged to
produce 61000 tonnes fish by stocking 3300 lakh fish
seed during the year 2007-08. As shown in Table 1.37,
there are 25 fishery seed farms in the State. In order to
promote pisciculture in the State, one new fish seed
farm is being set up at village Ottu in Sirsa district.
To prevent the diseases in the fish, Heath Care
Centers at districts, Aquatic Polyclinics at Farms and
Diagnostic Laboratories at State level are also being set
up. Hatchery of high valued Magur Fish is being
constructed at Government Fish Seed Farm, Badkhal
(Faridabad) and that of Ornamental Fish at Government
Fish Seed Farm, Saidpura (Karnal). Two new fish
markets are being set-up at Gurgaon and Bahadurgarh.
1.2.4 Rural Development
Rural development implies both economic
betterment of people as well as greater social
transformation. Increased participation of people in the
rural development process, decentralisation of planning,
better enforcement of land reforms and greater access to
credit and inputs go a long way in providing the rural
people with better prospects for economic development.
Improvements in health, education, drinking water,
energy supply, sanitation and housing coupled with
attitudinal changes also facilitate their social
development.
During the Fourth and Fifth Five Year Plan the
expenditure on Rural Development in the state was
0.42 per cent and 1.50 per cent of the total
expenditure, respectively. But during the Sixth, Seventh
and Eighth Five Year Plans the expenditure in this
sector increased to 2.95 per cent, 2.85 per cent, and
2.56 per cent, respectively. It further increased to 3.65
per cent during the Ninth Five Year Plan. But during
the Tenth Five Year Plan the expenditure on rural
development came down to 2.97 per cent. The approved
outlay for rural development in the state during the
Eleventh Five Year Plan has been increased to 3.62 per
cent of the total expenditure.
As per the 2001 Census, 71 per cent of Haryana’s
population lives in rural areas. The sex ratio of Haryana’s
rural population, as per 2001 Census, was 867 as against
the urban sex ratio of 847. The sex ratio of child
population in the age group of 0-6 in rural Haryana was
824 as against 809 in urban areas. The sex ratio of
rural literates is 572. The dependency ratio has declined
from 937 in 1991 to 827 in 2001. All the villages in the
State are electrified and linked with metalled roads.
The population below poverty line in rural Haryana
has significantly declined from 26.62 per cent in 1993-
94 to 13.41 per cent in 2004-05 as against all-India’s
average figure of 29.18 per cent (Dev and Ravi, 2007).
The number of rural hospitals has increased from 3 in
1968 to 8 in 2002-03. The number of primary health
centres has increased from 73 in 1968 to 367 in 2003-
04. In addition, there are 33 dispensaries and 33
community health centres in rural areas presently. The
TABLE 1.37
Location of Fishery Seed Farms in Haryana
(in Hectares)
Sr. Location of the Total TotalNo. Farm Land Area Water Area
Government Farms
1. Jansui (Ambala) 1.00 0.94
2. Sidpura (Karnal) 3.00 1.98
3. Jyotisar (Kurukshetra) 14.60 6.93
4. Rohat (Sonipat) 3.00 1.42
5. Damadama (Gurgaon) 6.61 1.25
6. Badhkal (Faridabad) 6.50 3.50
7. Lisana (Rewari) 4.81 1.93
8. Sampla (Rohtak) 6.44 3.24
9. Kakroi (Sonipat) 4.52 2.31
10. Jhajjar 4.00 1.42
11. Tohana (Fatehabad) 4.20 1.60
12. Hisar 21.80 7.17
13. Dadupur (Yamuna Nagar) 0.60 0.08
14. Mundri (Kaithal) 2.00 0.90
Private Farms
1. Dherdu (Kaithal) 2.00 1.80
2. Bhutana (Karnal) 10.00 8.00
3. Mandheri (Kurukshetra) 10.00 6.40
4. Laloda (Fatehabad) 3.50 1.80
5. Gochi (Jhajjar) 1.00 0.60
6. Dabra (Hisar) 4.50 3.45
7. Satrod (Hisar) 4.00 3.25
8. Julani-Khera (Kaithal) 1.50 0.80
9. Mauli (Panchkula) 1.00 0.60
10. Majra (Jhajjar) 1.00 0.60
11. Gagan Kheri (Hisar) 1.60 1.20
Source: Fisheries Department, Haryana.
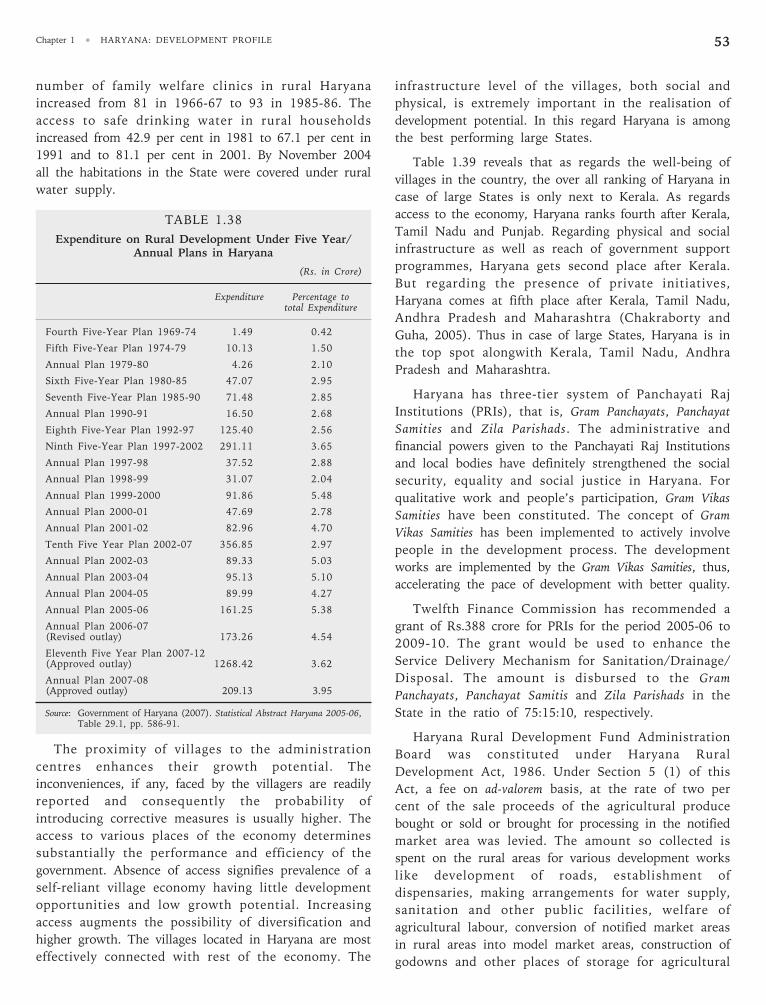
Chapter 1 • HARYANA: DEVELOPMENT PROFILE 53
number of family welfare clinics in rural Haryana
increased from 81 in 1966-67 to 93 in 1985-86. The
access to safe drinking water in rural households
increased from 42.9 per cent in 1981 to 67.1 per cent in
1991 and to 81.1 per cent in 2001. By November 2004
all the habitations in the State were covered under rural
water supply.
TABLE 1.38
Expenditure on Rural Development Under Five Year/Annual Plans in Haryana
(Rs. in Crore)
Expenditure Percentage tototal Expenditure
Fourth Five-Year Plan 1969-74 1.49 0.42
Fifth Five-Year Plan 1974-79 10.13 1.50
Annual Plan 1979-80 4.26 2.10
Sixth Five-Year Plan 1980-85 47.07 2.95
Seventh Five-Year Plan 1985-90 71.48 2.85
Annual Plan 1990-91 16.50 2.68
Eighth Five-Year Plan 1992-97 125.40 2.56
Ninth Five-Year Plan 1997-2002 291.11 3.65
Annual Plan 1997-98 37.52 2.88
Annual Plan 1998-99 31.07 2.04
Annual Plan 1999-2000 91.86 5.48
Annual Plan 2000-01 47.69 2.78
Annual Plan 2001-02 82.96 4.70
Tenth Five Year Plan 2002-07 356.85 2.97
Annual Plan 2002-03 89.33 5.03
Annual Plan 2003-04 95.13 5.10
Annual Plan 2004-05 89.99 4.27
Annual Plan 2005-06 161.25 5.38
Annual Plan 2006-07(Revised outlay) 173.26 4.54
Eleventh Five Year Plan 2007-12(Approved outlay) 1268.42 3.62
Annual Plan 2007-08(Approved outlay) 209.13 3.95
Source: Government of Haryana (2007). Statistical Abstract Haryana 2005-06,Table 29.1, pp. 586-91.
The proximity of villages to the administration
centres enhances their growth potential. The
inconveniences, if any, faced by the villagers are readily
reported and consequently the probability of
introducing corrective measures is usually higher. The
access to various places of the economy determines
substantially the performance and efficiency of the
government. Absence of access signifies prevalence of a
self-reliant village economy having little development
opportunities and low growth potential. Increasing
access augments the possibility of diversification and
higher growth. The villages located in Haryana are most
effectively connected with rest of the economy. The
infrastructure level of the villages, both social and
physical, is extremely important in the realisation of
development potential. In this regard Haryana is among
the best performing large States.
Table 1.39 reveals that as regards the well-being of
villages in the country, the over all ranking of Haryana in
case of large States is only next to Kerala. As regards
access to the economy, Haryana ranks fourth after Kerala,
Tamil Nadu and Punjab. Regarding physical and social
infrastructure as well as reach of government support
programmes, Haryana gets second place after Kerala.
But regarding the presence of private initiatives,
Haryana comes at fifth place after Kerala, Tamil Nadu,
Andhra Pradesh and Maharashtra (Chakraborty and
Guha, 2005). Thus in case of large States, Haryana is in
the top spot alongwith Kerala, Tamil Nadu, Andhra
Pradesh and Maharashtra.
Haryana has three-tier system of Panchayati Raj
Institutions (PRIs), that is, Gram Panchayats, Panchayat
Samities and Zila Parishads. The administrative and
financial powers given to the Panchayati Raj Institutions
and local bodies have definitely strengthened the social
security, equality and social justice in Haryana. For
qualitative work and people’s participation, Gram Vikas
Samities have been constituted. The concept of Gram
Vikas Samities has been implemented to actively involve
people in the development process. The development
works are implemented by the Gram Vikas Samities, thus,
accelerating the pace of development with better quality.
Twelfth Finance Commission has recommended a
grant of Rs.388 crore for PRIs for the period 2005-06 to
2009-10. The grant would be used to enhance the
Service Delivery Mechanism for Sanitation/Drainage/
Disposal. The amount is disbursed to the Gram
Panchayats, Panchayat Samitis and Zila Parishads in the
State in the ratio of 75:15:10, respectively.
Haryana Rural Development Fund Administration
Board was constituted under Haryana Rural
Development Act, 1986. Under Section 5 (1) of this
Act, a fee on ad-valorem basis, at the rate of two per
cent of the sale proceeds of the agricultural produce
bought or sold or brought for processing in the notified
market area was levied. The amount so collected is
spent on the rural areas for various development works
like development of roads, establishment of
dispensaries, making arrangements for water supply,
sanitation and other public facilities, welfare of
agricultural labour, conversion of notified market areas
in rural areas into model market areas, construction of
godowns and other places of storage for agricultural
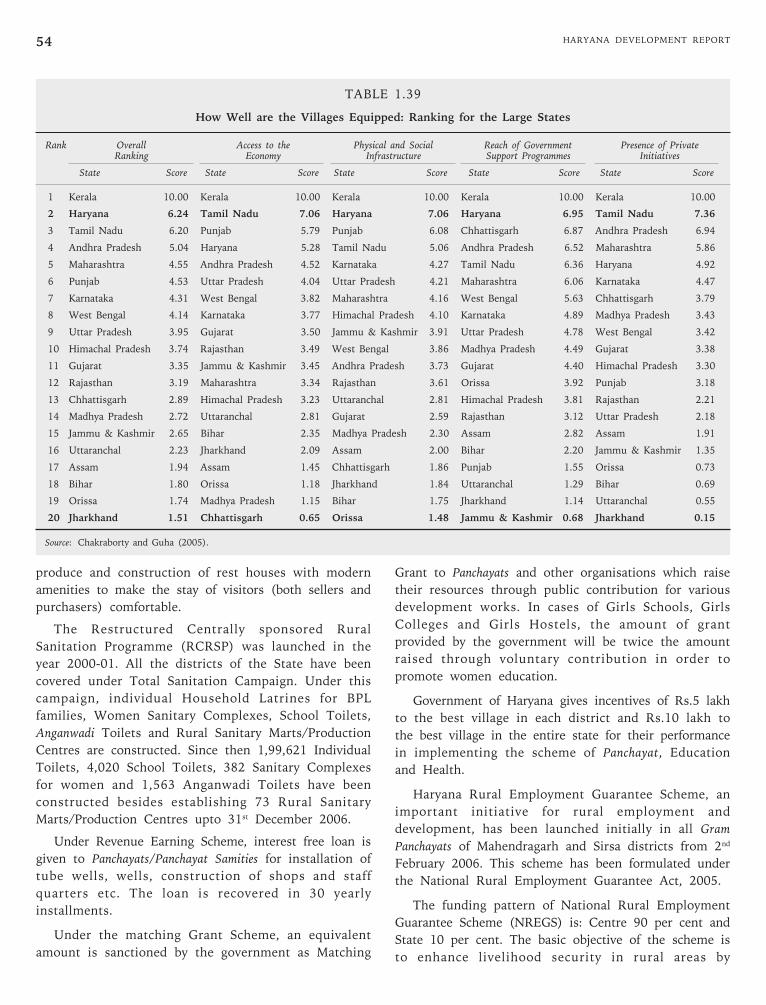
HARYANA DEVELOPMENT REPORT54
produce and construction of rest houses with modern
amenities to make the stay of visitors (both sellers and
purchasers) comfortable.
The Restructured Centrally sponsored Rural
Sanitation Programme (RCRSP) was launched in the
year 2000-01. All the districts of the State have been
covered under Total Sanitation Campaign. Under this
campaign, individual Household Latrines for BPL
families, Women Sanitary Complexes, School Toilets,
Anganwadi Toilets and Rural Sanitary Marts/Production
Centres are constructed. Since then 1,99,621 Individual
Toilets, 4,020 School Toilets, 382 Sanitary Complexes
for women and 1,563 Anganwadi Toilets have been
constructed besides establishing 73 Rural Sanitary
Marts/Production Centres upto 31st December 2006.
Under Revenue Earning Scheme, interest free loan is
given to Panchayats/Panchayat Samities for installation of
tube wells, wells, construction of shops and staff
quarters etc. The loan is recovered in 30 yearly
installments.
Under the matching Grant Scheme, an equivalent
amount is sanctioned by the government as Matching
Grant to Panchayats and other organisations which raise
their resources through public contribution for various
development works. In cases of Girls Schools, Girls
Colleges and Girls Hostels, the amount of grant
provided by the government will be twice the amount
raised through voluntary contribution in order to
promote women education.
Government of Haryana gives incentives of Rs.5 lakh
to the best village in each district and Rs.10 lakh to
the best village in the entire state for their performance
in implementing the scheme of Panchayat, Education
and Health.
Haryana Rural Employment Guarantee Scheme, an
important initiative for rural employment and
development, has been launched initially in all Gram
Panchayats of Mahendragarh and Sirsa districts from 2nd
February 2006. This scheme has been formulated under
the National Rural Employment Guarantee Act, 2005.
The funding pattern of National Rural Employment
Guarantee Scheme (NREGS) is: Centre 90 per cent and
State 10 per cent. The basic objective of the scheme is
to enhance livelihood security in rural areas by
TABLE 1.39
How Well are the Villages Equipped: Ranking for the Large States
Rank Overall Access to the Physical and Social Reach of Government Presence of PrivateRanking Economy Infrastructure Support Programmes Initiatives
State Score State Score State Score State Score State Score
1 Kerala 10.00 Kerala 10.00 Kerala 10.00 Kerala 10.00 Kerala 10.00
2 Haryana 6.24 Tamil Nadu 7.06 Haryana 7.06 Haryana 6.95 Tamil Nadu 7.36
3 Tamil Nadu 6.20 Punjab 5.79 Punjab 6.08 Chhattisgarh 6.87 Andhra Pradesh 6.94
4 Andhra Pradesh 5.04 Haryana 5.28 Tamil Nadu 5.06 Andhra Pradesh 6.52 Maharashtra 5.86
5 Maharashtra 4.55 Andhra Pradesh 4.52 Karnataka 4.27 Tamil Nadu 6.36 Haryana 4.92
6 Punjab 4.53 Uttar Pradesh 4.04 Uttar Pradesh 4.21 Maharashtra 6.06 Karnataka 4.47
7 Karnataka 4.31 West Bengal 3.82 Maharashtra 4.16 West Bengal 5.63 Chhattisgarh 3.79
8 West Bengal 4.14 Karnataka 3.77 Himachal Pradesh 4.10 Karnataka 4.89 Madhya Pradesh 3.43
9 Uttar Pradesh 3.95 Gujarat 3.50 Jammu & Kashmir 3.91 Uttar Pradesh 4.78 West Bengal 3.42
10 Himachal Pradesh 3.74 Rajasthan 3.49 West Bengal 3.86 Madhya Pradesh 4.49 Gujarat 3.38
11 Gujarat 3.35 Jammu & Kashmir 3.45 Andhra Pradesh 3.73 Gujarat 4.40 Himachal Pradesh 3.30
12 Rajasthan 3.19 Maharashtra 3.34 Rajasthan 3.61 Orissa 3.92 Punjab 3.18
13 Chhattisgarh 2.89 Himachal Pradesh 3.23 Uttaranchal 2.81 Himachal Pradesh 3.81 Rajasthan 2.21
14 Madhya Pradesh 2.72 Uttaranchal 2.81 Gujarat 2.59 Rajasthan 3.12 Uttar Pradesh 2.18
15 Jammu & Kashmir 2.65 Bihar 2.35 Madhya Pradesh 2.30 Assam 2.82 Assam 1.91
16 Uttaranchal 2.23 Jharkhand 2.09 Assam 2.00 Bihar 2.20 Jammu & Kashmir 1.35
17 Assam 1.94 Assam 1.45 Chhattisgarh 1.86 Punjab 1.55 Orissa 0.73
18 Bihar 1.80 Orissa 1.18 Jharkhand 1.84 Uttaranchal 1.29 Bihar 0.69
19 Orissa 1.74 Madhya Pradesh 1.15 Bihar 1.75 Jharkhand 1.14 Uttaranchal 0.55
20 Jharkhand 1.51 Chhattisgarh 0.65 Orissa 1.48 Jammu & Kashmir 0.68 Jharkhand 0.15
Source: Chakraborty and Guha (2005).
Chapter 1 • HARYANA: DEVELOPMENT PROFILE 55
providing at least 100 days of guaranteed wage
employment in a financial year to every household
whose adult members volunteer to do unskilled manual
work.
The scheme is applicable only to rural areas. One
third of the jobs are reserved for women. Minimum
wages applicable in the state are payable to the persons
employed. Unemployed persons are to apply for
registration with concerned Gram Panchayats. After
registration, Job Cards are issued to the households by
the Gram Panchayats. The payment of wages is being
made on weekly or fortnightly basis. The contractors
are banned under this programme.
The following works are permissible under NREGS:
i) water conservation and water harvesting;
ii) drought proofing (including afforestation and
tree plantation);
iii) irrigation canals including micro and minor
irrigation works;
iv) provision of irrigation facility to land owned by
households belonging to the Scheduled Castes
and Scheduled Tribes or to land beneficiaries
of land reforms or that of the beneficiaries
under the Indira Awaas Yojana of the
Government of India;
v) renovation of traditional water bodies
including desilting of tanks;
vi) land development;
vii) flood control and protection works including
drainage in water logged areas;
viii) rural connectivity to provide all-weather
access; and
ix) any other work which may be notified by the
Central Government in consultation with the
State Government.
The programme is being implemented through the
Gram Panchayats. The Annual Action Plans are also
sanctioned by PRIs.
The Desert Development Programme (DDP) has been
launched by Government of India during the year 1995-
96 in 45 blocks of districts Bhiwani, Hisar, Fatehabad,
Sirsa, Jhajjar, Rewari and Mohindergarh. The funding
pattern of the Desert Development Programme (DDP)
is: Central Government 75 per cent and State
Government 25 per cent.
The objective of DDP is to control the severity of
drought and desert conditions and to bring ecological
balance by having integrated development of soil and
moisture conservation including land shaping and
development, dry land farming, water resource
development and afforestation and pasture development on
watershed development approach in an integrated manner.
The Government of India has sanctioned 1030
watersheds from 1995-96 to 2005-06. The norms of
Watershed Development Project has now been fixed as
Rs.6,000 per hectare for the development of 500 hectare
area of each watershed. Thus, on an average, the cost of
each watershed is Rs.30.00 lakh for development in a
normal period of five years. The programme is now
governed by the guidelines on Hariyali prescribed by the
Government of India.
Integrated Wasteland Development Programme
(IWDP) is aimed at an integrated wastelands
development based on village/micro watershed plans.
These plans are prepared after taking into consideration
the land capability, site condition and local needs of the
people. The following major activities can be taken up
under this programme:
1. Soil and moisture conservation measures.
2. Planting and sowing of multi purpose trees.
3. Encouraging natural regeneration.
4. Promotion of agro forestry and horticulture.
5. Measures needed to desseminate technology.
6. Encouraging people participation.
The IWDP projects are sanctioned by Government of
India in the non D.D.P. districts each year. The cost
norm of Rs.6,000 per hectare is also applicable while
sanctioning assistance under IWDP.
Public Distribution System (PDS) is the chief
instrument for meeting twin objectives of price stability
and ensuring availability of essential commodities at
easily affordable prices especially for the poor. At the
time of creation of Haryana, PDS was of a very small
size having only 988 fair price shops in rural areas.
However, with the passage of time, it has expanded to
almost every nook and corner of the State. It has been
reorganised and streamlined from time to time to
accommodate human needs. As on 30th of November
2005, there was a big network of 6076 fair price shops
in the rural areas. At present, under the “Targetted
Public Distribution System” scheme, 25 kilograms of
wheat and 10 kilograms of rice per month is being
made available to the below poverty line families at a
subsidised rate.
HARYANA DEVELOPMENT REPORT56
Cooperation
Cooperative Movement is an effective instrument of
economic and social reform. It has played a highly
significant role particularly in the sphere of agricultural
credit and marketing. The Cooperatives in the State have
amply demonstrated their strength in several fields of
rural economy. There are 22,545 Cooperative Societies
with a membership of about 50 lakh. There are 19 Central
Cooperative Banks with 356 branches and 2431 Mini
Banks. There is Haryana State Cooperative Agriculture
and Rural Development Bank also.
The Cooperative Movement is playing a vital role in
the economic and social transformation of the people of
Haryana. The movement is engaged in the activities
pertaining to the disbursement of adequate credit and
marketing facilities to the people by encouraging the
development of activities like Housing, Dairying and Sugar
Cooperatives etc. to augment the income of the people.
The Cooperative Banks have disbursed loans to the
tune of Rs.4357 crore during the year 2005-06. In the
year 2006-07, Rs.2940.86 crore have been disbursed as
loans upto 20 th December, 2006. The branches of
Cooperative Banks are being increased from 358 to 560.
With a view to provide easy and adequate credit and
other allied facilities to the farmers, the primary
Cooperative Credit Societies have been reorganised. 560
Primary Cooperative Agriculture Credit Societies have
been formed and to make these Societies viable, these are
engaged in providing credit, marketing, consumers and
other facilities in their respective area of operation.
Haryana Cooperative Societies Act, 1984 has been
amended and the provision under which the over due
amount of Cooperative loans was being recovered as
arrears of land revenue has been deleted. Now, no farmer
will be arrested for the recovery of Cooperative loans.
The Cooperative Agriculture and Rural Development
Banks have disbursed a loan to the tune of Rs.4307.90
crore to 10.51 lakh members since their inception.
These banks have disbursed Rs.146.49 crore as loans
during the period from April 2006 to 30th November
2006. These banks disbursed loans amounting to
Rs.302.68 crore during the year 2005-06. The
government has reduced the rate of interest on short
term agriculture loans from 11 per cent to 10 per cent
as on 1st May 2005. The rate of interest on these loans
has further been slashed from 10 per cent to 7 per cent
with effect from April 2006.
The Cooperative Sugar Mills in Haryana have crushed
196.30 lakh quintals sugarcane during the year 2005-06
resulting into the production of 18.75 lakh quintals of
sugar. These mills have paid total cost of sugarcane to
the tune of Rs.243.24 crore during the year 2005-06.
Haryana State Cooperative Supply and Marketing
Federation (HAFED), which is engaged in providing
Marketing and Processing facilities to farmers, has
purchased 4.62 lakh tonnes mustard during Rabi 2006.
This institution is encouraging farmers to produce good
quality Basmati and Desi Wheat by allowing them 10 per
cent additional price for their produce. During Rabi
2006, HAFED has purchased 8.40 lakh tonnes wheat
which is 37.72 per cent of the total wheat purchased by
government agencies in the State. To benefit further the
farmers of the state, HAFED has also made commercial
purchase of wheat. During 2006-07, HAFED has
purchased 1,07,043 tonnes wheat. It has distributed
3.31 lakh tonnes fertiliser upto 30th November 2006.
ISO 9001-2000 certification has been awarded to all the
oil mills, rice mills, cattle feed plants and pesticides
plants of HAFED. Besides, Oil Mills have also been
granted Food Safety Standard Certification for adopting
best safety norms.
There is a three tier system under Cooperative Sector
for the development of milk. During 2005-06, the
Cooperative Milk Producers Societies have procured
average 4.02 lakh litres milk every day. Milk Cooperatives
in Haryana are giving remunerative prices of Rs.220 per
kilo to milk producers. The white card scheme has been
introduced to benefit those farmers who are supplying
milk to the society continuously during the last three
years. These farmers will get Rs.1.00 lakh as loan for
which no security will be required. Haryana Dairy has also
introduced insurance scheme for those farmers who are
committed members and are supplying milk continuously
for the last three years. Presently, Haryana Dairy has 205
milk booths for the sale of milk and milk products.
HARCOFED, which is engaged in the activities of
publicity and extension of cooperative movement, has
imparted knowledge to 24,039 members, 1160
cooperative leaders, 13,529 school students, 1364 women
and 1307 for the year 2006-07 upto 31 December 2006.
Besides, this organisation has organised seminars,
speech contests, essay competitions and brought out
Hindi fortnightly magazine Haryana Sahkari Parkash and
English quarterly Cooperative Mirror to disseminate
information regarding various activities of Cooperative
Institutions and also principles and practices of
cooperative movement.
To generate employment for the unemployed youth,
2203 Primary Labour and Construction Cooperative
Chapter 1 • HARYANA: DEVELOPMENT PROFILE 57
Societies have been organised during the period from
1996 to 2006 with a membership of 22,580. The
number of Labour and Construction Societies has
increased to 4634 upto October 2006. These societies
had executed work to the tune of Rs.9610 lakh during
the year 2005-06 whereas these societies have executive
work amounting Rs.9588 lakh during the current
financial year upto October 2006. Haryana State
Cooperative Housing Federation has provided loans of
Rs.119.25 lakh during 2005-06 for the construction of
dwelling units.
The State of Haryana, in collaboration with National
Cooperative Development Corporation, is implementing
Intensive Cooperative Development Project in ten
districts of the State.
Cooperative marketing is a two-tier structure in
Haryana, HAFED at Apex Level and Primary Cooperative
Marketing-cum-Processing Societies at ‘mandi’ level.
HAFED has established a name for itself in the field of
marketing at the national level among cooperative
marketing institutions. HAFED purchases produce of
the farmers and help them by timely supplies of
fertilisers, seeds, pesticides etc. There are 61 cooperative
marketing societies at the primary level which are
working for the benefit of farmers providing them
fertilisers/seeds at rates cheaper than in the market.
HAFED has created godown capacity of 7.50 lakh metric
tonnes to ensure safe and scientific storage of
foodgrains. In addition, godowns having 2.65 lakh
metric tonnes capacity have been constructed under
seven years guarantee scheme through private parties.
The Sugar Mills in Haryana in cooperative sector are
performing well and ensuring timely payment to the
sugarcane growers. It is heartening to note that two
Cooperative Sugar Mills in the State bagged five
National Awards for technical efficiency and cane
development during the year 2004-05.
The objective of the dairy cooperatives is to promote
the economic interest of milk producers of Haryana by
purchasing milk and marketing the same and by
undertaking allied activities as are conducive for
promotion of milk production. A large network of
cooperative milk societies has been established which
provides market to milk producers at their door steps at
a remunerative price. Apart from payment of
remunerative price, dairy cooperatives also provide
quality cattle feed, fodder seeds, veterinary medicines
and milk products to producers, thus helping them to
increase their incomes.
Institutional finance is essential for any development
programme. In Haryana, the number of Cooperative
Banks and Rural Land Development Banks at the end of
December, 2004 were 356 and 48 (9 district level and
39 village level Primary Cooperative Agriculture and
Rural Development Banks), respectively. The Haryana
Cooperative Apex Bank Ltd is providing credit facilities
throughout the State through the existing 2433 Primary
Agriculture Credit Societies (as on 31 March 2005). These
Primary Agriculture Credit Societies are financially
assisted by 19 Central Cooperative Banks functioning at
the district level. The Haryana State Cooperative Apex
Bank Ltd. provides adequate credit facilities by securing
financial assistance from NABARD and also by pumping
in its own resources.
1.2.5 Poverty
Poverty eradication is one of the most important
objectives of our development policy. The growth
performance of the State truly lies in poverty reduction.
Prima facie, poverty may be expected to decline more
rapidly in a faster growing state.
In an excellent recent study, Dev and Ravi (2007)
show that poverty ratio in Haryana has declined form
24.26 in 1993-94 to 13.92 in 2004-05. As is clear from
Table 1.40, this trend is noticed in almost all the major
states. Of course, some of the States are having very high
poverty ratios for the total population. In 2004-05, it was
more than 40 per cent in Orissa and Bihar and between
30 and 40 per cent in Madhya Pradesh and Uttar Pradesh
and between 25 per cent and 30 per cent in
Maharashtra, Tamil Nadu, Karnataka and West Bengal.
Rural poverty is high in all these States except in Tamil
Nadu. Urban poverty was 30 per cent or more in Bihar,
Madhya Pradesh, Orissa, Rajasthan, Tamil Nadu and
Uttar Pradesh in 2004-05.
The absolute number of poor is given in Table 1.41.
In Haryana, the absolute number of rural poor people
declined from 3.51 millions in 1993-94 to 2.17 millions
in 2004-05. But, the absolute number of urban poor
people increased from 0.81 million to 1.1 million during
this period. Only in the States of Madhya Pradesh,
Orissa and Uttar Pradesh the number of rural poor
increased in 2004-05 as compared to 1993-94. But the
number of urban poor increased in eight States. The
number of poor for the total population increased in
Madhya Pradesh, Maharashtra, Orissa and Uttar Pradesh.
As shown in Table 1.42, the percentage of very poor
in the total population declined in all the states since
1983—the only exception being Orissa between 1993-94
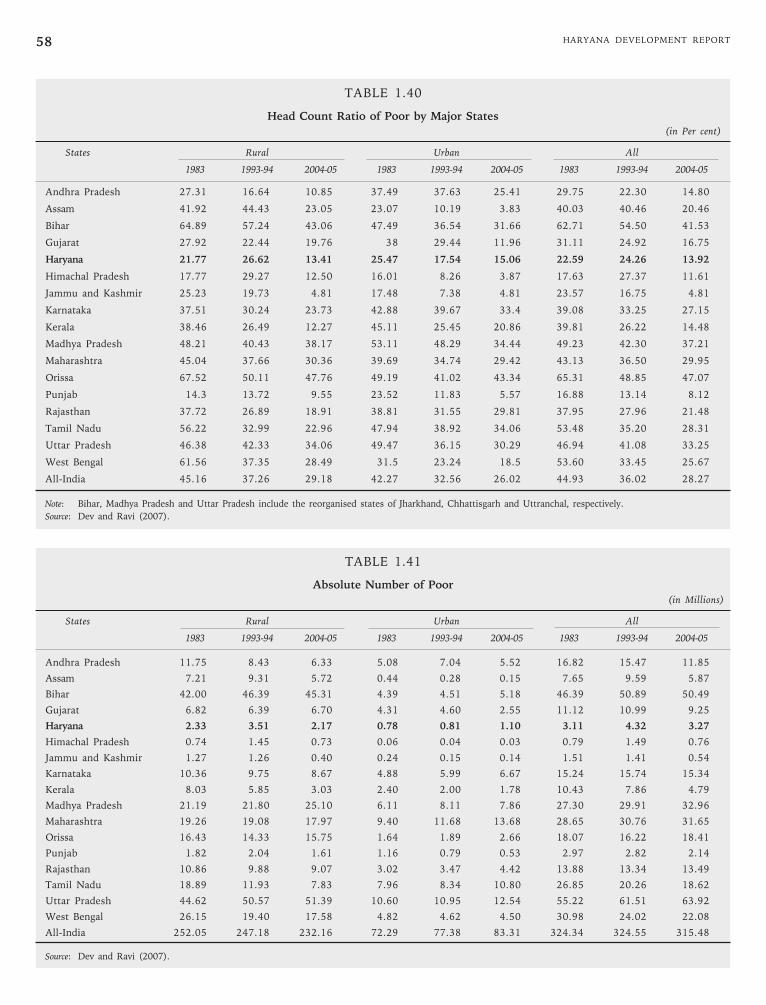
HARYANA DEVELOPMENT REPORT58
TABLE 1.40
Head Count Ratio of Poor by Major States(in Per cent)
States Rural Urban All
1983 1993-94 2004-05 1983 1993-94 2004-05 1983 1993-94 2004-05
Andhra Pradesh 27.31 16.64 10.85 37.49 37.63 25.41 29.75 22.30 14.80
Assam 41.92 44.43 23.05 23.07 10.19 3.83 40.03 40.46 20.46
Bihar 64.89 57.24 43.06 47.49 36.54 31.66 62.71 54.50 41.53
Gujarat 27.92 22.44 19.76 38 29.44 11.96 31.11 24.92 16.75
Haryana 21.77 26.62 13.41 25.47 17.54 15.06 22.59 24.26 13.92
Himachal Pradesh 17.77 29.27 12.50 16.01 8.26 3.87 17.63 27.37 11.61
Jammu and Kashmir 25.23 19.73 4.81 17.48 7.38 4.81 23.57 16.75 4.81
Karnataka 37.51 30.24 23.73 42.88 39.67 33.4 39.08 33.25 27.15
Kerala 38.46 26.49 12.27 45.11 25.45 20.86 39.81 26.22 14.48
Madhya Pradesh 48.21 40.43 38.17 53.11 48.29 34.44 49.23 42.30 37.21
Maharashtra 45.04 37.66 30.36 39.69 34.74 29.42 43.13 36.50 29.95
Orissa 67.52 50.11 47.76 49.19 41.02 43.34 65.31 48.85 47.07
Punjab 14.3 13.72 9.55 23.52 11.83 5.57 16.88 13.14 8.12
Rajasthan 37.72 26.89 18.91 38.81 31.55 29.81 37.95 27.96 21.48
Tamil Nadu 56.22 32.99 22.96 47.94 38.92 34.06 53.48 35.20 28.31
Uttar Pradesh 46.38 42.33 34.06 49.47 36.15 30.29 46.94 41.08 33.25
West Bengal 61.56 37.35 28.49 31.5 23.24 18.5 53.60 33.45 25.67
All-India 45.16 37.26 29.18 42.27 32.56 26.02 44.93 36.02 28.27
Note: Bihar, Madhya Pradesh and Uttar Pradesh include the reorganised states of Jharkhand, Chhattisgarh and Uttranchal, respectively.
Source: Dev and Ravi (2007).
TABLE 1.41
Absolute Number of Poor(in Millions)
States Rural Urban All
1983 1993-94 2004-05 1983 1993-94 2004-05 1983 1993-94 2004-05
Andhra Pradesh 11.75 8.43 6.33 5.08 7.04 5.52 16.82 15.47 11.85
Assam 7.21 9.31 5.72 0.44 0.28 0.15 7.65 9.59 5.87
Bihar 42.00 46.39 45.31 4.39 4.51 5.18 46.39 50.89 50.49
Gujarat 6.82 6.39 6.70 4.31 4.60 2.55 11.12 10.99 9.25
Haryana 2.33 3.51 2.17 0.78 0.81 1.10 3.11 4.32 3.27
Himachal Pradesh 0.74 1.45 0.73 0.06 0.04 0.03 0.79 1.49 0.76
Jammu and Kashmir 1.27 1.26 0.40 0.24 0.15 0.14 1.51 1.41 0.54
Karnataka 10.36 9.75 8.67 4.88 5.99 6.67 15.24 15.74 15.34
Kerala 8.03 5.85 3.03 2.40 2.00 1.78 10.43 7.86 4.79
Madhya Pradesh 21.19 21.80 25.10 6.11 8.11 7.86 27.30 29.91 32.96
Maharashtra 19.26 19.08 17.97 9.40 11.68 13.68 28.65 30.76 31.65
Orissa 16.43 14.33 15.75 1.64 1.89 2.66 18.07 16.22 18.41
Punjab 1.82 2.04 1.61 1.16 0.79 0.53 2.97 2.82 2.14
Rajasthan 10.86 9.88 9.07 3.02 3.47 4.42 13.88 13.34 13.49
Tamil Nadu 18.89 11.93 7.83 7.96 8.34 10.80 26.85 20.26 18.62
Uttar Pradesh 44.62 50.57 51.39 10.60 10.95 12.54 55.22 61.51 63.92
West Bengal 26.15 19.40 17.58 4.82 4.62 4.50 30.98 24.02 22.08
All-India 252.05 247.18 232.16 72.29 77.38 83.31 324.34 324.55 315.48
Source: Dev and Ravi (2007).
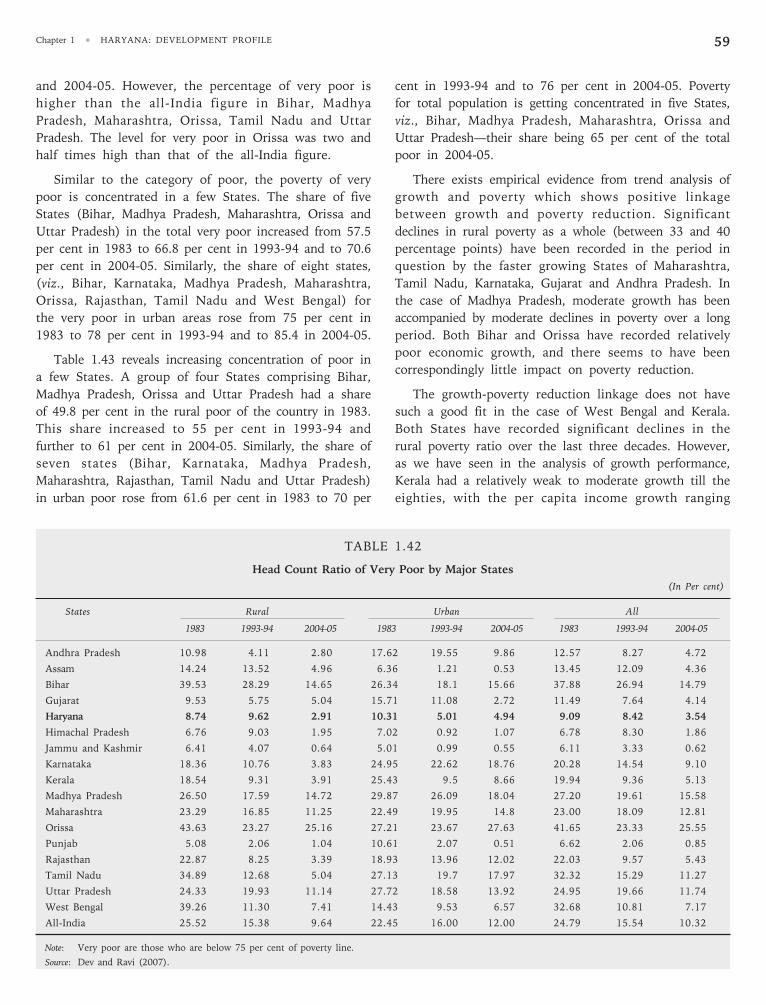
Chapter 1 • HARYANA: DEVELOPMENT PROFILE 59
TABLE 1.42
Head Count Ratio of Very Poor by Major States
(In Per cent)
States Rural Urban All
1983 1993-94 2004-05 1983 1993-94 2004-05 1983 1993-94 2004-05
Andhra Pradesh 10.98 4.11 2.80 17.62 19.55 9.86 12.57 8.27 4.72
Assam 14.24 13.52 4.96 6.36 1.21 0.53 13.45 12.09 4.36
Bihar 39.53 28.29 14.65 26.34 18.1 15.66 37.88 26.94 14.79
Gujarat 9.53 5.75 5.04 15.71 11.08 2.72 11.49 7.64 4.14
Haryana 8.74 9.62 2.91 10.31 5.01 4.94 9.09 8.42 3.54
Himachal Pradesh 6.76 9.03 1.95 7.02 0.92 1.07 6.78 8.30 1.86
Jammu and Kashmir 6.41 4.07 0.64 5.01 0.99 0.55 6.11 3.33 0.62
Karnataka 18.36 10.76 3.83 24.95 22.62 18.76 20.28 14.54 9.10
Kerala 18.54 9.31 3.91 25.43 9.5 8.66 19.94 9.36 5.13
Madhya Pradesh 26.50 17.59 14.72 29.87 26.09 18.04 27.20 19.61 15.58
Maharashtra 23.29 16.85 11.25 22.49 19.95 14.8 23.00 18.09 12.81
Orissa 43.63 23.27 25.16 27.21 23.67 27.63 41.65 23.33 25.55
Punjab 5.08 2.06 1.04 10.61 2.07 0.51 6.62 2.06 0.85
Rajasthan 22.87 8.25 3.39 18.93 13.96 12.02 22.03 9.57 5.43
Tamil Nadu 34.89 12.68 5.04 27.13 19.7 17.97 32.32 15.29 11.27
Uttar Pradesh 24.33 19.93 11.14 27.72 18.58 13.92 24.95 19.66 11.74
West Bengal 39.26 11.30 7.41 14.43 9.53 6.57 32.68 10.81 7.17
All-India 25.52 15.38 9.64 22.45 16.00 12.00 24.79 15.54 10.32
Note: Very poor are those who are below 75 per cent of poverty line.
Source: Dev and Ravi (2007).
and 2004-05. However, the percentage of very poor is
higher than the all-India figure in Bihar, Madhya
Pradesh, Maharashtra, Orissa, Tamil Nadu and Uttar
Pradesh. The level for very poor in Orissa was two and
half times high than that of the all-India figure.
Similar to the category of poor, the poverty of very
poor is concentrated in a few States. The share of five
States (Bihar, Madhya Pradesh, Maharashtra, Orissa and
Uttar Pradesh) in the total very poor increased from 57.5
per cent in 1983 to 66.8 per cent in 1993-94 and to 70.6
per cent in 2004-05. Similarly, the share of eight states,
(viz., Bihar, Karnataka, Madhya Pradesh, Maharashtra,
Orissa, Rajasthan, Tamil Nadu and West Bengal) for
the very poor in urban areas rose from 75 per cent in
1983 to 78 per cent in 1993-94 and to 85.4 in 2004-05.
Table 1.43 reveals increasing concentration of poor in
a few States. A group of four States comprising Bihar,
Madhya Pradesh, Orissa and Uttar Pradesh had a share
of 49.8 per cent in the rural poor of the country in 1983.
This share increased to 55 per cent in 1993-94 and
further to 61 per cent in 2004-05. Similarly, the share of
seven states (Bihar, Karnataka, Madhya Pradesh,
Maharashtra, Rajasthan, Tamil Nadu and Uttar Pradesh)
in urban poor rose from 61.6 per cent in 1983 to 70 per
cent in 1993-94 and to 76 per cent in 2004-05. Poverty
for total population is getting concentrated in five States,
viz., Bihar, Madhya Pradesh, Maharashtra, Orissa and
Uttar Pradesh—their share being 65 per cent of the total
poor in 2004-05.
There exists empirical evidence from trend analysis of
growth and poverty which shows positive linkage
between growth and poverty reduction. Significant
declines in rural poverty as a whole (between 33 and 40
percentage points) have been recorded in the period in
question by the faster growing States of Maharashtra,
Tamil Nadu, Karnataka, Gujarat and Andhra Pradesh. In
the case of Madhya Pradesh, moderate growth has been
accompanied by moderate declines in poverty over a long
period. Both Bihar and Orissa have recorded relatively
poor economic growth, and there seems to have been
correspondingly little impact on poverty reduction.
The growth-poverty reduction linkage does not have
such a good fit in the case of West Bengal and Kerala.
Both States have recorded significant declines in the
rural poverty ratio over the last three decades. However,
as we have seen in the analysis of growth performance,
Kerala had a relatively weak to moderate growth till the
eighties, with the per capita income growth ranging
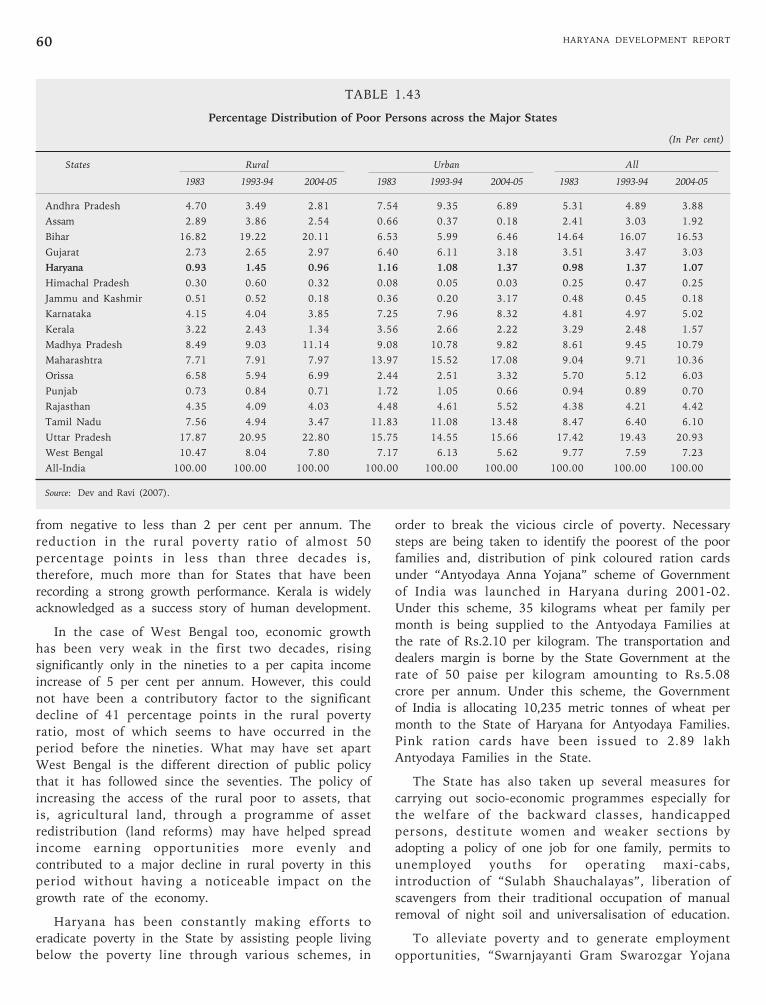
HARYANA DEVELOPMENT REPORT60
TABLE 1.43
Percentage Distribution of Poor Persons across the Major States
(In Per cent)
States Rural Urban All
1983 1993-94 2004-05 1983 1993-94 2004-05 1983 1993-94 2004-05
Andhra Pradesh 4.70 3.49 2.81 7.54 9.35 6.89 5.31 4.89 3.88
Assam 2.89 3.86 2.54 0.66 0.37 0.18 2.41 3.03 1.92
Bihar 16.82 19.22 20.11 6.53 5.99 6.46 14.64 16.07 16.53
Gujarat 2.73 2.65 2.97 6.40 6.11 3.18 3.51 3.47 3.03
Haryana 0.93 1.45 0.96 1.16 1.08 1.37 0.98 1.37 1.07
Himachal Pradesh 0.30 0.60 0.32 0.08 0.05 0.03 0.25 0.47 0.25
Jammu and Kashmir 0.51 0.52 0.18 0.36 0.20 3.17 0.48 0.45 0.18
Karnataka 4.15 4.04 3.85 7.25 7.96 8.32 4.81 4.97 5.02
Kerala 3.22 2.43 1.34 3.56 2.66 2.22 3.29 2.48 1.57
Madhya Pradesh 8.49 9.03 11.14 9.08 10.78 9.82 8.61 9.45 10.79
Maharashtra 7.71 7.91 7.97 13.97 15.52 17.08 9.04 9.71 10.36
Orissa 6.58 5.94 6.99 2.44 2.51 3.32 5.70 5.12 6.03
Punjab 0.73 0.84 0.71 1.72 1.05 0.66 0.94 0.89 0.70
Rajasthan 4.35 4.09 4.03 4.48 4.61 5.52 4.38 4.21 4.42
Tamil Nadu 7.56 4.94 3.47 11.83 11.08 13.48 8.47 6.40 6.10
Uttar Pradesh 17.87 20.95 22.80 15.75 14.55 15.66 17.42 19.43 20.93
West Bengal 10.47 8.04 7.80 7.17 6.13 5.62 9.77 7.59 7.23
All-India 100.00 100.00 100.00 100.00 100.00 100.00 100.00 100.00 100.00
Source: Dev and Ravi (2007).
from negative to less than 2 per cent per annum. The
reduction in the rural poverty ratio of almost 50
percentage points in less than three decades is,
therefore, much more than for States that have been
recording a strong growth performance. Kerala is widely
acknowledged as a success story of human development.
In the case of West Bengal too, economic growth
has been very weak in the first two decades, rising
significantly only in the nineties to a per capita income
increase of 5 per cent per annum. However, this could
not have been a contributory factor to the significant
decline of 41 percentage points in the rural poverty
ratio, most of which seems to have occurred in the
period before the nineties. What may have set apart
West Bengal is the different direction of public policy
that it has followed since the seventies. The policy of
increasing the access of the rural poor to assets, that
is, agricultural land, through a programme of asset
redistribution (land reforms) may have helped spread
income earning opportunities more evenly and
contributed to a major decline in rural poverty in this
period without having a noticeable impact on the
growth rate of the economy.
Haryana has been constantly making efforts to
eradicate poverty in the State by assisting people living
below the poverty line through various schemes, in
order to break the vicious circle of poverty. Necessary
steps are being taken to identify the poorest of the poor
families and, distribution of pink coloured ration cards
under “Antyodaya Anna Yojana” scheme of Government
of India was launched in Haryana during 2001-02.
Under this scheme, 35 kilograms wheat per family per
month is being supplied to the Antyodaya Families at
the rate of Rs.2.10 per kilogram. The transportation and
dealers margin is borne by the State Government at the
rate of 50 paise per kilogram amounting to Rs.5.08
crore per annum. Under this scheme, the Government
of India is allocating 10,235 metric tonnes of wheat per
month to the State of Haryana for Antyodaya Families.
Pink ration cards have been issued to 2.89 lakh
Antyodaya Families in the State.
The State has also taken up several measures for
carrying out socio-economic programmes especially for
the welfare of the backward classes, handicapped
persons, destitute women and weaker sections by
adopting a policy of one job for one family, permits to
unemployed youths for operating maxi-cabs,
introduction of “Sulabh Shauchalayas”, liberation of
scavengers from their traditional occupation of manual
removal of night soil and universalisation of education.
To alleviate poverty and to generate employment
opportunities, “Swarnjayanti Gram Swarozgar Yojana
Chapter 1 • HARYANA: DEVELOPMENT PROFILE 61
(SGSY)” is being implemented in the rural areas. This
is a holistic programme covering all aspects of self
employment such as organisation of the poor into Self
Help Groups, training, credit, technology,
infrastructure, and marketing etc. The target group
consists of families living below the poverty line. The
objective of the scheme is to bring every assisted family
above the poverty line within three years.
Under “Indira Awaas Yojana (New construction)”,
houses are constructed for the poor living below poverty
line. “Sampooran Grameen Rozgar Yojana (SGRY)” aims
to provide additional wage employment opportunities to
rural poor who are in need of work. The secondary
objective of the scheme is the creation of durable
community, social and economic assets and
infrastructural development in rural areas. The wages to
the workers are being paid in the shape of cash and
kind. The Ministry of Rural Development, Government of
India has launched a scheme namely, “National Food For
Work Programme (NFFWP)” from the year 2004-05 in
Mahendragarh District. This is a 100 per cent Centrally
Sponsored Scheme. Foodgrains are provided by the
Government of India, free of cost. The main objective of
this programme is to provide additional resources apart
from the resources available under the SGRY so that
generation of supplementary wage employment and
provision of food-security through creation of need based
economic, social and community assets is further
intensified. This programme is open to all rural poor
who are in need of wage employment and desire to do
manual and unskilled work.
National Rural Employment Guarantee Scheme has
been launched in all Gram Panchayats of district
Mahendragarh and Sirsa of the State on 2nd February
2006. The basic objective of the scheme is to enhance
livelihood security in rural areas by providing at least
100 days of guaranteed wage employment in a financial
year to every household whose adult members volunteer
to do unskilled manual work. The scheme is applicable
only to rural areas. One third of the jobs are reserved
for women. Minimum wages applicable in the State are
payable to the persons employed. Unemployed persons
are to apply for registration with the Gram Panchayats
concerned. The payment of wages is being made on
weekly or fortnightly basis. The development works like
water conservation, water harvesting, drought proofing,
afforestation, tree plantation, canals irrigation,
irrigation facilities to the land owned by scheduled
castes and other rural poor, renovation of traditional
water bodies, land development, flood control and
protection works and rural connectivity etc. are taken
up by the Gram Panchayats and other implementing
agencies.
The Planning Commission, Government of India,
had launched a new 100 per cent Centrally Assisted
Scheme for Backward Districts namely Rashtriya Sam
Vikas Yojana (RSVY) now Backward Region Grant
Fund (BRGF) from the year 2004-05 in Sirsa district.
From the year 2007-08, this scheme has been extended
by the Government of India to district Mahendragarh
also. The main aim of this scheme is to solve the
problems of poverty, low growth and poor governance
in the backward districts. Under this scheme, an
amount of Rs.1226.14 lakh has been spent and 656
works have been completed upto the month of
December 2006 and 231 works are under progress. An
outlay of Rs.2450.00 lakh has been proposed for the
year 2007-08.
Desert Development Programme (DDP) is based on
Watershed Development Projects and is being
implemented in 47 blocks of Bhiwani, Hisar, Fatehabad,
Sirsa, Jhajjar, Rewari and Mahendragarh districts from the
year 1995-96. The strategies of this programme are to
control severity of drought and desert conditions in the
targeted areas.
The basic objective of Integrated Wastelands
Development Programme (IWDP) is aimed at an
integrated wastelands development based on village/micro
watershed plans. These plans are prepared after taking
into consideration the land capability, site conditions and
local needs of the people. The major activities like soil
and moisture conservation measures, planting and sowing
of multi purpose trees, encouraging natural regeneration,
promotion of agro forestry etcetera can be taken up under
IWDP. An expenditure of Rs.316.32 lakh has been made
during 2006-07 (upto December 2006). An outlay of
Rs.100.00 lakh has been proposed for the Annual Plan
2007-08 as State share in the ratio of 11:1 between the
Centre and State Government.
The Member of Parliament Local Area Development
Scheme (MPLADS) has been launched from 23 December
1993. Under this scheme, Government of India provides
each Member of Parliament an amount of Rs.2.00 crore
per annum for the development works.
The State Urban Development Society, Haryana is
implementing Swarna Jayanti Shahri Rozgar Yojana
(SJSRY) to provide gainful employment to the urban
unemployed and underemployed poor beneficiaries by
setting up of self-employment ventures providing wage
employment through skill development training. The
HARYANA DEVELOPMENT REPORT62
scheme is funded in the ratio of 75:25 by the Centre
and State Government. During the financial year 2006-
07, 1737 individual beneficiaries and 58 groups relating
to Development of Women and Children in Urban Areas
(DWCUA) were provided loans and subsidy, 5380
persons were provided training, 59 Thrift and Credit
Societies were assisted and 0.39 lakh mandays were
generated upto 31.12.2006 by utilising Rs.599.95 lakh.
The scheme of Integrated Housing and Slum
Development Programme (IHSDP) was introduced by
Government of India by replacing National Slum
Development Programme (NSDP) and Valmiki
Ambedkar Awas Yojana (VAMBAY) in December 2005.
The objective of the scheme is to provide basic
amenities, that is, Water, Sewerage, Drainage, Roads &
Streets and Dwelling Units to slum dwellers. This is a
demand based scheme and the funds are to be provided
by Government of India and State Government in the
ratio of 80:20. The contribution of the beneficiary is
merely 12 per cent for general category and 10 per cent
for SC category for the construction/upgradation of
dwelling units. So far, project reports for 31 towns have
been submitted to Government of India out of which 12
projects with a total financial outlay of Rs.235.74 crore
have been approved. The 50 per cent central share
amounting to Rs.91.48 crore pertaining to 12 projects
have been sanctioned.
In the area of social security, a scheme known as
Rajiv Gandhi Parivar Bima Yojana launched from 1st
April 2006 is providing social security to the citizens of
the State. Under this scheme, all the persons of
Haryana in the age group of 18 to 60 years are provided
compensation of Rs.1 lakh in case of unnatural death
or permanent total disability due to accidents like rail
or road or air accidents, tractor or farming equipment,
riot, earthquake, strike, terrorist activity, storm,
cyclone, snake bite, drowning, poisoning, electrocution,
falling from height, collapse of house or building, fire,
explosion, implosion, murder, attack of animals,
stampede and suffocation, lightening, frost bite, sun
burn (loo), burn injuries, death or permanent total
disability due to any other unnatural event, within 72
hours of the submission of claim form. Similarly,
Rs.25,000 to Rs.50,000 is also given on the basis of
disability percentage. Under this scheme 980 cases have
been covered upto 31st December 2006.
To remove the sense of economic insecurity in the
minds of parents who have only daughters Ladli Social
Security Pension Scheme is being implemented with effect
from 1st January 2006 under which pension at the rate
of Rs.300 per month will be paid to the families from
the 55th birthday of the father or mother till their 60th
birthday, that is, for five years. Thereafter, they will be
eligible for old age allowance.
The Unemployment Allowance for the Educated
Unemployed Scheme has become effective from 1st
November 2005. The rates of Unemployment Allowance
are Rs.300 per month in case of those with
qualification 10+2 or equivalent (with minimum 2
years certificate/diploma course after Matric) and Rs.500
per month to graduates or diploma holders (with
minimum three years after 10+2) and above from any
Board/University recognised by Haryana Government.
The applicants with qualification below 10+2 are also
receiving the Unemployment Allowance at the rate of
Rs.100 per month till they attain the upper age limit of
35 years. The Unemployment Allowance has been
disbursed to 38,550 beneficiaries amounting to Rs.7.23
crore under this scheme upto 31st December 2006.
The Department of Employment, Haryana has started
On-Line Services for Facilitating Placement in private
sector. These services are available at the website
www.haryanajobs.in. Any applicant or employer can make
use of these services free of charge. A Private Placement
Cell has been established in the District Employment
Exchange, Gurgaon for such facilities.
In order to cater to the growing demands for skilled
and unskilled labour, technicians, IT professionals,
engineers and doctors in foreign countries especially in
the middle-east, the State has launched the Overseas
Placement Bureau on 1st July 2006 at Sonipat. This
Bureau is functioning under the aegis of Haryana
Overseas Placement Assistance Society (HOPAS), with
its registered office at Panchkula. For the functioning
of this Society, Overseas Placement Committee was
constituted on 5th October 2005 which is competent to
exercise all powers on behalf of Government in this
regard. The committee approved the constitution in the
Society. These services are freely available at the website
www.haryanajonbs.in.
“Old Age Pension Scheme” prevalent in the State
has been based on economic criteria and the eligibility
age is 60 years or more so as to give the benefit to the
really poor and needy persons. Under this scheme,
pension at the rate of Rs.300 per month is given to the
eligible senior citizens of Haryana domicile. As many as
10,74,610 senior citizens have been covered under the
scheme upto 31st December 2006.
“Widow Pension Scheme” is also being implemented
to provide security and financial assistance to widows
and destitute women. Under this scheme, widows and
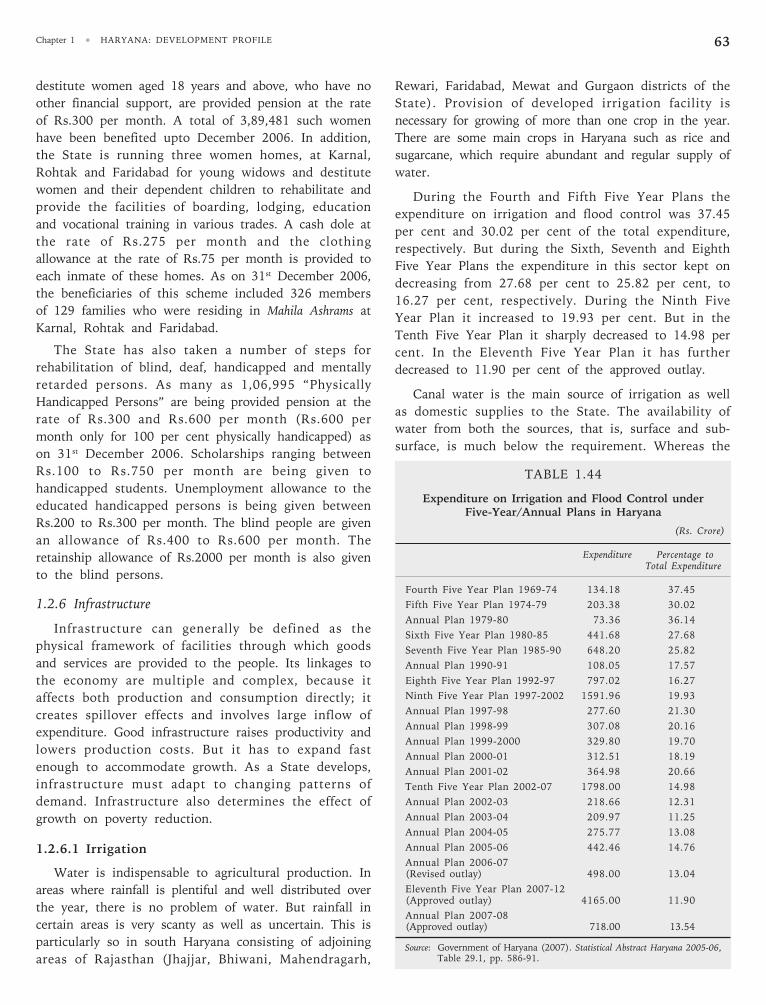
Chapter 1 • HARYANA: DEVELOPMENT PROFILE 63
destitute women aged 18 years and above, who have no
other financial support, are provided pension at the rate
of Rs.300 per month. A total of 3,89,481 such women
have been benefited upto December 2006. In addition,
the State is running three women homes, at Karnal,
Rohtak and Faridabad for young widows and destitute
women and their dependent children to rehabilitate and
provide the facilities of boarding, lodging, education
and vocational training in various trades. A cash dole at
the rate of Rs.275 per month and the clothing
allowance at the rate of Rs.75 per month is provided to
each inmate of these homes. As on 31st December 2006,
the beneficiaries of this scheme included 326 members
of 129 families who were residing in Mahila Ashrams at
Karnal, Rohtak and Faridabad.
The State has also taken a number of steps for
rehabilitation of blind, deaf, handicapped and mentally
retarded persons. As many as 1,06,995 “Physically
Handicapped Persons” are being provided pension at the
rate of Rs.300 and Rs.600 per month (Rs.600 per
month only for 100 per cent physically handicapped) as
on 31st December 2006. Scholarships ranging between
Rs.100 to Rs.750 per month are being given to
handicapped students. Unemployment allowance to the
educated handicapped persons is being given between
Rs.200 to Rs.300 per month. The blind people are given
an allowance of Rs.400 to Rs.600 per month. The
retainship allowance of Rs.2000 per month is also given
to the blind persons.
1.2.6 Infrastructure
Infrastructure can generally be defined as the
physical framework of facilities through which goods
and services are provided to the people. Its linkages to
the economy are multiple and complex, because it
affects both production and consumption directly; it
creates spillover effects and involves large inflow of
expenditure. Good infrastructure raises productivity and
lowers production costs. But it has to expand fast
enough to accommodate growth. As a State develops,
infrastructure must adapt to changing patterns of
demand. Infrastructure also determines the effect of
growth on poverty reduction.
1.2.6.1 Irrigation
Water is indispensable to agricultural production. In
areas where rainfall is plentiful and well distributed over
the year, there is no problem of water. But rainfall in
certain areas is very scanty as well as uncertain. This is
particularly so in south Haryana consisting of adjoining
areas of Rajasthan (Jhajjar, Bhiwani, Mahendragarh,
Rewari, Faridabad, Mewat and Gurgaon districts of the
State). Provision of developed irrigation facility is
necessary for growing of more than one crop in the year.
There are some main crops in Haryana such as rice and
sugarcane, which require abundant and regular supply of
water.
During the Fourth and Fifth Five Year Plans the
expenditure on irrigation and flood control was 37.45
per cent and 30.02 per cent of the total expenditure,
respectively. But during the Sixth, Seventh and Eighth
Five Year Plans the expenditure in this sector kept on
decreasing from 27.68 per cent to 25.82 per cent, to
16.27 per cent, respectively. During the Ninth Five
Year Plan it increased to 19.93 per cent. But in the
Tenth Five Year Plan it sharply decreased to 14.98 per
cent. In the Eleventh Five Year Plan it has further
decreased to 11.90 per cent of the approved outlay.
Canal water is the main source of irrigation as well
as domestic supplies to the State. The availability of
water from both the sources, that is, surface and sub-
surface, is much below the requirement. Whereas the
TABLE 1.44
Expenditure on Irrigation and Flood Control underFive-Year/Annual Plans in Haryana
(Rs. Crore)
Expenditure Percentage toTotal Expenditure
Fourth Five Year Plan 1969-74 134.18 37.45
Fifth Five Year Plan 1974-79 203.38 30.02
Annual Plan 1979-80 73.36 36.14
Sixth Five Year Plan 1980-85 441.68 27.68
Seventh Five Year Plan 1985-90 648.20 25.82
Annual Plan 1990-91 108.05 17.57
Eighth Five Year Plan 1992-97 797.02 16.27
Ninth Five Year Plan 1997-2002 1591.96 19.93
Annual Plan 1997-98 277.60 21.30
Annual Plan 1998-99 307.08 20.16
Annual Plan 1999-2000 329.80 19.70
Annual Plan 2000-01 312.51 18.19
Annual Plan 2001-02 364.98 20.66
Tenth Five Year Plan 2002-07 1798.00 14.98
Annual Plan 2002-03 218.66 12.31
Annual Plan 2003-04 209.97 11.25
Annual Plan 2004-05 275.77 13.08
Annual Plan 2005-06 442.46 14.76
Annual Plan 2006-07(Revised outlay) 498.00 13.04
Eleventh Five Year Plan 2007-12(Approved outlay) 4165.00 11.90
Annual Plan 2007-08(Approved outlay) 718.00 13.54
Source: Government of Haryana (2007). Statistical Abstract Haryana 2005-06,Table 29.1, pp. 586-91.
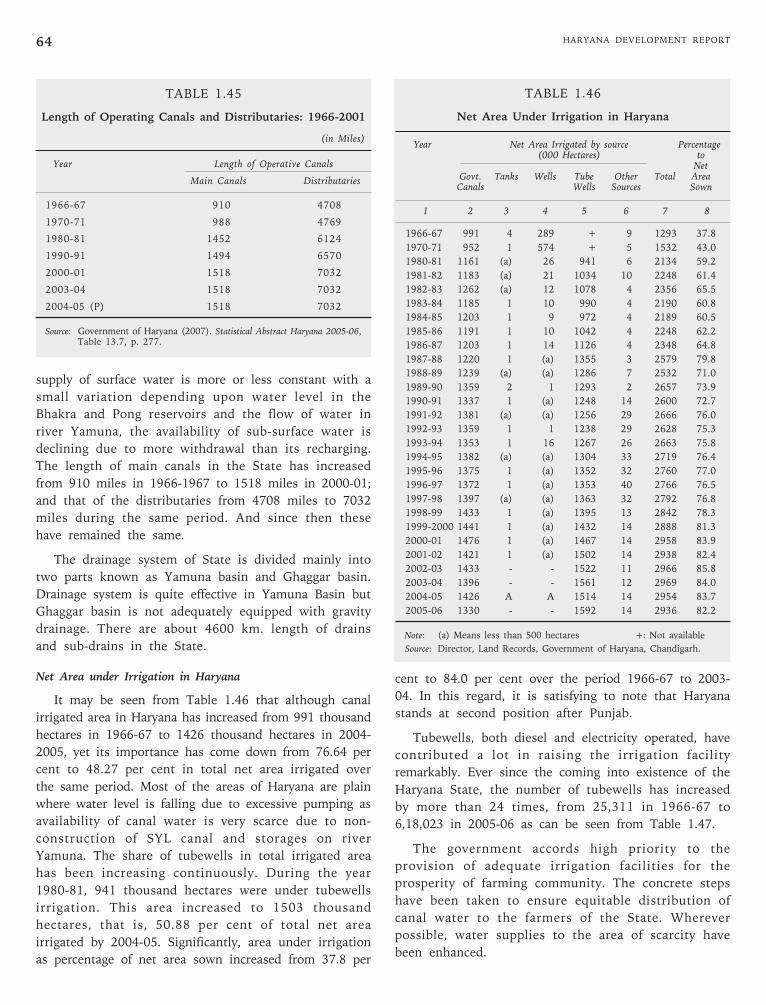
HARYANA DEVELOPMENT REPORT64
supply of surface water is more or less constant with a
small variation depending upon water level in the
Bhakra and Pong reservoirs and the flow of water in
river Yamuna, the availability of sub-surface water is
declining due to more withdrawal than its recharging.
The length of main canals in the State has increased
from 910 miles in 1966-1967 to 1518 miles in 2000-01;
and that of the distributaries from 4708 miles to 7032
miles during the same period. And since then these
have remained the same.
The drainage system of State is divided mainly into
two parts known as Yamuna basin and Ghaggar basin.
Drainage system is quite effective in Yamuna Basin but
Ghaggar basin is not adequately equipped with gravity
drainage. There are about 4600 km. length of drains
and sub-drains in the State.
Net Area under Irrigation in Haryana
It may be seen from Table 1.46 that although canal
irrigated area in Haryana has increased from 991 thousand
hectares in 1966-67 to 1426 thousand hectares in 2004-
2005, yet its importance has come down from 76.64 per
cent to 48.27 per cent in total net area irrigated over
the same period. Most of the areas of Haryana are plain
where water level is falling due to excessive pumping as
availability of canal water is very scarce due to non-
construction of SYL canal and storages on river
Yamuna. The share of tubewells in total irrigated area
has been increasing continuously. During the year
1980-81, 941 thousand hectares were under tubewells
irrigation. This area increased to 1503 thousand
hectares, that is, 50.88 per cent of total net area
irrigated by 2004-05. Significantly, area under irrigation
as percentage of net area sown increased from 37.8 per
cent to 84.0 per cent over the period 1966-67 to 2003-
04. In this regard, it is satisfying to note that Haryana
stands at second position after Punjab.
Tubewells, both diesel and electricity operated, have
contributed a lot in raising the irrigation facility
remarkably. Ever since the coming into existence of the
Haryana State, the number of tubewells has increased
by more than 24 times, from 25,311 in 1966-67 to
6,18,023 in 2005-06 as can be seen from Table 1.47.
The government accords high priority to the
provision of adequate irrigation facilities for the
prosperity of farming community. The concrete steps
have been taken to ensure equitable distribution of
canal water to the farmers of the State. Wherever
possible, water supplies to the area of scarcity have
been enhanced.
TABLE 1.45
Length of Operating Canals and Distributaries: 1966-2001
(in Miles)
Year Length of Operative Canals
Main Canals Distributaries
1966-67 910 4708
1970-71 988 4769
1980-81 1452 6124
1990-91 1494 6570
2000-01 1518 7032
2003-04 1518 7032
2004-05 (P) 1518 7032
Source: Government of Haryana (2007). Statistical Abstract Haryana 2005-06,Table 13.7, p. 277.
TABLE 1.46
Net Area Under Irrigation in Haryana
Year Net Area Irrigated by source Percentage(000 Hectares) to
NetGovt. Tanks Wells Tube Other Total Area
Canals Wells Sources Sown
1 2 3 4 5 6 7 8
1966-67 991 4 289 + 9 1293 37.8
1970-71 952 1 574 + 5 1532 43.0
1980-81 1161 (a) 26 941 6 2134 59.2
1981-82 1183 (a) 21 1034 10 2248 61.4
1982-83 1262 (a) 12 1078 4 2356 65.5
1983-84 1185 1 10 990 4 2190 60.8
1984-85 1203 1 9 972 4 2189 60.5
1985-86 1191 1 10 1042 4 2248 62.2
1986-87 1203 1 14 1126 4 2348 64.8
1987-88 1220 1 (a) 1355 3 2579 79.8
1988-89 1239 (a) (a) 1286 7 2532 71.0
1989-90 1359 2 1 1293 2 2657 73.9
1990-91 1337 1 (a) 1248 14 2600 72.7
1991-92 1381 (a) (a) 1256 29 2666 76.0
1992-93 1359 1 1 1238 29 2628 75.3
1993-94 1353 1 16 1267 26 2663 75.8
1994-95 1382 (a) (a) 1304 33 2719 76.4
1995-96 1375 1 (a) 1352 32 2760 77.0
1996-97 1372 1 (a) 1353 40 2766 76.5
1997-98 1397 (a) (a) 1363 32 2792 76.8
1998-99 1433 1 (a) 1395 13 2842 78.3
1999-2000 1441 1 (a) 1432 14 2888 81.3
2000-01 1476 1 (a) 1467 14 2958 83.9
2001-02 1421 1 (a) 1502 14 2938 82.4
2002-03 1433 - - 1522 11 2966 85.8
2003-04 1396 - - 1561 12 2969 84.0
2004-05 1426 A A 1514 14 2954 83.7
2005-06 1330 - - 1592 14 2936 82.2
Note: (a) Means less than 500 hectares +: Not available
Source: Director, Land Records, Government of Haryana, Chandigarh.
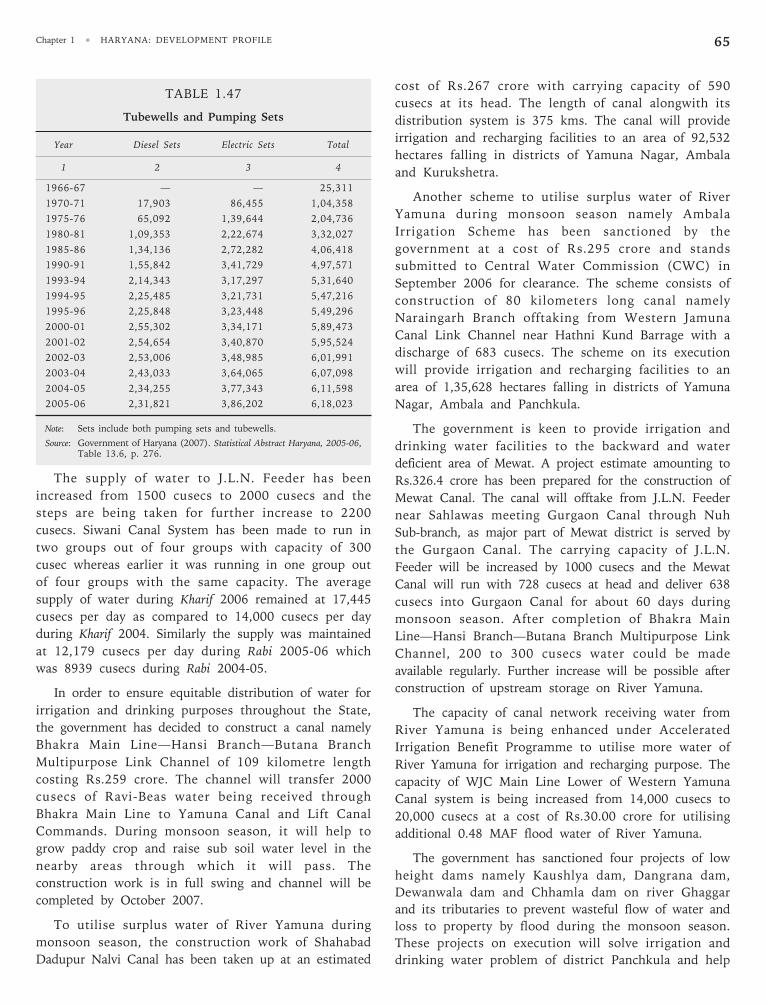
Chapter 1 • HARYANA: DEVELOPMENT PROFILE 65
The supply of water to J.L.N. Feeder has been
increased from 1500 cusecs to 2000 cusecs and the
steps are being taken for further increase to 2200
cusecs. Siwani Canal System has been made to run in
two groups out of four groups with capacity of 300
cusec whereas earlier it was running in one group out
of four groups with the same capacity. The average
supply of water during Kharif 2006 remained at 17,445
cusecs per day as compared to 14,000 cusecs per day
during Kharif 2004. Similarly the supply was maintained
at 12,179 cusecs per day during Rabi 2005-06 which
was 8939 cusecs during Rabi 2004-05.
In order to ensure equitable distribution of water for
irrigation and drinking purposes throughout the State,
the government has decided to construct a canal namely
Bhakra Main Line—Hansi Branch—Butana Branch
Multipurpose Link Channel of 109 kilometre length
costing Rs.259 crore. The channel will transfer 2000
cusecs of Ravi-Beas water being received through
Bhakra Main Line to Yamuna Canal and Lift Canal
Commands. During monsoon season, it will help to
grow paddy crop and raise sub soil water level in the
nearby areas through which it will pass. The
construction work is in full swing and channel will be
completed by October 2007.
To utilise surplus water of River Yamuna during
monsoon season, the construction work of Shahabad
Dadupur Nalvi Canal has been taken up at an estimated
cost of Rs.267 crore with carrying capacity of 590
cusecs at its head. The length of canal alongwith its
distribution system is 375 kms. The canal will provide
irrigation and recharging facilities to an area of 92,532
hectares falling in districts of Yamuna Nagar, Ambala
and Kurukshetra.
Another scheme to utilise surplus water of River
Yamuna during monsoon season namely Ambala
Irrigation Scheme has been sanctioned by the
government at a cost of Rs.295 crore and stands
submitted to Central Water Commission (CWC) in
September 2006 for clearance. The scheme consists of
construction of 80 kilometers long canal namely
Naraingarh Branch offtaking from Western Jamuna
Canal Link Channel near Hathni Kund Barrage with a
discharge of 683 cusecs. The scheme on its execution
will provide irrigation and recharging facilities to an
area of 1,35,628 hectares falling in districts of Yamuna
Nagar, Ambala and Panchkula.
The government is keen to provide irrigation and
drinking water facilities to the backward and water
deficient area of Mewat. A project estimate amounting to
Rs.326.4 crore has been prepared for the construction of
Mewat Canal. The canal will offtake from J.L.N. Feeder
near Sahlawas meeting Gurgaon Canal through Nuh
Sub-branch, as major part of Mewat district is served by
the Gurgaon Canal. The carrying capacity of J.L.N.
Feeder will be increased by 1000 cusecs and the Mewat
Canal will run with 728 cusecs at head and deliver 638
cusecs into Gurgaon Canal for about 60 days during
monsoon season. After completion of Bhakra Main
Line—Hansi Branch—Butana Branch Multipurpose Link
Channel, 200 to 300 cusecs water could be made
available regularly. Further increase will be possible after
construction of upstream storage on River Yamuna.
The capacity of canal network receiving water from
River Yamuna is being enhanced under Accelerated
Irrigation Benefit Programme to utilise more water of
River Yamuna for irrigation and recharging purpose. The
capacity of WJC Main Line Lower of Western Yamuna
Canal system is being increased from 14,000 cusecs to
20,000 cusecs at a cost of Rs.30.00 crore for utilising
additional 0.48 MAF flood water of River Yamuna.
The government has sanctioned four projects of low
height dams namely Kaushlya dam, Dangrana dam,
Dewanwala dam and Chhamla dam on river Ghaggar
and its tributaries to prevent wasteful flow of water and
loss to property by flood during the monsoon season.
These projects on execution will solve irrigation and
drinking water problem of district Panchkula and help
TABLE 1.47
Tubewells and Pumping Sets
Year Diesel Sets Electric Sets Total
1 2 3 4
1966-67 — — 25,311
1970-71 17,903 86,455 1,04,358
1975-76 65,092 1,39,644 2,04,736
1980-81 1,09,353 2,22,674 3,32,027
1985-86 1,34,136 2,72,282 4,06,418
1990-91 1,55,842 3,41,729 4,97,571
1993-94 2,14,343 3,17,297 5,31,640
1994-95 2,25,485 3,21,731 5,47,216
1995-96 2,25,848 3,23,448 5,49,296
2000-01 2,55,302 3,34,171 5,89,473
2001-02 2,54,654 3,40,870 5,95,524
2002-03 2,53,006 3,48,985 6,01,991
2003-04 2,43,033 3,64,065 6,07,098
2004-05 2,34,255 3,77,343 6,11,598
2005-06 2,31,821 3,86,202 6,18,023
Note: Sets include both pumping sets and tubewells.
Source: Government of Haryana (2007). Statistical Abstract Haryana, 2005-06,Table 13.6, p. 276.
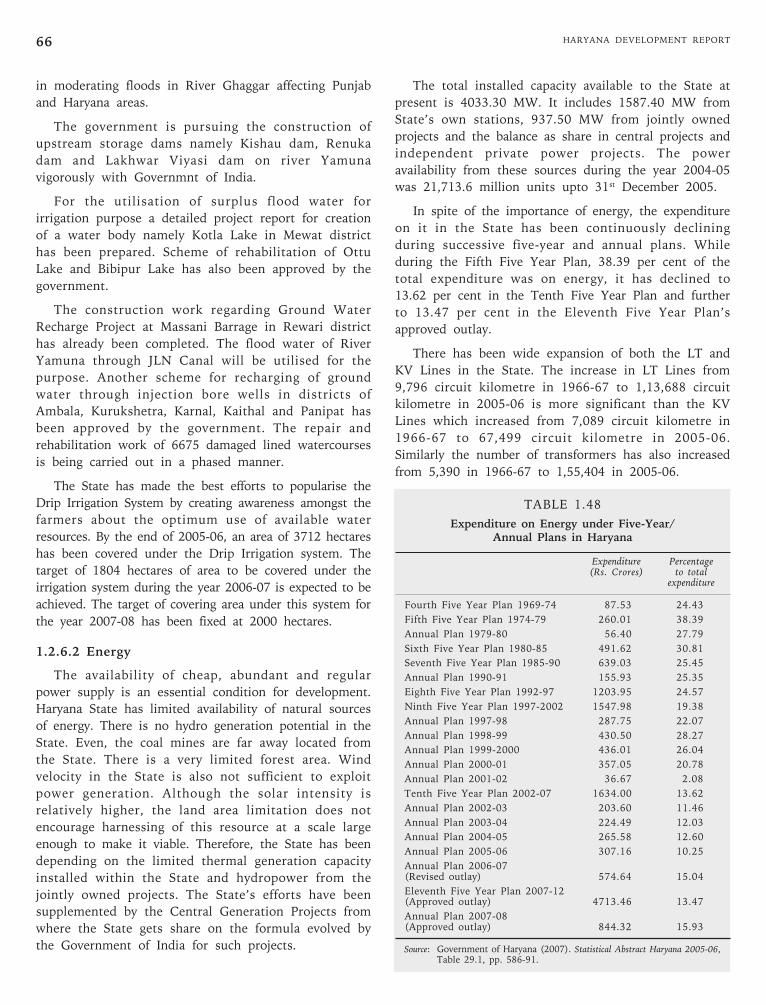
HARYANA DEVELOPMENT REPORT66
The total installed capacity available to the State at
present is 4033.30 MW. It includes 1587.40 MW from
State’s own stations, 937.50 MW from jointly owned
projects and the balance as share in central projects and
independent private power projects. The power
availability from these sources during the year 2004-05
was 21,713.6 million units upto 31st December 2005.
In spite of the importance of energy, the expenditure
on it in the State has been continuously declining
during successive five-year and annual plans. While
during the Fifth Five Year Plan, 38.39 per cent of the
total expenditure was on energy, it has declined to
13.62 per cent in the Tenth Five Year Plan and further
to 13.47 per cent in the Eleventh Five Year Plan’s
approved outlay.
There has been wide expansion of both the LT and
KV Lines in the State. The increase in LT Lines from
9,796 circuit kilometre in 1966-67 to 1,13,688 circuit
kilometre in 2005-06 is more significant than the KV
Lines which increased from 7,089 circuit kilometre in
1966-67 to 67,499 circuit kilometre in 2005-06.
Similarly the number of transformers has also increased
from 5,390 in 1966-67 to 1,55,404 in 2005-06.
TABLE 1.48
Expenditure on Energy under Five-Year/Annual Plans in Haryana
Expenditure Percentage(Rs. Crores) to total
expenditure
Fourth Five Year Plan 1969-74 87.53 24.43
Fifth Five Year Plan 1974-79 260.01 38.39
Annual Plan 1979-80 56.40 27.79
Sixth Five Year Plan 1980-85 491.62 30.81
Seventh Five Year Plan 1985-90 639.03 25.45
Annual Plan 1990-91 155.93 25.35
Eighth Five Year Plan 1992-97 1203.95 24.57
Ninth Five Year Plan 1997-2002 1547.98 19.38
Annual Plan 1997-98 287.75 22.07
Annual Plan 1998-99 430.50 28.27
Annual Plan 1999-2000 436.01 26.04
Annual Plan 2000-01 357.05 20.78
Annual Plan 2001-02 36.67 2.08
Tenth Five Year Plan 2002-07 1634.00 13.62
Annual Plan 2002-03 203.60 11.46
Annual Plan 2003-04 224.49 12.03
Annual Plan 2004-05 265.58 12.60
Annual Plan 2005-06 307.16 10.25
Annual Plan 2006-07(Revised outlay) 574.64 15.04
Eleventh Five Year Plan 2007-12(Approved outlay) 4713.46 13.47
Annual Plan 2007-08(Approved outlay) 844.32 15.93
Source: Government of Haryana (2007). Statistical Abstract Haryana 2005-06,Table 29.1, pp. 586-91.
in moderating floods in River Ghaggar affecting Punjab
and Haryana areas.
The government is pursuing the construction of
upstream storage dams namely Kishau dam, Renuka
dam and Lakhwar Viyasi dam on river Yamuna
vigorously with Governmnt of India.
For the utilisation of surplus flood water for
irrigation purpose a detailed project report for creation
of a water body namely Kotla Lake in Mewat district
has been prepared. Scheme of rehabilitation of Ottu
Lake and Bibipur Lake has also been approved by the
government.
The construction work regarding Ground Water
Recharge Project at Massani Barrage in Rewari district
has already been completed. The flood water of River
Yamuna through JLN Canal will be utilised for the
purpose. Another scheme for recharging of ground
water through injection bore wells in districts of
Ambala, Kurukshetra, Karnal, Kaithal and Panipat has
been approved by the government. The repair and
rehabilitation work of 6675 damaged lined watercourses
is being carried out in a phased manner.
The State has made the best efforts to popularise the
Drip Irrigation System by creating awareness amongst the
farmers about the optimum use of available water
resources. By the end of 2005-06, an area of 3712 hectares
has been covered under the Drip Irrigation system. The
target of 1804 hectares of area to be covered under the
irrigation system during the year 2006-07 is expected to be
achieved. The target of covering area under this system for
the year 2007-08 has been fixed at 2000 hectares.
1.2.6.2 Energy
The availability of cheap, abundant and regular
power supply is an essential condition for development.
Haryana State has limited availability of natural sources
of energy. There is no hydro generation potential in the
State. Even, the coal mines are far away located from
the State. There is a very limited forest area. Wind
velocity in the State is also not sufficient to exploit
power generation. Although the solar intensity is
relatively higher, the land area limitation does not
encourage harnessing of this resource at a scale large
enough to make it viable. Therefore, the State has been
depending on the limited thermal generation capacity
installed within the State and hydropower from the
jointly owned projects. The State’s efforts have been
supplemented by the Central Generation Projects from
where the State gets share on the formula evolved by
the Government of India for such projects.
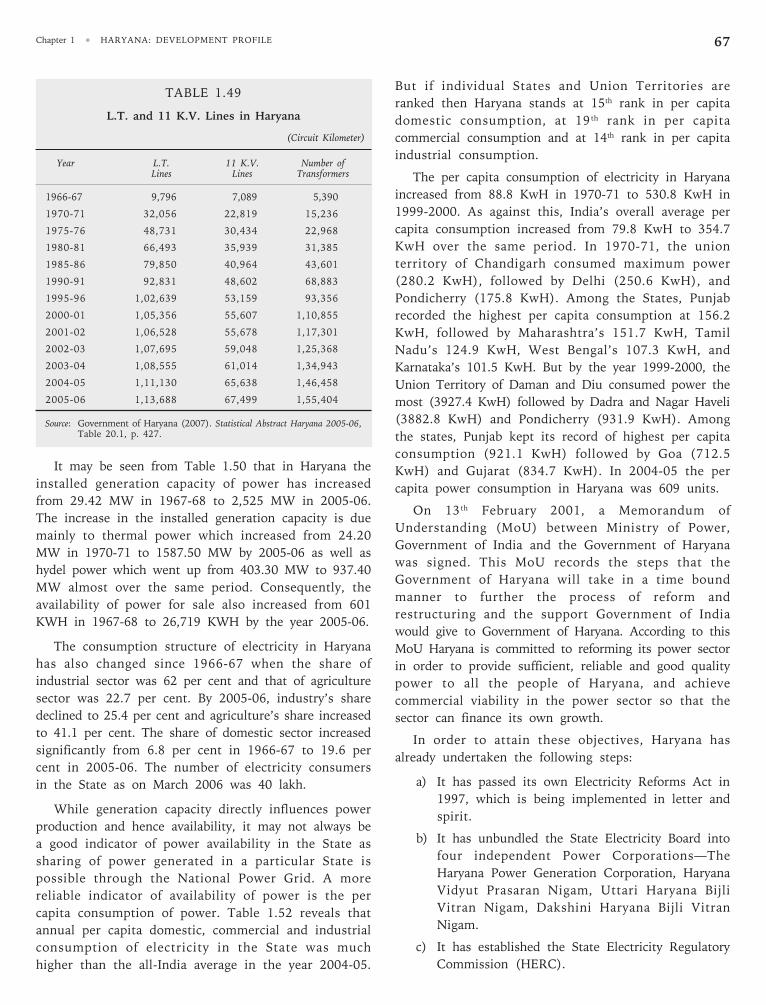
Chapter 1 • HARYANA: DEVELOPMENT PROFILE 67
It may be seen from Table 1.50 that in Haryana the
installed generation capacity of power has increased
from 29.42 MW in 1967-68 to 2,525 MW in 2005-06.
The increase in the installed generation capacity is due
mainly to thermal power which increased from 24.20
MW in 1970-71 to 1587.50 MW by 2005-06 as well as
hydel power which went up from 403.30 MW to 937.40
MW almost over the same period. Consequently, the
availability of power for sale also increased from 601
KWH in 1967-68 to 26,719 KWH by the year 2005-06.
The consumption structure of electricity in Haryana
has also changed since 1966-67 when the share of
industrial sector was 62 per cent and that of agriculture
sector was 22.7 per cent. By 2005-06, industry’s share
declined to 25.4 per cent and agriculture’s share increased
to 41.1 per cent. The share of domestic sector increased
significantly from 6.8 per cent in 1966-67 to 19.6 per
cent in 2005-06. The number of electricity consumers
in the State as on March 2006 was 40 lakh.
While generation capacity directly influences power
production and hence availability, it may not always be
a good indicator of power availability in the State as
sharing of power generated in a particular State is
possible through the National Power Grid. A more
reliable indicator of availability of power is the per
capita consumption of power. Table 1.52 reveals that
annual per capita domestic, commercial and industrial
consumption of electricity in the State was much
higher than the all-India average in the year 2004-05.
But if individual States and Union Territories are
ranked then Haryana stands at 15th rank in per capita
domestic consumption, at 19 th rank in per capita
commercial consumption and at 14th rank in per capita
industrial consumption.
The per capita consumption of electricity in Haryana
increased from 88.8 KwH in 1970-71 to 530.8 KwH in
1999-2000. As against this, India’s overall average per
capita consumption increased from 79.8 KwH to 354.7
KwH over the same period. In 1970-71, the union
territory of Chandigarh consumed maximum power
(280.2 KwH), followed by Delhi (250.6 KwH), and
Pondicherry (175.8 KwH). Among the States, Punjab
recorded the highest per capita consumption at 156.2
KwH, followed by Maharashtra’s 151.7 KwH, Tamil
Nadu’s 124.9 KwH, West Bengal’s 107.3 KwH, and
Karnataka’s 101.5 KwH. But by the year 1999-2000, the
Union Territory of Daman and Diu consumed power the
most (3927.4 KwH) followed by Dadra and Nagar Haveli
(3882.8 KwH) and Pondicherry (931.9 KwH). Among
the states, Punjab kept its record of highest per capita
consumption (921.1 KwH) followed by Goa (712.5
KwH) and Gujarat (834.7 KwH). In 2004-05 the per
capita power consumption in Haryana was 609 units.
On 13 th February 2001, a Memorandum of
Understanding (MoU) between Ministry of Power,
Government of India and the Government of Haryana
was signed. This MoU records the steps that the
Government of Haryana will take in a time bound
manner to further the process of reform and
restructuring and the support Government of India
would give to Government of Haryana. According to this
MoU Haryana is committed to reforming its power sector
in order to provide sufficient, reliable and good quality
power to all the people of Haryana, and achieve
commercial viability in the power sector so that the
sector can finance its own growth.
In order to attain these objectives, Haryana has
already undertaken the following steps:
a) It has passed its own Electricity Reforms Act in
1997, which is being implemented in letter and
spirit.
b) It has unbundled the State Electricity Board into
four independent Power Corporations—The
Haryana Power Generation Corporation, Haryana
Vidyut Prasaran Nigam, Uttari Haryana Bijli
Vitran Nigam, Dakshini Haryana Bijli Vitran
Nigam.
c) It has established the State Electricity Regulatory
Commission (HERC).
TABLE 1.49
L.T. and 11 K.V. Lines in Haryana
(Circuit Kilometer)
Year L.T. 11 K.V. Number ofLines Lines Transformers
1966-67 9,796 7,089 5,390
1970-71 32,056 22,819 15,236
1975-76 48,731 30,434 22,968
1980-81 66,493 35,939 31,385
1985-86 79,850 40,964 43,601
1990-91 92,831 48,602 68,883
1995-96 1,02,639 53,159 93,356
2000-01 1,05,356 55,607 1,10,855
2001-02 1,06,528 55,678 1,17,301
2002-03 1,07,695 59,048 1,25,368
2003-04 1,08,555 61,014 1,34,943
2004-05 1,11,130 65,638 1,46,458
2005-06 1,13,688 67,499 1,55,404
Source: Government of Haryana (2007). Statistical Abstract Haryana 2005-06,Table 20.1, p. 427.
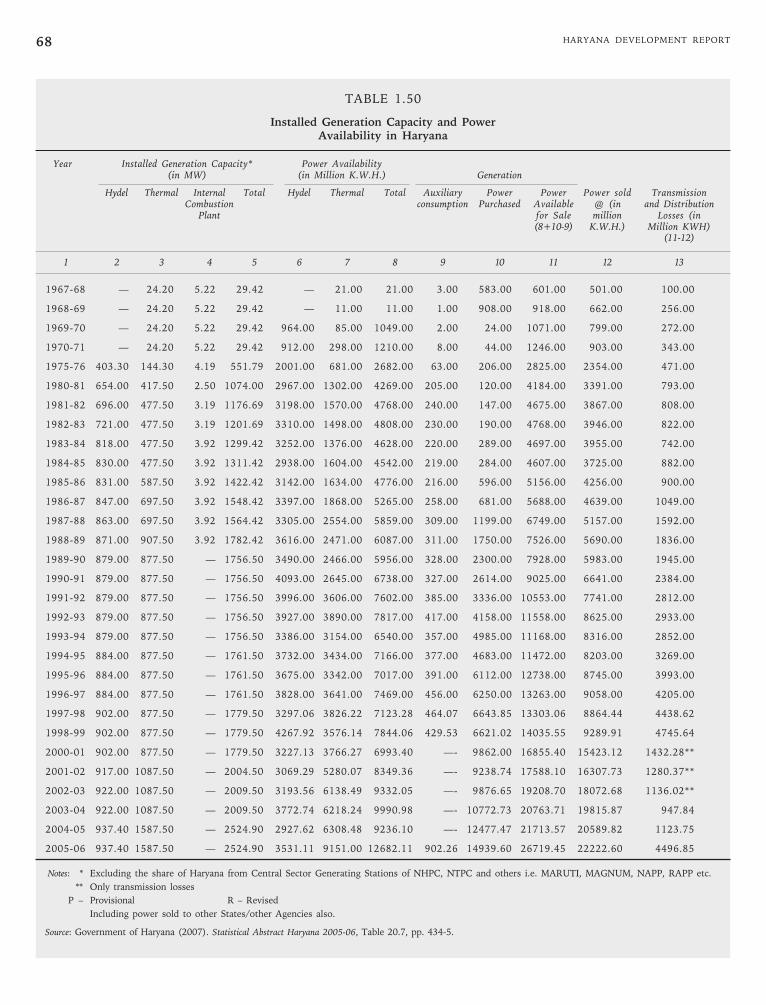
HARYANA DEVELOPMENT REPORT68
TABLE 1.50
Installed Generation Capacity and PowerAvailability in Haryana
Year Installed Generation Capacity* Power Availability(in MW) (in Million K.W.H.) Generation
Hydel Thermal Internal Total Hydel Thermal Total Auxiliary Power Power Power sold TransmissionCombustion consumption Purchased Available @ (in and Distribution
Plant for Sale million Losses (in(8+10-9) K.W.H.) Million KWH)
(11-12)
1 2 3 4 5 6 7 8 9 10 11 12 13
1967-68 — 24.20 5.22 29.42 — 21.00 21.00 3.00 583.00 601.00 501.00 100.00
1968-69 — 24.20 5.22 29.42 — 11.00 11.00 1.00 908.00 918.00 662.00 256.00
1969-70 — 24.20 5.22 29.42 964.00 85.00 1049.00 2.00 24.00 1071.00 799.00 272.00
1970-71 — 24.20 5.22 29.42 912.00 298.00 1210.00 8.00 44.00 1246.00 903.00 343.00
1975-76 403.30 144.30 4.19 551.79 2001.00 681.00 2682.00 63.00 206.00 2825.00 2354.00 471.00
1980-81 654.00 417.50 2.50 1074.00 2967.00 1302.00 4269.00 205.00 120.00 4184.00 3391.00 793.00
1981-82 696.00 477.50 3.19 1176.69 3198.00 1570.00 4768.00 240.00 147.00 4675.00 3867.00 808.00
1982-83 721.00 477.50 3.19 1201.69 3310.00 1498.00 4808.00 230.00 190.00 4768.00 3946.00 822.00
1983-84 818.00 477.50 3.92 1299.42 3252.00 1376.00 4628.00 220.00 289.00 4697.00 3955.00 742.00
1984-85 830.00 477.50 3.92 1311.42 2938.00 1604.00 4542.00 219.00 284.00 4607.00 3725.00 882.00
1985-86 831.00 587.50 3.92 1422.42 3142.00 1634.00 4776.00 216.00 596.00 5156.00 4256.00 900.00
1986-87 847.00 697.50 3.92 1548.42 3397.00 1868.00 5265.00 258.00 681.00 5688.00 4639.00 1049.00
1987-88 863.00 697.50 3.92 1564.42 3305.00 2554.00 5859.00 309.00 1199.00 6749.00 5157.00 1592.00
1988-89 871.00 907.50 3.92 1782.42 3616.00 2471.00 6087.00 311.00 1750.00 7526.00 5690.00 1836.00
1989-90 879.00 877.50 — 1756.50 3490.00 2466.00 5956.00 328.00 2300.00 7928.00 5983.00 1945.00
1990-91 879.00 877.50 — 1756.50 4093.00 2645.00 6738.00 327.00 2614.00 9025.00 6641.00 2384.00
1991-92 879.00 877.50 — 1756.50 3996.00 3606.00 7602.00 385.00 3336.00 10553.00 7741.00 2812.00
1992-93 879.00 877.50 — 1756.50 3927.00 3890.00 7817.00 417.00 4158.00 11558.00 8625.00 2933.00
1993-94 879.00 877.50 — 1756.50 3386.00 3154.00 6540.00 357.00 4985.00 11168.00 8316.00 2852.00
1994-95 884.00 877.50 — 1761.50 3732.00 3434.00 7166.00 377.00 4683.00 11472.00 8203.00 3269.00
1995-96 884.00 877.50 — 1761.50 3675.00 3342.00 7017.00 391.00 6112.00 12738.00 8745.00 3993.00
1996-97 884.00 877.50 — 1761.50 3828.00 3641.00 7469.00 456.00 6250.00 13263.00 9058.00 4205.00
1997-98 902.00 877.50 — 1779.50 3297.06 3826.22 7123.28 464.07 6643.85 13303.06 8864.44 4438.62
1998-99 902.00 877.50 — 1779.50 4267.92 3576.14 7844.06 429.53 6621.02 14035.55 9289.91 4745.64
2000-01 902.00 877.50 — 1779.50 3227.13 3766.27 6993.40 —- 9862.00 16855.40 15423.12 1432.28**
2001-02 917.00 1087.50 — 2004.50 3069.29 5280.07 8349.36 —- 9238.74 17588.10 16307.73 1280.37**
2002-03 922.00 1087.50 — 2009.50 3193.56 6138.49 9332.05 —- 9876.65 19208.70 18072.68 1136.02**
2003-04 922.00 1087.50 — 2009.50 3772.74 6218.24 9990.98 —- 10772.73 20763.71 19815.87 947.84
2004-05 937.40 1587.50 — 2524.90 2927.62 6308.48 9236.10 —- 12477.47 21713.57 20589.82 1123.75
2005-06 937.40 1587.50 — 2524.90 3531.11 9151.00 12682.11 902.26 14939.60 26719.45 22222.60 4496.85
Notes: * Excluding the share of Haryana from Central Sector Generating Stations of NHPC, NTPC and others i.e. MARUTI, MAGNUM, NAPP, RAPP etc.
** Only transmission losses
P – Provisional R – Revised
Including power sold to other States/other Agencies also.
Source: Government of Haryana (2007). Statistical Abstract Haryana 2005-06, Table 20.7, pp. 434-5.
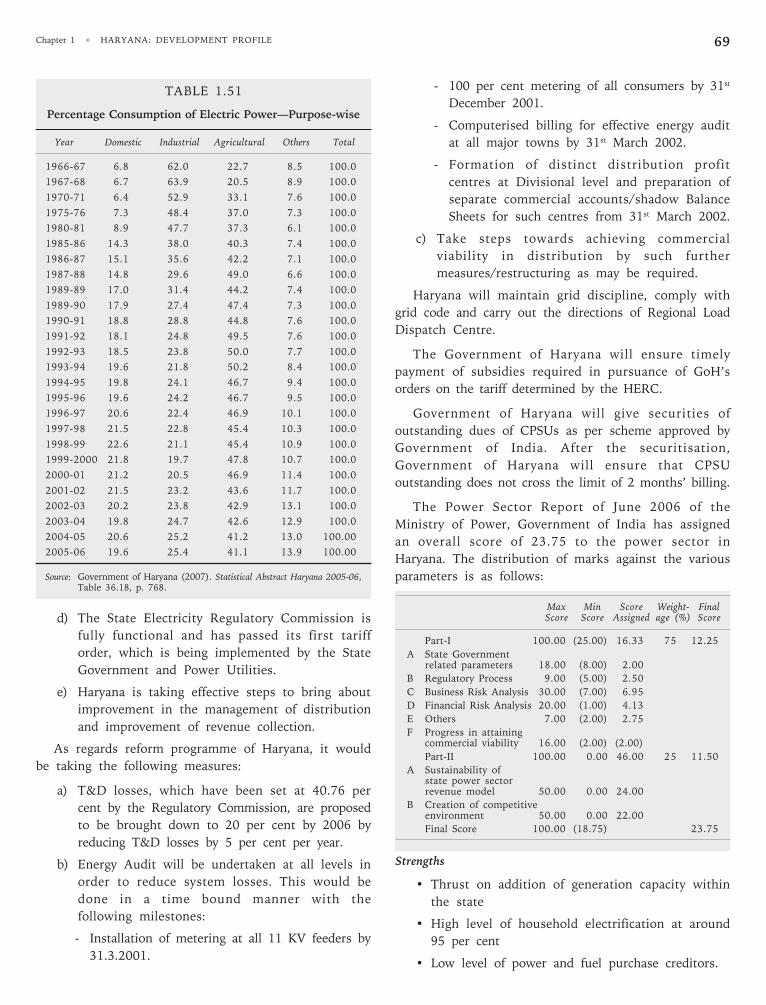
Chapter 1 • HARYANA: DEVELOPMENT PROFILE 69
d) The State Electricity Regulatory Commission is
fully functional and has passed its first tariff
order, which is being implemented by the State
Government and Power Utilities.
e) Haryana is taking effective steps to bring about
improvement in the management of distribution
and improvement of revenue collection.
As regards reform programme of Haryana, it would
be taking the following measures:
a) T&D losses, which have been set at 40.76 per
cent by the Regulatory Commission, are proposed
to be brought down to 20 per cent by 2006 by
reducing T&D losses by 5 per cent per year.
b) Energy Audit will be undertaken at all levels in
order to reduce system losses. This would be
done in a time bound manner with the
following milestones:
- Installation of metering at all 11 KV feeders by
31.3.2001.
- 100 per cent metering of all consumers by 31st
December 2001.
- Computerised billing for effective energy audit
at all major towns by 31st March 2002.
- Formation of distinct distribution profit
centres at Divisional level and preparation of
separate commercial accounts/shadow Balance
Sheets for such centres from 31st March 2002.
c) Take steps towards achieving commercial
viability in distribution by such further
measures/restructuring as may be required.
Haryana will maintain grid discipline, comply with
grid code and carry out the directions of Regional Load
Dispatch Centre.
The Government of Haryana will ensure timely
payment of subsidies required in pursuance of GoH’s
orders on the tariff determined by the HERC.
Government of Haryana will give securities of
outstanding dues of CPSUs as per scheme approved by
Government of India. After the securitisation,
Government of Haryana will ensure that CPSU
outstanding does not cross the limit of 2 months’ billing.
The Power Sector Report of June 2006 of the
Ministry of Power, Government of India has assigned
an overall score of 23.75 to the power sector in
Haryana. The distribution of marks against the various
parameters is as follows:
Max Min Score Weight- FinalScore Score Assigned age (%) Score
Part-I 100.00 (25.00) 16.33 75 12.25
A State Governmentrelated parameters 18.00 (8.00) 2.00
B Regulatory Process 9.00 (5.00) 2.50
C Business Risk Analysis 30.00 (7.00) 6.95
D Financial Risk Analysis 20.00 (1.00) 4.13
E Others 7.00 (2.00) 2.75
F Progress in attainingcommercial viability 16.00 (2.00) (2.00)
Part-II 100.00 0.00 46.00 25 11.50
A Sustainability ofstate power sectorrevenue model 50.00 0.00 24.00
B Creation of competitiveenvironment 50.00 0.00 22.00
Final Score 100.00 (18.75) 23.75
Strengths
• Thrust on addition of generation capacity within
the state
• High level of household electrification at around
95 per cent
• Low level of power and fuel purchase creditors.
TABLE 1.51
Percentage Consumption of Electric Power—Purpose-wise
Year Domestic Industrial Agricultural Others Total
1966-67 6.8 62.0 22.7 8.5 100.0
1967-68 6.7 63.9 20.5 8.9 100.0
1970-71 6.4 52.9 33.1 7.6 100.0
1975-76 7.3 48.4 37.0 7.3 100.0
1980-81 8.9 47.7 37.3 6.1 100.0
1985-86 14.3 38.0 40.3 7.4 100.0
1986-87 15.1 35.6 42.2 7.1 100.0
1987-88 14.8 29.6 49.0 6.6 100.0
1989-89 17.0 31.4 44.2 7.4 100.0
1989-90 17.9 27.4 47.4 7.3 100.0
1990-91 18.8 28.8 44.8 7.6 100.0
1991-92 18.1 24.8 49.5 7.6 100.0
1992-93 18.5 23.8 50.0 7.7 100.0
1993-94 19.6 21.8 50.2 8.4 100.0
1994-95 19.8 24.1 46.7 9.4 100.0
1995-96 19.6 24.2 46.7 9.5 100.0
1996-97 20.6 22.4 46.9 10.1 100.0
1997-98 21.5 22.8 45.4 10.3 100.0
1998-99 22.6 21.1 45.4 10.9 100.0
1999-2000 21.8 19.7 47.8 10.7 100.0
2000-01 21.2 20.5 46.9 11.4 100.0
2001-02 21.5 23.2 43.6 11.7 100.0
2002-03 20.2 23.8 42.9 13.1 100.0
2003-04 19.8 24.7 42.6 12.9 100.0
2004-05 20.6 25.2 41.2 13.0 100.00
2005-06 19.6 25.4 41.1 13.9 100.00
Source: Government of Haryana (2007). Statistical Abstract Haryana 2005-06,Table 36.18, p. 768.
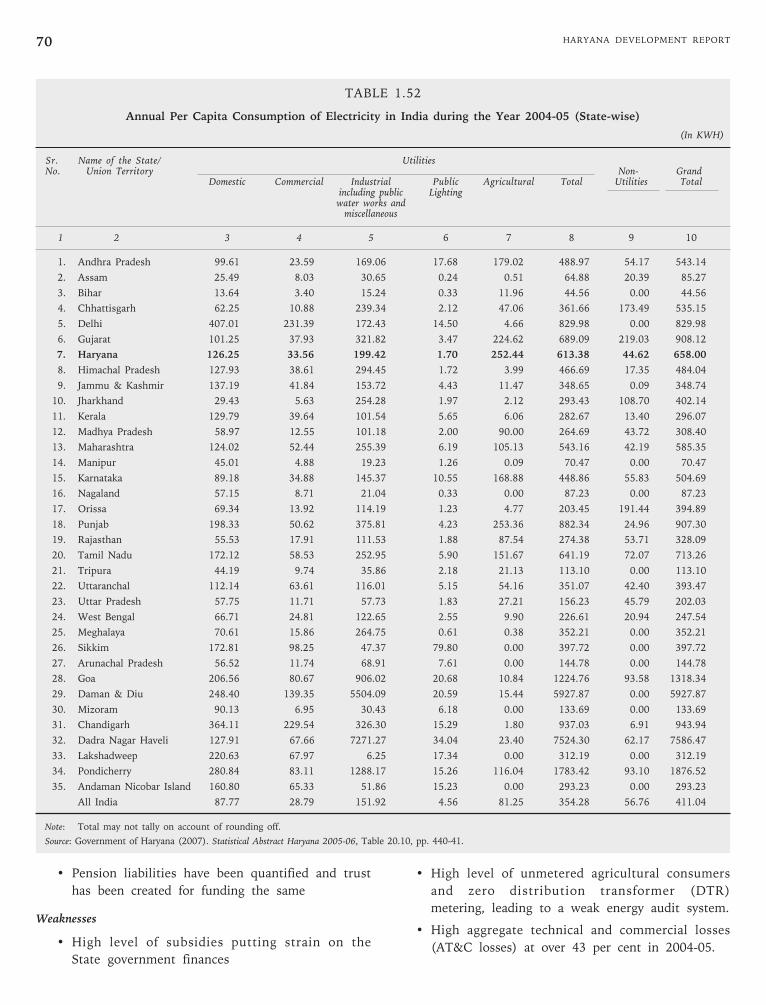
HARYANA DEVELOPMENT REPORT70
TABLE 1.52
Annual Per Capita Consumption of Electricity in India during the Year 2004-05 (State-wise)
(In KWH)
Sr. Name of the State/ UtilitiesNo. Union Territory Non- Grand
Domestic Commercial Industrial Public Agricultural Total Utilities Totalincluding public Lightingwater works and
miscellaneous
1 2 3 4 5 6 7 8 9 10
1. Andhra Pradesh 99.61 23.59 169.06 17.68 179.02 488.97 54.17 543.14
2. Assam 25.49 8.03 30.65 0.24 0.51 64.88 20.39 85.27
3. Bihar 13.64 3.40 15.24 0.33 11.96 44.56 0.00 44.56
4. Chhattisgarh 62.25 10.88 239.34 2.12 47.06 361.66 173.49 535.15
5. Delhi 407.01 231.39 172.43 14.50 4.66 829.98 0.00 829.98
6. Gujarat 101.25 37.93 321.82 3.47 224.62 689.09 219.03 908.12
7. Haryana 126.25 33.56 199.42 1.70 252.44 613.38 44.62 658.00
8. Himachal Pradesh 127.93 38.61 294.45 1.72 3.99 466.69 17.35 484.04
9. Jammu & Kashmir 137.19 41.84 153.72 4.43 11.47 348.65 0.09 348.74
10. Jharkhand 29.43 5.63 254.28 1.97 2.12 293.43 108.70 402.14
11. Kerala 129.79 39.64 101.54 5.65 6.06 282.67 13.40 296.07
12. Madhya Pradesh 58.97 12.55 101.18 2.00 90.00 264.69 43.72 308.40
13. Maharashtra 124.02 52.44 255.39 6.19 105.13 543.16 42.19 585.35
14. Manipur 45.01 4.88 19.23 1.26 0.09 70.47 0.00 70.47
15. Karnataka 89.18 34.88 145.37 10.55 168.88 448.86 55.83 504.69
16. Nagaland 57.15 8.71 21.04 0.33 0.00 87.23 0.00 87.23
17. Orissa 69.34 13.92 114.19 1.23 4.77 203.45 191.44 394.89
18. Punjab 198.33 50.62 375.81 4.23 253.36 882.34 24.96 907.30
19. Rajasthan 55.53 17.91 111.53 1.88 87.54 274.38 53.71 328.09
20. Tamil Nadu 172.12 58.53 252.95 5.90 151.67 641.19 72.07 713.26
21. Tripura 44.19 9.74 35.86 2.18 21.13 113.10 0.00 113.10
22. Uttaranchal 112.14 63.61 116.01 5.15 54.16 351.07 42.40 393.47
23. Uttar Pradesh 57.75 11.71 57.73 1.83 27.21 156.23 45.79 202.03
24. West Bengal 66.71 24.81 122.65 2.55 9.90 226.61 20.94 247.54
25. Meghalaya 70.61 15.86 264.75 0.61 0.38 352.21 0.00 352.21
26. Sikkim 172.81 98.25 47.37 79.80 0.00 397.72 0.00 397.72
27. Arunachal Pradesh 56.52 11.74 68.91 7.61 0.00 144.78 0.00 144.78
28. Goa 206.56 80.67 906.02 20.68 10.84 1224.76 93.58 1318.34
29. Daman & Diu 248.40 139.35 5504.09 20.59 15.44 5927.87 0.00 5927.87
30. Mizoram 90.13 6.95 30.43 6.18 0.00 133.69 0.00 133.69
31. Chandigarh 364.11 229.54 326.30 15.29 1.80 937.03 6.91 943.94
32. Dadra Nagar Haveli 127.91 67.66 7271.27 34.04 23.40 7524.30 62.17 7586.47
33. Lakshadweep 220.63 67.97 6.25 17.34 0.00 312.19 0.00 312.19
34. Pondicherry 280.84 83.11 1288.17 15.26 116.04 1783.42 93.10 1876.52
35. Andaman Nicobar Island 160.80 65.33 51.86 15.23 0.00 293.23 0.00 293.23
All India 87.77 28.79 151.92 4.56 81.25 354.28 56.76 411.04
Note: Total may not tally on account of rounding off.
Source: Government of Haryana (2007). Statistical Abstract Haryana 2005-06, Table 20.10, pp. 440-41.
• Pension liabilities have been quantified and trust
has been created for funding the same
Weaknesses
• High level of subsidies putting strain on the
State government finances
• High level of unmetered agricultural consumers
and zero distribution transformer (DTR)
metering, leading to a weak energy audit system.
• High aggregate technical and commercial losses
(AT&C losses) at over 43 per cent in 2004-05.
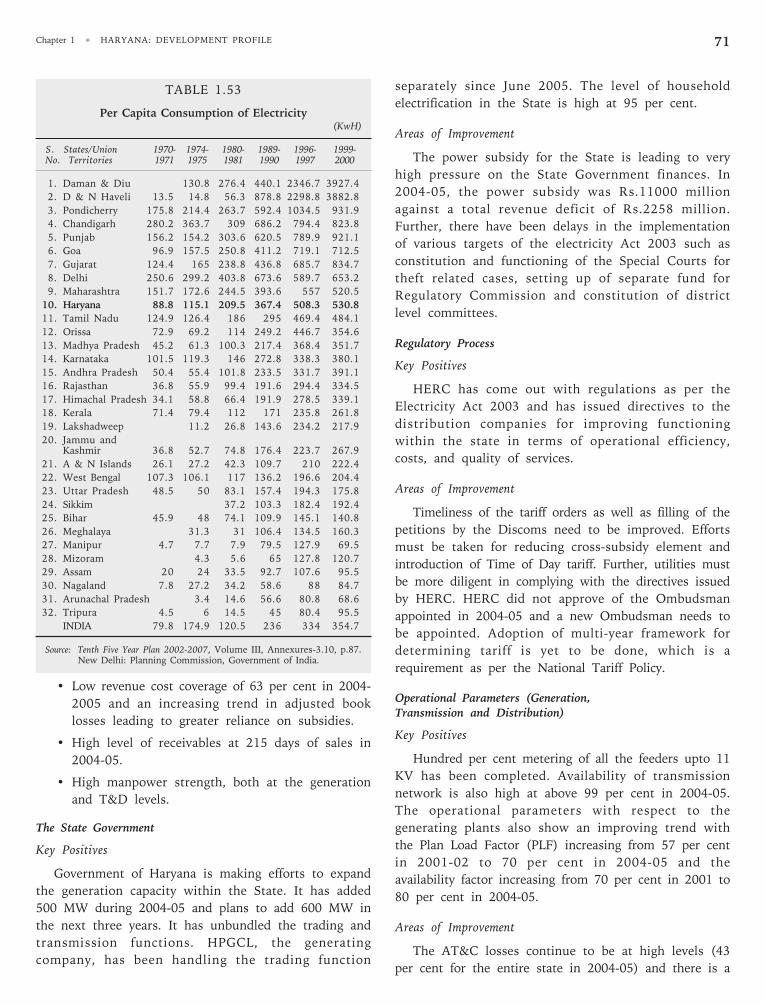
Chapter 1 • HARYANA: DEVELOPMENT PROFILE 71
• Low revenue cost coverage of 63 per cent in 2004-
2005 and an increasing trend in adjusted book
losses leading to greater reliance on subsidies.
• High level of receivables at 215 days of sales in
2004-05.
• High manpower strength, both at the generation
and T&D levels.
The State Government
Key Positives
Government of Haryana is making efforts to expand
the generation capacity within the State. It has added
500 MW during 2004-05 and plans to add 600 MW in
the next three years. It has unbundled the trading and
transmission functions. HPGCL, the generating
company, has been handling the trading function
separately since June 2005. The level of household
electrification in the State is high at 95 per cent.
Areas of Improvement
The power subsidy for the State is leading to very
high pressure on the State Government finances. In
2004-05, the power subsidy was Rs.11000 million
against a total revenue deficit of Rs.2258 million.
Further, there have been delays in the implementation
of various targets of the electricity Act 2003 such as
constitution and functioning of the Special Courts for
theft related cases, setting up of separate fund for
Regulatory Commission and constitution of district
level committees.
Regulatory Process
Key Positives
HERC has come out with regulations as per the
Electricity Act 2003 and has issued directives to the
distribution companies for improving functioning
within the state in terms of operational efficiency,
costs, and quality of services.
Areas of Improvement
Timeliness of the tariff orders as well as filling of the
petitions by the Discoms need to be improved. Efforts
must be taken for reducing cross-subsidy element and
introduction of Time of Day tariff. Further, utilities must
be more diligent in complying with the directives issued
by HERC. HERC did not approve of the Ombudsman
appointed in 2004-05 and a new Ombudsman needs to
be appointed. Adoption of multi-year framework for
determining tariff is yet to be done, which is a
requirement as per the National Tariff Policy.
Operational Parameters (Generation,Transmission and Distribution)
Key Positives
Hundred per cent metering of all the feeders upto 11
KV has been completed. Availability of transmission
network is also high at above 99 per cent in 2004-05.
The operational parameters with respect to the
generating plants also show an improving trend with
the Plan Load Factor (PLF) increasing from 57 per cent
in 2001-02 to 70 per cent in 2004-05 and the
availability factor increasing from 70 per cent in 2001 to
80 per cent in 2004-05.
Areas of Improvement
The AT&C losses continue to be at high levels (43
per cent for the entire state in 2004-05) and there is a
TABLE 1.53
Per Capita Consumption of Electricity(KwH)
S. States/Union 1970- 1974- 1980- 1989- 1996- 1999-No. Territories 1971 1975 1981 1990 1997 2000
1. Daman & Diu 130.8 276.4 440.1 2346.7 3927.4
2. D & N Haveli 13.5 14.8 56.3 878.8 2298.8 3882.8
3. Pondicherry 175.8 214.4 263.7 592.4 1034.5 931.9
4. Chandigarh 280.2 363.7 309 686.2 794.4 823.8
5. Punjab 156.2 154.2 303.6 620.5 789.9 921.1
6. Goa 96.9 157.5 250.8 411.2 719.1 712.5
7. Gujarat 124.4 165 238.8 436.8 685.7 834.7
8. Delhi 250.6 299.2 403.8 673.6 589.7 653.2
9. Maharashtra 151.7 172.6 244.5 393.6 557 520.5
10. Haryana 88.8 115.1 209.5 367.4 508.3 530.8
11. Tamil Nadu 124.9 126.4 186 295 469.4 484.1
12. Orissa 72.9 69.2 114 249.2 446.7 354.6
13. Madhya Pradesh 45.2 61.3 100.3 217.4 368.4 351.7
14. Karnataka 101.5 119.3 146 272.8 338.3 380.1
15. Andhra Pradesh 50.4 55.4 101.8 233.5 331.7 391.1
16. Rajasthan 36.8 55.9 99.4 191.6 294.4 334.5
17. Himachal Pradesh 34.1 58.8 66.4 191.9 278.5 339.1
18. Kerala 71.4 79.4 112 171 235.8 261.8
19. Lakshadweep 11.2 26.8 143.6 234.2 217.9
20. Jammu andKashmir 36.8 52.7 74.8 176.4 223.7 267.9
21. A & N Islands 26.1 27.2 42.3 109.7 210 222.4
22. West Bengal 107.3 106.1 117 136.2 196.6 204.4
23. Uttar Pradesh 48.5 50 83.1 157.4 194.3 175.8
24. Sikkim 37.2 103.3 182.4 192.4
25. Bihar 45.9 48 74.1 109.9 145.1 140.8
26. Meghalaya 31.3 31 106.4 134.5 160.3
27. Manipur 4.7 7.7 7.9 79.5 127.9 69.5
28. Mizoram 4.3 5.6 65 127.8 120.7
29. Assam 20 24 33.5 92.7 107.6 95.5
30. Nagaland 7.8 27.2 34.2 58.6 88 84.7
31. Arunachal Pradesh 3.4 14.6 56.6 80.8 68.6
32. Tripura 4.5 6 14.5 45 80.4 95.5
INDIA 79.8 174.9 120.5 236 334 354.7
Source: Tenth Five Year Plan 2002-2007, Volume III, Annexures-3.10, p.87.New Delhi: Planning Commission, Government of India.
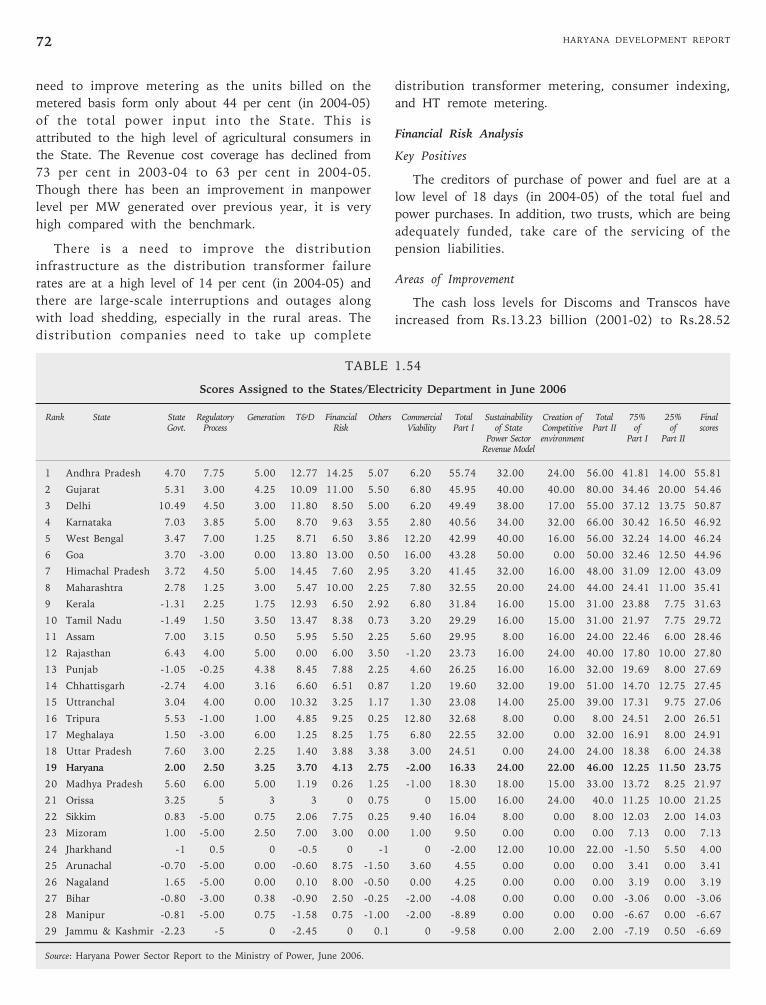
HARYANA DEVELOPMENT REPORT72
need to improve metering as the units billed on the
metered basis form only about 44 per cent (in 2004-05)
of the total power input into the State. This is
attributed to the high level of agricultural consumers in
the State. The Revenue cost coverage has declined from
73 per cent in 2003-04 to 63 per cent in 2004-05.
Though there has been an improvement in manpower
level per MW generated over previous year, it is very
high compared with the benchmark.
There is a need to improve the distribution
infrastructure as the distribution transformer failure
rates are at a high level of 14 per cent (in 2004-05) and
there are large-scale interruptions and outages along
with load shedding, especially in the rural areas. The
distribution companies need to take up complete
distribution transformer metering, consumer indexing,
and HT remote metering.
Financial Risk Analysis
Key Positives
The creditors of purchase of power and fuel are at a
low level of 18 days (in 2004-05) of the total fuel and
power purchases. In addition, two trusts, which are being
adequately funded, take care of the servicing of the
pension liabilities.
Areas of Improvement
The cash loss levels for Discoms and Transcos have
increased from Rs.13.23 billion (2001-02) to Rs.28.52
TABLE 1.54
Scores Assigned to the States/Electricity Department in June 2006
Rank State State Regulatory Generation T&D Financial Others Commercial Total Sustainability Creation of Total 75% 25% FinalGovt. Process Risk Viability Part I of State Competitive Part II of of scores
Power Sector environment Part I Part IIRevenue Model
1 Andhra Pradesh 4.70 7.75 5.00 12.77 14.25 5.07 6.20 55.74 32.00 24.00 56.00 41.81 14.00 55.81
2 Gujarat 5.31 3.00 4.25 10.09 11.00 5.50 6.80 45.95 40.00 40.00 80.00 34.46 20.00 54.46
3 Delhi 10.49 4.50 3.00 11.80 8.50 5.00 6.20 49.49 38.00 17.00 55.00 37.12 13.75 50.87
4 Karnataka 7.03 3.85 5.00 8.70 9.63 3.55 2.80 40.56 34.00 32.00 66.00 30.42 16.50 46.92
5 West Bengal 3.47 7.00 1.25 8.71 6.50 3.86 12.20 42.99 40.00 16.00 56.00 32.24 14.00 46.24
6 Goa 3.70 -3.00 0.00 13.80 13.00 0.50 16.00 43.28 50.00 0.00 50.00 32.46 12.50 44.96
7 Himachal Pradesh 3.72 4.50 5.00 14.45 7.60 2.95 3.20 41.45 32.00 16.00 48.00 31.09 12.00 43.09
8 Maharashtra 2.78 1.25 3.00 5.47 10.00 2.25 7.80 32.55 20.00 24.00 44.00 24.41 11.00 35.41
9 Kerala -1.31 2.25 1.75 12.93 6.50 2.92 6.80 31.84 16.00 15.00 31.00 23.88 7.75 31.63
10 Tamil Nadu -1.49 1.50 3.50 13.47 8.38 0.73 3.20 29.29 16.00 15.00 31.00 21.97 7.75 29.72
11 Assam 7.00 3.15 0.50 5.95 5.50 2.25 5.60 29.95 8.00 16.00 24.00 22.46 6.00 28.46
12 Rajasthan 6.43 4.00 5.00 0.00 6.00 3.50 -1.20 23.73 16.00 24.00 40.00 17.80 10.00 27.80
13 Punjab -1.05 -0.25 4.38 8.45 7.88 2.25 4.60 26.25 16.00 16.00 32.00 19.69 8.00 27.69
14 Chhattisgarh -2.74 4.00 3.16 6.60 6.51 0.87 1.20 19.60 32.00 19.00 51.00 14.70 12.75 27.45
15 Uttranchal 3.04 4.00 0.00 10.32 3.25 1.17 1.30 23.08 14.00 25.00 39.00 17.31 9.75 27.06
16 Tripura 5.53 -1.00 1.00 4.85 9.25 0.25 12.80 32.68 8.00 0.00 8.00 24.51 2.00 26.51
17 Meghalaya 1.50 -3.00 6.00 1.25 8.25 1.75 6.80 22.55 32.00 0.00 32.00 16.91 8.00 24.91
18 Uttar Pradesh 7.60 3.00 2.25 1.40 3.88 3.38 3.00 24.51 0.00 24.00 24.00 18.38 6.00 24.38
19 Haryana 2.00 2.50 3.25 3.70 4.13 2.75 -2.00 16.33 24.00 22.00 46.00 12.25 11.50 23.75
20 Madhya Pradesh 5.60 6.00 5.00 1.19 0.26 1.25 -1.00 18.30 18.00 15.00 33.00 13.72 8.25 21.97
21 Orissa 3.25 5 3 3 0 0.75 0 15.00 16.00 24.00 40.0 11.25 10.00 21.25
22 Sikkim 0.83 -5.00 0.75 2.06 7.75 0.25 9.40 16.04 8.00 0.00 8.00 12.03 2.00 14.03
23 Mizoram 1.00 -5.00 2.50 7.00 3.00 0.00 1.00 9.50 0.00 0.00 0.00 7.13 0.00 7.13
24 Jharkhand -1 0.5 0 -0.5 0 -1 0 -2.00 12.00 10.00 22.00 -1.50 5.50 4.00
25 Arunachal -0.70 -5.00 0.00 -0.60 8.75 -1.50 3.60 4.55 0.00 0.00 0.00 3.41 0.00 3.41
26 Nagaland 1.65 -5.00 0.00 0.10 8.00 -0.50 0.00 4.25 0.00 0.00 0.00 3.19 0.00 3.19
27 Bihar -0.80 -3.00 0.38 -0.90 2.50 -0.25 -2.00 -4.08 0.00 0.00 0.00 -3.06 0.00 -3.06
28 Manipur -0.81 -5.00 0.75 -1.58 0.75 -1.00 -2.00 -8.89 0.00 0.00 0.00 -6.67 0.00 -6.67
29 Jammu & Kashmir -2.23 -5 0 -2.45 0 0.1 0 -9.58 0.00 2.00 2.00 -7.19 0.50 -6.69
Source: Haryana Power Sector Report to the Ministry of Power, June 2006.
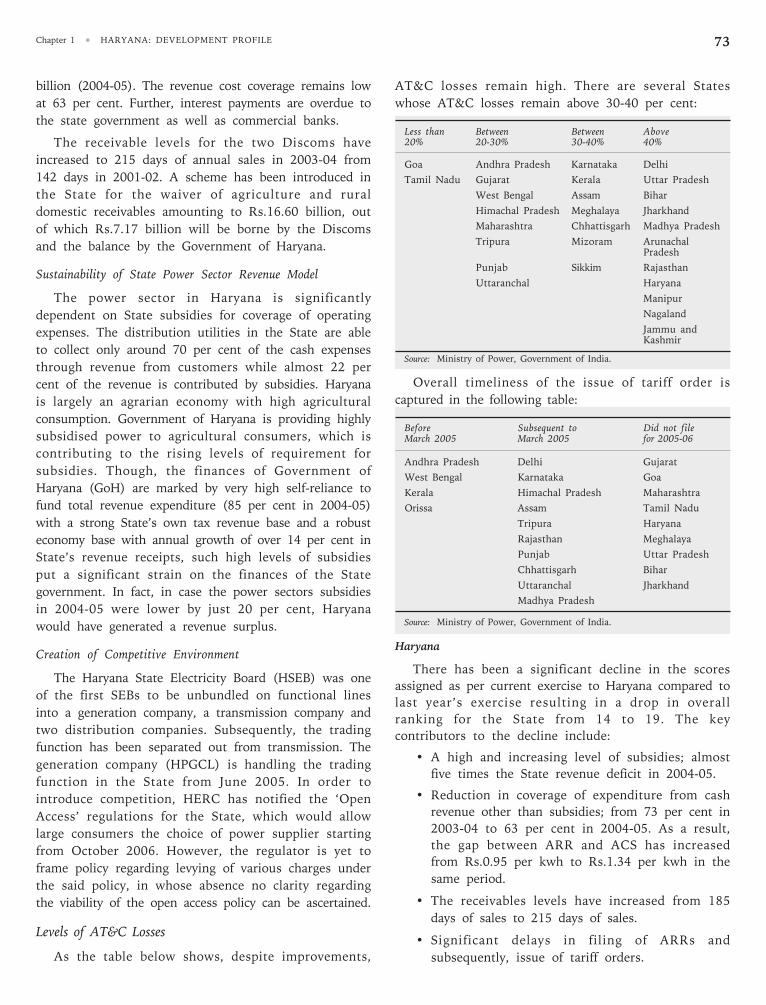
Chapter 1 • HARYANA: DEVELOPMENT PROFILE 73
billion (2004-05). The revenue cost coverage remains low
at 63 per cent. Further, interest payments are overdue to
the state government as well as commercial banks.
The receivable levels for the two Discoms have
increased to 215 days of annual sales in 2003-04 from
142 days in 2001-02. A scheme has been introduced in
the State for the waiver of agriculture and rural
domestic receivables amounting to Rs.16.60 billion, out
of which Rs.7.17 billion will be borne by the Discoms
and the balance by the Government of Haryana.
Sustainability of State Power Sector Revenue Model
The power sector in Haryana is significantly
dependent on State subsidies for coverage of operating
expenses. The distribution utilities in the State are able
to collect only around 70 per cent of the cash expenses
through revenue from customers while almost 22 per
cent of the revenue is contributed by subsidies. Haryana
is largely an agrarian economy with high agricultural
consumption. Government of Haryana is providing highly
subsidised power to agricultural consumers, which is
contributing to the rising levels of requirement for
subsidies. Though, the finances of Government of
Haryana (GoH) are marked by very high self-reliance to
fund total revenue expenditure (85 per cent in 2004-05)
with a strong State’s own tax revenue base and a robust
economy base with annual growth of over 14 per cent in
State’s revenue receipts, such high levels of subsidies
put a significant strain on the finances of the State
government. In fact, in case the power sectors subsidies
in 2004-05 were lower by just 20 per cent, Haryana
would have generated a revenue surplus.
Creation of Competitive Environment
The Haryana State Electricity Board (HSEB) was one
of the first SEBs to be unbundled on functional lines
into a generation company, a transmission company and
two distribution companies. Subsequently, the trading
function has been separated out from transmission. The
generation company (HPGCL) is handling the trading
function in the State from June 2005. In order to
introduce competition, HERC has notified the ‘Open
Access’ regulations for the State, which would allow
large consumers the choice of power supplier starting
from October 2006. However, the regulator is yet to
frame policy regarding levying of various charges under
the said policy, in whose absence no clarity regarding
the viability of the open access policy can be ascertained.
Levels of AT&C Losses
As the table below shows, despite improvements,
AT&C losses remain high. There are several States
whose AT&C losses remain above 30-40 per cent:
Less than Between Between Above20% 20-30% 30-40% 40%
Goa Andhra Pradesh Karnataka Delhi
Tamil Nadu Gujarat Kerala Uttar Pradesh
West Bengal Assam Bihar
Himachal Pradesh Meghalaya Jharkhand
Maharashtra Chhattisgarh Madhya Pradesh
Tripura Mizoram ArunachalPradesh
Punjab Sikkim Rajasthan
Uttaranchal Haryana
Manipur
Nagaland
Jammu andKashmir
Source: Ministry of Power, Government of India.
Overall timeliness of the issue of tariff order is
captured in the following table:
Before Subsequent to Did not fileMarch 2005 March 2005 for 2005-06
Andhra Pradesh Delhi Gujarat
West Bengal Karnataka Goa
Kerala Himachal Pradesh Maharashtra
Orissa Assam Tamil Nadu
Tripura Haryana
Rajasthan Meghalaya
Punjab Uttar Pradesh
Chhattisgarh Bihar
Uttaranchal Jharkhand
Madhya Pradesh
Source: Ministry of Power, Government of India.
Haryana
There has been a significant decline in the scores
assigned as per current exercise to Haryana compared to
last year’s exercise resulting in a drop in overall
ranking for the State from 14 to 19. The key
contributors to the decline include:
• A high and increasing level of subsidies; almost
five times the State revenue deficit in 2004-05.
• Reduction in coverage of expenditure from cash
revenue other than subsidies; from 73 per cent in
2003-04 to 63 per cent in 2004-05. As a result,
the gap between ARR and ACS has increased
from Rs.0.95 per kwh to Rs.1.34 per kwh in the
same period.
• The receivables levels have increased from 185
days of sales to 215 days of sales.
• Significant delays in filing of ARRs and
subsequently, issue of tariff orders.
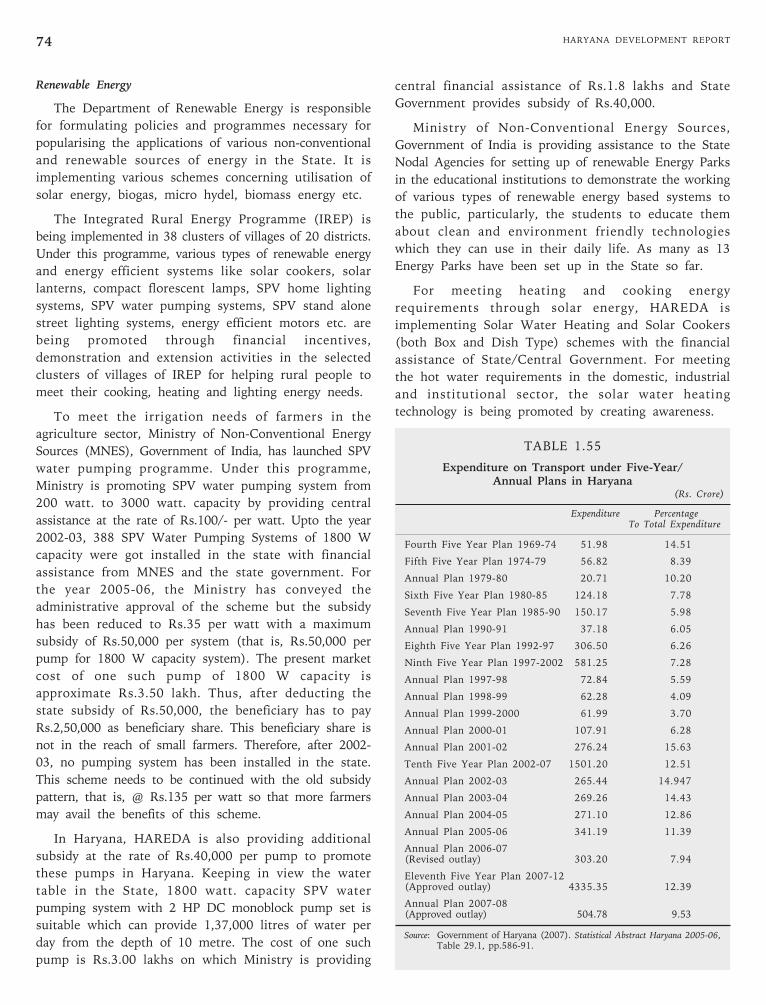
HARYANA DEVELOPMENT REPORT74
central financial assistance of Rs.1.8 lakhs and State
Government provides subsidy of Rs.40,000.
Ministry of Non-Conventional Energy Sources,
Government of India is providing assistance to the State
Nodal Agencies for setting up of renewable Energy Parks
in the educational institutions to demonstrate the working
of various types of renewable energy based systems to
the public, particularly, the students to educate them
about clean and environment friendly technologies
which they can use in their daily life. As many as 13
Energy Parks have been set up in the State so far.
For meeting heating and cooking energy
requirements through solar energy, HAREDA is
implementing Solar Water Heating and Solar Cookers
(both Box and Dish Type) schemes with the financial
assistance of State/Central Government. For meeting
the hot water requirements in the domestic, industrial
and institutional sector, the solar water heating
technology is being promoted by creating awareness.
Renewable Energy
The Department of Renewable Energy is responsible
for formulating policies and programmes necessary for
popularising the applications of various non-conventional
and renewable sources of energy in the State. It is
implementing various schemes concerning utilisation of
solar energy, biogas, micro hydel, biomass energy etc.
The Integrated Rural Energy Programme (IREP) is
being implemented in 38 clusters of villages of 20 districts.
Under this programme, various types of renewable energy
and energy efficient systems like solar cookers, solar
lanterns, compact florescent lamps, SPV home lighting
systems, SPV water pumping systems, SPV stand alone
street lighting systems, energy efficient motors etc. are
being promoted through financial incentives,
demonstration and extension activities in the selected
clusters of villages of IREP for helping rural people to
meet their cooking, heating and lighting energy needs.
To meet the irrigation needs of farmers in the
agriculture sector, Ministry of Non-Conventional Energy
Sources (MNES), Government of India, has launched SPV
water pumping programme. Under this programme,
Ministry is promoting SPV water pumping system from
200 watt. to 3000 watt. capacity by providing central
assistance at the rate of Rs.100/- per watt. Upto the year
2002-03, 388 SPV Water Pumping Systems of 1800 W
capacity were got installed in the state with financial
assistance from MNES and the state government. For
the year 2005-06, the Ministry has conveyed the
administrative approval of the scheme but the subsidy
has been reduced to Rs.35 per watt with a maximum
subsidy of Rs.50,000 per system (that is, Rs.50,000 per
pump for 1800 W capacity system). The present market
cost of one such pump of 1800 W capacity is
approximate Rs.3.50 lakh. Thus, after deducting the
state subsidy of Rs.50,000, the beneficiary has to pay
Rs.2,50,000 as beneficiary share. This beneficiary share is
not in the reach of small farmers. Therefore, after 2002-
03, no pumping system has been installed in the state.
This scheme needs to be continued with the old subsidy
pattern, that is, @ Rs.135 per watt so that more farmers
may avail the benefits of this scheme.
In Haryana, HAREDA is also providing additional
subsidy at the rate of Rs.40,000 per pump to promote
these pumps in Haryana. Keeping in view the water
table in the State, 1800 watt. capacity SPV water
pumping system with 2 HP DC monoblock pump set is
suitable which can provide 1,37,000 litres of water per
day from the depth of 10 metre. The cost of one such
pump is Rs.3.00 lakhs on which Ministry is providing
TABLE 1.55
Expenditure on Transport under Five-Year/Annual Plans in Haryana
(Rs. Crore)
Expenditure PercentageTo Total Expenditure
Fourth Five Year Plan 1969-74 51.98 14.51
Fifth Five Year Plan 1974-79 56.82 8.39
Annual Plan 1979-80 20.71 10.20
Sixth Five Year Plan 1980-85 124.18 7.78
Seventh Five Year Plan 1985-90 150.17 5.98
Annual Plan 1990-91 37.18 6.05
Eighth Five Year Plan 1992-97 306.50 6.26
Ninth Five Year Plan 1997-2002 581.25 7.28
Annual Plan 1997-98 72.84 5.59
Annual Plan 1998-99 62.28 4.09
Annual Plan 1999-2000 61.99 3.70
Annual Plan 2000-01 107.91 6.28
Annual Plan 2001-02 276.24 15.63
Tenth Five Year Plan 2002-07 1501.20 12.51
Annual Plan 2002-03 265.44 14.947
Annual Plan 2003-04 269.26 14.43
Annual Plan 2004-05 271.10 12.86
Annual Plan 2005-06 341.19 11.39
Annual Plan 2006-07(Revised outlay) 303.20 7.94
Eleventh Five Year Plan 2007-12(Approved outlay) 4335.35 12.39
Annual Plan 2007-08(Approved outlay) 504.78 9.53
Source: Government of Haryana (2007). Statistical Abstract Haryana 2005-06,Table 29.1, pp.586-91.
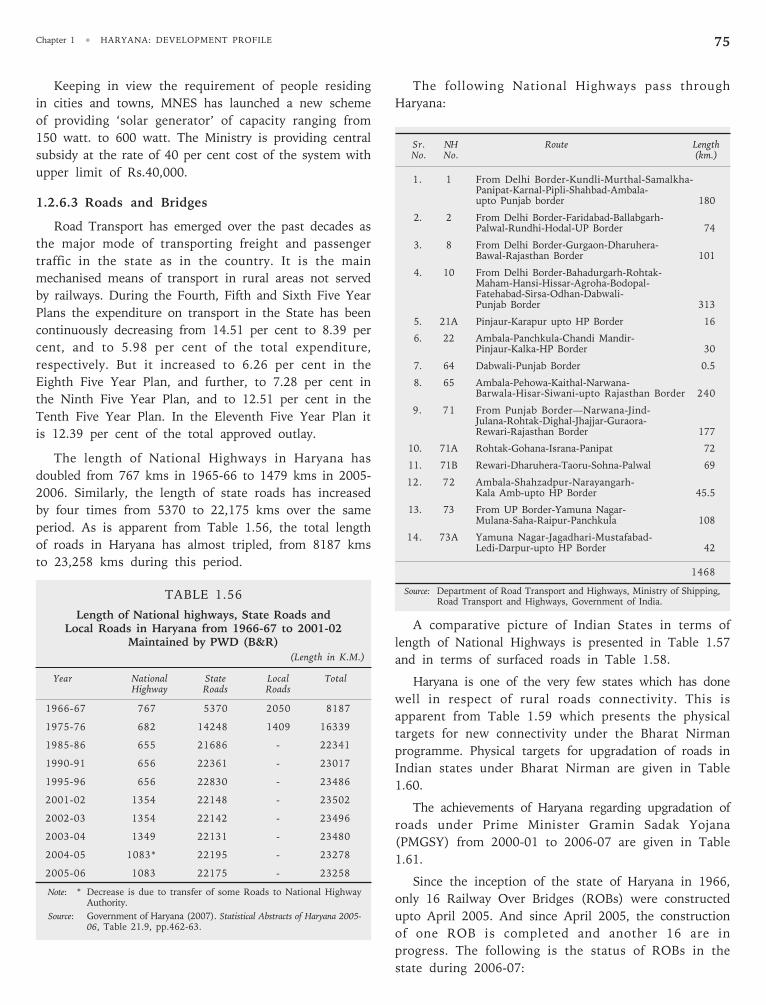
Chapter 1 • HARYANA: DEVELOPMENT PROFILE 75
The following National Highways pass through
Haryana:
Sr. NH Route LengthNo. No. (km.)
1. 1 From Delhi Border-Kundli-Murthal-Samalkha-Panipat-Karnal-Pipli-Shahbad-Ambala-upto Punjab border 180
2. 2 From Delhi Border-Faridabad-Ballabgarh-Palwal-Rundhi-Hodal-UP Border 74
3. 8 From Delhi Border-Gurgaon-Dharuhera-Bawal-Rajasthan Border 101
4. 10 From Delhi Border-Bahadurgarh-Rohtak-Maham-Hansi-Hissar-Agroha-Bodopal-Fatehabad-Sirsa-Odhan-Dabwali-Punjab Border 313
5. 21A Pinjaur-Karapur upto HP Border 16
6. 22 Ambala-Panchkula-Chandi Mandir-Pinjaur-Kalka-HP Border 30
7. 64 Dabwali-Punjab Border 0.5
8. 65 Ambala-Pehowa-Kaithal-Narwana-Barwala-Hisar-Siwani-upto Rajasthan Border 240
9. 71 From Punjab Border—Narwana-Jind-Julana-Rohtak-Dighal-Jhajjar-Guraora-Rewari-Rajasthan Border 177
10. 71A Rohtak-Gohana-Israna-Panipat 72
11. 71B Rewari-Dharuhera-Taoru-Sohna-Palwal 69
12. 72 Ambala-Shahzadpur-Narayangarh-Kala Amb-upto HP Border 45.5
13. 73 From UP Border-Yamuna Nagar-Mulana-Saha-Raipur-Panchkula 108
14. 73A Yamuna Nagar-Jagadhari-Mustafabad-Ledi-Darpur-upto HP Border 42
1468
Source: Department of Road Transport and Highways, Ministry of Shipping,Road Transport and Highways, Government of India.
A comparative picture of Indian States in terms of
length of National Highways is presented in Table 1.57
and in terms of surfaced roads in Table 1.58.
Haryana is one of the very few states which has done
well in respect of rural roads connectivity. This is
apparent from Table 1.59 which presents the physical
targets for new connectivity under the Bharat Nirman
programme. Physical targets for upgradation of roads in
Indian states under Bharat Nirman are given in Table
1.60.
The achievements of Haryana regarding upgradation of
roads under Prime Minister Gramin Sadak Yojana
(PMGSY) from 2000-01 to 2006-07 are given in Table
1.61.
Since the inception of the state of Haryana in 1966,
only 16 Railway Over Bridges (ROBs) were constructed
upto April 2005. And since April 2005, the construction
of one ROB is completed and another 16 are in
progress. The following is the status of ROBs in the
state during 2006-07:
Keeping in view the requirement of people residing
in cities and towns, MNES has launched a new scheme
of providing ‘solar generator’ of capacity ranging from
150 watt. to 600 watt. The Ministry is providing central
subsidy at the rate of 40 per cent cost of the system with
upper limit of Rs.40,000.
1.2.6.3 Roads and Bridges
Road Transport has emerged over the past decades as
the major mode of transporting freight and passenger
traffic in the state as in the country. It is the main
mechanised means of transport in rural areas not served
by railways. During the Fourth, Fifth and Sixth Five Year
Plans the expenditure on transport in the State has been
continuously decreasing from 14.51 per cent to 8.39 per
cent, and to 5.98 per cent of the total expenditure,
respectively. But it increased to 6.26 per cent in the
Eighth Five Year Plan, and further, to 7.28 per cent in
the Ninth Five Year Plan, and to 12.51 per cent in the
Tenth Five Year Plan. In the Eleventh Five Year Plan it
is 12.39 per cent of the total approved outlay.
The length of National Highways in Haryana has
doubled from 767 kms in 1965-66 to 1479 kms in 2005-
2006. Similarly, the length of state roads has increased
by four times from 5370 to 22,175 kms over the same
period. As is apparent from Table 1.56, the total length
of roads in Haryana has almost tripled, from 8187 kms
to 23,258 kms during this period.
TABLE 1.56
Length of National highways, State Roads andLocal Roads in Haryana from 1966-67 to 2001-02
Maintained by PWD (B&R)(Length in K.M.)
Year National State Local TotalHighway Roads Roads
1966-67 767 5370 2050 8187
1975-76 682 14248 1409 16339
1985-86 655 21686 - 22341
1990-91 656 22361 - 23017
1995-96 656 22830 - 23486
2001-02 1354 22148 - 23502
2002-03 1354 22142 - 23496
2003-04 1349 22131 - 23480
2004-05 1083* 22195 - 23278
2005-06 1083 22175 - 23258
Note: * Decrease is due to transfer of some Roads to National HighwayAuthority.
Source: Government of Haryana (2007). Statistical Abstracts of Haryana 2005-06, Table 21.9, pp.462-63.
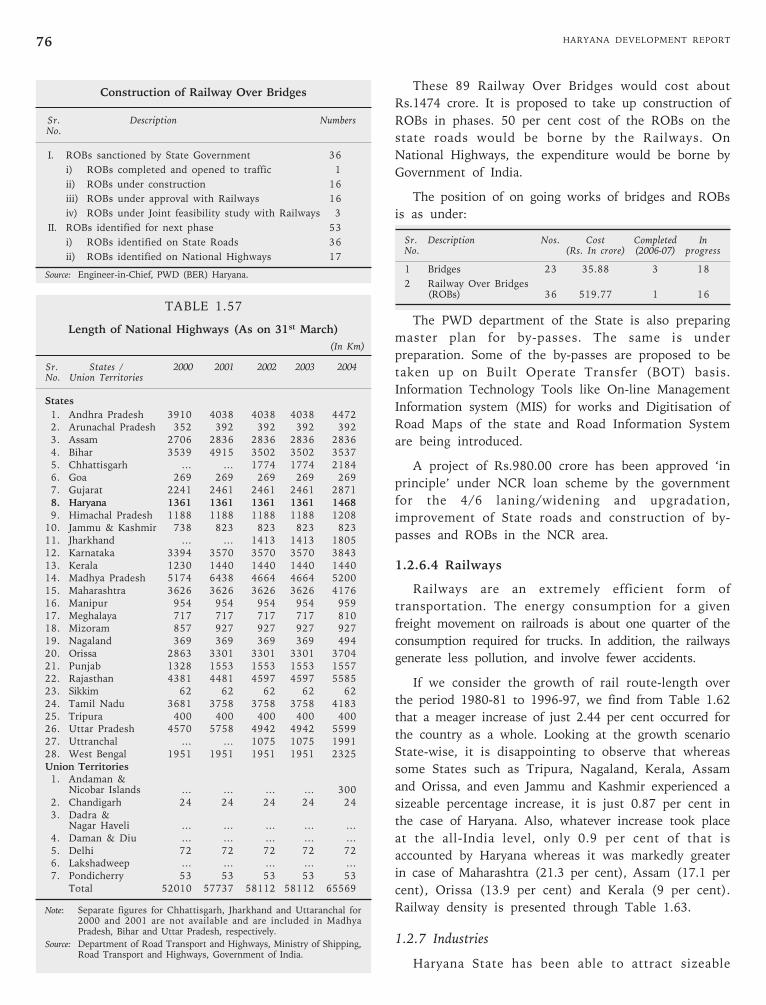
HARYANA DEVELOPMENT REPORT76
Construction of Railway Over Bridges
Sr. Description NumbersNo.
I. ROBs sanctioned by State Government 36
i) ROBs completed and opened to traffic 1
ii) ROBs under construction 16
iii) ROBs under approval with Railways 16
iv) ROBs under Joint feasibility study with Railways 3
II. ROBs identified for next phase 53
i) ROBs identified on State Roads 36
ii) ROBs identified on National Highways 17
Source: Engineer-in-Chief, PWD (BER) Haryana.
TABLE 1.57
Length of National Highways (As on 31st March)
(In Km)
Sr. States / 2000 2001 2002 2003 2004No. Union Territories
States
1. Andhra Pradesh 3910 4038 4038 4038 44722. Arunachal Pradesh 352 392 392 392 3923. Assam 2706 2836 2836 2836 28364. Bihar 3539 4915 3502 3502 35375. Chhattisgarh … … 1774 1774 21846. Goa 269 269 269 269 2697. Gujarat 2241 2461 2461 2461 28718. Haryana 1361 1361 1361 1361 14689. Himachal Pradesh 1188 1188 1188 1188 1208
10. Jammu & Kashmir 738 823 823 823 82311. Jharkhand … … 1413 1413 180512. Karnataka 3394 3570 3570 3570 384313. Kerala 1230 1440 1440 1440 144014. Madhya Pradesh 5174 6438 4664 4664 520015. Maharashtra 3626 3626 3626 3626 417616. Manipur 954 954 954 954 95917. Meghalaya 717 717 717 717 81018. Mizoram 857 927 927 927 92719. Nagaland 369 369 369 369 49420. Orissa 2863 3301 3301 3301 370421. Punjab 1328 1553 1553 1553 155722. Rajasthan 4381 4481 4597 4597 558523. Sikkim 62 62 62 62 6224. Tamil Nadu 3681 3758 3758 3758 418325. Tripura 400 400 400 400 40026. Uttar Pradesh 4570 5758 4942 4942 559927. Uttranchal … … 1075 1075 199128. West Bengal 1951 1951 1951 1951 2325Union Territories
1. Andaman &Nicobar Islands … … … … 300
2. Chandigarh 24 24 24 24 243. Dadra &
Nagar Haveli … … … … …4. Daman & Diu … … … … …5. Delhi 72 72 72 72 726. Lakshadweep … … … … …7. Pondicherry 53 53 53 53 53
Total 52010 57737 58112 58112 65569
Note: Separate figures for Chhattisgarh, Jharkhand and Uttaranchal for2000 and 2001 are not available and are included in MadhyaPradesh, Bihar and Uttar Pradesh, respectively.
Source: Department of Road Transport and Highways, Ministry of Shipping,Road Transport and Highways, Government of India.
These 89 Railway Over Bridges would cost about
Rs.1474 crore. It is proposed to take up construction of
ROBs in phases. 50 per cent cost of the ROBs on the
state roads would be borne by the Railways. On
National Highways, the expenditure would be borne by
Government of India.
The position of on going works of bridges and ROBs
is as under:
Sr. Description Nos. Cost Completed InNo. (Rs. In crore) (2006-07) progress
1 Bridges 23 35.88 3 18
2 Railway Over Bridges(ROBs) 36 519.77 1 16
The PWD department of the State is also preparing
master plan for by-passes. The same is under
preparation. Some of the by-passes are proposed to be
taken up on Built Operate Transfer (BOT) basis.
Information Technology Tools like On-line Management
Information system (MIS) for works and Digitisation of
Road Maps of the state and Road Information System
are being introduced.
A project of Rs.980.00 crore has been approved ‘in
principle’ under NCR loan scheme by the government
for the 4/6 laning/widening and upgradation,
improvement of State roads and construction of by-
passes and ROBs in the NCR area.
1.2.6.4 Railways
Railways are an extremely efficient form of
transportation. The energy consumption for a given
freight movement on railroads is about one quarter of the
consumption required for trucks. In addition, the railways
generate less pollution, and involve fewer accidents.
If we consider the growth of rail route-length over
the period 1980-81 to 1996-97, we find from Table 1.62
that a meager increase of just 2.44 per cent occurred for
the country as a whole. Looking at the growth scenario
State-wise, it is disappointing to observe that whereas
some States such as Tripura, Nagaland, Kerala, Assam
and Orissa, and even Jammu and Kashmir experienced a
sizeable percentage increase, it is just 0.87 per cent in
the case of Haryana. Also, whatever increase took place
at the all-India level, only 0.9 per cent of that is
accounted by Haryana whereas it was markedly greater
in case of Maharashtra (21.3 per cent), Assam (17.1 per
cent), Orissa (13.9 per cent) and Kerala (9 per cent).
Railway density is presented through Table 1.63.
1.2.7 Industries
Haryana State has been able to attract sizeable
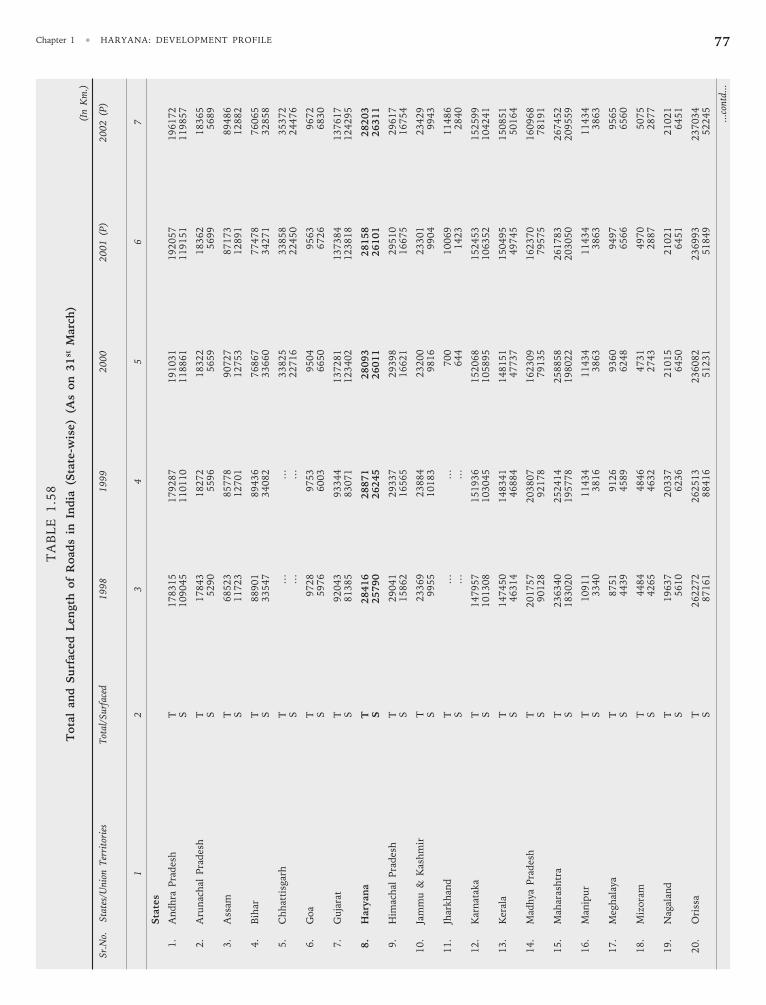
Chapter 1 • HARYANA: DEVELOPMENT PROFILE 77T
AB
LE
1.5
8
Tota
l an
d S
urf
ace
d L
en
gth
of
Road
s in
In
dia
(S
tate
-wis
e)
(As
on
31st M
arc
h)
(In
Km
.)
Sr.
No.
Sta
tes/
Uni
on T
erri
tori
esT
otal
/Sur
face
d1
99
81
99
92
00
02
00
1 (
P)
20
02
(P
)
12
34
56
7
Sta
tes
1.
An
dh
ra P
rad
esh
T1
78
31
51
79
28
71
91
03
11
92
05
71
96
17
2S
10
90
45
11
01
10
11
88
61
11
91
51
11
98
57
2.
Aru
nac
hal
Pra
des
hT
17
84
31
82
72
18
32
21
83
62
18
36
5S
52
90
55
96
56
59
56
99
56
89
3.
Ass
amT
68
52
38
57
78
90
72
78
71
73
89
48
6S
11
72
31
27
01
12
75
31
28
91
12
88
2
4.
Bih
arT
88
90
18
94
36
76
86
77
74
78
76
06
5S
33
54
73
40
82
33
66
03
42
71
32
85
8
5.
Ch
hat
tisg
arh
T…
…3
38
25
33
85
83
53
72
S…
…2
27
16
22
45
02
44
76
6.
Goa
T9
72
89
75
39
50
49
56
39
67
2S
59
76
60
03
66
50
67
26
68
30
7.
Gu
jara
tT
92
04
39
33
44
13
72
81
13
73
84
13
76
17
S8
13
85
83
07
11
23
40
21
23
81
81
24
29
5
8.
Hary
an
aT
28
41
62
88
71
28
09
32
81
58
28
20
3S
25
79
02
62
45
26
01
12
61
01
26
31
1
9.
Him
ach
al P
rad
esh
T2
90
41
29
33
72
93
98
29
51
02
96
17
S1
58
62
16
56
51
66
21
16
67
51
67
54
10.
Jam
mu
& K
ash
mir
T23369
23884
23200
23301
23429
S9
95
51
01
83
98
16
99
04
99
43
11.
Jhar
kh
and
T…
…7
00
10
06
91
14
86
S…
…6
44
14
23
28
40
12.
Kar
nat
aka
T1
47
95
71
51
93
61
52
06
81
52
45
31
52
59
9S
10
13
08
10
30
45
10
58
95
10
63
52
10
42
41
13
.K
eral
aT
14
74
50
14
83
41
14
81
51
15
04
95
15
08
51
S4
63
14
46
88
44
77
37
49
74
55
01
64
14.
Mad
hya
Pra
des
hT
20
17
57
20
38
07
16
23
09
16
23
70
16
09
68
S9
01
28
92
17
87
91
35
79
57
57
81
91
15.
Mah
aras
htr
aT
236340
25
24
14
25
88
58
26
17
83
26
74
52
S1
83
02
01
95
77
81
98
02
22
03
05
02
09
55
9
16.
Man
ipu
rT
10911
11
43
41
14
34
11
43
41
14
34
S3
34
03
81
63
86
33
86
33
86
3
17.
Meg
hal
aya
T8
75
19
12
69
36
09
49
79
56
5S
44
39
45
89
62
48
65
66
65
60
18
.M
izora
mT
44
84
48
46
47
31
49
70
50
75
S4
26
54
63
22
74
32
88
72
87
7
19.
Nag
alan
dT
19
63
72
03
37
21
01
52
10
21
21
02
1S
56
10
62
36
64
50
64
51
64
51
20.
Ori
ssa
T262272
262513
236082
236993
237034
S8
71
61
88
41
65
12
31
51
84
95
22
45
...c
ontd
...
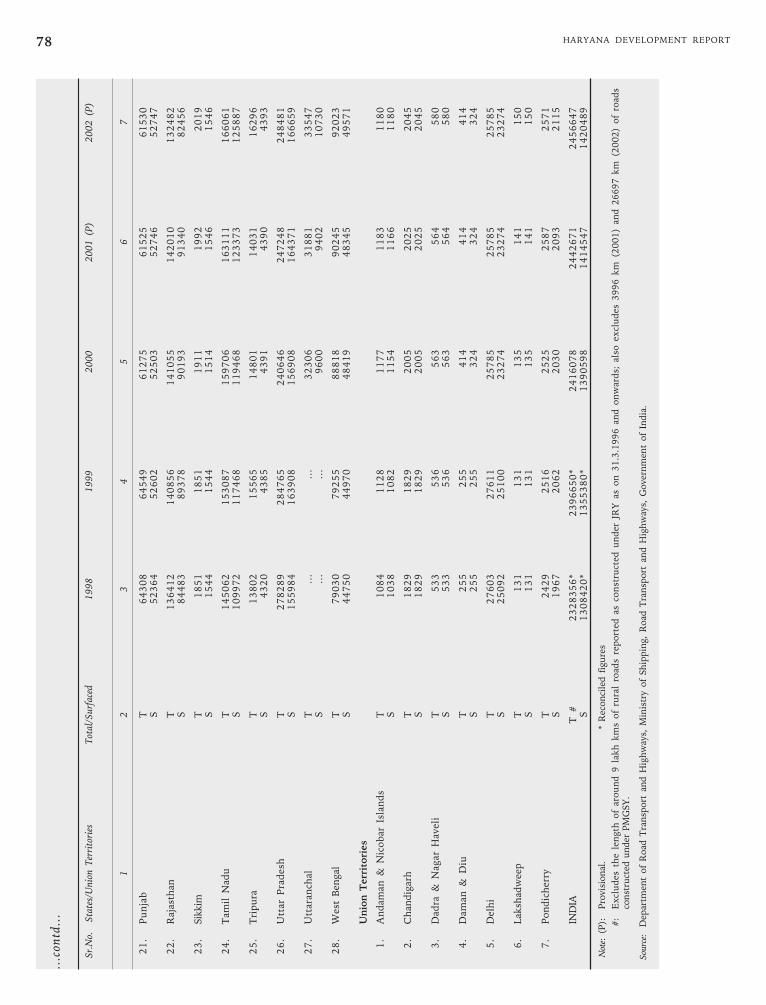
HARYANA DEVELOPMENT REPORT78
21
.P
un
jab
T6
43
08
64
54
96
12
75
61
52
56
15
30
S5
23
64
52
60
25
25
03
52
74
65
27
47
22
.R
ajas
than
T1
36
41
21
40
85
61
41
05
51
42
01
01
32
48
2S
84
48
38
93
78
90
19
39
13
40
82
45
6
23
.Sik
kim
T1
85
11
85
11
91
11
99
22
01
9S
15
44
15
44
15
14
15
46
15
46
24
.T
amil
Nad
uT
14
50
62
15
30
87
15
97
06
16
31
11
16
60
61
S1
09
97
21
17
46
81
19
46
81
23
37
31
25
88
7
25
.T
rip
ura
T1
38
02
15
56
51
48
01
14
03
11
62
96
S4
32
04
38
54
39
14
39
04
39
3
26
.U
ttar
Pra
des
hT
27
82
89
28
47
65
24
06
46
24
72
48
24
84
81
S1
55
98
41
63
90
81
56
90
81
64
37
11
66
65
9
27
.U
ttar
anch
alT
……
32
30
63
18
81
33
54
7S
……
96
00
94
02
10
73
0
28
.W
est
Ben
gal
T7
90
30
79
25
58
88
18
90
24
59
20
23
S4
47
50
44
97
04
84
19
48
34
54
95
71
Un
ion
Terr
itori
es
1.
An
dam
an &
Nic
ob
ar I
slan
ds
T1
08
41
12
81
17
71
18
31
18
0S
10
38
10
82
11
54
11
66
11
80
2.
Ch
and
igar
hT
18
29
18
29
20
05
20
25
20
45
S1
82
91
82
92
00
52
02
52
04
5
3.
Dad
ra &
Nag
ar H
avel
iT
53
35
36
56
35
64
58
0S
53
35
36
56
35
64
58
0
4.
Dam
an &
Diu
T2
55
25
54
14
41
44
14
S2
55
25
53
24
32
43
24
5.
Del
hi
T2
76
03
27
61
12
57
85
25
78
52
57
85
S2
50
92
25
10
02
32
74
23
27
42
32
74
6.
Lak
shad
wee
pT
13
11
31
13
51
41
15
0S
13
11
31
13
51
41
15
0
7.
Po
nd
ich
erry
T2
42
92
51
62
52
52
58
72
57
1S
19
67
20
62
20
30
20
93
21
15
IND
IAT
#2
32
83
56
*2
39
66
50
*2
41
60
78
24
42
67
12
45
66
47
S1
30
84
20
*1
35
53
80
*1
39
05
98
14
14
54
71
42
04
89
Not
e:(P
):P
rovi
sion
al.
* R
econ
cile
d f
igu
res
#:
Excl
ud
es t
he
len
gth
of
aro
un
d 9
lak
h k
ms
of
rura
l ro
ads
rep
ort
ed a
s co
nst
ruct
ed u
nd
er J
RY
as
on
31
.3.1
99
6 a
nd
on
war
ds;
als
o e
xcl
ud
es 3
99
6 k
m (
20
01
) an
d 2
66
97
km
(2
00
2)
of
road
sco
nst
ruct
ed u
nder
PM
GSY
.
Sou
rce:
Dep
artm
ent
of
Road
Tra
nsp
ort
an
d H
igh
way
s, M
inis
try
of
Sh
ipp
ing,
Road
Tra
nsp
ort
an
d H
igh
way
s, G
ove
rnm
ent
of
Ind
ia.
...c
ontd
...
Sr.
No.
Sta
tes/
Uni
on T
erri
tori
esT
otal
/Sur
face
d1
99
81
99
92
00
02
00
1 (
P)
20
02
(P
)
12
34
56
7
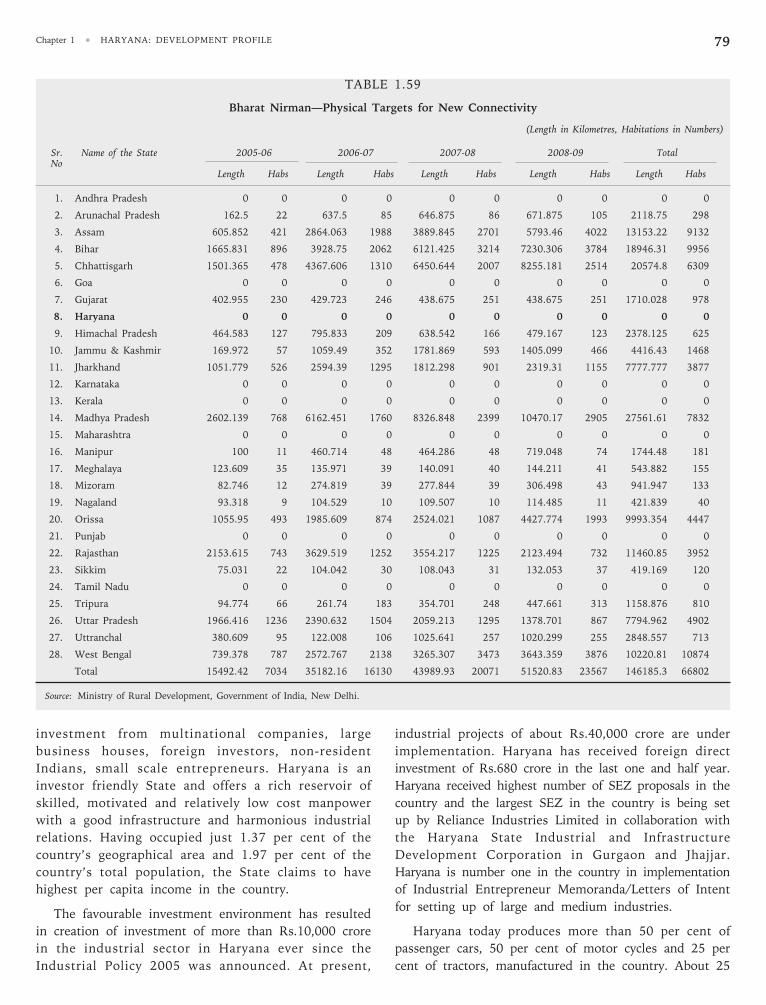
Chapter 1 • HARYANA: DEVELOPMENT PROFILE 79
TABLE 1.59
Bharat Nirman—Physical Targets for New Connectivity
(Length in Kilometres, Habitations in Numbers)
Sr. Name of the State 2005-06 2006-07 2007-08 2008-09 TotalNo
Length Habs Length Habs Length Habs Length Habs Length Habs
1. Andhra Pradesh 0 0 0 0 0 0 0 0 0 0
2. Arunachal Pradesh 162.5 22 637.5 85 646.875 86 671.875 105 2118.75 298
3. Assam 605.852 421 2864.063 1988 3889.845 2701 5793.46 4022 13153.22 9132
4. Bihar 1665.831 896 3928.75 2062 6121.425 3214 7230.306 3784 18946.31 9956
5. Chhattisgarh 1501.365 478 4367.606 1310 6450.644 2007 8255.181 2514 20574.8 6309
6. Goa 0 0 0 0 0 0 0 0 0 0
7. Gujarat 402.955 230 429.723 246 438.675 251 438.675 251 1710.028 978
8. Haryana 0 0 0 0 0 0 0 0 0 0
9. Himachal Pradesh 464.583 127 795.833 209 638.542 166 479.167 123 2378.125 625
10. Jammu & Kashmir 169.972 57 1059.49 352 1781.869 593 1405.099 466 4416.43 1468
11. Jharkhand 1051.779 526 2594.39 1295 1812.298 901 2319.31 1155 7777.777 3877
12. Karnataka 0 0 0 0 0 0 0 0 0 0
13. Kerala 0 0 0 0 0 0 0 0 0 0
14. Madhya Pradesh 2602.139 768 6162.451 1760 8326.848 2399 10470.17 2905 27561.61 7832
15. Maharashtra 0 0 0 0 0 0 0 0 0 0
16. Manipur 100 11 460.714 48 464.286 48 719.048 74 1744.48 181
17. Meghalaya 123.609 35 135.971 39 140.091 40 144.211 41 543.882 155
18. Mizoram 82.746 12 274.819 39 277.844 39 306.498 43 941.947 133
19. Nagaland 93.318 9 104.529 10 109.507 10 114.485 11 421.839 40
20. Orissa 1055.95 493 1985.609 874 2524.021 1087 4427.774 1993 9993.354 4447
21. Punjab 0 0 0 0 0 0 0 0 0 0
22. Rajasthan 2153.615 743 3629.519 1252 3554.217 1225 2123.494 732 11460.85 3952
23. Sikkim 75.031 22 104.042 30 108.043 31 132.053 37 419.169 120
24. Tamil Nadu 0 0 0 0 0 0 0 0 0 0
25. Tripura 94.774 66 261.74 183 354.701 248 447.661 313 1158.876 810
26. Uttar Pradesh 1966.416 1236 2390.632 1504 2059.213 1295 1378.701 867 7794.962 4902
27. Uttranchal 380.609 95 122.008 106 1025.641 257 1020.299 255 2848.557 713
28. West Bengal 739.378 787 2572.767 2138 3265.307 3473 3643.359 3876 10220.81 10874
Total 15492.42 7034 35182.16 16130 43989.93 20071 51520.83 23567 146185.3 66802
Source: Ministry of Rural Development, Government of India, New Delhi.
investment from multinational companies, large
business houses, foreign investors, non-resident
Indians, small scale entrepreneurs. Haryana is an
investor friendly State and offers a rich reservoir of
skilled, motivated and relatively low cost manpower
with a good infrastructure and harmonious industrial
relations. Having occupied just 1.37 per cent of the
country’s geographical area and 1.97 per cent of the
country’s total population, the State claims to have
highest per capita income in the country.
The favourable investment environment has resulted
in creation of investment of more than Rs.10,000 crore
in the industrial sector in Haryana ever since the
Industrial Policy 2005 was announced. At present,
industrial projects of about Rs.40,000 crore are under
implementation. Haryana has received foreign direct
investment of Rs.680 crore in the last one and half year.
Haryana received highest number of SEZ proposals in the
country and the largest SEZ in the country is being set
up by Reliance Industries Limited in collaboration with
the Haryana State Industrial and Infrastructure
Development Corporation in Gurgaon and Jhajjar.
Haryana is number one in the country in implementation
of Industrial Entrepreneur Memoranda/Letters of Intent
for setting up of large and medium industries.
Haryana today produces more than 50 per cent of
passenger cars, 50 per cent of motor cycles and 25 per
cent of tractors, manufactured in the country. About 25
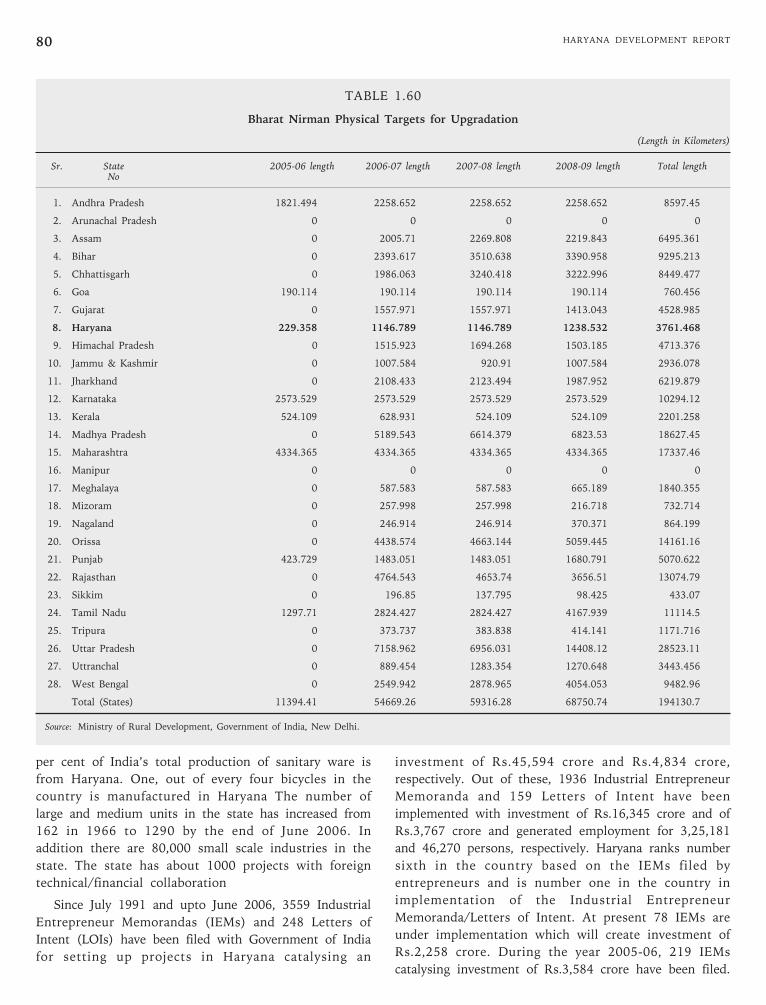
HARYANA DEVELOPMENT REPORT80
per cent of India’s total production of sanitary ware is
from Haryana. One, out of every four bicycles in the
country is manufactured in Haryana The number of
large and medium units in the state has increased from
162 in 1966 to 1290 by the end of June 2006. In
addition there are 80,000 small scale industries in the
state. The state has about 1000 projects with foreign
technical/financial collaboration
Since July 1991 and upto June 2006, 3559 Industrial
Entrepreneur Memorandas (IEMs) and 248 Letters of
Intent (LOIs) have been filed with Government of India
for setting up projects in Haryana catalysing an
investment of Rs.45,594 crore and Rs.4,834 crore,
respectively. Out of these, 1936 Industrial Entrepreneur
Memoranda and 159 Letters of Intent have been
implemented with investment of Rs.16,345 crore and of
Rs.3,767 crore and generated employment for 3,25,181
and 46,270 persons, respectively. Haryana ranks number
sixth in the country based on the IEMs filed by
entrepreneurs and is number one in the country in
implementation of the Industrial Entrepreneur
Memoranda/Letters of Intent. At present 78 IEMs are
under implementation which will create investment of
Rs.2,258 crore. During the year 2005-06, 219 IEMs
catalysing investment of Rs.3,584 crore have been filed.
TABLE 1.60
Bharat Nirman Physical Targets for Upgradation
(Length in Kilometers)
Sr. State 2005-06 length 2006-07 length 2007-08 length 2008-09 length Total lengthNo
1. Andhra Pradesh 1821.494 2258.652 2258.652 2258.652 8597.45
2. Arunachal Pradesh 0 0 0 0 0
3. Assam 0 2005.71 2269.808 2219.843 6495.361
4. Bihar 0 2393.617 3510.638 3390.958 9295.213
5. Chhattisgarh 0 1986.063 3240.418 3222.996 8449.477
6. Goa 190.114 190.114 190.114 190.114 760.456
7. Gujarat 0 1557.971 1557.971 1413.043 4528.985
8. Haryana 229.358 1146.789 1146.789 1238.532 3761.468
9. Himachal Pradesh 0 1515.923 1694.268 1503.185 4713.376
10. Jammu & Kashmir 0 1007.584 920.91 1007.584 2936.078
11. Jharkhand 0 2108.433 2123.494 1987.952 6219.879
12. Karnataka 2573.529 2573.529 2573.529 2573.529 10294.12
13. Kerala 524.109 628.931 524.109 524.109 2201.258
14. Madhya Pradesh 0 5189.543 6614.379 6823.53 18627.45
15. Maharashtra 4334.365 4334.365 4334.365 4334.365 17337.46
16. Manipur 0 0 0 0 0
17. Meghalaya 0 587.583 587.583 665.189 1840.355
18. Mizoram 0 257.998 257.998 216.718 732.714
19. Nagaland 0 246.914 246.914 370.371 864.199
20. Orissa 0 4438.574 4663.144 5059.445 14161.16
21. Punjab 423.729 1483.051 1483.051 1680.791 5070.622
22. Rajasthan 0 4764.543 4653.74 3656.51 13074.79
23. Sikkim 0 196.85 137.795 98.425 433.07
24. Tamil Nadu 1297.71 2824.427 2824.427 4167.939 11114.5
25. Tripura 0 373.737 383.838 414.141 1171.716
26. Uttar Pradesh 0 7158.962 6956.031 14408.12 28523.11
27. Uttranchal 0 889.454 1283.354 1270.648 3443.456
28. West Bengal 0 2549.942 2878.965 4054.053 9482.96
Total (States) 11394.41 54669.26 59316.28 68750.74 194130.7
Source: Ministry of Rural Development, Government of India, New Delhi.
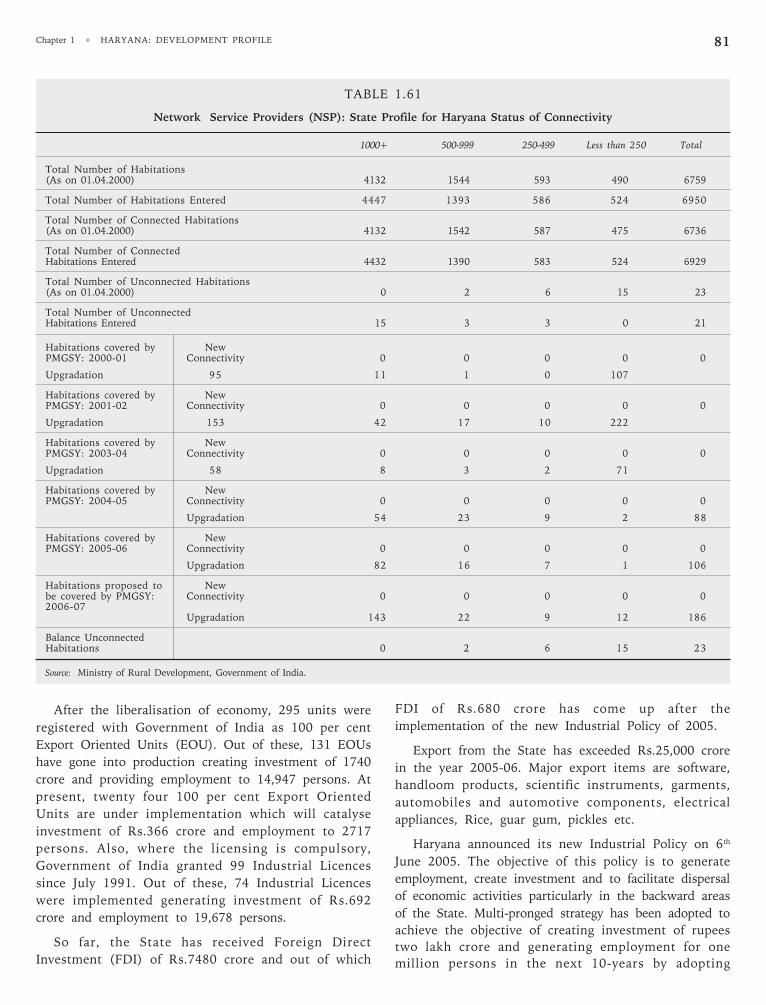
Chapter 1 • HARYANA: DEVELOPMENT PROFILE 81
TABLE 1.61
Network Service Providers (NSP): State Profile for Haryana Status of Connectivity
1000+ 500-999 250-499 Less than 250 Total
Total Number of Habitations(As on 01.04.2000) 4132 1544 593 490 6759
Total Number of Habitations Entered 4447 1393 586 524 6950
Total Number of Connected Habitations(As on 01.04.2000) 4132 1542 587 475 6736
Total Number of ConnectedHabitations Entered 4432 1390 583 524 6929
Total Number of Unconnected Habitations(As on 01.04.2000) 0 2 6 15 23
Total Number of UnconnectedHabitations Entered 15 3 3 0 21
Habitations covered by NewPMGSY: 2000-01 Connectivity 0 0 0 0 0
Upgradation 95 11 1 0 107
Habitations covered by NewPMGSY: 2001-02 Connectivity 0 0 0 0 0
Upgradation 153 42 17 10 222
Habitations covered by NewPMGSY: 2003-04 Connectivity 0 0 0 0 0
Upgradation 58 8 3 2 71
Habitations covered by NewPMGSY: 2004-05 Connectivity 0 0 0 0 0
Upgradation 54 23 9 2 88
Habitations covered by NewPMGSY: 2005-06 Connectivity 0 0 0 0 0
Upgradation 82 16 7 1 106
Habitations proposed to Newbe covered by PMGSY: Connectivity 0 0 0 0 02006-07
Upgradation 143 22 9 12 186
Balance UnconnectedHabitations 0 2 6 15 23
Source: Ministry of Rural Development, Government of India.
After the liberalisation of economy, 295 units were
registered with Government of India as 100 per cent
Export Oriented Units (EOU). Out of these, 131 EOUs
have gone into production creating investment of 1740
crore and providing employment to 14,947 persons. At
present, twenty four 100 per cent Export Oriented
Units are under implementation which will catalyse
investment of Rs.366 crore and employment to 2717
persons. Also, where the licensing is compulsory,
Government of India granted 99 Industrial Licences
since July 1991. Out of these, 74 Industrial Licences
were implemented generating investment of Rs.692
crore and employment to 19,678 persons.
So far, the State has received Foreign Direct
Investment (FDI) of Rs.7480 crore and out of which
FDI of Rs.680 crore has come up after the
implementation of the new Industrial Policy of 2005.
Export from the State has exceeded Rs.25,000 crore
in the year 2005-06. Major export items are software,
handloom products, scientific instruments, garments,
automobiles and automotive components, electrical
appliances, Rice, guar gum, pickles etc.
Haryana announced its new Industrial Policy on 6th
June 2005. The objective of this policy is to generate
employment, create investment and to facilitate dispersal
of economic activities particularly in the backward areas
of the State. Multi-pronged strategy has been adopted to
achieve the objective of creating investment of rupees
two lakh crore and generating employment for one
million persons in the next 10-years by adopting
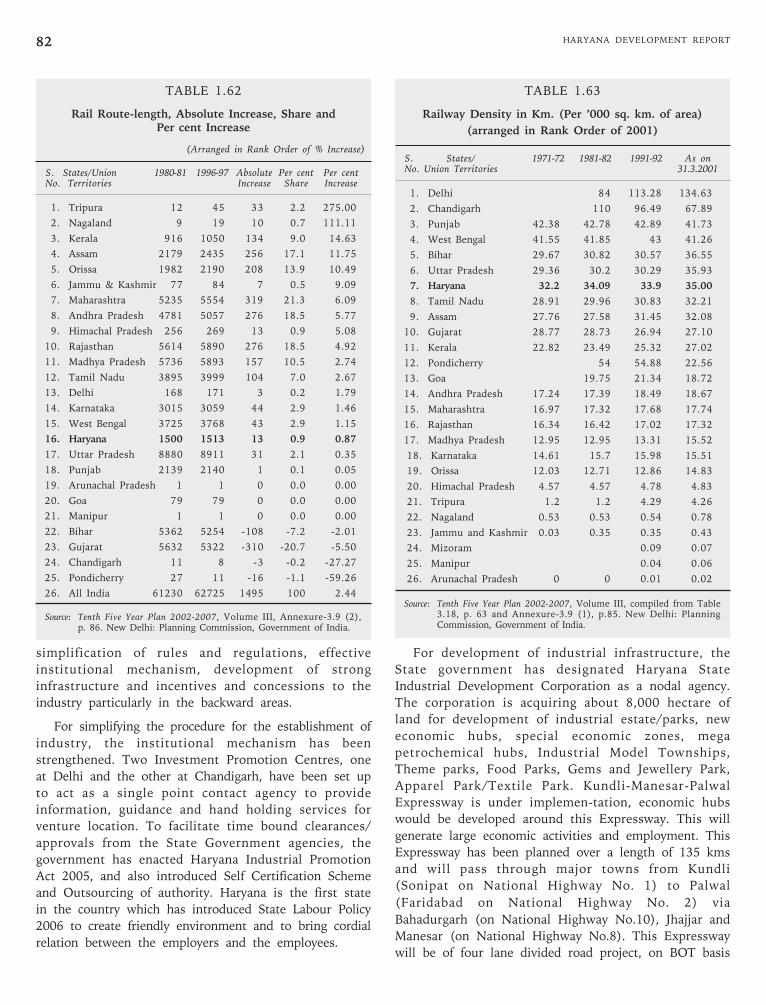
HARYANA DEVELOPMENT REPORT82
simplification of rules and regulations, effective
institutional mechanism, development of strong
infrastructure and incentives and concessions to the
industry particularly in the backward areas.
For simplifying the procedure for the establishment of
industry, the institutional mechanism has been
strengthened. Two Investment Promotion Centres, one
at Delhi and the other at Chandigarh, have been set up
to act as a single point contact agency to provide
information, guidance and hand holding services for
venture location. To facilitate time bound clearances/
approvals from the State Government agencies, the
government has enacted Haryana Industrial Promotion
Act 2005, and also introduced Self Certification Scheme
and Outsourcing of authority. Haryana is the first state
in the country which has introduced State Labour Policy
2006 to create friendly environment and to bring cordial
relation between the employers and the employees.
For development of industrial infrastructure, the
State government has designated Haryana State
Industrial Development Corporation as a nodal agency.
The corporation is acquiring about 8,000 hectare of
land for development of industrial estate/parks, new
economic hubs, special economic zones, mega
petrochemical hubs, Industrial Model Townships,
Theme parks, Food Parks, Gems and Jewellery Park,
Apparel Park/Textile Park. Kundli-Manesar-Palwal
Expressway is under implemen-tation, economic hubs
would be developed around this Expressway. This will
generate large economic activities and employment. This
Expressway has been planned over a length of 135 kms
and will pass through major towns from Kundli
(Sonipat on National Highway No. 1) to Palwal
(Faridabad on National Highway No. 2) via
Bahadurgarh (on National Highway No.10), Jhajjar and
Manesar (on National Highway No.8). This Expressway
will be of four lane divided road project, on BOT basis
TABLE 1.62
Rail Route-length, Absolute Increase, Share andPer cent Increase
(Arranged in Rank Order of % Increase)
S. States/Union 1980-81 1996-97 Absolute Per cent Per centNo. Territories Increase Share Increase
1. Tripura 12 45 33 2.2 275.00
2. Nagaland 9 19 10 0.7 111.11
3. Kerala 916 1050 134 9.0 14.63
4. Assam 2179 2435 256 17.1 11.75
5. Orissa 1982 2190 208 13.9 10.49
6. Jammu & Kashmir 77 84 7 0.5 9.09
7. Maharashtra 5235 5554 319 21.3 6.09
8. Andhra Pradesh 4781 5057 276 18.5 5.77
9. Himachal Pradesh 256 269 13 0.9 5.08
10. Rajasthan 5614 5890 276 18.5 4.92
11. Madhya Pradesh 5736 5893 157 10.5 2.74
12. Tamil Nadu 3895 3999 104 7.0 2.67
13. Delhi 168 171 3 0.2 1.79
14. Karnataka 3015 3059 44 2.9 1.46
15. West Bengal 3725 3768 43 2.9 1.15
16. Haryana 1500 1513 13 0.9 0.87
17. Uttar Pradesh 8880 8911 31 2.1 0.35
18. Punjab 2139 2140 1 0.1 0.05
19. Arunachal Pradesh 1 1 0 0.0 0.00
20. Goa 79 79 0 0.0 0.00
21. Manipur 1 1 0 0.0 0.00
22. Bihar 5362 5254 -108 -7.2 -2.01
23. Gujarat 5632 5322 -310 -20.7 -5.50
24. Chandigarh 11 8 -3 -0.2 -27.27
25. Pondicherry 27 11 -16 -1.1 -59.26
26. All India 61230 62725 1495 100 2.44
Source: Tenth Five Year Plan 2002-2007, Volume III, Annexure-3.9 (2),p. 86. New Delhi: Planning Commission, Government of India.
TABLE 1.63
Railway Density in Km. (Per ’000 sq. km. of area)
(arranged in Rank Order of 2001)
S. States/ 1971-72 1981-82 1991-92 As onNo. Union Territories 31.3.2001
1. Delhi 84 113.28 134.63
2. Chandigarh 110 96.49 67.89
3. Punjab 42.38 42.78 42.89 41.73
4. West Bengal 41.55 41.85 43 41.26
5. Bihar 29.67 30.82 30.57 36.55
6. Uttar Pradesh 29.36 30.2 30.29 35.93
7. Haryana 32.2 34.09 33.9 35.00
8. Tamil Nadu 28.91 29.96 30.83 32.21
9. Assam 27.76 27.58 31.45 32.08
10. Gujarat 28.77 28.73 26.94 27.10
11. Kerala 22.82 23.49 25.32 27.02
12. Pondicherry 54 54.88 22.56
13. Goa 19.75 21.34 18.72
14. Andhra Pradesh 17.24 17.39 18.49 18.67
15. Maharashtra 16.97 17.32 17.68 17.74
16. Rajasthan 16.34 16.42 17.02 17.32
17. Madhya Pradesh 12.95 12.95 13.31 15.52
18. Karnataka 14.61 15.7 15.98 15.51
19. Orissa 12.03 12.71 12.86 14.83
20. Himachal Pradesh 4.57 4.57 4.78 4.83
21. Tripura 1.2 1.2 4.29 4.26
22. Nagaland 0.53 0.53 0.54 0.78
23. Jammu and Kashmir 0.03 0.35 0.35 0.43
24. Mizoram 0.09 0.07
25. Manipur 0.04 0.06
26. Arunachal Pradesh 0 0 0.01 0.02
Source: Tenth Five Year Plan 2002-2007, Volume III, compiled from Table3.18, p. 63 and Annexure-3.9 (1), p.85. New Delhi: PlanningCommission, Government of India.
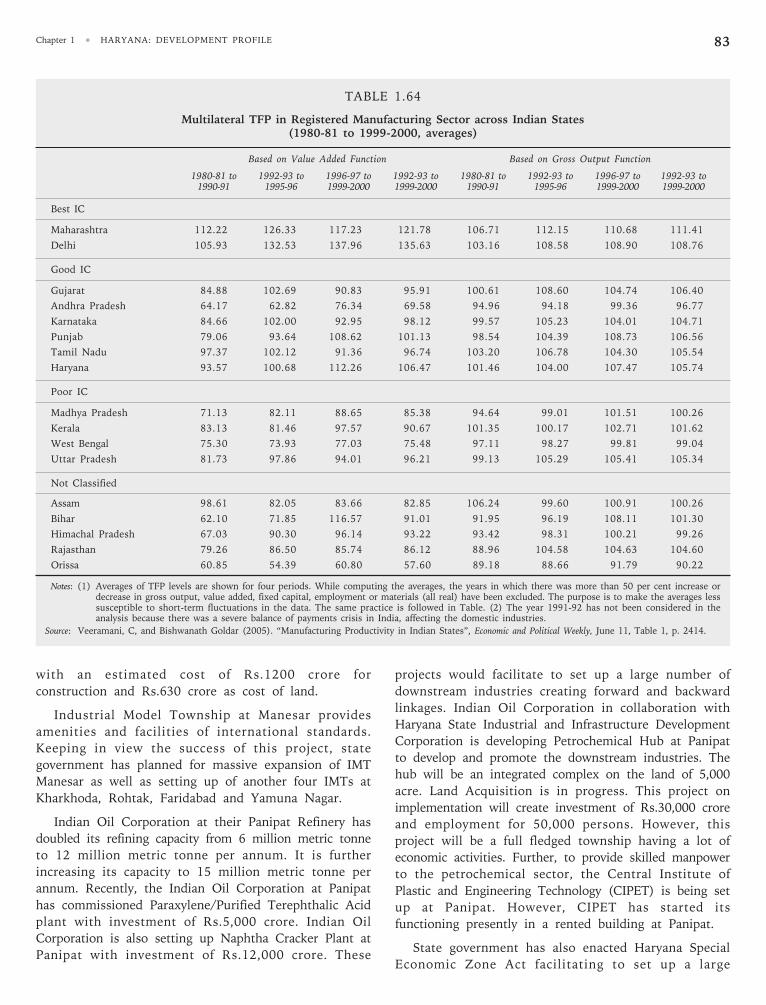
Chapter 1 • HARYANA: DEVELOPMENT PROFILE 83
with an estimated cost of Rs.1200 crore for
construction and Rs.630 crore as cost of land.
Industrial Model Township at Manesar provides
amenities and facilities of international standards.
Keeping in view the success of this project, state
government has planned for massive expansion of IMT
Manesar as well as setting up of another four IMTs at
Kharkhoda, Rohtak, Faridabad and Yamuna Nagar.
Indian Oil Corporation at their Panipat Refinery has
doubled its refining capacity from 6 million metric tonne
to 12 million metric tonne per annum. It is further
increasing its capacity to 15 million metric tonne per
annum. Recently, the Indian Oil Corporation at Panipat
has commissioned Paraxylene/Purified Terephthalic Acid
plant with investment of Rs.5,000 crore. Indian Oil
Corporation is also setting up Naphtha Cracker Plant at
Panipat with investment of Rs.12,000 crore. These
projects would facilitate to set up a large number of
downstream industries creating forward and backward
linkages. Indian Oil Corporation in collaboration with
Haryana State Industrial and Infrastructure Development
Corporation is developing Petrochemical Hub at Panipat
to develop and promote the downstream industries. The
hub will be an integrated complex on the land of 5,000
acre. Land Acquisition is in progress. This project on
implementation will create investment of Rs.30,000 crore
and employment for 50,000 persons. However, this
project will be a full fledged township having a lot of
economic activities. Further, to provide skilled manpower
to the petrochemical sector, the Central Institute of
Plastic and Engineering Technology (CIPET) is being set
up at Panipat. However, CIPET has started its
functioning presently in a rented building at Panipat.
State government has also enacted Haryana Special
Economic Zone Act facilitating to set up a large
TABLE 1.64
Multilateral TFP in Registered Manufacturing Sector across Indian States(1980-81 to 1999-2000, averages)
Based on Value Added Function Based on Gross Output Function
1980-81 to 1992-93 to 1996-97 to 1992-93 to 1980-81 to 1992-93 to 1996-97 to 1992-93 to1990-91 1995-96 1999-2000 1999-2000 1990-91 1995-96 1999-2000 1999-2000
Best IC
Maharashtra 112.22 126.33 117.23 121.78 106.71 112.15 110.68 111.41
Delhi 105.93 132.53 137.96 135.63 103.16 108.58 108.90 108.76
Good IC
Gujarat 84.88 102.69 90.83 95.91 100.61 108.60 104.74 106.40
Andhra Pradesh 64.17 62.82 76.34 69.58 94.96 94.18 99.36 96.77
Karnataka 84.66 102.00 92.95 98.12 99.57 105.23 104.01 104.71
Punjab 79.06 93.64 108.62 101.13 98.54 104.39 108.73 106.56
Tamil Nadu 97.37 102.12 91.36 96.74 103.20 106.78 104.30 105.54
Haryana 93.57 100.68 112.26 106.47 101.46 104.00 107.47 105.74
Poor IC
Madhya Pradesh 71.13 82.11 88.65 85.38 94.64 99.01 101.51 100.26
Kerala 83.13 81.46 97.57 90.67 101.35 100.17 102.71 101.62
West Bengal 75.30 73.93 77.03 75.48 97.11 98.27 99.81 99.04
Uttar Pradesh 81.73 97.86 94.01 96.21 99.13 105.29 105.41 105.34
Not Classified
Assam 98.61 82.05 83.66 82.85 106.24 99.60 100.91 100.26
Bihar 62.10 71.85 116.57 91.01 91.95 96.19 108.11 101.30
Himachal Pradesh 67.03 90.30 96.14 93.22 93.42 98.31 100.21 99.26
Rajasthan 79.26 86.50 85.74 86.12 88.96 104.58 104.63 104.60
Orissa 60.85 54.39 60.80 57.60 89.18 88.66 91.79 90.22
Notes: (1) Averages of TFP levels are shown for four periods. While computing the averages, the years in which there was more than 50 per cent increase ordecrease in gross output, value added, fixed capital, employment or materials (all real) have been excluded. The purpose is to make the averages lesssusceptible to short-term fluctuations in the data. The same practice is followed in Table. (2) The year 1991-92 has not been considered in theanalysis because there was a severe balance of payments crisis in India, affecting the domestic industries.
Source: Veeramani, C, and Bishwanath Goldar (2005). “Manufacturing Productivity in Indian States”, Economic and Political Weekly, June 11, Table 1, p. 2414.
HARYANA DEVELOPMENT REPORT84
number of industries having export commitments. So
far 63 proposals to set up Special Economic Zones
(SEZs) in Haryana catalysing industrial infrastructure
investment of Rs.1.75 lakh crore have been received.
Out of these, 37 proposals have ‘in principle’ approval
from the Government of India. It is envisaged that
industrial investment of Rs.1.50 lakh crore for ten lakh
persons over the years will be created through these
SEZs. Reliance Industries Limited has signed a MoU
with the Haryana State Industrial and Infrastructure
Development Corporation to set up mega Special
Economic Zone in a joint venture at Gurgaon and
Jhajjar. This project would be developed on 10,000
hectare of land. Infrastructure investment on this
project is of the order of Rs.40,000 crore and would
catalyse industrial investment of about Rs.1.00 lakh
crore and generate employment for five lakh persons.
As mentioned in the State Industrial Policy of 2005,
State government is providing several incentives and
concessions to the industry including Interest Free Loan
in lieu of Value Added Tax, exemption of electricity duty,
customised package of incentives, exemption from LADT,
and subsidy on freight for exporting units. As a result of
the new Industrial Policy of 2005, 29 new, large and
medium industrial units with an investment of Rs.348
crore providing employment to 3365 persons and 1356
small scale units with an investment of Rs.31 crore
providing employment to 8415 persons have been
established since the implementation of this policy.
Industrial projects having investment of Rs.10,000 crore
generating employment for 15,000 persons have been
implemented.
Based on the growth potential and contribution to
the long term economic development of the State, the
following sectors have been identified as the thrust
areas in the Industrial Policy of 2005:
i) Agro based and Food Processing Industries.
ii) Electronics and Information and Communication
Technology.
iii) Automobiles and Automotive components.
iv) Handloom, Hosiery, Textile and Garment
manufacturing.
v) Export oriented units.
vi) Footwear, leather garment and accessories.
Haryana is an agrarian economy. A large part of
population of the State is engaged in agriculture and
allied activities. It contributes about 45 lakh tonnes of
foodgrain every year to the central pool. Basmati Rice of
Haryana finds an easy market abroad and the State ranks
number one in its export. There is a large scope for the
growth of agri-business, animal husbandry and dairying
in the State of Haryana. Crop diversification, efficiencies
in logistics, storage and distribution of foodgrains can
substantially contribute to this sector. Haryana
government is keen to encourage the investment in agro
processing sector. The State government has taken
several initiatives and has provided a number of
incentives in the new industrial policy for promotion of
food processing industry. The thrust is to create best
infrastructure for the growth of this sector.
The Government of India, Ministry of Food
Processing Industry, is in the process of setting up of
National Institute of Food Technology,
Entrepreneurship and Management (NIFTEM) in the
State at a project cost of about Rs.350 crore. The
project will be the first of its kind in India. Haryana
State Industrial and Infrastructure Development
Corporation has offered to allot 100 acres of land for
this project at Kundli. Food Parks at Rai (Sonipat) and
Saha (Ambala) have been established.
An Irradiation Centre has been set up in private
sector at Bahalgarh in district Sonipat with investment
of Rs.18 crore. The facilities provided will increase the
shelf life of food products. Container Corporation of
India is setting up a Cold Chain Project at Rai in
district Sonipat. A Modern Fruit and Vegetable market
along with processing industries to make value addition
and prevent wastage of farm produce is also being set
up in Sonipat.
Haryana is number one State in the country so far as
production of passenger cars and two wheelers are
concerned. Gurgaon and Faridabad are the major auto-
mobile centres in the State. The presence of established
manufacturers Maruti Suzuki, Honda Motors, Hero
Group, Yamaha Group and Escorts has contributed a lot
to develop ancillary automotive components. Industrial
Model Township, Manesar is developing as a prominent
cluster of automobiles and autocomponents. Maruti
Udyog Limited is undertaking its massive expansion
programme at Manesar creating fresh investment of
Rs.8,000 crore. They are doubling the capacity of
passenger cars and also putting up diesel engine project
in Manesar.
For the promotion of automobile industry,
government of India, Ministry of Heavy Industries is
setting up National Automotive Testing and R&D
Infrastructure Project (NTRIP) at a cost of Rs.400 crore
at IMT, Manesar. State government is providing 40 acres
of land for this project.
Haryana is a pioneer in producing textiles and ready
made garments. Orient Craft Limited is the largest
exporter of readymade garments in the country. The
state has the inherent advantage of manufacturing
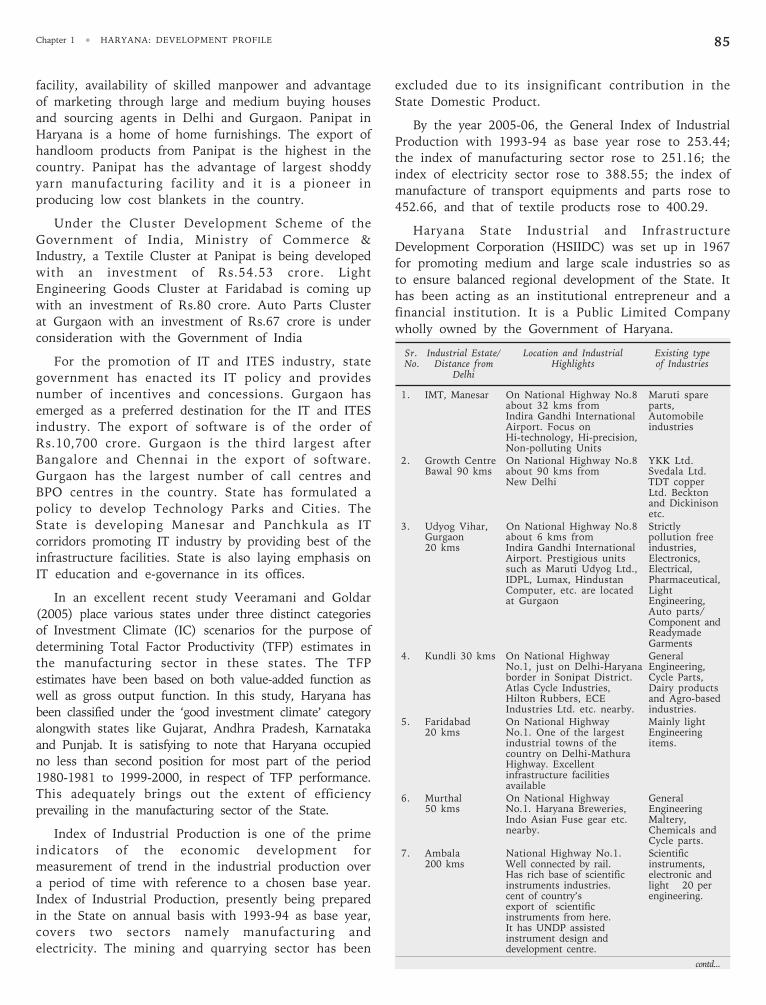
Chapter 1 • HARYANA: DEVELOPMENT PROFILE 85
facility, availability of skilled manpower and advantage
of marketing through large and medium buying houses
and sourcing agents in Delhi and Gurgaon. Panipat in
Haryana is a home of home furnishings. The export of
handloom products from Panipat is the highest in the
country. Panipat has the advantage of largest shoddy
yarn manufacturing facility and it is a pioneer in
producing low cost blankets in the country.
Under the Cluster Development Scheme of the
Government of India, Ministry of Commerce &
Industry, a Textile Cluster at Panipat is being developed
with an investment of Rs.54.53 crore. Light
Engineering Goods Cluster at Faridabad is coming up
with an investment of Rs.80 crore. Auto Parts Cluster
at Gurgaon with an investment of Rs.67 crore is under
consideration with the Government of India
For the promotion of IT and ITES industry, state
government has enacted its IT policy and provides
number of incentives and concessions. Gurgaon has
emerged as a preferred destination for the IT and ITES
industry. The export of software is of the order of
Rs.10,700 crore. Gurgaon is the third largest after
Bangalore and Chennai in the export of software.
Gurgaon has the largest number of call centres and
BPO centres in the country. State has formulated a
policy to develop Technology Parks and Cities. The
State is developing Manesar and Panchkula as IT
corridors promoting IT industry by providing best of the
infrastructure facilities. State is also laying emphasis on
IT education and e-governance in its offices.
In an excellent recent study Veeramani and Goldar
(2005) place various states under three distinct categories
of Investment Climate (IC) scenarios for the purpose of
determining Total Factor Productivity (TFP) estimates in
the manufacturing sector in these states. The TFP
estimates have been based on both value-added function as
well as gross output function. In this study, Haryana has
been classified under the ‘good investment climate’ category
alongwith states like Gujarat, Andhra Pradesh, Karnataka
and Punjab. It is satisfying to note that Haryana occupied
no less than second position for most part of the period
1980-1981 to 1999-2000, in respect of TFP performance.
This adequately brings out the extent of efficiency
prevailing in the manufacturing sector of the State.
Index of Industrial Production is one of the prime
indicators of the economic development for
measurement of trend in the industrial production over
a period of time with reference to a chosen base year.
Index of Industrial Production, presently being prepared
in the State on annual basis with 1993-94 as base year,
covers two sectors namely manufacturing and
electricity. The mining and quarrying sector has been
excluded due to its insignificant contribution in the
State Domestic Product.
By the year 2005-06, the General Index of Industrial
Production with 1993-94 as base year rose to 253.44;
the index of manufacturing sector rose to 251.16; the
index of electricity sector rose to 388.55; the index of
manufacture of transport equipments and parts rose to
452.66, and that of textile products rose to 400.29.
Haryana State Industrial and Infrastructure
Development Corporation (HSIIDC) was set up in 1967
for promoting medium and large scale industries so as
to ensure balanced regional development of the State. It
has been acting as an institutional entrepreneur and a
financial institution. It is a Public Limited Company
wholly owned by the Government of Haryana.
Sr. Industrial Estate/ Location and Industrial Existing typeNo. Distance from Highlights of Industries
Delhi
1. IMT, Manesar On National Highway No.8 Maruti spareabout 32 kms from parts,Indira Gandhi International AutomobileAirport. Focus on industriesHi-technology, Hi-precision,Non-polluting Units
2. Growth Centre On National Highway No.8 YKK Ltd.Bawal 90 kms about 90 kms from Svedala Ltd.
New Delhi TDT copperLtd. Becktonand Dickinisonetc.
3. Udyog Vihar, On National Highway No.8 StrictlyGurgaon about 6 kms from pollution free20 kms Indira Gandhi International industries,
Airport. Prestigious units Electronics,such as Maruti Udyog Ltd., Electrical,IDPL, Lumax, Hindustan Pharmaceutical,Computer, etc. are located Lightat Gurgaon Engineering,
Auto parts/Component andReadymadeGarments
4. Kundli 30 kms On National Highway GeneralNo.1, just on Delhi-Haryana Engineering,border in Sonipat District. Cycle Parts,Atlas Cycle Industries, Dairy productsHilton Rubbers, ECE and Agro-basedIndustries Ltd. etc. nearby. industries.
5. Faridabad On National Highway Mainly light20 kms No.1. One of the largest Engineering
industrial towns of the items.country on Delhi-MathuraHighway. Excellentinfrastructure facilitiesavailable
6. Murthal On National Highway General50 kms No.1. Haryana Breweries, Engineering
Indo Asian Fuse gear etc. Maltery,nearby. Chemicals and
Cycle parts.7. Ambala National Highway No.1. Scientific
200 kms Well connected by rail. instruments,Has rich base of scientific electronic andinstruments industries. light 20 percent of country’s engineering.export of scientificinstruments from here.It has UNDP assistedinstrument design anddevelopment centre.
contd...
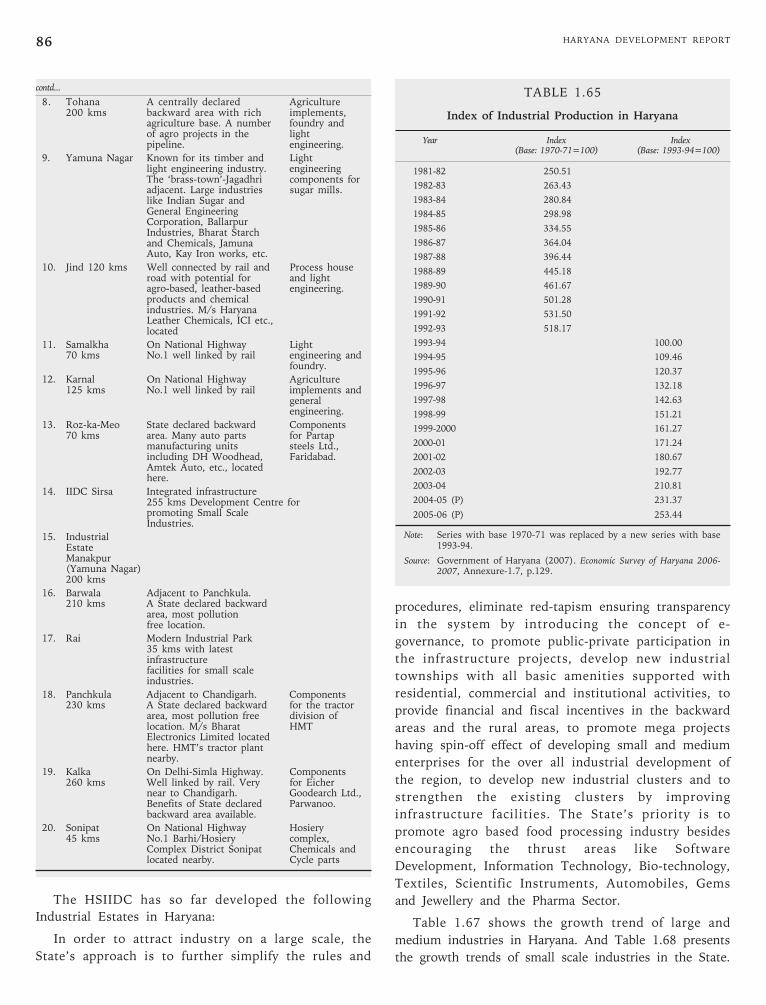
HARYANA DEVELOPMENT REPORT86
The HSIIDC has so far developed the following
Industrial Estates in Haryana:
In order to attract industry on a large scale, the
State’s approach is to further simplify the rules and
contd...
8. Tohana A centrally declared Agriculture200 kms backward area with rich implements,
agriculture base. A number foundry andof agro projects in the lightpipeline. engineering.
9. Yamuna Nagar Known for its timber and Lightlight engineering industry. engineeringThe ‘brass-town’-Jagadhri components foradjacent. Large industries sugar mills.like Indian Sugar andGeneral EngineeringCorporation, BallarpurIndustries, Bharat Starchand Chemicals, JamunaAuto, Kay Iron works, etc.
10. Jind 120 kms Well connected by rail and Process houseroad with potential for and lightagro-based, leather-based engineering.products and chemicalindustries. M/s HaryanaLeather Chemicals, ICI etc.,located
11. Samalkha On National Highway Light70 kms No.1 well linked by rail engineering and
foundry.
12. Karnal On National Highway Agriculture125 kms No.1 well linked by rail implements and
generalengineering.
13. Roz-ka-Meo State declared backward Components70 kms area. Many auto parts for Partap
manufacturing units steels Ltd.,including DH Woodhead, Faridabad.Amtek Auto, etc., locatedhere.
14. IIDC Sirsa Integrated infrastructure255 kms Development Centre forpromoting Small ScaleIndustries.
15. IndustrialEstateManakpur(Yamuna Nagar)200 kms
16. Barwala Adjacent to Panchkula.210 kms A State declared backward
area, most pollutionfree location.
17. Rai Modern Industrial Park35 kms with latestinfrastructurefacilities for small scaleindustries.
18. Panchkula Adjacent to Chandigarh. Components230 kms A State declared backward for the tractor
area, most pollution free division oflocation. M/s Bharat HMTElectronics Limited locatedhere. HMT’s tractor plantnearby.
19. Kalka On Delhi-Simla Highway. Components260 kms Well linked by rail. Very for Eicher
near to Chandigarh. Goodearch Ltd.,Benefits of State declared Parwanoo.backward area available.
20. Sonipat On National Highway Hosiery45 kms No.1 Barhi/Hosiery complex,
Complex District Sonipat Chemicals andlocated nearby. Cycle parts
procedures, eliminate red-tapism ensuring transparency
in the system by introducing the concept of e-
governance, to promote public-private participation in
the infrastructure projects, develop new industrial
townships with all basic amenities supported with
residential, commercial and institutional activities, to
provide financial and fiscal incentives in the backward
areas and the rural areas, to promote mega projects
having spin-off effect of developing small and medium
enterprises for the over all industrial development of
the region, to develop new industrial clusters and to
strengthen the existing clusters by improving
infrastructure facilities. The State’s priority is to
promote agro based food processing industry besides
encouraging the thrust areas like Software
Development, Information Technology, Bio-technology,
Textiles, Scientific Instruments, Automobiles, Gems
and Jewellery and the Pharma Sector.
Table 1.67 shows the growth trend of large and
medium industries in Haryana. And Table 1.68 presents
the growth trends of small scale industries in the State.
TABLE 1.65
Index of Industrial Production in Haryana
Year Index Index(Base: 1970-71=100) (Base: 1993-94=100)
1981-82 250.51
1982-83 263.43
1983-84 280.84
1984-85 298.98
1985-86 334.55
1986-87 364.04
1987-88 396.44
1988-89 445.18
1989-90 461.67
1990-91 501.28
1991-92 531.50
1992-93 518.17
1993-94 100.00
1994-95 109.46
1995-96 120.37
1996-97 132.18
1997-98 142.63
1998-99 151.21
1999-2000 161.27
2000-01 171.24
2001-02 180.67
2002-03 192.77
2003-04 210.81
2004-05 (P) 231.37
2005-06 (P) 253.44
Note: Series with base 1970-71 was replaced by a new series with base1993-94.
Source: Government of Haryana (2007). Economic Survey of Haryana 2006-2007, Annexure-1.7, p.129.
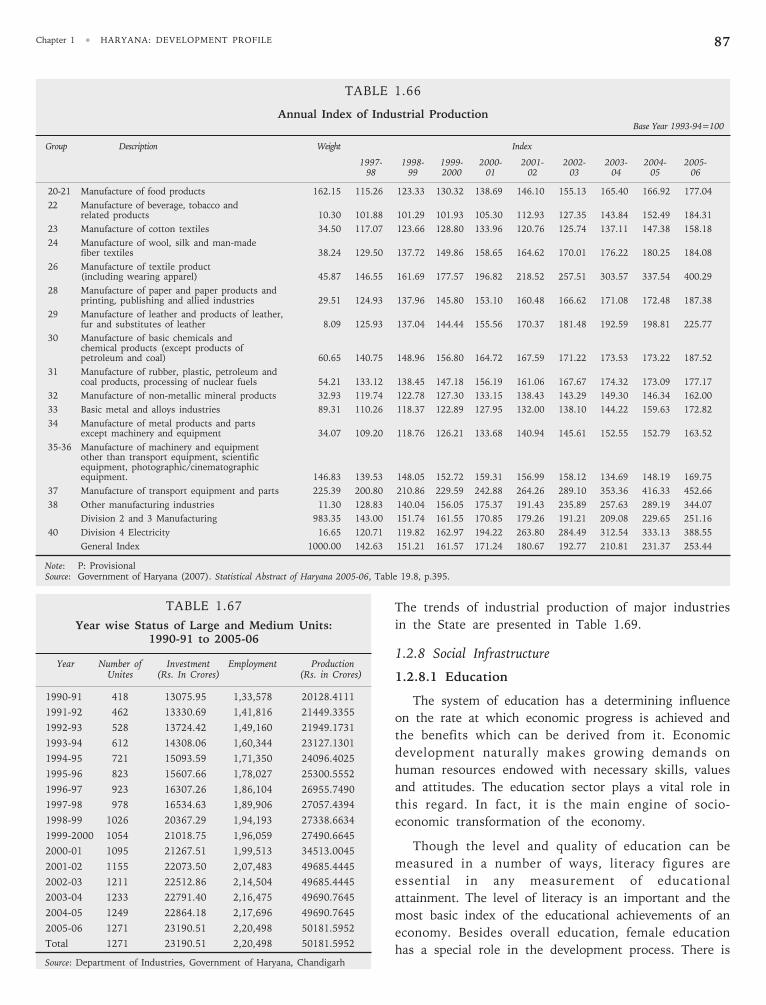
Chapter 1 • HARYANA: DEVELOPMENT PROFILE 87
TABLE 1.66
Annual Index of Industrial ProductionBase Year 1993-94=100
Group Description Weight Index
1997- 1998- 1999- 2000- 2001- 2002- 2003- 2004- 2005-98 99 2000 01 02 03 04 05 06
20-21 Manufacture of food products 162.15 115.26 123.33 130.32 138.69 146.10 155.13 165.40 166.92 177.04
22 Manufacture of beverage, tobacco andrelated products 10.30 101.88 101.29 101.93 105.30 112.93 127.35 143.84 152.49 184.31
23 Manufacture of cotton textiles 34.50 117.07 123.66 128.80 133.96 120.76 125.74 137.11 147.38 158.18
24 Manufacture of wool, silk and man-madefiber textiles 38.24 129.50 137.72 149.86 158.65 164.62 170.01 176.22 180.25 184.08
26 Manufacture of textile product(including wearing apparel) 45.87 146.55 161.69 177.57 196.82 218.52 257.51 303.57 337.54 400.29
28 Manufacture of paper and paper products andprinting, publishing and allied industries 29.51 124.93 137.96 145.80 153.10 160.48 166.62 171.08 172.48 187.38
29 Manufacture of leather and products of leather,fur and substitutes of leather 8.09 125.93 137.04 144.44 155.56 170.37 181.48 192.59 198.81 225.77
30 Manufacture of basic chemicals andchemical products (except products ofpetroleum and coal) 60.65 140.75 148.96 156.80 164.72 167.59 171.22 173.53 173.22 187.52
31 Manufacture of rubber, plastic, petroleum andcoal products, processing of nuclear fuels 54.21 133.12 138.45 147.18 156.19 161.06 167.67 174.32 173.09 177.17
32 Manufacture of non-metallic mineral products 32.93 119.74 122.78 127.30 133.15 138.43 143.29 149.30 146.34 162.00
33 Basic metal and alloys industries 89.31 110.26 118.37 122.89 127.95 132.00 138.10 144.22 159.63 172.82
34 Manufacture of metal products and partsexcept machinery and equipment 34.07 109.20 118.76 126.21 133.68 140.94 145.61 152.55 152.79 163.52
35-36 Manufacture of machinery and equipmentother than transport equipment, scientificequipment, photographic/cinematographicequipment. 146.83 139.53 148.05 152.72 159.31 156.99 158.12 134.69 148.19 169.75
37 Manufacture of transport equipment and parts 225.39 200.80 210.86 229.59 242.88 264.26 289.10 353.36 416.33 452.66
38 Other manufacturing industries 11.30 128.83 140.04 156.05 175.37 191.43 235.89 257.63 289.19 344.07
Division 2 and 3 Manufacturing 983.35 143.00 151.74 161.55 170.85 179.26 191.21 209.08 229.65 251.16
40 Division 4 Electricity 16.65 120.71 119.82 162.97 194.22 263.80 284.49 312.54 333.13 388.55
General Index 1000.00 142.63 151.21 161.57 171.24 180.67 192.77 210.81 231.37 253.44
Note: P: ProvisionalSource: Government of Haryana (2007). Statistical Abstract of Haryana 2005-06, Table 19.8, p.395.
TABLE 1.67
Year wise Status of Large and Medium Units:1990-91 to 2005-06
Year Number of Investment Employment ProductionUnites (Rs. In Crores) (Rs. in Crores)
1990-91 418 13075.95 1,33,578 20128.4111
1991-92 462 13330.69 1,41,816 21449.3355
1992-93 528 13724.42 1,49,160 21949.1731
1993-94 612 14308.06 1,60,344 23127.1301
1994-95 721 15093.59 1,71,350 24096.4025
1995-96 823 15607.66 1,78,027 25300.5552
1996-97 923 16307.26 1,86,104 26955.7490
1997-98 978 16534.63 1,89,906 27057.4394
1998-99 1026 20367.29 1,94,193 27338.6634
1999-2000 1054 21018.75 1,96,059 27490.6645
2000-01 1095 21267.51 1,99,513 34513.0045
2001-02 1155 22073.50 2,07,483 49685.4445
2002-03 1211 22512.86 2,14,504 49685.4445
2003-04 1233 22791.40 2,16,475 49690.7645
2004-05 1249 22864.18 2,17,696 49690.7645
2005-06 1271 23190.51 2,20,498 50181.5952
Total 1271 23190.51 2,20,498 50181.5952
Source: Department of Industries, Government of Haryana, Chandigarh
The trends of industrial production of major industries
in the State are presented in Table 1.69.
1.2.8 Social Infrastructure
1.2.8.1 Education
The system of education has a determining influence
on the rate at which economic progress is achieved and
the benefits which can be derived from it. Economic
development naturally makes growing demands on
human resources endowed with necessary skills, values
and attitudes. The education sector plays a vital role in
this regard. In fact, it is the main engine of socio-
economic transformation of the economy.
Though the level and quality of education can be
measured in a number of ways, literacy figures are
essential in any measurement of educational
attainment. The level of literacy is an important and the
most basic index of the educational achievements of an
economy. Besides overall education, female education
has a special role in the development process. There is
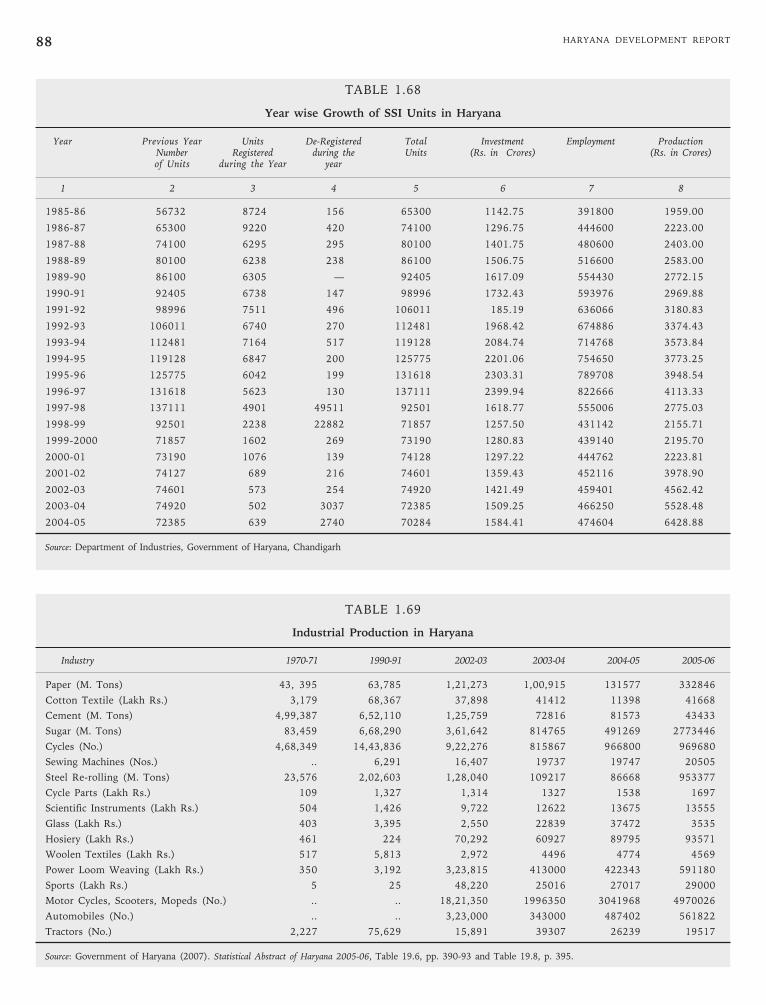
HARYANA DEVELOPMENT REPORT88
TABLE 1.68
Year wise Growth of SSI Units in Haryana
Year Previous Year Units De-Registered Total Investment Employment ProductionNumber Registered during the Units (Rs. in Crores) (Rs. in Crores)of Units during the Year year
1 2 3 4 5 6 7 8
1985-86 56732 8724 156 65300 1142.75 391800 1959.00
1986-87 65300 9220 420 74100 1296.75 444600 2223.00
1987-88 74100 6295 295 80100 1401.75 480600 2403.00
1988-89 80100 6238 238 86100 1506.75 516600 2583.00
1989-90 86100 6305 — 92405 1617.09 554430 2772.15
1990-91 92405 6738 147 98996 1732.43 593976 2969.88
1991-92 98996 7511 496 106011 185.19 636066 3180.83
1992-93 106011 6740 270 112481 1968.42 674886 3374.43
1993-94 112481 7164 517 119128 2084.74 714768 3573.84
1994-95 119128 6847 200 125775 2201.06 754650 3773.25
1995-96 125775 6042 199 131618 2303.31 789708 3948.54
1996-97 131618 5623 130 137111 2399.94 822666 4113.33
1997-98 137111 4901 49511 92501 1618.77 555006 2775.03
1998-99 92501 2238 22882 71857 1257.50 431142 2155.71
1999-2000 71857 1602 269 73190 1280.83 439140 2195.70
2000-01 73190 1076 139 74128 1297.22 444762 2223.81
2001-02 74127 689 216 74601 1359.43 452116 3978.90
2002-03 74601 573 254 74920 1421.49 459401 4562.42
2003-04 74920 502 3037 72385 1509.25 466250 5528.48
2004-05 72385 639 2740 70284 1584.41 474604 6428.88
Source: Department of Industries, Government of Haryana, Chandigarh
TABLE 1.69
Industrial Production in Haryana
Industry 1970-71 1990-91 2002-03 2003-04 2004-05 2005-06
Paper (M. Tons) 43, 395 63,785 1,21,273 1,00,915 131577 332846
Cotton Textile (Lakh Rs.) 3,179 68,367 37,898 41412 11398 41668
Cement (M. Tons) 4,99,387 6,52,110 1,25,759 72816 81573 43433
Sugar (M. Tons) 83,459 6,68,290 3,61,642 814765 491269 2773446
Cycles (No.) 4,68,349 14,43,836 9,22,276 815867 966800 969680
Sewing Machines (Nos.) .. 6,291 16,407 19737 19747 20505
Steel Re-rolling (M. Tons) 23,576 2,02,603 1,28,040 109217 86668 953377
Cycle Parts (Lakh Rs.) 109 1,327 1,314 1327 1538 1697
Scientific Instruments (Lakh Rs.) 504 1,426 9,722 12622 13675 13555
Glass (Lakh Rs.) 403 3,395 2,550 22839 37472 3535
Hosiery (Lakh Rs.) 461 224 70,292 60927 89795 93571
Woolen Textiles (Lakh Rs.) 517 5,813 2,972 4496 4774 4569
Power Loom Weaving (Lakh Rs.) 350 3,192 3,23,815 413000 422343 591180
Sports (Lakh Rs.) 5 25 48,220 25016 27017 29000
Motor Cycles, Scooters, Mopeds (No.) .. .. 18,21,350 1996350 3041968 4970026
Automobiles (No.) .. .. 3,23,000 343000 487402 561822
Tractors (No.) 2,227 75,629 15,891 39307 26239 19517
Source: Government of Haryana (2007). Statistical Abstract of Haryana 2005-06, Table 19.6, pp. 390-93 and Table 19.8, p. 395.
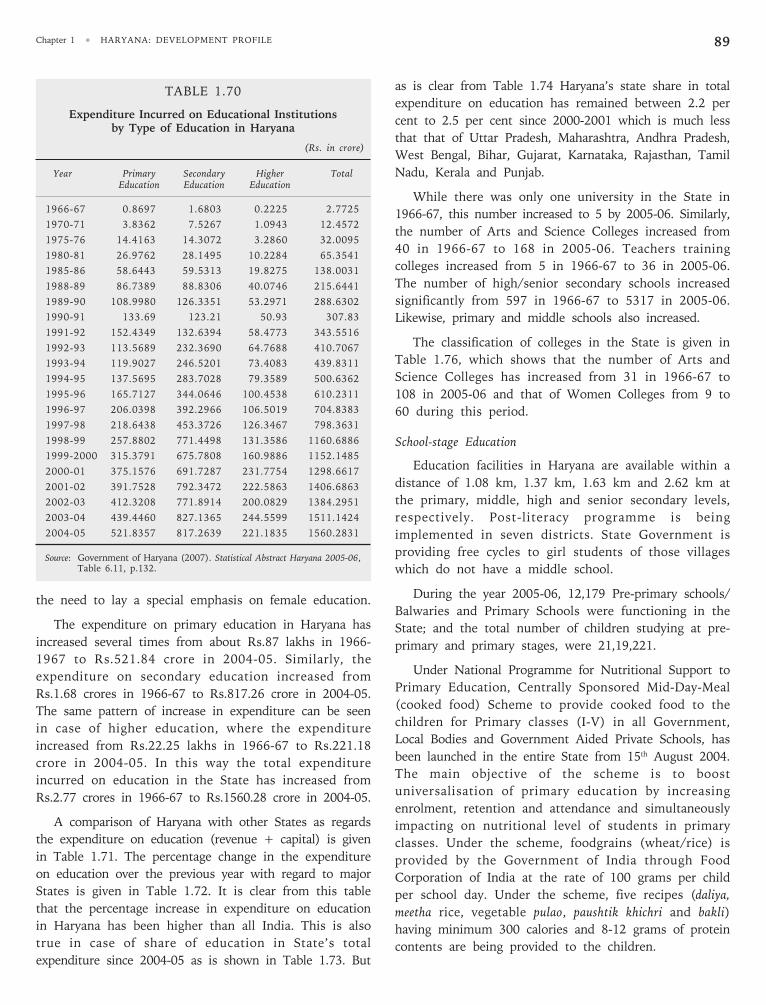
Chapter 1 • HARYANA: DEVELOPMENT PROFILE 89
the need to lay a special emphasis on female education.
The expenditure on primary education in Haryana has
increased several times from about Rs.87 lakhs in 1966-
1967 to Rs.521.84 crore in 2004-05. Similarly, the
expenditure on secondary education increased from
Rs.1.68 crores in 1966-67 to Rs.817.26 crore in 2004-05.
The same pattern of increase in expenditure can be seen
in case of higher education, where the expenditure
increased from Rs.22.25 lakhs in 1966-67 to Rs.221.18
crore in 2004-05. In this way the total expenditure
incurred on education in the State has increased from
Rs.2.77 crores in 1966-67 to Rs.1560.28 crore in 2004-05.
A comparison of Haryana with other States as regards
the expenditure on education (revenue + capital) is given
in Table 1.71. The percentage change in the expenditure
on education over the previous year with regard to major
States is given in Table 1.72. It is clear from this table
that the percentage increase in expenditure on education
in Haryana has been higher than all India. This is also
true in case of share of education in State’s total
expenditure since 2004-05 as is shown in Table 1.73. But
as is clear from Table 1.74 Haryana’s state share in total
expenditure on education has remained between 2.2 per
cent to 2.5 per cent since 2000-2001 which is much less
that that of Uttar Pradesh, Maharashtra, Andhra Pradesh,
West Bengal, Bihar, Gujarat, Karnataka, Rajasthan, Tamil
Nadu, Kerala and Punjab.
While there was only one university in the State in
1966-67, this number increased to 5 by 2005-06. Similarly,
the number of Arts and Science Colleges increased from
40 in 1966-67 to 168 in 2005-06. Teachers training
colleges increased from 5 in 1966-67 to 36 in 2005-06.
The number of high/senior secondary schools increased
significantly from 597 in 1966-67 to 5317 in 2005-06.
Likewise, primary and middle schools also increased.
The classification of colleges in the State is given in
Table 1.76, which shows that the number of Arts and
Science Colleges has increased from 31 in 1966-67 to
108 in 2005-06 and that of Women Colleges from 9 to
60 during this period.
School-stage Education
Education facilities in Haryana are available within a
distance of 1.08 km, 1.37 km, 1.63 km and 2.62 km at
the primary, middle, high and senior secondary levels,
respectively. Post-literacy programme is being
implemented in seven districts. State Government is
providing free cycles to girl students of those villages
which do not have a middle school.
During the year 2005-06, 12,179 Pre-primary schools/
Balwaries and Primary Schools were functioning in the
State; and the total number of children studying at pre-
primary and primary stages, were 21,19,221.
Under National Programme for Nutritional Support to
Primary Education, Centrally Sponsored Mid-Day-Meal
(cooked food) Scheme to provide cooked food to the
children for Primary classes (I-V) in all Government,
Local Bodies and Government Aided Private Schools, has
been launched in the entire State from 15th August 2004.
The main objective of the scheme is to boost
universalisation of primary education by increasing
enrolment, retention and attendance and simultaneously
impacting on nutritional level of students in primary
classes. Under the scheme, foodgrains (wheat/rice) is
provided by the Government of India through Food
Corporation of India at the rate of 100 grams per child
per school day. Under the scheme, five recipes (daliya,
meetha rice, vegetable pulao, paushtik khichri and bakli)
having minimum 300 calories and 8-12 grams of protein
contents are being provided to the children.
TABLE 1.70
Expenditure Incurred on Educational Institutionsby Type of Education in Haryana
(Rs. in crore)
Year Primary Secondary Higher TotalEducation Education Education
1966-67 0.8697 1.6803 0.2225 2.7725
1970-71 3.8362 7.5267 1.0943 12.4572
1975-76 14.4163 14.3072 3.2860 32.0095
1980-81 26.9762 28.1495 10.2284 65.3541
1985-86 58.6443 59.5313 19.8275 138.0031
1988-89 86.7389 88.8306 40.0746 215.6441
1989-90 108.9980 126.3351 53.2971 288.6302
1990-91 133.69 123.21 50.93 307.83
1991-92 152.4349 132.6394 58.4773 343.5516
1992-93 113.5689 232.3690 64.7688 410.7067
1993-94 119.9027 246.5201 73.4083 439.8311
1994-95 137.5695 283.7028 79.3589 500.6362
1995-96 165.7127 344.0646 100.4538 610.2311
1996-97 206.0398 392.2966 106.5019 704.8383
1997-98 218.6438 453.3726 126.3467 798.3631
1998-99 257.8802 771.4498 131.3586 1160.6886
1999-2000 315.3791 675.7808 160.9886 1152.1485
2000-01 375.1576 691.7287 231.7754 1298.6617
2001-02 391.7528 792.3472 222.5863 1406.6863
2002-03 412.3208 771.8914 200.0829 1384.2951
2003-04 439.4460 827.1365 244.5599 1511.1424
2004-05 521.8357 817.2639 221.1835 1560.2831
Source: Government of Haryana (2007). Statistical Abstract Haryana 2005-06,Table 6.11, p.132.
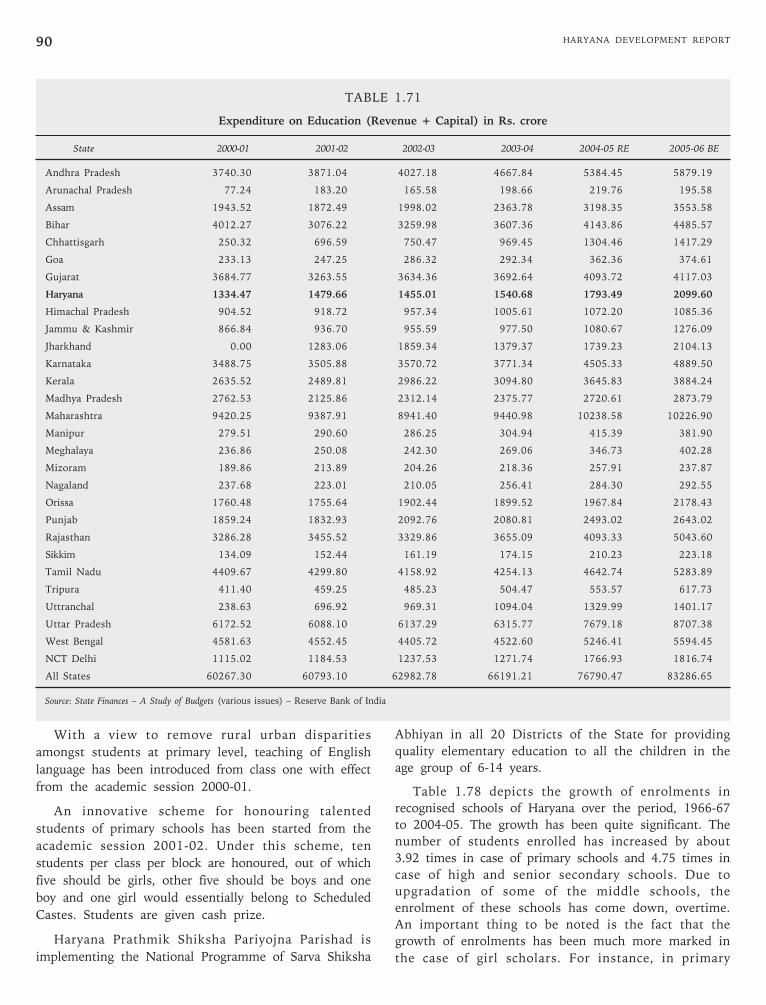
HARYANA DEVELOPMENT REPORT90
With a view to remove rural urban disparities
amongst students at primary level, teaching of English
language has been introduced from class one with effect
from the academic session 2000-01.
An innovative scheme for honouring talented
students of primary schools has been started from the
academic session 2001-02. Under this scheme, ten
students per class per block are honoured, out of which
five should be girls, other five should be boys and one
boy and one girl would essentially belong to Scheduled
Castes. Students are given cash prize.
Haryana Prathmik Shiksha Pariyojna Parishad is
implementing the National Programme of Sarva Shiksha
TABLE 1.71
Expenditure on Education (Revenue + Capital) in Rs. crore
State 2000-01 2001-02 2002-03 2003-04 2004-05 RE 2005-06 BE
Andhra Pradesh 3740.30 3871.04 4027.18 4667.84 5384.45 5879.19
Arunachal Pradesh 77.24 183.20 165.58 198.66 219.76 195.58
Assam 1943.52 1872.49 1998.02 2363.78 3198.35 3553.58
Bihar 4012.27 3076.22 3259.98 3607.36 4143.86 4485.57
Chhattisgarh 250.32 696.59 750.47 969.45 1304.46 1417.29
Goa 233.13 247.25 286.32 292.34 362.36 374.61
Gujarat 3684.77 3263.55 3634.36 3692.64 4093.72 4117.03
Haryana 1334.47 1479.66 1455.01 1540.68 1793.49 2099.60
Himachal Pradesh 904.52 918.72 957.34 1005.61 1072.20 1085.36
Jammu & Kashmir 866.84 936.70 955.59 977.50 1080.67 1276.09
Jharkhand 0.00 1283.06 1859.34 1379.37 1739.23 2104.13
Karnataka 3488.75 3505.88 3570.72 3771.34 4505.33 4889.50
Kerala 2635.52 2489.81 2986.22 3094.80 3645.83 3884.24
Madhya Pradesh 2762.53 2125.86 2312.14 2375.77 2720.61 2873.79
Maharashtra 9420.25 9387.91 8941.40 9440.98 10238.58 10226.90
Manipur 279.51 290.60 286.25 304.94 415.39 381.90
Meghalaya 236.86 250.08 242.30 269.06 346.73 402.28
Mizoram 189.86 213.89 204.26 218.36 257.91 237.87
Nagaland 237.68 223.01 210.05 256.41 284.30 292.55
Orissa 1760.48 1755.64 1902.44 1899.52 1967.84 2178.43
Punjab 1859.24 1832.93 2092.76 2080.81 2493.02 2643.02
Rajasthan 3286.28 3455.52 3329.86 3655.09 4093.33 5043.60
Sikkim 134.09 152.44 161.19 174.15 210.23 223.18
Tamil Nadu 4409.67 4299.80 4158.92 4254.13 4642.74 5283.89
Tripura 411.40 459.25 485.23 504.47 553.57 617.73
Uttranchal 238.63 696.92 969.31 1094.04 1329.99 1401.17
Uttar Pradesh 6172.52 6088.10 6137.29 6315.77 7679.18 8707.38
West Bengal 4581.63 4552.45 4405.72 4522.60 5246.41 5594.45
NCT Delhi 1115.02 1184.53 1237.53 1271.74 1766.93 1816.74
All States 60267.30 60793.10 62982.78 66191.21 76790.47 83286.65
Source: State Finances – A Study of Budgets (various issues) – Reserve Bank of India
Abhiyan in all 20 Districts of the State for providing
quality elementary education to all the children in the
age group of 6-14 years.
Table 1.78 depicts the growth of enrolments in
recognised schools of Haryana over the period, 1966-67
to 2004-05. The growth has been quite significant. The
number of students enrolled has increased by about
3.92 times in case of primary schools and 4.75 times in
case of high and senior secondary schools. Due to
upgradation of some of the middle schools, the
enrolment of these schools has come down, overtime.
An important thing to be noted is the fact that the
growth of enrolments has been much more marked in
the case of girl scholars. For instance, in primary
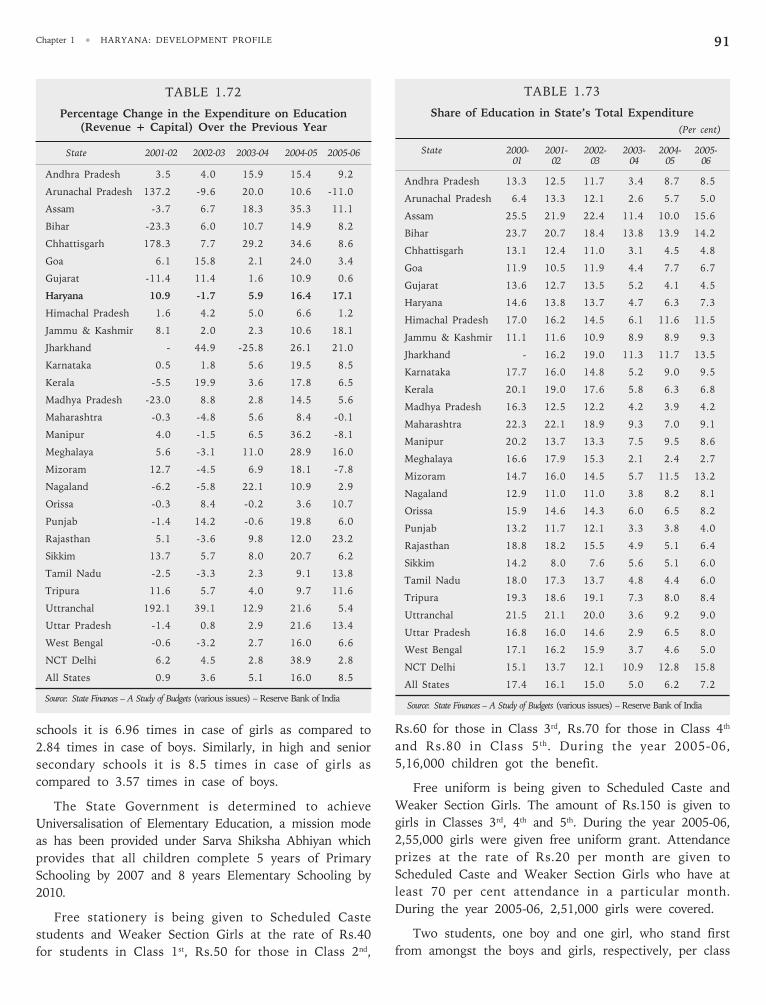
Chapter 1 • HARYANA: DEVELOPMENT PROFILE 91
TABLE 1.73
Share of Education in State’s Total Expenditure
(Per cent)
State 2000- 2001- 2002- 2003- 2004- 2005-01 02 03 04 05 06
Andhra Pradesh 13.3 12.5 11.7 3.4 8.7 8.5
Arunachal Pradesh 6.4 13.3 12.1 2.6 5.7 5.0
Assam 25.5 21.9 22.4 11.4 10.0 15.6
Bihar 23.7 20.7 18.4 13.8 13.9 14.2
Chhattisgarh 13.1 12.4 11.0 3.1 4.5 4.8
Goa 11.9 10.5 11.9 4.4 7.7 6.7
Gujarat 13.6 12.7 13.5 5.2 4.1 4.5
Haryana 14.6 13.8 13.7 4.7 6.3 7.3
Himachal Pradesh 17.0 16.2 14.5 6.1 11.6 11.5
Jammu & Kashmir 11.1 11.6 10.9 8.9 8.9 9.3
Jharkhand - 16.2 19.0 11.3 11.7 13.5
Karnataka 17.7 16.0 14.8 5.2 9.0 9.5
Kerala 20.1 19.0 17.6 5.8 6.3 6.8
Madhya Pradesh 16.3 12.5 12.2 4.2 3.9 4.2
Maharashtra 22.3 22.1 18.9 9.3 7.0 9.1
Manipur 20.2 13.7 13.3 7.5 9.5 8.6
Meghalaya 16.6 17.9 15.3 2.1 2.4 2.7
Mizoram 14.7 16.0 14.5 5.7 11.5 13.2
Nagaland 12.9 11.0 11.0 3.8 8.2 8.1
Orissa 15.9 14.6 14.3 6.0 6.5 8.2
Punjab 13.2 11.7 12.1 3.3 3.8 4.0
Rajasthan 18.8 18.2 15.5 4.9 5.1 6.4
Sikkim 14.2 8.0 7.6 5.6 5.1 6.0
Tamil Nadu 18.0 17.3 13.7 4.8 4.4 6.0
Tripura 19.3 18.6 19.1 7.3 8.0 8.4
Uttranchal 21.5 21.1 20.0 3.6 9.2 9.0
Uttar Pradesh 16.8 16.0 14.6 2.9 6.5 8.0
West Bengal 17.1 16.2 15.9 3.7 4.6 5.0
NCT Delhi 15.1 13.7 12.1 10.9 12.8 15.8
All States 17.4 16.1 15.0 5.0 6.2 7.2
Source: State Finances – A Study of Budgets (various issues) – Reserve Bank of India
TABLE 1.72
Percentage Change in the Expenditure on Education(Revenue + Capital) Over the Previous Year
State 2001-02 2002-03 2003-04 2004-05 2005-06
Andhra Pradesh 3.5 4.0 15.9 15.4 9.2
Arunachal Pradesh 137.2 -9.6 20.0 10.6 -11.0
Assam -3.7 6.7 18.3 35.3 11.1
Bihar -23.3 6.0 10.7 14.9 8.2
Chhattisgarh 178.3 7.7 29.2 34.6 8.6
Goa 6.1 15.8 2.1 24.0 3.4
Gujarat -11.4 11.4 1.6 10.9 0.6
Haryana 10.9 -1.7 5.9 16.4 17.1
Himachal Pradesh 1.6 4.2 5.0 6.6 1.2
Jammu & Kashmir 8.1 2.0 2.3 10.6 18.1
Jharkhand - 44.9 -25.8 26.1 21.0
Karnataka 0.5 1.8 5.6 19.5 8.5
Kerala -5.5 19.9 3.6 17.8 6.5
Madhya Pradesh -23.0 8.8 2.8 14.5 5.6
Maharashtra -0.3 -4.8 5.6 8.4 -0.1
Manipur 4.0 -1.5 6.5 36.2 -8.1
Meghalaya 5.6 -3.1 11.0 28.9 16.0
Mizoram 12.7 -4.5 6.9 18.1 -7.8
Nagaland -6.2 -5.8 22.1 10.9 2.9
Orissa -0.3 8.4 -0.2 3.6 10.7
Punjab -1.4 14.2 -0.6 19.8 6.0
Rajasthan 5.1 -3.6 9.8 12.0 23.2
Sikkim 13.7 5.7 8.0 20.7 6.2
Tamil Nadu -2.5 -3.3 2.3 9.1 13.8
Tripura 11.6 5.7 4.0 9.7 11.6
Uttranchal 192.1 39.1 12.9 21.6 5.4
Uttar Pradesh -1.4 0.8 2.9 21.6 13.4
West Bengal -0.6 -3.2 2.7 16.0 6.6
NCT Delhi 6.2 4.5 2.8 38.9 2.8
All States 0.9 3.6 5.1 16.0 8.5
Source: State Finances – A Study of Budgets (various issues) – Reserve Bank of India
schools it is 6.96 times in case of girls as compared to
2.84 times in case of boys. Similarly, in high and senior
secondary schools it is 8.5 times in case of girls as
compared to 3.57 times in case of boys.
The State Government is determined to achieve
Universalisation of Elementary Education, a mission mode
as has been provided under Sarva Shiksha Abhiyan which
provides that all children complete 5 years of Primary
Schooling by 2007 and 8 years Elementary Schooling by
2010.
Free stationery is being given to Scheduled Caste
students and Weaker Section Girls at the rate of Rs.40
for students in Class 1st, Rs.50 for those in Class 2nd,
Rs.60 for those in Class 3rd, Rs.70 for those in Class 4th
and Rs.80 in Class 5th. During the year 2005-06,
5,16,000 children got the benefit.
Free uniform is being given to Scheduled Caste and
Weaker Section Girls. The amount of Rs.150 is given to
girls in Classes 3rd, 4th and 5th. During the year 2005-06,
2,55,000 girls were given free uniform grant. Attendance
prizes at the rate of Rs.20 per month are given to
Scheduled Caste and Weaker Section Girls who have at
least 70 per cent attendance in a particular month.
During the year 2005-06, 2,51,000 girls were covered.
Two students, one boy and one girl, who stand first
from amongst the boys and girls, respectively, per class
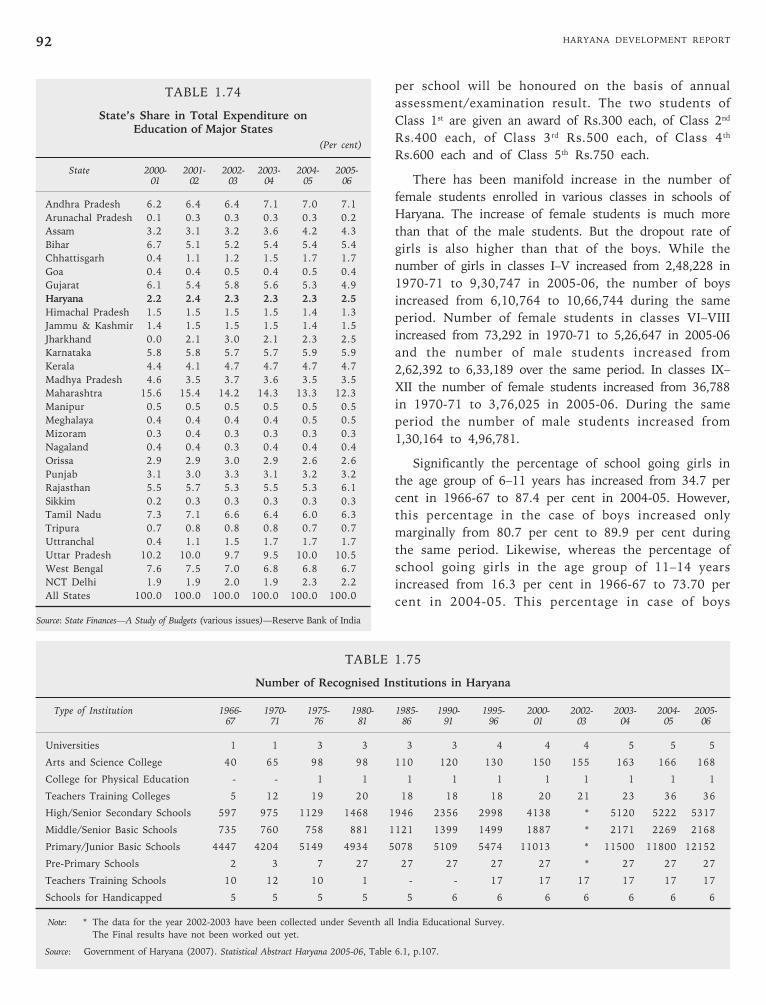
HARYANA DEVELOPMENT REPORT92
TABLE 1.74
State’s Share in Total Expenditure onEducation of Major States
(Per cent)
State 2000- 2001- 2002- 2003- 2004- 2005-01 02 03 04 05 06
Andhra Pradesh 6.2 6.4 6.4 7.1 7.0 7.1
Arunachal Pradesh 0.1 0.3 0.3 0.3 0.3 0.2
Assam 3.2 3.1 3.2 3.6 4.2 4.3
Bihar 6.7 5.1 5.2 5.4 5.4 5.4
Chhattisgarh 0.4 1.1 1.2 1.5 1.7 1.7
Goa 0.4 0.4 0.5 0.4 0.5 0.4
Gujarat 6.1 5.4 5.8 5.6 5.3 4.9
Haryana 2.2 2.4 2.3 2.3 2.3 2.5
Himachal Pradesh 1.5 1.5 1.5 1.5 1.4 1.3
Jammu & Kashmir 1.4 1.5 1.5 1.5 1.4 1.5
Jharkhand 0.0 2.1 3.0 2.1 2.3 2.5
Karnataka 5.8 5.8 5.7 5.7 5.9 5.9
Kerala 4.4 4.1 4.7 4.7 4.7 4.7
Madhya Pradesh 4.6 3.5 3.7 3.6 3.5 3.5
Maharashtra 15.6 15.4 14.2 14.3 13.3 12.3
Manipur 0.5 0.5 0.5 0.5 0.5 0.5
Meghalaya 0.4 0.4 0.4 0.4 0.5 0.5
Mizoram 0.3 0.4 0.3 0.3 0.3 0.3
Nagaland 0.4 0.4 0.3 0.4 0.4 0.4
Orissa 2.9 2.9 3.0 2.9 2.6 2.6
Punjab 3.1 3.0 3.3 3.1 3.2 3.2
Rajasthan 5.5 5.7 5.3 5.5 5.3 6.1
Sikkim 0.2 0.3 0.3 0.3 0.3 0.3
Tamil Nadu 7.3 7.1 6.6 6.4 6.0 6.3
Tripura 0.7 0.8 0.8 0.8 0.7 0.7
Uttranchal 0.4 1.1 1.5 1.7 1.7 1.7
Uttar Pradesh 10.2 10.0 9.7 9.5 10.0 10.5
West Bengal 7.6 7.5 7.0 6.8 6.8 6.7
NCT Delhi 1.9 1.9 2.0 1.9 2.3 2.2
All States 100.0 100.0 100.0 100.0 100.0 100.0
Source: State Finances—A Study of Budgets (various issues)—Reserve Bank of India
TABLE 1.75
Number of Recognised Institutions in Haryana
Type of Institution 1966- 1970- 1975- 1980- 1985- 1990- 1995- 2000- 2002- 2003- 2004- 2005-67 71 76 81 86 91 96 01 03 04 05 06
Universities 1 1 3 3 3 3 4 4 4 5 5 5
Arts and Science College 40 65 98 98 110 120 130 150 155 163 166 168
College for Physical Education - - 1 1 1 1 1 1 1 1 1 1
Teachers Training Colleges 5 12 19 20 18 18 18 20 21 23 36 36
High/Senior Secondary Schools 597 975 1129 1468 1946 2356 2998 4138 * 5120 5222 5317
Middle/Senior Basic Schools 735 760 758 881 1121 1399 1499 1887 * 2171 2269 2168
Primary/Junior Basic Schools 4447 4204 5149 4934 5078 5109 5474 11013 * 11500 11800 12152
Pre-Primary Schools 2 3 7 27 27 27 27 27 * 27 27 27
Teachers Training Schools 10 12 10 1 - - 17 17 17 17 17 17
Schools for Handicapped 5 5 5 5 5 6 6 6 6 6 6 6
Note: * The data for the year 2002-2003 have been collected under Seventh all India Educational Survey.
The Final results have not been worked out yet.
Source: Government of Haryana (2007). Statistical Abstract Haryana 2005-06, Table 6.1, p.107.
per school will be honoured on the basis of annual
assessment/examination result. The two students of
Class 1st are given an award of Rs.300 each, of Class 2nd
Rs.400 each, of Class 3rd Rs.500 each, of Class 4th
Rs.600 each and of Class 5th Rs.750 each.
There has been manifold increase in the number of
female students enrolled in various classes in schools of
Haryana. The increase of female students is much more
than that of the male students. But the dropout rate of
girls is also higher than that of the boys. While the
number of girls in classes I–V increased from 2,48,228 in
1970-71 to 9,30,747 in 2005-06, the number of boys
increased from 6,10,764 to 10,66,744 during the same
period. Number of female students in classes VI–VIII
increased from 73,292 in 1970-71 to 5,26,647 in 2005-06
and the number of male students increased from
2,62,392 to 6,33,189 over the same period. In classes IX–
XII the number of female students increased from 36,788
in 1970-71 to 3,76,025 in 2005-06. During the same
period the number of male students increased from
1,30,164 to 4,96,781.
Significantly the percentage of school going girls in
the age group of 6–11 years has increased from 34.7 per
cent in 1966-67 to 87.4 per cent in 2004-05. However,
this percentage in the case of boys increased only
marginally from 80.7 per cent to 89.9 per cent during
the same period. Likewise, whereas the percentage of
school going girls in the age group of 11–14 years
increased from 16.3 per cent in 1966-67 to 73.70 per
cent in 2004-05. This percentage in case of boys
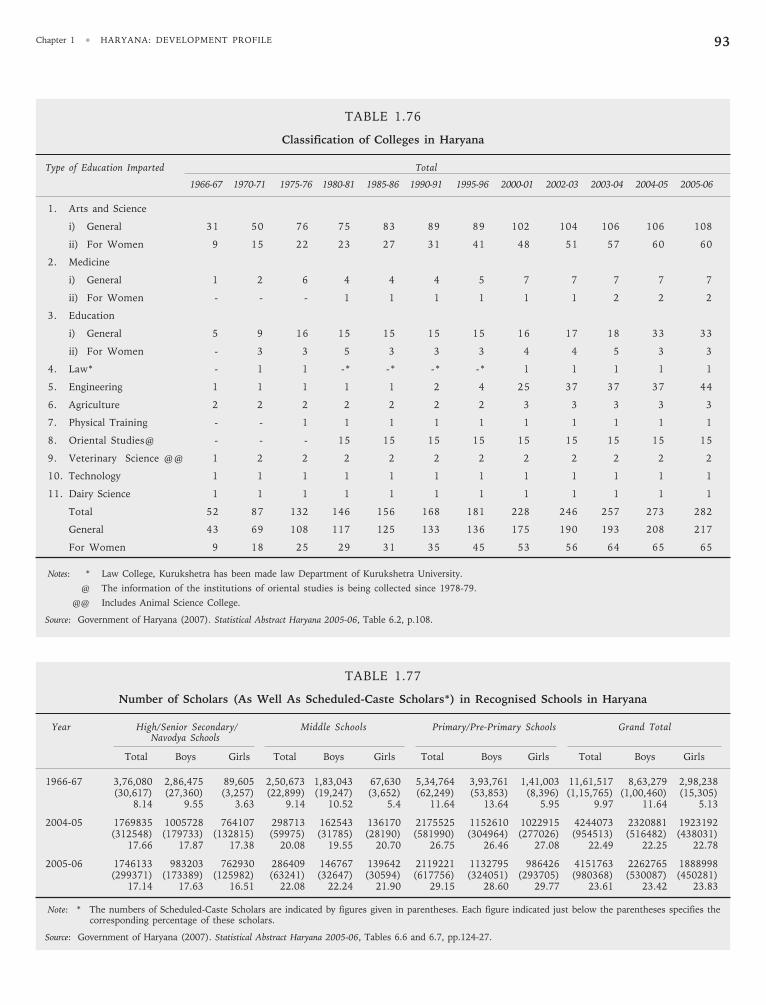
Chapter 1 • HARYANA: DEVELOPMENT PROFILE 93
TABLE 1.76
Classification of Colleges in Haryana
Type of Education Imparted Total
1966-67 1970-71 1975-76 1980-81 1985-86 1990-91 1995-96 2000-01 2002-03 2003-04 2004-05 2005-06
1. Arts and Science
i) General 31 50 76 75 83 89 89 102 104 106 106 108
ii) For Women 9 15 22 23 27 31 41 48 51 57 60 60
2. Medicine
i) General 1 2 6 4 4 4 5 7 7 7 7 7
ii) For Women - - - 1 1 1 1 1 1 2 2 2
3. Education
i) General 5 9 16 15 15 15 15 16 17 18 33 33
ii) For Women - 3 3 5 3 3 3 4 4 5 3 3
4. Law* - 1 1 -* -* -* -* 1 1 1 1 1
5. Engineering 1 1 1 1 1 2 4 25 37 37 37 44
6. Agriculture 2 2 2 2 2 2 2 3 3 3 3 3
7. Physical Training - - 1 1 1 1 1 1 1 1 1 1
8. Oriental Studies@ - - - 15 15 15 15 15 15 15 15 15
9. Veterinary Science @@ 1 2 2 2 2 2 2 2 2 2 2 2
10. Technology 1 1 1 1 1 1 1 1 1 1 1 1
11. Dairy Science 1 1 1 1 1 1 1 1 1 1 1 1
Total 52 87 132 146 156 168 181 228 246 257 273 282
General 43 69 108 117 125 133 136 175 190 193 208 217
For Women 9 18 25 29 31 35 45 53 56 64 65 65
Notes: * Law College, Kurukshetra has been made law Department of Kurukshetra University.
@ The information of the institutions of oriental studies is being collected since 1978-79.
@@ Includes Animal Science College.
Source: Government of Haryana (2007). Statistical Abstract Haryana 2005-06, Table 6.2, p.108.
TABLE 1.77
Number of Scholars (As Well As Scheduled-Caste Scholars*) in Recognised Schools in Haryana
Year High/Senior Secondary/ Middle Schools Primary/Pre-Primary Schools Grand TotalNavodya Schools
Total Boys Girls Total Boys Girls Total Boys Girls Total Boys Girls
1966-67 3,76,080 2,86,475 89,605 2,50,673 1,83,043 67,630 5,34,764 3,93,761 1,41,003 11,61,517 8,63,279 2,98,238(30,617) (27,360) (3,257) (22,899) (19,247) (3,652) (62,249) (53,853) (8,396) (1,15,765) (1,00,460) (15,305)
8.14 9.55 3.63 9.14 10.52 5.4 11.64 13.64 5.95 9.97 11.64 5.13
2004-05 1769835 1005728 764107 298713 162543 136170 2175525 1152610 1022915 4244073 2320881 1923192(312548) (179733) (132815) (59975) (31785) (28190) (581990) (304964) (277026) (954513) (516482) (438031)
17.66 17.87 17.38 20.08 19.55 20.70 26.75 26.46 27.08 22.49 22.25 22.78
2005-06 1746133 983203 762930 286409 146767 139642 2119221 1132795 986426 4151763 2262765 1888998(299371) (173389) (125982) (63241) (32647) (30594) (617756) (324051) (293705) (980368) (530087) (450281)
17.14 17.63 16.51 22.08 22.24 21.90 29.15 28.60 29.77 23.61 23.42 23.83
Note: * The numbers of Scheduled-Caste Scholars are indicated by figures given in parentheses. Each figure indicated just below the parentheses specifies thecorresponding percentage of these scholars.
Source: Government of Haryana (2007). Statistical Abstract Haryana 2005-06, Tables 6.6 and 6.7, pp.124-27.
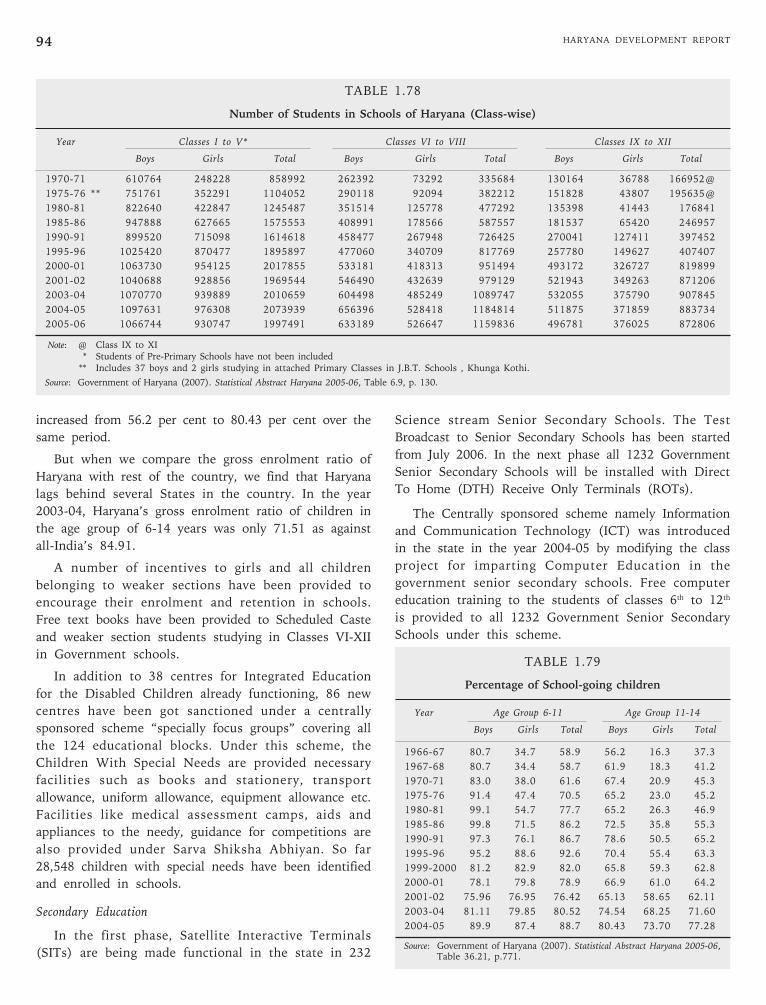
HARYANA DEVELOPMENT REPORT94
increased from 56.2 per cent to 80.43 per cent over the
same period.
But when we compare the gross enrolment ratio of
Haryana with rest of the country, we find that Haryana
lags behind several States in the country. In the year
2003-04, Haryana’s gross enrolment ratio of children in
the age group of 6-14 years was only 71.51 as against
all-India’s 84.91.
A number of incentives to girls and all children
belonging to weaker sections have been provided to
encourage their enrolment and retention in schools.
Free text books have been provided to Scheduled Caste
and weaker section students studying in Classes VI-XII
in Government schools.
In addition to 38 centres for Integrated Education
for the Disabled Children already functioning, 86 new
centres have been got sanctioned under a centrally
sponsored scheme “specially focus groups” covering all
the 124 educational blocks. Under this scheme, the
Children With Special Needs are provided necessary
facilities such as books and stationery, transport
allowance, uniform allowance, equipment allowance etc.
Facilities like medical assessment camps, aids and
appliances to the needy, guidance for competitions are
also provided under Sarva Shiksha Abhiyan. So far
28,548 children with special needs have been identified
and enrolled in schools.
Secondary Education
In the first phase, Satellite Interactive Terminals
(SITs) are being made functional in the state in 232
TABLE 1.79
Percentage of School-going children
Year Age Group 6-11 Age Group 11-14
Boys Girls Total Boys Girls Total
1966-67 80.7 34.7 58.9 56.2 16.3 37.3
1967-68 80.7 34.4 58.7 61.9 18.3 41.2
1970-71 83.0 38.0 61.6 67.4 20.9 45.3
1975-76 91.4 47.4 70.5 65.2 23.0 45.2
1980-81 99.1 54.7 77.7 65.2 26.3 46.9
1985-86 99.8 71.5 86.2 72.5 35.8 55.3
1990-91 97.3 76.1 86.7 78.6 50.5 65.2
1995-96 95.2 88.6 92.6 70.4 55.4 63.3
1999-2000 81.2 82.9 82.0 65.8 59.3 62.8
2000-01 78.1 79.8 78.9 66.9 61.0 64.2
2001-02 75.96 76.95 76.42 65.13 58.65 62.11
2003-04 81.11 79.85 80.52 74.54 68.25 71.60
2004-05 89.9 87.4 88.7 80.43 73.70 77.28
Source: Government of Haryana (2007). Statistical Abstract Haryana 2005-06,Table 36.21, p.771.
TABLE 1.78
Number of Students in Schools of Haryana (Class-wise)
Year Classes I to V* Classes VI to VIII Classes IX to XII
Boys Girls Total Boys Girls Total Boys Girls Total
1970-71 610764 248228 858992 262392 73292 335684 130164 36788 166952@
1975-76 ** 751761 352291 1104052 290118 92094 382212 151828 43807 195635@
1980-81 822640 422847 1245487 351514 125778 477292 135398 41443 176841
1985-86 947888 627665 1575553 408991 178566 587557 181537 65420 246957
1990-91 899520 715098 1614618 458477 267948 726425 270041 127411 397452
1995-96 1025420 870477 1895897 477060 340709 817769 257780 149627 407407
2000-01 1063730 954125 2017855 533181 418313 951494 493172 326727 819899
2001-02 1040688 928856 1969544 546490 432639 979129 521943 349263 871206
2003-04 1070770 939889 2010659 604498 485249 1089747 532055 375790 907845
2004-05 1097631 976308 2073939 656396 528418 1184814 511875 371859 883734
2005-06 1066744 930747 1997491 633189 526647 1159836 496781 376025 872806
Note: @ Class IX to XI* Students of Pre-Primary Schools have not been included
** Includes 37 boys and 2 girls studying in attached Primary Classes in J.B.T. Schools , Khunga Kothi.
Source: Government of Haryana (2007). Statistical Abstract Haryana 2005-06, Table 6.9, p. 130.
Science stream Senior Secondary Schools. The Test
Broadcast to Senior Secondary Schools has been started
from July 2006. In the next phase all 1232 Government
Senior Secondary Schools will be installed with Direct
To Home (DTH) Receive Only Terminals (ROTs).
The Centrally sponsored scheme namely Information
and Communication Technology (ICT) was introduced
in the state in the year 2004-05 by modifying the class
project for imparting Computer Education in the
government senior secondary schools. Free computer
education training to the students of classes 6th to 12th
is provided to all 1232 Government Senior Secondary
Schools under this scheme.
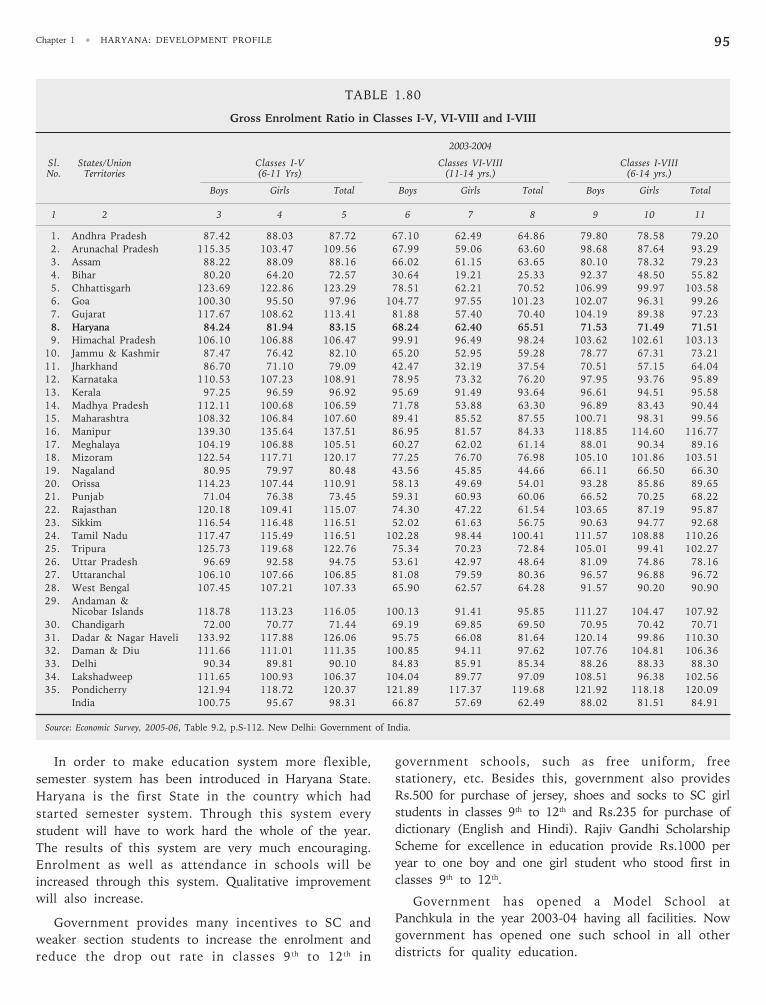
Chapter 1 • HARYANA: DEVELOPMENT PROFILE 95
In order to make education system more flexible,
semester system has been introduced in Haryana State.
Haryana is the first State in the country which had
started semester system. Through this system every
student will have to work hard the whole of the year.
The results of this system are very much encouraging.
Enrolment as well as attendance in schools will be
increased through this system. Qualitative improvement
will also increase.
Government provides many incentives to SC and
weaker section students to increase the enrolment and
reduce the drop out rate in classes 9 th to 12th in
government schools, such as free uniform, free
stationery, etc. Besides this, government also provides
Rs.500 for purchase of jersey, shoes and socks to SC girl
students in classes 9th to 12th and Rs.235 for purchase of
dictionary (English and Hindi). Rajiv Gandhi Scholarship
Scheme for excellence in education provide Rs.1000 per
year to one boy and one girl student who stood first in
classes 9th to 12th.
Government has opened a Model School at
Panchkula in the year 2003-04 having all facilities. Now
government has opened one such school in all other
districts for quality education.
TABLE 1.80
Gross Enrolment Ratio in Classes I-V, VI-VIII and I-VIII
2003-2004
Sl. States/Union Classes I-V Classes VI-VIII Classes I-VIIINo. Territories (6-11 Yrs) (11-14 yrs.) (6-14 yrs.)
Boys Girls Total Boys Girls Total Boys Girls Total
1 2 3 4 5 6 7 8 9 10 11
1. Andhra Pradesh 87.42 88.03 87.72 67.10 62.49 64.86 79.80 78.58 79.20
2. Arunachal Pradesh 115.35 103.47 109.56 67.99 59.06 63.60 98.68 87.64 93.29
3. Assam 88.22 88.09 88.16 66.02 61.15 63.65 80.10 78.32 79.23
4. Bihar 80.20 64.20 72.57 30.64 19.21 25.33 92.37 48.50 55.82
5. Chhattisgarh 123.69 122.86 123.29 78.51 62.21 70.52 106.99 99.97 103.58
6. Goa 100.30 95.50 97.96 104.77 97.55 101.23 102.07 96.31 99.26
7. Gujarat 117.67 108.62 113.41 81.88 57.40 70.40 104.19 89.38 97.23
8. Haryana 84.24 81.94 83.15 68.24 62.40 65.51 71.53 71.49 71.51
9. Himachal Pradesh 106.10 106.88 106.47 99.91 96.49 98.24 103.62 102.61 103.13
10. Jammu & Kashmir 87.47 76.42 82.10 65.20 52.95 59.28 78.77 67.31 73.21
11. Jharkhand 86.70 71.10 79.09 42.47 32.19 37.54 70.51 57.15 64.04
12. Karnataka 110.53 107.23 108.91 78.95 73.32 76.20 97.95 93.76 95.89
13. Kerala 97.25 96.59 96.92 95.69 91.49 93.64 96.61 94.51 95.58
14. Madhya Pradesh 112.11 100.68 106.59 71.78 53.88 63.30 96.89 83.43 90.44
15. Maharashtra 108.32 106.84 107.60 89.41 85.52 87.55 100.71 98.31 99.56
16. Manipur 139.30 135.64 137.51 86.95 81.57 84.33 118.85 114.60 116.77
17. Meghalaya 104.19 106.88 105.51 60.27 62.02 61.14 88.01 90.34 89.16
18. Mizoram 122.54 117.71 120.17 77.25 76.70 76.98 105.10 101.86 103.51
19. Nagaland 80.95 79.97 80.48 43.56 45.85 44.66 66.11 66.50 66.30
20. Orissa 114.23 107.44 110.91 58.13 49.69 54.01 93.28 85.86 89.65
21. Punjab 71.04 76.38 73.45 59.31 60.93 60.06 66.52 70.25 68.22
22. Rajasthan 120.18 109.41 115.07 74.30 47.22 61.54 103.65 87.19 95.87
23. Sikkim 116.54 116.48 116.51 52.02 61.63 56.75 90.63 94.77 92.68
24. Tamil Nadu 117.47 115.49 116.51 102.28 98.44 100.41 111.57 108.88 110.26
25. Tripura 125.73 119.68 122.76 75.34 70.23 72.84 105.01 99.41 102.27
26. Uttar Pradesh 96.69 92.58 94.75 53.61 42.97 48.64 81.09 74.86 78.16
27. Uttaranchal 106.10 107.66 106.85 81.08 79.59 80.36 96.57 96.88 96.72
28. West Bengal 107.45 107.21 107.33 65.90 62.57 64.28 91.57 90.20 90.90
29. Andaman &Nicobar Islands 118.78 113.23 116.05 100.13 91.41 95.85 111.27 104.47 107.92
30. Chandigarh 72.00 70.77 71.44 69.19 69.85 69.50 70.95 70.42 70.71
31. Dadar & Nagar Haveli 133.92 117.88 126.06 95.75 66.08 81.64 120.14 99.86 110.30
32. Daman & Diu 111.66 111.01 111.35 100.85 94.11 97.62 107.76 104.81 106.36
33. Delhi 90.34 89.81 90.10 84.83 85.91 85.34 88.26 88.33 88.30
34. Lakshadweep 111.65 100.93 106.37 104.04 89.77 97.09 108.51 96.38 102.56
35. Pondicherry 121.94 118.72 120.37 121.89 117.37 119.68 121.92 118.18 120.09
India 100.75 95.67 98.31 66.87 57.69 62.49 88.02 81.51 84.91
Source: Economic Survey, 2005-06, Table 9.2, p.S-112. New Delhi: Government of India.
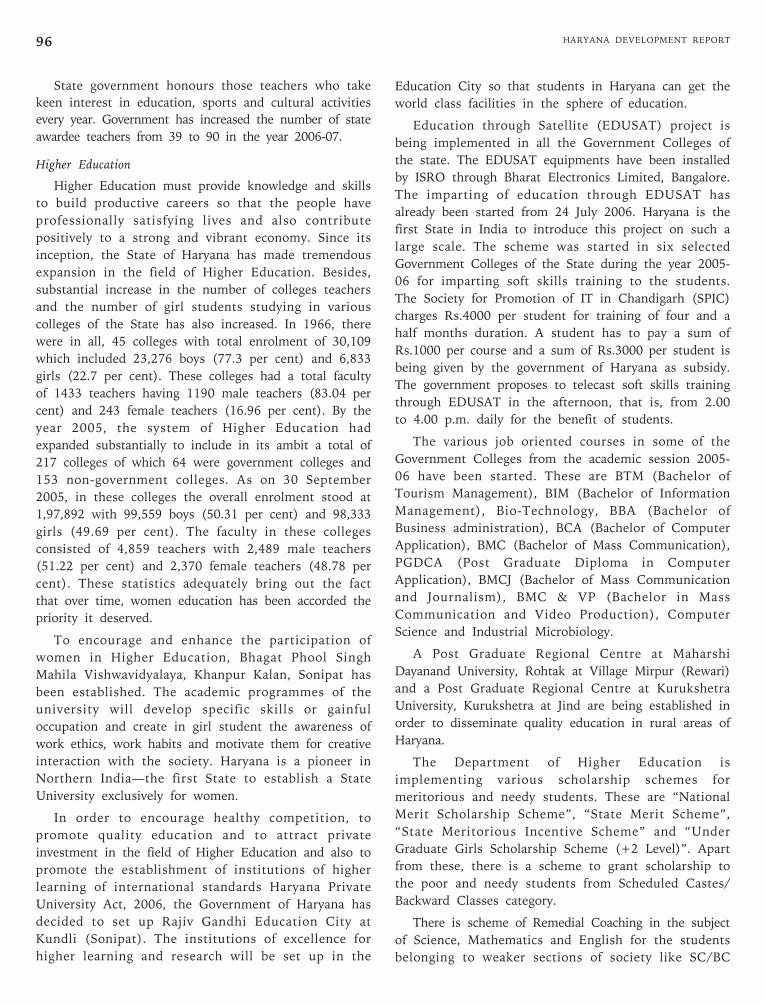
HARYANA DEVELOPMENT REPORT96
State government honours those teachers who take
keen interest in education, sports and cultural activities
every year. Government has increased the number of state
awardee teachers from 39 to 90 in the year 2006-07.
Higher Education
Higher Education must provide knowledge and skills
to build productive careers so that the people have
professionally satisfying lives and also contribute
positively to a strong and vibrant economy. Since its
inception, the State of Haryana has made tremendous
expansion in the field of Higher Education. Besides,
substantial increase in the number of colleges teachers
and the number of girl students studying in various
colleges of the State has also increased. In 1966, there
were in all, 45 colleges with total enrolment of 30,109
which included 23,276 boys (77.3 per cent) and 6,833
girls (22.7 per cent). These colleges had a total faculty
of 1433 teachers having 1190 male teachers (83.04 per
cent) and 243 female teachers (16.96 per cent). By the
year 2005, the system of Higher Education had
expanded substantially to include in its ambit a total of
217 colleges of which 64 were government colleges and
153 non-government colleges. As on 30 September
2005, in these colleges the overall enrolment stood at
1,97,892 with 99,559 boys (50.31 per cent) and 98,333
girls (49.69 per cent). The faculty in these colleges
consisted of 4,859 teachers with 2,489 male teachers
(51.22 per cent) and 2,370 female teachers (48.78 per
cent). These statistics adequately bring out the fact
that over time, women education has been accorded the
priority it deserved.
To encourage and enhance the participation of
women in Higher Education, Bhagat Phool Singh
Mahila Vishwavidyalaya, Khanpur Kalan, Sonipat has
been established. The academic programmes of the
university will develop specific skills or gainful
occupation and create in girl student the awareness of
work ethics, work habits and motivate them for creative
interaction with the society. Haryana is a pioneer in
Northern India—the first State to establish a State
University exclusively for women.
In order to encourage healthy competition, to
promote quality education and to attract private
investment in the field of Higher Education and also to
promote the establishment of institutions of higher
learning of international standards Haryana Private
University Act, 2006, the Government of Haryana has
decided to set up Rajiv Gandhi Education City at
Kundli (Sonipat). The institutions of excellence for
higher learning and research will be set up in the
Education City so that students in Haryana can get the
world class facilities in the sphere of education.
Education through Satellite (EDUSAT) project is
being implemented in all the Government Colleges of
the state. The EDUSAT equipments have been installed
by ISRO through Bharat Electronics Limited, Bangalore.
The imparting of education through EDUSAT has
already been started from 24 July 2006. Haryana is the
first State in India to introduce this project on such a
large scale. The scheme was started in six selected
Government Colleges of the State during the year 2005-
06 for imparting soft skills training to the students.
The Society for Promotion of IT in Chandigarh (SPIC)
charges Rs.4000 per student for training of four and a
half months duration. A student has to pay a sum of
Rs.1000 per course and a sum of Rs.3000 per student is
being given by the government of Haryana as subsidy.
The government proposes to telecast soft skills training
through EDUSAT in the afternoon, that is, from 2.00
to 4.00 p.m. daily for the benefit of students.
The various job oriented courses in some of the
Government Colleges from the academic session 2005-
06 have been started. These are BTM (Bachelor of
Tourism Management), BIM (Bachelor of Information
Management), Bio-Technology, BBA (Bachelor of
Business administration), BCA (Bachelor of Computer
Application), BMC (Bachelor of Mass Communication),
PGDCA (Post Graduate Diploma in Computer
Application), BMCJ (Bachelor of Mass Communication
and Journalism), BMC & VP (Bachelor in Mass
Communication and Video Production), Computer
Science and Industrial Microbiology.
A Post Graduate Regional Centre at Maharshi
Dayanand University, Rohtak at Village Mirpur (Rewari)
and a Post Graduate Regional Centre at Kurukshetra
University, Kurukshetra at Jind are being established in
order to disseminate quality education in rural areas of
Haryana.
The Department of Higher Education is
implementing various scholarship schemes for
meritorious and needy students. These are “National
Merit Scholarship Scheme”, “State Merit Scheme”,
“State Meritorious Incentive Scheme” and “Under
Graduate Girls Scholarship Scheme (+2 Level)”. Apart
from these, there is a scheme to grant scholarship to
the poor and needy students from Scheduled Castes/
Backward Classes category.
There is scheme of Remedial Coaching in the subject
of Science, Mathematics and English for the students
belonging to weaker sections of society like SC/BC
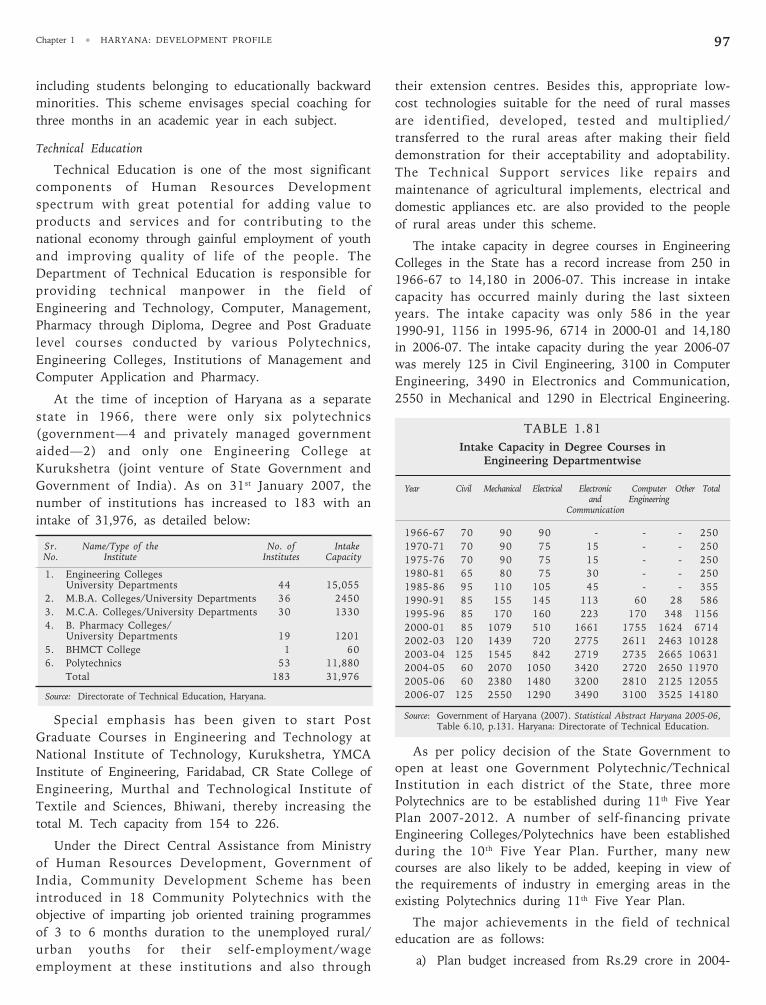
Chapter 1 • HARYANA: DEVELOPMENT PROFILE 97
including students belonging to educationally backward
minorities. This scheme envisages special coaching for
three months in an academic year in each subject.
Technical Education
Technical Education is one of the most significant
components of Human Resources Development
spectrum with great potential for adding value to
products and services and for contributing to the
national economy through gainful employment of youth
and improving quality of life of the people. The
Department of Technical Education is responsible for
providing technical manpower in the field of
Engineering and Technology, Computer, Management,
Pharmacy through Diploma, Degree and Post Graduate
level courses conducted by various Polytechnics,
Engineering Colleges, Institutions of Management and
Computer Application and Pharmacy.
At the time of inception of Haryana as a separate
state in 1966, there were only six polytechnics
(government—4 and privately managed government
aided—2) and only one Engineering College at
Kurukshetra (joint venture of State Government and
Government of India). As on 31st January 2007, the
number of institutions has increased to 183 with an
intake of 31,976, as detailed below:
Sr. Name/Type of the No. of IntakeNo. Institute Institutes Capacity
1. Engineering CollegesUniversity Departments 44 15,055
2. M.B.A. Colleges/University Departments 36 2450
3. M.C.A. Colleges/University Departments 30 1330
4. B. Pharmacy Colleges/University Departments 19 1201
5. BHMCT College 1 60
6. Polytechnics 53 11,880
Total 183 31,976
Source: Directorate of Technical Education, Haryana.
Special emphasis has been given to start Post
Graduate Courses in Engineering and Technology at
National Institute of Technology, Kurukshetra, YMCA
Institute of Engineering, Faridabad, CR State College of
Engineering, Murthal and Technological Institute of
Textile and Sciences, Bhiwani, thereby increasing the
total M. Tech capacity from 154 to 226.
Under the Direct Central Assistance from Ministry
of Human Resources Development, Government of
India, Community Development Scheme has been
introduced in 18 Community Polytechnics with the
objective of imparting job oriented training programmes
of 3 to 6 months duration to the unemployed rural/
urban youths for their self-employment/wage
employment at these institutions and also through
their extension centres. Besides this, appropriate low-
cost technologies suitable for the need of rural masses
are identified, developed, tested and multiplied/
transferred to the rural areas after making their field
demonstration for their acceptability and adoptability.
The Technical Support services like repairs and
maintenance of agricultural implements, electrical and
domestic appliances etc. are also provided to the people
of rural areas under this scheme.
The intake capacity in degree courses in Engineering
Colleges in the State has a record increase from 250 in
1966-67 to 14,180 in 2006-07. This increase in intake
capacity has occurred mainly during the last sixteen
years. The intake capacity was only 586 in the year
1990-91, 1156 in 1995-96, 6714 in 2000-01 and 14,180
in 2006-07. The intake capacity during the year 2006-07
was merely 125 in Civil Engineering, 3100 in Computer
Engineering, 3490 in Electronics and Communication,
2550 in Mechanical and 1290 in Electrical Engineering.
TABLE 1.81
Intake Capacity in Degree Courses inEngineering Departmentwise
Year Civil Mechanical Electrical Electronic Computer Other Totaland Engineering
Communication
1966-67 70 90 90 - - - 250
1970-71 70 90 75 15 - - 250
1975-76 70 90 75 15 - - 250
1980-81 65 80 75 30 - - 250
1985-86 95 110 105 45 - - 355
1990-91 85 155 145 113 60 28 586
1995-96 85 170 160 223 170 348 1156
2000-01 85 1079 510 1661 1755 1624 6714
2002-03 120 1439 720 2775 2611 2463 10128
2003-04 125 1545 842 2719 2735 2665 10631
2004-05 60 2070 1050 3420 2720 2650 11970
2005-06 60 2380 1480 3200 2810 2125 12055
2006-07 125 2550 1290 3490 3100 3525 14180
Source: Government of Haryana (2007). Statistical Abstract Haryana 2005-06,Table 6.10, p.131. Haryana: Directorate of Technical Education.
As per policy decision of the State Government to
open at least one Government Polytechnic/Technical
Institution in each district of the State, three more
Polytechnics are to be established during 11th Five Year
Plan 2007-2012. A number of self-financing private
Engineering Colleges/Polytechnics have been established
during the 10th Five Year Plan. Further, many new
courses are also likely to be added, keeping in view of
the requirements of industry in emerging areas in the
existing Polytechnics during 11th Five Year Plan.
The major achievements in the field of technical
education are as follows:
a) Plan budget increased from Rs.29 crore in 2004-
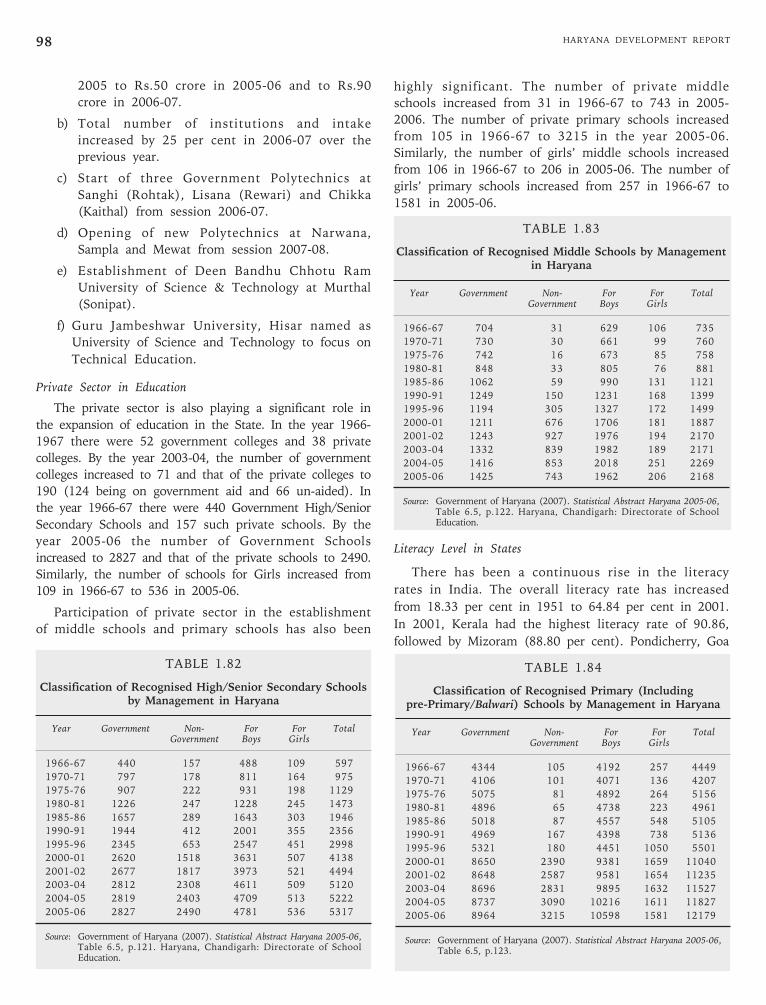
HARYANA DEVELOPMENT REPORT98
highly significant. The number of private middle
schools increased from 31 in 1966-67 to 743 in 2005-
2006. The number of private primary schools increased
from 105 in 1966-67 to 3215 in the year 2005-06.
Similarly, the number of girls’ middle schools increased
from 106 in 1966-67 to 206 in 2005-06. The number of
girls’ primary schools increased from 257 in 1966-67 to
1581 in 2005-06.
TABLE 1.83
Classification of Recognised Middle Schools by Managementin Haryana
Year Government Non- For For TotalGovernment Boys Girls
1966-67 704 31 629 106 735
1970-71 730 30 661 99 760
1975-76 742 16 673 85 758
1980-81 848 33 805 76 881
1985-86 1062 59 990 131 1121
1990-91 1249 150 1231 168 1399
1995-96 1194 305 1327 172 1499
2000-01 1211 676 1706 181 1887
2001-02 1243 927 1976 194 2170
2003-04 1332 839 1982 189 2171
2004-05 1416 853 2018 251 2269
2005-06 1425 743 1962 206 2168
Source: Government of Haryana (2007). Statistical Abstract Haryana 2005-06,Table 6.5, p.122. Haryana, Chandigarh: Directorate of SchoolEducation.
Literacy Level in States
There has been a continuous rise in the literacy
rates in India. The overall literacy rate has increased
from 18.33 per cent in 1951 to 64.84 per cent in 2001.
In 2001, Kerala had the highest literacy rate of 90.86,
followed by Mizoram (88.80 per cent). Pondicherry, Goa
2005 to Rs.50 crore in 2005-06 and to Rs.90
crore in 2006-07.
b) Total number of institutions and intake
increased by 25 per cent in 2006-07 over the
previous year.
c) Start of three Government Polytechnics at
Sanghi (Rohtak), Lisana (Rewari) and Chikka
(Kaithal) from session 2006-07.
d) Opening of new Polytechnics at Narwana,
Sampla and Mewat from session 2007-08.
e) Establishment of Deen Bandhu Chhotu Ram
University of Science & Technology at Murthal
(Sonipat).
f) Guru Jambeshwar University, Hisar named as
University of Science and Technology to focus on
Technical Education.
Private Sector in Education
The private sector is also playing a significant role in
the expansion of education in the State. In the year 1966-
1967 there were 52 government colleges and 38 private
colleges. By the year 2003-04, the number of government
colleges increased to 71 and that of the private colleges to
190 (124 being on government aid and 66 un-aided). In
the year 1966-67 there were 440 Government High/Senior
Secondary Schools and 157 such private schools. By the
year 2005-06 the number of Government Schools
increased to 2827 and that of the private schools to 2490.
Similarly, the number of schools for Girls increased from
109 in 1966-67 to 536 in 2005-06.
Participation of private sector in the establishment
of middle schools and primary schools has also been
TABLE 1.82
Classification of Recognised High/Senior Secondary Schoolsby Management in Haryana
Year Government Non- For For TotalGovernment Boys Girls
1966-67 440 157 488 109 597
1970-71 797 178 811 164 975
1975-76 907 222 931 198 1129
1980-81 1226 247 1228 245 1473
1985-86 1657 289 1643 303 1946
1990-91 1944 412 2001 355 2356
1995-96 2345 653 2547 451 2998
2000-01 2620 1518 3631 507 4138
2001-02 2677 1817 3973 521 4494
2003-04 2812 2308 4611 509 5120
2004-05 2819 2403 4709 513 5222
2005-06 2827 2490 4781 536 5317
Source: Government of Haryana (2007). Statistical Abstract Haryana 2005-06,Table 6.5, p.121. Haryana, Chandigarh: Directorate of SchoolEducation.
TABLE 1.84
Classification of Recognised Primary (Includingpre-Primary/Balwari) Schools by Management in Haryana
Year Government Non- For For TotalGovernment Boys Girls
1966-67 4344 105 4192 257 4449
1970-71 4106 101 4071 136 4207
1975-76 5075 81 4892 264 5156
1980-81 4896 65 4738 223 4961
1985-86 5018 87 4557 548 5105
1990-91 4969 167 4398 738 5136
1995-96 5321 180 4451 1050 5501
2000-01 8650 2390 9381 1659 11040
2001-02 8648 2587 9581 1654 11235
2003-04 8696 2831 9895 1632 11527
2004-05 8737 3090 10216 1611 11827
2005-06 8964 3215 10598 1581 12179
Source: Government of Haryana (2007). Statistical Abstract Haryana 2005-06,Table 6.5, p.123.
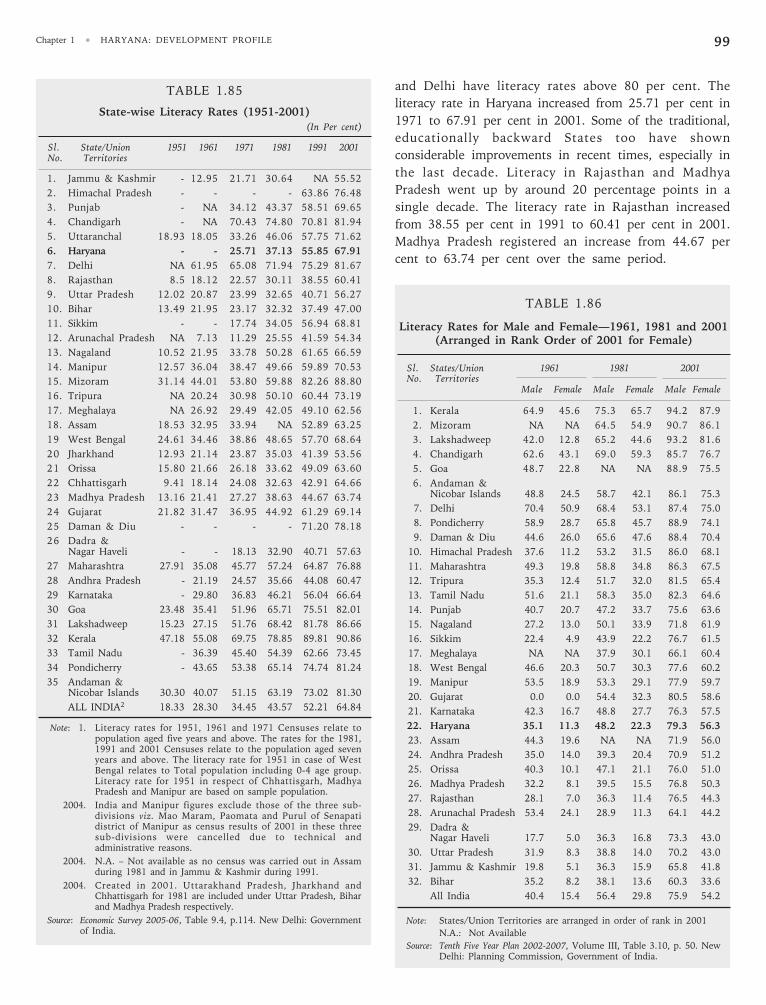
Chapter 1 • HARYANA: DEVELOPMENT PROFILE 99
and Delhi have literacy rates above 80 per cent. The
literacy rate in Haryana increased from 25.71 per cent in
1971 to 67.91 per cent in 2001. Some of the traditional,
educationally backward States too have shown
considerable improvements in recent times, especially in
the last decade. Literacy in Rajasthan and Madhya
Pradesh went up by around 20 percentage points in a
single decade. The literacy rate in Rajasthan increased
from 38.55 per cent in 1991 to 60.41 per cent in 2001.
Madhya Pradesh registered an increase from 44.67 per
cent to 63.74 per cent over the same period.
TABLE 1.85
State-wise Literacy Rates (1951-2001)(In Per cent)
Sl. State/Union 1951 1961 1971 1981 1991 2001No. Territories
1. Jammu & Kashmir - 12.95 21.71 30.64 NA 55.52
2. Himachal Pradesh - - - - 63.86 76.48
3. Punjab - NA 34.12 43.37 58.51 69.65
4. Chandigarh - NA 70.43 74.80 70.81 81.94
5. Uttaranchal 18.93 18.05 33.26 46.06 57.75 71.62
6. Haryana - - 25.71 37.13 55.85 67.91
7. Delhi NA 61.95 65.08 71.94 75.29 81.67
8. Rajasthan 8.5 18.12 22.57 30.11 38.55 60.41
9. Uttar Pradesh 12.02 20.87 23.99 32.65 40.71 56.27
10. Bihar 13.49 21.95 23.17 32.32 37.49 47.00
11. Sikkim - - 17.74 34.05 56.94 68.81
12. Arunachal Pradesh NA 7.13 11.29 25.55 41.59 54.34
13. Nagaland 10.52 21.95 33.78 50.28 61.65 66.59
14. Manipur 12.57 36.04 38.47 49.66 59.89 70.53
15. Mizoram 31.14 44.01 53.80 59.88 82.26 88.80
16. Tripura NA 20.24 30.98 50.10 60.44 73.19
17. Meghalaya NA 26.92 29.49 42.05 49.10 62.56
18. Assam 18.53 32.95 33.94 NA 52.89 63.25
19 West Bengal 24.61 34.46 38.86 48.65 57.70 68.64
20 Jharkhand 12.93 21.14 23.87 35.03 41.39 53.56
21 Orissa 15.80 21.66 26.18 33.62 49.09 63.60
22 Chhattisgarh 9.41 18.14 24.08 32.63 42.91 64.66
23 Madhya Pradesh 13.16 21.41 27.27 38.63 44.67 63.74
24 Gujarat 21.82 31.47 36.95 44.92 61.29 69.14
25 Daman & Diu - - - - 71.20 78.18
26 Dadra &Nagar Haveli - - 18.13 32.90 40.71 57.63
27 Maharashtra 27.91 35.08 45.77 57.24 64.87 76.88
28 Andhra Pradesh - 21.19 24.57 35.66 44.08 60.47
29 Karnataka - 29.80 36.83 46.21 56.04 66.64
30 Goa 23.48 35.41 51.96 65.71 75.51 82.01
31 Lakshadweep 15.23 27.15 51.76 68.42 81.78 86.66
32 Kerala 47.18 55.08 69.75 78.85 89.81 90.86
33 Tamil Nadu - 36.39 45.40 54.39 62.66 73.45
34 Pondicherry - 43.65 53.38 65.14 74.74 81.24
35 Andaman &Nicobar Islands 30.30 40.07 51.15 63.19 73.02 81.30
ALL INDIA2 18.33 28.30 34.45 43.57 52.21 64.84
Note: 1. Literacy rates for 1951, 1961 and 1971 Censuses relate topopulation aged five years and above. The rates for the 1981,1991 and 2001 Censuses relate to the population aged sevenyears and above. The literacy rate for 1951 in case of WestBengal relates to Total population including 0-4 age group.Literacy rate for 1951 in respect of Chhattisgarh, MadhyaPradesh and Manipur are based on sample population.
2004. India and Manipur figures exclude those of the three sub-divisions viz. Mao Maram, Paomata and Purul of Senapatidistrict of Manipur as census results of 2001 in these threesub-divisions were cancelled due to technical andadministrative reasons.
2004. N.A. – Not available as no census was carried out in Assamduring 1981 and in Jammu & Kashmir during 1991.
2004. Created in 2001. Uttarakhand Pradesh, Jharkhand andChhattisgarh for 1981 are included under Uttar Pradesh, Biharand Madhya Pradesh respectively.
Source: Economic Survey 2005-06, Table 9.4, p.114. New Delhi: Governmentof India.
TABLE 1.86
Literacy Rates for Male and Female—1961, 1981 and 2001(Arranged in Rank Order of 2001 for Female)
Sl. States/Union 1961 1981 2001No. Territories
Male Female Male Female Male Female
1. Kerala 64.9 45.6 75.3 65.7 94.2 87.9
2. Mizoram NA NA 64.5 54.9 90.7 86.1
3. Lakshadweep 42.0 12.8 65.2 44.6 93.2 81.6
4. Chandigarh 62.6 43.1 69.0 59.3 85.7 76.7
5. Goa 48.7 22.8 NA NA 88.9 75.5
6. Andaman &Nicobar Islands 48.8 24.5 58.7 42.1 86.1 75.3
7. Delhi 70.4 50.9 68.4 53.1 87.4 75.0
8. Pondicherry 58.9 28.7 65.8 45.7 88.9 74.1
9. Daman & Diu 44.6 26.0 65.6 47.6 88.4 70.4
10. Himachal Pradesh 37.6 11.2 53.2 31.5 86.0 68.1
11. Maharashtra 49.3 19.8 58.8 34.8 86.3 67.5
12. Tripura 35.3 12.4 51.7 32.0 81.5 65.4
13. Tamil Nadu 51.6 21.1 58.3 35.0 82.3 64.6
14. Punjab 40.7 20.7 47.2 33.7 75.6 63.6
15. Nagaland 27.2 13.0 50.1 33.9 71.8 61.9
16. Sikkim 22.4 4.9 43.9 22.2 76.7 61.5
17. Meghalaya NA NA 37.9 30.1 66.1 60.4
18. West Bengal 46.6 20.3 50.7 30.3 77.6 60.2
19. Manipur 53.5 18.9 53.3 29.1 77.9 59.7
20. Gujarat 0.0 0.0 54.4 32.3 80.5 58.6
21. Karnataka 42.3 16.7 48.8 27.7 76.3 57.5
22. Haryana 35.1 11.3 48.2 22.3 79.3 56.3
23. Assam 44.3 19.6 NA NA 71.9 56.0
24. Andhra Pradesh 35.0 14.0 39.3 20.4 70.9 51.2
25. Orissa 40.3 10.1 47.1 21.1 76.0 51.0
26. Madhya Pradesh 32.2 8.1 39.5 15.5 76.8 50.3
27. Rajasthan 28.1 7.0 36.3 11.4 76.5 44.3
28. Arunachal Pradesh 53.4 24.1 28.9 11.3 64.1 44.2
29. Dadra &Nagar Haveli 17.7 5.0 36.3 16.8 73.3 43.0
30. Uttar Pradesh 31.9 8.3 38.8 14.0 70.2 43.0
31. Jammu & Kashmir 19.8 5.1 36.3 15.9 65.8 41.8
32. Bihar 35.2 8.2 38.1 13.6 60.3 33.6
All India 40.4 15.4 56.4 29.8 75.9 54.2
Note: States/Union Territories are arranged in order of rank in 2001
N.A.: Not Available
Source: Tenth Five Year Plan 2002-2007, Volume III, Table 3.10, p. 50. NewDelhi: Planning Commission, Government of India.
HARYANA DEVELOPMENT REPORT100
A case in contrast is Bihar with the lowest literacy
rate of just 47 per cent. Literacy in Bihar, which was at
par with Rajasthan in 1991, has fallen far behind in
just one decade. Both Rajasthan and Bihar started with
more or less the same literacy rate in 1991. But a
decade later whereas Rajasthan improved its literacy rate
by 20 percentage point (from 38.55 to 60.41 per cent),
Bihar could achieve a progress of just 10 percentage
point (from 37.49 to 47 per cent).
Gender Disparities in Literacy Rates
There are gender disparities in literacy at all-India
level, as also within individual States. The gap is the
narrowest in Mizoram where in 2001 male literacy stood
at 90.7 per cent and female literacy at 86.1 per cent. For
Kerala, the two rates in 2001 were 94.2 and 87.9 per
cent, respectively. The gap is the widest in the low
literacy States. For instance, male-female literacy rates in
2001 were 60.3 per cent and 33.6 per cent in Bihar, and
70.2 per cent and 43 per cent in Uttar Pradesh. At the
same time, it should be recognised that these States, as
also Jammu & Kashmir and Madhya Pradesh, have come
a long way since 1961, when female literacy rates were
in single digit only. The exception is Meghalaya where
in spite of low overall literacy rate, the differential
between male and female rate is small. In Haryana, in
2001 the overall literacy rate was 67.91 per cent and the
male and female literacy rates were 79.3 per cent and
56.3 per cent, respectively.
1.2.8.2 Health
In Haryana, the per capita expenditure on health for
the year 2005-06 was Rs.199.40. There was a provision
of per capita expenditure of Rs.243.27 for the year
2006-07. The health services are being provided to the
people through a well connected network of 50
Government Hospitals, 82 Community Health Centres,
408 Primary Health Centres, 2433 Sub Centres, 15
District Tuberculosis Centres, 41 Dispensaries, 14
Mobile units and 2 Mobile Dental Dispensaries, 377 PP
Centres and 16 Urban Health Posts. In addition, there
is a Post-Graduate Institute of Medical Education and
Research Centre at Rohtak with a capacity of 1276 beds
and specialities services which also provides Medical
Training at the Graduate and Post-Graduate level. There
is another Medical College at Agroha, Hisar. Thus the
State has made tremendous progress in the
augmentation of health and medical services.
The number of hospitals, dispensaries and health
centres in the State increased from 785 in 1968 to 3176
in 2005-06. Almost 95 per cent of these are of
government. Similarly, the number of PHCs in rural
and urban Haryana increased from 73 and 16 in 1968 to
363 and 46 in 2005-2006, respectively.
The Revised National Tuberculosis Control
Programme (RNTCP) has been implemented in the
State to control the problem of tuberculosis (TB). This
programme was launched in 3 Districts of Faridabad,
Gurgaon and Sonipat in April, 2000 in the first phase.
The scheme was extended to the districts of Karnal and
Jind in March 2003 in the 2nd phase. In the 3rd phase,
the Government of India agreed to extend this
programme to whole of Haryana under USAID in
August, 2003. Haryana State has been successful to
cover 14 more districts namely Panchkula, Yamuna
Nagar, Ambala, Kaithal, Rewari, Narnaul, Fatehabad,
Sirsa, Rohtak, Kurukshetra, Jhajjar, Bhiwani, Panipat
and Hisar under RNTCP by February, 2004. With the
inclusion of these districts, entire population of 2.2
crore has been covered under RNTCP. Under this
programme, more than 5000 Directly Observed
Treatment (DOT) centres, 206 Microscope centres and
45 TB Units are functioning in the entire State. The
Government provides free medicines and investigations.
Under this programme, the medicine is being given by
the Health Worker to the patient under his direct
supervision. Directly Observed Treatment (DOT) centres
are made near the patient’s house. The State has again
made a National record for the fastest DOTS expansions
in the country and it has been appreciated by the World
Health Organisation. With the implementation of the
RNTCP, the cure rate has increased to 83.4 per cent.
The Pulse Polio Programme is being implemented in
the State, efficiently and effectively. An Intensive
Campaign on School Health Programme is being carried
out in the State. The Reproductive and Child Health
Programme Phase-II is being implemented from 1st April,
2005 in the State of Haryana. To provide 24 hours
delivery services and emergency obstetric care,
Integrated Management of New Born and Childhood
Premises strategy and hiring of medical and para-
medical personnel are some of the few activities
undertaken in this programme. The goal of the RCH-II
programme is to improve Total Fertility Rate, Infant
Mortality Rate, Maternal Mortality Rate, Institutional
Deliveries, Emergency Obstetric Care, Immunisation and
Contraceptive Prevalence.
The first Trauma Centre of the State was made
functional on 19th January 2003 on National Highway
No.1 at General Hospital, Karnal. Another Trauma
Centre at Sirsa was also opened in the year 2003-04.
The Government of India has agreed to establish
another Trauma Centre at Government Hospital, Rewari
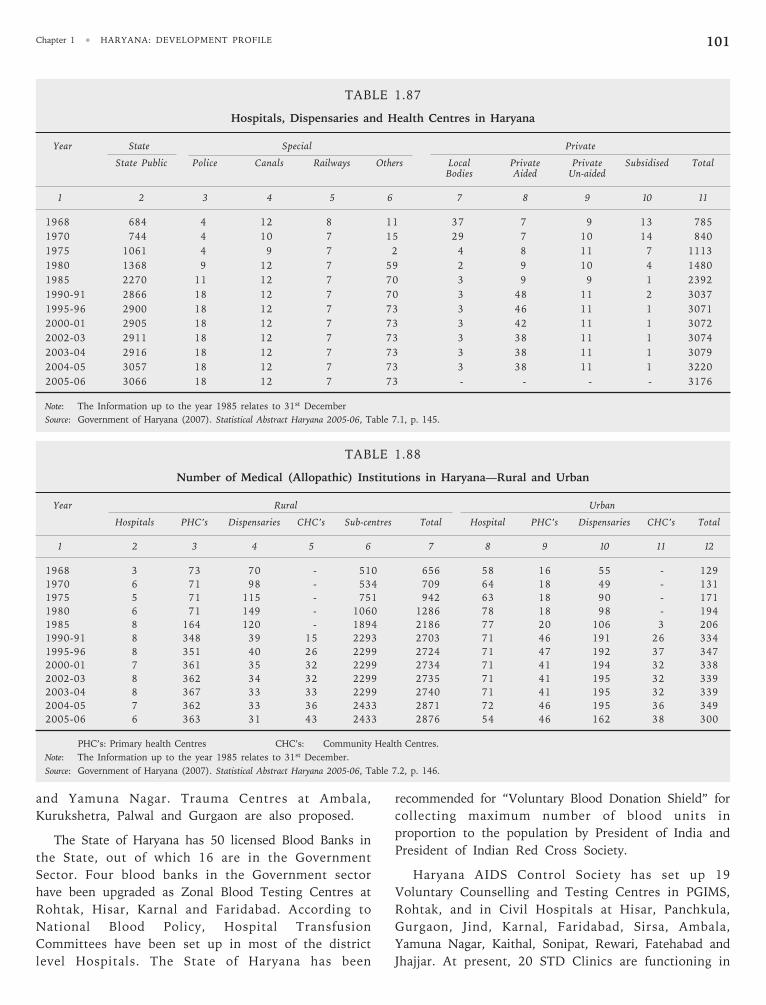
Chapter 1 • HARYANA: DEVELOPMENT PROFILE 101
and Yamuna Nagar. Trauma Centres at Ambala,
Kurukshetra, Palwal and Gurgaon are also proposed.
The State of Haryana has 50 licensed Blood Banks in
the State, out of which 16 are in the Government
Sector. Four blood banks in the Government sector
have been upgraded as Zonal Blood Testing Centres at
Rohtak, Hisar, Karnal and Faridabad. According to
National Blood Policy, Hospital Transfusion
Committees have been set up in most of the district
level Hospitals. The State of Haryana has been
TABLE 1.87
Hospitals, Dispensaries and Health Centres in Haryana
Year State Special Private
State Public Police Canals Railways Others Local Private Private Subsidised TotalBodies Aided Un-aided
1 2 3 4 5 6 7 8 9 10 11
1968 684 4 12 8 11 37 7 9 13 785
1970 744 4 10 7 15 29 7 10 14 840
1975 1061 4 9 7 2 4 8 11 7 1113
1980 1368 9 12 7 59 2 9 10 4 1480
1985 2270 11 12 7 70 3 9 9 1 2392
1990-91 2866 18 12 7 70 3 48 11 2 3037
1995-96 2900 18 12 7 73 3 46 11 1 3071
2000-01 2905 18 12 7 73 3 42 11 1 3072
2002-03 2911 18 12 7 73 3 38 11 1 3074
2003-04 2916 18 12 7 73 3 38 11 1 3079
2004-05 3057 18 12 7 73 3 38 11 1 3220
2005-06 3066 18 12 7 73 - - - - 3176
Note: The Information up to the year 1985 relates to 31st December
Source: Government of Haryana (2007). Statistical Abstract Haryana 2005-06, Table 7.1, p. 145.
TABLE 1.88
Number of Medical (Allopathic) Institutions in Haryana—Rural and Urban
Year Rural Urban
Hospitals PHC’s Dispensaries CHC’s Sub-centres Total Hospital PHC’s Dispensaries CHC’s Total
1 2 3 4 5 6 7 8 9 10 11 12
1968 3 73 70 - 510 656 58 16 55 - 129
1970 6 71 98 - 534 709 64 18 49 - 131
1975 5 71 115 - 751 942 63 18 90 - 171
1980 6 71 149 - 1060 1286 78 18 98 - 194
1985 8 164 120 - 1894 2186 77 20 106 3 206
1990-91 8 348 39 15 2293 2703 71 46 191 26 334
1995-96 8 351 40 26 2299 2724 71 47 192 37 347
2000-01 7 361 35 32 2299 2734 71 41 194 32 338
2002-03 8 362 34 32 2299 2735 71 41 195 32 339
2003-04 8 367 33 33 2299 2740 71 41 195 32 339
2004-05 7 362 33 36 2433 2871 72 46 195 36 349
2005-06 6 363 31 43 2433 2876 54 46 162 38 300
PHC’s: Primary health Centres CHC’s: Community Health Centres.
Note: The Information up to the year 1985 relates to 31st December.
Source: Government of Haryana (2007). Statistical Abstract Haryana 2005-06, Table 7.2, p. 146.
recommended for “Voluntary Blood Donation Shield” for
collecting maximum number of blood units in
proportion to the population by President of India and
President of Indian Red Cross Society.
Haryana AIDS Control Society has set up 19
Voluntary Counselling and Testing Centres in PGIMS,
Rohtak, and in Civil Hospitals at Hisar, Panchkula,
Gurgaon, Jind, Karnal, Faridabad, Sirsa, Ambala,
Yamuna Nagar, Kaithal, Sonipat, Rewari, Fatehabad and
Jhajjar. At present, 20 STD Clinics are functioning in
HARYANA DEVELOPMENT REPORT102
the State for treatment of Sexually Transmitted
Diseases.
Under the banner of the National Rural Health
Mission (NRHM), the Government of India has
launched Reproductive Child Health (RCH-II) to the
tune of Rs.749 crore for Haryana. This programme was
launched on 12th April, 2005 and will continue upto the
year 2011. The Health services are being provided
through a well-connected network of 50 Hospitals, 85
Community Health Centres, 408 Primary Health
Centres, 2433 Sub-centres, 15 District T.B. Centres and
41 Dispensaries. In addition, there is a Post Graduate
Institute of Medical Education and Research at Rohtak
and a Medical College at Agroha, Hisar. The Infant
Mortality Rate which was 61/1000 in 2004 has now
been reduced to 42/1000 in 2006. Similarly, the
Maternal Maternity Rate which was estimated to be 300
per one lakh deliveries is now 162 and institutional
deliveries which were 23 per cent in 2004 have
increased to 46 per cent in 2006.
The estimated per capita expenditure on health for
the year 2006-07 is Rs.243.47. This was Rs.185.90 in
the year 2004-05 and Rs.199.40 in 2005-06.
399 Delivery Huts have been established in the state
to provide safe deliveries to the rural women in a
hygienic environment. This would decrease the
maternal and infant mortality rate. Efforts are being
made to establish 500 Delivery Huts till end of year
2007.
Multi-speciality Health Camps were organised in
every Block of Mewat Area to improve the health status
of the people. 20 such Multi-speciality camps were
organised in which 46,000 people availed health
benefits. Health Camps were also organised in each
Sub-centre. Primary health care outreach services are
being provided through Mobile Health Units.
Arogya Kosh scheme in the state provides health
care to patients Below Poverty Line (BPL) requiring
specialised treatment and financial help. This is 50:50
sharing scheme between the State and the Government
of India.
Another scheme VIKALP is providing treatment to
BPL families through accredited private hospitals. It has
now been extended to all the districts. 96 MoUs have
been signed with private health care providers.
Approximately 1500 families have been registered with
each doctor. The government has constituted a panel of
private specialists wherever specialist services are not
available in government institutions. These specialists
are paid prescribed honorarium for their services and
follow up to the families.
Janani Suraksha Yojna being implemented in the
state is a cent per cent centrally sponsored scheme to
reduce the infant and maternal mortality rate by
promoting institutional deliveries for BPL families.
Antenatal mothers are being registered in their first
trimester and high-risk mothers are also been identified
and given adequate advice. Under this scheme, rural
BPL women are being given Rs.700 for institutional
delivery.
The state has started Janani Suvidha Yojana for
urban slum population under which the women of
these slums can avail free antenatal, natal and post-
natal facilities in some selected nursing homes through
an NGO. This is a prepaid voucher scheme for
antenatal, natal and post-natal care in health
institutions. One woman worker, Sakhi, has been
identified who will act as a link worker to run this
programme. This scheme is presently (in 2006-07)
being implemented in 8 districts, that is, Panchkula,
Gurgaon, Yamuna Nagar, Narnaul, Kurukshetra,
Rewari, Bhiwani and Sonipat.
Under the NRHM umbrella, one female Accredited
Social Health Activist (ASHA) has been identified per
1000 rural population who will act as a link between
the community and the Health Workers. Till date, 7000
ASHAs have been identified. 14,000 ASHAs will be
identified by the year 2008. Health check-ups of all
primary school children are conducted under the School
Health programme and free medicines are given on the
spot for minor ailments. A special Mass De-worming
Campaign of Primary School children was launched in the
state on 5th September 2005 as it was seen that a lot of
children were suffering from anaemia, and worm-
infestation is one of the main causes of this disease.
An intensive health campaign for health check up of
children is being carried out from July 2006 in which
health check up of all children of primary classes is
being conducted. Each child is being given a health
card in which the date of health checkup, height,
weight, diagnosis and treatment, if any, are recorded.
The State government has increased the coverage of
the School Health Programme under the Girl Child Year
2006. Health checks up are being conducted of all school
girls upto 18 years of age and a health card is issued to
them. Health education and advice is given on spread
and control of Sexually Transmitted Diseases (STD),
HIV/AIDS and nutrition etc. Private schools are also
being brought under the perview of this programme.
Chapter 1 • HARYANA: DEVELOPMENT PROFILE 103
Under Blindness Control Programme 8,81,655
children were screened in the year 2005-06. 3,95,019
were screened in the year 2006-07 out of which 24,820
children were found with refractive errors and 3,076
children were given free spectacles.
The declining female/male ratio in the state is a
matter of great concern. As per the census of 2001 the
sex ratio of the state is 861 females/1000 males. The
PNDT Act 1994 and the amendment Act 2002 are being
effectively implemented in the state to stop the social
practice of female foeticide. The state has so far
registered 901 Genetic Clinics and 66 Genetic
Counseling Centres. Registration of 134 Ultrasound
clinics has been suspended/cancelled. 46 ultrasound
clinics are registered in government institutions. 89
ultrasound machines have been seized and sealed by the
respective district appropriate authorities.
In order to increase male participation in Family
Welfare Programme, the No Scalpel Vasectomy (NSV)
technique has been introduced and till January 2007,
121 doctors have been trained in all the districts.
During the year 2005-06, a total of 12,995 Vasectomy
Operations were conducted out of which 12,683 were
NSV while in the year 2004-5, 1900 Vasectomies were
conducted out of which 1500 were NSV. In the year
2006-07, 6306 Vasectomies were conducted out of
which 6206 were NSV.
Haryana has been declared one of the top ranking
States for male participation in Family Welfare
Programme. General Hospital, Sonipat and CHC, Gohana
have been linked to a prestigious hospital of Delhi for
diagnostic services under the Telemedicine Programme.
To spread the message on HIV/AIDS across the state
under the Aids Control Programme, Free
Telecounselling Centres with toll free Number 1097
have been established in all the districts where
information regarding HIV/AIDS is being given for 24
hours. 19 Voluntary Counselling and Testing Centres
have been established by Haryana AIDS Control Society.
There are 19 Parent to Child Transmission and
Counseling Centre. There are 20 STD Clinics for
treatment of Sexually Transmitted Diseases.
Targetted Intervention Programme has been started
by NGOs and Red Cross. The school AIDS Education
Programme in which students of Secondary and Senior
Secondary Schools are being made aware of HIV/AIDS,
6600 teachers from 3050 schools have been imparted
training. There are 51 licensed blood banks in the state
out of which 16 are in the government sector. Zonal
Blood Testing Centres have been established at Rohtak,
Karnal, Hisar and Faridabad.
The Revised Tuberculosis Control Programme
(RTCP) is being implemented in the entire state to
control the problem of TB. The main objective of this
programme is to have 85 per cent cure rate in new
cases. Under this programme more than 6000 DOT
(Directly Observed Treatment) Centres, 210 Microscope
Centres and 46 TB Units are functioning in the State.
The Health Workers/Voluntary DOT provider gives the
medicines to the patient under his/her direct
supervision. DOT centres are made near to the patients’
houses.
Integrated Disease Surveillance Programme (IDSP)
has been started in the State from April 2005 with the
assistance of the World Bank. This project will
continue upto 31 March 2009. The objective of the
programme is to establish decentralised State bases
system of surveillance for communicable and non-
communicable diseases so that timely action can be
taken for prevention and containment of disease. This
is the E-highway for disease surveillance. It also
involves upgrading laboratory services, specialised
training for disease surveillance so that the health
status of the community improves. All the districts are
being connected with the state headquarter.
Integrated Management of Neo Natal and Childhood
Illnesses (IMNCI) to promote early identification, home
based management and timely referral of sick newborns
and children, was launched in the state during 2005-
06. This project was started in the districts of Rewari,
Panchkula, Rohtak, Faridabad and Kaithal. In the year
2006-07, the IMNCI training in the districts of
Narnaul, Yamuna Nagar, Sonipat and Sirsa are being
covered under this programme.
Doctors, LHVs, ANMs, CDPOs, Anganwadi Workers
and ASHA were trained by PGI Chandigarh, WHO,
UNICEF and CLEN programme. The registration of
births and deaths in the state is being done by the
Health Department, Haryana now. This system has been
started from 1st January 2005. The Director General,
Health Services, Haryana is the Chief Registrar of Births
and Deaths in Haryana state. The registration of births
and deaths in the state is about 90 per cent.
Ayurveda
Indian Systems of Medicine and Homeopathy
(AYUSH) cover both the systems which originated in
India and outside but got adopted in India in course of
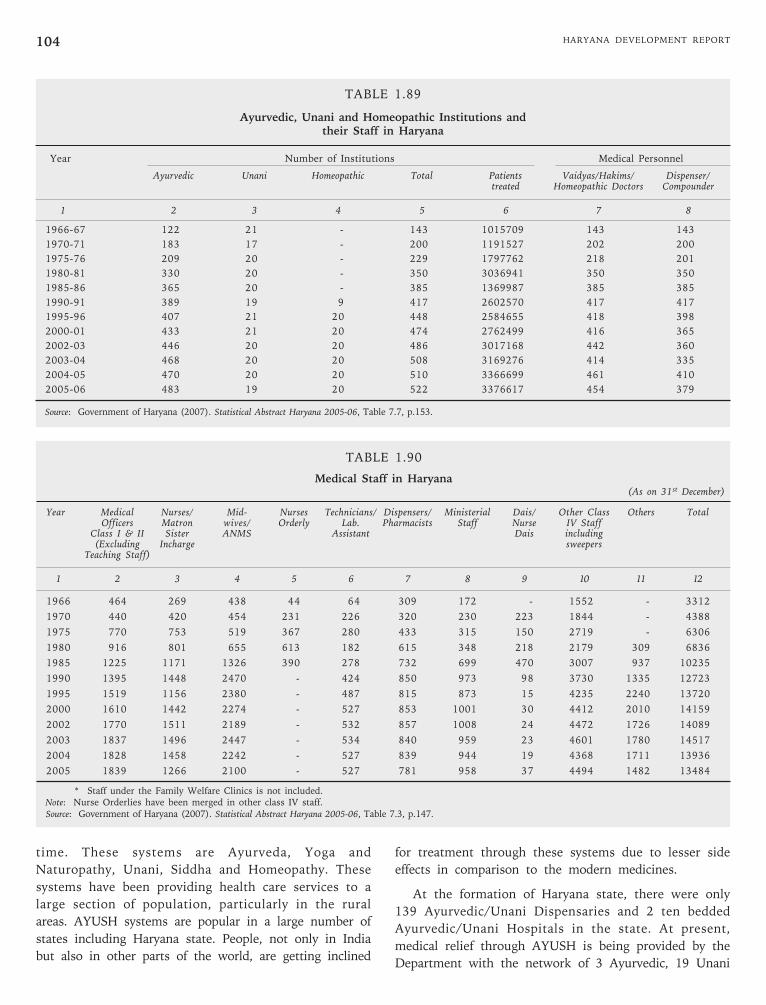
HARYANA DEVELOPMENT REPORT104
TABLE 1.89
Ayurvedic, Unani and Homeopathic Institutions andtheir Staff in Haryana
Year Number of Institutions Medical Personnel
Ayurvedic Unani Homeopathic Total Patients Vaidyas/Hakims/ Dispenser/treated Homeopathic Doctors Compounder
1 2 3 4 5 6 7 8
1966-67 122 21 - 143 1015709 143 143
1970-71 183 17 - 200 1191527 202 200
1975-76 209 20 - 229 1797762 218 201
1980-81 330 20 - 350 3036941 350 350
1985-86 365 20 - 385 1369987 385 385
1990-91 389 19 9 417 2602570 417 417
1995-96 407 21 20 448 2584655 418 398
2000-01 433 21 20 474 2762499 416 365
2002-03 446 20 20 486 3017168 442 360
2003-04 468 20 20 508 3169276 414 335
2004-05 470 20 20 510 3366699 461 410
2005-06 483 19 20 522 3376617 454 379
Source: Government of Haryana (2007). Statistical Abstract Haryana 2005-06, Table 7.7, p.153.
TABLE 1.90
Medical Staff in Haryana(As on 31st December)
Year Medical Nurses/ Mid- Nurses Technicians/ Dispensers/ Ministerial Dais/ Other Class Others TotalOfficers Matron wives/ Orderly Lab. Pharmacists Staff Nurse IV Staff
Class I & II Sister ANMS Assistant Dais including(Excluding Incharge sweepers
Teaching Staff)
1 2 3 4 5 6 7 8 9 10 11 12
1966 464 269 438 44 64 309 172 - 1552 - 3312
1970 440 420 454 231 226 320 230 223 1844 - 4388
1975 770 753 519 367 280 433 315 150 2719 - 6306
1980 916 801 655 613 182 615 348 218 2179 309 6836
1985 1225 1171 1326 390 278 732 699 470 3007 937 10235
1990 1395 1448 2470 - 424 850 973 98 3730 1335 12723
1995 1519 1156 2380 - 487 815 873 15 4235 2240 13720
2000 1610 1442 2274 - 527 853 1001 30 4412 2010 14159
2002 1770 1511 2189 - 532 857 1008 24 4472 1726 14089
2003 1837 1496 2447 - 534 840 959 23 4601 1780 14517
2004 1828 1458 2242 - 527 839 944 19 4368 1711 13936
2005 1839 1266 2100 - 527 781 958 37 4494 1482 13484
* Staff under the Family Welfare Clinics is not included.Note: Nurse Orderlies have been merged in other class IV staff.Source: Government of Haryana (2007). Statistical Abstract Haryana 2005-06, Table 7.3, p.147.
time. These systems are Ayurveda, Yoga and
Naturopathy, Unani, Siddha and Homeopathy. These
systems have been providing health care services to a
large section of population, particularly in the rural
areas. AYUSH systems are popular in a large number of
states including Haryana state. People, not only in India
but also in other parts of the world, are getting inclined
for treatment through these systems due to lesser side
effects in comparison to the modern medicines.
At the formation of Haryana state, there were only
139 Ayurvedic/Unani Dispensaries and 2 ten bedded
Ayurvedic/Unani Hospitals in the state. At present,
medical relief through AYUSH is being provided by the
Department with the network of 3 Ayurvedic, 19 Unani
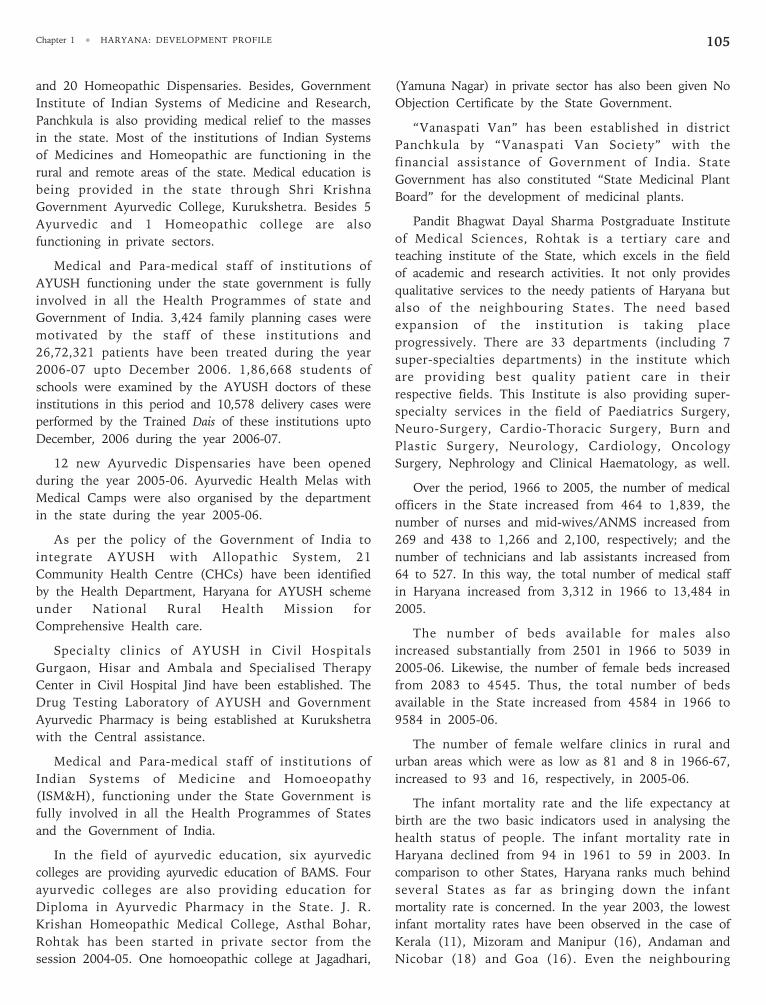
Chapter 1 • HARYANA: DEVELOPMENT PROFILE 105
and 20 Homeopathic Dispensaries. Besides, Government
Institute of Indian Systems of Medicine and Research,
Panchkula is also providing medical relief to the masses
in the state. Most of the institutions of Indian Systems
of Medicines and Homeopathic are functioning in the
rural and remote areas of the state. Medical education is
being provided in the state through Shri Krishna
Government Ayurvedic College, Kurukshetra. Besides 5
Ayurvedic and 1 Homeopathic college are also
functioning in private sectors.
Medical and Para-medical staff of institutions of
AYUSH functioning under the state government is fully
involved in all the Health Programmes of state and
Government of India. 3,424 family planning cases were
motivated by the staff of these institutions and
26,72,321 patients have been treated during the year
2006-07 upto December 2006. 1,86,668 students of
schools were examined by the AYUSH doctors of these
institutions in this period and 10,578 delivery cases were
performed by the Trained Dais of these institutions upto
December, 2006 during the year 2006-07.
12 new Ayurvedic Dispensaries have been opened
during the year 2005-06. Ayurvedic Health Melas with
Medical Camps were also organised by the department
in the state during the year 2005-06.
As per the policy of the Government of India to
integrate AYUSH with Allopathic System, 21
Community Health Centre (CHCs) have been identified
by the Health Department, Haryana for AYUSH scheme
under National Rural Health Mission for
Comprehensive Health care.
Specialty clinics of AYUSH in Civil Hospitals
Gurgaon, Hisar and Ambala and Specialised Therapy
Center in Civil Hospital Jind have been established. The
Drug Testing Laboratory of AYUSH and Government
Ayurvedic Pharmacy is being established at Kurukshetra
with the Central assistance.
Medical and Para-medical staff of institutions of
Indian Systems of Medicine and Homoeopathy
(ISM&H), functioning under the State Government is
fully involved in all the Health Programmes of States
and the Government of India.
In the field of ayurvedic education, six ayurvedic
colleges are providing ayurvedic education of BAMS. Four
ayurvedic colleges are also providing education for
Diploma in Ayurvedic Pharmacy in the State. J. R.
Krishan Homeopathic Medical College, Asthal Bohar,
Rohtak has been started in private sector from the
session 2004-05. One homoeopathic college at Jagadhari,
(Yamuna Nagar) in private sector has also been given No
Objection Certificate by the State Government.
“Vanaspati Van” has been established in district
Panchkula by “Vanaspati Van Society” with the
financial assistance of Government of India. State
Government has also constituted “State Medicinal Plant
Board” for the development of medicinal plants.
Pandit Bhagwat Dayal Sharma Postgraduate Institute
of Medical Sciences, Rohtak is a tertiary care and
teaching institute of the State, which excels in the field
of academic and research activities. It not only provides
qualitative services to the needy patients of Haryana but
also of the neighbouring States. The need based
expansion of the institution is taking place
progressively. There are 33 departments (including 7
super-specialties departments) in the institute which
are providing best quality patient care in their
respective fields. This Institute is also providing super-
specialty services in the field of Paediatrics Surgery,
Neuro-Surgery, Cardio-Thoracic Surgery, Burn and
Plastic Surgery, Neurology, Cardiology, Oncology
Surgery, Nephrology and Clinical Haematology, as well.
Over the period, 1966 to 2005, the number of medical
officers in the State increased from 464 to 1,839, the
number of nurses and mid-wives/ANMS increased from
269 and 438 to 1,266 and 2,100, respectively; and the
number of technicians and lab assistants increased from
64 to 527. In this way, the total number of medical staff
in Haryana increased from 3,312 in 1966 to 13,484 in
2005.
The number of beds available for males also
increased substantially from 2501 in 1966 to 5039 in
2005-06. Likewise, the number of female beds increased
from 2083 to 4545. Thus, the total number of beds
available in the State increased from 4584 in 1966 to
9584 in 2005-06.
The number of female welfare clinics in rural and
urban areas which were as low as 81 and 8 in 1966-67,
increased to 93 and 16, respectively, in 2005-06.
The infant mortality rate and the life expectancy at
birth are the two basic indicators used in analysing the
health status of people. The infant mortality rate in
Haryana declined from 94 in 1961 to 59 in 2003. In
comparison to other States, Haryana ranks much behind
several States as far as bringing down the infant
mortality rate is concerned. In the year 2003, the lowest
infant mortality rates have been observed in the case of
Kerala (11), Mizoram and Manipur (16), Andaman and
Nicobar (18) and Goa (16). Even the neighbouring
HARYANA DEVELOPMENT REPORT106
MEGA HEALTH CAMP-DISTRICT JHAJJAR(HARYANA)
2-3-4, APRIL, 20006
(As Experiment in Public-Private Partnership)
Background
Jhajjar is basically a rural and backward district of the statehaving a weak health infrastructure. Most of the populationliving in the rural area is socio-economically backwardhaving little means and unable to avail the costly privatehealth facilities. Moreover, being a backward district evenprivate health care is not available in the area. The ruralpopulation of the district cannot afford the high costspecialist treatment available in the nearby cities due to weakeconomic condition. The only nearest super specialtygovernment hospital is PGIMS, Rohtak, which is alreadyoverburdened with long queues of patients, and sometimesoperation cases have to wait for several days.
Planning
Shri Deepender Singh Hooda, Member of Parliament fromRohtak (Jhajjar district is a part of Rohtak Parliamentaryconstituency) and the District Administration of Jhajjardecided to hold a Mega Health Camp wherein superspecialist treatment could be provided to the people of thearea at their door steps. After discussing all aspects ofMedicare facilities available in the area, health careinfrastructure available in the district and surroundingdistricts, the medicines were distributed free of cost.
Venue
The building of S.D. Institute of Medical Technology onBadli Road was chosen because it has good infrastructure.It is a three-storeyed building with large size rooms, hugelawns and several entry points to the building, with drinkingwater and toilet facilities on each floor.
Identification of Activities and Tie up withprivate Hospitals:
Detailed discussions were held with the Director andfaculty of the PGIMS Rohtak and it was decided that allspecialities should be made available so that patients mayget specialised treatment at one go and under one roof.Simultaneously private hospitals were also approached bythe M.P. Consequently, the following private hospitalsagreed to join hands in this noble venture:
1. Bhagwan Mahavira Viklang Sanstha, Jaipur agreed tocome and provide artificial limbs free of cost.
2. Escorts Heart Centre agreed to send its mobile unit forECG and other heart related tests.
3. Escorts, Faridabad agreed to send its team for generalhealth check-up.
4. Sun Flag Hospital, Faridabad volunteered to send itsteam for chest and T.B. check-up.
5. Shri Guru Gobind Singh Tri-centenary Dental College(Budhera), Gurgaon agreed to send their team for dentalcheck up and to provide basic dental care.
6. The remaining specialities like Orthopedics, Eye, Skin,Gynaecology, Pediatrics, Psychiatry, ENT and Medicinewere to be covered by the specialists from PGIMS,Rohtak.
TABLE 1.91
Beds Available in Haryana(As on 31st December)
Year Beds
Males Females Total
1 2 3 4
1966 2501 2083 4584
1970 3184 2872 6056
1975 4128 3620 7748
1980 4728 4020 8748
1985 5123 4352 9475
1990-91 5562 5069 10631
1995-96 5855 5473 11328
2000-01 5632 5246 10878
2002-03 5715 5329 11044
2003-04 5734 5348 11082
2004-05 5734 5348 11082
2005-06 5039 4545 9584
Note: Information relating to beds for the years 1990-91 onwards relatesto 31st March.
Source: Government of Haryana (2007). Statistical Abstract Haryana 2005-06,Table 7.4, p.148.
TABLE 1.92
Number of Family Welfare Clinics in Haryana
Number of Family Welfare Clinics/Centres
Year Rural Urban Total
1966-67 81 8 89
1970-71 89 9 98
1975-76 89 14 103
1980-81 89 41 130
1985-86 93 43 136
1990-91 93 56 149
1995-96 93 56 149
2000-01 93 56 149
2001-02 93 56 149
2002-03 93 53 146
2003-04 93 53 146
2004-05 93 52 145
2005-06 93 16 109
Note: (1) Post-partum Centres are included under urban informationfrom 1980-81.
(2) Urban Centres of voluntary organistions have also beenincluded from the year 1988-89.
Source: Government of Haryana (2007). Statistical Abstract Haryana 2005-06,Table 7.8, p.154.
States of Punjab (49) and Himachal Pradesh (49) are
ahead of Haryana in this regard. Obviously, in the
sphere of improving health conditions, this constitutes
an important area of serious concern for the State.
Happily, the life expectancy at birth in Haryana has
increased from 60.3 in 1981-85 to 64 in 1993-97 which
has placed Haryana only after Kerala (73), Punjab (68)
and Maharashtra (66) among the major States of the
country.
Chapter 1 • HARYANA: DEVELOPMENT PROFILE 107
7. The ophthalmology department of PGIMS evenvolunteered to even operate patients for cataract atJhajjar Civil Hospital.
8. The back up to the PGIMS team was provided by theHealth Department of Jhajjar district.
It was decided to do all routine pathological tests of thepatients at the venue, and Ultra-Sound and X-Ray facilitieswere also provided. The Department of Ayurveda,Government of Haryana also participated.
Publicity:
The next important aspect of the Health Camp was publicity.For this purpose Public Relation Department of the districtcarried out wide publicity. Coverage in newspapers wasprovided by giving press statements and news, everyday, for5 days preceding the camp. The entire district was dividedinto zones so that patients coming on a single day could beattended to within 1 to 1.5 hour thus a large number ofpatients could be covered.
Facilities for Patients:
Every patient coming to the venue was first taken to theRegistration Counter (10 in number). Here all the detailsof the patient were entered in a register and he/she wasissued a numbered Registration Card. After registration thepatient was escorted to the screening table (20 innumber)—10 each for male and female-manned by JuniorDoctors of the PGIMS. After enquiring from the patientabout his ailment, they entered the room numbers of thespecialists where the patient was required to go.
The services of about 100 volunteers were utilised to guidethe patients to the various rooms and even help instreamlining the entry to various rooms to preventovercrowding.
The patients could visit as many OPDs as they desired. Herethe private hospitals and the PGIMS doctors again issuedtheir follow-up cards—as the Private Hospitals had agreedto provide free follow-up to the patients at their hospitalsfor 15 days after the camp. The PGIMS doctors also gavethe patients follow-up cards with the OPD days and room-numbers of the PGIMS indicated thereupon. Thereafter thepatient went to the medicine counter, where he/she wasgiven medicines for one full course, generally 5-7 days.
Arrangements for drinking water were made on each floorand durries were provided in the lobby of each floor for thecomfort of the patients. Sweepers were assigned duty roundthe clock, to keep the area, galleries and toilets clean.
Other Activities:
Since people were coming from distant places, they werealso provided other facilities such as: 1) PhysicallyHandicapped Certificates, 2) Widow Pension Certificates, 3)Bus Passes for the Physically Challenged, and 4) Loanfacilities for the physically challenged.
At the same time, arrangements were also made by eachdepartment to have an exhibition depicting the activities.Documentaries on various social issues including AIDS andsafe drinking water were shown.
The services of the Public Relations Department were
utilised to keep the people entertained. They provided theservices of the bhajan parties to keep the people waiting fortheir turn, entertained.
On the third day a closing ceremony was organised where500 Hearing Aids, 75 Wheel Chairs, 200 Tricycles,Spectacles and Calipers etc. were distributed to the needypatients. Freedom Fighters of the district were alsohonoured on this occasion.
Mementoes were given to honour the institutes. Private aswell as Government organisations which had played a majorrole in making the camp a success and appreciationcertificates were issued to each individual Doctor/ParaMedical and other Staff for their contribution.
This three day Mega Health Camp generated keen interestamong the people of the area which is evident from thestatistics given below:
Number of Patients Registered on 2.4.2006 - 3616
Number of Patients attended OPD - 3820
Number of Patients Registeredon 3.4.2006 - 4037
Number of Patients attended OPD - 4425
Number of Patients Registeredon 4.4.2006 - 4401
Number of Patients attended OPD - 5597
Total Number ofPatients Registered - 12,054
Total Number of OPD - 13,842
Break-up Specialty wise
Gynae - 520
Medicine - 1619
Orthopedic - 2357
Pediatric - 658
Eyes - 1394* (96operatedout of 200identified)
ENT - 1521
Skin - 716
Dental - 857
Psychiatry - 126
Heart - 1166
Surgery - 594
Chest - 590
Ayurveda - 1724
Total 13,842
* 104 eye operations could not be conducted due to thepatients being found medically unfit.
The camp was a grand success which is evident from thelarge number of people who visited it and benefited fromit. People from all corners of the five assembly segments ofthe district got benefited from this mega Health Camp. Itwas an attempt to serve the poor, needy, ailing rural peopleof the district.
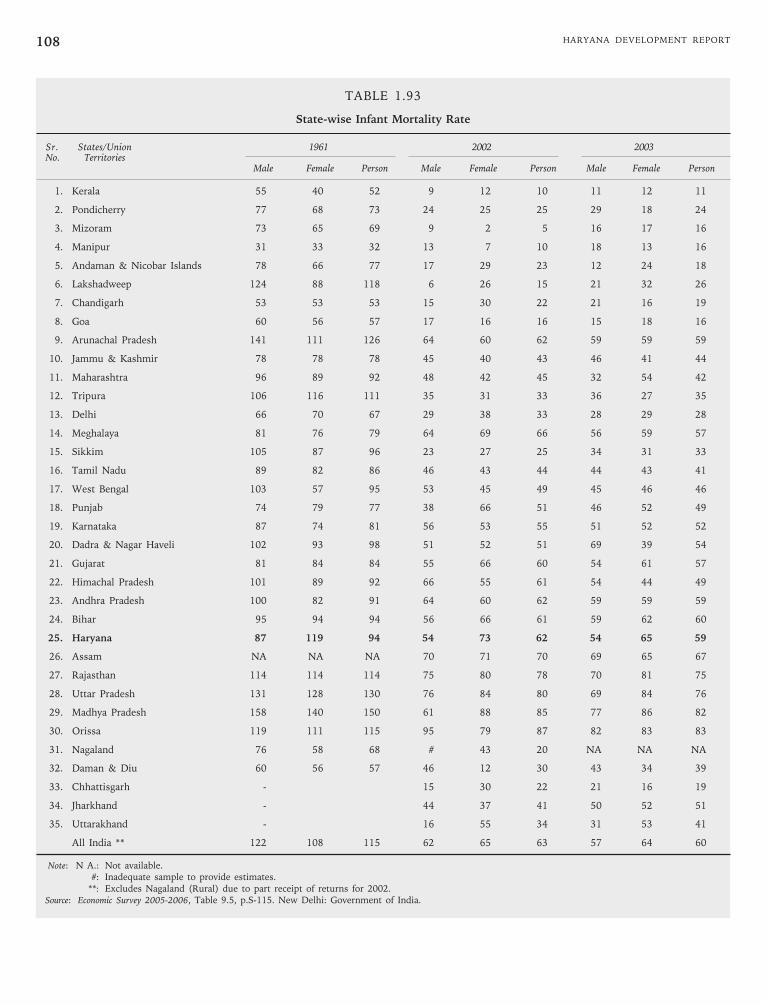
HARYANA DEVELOPMENT REPORT108
TABLE 1.93
State-wise Infant Mortality Rate
Sr. States/Union 1961 2002 2003No. Territories
Male Female Person Male Female Person Male Female Person
1. Kerala 55 40 52 9 12 10 11 12 11
2. Pondicherry 77 68 73 24 25 25 29 18 24
3. Mizoram 73 65 69 9 2 5 16 17 16
4. Manipur 31 33 32 13 7 10 18 13 16
5. Andaman & Nicobar Islands 78 66 77 17 29 23 12 24 18
6. Lakshadweep 124 88 118 6 26 15 21 32 26
7. Chandigarh 53 53 53 15 30 22 21 16 19
8. Goa 60 56 57 17 16 16 15 18 16
9. Arunachal Pradesh 141 111 126 64 60 62 59 59 59
10. Jammu & Kashmir 78 78 78 45 40 43 46 41 44
11. Maharashtra 96 89 92 48 42 45 32 54 42
12. Tripura 106 116 111 35 31 33 36 27 35
13. Delhi 66 70 67 29 38 33 28 29 28
14. Meghalaya 81 76 79 64 69 66 56 59 57
15. Sikkim 105 87 96 23 27 25 34 31 33
16. Tamil Nadu 89 82 86 46 43 44 44 43 41
17. West Bengal 103 57 95 53 45 49 45 46 46
18. Punjab 74 79 77 38 66 51 46 52 49
19. Karnataka 87 74 81 56 53 55 51 52 52
20. Dadra & Nagar Haveli 102 93 98 51 52 51 69 39 54
21. Gujarat 81 84 84 55 66 60 54 61 57
22. Himachal Pradesh 101 89 92 66 55 61 54 44 49
23. Andhra Pradesh 100 82 91 64 60 62 59 59 59
24. Bihar 95 94 94 56 66 61 59 62 60
25. Haryana 87 119 94 54 73 62 54 65 59
26. Assam NA NA NA 70 71 70 69 65 67
27. Rajasthan 114 114 114 75 80 78 70 81 75
28. Uttar Pradesh 131 128 130 76 84 80 69 84 76
29. Madhya Pradesh 158 140 150 61 88 85 77 86 82
30. Orissa 119 111 115 95 79 87 82 83 83
31. Nagaland 76 58 68 # 43 20 NA NA NA
32. Daman & Diu 60 56 57 46 12 30 43 34 39
33. Chhattisgarh - 15 30 22 21 16 19
34. Jharkhand - 44 37 41 50 52 51
35. Uttarakhand - 16 55 34 31 53 41
All India ** 122 108 115 62 65 63 57 64 60
Note: N A.: Not available.#: Inadequate sample to provide estimates.
**: Excludes Nagaland (Rural) due to part receipt of returns for 2002.Source: Economic Survey 2005-2006, Table 9.5, p.S-115. New Delhi: Government of India.
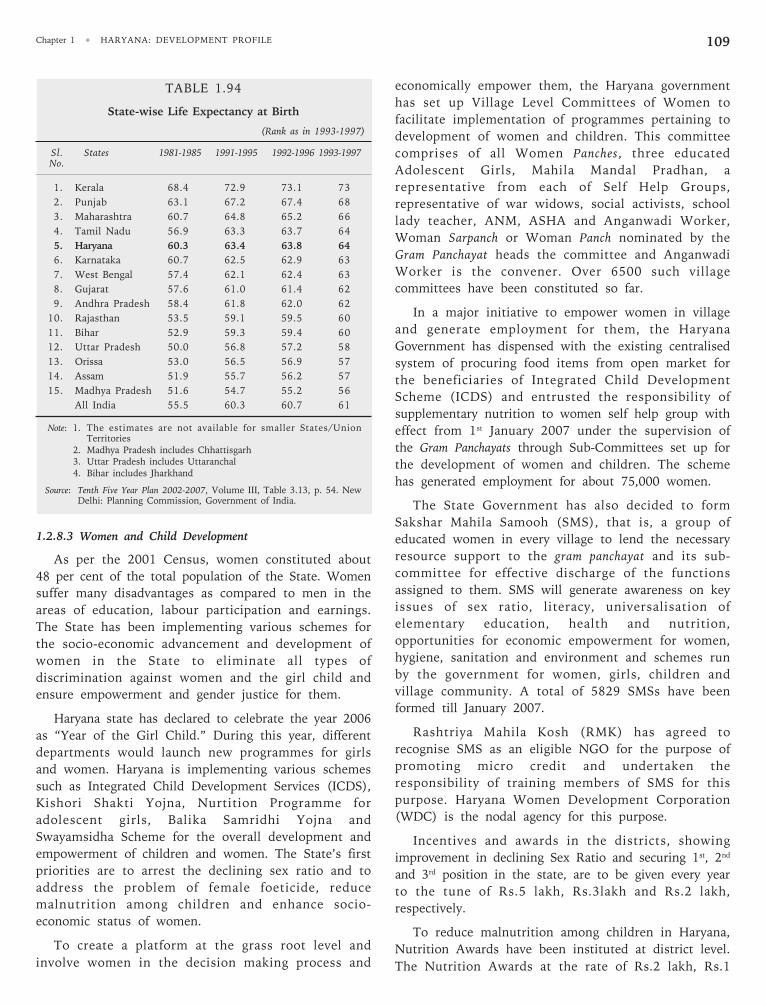
Chapter 1 • HARYANA: DEVELOPMENT PROFILE 109
1.2.8.3 Women and Child Development
As per the 2001 Census, women constituted about
48 per cent of the total population of the State. Women
suffer many disadvantages as compared to men in the
areas of education, labour participation and earnings.
The State has been implementing various schemes for
the socio-economic advancement and development of
women in the State to eliminate all types of
discrimination against women and the girl child and
ensure empowerment and gender justice for them.
Haryana state has declared to celebrate the year 2006
as “Year of the Girl Child.” During this year, different
departments would launch new programmes for girls
and women. Haryana is implementing various schemes
such as Integrated Child Development Services (ICDS),
Kishori Shakti Yojna, Nurtition Programme for
adolescent girls, Balika Samridhi Yojna and
Swayamsidha Scheme for the overall development and
empowerment of children and women. The State’s first
priorities are to arrest the declining sex ratio and to
address the problem of female foeticide, reduce
malnutrition among children and enhance socio-
economic status of women.
To create a platform at the grass root level and
involve women in the decision making process and
economically empower them, the Haryana government
has set up Village Level Committees of Women to
facilitate implementation of programmes pertaining to
development of women and children. This committee
comprises of all Women Panches, three educated
Adolescent Girls, Mahila Mandal Pradhan, a
representative from each of Self Help Groups,
representative of war widows, social activists, school
lady teacher, ANM, ASHA and Anganwadi Worker,
Woman Sarpanch or Woman Panch nominated by the
Gram Panchayat heads the committee and Anganwadi
Worker is the convener. Over 6500 such village
committees have been constituted so far.
In a major initiative to empower women in village
and generate employment for them, the Haryana
Government has dispensed with the existing centralised
system of procuring food items from open market for
the beneficiaries of Integrated Child Development
Scheme (ICDS) and entrusted the responsibility of
supplementary nutrition to women self help group with
effect from 1st January 2007 under the supervision of
the Gram Panchayats through Sub-Committees set up for
the development of women and children. The scheme
has generated employment for about 75,000 women.
The State Government has also decided to form
Sakshar Mahila Samooh (SMS), that is, a group of
educated women in every village to lend the necessary
resource support to the gram panchayat and its sub-
committee for effective discharge of the functions
assigned to them. SMS will generate awareness on key
issues of sex ratio, literacy, universalisation of
elementary education, health and nutrition,
opportunities for economic empowerment for women,
hygiene, sanitation and environment and schemes run
by the government for women, girls, children and
village community. A total of 5829 SMSs have been
formed till January 2007.
Rashtriya Mahila Kosh (RMK) has agreed to
recognise SMS as an eligible NGO for the purpose of
promoting micro credit and undertaken the
responsibility of training members of SMS for this
purpose. Haryana Women Development Corporation
(WDC) is the nodal agency for this purpose.
Incentives and awards in the districts, showing
improvement in declining Sex Ratio and securing 1st, 2nd
and 3rd position in the state, are to be given every year
to the tune of Rs.5 lakh, Rs.3lakh and Rs.2 lakh,
respectively.
To reduce malnutrition among children in Haryana,
Nutrition Awards have been instituted at district level.
The Nutrition Awards at the rate of Rs.2 lakh, Rs.1
TABLE 1.94
State-wise Life Expectancy at Birth
(Rank as in 1993-1997)
Sl. States 1981-1985 1991-1995 1992-1996 1993-1997No.
1. Kerala 68.4 72.9 73.1 73
2. Punjab 63.1 67.2 67.4 68
3. Maharashtra 60.7 64.8 65.2 66
4. Tamil Nadu 56.9 63.3 63.7 64
5. Haryana 60.3 63.4 63.8 64
6. Karnataka 60.7 62.5 62.9 63
7. West Bengal 57.4 62.1 62.4 63
8. Gujarat 57.6 61.0 61.4 62
9. Andhra Pradesh 58.4 61.8 62.0 62
10. Rajasthan 53.5 59.1 59.5 60
11. Bihar 52.9 59.3 59.4 60
12. Uttar Pradesh 50.0 56.8 57.2 58
13. Orissa 53.0 56.5 56.9 57
14. Assam 51.9 55.7 56.2 57
15. Madhya Pradesh 51.6 54.7 55.2 56
All India 55.5 60.3 60.7 61
Note: 1. The estimates are not available for smaller States/UnionTerritories
2. Madhya Pradesh includes Chhattisgarh3. Uttar Pradesh includes Uttaranchal4. Bihar includes Jharkhand
Source: Tenth Five Year Plan 2002-2007, Volume III, Table 3.13, p. 54. NewDelhi: Planning Commission, Government of India.
HARYANA DEVELOPMENT REPORT110
lakh and Rs.0.5 lakh are to be given every year to the
districts securing 1st, 2nd and 3rd positions, respectively,
in the State.
In order to make the Anganwadi Centres (AWCs)
attractive and ensure regular attendance of children, the
State government has made a provision at the rate of
Rs.5,000 per Anganwadi Centre to provide toys and
swings for children in Anganwadi Centre in the state.
The State Government has enhanced the financial
norms under Supplementary Nutrition Programme (SNP)
with effect from 1st January 2007 from Rs.2.00 to Rs.3.00
per day per child and from Rs.2.50 to Rs.5.00 per day
per mother/adolescent girl so that protein and calories
requirements as per norms of ICDS scheme could be
ensured to all the beneficiaries. These rates are highest in
the country. The honorarium of Anganwadi Workers and
helpers has been enhanced with effect from 1st May
2006 at the rate of Rs.100 per year for next five years.
Financial assistance to all Mahila Mandals in Haryana
at the rate of Rs.5,000 every year is being given.
For speedy disposal of family disputes, the state
government has sanctioned 4 Family Courts at Faridabad,
Gurgaon, Hisar and Bhiwani to be set up in phased
manner. Female Protection Officers are proposed to be
appointed to protect women from domestic violence.
In order to combat the problem of female foeticide
and arrest the declining sex ratio in the state, an
incentive based scheme Ladli has been launched by the
state government. Under this scheme Rs.5,000 per year
are given on the birth of second daughter born on or
after 20 August 2005 for five years. The parents who are
resident of Haryana or having Haryana domicile are
eligible for this cash incentive irrespective of their caste,
creed, religion, income and number of sons. The amount
is invested in Kisan Vikas Patras in the name of the
second daughter through mother/father/guardian and
the matured amount of approximately Rs.86,927 at
current rates of interest would be paid after the second
daughter attains the age of 18 years. 15,482 beneficiaries
have been covered upto December 2006. It is proposed to
cover 42,000 beneficiaries during 2007-08.
In order to encourage rural girls to pursue higher
education, the scheme of Awards to Rural Adolescent
Girls has been started from the year 2005-06. Under this
scheme, 3 rural girls who pass the matriculation
examination conducted by Haryana State Education
Board from each block are given awards of Rs.2000,
Rs.1500 and Rs.1000 for 1st, 2nd and 3rd positions,
respectively.
To encourage women for proper rearing of their
children, especially the girl child with a view to
improve their nutritional and health status, the scheme
of Best Mother Award has been started form the year
2005-06. Under this scheme from each circle and each
block of ICDS scheme, 3 mothers having at least one
girl child are selected for 1st, 2nd and 3rd prizes, who are
given prizes of Rs.1000, Rs.750, and Rs.500,
respectively, at block level and Rs.500, Rs.300 and
Rs.200, respectively, at the circle level.
For providing exposure to sports and recreation to
women, the state government has implemented the
scheme of Annual Sports Meet at block level. Three
prizes at the rate of Rs.500, Rs.300 and Rs.200 for each
event are given to winners in each block. The state
government has decided to hold sports meet at district
level also from the year 2006-07. Three prizes at the
rate of Rs.1000, Rs.600 and Rs.400 for each event are
given to winners in each district.
To reduce malnutrition among children, the scheme
of Improving Infant and Young Child Feeding has been
started by the state government. All Anganwadi Workers
are being trained to equip them with knowledge and skill
of infant and young child feeding to enable them to
create awareness and counseling of mothers more
effectively.
The village community in general and women in
particular come into frequent contacts with various
development functionaries and officials like Doctors,
Multi Purpose Health Workers, Panchayati Raj Members
and Police Personnel etc. who often lack gender
sensitivity to realise the need and problems of women.
Within this context, Gender Sensitisation Training to
Panches and Sarpanches, Medical Officers/Health
functionaries and Police personnel at the first instance
is being imparted.
1675 Self Help Groups from members of Mahila
Mandals have been formed to make women economically
independent. This scheme will be operational for a
period of 5 years during which the SHGs will be formed
and their capacity will be built through trainings on
Group Dynamics, Accounts Keeping, Legal Literacy,
Gender Sensitisation, Self Defence and Social Evils
including AIDS to empower them.
Centrally sponsored Integrated Child Development
Services Scheme (ICDS) has been expanded and as a
step towards universalisation of ICDS, the total number
of sanctioned ICDS projects in the state has risen to
128 with 16,359 Anganwadi Centres, including 10
Chapter 1 • HARYANA: DEVELOPMENT PROFILE 111
urban projects. Under this scheme, services like
Supplementary Nutrition, Immunisation, Health Check
Up, Referral Services, Non-formal Pre-School Education
and Health and Nutrition Education are being provided
to children below six years of age, pregnant and
nursing mothers and other women in the age group of
15-45 years in an integrated manner through the
network of Anganwadi Centres.
Centrally sponsored Kishori Shakti Yojna is being
implemented in 128 ICDS projects for improving the
health and nutritional status of adolescent girls in the
age group of 11-18 years and to train and equip them
to improve home based and vocational skills and to
promote awareness of health, hygiene, nutrition, home
management, child care etc. Under the scheme, services
are provided through formation of Balika Mandals for
six months in 10 per cent of the Anganwadi Centres.
At present 1622 Balika Mandals have been formed. The
girls are also provided supplementary nutrition at the
rate of Rs.5 per girl per day.
Haryana Women Development Corporation is
functioning to promote activities for women’s
development, awareness generation, vocational training
and arrange institutional finance for self employment to
ameliorate the socio-economic conditions of women
belonging to weaker sections. This corporation is
implementing a loaning scheme for women to set up
their own enterprises. During the year 2006-07, against
the target of 11,070 women 7544 women have been
covered upto December 2006.
Financial assistance in the form of Grant-in-Aid is
provided to Voluntary Organisations/Semi-Government/
Welfare Organisations/training and research institutes
operating in Haryana State which may render welfare
services to women, children and adolescents.
For creating awareness amongst women for their
development and empowerment through Mahila
Mandals, assistance upto Rs.1500 per Mahila Mandal
under the scheme of Promotion and Strengthening of
Mahila Mandals is provided apart from providing
Incentive Awards to Mahila Mandals, holding Mahila
Sammelan and Inter state Study Tours.
The centrally sponsored Swayamsidha, an integrated
scheme for women’s empowerment is based on the
formation of women Self Help Groups and aims at the
holistic empowerment of women through training on
capacity building, awareness generation, economic
empowerment and convergence of various schemes.
Under this programme, 1300 Self Help Groups of
women have been formed. These SHGs have been
imparted training on accounts keeping, legal literacy,
self defence, gender sensitisation and group dynamics.
The habit of saving is being inculcated among SHGs
and 1300 SHGs have made savings to the tune of
Rs.391.17 lakh while inter-loaning to the tune of
Rs.330.87 lakh has taken place among 1300 SHGs up to
December, 2006. 8281 women of 1081 SHGs are doing
income generating activities in different trades.
To eradicate the social evil of dowry, Dowry
Prohibition Act is being implemented in the state. For
effective implementation of the Act, Dowry Rules under
Dowry Prohibition Act has been amended and were
notified in February 2003 giving more powers and
functions to Dowry Prohibition Officers. Director,
Women and child Development Department, Haryana is
designated as Chief Dowry prohibition Officer. All Sub
Divisional Magistrates and City Magistrates have been
appointed as Dowry Prohibition Officers. State
government has declared 26th November, to be
celebrated as Dowry Prohibition Day every year. For the
purpose of advising and assisting the Dowry
Prohibition Officers, Advisory Boards/Committees have
also been constituted.
To provide safe accommodation at economical rates
to working women, 12 Working Women Hostels are
being run at Ambala, Karnal, Gurgaon, Sonipat,
Faridabad, Rohtak, Kurukshetra, Sirsa, Rewari, Bhiwani,
Hisar and Jind by the respective Red Cross society/
Municipality. Under the provisions of this scheme,
financial assistance to the tune of 50 per cent of the
cost of land and 75 per cent of the total cost of
construction is provided to voluntary organisations/
autonomous bodies etc. by the Government of India.
The balance 50 per cent cost of land and balance 25 per
cent cost of construction is to be borne by the
organisation. However, the state government is
providing assistance upto 15 per cent of the cost of
construction. The Hostels at Jagadhari, Panchkula,
Meham, Bahadurgarh, Haryana Agriculture University,
Hisar and Guru Jambheshwar University, Hisar and
Maharshi Dayanand University, Rohtak are under
construction by the different organisations/agencies.
The NFH-3 presents data on three commonly used
measures of child malnutrition among children under
three years: stunting, that is, deficit in height-for-age,
wasting, that is, deficit in weight for height, and
proportion of underweight, that is, weight-for-age,
children. These three indicators of undernourishment
provide somewhat different information about the
nutritional status of children. Stunting captures chronic
undernutrition as its reflects a failure to receive adequate
nutrition over a long period of time or from chronic or
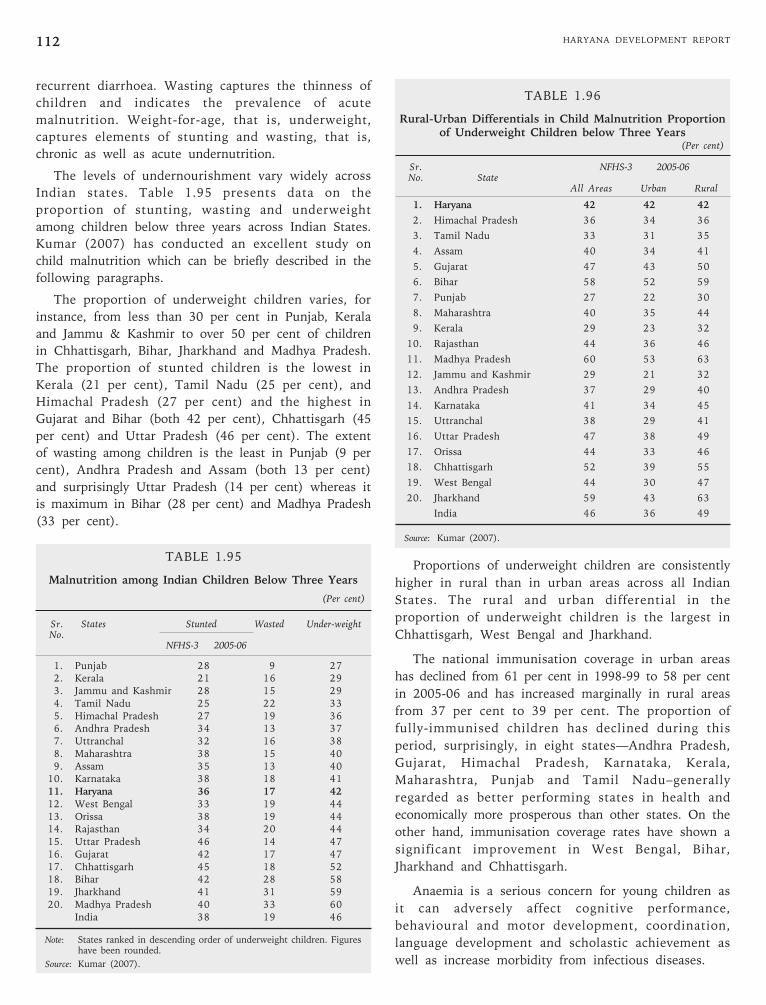
HARYANA DEVELOPMENT REPORT112
recurrent diarrhoea. Wasting captures the thinness of
children and indicates the prevalence of acute
malnutrition. Weight-for-age, that is, underweight,
captures elements of stunting and wasting, that is,
chronic as well as acute undernutrition.
The levels of undernourishment vary widely across
Indian states. Table 1.95 presents data on the
proportion of stunting, wasting and underweight
among children below three years across Indian States.
Kumar (2007) has conducted an excellent study on
child malnutrition which can be briefly described in the
following paragraphs.
The proportion of underweight children varies, for
instance, from less than 30 per cent in Punjab, Kerala
and Jammu & Kashmir to over 50 per cent of children
in Chhattisgarh, Bihar, Jharkhand and Madhya Pradesh.
The proportion of stunted children is the lowest in
Kerala (21 per cent), Tamil Nadu (25 per cent), and
Himachal Pradesh (27 per cent) and the highest in
Gujarat and Bihar (both 42 per cent), Chhattisgarh (45
per cent) and Uttar Pradesh (46 per cent). The extent
of wasting among children is the least in Punjab (9 per
cent), Andhra Pradesh and Assam (both 13 per cent)
and surprisingly Uttar Pradesh (14 per cent) whereas it
is maximum in Bihar (28 per cent) and Madhya Pradesh
(33 per cent).
TABLE 1.95
Malnutrition among Indian Children Below Three Years
(Per cent)
Sr. States Stunted Wasted Under-weightNo.
NFHS-3 2005-06
1. Punjab 28 9 272. Kerala 21 16 293. Jammu and Kashmir 28 15 294. Tamil Nadu 25 22 335. Himachal Pradesh 27 19 366. Andhra Pradesh 34 13 377. Uttranchal 32 16 388. Maharashtra 38 15 409. Assam 35 13 40
10. Karnataka 38 18 4111. Haryana 36 17 4212. West Bengal 33 19 4413. Orissa 38 19 4414. Rajasthan 34 20 4415. Uttar Pradesh 46 14 4716. Gujarat 42 17 4717. Chhattisgarh 45 18 5218. Bihar 42 28 5819. Jharkhand 41 31 5920. Madhya Pradesh 40 33 60
India 38 19 46
Note: States ranked in descending order of underweight children. Figureshave been rounded.
Source: Kumar (2007).
TABLE 1.96
Rural-Urban Differentials in Child Malnutrition Proportionof Underweight Children below Three Years
(Per cent)
Sr. NFHS-3 2005-06No. State
All Areas Urban Rural
1. Haryana 42 42 42
2. Himachal Pradesh 36 34 36
3. Tamil Nadu 33 31 35
4. Assam 40 34 41
5. Gujarat 47 43 50
6. Bihar 58 52 59
7. Punjab 27 22 30
8. Maharashtra 40 35 44
9. Kerala 29 23 32
10. Rajasthan 44 36 46
11. Madhya Pradesh 60 53 63
12. Jammu and Kashmir 29 21 32
13. Andhra Pradesh 37 29 40
14. Karnataka 41 34 45
15. Uttranchal 38 29 41
16. Uttar Pradesh 47 38 49
17. Orissa 44 33 46
18. Chhattisgarh 52 39 55
19. West Bengal 44 30 47
20. Jharkhand 59 43 63
India 46 36 49
Source: Kumar (2007).
Proportions of underweight children are consistently
higher in rural than in urban areas across all Indian
States. The rural and urban differential in the
proportion of underweight children is the largest in
Chhattisgarh, West Bengal and Jharkhand.
The national immunisation coverage in urban areas
has declined from 61 per cent in 1998-99 to 58 per cent
in 2005-06 and has increased marginally in rural areas
from 37 per cent to 39 per cent. The proportion of
fully-immunised children has declined during this
period, surprisingly, in eight states—Andhra Pradesh,
Gujarat, Himachal Pradesh, Karnataka, Kerala,
Maharashtra, Punjab and Tamil Nadu–generally
regarded as better performing states in health and
economically more prosperous than other states. On the
other hand, immunisation coverage rates have shown a
significant improvement in West Bengal, Bihar,
Jharkhand and Chhattisgarh.
Anaemia is a serious concern for young children as
it can adversely affect cognitive performance,
behavioural and motor development, coordination,
language development and scholastic achievement as
well as increase morbidity from infectious diseases.
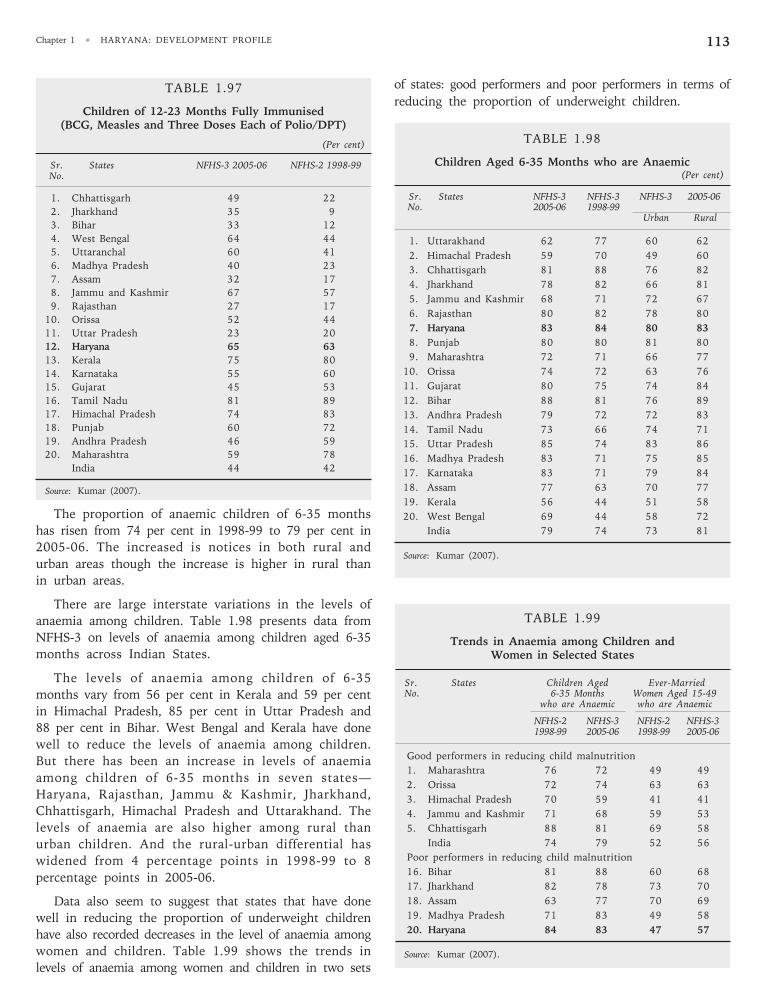
Chapter 1 • HARYANA: DEVELOPMENT PROFILE 113
TABLE 1.97
Children of 12-23 Months Fully Immunised(BCG, Measles and Three Doses Each of Polio/DPT)
(Per cent)
Sr. States NFHS-3 2005-06 NFHS-2 1998-99No.
1. Chhattisgarh 49 22
2. Jharkhand 35 9
3. Bihar 33 12
4. West Bengal 64 44
5. Uttaranchal 60 41
6. Madhya Pradesh 40 23
7. Assam 32 17
8. Jammu and Kashmir 67 57
9. Rajasthan 27 17
10. Orissa 52 44
11. Uttar Pradesh 23 20
12. Haryana 65 63
13. Kerala 75 80
14. Karnataka 55 60
15. Gujarat 45 53
16. Tamil Nadu 81 89
17. Himachal Pradesh 74 83
18. Punjab 60 72
19. Andhra Pradesh 46 59
20. Maharashtra 59 78
India 44 42
Source: Kumar (2007).
The proportion of anaemic children of 6-35 months
has risen from 74 per cent in 1998-99 to 79 per cent in
2005-06. The increased is notices in both rural and
urban areas though the increase is higher in rural than
in urban areas.
There are large interstate variations in the levels of
anaemia among children. Table 1.98 presents data from
NFHS-3 on levels of anaemia among children aged 6-35
months across Indian States.
The levels of anaemia among children of 6-35
months vary from 56 per cent in Kerala and 59 per cent
in Himachal Pradesh, 85 per cent in Uttar Pradesh and
88 per cent in Bihar. West Bengal and Kerala have done
well to reduce the levels of anaemia among children.
But there has been an increase in levels of anaemia
among children of 6-35 months in seven states—
Haryana, Rajasthan, Jammu & Kashmir, Jharkhand,
Chhattisgarh, Himachal Pradesh and Uttarakhand. The
levels of anaemia are also higher among rural than
urban children. And the rural-urban differential has
widened from 4 percentage points in 1998-99 to 8
percentage points in 2005-06.
Data also seem to suggest that states that have done
well in reducing the proportion of underweight children
have also recorded decreases in the level of anaemia among
women and children. Table 1.99 shows the trends in
levels of anaemia among women and children in two sets
of states: good performers and poor performers in terms of
reducing the proportion of underweight children.
TABLE 1.98
Children Aged 6-35 Months who are Anaemic(Per cent)
Sr. States NFHS-3 NFHS-3 NFHS-3 2005-06No. 2005-06 1998-99
Urban Rural
1. Uttarakhand 62 77 60 62
2. Himachal Pradesh 59 70 49 60
3. Chhattisgarh 81 88 76 82
4. Jharkhand 78 82 66 81
5. Jammu and Kashmir 68 71 72 67
6. Rajasthan 80 82 78 80
7. Haryana 83 84 80 83
8. Punjab 80 80 81 80
9. Maharashtra 72 71 66 77
10. Orissa 74 72 63 76
11. Gujarat 80 75 74 84
12. Bihar 88 81 76 89
13. Andhra Pradesh 79 72 72 83
14. Tamil Nadu 73 66 74 71
15. Uttar Pradesh 85 74 83 86
16. Madhya Pradesh 83 71 75 85
17. Karnataka 83 71 79 84
18. Assam 77 63 70 77
19. Kerala 56 44 51 58
20. West Bengal 69 44 58 72
India 79 74 73 81
Source: Kumar (2007).
TABLE 1.99
Trends in Anaemia among Children andWomen in Selected States
Sr. States Children Aged Ever-MarriedNo. 6-35 Months Women Aged 15-49
who are Anaemic who are Anaemic
NFHS-2 NFHS-3 NFHS-2 NFHS-31998-99 2005-06 1998-99 2005-06
Good performers in reducing child malnutrition
1. Maharashtra 76 72 49 49
2. Orissa 72 74 63 63
3. Himachal Pradesh 70 59 41 41
4. Jammu and Kashmir 71 68 59 53
5. Chhattisgarh 88 81 69 58
India 74 79 52 56
Poor performers in reducing child malnutrition
16. Bihar 81 88 60 68
17. Jharkhand 82 78 73 70
18. Assam 63 77 70 69
19. Madhya Pradesh 71 83 49 58
20. Haryana 84 83 47 57
Source: Kumar (2007).
HARYANA DEVELOPMENT REPORT114
The proportion of children of 6-35 months who are
anaemic has come down in four out of the five states
that have recorded maximum reductions in child
malnutrition. In Orissa, a state in the set of good
performers, the proportion of anaemic children has gone
up marginally from 72 per cent in 1998-99 to 74 per
cent in 2005-06. On the other hand, the proportion of
children with anaemia has risen in four of the five
states where the proportion of underweight children
has increased the most. The exception is Jharkhand
where the proportion of anaemic children had dropped
marginally from 73 per cent in 1998-99 to 70 per cent
in 2005-06. Among the good performers, the proportion
of ever-married women aged 15-49 years who are
anaemic has decreased or more or less remained
unchanged in the five states. On the other hand,
among the poor performers, the proportion of ever-
married women aged 15-49 years who are anaemic has
increased significantly in three states and come down
marginally in the other two.
To reduce malnutrition among children, the scheme
of “Improving Infant and Young Child Feeding” has
been started in the state from the year 2005-06.
National Programme for Nutritional Support to Primary
Education, a centrally sponsored mid-day meal scheme,
launched in the state from 15th August 2004, is another
effort in the direction of eradication of malnutrition
among young children going to primary classes (I-V) in
government, local bodies and private-aided schools in
the state. To encourage women for proper rearing of
their children, especially the girl child, with a view to
improve their nutritional and health status, the scheme
of “Best Mother Award” has been started from the year
2005-06. To remove the sense of economic insecurity in
the minds of parents who have only daughters, “Ladli
Social Security Pension Scheme” is being implemented
with effect from 1st January 2006.
In sum, NFHS-3 brings out sharply the serious
neglect of young children below three years—and
especially newborn babies for whom early childhood
development and care are critical for healthy growth.
Preliminary results confirm the continuing neglect of
health, inadequate reach and efficacy of health and
childcare services, the failure of strategies to reach
newborn children and those under three years.
1.2.9 Human Development and Demographic Changes
An economy’s human resources are a vital
component in stimulating rapid economic growth.
While physical capital and natural endowments of land
and resources are also important, human resources are
critical in bringing about structural and technological
transformation required for industrialisation and raising
per capita income rapidly. People, not machines, make
the crucial decisions that result in improved allocation
of resources and implementation of new technology.
People save and invest in new technology and
infrastructure. People decide how resources are to be
used and mobilised. It is, therefore, critical that these
human resources be developed and nurtured to ensure
that they are capable of making these important
decisions of far reaching consequences.
The improvement of human capital has become a prime
economic development objective. Through the provision of
education and better health and nutrition, the level of
human capital has been raised substantially in Haryana.
Human development is a process of enlarging people’s
choices. In principle, these choices can be infinite and
change over time. But at all levels of development, three
essential things are: people lead a long and healthy life,
they acquire knowledge and have access to resources
needed for a better standard of living. If these essential
conditions are not available, all opportunities of moving
forward are bound to remain inaccessible.
Human development has two sides: the formation of
human capabilities—such as improved health,
knowledge and skills—and the use people make of their
acquired capabilities. Development must, therefore, be
more than just an expansion of income and wealth. Its
focus must be people.
The first ever National Human Development Report
(NHDR), 2001 brought out by the Planning
Commission estimated the value of Human
Development Index (HDI) for the States and the Union
territories for 1981, 1991 and 2001. Table 1.100
presents the findings for some of the major States.
Although the estimation of HDI for 2001 does not
cover all the States, NHDR has estimated that the HDI
for the country as a whole has improved from 0.302 in
1981 to 0.472 in 2001. The HDI for Haryana has
improved from 0.360 in 1981 to 0.509 in 2001. As per
HDI, Haryana was ranked at 15 in 1981 and it has
improved its rank to 5 in 2001. Kerala—albeit a middle
income State—remains at the top with HDI equal to
0.638, which stood at 0.5 in 1981. West Bengal, which
had an index of 0.305 in 1981 improved it to 0.404 in
1991 and 0.472 in 2001. The HDI for Bihar registered
the lowest value of 0.367 in 2001 despite an
improvement over the earlier years.
The States which have done well in terms of HDI
are Punjab (0.537), Tamil Nadu (0.531) and
Maharashtra (0.523). The HDI of Karnataka (0.478), the
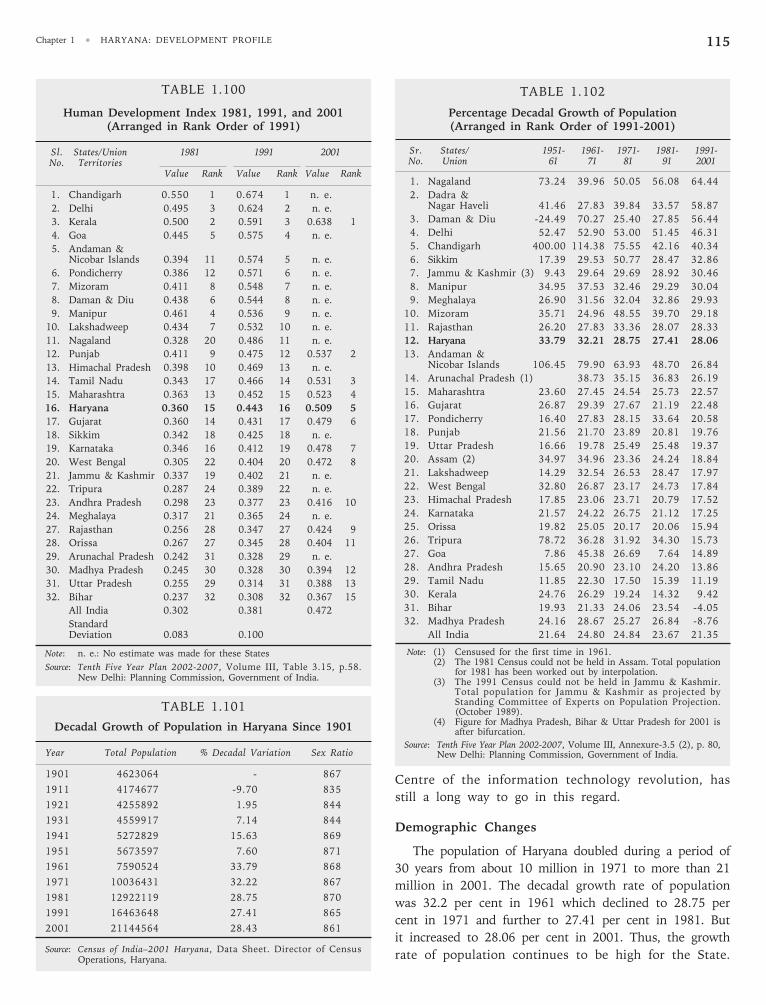
Chapter 1 • HARYANA: DEVELOPMENT PROFILE 115
Centre of the information technology revolution, has
still a long way to go in this regard.
Demographic Changes
The population of Haryana doubled during a period of
30 years from about 10 million in 1971 to more than 21
million in 2001. The decadal growth rate of population
was 32.2 per cent in 1961 which declined to 28.75 per
cent in 1971 and further to 27.41 per cent in 1981. But
it increased to 28.06 per cent in 2001. Thus, the growth
rate of population continues to be high for the State.
TABLE 1.101
Decadal Growth of Population in Haryana Since 1901
Year Total Population % Decadal Variation Sex Ratio
1901 4623064 - 867
1911 4174677 -9.70 835
1921 4255892 1.95 844
1931 4559917 7.14 844
1941 5272829 15.63 869
1951 5673597 7.60 871
1961 7590524 33.79 868
1971 10036431 32.22 867
1981 12922119 28.75 870
1991 16463648 27.41 865
2001 21144564 28.43 861
Source: Census of India–2001 Haryana, Data Sheet. Director of CensusOperations, Haryana.
TABLE 1.102
Percentage Decadal Growth of Population(Arranged in Rank Order of 1991-2001)
Sr. States/ 1951- 1961- 1971- 1981- 1991-No. Union 61 71 81 91 2001
1. Nagaland 73.24 39.96 50.05 56.08 64.44
2. Dadra &Nagar Haveli 41.46 27.83 39.84 33.57 58.87
3. Daman & Diu -24.49 70.27 25.40 27.85 56.44
4. Delhi 52.47 52.90 53.00 51.45 46.31
5. Chandigarh 400.00 114.38 75.55 42.16 40.34
6. Sikkim 17.39 29.53 50.77 28.47 32.86
7. Jammu & Kashmir (3) 9.43 29.64 29.69 28.92 30.46
8. Manipur 34.95 37.53 32.46 29.29 30.04
9. Meghalaya 26.90 31.56 32.04 32.86 29.93
10. Mizoram 35.71 24.96 48.55 39.70 29.18
11. Rajasthan 26.20 27.83 33.36 28.07 28.33
12. Haryana 33.79 32.21 28.75 27.41 28.06
13. Andaman &Nicobar Islands 106.45 79.90 63.93 48.70 26.84
14. Arunachal Pradesh (1) 38.73 35.15 36.83 26.19
15. Maharashtra 23.60 27.45 24.54 25.73 22.57
16. Gujarat 26.87 29.39 27.67 21.19 22.48
17. Pondicherry 16.40 27.83 28.15 33.64 20.58
18. Punjab 21.56 21.70 23.89 20.81 19.76
19. Uttar Pradesh 16.66 19.78 25.49 25.48 19.37
20. Assam (2) 34.97 34.96 23.36 24.24 18.84
21. Lakshadweep 14.29 32.54 26.53 28.47 17.97
22. West Bengal 32.80 26.87 23.17 24.73 17.84
23. Himachal Pradesh 17.85 23.06 23.71 20.79 17.52
24. Karnataka 21.57 24.22 26.75 21.12 17.25
25. Orissa 19.82 25.05 20.17 20.06 15.94
26. Tripura 78.72 36.28 31.92 34.30 15.73
27. Goa 7.86 45.38 26.69 7.64 14.89
28. Andhra Pradesh 15.65 20.90 23.10 24.20 13.86
29. Tamil Nadu 11.85 22.30 17.50 15.39 11.19
30. Kerala 24.76 26.29 19.24 14.32 9.42
31. Bihar 19.93 21.33 24.06 23.54 -4.05
32. Madhya Pradesh 24.16 28.67 25.27 26.84 -8.76
All India 21.64 24.80 24.84 23.67 21.35
Note: (1) Censused for the first time in 1961.(2) The 1981 Census could not be held in Assam. Total population
for 1981 has been worked out by interpolation.(3) The 1991 Census could not be held in Jammu & Kashmir.
Total population for Jammu & Kashmir as projected byStanding Committee of Experts on Population Projection.(October 1989).
(4) Figure for Madhya Pradesh, Bihar & Uttar Pradesh for 2001 isafter bifurcation.
Source: Tenth Five Year Plan 2002-2007, Volume III, Annexure-3.5 (2), p. 80,New Delhi: Planning Commission, Government of India.
TABLE 1.100
Human Development Index 1981, 1991, and 2001(Arranged in Rank Order of 1991)
Sl. States/Union 1981 1991 2001No. Territories
Value Rank Value Rank Value Rank
1. Chandigarh 0.550 1 0.674 1 n. e.
2. Delhi 0.495 3 0.624 2 n. e.
3. Kerala 0.500 2 0.591 3 0.638 1
4. Goa 0.445 5 0.575 4 n. e.
5. Andaman &Nicobar Islands 0.394 11 0.574 5 n. e.
6. Pondicherry 0.386 12 0.571 6 n. e.
7. Mizoram 0.411 8 0.548 7 n. e.
8. Daman & Diu 0.438 6 0.544 8 n. e.
9. Manipur 0.461 4 0.536 9 n. e.
10. Lakshadweep 0.434 7 0.532 10 n. e.
11. Nagaland 0.328 20 0.486 11 n. e.
12. Punjab 0.411 9 0.475 12 0.537 2
13. Himachal Pradesh 0.398 10 0.469 13 n. e.
14. Tamil Nadu 0.343 17 0.466 14 0.531 3
15. Maharashtra 0.363 13 0.452 15 0.523 4
16. Haryana 0.360 15 0.443 16 0.509 5
17. Gujarat 0.360 14 0.431 17 0.479 6
18. Sikkim 0.342 18 0.425 18 n. e.
19. Karnataka 0.346 16 0.412 19 0.478 7
20. West Bengal 0.305 22 0.404 20 0.472 8
21. Jammu & Kashmir 0.337 19 0.402 21 n. e.
22. Tripura 0.287 24 0.389 22 n. e.
23. Andhra Pradesh 0.298 23 0.377 23 0.416 10
24. Meghalaya 0.317 21 0.365 24 n. e.
27. Rajasthan 0.256 28 0.347 27 0.424 9
28. Orissa 0.267 27 0.345 28 0.404 11
29. Arunachal Pradesh 0.242 31 0.328 29 n. e.
30. Madhya Pradesh 0.245 30 0.328 30 0.394 12
31. Uttar Pradesh 0.255 29 0.314 31 0.388 13
32. Bihar 0.237 32 0.308 32 0.367 15
All India 0.302 0.381 0.472
StandardDeviation 0.083 0.100
Note: n. e.: No estimate was made for these States
Source: Tenth Five Year Plan 2002-2007, Volume III, Table 3.15, p.58.New Delhi: Planning Commission, Government of India.
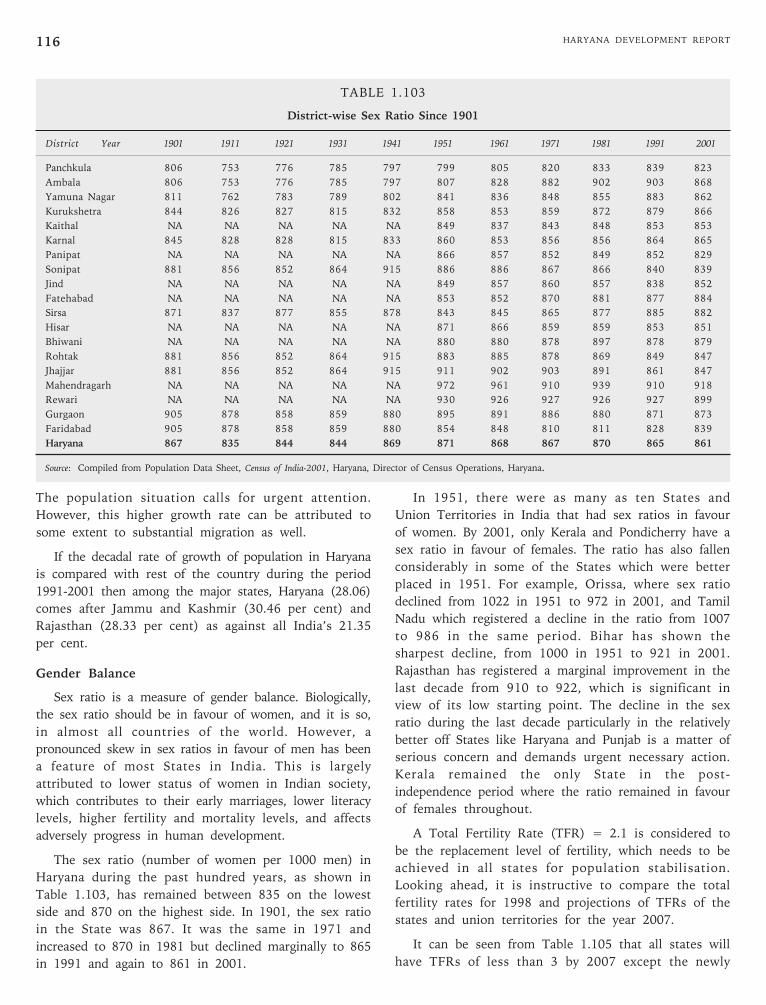
HARYANA DEVELOPMENT REPORT116
TABLE 1.103
District-wise Sex Ratio Since 1901
District Year 1901 1911 1921 1931 1941 1951 1961 1971 1981 1991 2001
Panchkula 806 753 776 785 797 799 805 820 833 839 823
Ambala 806 753 776 785 797 807 828 882 902 903 868
Yamuna Nagar 811 762 783 789 802 841 836 848 855 883 862
Kurukshetra 844 826 827 815 832 858 853 859 872 879 866
Kaithal NA NA NA NA NA 849 837 843 848 853 853
Karnal 845 828 828 815 833 860 853 856 856 864 865
Panipat NA NA NA NA NA 866 857 852 849 852 829
Sonipat 881 856 852 864 915 886 886 867 866 840 839
Jind NA NA NA NA NA 849 857 860 857 838 852
Fatehabad NA NA NA NA NA 853 852 870 881 877 884
Sirsa 871 837 877 855 878 843 845 865 877 885 882
Hisar NA NA NA NA NA 871 866 859 859 853 851
Bhiwani NA NA NA NA NA 880 880 878 897 878 879
Rohtak 881 856 852 864 915 883 885 878 869 849 847
Jhajjar 881 856 852 864 915 911 902 903 891 861 847
Mahendragarh NA NA NA NA NA 972 961 910 939 910 918
Rewari NA NA NA NA NA 930 926 927 926 927 899
Gurgaon 905 878 858 859 880 895 891 886 880 871 873
Faridabad 905 878 858 859 880 854 848 810 811 828 839
Haryana 867 835 844 844 869 871 868 867 870 865 861
Source: Compiled from Population Data Sheet, Census of India-2001, Haryana, Director of Census Operations, Haryana.
The population situation calls for urgent attention.
However, this higher growth rate can be attributed to
some extent to substantial migration as well.
If the decadal rate of growth of population in Haryana
is compared with rest of the country during the period
1991-2001 then among the major states, Haryana (28.06)
comes after Jammu and Kashmir (30.46 per cent) and
Rajasthan (28.33 per cent) as against all India’s 21.35
per cent.
Gender Balance
Sex ratio is a measure of gender balance. Biologically,
the sex ratio should be in favour of women, and it is so,
in almost all countries of the world. However, a
pronounced skew in sex ratios in favour of men has been
a feature of most States in India. This is largely
attributed to lower status of women in Indian society,
which contributes to their early marriages, lower literacy
levels, higher fertility and mortality levels, and affects
adversely progress in human development.
The sex ratio (number of women per 1000 men) in
Haryana during the past hundred years, as shown in
Table 1.103, has remained between 835 on the lowest
side and 870 on the highest side. In 1901, the sex ratio
in the State was 867. It was the same in 1971 and
increased to 870 in 1981 but declined marginally to 865
in 1991 and again to 861 in 2001.
In 1951, there were as many as ten States and
Union Territories in India that had sex ratios in favour
of women. By 2001, only Kerala and Pondicherry have a
sex ratio in favour of females. The ratio has also fallen
considerably in some of the States which were better
placed in 1951. For example, Orissa, where sex ratio
declined from 1022 in 1951 to 972 in 2001, and Tamil
Nadu which registered a decline in the ratio from 1007
to 986 in the same period. Bihar has shown the
sharpest decline, from 1000 in 1951 to 921 in 2001.
Rajasthan has registered a marginal improvement in the
last decade from 910 to 922, which is significant in
view of its low starting point. The decline in the sex
ratio during the last decade particularly in the relatively
better off States like Haryana and Punjab is a matter of
serious concern and demands urgent necessary action.
Kerala remained the only State in the post-
independence period where the ratio remained in favour
of females throughout.
A Total Fertility Rate (TFR) = 2.1 is considered to
be the replacement level of fertility, which needs to be
achieved in all states for population stabilisation.
Looking ahead, it is instructive to compare the total
fertility rates for 1998 and projections of TFRs of the
states and union territories for the year 2007.
It can be seen from Table 1.105 that all states will
have TFRs of less than 3 by 2007 except the newly
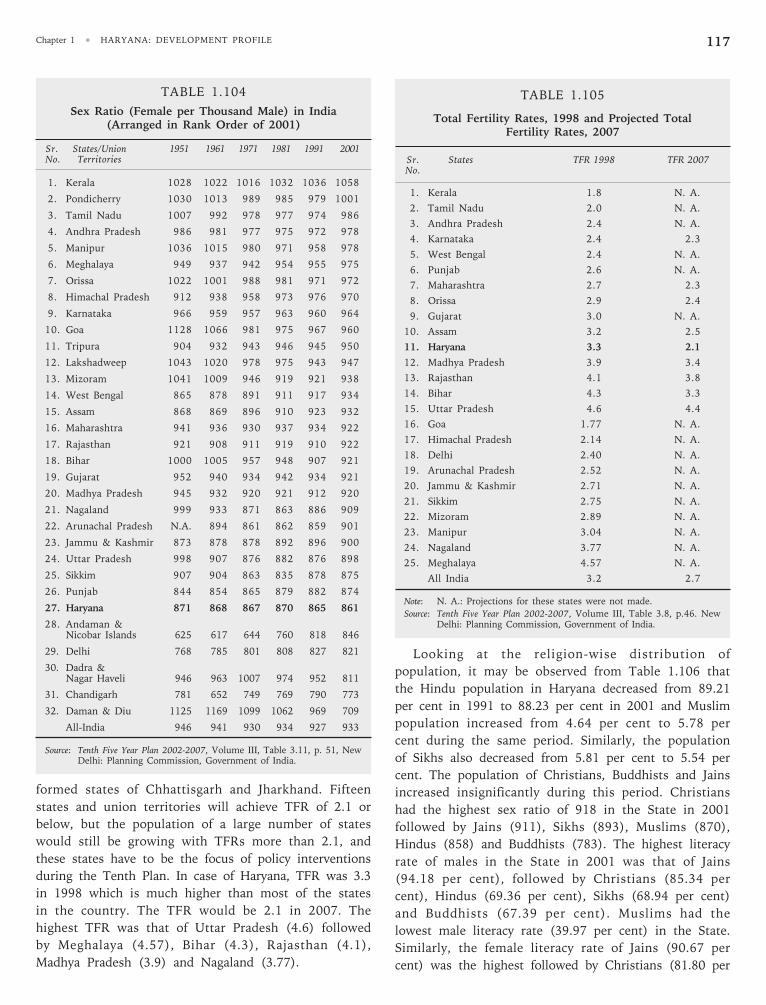
Chapter 1 • HARYANA: DEVELOPMENT PROFILE 117
TABLE 1.104
Sex Ratio (Female per Thousand Male) in India(Arranged in Rank Order of 2001)
Sr. States/Union 1951 1961 1971 1981 1991 2001No. Territories
1. Kerala 1028 1022 1016 1032 1036 1058
2. Pondicherry 1030 1013 989 985 979 1001
3. Tamil Nadu 1007 992 978 977 974 986
4. Andhra Pradesh 986 981 977 975 972 978
5. Manipur 1036 1015 980 971 958 978
6. Meghalaya 949 937 942 954 955 975
7. Orissa 1022 1001 988 981 971 972
8. Himachal Pradesh 912 938 958 973 976 970
9. Karnataka 966 959 957 963 960 964
10. Goa 1128 1066 981 975 967 960
11. Tripura 904 932 943 946 945 950
12. Lakshadweep 1043 1020 978 975 943 947
13. Mizoram 1041 1009 946 919 921 938
14. West Bengal 865 878 891 911 917 934
15. Assam 868 869 896 910 923 932
16. Maharashtra 941 936 930 937 934 922
17. Rajasthan 921 908 911 919 910 922
18. Bihar 1000 1005 957 948 907 921
19. Gujarat 952 940 934 942 934 921
20. Madhya Pradesh 945 932 920 921 912 920
21. Nagaland 999 933 871 863 886 909
22. Arunachal Pradesh N.A. 894 861 862 859 901
23. Jammu & Kashmir 873 878 878 892 896 900
24. Uttar Pradesh 998 907 876 882 876 898
25. Sikkim 907 904 863 835 878 875
26. Punjab 844 854 865 879 882 874
27. Haryana 871 868 867 870 865 861
28. Andaman &Nicobar Islands 625 617 644 760 818 846
29. Delhi 768 785 801 808 827 821
30. Dadra &Nagar Haveli 946 963 1007 974 952 811
31. Chandigarh 781 652 749 769 790 773
32. Daman & Diu 1125 1169 1099 1062 969 709
All-India 946 941 930 934 927 933
Source: Tenth Five Year Plan 2002-2007, Volume III, Table 3.11, p. 51, NewDelhi: Planning Commission, Government of India.
TABLE 1.105
Total Fertility Rates, 1998 and Projected TotalFertility Rates, 2007
Sr. States TFR 1998 TFR 2007No.
1. Kerala 1.8 N. A.
2. Tamil Nadu 2.0 N. A.
3. Andhra Pradesh 2.4 N. A.
4. Karnataka 2.4 2.3
5. West Bengal 2.4 N. A.
6. Punjab 2.6 N. A.
7. Maharashtra 2.7 2.3
8. Orissa 2.9 2.4
9. Gujarat 3.0 N. A.
10. Assam 3.2 2.5
11. Haryana 3.3 2.1
12. Madhya Pradesh 3.9 3.4
13. Rajasthan 4.1 3.8
14. Bihar 4.3 3.3
15. Uttar Pradesh 4.6 4.4
16. Goa 1.77 N. A.
17. Himachal Pradesh 2.14 N. A.
18. Delhi 2.40 N. A.
19. Arunachal Pradesh 2.52 N. A.
20. Jammu & Kashmir 2.71 N. A.
21. Sikkim 2.75 N. A.
22. Mizoram 2.89 N. A.
23. Manipur 3.04 N. A.
24. Nagaland 3.77 N. A.
25. Meghalaya 4.57 N. A.
All India 3.2 2.7
Note: N. A.: Projections for these states were not made.
Source: Tenth Five Year Plan 2002-2007, Volume III, Table 3.8, p.46. NewDelhi: Planning Commission, Government of India.
formed states of Chhattisgarh and Jharkhand. Fifteen
states and union territories will achieve TFR of 2.1 or
below, but the population of a large number of states
would still be growing with TFRs more than 2.1, and
these states have to be the focus of policy interventions
during the Tenth Plan. In case of Haryana, TFR was 3.3
in 1998 which is much higher than most of the states
in the country. The TFR would be 2.1 in 2007. The
highest TFR was that of Uttar Pradesh (4.6) followed
by Meghalaya (4.57), Bihar (4.3), Rajasthan (4.1),
Madhya Pradesh (3.9) and Nagaland (3.77).
Looking at the religion-wise distribution of
population, it may be observed from Table 1.106 that
the Hindu population in Haryana decreased from 89.21
per cent in 1991 to 88.23 per cent in 2001 and Muslim
population increased from 4.64 per cent to 5.78 per
cent during the same period. Similarly, the population
of Sikhs also decreased from 5.81 per cent to 5.54 per
cent. The population of Christians, Buddhists and Jains
increased insignificantly during this period. Christians
had the highest sex ratio of 918 in the State in 2001
followed by Jains (911), Sikhs (893), Muslims (870),
Hindus (858) and Buddhists (783). The highest literacy
rate of males in the State in 2001 was that of Jains
(94.18 per cent), followed by Christians (85.34 per
cent), Hindus (69.36 per cent), Sikhs (68.94 per cent)
and Buddhists (67.39 per cent). Muslims had the
lowest male literacy rate (39.97 per cent) in the State.
Similarly, the female literacy rate of Jains (90.67 per
cent) was the highest followed by Christians (81.80 per
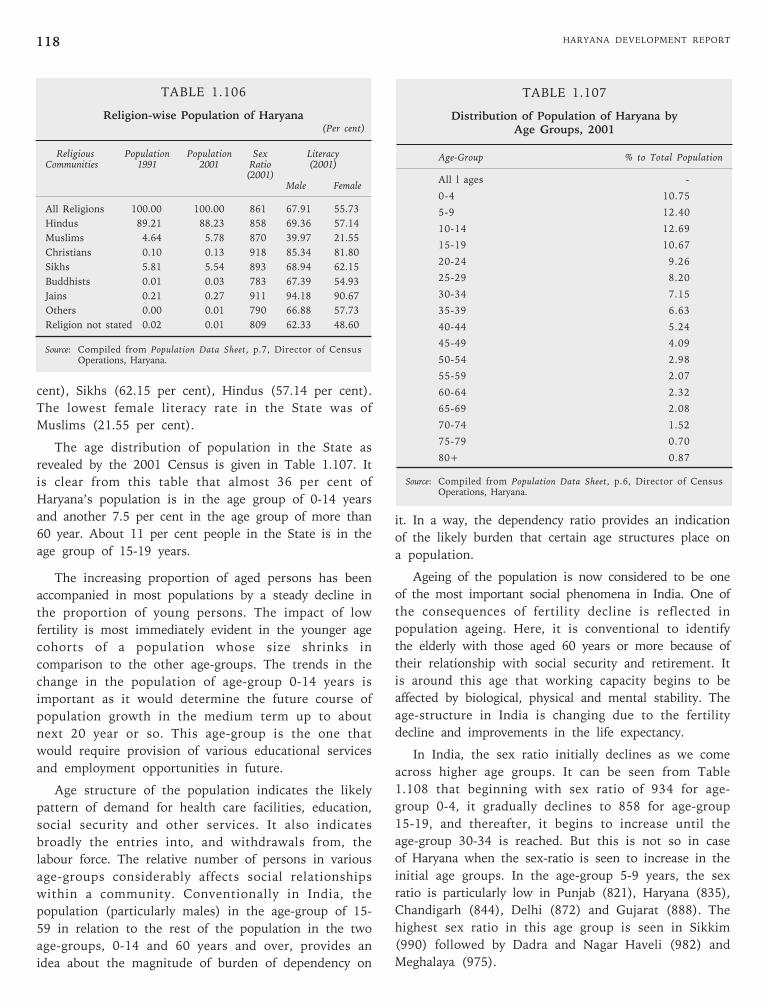
HARYANA DEVELOPMENT REPORT118
it. In a way, the dependency ratio provides an indication
of the likely burden that certain age structures place on
a population.
Ageing of the population is now considered to be one
of the most important social phenomena in India. One of
the consequences of fertility decline is reflected in
population ageing. Here, it is conventional to identify
the elderly with those aged 60 years or more because of
their relationship with social security and retirement. It
is around this age that working capacity begins to be
affected by biological, physical and mental stability. The
age-structure in India is changing due to the fertility
decline and improvements in the life expectancy.
In India, the sex ratio initially declines as we come
across higher age groups. It can be seen from Table
1.108 that beginning with sex ratio of 934 for age-
group 0-4, it gradually declines to 858 for age-group
15-19, and thereafter, it begins to increase until the
age-group 30-34 is reached. But this is not so in case
of Haryana when the sex-ratio is seen to increase in the
initial age groups. In the age-group 5-9 years, the sex
ratio is particularly low in Punjab (821), Haryana (835),
Chandigarh (844), Delhi (872) and Gujarat (888). The
highest sex ratio in this age group is seen in Sikkim
(990) followed by Dadra and Nagar Haveli (982) and
Meghalaya (975).
TABLE 1.106
Religion-wise Population of Haryana(Per cent)
Religious Population Population Sex LiteracyCommunities 1991 2001 Ratio (2001)
(2001)Male Female
All Religions 100.00 100.00 861 67.91 55.73
Hindus 89.21 88.23 858 69.36 57.14
Muslims 4.64 5.78 870 39.97 21.55
Christians 0.10 0.13 918 85.34 81.80
Sikhs 5.81 5.54 893 68.94 62.15
Buddhists 0.01 0.03 783 67.39 54.93
Jains 0.21 0.27 911 94.18 90.67
Others 0.00 0.01 790 66.88 57.73
Religion not stated 0.02 0.01 809 62.33 48.60
Source: Compiled from Population Data Sheet, p.7, Director of CensusOperations, Haryana.
cent), Sikhs (62.15 per cent), Hindus (57.14 per cent).
The lowest female literacy rate in the State was of
Muslims (21.55 per cent).
The age distribution of population in the State as
revealed by the 2001 Census is given in Table 1.107. It
is clear from this table that almost 36 per cent of
Haryana’s population is in the age group of 0-14 years
and another 7.5 per cent in the age group of more than
60 year. About 11 per cent people in the State is in the
age group of 15-19 years.
The increasing proportion of aged persons has been
accompanied in most populations by a steady decline in
the proportion of young persons. The impact of low
fertility is most immediately evident in the younger age
cohorts of a population whose size shrinks in
comparison to the other age-groups. The trends in the
change in the population of age-group 0-14 years is
important as it would determine the future course of
population growth in the medium term up to about
next 20 year or so. This age-group is the one that
would require provision of various educational services
and employment opportunities in future.
Age structure of the population indicates the likely
pattern of demand for health care facilities, education,
social security and other services. It also indicates
broadly the entries into, and withdrawals from, the
labour force. The relative number of persons in various
age-groups considerably affects social relationships
within a community. Conventionally in India, the
population (particularly males) in the age-group of 15-
59 in relation to the rest of the population in the two
age-groups, 0-14 and 60 years and over, provides an
idea about the magnitude of burden of dependency on
TABLE 1.107
Distribution of Population of Haryana byAge Groups, 2001
Age-Group % to Total Population
All l ages -
0-4 10.75
5-9 12.40
10-14 12.69
15-19 10.67
20-24 9.26
25-29 8.20
30-34 7.15
35-39 6.63
40-44 5.24
45-49 4.09
50-54 2.98
55-59 2.07
60-64 2.32
65-69 2.08
70-74 1.52
75-79 0.70
80+ 0.87
Source: Compiled from Population Data Sheet, p.6, Director of CensusOperations, Haryana.
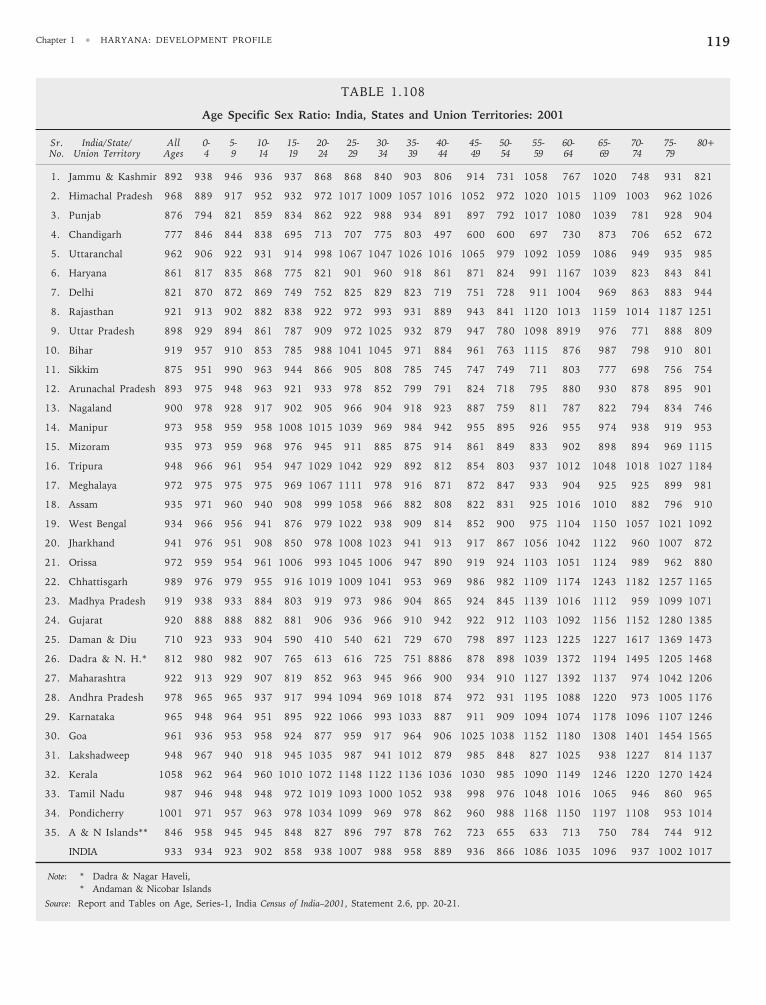
Chapter 1 • HARYANA: DEVELOPMENT PROFILE 119
TABLE 1.108
Age Specific Sex Ratio: India, States and Union Territories: 2001
Sr. India/State/ All 0- 5- 10- 15- 20- 25- 30- 35- 40- 45- 50- 55- 60- 65- 70- 75- 80+No. Union Territory Ages 4 9 14 19 24 29 34 39 44 49 54 59 64 69 74 79
1. Jammu & Kashmir 892 938 946 936 937 868 868 840 903 806 914 731 1058 767 1020 748 931 821
2. Himachal Pradesh 968 889 917 952 932 972 1017 1009 1057 1016 1052 972 1020 1015 1109 1003 962 1026
3. Punjab 876 794 821 859 834 862 922 988 934 891 897 792 1017 1080 1039 781 928 904
4. Chandigarh 777 846 844 838 695 713 707 775 803 497 600 600 697 730 873 706 652 672
5. Uttaranchal 962 906 922 931 914 998 1067 1047 1026 1016 1065 979 1092 1059 1086 949 935 985
6. Haryana 861 817 835 868 775 821 901 960 918 861 871 824 991 1167 1039 823 843 841
7. Delhi 821 870 872 869 749 752 825 829 823 719 751 728 911 1004 969 863 883 944
8. Rajasthan 921 913 902 882 838 922 972 993 931 889 943 841 1120 1013 1159 1014 1187 1251
9. Uttar Pradesh 898 929 894 861 787 909 972 1025 932 879 947 780 1098 8919 976 771 888 809
10. Bihar 919 957 910 853 785 988 1041 1045 971 884 961 763 1115 876 987 798 910 801
11. Sikkim 875 951 990 963 944 866 905 808 785 745 747 749 711 803 777 698 756 754
12. Arunachal Pradesh 893 975 948 963 921 933 978 852 799 791 824 718 795 880 930 878 895 901
13. Nagaland 900 978 928 917 902 905 966 904 918 923 887 759 811 787 822 794 834 746
14. Manipur 973 958 959 958 1008 1015 1039 969 984 942 955 895 926 955 974 938 919 953
15. Mizoram 935 973 959 968 976 945 911 885 875 914 861 849 833 902 898 894 969 1115
16. Tripura 948 966 961 954 947 1029 1042 929 892 812 854 803 937 1012 1048 1018 1027 1184
17. Meghalaya 972 975 975 975 969 1067 1111 978 916 871 872 847 933 904 925 925 899 981
18. Assam 935 971 960 940 908 999 1058 966 882 808 822 831 925 1016 1010 882 796 910
19. West Bengal 934 966 956 941 876 979 1022 938 909 814 852 900 975 1104 1150 1057 1021 1092
20. Jharkhand 941 976 951 908 850 978 1008 1023 941 913 917 867 1056 1042 1122 960 1007 872
21. Orissa 972 959 954 961 1006 993 1045 1006 947 890 919 924 1103 1051 1124 989 962 880
22. Chhattisgarh 989 976 979 955 916 1019 1009 1041 953 969 986 982 1109 1174 1243 1182 1257 1165
23. Madhya Pradesh 919 938 933 884 803 919 973 986 904 865 924 845 1139 1016 1112 959 1099 1071
24. Gujarat 920 888 888 882 881 906 936 966 910 942 922 912 1103 1092 1156 1152 1280 1385
25. Daman & Diu 710 923 933 904 590 410 540 621 729 670 798 897 1123 1225 1227 1617 1369 1473
26. Dadra & N. H.* 812 980 982 907 765 613 616 725 751 8886 878 898 1039 1372 1194 1495 1205 1468
27. Maharashtra 922 913 929 907 819 852 963 945 966 900 934 910 1127 1392 1137 974 1042 1206
28. Andhra Pradesh 978 965 965 937 917 994 1094 969 1018 874 972 931 1195 1088 1220 973 1005 1176
29. Karnataka 965 948 964 951 895 922 1066 993 1033 887 911 909 1094 1074 1178 1096 1107 1246
30. Goa 961 936 953 958 924 877 959 917 964 906 1025 1038 1152 1180 1308 1401 1454 1565
31. Lakshadweep 948 967 940 918 945 1035 987 941 1012 879 985 848 827 1025 938 1227 814 1137
32. Kerala 1058 962 964 960 1010 1072 1148 1122 1136 1036 1030 985 1090 1149 1246 1220 1270 1424
33. Tamil Nadu 987 946 948 948 972 1019 1093 1000 1052 938 998 976 1048 1016 1065 946 860 965
34. Pondicherry 1001 971 957 963 978 1034 1099 969 978 862 960 988 1168 1150 1197 1108 953 1014
35. A & N Islands** 846 958 945 945 848 827 896 797 878 762 723 655 633 713 750 784 744 912
INDIA 933 934 923 902 858 938 1007 988 958 889 936 866 1086 1035 1096 937 1002 1017
Note: * Dadra & Nagar Haveli,
* Andaman & Nicobar Islands
Source: Report and Tables on Age, Series-1, India Census of India–2001, Statement 2.6, pp. 20-21.
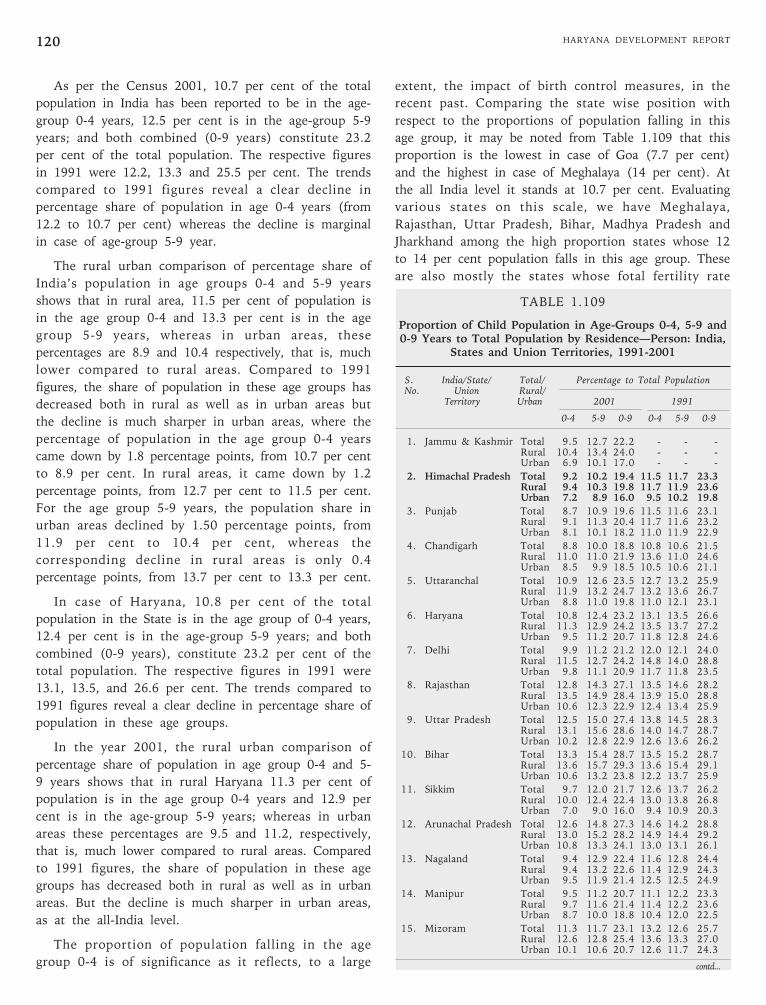
HARYANA DEVELOPMENT REPORT120
As per the Census 2001, 10.7 per cent of the total
population in India has been reported to be in the age-
group 0-4 years, 12.5 per cent is in the age-group 5-9
years; and both combined (0-9 years) constitute 23.2
per cent of the total population. The respective figures
in 1991 were 12.2, 13.3 and 25.5 per cent. The trends
compared to 1991 figures reveal a clear decline in
percentage share of population in age 0-4 years (from
12.2 to 10.7 per cent) whereas the decline is marginal
in case of age-group 5-9 year.
The rural urban comparison of percentage share of
India’s population in age groups 0-4 and 5-9 years
shows that in rural area, 11.5 per cent of population is
in the age group 0-4 and 13.3 per cent is in the age
group 5-9 years, whereas in urban areas, these
percentages are 8.9 and 10.4 respectively, that is, much
lower compared to rural areas. Compared to 1991
figures, the share of population in these age groups has
decreased both in rural as well as in urban areas but
the decline is much sharper in urban areas, where the
percentage of population in the age group 0-4 years
came down by 1.8 percentage points, from 10.7 per cent
to 8.9 per cent. In rural areas, it came down by 1.2
percentage points, from 12.7 per cent to 11.5 per cent.
For the age group 5-9 years, the population share in
urban areas declined by 1.50 percentage points, from
11.9 per cent to 10.4 per cent, whereas the
corresponding decline in rural areas is only 0.4
percentage points, from 13.7 per cent to 13.3 per cent.
In case of Haryana, 10.8 per cent of the total
population in the State is in the age group of 0-4 years,
12.4 per cent is in the age-group 5-9 years; and both
combined (0-9 years), constitute 23.2 per cent of the
total population. The respective figures in 1991 were
13.1, 13.5, and 26.6 per cent. The trends compared to
1991 figures reveal a clear decline in percentage share of
population in these age groups.
In the year 2001, the rural urban comparison of
percentage share of population in age group 0-4 and 5-
9 years shows that in rural Haryana 11.3 per cent of
population is in the age group 0-4 years and 12.9 per
cent is in the age-group 5-9 years; whereas in urban
areas these percentages are 9.5 and 11.2, respectively,
that is, much lower compared to rural areas. Compared
to 1991 figures, the share of population in these age
groups has decreased both in rural as well as in urban
areas. But the decline is much sharper in urban areas,
as at the all-India level.
The proportion of population falling in the age
group 0-4 is of significance as it reflects, to a large
extent, the impact of birth control measures, in the
recent past. Comparing the state wise position with
respect to the proportions of population falling in this
age group, it may be noted from Table 1.109 that this
proportion is the lowest in case of Goa (7.7 per cent)
and the highest in case of Meghalaya (14 per cent). At
the all India level it stands at 10.7 per cent. Evaluating
various states on this scale, we have Meghalaya,
Rajasthan, Uttar Pradesh, Bihar, Madhya Pradesh and
Jharkhand among the high proportion states whose 12
to 14 per cent population falls in this age group. These
are also mostly the states whose fotal fertility rate
TABLE 1.109
Proportion of Child Population in Age-Groups 0-4, 5-9 and0-9 Years to Total Population by Residence—Person: India,
States and Union Territories, 1991-2001
S. India/State/ Total/ Percentage to Total PopulationNo. Union Rural/
Territory Urban 2001 1991
0-4 5-9 0-9 0-4 5-9 0-9
1. Jammu & Kashmir Total 9.5 12.7 22.2 - - -Rural 10.4 13.4 24.0 - - -Urban 6.9 10.1 17.0 - - -
2. Himachal Pradesh Total 9.2 10.2 19.4 11.5 11.7 23.3Rural 9.4 10.3 19.8 11.7 11.9 23.6Urban 7.2 8.9 16.0 9.5 10.2 19.8
3. Punjab Total 8.7 10.9 19.6 11.5 11.6 23.1Rural 9.1 11.3 20.4 11.7 11.6 23.2Urban 8.1 10.1 18.2 11.0 11.9 22.9
4. Chandigarh Total 8.8 10.0 18.8 10.8 10.6 21.5Rural 11.0 11.0 21.9 13.6 11.0 24.6Urban 8.5 9.9 18.5 10.5 10.6 21.1
5. Uttaranchal Total 10.9 12.6 23.5 12.7 13.2 25.9Rural 11.9 13.2 24.7 13.2 13.6 26.7Urban 8.8 11.0 19.8 11.0 12.1 23.1
6. Haryana Total 10.8 12.4 23.2 13.1 13.5 26.6Rural 11.3 12.9 24.2 13.5 13.7 27.2Urban 9.5 11.2 20.7 11.8 12.8 24.6
7. Delhi Total 9.9 11.2 21.2 12.0 12.1 24.0Rural 11.5 12.7 24.2 14.8 14.0 28.8Urban 9.8 11.1 20.9 11.7 11.8 23.5
8. Rajasthan Total 12.8 14.3 27.1 13.5 14.6 28.2Rural 13.5 14.9 28.4 13.9 15.0 28.8Urban 10.6 12.3 22.9 12.4 13.4 25.9
9. Uttar Pradesh Total 12.5 15.0 27.4 13.8 14.5 28.3Rural 13.1 15.6 28.6 14.0 14.7 28.7Urban 10.2 12.8 22.9 12.6 13.6 26.2
10. Bihar Total 13.3 15.4 28.7 13.5 15.2 28.7Rural 13.6 15.7 29.3 13.6 15.4 29.1Urban 10.6 13.2 23.8 12.2 13.7 25.9
11. Sikkim Total 9.7 12.0 21.7 12.6 13.7 26.2Rural 10.0 12.4 22.4 13.0 13.8 26.8Urban 7.0 9.0 16.0 9.4 10.9 20.3
12. Arunachal Pradesh Total 12.6 14.8 27.3 14.6 14.2 28.8Rural 13.0 15.2 28.2 14.9 14.4 29.2Urban 10.8 13.3 24.1 13.0 13.1 26.1
13. Nagaland Total 9.4 12.9 22.4 11.6 12.8 24.4Rural 9.4 13.2 22.6 11.4 12.9 24.3Urban 9.5 11.9 21.4 12.5 12.5 24.9
14. Manipur Total 9.5 11.2 20.7 11.1 12.2 23.3Rural 9.7 11.6 21.4 11.4 12.2 23.6Urban 8.7 10.0 18.8 10.4 12.0 22.5
15. Mizoram Total 11.3 11.7 23.1 13.2 12.6 25.7Rural 12.6 12.8 25.4 13.6 13.3 27.0Urban 10.1 10.6 20.7 12.6 11.7 24.3
contd...
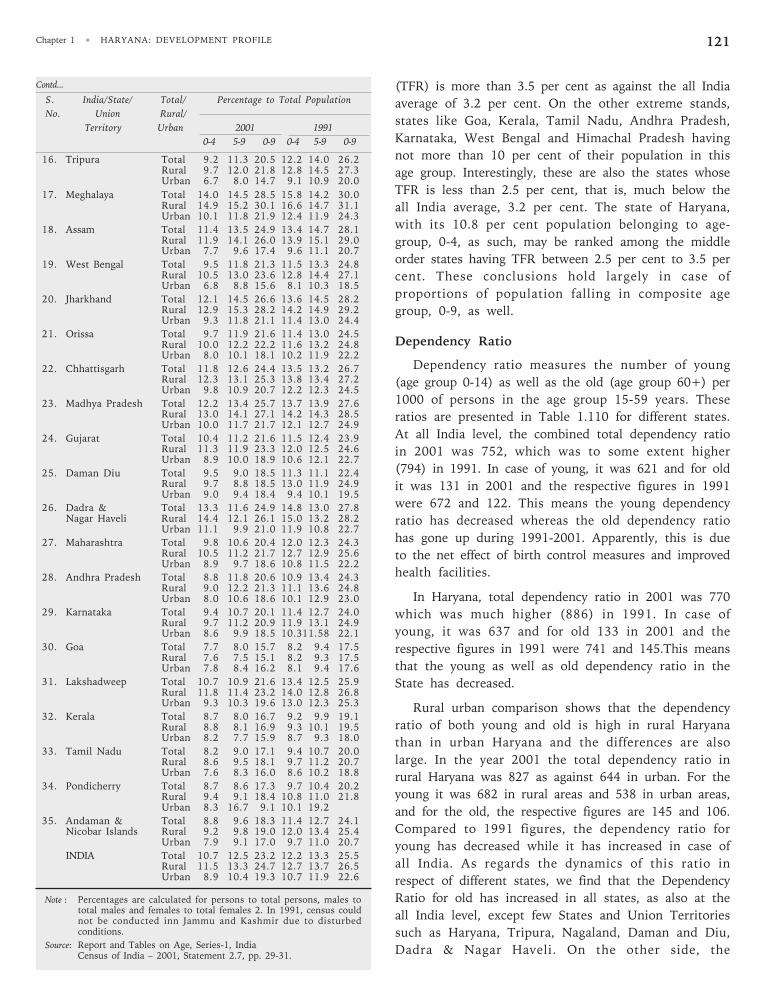
Chapter 1 • HARYANA: DEVELOPMENT PROFILE 121
Contd...
S. India/State/ Total/ Percentage to Total Population
No. Union Rural/
Territory Urban 2001 1991
0-4 5-9 0-9 0-4 5-9 0-9
16. Tripura Total 9.2 11.3 20.5 12.2 14.0 26.2Rural 9.7 12.0 21.8 12.8 14.5 27.3Urban 6.7 8.0 14.7 9.1 10.9 20.0
17. Meghalaya Total 14.0 14.5 28.5 15.8 14.2 30.0Rural 14.9 15.2 30.1 16.6 14.7 31.1Urban 10.1 11.8 21.9 12.4 11.9 24.3
18. Assam Total 11.4 13.5 24.9 13.4 14.7 28.1Rural 11.9 14.1 26.0 13.9 15.1 29.0Urban 7.7 9.6 17.4 9.6 11.1 20.7
19. West Bengal Total 9.5 11.8 21.3 11.5 13.3 24.8Rural 10.5 13.0 23.6 12.8 14.4 27.1Urban 6.8 8.8 15.6 8.1 10.3 18.5
20. Jharkhand Total 12.1 14.5 26.6 13.6 14.5 28.2Rural 12.9 15.3 28.2 14.2 14.9 29.2Urban 9.3 11.8 21.1 11.4 13.0 24.4
21. Orissa Total 9.7 11.9 21.6 11.4 13.0 24.5Rural 10.0 12.2 22.2 11.6 13.2 24.8Urban 8.0 10.1 18.1 10.2 11.9 22.2
22. Chhattisgarh Total 11.8 12.6 24.4 13.5 13.2 26.7Rural 12.3 13.1 25.3 13.8 13.4 27.2Urban 9.8 10.9 20.7 12.2 12.3 24.5
23. Madhya Pradesh Total 12.2 13.4 25.7 13.7 13.9 27.6Rural 13.0 14.1 27.1 14.2 14.3 28.5Urban 10.0 11.7 21.7 12.1 12.7 24.9
24. Gujarat Total 10.4 11.2 21.6 11.5 12.4 23.9Rural 11.3 11.9 23.3 12.0 12.5 24.6Urban 8.9 10.0 18.9 10.6 12.1 22.7
25. Daman Diu Total 9.5 9.0 18.5 11.3 11.1 22.4Rural 9.7 8.8 18.5 13.0 11.9 24.9Urban 9.0 9.4 18.4 9.4 10.1 19.5
26. Dadra & Total 13.3 11.6 24.9 14.8 13.0 27.8Nagar Haveli Rural 14.4 12.1 26.1 15.0 13.2 28.2
Urban 11.1 9.9 21.0 11.9 10.8 22.7
27. Maharashtra Total 9.8 10.6 20.4 12.0 12.3 24.3Rural 10.5 11.2 21.7 12.7 12.9 25.6Urban 8.9 9.7 18.6 10.8 11.5 22.2
28. Andhra Pradesh Total 8.8 11.8 20.6 10.9 13.4 24.3Rural 9.0 12.2 21.3 11.1 13.6 24.8Urban 8.0 10.6 18.6 10.1 12.9 23.0
29. Karnataka Total 9.4 10.7 20.1 11.4 12.7 24.0Rural 9.7 11.2 20.9 11.9 13.1 24.9Urban 8.6 9.9 18.5 10.311.58 22.1
30. Goa Total 7.7 8.0 15.7 8.2 9.4 17.5Rural 7.6 7.5 15.1 8.2 9.3 17.5Urban 7.8 8.4 16.2 8.1 9.4 17.6
31. Lakshadweep Total 10.7 10.9 21.6 13.4 12.5 25.9Rural 11.8 11.4 23.2 14.0 12.8 26.8Urban 9.3 10.3 19.6 13.0 12.3 25.3
32. Kerala Total 8.7 8.0 16.7 9.2 9.9 19.1Rural 8.8 8.1 16.9 9.3 10.1 19.5Urban 8.2 7.7 15.9 8.7 9.3 18.0
33. Tamil Nadu Total 8.2 9.0 17.1 9.4 10.7 20.0Rural 8.6 9.5 18.1 9.7 11.2 20.7Urban 7.6 8.3 16.0 8.6 10.2 18.8
34. Pondicherry Total 8.7 8.6 17.3 9.7 10.4 20.2Rural 9.4 9.1 18.4 10.8 11.0 21.8Urban 8.3 16.7 9.1 10.1 19.2
35. Andaman & Total 8.8 9.6 18.3 11.4 12.7 24.1Nicobar Islands Rural 9.2 9.8 19.0 12.0 13.4 25.4
Urban 7.9 9.1 17.0 9.7 11.0 20.7
INDIA Total 10.7 12.5 23.2 12.2 13.3 25.5Rural 11.5 13.3 24.7 12.7 13.7 26.5Urban 8.9 10.4 19.3 10.7 11.9 22.6
Note : Percentages are calculated for persons to total persons, males tototal males and females to total females 2. In 1991, census couldnot be conducted inn Jammu and Kashmir due to disturbedconditions.
Source: Report and Tables on Age, Series-1, IndiaCensus of India – 2001, Statement 2.7, pp. 29-31.
(TFR) is more than 3.5 per cent as against the all India
average of 3.2 per cent. On the other extreme stands,
states like Goa, Kerala, Tamil Nadu, Andhra Pradesh,
Karnataka, West Bengal and Himachal Pradesh having
not more than 10 per cent of their population in this
age group. Interestingly, these are also the states whose
TFR is less than 2.5 per cent, that is, much below the
all India average, 3.2 per cent. The state of Haryana,
with its 10.8 per cent population belonging to age-
group, 0-4, as such, may be ranked among the middle
order states having TFR between 2.5 per cent to 3.5 per
cent. These conclusions hold largely in case of
proportions of population falling in composite age
group, 0-9, as well.
Dependency Ratio
Dependency ratio measures the number of young
(age group 0-14) as well as the old (age group 60+) per
1000 of persons in the age group 15-59 years. These
ratios are presented in Table 1.110 for different states.
At all India level, the combined total dependency ratio
in 2001 was 752, which was to some extent higher
(794) in 1991. In case of young, it was 621 and for old
it was 131 in 2001 and the respective figures in 1991
were 672 and 122. This means the young dependency
ratio has decreased whereas the old dependency ratio
has gone up during 1991-2001. Apparently, this is due
to the net effect of birth control measures and improved
health facilities.
In Haryana, total dependency ratio in 2001 was 770
which was much higher (886) in 1991. In case of
young, it was 637 and for old 133 in 2001 and the
respective figures in 1991 were 741 and 145.This means
that the young as well as old dependency ratio in the
State has decreased.
Rural urban comparison shows that the dependency
ratio of both young and old is high in rural Haryana
than in urban Haryana and the differences are also
large. In the year 2001 the total dependency ratio in
rural Haryana was 827 as against 644 in urban. For the
young it was 682 in rural areas and 538 in urban areas,
and for the old, the respective figures are 145 and 106.
Compared to 1991 figures, the dependency ratio for
young has decreased while it has increased in case of
all India. As regards the dynamics of this ratio in
respect of different states, we find that the Dependency
Ratio for old has increased in all states, as also at the
all India level, except few States and Union Territories
such as Haryana, Tripura, Nagaland, Daman and Diu,
Dadra & Nagar Haveli. On the other side, the
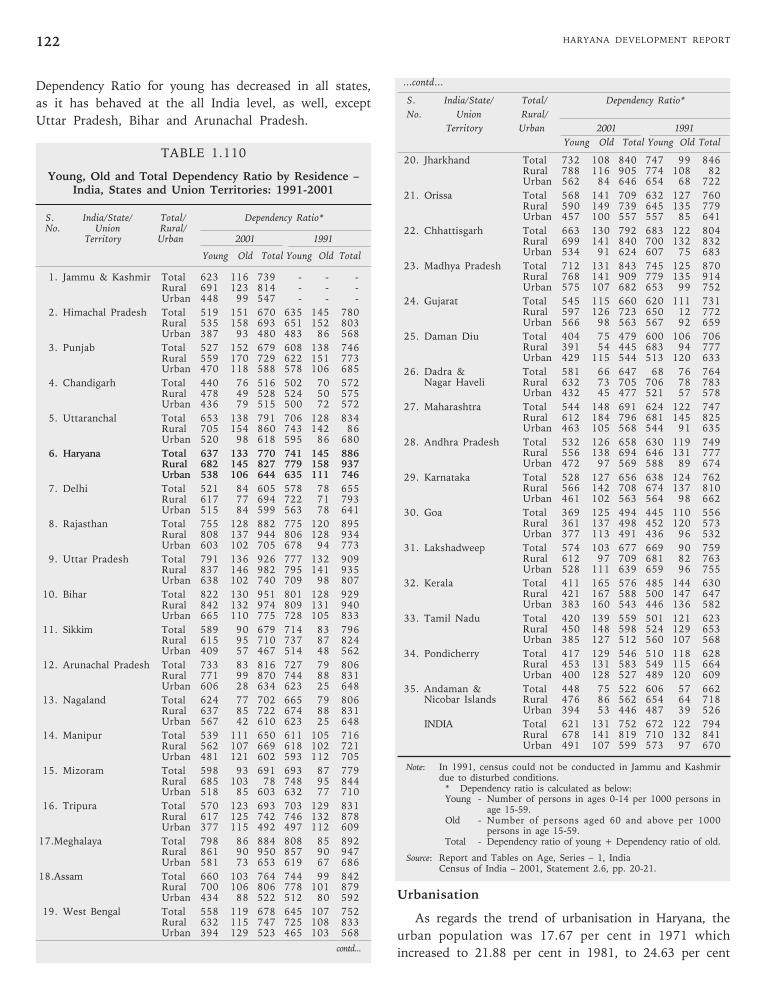
HARYANA DEVELOPMENT REPORT122
Dependency Ratio for young has decreased in all states,
as it has behaved at the all India level, as well, except
Uttar Pradesh, Bihar and Arunachal Pradesh.
TABLE 1.110
Young, Old and Total Dependency Ratio by Residence –India, States and Union Territories: 1991-2001
S. India/State/ Total/ Dependency Ratio*No. Union Rural/
Territory Urban 2001 1991
Young Old Total Young Old Total
1. Jammu & Kashmir Total 623 116 739 - - -Rural 691 123 814 - - -Urban 448 99 547 - - -
2. Himachal Pradesh Total 519 151 670 635 145 780Rural 535 158 693 651 152 803Urban 387 93 480 483 86 568
3. Punjab Total 527 152 679 608 138 746Rural 559 170 729 622 151 773Urban 470 118 588 578 106 685
4. Chandigarh Total 440 76 516 502 70 572Rural 478 49 528 524 50 575Urban 436 79 515 500 72 572
5. Uttaranchal Total 653 138 791 706 128 834Rural 705 154 860 743 142 86Urban 520 98 618 595 86 680
6. Haryana Total 637 133 770 741 145 886Rural 682 145 827 779 158 937Urban 538 106 644 635 111 746
7. Delhi Total 521 84 605 578 78 655Rural 617 77 694 722 71 793Urban 515 84 599 563 78 641
8. Rajasthan Total 755 128 882 775 120 895Rural 808 137 944 806 128 934Urban 603 102 705 678 94 773
9. Uttar Pradesh Total 791 136 926 777 132 909Rural 837 146 982 795 141 935Urban 638 102 740 709 98 807
10. Bihar Total 822 130 951 801 128 929Rural 842 132 974 809 131 940Urban 665 110 775 728 105 833
11. Sikkim Total 589 90 679 714 83 796Rural 615 95 710 737 87 824Urban 409 57 467 514 48 562
12. Arunachal Pradesh Total 733 83 816 727 79 806Rural 771 99 870 744 88 831Urban 606 28 634 623 25 648
13. Nagaland Total 624 77 702 665 79 806Rural 637 85 722 674 88 831Urban 567 42 610 623 25 648
14. Manipur Total 539 111 650 611 105 716Rural 562 107 669 618 102 721Urban 481 121 602 593 112 705
15. Mizoram Total 598 93 691 693 87 779Rural 685 103 78 748 95 844Urban 518 85 603 632 77 710
16. Tripura Total 570 123 693 703 129 831Rural 617 125 742 746 132 878Urban 377 115 492 497 112 609
17.Meghalaya Total 798 86 884 808 85 892Rural 861 90 950 857 90 947Urban 581 73 653 619 67 686
18.Assam Total 660 103 764 744 99 842Rural 700 106 806 778 101 879Urban 434 88 522 512 80 592
19. West Bengal Total 558 119 678 645 107 752Rural 632 115 747 725 108 833Urban 394 129 523 465 103 568
contd...
...contd...
S. India/State/ Total/ Dependency Ratio*
No. Union Rural/
Territory Urban 2001 1991
Young Old Total Young Old Total
20. Jharkhand Total 732 108 840 747 99 846Rural 788 116 905 774 108 82Urban 562 84 646 654 68 722
21. Orissa Total 568 141 709 632 127 760Rural 590 149 739 645 135 779Urban 457 100 557 557 85 641
22. Chhattisgarh Total 663 130 792 683 122 804Rural 699 141 840 700 132 832Urban 534 91 624 607 75 683
23. Madhya Pradesh Total 712 131 843 745 125 870Rural 768 141 909 779 135 914Urban 575 107 682 653 99 752
24. Gujarat Total 545 115 660 620 111 731Rural 597 126 723 650 12 772Urban 566 98 563 567 92 659
25. Daman Diu Total 404 75 479 600 106 706Rural 391 54 445 683 94 777Urban 429 115 544 513 120 633
26. Dadra & Total 581 66 647 68 76 764Nagar Haveli Rural 632 73 705 706 78 783
Urban 432 45 477 521 57 578
27. Maharashtra Total 544 148 691 624 122 747Rural 612 184 796 681 145 825Urban 463 105 568 544 91 635
28. Andhra Pradesh Total 532 126 658 630 119 749Rural 556 138 694 646 131 777Urban 472 97 569 588 89 674
29. Karnataka Total 528 127 656 638 124 762Rural 566 142 708 674 137 810Urban 461 102 563 564 98 662
30. Goa Total 369 125 494 445 110 556Rural 361 137 498 452 120 573Urban 377 113 491 436 96 532
31. Lakshadweep Total 574 103 677 669 90 759Rural 612 97 709 681 82 763Urban 528 111 639 659 96 755
32. Kerala Total 411 165 576 485 144 630Rural 421 167 588 500 147 647Urban 383 160 543 446 136 582
33. Tamil Nadu Total 420 139 559 501 121 623Rural 450 148 598 524 129 653Urban 385 127 512 560 107 568
34. Pondicherry Total 417 129 546 510 118 628Rural 453 131 583 549 115 664Urban 400 128 527 489 120 609
35. Andaman & Total 448 75 522 606 57 662Nicobar Islands Rural 476 86 562 654 64 718
Urban 394 53 446 487 39 526
INDIA Total 621 131 752 672 122 794Rural 678 141 819 710 132 841Urban 491 107 599 573 97 670
Note: In 1991, census could not be conducted in Jammu and Kashmirdue to disturbed conditions.
* Dependency ratio is calculated as below:Young - Number of persons in ages 0-14 per 1000 persons in
age 15-59.Old - Number of persons aged 60 and above per 1000
persons in age 15-59.Total - Dependency ratio of young + Dependency ratio of old.
Source: Report and Tables on Age, Series – 1, IndiaCensus of India – 2001, Statement 2.6, pp. 20-21.
Urbanisation
As regards the trend of urbanisation in Haryana, the
urban population was 17.67 per cent in 1971 which
increased to 21.88 per cent in 1981, to 24.63 per cent
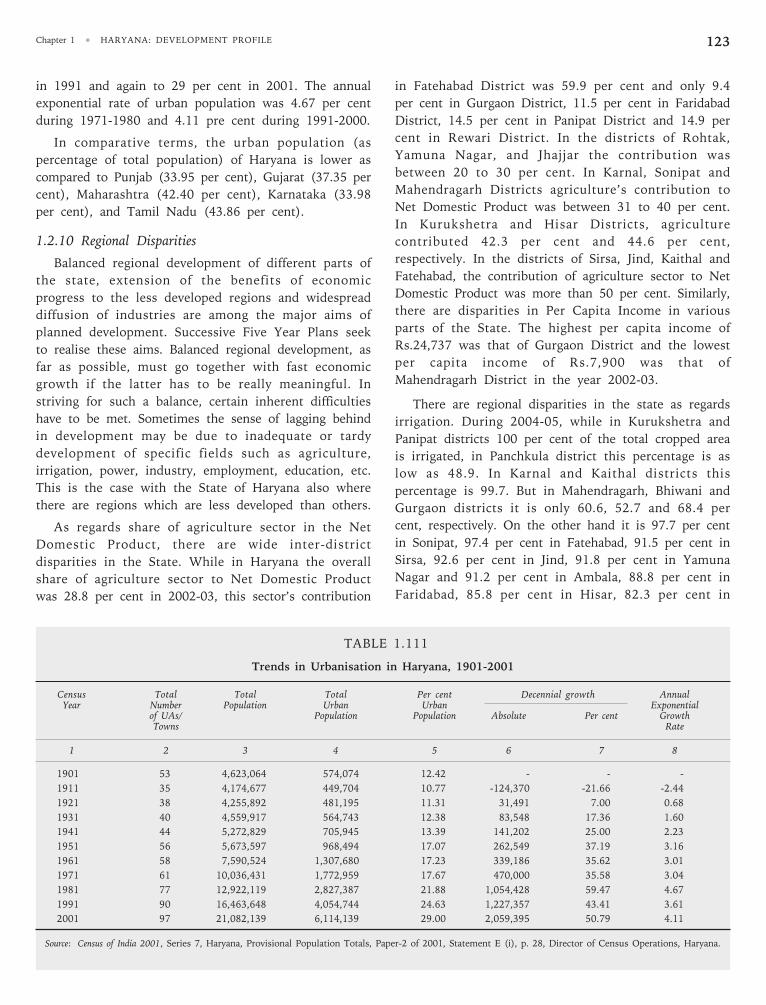
Chapter 1 • HARYANA: DEVELOPMENT PROFILE 123
in 1991 and again to 29 per cent in 2001. The annual
exponential rate of urban population was 4.67 per cent
during 1971-1980 and 4.11 pre cent during 1991-2000.
In comparative terms, the urban population (as
percentage of total population) of Haryana is lower as
compared to Punjab (33.95 per cent), Gujarat (37.35 per
cent), Maharashtra (42.40 per cent), Karnataka (33.98
per cent), and Tamil Nadu (43.86 per cent).
1.2.10 Regional Disparities
Balanced regional development of different parts of
the state, extension of the benefits of economic
progress to the less developed regions and widespread
diffusion of industries are among the major aims of
planned development. Successive Five Year Plans seek
to realise these aims. Balanced regional development, as
far as possible, must go together with fast economic
growth if the latter has to be really meaningful. In
striving for such a balance, certain inherent difficulties
have to be met. Sometimes the sense of lagging behind
in development may be due to inadequate or tardy
development of specific fields such as agriculture,
irrigation, power, industry, employment, education, etc.
This is the case with the State of Haryana also where
there are regions which are less developed than others.
As regards share of agriculture sector in the Net
Domestic Product, there are wide inter-district
disparities in the State. While in Haryana the overall
share of agriculture sector to Net Domestic Product
was 28.8 per cent in 2002-03, this sector’s contribution
in Fatehabad District was 59.9 per cent and only 9.4
per cent in Gurgaon District, 11.5 per cent in Faridabad
District, 14.5 per cent in Panipat District and 14.9 per
cent in Rewari District. In the districts of Rohtak,
Yamuna Nagar, and Jhajjar the contribution was
between 20 to 30 per cent. In Karnal, Sonipat and
Mahendragarh Districts agriculture’s contribution to
Net Domestic Product was between 31 to 40 per cent.
In Kurukshetra and Hisar Districts, agriculture
contributed 42.3 per cent and 44.6 per cent,
respectively. In the districts of Sirsa, Jind, Kaithal and
Fatehabad, the contribution of agriculture sector to Net
Domestic Product was more than 50 per cent. Similarly,
there are disparities in Per Capita Income in various
parts of the State. The highest per capita income of
Rs.24,737 was that of Gurgaon District and the lowest
per capita income of Rs.7,900 was that of
Mahendragarh District in the year 2002-03.
There are regional disparities in the state as regards
irrigation. During 2004-05, while in Kurukshetra and
Panipat districts 100 per cent of the total cropped area
is irrigated, in Panchkula district this percentage is as
low as 48.9. In Karnal and Kaithal districts this
percentage is 99.7. But in Mahendragarh, Bhiwani and
Gurgaon districts it is only 60.6, 52.7 and 68.4 per
cent, respectively. On the other hand it is 97.7 per cent
in Sonipat, 97.4 per cent in Fatehabad, 91.5 per cent in
Sirsa, 92.6 per cent in Jind, 91.8 per cent in Yamuna
Nagar and 91.2 per cent in Ambala, 88.8 per cent in
Faridabad, 85.8 per cent in Hisar, 82.3 per cent in
TABLE 1.111
Trends in Urbanisation in Haryana, 1901-2001
Census Total Total Total Per cent Decennial growth AnnualYear Number Population Urban Urban Exponential
of UAs/ Population Population Absolute Per cent GrowthTowns Rate
1 2 3 4 5 6 7 8
1901 53 4,623,064 574,074 12.42 - - -
1911 35 4,174,677 449,704 10.77 -124,370 -21.66 -2.44
1921 38 4,255,892 481,195 11.31 31,491 7.00 0.68
1931 40 4,559,917 564,743 12.38 83,548 17.36 1.60
1941 44 5,272,829 705,945 13.39 141,202 25.00 2.23
1951 56 5,673,597 968,494 17.07 262,549 37.19 3.16
1961 58 7,590,524 1,307,680 17.23 339,186 35.62 3.01
1971 61 10,036,431 1,772,959 17.67 470,000 35.58 3.04
1981 77 12,922,119 2,827,387 21.88 1,054,428 59.47 4.67
1991 90 16,463,648 4,054,744 24.63 1,227,357 43.41 3.61
2001 97 21,082,139 6,114,139 29.00 2,059,395 50.79 4.11
Source: Census of India 2001, Series 7, Haryana, Provisional Population Totals, Paper-2 of 2001, Statement E (i), p. 28, Director of Census Operations, Haryana.
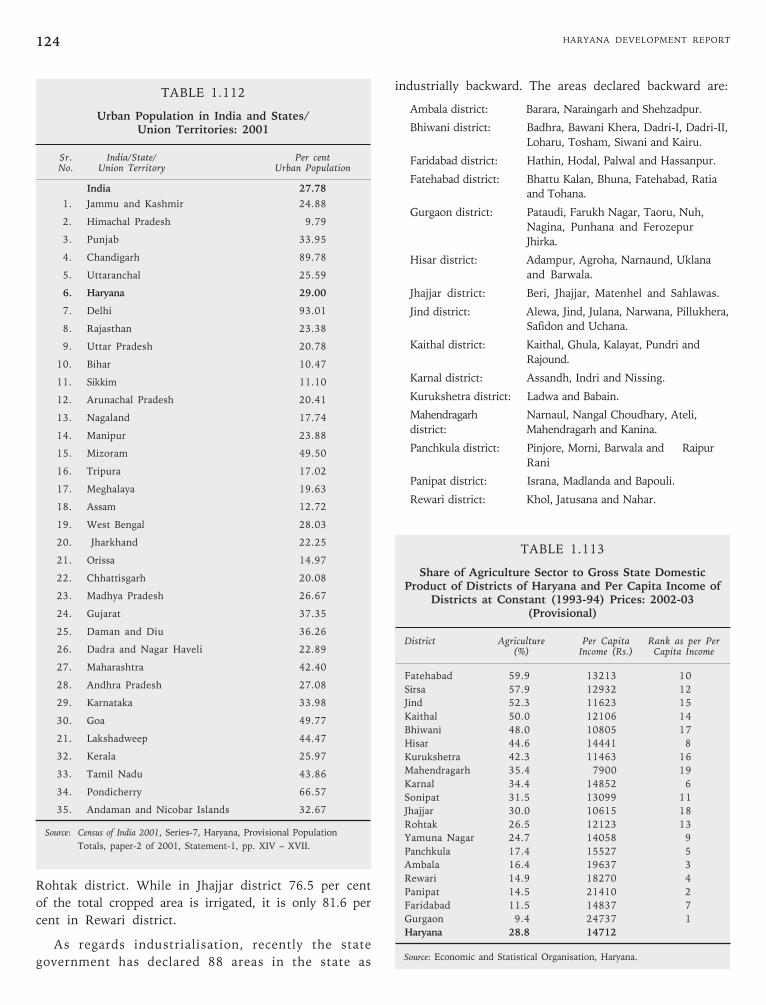
HARYANA DEVELOPMENT REPORT124
Rohtak district. While in Jhajjar district 76.5 per cent
of the total cropped area is irrigated, it is only 81.6 per
cent in Rewari district.
As regards industrialisation, recently the state
government has declared 88 areas in the state as
TABLE 1.112
Urban Population in India and States/Union Territories: 2001
Sr. India/State/ Per centNo. Union Territory Urban Population
India 27.78
1. Jammu and Kashmir 24.88
2. Himachal Pradesh 9.79
3. Punjab 33.95
4. Chandigarh 89.78
5. Uttaranchal 25.59
6. Haryana 29.00
7. Delhi 93.01
8. Rajasthan 23.38
9. Uttar Pradesh 20.78
10. Bihar 10.47
11. Sikkim 11.10
12. Arunachal Pradesh 20.41
13. Nagaland 17.74
14. Manipur 23.88
15. Mizoram 49.50
16. Tripura 17.02
17. Meghalaya 19.63
18. Assam 12.72
19. West Bengal 28.03
20. Jharkhand 22.25
21. Orissa 14.97
22. Chhattisgarh 20.08
23. Madhya Pradesh 26.67
24. Gujarat 37.35
25. Daman and Diu 36.26
26. Dadra and Nagar Haveli 22.89
27. Maharashtra 42.40
28. Andhra Pradesh 27.08
29. Karnataka 33.98
30. Goa 49.77
21. Lakshadweep 44.47
32. Kerala 25.97
33. Tamil Nadu 43.86
34. Pondicherry 66.57
35. Andaman and Nicobar Islands 32.67
Source: Census of India 2001, Series-7, Haryana, Provisional Population
Totals, paper-2 of 2001, Statement-1, pp. XIV – XVII.
TABLE 1.113
Share of Agriculture Sector to Gross State DomesticProduct of Districts of Haryana and Per Capita Income of
Districts at Constant (1993-94) Prices: 2002-03(Provisional)
District Agriculture Per Capita Rank as per Per(%) Income (Rs.) Capita Income
Fatehabad 59.9 13213 10
Sirsa 57.9 12932 12
Jind 52.3 11623 15
Kaithal 50.0 12106 14
Bhiwani 48.0 10805 17
Hisar 44.6 14441 8
Kurukshetra 42.3 11463 16
Mahendragarh 35.4 7900 19
Karnal 34.4 14852 6
Sonipat 31.5 13099 11
Jhajjar 30.0 10615 18
Rohtak 26.5 12123 13
Yamuna Nagar 24.7 14058 9
Panchkula 17.4 15527 5
Ambala 16.4 19637 3
Rewari 14.9 18270 4
Panipat 14.5 21410 2
Faridabad 11.5 14837 7
Gurgaon 9.4 24737 1
Haryana 28.8 14712
Source: Economic and Statistical Organisation, Haryana.
industrially backward. The areas declared backward are:
Ambala district: Barara, Naraingarh and Shehzadpur.
Bhiwani district: Badhra, Bawani Khera, Dadri-I, Dadri-II,
Loharu, Tosham, Siwani and Kairu.
Faridabad district: Hathin, Hodal, Palwal and Hassanpur.
Fatehabad district: Bhattu Kalan, Bhuna, Fatehabad, Ratiaand Tohana.
Gurgaon district: Pataudi, Farukh Nagar, Taoru, Nuh,
Nagina, Punhana and Ferozepur
Jhirka.
Hisar district: Adampur, Agroha, Narnaund, Uklana
and Barwala.
Jhajjar district: Beri, Jhajjar, Matenhel and Sahlawas.
Jind district: Alewa, Jind, Julana, Narwana, Pillukhera,Safidon and Uchana.
Kaithal district: Kaithal, Ghula, Kalayat, Pundri and
Rajound.
Karnal district: Assandh, Indri and Nissing.
Kurukshetra district: Ladwa and Babain.
Mahendragarh Narnaul, Nangal Choudhary, Ateli,
district: Mahendragarh and Kanina.
Panchkula district: Pinjore, Morni, Barwala and Raipur
Rani
Panipat district: Israna, Madlanda and Bapouli.
Rewari district: Khol, Jatusana and Nahar.
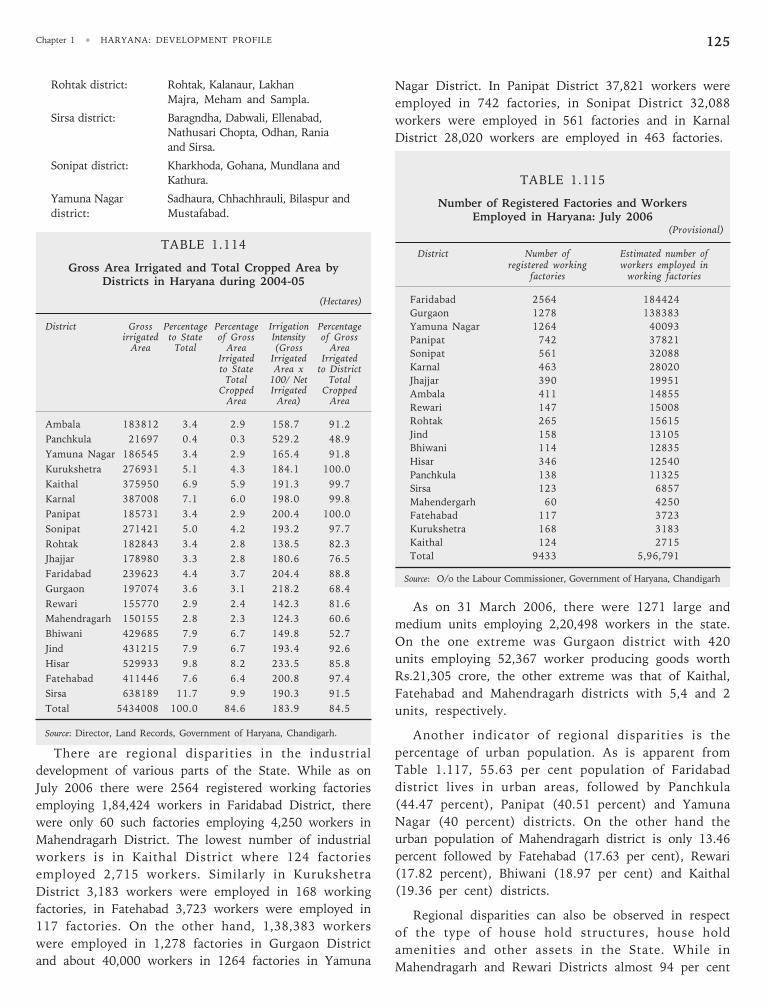
Chapter 1 • HARYANA: DEVELOPMENT PROFILE 125
Nagar District. In Panipat District 37,821 workers were
employed in 742 factories, in Sonipat District 32,088
workers were employed in 561 factories and in Karnal
District 28,020 workers are employed in 463 factories.
TABLE 1.115
Number of Registered Factories and WorkersEmployed in Haryana: July 2006
(Provisional)
District Number of Estimated number ofregistered working workers employed in
factories working factories
Faridabad 2564 184424
Gurgaon 1278 138383
Yamuna Nagar 1264 40093
Panipat 742 37821
Sonipat 561 32088
Karnal 463 28020
Jhajjar 390 19951
Ambala 411 14855
Rewari 147 15008
Rohtak 265 15615
Jind 158 13105
Bhiwani 114 12835
Hisar 346 12540
Panchkula 138 11325
Sirsa 123 6857
Mahendergarh 60 4250
Fatehabad 117 3723
Kurukshetra 168 3183
Kaithal 124 2715
Total 9433 5,96,791
Source: O/o the Labour Commissioner, Government of Haryana, Chandigarh
As on 31 March 2006, there were 1271 large and
medium units employing 2,20,498 workers in the state.
On the one extreme was Gurgaon district with 420
units employing 52,367 worker producing goods worth
Rs.21,305 crore, the other extreme was that of Kaithal,
Fatehabad and Mahendragarh districts with 5,4 and 2
units, respectively.
Another indicator of regional disparities is the
percentage of urban population. As is apparent from
Table 1.117, 55.63 per cent population of Faridabad
district lives in urban areas, followed by Panchkula
(44.47 percent), Panipat (40.51 percent) and Yamuna
Nagar (40 percent) districts. On the other hand the
urban population of Mahendragarh district is only 13.46
percent followed by Fatehabad (17.63 per cent), Rewari
(17.82 percent), Bhiwani (18.97 per cent) and Kaithal
(19.36 per cent) districts.
Regional disparities can also be observed in respect
of the type of house hold structures, house hold
amenities and other assets in the State. While in
Mahendragarh and Rewari Districts almost 94 per cent
Rohtak district: Rohtak, Kalanaur, Lakhan
Majra, Meham and Sampla.
Sirsa district: Baragndha, Dabwali, Ellenabad,Nathusari Chopta, Odhan, Rania
and Sirsa.
Sonipat district: Kharkhoda, Gohana, Mundlana andKathura.
Yamuna Nagar Sadhaura, Chhachhrauli, Bilaspur and
district: Mustafabad.
TABLE 1.114
Gross Area Irrigated and Total Cropped Area byDistricts in Haryana during 2004-05
(Hectares)
District Gross Percentage Percentage Irrigation Percentageirrigated to State of Gross Intensity of Gross
Area Total Area (Gross AreaIrrigated Irrigated Irrigatedto State Area x to District
Total 100/ Net TotalCropped Irrigated Cropped
Area Area) Area
Ambala 183812 3.4 2.9 158.7 91.2
Panchkula 21697 0.4 0.3 529.2 48.9
Yamuna Nagar 186545 3.4 2.9 165.4 91.8
Kurukshetra 276931 5.1 4.3 184.1 100.0
Kaithal 375950 6.9 5.9 191.3 99.7
Karnal 387008 7.1 6.0 198.0 99.8
Panipat 185731 3.4 2.9 200.4 100.0
Sonipat 271421 5.0 4.2 193.2 97.7
Rohtak 182843 3.4 2.8 138.5 82.3
Jhajjar 178980 3.3 2.8 180.6 76.5
Faridabad 239623 4.4 3.7 204.4 88.8
Gurgaon 197074 3.6 3.1 218.2 68.4
Rewari 155770 2.9 2.4 142.3 81.6
Mahendragarh 150155 2.8 2.3 124.3 60.6
Bhiwani 429685 7.9 6.7 149.8 52.7
Jind 431215 7.9 6.7 193.4 92.6
Hisar 529933 9.8 8.2 233.5 85.8
Fatehabad 411446 7.6 6.4 200.8 97.4
Sirsa 638189 11.7 9.9 190.3 91.5
Total 5434008 100.0 84.6 183.9 84.5
Source: Director, Land Records, Government of Haryana, Chandigarh.
There are regional disparities in the industrial
development of various parts of the State. While as on
July 2006 there were 2564 registered working factories
employing 1,84,424 workers in Faridabad District, there
were only 60 such factories employing 4,250 workers in
Mahendragarh District. The lowest number of industrial
workers is in Kaithal District where 124 factories
employed 2,715 workers. Similarly in Kurukshetra
District 3,183 workers were employed in 168 working
factories, in Fatehabad 3,723 workers were employed in
117 factories. On the other hand, 1,38,383 workers
were employed in 1,278 factories in Gurgaon District
and about 40,000 workers in 1264 factories in Yamuna
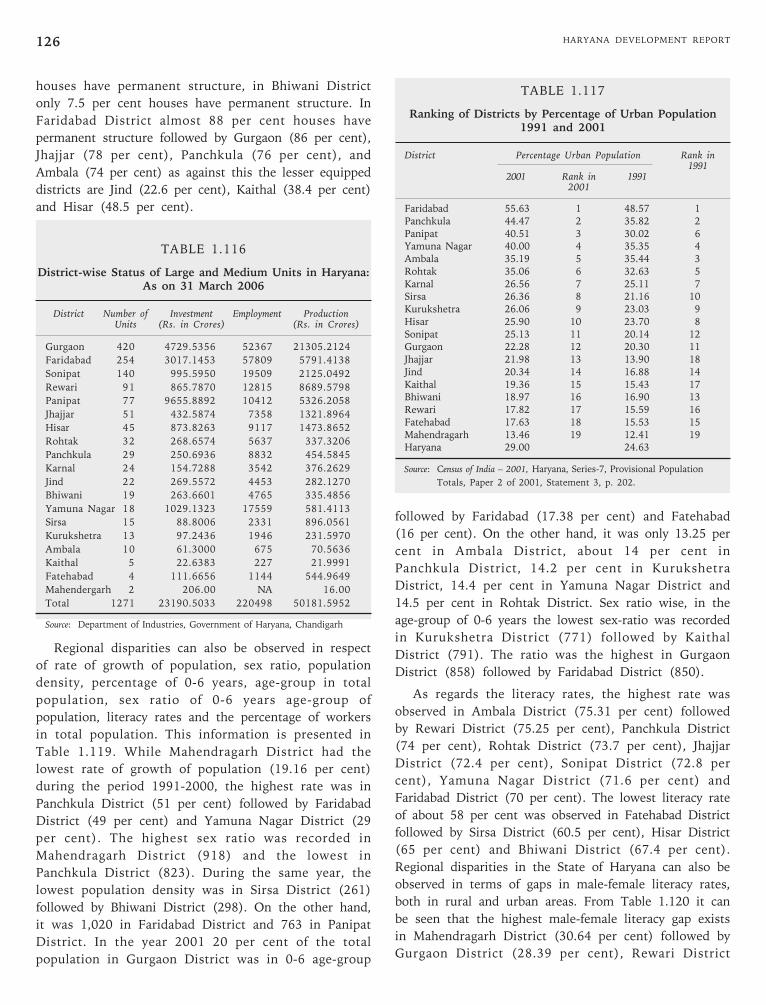
HARYANA DEVELOPMENT REPORT126
houses have permanent structure, in Bhiwani District
only 7.5 per cent houses have permanent structure. In
Faridabad District almost 88 per cent houses have
permanent structure followed by Gurgaon (86 per cent),
Jhajjar (78 per cent), Panchkula (76 per cent), and
Ambala (74 per cent) as against this the lesser equipped
districts are Jind (22.6 per cent), Kaithal (38.4 per cent)
and Hisar (48.5 per cent).
TABLE 1.116
District-wise Status of Large and Medium Units in Haryana:As on 31 March 2006
District Number of Investment Employment ProductionUnits (Rs. in Crores) (Rs. in Crores)
Gurgaon 420 4729.5356 52367 21305.2124
Faridabad 254 3017.1453 57809 5791.4138
Sonipat 140 995.5950 19509 2125.0492
Rewari 91 865.7870 12815 8689.5798
Panipat 77 9655.8892 10412 5326.2058
Jhajjar 51 432.5874 7358 1321.8964
Hisar 45 873.8263 9117 1473.8652
Rohtak 32 268.6574 5637 337.3206
Panchkula 29 250.6936 8832 454.5845
Karnal 24 154.7288 3542 376.2629
Jind 22 269.5572 4453 282.1270
Bhiwani 19 263.6601 4765 335.4856
Yamuna Nagar 18 1029.1323 17559 581.4113
Sirsa 15 88.8006 2331 896.0561
Kurukshetra 13 97.2436 1946 231.5970
Ambala 10 61.3000 675 70.5636
Kaithal 5 22.6383 227 21.9991
Fatehabad 4 111.6656 1144 544.9649
Mahendergarh 2 206.00 NA 16.00
Total 1271 23190.5033 220498 50181.5952
Source: Department of Industries, Government of Haryana, Chandigarh
Regional disparities can also be observed in respect
of rate of growth of population, sex ratio, population
density, percentage of 0-6 years, age-group in total
population, sex ratio of 0-6 years age-group of
population, literacy rates and the percentage of workers
in total population. This information is presented in
Table 1.119. While Mahendragarh District had the
lowest rate of growth of population (19.16 per cent)
during the period 1991-2000, the highest rate was in
Panchkula District (51 per cent) followed by Faridabad
District (49 per cent) and Yamuna Nagar District (29
per cent). The highest sex ratio was recorded in
Mahendragarh District (918) and the lowest in
Panchkula District (823). During the same year, the
lowest population density was in Sirsa District (261)
followed by Bhiwani District (298). On the other hand,
it was 1,020 in Faridabad District and 763 in Panipat
District. In the year 2001 20 per cent of the total
population in Gurgaon District was in 0-6 age-group
TABLE 1.117
Ranking of Districts by Percentage of Urban Population1991 and 2001
District Percentage Urban Population Rank in1991
2001 Rank in 19912001
Faridabad 55.63 1 48.57 1Panchkula 44.47 2 35.82 2Panipat 40.51 3 30.02 6Yamuna Nagar 40.00 4 35.35 4Ambala 35.19 5 35.44 3Rohtak 35.06 6 32.63 5Karnal 26.56 7 25.11 7Sirsa 26.36 8 21.16 10Kurukshetra 26.06 9 23.03 9Hisar 25.90 10 23.70 8Sonipat 25.13 11 20.14 12Gurgaon 22.28 12 20.30 11Jhajjar 21.98 13 13.90 18Jind 20.34 14 16.88 14Kaithal 19.36 15 15.43 17Bhiwani 18.97 16 16.90 13Rewari 17.82 17 15.59 16Fatehabad 17.63 18 15.53 15Mahendragarh 13.46 19 12.41 19Haryana 29.00 24.63
Source: Census of India – 2001, Haryana, Series-7, Provisional Population
Totals, Paper 2 of 2001, Statement 3, p. 202.
followed by Faridabad (17.38 per cent) and Fatehabad
(16 per cent). On the other hand, it was only 13.25 per
cent in Ambala District, about 14 per cent in
Panchkula District, 14.2 per cent in Kurukshetra
District, 14.4 per cent in Yamuna Nagar District and
14.5 per cent in Rohtak District. Sex ratio wise, in the
age-group of 0-6 years the lowest sex-ratio was recorded
in Kurukshetra District (771) followed by Kaithal
District (791). The ratio was the highest in Gurgaon
District (858) followed by Faridabad District (850).
As regards the literacy rates, the highest rate was
observed in Ambala District (75.31 per cent) followed
by Rewari District (75.25 per cent), Panchkula District
(74 per cent), Rohtak District (73.7 per cent), Jhajjar
District (72.4 per cent), Sonipat District (72.8 per
cent), Yamuna Nagar District (71.6 per cent) and
Faridabad District (70 per cent). The lowest literacy rate
of about 58 per cent was observed in Fatehabad District
followed by Sirsa District (60.5 per cent), Hisar District
(65 per cent) and Bhiwani District (67.4 per cent).
Regional disparities in the State of Haryana can also be
observed in terms of gaps in male-female literacy rates,
both in rural and urban areas. From Table 1.120 it can
be seen that the highest male-female literacy gap exists
in Mahendragarh District (30.64 per cent) followed by
Gurgaon District (28.39 per cent), Rewari District
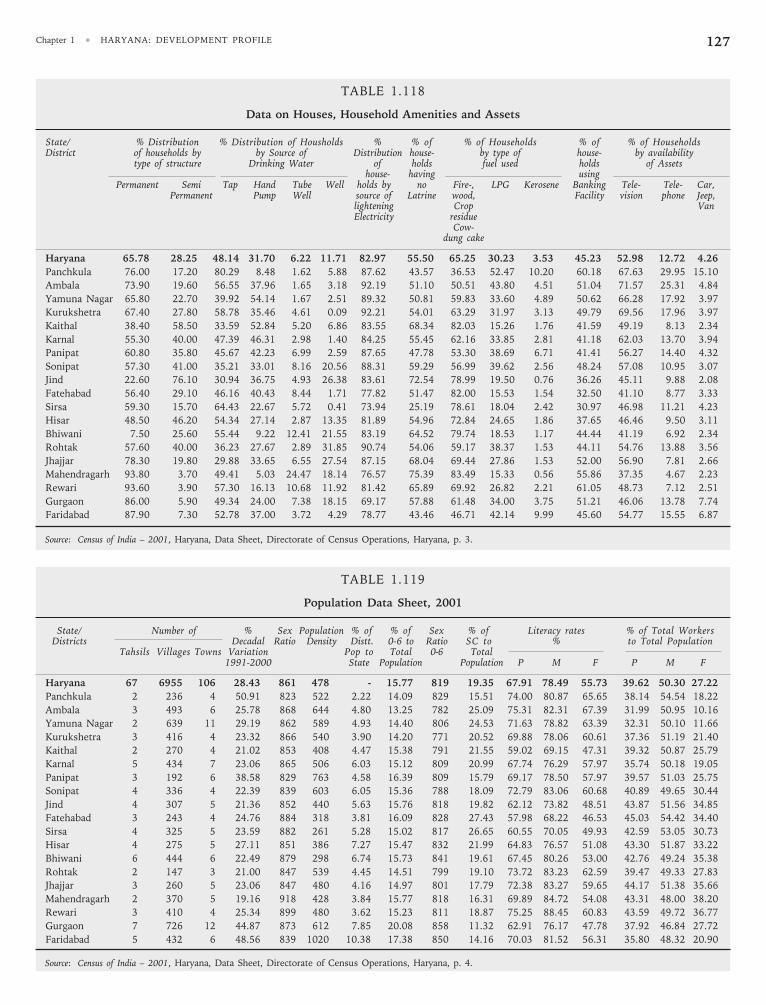
Chapter 1 • HARYANA: DEVELOPMENT PROFILE 127
TABLE 1.118
Data on Houses, Household Amenities and Assets
State/ % Distribution % Distribution of Housholds % % of % of Households % of % of HouseholdsDistrict of households by by Source of Distribution house- by type of house- by availability
type of structure Drinking Water of holds fuel used holds of Assetshouse- having using
Permanent Semi Tap Hand Tube Well holds by no Fire-, LPG Kerosene Banking Tele- Tele- Car,Permanent Pump Well source of Latrine wood, Facility vision phone Jeep,
lightening Crop VanElectricity residue
Cow-dung cake
Haryana 65.78 28.25 48.14 31.70 6.22 11.71 82.97 55.50 65.25 30.23 3.53 45.23 52.98 12.72 4.26
Panchkula 76.00 17.20 80.29 8.48 1.62 5.88 87.62 43.57 36.53 52.47 10.20 60.18 67.63 29.95 15.10
Ambala 73.90 19.60 56.55 37.96 1.65 3.18 92.19 51.10 50.51 43.80 4.51 51.04 71.57 25.31 4.84
Yamuna Nagar 65.80 22.70 39.92 54.14 1.67 2.51 89.32 50.81 59.83 33.60 4.89 50.62 66.28 17.92 3.97
Kurukshetra 67.40 27.80 58.78 35.46 4.61 0.09 92.21 54.01 63.29 31.97 3.13 49.79 69.56 17.96 3.97
Kaithal 38.40 58.50 33.59 52.84 5.20 6.86 83.55 68.34 82.03 15.26 1.76 41.59 49.19 8.13 2.34
Karnal 55.30 40.00 47.39 46.31 2.98 1.40 84.25 55.45 62.16 33.85 2.81 41.18 62.03 13.70 3.94
Panipat 60.80 35.80 45.67 42.23 6.99 2.59 87.65 47.78 53.30 38.69 6.71 41.41 56.27 14.40 4.32
Sonipat 57.30 41.00 35.21 33.01 8.16 20.56 88.31 59.29 56.99 39.62 2.56 48.24 57.08 10.95 3.07
Jind 22.60 76.10 30.94 36.75 4.93 26.38 83.61 72.54 78.99 19.50 0.76 36.26 45.11 9.88 2.08
Fatehabad 56.40 29.10 46.16 40.43 8.44 1.71 77.82 51.47 82.00 15.53 1.54 32.50 41.10 8.77 3.33
Sirsa 59.30 15.70 64.43 22.67 5.72 0.41 73.94 25.19 78.61 18.04 2.42 30.97 46.98 11.21 4.23
Hisar 48.50 46.20 54.34 27.14 2.87 13.35 81.89 54.96 72.84 24.65 1.86 37.65 46.46 9.50 3.11
Bhiwani 7.50 25.60 55.44 9.22 12.41 21.55 83.19 64.52 79.74 18.53 1.17 44.44 41.19 6.92 2.34
Rohtak 57.60 40.00 36.23 27.67 2.89 31.85 90.74 54.06 59.17 38.37 1.53 44.11 54.76 13.88 3.56
Jhajjar 78.30 19.80 29.88 33.65 6.55 27.54 87.15 68.04 69.44 27.86 1.53 52.00 56.90 7.81 2.66
Mahendragarh 93.80 3.70 49.41 5.03 24.47 18.14 76.57 75.39 83.49 15.33 0.56 55.86 37.35 4.67 2.23
Rewari 93.60 3.90 57.30 16.13 10.68 11.92 81.42 65.89 69.92 26.82 2.21 61.05 48.73 7.12 2.51
Gurgaon 86.00 5.90 49.34 24.00 7.38 18.15 69.17 57.88 61.48 34.00 3.75 51.21 46.06 13.78 7.74
Faridabad 87.90 7.30 52.78 37.00 3.72 4.29 78.77 43.46 46.71 42.14 9.99 45.60 54.77 15.55 6.87
Source: Census of India – 2001, Haryana, Data Sheet, Directorate of Census Operations, Haryana, p. 3.
TABLE 1.119
Population Data Sheet, 2001
State/ Number of % Sex Population % of % of Sex % of Literacy rates % of Total WorkersDistricts Decadal Ratio Density Distt. 0-6 to Ratio SC to % to Total Population
Tahsils Villages Towns Variation Pop to Total 0-6 Total1991-2000 State Population Population P M F P M F
Haryana 67 6955 106 28.43 861 478 - 15.77 819 19.35 67.91 78.49 55.73 39.62 50.30 27.22
Panchkula 2 236 4 50.91 823 522 2.22 14.09 829 15.51 74.00 80.87 65.65 38.14 54.54 18.22
Ambala 3 493 6 25.78 868 644 4.80 13.25 782 25.09 75.31 82.31 67.39 31.99 50.95 10.16
Yamuna Nagar 2 639 11 29.19 862 589 4.93 14.40 806 24.53 71.63 78.82 63.39 32.31 50.10 11.66
Kurukshetra 3 416 4 23.32 866 540 3.90 14.20 771 20.52 69.88 78.06 60.61 37.36 51.19 21.40
Kaithal 2 270 4 21.02 853 408 4.47 15.38 791 21.55 59.02 69.15 47.31 39.32 50.87 25.79
Karnal 5 434 7 23.06 865 506 6.03 15.12 809 20.99 67.74 76.29 57.97 35.74 50.18 19.05
Panipat 3 192 6 38.58 829 763 4.58 16.39 809 15.79 69.17 78.50 57.97 39.57 51.03 25.75
Sonipat 4 336 4 22.39 839 603 6.05 15.36 788 18.09 72.79 83.06 60.68 40.89 49.65 30.44
Jind 4 307 5 21.36 852 440 5.63 15.76 818 19.82 62.12 73.82 48.51 43.87 51.56 34.85
Fatehabad 3 243 4 24.76 884 318 3.81 16.09 828 27.43 57.98 68.22 46.53 45.03 54.42 34.40
Sirsa 4 325 5 23.59 882 261 5.28 15.02 817 26.65 60.55 70.05 49.93 42.59 53.05 30.73
Hisar 4 275 5 27.11 851 386 7.27 15.47 832 21.99 64.83 76.57 51.08 43.30 51.87 33.22
Bhiwani 6 444 6 22.49 879 298 6.74 15.73 841 19.61 67.45 80.26 53.00 42.76 49.24 35.38
Rohtak 2 147 3 21.00 847 539 4.45 14.51 799 19.10 73.72 83.23 62.59 39.47 49.33 27.83
Jhajjar 3 260 5 23.06 847 480 4.16 14.97 801 17.79 72.38 83.27 59.65 44.17 51.38 35.66
Mahendragarh 2 370 5 19.16 918 428 3.84 15.77 818 16.31 69.89 84.72 54.08 43.31 48.00 38.20
Rewari 3 410 4 25.34 899 480 3.62 15.23 811 18.87 75.25 88.45 60.83 43.59 49.72 36.77
Gurgaon 7 726 12 44.87 873 612 7.85 20.08 858 11.32 62.91 76.17 47.78 37.92 46.84 27.72
Faridabad 5 432 6 48.56 839 1020 10.38 17.38 850 14.16 70.03 81.52 56.31 35.80 48.32 20.90
Source: Census of India – 2001, Haryana, Data Sheet, Directorate of Census Operations, Haryana, p. 4.
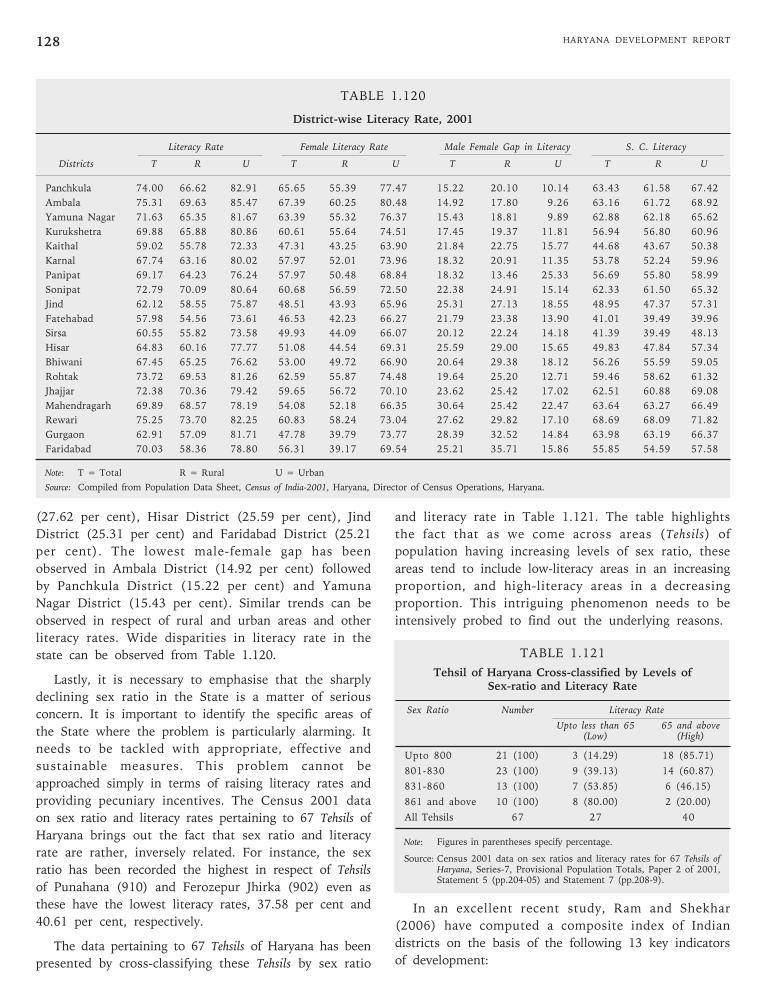
HARYANA DEVELOPMENT REPORT128
(27.62 per cent), Hisar District (25.59 per cent), Jind
District (25.31 per cent) and Faridabad District (25.21
per cent). The lowest male-female gap has been
observed in Ambala District (14.92 per cent) followed
by Panchkula District (15.22 per cent) and Yamuna
Nagar District (15.43 per cent). Similar trends can be
observed in respect of rural and urban areas and other
literacy rates. Wide disparities in literacy rate in the
state can be observed from Table 1.120.
Lastly, it is necessary to emphasise that the sharply
declining sex ratio in the State is a matter of serious
concern. It is important to identify the specific areas of
the State where the problem is particularly alarming. It
needs to be tackled with appropriate, effective and
sustainable measures. This problem cannot be
approached simply in terms of raising literacy rates and
providing pecuniary incentives. The Census 2001 data
on sex ratio and literacy rates pertaining to 67 Tehsils of
Haryana brings out the fact that sex ratio and literacy
rate are rather, inversely related. For instance, the sex
ratio has been recorded the highest in respect of Tehsils
of Punahana (910) and Ferozepur Jhirka (902) even as
these have the lowest literacy rates, 37.58 per cent and
40.61 per cent, respectively.
The data pertaining to 67 Tehsils of Haryana has been
presented by cross-classifying these Tehsils by sex ratio
and literacy rate in Table 1.121. The table highlights
the fact that as we come across areas (Tehsils) of
population having increasing levels of sex ratio, these
areas tend to include low-literacy areas in an increasing
proportion, and high-literacy areas in a decreasing
proportion. This intriguing phenomenon needs to be
intensively probed to find out the underlying reasons.
TABLE 1.121
Tehsil of Haryana Cross-classified by Levels ofSex-ratio and Literacy Rate
Sex Ratio Number Literacy Rate
Upto less than 65 65 and above(Low) (High)
Upto 800 21 (100) 3 (14.29) 18 (85.71)
801-830 23 (100) 9 (39.13) 14 (60.87)
831-860 13 (100) 7 (53.85) 6 (46.15)
861 and above 10 (100) 8 (80.00) 2 (20.00)
All Tehsils 67 27 40
Note: Figures in parentheses specify percentage.
Source: Census 2001 data on sex ratios and literacy rates for 67 Tehsils ofHaryana, Series-7, Provisional Population Totals, Paper 2 of 2001,Statement 5 (pp.204-05) and Statement 7 (pp.208-9).
In an excellent recent study, Ram and Shekhar
(2006) have computed a composite index of Indian
districts on the basis of the following 13 key indicators
of development:
TABLE 1.120
District-wise Literacy Rate, 2001
Literacy Rate Female Literacy Rate Male Female Gap in Literacy S. C. Literacy
Districts T R U T R U T R U T R U
Panchkula 74.00 66.62 82.91 65.65 55.39 77.47 15.22 20.10 10.14 63.43 61.58 67.42
Ambala 75.31 69.63 85.47 67.39 60.25 80.48 14.92 17.80 9.26 63.16 61.72 68.92
Yamuna Nagar 71.63 65.35 81.67 63.39 55.32 76.37 15.43 18.81 9.89 62.88 62.18 65.62
Kurukshetra 69.88 65.88 80.86 60.61 55.64 74.51 17.45 19.37 11.81 56.94 56.80 60.96
Kaithal 59.02 55.78 72.33 47.31 43.25 63.90 21.84 22.75 15.77 44.68 43.67 50.38
Karnal 67.74 63.16 80.02 57.97 52.01 73.96 18.32 20.91 11.35 53.78 52.24 59.96
Panipat 69.17 64.23 76.24 57.97 50.48 68.84 18.32 13.46 25.33 56.69 55.80 58.99
Sonipat 72.79 70.09 80.64 60.68 56.59 72.50 22.38 24.91 15.14 62.33 61.50 65.32
Jind 62.12 58.55 75.87 48.51 43.93 65.96 25.31 27.13 18.55 48.95 47.37 57.31
Fatehabad 57.98 54.56 73.61 46.53 42.23 66.27 21.79 23.38 13.90 41.01 39.49 39.96
Sirsa 60.55 55.82 73.58 49.93 44.09 66.07 20.12 22.24 14.18 41.39 39.49 48.13
Hisar 64.83 60.16 77.77 51.08 44.54 69.31 25.59 29.00 15.65 49.83 47.84 57.34
Bhiwani 67.45 65.25 76.62 53.00 49.72 66.90 20.64 29.38 18.12 56.26 55.59 59.05
Rohtak 73.72 69.53 81.26 62.59 55.87 74.48 19.64 25.20 12.71 59.46 58.62 61.32
Jhajjar 72.38 70.36 79.42 59.65 56.72 70.10 23.62 25.42 17.02 62.51 60.88 69.08
Mahendragarh 69.89 68.57 78.19 54.08 52.18 66.35 30.64 25.42 22.47 63.64 63.27 66.49
Rewari 75.25 73.70 82.25 60.83 58.24 73.04 27.62 29.82 17.10 68.69 68.09 71.82
Gurgaon 62.91 57.09 81.71 47.78 39.79 73.77 28.39 32.52 14.84 63.98 63.19 66.37
Faridabad 70.03 58.36 78.80 56.31 39.17 69.54 25.21 35.71 15.86 55.85 54.59 57.58
Note: T = Total R = Rural U = Urban
Source: Compiled from Population Data Sheet, Census of India-2001, Haryana, Director of Census Operations, Haryana.
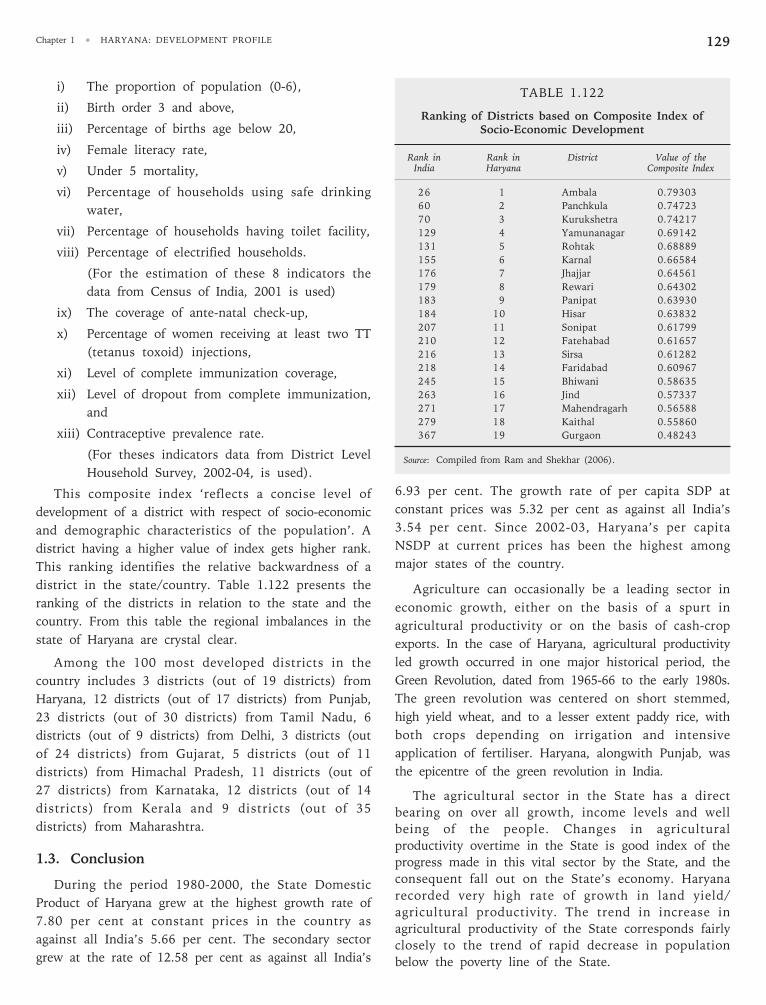
Chapter 1 • HARYANA: DEVELOPMENT PROFILE 129
i) The proportion of population (0-6),
ii) Birth order 3 and above,
iii) Percentage of births age below 20,
iv) Female literacy rate,
v) Under 5 mortality,
vi) Percentage of households using safe drinking
water,
vii) Percentage of households having toilet facility,
viii) Percentage of electrified households.
(For the estimation of these 8 indicators the
data from Census of India, 2001 is used)
ix) The coverage of ante-natal check-up,
x) Percentage of women receiving at least two TT
(tetanus toxoid) injections,
xi) Level of complete immunization coverage,
xii) Level of dropout from complete immunization,
and
xiii) Contraceptive prevalence rate.
(For theses indicators data from District Level
Household Survey, 2002-04, is used).
This composite index ‘reflects a concise level of
development of a district with respect of socio-economic
and demographic characteristics of the population’. A
district having a higher value of index gets higher rank.
This ranking identifies the relative backwardness of a
district in the state/country. Table 1.122 presents the
ranking of the districts in relation to the state and the
country. From this table the regional imbalances in the
state of Haryana are crystal clear.
Among the 100 most developed districts in the
country includes 3 districts (out of 19 districts) from
Haryana, 12 districts (out of 17 districts) from Punjab,
23 districts (out of 30 districts) from Tamil Nadu, 6
districts (out of 9 districts) from Delhi, 3 districts (out
of 24 districts) from Gujarat, 5 districts (out of 11
districts) from Himachal Pradesh, 11 districts (out of
27 districts) from Karnataka, 12 districts (out of 14
districts) from Kerala and 9 districts (out of 35
districts) from Maharashtra.
1.3. Conclusion
During the period 1980-2000, the State Domestic
Product of Haryana grew at the highest growth rate of
7.80 per cent at constant prices in the country as
against all India’s 5.66 per cent. The secondary sector
grew at the rate of 12.58 per cent as against all India’s
6.93 per cent. The growth rate of per capita SDP at
constant prices was 5.32 per cent as against all India’s
3.54 per cent. Since 2002-03, Haryana’s per capita
NSDP at current prices has been the highest among
major states of the country.
Agriculture can occasionally be a leading sector in
economic growth, either on the basis of a spurt in
agricultural productivity or on the basis of cash-crop
exports. In the case of Haryana, agricultural productivity
led growth occurred in one major historical period, the
Green Revolution, dated from 1965-66 to the early 1980s.
The green revolution was centered on short stemmed,
high yield wheat, and to a lesser extent paddy rice, with
both crops depending on irrigation and intensive
application of fertiliser. Haryana, alongwith Punjab, was
the epicentre of the green revolution in India.
The agricultural sector in the State has a direct
bearing on over all growth, income levels and well
being of the people. Changes in agricultural
productivity overtime in the State is good index of the
progress made in this vital sector by the State, and the
consequent fall out on the State’s economy. Haryana
recorded very high rate of growth in land yield/
agricultural productivity. The trend in increase in
agricultural productivity of the State corresponds fairly
closely to the trend of rapid decrease in population
below the poverty line of the State.
TABLE 1.122
Ranking of Districts based on Composite Index ofSocio-Economic Development
Rank in Rank in District Value of theIndia Haryana Composite Index
26 1 Ambala 0.79303
60 2 Panchkula 0.74723
70 3 Kurukshetra 0.74217
129 4 Yamunanagar 0.69142
131 5 Rohtak 0.68889
155 6 Karnal 0.66584
176 7 Jhajjar 0.64561
179 8 Rewari 0.64302
183 9 Panipat 0.63930
184 10 Hisar 0.63832
207 11 Sonipat 0.61799
210 12 Fatehabad 0.61657
216 13 Sirsa 0.61282
218 14 Faridabad 0.60967
245 15 Bhiwani 0.58635
263 16 Jind 0.57337
271 17 Mahendragarh 0.56588
279 18 Kaithal 0.55860
367 19 Gurgaon 0.48243
Source: Compiled from Ram and Shekhar (2006).
HARYANA DEVELOPMENT REPORT130
The high rate of economic growth in the State has
been accompanied by a reduction in poverty. There has
been an appreciable decline in the percentage of
population below the poverty line from over 35 per cent
in the 1970s to less than 9 per cent in the late 1990s.
An encouraging trend that emerged between 1993-94
and 1999-2000 in the State is that rural poverty
decreased much faster than urban poverty. There have
been improvements in the social indicators as well. The
literacy rate has increased from almost 26 per cent in
1971 to about 68 per cent in 2001. According to the
Human Development Report of the Planning
Commission, Haryana has been moving up steadily in
the national comparative ranking of human development
from 16th rank in 1991 to 5th rank in 2001.
At the time of formation of the State in 1966,
Haryana had only 162 large and medium units and
about 5000 small scale industries. Now in 2005-06 the
large and medium industries have grown to 1260 and
the small scale industries are about 80,000. The export
which was only Rs.4.5 crores in 1966 has crossed
Rs.20,000 crores in 2004-05.
The State of Haryana has been able to attract sizeable
investment from multinational companies, large business
houses, foreign investors, non-residents Indian and small
scale entrepreneurs. Haryana is an investor friendly State
and offers a rich reservoir of skilled, motivated and
relatively low cost manpower with a good infrastructure
and harmonious industrial relations.
Haryana currently produces 75 per cent of passenger
cars, 60 per cent of tractors, 70 per cent of motor cycles
and 50 per cent of refrigerators manufactured in the
country. About 25 per cent of India’s total production of
sanitary ware is from Haryana. One out of every four
bicycles in the country is manufactured here. The number
of large and medium units in the State has increased from
162 in 1966 to 1260 in 2005 with a capital investment of
Rs.220 billion while employing 2 lakhs persons and
producing goods worth Rs.12800 crores.
Infrastructure investment influences agricultural
productivity, non-agricultural productivity and non-
agricultural employment. These, in turn, impact upon
rural economic growth and wages and employment of
the poor, thereby affecting their real income or
consumption levels. Haryana has developed an excellent
infrastructure.
The relationship between education and measures of
well being is born out by theory and history. Labour is
essentially the only source of income for the poor.
Hence, increasing the productivity of labour through
education provides sustainable means of poverty
reduction. Recognizing this fact, Haryana has made
significant expansion in education sector.
A reduction of gender inequality in access to
resources and opportunities leads to an increase in the
rate of economic growth, which, in turn, is poverty
reducing. This is because greater gender equality enables
women to take up income earning opportunities, and
participate in the growth process. Gender disparities are
very closely associated with poverty levels. For example,
improving women’s access to education or land in rural
areas is likely to lead a significant increase in
agricultural productivity. In addition, lower gender
disparities increase women’s power to allocate family
resources. This benefits children’s health and education,
inducing a reduction in inter-generational poverty.
Furthermore, gender equality in access to education
helps to reduce infant mortality and fertility. Significant
steps have been taken in this direction in Haryana and
its women are much more empowered now than in the
1960s or 1970s. But the declining sex ratio in the State
is of particular concern.
The infant mortality rate (IMR) is considered to be a
sensitive indicator of not only the health status of the
population but also the level of human development in
the context of education, economic conditions, nutrition
etcetera. Poverty, malnutrition, a decline in breast
feeding and inadequacy or lack or sanitation are all
associated with high infant mortality. High infant
mortality and high fertility are related concepts. Haryana
has registered declining infant mortality rates over the
period 1971-2001. But there is cause for concern over
the higher IMR for females than males in Haryana.
Life expectancy at birth or longevity is an overall
indicator of the economic and social well being of the
people. As a society advances, the life expectancy of its
people also increases. Haryana is one of the top four states,
after Kerala, Punjab and Maharashtra, in this regard.
Balanced regional development of different parts of the
state, extension of the benefits of economic progress to
the less developed regions and widespread diffusion of
industries are among the major aims of planned
development. Successive Five Year Plans seek to realise
these aims in larger measure. Expansion of the economy
and more rapid growth increase progressively the capacity
to achieve a better balance between state and regional
development. In striving for such a balance, certain
inherent difficulties have to be met. Sometimes the sense
of lagging behind in development may be due to
inadequate or tardy development of specific fields such as
agriculture, irrigation, power, industry, employment,
education, etc. This is the case with the State of
Haryana also where there are regions which are less
developed than others.
But still there is much more growth potential in
Haryana than has been achieved to date.
2.0 Analysis of Status and Prospectsof Natural Resources
Natural resource constitutes the base on which
development takes place particularly at the initial stage. It
is almost impossible to imagine any worthwhile
development process to begin and pick-up without the
availability of some natural resource. Of course,
technological advancement plays a crucial role in
translating the potential of any natural resource,
particularly renewable resource, into development, and
more significantly, sustainable development.
The success of development programmes depends,
among so many things, on a correct knowledge and
assessment of natural resources as well as the extent to
which these can be exploited. This facilitates the setting of
realistic targets. As technological advancement occurs,
over time, new resource possibilities emerge and the
prospects signalled by these resources increase. Thus, a
review of resource endowment and its potential, from
time to time, assumes significance in a fast changing
knowledge scenario.
2.1 Natural Resources
The climate of the State is sub-tropical, semi-arid,
continental and monsoonal and is characterised by four
seasons namely dry hot summer season from March to
June, rainy season from July to September, moderately
warm post-monsoon season from October to mid
November and cold season from mid November to
February.
The State receives an average rainfall of about 650
mm. The average annual rainfall varies from less than 300
mm in the western and south western parts of Sirsa, Hisar
and Bhiwani districts along the Rajasthan border to over
1000 mm in the north-eastern Shiwalik hilly tracts of
Panchkula and Yamunanagar districts along the Himachal
Pradesh border. Of the total annual rainfall 73 per cent to
79 per cent comes in summer monsoon season (July to
September), 4 to 9 per cent in June and during March to
May, 2 to 3 per cent in October to November, and 7 to 9
per cent during winter months of December to February.
The receipt of rainfall is highly uncertain in time and
space as the coefficient of variation even in the monthly
rainfall for the monsoon months of July to August is
about 50 per cent.
Average temperature in the State increases from south-
west to north-east. The summer months are very hot with
maximum temperature ranging from 40o to 45o C in May
and June. Winter months are fairly cool. There are some-
times freezing temperatures during the nights of
December and January. The daily and seasonal ranges of
temperature are high. Occasionally frost occurs in the
months of December to February. The mean monthly
temprature is 20o C in eight months in a year from less
than 15o C in January. It normally rises to 34.5o C in June
in the SW and above 33o C in NE. Hisar and adjoining
areas are the hottest in summer and the coldest in the
winter season.
Owing to high temperature in the State the relative
humidity remains low from March to June (41-58 per
cent), high during July to September (73 per cent to 84
per cent) and medium from October to March (61 to 83
per cent). The State experiences gusty winds, dust storms
and thunderstorms during March to June. The wind
velocity recorded at Ambala and Hisar shows that from
October to September, it is higher (6.7 to 10.6 km/h)
around Hisar than around Ambala (6.1 to 7.1 km/hr) but
during post-monsoon and winter season it is lower at
Hisar than at Ambala.
Haryana is an agrarian State wherein about 85 per cent
of its area is under cultivation, engaging about 78 per cent
Chapter 2
Resource Assessment
HAR
YANA
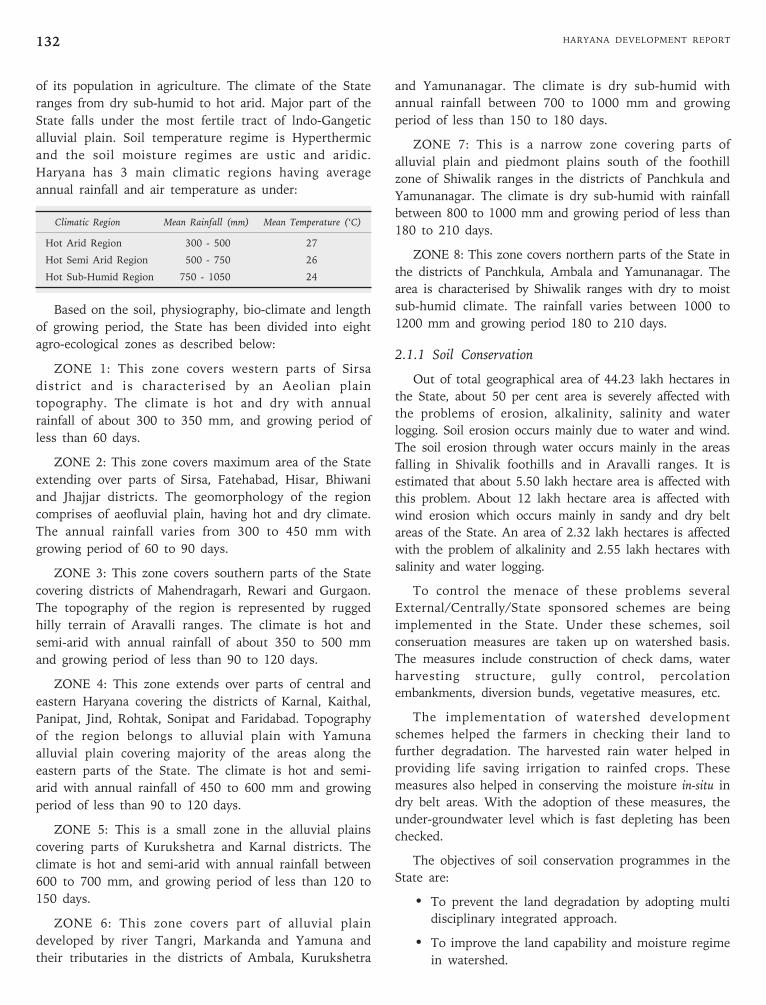
HARYANA DEVELOPMENT REPORT132
of its population in agriculture. The climate of the State
ranges from dry sub-humid to hot arid. Major part of the
State falls under the most fertile tract of lndo-Gangetic
alluvial plain. Soil temperature regime is Hyperthermic
and the soil moisture regimes are ustic and aridic.
Haryana has 3 main climatic regions having average
annual rainfall and air temperature as under:
Climatic Region Mean Rainfall (mm) Mean Temperature (‘C)
Hot Arid Region 300 - 500 27
Hot Semi Arid Region 500 - 750 26
Hot Sub-Humid Region 750 - 1050 24
Based on the soil, physiography, bio-climate and length
of growing period, the State has been divided into eight
agro-ecological zones as described below:
ZONE 1: This zone covers western parts of Sirsa
district and is characterised by an Aeolian plain
topography. The climate is hot and dry with annual
rainfall of about 300 to 350 mm, and growing period of
less than 60 days.
ZONE 2: This zone covers maximum area of the State
extending over parts of Sirsa, Fatehabad, Hisar, Bhiwani
and Jhajjar districts. The geomorphology of the region
comprises of aeofluvial plain, having hot and dry climate.
The annual rainfall varies from 300 to 450 mm with
growing period of 60 to 90 days.
ZONE 3: This zone covers southern parts of the State
covering districts of Mahendragarh, Rewari and Gurgaon.
The topography of the region is represented by rugged
hilly terrain of Aravalli ranges. The climate is hot and
semi-arid with annual rainfall of about 350 to 500 mm
and growing period of less than 90 to 120 days.
ZONE 4: This zone extends over parts of central and
eastern Haryana covering the districts of Karnal, Kaithal,
Panipat, Jind, Rohtak, Sonipat and Faridabad. Topography
of the region belongs to alluvial plain with Yamuna
alluvial plain covering majority of the areas along the
eastern parts of the State. The climate is hot and semi-
arid with annual rainfall of 450 to 600 mm and growing
period of less than 90 to 120 days.
ZONE 5: This is a small zone in the alluvial plains
covering parts of Kurukshetra and Karnal districts. The
climate is hot and semi-arid with annual rainfall between
600 to 700 mm, and growing period of less than 120 to
150 days.
ZONE 6: This zone covers part of alluvial plain
developed by river Tangri, Markanda and Yamuna and
their tributaries in the districts of Ambala, Kurukshetra
and Yamunanagar. The climate is dry sub-humid with
annual rainfall between 700 to 1000 mm and growing
period of less than 150 to 180 days.
ZONE 7: This is a narrow zone covering parts of
alluvial plain and piedmont plains south of the foothill
zone of Shiwalik ranges in the districts of Panchkula and
Yamunanagar. The climate is dry sub-humid with rainfall
between 800 to 1000 mm and growing period of less than
180 to 210 days.
ZONE 8: This zone covers northern parts of the State in
the districts of Panchkula, Ambala and Yamunanagar. The
area is characterised by Shiwalik ranges with dry to moist
sub-humid climate. The rainfall varies between 1000 to
1200 mm and growing period 180 to 210 days.
2.1.1 Soil Conservation
Out of total geographical area of 44.23 lakh hectares in
the State, about 50 per cent area is severely affected with
the problems of erosion, alkalinity, salinity and water
logging. Soil erosion occurs mainly due to water and wind.
The soil erosion through water occurs mainly in the areas
falling in Shivalik foothills and in Aravalli ranges. It is
estimated that about 5.50 lakh hectare area is affected with
this problem. About 12 lakh hectare area is affected with
wind erosion which occurs mainly in sandy and dry belt
areas of the State. An area of 2.32 lakh hectares is affected
with the problem of alkalinity and 2.55 lakh hectares with
salinity and water logging.
To control the menace of these problems several
External/Centrally/State sponsored schemes are being
implemented in the State. Under these schemes, soil
conseruation measures are taken up on watershed basis.
The measures include construction of check dams, water
harvesting structure, gully control, percolation
embankments, diversion bunds, vegetative measures, etc.
The implementation of watershed development
schemes helped the farmers in checking their land to
further degradation. The harvested rain water helped in
providing life saving irrigation to rainfed crops. These
measures also helped in conserving the moisture in-situ in
dry belt areas. With the adoption of these measures, the
under-groundwater level which is fast depleting has been
checked.
The objectives of soil conservation programmes in the
State are:
• To prevent the land degradation by adopting multi
disciplinary integrated approach.
• To improve the land capability and moisture regime
in watershed.
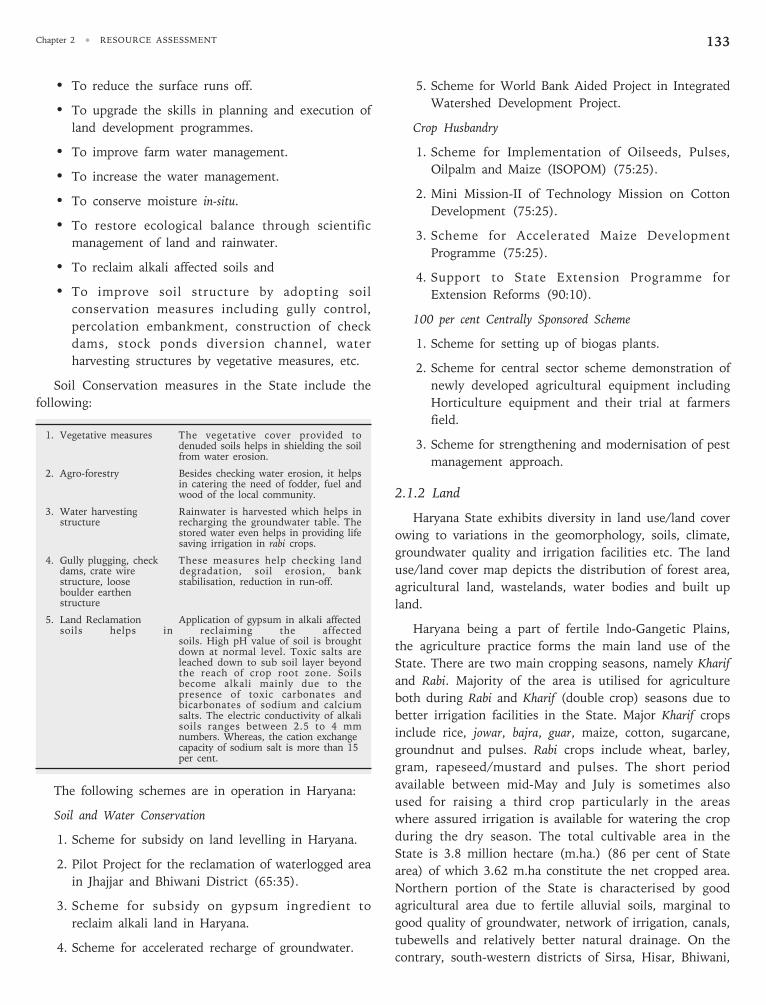
Chapter 2 • RESOURCE ASSESSMENT 133
• To reduce the surface runs off.
• To upgrade the skills in planning and execution of
land development programmes.
• To improve farm water management.
• To increase the water management.
• To conserve moisture in-situ.
• To restore ecological balance through scientific
management of land and rainwater.
• To reclaim alkali affected soils and
• To improve soil structure by adopting soil
conservation measures including gully control,
percolation embankment, construction of check
dams, stock ponds diversion channel, water
harvesting structures by vegetative measures, etc.
Soil Conservation measures in the State include the
following:
1. Vegetative measures The vegetative cover provided todenuded soils helps in shielding the soilfrom water erosion.
2. Agro-forestry Besides checking water erosion, it helpsin catering the need of fodder, fuel andwood of the local community.
3. Water harvesting Rainwater is harvested which helps instructure recharging the groundwater table. The
stored water even helps in providing lifesaving irrigation in rabi crops.
4. Gully plugging, check These measures help checking landdams, crate wire degradation, soil erosion, bankstructure, loose stabilisation, reduction in run-off.boulder earthenstructure
5. Land Reclamation Application of gypsum in alkali affectedsoils helps in reclaiming the affected
soils. High pH value of soil is broughtdown at normal level. Toxic salts areleached down to sub soil layer beyondthe reach of crop root zone. Soilsbecome alkali mainly due to thepresence of toxic carbonates andbicarbonates of sodium and calciumsalts. The electric conductivity of alkalisoils ranges between 2.5 to 4 mmnumbers. Whereas, the cation exchangecapacity of sodium salt is more than 15per cent.
The following schemes are in operation in Haryana:
Soil and Water Conservation
1. Scheme for subsidy on land levelling in Haryana.
2. Pilot Project for the reclamation of waterlogged area
in Jhajjar and Bhiwani District (65:35).
3. Scheme for subsidy on gypsum ingredient to
reclaim alkali land in Haryana.
4. Scheme for accelerated recharge of groundwater.
5. Scheme for World Bank Aided Project in Integrated
Watershed Development Project.
Crop Husbandry
1. Scheme for Implementation of Oilseeds, Pulses,
Oilpalm and Maize (ISOPOM) (75:25).
2. Mini Mission-II of Technology Mission on Cotton
Development (75:25).
3. Scheme for Accelerated Maize Development
Programme (75:25).
4. Support to State Extension Programme for
Extension Reforms (90:10).
100 per cent Centrally Sponsored Scheme
1. Scheme for setting up of biogas plants.
2. Scheme for central sector scheme demonstration of
newly developed agricultural equipment including
Horticulture equipment and their trial at farmers
field.
3. Scheme for strengthening and modernisation of pest
management approach.
2.1.2 Land
Haryana State exhibits diversity in land use/land cover
owing to variations in the geomorphology, soils, climate,
groundwater quality and irrigation facilities etc. The land
use/land cover map depicts the distribution of forest area,
agricultural land, wastelands, water bodies and built up
land.
Haryana being a part of fertile lndo-Gangetic Plains,
the agriculture practice forms the main land use of the
State. There are two main cropping seasons, namely Kharif
and Rabi. Majority of the area is utilised for agriculture
both during Rabi and Kharif (double crop) seasons due to
better irrigation facilities in the State. Major Kharif crops
include rice, jowar, bajra, guar, maize, cotton, sugarcane,
groundnut and pulses. Rabi crops include wheat, barley,
gram, rapeseed/mustard and pulses. The short period
available between mid-May and July is sometimes also
used for raising a third crop particularly in the areas
where assured irrigation is available for watering the crop
during the dry season. The total cultivable area in the
State is 3.8 million hectare (m.ha.) (86 per cent of State
area) of which 3.62 m.ha constitute the net cropped area.
Northern portion of the State is characterised by good
agricultural area due to fertile alluvial soils, marginal to
good quality of groundwater, network of irrigation, canals,
tubewells and relatively better natural drainage. On the
contrary, south-western districts of Sirsa, Hisar, Bhiwani,
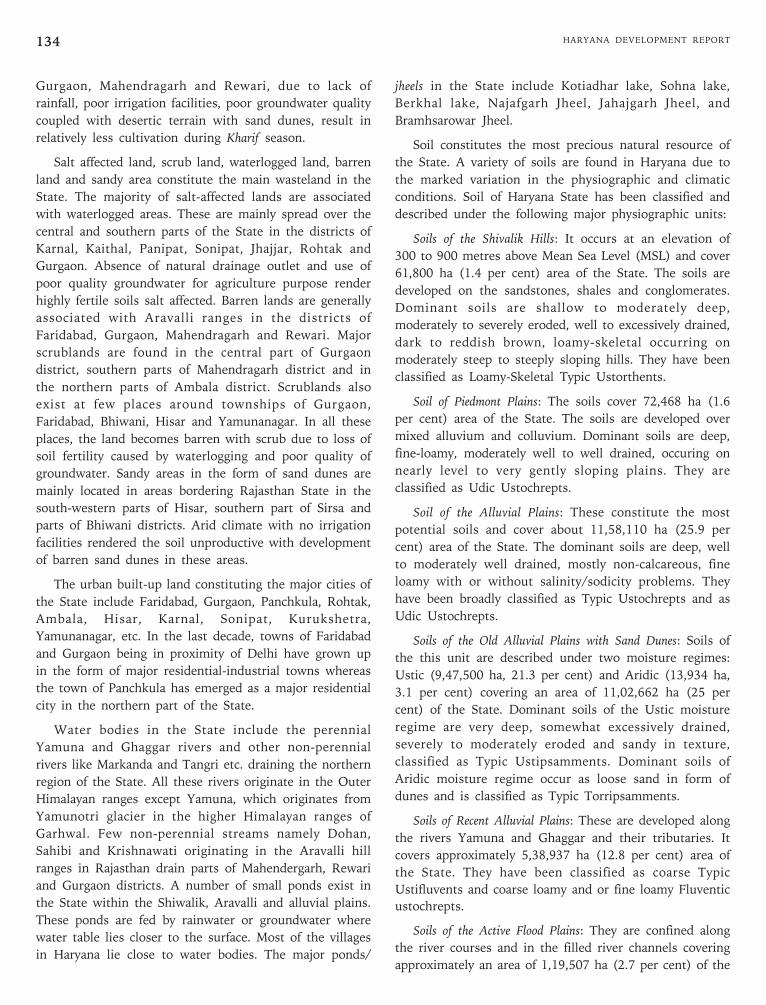
HARYANA DEVELOPMENT REPORT134
Gurgaon, Mahendragarh and Rewari, due to lack of
rainfall, poor irrigation facilities, poor groundwater quality
coupled with desertic terrain with sand dunes, result in
relatively less cultivation during Kharif season.
Salt affected land, scrub land, waterlogged land, barren
land and sandy area constitute the main wasteland in the
State. The majority of salt-affected lands are associated
with waterlogged areas. These are mainly spread over the
central and southern parts of the State in the districts of
Karnal, Kaithal, Panipat, Sonipat, Jhajjar, Rohtak and
Gurgaon. Absence of natural drainage outlet and use of
poor quality groundwater for agriculture purpose render
highly fertile soils salt affected. Barren lands are generally
associated with Aravalli ranges in the districts of
Faridabad, Gurgaon, Mahendragarh and Rewari. Major
scrublands are found in the central part of Gurgaon
district, southern parts of Mahendragarh district and in
the northern parts of Ambala district. Scrublands also
exist at few places around townships of Gurgaon,
Faridabad, Bhiwani, Hisar and Yamunanagar. In all these
places, the land becomes barren with scrub due to loss of
soil fertility caused by waterlogging and poor quality of
groundwater. Sandy areas in the form of sand dunes are
mainly located in areas bordering Rajasthan State in the
south-western parts of Hisar, southern part of Sirsa and
parts of Bhiwani districts. Arid climate with no irrigation
facilities rendered the soil unproductive with development
of barren sand dunes in these areas.
The urban built-up land constituting the major cities of
the State include Faridabad, Gurgaon, Panchkula, Rohtak,
Ambala, Hisar, Karnal, Sonipat, Kurukshetra,
Yamunanagar, etc. In the last decade, towns of Faridabad
and Gurgaon being in proximity of Delhi have grown up
in the form of major residential-industrial towns whereas
the town of Panchkula has emerged as a major residential
city in the northern part of the State.
Water bodies in the State include the perennial
Yamuna and Ghaggar rivers and other non-perennial
rivers like Markanda and Tangri etc. draining the northern
region of the State. All these rivers originate in the Outer
Himalayan ranges except Yamuna, which originates from
Yamunotri glacier in the higher Himalayan ranges of
Garhwal. Few non-perennial streams namely Dohan,
Sahibi and Krishnawati originating in the Aravalli hill
ranges in Rajasthan drain parts of Mahendergarh, Rewari
and Gurgaon districts. A number of small ponds exist in
the State within the Shiwalik, Aravalli and alluvial plains.
These ponds are fed by rainwater or groundwater where
water table lies closer to the surface. Most of the villages
in Haryana lie close to water bodies. The major ponds/
jheels in the State include Kotiadhar lake, Sohna lake,
Berkhal lake, Najafgarh Jheel, Jahajgarh Jheel, and
Bramhsarowar Jheel.
Soil constitutes the most precious natural resource of
the State. A variety of soils are found in Haryana due to
the marked variation in the physiographic and climatic
conditions. Soil of Haryana State has been classified and
described under the following major physiographic units:
Soils of the Shivalik Hills: It occurs at an elevation of
300 to 900 metres above Mean Sea Level (MSL) and cover
61,800 ha (1.4 per cent) area of the State. The soils are
developed on the sandstones, shales and conglomerates.
Dominant soils are shallow to moderately deep,
moderately to severely eroded, well to excessively drained,
dark to reddish brown, loamy-skeletal occurring on
moderately steep to steeply sloping hills. They have been
classified as Loamy-Skeletal Typic Ustorthents.
Soil of Piedmont Plains: The soils cover 72,468 ha (1.6
per cent) area of the State. The soils are developed over
mixed alluvium and colluvium. Dominant soils are deep,
fine-loamy, moderately well to well drained, occuring on
nearly level to very gently sloping plains. They are
classified as Udic Ustochrepts.
Soil of the Alluvial Plains: These constitute the most
potential soils and cover about 11,58,110 ha (25.9 per
cent) area of the State. The dominant soils are deep, well
to moderately well drained, mostly non-calcareous, fine
loamy with or without salinity/sodicity problems. They
have been broadly classified as Typic Ustochrepts and as
Udic Ustochrepts.
Soils of the Old Alluvial Plains with Sand Dunes: Soils of
the this unit are described under two moisture regimes:
Ustic (9,47,500 ha, 21.3 per cent) and Aridic (13,934 ha,
3.1 per cent) covering an area of 11,02,662 ha (25 per
cent) of the State. Dominant soils of the Ustic moisture
regime are very deep, somewhat excessively drained,
severely to moderately eroded and sandy in texture,
classified as Typic Ustipsamments. Dominant soils of
Aridic moisture regime occur as loose sand in form of
dunes and is classified as Typic Torripsamments.
Soils of Recent Alluvial Plains: These are developed along
the rivers Yamuna and Ghaggar and their tributaries. It
covers approximately 5,38,937 ha (12.8 per cent) area of
the State. They have been classified as coarse Typic
Ustifluvents and coarse loamy and or fine loamy Fluventic
ustochrepts.
Soils of the Active Flood Plains: They are confined along
the river courses and in the filled river channels covering
approximately an area of 1,19,507 ha (2.7 per cent) of the
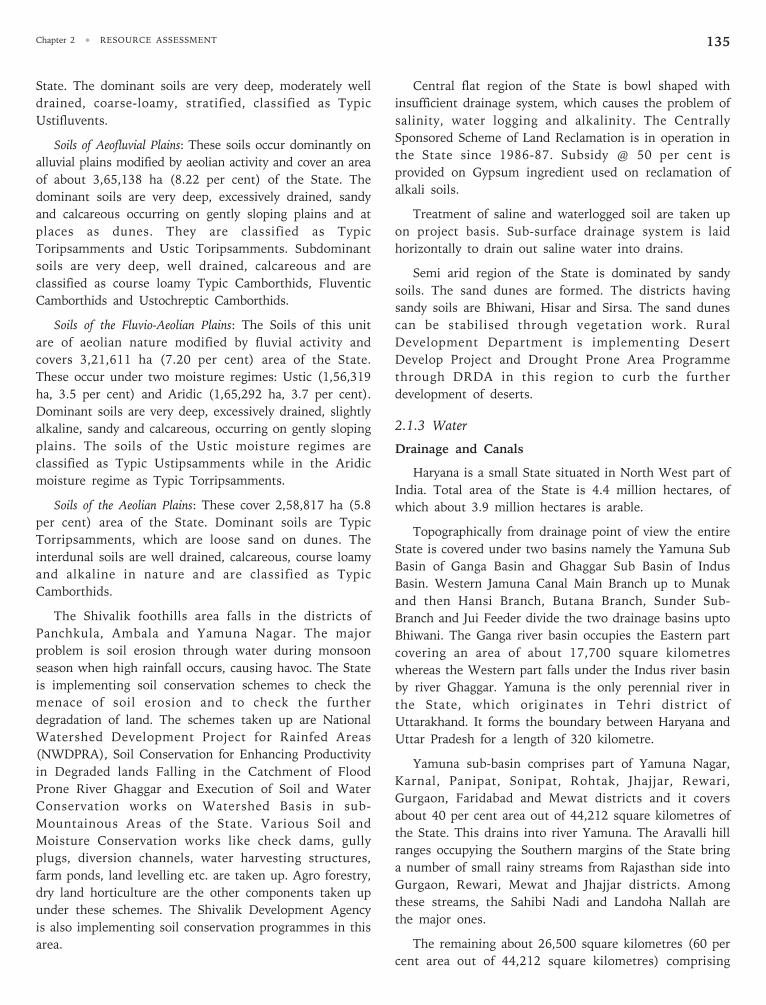
Chapter 2 • RESOURCE ASSESSMENT 135
State. The dominant soils are very deep, moderately well
drained, coarse-loamy, stratified, classified as Typic
Ustifluvents.
Soils of Aeofluvial Plains: These soils occur dominantly on
alluvial plains modified by aeolian activity and cover an area
of about 3,65,138 ha (8.22 per cent) of the State. The
dominant soils are very deep, excessively drained, sandy
and calcareous occurring on gently sloping plains and at
places as dunes. They are classified as Typic
Toripsamments and Ustic Toripsamments. Subdominant
soils are very deep, well drained, calcareous and are
classified as course loamy Typic Camborthids, Fluventic
Camborthids and Ustochreptic Camborthids.
Soils of the Fluvio-Aeolian Plains: The Soils of this unit
are of aeolian nature modified by fluvial activity and
covers 3,21,611 ha (7.20 per cent) area of the State.
These occur under two moisture regimes: Ustic (1,56,319
ha, 3.5 per cent) and Aridic (1,65,292 ha, 3.7 per cent).
Dominant soils are very deep, excessively drained, slightly
alkaline, sandy and calcareous, occurring on gently sloping
plains. The soils of the Ustic moisture regimes are
classified as Typic Ustipsamments while in the Aridic
moisture regime as Typic Torripsamments.
Soils of the Aeolian Plains: These cover 2,58,817 ha (5.8
per cent) area of the State. Dominant soils are Typic
Torripsamments, which are loose sand on dunes. The
interdunal soils are well drained, calcareous, course loamy
and alkaline in nature and are classified as Typic
Camborthids.
The Shivalik foothills area falls in the districts of
Panchkula, Ambala and Yamuna Nagar. The major
problem is soil erosion through water during monsoon
season when high rainfall occurs, causing havoc. The State
is implementing soil conservation schemes to check the
menace of soil erosion and to check the further
degradation of land. The schemes taken up are National
Watershed Development Project for Rainfed Areas
(NWDPRA), Soil Conservation for Enhancing Productivity
in Degraded lands Falling in the Catchment of Flood
Prone River Ghaggar and Execution of Soil and Water
Conservation works on Watershed Basis in sub-
Mountainous Areas of the State. Various Soil and
Moisture Conservation works like check dams, gully
plugs, diversion channels, water harvesting structures,
farm ponds, land levelling etc. are taken up. Agro forestry,
dry land horticulture are the other components taken up
under these schemes. The Shivalik Development Agency
is also implementing soil conservation programmes in this
area.
Central flat region of the State is bowl shaped with
insufficient drainage system, which causes the problem of
salinity, water logging and alkalinity. The Centrally
Sponsored Scheme of Land Reclamation is in operation in
the State since 1986-87. Subsidy @ 50 per cent is
provided on Gypsum ingredient used on reclamation of
alkali soils.
Treatment of saline and waterlogged soil are taken up
on project basis. Sub-surface drainage system is laid
horizontally to drain out saline water into drains.
Semi arid region of the State is dominated by sandy
soils. The sand dunes are formed. The districts having
sandy soils are Bhiwani, Hisar and Sirsa. The sand dunes
can be stabilised through vegetation work. Rural
Development Department is implementing Desert
Develop Project and Drought Prone Area Programme
through DRDA in this region to curb the further
development of deserts.
2.1.3 Water
Drainage and Canals
Haryana is a small State situated in North West part of
India. Total area of the State is 4.4 million hectares, of
which about 3.9 million hectares is arable.
Topographically from drainage point of view the entire
State is covered under two basins namely the Yamuna Sub
Basin of Ganga Basin and Ghaggar Sub Basin of Indus
Basin. Western Jamuna Canal Main Branch up to Munak
and then Hansi Branch, Butana Branch, Sunder Sub-
Branch and Jui Feeder divide the two drainage basins upto
Bhiwani. The Ganga river basin occupies the Eastern part
covering an area of about 17,700 square kilometres
whereas the Western part falls under the Indus river basin
by river Ghaggar. Yamuna is the only perennial river in
the State, which originates in Tehri district of
Uttarakhand. It forms the boundary between Haryana and
Uttar Pradesh for a length of 320 kilometre.
Yamuna sub-basin comprises part of Yamuna Nagar,
Karnal, Panipat, Sonipat, Rohtak, Jhajjar, Rewari,
Gurgaon, Faridabad and Mewat districts and it covers
about 40 per cent area out of 44,212 square kilometres of
the State. This drains into river Yamuna. The Aravalli hill
ranges occupying the Southern margins of the State bring
a number of small rainy streams from Rajasthan side into
Gurgaon, Rewari, Mewat and Jhajjar districts. Among
these streams, the Sahibi Nadi and Landoha Nallah are
the major ones.
The remaining about 26,500 square kilometres (60 per
cent area out of 44,212 square kilometres) comprising
HARYANA DEVELOPMENT REPORT136
Panchkula, Ambala, part of Yamuna Nagar, Kurukshetra,
Kaithal, Jind, Mohindergarh, Bhiwani, Hisar, Fatehabad
and Sirsa districts has country slope toward river Ghaggar
and is known as Ghaggar Sub Basin.
The river Ghaggar originates from the slopes of
Himalayas in Sirmour district (H.P.) and enters Haryana
near Pinjore in Panchkula district from the foothills of
Shivalik and flows in North East direction through
Haryana, Punjab and then to Rajasthan. Ghaggar river is
perennial in the upper reaches and become ephemeral
downstream. The important tributaries of Ghaggar river
are river Tangri, Saraswati, Markanada which join Ghaggar
river in Kaithal district.
Large number of drains with a length of about 4670
kilometres has been constructed to drain the excessive
rain water to the main rivers. In the State a number of
small ponds or lakes exists of which Ottu Lake, Bibipur
Lake, Bhindawas/Jahazgarh Lake, Badkhal Lake, Surajkund
Lake, Kotla Lake, Damdama Lake, etc. are the most
important.
Initially the drain of the central flat area of Kaithal,
Jind, Hisar, Bhiwani and Rohtak districts were made to
outfall in the nearby canals but now gravity drainage
system is being developed.
Canals are the most popular and important source of
irrigation in Haryana due to easy supply and regular flow of
water to the agriculture fields. In Haryana State, about 85
per cent of the net area sown is irrigated, out of which
about 48 per cent is irrigated by canals and about 51 per
cent by tube wells. Haryana State has a dense network of
gravity and lift canal systems. The cumulative length of
canals is about 12,980 kilometres, which includes 2,405
kilometres of main canals and branches, 10,575 kilometres
of distributaries and minors. The canals network is dense
in most of the districts except in the districts of
Mahindergarh, Rewari and Gurgaon where Lift canal
system is at development stage.
Major Canal System in Haryana
Sr. Canal (River) Length Capacity of TypeNo (Kms) Canal (cumecs)
1. Western Yamuna 5680 448 Gravity
2. Bhakra and Ghaggar 4850 213 Gravity
3. Agra/Gurgaon 476 55 Gravity
4. Siwani 705 12 Lift
5. Jui 225 9.5 Lift
6. Loharu 694 39.4 Lift
7. Jawahar Lal Nehru 205 90.6 Lift
8. Naggal 49 0.38 Lift
Source: Engineer-in-Chief, Irrigation Department, Haryana.
There are four irrigation systems in the State, namely,
Western Yamuna Canal, Bhakra Canal, Agra Canal and
Ghaggar Canal. The Bhakra and Western Yamuna Canal
system are interlinked and it is difficult to separate their
command areas. All the districts except Gurgaon and
Panchkula fall under their commands. The Bhakra
Irrigation System (which receives water from Gobind
Sagar Reservoir) and the Western Yamuna Canal system
irrigate the major part of the State. Western Yamuna
Canal relies on the water availability in the Yamuna river
because no dam has been built on the river in the
recharge area to tap the water for canal feeding. Both the
systems have been joined to cater to the needs of each
other. With the help of these canals water to lift irrigation
schemes are made available for the purpose of irrigation.
The districts of Faridabad and Mewat fall under Agra
Canal Command. Sirsa district is under the command of
both Bhakra and Ghaggar canal systems. The topography
of the State is such that the districts of Gurgaon,
Mahendergarh, Rewari, and part of Bhiwani and part of
Jhajjar cannot be brought under gravity canal commands.
To overcome this difficulty, Lift canal system with a total
length of 1665 kilometres has been developed. The total
commandable area from all the canals is 3.9 M ha. The
draught affected South-Western parts of the State
occupied by sand dunes and Aravalli hills, and not
suitable for gravity flow irrigation, are provided with lift
irrigation system namely the Jui, Indira Gandhi, Jawaharlal
Lal Nehru, Birendra Narayan Chakaravarti, Sahlawas and
Jhajjar Lift Canals.
Hydrogeomorphology
Hydrogeomorphology is the study of the subsurface
hydrological characteristics of a region based on its
geological and geomorphological aspects. The entire State
has been divided into 10 geomorphic units based on
landforms, relief, geomorphic processes, lithology,
structure and surface and subsurface water bearing
characteristics. A brief description of each unit is given
here.
Flood Plains: Lying adjacent to a river channel, it is
characterised by flat and gently sloping unconsolidated
fluvial deposits like gravel, sand, silt and clay. The zone is
well recharged and forms excellent aquifers with good
quality.
Alluvial Plain: Major part of the State is covered by
extensive alluvial plain, which is a part of Indo-Gangetic
plain. These are level or gently undulating plains
consisting of clay, silt, fine to coarse sand and gravel.
These form good groundwater aquifers with good quality.
Chapter 2 • RESOURCE ASSESSMENT 137
Alluvial Plain Saline: The occurrence of saline soils
induces the salinity in the associated groundwater. The
zones of saline soils are found within the alluvial plain
covering parts of Karnal, Panipat, Sonipat and Kaithal, etc.
Groundwater is available in these plains but is not
potable.
Aeolian Plain: It is undulating terrain comprising mainly
low to moderately high dunes. The dunal sand is very fine
to fine-grained whereas the aquifer material is coarse
sand. The groundwater prospects in the aeolian plains are
poor to moderate and the water is generally saline. The
deeper aquifers yield more than the shallow aquifers and
may provide good quality water.
Alluvial Plain with Stable Sand Dunes: Good prospects
(may be of poor quality) of groundwater exist in this unit.
Inter-dunal areas are suited best for locating aquifers in
the alluvial plains.
Sand Dunes: Sand dunes are made up of coarse to very
fine-grained sand and covered by small thorny bushes.
Mostly dunes are continuous and separated by interdunal
depression and at times by inter-dunal flats. Only the
inter-dunal areas are likely to yield moderate quantity of
water.
Piedmont Zone: This is gently sloping plain, about 5 to
20 km. wide, occurring between the Shiwalik hill ranges
and the alluvial plains. It is developed due to the
deposition of boulders, pebbles, gravels, sand and silt
brought by the streams, while they enter into alluvial
plains from the hills. High permeability of the zone
coupled with gentle slopes results in downslope
movement of water. Hence this zone gives poor to
moderate prospects of groundwater with fresh water
quality.
Intermontane Valley: Because of its location between the
two hill ranges, the valley receives water input from both
sides. The material of intermontane valley consists of
colluvial and alluvial deposits like bolders, gravels, sand
and silt which renders high permeability to this zone and
hence good to excellent water prospects with good quality
exist in this zone.
Structural HiIls: These include hill ranges, showing steep
slopes and consist of massive, hard rocks which exhibit
structural controls in the form of joints, fractures, cleavage,
faults and folds etc. They form areas of high runoff and poor
percolation. Groundwater potential of this unit is therefore
poor. Highly jointed rocks may form local pockets of good
groundwater aquifers.
Denudational Hills: These are characterised by
moderately steep slopes, exhibiting less structural control
and rock hardness as compared to structural hills. High
runoff and poor percolation make them poor water
potential zones.
Residual Hills: These are steep sided, small, isolated,
remnant hills projecting out of alluvial plain. They form
areas of high runoff and hence groundwater potential are
negligible.
Pediment: This unit is generally found fringing the
Aravalli hills and is developed due to the erosion of the
associated hills. The material consists of colluvial deposits
made up of medium to fine grained sand, silt and rock
debris. The thickness of the zone decreases away from the
ridge. These form moderate to good, shallow aquifers of
good quality, particularly close to the hard rock.
Abandoned Channels: These include the older river
channels which have been left by the river due to the
process of lateral shifting in due course of time. These
consist of unconsolidated fluvial deposits, mainly gravel,
sand, silt and clay particles of varying lithology. The high
permeability and good water retention capability make
these units excellent water potential zones with good
quality.
Lineaments: Lineaments may be faults, fractures, joints,
etc. These generally represent the zones of secondary
porosity and permeability in hard rock terrain and
facilitate occurrence and movement of groundwater.
Generally, the zone along major lineaments and lineament
intersections is found to be good groundwater potential
zone.
In addition to the aforementioned 10 geomorphological
units there are some artificial hydrogeomorphological
characteristics developed in some parts of the State such as
fresh water storage channels along unlined/lined canals
with small lateral extent in Alluvial Plain Saline, this thin
layer of percolated canal water flooding on saline water
having low to medium potential of potable water up to low
depth.
Artificially constructed dams/bunds on the natural
channels reduce the potential of groundwater in
Abandoned Channels; make these units of poor potential
of good quality such as on Krishnawati and Dohan river
channels.
Groundwater Quality
Groundwater quality map depicts the geographic extent
of the groundwater quality zones with respect to their
quality. The State has been divided into three quality
zones based on the Electrical Conductivity (EC) value of
the groundwater as: Fresh with EC Value < 2000 μ
HARYANA DEVELOPMENT REPORT138
mhos/cm, Marginal with 2000-6000 μ mhos/cm and
Saline with 6000 μ mhos/cm and six combination of
zones based on the occurrence of quality zone with
respect to depth as shown on the map.
Fresh Groundwater: Fresh groundwater occurrence is
more in the shallow aquifers as compared to deep aquifers
wherein the water salinity becomes prominent with the
increase in depth of water bearing zones. The northern,
north-eastern and eastern part of the State constituting
the recent and the old flood plains of river Yamuna,
Ghaggar, Markanda, Saraswati and their tributaries are
characterised by fresh water. Fresh water zones are also
found in the southern district of the State consisting of
major parts of Mahendragarh district, western and south-
western parts of Rewari district. In these districts the
presence of Aravalli hills, which help recharge the
groundwater, and absence of canal irrigation has improved
the groundwater quality.
Marginal Groundwater: Marginal groundwater is
generally located around the zones of fresh water as in the
majority of areas of Rewari district, southern part of
Kaithal district, south-western part of the Bhiwani district,
north-eastern part of Mahendergarh district, western part
of Gurgaon district and central part of Faridabad district.
Saline Groundwater: Saline groundwater occurs mainly
in parts of Hisar district, northern part of Bhiwani district,
southern part of Fatehabad district, northern part of
Jhajjar district and at a number of places in Rohtak and
Jind districts. The occurrence of saline zone along the
Delhi-Hisar-Sirsa alignment can be explained due to lack
of drainage surface outlet. This is aggravated due to
extensive canal network adding surface water to saline
groundwater and non-exploitation of groundwater due to
its saline quality. This has resulted in the rise of water
table and waterlogging in the area. According to an
estimate given by HSMITC, about 70 per cent area of the
State has marginal to saline groundwater. The salinity in
the upper part of the Sirsa district and south-western and
south-eastern parts of Faridabad and Gurgaon districts,
respectively, may be explained in terms of desiccation of
water in these flat and semi-arid plains coupled with
under exploitation of groundwater.
Shallow Marginal to Deep Fresh zone is found to be
associated with fresh water zone as seen in Kaithal,
Mahendergarh, Rewari, Gurgaon, Fatehabad and Sirsa
districts.
Shallow Marginal to Deep Saline zone is generally
associated with Saline zone. It is mainly located in the
zone of Inland Drainage Basin, which lacks drainage
outlets. This covers majority of Sonipat, Jind, Hisar,
Bhiwani and Jhajjar districts, southern and northern parts
of Sirsa district and south-western and south-eastern parts
of Gurgaon and Faridabad districts, respectively.
Shallow Fresh to Deep Saline zone is found to be
associated with Shallow Marginal to Deep Saline zone
indicating that water is always saline at deeper level but
may become fresh depending upon the local conditions.
Shallow Fresh to Deep Marginal zone is found to be
associated with fresh or marginal zones showing fresh
water availability at shallow depth, which deteriorates to
marginal quality at deeper level, but overall the zone is
prospective for limited water supply from shallow depth.
Shallow Saline to Deep Marginal zone is found only at
few places as in north-western fringe of Mahendergarh and
Rewari districts showing some local control in creating
these zones of poor quality groundwater.
Based on the estimates of groundwater fluctuations for
the year 1998 during pre-monsoon period (Groundwater
Cell, Haryana) the percentage of area under fresh water
was 42.55 per cent of the total geographical area. This
increased to 52.38 per cent in the post-monsoon period.
The marginal and saline groundwater zones indicated a
decrease after the monsoon period from 21.68 to 13.13
per cent. Thus, monsoon has a positive impact on the
availability of better quality groundwater.
Accurate mapping of groundwater zones as per their
suitability for domestic, irrigation and industrial uses is
highly desirable for proper management of groundwater
resources and to safeguard human beings from
consumption of poor quality groundwater. To check
further deterioration of quality of groundwater in the
State, regular monitoring of their chemical quality is
necessary.
Groundwater Pollution and QualityHazards Scenario in India
The rapid pace of urbanisation, industrialisation as well
as agricultural activities has made environmental pollution
a growing concern globally. Of all the receptor systems
exposed to the contaminants, groundwater has received
little attention in the past because of the common belief
that groundwater was pristine.
Groundwater Pollution is usually traced back to four
main origins: industrial, domestic, agricultural and over
exploitation. The last category mainly accounts for
seawater intrusion. Studies carried out in India reveal that
one of the most important causes of groundwater
pollution is unplanned urban development without
Chapter 2 • RESOURCE ASSESSMENT 139
adequate attention to sewage and waste disposal.
Industrialisation without provision of proper treatment
and disposal wastes and affluent is another source of
groundwater pollution. Excessive application of fertilisers
for agricultural development coupled with over-irrigation
intrusion due to excessive pumping of fresh water in
coastal aquifers is also responsible for groundwater
pollution.
With the declared objectives of providing at least the
basic amenities there has been a tremendous development
in India, in the agriculture and industrial sector, with
concomitant pressure on the fresh water resources. The
waste generated by anthropogenic activities has not only
polluted the environment as a whole but had a particular
detrimental effect on the quality of aquatio-envison too.
Leachates from compost pits, animal refuse of garbage
dumping grounds, nutrient enriched return irrigation
flows, seepage from septic tanks, seepage of sewage etc.
have adversely affected the groundwater quality in several
parts of India. The rate of generation of wastewater in
India during 1981 was estimated to be 74,529 million
litre/day, that is, 27 km3 annually, which poses a
perennial danger to the potable groundwater resource.
The gravity of situation can be judged from the act that in
spite of sewage treatment plant, Delhi discharged 100
million gallon of untreated sewage into the Yamuna. The
problem is likely to compound further with increasing rate
of wastewater generation which is estimated to about 40
km3 (110,000 million litre/day) annually by the year 2000
million tone (Vimal and Tala Shilkar, 1983). Studies on
chemical composition of groundwater in phreatic zone
have revealed that in many cases anomalously high
concentration of nitrate potassium and even phosphate
(total phosphate) are present in contrast to their virtual
absence or low concentration (No.3 and K less than 10
mg/1) in semi-confined aquifers. Unsystematic use of
synthetic fertilisers coupled with improper water
management practices have resulted in deterioration of
groundwater quality in many parts of the country.
In case of industrial units, effluent in most of the cases
are discharged into pits, open ground, or open unlined
drains near the factories, thus allowing it to move to low
lying depressions resulting in groundwater pollution. The
industries which are burgeoning at terrifying rate, daily
produce about 55,000 million M3 of waste water per day,
out of which 68.5 million M3 is discharged into river
streams. Thus, the magnitude of damage caused to our
water resources can be estimated from the fact that about
70 per cent of rivers and streams in India contain polluted
water.
The incidence of groundwater pollution is highest in
urban area where large volume of waste are concentrated
and discharged into relatively small areas. The groundwater
contamination, however, is detected only some time after
the subsurface contamination begins.
Thirteen states in India have been identified as endemic
to fluorosis due to abundance in natural occurring fluoride
bearing minerals. These are Nalgonda, Rangareddy district
in Andhra Pradesh, Banaskantha, Kutch, Amroli in Gujarat,
Hisar, Kaithal, Gurgaon in Haryana, Augul Bolengir,
Phulbani in Orissa, Bhatinda, Sangrur in Punjab, Ajmer,
Bikaner, Pali, Nagur, Sirohi in Rajasthan, Chengalpattu,
Madurai in Tamil Nadu, Unnao in Uttar Pradesh,
Karnataka, Madhya Pradesh, Maharashtra, Bihar and Delhi.
There are nearly half a million people in India suffering
from ailment due to excess of fluoride in drinking water. In
some villages of Rajasthan and Amroli in Gujarat level of
the fluoride goes up to 11.0 mg/litre.
Though iron content in drinking water may not affect
the human system as a simple dietary overload, but in the
long run prolonged accumulation of Iron in the body may
result in homochromatosis, where tissues are damaged. In
some districts of Assam (Barpeta, Darrang, Kamrup,
Sonitpur) and Orissa (Balasore, Cuttack, Puri)
groundwater have high iron content ranging from 1 to 10
mg/litre.
A total of 1,06,019 sq km area (about 31 per cent) of
Rajasthan comes under saline groundwater of which 88,675
sq km area falls in western Rajasthan comprising
Ganganagar, Barmer, Bikaner, Churu and Jaisalmer districts.
The electrical conductivity of groundwater in western
Rajasthan is over 8 ds/cm and in eastern Rajasthan over 6
ds/cm. Vast low lying alluvial tract from North-Western part
of Banaskantha district through the western part of Mashing
and Ahmedabad districts, western and north-eastern parts of
Surendranagar district, southern part of Ahmedabad and
south-western part of Kheda district is underlain by saline
groundwater (EC 3.46 ds/cm). Groundwater in Sangrur,
Bhatinda, Ferozpur and Faridkot districts have as high as
11.30 ds/cm salinity. About 3766 sq km area in Haryana is
underlain by saline groundwater (EC6 ds/cm).
Arsenic in groundwater have been reported in a range
(0.05-3.2) mglp in shallow aquifers from 61 block in 8
districts of West Bengal namely Malda, Mushirdabad,
Nadia, North and South 24 Parganas, Bardhaman, Howrah
and Hoogly.
The following table shows state-wise places, affected
by pollutant contents:
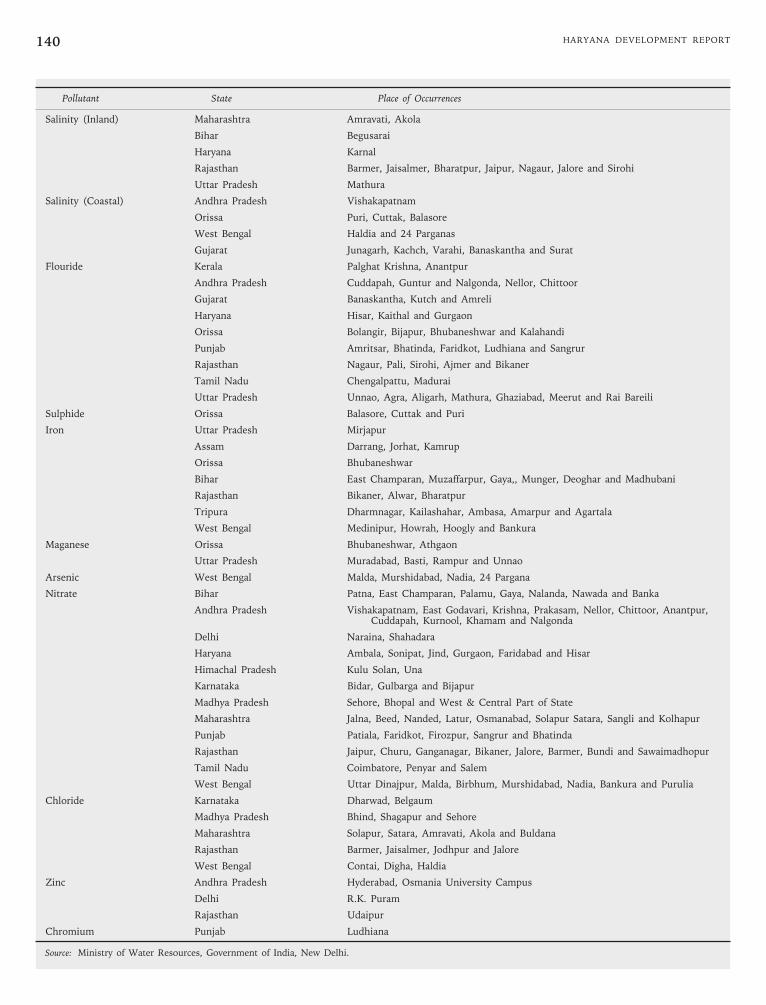
HARYANA DEVELOPMENT REPORT140
Pollutant State Place of Occurrences
Salinity (Inland) Maharashtra Amravati, Akola
Bihar Begusarai
Haryana Karnal
Rajasthan Barmer, Jaisalmer, Bharatpur, Jaipur, Nagaur, Jalore and Sirohi
Uttar Pradesh Mathura
Salinity (Coastal) Andhra Pradesh Vishakapatnam
Orissa Puri, Cuttak, Balasore
West Bengal Haldia and 24 Parganas
Gujarat Junagarh, Kachch, Varahi, Banaskantha and Surat
Flouride Kerala Palghat Krishna, Anantpur
Andhra Pradesh Cuddapah, Guntur and Nalgonda, Nellor, Chittoor
Gujarat Banaskantha, Kutch and Amreli
Haryana Hisar, Kaithal and Gurgaon
Orissa Bolangir, Bijapur, Bhubaneshwar and Kalahandi
Punjab Amritsar, Bhatinda, Faridkot, Ludhiana and Sangrur
Rajasthan Nagaur, Pali, Sirohi, Ajmer and Bikaner
Tamil Nadu Chengalpattu, Madurai
Uttar Pradesh Unnao, Agra, Aligarh, Mathura, Ghaziabad, Meerut and Rai Bareili
Sulphide Orissa Balasore, Cuttak and Puri
Iron Uttar Pradesh Mirjapur
Assam Darrang, Jorhat, Kamrup
Orissa Bhubaneshwar
Bihar East Champaran, Muzaffarpur, Gaya,, Munger, Deoghar and Madhubani
Rajasthan Bikaner, Alwar, Bharatpur
Tripura Dharmnagar, Kailashahar, Ambasa, Amarpur and Agartala
West Bengal Medinipur, Howrah, Hoogly and Bankura
Maganese Orissa Bhubaneshwar, Athgaon
Uttar Pradesh Muradabad, Basti, Rampur and Unnao
Arsenic West Bengal Malda, Murshidabad, Nadia, 24 Pargana
Nitrate Bihar Patna, East Champaran, Palamu, Gaya, Nalanda, Nawada and Banka
Andhra Pradesh Vishakapatnam, East Godavari, Krishna, Prakasam, Nellor, Chittoor, Anantpur,Cuddapah, Kurnool, Khamam and Nalgonda
Delhi Naraina, Shahadara
Haryana Ambala, Sonipat, Jind, Gurgaon, Faridabad and Hisar
Himachal Pradesh Kulu Solan, Una
Karnataka Bidar, Gulbarga and Bijapur
Madhya Pradesh Sehore, Bhopal and West & Central Part of State
Maharashtra Jalna, Beed, Nanded, Latur, Osmanabad, Solapur Satara, Sangli and Kolhapur
Punjab Patiala, Faridkot, Firozpur, Sangrur and Bhatinda
Rajasthan Jaipur, Churu, Ganganagar, Bikaner, Jalore, Barmer, Bundi and Sawaimadhopur
Tamil Nadu Coimbatore, Penyar and Salem
West Bengal Uttar Dinajpur, Malda, Birbhum, Murshidabad, Nadia, Bankura and Purulia
Chloride Karnataka Dharwad, Belgaum
Madhya Pradesh Bhind, Shagapur and Sehore
Maharashtra Solapur, Satara, Amravati, Akola and Buldana
Rajasthan Barmer, Jaisalmer, Jodhpur and Jalore
West Bengal Contai, Digha, Haldia
Zinc Andhra Pradesh Hyderabad, Osmania University Campus
Delhi R.K. Puram
Rajasthan Udaipur
Chromium Punjab Ludhiana
Source: Ministry of Water Resources, Government of India, New Delhi.
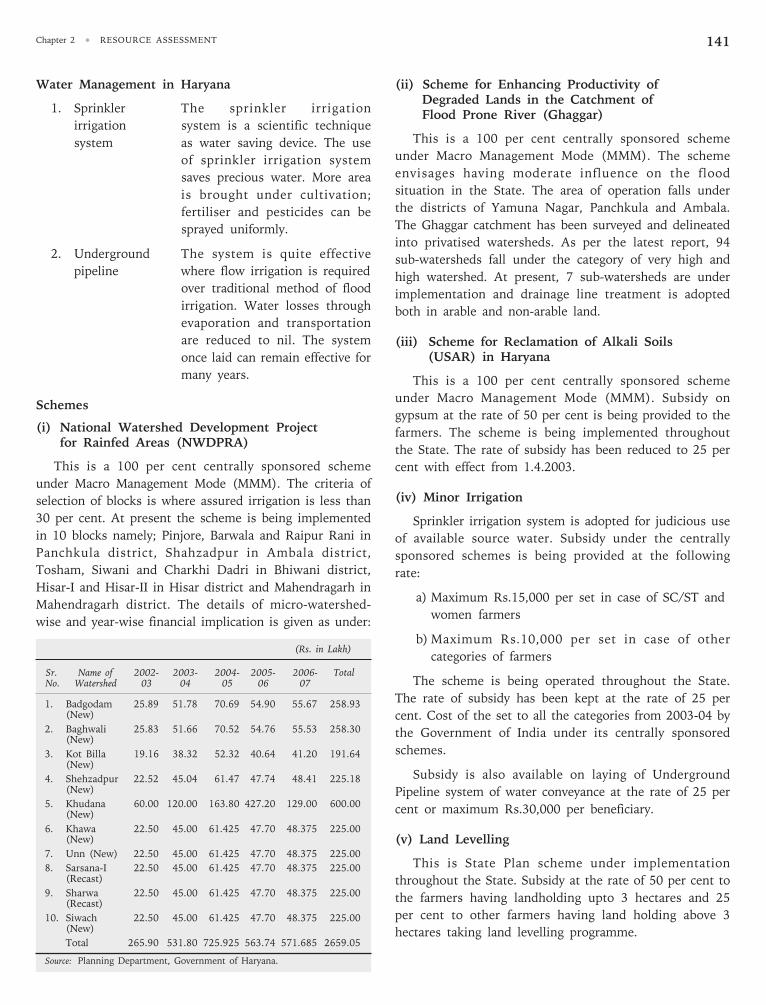
Chapter 2 • RESOURCE ASSESSMENT 141
Water Management in Haryana
1. Sprinkler The sprinkler irrigation
irrigation system is a scientific technique
system as water saving device. The use
of sprinkler irrigation system
saves precious water. More area
is brought under cultivation;
fertiliser and pesticides can be
sprayed uniformly.
2. Underground The system is quite effective
pipeline where flow irrigation is required
over traditional method of flood
irrigation. Water losses through
evaporation and transportation
are reduced to nil. The system
once laid can remain effective for
many years.
Schemes
(i) National Watershed Development Projectfor Rainfed Areas (NWDPRA)
This is a 100 per cent centrally sponsored scheme
under Macro Management Mode (MMM). The criteria of
selection of blocks is where assured irrigation is less than
30 per cent. At present the scheme is being implemented
in 10 blocks namely; Pinjore, Barwala and Raipur Rani in
Panchkula district, Shahzadpur in Ambala district,
Tosham, Siwani and Charkhi Dadri in Bhiwani district,
Hisar-I and Hisar-II in Hisar district and Mahendragarh in
Mahendragarh district. The details of micro-watershed-
wise and year-wise financial implication is given as under:
(Rs. in Lakh)
Sr. Name of 2002- 2003- 2004- 2005- 2006- TotalNo. Watershed 03 04 05 06 07
1. Badgodam 25.89 51.78 70.69 54.90 55.67 258.93(New)
2. Baghwali 25.83 51.66 70.52 54.76 55.53 258.30(New)
3. Kot Billa 19.16 38.32 52.32 40.64 41.20 191.64(New)
4. Shehzadpur 22.52 45.04 61.47 47.74 48.41 225.18(New)
5. Khudana 60.00 120.00 163.80 427.20 129.00 600.00(New)
6. Khawa 22.50 45.00 61.425 47.70 48.375 225.00(New)
7. Unn (New) 22.50 45.00 61.425 47.70 48.375 225.00
8. Sarsana-I 22.50 45.00 61.425 47.70 48.375 225.00(Recast)
9. Sharwa 22.50 45.00 61.425 47.70 48.375 225.00(Recast)
10. Siwach 22.50 45.00 61.425 47.70 48.375 225.00(New)
Total 265.90 531.80 725.925 563.74 571.685 2659.05
Source: Planning Department, Government of Haryana.
(ii) Scheme for Enhancing Productivity ofDegraded Lands in the Catchment ofFlood Prone River (Ghaggar)
This is a 100 per cent centrally sponsored scheme
under Macro Management Mode (MMM). The scheme
envisages having moderate influence on the flood
situation in the State. The area of operation falls under
the districts of Yamuna Nagar, Panchkula and Ambala.
The Ghaggar catchment has been surveyed and delineated
into privatised watersheds. As per the latest report, 94
sub-watersheds fall under the category of very high and
high watershed. At present, 7 sub-watersheds are under
implementation and drainage line treatment is adopted
both in arable and non-arable land.
(iii) Scheme for Reclamation of Alkali Soils(USAR) in Haryana
This is a 100 per cent centrally sponsored scheme
under Macro Management Mode (MMM). Subsidy on
gypsum at the rate of 50 per cent is being provided to the
farmers. The scheme is being implemented throughout
the State. The rate of subsidy has been reduced to 25 per
cent with effect from 1.4.2003.
(iv) Minor Irrigation
Sprinkler irrigation system is adopted for judicious use
of available source water. Subsidy under the centrally
sponsored schemes is being provided at the following
rate:
a) Maximum Rs.15,000 per set in case of SC/ST and
women farmers
b) Maximum Rs.10,000 per set in case of other
categories of farmers
The scheme is being operated throughout the State.
The rate of subsidy has been kept at the rate of 25 per
cent. Cost of the set to all the categories from 2003-04 by
the Government of India under its centrally sponsored
schemes.
Subsidy is also available on laying of Underground
Pipeline system of water conveyance at the rate of 25 per
cent or maximum Rs.30,000 per beneficiary.
(v) Land Levelling
This is State Plan scheme under implementation
throughout the State. Subsidy at the rate of 50 per cent to
the farmers having landholding upto 3 hectares and 25
per cent to other farmers having land holding above 3
hectares taking land levelling programme.
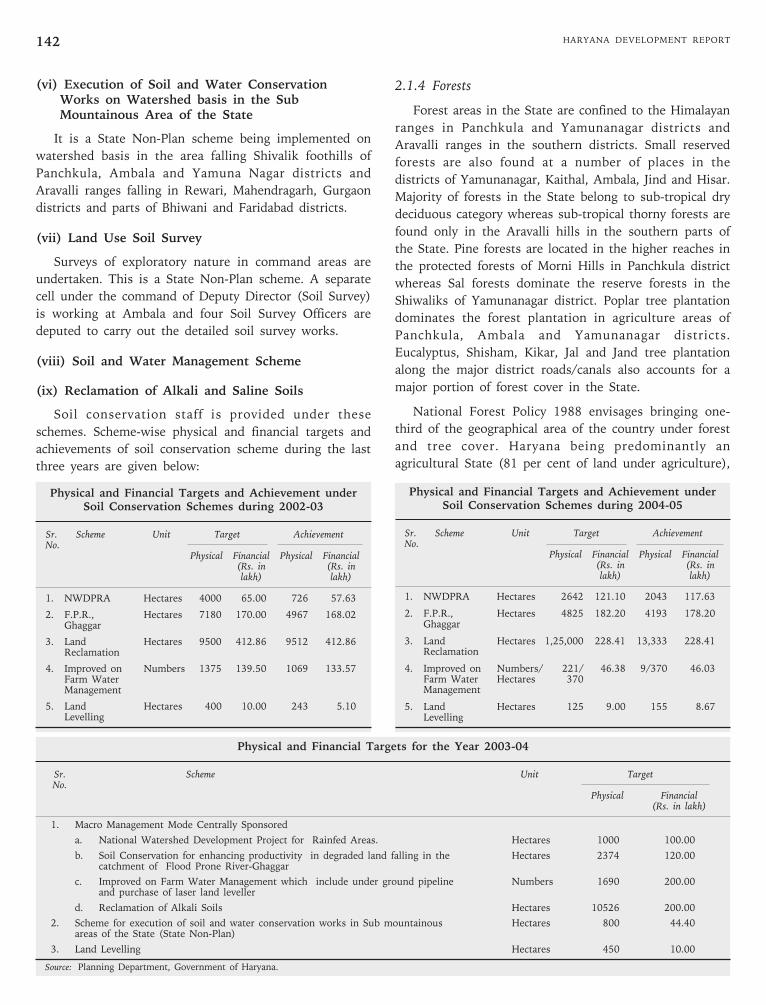
HARYANA DEVELOPMENT REPORT142
(vi) Execution of Soil and Water ConservationWorks on Watershed basis in the SubMountainous Area of the State
It is a State Non-Plan scheme being implemented on
watershed basis in the area falling Shivalik foothills of
Panchkula, Ambala and Yamuna Nagar districts and
Aravalli ranges falling in Rewari, Mahendragarh, Gurgaon
districts and parts of Bhiwani and Faridabad districts.
(vii) Land Use Soil Survey
Surveys of exploratory nature in command areas are
undertaken. This is a State Non-Plan scheme. A separate
cell under the command of Deputy Director (Soil Survey)
is working at Ambala and four Soil Survey Officers are
deputed to carry out the detailed soil survey works.
(viii) Soil and Water Management Scheme
(ix) Reclamation of Alkali and Saline Soils
Soil conservation staff is provided under these
schemes. Scheme-wise physical and financial targets and
achievements of soil conservation scheme during the last
three years are given below:
Physical and Financial Targets and Achievement underSoil Conservation Schemes during 2002-03
Sr. Scheme Unit Target AchievementNo.
Physical Financial Physical Financial(Rs. in (Rs. inlakh) lakh)
1. NWDPRA Hectares 4000 65.00 726 57.63
2. F.P.R., Hectares 7180 170.00 4967 168.02Ghaggar
3. Land Hectares 9500 412.86 9512 412.86Reclamation
4. Improved on Numbers 1375 139.50 1069 133.57Farm WaterManagement
5. Land Hectares 400 10.00 243 5.10Levelling
2.1.4 Forests
Forest areas in the State are confined to the Himalayan
ranges in Panchkula and Yamunanagar districts and
Aravalli ranges in the southern districts. Small reserved
forests are also found at a number of places in the
districts of Yamunanagar, Kaithal, Ambala, Jind and Hisar.
Majority of forests in the State belong to sub-tropical dry
deciduous category whereas sub-tropical thorny forests are
found only in the Aravalli hills in the southern parts of
the State. Pine forests are located in the higher reaches in
the protected forests of Morni Hills in Panchkula district
whereas Sal forests dominate the reserve forests in the
Shiwaliks of Yamunanagar district. Poplar tree plantation
dominates the forest plantation in agriculture areas of
Panchkula, Ambala and Yamunanagar districts.
Eucalyptus, Shisham, Kikar, Jal and Jand tree plantation
along the major district roads/canals also accounts for a
major portion of forest cover in the State.
National Forest Policy 1988 envisages bringing one-
third of the geographical area of the country under forest
and tree cover. Haryana being predominantly an
agricultural State (81 per cent of land under agriculture),
Physical and Financial Targets for the Year 2003-04
Sr. Scheme Unit TargetNo.
Physical Financial(Rs. in lakh)
1. Macro Management Mode Centrally Sponsored
a. National Watershed Development Project for Rainfed Areas. Hectares 1000 100.00
b. Soil Conservation for enhancing productivity in degraded land falling in the Hectares 2374 120.00catchment of Flood Prone River-Ghaggar
c. Improved on Farm Water Management which include under ground pipeline Numbers 1690 200.00and purchase of laser land leveller
d. Reclamation of Alkali Soils Hectares 10526 200.00
2. Scheme for execution of soil and water conservation works in Sub mountainous Hectares 800 44.40areas of the State (State Non-Plan)
3. Land Levelling Hectares 450 10.00
Source: Planning Department, Government of Haryana.
Physical and Financial Targets and Achievement underSoil Conservation Schemes during 2004-05
Sr. Scheme Unit Target AchievementNo.
Physical Financial Physical Financial(Rs. in (Rs. inlakh) lakh)
1. NWDPRA Hectares 2642 121.10 2043 117.63
2. F.P.R., Hectares 4825 182.20 4193 178.20Ghaggar
3. Land Hectares 1,25,000 228.41 13,333 228.41Reclamation
4. Improved on Numbers/ 221/ 46.38 9/370 46.03Farm Water Hectares 370Management
5. Land Hectares 125 9.00 155 8.67Levelling
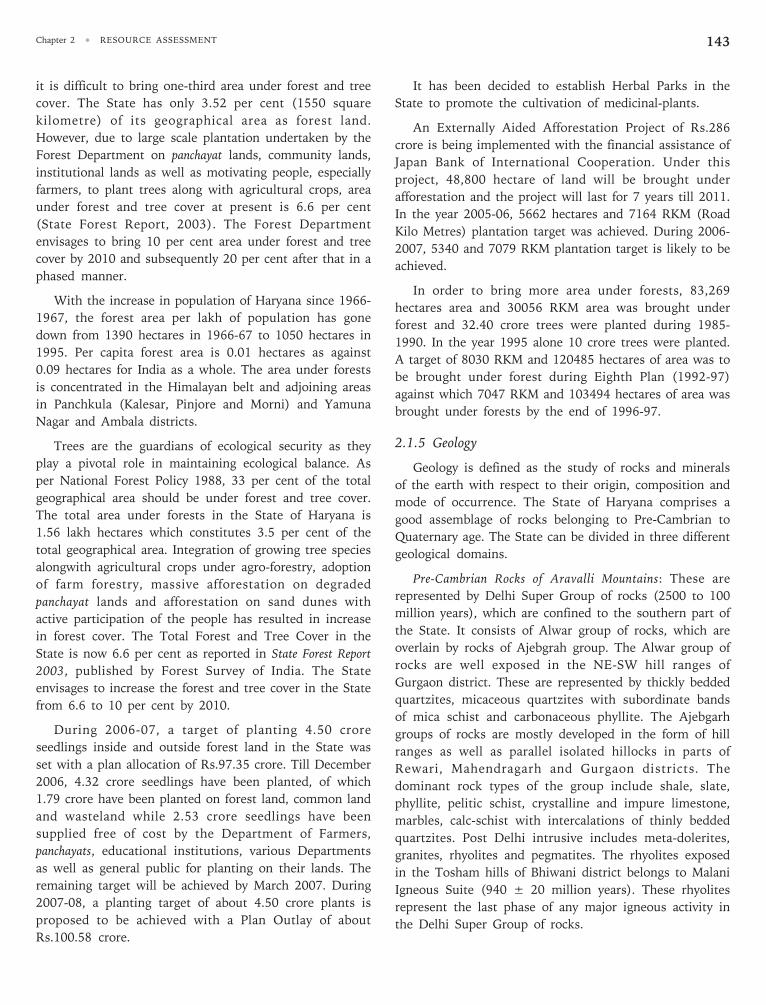
Chapter 2 • RESOURCE ASSESSMENT 143
it is difficult to bring one-third area under forest and tree
cover. The State has only 3.52 per cent (1550 square
kilometre) of its geographical area as forest land.
However, due to large scale plantation undertaken by the
Forest Department on panchayat lands, community lands,
institutional lands as well as motivating people, especially
farmers, to plant trees along with agricultural crops, area
under forest and tree cover at present is 6.6 per cent
(State Forest Report, 2003). The Forest Department
envisages to bring 10 per cent area under forest and tree
cover by 2010 and subsequently 20 per cent after that in a
phased manner.
With the increase in population of Haryana since 1966-
1967, the forest area per lakh of population has gone
down from 1390 hectares in 1966-67 to 1050 hectares in
1995. Per capita forest area is 0.01 hectares as against
0.09 hectares for India as a whole. The area under forests
is concentrated in the Himalayan belt and adjoining areas
in Panchkula (Kalesar, Pinjore and Morni) and Yamuna
Nagar and Ambala districts.
Trees are the guardians of ecological security as they
play a pivotal role in maintaining ecological balance. As
per National Forest Policy 1988, 33 per cent of the total
geographical area should be under forest and tree cover.
The total area under forests in the State of Haryana is
1.56 lakh hectares which constitutes 3.5 per cent of the
total geographical area. Integration of growing tree species
alongwith agricultural crops under agro-forestry, adoption
of farm forestry, massive afforestation on degraded
panchayat lands and afforestation on sand dunes with
active participation of the people has resulted in increase
in forest cover. The Total Forest and Tree Cover in the
State is now 6.6 per cent as reported in State Forest Report
2003, published by Forest Survey of India. The State
envisages to increase the forest and tree cover in the State
from 6.6 to 10 per cent by 2010.
During 2006-07, a target of planting 4.50 crore
seedlings inside and outside forest land in the State was
set with a plan allocation of Rs.97.35 crore. Till December
2006, 4.32 crore seedlings have been planted, of which
1.79 crore have been planted on forest land, common land
and wasteland while 2.53 crore seedlings have been
supplied free of cost by the Department of Farmers,
panchayats, educational institutions, various Departments
as well as general public for planting on their lands. The
remaining target will be achieved by March 2007. During
2007-08, a planting target of about 4.50 crore plants is
proposed to be achieved with a Plan Outlay of about
Rs.100.58 crore.
It has been decided to establish Herbal Parks in the
State to promote the cultivation of medicinal-plants.
An Externally Aided Afforestation Project of Rs.286
crore is being implemented with the financial assistance of
Japan Bank of International Cooperation. Under this
project, 48,800 hectare of land will be brought under
afforestation and the project will last for 7 years till 2011.
In the year 2005-06, 5662 hectares and 7164 RKM (Road
Kilo Metres) plantation target was achieved. During 2006-
2007, 5340 and 7079 RKM plantation target is likely to be
achieved.
In order to bring more area under forests, 83,269
hectares area and 30056 RKM area was brought under
forest and 32.40 crore trees were planted during 1985-
1990. In the year 1995 alone 10 crore trees were planted.
A target of 8030 RKM and 120485 hectares of area was to
be brought under forest during Eighth Plan (1992-97)
against which 7047 RKM and 103494 hectares of area was
brought under forests by the end of 1996-97.
2.1.5 Geology
Geology is defined as the study of rocks and minerals
of the earth with respect to their origin, composition and
mode of occurrence. The State of Haryana comprises a
good assemblage of rocks belonging to Pre-Cambrian to
Quaternary age. The State can be divided in three different
geological domains.
Pre-Cambrian Rocks of Aravalli Mountains: These are
represented by Delhi Super Group of rocks (2500 to 100
million years), which are confined to the southern part of
the State. It consists of Alwar group of rocks, which are
overlain by rocks of Ajebgrah group. The Alwar group of
rocks are well exposed in the NE-SW hill ranges of
Gurgaon district. These are represented by thickly bedded
quartzites, micaceous quartzites with subordinate bands
of mica schist and carbonaceous phyllite. The Ajebgarh
groups of rocks are mostly developed in the form of hill
ranges as well as parallel isolated hillocks in parts of
Rewari, Mahendragarh and Gurgaon districts. The
dominant rock types of the group include shale, slate,
phyllite, pelitic schist, crystalline and impure limestone,
marbles, calc-schist with intercalations of thinly bedded
quartzites. Post Delhi intrusive includes meta-dolerites,
granites, rhyolites and pegmatites. The rhyolites exposed
in the Tosham hills of Bhiwani district belongs to Malani
Igneous Suite (940 ± 20 million years). These rhyolites
represent the last phase of any major igneous activity in
the Delhi Super Group of rocks.
HARYANA DEVELOPMENT REPORT144
Tertiary Rocks of Himalaya: The north eastern part of
Haryana is characterised by the Himalayan Palaeogene
succession comprising Subathu and Dagshai formation
and Neogene succession of Shiwalik Group of rocks.
Subathu formation (late Paleocene to middle Eocene)
consists of pisolitic laterite and shales. Overlying the
Subathus, the Dagshai formation (late Eocene to
Oligocene) consist of alternating sequence of grey and
purple clay and hard, fine grained greenish impure
sandstone. The sediments of the Shiwalik Group were
derived from the rising mountain in the north and they
are laid down in the alluvial plains of a series of rivers
along the foot of the Outer Himalaya during the Neogene
period (Mid. Miocene to Lr. Pleistocene). Based on the
evidences of vertebrate fauna, the Shiwalik succession has
been divided into three units viz. Lower Shiwalik (Mid.
Miocene), Middle Shiwalik (Up. Miocene to Lr. Pliocene
and Upper Shiwalik (Up. Pliocene to Lr. Pleistocene). The
contact of Shiwaliks with the Indo Gangetic Plains is
defined as Main Frontal Thrust, whereas the contact of
Shiwaliks with the Subathu in the north is known as Main
Boundary Thrust. Upper Shiwaliks occur all along the
southern margin of the Shiwalik belt in Panchkula district
and along the northern margin of Yamunanagar district. It
is characterised by coarse boulder conglomerate and
associated with alternating sequence of sandstones, grits,
clays and conglomerates. Middle Shiwalik is located in the
Yamunanagar district and marked by alternating sequence
of massive sandstone, red shales, clay and occasional
pebbly beds. Lower Shiwalik is characterised by the
presence of nodular shales and is constituted by
alternating sequence of dark hard sandstone, clays and
red-purple shales. Rocks of the Lower Shiwaliks occupy
middle slopes in Panchkula district, which are tectonically
underlained by the rocks of Upper Shiwaliks to the south
and by the Subathu formation to the north.
Quaternary Deposits of Indo-Gangetic Plain: It occupies
nearly 97 per cent area of the State. It is formed by the
deposition of alluvial sediments brought by Himalayan
rivers into a deep crustal trough between Himalaya in the
north and Deccan plateau in the south. The deposits
range in age from Pleistocene to recent period. The
thickness of the alluvium varies from a few metres to
about 1200 metres. Maximum thickness of the
Quaternary sediments is encountered along the northern
fringes near the foredeep folded belt of Shiwalik hills. The
alluvial deposits consist of sand, silt, clays, kankar, gravel
and boulders. The sediments have been divided into the
newer alluvium of Pleistocene period known as Bhangar
and older alluvium is known as Khaddar. The Bhangar
comprises of stream laid silt, sand, clay and calcareous
nodules, comparatively occupies the higher terrain,
whereas the Khaddar comprising of generally poorly
sorted silt, sand, gravel and clay occurs adjacent to the
river channels. The Bhanagar occupies the outer margins
of the Shiwaliks. In the Holocene period, aeolian sands in
the form of sand dunes and sandy deposits have been
deposited over the alluvium deposits in the south-western
parts of the State.
Being an alluvial formation, Haryana has very little
mineral wealth. Various rocks and minerals found in the
State according to definitions contained in the Mines &
Minerals Act, 1957 under section 3(E), are described as
“minor minerals” and remaining as minerals commonly
known as “major minerals”.
Minor Minerals: Minor minerals include building stones,
gravel, ordinary clay, ordinary sand, boulder, shingle,
chalcedony pebble, kankar and limestone, murrum, brick
earth, fuller’s earth, bentonite, road metal, rehmatti, slate
and shale (used as building material), saltpetre and
granite. Minor minerals are the major source of income
because maximum amount of revenue is derived from the
auctioning of these minerals.
Major Minerals: Almost all the industrial rocks and
minerals are grouped under major minerals. Major
minerals found in the State are asbestos, arsenopyrite,
apatite & rock phosphate, barytes, beryl, china clay,
calcite, copper, felspar, garnet, graphite, gold, glass and
fondary sands, lead, zinc, tin-tungsten ores, milestones,
lime, kankar, dolomite, manganese, mica, quartz, quartzite
and slate.
Most of the minerals are found in Mahendragarh,
Gurgaon, Ambala, Yamunanagar and Panchkula districts.
Iron ore, limestone and slate are the only three principal
minerals economically exploited at present. Other minerals
are lime, kankar, china clay, dolomite, quartz and silica.
Limestone and kankar are used in cement manufacturing.
The Geological Survey of India has estimated the resources
of crystalline limestone to be of the order of 17.5 million
tonnes. Slate is found in the Rewari, Mahendragarh and
Gurgaon districts. The iron ore reserves are of the order of
five million tonnes. The ore is of high grade, varying from
50 per cent to 65 per cent in iron contents. Various
minerals being economically exploited in the State are as
under:
Building Stones: Large quantities of sand, pebbles,
gravels and boulders are found in the river beds and flood
plains of Ghaggar, Tangri, Markanda and Yamuna rivers.
River sand is also quarried for construction material in the
river beds of Sahibi, Dohan and Kasauti rivers in parts of
Chapter 2 • RESOURCE ASSESSMENT 145
Mahendragarh and Rewari districts. Badar sand also called
bazri is found in huge quantities in the hilly terrain of
Aravallis in Faridabad and Gurgaon district. Siliceous
kankar and Lime kankar occur in huge quantities in parts
of Bhiwani and Jhajjar districts. Minor quantities of kankar
are also found in parts of Rewari, Mahendragarh,
Faridabad, Gurgaon and Sirsa districts. Brick earth/
ordinary clay suitable for manufacturing of bricks is
available in plenty in almost every part of the State except
in hilly terrain and areas covered with sand dunes.
Saltpetre occurs as thin white incrustations on the surface.
Its major occurrences are in Kurukshetra, Hisar, Rohtak,
Jind and Sirsa districts whereas minor occurrences are in
Sonipat, Karnal, Gurgaon, Faridabad and Bhiwani districts.
Practically inexhaustible deposits of quartzite are found in
the State, distributed within narrow, widly isolated strike
ridges of Aravallis in the districts of Faridabad, Gurgaon,
Rewari, Mahendargarh and Bhiwani. Limestone reserves
are located in the hilly tracts of Panchkula (Morni) and
Mahendragarh (Narnaul) districts. Granite deposits of
ornamental building stone variety and of ordinary building
stone variety occur as inexhaustible deposits around
Narnaul and around Riwasa in parts of Mahendragarh and
Bhiwani districts respectively. Marble in the shades of
white, pink, grey and pale green coloured marble are
found at a number of places around Narnaul in parts of
Mahendragarh district. Huge deposits of good quality
slates occurring in shades of green, black and brown
exists in the district of Rewari and Mahendragarh.
Metallic Deposits: Iron ore deposits in form of magnetite
with little haematite occur in calc-quartz-biotite schist of
Ajabgarh rock due south of Narnaul in Mahendragarh
district. Haematitic quartzite associated with quartzite and
phyllite occur in Kaliana hill top in Bhiwani district. Low
grade haematite and jasperoid haematite occur in
Ferozpur-Jhirka area of Gurgaon district. Lead, zinc and
tin mineralisation occur in granites and rhyolites of
Tosham area of Bhiwani district.
A number of major minerals, though in minor
quantities, are found in the State. These include
arsenopyrite (Alwar quartzites of Gurgaon district),
tremolite (in Ajabgarh quartzites, near Narnaul), apatite
and rock-phosphate (Calc silicate rocks of Dochan,
Mahendragarh and in Subathu shales of Morni Hills,
Panchkula), barytes (in Ajabgarh rocks of Narnaul tehsil,
Dagshai shales of Morni hills, Panchkula), beryl (in
pegmatites intruding the schistose rocks of Ajabgarh
group in Narnaul tehshil), china clay (in the feldspathic
pegmatite veins occuring in Alwar quartzites in Faridabad
and Gurgaon district), red clays (in Kona Nala area, Kalka
tehshil of Panchkula district), calcite (in limestone and calc
silicate rocks of Ajabgarh Group in Narnaul tehshil),
copper (in calc-silicate and gneissic rocks in Narnaul
tehshil and Alwar quartzites in Khodana hillocks in
Bhiwani district), felspars (in pegmatites intruding
quartzites in Narnaul tehshil and in Gurgaon district),
garnet (in Garnetiferous mica schist associated with Alwar
quartzites in Gurgaon district), graphite (in graphite mica
schist occuring in Narnaul tehshil and Gurgaon district),
gold (occurring as placer deposits in river sands of
Markanda, Tangri and other rivulets in Yamunanagar
district), silica sand (occur in hilly terrain of Aravalli in
Gurgaon, Mahendragarh districts), foundry sand (in
abandoned course of Yamuna river in Sonipat district),
kyanite (in st-ky-mica schist rock in Mahendragarh
district, and in metasedimentary rocks of Delhi Special
Group in Gurgaon district), manganese (low grade, small
deposits associated with limestones in Narnaul tehshil),
mica (pegmatitic dykes in schistose rocks of Ajabgarh
group), quartz (as intrusive veins with pegmatites in
Mahendragarh, Gurgaon and Faridabad districts).
Mines and Geology Department is entrusted with the
work of exploration and exploitation of the minerals in
the State. For exploitation of the minerals in the State,
investigation works are being done by the Geological
Wing of the department. Apart from this, prospecting
licences are also being granted to private entrepreneurs
for this purpose. Mining leases/contracts for extraction of
minerals are being given on establishment of deposits as
per provisions of Mines and Minerals (Regulation and
Development) Act 1957, a Central Act and Mineral
Concession Rules, 1960 (Central Rules), framed by
Central Government for regulating the Major Minerals. In
the State of Haryana, limestone, lime kankar, dolomite,
school slate, silica sand, China clay and quartzite and iron
ore are available. Central Government has defined
minerals used as building material like road metal and
masonry stone, ordinary sand, saltpetre and brick earth as
Minor Mineral.
The mineral concession of Minor Minerals is regulated
by Punjab Minor Mineral Concession Rules, 1964, a State
rule framed as per delegated powers under Section 15 of
the Central Act. Mining Department also regulates stone
crusher in the State. Haryana Regulation and Control of
crusher Act, 1991 and rules framed thereunder regulates
in operation of stone crusher in the State. The stone
crushers are allowed to be installed only in the identified
Crusher Zones or in the areas which fulfils the sitting
parameters fixed by Environment Department and have
‘NOC’ of Haryana State Pollution Control Board.
HARYANA DEVELOPMENT REPORT146
As per existing provisions of State rules, mining leases
for Minor Mineral are being granted by public auction
instead of granting mining leases by inviting applications.
The leases are granted by auction and lessees are liable to
pay royalty on the mineral dispatched or minimum dead rent
(fixed in open auction) whichever is more. The period of
mining lease is granted for seven years. The annual dead
rent is further liable to be increased by 50 per cent after
expiring of every three years lease period. The policy of grant
of mining leases by public auction gives equal opportunity to
all interested persons by participating in the auction.
Mining leases for the Major Minerals having industrial
use are granted by inviting applications as per provisions
of Central Act and Rules framed thereunder. State
Government is not empowered to frame rules. However,
the power to grant is exercised by State Government. The
applicants are interviewed by a Committee headed by
Director, Mines and Geology, in order to adjudicate their
suitability for grant of mining lease. The financial
resources, knowledge of mining and staff employed by
applicants are the main factors for deciding the matter for
grant of lease.
In view of principles laid down by Central Government
in a case decided by Central Tribunal in 1993, State
government took a policy decision ‘one area one lessee’
and mining lease holders of ‘Major Minerals’ are being
granted mining lease of minor minerals in the same area.
The other mode for grant of mineral concession for the
minor minerals quarries is the contracts by open auction.
In case of mining contract, the quantity of mineral
extracted is not linked with the contract money. Prior to
March, 2005 minor mineral quarries in various districts
were granted ‘as one unit’. However, now on expiry of old
contracts, department is auctioning the minor mineral
mines by forming small zones.
2.2 Human Resources (Skill Base)
Knowledge is more important today than ever, as the
twin forces of globalisation and technological advances are
spurring an ongoing knowledge revolution. This
revolution manifests itself in many ways: closer links
between science and technology (S&T), greater
importance of innovation for economic growth and
competitiveness, increased importance of education and
lifelong learning, and more investment in intangibles
(R&D, software, and education); the latter is even greater
than investments in fixed capital.
Improved knowledge has led to increasing productivity.
The creation and application of new technologies has
increased growth possibilities and an expanding range of
products and services. It has brought revolutionary change
to virtually all markets and sectors.
Education is the fundamental enablers of the
knowledge economy. Well-educated and skilled people are
keys to creating, sharing, disseminating, and using
knowledge effectively.
Rates of literacy among the population have risen
considerably in Haryana in the past ten years. The 2001
census recorded literacy rates of 67.91 per cent, as compared
to 55.85 per cent in 1991. In 2001, the male literacy rate
was 79.3 per cent which was 48.2 per cent in 1981 as
against it the female literacy rate was 56.3 per cent which
was just 22.3 per cent in 1981. The gap between male and
female rates has therefore, narrowed down from 25.9 per
cent in 1981 to 23.0 per cent in 2001.
Skills matter more than ever in today’s competitive
global market. Firms and farmers alike must be able to
learn and develop new skills. While not losing sight of the
need for secondary and higher education, there is the need
for improving the skill and education levels of the mass of
people though primary and vocational education.
Training of youths in various industrial skills is the
backbone for creation of a sound industrial economy. The
Industrial Training and Vocational Education Department
through a network of 192 institutes (ITIs, ITIs Women,
Vocational Education Institutes (VEIs), Art Schools and
Footwear Institutes) is presently providing certificate
courses to nearly 31,358 students all over the State. These
institutes are not only supplying skilled draftsmen to the
industries but also generate avenues for self-employment.
A number of 78 ITIs and ITIs (W) with a seating
capacity of 15,140 and 112 VEIs with seating capacity of
16,060 students are working under this department. Art
School, Rohtak with a seating capacity of 60 students and
a Government Footwear Institute, Rewari with a seating
capacity of 50 students, are also functioning in the State.
Teacher Training Courses with seating capacity of 224
seats are being run at Ambala City, Rohtak, Bhiwani, Jind,
Narnaul and Sirsa. The institutes of the Department are
imparting training at certificate level. Out of the total 192
institutes, 31 institutes are meant exclusively for women
while there is a facility of co-education in the remaining
institutes. Further, no tuition fee is charged from women
trainees in all these institutes.
During the year 2005-06, the intake capacity in Guru
Jambheshwar University of Science and Technology, Hisar
was 617 students. There were 40 Engineering colleges in
the State where the intake capacity was 14,308 students.
33 institutions were imparting education in Master of

Chapter 2 • RESOURCE ASSESSMENT 147
Business Management with an intake capacity of 2027
students. 32 institutions were imparting education for
Master of Computer Application with an intake capacity of
1825 students. 17 institutions were imparting education
in Pharmacy with an intake capacity of 1039 students. 43
Polytechnics were functioning in the State with an intake
capacity of 90705 students. Ten institutions were
imparting training for M. Tech courses with an intake
capacity of 360 students. The Hotel Management institute
was functioning with an intake capacity of 60 students. In
this way 177 institutions have been imparting technical
education with an intake capacity of 29,941 students.
The number of scholars in recognised colleges for
general education has increased from 75,863 in 1980-81
to 1,94,366 in 2004-05. The number of girl students in
these colleges has increased from 22,319 in 1980-81 to
92,962 in 2004-05. The gross enrolment ratio in Classes
I-V was 84.24 per cent and in classes VI-VIII it was 68.24
per cent in 2002-03. The Human Development Index
(HDI) for Haryana has improved from 0.360 in 1981 to
0.5505 in 2001 as per Human Development Report of
Haryana prepared by Haryana Institute of Public
Administration.
2.2.1 Work Participation in Districts
The total work participation of Haryana in the year
2001, as specified in Table 2.1, was 39.62 per cent, of
which 42.93 per cent was in rural areas and 31.49 per
cent in urban areas. The work participation of males was
very high as compared to females in both rural and urban
areas. In case of males, it was 68.22 per cent whereas for
females it was 31.78 per cent. Work participation of rural
males was 63.33 per cent as compared to urban males
whose work participation was 84.63 per cent. For females
this ratio was reverse. In rural areas 36.67 per cent
females participated in work, and in urban areas 15.37 per
cent females participated in work. The district-wise
position of the overall work participation shows that the
maximum work was observed in district Fatehabad (45.03
per cent). The minimum work participation was recorded
in district Ambala (31.99 per cent). Among the rural
areas, the maximum work participation was found again
in district Fatehabad (48.01 per cent), and the lowest in
district Ambala (31.64 per cent). But as regards the urban
areas, the highest work participation was from district
Panipat (36.13 per cent), and the lowest, from district
Yamuna Nagar (29.51 per cent). Surprisingly, the urban
areas of district Yamuna Nagar have the distinction of
having the highest work participation rate for males
(90.11 per cent), and the lowest, for females (9.89 per
cent) among all districts and areas of the State.
TABLE 2.1
Haryana: Work Participation Rate by District, 2001(in Per cent)
Sr.No. State/District Area Total Male Female
1. Haryana Total 39.62 68.22 31.78Rural 42.93 63.33 36.67Urban 31.49 84.63 15.37
2. Panchkula Total 38.14 78.44 21.56Rural 41.79 75.98 24.02Urban 33.58 82.24 17.76
3. Ambala Total 31.99 85.24 14.76Rural 31.64 84.16 15.84Urban 32.64 87.18 12.82
4. Yamuna Nagar Total 32.31 83.29 16.71Rural 34.00 79.70 20.30Urban 29.51 90.11 09.89
5. Kurukshetra Total 37.36 73.42 26.58Rural 39.96 70.43 29.57Urban 30.00 84.69 15.31
6. Kaithal Total 39.32 69.80 30.20Rural 41.56 66.85 33.15Urban 30.01 86.82 13.18
7. Karnal Total 35.74 75.29 24.71Rural 37.29 72.15 27.85Urban 31.46 85.60 14.40
8. Panipat Total 39.57 70.50 29.50Rural 41.91 64.26 35.74Urban 36.13 81.11 18.89
9. Sonipat Total 40.89 66.05 33.95Rural 44.59 62.27 37.73Urban 29.84 82.88 17.12
10. Jind Total 43.87 63.44 36.56Rural 47.28 60.25 39.75Urban 30.46 82.89 17.11
11. Fatehabad Total 45.03 64.15 35.85Rural 48.01 61.21 38.79Urban 31.09 85.37 14.63
12. Sirsa Total 42.59 66.17 33.83Rural 46.34 61.69 38.31Urban 32.06 84.37 15.63
13. Hisar Total 43.30 64.73 35.27Rural 47.02 60.55 39.45Urban 32.66 81.96 18.04
14. Bhiwani Total 42.76 61.28 38.72Rural 45.65 58.03 41.97Urban 30.39 82.10 17.90
15. Rohtak Total 39.47 67.67 32.33Rural 44.63 61.93 38.07Urban 29.91 83.53 16.47
16. Jhajjar Total 44.17 62.98 37.02Rural 47.32 59.42 40.58Urban 33.10 80.82 19.18
17. Mahendragarh Total 43.31 57.78 42.22Rural 45.19 55.34 44.66Urban 31.21 80.44 19.56
18. Rewari Total 43.59 60.07 39.93Rural 46.50 56.41 43.59Urban 30.14 86.15 13.85
19. Gurgaon Total 37.92 65.94 34.06Rural 39.58 62.08 37.92Urban 32.14 82.55 17.45
20. Faridabad Total 35.80 73.37 26.63Rural 41.83 60.35 39.65Urban 31.01 87.36 12.64
Source : Director of Census operations, Haryana, available atwww.censusindia.net
2.2.2 Occupational Distribution
The occupational distribution of persons as reported by
the Live Register of Employment Exchanges in Haryana
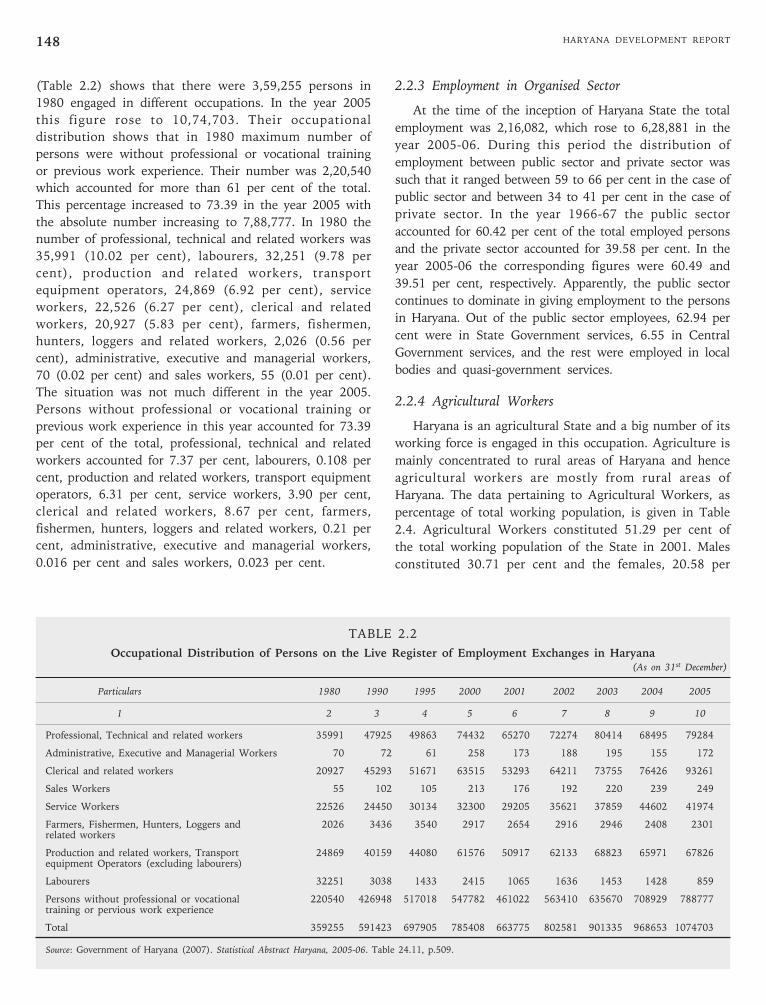
HARYANA DEVELOPMENT REPORT148
(Table 2.2) shows that there were 3,59,255 persons in
1980 engaged in different occupations. In the year 2005
this figure rose to 10,74,703. Their occupational
distribution shows that in 1980 maximum number of
persons were without professional or vocational training
or previous work experience. Their number was 2,20,540
which accounted for more than 61 per cent of the total.
This percentage increased to 73.39 in the year 2005 with
the absolute number increasing to 7,88,777. In 1980 the
number of professional, technical and related workers was
35,991 (10.02 per cent), labourers, 32,251 (9.78 per
cent), production and related workers, transport
equipment operators, 24,869 (6.92 per cent), service
workers, 22,526 (6.27 per cent), clerical and related
workers, 20,927 (5.83 per cent), farmers, fishermen,
hunters, loggers and related workers, 2,026 (0.56 per
cent), administrative, executive and managerial workers,
70 (0.02 per cent) and sales workers, 55 (0.01 per cent).
The situation was not much different in the year 2005.
Persons without professional or vocational training or
previous work experience in this year accounted for 73.39
per cent of the total, professional, technical and related
workers accounted for 7.37 per cent, labourers, 0.108 per
cent, production and related workers, transport equipment
operators, 6.31 per cent, service workers, 3.90 per cent,
clerical and related workers, 8.67 per cent, farmers,
fishermen, hunters, loggers and related workers, 0.21 per
cent, administrative, executive and managerial workers,
0.016 per cent and sales workers, 0.023 per cent.
2.2.3 Employment in Organised Sector
At the time of the inception of Haryana State the total
employment was 2,16,082, which rose to 6,28,881 in the
year 2005-06. During this period the distribution of
employment between public sector and private sector was
such that it ranged between 59 to 66 per cent in the case of
public sector and between 34 to 41 per cent in the case of
private sector. In the year 1966-67 the public sector
accounted for 60.42 per cent of the total employed persons
and the private sector accounted for 39.58 per cent. In the
year 2005-06 the corresponding figures were 60.49 and
39.51 per cent, respectively. Apparently, the public sector
continues to dominate in giving employment to the persons
in Haryana. Out of the public sector employees, 62.94 per
cent were in State Government services, 6.55 in Central
Government services, and the rest were employed in local
bodies and quasi-government services.
2.2.4 Agricultural Workers
Haryana is an agricultural State and a big number of its
working force is engaged in this occupation. Agriculture is
mainly concentrated to rural areas of Haryana and hence
agricultural workers are mostly from rural areas of
Haryana. The data pertaining to Agricultural Workers, as
percentage of total working population, is given in Table
2.4. Agricultural Workers constituted 51.29 per cent of
the total working population of the State in 2001. Males
constituted 30.71 per cent and the females, 20.58 per
TABLE 2.2
Occupational Distribution of Persons on the Live Register of Employment Exchanges in Haryana(As on 31st December)
Particulars 1980 1990 1995 2000 2001 2002 2003 2004 2005
1 2 3 4 5 6 7 8 9 10
Professional, Technical and related workers 35991 47925 49863 74432 65270 72274 80414 68495 79284
Administrative, Executive and Managerial Workers 70 72 61 258 173 188 195 155 172
Clerical and related workers 20927 45293 51671 63515 53293 64211 73755 76426 93261
Sales Workers 55 102 105 213 176 192 220 239 249
Service Workers 22526 24450 30134 32300 29205 35621 37859 44602 41974
Farmers, Fishermen, Hunters, Loggers and 2026 3436 3540 2917 2654 2916 2946 2408 2301related workers
Production and related workers, Transport 24869 40159 44080 61576 50917 62133 68823 65971 67826equipment Operators (excluding labourers)
Labourers 32251 3038 1433 2415 1065 1636 1453 1428 859
Persons without professional or vocational 220540 426948 517018 547782 461022 563410 635670 708929 788777training or pervious work experience
Total 359255 591423 697905 785408 663775 802581 901335 968653 1074703
Source: Government of Haryana (2007). Statistical Abstract Haryana, 2005-06. Table 24.11, p.509.
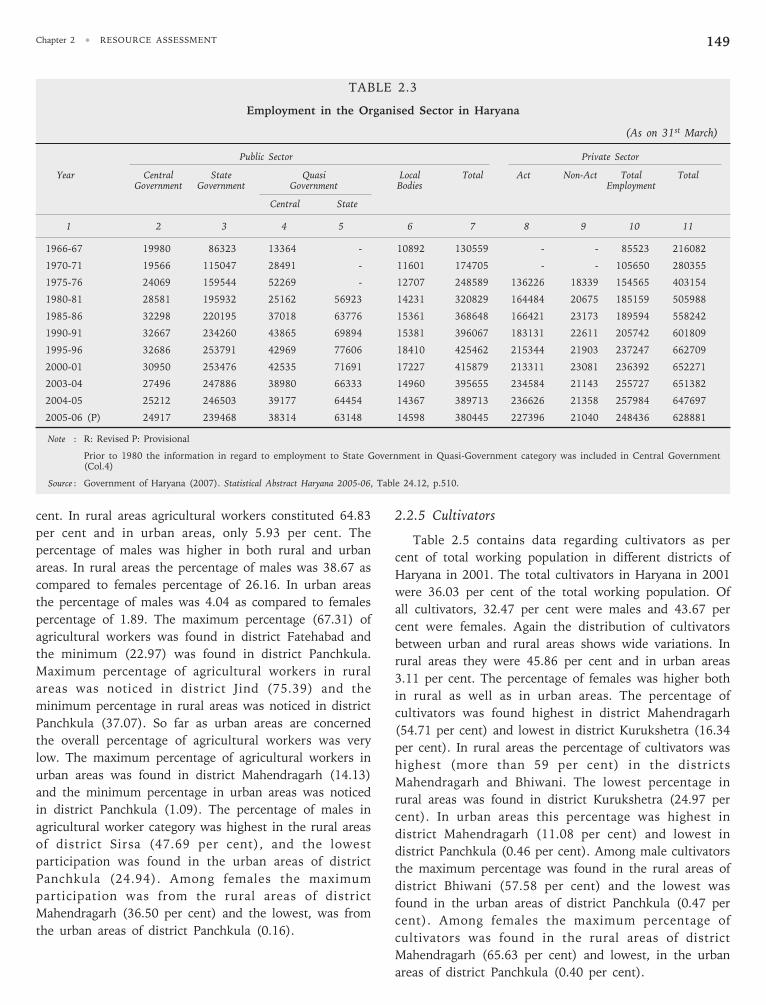
Chapter 2 • RESOURCE ASSESSMENT 149
cent. In rural areas agricultural workers constituted 64.83
per cent and in urban areas, only 5.93 per cent. The
percentage of males was higher in both rural and urban
areas. In rural areas the percentage of males was 38.67 as
compared to females percentage of 26.16. In urban areas
the percentage of males was 4.04 as compared to females
percentage of 1.89. The maximum percentage (67.31) of
agricultural workers was found in district Fatehabad and
the minimum (22.97) was found in district Panchkula.
Maximum percentage of agricultural workers in rural
areas was noticed in district Jind (75.39) and the
minimum percentage in rural areas was noticed in district
Panchkula (37.07). So far as urban areas are concerned
the overall percentage of agricultural workers was very
low. The maximum percentage of agricultural workers in
urban areas was found in district Mahendragarh (14.13)
and the minimum percentage in urban areas was noticed
in district Panchkula (1.09). The percentage of males in
agricultural worker category was highest in the rural areas
of district Sirsa (47.69 per cent), and the lowest
participation was found in the urban areas of district
Panchkula (24.94). Among females the maximum
participation was from the rural areas of district
Mahendragarh (36.50 per cent) and the lowest, was from
the urban areas of district Panchkula (0.16).
2.2.5 Cultivators
Table 2.5 contains data regarding cultivators as per
cent of total working population in different districts of
Haryana in 2001. The total cultivators in Haryana in 2001
were 36.03 per cent of the total working population. Of
all cultivators, 32.47 per cent were males and 43.67 per
cent were females. Again the distribution of cultivators
between urban and rural areas shows wide variations. In
rural areas they were 45.86 per cent and in urban areas
3.11 per cent. The percentage of females was higher both
in rural as well as in urban areas. The percentage of
cultivators was found highest in district Mahendragarh
(54.71 per cent) and lowest in district Kurukshetra (16.34
per cent). In rural areas the percentage of cultivators was
highest (more than 59 per cent) in the districts
Mahendragarh and Bhiwani. The lowest percentage in
rural areas was found in district Kurukshetra (24.97 per
cent). In urban areas this percentage was highest in
district Mahendragarh (11.08 per cent) and lowest in
district Panchkula (0.46 per cent). Among male cultivators
the maximum percentage was found in the rural areas of
district Bhiwani (57.58 per cent) and the lowest was
found in the urban areas of district Panchkula (0.47 per
cent). Among females the maximum percentage of
cultivators was found in the rural areas of district
Mahendragarh (65.63 per cent) and lowest, in the urban
areas of district Panchkula (0.40 per cent).
TABLE 2.3
Employment in the Organised Sector in Haryana
(As on 31st March)
Public Sector Private Sector
Year Central State Quasi Local Total Act Non-Act Total TotalGovernment Government Government Bodies Employment
Central State
1 2 3 4 5 6 7 8 9 10 11
1966-67 19980 86323 13364 - 10892 130559 - - 85523 216082
1970-71 19566 115047 28491 - 11601 174705 - - 105650 280355
1975-76 24069 159544 52269 - 12707 248589 136226 18339 154565 403154
1980-81 28581 195932 25162 56923 14231 320829 164484 20675 185159 505988
1985-86 32298 220195 37018 63776 15361 368648 166421 23173 189594 558242
1990-91 32667 234260 43865 69894 15381 396067 183131 22611 205742 601809
1995-96 32686 253791 42969 77606 18410 425462 215344 21903 237247 662709
2000-01 30950 253476 42535 71691 17227 415879 213311 23081 236392 652271
2003-04 27496 247886 38980 66333 14960 395655 234584 21143 255727 651382
2004-05 25212 246503 39177 64454 14367 389713 236626 21358 257984 647697
2005-06 (P) 24917 239468 38314 63148 14598 380445 227396 21040 248436 628881
Note : R: Revised P: Provisional
Prior to 1980 the information in regard to employment to State Government in Quasi-Government category was included in Central Government(Col.4)
Source : Government of Haryana (2007). Statistical Abstract Haryana 2005-06, Table 24.12, p.510.
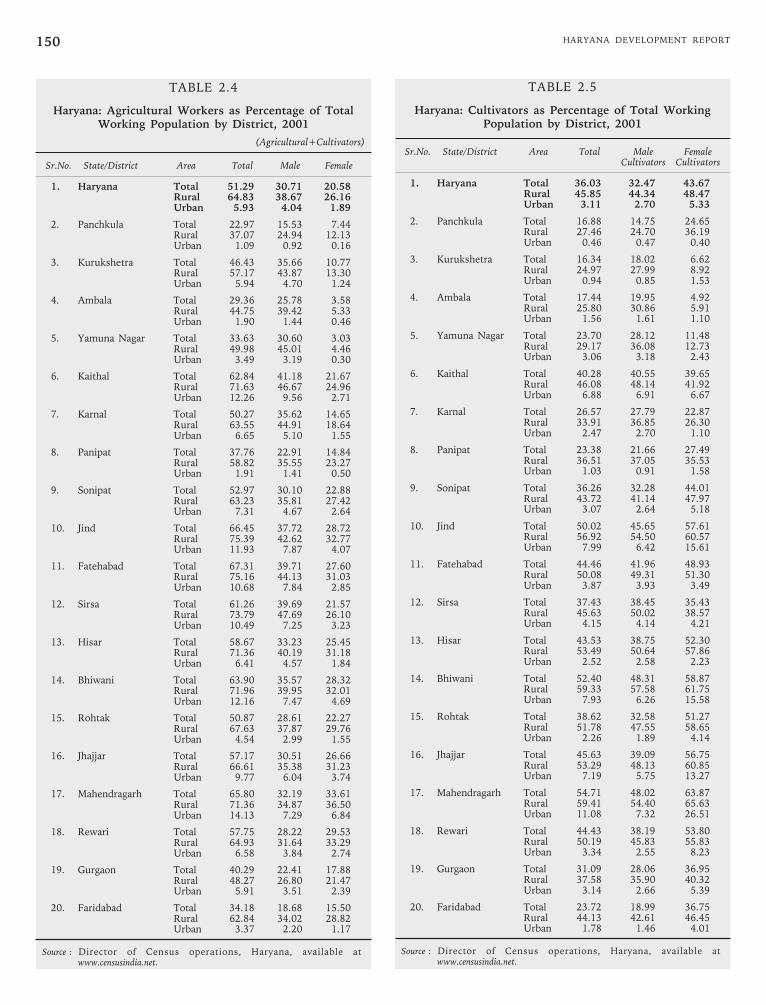
HARYANA DEVELOPMENT REPORT150
TABLE 2.4
Haryana: Agricultural Workers as Percentage of TotalWorking Population by District, 2001
(Agricultural+Cultivators)
Sr.No. State/District Area Total Male Female
1. Haryana Total 51.29 30.71 20.58Rural 64.83 38.67 26.16Urban 5.93 4.04 1.89
2. Panchkula Total 22.97 15.53 7.44Rural 37.07 24.94 12.13Urban 1.09 0.92 0.16
3. Kurukshetra Total 46.43 35.66 10.77Rural 57.17 43.87 13.30Urban 5.94 4.70 1.24
4. Ambala Total 29.36 25.78 3.58Rural 44.75 39.42 5.33Urban 1.90 1.44 0.46
5. Yamuna Nagar Total 33.63 30.60 3.03Rural 49.98 45.01 4.46Urban 3.49 3.19 0.30
6. Kaithal Total 62.84 41.18 21.67Rural 71.63 46.67 24.96Urban 12.26 9.56 2.71
7. Karnal Total 50.27 35.62 14.65Rural 63.55 44.91 18.64Urban 6.65 5.10 1.55
8. Panipat Total 37.76 22.91 14.84Rural 58.82 35.55 23.27Urban 1.91 1.41 0.50
9. Sonipat Total 52.97 30.10 22.88Rural 63.23 35.81 27.42Urban 7.31 4.67 2.64
10. Jind Total 66.45 37.72 28.72Rural 75.39 42.62 32.77Urban 11.93 7.87 4.07
11. Fatehabad Total 67.31 39.71 27.60Rural 75.16 44.13 31.03Urban 10.68 7.84 2.85
12. Sirsa Total 61.26 39.69 21.57Rural 73.79 47.69 26.10Urban 10.49 7.25 3.23
13. Hisar Total 58.67 33.23 25.45Rural 71.36 40.19 31.18Urban 6.41 4.57 1.84
14. Bhiwani Total 63.90 35.57 28.32Rural 71.96 39.95 32.01Urban 12.16 7.47 4.69
15. Rohtak Total 50.87 28.61 22.27Rural 67.63 37.87 29.76Urban 4.54 2.99 1.55
16. Jhajjar Total 57.17 30.51 26.66Rural 66.61 35.38 31.23Urban 9.77 6.04 3.74
17. Mahendragarh Total 65.80 32.19 33.61Rural 71.36 34.87 36.50Urban 14.13 7.29 6.84
18. Rewari Total 57.75 28.22 29.53Rural 64.93 31.64 33.29Urban 6.58 3.84 2.74
19. Gurgaon Total 40.29 22.41 17.88Rural 48.27 26.80 21.47Urban 5.91 3.51 2.39
20. Faridabad Total 34.18 18.68 15.50Rural 62.84 34.02 28.82Urban 3.37 2.20 1.17
Source : Director of Census operations, Haryana, available atwww.censusindia.net.
TABLE 2.5
Haryana: Cultivators as Percentage of Total WorkingPopulation by District, 2001
Sr.No. State/District Area Total Male FemaleCultivators Cultivators
1. Haryana Total 36.03 32.47 43.67Rural 45.85 44.34 48.47Urban 3.11 2.70 5.33
2. Panchkula Total 16.88 14.75 24.65Rural 27.46 24.70 36.19Urban 0.46 0.47 0.40
3. Kurukshetra Total 16.34 18.02 6.62Rural 24.97 27.99 8.92Urban 0.94 0.85 1.53
4. Ambala Total 17.44 19.95 4.92Rural 25.80 30.86 5.91Urban 1.56 1.61 1.10
5. Yamuna Nagar Total 23.70 28.12 11.48Rural 29.17 36.08 12.73Urban 3.06 3.18 2.43
6. Kaithal Total 40.28 40.55 39.65Rural 46.08 48.14 41.92Urban 6.88 6.91 6.67
7. Karnal Total 26.57 27.79 22.87Rural 33.91 36.85 26.30Urban 2.47 2.70 1.10
8. Panipat Total 23.38 21.66 27.49Rural 36.51 37.05 35.53Urban 1.03 0.91 1.58
9. Sonipat Total 36.26 32.28 44.01Rural 43.72 41.14 47.97Urban 3.07 2.64 5.18
10. Jind Total 50.02 45.65 57.61Rural 56.92 54.50 60.57Urban 7.99 6.42 15.61
11. Fatehabad Total 44.46 41.96 48.93Rural 50.08 49.31 51.30Urban 3.87 3.93 3.49
12. Sirsa Total 37.43 38.45 35.43Rural 45.63 50.02 38.57Urban 4.15 4.14 4.21
13. Hisar Total 43.53 38.75 52.30Rural 53.49 50.64 57.86Urban 2.52 2.58 2.23
14. Bhiwani Total 52.40 48.31 58.87Rural 59.33 57.58 61.75Urban 7.93 6.26 15.58
15. Rohtak Total 38.62 32.58 51.27Rural 51.78 47.55 58.65Urban 2.26 1.89 4.14
16. Jhajjar Total 45.63 39.09 56.75Rural 53.29 48.13 60.85Urban 7.19 5.75 13.27
17. Mahendragarh Total 54.71 48.02 63.87Rural 59.41 54.40 65.63Urban 11.08 7.32 26.51
18. Rewari Total 44.43 38.19 53.80Rural 50.19 45.83 55.83Urban 3.34 2.55 8.23
19. Gurgaon Total 31.09 28.06 36.95Rural 37.58 35.90 40.32Urban 3.14 2.66 5.39
20. Faridabad Total 23.72 18.99 36.75Rural 44.13 42.61 46.45Urban 1.78 1.46 4.01
Source : Director of Census operations, Haryana, available atwww.censusindia.net.
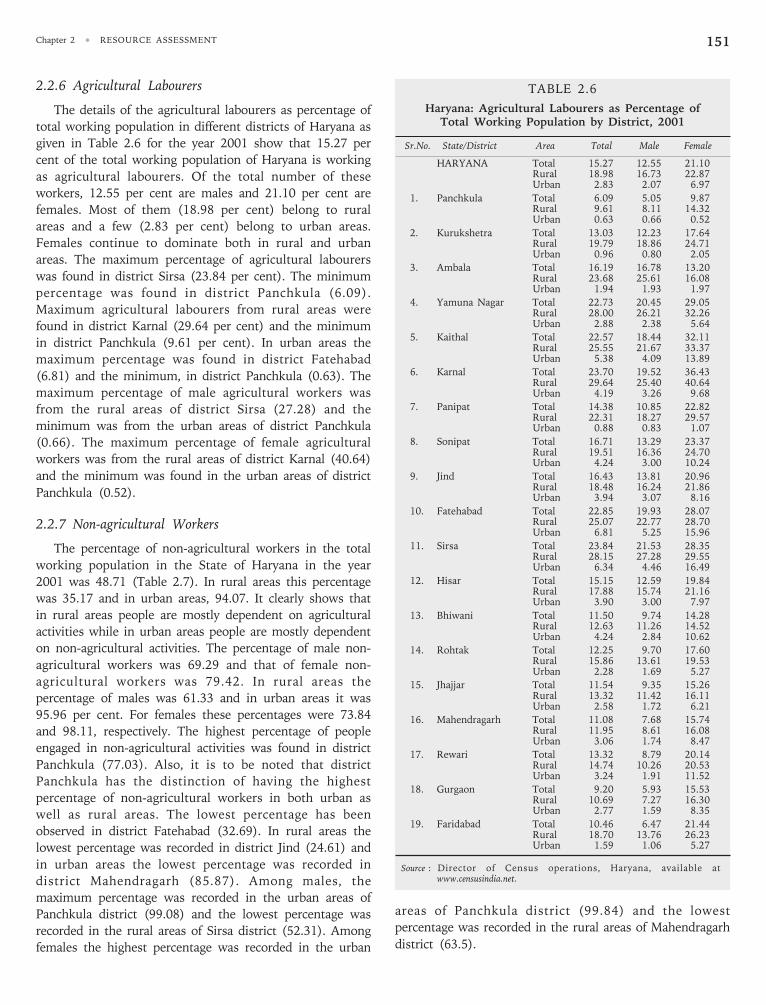
Chapter 2 • RESOURCE ASSESSMENT 151
2.2.6 Agricultural Labourers
The details of the agricultural labourers as percentage of
total working population in different districts of Haryana as
given in Table 2.6 for the year 2001 show that 15.27 per
cent of the total working population of Haryana is working
as agricultural labourers. Of the total number of these
workers, 12.55 per cent are males and 21.10 per cent are
females. Most of them (18.98 per cent) belong to rural
areas and a few (2.83 per cent) belong to urban areas.
Females continue to dominate both in rural and urban
areas. The maximum percentage of agricultural labourers
was found in district Sirsa (23.84 per cent). The minimum
percentage was found in district Panchkula (6.09).
Maximum agricultural labourers from rural areas were
found in district Karnal (29.64 per cent) and the minimum
in district Panchkula (9.61 per cent). In urban areas the
maximum percentage was found in district Fatehabad
(6.81) and the minimum, in district Panchkula (0.63). The
maximum percentage of male agricultural workers was
from the rural areas of district Sirsa (27.28) and the
minimum was from the urban areas of district Panchkula
(0.66). The maximum percentage of female agricultural
workers was from the rural areas of district Karnal (40.64)
and the minimum was found in the urban areas of district
Panchkula (0.52).
2.2.7 Non-agricultural Workers
The percentage of non-agricultural workers in the total
working population in the State of Haryana in the year
2001 was 48.71 (Table 2.7). In rural areas this percentage
was 35.17 and in urban areas, 94.07. It clearly shows that
in rural areas people are mostly dependent on agricultural
activities while in urban areas people are mostly dependent
on non-agricultural activities. The percentage of male non-
agricultural workers was 69.29 and that of female non-
agricultural workers was 79.42. In rural areas the
percentage of males was 61.33 and in urban areas it was
95.96 per cent. For females these percentages were 73.84
and 98.11, respectively. The highest percentage of people
engaged in non-agricultural activities was found in district
Panchkula (77.03). Also, it is to be noted that district
Panchkula has the distinction of having the highest
percentage of non-agricultural workers in both urban as
well as rural areas. The lowest percentage has been
observed in district Fatehabad (32.69). In rural areas the
lowest percentage was recorded in district Jind (24.61) and
in urban areas the lowest percentage was recorded in
district Mahendragarh (85.87). Among males, the
maximum percentage was recorded in the urban areas of
Panchkula district (99.08) and the lowest percentage was
recorded in the rural areas of Sirsa district (52.31). Among
females the highest percentage was recorded in the urban
TABLE 2.6
Haryana: Agricultural Labourers as Percentage ofTotal Working Population by District, 2001
Sr.No. State/District Area Total Male Female
HARYANA Total 15.27 12.55 21.10Rural 18.98 16.73 22.87Urban 2.83 2.07 6.97
1. Panchkula Total 6.09 5.05 9.87Rural 9.61 8.11 14.32Urban 0.63 0.66 0.52
2. Kurukshetra Total 13.03 12.23 17.64Rural 19.79 18.86 24.71Urban 0.96 0.80 2.05
3. Ambala Total 16.19 16.78 13.20Rural 23.68 25.61 16.08Urban 1.94 1.93 1.97
4. Yamuna Nagar Total 22.73 20.45 29.05Rural 28.00 26.21 32.26Urban 2.88 2.38 5.64
5. Kaithal Total 22.57 18.44 32.11Rural 25.55 21.67 33.37Urban 5.38 4.09 13.89
6. Karnal Total 23.70 19.52 36.43Rural 29.64 25.40 40.64Urban 4.19 3.26 9.68
7. Panipat Total 14.38 10.85 22.82Rural 22.31 18.27 29.57Urban 0.88 0.83 1.07
8. Sonipat Total 16.71 13.29 23.37Rural 19.51 16.36 24.70Urban 4.24 3.00 10.24
9. Jind Total 16.43 13.81 20.96Rural 18.48 16.24 21.86Urban 3.94 3.07 8.16
10. Fatehabad Total 22.85 19.93 28.07Rural 25.07 22.77 28.70Urban 6.81 5.25 15.96
11. Sirsa Total 23.84 21.53 28.35Rural 28.15 27.28 29.55Urban 6.34 4.46 16.49
12. Hisar Total 15.15 12.59 19.84Rural 17.88 15.74 21.16Urban 3.90 3.00 7.97
13. Bhiwani Total 11.50 9.74 14.28Rural 12.63 11.26 14.52Urban 4.24 2.84 10.62
14. Rohtak Total 12.25 9.70 17.60Rural 15.86 13.61 19.53Urban 2.28 1.69 5.27
15. Jhajjar Total 11.54 9.35 15.26Rural 13.32 11.42 16.11Urban 2.58 1.72 6.21
16. Mahendragarh Total 11.08 7.68 15.74Rural 11.95 8.61 16.08Urban 3.06 1.74 8.47
17. Rewari Total 13.32 8.79 20.14Rural 14.74 10.26 20.53Urban 3.24 1.91 11.52
18. Gurgaon Total 9.20 5.93 15.53Rural 10.69 7.27 16.30Urban 2.77 1.59 8.35
19. Faridabad Total 10.46 6.47 21.44Rural 18.70 13.76 26.23Urban 1.59 1.06 5.27
Source : Director of Census operations, Haryana, available atwww.censusindia.net.
areas of Panchkula district (99.84) and the lowest
percentage was recorded in the rural areas of Mahendragarh
district (63.5).
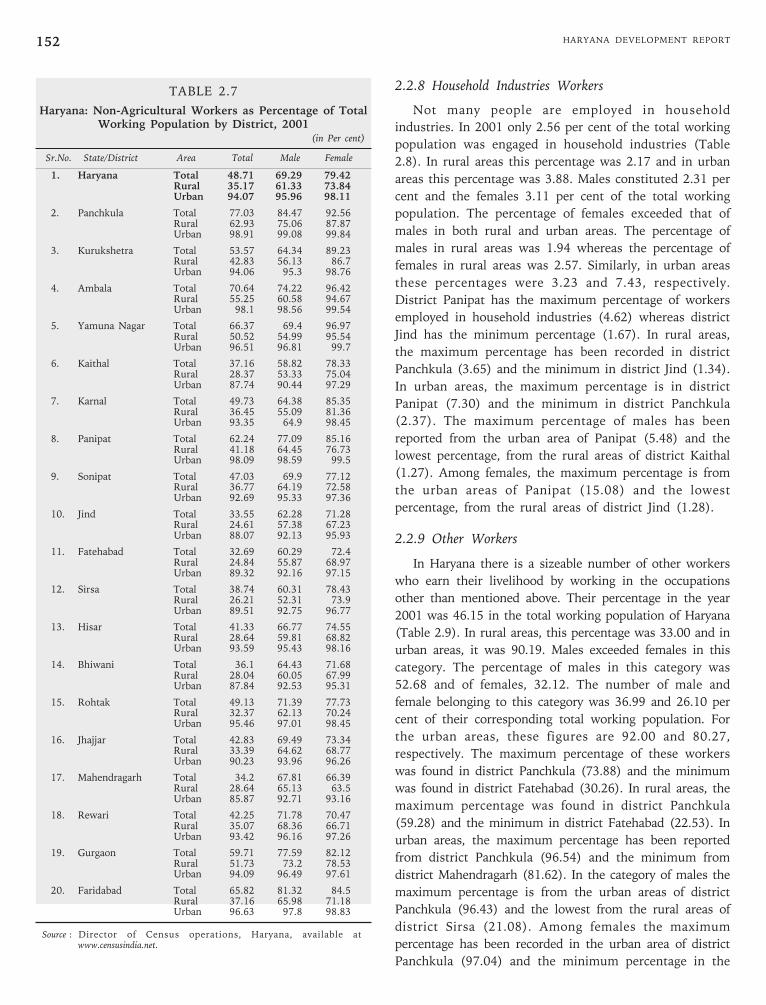
HARYANA DEVELOPMENT REPORT152
TABLE 2.7
Haryana: Non-Agricultural Workers as Percentage of TotalWorking Population by District, 2001
(in Per cent)
Sr.No. State/District Area Total Male Female
1. Haryana Total 48.71 69.29 79.42Rural 35.17 61.33 73.84Urban 94.07 95.96 98.11
2. Panchkula Total 77.03 84.47 92.56Rural 62.93 75.06 87.87Urban 98.91 99.08 99.84
3. Kurukshetra Total 53.57 64.34 89.23Rural 42.83 56.13 86.7Urban 94.06 95.3 98.76
4. Ambala Total 70.64 74.22 96.42Rural 55.25 60.58 94.67Urban 98.1 98.56 99.54
5. Yamuna Nagar Total 66.37 69.4 96.97Rural 50.52 54.99 95.54Urban 96.51 96.81 99.7
6. Kaithal Total 37.16 58.82 78.33Rural 28.37 53.33 75.04Urban 87.74 90.44 97.29
7. Karnal Total 49.73 64.38 85.35Rural 36.45 55.09 81.36Urban 93.35 64.9 98.45
8. Panipat Total 62.24 77.09 85.16Rural 41.18 64.45 76.73Urban 98.09 98.59 99.5
9. Sonipat Total 47.03 69.9 77.12Rural 36.77 64.19 72.58Urban 92.69 95.33 97.36
10. Jind Total 33.55 62.28 71.28Rural 24.61 57.38 67.23Urban 88.07 92.13 95.93
11. Fatehabad Total 32.69 60.29 72.4Rural 24.84 55.87 68.97Urban 89.32 92.16 97.15
12. Sirsa Total 38.74 60.31 78.43Rural 26.21 52.31 73.9Urban 89.51 92.75 96.77
13. Hisar Total 41.33 66.77 74.55Rural 28.64 59.81 68.82Urban 93.59 95.43 98.16
14. Bhiwani Total 36.1 64.43 71.68Rural 28.04 60.05 67.99Urban 87.84 92.53 95.31
15. Rohtak Total 49.13 71.39 77.73Rural 32.37 62.13 70.24Urban 95.46 97.01 98.45
16. Jhajjar Total 42.83 69.49 73.34Rural 33.39 64.62 68.77Urban 90.23 93.96 96.26
17. Mahendragarh Total 34.2 67.81 66.39Rural 28.64 65.13 63.5Urban 85.87 92.71 93.16
18. Rewari Total 42.25 71.78 70.47Rural 35.07 68.36 66.71Urban 93.42 96.16 97.26
19. Gurgaon Total 59.71 77.59 82.12Rural 51.73 73.2 78.53Urban 94.09 96.49 97.61
20. Faridabad Total 65.82 81.32 84.5Rural 37.16 65.98 71.18Urban 96.63 97.8 98.83
Source : Director of Census operations, Haryana, available atwww.censusindia.net.
2.2.8 Household Industries Workers
Not many people are employed in household
industries. In 2001 only 2.56 per cent of the total working
population was engaged in household industries (Table
2.8). In rural areas this percentage was 2.17 and in urban
areas this percentage was 3.88. Males constituted 2.31 per
cent and the females 3.11 per cent of the total working
population. The percentage of females exceeded that of
males in both rural and urban areas. The percentage of
males in rural areas was 1.94 whereas the percentage of
females in rural areas was 2.57. Similarly, in urban areas
these percentages were 3.23 and 7.43, respectively.
District Panipat has the maximum percentage of workers
employed in household industries (4.62) whereas district
Jind has the minimum percentage (1.67). In rural areas,
the maximum percentage has been recorded in district
Panchkula (3.65) and the minimum in district Jind (1.34).
In urban areas, the maximum percentage is in district
Panipat (7.30) and the minimum in district Panchkula
(2.37). The maximum percentage of males has been
reported from the urban area of Panipat (5.48) and the
lowest percentage, from the rural areas of district Kaithal
(1.27). Among females, the maximum percentage is from
the urban areas of Panipat (15.08) and the lowest
percentage, from the rural areas of district Jind (1.28).
2.2.9 Other Workers
In Haryana there is a sizeable number of other workers
who earn their livelihood by working in the occupations
other than mentioned above. Their percentage in the year
2001 was 46.15 in the total working population of Haryana
(Table 2.9). In rural areas, this percentage was 33.00 and in
urban areas, it was 90.19. Males exceeded females in this
category. The percentage of males in this category was
52.68 and of females, 32.12. The number of male and
female belonging to this category was 36.99 and 26.10 per
cent of their corresponding total working population. For
the urban areas, these figures are 92.00 and 80.27,
respectively. The maximum percentage of these workers
was found in district Panchkula (73.88) and the minimum
was found in district Fatehabad (30.26). In rural areas, the
maximum percentage was found in district Panchkula
(59.28) and the minimum in district Fatehabad (22.53). In
urban areas, the maximum percentage has been reported
from district Panchkula (96.54) and the minimum from
district Mahendragarh (81.62). In the category of males the
maximum percentage is from the urban areas of district
Panchkula (96.43) and the lowest from the rural areas of
district Sirsa (21.08). Among females the maximum
percentage has been recorded in the urban area of district
Panchkula (97.04) and the minimum percentage in the
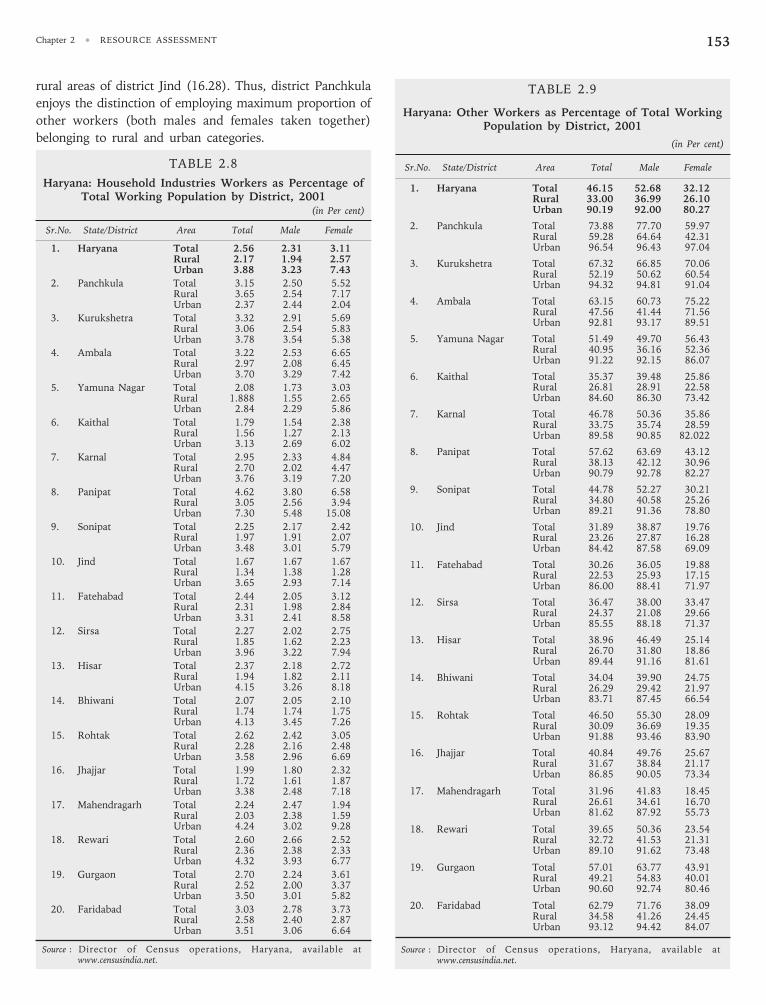
Chapter 2 • RESOURCE ASSESSMENT 153
rural areas of district Jind (16.28). Thus, district Panchkula
enjoys the distinction of employing maximum proportion of
other workers (both males and females taken together)
belonging to rural and urban categories.
TABLE 2.8
Haryana: Household Industries Workers as Percentage ofTotal Working Population by District, 2001
(in Per cent)
Sr.No. State/District Area Total Male Female
1. Haryana Total 2.56 2.31 3.11Rural 2.17 1.94 2.57Urban 3.88 3.23 7.43
2. Panchkula Total 3.15 2.50 5.52Rural 3.65 2.54 7.17Urban 2.37 2.44 2.04
3. Kurukshetra Total 3.32 2.91 5.69Rural 3.06 2.54 5.83Urban 3.78 3.54 5.38
4. Ambala Total 3.22 2.53 6.65Rural 2.97 2.08 6.45Urban 3.70 3.29 7.42
5. Yamuna Nagar Total 2.08 1.73 3.03Rural 1.888 1.55 2.65Urban 2.84 2.29 5.86
6. Kaithal Total 1.79 1.54 2.38Rural 1.56 1.27 2.13Urban 3.13 2.69 6.02
7. Karnal Total 2.95 2.33 4.84Rural 2.70 2.02 4.47Urban 3.76 3.19 7.20
8. Panipat Total 4.62 3.80 6.58Rural 3.05 2.56 3.94Urban 7.30 5.48 15.08
9. Sonipat Total 2.25 2.17 2.42Rural 1.97 1.91 2.07Urban 3.48 3.01 5.79
10. Jind Total 1.67 1.67 1.67Rural 1.34 1.38 1.28Urban 3.65 2.93 7.14
11. Fatehabad Total 2.44 2.05 3.12Rural 2.31 1.98 2.84Urban 3.31 2.41 8.58
12. Sirsa Total 2.27 2.02 2.75Rural 1.85 1.62 2.23Urban 3.96 3.22 7.94
13. Hisar Total 2.37 2.18 2.72Rural 1.94 1.82 2.11Urban 4.15 3.26 8.18
14. Bhiwani Total 2.07 2.05 2.10Rural 1.74 1.74 1.75Urban 4.13 3.45 7.26
15. Rohtak Total 2.62 2.42 3.05Rural 2.28 2.16 2.48Urban 3.58 2.96 6.69
16. Jhajjar Total 1.99 1.80 2.32Rural 1.72 1.61 1.87Urban 3.38 2.48 7.18
17. Mahendragarh Total 2.24 2.47 1.94Rural 2.03 2.38 1.59Urban 4.24 3.02 9.28
18. Rewari Total 2.60 2.66 2.52Rural 2.36 2.38 2.33Urban 4.32 3.93 6.77
19. Gurgaon Total 2.70 2.24 3.61Rural 2.52 2.00 3.37Urban 3.50 3.01 5.82
20. Faridabad Total 3.03 2.78 3.73Rural 2.58 2.40 2.87Urban 3.51 3.06 6.64
Source : Director of Census operations, Haryana, available atwww.censusindia.net.
TABLE 2.9
Haryana: Other Workers as Percentage of Total WorkingPopulation by District, 2001
(in Per cent)
Sr.No. State/District Area Total Male Female
1. Haryana Total 46.15 52.68 32.12Rural 33.00 36.99 26.10Urban 90.19 92.00 80.27
2. Panchkula Total 73.88 77.70 59.97Rural 59.28 64.64 42.31Urban 96.54 96.43 97.04
3. Kurukshetra Total 67.32 66.85 70.06Rural 52.19 50.62 60.54Urban 94.32 94.81 91.04
4. Ambala Total 63.15 60.73 75.22Rural 47.56 41.44 71.56Urban 92.81 93.17 89.51
5. Yamuna Nagar Total 51.49 49.70 56.43Rural 40.95 36.16 52.36Urban 91.22 92.15 86.07
6. Kaithal Total 35.37 39.48 25.86Rural 26.81 28.91 22.58Urban 84.60 86.30 73.42
7. Karnal Total 46.78 50.36 35.86Rural 33.75 35.74 28.59Urban 89.58 90.85 82.022
8. Panipat Total 57.62 63.69 43.12Rural 38.13 42.12 30.96Urban 90.79 92.78 82.27
9. Sonipat Total 44.78 52.27 30.21Rural 34.80 40.58 25.26Urban 89.21 91.36 78.80
10. Jind Total 31.89 38.87 19.76Rural 23.26 27.87 16.28Urban 84.42 87.58 69.09
11. Fatehabad Total 30.26 36.05 19.88Rural 22.53 25.93 17.15Urban 86.00 88.41 71.97
12. Sirsa Total 36.47 38.00 33.47Rural 24.37 21.08 29.66Urban 85.55 88.18 71.37
13. Hisar Total 38.96 46.49 25.14Rural 26.70 31.80 18.86Urban 89.44 91.16 81.61
14. Bhiwani Total 34.04 39.90 24.75Rural 26.29 29.42 21.97Urban 83.71 87.45 66.54
15. Rohtak Total 46.50 55.30 28.09Rural 30.09 36.69 19.35Urban 91.88 93.46 83.90
16. Jhajjar Total 40.84 49.76 25.67Rural 31.67 38.84 21.17Urban 86.85 90.05 73.34
17. Mahendragarh Total 31.96 41.83 18.45Rural 26.61 34.61 16.70Urban 81.62 87.92 55.73
18. Rewari Total 39.65 50.36 23.54Rural 32.72 41.53 21.31Urban 89.10 91.62 73.48
19. Gurgaon Total 57.01 63.77 43.91Rural 49.21 54.83 40.01Urban 90.60 92.74 80.46
20. Faridabad Total 62.79 71.76 38.09Rural 34.58 41.26 24.45Urban 93.12 94.42 84.07
Source : Director of Census operations, Haryana, available atwww.censusindia.net.
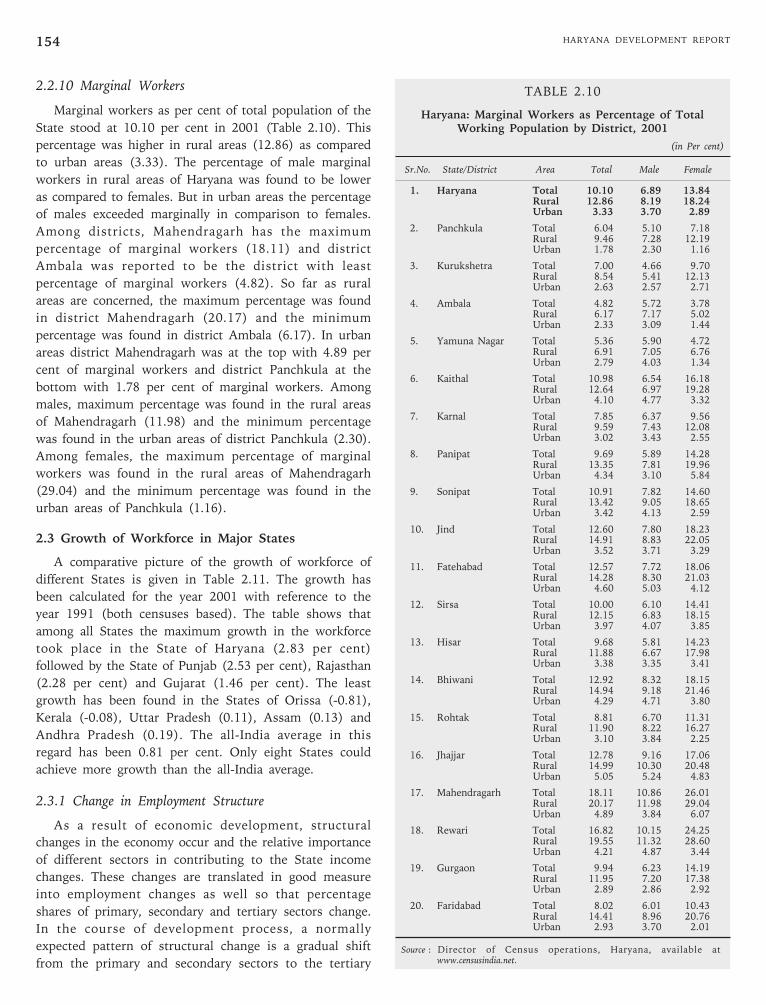
HARYANA DEVELOPMENT REPORT154
2.2.10 Marginal Workers
Marginal workers as per cent of total population of the
State stood at 10.10 per cent in 2001 (Table 2.10). This
percentage was higher in rural areas (12.86) as compared
to urban areas (3.33). The percentage of male marginal
workers in rural areas of Haryana was found to be lower
as compared to females. But in urban areas the percentage
of males exceeded marginally in comparison to females.
Among districts, Mahendragarh has the maximum
percentage of marginal workers (18.11) and district
Ambala was reported to be the district with least
percentage of marginal workers (4.82). So far as rural
areas are concerned, the maximum percentage was found
in district Mahendragarh (20.17) and the minimum
percentage was found in district Ambala (6.17). In urban
areas district Mahendragarh was at the top with 4.89 per
cent of marginal workers and district Panchkula at the
bottom with 1.78 per cent of marginal workers. Among
males, maximum percentage was found in the rural areas
of Mahendragarh (11.98) and the minimum percentage
was found in the urban areas of district Panchkula (2.30).
Among females, the maximum percentage of marginal
workers was found in the rural areas of Mahendragarh
(29.04) and the minimum percentage was found in the
urban areas of Panchkula (1.16).
2.3 Growth of Workforce in Major States
A comparative picture of the growth of workforce of
different States is given in Table 2.11. The growth has
been calculated for the year 2001 with reference to the
year 1991 (both censuses based). The table shows that
among all States the maximum growth in the workforce
took place in the State of Haryana (2.83 per cent)
followed by the State of Punjab (2.53 per cent), Rajasthan
(2.28 per cent) and Gujarat (1.46 per cent). The least
growth has been found in the States of Orissa (-0.81),
Kerala (-0.08), Uttar Pradesh (0.11), Assam (0.13) and
Andhra Pradesh (0.19). The all-India average in this
regard has been 0.81 per cent. Only eight States could
achieve more growth than the all-India average.
2.3.1 Change in Employment Structure
As a result of economic development, structural
changes in the economy occur and the relative importance
of different sectors in contributing to the State income
changes. These changes are translated in good measure
into employment changes as well so that percentage
shares of primary, secondary and tertiary sectors change.
In the course of development process, a normally
expected pattern of structural change is a gradual shift
from the primary and secondary sectors to the tertiary
TABLE 2.10
Haryana: Marginal Workers as Percentage of TotalWorking Population by District, 2001
(in Per cent)
Sr.No. State/District Area Total Male Female
1. Haryana Total 10.10 6.89 13.84Rural 12.86 8.19 18.24Urban 3.33 3.70 2.89
2. Panchkula Total 6.04 5.10 7.18Rural 9.46 7.28 12.19Urban 1.78 2.30 1.16
3. Kurukshetra Total 7.00 4.66 9.70Rural 8.54 5.41 12.13Urban 2.63 2.57 2.71
4. Ambala Total 4.82 5.72 3.78Rural 6.17 7.17 5.02Urban 2.33 3.09 1.44
5. Yamuna Nagar Total 5.36 5.90 4.72Rural 6.91 7.05 6.76Urban 2.79 4.03 1.34
6. Kaithal Total 10.98 6.54 16.18Rural 12.64 6.97 19.28Urban 4.10 4.77 3.32
7. Karnal Total 7.85 6.37 9.56Rural 9.59 7.43 12.08Urban 3.02 3.43 2.55
8. Panipat Total 9.69 5.89 14.28Rural 13.35 7.81 19.96Urban 4.34 3.10 5.84
9. Sonipat Total 10.91 7.82 14.60Rural 13.42 9.05 18.65Urban 3.42 4.13 2.59
10. Jind Total 12.60 7.80 18.23Rural 14.91 8.83 22.05Urban 3.52 3.71 3.29
11. Fatehabad Total 12.57 7.72 18.06Rural 14.28 8.30 21.03Urban 4.60 5.03 4.12
12. Sirsa Total 10.00 6.10 14.41Rural 12.15 6.83 18.15Urban 3.97 4.07 3.85
13. Hisar Total 9.68 5.81 14.23Rural 11.88 6.67 17.98Urban 3.38 3.35 3.41
14. Bhiwani Total 12.92 8.32 18.15Rural 14.94 9.18 21.46Urban 4.29 4.71 3.80
15. Rohtak Total 8.81 6.70 11.31Rural 11.90 8.22 16.27Urban 3.10 3.84 2.25
16. Jhajjar Total 12.78 9.16 17.06Rural 14.99 10.30 20.48Urban 5.05 5.24 4.83
17. Mahendragarh Total 18.11 10.86 26.01Rural 20.17 11.98 29.04Urban 4.89 3.84 6.07
18. Rewari Total 16.82 10.15 24.25Rural 19.55 11.32 28.60Urban 4.21 4.87 3.44
19. Gurgaon Total 9.94 6.23 14.19Rural 11.95 7.20 17.38Urban 2.89 2.86 2.92
20. Faridabad Total 8.02 6.01 10.43Rural 14.41 8.96 20.76Urban 2.93 3.70 2.01
Source : Director of Census operations, Haryana, available atwww.censusindia.net.
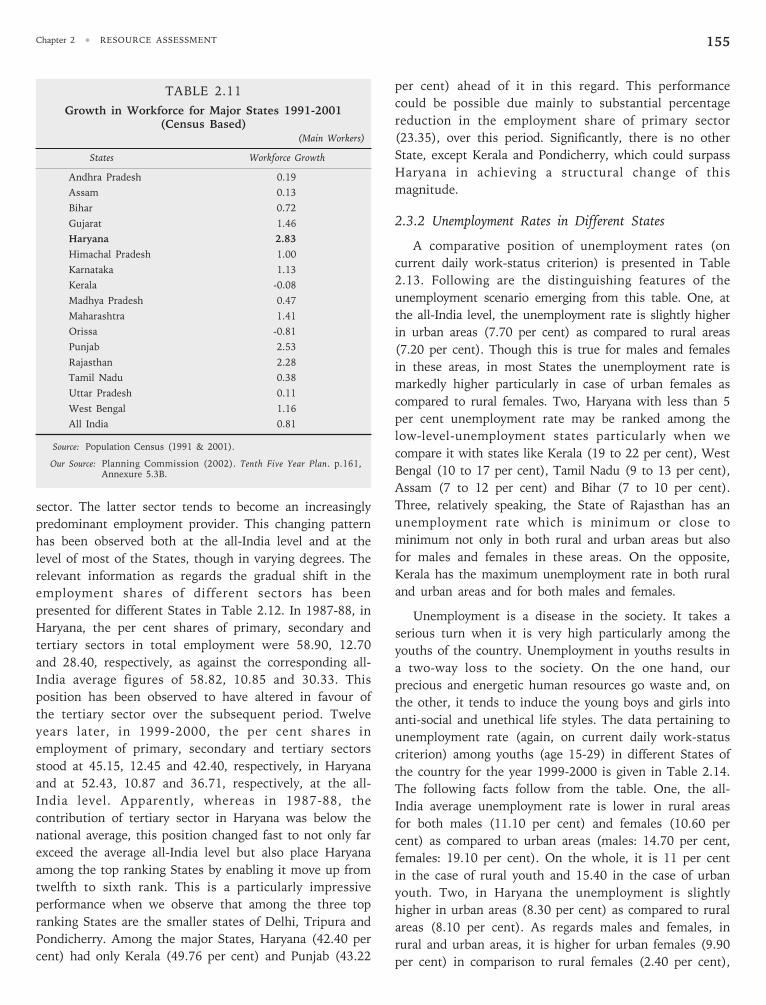
Chapter 2 • RESOURCE ASSESSMENT 155
sector. The latter sector tends to become an increasingly
predominant employment provider. This changing pattern
has been observed both at the all-India level and at the
level of most of the States, though in varying degrees. The
relevant information as regards the gradual shift in the
employment shares of different sectors has been
presented for different States in Table 2.12. In 1987-88, in
Haryana, the per cent shares of primary, secondary and
tertiary sectors in total employment were 58.90, 12.70
and 28.40, respectively, as against the corresponding all-
India average figures of 58.82, 10.85 and 30.33. This
position has been observed to have altered in favour of
the tertiary sector over the subsequent period. Twelve
years later, in 1999-2000, the per cent shares in
employment of primary, secondary and tertiary sectors
stood at 45.15, 12.45 and 42.40, respectively, in Haryana
and at 52.43, 10.87 and 36.71, respectively, at the all-
India level. Apparently, whereas in 1987-88, the
contribution of tertiary sector in Haryana was below the
national average, this position changed fast to not only far
exceed the average all-India level but also place Haryana
among the top ranking States by enabling it move up from
twelfth to sixth rank. This is a particularly impressive
performance when we observe that among the three top
ranking States are the smaller states of Delhi, Tripura and
Pondicherry. Among the major States, Haryana (42.40 per
cent) had only Kerala (49.76 per cent) and Punjab (43.22
per cent) ahead of it in this regard. This performance
could be possible due mainly to substantial percentage
reduction in the employment share of primary sector
(23.35), over this period. Significantly, there is no other
State, except Kerala and Pondicherry, which could surpass
Haryana in achieving a structural change of this
magnitude.
2.3.2 Unemployment Rates in Different States
A comparative position of unemployment rates (on
current daily work-status criterion) is presented in Table
2.13. Following are the distinguishing features of the
unemployment scenario emerging from this table. One, at
the all-India level, the unemployment rate is slightly higher
in urban areas (7.70 per cent) as compared to rural areas
(7.20 per cent). Though this is true for males and females
in these areas, in most States the unemployment rate is
markedly higher particularly in case of urban females as
compared to rural females. Two, Haryana with less than 5
per cent unemployment rate may be ranked among the
low-level-unemployment states particularly when we
compare it with states like Kerala (19 to 22 per cent), West
Bengal (10 to 17 per cent), Tamil Nadu (9 to 13 per cent),
Assam (7 to 12 per cent) and Bihar (7 to 10 per cent).
Three, relatively speaking, the State of Rajasthan has an
unemployment rate which is minimum or close to
minimum not only in both rural and urban areas but also
for males and females in these areas. On the opposite,
Kerala has the maximum unemployment rate in both rural
and urban areas and for both males and females.
Unemployment is a disease in the society. It takes a
serious turn when it is very high particularly among the
youths of the country. Unemployment in youths results in
a two-way loss to the society. On the one hand, our
precious and energetic human resources go waste and, on
the other, it tends to induce the young boys and girls into
anti-social and unethical life styles. The data pertaining to
unemployment rate (again, on current daily work-status
criterion) among youths (age 15-29) in different States of
the country for the year 1999-2000 is given in Table 2.14.
The following facts follow from the table. One, the all-
India average unemployment rate is lower in rural areas
for both males (11.10 per cent) and females (10.60 per
cent) as compared to urban areas (males: 14.70 per cent,
females: 19.10 per cent). On the whole, it is 11 per cent
in the case of rural youth and 15.40 in the case of urban
youth. Two, in Haryana the unemployment is slightly
higher in urban areas (8.30 per cent) as compared to rural
areas (8.10 per cent). As regards males and females, in
rural and urban areas, it is higher for urban females (9.90
per cent) in comparison to rural females (2.40 per cent),
TABLE 2.11
Growth in Workforce for Major States 1991-2001(Census Based)
(Main Workers)
States Workforce Growth
Andhra Pradesh 0.19
Assam 0.13
Bihar 0.72
Gujarat 1.46
Haryana 2.83
Himachal Pradesh 1.00
Karnataka 1.13
Kerala -0.08
Madhya Pradesh 0.47
Maharashtra 1.41
Orissa -0.81
Punjab 2.53
Rajasthan 2.28
Tamil Nadu 0.38
Uttar Pradesh 0.11
West Bengal 1.16
All India 0.81
Source: Population Census (1991 & 2001).
Our Source: Planning Commission (2002). Tenth Five Year Plan. p.161,Annexure 5.3B.
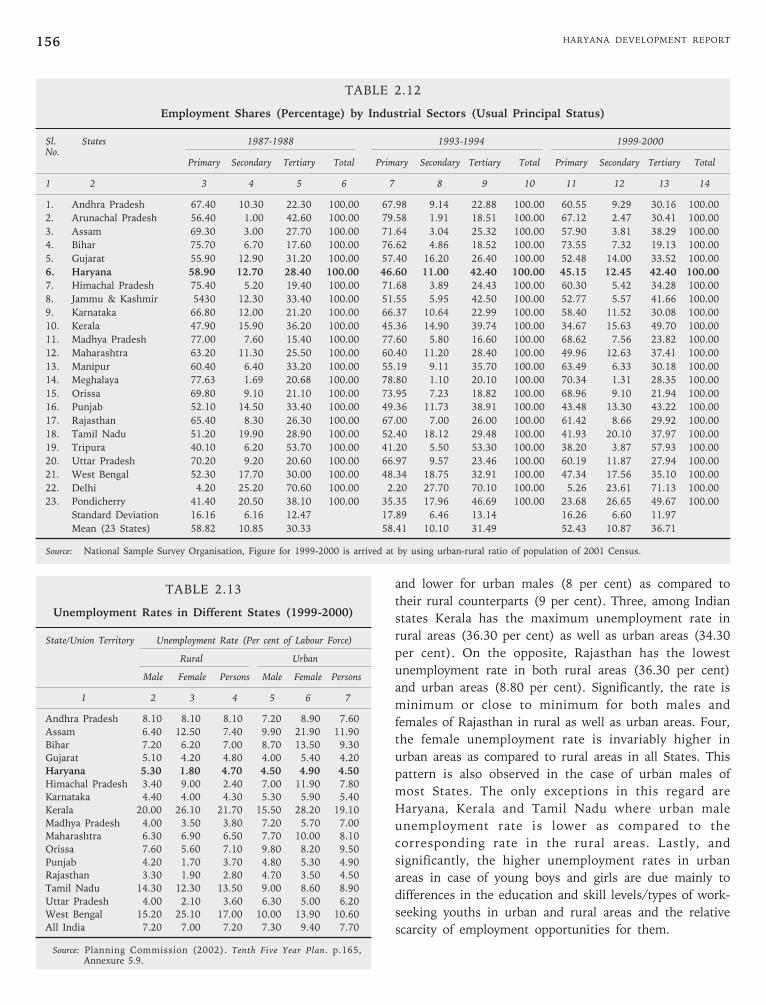
HARYANA DEVELOPMENT REPORT156
TABLE 2.12
Employment Shares (Percentage) by Industrial Sectors (Usual Principal Status)
Sl. States 1987-1988 1993-1994 1999-2000No.
Primary Secondary Tertiary Total Primary Secondary Tertiary Total Primary Secondary Tertiary Total
1 2 3 4 5 6 7 8 9 10 11 12 13 14
1. Andhra Pradesh 67.40 10.30 22.30 100.00 67.98 9.14 22.88 100.00 60.55 9.29 30.16 100.00
2. Arunachal Pradesh 56.40 1.00 42.60 100.00 79.58 1.91 18.51 100.00 67.12 2.47 30.41 100.00
3. Assam 69.30 3.00 27.70 100.00 71.64 3.04 25.32 100.00 57.90 3.81 38.29 100.00
4. Bihar 75.70 6.70 17.60 100.00 76.62 4.86 18.52 100.00 73.55 7.32 19.13 100.00
5. Gujarat 55.90 12.90 31.20 100.00 57.40 16.20 26.40 100.00 52.48 14.00 33.52 100.00
6. Haryana 58.90 12.70 28.40 100.00 46.60 11.00 42.40 100.00 45.15 12.45 42.40 100.00
7. Himachal Pradesh 75.40 5.20 19.40 100.00 71.68 3.89 24.43 100.00 60.30 5.42 34.28 100.00
8. Jammu & Kashmir 5430 12.30 33.40 100.00 51.55 5.95 42.50 100.00 52.77 5.57 41.66 100.00
9. Karnataka 66.80 12.00 21.20 100.00 66.37 10.64 22.99 100.00 58.40 11.52 30.08 100.00
10. Kerala 47.90 15.90 36.20 100.00 45.36 14.90 39.74 100.00 34.67 15.63 49.70 100.00
11. Madhya Pradesh 77.00 7.60 15.40 100.00 77.60 5.80 16.60 100.00 68.62 7.56 23.82 100.00
12. Maharashtra 63.20 11.30 25.50 100.00 60.40 11.20 28.40 100.00 49.96 12.63 37.41 100.00
13. Manipur 60.40 6.40 33.20 100.00 55.19 9.11 35.70 100.00 63.49 6.33 30.18 100.00
14. Meghalaya 77.63 1.69 20.68 100.00 78.80 1.10 20.10 100.00 70.34 1.31 28.35 100.00
15. Orissa 69.80 9.10 21.10 100.00 73.95 7.23 18.82 100.00 68.96 9.10 21.94 100.00
16. Punjab 52.10 14.50 33.40 100.00 49.36 11.73 38.91 100.00 43.48 13.30 43.22 100.00
17. Rajasthan 65.40 8.30 26.30 100.00 67.00 7.00 26.00 100.00 61.42 8.66 29.92 100.00
18. Tamil Nadu 51.20 19.90 28.90 100.00 52.40 18.12 29.48 100.00 41.93 20.10 37.97 100.00
19. Tripura 40.10 6.20 53.70 100.00 41.20 5.50 53.30 100.00 38.20 3.87 57.93 100.00
20. Uttar Pradesh 70.20 9.20 20.60 100.00 66.97 9.57 23.46 100.00 60.19 11.87 27.94 100.00
21. West Bengal 52.30 17.70 30.00 100.00 48.34 18.75 32.91 100.00 47.34 17.56 35.10 100.00
22. Delhi 4.20 25.20 70.60 100.00 2.20 27.70 70.10 100.00 5.26 23.61 71.13 100.00
23. Pondicherry 41.40 20.50 38.10 100.00 35.35 17.96 46.69 100.00 23.68 26.65 49.67 100.00
Standard Deviation 16.16 6.16 12.47 17.89 6.46 13.14 16.26 6.60 11.97
Mean (23 States) 58.82 10.85 30.33 58.41 10.10 31.49 52.43 10.87 36.71
Source: National Sample Survey Organisation, Figure for 1999-2000 is arrived at by using urban-rural ratio of population of 2001 Census.
TABLE 2.13
Unemployment Rates in Different States (1999-2000)
State/Union Territory Unemployment Rate (Per cent of Labour Force)
Rural Urban
Male Female Persons Male Female Persons
1 2 3 4 5 6 7
Andhra Pradesh 8.10 8.10 8.10 7.20 8.90 7.60
Assam 6.40 12.50 7.40 9.90 21.90 11.90
Bihar 7.20 6.20 7.00 8.70 13.50 9.30
Gujarat 5.10 4.20 4.80 4.00 5.40 4.20
Haryana 5.30 1.80 4.70 4.50 4.90 4.50
Himachal Pradesh 3.40 9.00 2.40 7.00 11.90 7.80
Karnataka 4.40 4.00 4.30 5.30 5.90 5.40
Kerala 20.00 26.10 21.70 15.50 28.20 19.10
Madhya Pradesh 4.00 3.50 3.80 7.20 5.70 7.00
Maharashtra 6.30 6.90 6.50 7.70 10.00 8.10
Orissa 7.60 5.60 7.10 9.80 8.20 9.50
Punjab 4.20 1.70 3.70 4.80 5.30 4.90
Rajasthan 3.30 1.90 2.80 4.70 3.50 4.50
Tamil Nadu 14.30 12.30 13.50 9.00 8.60 8.90
Uttar Pradesh 4.00 2.10 3.60 6.30 5.00 6.20
West Bengal 15.20 25.10 17.00 10.00 13.90 10.60
All India 7.20 7.00 7.20 7.30 9.40 7.70
Source: Planning Commission (2002). Tenth Five Year Plan. p.165,Annexure 5.9.
and lower for urban males (8 per cent) as compared to
their rural counterparts (9 per cent). Three, among Indian
states Kerala has the maximum unemployment rate in
rural areas (36.30 per cent) as well as urban areas (34.30
per cent). On the opposite, Rajasthan has the lowest
unemployment rate in both rural areas (36.30 per cent)
and urban areas (8.80 per cent). Significantly, the rate is
minimum or close to minimum for both males and
females of Rajasthan in rural as well as urban areas. Four,
the female unemployment rate is invariably higher in
urban areas as compared to rural areas in all States. This
pattern is also observed in the case of urban males of
most States. The only exceptions in this regard are
Haryana, Kerala and Tamil Nadu where urban male
unemployment rate is lower as compared to the
corresponding rate in the rural areas. Lastly, and
significantly, the higher unemployment rates in urban
areas in case of young boys and girls are due mainly to
differences in the education and skill levels/types of work-
seeking youths in urban and rural areas and the relative
scarcity of employment opportunities for them.
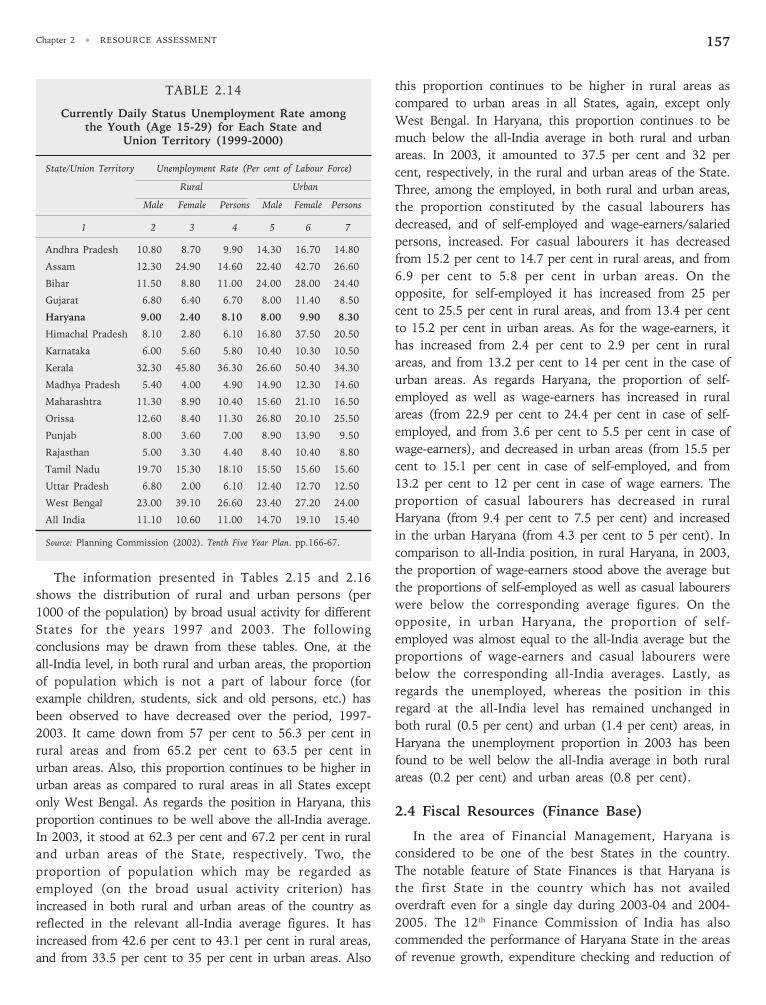
Chapter 2 • RESOURCE ASSESSMENT 157
TABLE 2.14
Currently Daily Status Unemployment Rate amongthe Youth (Age 15-29) for Each State and
Union Territory (1999-2000)
State/Union Territory Unemployment Rate (Per cent of Labour Force)
Rural Urban
Male Female Persons Male Female Persons
1 2 3 4 5 6 7
Andhra Pradesh 10.80 8.70 9.90 14.30 16.70 14.80
Assam 12.30 24.90 14.60 22.40 42.70 26.60
Bihar 11.50 8.80 11.00 24.00 28.00 24.40
Gujarat 6.80 6.40 6.70 8.00 11.40 8.50
Haryana 9.00 2.40 8.10 8.00 9.90 8.30
Himachal Pradesh 8.10 2.80 6.10 16.80 37.50 20.50
Karnataka 6.00 5.60 5.80 10.40 10.30 10.50
Kerala 32.30 45.80 36.30 26.60 50.40 34.30
Madhya Pradesh 5.40 4.00 4.90 14.90 12.30 14.60
Maharashtra 11.30 8.90 10.40 15.60 21.10 16.50
Orissa 12.60 8.40 11.30 26.80 20.10 25.50
Punjab 8.00 3.60 7.00 8.90 13.90 9.50
Rajasthan 5.00 3.30 4.40 8.40 10.40 8.80
Tamil Nadu 19.70 15.30 18.10 15.50 15.60 15.60
Uttar Pradesh 6.80 2.00 6.10 12.40 12.70 12.50
West Bengal 23.00 39.10 26.60 23.40 27.20 24.00
All India 11.10 10.60 11.00 14.70 19.10 15.40
Source: Planning Commission (2002). Tenth Five Year Plan. pp.166-67.
The information presented in Tables 2.15 and 2.16
shows the distribution of rural and urban persons (per
1000 of the population) by broad usual activity for different
States for the years 1997 and 2003. The following
conclusions may be drawn from these tables. One, at the
all-India level, in both rural and urban areas, the proportion
of population which is not a part of labour force (for
example children, students, sick and old persons, etc.) has
been observed to have decreased over the period, 1997-
2003. It came down from 57 per cent to 56.3 per cent in
rural areas and from 65.2 per cent to 63.5 per cent in
urban areas. Also, this proportion continues to be higher in
urban areas as compared to rural areas in all States except
only West Bengal. As regards the position in Haryana, this
proportion continues to be well above the all-India average.
In 2003, it stood at 62.3 per cent and 67.2 per cent in rural
and urban areas of the State, respectively. Two, the
proportion of population which may be regarded as
employed (on the broad usual activity criterion) has
increased in both rural and urban areas of the country as
reflected in the relevant all-India average figures. It has
increased from 42.6 per cent to 43.1 per cent in rural areas,
and from 33.5 per cent to 35 per cent in urban areas. Also
this proportion continues to be higher in rural areas as
compared to urban areas in all States, again, except only
West Bengal. In Haryana, this proportion continues to be
much below the all-India average in both rural and urban
areas. In 2003, it amounted to 37.5 per cent and 32 per
cent, respectively, in the rural and urban areas of the State.
Three, among the employed, in both rural and urban areas,
the proportion constituted by the casual labourers has
decreased, and of self-employed and wage-earners/salaried
persons, increased. For casual labourers it has decreased
from 15.2 per cent to 14.7 per cent in rural areas, and from
6.9 per cent to 5.8 per cent in urban areas. On the
opposite, for self-employed it has increased from 25 per
cent to 25.5 per cent in rural areas, and from 13.4 per cent
to 15.2 per cent in urban areas. As for the wage-earners, it
has increased from 2.4 per cent to 2.9 per cent in rural
areas, and from 13.2 per cent to 14 per cent in the case of
urban areas. As regards Haryana, the proportion of self-
employed as well as wage-earners has increased in rural
areas (from 22.9 per cent to 24.4 per cent in case of self-
employed, and from 3.6 per cent to 5.5 per cent in case of
wage-earners), and decreased in urban areas (from 15.5 per
cent to 15.1 per cent in case of self-employed, and from
13.2 per cent to 12 per cent in case of wage earners. The
proportion of casual labourers has decreased in rural
Haryana (from 9.4 per cent to 7.5 per cent) and increased
in the urban Haryana (from 4.3 per cent to 5 per cent). In
comparison to all-India position, in rural Haryana, in 2003,
the proportion of wage-earners stood above the average but
the proportions of self-employed as well as casual labourers
were below the corresponding average figures. On the
opposite, in urban Haryana, the proportion of self-
employed was almost equal to the all-India average but the
proportions of wage-earners and casual labourers were
below the corresponding all-India averages. Lastly, as
regards the unemployed, whereas the position in this
regard at the all-India level has remained unchanged in
both rural (0.5 per cent) and urban (1.4 per cent) areas, in
Haryana the unemployment proportion in 2003 has been
found to be well below the all-India average in both rural
areas (0.2 per cent) and urban areas (0.8 per cent).
2.4 Fiscal Resources (Finance Base)
In the area of Financial Management, Haryana is
considered to be one of the best States in the country.
The notable feature of State Finances is that Haryana is
the first State in the country which has not availed
overdraft even for a single day during 2003-04 and 2004-
2005. The 12th Finance Commission of India has also
commended the performance of Haryana State in the areas
of revenue growth, expenditure checking and reduction of
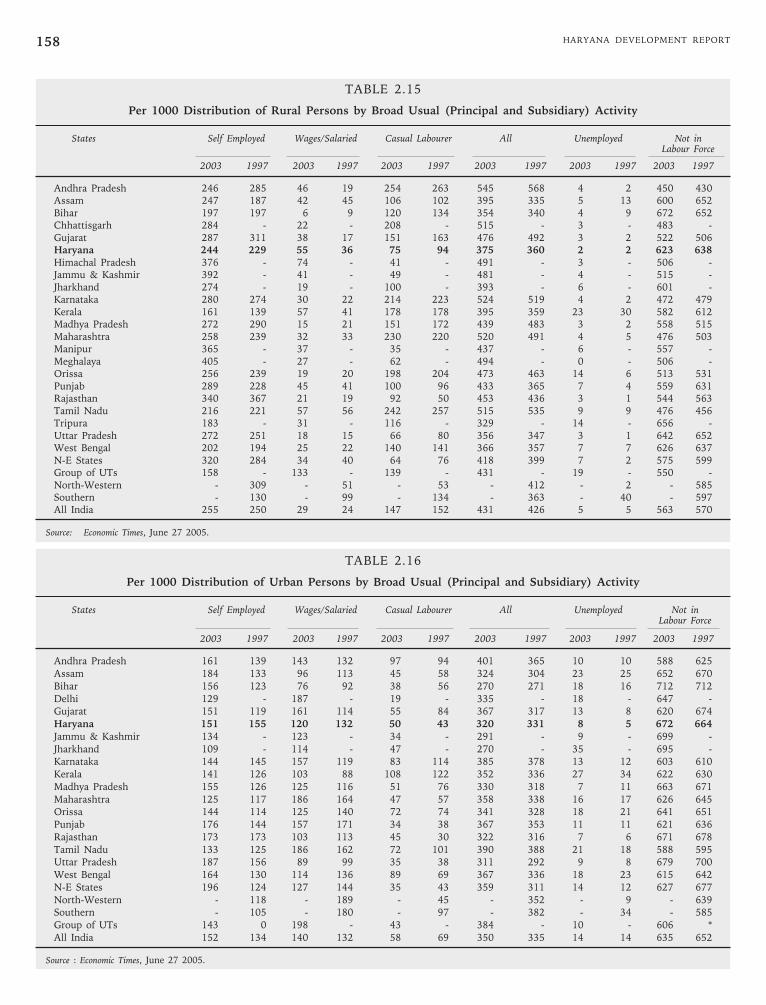
HARYANA DEVELOPMENT REPORT158
TABLE 2.15
Per 1000 Distribution of Rural Persons by Broad Usual (Principal and Subsidiary) Activity
States Self Employed Wages/Salaried Casual Labourer All Unemployed Not inLabour Force
2003 1997 2003 1997 2003 1997 2003 1997 2003 1997 2003 1997
Andhra Pradesh 246 285 46 19 254 263 545 568 4 2 450 430Assam 247 187 42 45 106 102 395 335 5 13 600 652Bihar 197 197 6 9 120 134 354 340 4 9 672 652Chhattisgarh 284 - 22 - 208 - 515 - 3 - 483 -Gujarat 287 311 38 17 151 163 476 492 3 2 522 506Haryana 244 229 55 36 75 94 375 360 2 2 623 638Himachal Pradesh 376 - 74 - 41 - 491 - 3 - 506 -Jammu & Kashmir 392 - 41 - 49 - 481 - 4 - 515 -Jharkhand 274 - 19 - 100 - 393 - 6 - 601 -Karnataka 280 274 30 22 214 223 524 519 4 2 472 479Kerala 161 139 57 41 178 178 395 359 23 30 582 612Madhya Pradesh 272 290 15 21 151 172 439 483 3 2 558 515Maharashtra 258 239 32 33 230 220 520 491 4 5 476 503Manipur 365 - 37 - 35 - 437 - 6 - 557 -Meghalaya 405 - 27 - 62 - 494 - 0 - 506 -Orissa 256 239 19 20 198 204 473 463 14 6 513 531Punjab 289 228 45 41 100 96 433 365 7 4 559 631Rajasthan 340 367 21 19 92 50 453 436 3 1 544 563Tamil Nadu 216 221 57 56 242 257 515 535 9 9 476 456Tripura 183 - 31 - 116 - 329 - 14 - 656 -Uttar Pradesh 272 251 18 15 66 80 356 347 3 1 642 652West Bengal 202 194 25 22 140 141 366 357 7 7 626 637N-E States 320 284 34 40 64 76 418 399 7 2 575 599Group of UTs 158 - 133 - 139 - 431 - 19 - 550 -North-Western - 309 - 51 - 53 - 412 - 2 - 585Southern - 130 - 99 - 134 - 363 - 40 - 597All India 255 250 29 24 147 152 431 426 5 5 563 570
Source: Economic Times, June 27 2005.
TABLE 2.16
Per 1000 Distribution of Urban Persons by Broad Usual (Principal and Subsidiary) Activity
States Self Employed Wages/Salaried Casual Labourer All Unemployed Not inLabour Force
2003 1997 2003 1997 2003 1997 2003 1997 2003 1997 2003 1997
Andhra Pradesh 161 139 143 132 97 94 401 365 10 10 588 625Assam 184 133 96 113 45 58 324 304 23 25 652 670Bihar 156 123 76 92 38 56 270 271 18 16 712 712Delhi 129 - 187 - 19 - 335 - 18 - 647 -Gujarat 151 119 161 114 55 84 367 317 13 8 620 674Haryana 151 155 120 132 50 43 320 331 8 5 672 664Jammu & Kashmir 134 - 123 - 34 - 291 - 9 - 699 -Jharkhand 109 - 114 - 47 - 270 - 35 - 695 -Karnataka 144 145 157 119 83 114 385 378 13 12 603 610Kerala 141 126 103 88 108 122 352 336 27 34 622 630Madhya Pradesh 155 126 125 116 51 76 330 318 7 11 663 671Maharashtra 125 117 186 164 47 57 358 338 16 17 626 645Orissa 144 114 125 140 72 74 341 328 18 21 641 651Punjab 176 144 157 171 34 38 367 353 11 11 621 636Rajasthan 173 173 103 113 45 30 322 316 7 6 671 678Tamil Nadu 133 125 186 162 72 101 390 388 21 18 588 595Uttar Pradesh 187 156 89 99 35 38 311 292 9 8 679 700West Bengal 164 130 114 136 89 69 367 336 18 23 615 642N-E States 196 124 127 144 35 43 359 311 14 12 627 677North-Western - 118 - 189 - 45 - 352 - 9 - 639Southern - 105 - 180 - 97 - 382 - 34 - 585Group of UTs 143 0 198 - 43 - 384 - 10 - 606 *All India 152 134 140 132 58 69 350 335 14 14 635 652
Source : Economic Times, June 27 2005.
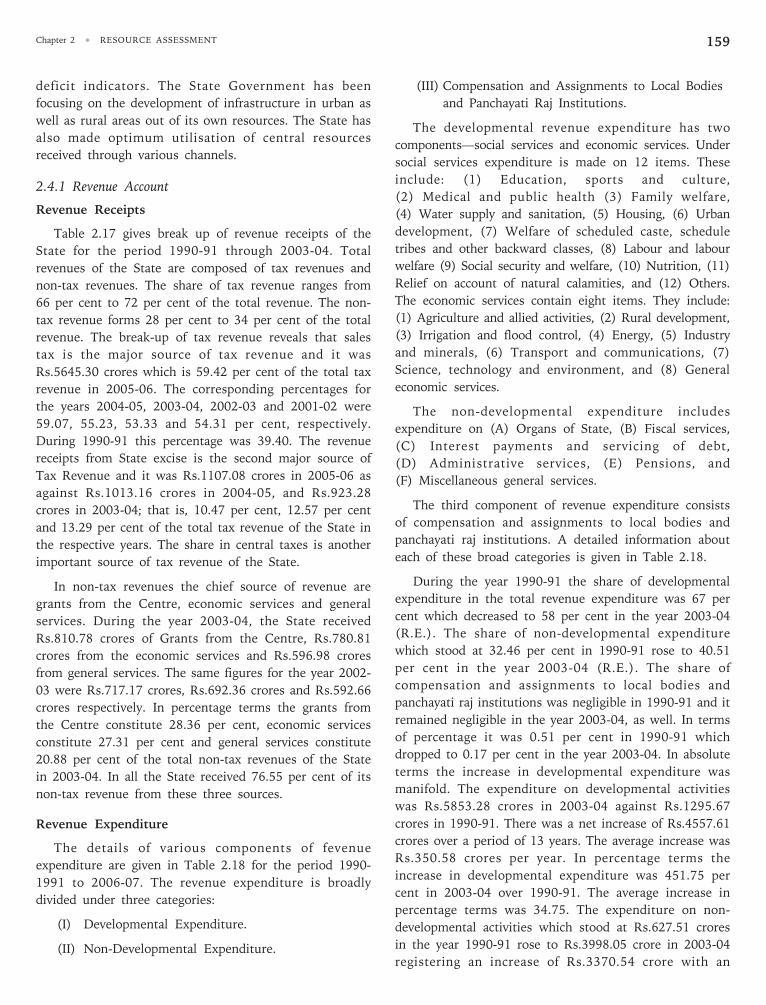
Chapter 2 • RESOURCE ASSESSMENT 159
deficit indicators. The State Government has been
focusing on the development of infrastructure in urban as
well as rural areas out of its own resources. The State has
also made optimum utilisation of central resources
received through various channels.
2.4.1 Revenue Account
Revenue Receipts
Table 2.17 gives break up of revenue receipts of the
State for the period 1990-91 through 2003-04. Total
revenues of the State are composed of tax revenues and
non-tax revenues. The share of tax revenue ranges from
66 per cent to 72 per cent of the total revenue. The non-
tax revenue forms 28 per cent to 34 per cent of the total
revenue. The break-up of tax revenue reveals that sales
tax is the major source of tax revenue and it was
Rs.5645.30 crores which is 59.42 per cent of the total tax
revenue in 2005-06. The corresponding percentages for
the years 2004-05, 2003-04, 2002-03 and 2001-02 were
59.07, 55.23, 53.33 and 54.31 per cent, respectively.
During 1990-91 this percentage was 39.40. The revenue
receipts from State excise is the second major source of
Tax Revenue and it was Rs.1107.08 crores in 2005-06 as
against Rs.1013.16 crores in 2004-05, and Rs.923.28
crores in 2003-04; that is, 10.47 per cent, 12.57 per cent
and 13.29 per cent of the total tax revenue of the State in
the respective years. The share in central taxes is another
important source of tax revenue of the State.
In non-tax revenues the chief source of revenue are
grants from the Centre, economic services and general
services. During the year 2003-04, the State received
Rs.810.78 crores of Grants from the Centre, Rs.780.81
crores from the economic services and Rs.596.98 crores
from general services. The same figures for the year 2002-
03 were Rs.717.17 crores, Rs.692.36 crores and Rs.592.66
crores respectively. In percentage terms the grants from
the Centre constitute 28.36 per cent, economic services
constitute 27.31 per cent and general services constitute
20.88 per cent of the total non-tax revenues of the State
in 2003-04. In all the State received 76.55 per cent of its
non-tax revenue from these three sources.
Revenue Expenditure
The details of various components of fevenue
expenditure are given in Table 2.18 for the period 1990-
1991 to 2006-07. The revenue expenditure is broadly
divided under three categories:
(I) Developmental Expenditure.
(II) Non-Developmental Expenditure.
(III) Compensation and Assignments to Local Bodies
and Panchayati Raj Institutions.
The developmental revenue expenditure has two
components—social services and economic services. Under
social services expenditure is made on 12 items. These
include: (1) Education, sports and culture,
(2) Medical and public health (3) Family welfare,
(4) Water supply and sanitation, (5) Housing, (6) Urban
development, (7) Welfare of scheduled caste, schedule
tribes and other backward classes, (8) Labour and labour
welfare (9) Social security and welfare, (10) Nutrition, (11)
Relief on account of natural calamities, and (12) Others.
The economic services contain eight items. They include:
(1) Agriculture and allied activities, (2) Rural development,
(3) Irrigation and flood control, (4) Energy, (5) Industry
and minerals, (6) Transport and communications, (7)
Science, technology and environment, and (8) General
economic services.
The non-developmental expenditure includes
expenditure on (A) Organs of State, (B) Fiscal services,
(C) Interest payments and servicing of debt,
(D) Administrative services, (E) Pensions, and
(F) Miscellaneous general services.
The third component of revenue expenditure consists
of compensation and assignments to local bodies and
panchayati raj institutions. A detailed information about
each of these broad categories is given in Table 2.18.
During the year 1990-91 the share of developmental
expenditure in the total revenue expenditure was 67 per
cent which decreased to 58 per cent in the year 2003-04
(R.E.). The share of non-developmental expenditure
which stood at 32.46 per cent in 1990-91 rose to 40.51
per cent in the year 2003-04 (R.E.). The share of
compensation and assignments to local bodies and
panchayati raj institutions was negligible in 1990-91 and it
remained negligible in the year 2003-04, as well. In terms
of percentage it was 0.51 per cent in 1990-91 which
dropped to 0.17 per cent in the year 2003-04. In absolute
terms the increase in developmental expenditure was
manifold. The expenditure on developmental activities
was Rs.5853.28 crores in 2003-04 against Rs.1295.67
crores in 1990-91. There was a net increase of Rs.4557.61
crores over a period of 13 years. The average increase was
Rs.350.58 crores per year. In percentage terms the
increase in developmental expenditure was 451.75 per
cent in 2003-04 over 1990-91. The average increase in
percentage terms was 34.75. The expenditure on non-
developmental activities which stood at Rs.627.51 crores
in the year 1990-91 rose to Rs.3998.05 crore in 2003-04
registering an increase of Rs.3370.54 crore with an
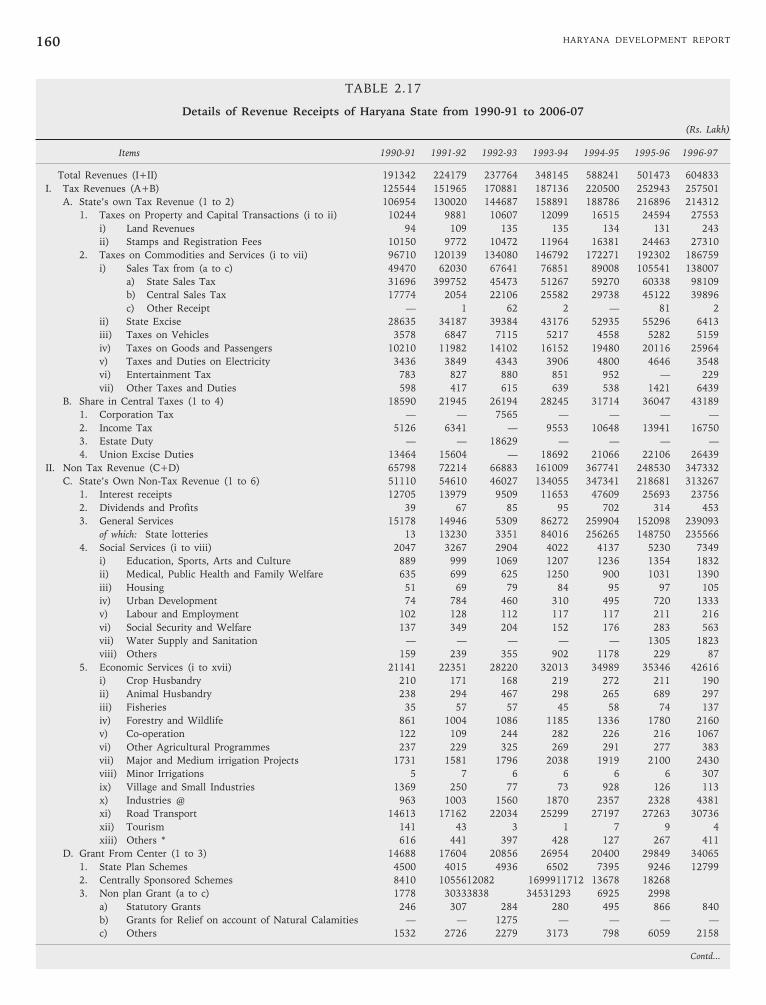
HARYANA DEVELOPMENT REPORT160
TABLE 2.17
Details of Revenue Receipts of Haryana State from 1990-91 to 2006-07
(Rs. Lakh)
Items 1990-91 1991-92 1992-93 1993-94 1994-95 1995-96 1996-97
Total Revenues (I+II) 191342 224179 237764 348145 588241 501473 604833
I. Tax Revenues (A+B) 125544 151965 170881 187136 220500 252943 257501
A. State’s own Tax Revenue (1 to 2) 106954 130020 144687 158891 188786 216896 214312
1. Taxes on Property and Capital Transactions (i to ii) 10244 9881 10607 12099 16515 24594 27553
i) Land Revenues 94 109 135 135 134 131 243
ii) Stamps and Registration Fees 10150 9772 10472 11964 16381 24463 27310
2. Taxes on Commodities and Services (i to vii) 96710 120139 134080 146792 172271 192302 186759
i) Sales Tax from (a to c) 49470 62030 67641 76851 89008 105541 138007
a) State Sales Tax 31696 399752 45473 51267 59270 60338 98109
b) Central Sales Tax 17774 2054 22106 25582 29738 45122 39896
c) Other Receipt — 1 62 2 — 81 2
ii) State Excise 28635 34187 39384 43176 52935 55296 6413
iii) Taxes on Vehicles 3578 6847 7115 5217 4558 5282 5159
iv) Taxes on Goods and Passengers 10210 11982 14102 16152 19480 20116 25964
v) Taxes and Duties on Electricity 3436 3849 4343 3906 4800 4646 3548
vi) Entertainment Tax 783 827 880 851 952 — 229
vii) Other Taxes and Duties 598 417 615 639 538 1421 6439
B. Share in Central Taxes (1 to 4) 18590 21945 26194 28245 31714 36047 43189
1. Corporation Tax — — 7565 — — — —
2. Income Tax 5126 6341 — 9553 10648 13941 16750
3. Estate Duty — — 18629 — — — —
4. Union Excise Duties 13464 15604 — 18692 21066 22106 26439
II. Non Tax Revenue (C+D) 65798 72214 66883 161009 367741 248530 347332
C. State’s Own Non-Tax Revenue (1 to 6) 51110 54610 46027 134055 347341 218681 313267
1. Interest receipts 12705 13979 9509 11653 47609 25693 23756
2. Dividends and Profits 39 67 85 95 702 314 453
3. General Services 15178 14946 5309 86272 259904 152098 239093
of which: State lotteries 13 13230 3351 84016 256265 148750 235566
4. Social Services (i to viii) 2047 3267 2904 4022 4137 5230 7349
i) Education, Sports, Arts and Culture 889 999 1069 1207 1236 1354 1832
ii) Medical, Public Health and Family Welfare 635 699 625 1250 900 1031 1390
iii) Housing 51 69 79 84 95 97 105
iv) Urban Development 74 784 460 310 495 720 1333
v) Labour and Employment 102 128 112 117 117 211 216
vi) Social Security and Welfare 137 349 204 152 176 283 563
vii) Water Supply and Sanitation — — — — — 1305 1823
viii) Others 159 239 355 902 1178 229 87
5. Economic Services (i to xvii) 21141 22351 28220 32013 34989 35346 42616
i) Crop Husbandry 210 171 168 219 272 211 190
ii) Animal Husbandry 238 294 467 298 265 689 297
iii) Fisheries 35 57 57 45 58 74 137
iv) Forestry and Wildlife 861 1004 1086 1185 1336 1780 2160
v) Co-operation 122 109 244 282 226 216 1067
vi) Other Agricultural Programmes 237 229 325 269 291 277 383
vii) Major and Medium irrigation Projects 1731 1581 1796 2038 1919 2100 2430
viii) Minor Irrigations 5 7 6 6 6 6 307
ix) Village and Small Industries 1369 250 77 73 928 126 113
x) Industries @ 963 1003 1560 1870 2357 2328 4381
xi) Road Transport 14613 17162 22034 25299 27197 27263 30736
xii) Tourism 141 43 3 1 7 9 4
xiii) Others * 616 441 397 428 127 267 411
D. Grant From Center (1 to 3) 14688 17604 20856 26954 20400 29849 34065
1. State Plan Schemes 4500 4015 4936 6502 7395 9246 12799
2. Centrally Sponsored Schemes 8410 1055612082 1699911712 13678 18268
3. Non plan Grant (a to c) 1778 30333838 34531293 6925 2998
a) Statutory Grants 246 307 284 280 495 866 840
b) Grants for Relief on account of Natural Calamities — — 1275 — — — —
c) Others 1532 2726 2279 3173 798 6059 2158
Contd...
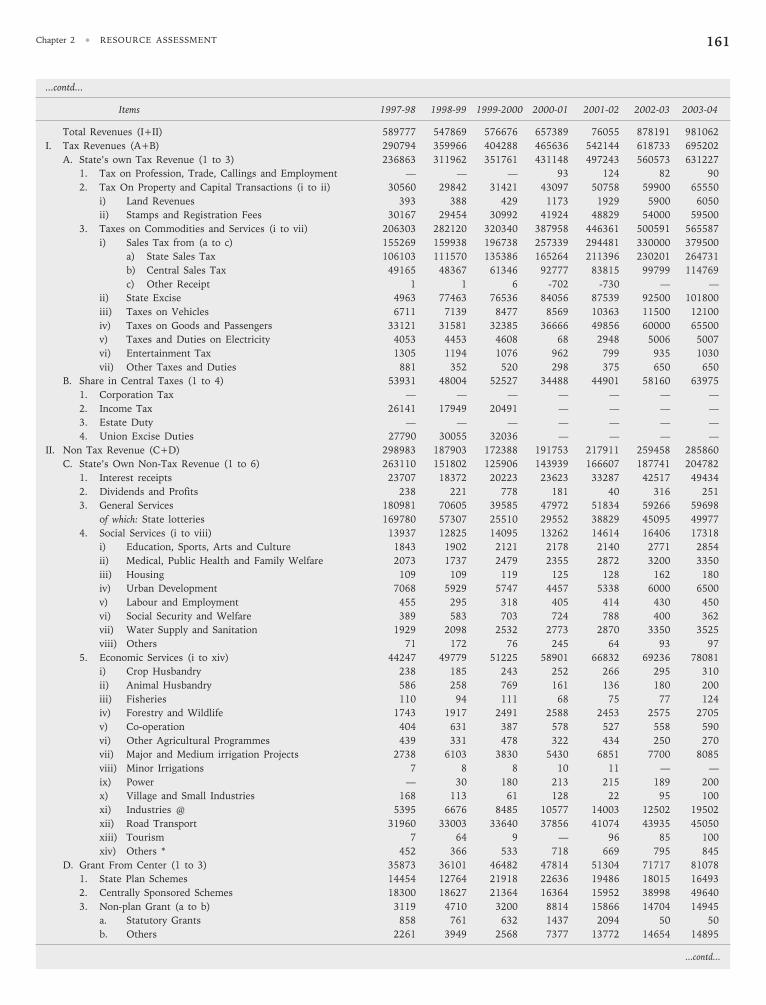
Chapter 2 • RESOURCE ASSESSMENT 161
...contd...
Items 1997-98 1998-99 1999-2000 2000-01 2001-02 2002-03 2003-04
Total Revenues (I+II) 589777 547869 576676 657389 76055 878191 981062
I. Tax Revenues (A+B) 290794 359966 404288 465636 542144 618733 695202
A. State’s own Tax Revenue (1 to 3) 236863 311962 351761 431148 497243 560573 631227
1. Tax on Profession, Trade, Callings and Employment — — — 93 124 82 90
2. Tax On Property and Capital Transactions (i to ii) 30560 29842 31421 43097 50758 59900 65550
i) Land Revenues 393 388 429 1173 1929 5900 6050
ii) Stamps and Registration Fees 30167 29454 30992 41924 48829 54000 59500
3. Taxes on Commodities and Services (i to vii) 206303 282120 320340 387958 446361 500591 565587
i) Sales Tax from (a to c) 155269 159938 196738 257339 294481 330000 379500
a) State Sales Tax 106103 111570 135386 165264 211396 230201 264731
b) Central Sales Tax 49165 48367 61346 92777 83815 99799 114769
c) Other Receipt 1 1 6 -702 -730 — —
ii) State Excise 4963 77463 76536 84056 87539 92500 101800
iii) Taxes on Vehicles 6711 7139 8477 8569 10363 11500 12100
iv) Taxes on Goods and Passengers 33121 31581 32385 36666 49856 60000 65500
v) Taxes and Duties on Electricity 4053 4453 4608 68 2948 5006 5007
vi) Entertainment Tax 1305 1194 1076 962 799 935 1030
vii) Other Taxes and Duties 881 352 520 298 375 650 650
B. Share in Central Taxes (1 to 4) 53931 48004 52527 34488 44901 58160 63975
1. Corporation Tax — — — — — — —
2. Income Tax 26141 17949 20491 — — — —
3. Estate Duty — — — — — — —
4. Union Excise Duties 27790 30055 32036 — — — —
II. Non Tax Revenue (C+D) 298983 187903 172388 191753 217911 259458 285860
C. State’s Own Non-Tax Revenue (1 to 6) 263110 151802 125906 143939 166607 187741 204782
1. Interest receipts 23707 18372 20223 23623 33287 42517 49434
2. Dividends and Profits 238 221 778 181 40 316 251
3. General Services 180981 70605 39585 47972 51834 59266 59698
of which: State lotteries 169780 57307 25510 29552 38829 45095 49977
4. Social Services (i to viii) 13937 12825 14095 13262 14614 16406 17318
i) Education, Sports, Arts and Culture 1843 1902 2121 2178 2140 2771 2854
ii) Medical, Public Health and Family Welfare 2073 1737 2479 2355 2872 3200 3350
iii) Housing 109 109 119 125 128 162 180
iv) Urban Development 7068 5929 5747 4457 5338 6000 6500
v) Labour and Employment 455 295 318 405 414 430 450
vi) Social Security and Welfare 389 583 703 724 788 400 362
vii) Water Supply and Sanitation 1929 2098 2532 2773 2870 3350 3525
viii) Others 71 172 76 245 64 93 97
5. Economic Services (i to xiv) 44247 49779 51225 58901 66832 69236 78081
i) Crop Husbandry 238 185 243 252 266 295 310
ii) Animal Husbandry 586 258 769 161 136 180 200
iii) Fisheries 110 94 111 68 75 77 124
iv) Forestry and Wildlife 1743 1917 2491 2588 2453 2575 2705
v) Co-operation 404 631 387 578 527 558 590
vi) Other Agricultural Programmes 439 331 478 322 434 250 270
vii) Major and Medium irrigation Projects 2738 6103 3830 5430 6851 7700 8085
viii) Minor Irrigations 7 8 8 10 11 — —
ix) Power — 30 180 213 215 189 200
x) Village and Small Industries 168 113 61 128 22 95 100
xi) Industries @ 5395 6676 8485 10577 14003 12502 19502
xii) Road Transport 31960 33003 33640 37856 41074 43935 45050
xiii) Tourism 7 64 9 — 96 85 100
xiv) Others * 452 366 533 718 669 795 845
D. Grant From Center (1 to 3) 35873 36101 46482 47814 51304 71717 81078
1. State Plan Schemes 14454 12764 21918 22636 19486 18015 16493
2. Centrally Sponsored Schemes 18300 18627 21364 16364 15952 38998 49640
3. Non-plan Grant (a to b) 3119 4710 3200 8814 15866 14704 14945
a. Statutory Grants 858 761 632 1437 2094 50 50
b. Others 2261 3949 2568 7377 13772 14654 14895
...contd...
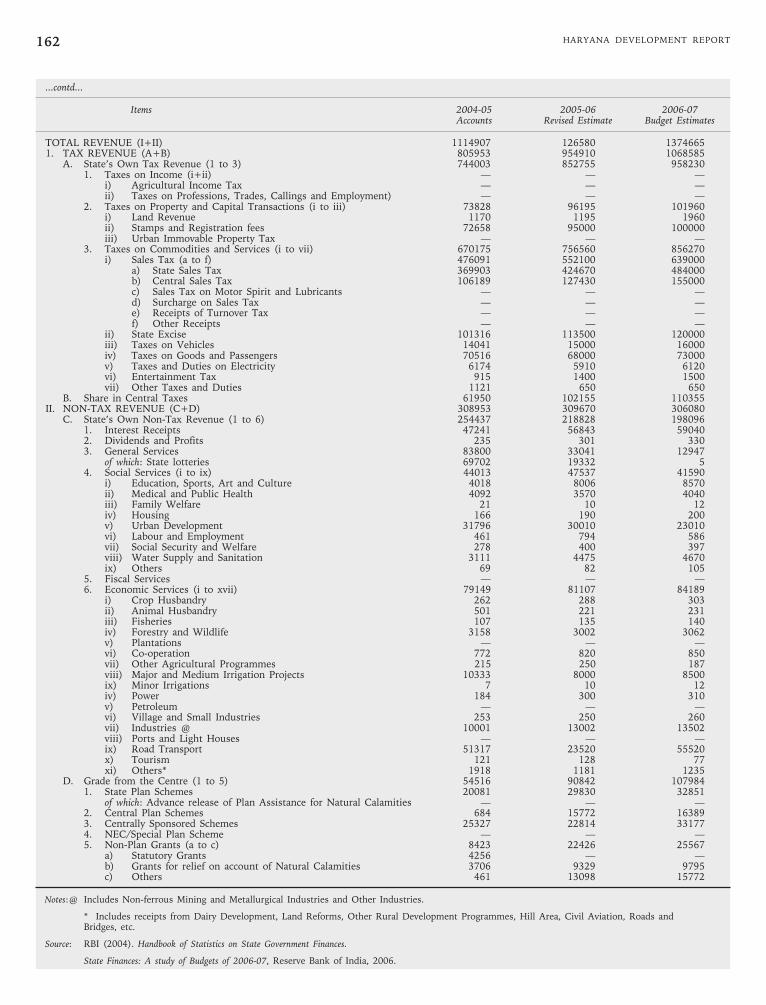
HARYANA DEVELOPMENT REPORT162
...contd...
Items 2004-05 2005-06 2006-07Accounts Revised Estimate Budget Estimates
TOTAL REVENUE (I+II) 1114907 126580 13746651. TAX REVENUE (A+B) 805953 954910 1068585
A. State’s Own Tax Revenue (1 to 3) 744003 852755 9582301. Taxes on Income (i+ii) — — —
i) Agricultural Income Tax — — —ii) Taxes on Professions, Trades, Callings and Employment) — — —
2. Taxes on Property and Capital Transactions (i to iii) 73828 96195 101960i) Land Revenue 1170 1195 1960ii) Stamps and Registration fees 72658 95000 100000iii) Urban Immovable Property Tax — — —
3. Taxes on Commodities and Services (i to vii) 670175 756560 856270i) Sales Tax (a to f) 476091 552100 639000
a) State Sales Tax 369903 424670 484000b) Central Sales Tax 106189 127430 155000c) Sales Tax on Motor Spirit and Lubricants — — —d) Surcharge on Sales Tax — — —e) Receipts of Turnover Tax — — —f) Other Receipts — — —
ii) State Excise 101316 113500 120000iii) Taxes on Vehicles 14041 15000 16000iv) Taxes on Goods and Passengers 70516 68000 73000v) Taxes and Duties on Electricity 6174 5910 6120vi) Entertainment Tax 915 1400 1500vii) Other Taxes and Duties 1121 650 650
B. Share in Central Taxes 61950 102155 110355II. NON-TAX REVENUE (C+D) 308953 309670 306080
C. State’s Own Non-Tax Revenue (1 to 6) 254437 218828 1980961. Interest Receipts 47241 56843 590402. Dividends and Profits 235 301 3303. General Services 83800 33041 12947
of which: State lotteries 69702 19332 54. Social Services (i to ix) 44013 47537 41590
i) Education, Sports, Art and Culture 4018 8006 8570ii) Medical and Public Health 4092 3570 4040iii) Family Welfare 21 10 12iv) Housing 166 190 200v) Urban Development 31796 30010 23010vi) Labour and Employment 461 794 586vii) Social Security and Welfare 278 400 397viii) Water Supply and Sanitation 3111 4475 4670ix) Others 69 82 105
5. Fiscal Services — — —6. Economic Services (i to xvii) 79149 81107 84189
i) Crop Husbandry 262 288 303ii) Animal Husbandry 501 221 231iii) Fisheries 107 135 140iv) Forestry and Wildlife 3158 3002 3062v) Plantations — — —vi) Co-operation 772 820 850vii) Other Agricultural Programmes 215 250 187viii) Major and Medium Irrigation Projects 10333 8000 8500ix) Minor Irrigations 7 10 12iv) Power 184 300 310v) Petroleum — — —vi) Village and Small Industries 253 250 260vii) Industries @ 10001 13002 13502viii) Ports and Light Houses — — —ix) Road Transport 51317 23520 55520x) Tourism 121 128 77xi) Others* 1918 1181 1235
D. Grade from the Centre (1 to 5) 54516 90842 1079841. State Plan Schemes 20081 29830 32851
of which: Advance release of Plan Assistance for Natural Calamities — — —2. Central Plan Schemes 684 15772 163893. Centrally Sponsored Schemes 25327 22814 331774. NEC/Special Plan Scheme — — —5. Non-Plan Grants (a to c) 8423 22426 25567
a) Statutory Grants 4256 — —b) Grants for relief on account of Natural Calamities 3706 9329 9795c) Others 461 13098 15772
Notes:@ Includes Non-ferrous Mining and Metallurgical Industries and Other Industries.
* Includes receipts from Dairy Development, Land Reforms, Other Rural Development Programmes, Hill Area, Civil Aviation, Roads andBridges, etc.
Source: RBI (2004). Handbook of Statistics on State Government Finances.
State Finances: A study of Budgets of 2006-07, Reserve Bank of India, 2006.
Chapter 2 • RESOURCE ASSESSMENT 163
average increase of Rs.259.27 crore per annum. This was
637.13 per cent higher than the figures of 1990-91. The
average increase in terms of percentage was 49 per
annum. The amount spent on compensation and
assignments to local bodies and panchayati raj institutions
stood at Rs.17.01 crores in 2003-04 as against Rs.9.89
crores in 1990-91 registering an increase of Rs. 7.12
crores with an average of Rs. 0.55 crores annually. It was
172 per cent higher as compared to 1990-91.
2.4.2 Capital Account
Capital Receipts
The Haryana State receives capital funds from eight
broad categories. They include: (i) Internal debt,
(ii) Loans and advances from the centre, (iii) Recovery of
loans and advances, (iv) Small savings, provident fund,
etc., (v) Reserve funds, (vi) Deposits and advances, (vii)
Suspense and miscellaneous, and (viii) Remittances (net).
Table 2.19 contains data regarding capital receipts of
Haryana. In 1990-91, the maximum proportion of capital
receipts were received from loans and advances from the
centre (52.07 per cent). Small savings and provident funds
contributed 23.52 per cent followed by internal debt (16.36
per cent). The situation in 2003-04 has been found to have
completely changed. Loans and advances from the centre
contributed only 11.12 per cent of the total. Most
contribution came from internal debt of the state which
stood at 67.40 per cent of the total. Small savings and
provident funds continue to maintain its place at number
two with 17.43 per cent contribution.
Capital Expenditure
The capital expenditure in the State is incurred mainly
on four heads: (i) Total capital outlay, (ii) Discharge of
internal debt, (iii) Repayment of loans to the centre, and
(iv) Loans and advances by state government.
Total capital outlay includes expenditure on
developmental and non-developmental services.
Developmental services include social services (for
instance, education, sports, medical and health, water
supply and sanitation, etc.) and economic services (for
instance, agriculture and allied activities, major and
medium irrigation and flood control, energy, transport,
etc.)
The details of the capital expenditure in Haryana state
are given in Table 2.20. During 1990-91 the maximum
share of capital expenditure was allotted to loans and
advances by State government for developmental
purposes. It constituted 43.86 per cent of the total capital
expenditure of the year. It was followed by capital outlay
for developmental purposes which accounted for 40.15
per cent of the total. Capital expenditure on account of
repayment of loans to the centre constituted 14.89 per
cent and the discharge of internal debts constitute 1.10
per cent of the total capital expenditure. In 2003-04 the
capital outlay for developmental purposes continued to be
on the priority list of the State. During this year the state
allotted 50.68 per cent of the total capital expenditure for
this purpose. The repayment of loans to the Centre which
used to be a small fraction during 1990-1991 received
about one-third of the total capital expenditure during
2003-04. It got 32.25 per cent of the total capital
expenditure of the State. The allocations to loans and
advances by the State government for developmental
purposes declined substantially to constitute only 10.56
per cent of the total capital expenditure. The discharge of
internal debt received more than before, that is, 6.51 per
cent of the State’s capital expenditure.
2.4.3 Surplus/Deficit on Revenue Account andCapital Account
The State has experienced a deficit on revenue account
over the period 1990-91 through 2004-05, except only
one year, namely, 1993-94. The Revenue Deficit of the
State has reduced from the peak of Rs.1540 crores in
1998-99 to Rs.258 crores in 2004-05. In terms of
percentage of GSDP, the revenue deficit has reduced from
3.5 per cent in 1998-99 to 0.31 per cent in 2004-05. On
the opposite, the Capital Account had surplus over almost
the entire period except only two years, 1992-93 and
1993-94. The magnitude of surplus has varied
substantially from year to year. Whereas, it stood at just
Rs.76.6 crores in 1990-91, in 1995-96 its magnitude was
Rs.3168.3 crores, and Rs.409.93 crores, in 2006-07.
2.4.4 Over-all Surplus/Deficit
The overall surplus/deficit position during this period
presents instances of both, net surplus and net deficit.
The Surplus has exhibited much greater variability as
compared to the deficit. The surplus stood as low as
Rs.14.9 crores in 1991-92, and as high as Rs.2821.5
crores in 1995-96 and Rs.89.92 crore in 2006-07. In
contrast, the magnitude of Deficit varied only over a
relatively smaller range, Rs.25.6 crores in 1997-98 to
Rs.310.5 crores in 2001-02. In any case, the figures of
surplus or deficit cannot be regarded important by
themselves as indicators of fiscal performance unless one
goes into a detailed analysis of the behaviour of various
items on revenue account and capital account in relation
to certain aggregates, such as, gross state domestic
product, or total receipts/expenditure on these accounts.
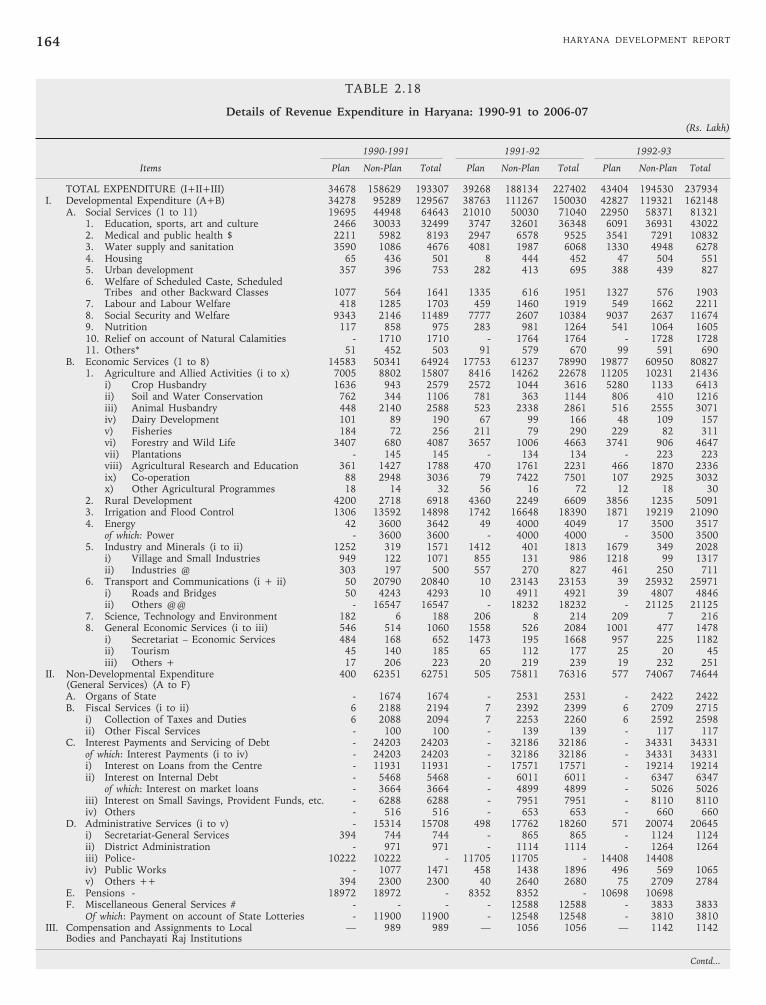
HARYANA DEVELOPMENT REPORT164
TABLE 2.18
Details of Revenue Expenditure in Haryana: 1990-91 to 2006-07
(Rs. Lakh)
1990-1991 1991-92 1992-93
Items Plan Non-Plan Total Plan Non-Plan Total Plan Non-Plan Total
TOTAL EXPENDITURE (I+II+III) 34678 158629 193307 39268 188134 227402 43404 194530 237934I. Developmental Expenditure (A+B) 34278 95289 129567 38763 111267 150030 42827 119321 162148 A. Social Services (1 to 11) 19695 44948 64643 21010 50030 71040 22950 58371 81321
1. Education, sports, art and culture 2466 30033 32499 3747 32601 36348 6091 36931 430222. Medical and public health $ 2211 5982 8193 2947 6578 9525 3541 7291 108323. Water supply and sanitation 3590 1086 4676 4081 1987 6068 1330 4948 62784. Housing 65 436 501 8 444 452 47 504 5515. Urban development 357 396 753 282 413 695 388 439 8276. Welfare of Scheduled Caste, Scheduled
Tribes and other Backward Classes 1077 564 1641 1335 616 1951 1327 576 19037. Labour and Labour Welfare 418 1285 1703 459 1460 1919 549 1662 22118. Social Security and Welfare 9343 2146 11489 7777 2607 10384 9037 2637 116749. Nutrition 117 858 975 283 981 1264 541 1064 160510. Relief on account of Natural Calamities - 1710 1710 - 1764 1764 - 1728 172811. Others* 51 452 503 91 579 670 99 591 690
B. Economic Services (1 to 8) 14583 50341 64924 17753 61237 78990 19877 60950 808271. Agriculture and Allied Activities (i to x) 7005 8802 15807 8416 14262 22678 11205 10231 21436
i) Crop Husbandry 1636 943 2579 2572 1044 3616 5280 1133 6413ii) Soil and Water Conservation 762 344 1106 781 363 1144 806 410 1216iii) Animal Husbandry 448 2140 2588 523 2338 2861 516 2555 3071iv) Dairy Development 101 89 190 67 99 166 48 109 157v) Fisheries 184 72 256 211 79 290 229 82 311vi) Forestry and Wild Life 3407 680 4087 3657 1006 4663 3741 906 4647vii) Plantations - 145 145 - 134 134 - 223 223viii) Agricultural Research and Education 361 1427 1788 470 1761 2231 466 1870 2336ix) Co-operation 88 2948 3036 79 7422 7501 107 2925 3032x) Other Agricultural Programmes 18 14 32 56 16 72 12 18 30
2. Rural Development 4200 2718 6918 4360 2249 6609 3856 1235 50913. Irrigation and Flood Control 1306 13592 14898 1742 16648 18390 1871 19219 210904. Energy 42 3600 3642 49 4000 4049 17 3500 3517
of which: Power - 3600 3600 - 4000 4000 - 3500 35005. Industry and Minerals (i to ii) 1252 319 1571 1412 401 1813 1679 349 2028
i) Village and Small Industries 949 122 1071 855 131 986 1218 99 1317ii) Industries @ 303 197 500 557 270 827 461 250 711
6. Transport and Communications (i + ii) 50 20790 20840 10 23143 23153 39 25932 25971i) Roads and Bridges 50 4243 4293 10 4911 4921 39 4807 4846ii) Others @@ - 16547 16547 - 18232 18232 - 21125 21125
7. Science, Technology and Environment 182 6 188 206 8 214 209 7 2168. General Economic Services (i to iii) 546 514 1060 1558 526 2084 1001 477 1478
i) Secretariat – Economic Services 484 168 652 1473 195 1668 957 225 1182ii) Tourism 45 140 185 65 112 177 25 20 45iii) Others + 17 206 223 20 219 239 19 232 251
II. Non-Developmental Expenditure 400 62351 62751 505 75811 76316 577 74067 74644(General Services) (A to F)A. Organs of State - 1674 1674 - 2531 2531 - 2422 2422B. Fiscal Services (i to ii) 6 2188 2194 7 2392 2399 6 2709 2715
i) Collection of Taxes and Duties 6 2088 2094 7 2253 2260 6 2592 2598ii) Other Fiscal Services - 100 100 - 139 139 - 117 117
C. Interest Payments and Servicing of Debt - 24203 24203 - 32186 32186 - 34331 34331of which: Interest Payments (i to iv) - 24203 24203 - 32186 32186 - 34331 34331i) Interest on Loans from the Centre - 11931 11931 - 17571 17571 - 19214 19214ii) Interest on Internal Debt - 5468 5468 - 6011 6011 - 6347 6347
of which: Interest on market loans - 3664 3664 - 4899 4899 - 5026 5026iii) Interest on Small Savings, Provident Funds, etc. - 6288 6288 - 7951 7951 - 8110 8110iv) Others - 516 516 - 653 653 - 660 660
D. Administrative Services (i to v) - 15314 15708 498 17762 18260 571 20074 20645i) Secretariat-General Services 394 744 744 - 865 865 - 1124 1124ii) District Administration - 971 971 - 1114 1114 - 1264 1264iii) Police- 10222 10222 - 11705 11705 - 14408 14408iv) Public Works - 1077 1471 458 1438 1896 496 569 1065v) Others ++ 394 2300 2300 40 2640 2680 75 2709 2784
E. Pensions - 18972 18972 - 8352 8352 - 10698 10698F. Miscellaneous General Services # - - - - 12588 12588 - 3833 3833
Of which: Payment on account of State Lotteries - 11900 11900 - 12548 12548 - 3810 3810III. Compensation and Assignments to Local — 989 989 — 1056 1056 — 1142 1142
Bodies and Panchayati Raj Institutions
Contd...
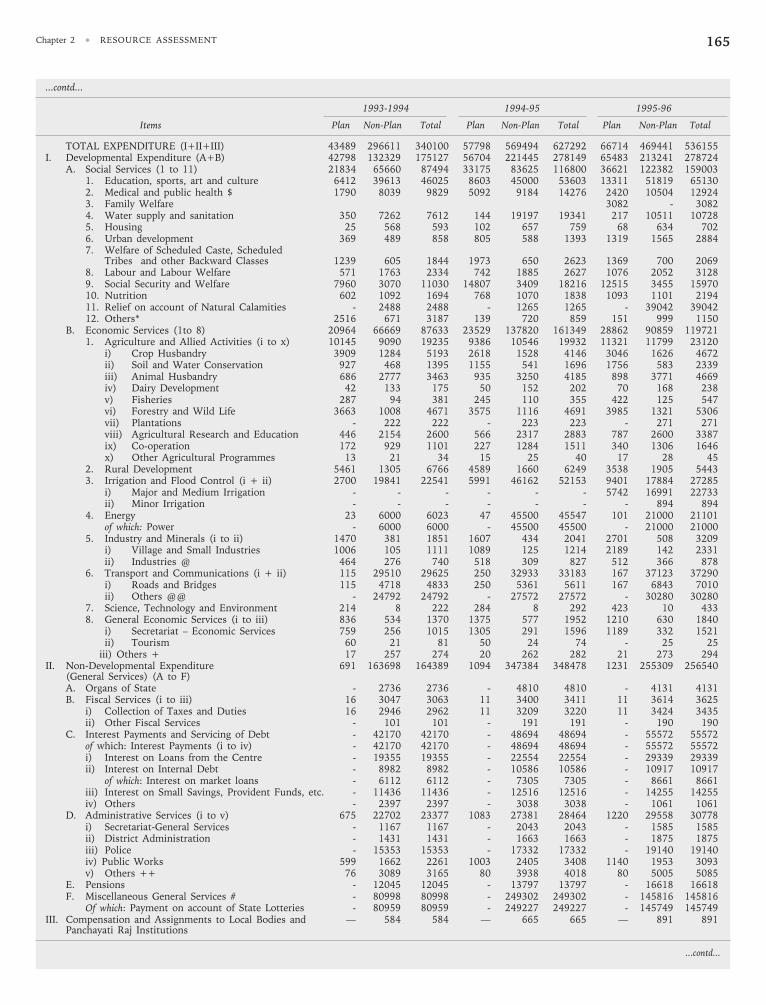
Chapter 2 • RESOURCE ASSESSMENT 165
...contd...
1993-1994 1994-95 1995-96
Items Plan Non-Plan Total Plan Non-Plan Total Plan Non-Plan Total
TOTAL EXPENDITURE (I+II+III) 43489 296611 340100 57798 569494 627292 66714 469441 536155I. Developmental Expenditure (A+B) 42798 132329 175127 56704 221445 278149 65483 213241 278724
A. Social Services (1 to 11) 21834 65660 87494 33175 83625 116800 36621 122382 1590031. Education, sports, art and culture 6412 39613 46025 8603 45000 53603 13311 51819 651302. Medical and public health $ 1790 8039 9829 5092 9184 14276 2420 10504 129243. Family Welfare 3082 - 30824. Water supply and sanitation 350 7262 7612 144 19197 19341 217 10511 107285. Housing 25 568 593 102 657 759 68 634 7026. Urban development 369 489 858 805 588 1393 1319 1565 28847. Welfare of Scheduled Caste, Scheduled
Tribes and other Backward Classes 1239 605 1844 1973 650 2623 1369 700 20698. Labour and Labour Welfare 571 1763 2334 742 1885 2627 1076 2052 31289. Social Security and Welfare 7960 3070 11030 14807 3409 18216 12515 3455 1597010. Nutrition 602 1092 1694 768 1070 1838 1093 1101 219411. Relief on account of Natural Calamities - 2488 2488 - 1265 1265 - 39042 3904212. Others* 2516 671 3187 139 720 859 151 999 1150
B. Economic Services (1to 8) 20964 66669 87633 23529 137820 161349 28862 90859 1197211. Agriculture and Allied Activities (i to x) 10145 9090 19235 9386 10546 19932 11321 11799 23120
i) Crop Husbandry 3909 1284 5193 2618 1528 4146 3046 1626 4672ii) Soil and Water Conservation 927 468 1395 1155 541 1696 1756 583 2339iii) Animal Husbandry 686 2777 3463 935 3250 4185 898 3771 4669iv) Dairy Development 42 133 175 50 152 202 70 168 238v) Fisheries 287 94 381 245 110 355 422 125 547vi) Forestry and Wild Life 3663 1008 4671 3575 1116 4691 3985 1321 5306vii) Plantations - 222 222 - 223 223 - 271 271viii) Agricultural Research and Education 446 2154 2600 566 2317 2883 787 2600 3387ix) Co-operation 172 929 1101 227 1284 1511 340 1306 1646x) Other Agricultural Programmes 13 21 34 15 25 40 17 28 45
2. Rural Development 5461 1305 6766 4589 1660 6249 3538 1905 54433. Irrigation and Flood Control (i + ii) 2700 19841 22541 5991 46162 52153 9401 17884 27285
i) Major and Medium Irrigation - - - - - - 5742 16991 22733ii) Minor Irrigation - - - - - - - 894 894
4. Energy 23 6000 6023 47 45500 45547 101 21000 21101of which: Power - 6000 6000 - 45500 45500 - 21000 21000
5. Industry and Minerals (i to ii) 1470 381 1851 1607 434 2041 2701 508 3209i) Village and Small Industries 1006 105 1111 1089 125 1214 2189 142 2331ii) Industries @ 464 276 740 518 309 827 512 366 878
6. Transport and Communications (i + ii) 115 29510 29625 250 32933 33183 167 37123 37290i) Roads and Bridges 115 4718 4833 250 5361 5611 167 6843 7010ii) Others @@ - 24792 24792 - 27572 27572 - 30280 30280
7. Science, Technology and Environment 214 8 222 284 8 292 423 10 4338. General Economic Services (i to iii) 836 534 1370 1375 577 1952 1210 630 1840
i) Secretariat – Economic Services 759 256 1015 1305 291 1596 1189 332 1521ii) Tourism 60 21 81 50 24 74 - 25 25
iii) Others + 17 257 274 20 262 282 21 273 294II. Non-Developmental Expenditure 691 163698 164389 1094 347384 348478 1231 255309 256540
(General Services) (A to F)A. Organs of State - 2736 2736 - 4810 4810 - 4131 4131B. Fiscal Services (i to iii) 16 3047 3063 11 3400 3411 11 3614 3625
i) Collection of Taxes and Duties 16 2946 2962 11 3209 3220 11 3424 3435ii) Other Fiscal Services - 101 101 - 191 191 - 190 190
C. Interest Payments and Servicing of Debt - 42170 42170 - 48694 48694 - 55572 55572of which: Interest Payments (i to iv) - 42170 42170 - 48694 48694 - 55572 55572i) Interest on Loans from the Centre - 19355 19355 - 22554 22554 - 29339 29339ii) Interest on Internal Debt - 8982 8982 - 10586 10586 - 10917 10917
of which: Interest on market loans - 6112 6112 - 7305 7305 - 8661 8661iii) Interest on Small Savings, Provident Funds, etc. - 11436 11436 - 12516 12516 - 14255 14255iv) Others - 2397 2397 - 3038 3038 - 1061 1061
D. Administrative Services (i to v) 675 22702 23377 1083 27381 28464 1220 29558 30778i) Secretariat-General Services - 1167 1167 - 2043 2043 - 1585 1585ii) District Administration - 1431 1431 - 1663 1663 - 1875 1875iii) Police - 15353 15353 - 17332 17332 - 19140 19140iv) Public Works 599 1662 2261 1003 2405 3408 1140 1953 3093v) Others ++ 76 3089 3165 80 3938 4018 80 5005 5085
E. Pensions - 12045 12045 - 13797 13797 - 16618 16618F. Miscellaneous General Services # - 80998 80998 - 249302 249302 - 145816 145816
Of which: Payment on account of State Lotteries - 80959 80959 - 249227 249227 - 145749 145749III. Compensation and Assignments to Local Bodies and — 584 584 — 665 665 — 891 891
Panchayati Raj Institutions
...contd...
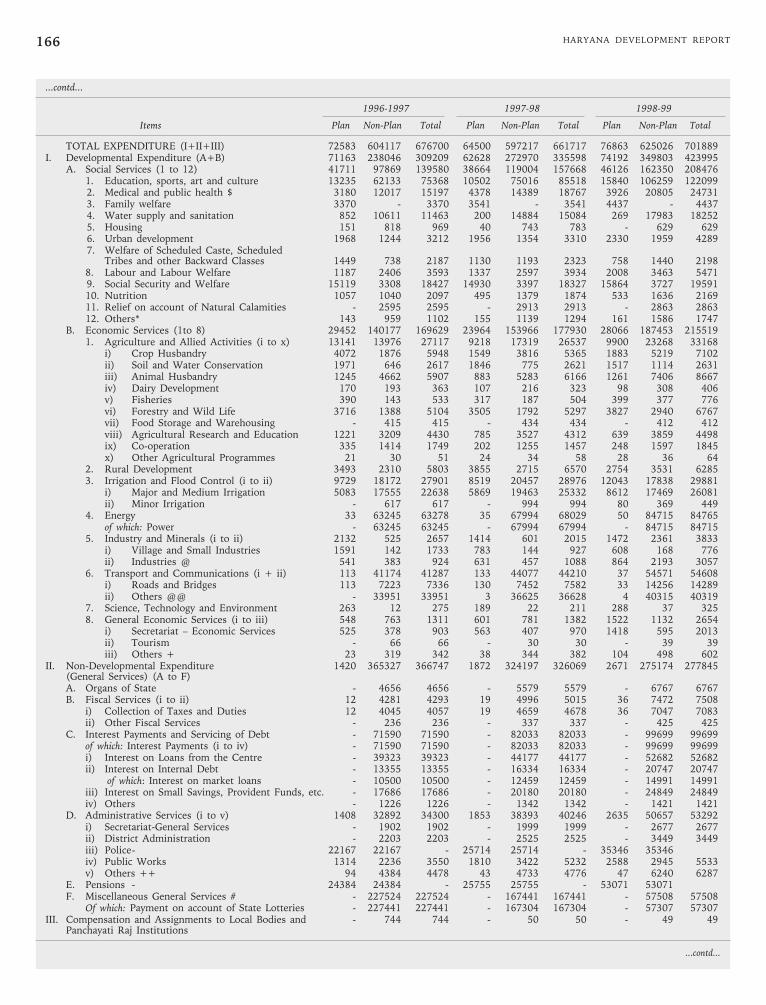
HARYANA DEVELOPMENT REPORT166
...contd...
1996-1997 1997-98 1998-99
Items Plan Non-Plan Total Plan Non-Plan Total Plan Non-Plan Total
TOTAL EXPENDITURE (I+II+III) 72583 604117 676700 64500 597217 661717 76863 625026 701889I. Developmental Expenditure (A+B) 71163 238046 309209 62628 272970 335598 74192 349803 423995 A. Social Services (1 to 12) 41711 97869 139580 38664 119004 157668 46126 162350 208476
1. Education, sports, art and culture 13235 62133 75368 10502 75016 85518 15840 106259 122099 2. Medical and public health $ 3180 12017 15197 4378 14389 18767 3926 20805 24731 3. Family welfare 3370 - 3370 3541 - 3541 4437 - 4437 4. Water supply and sanitation 852 10611 11463 200 14884 15084 269 17983 18252 5. Housing 151 818 969 40 743 783 - 629 629 6. Urban development 1968 1244 3212 1956 1354 3310 2330 1959 4289 7. Welfare of Scheduled Caste, Scheduled
Tribes and other Backward Classes 1449 738 2187 1130 1193 2323 758 1440 21988. Labour and Labour Welfare 1187 2406 3593 1337 2597 3934 2008 3463 5471
9. Social Security and Welfare 15119 3308 18427 14930 3397 18327 15864 3727 1959110. Nutrition 1057 1040 2097 495 1379 1874 533 1636 216911. Relief on account of Natural Calamities - 2595 2595 - 2913 2913 - 2863 286312. Others* 143 959 1102 155 1139 1294 161 1586 1747
B. Economic Services (1to 8) 29452 140177 169629 23964 153966 177930 28066 187453 2155191. Agriculture and Allied Activities (i to x) 13141 13976 27117 9218 17319 26537 9900 23268 33168
i) Crop Husbandry 4072 1876 5948 1549 3816 5365 1883 5219 7102ii) Soil and Water Conservation 1971 646 2617 1846 775 2621 1517 1114 2631iii) Animal Husbandry 1245 4662 5907 883 5283 6166 1261 7406 8667iv) Dairy Development 170 193 363 107 216 323 98 308 406v) Fisheries 390 143 533 317 187 504 399 377 776vi) Forestry and Wild Life 3716 1388 5104 3505 1792 5297 3827 2940 6767vii) Food Storage and Warehousing - 415 415 - 434 434 - 412 412viii) Agricultural Research and Education 1221 3209 4430 785 3527 4312 639 3859 4498ix) Co-operation 335 1414 1749 202 1255 1457 248 1597 1845x) Other Agricultural Programmes 21 30 51 24 34 58 28 36 64
2. Rural Development 3493 2310 5803 3855 2715 6570 2754 3531 62853. Irrigation and Flood Control (i to ii) 9729 18172 27901 8519 20457 28976 12043 17838 29881
i) Major and Medium Irrigation 5083 17555 22638 5869 19463 25332 8612 17469 26081ii) Minor Irrigation - 617 617 - 994 994 80 369 449
4. Energy 33 63245 63278 35 67994 68029 50 84715 84765of which: Power - 63245 63245 - 67994 67994 - 84715 84715
5. Industry and Minerals (i to ii) 2132 525 2657 1414 601 2015 1472 2361 3833i) Village and Small Industries 1591 142 1733 783 144 927 608 168 776ii) Industries @ 541 383 924 631 457 1088 864 2193 3057
6. Transport and Communications (i + ii) 113 41174 41287 133 44077 44210 37 54571 54608i) Roads and Bridges 113 7223 7336 130 7452 7582 33 14256 14289ii) Others @@ - 33951 33951 3 36625 36628 4 40315 40319
7. Science, Technology and Environment 263 12 275 189 22 211 288 37 3258. General Economic Services (i to iii) 548 763 1311 601 781 1382 1522 1132 2654
i) Secretariat – Economic Services 525 378 903 563 407 970 1418 595 2013ii) Tourism - 66 66 - 30 30 - 39 39iii) Others + 23 319 342 38 344 382 104 498 602
II. Non-Developmental Expenditure 1420 365327 366747 1872 324197 326069 2671 275174 277845(General Services) (A to F)A. Organs of State - 4656 4656 - 5579 5579 - 6767 6767B. Fiscal Services (i to ii) 12 4281 4293 19 4996 5015 36 7472 7508
i) Collection of Taxes and Duties 12 4045 4057 19 4659 4678 36 7047 7083ii) Other Fiscal Services - 236 236 - 337 337 - 425 425
C. Interest Payments and Servicing of Debt - 71590 71590 - 82033 82033 - 99699 99699of which: Interest Payments (i to iv) - 71590 71590 - 82033 82033 - 99699 99699i) Interest on Loans from the Centre - 39323 39323 - 44177 44177 - 52682 52682ii) Interest on Internal Debt - 13355 13355 - 16334 16334 - 20747 20747
of which: Interest on market loans - 10500 10500 - 12459 12459 - 14991 14991iii) Interest on Small Savings, Provident Funds, etc. - 17686 17686 - 20180 20180 - 24849 24849iv) Others - 1226 1226 - 1342 1342 - 1421 1421
D. Administrative Services (i to v) 1408 32892 34300 1853 38393 40246 2635 50657 53292i) Secretariat-General Services - 1902 1902 - 1999 1999 - 2677 2677ii) District Administration - 2203 2203 - 2525 2525 - 3449 3449iii) Police- 22167 22167 - 25714 25714 - 35346 35346iv) Public Works 1314 2236 3550 1810 3422 5232 2588 2945 5533v) Others ++ 94 4384 4478 43 4733 4776 47 6240 6287
E. Pensions - 24384 24384 - 25755 25755 - 53071 53071F. Miscellaneous General Services # - 227524 227524 - 167441 167441 - 57508 57508
Of which: Payment on account of State Lotteries - 227441 227441 - 167304 167304 - 57307 57307III. Compensation and Assignments to Local Bodies and - 744 744 - 50 50 - 49 49
Panchayati Raj Institutions
...contd...
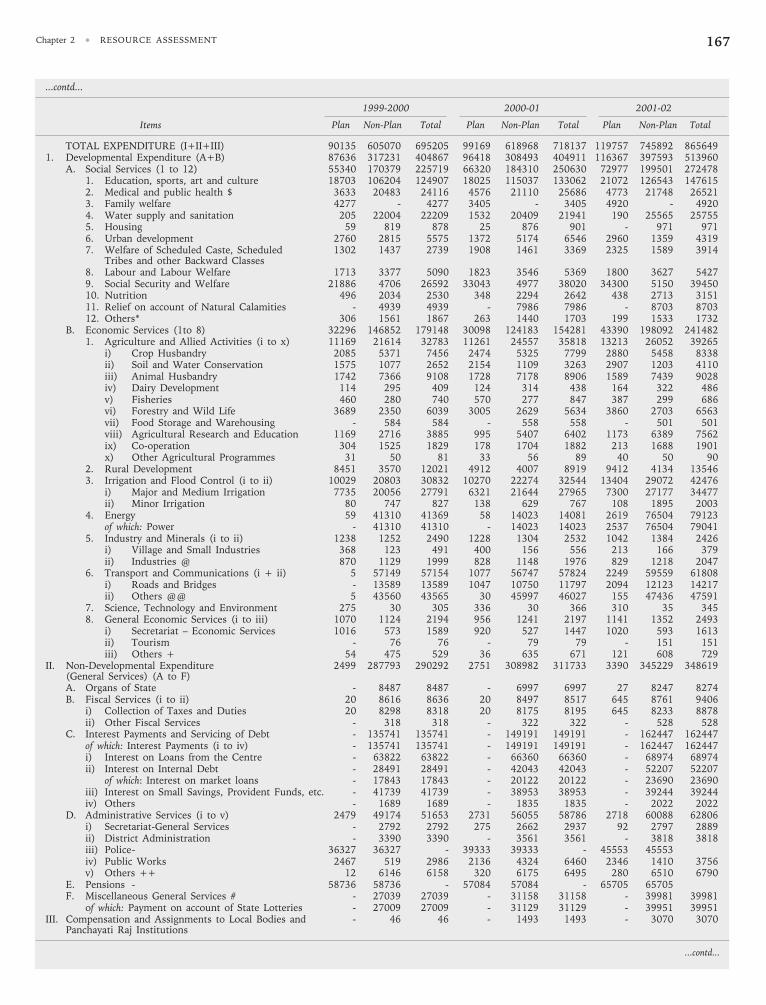
Chapter 2 • RESOURCE ASSESSMENT 167
...contd...
1999-2000 2000-01 2001-02
Items Plan Non-Plan Total Plan Non-Plan Total Plan Non-Plan Total
TOTAL EXPENDITURE (I+II+III) 90135 605070 695205 99169 618968 718137 119757 745892 8656491. Developmental Expenditure (A+B) 87636 317231 404867 96418 308493 404911 116367 397593 513960
A. Social Services (1 to 12) 55340 170379 225719 66320 184310 250630 72977 199501 2724781. Education, sports, art and culture 18703 106204 124907 18025 115037 133062 21072 126543 1476152. Medical and public health $ 3633 20483 24116 4576 21110 25686 4773 21748 265213. Family welfare 4277 - 4277 3405 - 3405 4920 - 49204. Water supply and sanitation 205 22004 22209 1532 20409 21941 190 25565 257555. Housing 59 819 878 25 876 901 - 971 9716. Urban development 2760 2815 5575 1372 5174 6546 2960 1359 43197. Welfare of Scheduled Caste, Scheduled 1302 1437 2739 1908 1461 3369 2325 1589 3914
Tribes and other Backward Classes8. Labour and Labour Welfare 1713 3377 5090 1823 3546 5369 1800 3627 54279. Social Security and Welfare 21886 4706 26592 33043 4977 38020 34300 5150 3945010. Nutrition 496 2034 2530 348 2294 2642 438 2713 315111. Relief on account of Natural Calamities - 4939 4939 - 7986 7986 - 8703 870312. Others* 306 1561 1867 263 1440 1703 199 1533 1732
B. Economic Services (1to 8) 32296 146852 179148 30098 124183 154281 43390 198092 2414821. Agriculture and Allied Activities (i to x) 11169 21614 32783 11261 24557 35818 13213 26052 39265
i) Crop Husbandry 2085 5371 7456 2474 5325 7799 2880 5458 8338ii) Soil and Water Conservation 1575 1077 2652 2154 1109 3263 2907 1203 4110iii) Animal Husbandry 1742 7366 9108 1728 7178 8906 1589 7439 9028iv) Dairy Development 114 295 409 124 314 438 164 322 486v) Fisheries 460 280 740 570 277 847 387 299 686vi) Forestry and Wild Life 3689 2350 6039 3005 2629 5634 3860 2703 6563vii) Food Storage and Warehousing - 584 584 - 558 558 - 501 501viii) Agricultural Research and Education 1169 2716 3885 995 5407 6402 1173 6389 7562ix) Co-operation 304 1525 1829 178 1704 1882 213 1688 1901x) Other Agricultural Programmes 31 50 81 33 56 89 40 50 90
2. Rural Development 8451 3570 12021 4912 4007 8919 9412 4134 135463. Irrigation and Flood Control (i to ii) 10029 20803 30832 10270 22274 32544 13404 29072 42476
i) Major and Medium Irrigation 7735 20056 27791 6321 21644 27965 7300 27177 34477ii) Minor Irrigation 80 747 827 138 629 767 108 1895 2003
4. Energy 59 41310 41369 58 14023 14081 2619 76504 79123of which: Power - 41310 41310 - 14023 14023 2537 76504 79041
5. Industry and Minerals (i to ii) 1238 1252 2490 1228 1304 2532 1042 1384 2426i) Village and Small Industries 368 123 491 400 156 556 213 166 379ii) Industries @ 870 1129 1999 828 1148 1976 829 1218 2047
6. Transport and Communications (i + ii) 5 57149 57154 1077 56747 57824 2249 59559 61808i) Roads and Bridges - 13589 13589 1047 10750 11797 2094 12123 14217ii) Others @@ 5 43560 43565 30 45997 46027 155 47436 47591
7. Science, Technology and Environment 275 30 305 336 30 366 310 35 3458. General Economic Services (i to iii) 1070 1124 2194 956 1241 2197 1141 1352 2493
i) Secretariat – Economic Services 1016 573 1589 920 527 1447 1020 593 1613ii) Tourism - 76 76 - 79 79 - 151 151iii) Others + 54 475 529 36 635 671 121 608 729
II. Non-Developmental Expenditure 2499 287793 290292 2751 308982 311733 3390 345229 348619(General Services) (A to F)A. Organs of State - 8487 8487 - 6997 6997 27 8247 8274B. Fiscal Services (i to ii) 20 8616 8636 20 8497 8517 645 8761 9406
i) Collection of Taxes and Duties 20 8298 8318 20 8175 8195 645 8233 8878ii) Other Fiscal Services - 318 318 - 322 322 - 528 528
C. Interest Payments and Servicing of Debt - 135741 135741 - 149191 149191 - 162447 162447of which: Interest Payments (i to iv) - 135741 135741 - 149191 149191 - 162447 162447i) Interest on Loans from the Centre - 63822 63822 - 66360 66360 - 68974 68974ii) Interest on Internal Debt - 28491 28491 - 42043 42043 - 52207 52207
of which: Interest on market loans - 17843 17843 - 20122 20122 - 23690 23690iii) Interest on Small Savings, Provident Funds, etc. - 41739 41739 - 38953 38953 - 39244 39244iv) Others - 1689 1689 - 1835 1835 - 2022 2022
D. Administrative Services (i to v) 2479 49174 51653 2731 56055 58786 2718 60088 62806i) Secretariat-General Services - 2792 2792 275 2662 2937 92 2797 2889ii) District Administration - 3390 3390 - 3561 3561 - 3818 3818iii) Police- 36327 36327 - 39333 39333 - 45553 45553iv) Public Works 2467 519 2986 2136 4324 6460 2346 1410 3756v) Others ++ 12 6146 6158 320 6175 6495 280 6510 6790
E. Pensions - 58736 58736 - 57084 57084 - 65705 65705F. Miscellaneous General Services # - 27039 27039 - 31158 31158 - 39981 39981
of which: Payment on account of State Lotteries - 27009 27009 - 31129 31129 - 39951 39951III. Compensation and Assignments to Local Bodies and - 46 46 - 1493 1493 - 3070 3070
Panchayati Raj Institutions
...contd...
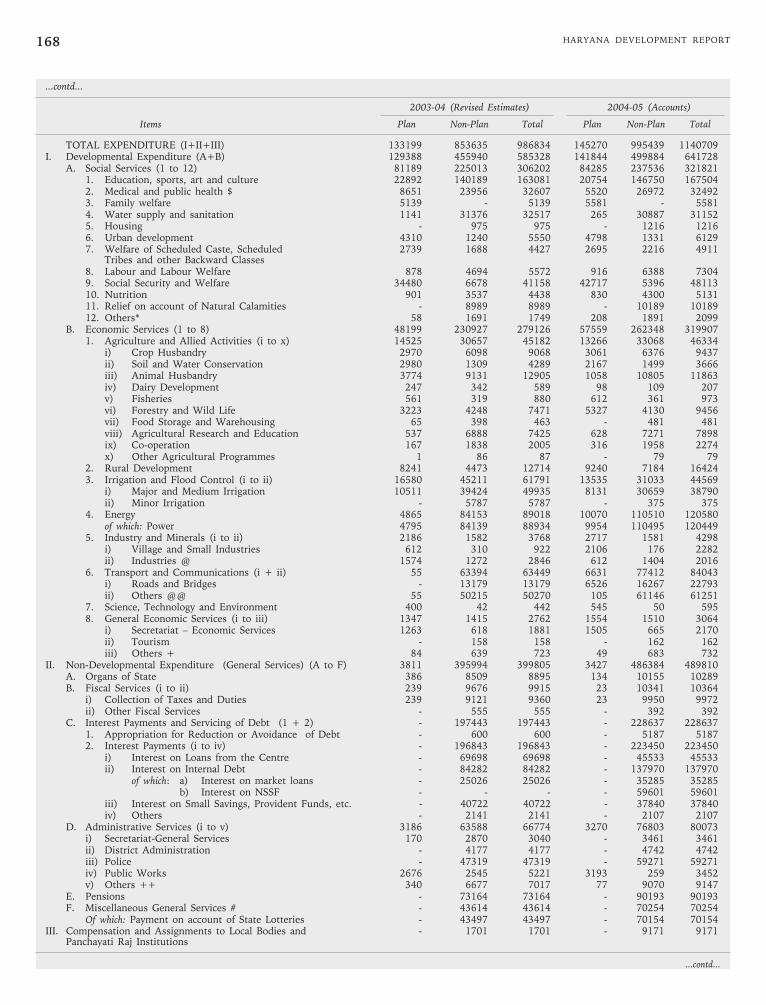
HARYANA DEVELOPMENT REPORT168
...contd...
2003-04 (Revised Estimates) 2004-05 (Accounts)
Items Plan Non-Plan Total Plan Non-Plan Total
TOTAL EXPENDITURE (I+II+III) 133199 853635 986834 145270 995439 1140709I. Developmental Expenditure (A+B) 129388 455940 585328 141844 499884 641728
A. Social Services (1 to 12) 81189 225013 306202 84285 237536 3218211. Education, sports, art and culture 22892 140189 163081 20754 146750 1675042. Medical and public health $ 8651 23956 32607 5520 26972 324923. Family welfare 5139 - 5139 5581 - 55814. Water supply and sanitation 1141 31376 32517 265 30887 311525. Housing - 975 975 - 1216 12166. Urban development 4310 1240 5550 4798 1331 61297. Welfare of Scheduled Caste, Scheduled 2739 1688 4427 2695 2216 4911
Tribes and other Backward Classes8. Labour and Labour Welfare 878 4694 5572 916 6388 73049. Social Security and Welfare 34480 6678 41158 42717 5396 4811310. Nutrition 901 3537 4438 830 4300 513111. Relief on account of Natural Calamities - 8989 8989 - 10189 1018912. Others* 58 1691 1749 208 1891 2099
B. Economic Services (1 to 8) 48199 230927 279126 57559 262348 3199071. Agriculture and Allied Activities (i to x) 14525 30657 45182 13266 33068 46334
i) Crop Husbandry 2970 6098 9068 3061 6376 9437ii) Soil and Water Conservation 2980 1309 4289 2167 1499 3666iii) Animal Husbandry 3774 9131 12905 1058 10805 11863iv) Dairy Development 247 342 589 98 109 207v) Fisheries 561 319 880 612 361 973vi) Forestry and Wild Life 3223 4248 7471 5327 4130 9456vii) Food Storage and Warehousing 65 398 463 - 481 481viii) Agricultural Research and Education 537 6888 7425 628 7271 7898ix) Co-operation 167 1838 2005 316 1958 2274x) Other Agricultural Programmes 1 86 87 - 79 79
2. Rural Development 8241 4473 12714 9240 7184 164243. Irrigation and Flood Control (i to ii) 16580 45211 61791 13535 31033 44569
i) Major and Medium Irrigation 10511 39424 49935 8131 30659 38790ii) Minor Irrigation - 5787 5787 - 375 375
4. Energy 4865 84153 89018 10070 110510 120580of which: Power 4795 84139 88934 9954 110495 120449
5. Industry and Minerals (i to ii) 2186 1582 3768 2717 1581 4298i) Village and Small Industries 612 310 922 2106 176 2282ii) Industries @ 1574 1272 2846 612 1404 2016
6. Transport and Communications (i + ii) 55 63394 63449 6631 77412 84043i) Roads and Bridges - 13179 13179 6526 16267 22793ii) Others @@ 55 50215 50270 105 61146 61251
7. Science, Technology and Environment 400 42 442 545 50 5958. General Economic Services (i to iii) 1347 1415 2762 1554 1510 3064
i) Secretariat – Economic Services 1263 618 1881 1505 665 2170ii) Tourism - 158 158 - 162 162iii) Others + 84 639 723 49 683 732
II. Non-Developmental Expenditure (General Services) (A to F) 3811 395994 399805 3427 486384 489810A. Organs of State 386 8509 8895 134 10155 10289B. Fiscal Services (i to ii) 239 9676 9915 23 10341 10364
i) Collection of Taxes and Duties 239 9121 9360 23 9950 9972ii) Other Fiscal Services - 555 555 - 392 392
C. Interest Payments and Servicing of Debt (1 + 2) - 197443 197443 - 228637 2286371. Appropriation for Reduction or Avoidance of Debt - 600 600 - 5187 51872. Interest Payments (i to iv) - 196843 196843 - 223450 223450
i) Interest on Loans from the Centre - 69698 69698 - 45533 45533ii) Interest on Internal Debt - 84282 84282 - 137970 137970
of which: a) Interest on market loans - 25026 25026 - 35285 35285b) Interest on NSSF - - - - 59601 59601
iii) Interest on Small Savings, Provident Funds, etc. - 40722 40722 - 37840 37840iv) Others - 2141 2141 - 2107 2107
D. Administrative Services (i to v) 3186 63588 66774 3270 76803 80073i) Secretariat-General Services 170 2870 3040 - 3461 3461ii) District Administration - 4177 4177 - 4742 4742iii) Police - 47319 47319 - 59271 59271iv) Public Works 2676 2545 5221 3193 259 3452v) Others ++ 340 6677 7017 77 9070 9147
E. Pensions - 73164 73164 - 90193 90193F. Miscellaneous General Services # - 43614 43614 - 70254 70254
Of which: Payment on account of State Lotteries - 43497 43497 - 70154 70154III. Compensation and Assignments to Local Bodies and - 1701 1701 - 9171 9171
Panchayati Raj Institutions
...contd...
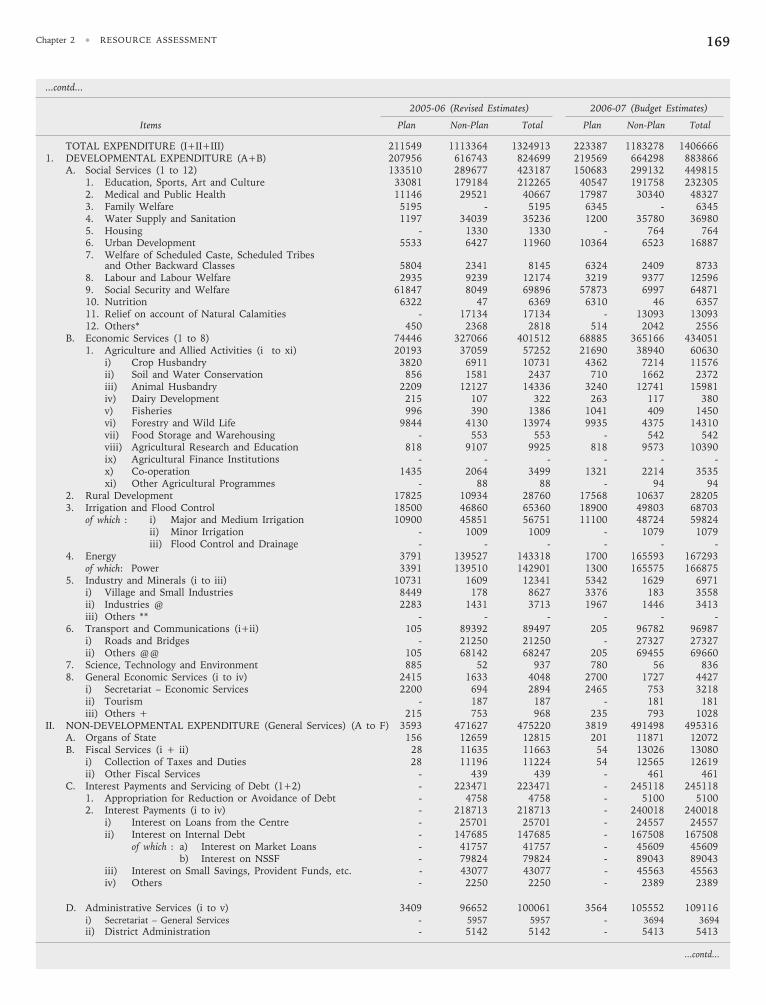
Chapter 2 • RESOURCE ASSESSMENT 169
...contd...
2005-06 (Revised Estimates) 2006-07 (Budget Estimates)
Items Plan Non-Plan Total Plan Non-Plan Total
TOTAL EXPENDITURE (I+II+III) 211549 1113364 1324913 223387 1183278 14066661. DEVELOPMENTAL EXPENDITURE (A+B) 207956 616743 824699 219569 664298 883866
A. Social Services (1 to 12) 133510 289677 423187 150683 299132 4498151. Education, Sports, Art and Culture 33081 179184 212265 40547 191758 2323052. Medical and Public Health 11146 29521 40667 17987 30340 483273. Family Welfare 5195 - 5195 6345 - 63454. Water Supply and Sanitation 1197 34039 35236 1200 35780 369805. Housing - 1330 1330 - 764 7646. Urban Development 5533 6427 11960 10364 6523 168877. Welfare of Scheduled Caste, Scheduled Tribes
and Other Backward Classes 5804 2341 8145 6324 2409 87338. Labour and Labour Welfare 2935 9239 12174 3219 9377 125969. Social Security and Welfare 61847 8049 69896 57873 6997 6487110. Nutrition 6322 47 6369 6310 46 635711. Relief on account of Natural Calamities - 17134 17134 - 13093 1309312. Others* 450 2368 2818 514 2042 2556
B. Economic Services (1 to 8) 74446 327066 401512 68885 365166 4340511. Agriculture and Allied Activities (i to xi) 20193 37059 57252 21690 38940 60630
i) Crop Husbandry 3820 6911 10731 4362 7214 11576ii) Soil and Water Conservation 856 1581 2437 710 1662 2372iii) Animal Husbandry 2209 12127 14336 3240 12741 15981iv) Dairy Development 215 107 322 263 117 380v) Fisheries 996 390 1386 1041 409 1450vi) Forestry and Wild Life 9844 4130 13974 9935 4375 14310vii) Food Storage and Warehousing - 553 553 - 542 542viii) Agricultural Research and Education 818 9107 9925 818 9573 10390ix) Agricultural Finance Institutions - - - - - -x) Co-operation 1435 2064 3499 1321 2214 3535xi) Other Agricultural Programmes - 88 88 - 94 94
2. Rural Development 17825 10934 28760 17568 10637 282053. Irrigation and Flood Control 18500 46860 65360 18900 49803 68703
of which : i) Major and Medium Irrigation 10900 45851 56751 11100 48724 59824ii) Minor Irrigation - 1009 1009 - 1079 1079iii) Flood Control and Drainage - - - - - -
4. Energy 3791 139527 143318 1700 165593 167293of which: Power 3391 139510 142901 1300 165575 166875
5. Industry and Minerals (i to iii) 10731 1609 12341 5342 1629 6971i) Village and Small Industries 8449 178 8627 3376 183 3558ii) Industries @ 2283 1431 3713 1967 1446 3413iii) Others ** - - - - - -
6. Transport and Communications (i+ii) 105 89392 89497 205 96782 96987i) Roads and Bridges - 21250 21250 - 27327 27327ii) Others @@ 105 68142 68247 205 69455 69660
7. Science, Technology and Environment 885 52 937 780 56 8368. General Economic Services (i to iv) 2415 1633 4048 2700 1727 4427
i) Secretariat – Economic Services 2200 694 2894 2465 753 3218ii) Tourism - 187 187 - 181 181iii) Others + 215 753 968 235 793 1028
II. NON-DEVELOPMENTAL EXPENDITURE (General Services) (A to F) 3593 471627 475220 3819 491498 495316A. Organs of State 156 12659 12815 201 11871 12072B. Fiscal Services (i + ii) 28 11635 11663 54 13026 13080
i) Collection of Taxes and Duties 28 11196 11224 54 12565 12619ii) Other Fiscal Services - 439 439 - 461 461
C. Interest Payments and Servicing of Debt (1+2) - 223471 223471 - 245118 2451181. Appropriation for Reduction or Avoidance of Debt - 4758 4758 - 5100 51002. Interest Payments (i to iv) - 218713 218713 - 240018 240018
i) Interest on Loans from the Centre - 25701 25701 - 24557 24557ii) Interest on Internal Debt - 147685 147685 - 167508 167508
of which : a) Interest on Market Loans - 41757 41757 - 45609 45609b) Interest on NSSF - 79824 79824 - 89043 89043
iii) Interest on Small Savings, Provident Funds, etc. - 43077 43077 - 45563 45563iv) Others - 2250 2250 - 2389 2389
D. Administrative Services (i to v) 3409 96652 100061 3564 105552 109116i) Secretariat – General Services - 5957 5957 - 3694 3694ii) District Administration - 5142 5142 - 5413 5413
...contd...
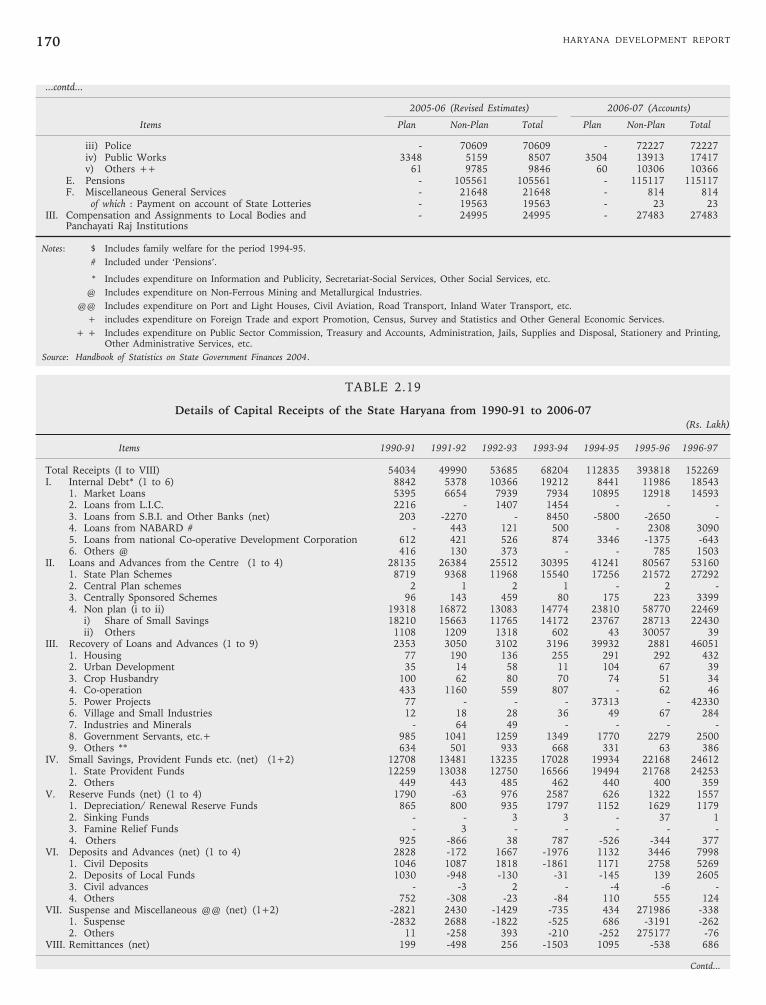
HARYANA DEVELOPMENT REPORT170
...contd...
2005-06 (Revised Estimates) 2006-07 (Accounts)
Items Plan Non-Plan Total Plan Non-Plan Total
iii) Police - 70609 70609 - 72227 72227iv) Public Works 3348 5159 8507 3504 13913 17417v) Others ++ 61 9785 9846 60 10306 10366
E. Pensions - 105561 105561 - 115117 115117F. Miscellaneous General Services - 21648 21648 - 814 814
of which : Payment on account of State Lotteries - 19563 19563 - 23 23III. Compensation and Assignments to Local Bodies and - 24995 24995 - 27483 27483
Panchayati Raj Institutions
Notes: $ Includes family welfare for the period 1994-95.
# Included under ‘Pensions’.
* Includes expenditure on Information and Publicity, Secretariat-Social Services, Other Social Services, etc.
@ Includes expenditure on Non-Ferrous Mining and Metallurgical Industries.
@@ Includes expenditure on Port and Light Houses, Civil Aviation, Road Transport, Inland Water Transport, etc.
+ includes expenditure on Foreign Trade and export Promotion, Census, Survey and Statistics and Other General Economic Services.
+ + Includes expenditure on Public Sector Commission, Treasury and Accounts, Administration, Jails, Supplies and Disposal, Stationery and Printing,Other Administrative Services, etc.
Source: Handbook of Statistics on State Government Finances 2004.
TABLE 2.19
Details of Capital Receipts of the State Haryana from 1990-91 to 2006-07(Rs. Lakh)
Items 1990-91 1991-92 1992-93 1993-94 1994-95 1995-96 1996-97
Total Receipts (I to VIII) 54034 49990 53685 68204 112835 393818 152269I. Internal Debt* (1 to 6) 8842 5378 10366 19212 8441 11986 18543
1. Market Loans 5395 6654 7939 7934 10895 12918 145932. Loans from L.I.C. 2216 - 1407 1454 - - -3. Loans from S.B.I. and Other Banks (net) 203 -2270 - 8450 -5800 -2650 -4. Loans from NABARD # - 443 121 500 - 2308 30905. Loans from national Co-operative Development Corporation 612 421 526 874 3346 -1375 -6436. Others @ 416 130 373 - - 785 1503
II. Loans and Advances from the Centre (1 to 4) 28135 26384 25512 30395 41241 80567 531601. State Plan Schemes 8719 9368 11968 15540 17256 21572 272922. Central Plan schemes 2 1 2 1 - 2 -3. Centrally Sponsored Schemes 96 143 459 80 175 223 33994. Non plan (i to ii) 19318 16872 13083 14774 23810 58770 22469
i) Share of Small Savings 18210 15663 11765 14172 23767 28713 22430ii) Others 1108 1209 1318 602 43 30057 39
III. Recovery of Loans and Advances (1 to 9) 2353 3050 3102 3196 39932 2881 460511. Housing 77 190 136 255 291 292 4322. Urban Development 35 14 58 11 104 67 393. Crop Husbandry 100 62 80 70 74 51 344. Co-operation 433 1160 559 807 - 62 465. Power Projects 77 - - - 37313 - 423306. Village and Small Industries 12 18 28 36 49 67 2847. Industries and Minerals - 64 49 - - - -8. Government Servants, etc.+ 985 1041 1259 1349 1770 2279 25009. Others ** 634 501 933 668 331 63 386
IV. Small Savings, Provident Funds etc. (net) (1+2) 12708 13481 13235 17028 19934 22168 246121. State Provident Funds 12259 13038 12750 16566 19494 21768 242532. Others 449 443 485 462 440 400 359
V. Reserve Funds (net) (1 to 4) 1790 -63 976 2587 626 1322 15571. Depreciation/ Renewal Reserve Funds 865 800 935 1797 1152 1629 11792. Sinking Funds - - 3 3 - 37 13. Famine Relief Funds - 3 - - - - -4. Others 925 -866 38 787 -526 -344 377
VI. Deposits and Advances (net) (1 to 4) 2828 -172 1667 -1976 1132 3446 79981. Civil Deposits 1046 1087 1818 -1861 1171 2758 52692. Deposits of Local Funds 1030 -948 -130 -31 -145 139 26053. Civil advances - -3 2 - -4 -6 -4. Others 752 -308 -23 -84 110 555 124
VII. Suspense and Miscellaneous @@ (net) (1+2) -2821 2430 -1429 -735 434 271986 -3381. Suspense -2832 2688 -1822 -525 686 -3191 -2622. Others 11 -258 393 -210 -252 275177 -76
VIII. Remittances (net) 199 -498 256 -1503 1095 -538 686
Contd...
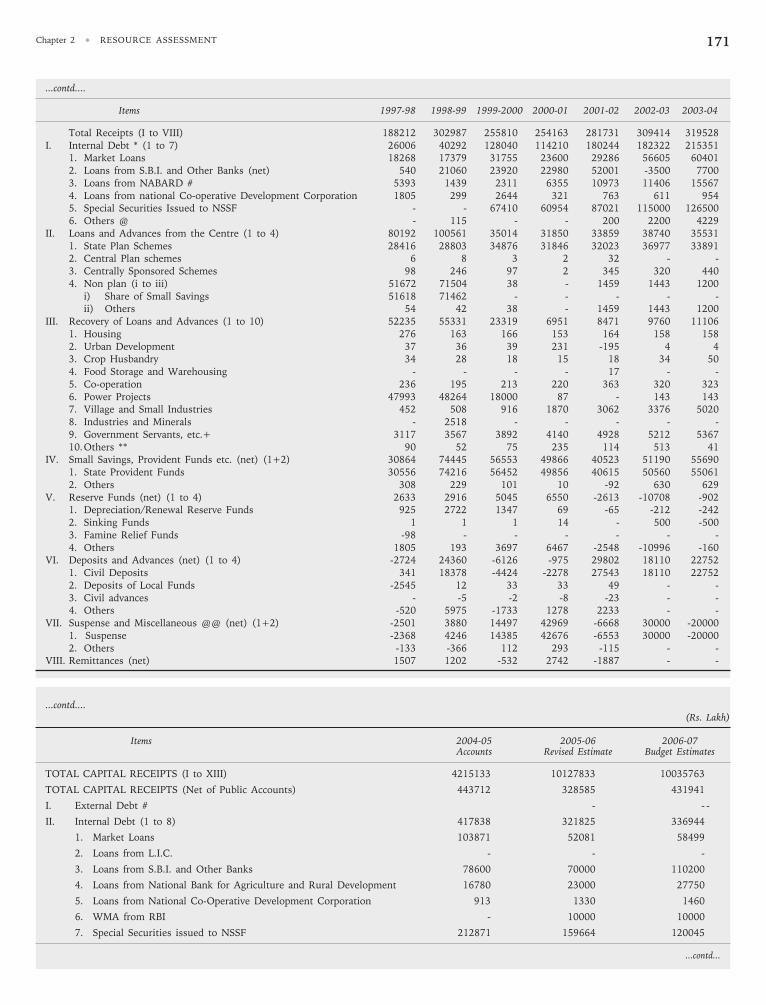
Chapter 2 • RESOURCE ASSESSMENT 171
...contd....
Items 1997-98 1998-99 1999-2000 2000-01 2001-02 2002-03 2003-04
Total Receipts (I to VIII) 188212 302987 255810 254163 281731 309414 319528I. Internal Debt * (1 to 7) 26006 40292 128040 114210 180244 182322 215351
1. Market Loans 18268 17379 31755 23600 29286 56605 604012. Loans from S.B.I. and Other Banks (net) 540 21060 23920 22980 52001 -3500 77003. Loans from NABARD # 5393 1439 2311 6355 10973 11406 155674. Loans from national Co-operative Development Corporation 1805 299 2644 321 763 611 9545. Special Securities Issued to NSSF - - 67410 60954 87021 115000 1265006. Others @ - 115 - - 200 2200 4229
II. Loans and Advances from the Centre (1 to 4) 80192 100561 35014 31850 33859 38740 355311. State Plan Schemes 28416 28803 34876 31846 32023 36977 338912. Central Plan schemes 6 8 3 2 32 - -3. Centrally Sponsored Schemes 98 246 97 2 345 320 4404. Non plan (i to iii) 51672 71504 38 - 1459 1443 1200
i) Share of Small Savings 51618 71462 - - - - -ii) Others 54 42 38 - 1459 1443 1200
III. Recovery of Loans and Advances (1 to 10) 52235 55331 23319 6951 8471 9760 111061. Housing 276 163 166 153 164 158 1582. Urban Development 37 36 39 231 -195 4 43. Crop Husbandry 34 28 18 15 18 34 504. Food Storage and Warehousing - - - - 17 - -5. Co-operation 236 195 213 220 363 320 3236. Power Projects 47993 48264 18000 87 - 143 1437. Village and Small Industries 452 508 916 1870 3062 3376 50208. Industries and Minerals - 2518 - - - - -9. Government Servants, etc.+ 3117 3567 3892 4140 4928 5212 536710.Others ** 90 52 75 235 114 513 41
IV. Small Savings, Provident Funds etc. (net) (1+2) 30864 74445 56553 49866 40523 51190 556901. State Provident Funds 30556 74216 56452 49856 40615 50560 550612. Others 308 229 101 10 -92 630 629
V. Reserve Funds (net) (1 to 4) 2633 2916 5045 6550 -2613 -10708 -9021. Depreciation/Renewal Reserve Funds 925 2722 1347 69 -65 -212 -2422. Sinking Funds 1 1 1 14 - 500 -5003. Famine Relief Funds -98 - - - - - -4. Others 1805 193 3697 6467 -2548 -10996 -160
VI. Deposits and Advances (net) (1 to 4) -2724 24360 -6126 -975 29802 18110 227521. Civil Deposits 341 18378 -4424 -2278 27543 18110 227522. Deposits of Local Funds -2545 12 33 33 49 - -3. Civil advances - -5 -2 -8 -23 - -4. Others -520 5975 -1733 1278 2233 - -
VII. Suspense and Miscellaneous @@ (net) (1+2) -2501 3880 14497 42969 -6668 30000 -200001. Suspense -2368 4246 14385 42676 -6553 30000 -200002. Others -133 -366 112 293 -115 - -
VIII. Remittances (net) 1507 1202 -532 2742 -1887 - -
...contd....(Rs. Lakh)
Items 2004-05 2005-06 2006-07Accounts Revised Estimate Budget Estimates
TOTAL CAPITAL RECEIPTS (I to XIII) 4215133 10127833 10035763
TOTAL CAPITAL RECEIPTS (Net of Public Accounts) 443712 328585 431941
I. External Debt # - - -
II. Internal Debt (1 to 8) 417838 321825 336944
1. Market Loans 103871 52081 58499
2. Loans from L.I.C. - - -
3. Loans from S.B.I. and Other Banks 78600 70000 110200
4. Loans from National Bank for Agriculture and Rural Development 16780 23000 27750
5. Loans from National Co-Operative Development Corporation 913 1330 1460
6. WMA from RBI - 10000 10000
7. Special Securities issued to NSSF 212871 159664 120045
...contd...
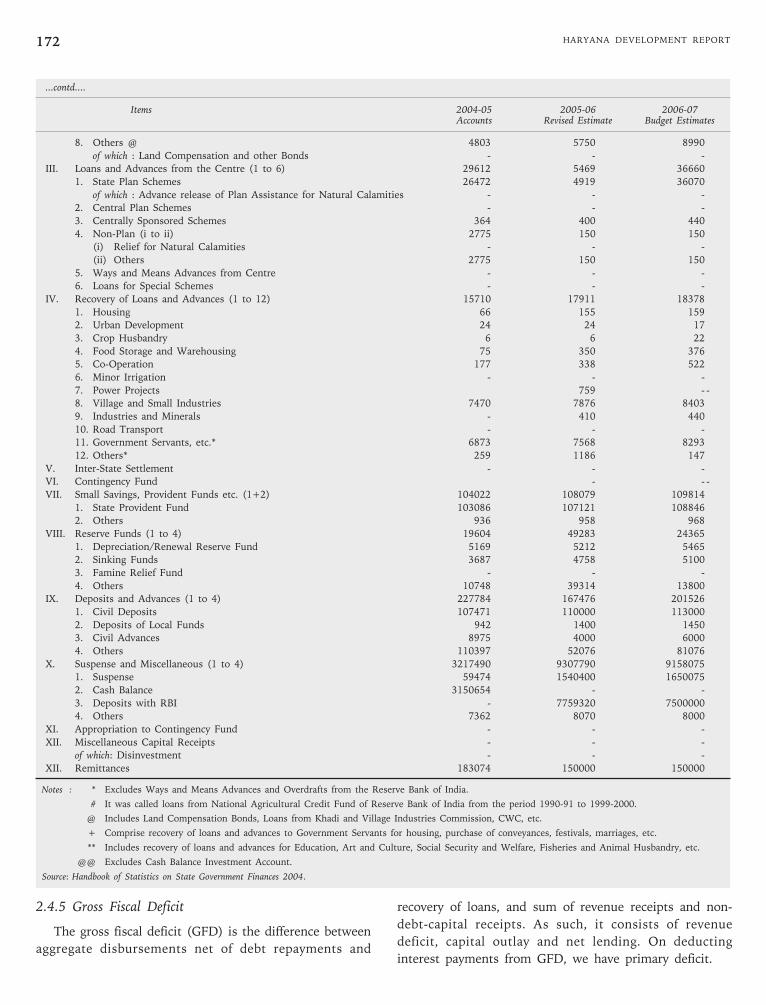
HARYANA DEVELOPMENT REPORT172
...contd....
Items 2004-05 2005-06 2006-07Accounts Revised Estimate Budget Estimates
8. Others @ 4803 5750 8990
of which : Land Compensation and other Bonds - - -
III. Loans and Advances from the Centre (1 to 6) 29612 5469 36660
1. State Plan Schemes 26472 4919 36070
of which : Advance release of Plan Assistance for Natural Calamities - - -
2. Central Plan Schemes - - -
3. Centrally Sponsored Schemes 364 400 440
4. Non-Plan (i to ii) 2775 150 150
(i) Relief for Natural Calamities - - -
(ii) Others 2775 150 150
5. Ways and Means Advances from Centre - - -
6. Loans for Special Schemes - - -
IV. Recovery of Loans and Advances (1 to 12) 15710 17911 18378
1. Housing 66 155 159
2. Urban Development 24 24 17
3. Crop Husbandry 6 6 22
4. Food Storage and Warehousing 75 350 376
5. Co-Operation 177 338 522
6. Minor Irrigation - - -
7. Power Projects 759 - -
8. Village and Small Industries 7470 7876 8403
9. Industries and Minerals - 410 440
10. Road Transport - - -
11. Government Servants, etc.* 6873 7568 8293
12. Others* 259 1186 147
V. Inter-State Settlement - - -
VI. Contingency Fund - - -
VII. Small Savings, Provident Funds etc. (1+2) 104022 108079 109814
1. State Provident Fund 103086 107121 108846
2. Others 936 958 968
VIII. Reserve Funds (1 to 4) 19604 49283 24365
1. Depreciation/Renewal Reserve Fund 5169 5212 5465
2. Sinking Funds 3687 4758 5100
3. Famine Relief Fund - - -
4. Others 10748 39314 13800
IX. Deposits and Advances (1 to 4) 227784 167476 201526
1. Civil Deposits 107471 110000 113000
2. Deposits of Local Funds 942 1400 1450
3. Civil Advances 8975 4000 6000
4. Others 110397 52076 81076
X. Suspense and Miscellaneous (1 to 4) 3217490 9307790 9158075
1. Suspense 59474 1540400 1650075
2. Cash Balance 3150654 - -
3. Deposits with RBI - 7759320 7500000
4. Others 7362 8070 8000
XI. Appropriation to Contingency Fund - - -
XII. Miscellaneous Capital Receipts - - -
of which: Disinvestment - - -
XII. Remittances 183074 150000 150000
Notes : * Excludes Ways and Means Advances and Overdrafts from the Reserve Bank of India.
# It was called loans from National Agricultural Credit Fund of Reserve Bank of India from the period 1990-91 to 1999-2000.
@ Includes Land Compensation Bonds, Loans from Khadi and Village Industries Commission, CWC, etc.
+ Comprise recovery of loans and advances to Government Servants for housing, purchase of conveyances, festivals, marriages, etc.
** Includes recovery of loans and advances for Education, Art and Culture, Social Security and Welfare, Fisheries and Animal Husbandry, etc.
@@ Excludes Cash Balance Investment Account.
Source: Handbook of Statistics on State Government Finances 2004.
2.4.5 Gross Fiscal Deficit
The gross fiscal deficit (GFD) is the difference between
aggregate disbursements net of debt repayments and
recovery of loans, and sum of revenue receipts and non-
debt-capital receipts. As such, it consists of revenue
deficit, capital outlay and net lending. On deducting
interest payments from GFD, we have primary deficit.
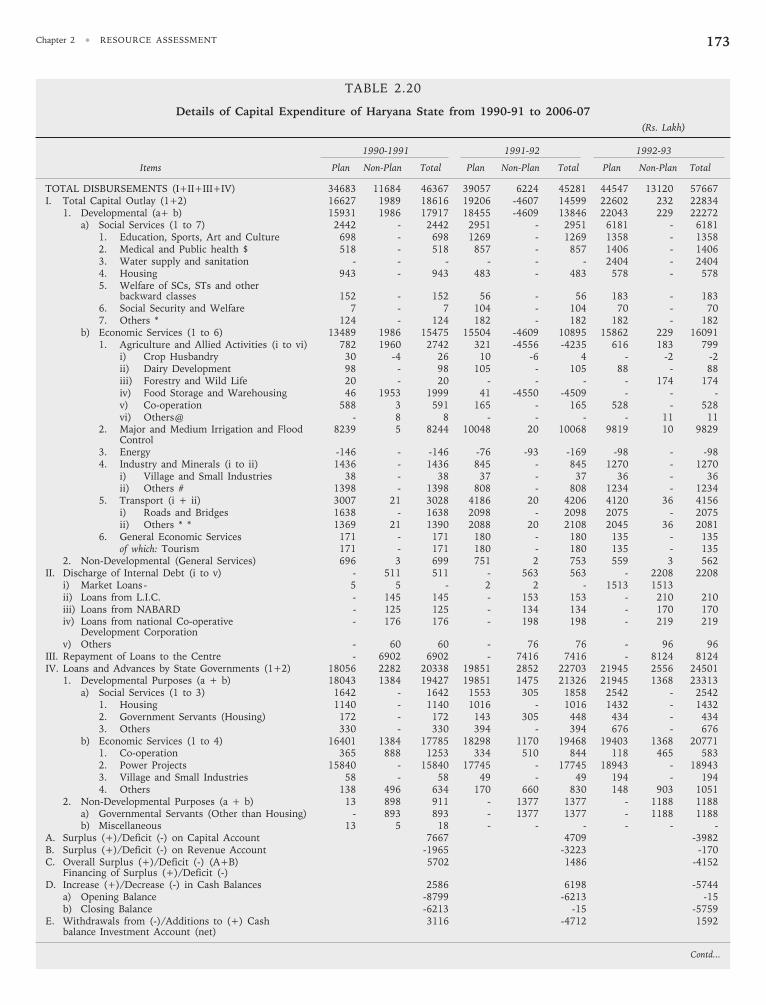
Chapter 2 • RESOURCE ASSESSMENT 173
TABLE 2.20
Details of Capital Expenditure of Haryana State from 1990-91 to 2006-07
(Rs. Lakh)
1990-1991 1991-92 1992-93
Items Plan Non-Plan Total Plan Non-Plan Total Plan Non-Plan Total
TOTAL DISBURSEMENTS (I+II+III+IV) 34683 11684 46367 39057 6224 45281 44547 13120 57667I. Total Capital Outlay (1+2) 16627 1989 18616 19206 -4607 14599 22602 232 22834
1. Developmental (a+ b) 15931 1986 17917 18455 -4609 13846 22043 229 22272a) Social Services (1 to 7) 2442 - 2442 2951 - 2951 6181 - 6181
1. Education, Sports, Art and Culture 698 - 698 1269 - 1269 1358 - 13582. Medical and Public health $ 518 - 518 857 - 857 1406 - 14063. Water supply and sanitation - - - - - - 2404 - 24044. Housing 943 - 943 483 - 483 578 - 5785. Welfare of SCs, STs and other
backward classes 152 - 152 56 - 56 183 - 1836. Social Security and Welfare 7 - 7 104 - 104 70 - 707. Others * 124 - 124 182 - 182 182 - 182
b) Economic Services (1 to 6) 13489 1986 15475 15504 -4609 10895 15862 229 160911. Agriculture and Allied Activities (i to vi) 782 1960 2742 321 -4556 -4235 616 183 799
i) Crop Husbandry 30 -4 26 10 -6 4 - -2 -2ii) Dairy Development 98 - 98 105 - 105 88 - 88iii) Forestry and Wild Life 20 - 20 - - - - 174 174iv) Food Storage and Warehousing 46 1953 1999 41 -4550 -4509 - - -v) Co-operation 588 3 591 165 - 165 528 - 528vi) Others@ - 8 8 - - - - 11 11
2. Major and Medium Irrigation and Flood 8239 5 8244 10048 20 10068 9819 10 9829Control
3. Energy -146 - -146 -76 -93 -169 -98 - -984. Industry and Minerals (i to ii) 1436 - 1436 845 - 845 1270 - 1270
i) Village and Small Industries 38 - 38 37 - 37 36 - 36ii) Others # 1398 - 1398 808 - 808 1234 - 1234
5. Transport (i + ii) 3007 21 3028 4186 20 4206 4120 36 4156i) Roads and Bridges 1638 - 1638 2098 - 2098 2075 - 2075ii) Others * * 1369 21 1390 2088 20 2108 2045 36 2081
6. General Economic Services 171 - 171 180 - 180 135 - 135of which: Tourism 171 - 171 180 - 180 135 - 135
2. Non-Developmental (General Services) 696 3 699 751 2 753 559 3 562II. Discharge of Internal Debt (i to v) - 511 511 - 563 563 - 2208 2208
i) Market Loans- 5 5 - 2 2 - 1513 1513ii) Loans from L.I.C. - 145 145 - 153 153 - 210 210iii) Loans from NABARD - 125 125 - 134 134 - 170 170iv) Loans from national Co-operative - 176 176 - 198 198 - 219 219
Development Corporationv) Others - 60 60 - 76 76 - 96 96
III. Repayment of Loans to the Centre - 6902 6902 - 7416 7416 - 8124 8124IV. Loans and Advances by State Governments (1+2) 18056 2282 20338 19851 2852 22703 21945 2556 24501
1. Developmental Purposes (a + b) 18043 1384 19427 19851 1475 21326 21945 1368 23313a) Social Services (1 to 3) 1642 - 1642 1553 305 1858 2542 - 2542
1. Housing 1140 - 1140 1016 - 1016 1432 - 14322. Government Servants (Housing) 172 - 172 143 305 448 434 - 4343. Others 330 - 330 394 - 394 676 - 676
b) Economic Services (1 to 4) 16401 1384 17785 18298 1170 19468 19403 1368 207711. Co-operation 365 888 1253 334 510 844 118 465 5832. Power Projects 15840 - 15840 17745 - 17745 18943 - 189433. Village and Small Industries 58 - 58 49 - 49 194 - 1944. Others 138 496 634 170 660 830 148 903 1051
2. Non-Developmental Purposes (a + b) 13 898 911 - 1377 1377 - 1188 1188a) Governmental Servants (Other than Housing) - 893 893 - 1377 1377 - 1188 1188b) Miscellaneous 13 5 18 - - - - - -
A. Surplus (+)/Deficit (-) on Capital Account 7667 4709 -3982B. Surplus (+)/Deficit (-) on Revenue Account -1965 -3223 -170C. Overall Surplus (+)/Deficit (-) (A+B) 5702 1486 -4152
Financing of Surplus (+)/Deficit (-)D. Increase (+)/Decrease (-) in Cash Balances 2586 6198 -5744
a) Opening Balance -8799 -6213 -15b) Closing Balance -6213 -15 -5759
E. Withdrawals from (-)/Additions to (+) Cash 3116 -4712 1592balance Investment Account (net)
Contd...
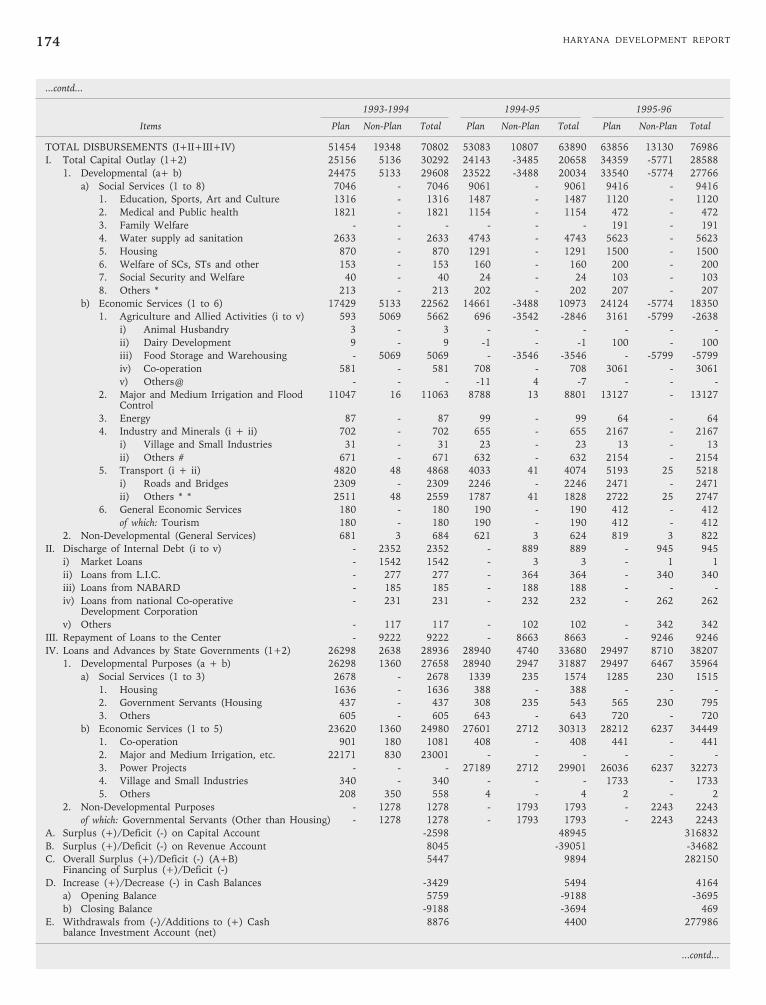
HARYANA DEVELOPMENT REPORT174
...contd...
1993-1994 1994-95 1995-96
Items Plan Non-Plan Total Plan Non-Plan Total Plan Non-Plan Total
TOTAL DISBURSEMENTS (I+II+III+IV) 51454 19348 70802 53083 10807 63890 63856 13130 76986
I. Total Capital Outlay (1+2) 25156 5136 30292 24143 -3485 20658 34359 -5771 28588
1. Developmental (a+ b) 24475 5133 29608 23522 -3488 20034 33540 -5774 27766
a) Social Services (1 to 8) 7046 - 7046 9061 - 9061 9416 - 9416
1. Education, Sports, Art and Culture 1316 - 1316 1487 - 1487 1120 - 1120
2. Medical and Public health 1821 - 1821 1154 - 1154 472 - 472
3. Family Welfare - - - - - - 191 - 191
4. Water supply ad sanitation 2633 - 2633 4743 - 4743 5623 - 5623
5. Housing 870 - 870 1291 - 1291 1500 - 1500
6. Welfare of SCs, STs and other 153 - 153 160 - 160 200 - 200
7. Social Security and Welfare 40 - 40 24 - 24 103 - 103
8. Others * 213 - 213 202 - 202 207 - 207
b) Economic Services (1 to 6) 17429 5133 22562 14661 -3488 10973 24124 -5774 18350
1. Agriculture and Allied Activities (i to v) 593 5069 5662 696 -3542 -2846 3161 -5799 -2638
i) Animal Husbandry 3 - 3 - - - - - -
ii) Dairy Development 9 - 9 -1 - -1 100 - 100
iii) Food Storage and Warehousing - 5069 5069 - -3546 -3546 - -5799 -5799
iv) Co-operation 581 - 581 708 - 708 3061 - 3061
v) Others@ - - - -11 4 -7 - - -
2. Major and Medium Irrigation and Flood 11047 16 11063 8788 13 8801 13127 - 13127Control
3. Energy 87 - 87 99 - 99 64 - 64
4. Industry and Minerals (i + ii) 702 - 702 655 - 655 2167 - 2167
i) Village and Small Industries 31 - 31 23 - 23 13 - 13
ii) Others # 671 - 671 632 - 632 2154 - 2154
5. Transport (i + ii) 4820 48 4868 4033 41 4074 5193 25 5218
i) Roads and Bridges 2309 - 2309 2246 - 2246 2471 - 2471
ii) Others * * 2511 48 2559 1787 41 1828 2722 25 2747
6. General Economic Services 180 - 180 190 - 190 412 - 412
of which: Tourism 180 - 180 190 - 190 412 - 412
2. Non-Developmental (General Services) 681 3 684 621 3 624 819 3 822
II. Discharge of Internal Debt (i to v) - 2352 2352 - 889 889 - 945 945
i) Market Loans - 1542 1542 - 3 3 - 1 1
ii) Loans from L.I.C. - 277 277 - 364 364 - 340 340
iii) Loans from NABARD - 185 185 - 188 188 - - -
iv) Loans from national Co-operative - 231 231 - 232 232 - 262 262Development Corporation
v) Others - 117 117 - 102 102 - 342 342
III. Repayment of Loans to the Center - 9222 9222 - 8663 8663 - 9246 9246
IV. Loans and Advances by State Governments (1+2) 26298 2638 28936 28940 4740 33680 29497 8710 38207
1. Developmental Purposes (a + b) 26298 1360 27658 28940 2947 31887 29497 6467 35964
a) Social Services (1 to 3) 2678 - 2678 1339 235 1574 1285 230 1515
1. Housing 1636 - 1636 388 - 388 - - -
2. Government Servants (Housing 437 - 437 308 235 543 565 230 795
3. Others 605 - 605 643 - 643 720 - 720
b) Economic Services (1 to 5) 23620 1360 24980 27601 2712 30313 28212 6237 34449
1. Co-operation 901 180 1081 408 - 408 441 - 441
2. Major and Medium Irrigation, etc. 22171 830 23001 - - - - - -
3. Power Projects - - - 27189 2712 29901 26036 6237 32273
4. Village and Small Industries 340 - 340 - - - 1733 - 1733
5. Others 208 350 558 4 - 4 2 - 2
2. Non-Developmental Purposes - 1278 1278 - 1793 1793 - 2243 2243
of which: Governmental Servants (Other than Housing) - 1278 1278 - 1793 1793 - 2243 2243
A. Surplus (+)/Deficit (-) on Capital Account -2598 48945 316832
B. Surplus (+)/Deficit (-) on Revenue Account 8045 -39051 -34682
C. Overall Surplus (+)/Deficit (-) (A+B) 5447 9894 282150Financing of Surplus (+)/Deficit (-)
D. Increase (+)/Decrease (-) in Cash Balances -3429 5494 4164
a) Opening Balance 5759 -9188 -3695
b) Closing Balance -9188 -3694 469
E. Withdrawals from (-)/Additions to (+) Cash 8876 4400 277986balance Investment Account (net)
...contd...
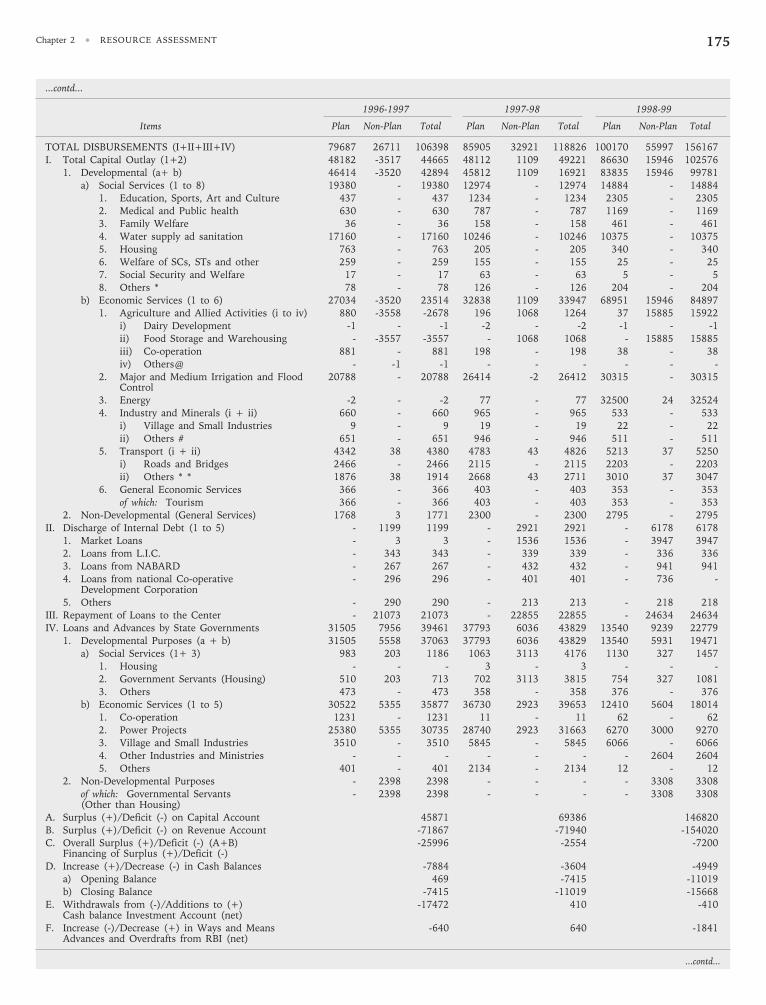
Chapter 2 • RESOURCE ASSESSMENT 175
...contd...
1996-1997 1997-98 1998-99
Items Plan Non-Plan Total Plan Non-Plan Total Plan Non-Plan Total
TOTAL DISBURSEMENTS (I+II+III+IV) 79687 26711 106398 85905 32921 118826 100170 55997 156167I. Total Capital Outlay (1+2) 48182 -3517 44665 48112 1109 49221 86630 15946 102576
1. Developmental (a+ b) 46414 -3520 42894 45812 1109 16921 83835 15946 99781a) Social Services (1 to 8) 19380 - 19380 12974 - 12974 14884 - 14884
1. Education, Sports, Art and Culture 437 - 437 1234 - 1234 2305 - 23052. Medical and Public health 630 - 630 787 - 787 1169 - 11693. Family Welfare 36 - 36 158 - 158 461 - 4614. Water supply ad sanitation 17160 - 17160 10246 - 10246 10375 - 103755. Housing 763 - 763 205 - 205 340 - 3406. Welfare of SCs, STs and other 259 - 259 155 - 155 25 - 257. Social Security and Welfare 17 - 17 63 - 63 5 - 58. Others * 78 - 78 126 - 126 204 - 204
b) Economic Services (1 to 6) 27034 -3520 23514 32838 1109 33947 68951 15946 848971. Agriculture and Allied Activities (i to iv) 880 -3558 -2678 196 1068 1264 37 15885 15922
i) Dairy Development -1 - -1 -2 - -2 -1 - -1ii) Food Storage and Warehousing - -3557 -3557 - 1068 1068 - 15885 15885iii) Co-operation 881 - 881 198 - 198 38 - 38iv) Others@ - -1 -1 - - - - - -
2. Major and Medium Irrigation and Flood 20788 - 20788 26414 -2 26412 30315 - 30315Control
3. Energy -2 - -2 77 - 77 32500 24 325244. Industry and Minerals (i + ii) 660 - 660 965 - 965 533 - 533
i) Village and Small Industries 9 - 9 19 - 19 22 - 22ii) Others # 651 - 651 946 - 946 511 - 511
5. Transport (i + ii) 4342 38 4380 4783 43 4826 5213 37 5250i) Roads and Bridges 2466 - 2466 2115 - 2115 2203 - 2203ii) Others * * 1876 38 1914 2668 43 2711 3010 37 3047
6. General Economic Services 366 - 366 403 - 403 353 - 353of which: Tourism 366 - 366 403 - 403 353 - 353
2. Non-Developmental (General Services) 1768 3 1771 2300 - 2300 2795 - 2795II. Discharge of Internal Debt (1 to 5) - 1199 1199 - 2921 2921 - 6178 6178
1. Market Loans - 3 3 - 1536 1536 - 3947 39472. Loans from L.I.C. - 343 343 - 339 339 - 336 3363. Loans from NABARD - 267 267 - 432 432 - 941 9414. Loans from national Co-operative - 296 296 - 401 401 - 736 -
Development Corporation5. Others - 290 290 - 213 213 - 218 218
III. Repayment of Loans to the Center - 21073 21073 - 22855 22855 - 24634 24634IV. Loans and Advances by State Governments 31505 7956 39461 37793 6036 43829 13540 9239 22779
1. Developmental Purposes (a + b) 31505 5558 37063 37793 6036 43829 13540 5931 19471a) Social Services (1+ 3) 983 203 1186 1063 3113 4176 1130 327 1457
1. Housing - - - 3 - 3 - - -2. Government Servants (Housing) 510 203 713 702 3113 3815 754 327 10813. Others 473 - 473 358 - 358 376 - 376
b) Economic Services (1 to 5) 30522 5355 35877 36730 2923 39653 12410 5604 180141. Co-operation 1231 - 1231 11 - 11 62 - 622. Power Projects 25380 5355 30735 28740 2923 31663 6270 3000 92703. Village and Small Industries 3510 - 3510 5845 - 5845 6066 - 60664. Other Industries and Ministries - - - - - - - 2604 26045. Others 401 - 401 2134 - 2134 12 - 12
2. Non-Developmental Purposes - 2398 2398 - - - - 3308 3308of which: Governmental Servants - 2398 2398 - - - - 3308 3308(Other than Housing)
A. Surplus (+)/Deficit (-) on Capital Account 45871 69386 146820B. Surplus (+)/Deficit (-) on Revenue Account -71867 -71940 -154020C. Overall Surplus (+)/Deficit (-) (A+B) -25996 -2554 -7200
Financing of Surplus (+)/Deficit (-)D. Increase (+)/Decrease (-) in Cash Balances -7884 -3604 -4949
a) Opening Balance 469 -7415 -11019b) Closing Balance -7415 -11019 -15668
E. Withdrawals from (-)/Additions to (+) -17472 410 -410Cash balance Investment Account (net)
F. Increase (-)/Decrease (+) in Ways and Means -640 640 -1841Advances and Overdrafts from RBI (net)
...contd...
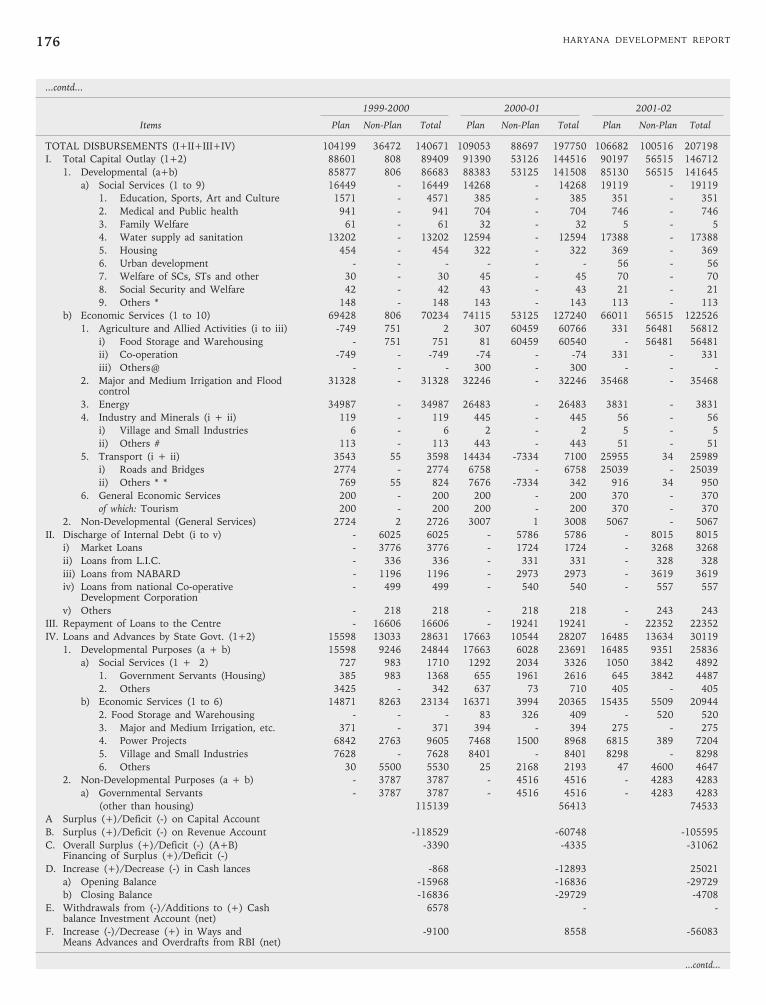
HARYANA DEVELOPMENT REPORT176
...contd...
1999-2000 2000-01 2001-02
Items Plan Non-Plan Total Plan Non-Plan Total Plan Non-Plan Total
TOTAL DISBURSEMENTS (I+II+III+IV) 104199 36472 140671 109053 88697 197750 106682 100516 207198
I. Total Capital Outlay (1+2) 88601 808 89409 91390 53126 144516 90197 56515 146712
1. Developmental (a+b) 85877 806 86683 88383 53125 141508 85130 56515 141645
a) Social Services (1 to 9) 16449 - 16449 14268 - 14268 19119 - 19119
1. Education, Sports, Art and Culture 1571 - 4571 385 - 385 351 - 351
2. Medical and Public health 941 - 941 704 - 704 746 - 746
3. Family Welfare 61 - 61 32 - 32 5 - 5
4. Water supply ad sanitation 13202 - 13202 12594 - 12594 17388 - 17388
5. Housing 454 - 454 322 - 322 369 - 369
6. Urban development - - - - - - 56 - 56
7. Welfare of SCs, STs and other 30 - 30 45 - 45 70 - 70
8. Social Security and Welfare 42 - 42 43 - 43 21 - 21
9. Others * 148 - 148 143 - 143 113 - 113
b) Economic Services (1 to 10) 69428 806 70234 74115 53125 127240 66011 56515 122526
1. Agriculture and Allied Activities (i to iii) -749 751 2 307 60459 60766 331 56481 56812
i) Food Storage and Warehousing - 751 751 81 60459 60540 - 56481 56481
ii) Co-operation -749 - -749 -74 - -74 331 - 331
iii) Others@ - - - 300 - 300 - - -
2. Major and Medium Irrigation and Flood 31328 - 31328 32246 - 32246 35468 - 35468control
3. Energy 34987 - 34987 26483 - 26483 3831 - 3831
4. Industry and Minerals (i + ii) 119 - 119 445 - 445 56 - 56
i) Village and Small Industries 6 - 6 2 - 2 5 - 5
ii) Others # 113 - 113 443 - 443 51 - 51
5. Transport (i + ii) 3543 55 3598 14434 -7334 7100 25955 34 25989
i) Roads and Bridges 2774 - 2774 6758 - 6758 25039 - 25039
ii) Others * * 769 55 824 7676 -7334 342 916 34 950
6. General Economic Services 200 - 200 200 - 200 370 - 370
of which: Tourism 200 - 200 200 - 200 370 - 370
2. Non-Developmental (General Services) 2724 2 2726 3007 1 3008 5067 - 5067
II. Discharge of Internal Debt (i to v) - 6025 6025 - 5786 5786 - 8015 8015
i) Market Loans - 3776 3776 - 1724 1724 - 3268 3268
ii) Loans from L.I.C. - 336 336 - 331 331 - 328 328
iii) Loans from NABARD - 1196 1196 - 2973 2973 - 3619 3619
iv) Loans from national Co-operative - 499 499 - 540 540 - 557 557Development Corporation
v) Others - 218 218 - 218 218 - 243 243
III. Repayment of Loans to the Centre - 16606 16606 - 19241 19241 - 22352 22352
IV. Loans and Advances by State Govt. (1+2) 15598 13033 28631 17663 10544 28207 16485 13634 30119
1. Developmental Purposes (a + b) 15598 9246 24844 17663 6028 23691 16485 9351 25836
a) Social Services (1 + 2) 727 983 1710 1292 2034 3326 1050 3842 4892
1. Government Servants (Housing) 385 983 1368 655 1961 2616 645 3842 4487
2. Others 3425 - 342 637 73 710 405 - 405
b) Economic Services (1 to 6) 14871 8263 23134 16371 3994 20365 15435 5509 20944
2. Food Storage and Warehousing - - - 83 326 409 - 520 520
3. Major and Medium Irrigation, etc. 371 - 371 394 - 394 275 - 275
4. Power Projects 6842 2763 9605 7468 1500 8968 6815 389 7204
5. Village and Small Industries 7628 - 7628 8401 - 8401 8298 - 8298
6. Others 30 5500 5530 25 2168 2193 47 4600 4647
2. Non-Developmental Purposes (a + b) - 3787 3787 - 4516 4516 - 4283 4283
a) Governmental Servants - 3787 3787 - 4516 4516 - 4283 4283
(other than housing) 115139 56413 74533
A Surplus (+)/Deficit (-) on Capital Account
B. Surplus (+)/Deficit (-) on Revenue Account -118529 -60748 -105595
C. Overall Surplus (+)/Deficit (-) (A+B) -3390 -4335 -31062Financing of Surplus (+)/Deficit (-)
D. Increase (+)/Decrease (-) in Cash lances -868 -12893 25021
a) Opening Balance -15968 -16836 -29729
b) Closing Balance -16836 -29729 -4708
E. Withdrawals from (-)/Additions to (+) Cash 6578 - -balance Investment Account (net)
F. Increase (-)/Decrease (+) in Ways and -9100 8558 -56083Means Advances and Overdrafts from RBI (net)
...contd...
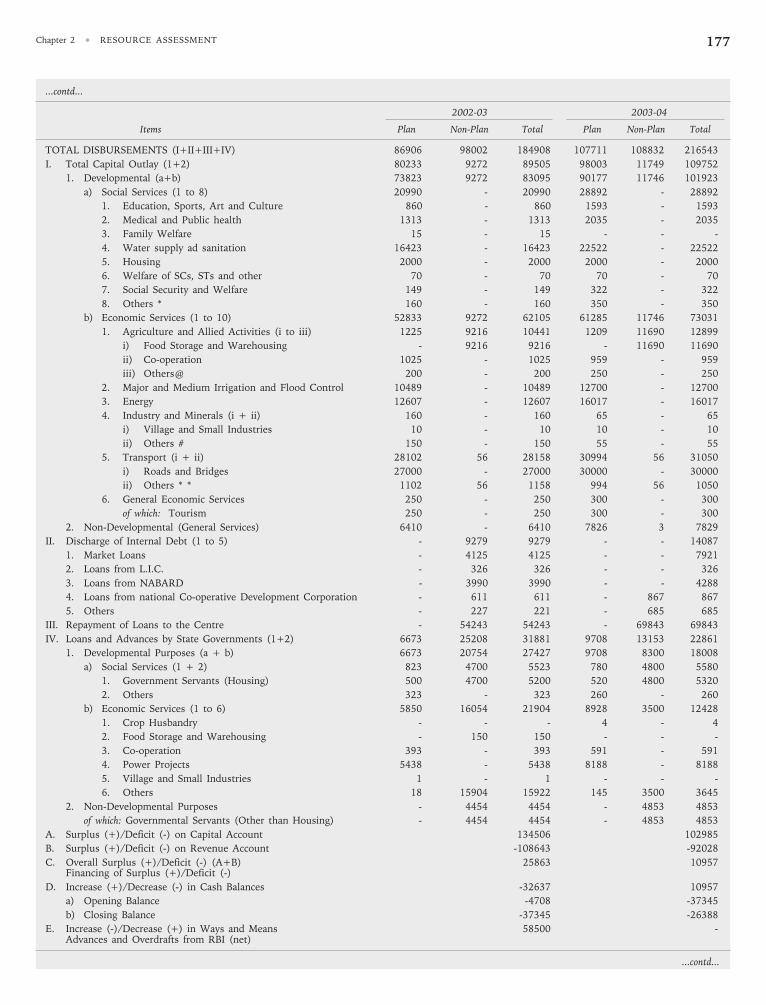
Chapter 2 • RESOURCE ASSESSMENT 177
...contd...
2002-03 2003-04
Items Plan Non-Plan Total Plan Non-Plan Total
TOTAL DISBURSEMENTS (I+II+III+IV) 86906 98002 184908 107711 108832 216543
I. Total Capital Outlay (1+2) 80233 9272 89505 98003 11749 109752
1. Developmental (a+b) 73823 9272 83095 90177 11746 101923
a) Social Services (1 to 8) 20990 - 20990 28892 - 28892
1. Education, Sports, Art and Culture 860 - 860 1593 - 1593
2. Medical and Public health 1313 - 1313 2035 - 2035
3. Family Welfare 15 - 15 - - -
4. Water supply ad sanitation 16423 - 16423 22522 - 22522
5. Housing 2000 - 2000 2000 - 2000
6. Welfare of SCs, STs and other 70 - 70 70 - 70
7. Social Security and Welfare 149 - 149 322 - 322
8. Others * 160 - 160 350 - 350
b) Economic Services (1 to 10) 52833 9272 62105 61285 11746 73031
1. Agriculture and Allied Activities (i to iii) 1225 9216 10441 1209 11690 12899
i) Food Storage and Warehousing - 9216 9216 - 11690 11690
ii) Co-operation 1025 - 1025 959 - 959
iii) Others@ 200 - 200 250 - 250
2. Major and Medium Irrigation and Flood Control 10489 - 10489 12700 - 12700
3. Energy 12607 - 12607 16017 - 16017
4. Industry and Minerals (i + ii) 160 - 160 65 - 65
i) Village and Small Industries 10 - 10 10 - 10
ii) Others # 150 - 150 55 - 55
5. Transport (i + ii) 28102 56 28158 30994 56 31050
i) Roads and Bridges 27000 - 27000 30000 - 30000
ii) Others * * 1102 56 1158 994 56 1050
6. General Economic Services 250 - 250 300 - 300
of which: Tourism 250 - 250 300 - 300
2. Non-Developmental (General Services) 6410 - 6410 7826 3 7829
II. Discharge of Internal Debt (1 to 5) - 9279 9279 - - 14087
1. Market Loans - 4125 4125 - - 7921
2. Loans from L.I.C. - 326 326 - - 326
3. Loans from NABARD - 3990 3990 - - 4288
4. Loans from national Co-operative Development Corporation - 611 611 - 867 867
5. Others - 227 221 - 685 685
III. Repayment of Loans to the Centre - 54243 54243 - 69843 69843
IV. Loans and Advances by State Governments (1+2) 6673 25208 31881 9708 13153 22861
1. Developmental Purposes (a + b) 6673 20754 27427 9708 8300 18008
a) Social Services (1 + 2) 823 4700 5523 780 4800 5580
1. Government Servants (Housing) 500 4700 5200 520 4800 5320
2. Others 323 - 323 260 - 260
b) Economic Services (1 to 6) 5850 16054 21904 8928 3500 12428
1. Crop Husbandry - - - 4 - 4
2. Food Storage and Warehousing - 150 150 - - -
3. Co-operation 393 - 393 591 - 591
4. Power Projects 5438 - 5438 8188 - 8188
5. Village and Small Industries 1 - 1 - - -
6. Others 18 15904 15922 145 3500 3645
2. Non-Developmental Purposes - 4454 4454 - 4853 4853
of which: Governmental Servants (Other than Housing) - 4454 4454 - 4853 4853
A. Surplus (+)/Deficit (-) on Capital Account 134506 102985
B. Surplus (+)/Deficit (-) on Revenue Account -108643 -92028
C. Overall Surplus (+)/Deficit (-) (A+B) 25863 10957Financing of Surplus (+)/Deficit (-)
D. Increase (+)/Decrease (-) in Cash Balances -32637 10957
a) Opening Balance -4708 -37345
b) Closing Balance -37345 -26388
E. Increase (-)/Decrease (+) in Ways and Means 58500 -Advances and Overdrafts from RBI (net)
...contd...
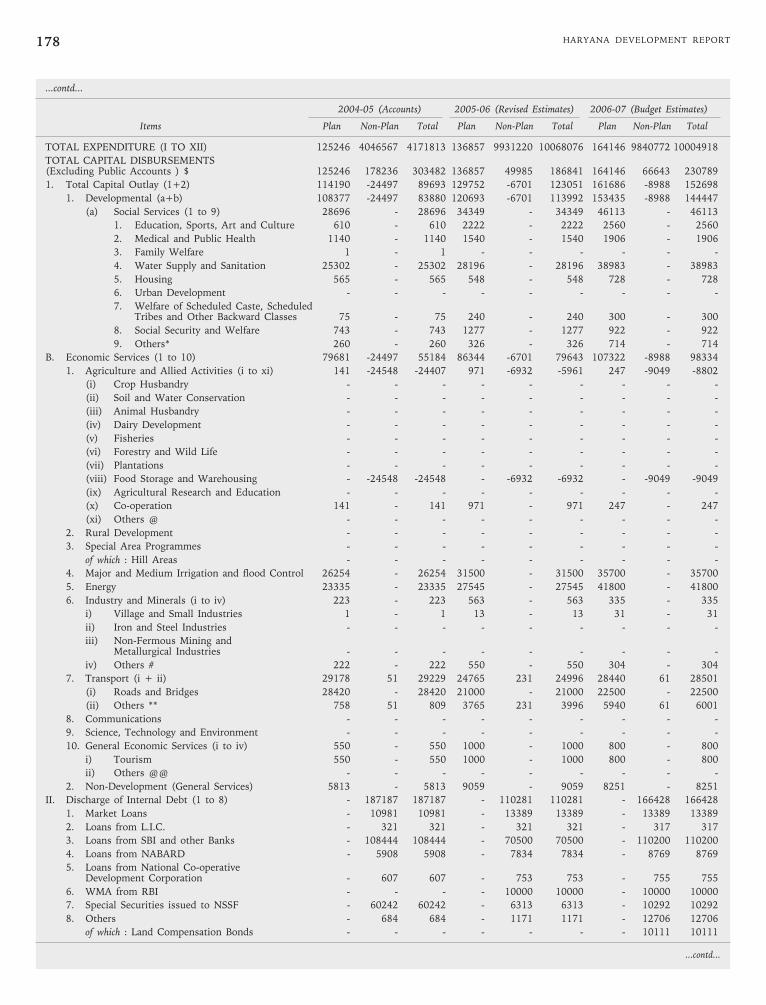
HARYANA DEVELOPMENT REPORT178
...contd...
2004-05 (Accounts) 2005-06 (Revised Estimates) 2006-07 (Budget Estimates)
Items Plan Non-Plan Total Plan Non-Plan Total Plan Non-Plan Total
TOTAL EXPENDITURE (I TO XII) 125246 4046567 4171813 136857 9931220 10068076 164146 9840772 10004918
TOTAL CAPITAL DISBURSEMENTS(Excluding Public Accounts ) $ 125246 178236 303482 136857 49985 186841 164146 66643 230789
1. Total Capital Outlay (1+2) 114190 -24497 89693 129752 -6701 123051 161686 -8988 152698
1. Developmental (a+b) 108377 -24497 83880 120693 -6701 113992 153435 -8988 144447
(a) Social Services (1 to 9) 28696 - 28696 34349 - 34349 46113 - 46113
1. Education, Sports, Art and Culture 610 - 610 2222 - 2222 2560 - 2560
2. Medical and Public Health 1140 - 1140 1540 - 1540 1906 - 1906
3. Family Welfare 1 - 1 - - - - - -
4. Water Supply and Sanitation 25302 - 25302 28196 - 28196 38983 - 38983
5. Housing 565 - 565 548 - 548 728 - 728
6. Urban Development - - - - - - - - -
7. Welfare of Scheduled Caste, ScheduledTribes and Other Backward Classes 75 - 75 240 - 240 300 - 300
8. Social Security and Welfare 743 - 743 1277 - 1277 922 - 922
9. Others* 260 - 260 326 - 326 714 - 714
B. Economic Services (1 to 10) 79681 -24497 55184 86344 -6701 79643 107322 -8988 98334
1. Agriculture and Allied Activities (i to xi) 141 -24548 -24407 971 -6932 -5961 247 -9049 -8802
(i) Crop Husbandry - - - - - - - - -
(ii) Soil and Water Conservation - - - - - - - - -
(iii) Animal Husbandry - - - - - - - - -
(iv) Dairy Development - - - - - - - - -
(v) Fisheries - - - - - - - - -
(vi) Forestry and Wild Life - - - - - - - - -
(vii) Plantations - - - - - - - - -
(viii) Food Storage and Warehousing - -24548 -24548 - -6932 -6932 - -9049 -9049
(ix) Agricultural Research and Education - - - - - - - - -
(x) Co-operation 141 - 141 971 - 971 247 - 247
(xi) Others @ - - - - - - - - -
2. Rural Development - - - - - - - - -
3. Special Area Programmes - - - - - - - - -
of which : Hill Areas - - - - - - - - -
4. Major and Medium Irrigation and flood Control 26254 - 26254 31500 - 31500 35700 - 35700
5. Energy 23335 - 23335 27545 - 27545 41800 - 41800
6. Industry and Minerals (i to iv) 223 - 223 563 - 563 335 - 335
i) Village and Small Industries 1 - 1 13 - 13 31 - 31
ii) Iron and Steel Industries - - - - - - - - -
iii) Non-Fermous Mining andMetallurgical Industries - - - - - - - - -
iv) Others # 222 - 222 550 - 550 304 - 304
7. Transport (i + ii) 29178 51 29229 24765 231 24996 28440 61 28501
(i) Roads and Bridges 28420 - 28420 21000 - 21000 22500 - 22500
(ii) Others ** 758 51 809 3765 231 3996 5940 61 6001
8. Communications - - - - - - - - -
9. Science, Technology and Environment - - - - - - - - -
10. General Economic Services (i to iv) 550 - 550 1000 - 1000 800 - 800
i) Tourism 550 - 550 1000 - 1000 800 - 800
ii) Others @@ - - - - - - - - -
2. Non-Development (General Services) 5813 - 5813 9059 - 9059 8251 - 8251
II. Discharge of Internal Debt (1 to 8) - 187187 187187 - 110281 110281 - 166428 166428
1. Market Loans - 10981 10981 - 13389 13389 - 13389 13389
2. Loans from L.I.C. - 321 321 - 321 321 - 317 317
3. Loans from SBI and other Banks - 108444 108444 - 70500 70500 - 110200 110200
4. Loans from NABARD - 5908 5908 - 7834 7834 - 8769 8769
5. Loans from National Co-operativeDevelopment Corporation - 607 607 - 753 753 - 755 755
6. WMA from RBI - - - - 10000 10000 - 10000 10000
7. Special Securities issued to NSSF - 60242 60242 - 6313 6313 - 10292 10292
8. Others - 684 684 - 1171 1171 - 12706 12706
of which : Land Compensation Bonds - - - - - - - 10111 10111
...contd...
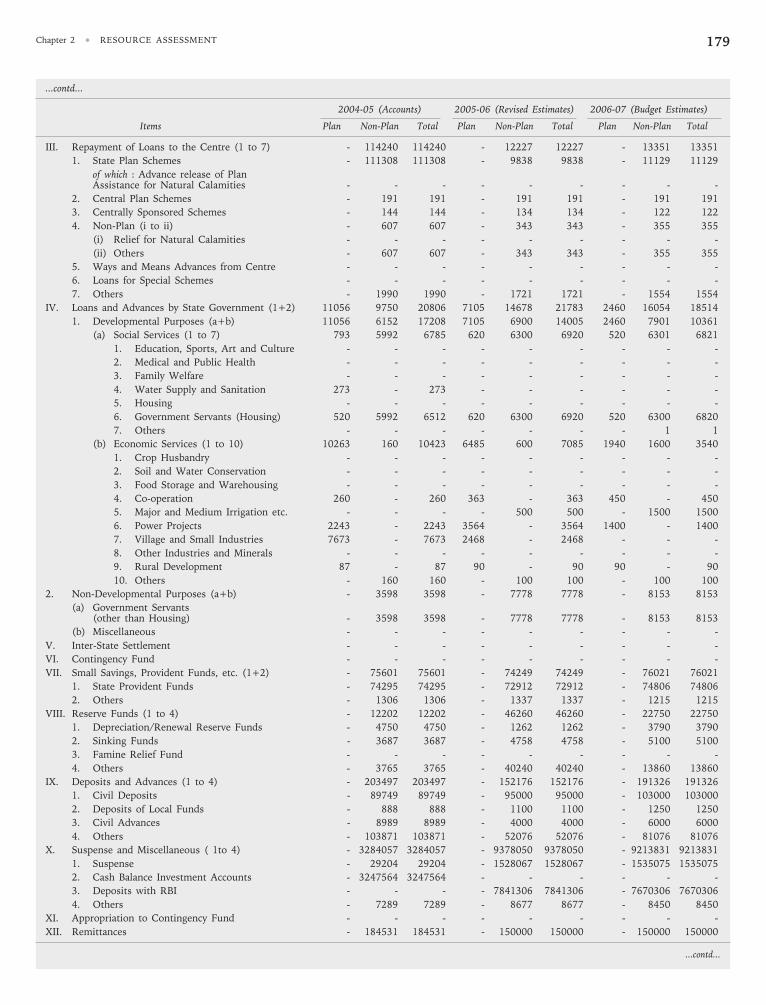
Chapter 2 • RESOURCE ASSESSMENT 179
...contd...
2004-05 (Accounts) 2005-06 (Revised Estimates) 2006-07 (Budget Estimates)
Items Plan Non-Plan Total Plan Non-Plan Total Plan Non-Plan Total
III. Repayment of Loans to the Centre (1 to 7) - 114240 114240 - 12227 12227 - 13351 13351
1. State Plan Schemes - 111308 111308 - 9838 9838 - 11129 11129
of which : Advance release of PlanAssistance for Natural Calamities - - - - - - - - -
2. Central Plan Schemes - 191 191 - 191 191 - 191 191
3. Centrally Sponsored Schemes - 144 144 - 134 134 - 122 122
4. Non-Plan (i to ii) - 607 607 - 343 343 - 355 355
(i) Relief for Natural Calamities - - - - - - - - -
(ii) Others - 607 607 - 343 343 - 355 355
5. Ways and Means Advances from Centre - - - - - - - - -
6. Loans for Special Schemes - - - - - - - - -
7. Others - 1990 1990 - 1721 1721 - 1554 1554
IV. Loans and Advances by State Government (1+2) 11056 9750 20806 7105 14678 21783 2460 16054 18514
1. Developmental Purposes (a+b) 11056 6152 17208 7105 6900 14005 2460 7901 10361
(a) Social Services (1 to 7) 793 5992 6785 620 6300 6920 520 6301 6821
1. Education, Sports, Art and Culture - - - - - - - - -
2. Medical and Public Health - - - - - - - - -
3. Family Welfare - - - - - - - - -
4. Water Supply and Sanitation 273 - 273 - - - - - -
5. Housing - - - - - - - - -
6. Government Servants (Housing) 520 5992 6512 620 6300 6920 520 6300 6820
7. Others - - - - - - - 1 1
(b) Economic Services (1 to 10) 10263 160 10423 6485 600 7085 1940 1600 3540
1. Crop Husbandry - - - - - - - - -
2. Soil and Water Conservation - - - - - - - - -
3. Food Storage and Warehousing - - - - - - - - -
4. Co-operation 260 - 260 363 - 363 450 - 450
5. Major and Medium Irrigation etc. - - - - 500 500 - 1500 1500
6. Power Projects 2243 - 2243 3564 - 3564 1400 - 1400
7. Village and Small Industries 7673 - 7673 2468 - 2468 - - -
8. Other Industries and Minerals - - - - - - - - -
9. Rural Development 87 - 87 90 - 90 90 - 90
10. Others - 160 160 - 100 100 - 100 100
2. Non-Developmental Purposes (a+b) - 3598 3598 - 7778 7778 - 8153 8153
(a) Government Servants(other than Housing) - 3598 3598 - 7778 7778 - 8153 8153
(b) Miscellaneous - - - - - - - - -
V. Inter-State Settlement - - - - - - - - -
VI. Contingency Fund - - - - - - - - -
VII. Small Savings, Provident Funds, etc. (1+2) - 75601 75601 - 74249 74249 - 76021 76021
1. State Provident Funds - 74295 74295 - 72912 72912 - 74806 74806
2. Others - 1306 1306 - 1337 1337 - 1215 1215
VIII. Reserve Funds (1 to 4) - 12202 12202 - 46260 46260 - 22750 22750
1. Depreciation/Renewal Reserve Funds - 4750 4750 - 1262 1262 - 3790 3790
2. Sinking Funds - 3687 3687 - 4758 4758 - 5100 5100
3. Famine Relief Fund - - - - - - - - -
4. Others - 3765 3765 - 40240 40240 - 13860 13860
IX. Deposits and Advances (1 to 4) - 203497 203497 - 152176 152176 - 191326 191326
1. Civil Deposits - 89749 89749 - 95000 95000 - 103000 103000
2. Deposits of Local Funds - 888 888 - 1100 1100 - 1250 1250
3. Civil Advances - 8989 8989 - 4000 4000 - 6000 6000
4. Others - 103871 103871 - 52076 52076 - 81076 81076
X. Suspense and Miscellaneous ( 1to 4) - 3284057 3284057 - 9378050 9378050 - 9213831 9213831
1. Suspense - 29204 29204 - 1528067 1528067 - 1535075 1535075
2. Cash Balance Investment Accounts - 3247564 3247564 - - - - - -
3. Deposits with RBI - - - - 7841306 7841306 - 7670306 7670306
4. Others - 7289 7289 - 8677 8677 - 8450 8450
XI. Appropriation to Contingency Fund - - - - - - - - -
XII. Remittances - 184531 184531 - 150000 150000 - 150000 150000
...contd...
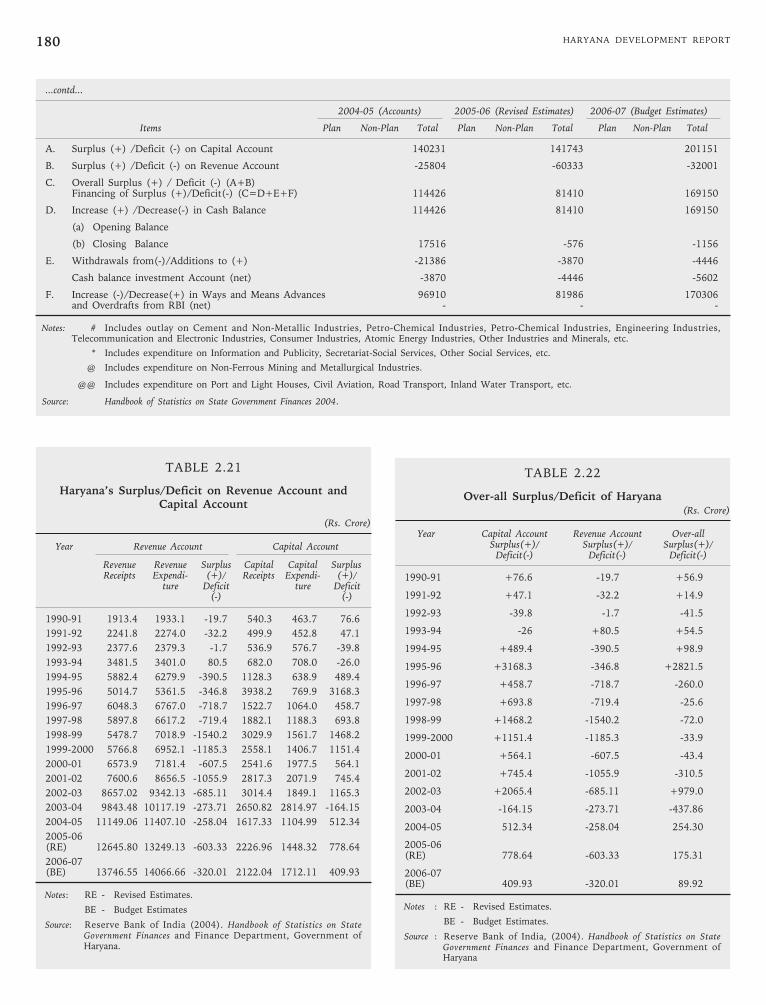
HARYANA DEVELOPMENT REPORT180
...contd...
2004-05 (Accounts) 2005-06 (Revised Estimates) 2006-07 (Budget Estimates)
Items Plan Non-Plan Total Plan Non-Plan Total Plan Non-Plan Total
A. Surplus (+) /Deficit (-) on Capital Account 140231 141743 201151
B. Surplus (+) /Deficit (-) on Revenue Account -25804 -60333 -32001
C. Overall Surplus (+) / Deficit (-) (A+B)Financing of Surplus (+)/Deficit(-) (C=D+E+F) 114426 81410 169150
D. Increase (+) /Decrease(-) in Cash Balance 114426 81410 169150
(a) Opening Balance
(b) Closing Balance 17516 -576 -1156
E. Withdrawals from(-)/Additions to (+) -21386 -3870 -4446
Cash balance investment Account (net) -3870 -4446 -5602
F. Increase (-)/Decrease(+) in Ways and Means Advances 96910 81986 170306and Overdrafts from RBI (net) - - -
Notes: # Includes outlay on Cement and Non-Metallic Industries, Petro-Chemical Industries, Petro-Chemical Industries, Engineering Industries,Telecommunication and Electronic Industries, Consumer Industries, Atomic Energy Industries, Other Industries and Minerals, etc.
* Includes expenditure on Information and Publicity, Secretariat-Social Services, Other Social Services, etc.
@ Includes expenditure on Non-Ferrous Mining and Metallurgical Industries.
@@ Includes expenditure on Port and Light Houses, Civil Aviation, Road Transport, Inland Water Transport, etc.
Source: Handbook of Statistics on State Government Finances 2004.
TABLE 2.21
Haryana’s Surplus/Deficit on Revenue Account andCapital Account
(Rs. Crore)
Year Revenue Account Capital Account
Revenue Revenue Surplus Capital Capital SurplusReceipts Expendi- (+)/ Receipts Expendi- (+)/
ture Deficit ture Deficit(-) (-)
1990-91 1913.4 1933.1 -19.7 540.3 463.7 76.6
1991-92 2241.8 2274.0 -32.2 499.9 452.8 47.1
1992-93 2377.6 2379.3 -1.7 536.9 576.7 -39.8
1993-94 3481.5 3401.0 80.5 682.0 708.0 -26.0
1994-95 5882.4 6279.9 -390.5 1128.3 638.9 489.4
1995-96 5014.7 5361.5 -346.8 3938.2 769.9 3168.3
1996-97 6048.3 6767.0 -718.7 1522.7 1064.0 458.7
1997-98 5897.8 6617.2 -719.4 1882.1 1188.3 693.8
1998-99 5478.7 7018.9 -1540.2 3029.9 1561.7 1468.2
1999-2000 5766.8 6952.1 -1185.3 2558.1 1406.7 1151.4
2000-01 6573.9 7181.4 -607.5 2541.6 1977.5 564.1
2001-02 7600.6 8656.5 -1055.9 2817.3 2071.9 745.4
2002-03 8657.02 9342.13 -685.11 3014.4 1849.1 1165.3
2003-04 9843.48 10117.19 -273.71 2650.82 2814.97 -164.15
2004-05 11149.06 11407.10 -258.04 1617.33 1104.99 512.34
2005-06(RE) 12645.80 13249.13 -603.33 2226.96 1448.32 778.64
2006-07(BE) 13746.55 14066.66 -320.01 2122.04 1712.11 409.93
Notes: RE - Revised Estimates.
BE - Budget Estimates
Source: Reserve Bank of India (2004). Handbook of Statistics on StateGovernment Finances and Finance Department, Government ofHaryana.
TABLE 2.22
Over-all Surplus/Deficit of Haryana(Rs. Crore)
Year Capital Account Revenue Account Over-allSurplus(+)/ Surplus(+)/ Surplus(+)/
Deficit(-) Deficit(-) Deficit(-)
1990-91 +76.6 -19.7 +56.9
1991-92 +47.1 -32.2 +14.9
1992-93 -39.8 -1.7 -41.5
1993-94 -26 +80.5 +54.5
1994-95 +489.4 -390.5 +98.9
1995-96 +3168.3 -346.8 +2821.5
1996-97 +458.7 -718.7 -260.0
1997-98 +693.8 -719.4 -25.6
1998-99 +1468.2 -1540.2 -72.0
1999-2000 +1151.4 -1185.3 -33.9
2000-01 +564.1 -607.5 -43.4
2001-02 +745.4 -1055.9 -310.5
2002-03 +2065.4 -685.11 +979.0
2003-04 -164.15 -273.71 -437.86
2004-05 512.34 -258.04 254.30
2005-06(RE) 778.64 -603.33 175.31
2006-07(BE) 409.93 -320.01 89.92
Notes : RE - Revised Estimates.
BE - Budget Estimates.
Source : Reserve Bank of India, (2004). Handbook of Statistics on StateGovernment Finances and Finance Department, Government ofHaryana
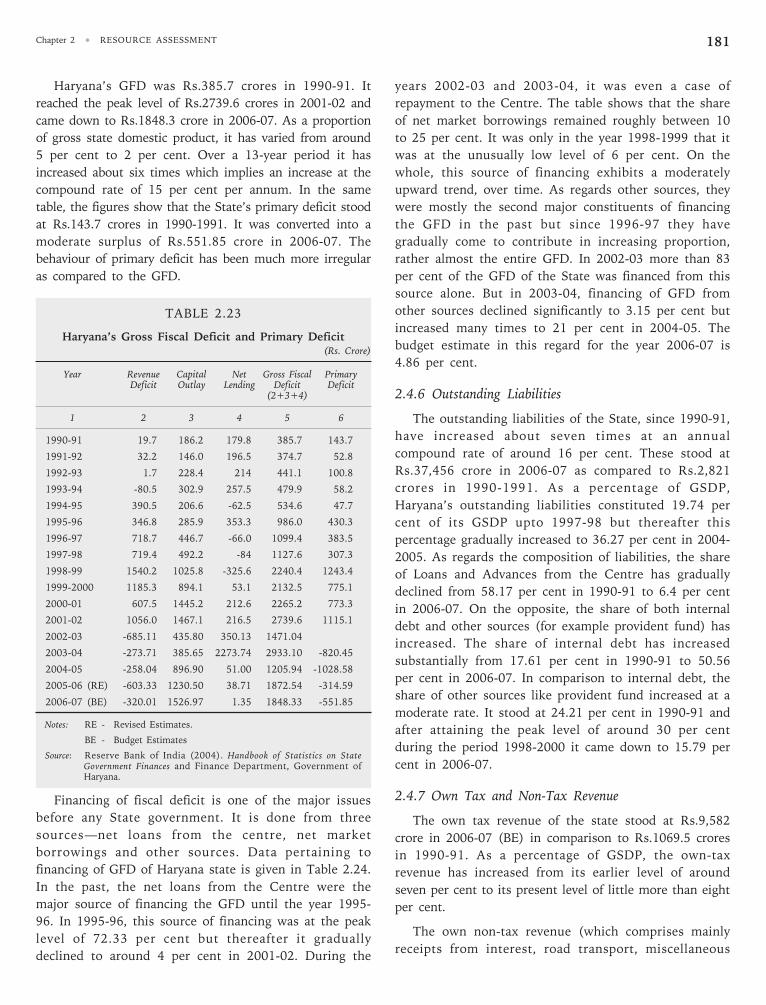
Chapter 2 • RESOURCE ASSESSMENT 181
Haryana’s GFD was Rs.385.7 crores in 1990-91. It
reached the peak level of Rs.2739.6 crores in 2001-02 and
came down to Rs.1848.3 crore in 2006-07. As a proportion
of gross state domestic product, it has varied from around
5 per cent to 2 per cent. Over a 13-year period it has
increased about six times which implies an increase at the
compound rate of 15 per cent per annum. In the same
table, the figures show that the State’s primary deficit stood
at Rs.143.7 crores in 1990-1991. It was converted into a
moderate surplus of Rs.551.85 crore in 2006-07. The
behaviour of primary deficit has been much more irregular
as compared to the GFD.
TABLE 2.23
Haryana’s Gross Fiscal Deficit and Primary Deficit(Rs. Crore)
Year Revenue Capital Net Gross Fiscal PrimaryDeficit Outlay Lending Deficit Deficit
(2+3+4)
1 2 3 4 5 6
1990-91 19.7 186.2 179.8 385.7 143.7
1991-92 32.2 146.0 196.5 374.7 52.8
1992-93 1.7 228.4 214 441.1 100.8
1993-94 -80.5 302.9 257.5 479.9 58.2
1994-95 390.5 206.6 -62.5 534.6 47.7
1995-96 346.8 285.9 353.3 986.0 430.3
1996-97 718.7 446.7 -66.0 1099.4 383.5
1997-98 719.4 492.2 -84 1127.6 307.3
1998-99 1540.2 1025.8 -325.6 2240.4 1243.4
1999-2000 1185.3 894.1 53.1 2132.5 775.1
2000-01 607.5 1445.2 212.6 2265.2 773.3
2001-02 1056.0 1467.1 216.5 2739.6 1115.1
2002-03 -685.11 435.80 350.13 1471.04
2003-04 -273.71 385.65 2273.74 2933.10 -820.45
2004-05 -258.04 896.90 51.00 1205.94 -1028.58
2005-06 (RE) -603.33 1230.50 38.71 1872.54 -314.59
2006-07 (BE) -320.01 1526.97 1.35 1848.33 -551.85
Notes: RE - Revised Estimates.
BE - Budget Estimates
Source: Reserve Bank of India (2004). Handbook of Statistics on StateGovernment Finances and Finance Department, Government ofHaryana.
Financing of fiscal deficit is one of the major issues
before any State government. It is done from three
sources—net loans from the centre, net market
borrowings and other sources. Data pertaining to
financing of GFD of Haryana state is given in Table 2.24.
In the past, the net loans from the Centre were the
major source of financing the GFD until the year 1995-
96. In 1995-96, this source of financing was at the peak
level of 72.33 per cent but thereafter it gradually
declined to around 4 per cent in 2001-02. During the
years 2002-03 and 2003-04, it was even a case of
repayment to the Centre. The table shows that the share
of net market borrowings remained roughly between 10
to 25 per cent. It was only in the year 1998-1999 that it
was at the unusually low level of 6 per cent. On the
whole, this source of financing exhibits a moderately
upward trend, over time. As regards other sources, they
were mostly the second major constituents of financing
the GFD in the past but since 1996-97 they have
gradually come to contribute in increasing proportion,
rather almost the entire GFD. In 2002-03 more than 83
per cent of the GFD of the State was financed from this
source alone. But in 2003-04, financing of GFD from
other sources declined significantly to 3.15 per cent but
increased many times to 21 per cent in 2004-05. The
budget estimate in this regard for the year 2006-07 is
4.86 per cent.
2.4.6 Outstanding Liabilities
The outstanding liabilities of the State, since 1990-91,
have increased about seven times at an annual
compound rate of around 16 per cent. These stood at
Rs.37,456 crore in 2006-07 as compared to Rs.2,821
crores in 1990-1991. As a percentage of GSDP,
Haryana’s outstanding liabilities constituted 19.74 per
cent of its GSDP upto 1997-98 but thereafter this
percentage gradually increased to 36.27 per cent in 2004-
2005. As regards the composition of liabilities, the share
of Loans and Advances from the Centre has gradually
declined from 58.17 per cent in 1990-91 to 6.4 per cent
in 2006-07. On the opposite, the share of both internal
debt and other sources (for example provident fund) has
increased. The share of internal debt has increased
substantially from 17.61 per cent in 1990-91 to 50.56
per cent in 2006-07. In comparison to internal debt, the
share of other sources like provident fund increased at a
moderate rate. It stood at 24.21 per cent in 1990-91 and
after attaining the peak level of around 30 per cent
during the period 1998-2000 it came down to 15.79 per
cent in 2006-07.
2.4.7 Own Tax and Non-Tax Revenue
The own tax revenue of the state stood at Rs.9,582
crore in 2006-07 (BE) in comparison to Rs.1069.5 crores
in 1990-91. As a percentage of GSDP, the own-tax
revenue has increased from its earlier level of around
seven per cent to its present level of little more than eight
per cent.
The own non-tax revenue (which comprises mainly
receipts from interest, road transport, miscellaneous
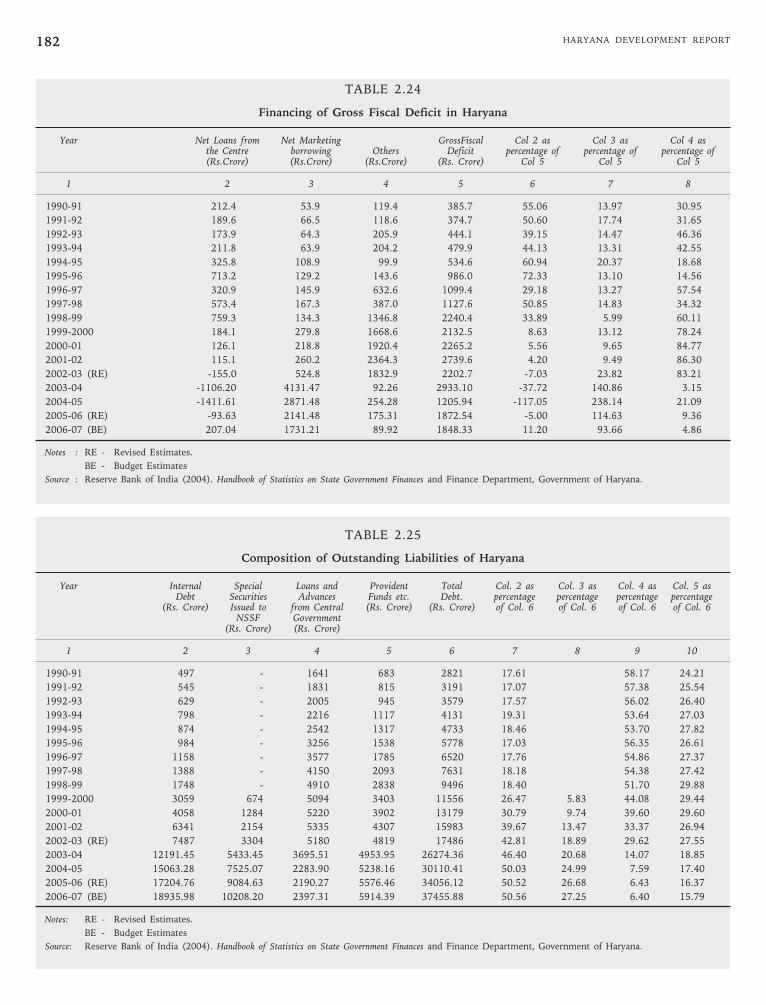
HARYANA DEVELOPMENT REPORT182
TABLE 2.24
Financing of Gross Fiscal Deficit in Haryana
Year Net Loans from Net Marketing GrossFiscal Col 2 as Col 3 as Col 4 asthe Centre borrowing Others Deficit percentage of percentage of percentage of(Rs.Crore) (Rs.Crore) (Rs.Crore) (Rs. Crore) Col 5 Col 5 Col 5
1 2 3 4 5 6 7 8
1990-91 212.4 53.9 119.4 385.7 55.06 13.97 30.95
1991-92 189.6 66.5 118.6 374.7 50.60 17.74 31.65
1992-93 173.9 64.3 205.9 444.1 39.15 14.47 46.36
1993-94 211.8 63.9 204.2 479.9 44.13 13.31 42.55
1994-95 325.8 108.9 99.9 534.6 60.94 20.37 18.68
1995-96 713.2 129.2 143.6 986.0 72.33 13.10 14.56
1996-97 320.9 145.9 632.6 1099.4 29.18 13.27 57.54
1997-98 573.4 167.3 387.0 1127.6 50.85 14.83 34.32
1998-99 759.3 134.3 1346.8 2240.4 33.89 5.99 60.11
1999-2000 184.1 279.8 1668.6 2132.5 8.63 13.12 78.24
2000-01 126.1 218.8 1920.4 2265.2 5.56 9.65 84.77
2001-02 115.1 260.2 2364.3 2739.6 4.20 9.49 86.30
2002-03 (RE) -155.0 524.8 1832.9 2202.7 -7.03 23.82 83.21
2003-04 -1106.20 4131.47 92.26 2933.10 -37.72 140.86 3.15
2004-05 -1411.61 2871.48 254.28 1205.94 -117.05 238.14 21.09
2005-06 (RE) -93.63 2141.48 175.31 1872.54 -5.00 114.63 9.36
2006-07 (BE) 207.04 1731.21 89.92 1848.33 11.20 93.66 4.86
Notes : RE - Revised Estimates.
BE - Budget Estimates
Source : Reserve Bank of India (2004). Handbook of Statistics on State Government Finances and Finance Department, Government of Haryana.
TABLE 2.25
Composition of Outstanding Liabilities of Haryana
Year Internal Special Loans and Provident Total Col. 2 as Col. 3 as Col. 4 as Col. 5 asDebt Securities Advances Funds etc. Debt. percentage percentage percentage percentage
(Rs. Crore) Issued to from Central (Rs. Crore) (Rs. Crore) of Col. 6 of Col. 6 of Col. 6 of Col. 6NSSF Government
(Rs. Crore) (Rs. Crore)
1 2 3 4 5 6 7 8 9 10
1990-91 497 - 1641 683 2821 17.61 58.17 24.21
1991-92 545 - 1831 815 3191 17.07 57.38 25.54
1992-93 629 - 2005 945 3579 17.57 56.02 26.40
1993-94 798 - 2216 1117 4131 19.31 53.64 27.03
1994-95 874 - 2542 1317 4733 18.46 53.70 27.82
1995-96 984 - 3256 1538 5778 17.03 56.35 26.61
1996-97 1158 - 3577 1785 6520 17.76 54.86 27.37
1997-98 1388 - 4150 2093 7631 18.18 54.38 27.42
1998-99 1748 - 4910 2838 9496 18.40 51.70 29.88
1999-2000 3059 674 5094 3403 11556 26.47 5.83 44.08 29.44
2000-01 4058 1284 5220 3902 13179 30.79 9.74 39.60 29.60
2001-02 6341 2154 5335 4307 15983 39.67 13.47 33.37 26.94
2002-03 (RE) 7487 3304 5180 4819 17486 42.81 18.89 29.62 27.55
2003-04 12191.45 5433.45 3695.51 4953.95 26274.36 46.40 20.68 14.07 18.85
2004-05 15063.28 7525.07 2283.90 5238.16 30110.41 50.03 24.99 7.59 17.40
2005-06 (RE) 17204.76 9084.63 2190.27 5576.46 34056.12 50.52 26.68 6.43 16.37
2006-07 (BE) 18935.98 10208.20 2397.31 5914.39 37455.88 50.56 27.25 6.40 15.79
Notes: RE - Revised Estimates.
BE - Budget Estimates
Source: Reserve Bank of India (2004). Handbook of Statistics on State Government Finances and Finance Department, Government of Haryana.
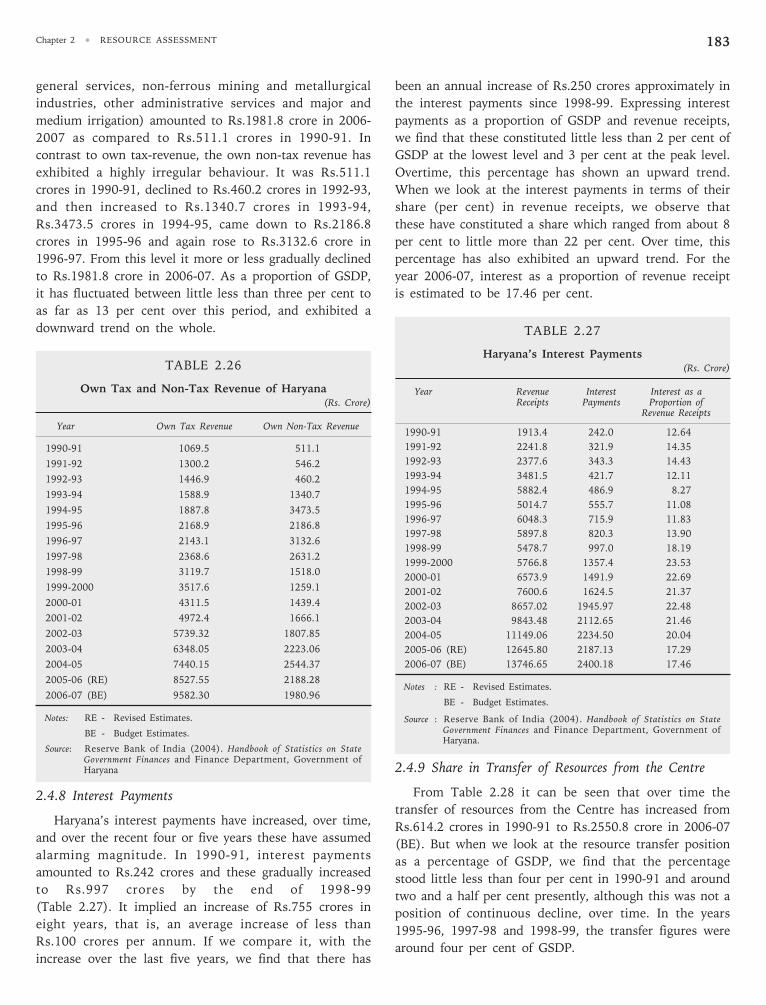
Chapter 2 • RESOURCE ASSESSMENT 183
general services, non-ferrous mining and metallurgical
industries, other administrative services and major and
medium irrigation) amounted to Rs.1981.8 crore in 2006-
2007 as compared to Rs.511.1 crores in 1990-91. In
contrast to own tax-revenue, the own non-tax revenue has
exhibited a highly irregular behaviour. It was Rs.511.1
crores in 1990-91, declined to Rs.460.2 crores in 1992-93,
and then increased to Rs.1340.7 crores in 1993-94,
Rs.3473.5 crores in 1994-95, came down to Rs.2186.8
crores in 1995-96 and again rose to Rs.3132.6 crore in
1996-97. From this level it more or less gradually declined
to Rs.1981.8 crore in 2006-07. As a proportion of GSDP,
it has fluctuated between little less than three per cent to
as far as 13 per cent over this period, and exhibited a
downward trend on the whole.
TABLE 2.26
Own Tax and Non-Tax Revenue of Haryana(Rs. Crore)
Year Own Tax Revenue Own Non-Tax Revenue
1990-91 1069.5 511.1
1991-92 1300.2 546.2
1992-93 1446.9 460.2
1993-94 1588.9 1340.7
1994-95 1887.8 3473.5
1995-96 2168.9 2186.8
1996-97 2143.1 3132.6
1997-98 2368.6 2631.2
1998-99 3119.7 1518.0
1999-2000 3517.6 1259.1
2000-01 4311.5 1439.4
2001-02 4972.4 1666.1
2002-03 5739.32 1807.85
2003-04 6348.05 2223.06
2004-05 7440.15 2544.37
2005-06 (RE) 8527.55 2188.28
2006-07 (BE) 9582.30 1980.96
Notes: RE - Revised Estimates.
BE - Budget Estimates.
Source: Reserve Bank of India (2004). Handbook of Statistics on StateGovernment Finances and Finance Department, Government ofHaryana
2.4.8 Interest Payments
Haryana’s interest payments have increased, over time,
and over the recent four or five years these have assumed
alarming magnitude. In 1990-91, interest payments
amounted to Rs.242 crores and these gradually increased
to Rs.997 crores by the end of 1998-99
(Table 2.27). It implied an increase of Rs.755 crores in
eight years, that is, an average increase of less than
Rs.100 crores per annum. If we compare it, with the
increase over the last five years, we find that there has
been an annual increase of Rs.250 crores approximately in
the interest payments since 1998-99. Expressing interest
payments as a proportion of GSDP and revenue receipts,
we find that these constituted little less than 2 per cent of
GSDP at the lowest level and 3 per cent at the peak level.
Overtime, this percentage has shown an upward trend.
When we look at the interest payments in terms of their
share (per cent) in revenue receipts, we observe that
these have constituted a share which ranged from about 8
per cent to little more than 22 per cent. Over time, this
percentage has also exhibited an upward trend. For the
year 2006-07, interest as a proportion of revenue receipt
is estimated to be 17.46 per cent.
TABLE 2.27
Haryana’s Interest Payments(Rs. Crore)
Year Revenue Interest Interest as aReceipts Payments Proportion of
Revenue Receipts
1990-91 1913.4 242.0 12.64
1991-92 2241.8 321.9 14.35
1992-93 2377.6 343.3 14.43
1993-94 3481.5 421.7 12.11
1994-95 5882.4 486.9 8.27
1995-96 5014.7 555.7 11.08
1996-97 6048.3 715.9 11.83
1997-98 5897.8 820.3 13.90
1998-99 5478.7 997.0 18.19
1999-2000 5766.8 1357.4 23.53
2000-01 6573.9 1491.9 22.69
2001-02 7600.6 1624.5 21.37
2002-03 8657.02 1945.97 22.48
2003-04 9843.48 2112.65 21.46
2004-05 11149.06 2234.50 20.04
2005-06 (RE) 12645.80 2187.13 17.29
2006-07 (BE) 13746.65 2400.18 17.46
Notes : RE - Revised Estimates.
BE - Budget Estimates.
Source : Reserve Bank of India (2004). Handbook of Statistics on StateGovernment Finances and Finance Department, Government ofHaryana.
2.4.9 Share in Transfer of Resources from the Centre
From Table 2.28 it can be seen that over time the
transfer of resources from the Centre has increased from
Rs.614.2 crores in 1990-91 to Rs.2550.8 crore in 2006-07
(BE). But when we look at the resource transfer position
as a percentage of GSDP, we find that the percentage
stood little less than four per cent in 1990-91 and around
two and a half per cent presently, although this was not a
position of continuous decline, over time. In the years
1995-96, 1997-98 and 1998-99, the transfer figures were
around four per cent of GSDP.
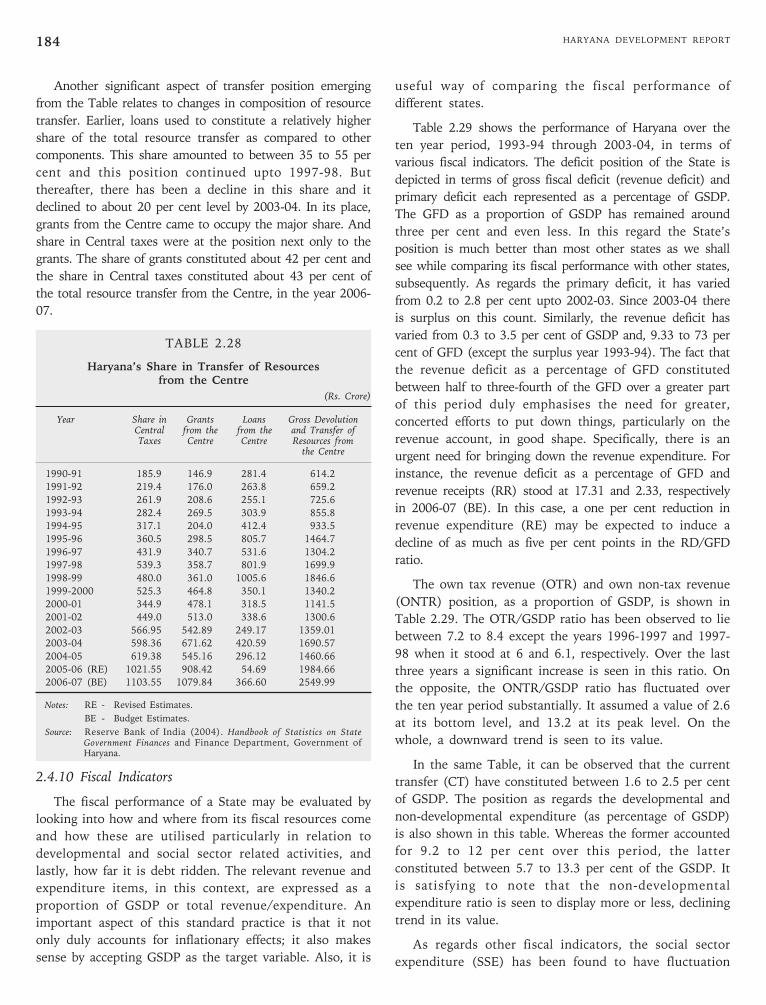
HARYANA DEVELOPMENT REPORT184
Another significant aspect of transfer position emerging
from the Table relates to changes in composition of resource
transfer. Earlier, loans used to constitute a relatively higher
share of the total resource transfer as compared to other
components. This share amounted to between 35 to 55 per
cent and this position continued upto 1997-98. But
thereafter, there has been a decline in this share and it
declined to about 20 per cent level by 2003-04. In its place,
grants from the Centre came to occupy the major share. And
share in Central taxes were at the position next only to the
grants. The share of grants constituted about 42 per cent and
the share in Central taxes constituted about 43 per cent of
the total resource transfer from the Centre, in the year 2006-
07.
TABLE 2.28
Haryana’s Share in Transfer of Resourcesfrom the Centre
(Rs. Crore)
Year Share in Grants Loans Gross DevolutionCentral from the from the and Transfer ofTaxes Centre Centre Resources from
the Centre
1990-91 185.9 146.9 281.4 614.2
1991-92 219.4 176.0 263.8 659.2
1992-93 261.9 208.6 255.1 725.6
1993-94 282.4 269.5 303.9 855.8
1994-95 317.1 204.0 412.4 933.5
1995-96 360.5 298.5 805.7 1464.7
1996-97 431.9 340.7 531.6 1304.2
1997-98 539.3 358.7 801.9 1699.9
1998-99 480.0 361.0 1005.6 1846.6
1999-2000 525.3 464.8 350.1 1340.2
2000-01 344.9 478.1 318.5 1141.5
2001-02 449.0 513.0 338.6 1300.6
2002-03 566.95 542.89 249.17 1359.01
2003-04 598.36 671.62 420.59 1690.57
2004-05 619.38 545.16 296.12 1460.66
2005-06 (RE) 1021.55 908.42 54.69 1984.66
2006-07 (BE) 1103.55 1079.84 366.60 2549.99
Notes: RE - Revised Estimates.
BE - Budget Estimates.
Source: Reserve Bank of India (2004). Handbook of Statistics on StateGovernment Finances and Finance Department, Government ofHaryana.
2.4.10 Fiscal Indicators
The fiscal performance of a State may be evaluated by
looking into how and where from its fiscal resources come
and how these are utilised particularly in relation to
developmental and social sector related activities, and
lastly, how far it is debt ridden. The relevant revenue and
expenditure items, in this context, are expressed as a
proportion of GSDP or total revenue/expenditure. An
important aspect of this standard practice is that it not
only duly accounts for inflationary effects; it also makes
sense by accepting GSDP as the target variable. Also, it is
useful way of comparing the fiscal performance of
different states.
Table 2.29 shows the performance of Haryana over the
ten year period, 1993-94 through 2003-04, in terms of
various fiscal indicators. The deficit position of the State is
depicted in terms of gross fiscal deficit (revenue deficit) and
primary deficit each represented as a percentage of GSDP.
The GFD as a proportion of GSDP has remained around
three per cent and even less. In this regard the State’s
position is much better than most other states as we shall
see while comparing its fiscal performance with other states,
subsequently. As regards the primary deficit, it has varied
from 0.2 to 2.8 per cent upto 2002-03. Since 2003-04 there
is surplus on this count. Similarly, the revenue deficit has
varied from 0.3 to 3.5 per cent of GSDP and, 9.33 to 73 per
cent of GFD (except the surplus year 1993-94). The fact that
the revenue deficit as a percentage of GFD constituted
between half to three-fourth of the GFD over a greater part
of this period duly emphasises the need for greater,
concerted efforts to put down things, particularly on the
revenue account, in good shape. Specifically, there is an
urgent need for bringing down the revenue expenditure. For
instance, the revenue deficit as a percentage of GFD and
revenue receipts (RR) stood at 17.31 and 2.33, respectively
in 2006-07 (BE). In this case, a one per cent reduction in
revenue expenditure (RE) may be expected to induce a
decline of as much as five per cent points in the RD/GFD
ratio.
The own tax revenue (OTR) and own non-tax revenue
(ONTR) position, as a proportion of GSDP, is shown in
Table 2.29. The OTR/GSDP ratio has been observed to lie
between 7.2 to 8.4 except the years 1996-1997 and 1997-
98 when it stood at 6 and 6.1, respectively. Over the last
three years a significant increase is seen in this ratio. On
the opposite, the ONTR/GSDP ratio has fluctuated over
the ten year period substantially. It assumed a value of 2.6
at its bottom level, and 13.2 at its peak level. On the
whole, a downward trend is seen to its value.
In the same Table, it can be observed that the current
transfer (CT) have constituted between 1.6 to 2.5 per cent
of GSDP. The position as regards the developmental and
non-developmental expenditure (as percentage of GSDP)
is also shown in this table. Whereas the former accounted
for 9.2 to 12 per cent over this period, the latter
constituted between 5.7 to 13.3 per cent of the GSDP. It
is satisfying to note that the non-developmental
expenditure ratio is seen to display more or less, declining
trend in its value.
As regards other fiscal indicators, the social sector
expenditure (SSE) has been found to have fluctuation
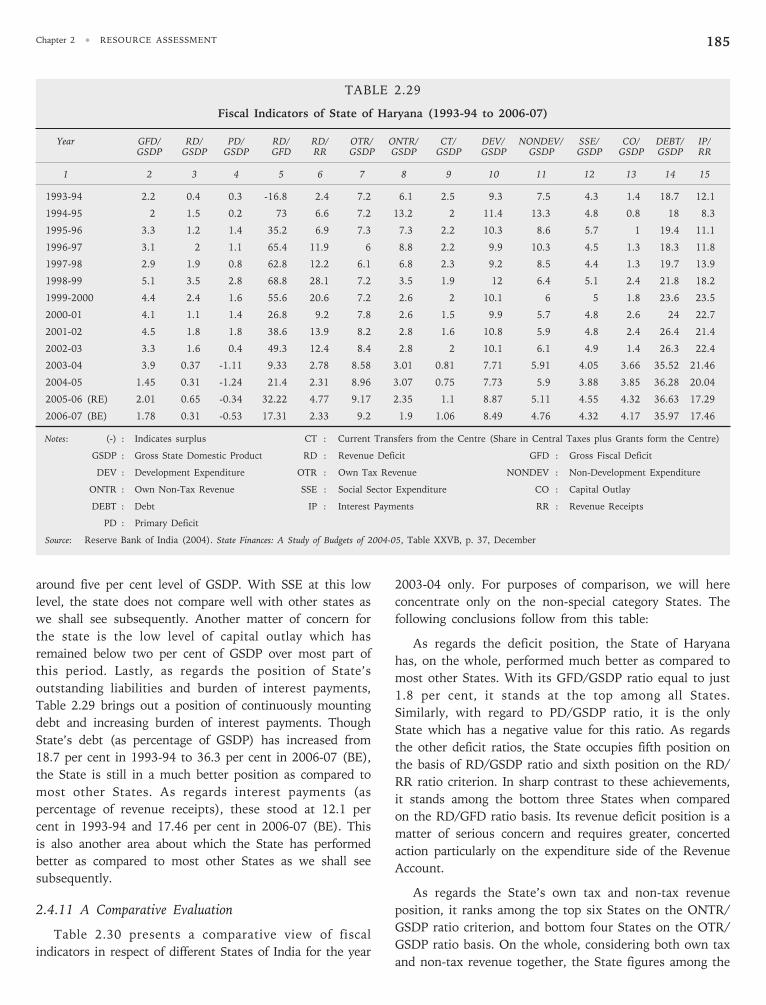
Chapter 2 • RESOURCE ASSESSMENT 185
TABLE 2.29
Fiscal Indicators of State of Haryana (1993-94 to 2006-07)
Year GFD/ RD/ PD/ RD/ RD/ OTR/ ONTR/ CT/ DEV/ NONDEV/ SSE/ CO/ DEBT/ IP/GSDP GSDP GSDP GFD RR GSDP GSDP GSDP GSDP GSDP GSDP GSDP GSDP RR
1 2 3 4 5 6 7 8 9 10 11 12 13 14 15
1993-94 2.2 0.4 0.3 -16.8 2.4 7.2 6.1 2.5 9.3 7.5 4.3 1.4 18.7 12.1
1994-95 2 1.5 0.2 73 6.6 7.2 13.2 2 11.4 13.3 4.8 0.8 18 8.3
1995-96 3.3 1.2 1.4 35.2 6.9 7.3 7.3 2.2 10.3 8.6 5.7 1 19.4 11.1
1996-97 3.1 2 1.1 65.4 11.9 6 8.8 2.2 9.9 10.3 4.5 1.3 18.3 11.8
1997-98 2.9 1.9 0.8 62.8 12.2 6.1 6.8 2.3 9.2 8.5 4.4 1.3 19.7 13.9
1998-99 5.1 3.5 2.8 68.8 28.1 7.2 3.5 1.9 12 6.4 5.1 2.4 21.8 18.2
1999-2000 4.4 2.4 1.6 55.6 20.6 7.2 2.6 2 10.1 6 5 1.8 23.6 23.5
2000-01 4.1 1.1 1.4 26.8 9.2 7.8 2.6 1.5 9.9 5.7 4.8 2.6 24 22.7
2001-02 4.5 1.8 1.8 38.6 13.9 8.2 2.8 1.6 10.8 5.9 4.8 2.4 26.4 21.4
2002-03 3.3 1.6 0.4 49.3 12.4 8.4 2.8 2 10.1 6.1 4.9 1.4 26.3 22.4
2003-04 3.9 0.37 -1.11 9.33 2.78 8.58 3.01 0.81 7.71 5.91 4.05 3.66 35.52 21.46
2004-05 1.45 0.31 -1.24 21.4 2.31 8.96 3.07 0.75 7.73 5.9 3.88 3.85 36.28 20.04
2005-06 (RE) 2.01 0.65 -0.34 32.22 4.77 9.17 2.35 1.1 8.87 5.11 4.55 4.32 36.63 17.29
2006-07 (BE) 1.78 0.31 -0.53 17.31 2.33 9.2 1.9 1.06 8.49 4.76 4.32 4.17 35.97 17.46
Notes: (-) : Indicates surplus CT : Current Transfers from the Centre (Share in Central Taxes plus Grants form the Centre)
GSDP : Gross State Domestic Product RD : Revenue Deficit GFD : Gross Fiscal Deficit
DEV : Development Expenditure OTR : Own Tax Revenue NONDEV : Non-Development Expenditure
ONTR : Own Non-Tax Revenue SSE : Social Sector Expenditure CO : Capital Outlay
DEBT : Debt IP : Interest Payments RR : Revenue Receipts
PD : Primary Deficit
Source: Reserve Bank of India (2004). State Finances: A Study of Budgets of 2004-05, Table XXVB, p. 37, December
around five per cent level of GSDP. With SSE at this low
level, the state does not compare well with other states as
we shall see subsequently. Another matter of concern for
the state is the low level of capital outlay which has
remained below two per cent of GSDP over most part of
this period. Lastly, as regards the position of State’s
outstanding liabilities and burden of interest payments,
Table 2.29 brings out a position of continuously mounting
debt and increasing burden of interest payments. Though
State’s debt (as percentage of GSDP) has increased from
18.7 per cent in 1993-94 to 36.3 per cent in 2006-07 (BE),
the State is still in a much better position as compared to
most other States. As regards interest payments (as
percentage of revenue receipts), these stood at 12.1 per
cent in 1993-94 and 17.46 per cent in 2006-07 (BE). This
is also another area about which the State has performed
better as compared to most other States as we shall see
subsequently.
2.4.11 A Comparative Evaluation
Table 2.30 presents a comparative view of fiscal
indicators in respect of different States of India for the year
2003-04 only. For purposes of comparison, we will here
concentrate only on the non-special category States. The
following conclusions follow from this table:
As regards the deficit position, the State of Haryana
has, on the whole, performed much better as compared to
most other States. With its GFD/GSDP ratio equal to just
1.8 per cent, it stands at the top among all States.
Similarly, with regard to PD/GSDP ratio, it is the only
State which has a negative value for this ratio. As regards
the other deficit ratios, the State occupies fifth position on
the basis of RD/GSDP ratio and sixth position on the RD/
RR ratio criterion. In sharp contrast to these achievements,
it stands among the bottom three States when compared
on the RD/GFD ratio basis. Its revenue deficit position is a
matter of serious concern and requires greater, concerted
action particularly on the expenditure side of the Revenue
Account.
As regards the State’s own tax and non-tax revenue
position, it ranks among the top six States on the ONTR/
GSDP ratio criterion, and bottom four States on the OTR/
GSDP ratio basis. On the whole, considering both own tax
and non-tax revenue together, the State figures among the
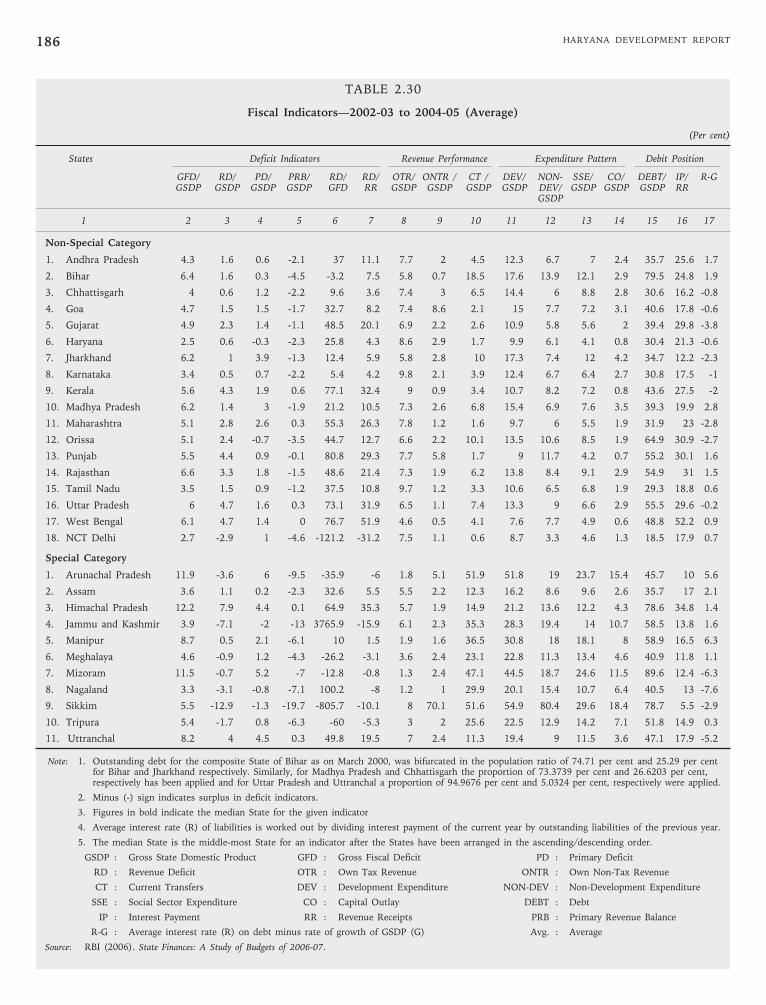
HARYANA DEVELOPMENT REPORT186
TABLE 2.30
Fiscal Indicators—2002-03 to 2004-05 (Average)
(Per cent)
States Deficit Indicators Revenue Performance Expenditure Pattern Debit Position
GFD/ RD/ PD/ PRB/ RD/ RD/ OTR/ ONTR / CT / DEV/ NON- SSE/ CO/ DEBT/ IP/ R-GGSDP GSDP GSDP GSDP GFD RR GSDP GSDP GSDP GSDP DEV/ GSDP GSDP GSDP RR
GSDP
1 2 3 4 5 6 7 8 9 10 11 12 13 14 15 16 17
Non-Special Category
1. Andhra Pradesh 4.3 1.6 0.6 -2.1 37 11.1 7.7 2 4.5 12.3 6.7 7 2.4 35.7 25.6 1.7
2. Bihar 6.4 1.6 0.3 -4.5 -3.2 7.5 5.8 0.7 18.5 17.6 13.9 12.1 2.9 79.5 24.8 1.9
3. Chhattisgarh 4 0.6 1.2 -2.2 9.6 3.6 7.4 3 6.5 14.4 6 8.8 2.8 30.6 16.2 -0.8
4. Goa 4.7 1.5 1.5 -1.7 32.7 8.2 7.4 8.6 2.1 15 7.7 7.2 3.1 40.6 17.8 -0.6
5. Gujarat 4.9 2.3 1.4 -1.1 48.5 20.1 6.9 2.2 2.6 10.9 5.8 5.6 2 39.4 29.8 -3.8
6. Haryana 2.5 0.6 -0.3 -2.3 25.8 4.3 8.6 2.9 1.7 9.9 6.1 4.1 0.8 30.4 21.3 -0.6
7. Jharkhand 6.2 1 3.9 -1.3 12.4 5.9 5.8 2.8 10 17.3 7.4 12 4.2 34.7 12.2 -2.3
8. Karnataka 3.4 0.5 0.7 -2.2 5.4 4.2 9.8 2.1 3.9 12.4 6.7 6.4 2.7 30.8 17.5 -1
9. Kerala 5.6 4.3 1.9 0.6 77.1 32.4 9 0.9 3.4 10.7 8.2 7.2 0.8 43.6 27.5 -2
10. Madhya Pradesh 6.2 1.4 3 -1.9 21.2 10.5 7.3 2.6 6.8 15.4 6.9 7.6 3.5 39.3 19.9 2.8
11. Maharashtra 5.1 2.8 2.6 0.3 55.3 26.3 7.8 1.2 1.6 9.7 6 5.5 1.9 31.9 23 -2.8
12. Orissa 5.1 2.4 -0.7 -3.5 44.7 12.7 6.6 2.2 10.1 13.5 10.6 8.5 1.9 64.9 30.9 -2.7
13. Punjab 5.5 4.4 0.9 -0.1 80.8 29.3 7.7 5.8 1.7 9 11.7 4.2 0.7 55.2 30.1 1.6
14. Rajasthan 6.6 3.3 1.8 -1.5 48.6 21.4 7.3 1.9 6.2 13.8 8.4 9.1 2.9 54.9 31 1.5
15. Tamil Nadu 3.5 1.5 0.9 -1.2 37.5 10.8 9.7 1.2 3.3 10.6 6.5 6.8 1.9 29.3 18.8 0.6
16. Uttar Pradesh 6 4.7 1.6 0.3 73.1 31.9 6.5 1.1 7.4 13.3 9 6.6 2.9 55.5 29.6 -0.2
17. West Bengal 6.1 4.7 1.4 0 76.7 51.9 4.6 0.5 4.1 7.6 7.7 4.9 0.6 48.8 52.2 0.9
18. NCT Delhi 2.7 -2.9 1 -4.6 -121.2 -31.2 7.5 1.1 0.6 8.7 3.3 4.6 1.3 18.5 17.9 0.7
Special Category
1. Arunachal Pradesh 11.9 -3.6 6 -9.5 -35.9 -6 1.8 5.1 51.9 51.8 19 23.7 15.4 45.7 10 5.6
2. Assam 3.6 1.1 0.2 -2.3 32.6 5.5 5.5 2.2 12.3 16.2 8.6 9.6 2.6 35.7 17 2.1
3. Himachal Pradesh 12.2 7.9 4.4 0.1 64.9 35.3 5.7 1.9 14.9 21.2 13.6 12.2 4.3 78.6 34.8 1.4
4. Jammu and Kashmir 3.9 -7.1 -2 -13 3765.9 -15.9 6.1 2.3 35.3 28.3 19.4 14 10.7 58.5 13.8 1.6
5. Manipur 8.7 0.5 2.1 -6.1 10 1.5 1.9 1.6 36.5 30.8 18 18.1 8 58.9 16.5 6.3
6. Meghalaya 4.6 -0.9 1.2 -4.3 -26.2 -3.1 3.6 2.4 23.1 22.8 11.3 13.4 4.6 40.9 11.8 1.1
7. Mizoram 11.5 -0.7 5.2 -7 -12.8 -0.8 1.3 2.4 47.1 44.5 18.7 24.6 11.5 89.6 12.4 -6.3
8. Nagaland 3.3 -3.1 -0.8 -7.1 100.2 -8 1.2 1 29.9 20.1 15.4 10.7 6.4 40.5 13 -7.6
9. Sikkim 5.5 -12.9 -1.3 -19.7 -805.7 -10.1 8 70.1 51.6 54.9 80.4 29.6 18.4 78.7 5.5 -2.9
10. Tripura 5.4 -1.7 0.8 -6.3 -60 -5.3 3 2 25.6 22.5 12.9 14.2 7.1 51.8 14.9 0.3
11. Uttranchal 8.2 4 4.5 0.3 49.8 19.5 7 2.4 11.3 19.4 9 11.5 3.6 47.1 17.9 -5.2
Note: 1. Outstanding debt for the composite State of Bihar as on March 2000, was bifurcated in the population ratio of 74.71 per cent and 25.29 per centfor Bihar and Jharkhand respectively. Similarly, for Madhya Pradesh and Chhattisgarh the proportion of 73.3739 per cent and 26.6203 per cent,respectively has been applied and for Uttar Pradesh and Uttranchal a proportion of 94.9676 per cent and 5.0324 per cent, respectively were applied.
2. Minus (-) sign indicates surplus in deficit indicators.
3. Figures in bold indicate the median State for the given indicator
4. Average interest rate (R) of liabilities is worked out by dividing interest payment of the current year by outstanding liabilities of the previous year.
5. The median State is the middle-most State for an indicator after the States have been arranged in the ascending/descending order.
GSDP : Gross State Domestic Product GFD : Gross Fiscal Deficit PD : Primary Deficit
RD : Revenue Deficit OTR : Own Tax Revenue ONTR : Own Non-Tax Revenue
CT : Current Transfers DEV : Development Expenditure NON-DEV : Non-Development Expenditure
SSE : Social Sector Expenditure CO : Capital Outlay DEBT : Debt
IP : Interest Payment RR : Revenue Receipts PRB : Primary Revenue Balance
R-G : Average interest rate (R) on debt minus rate of growth of GSDP (G) Avg. : Average
Source: RBI (2006). State Finances: A Study of Budgets of 2006-07.
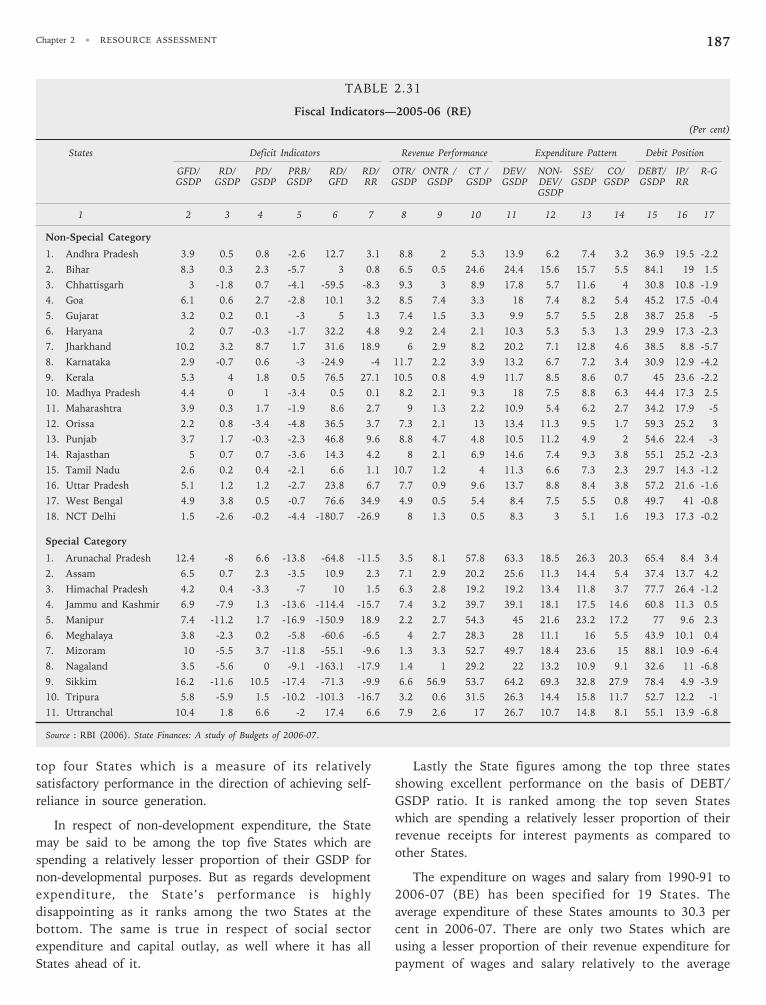
Chapter 2 • RESOURCE ASSESSMENT 187
TABLE 2.31
Fiscal Indicators—2005-06 (RE)
(Per cent)
States Deficit Indicators Revenue Performance Expenditure Pattern Debit Position
GFD/ RD/ PD/ PRB/ RD/ RD/ OTR/ ONTR / CT / DEV/ NON- SSE/ CO/ DEBT/ IP/ R-GGSDP GSDP GSDP GSDP GFD RR GSDP GSDP GSDP GSDP DEV/ GSDP GSDP GSDP RR
GSDP
1 2 3 4 5 6 7 8 9 10 11 12 13 14 15 16 17
Non-Special Category
1. Andhra Pradesh 3.9 0.5 0.8 -2.6 12.7 3.1 8.8 2 5.3 13.9 6.2 7.4 3.2 36.9 19.5 -2.2
2. Bihar 8.3 0.3 2.3 -5.7 3 0.8 6.5 0.5 24.6 24.4 15.6 15.7 5.5 84.1 19 1.5
3. Chhattisgarh 3 -1.8 0.7 -4.1 -59.5 -8.3 9.3 3 8.9 17.8 5.7 11.6 4 30.8 10.8 -1.9
4. Goa 6.1 0.6 2.7 -2.8 10.1 3.2 8.5 7.4 3.3 18 7.4 8.2 5.4 45.2 17.5 -0.4
5. Gujarat 3.2 0.2 0.1 -3 5 1.3 7.4 1.5 3.3 9.9 5.7 5.5 2.8 38.7 25.8 -5
6. Haryana 2 0.7 -0.3 -1.7 32.2 4.8 9.2 2.4 2.1 10.3 5.3 5.3 1.3 29.9 17.3 -2.3
7. Jharkhand 10.2 3.2 8.7 1.7 31.6 18.9 6 2.9 8.2 20.2 7.1 12.8 4.6 38.5 8.8 -5.7
8. Karnataka 2.9 -0.7 0.6 -3 -24.9 -4 11.7 2.2 3.9 13.2 6.7 7.2 3.4 30.9 12.9 -4.2
9. Kerala 5.3 4 1.8 0.5 76.5 27.1 10.5 0.8 4.9 11.7 8.5 8.6 0.7 45 23.6 -2.2
10. Madhya Pradesh 4.4 0 1 -3.4 0.5 0.1 8.2 2.1 9.3 18 7.5 8.8 6.3 44.4 17.3 2.5
11. Maharashtra 3.9 0.3 1.7 -1.9 8.6 2.7 9 1.3 2.2 10.9 5.4 6.2 2.7 34.2 17.9 -5
12. Orissa 2.2 0.8 -3.4 -4.8 36.5 3.7 7.3 2.1 13 13.4 11.3 9.5 1.7 59.3 25.2 3
13. Punjab 3.7 1.7 -0.3 -2.3 46.8 9.6 8.8 4.7 4.8 10.5 11.2 4.9 2 54.6 22.4 -3
14. Rajasthan 5 0.7 0.7 -3.6 14.3 4.2 8 2.1 6.9 14.6 7.4 9.3 3.8 55.1 25.2 -2.3
15. Tamil Nadu 2.6 0.2 0.4 -2.1 6.6 1.1 10.7 1.2 4 11.3 6.6 7.3 2.3 29.7 14.3 -1.2
16. Uttar Pradesh 5.1 1.2 1.2 -2.7 23.8 6.7 7.7 0.9 9.6 13.7 8.8 8.4 3.8 57.2 21.6 -1.6
17. West Bengal 4.9 3.8 0.5 -0.7 76.6 34.9 4.9 0.5 5.4 8.4 7.5 5.5 0.8 49.7 41 -0.8
18. NCT Delhi 1.5 -2.6 -0.2 -4.4 -180.7 -26.9 8 1.3 0.5 8.3 3 5.1 1.6 19.3 17.3 -0.2
Special Category
1. Arunachal Pradesh 12.4 -8 6.6 -13.8 -64.8 -11.5 3.5 8.1 57.8 63.3 18.5 26.3 20.3 65.4 8.4 3.4
2. Assam 6.5 0.7 2.3 -3.5 10.9 2.3 7.1 2.9 20.2 25.6 11.3 14.4 5.4 37.4 13.7 4.2
3. Himachal Pradesh 4.2 0.4 -3.3 -7 10 1.5 6.3 2.8 19.2 19.2 13.4 11.8 3.7 77.7 26.4 -1.2
4. Jammu and Kashmir 6.9 -7.9 1.3 -13.6 -114.4 -15.7 7.4 3.2 39.7 39.1 18.1 17.5 14.6 60.8 11.3 0.5
5. Manipur 7.4 -11.2 1.7 -16.9 -150.9 18.9 2.2 2.7 54.3 45 21.6 23.2 17.2 77 9.6 2.3
6. Meghalaya 3.8 -2.3 0.2 -5.8 -60.6 -6.5 4 2.7 28.3 28 11.1 16 5.5 43.9 10.1 0.4
7. Mizoram 10 -5.5 3.7 -11.8 -55.1 -9.6 1.3 3.3 52.7 49.7 18.4 23.6 15 88.1 10.9 -6.4
8. Nagaland 3.5 -5.6 0 -9.1 -163.1 -17.9 1.4 1 29.2 22 13.2 10.9 9.1 32.6 11 -6.8
9. Sikkim 16.2 -11.6 10.5 -17.4 -71.3 -9.9 6.6 56.9 53.7 64.2 69.3 32.8 27.9 78.4 4.9 -3.9
10. Tripura 5.8 -5.9 1.5 -10.2 -101.3 -16.7 3.2 0.6 31.5 26.3 14.4 15.8 11.7 52.7 12.2 -1
11. Uttranchal 10.4 1.8 6.6 -2 17.4 6.6 7.9 2.6 17 26.7 10.7 14.8 8.1 55.1 13.9 -6.8
Source : RBI (2006). State Finances: A study of Budgets of 2006-07.
top four States which is a measure of its relatively
satisfactory performance in the direction of achieving self-
reliance in source generation.
In respect of non-development expenditure, the State
may be said to be among the top five States which are
spending a relatively lesser proportion of their GSDP for
non-developmental purposes. But as regards development
expenditure, the State’s performance is highly
disappointing as it ranks among the two States at the
bottom. The same is true in respect of social sector
expenditure and capital outlay, as well where it has all
States ahead of it.
Lastly the State figures among the top three states
showing excellent performance on the basis of DEBT/
GSDP ratio. It is ranked among the top seven States
which are spending a relatively lesser proportion of their
revenue receipts for interest payments as compared to
other States.
The expenditure on wages and salary from 1990-91 to
2006-07 (BE) has been specified for 19 States. The
average expenditure of these States amounts to 30.3 per
cent in 2006-07. There are only two States which are
using a lesser proportion of their revenue expenditure for
payment of wages and salary relatively to the average
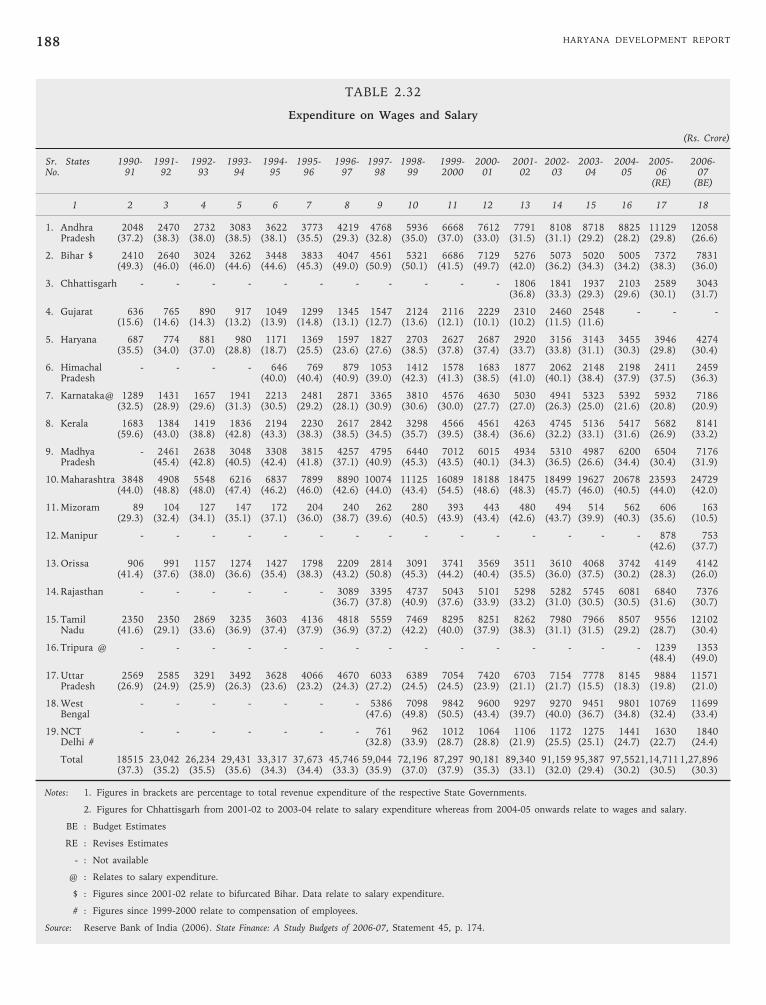
HARYANA DEVELOPMENT REPORT188
TABLE 2.32
Expenditure on Wages and Salary
(Rs. Crore)
Sr. States 1990- 1991- 1992- 1993- 1994- 1995- 1996- 1997- 1998- 1999- 2000- 2001- 2002- 2003- 2004- 2005- 2006-No. 91 92 93 94 95 96 97 98 99 2000 01 02 03 04 05 06 07
(RE) (BE)
1 2 3 4 5 6 7 8 9 10 11 12 13 14 15 16 17 18
1. Andhra 2048 2470 2732 3083 3622 3773 4219 4768 5936 6668 7612 7791 8108 8718 8825 11129 12058Pradesh (37.2) (38.3) (38.0) (38.5) (38.1) (35.5) (29.3) (32.8) (35.0) (37.0) (33.0) (31.5) (31.1) (29.2) (28.2) (29.8) (26.6)
2. Bihar $ 2410 2640 3024 3262 3448 3833 4047 4561 5321 6686 7129 5276 5073 5020 5005 7372 7831(49.3) (46.0) (46.0) (44.6) (44.6) (45.3) (49.0) (50.9) (50.1) (41.5) (49.7) (42.0) (36.2) (34.3) (34.2) (38.3) (36.0)
3. Chhattisgarh - - - - - - - - - - - 1806 1841 1937 2103 2589 3043(36.8) (33.3) (29.3) (29.6) (30.1) (31.7)
4. Gujarat 636 765 890 917 1049 1299 1345 1547 2124 2116 2229 2310 2460 2548 - - -(15.6) (14.6) (14.3) (13.2) (13.9) (14.8) (13.1) (12.7) (13.6) (12.1) (10.1) (10.2) (11.5) (11.6)
5. Haryana 687 774 881 980 1171 1369 1597 1827 2703 2627 2687 2920 3156 3143 3455 3946 4274(35.5) (34.0) (37.0) (28.8) (18.7) (25.5) (23.6) (27.6) (38.5) (37.8) (37.4) (33.7) (33.8) (31.1) (30.3) (29.8) (30.4)
6. Himachal - - - - 646 769 879 1053 1412 1578 1683 1877 2062 2148 2198 2411 2459Pradesh (40.0) (40.4) (40.9) (39.0) (42.3) (41.3) (38.5) (41.0) (40.1) (38.4) (37.9) (37.5) (36.3)
7. Karnataka@ 1289 1431 1657 1941 2213 2481 2871 3365 3810 4576 4630 5030 4941 5323 5392 5932 7186(32.5) (28.9) (29.6) (31.3) (30.5) (29.2) (28.1) (30.9) (30.6) (30.0) (27.7) (27.0) (26.3) (25.0) (21.6) (20.8) (20.9)
8. Kerala 1683 1384 1419 1836 2194 2230 2617 2842 3298 4566 4561 4263 4745 5136 5417 5682 8141(59.6) (43.0) (38.8) (42.8) (43.3) (38.3) (38.5) (34.5) (35.7) (39.5) (38.4) (36.6) (32.2) (33.1) (31.6) (26.9) (33.2)
9. Madhya - 2461 2638 3048 3308 3815 4257 4795 6440 7012 6015 4934 5310 4987 6200 6504 7176Pradesh (45.4) (42.8) (40.5) (42.4) (41.8) (37.1) (40.9) (45.3) (43.5) (40.1) (34.3) (36.5) (26.6) (34.4) (30.4) (31.9)
10. Maharashtra 3848 4908 5548 6216 6837 7899 8890 10074 11125 16089 18188 18475 18499 19627 20678 23593 24729(44.0) (48.8) (48.0) (47.4) (46.2) (46.0) (42.6) (44.0) (43.4) (54.5) (48.6) (48.3) (45.7) (46.0) (40.5) (44.0) (42.0)
11. Mizoram 89 104 127 147 172 204 240 262 280 393 443 480 494 514 562 606 163(29.3) (32.4) (34.1) (35.1) (37.1) (36.0) (38.7) (39.6) (40.5) (43.9) (43.4) (42.6) (43.7) (39.9) (40.3) (35.6) (10.5)
12. Manipur - - - - - - - - - - - - - - - 878 753(42.6) (37.7)
13. Orissa 906 991 1157 1274 1427 1798 2209 2814 3091 3741 3569 3511 3610 4068 3742 4149 4142(41.4) (37.6) (38.0) (36.6) (35.4) (38.3) (43.2) (50.8) (45.3) (44.2) (40.4) (35.5) (36.0) (37.5) (30.2) (28.3) (26.0)
14. Rajasthan - - - - - - 3089 3395 4737 5043 5101 5298 5282 5745 6081 6840 7376(36.7) (37.8) (40.9) (37.6) (33.9) (33.2) (31.0) (30.5) (30.5) (31.6) (30.7)
15. Tamil 2350 2350 2869 3235 3603 4136 4818 5559 7469 8295 8251 8262 7980 7966 8507 9556 12102Nadu (41.6) (29.1) (33.6) (36.9) (37.4) (37.9) (36.9) (37.2) (42.2) (40.0) (37.9) (38.3) (31.1) (31.5) (29.2) (28.7) (30.4)
16. Tripura @ - - - - - - - - - - - - - - - 1239 1353(48.4) (49.0)
17. Uttar 2569 2585 3291 3492 3628 4066 4670 6033 6389 7054 7420 6703 7154 7778 8145 9884 11571Pradesh (26.9) (24.9) (25.9) (26.3) (23.6) (23.2) (24.3) (27.2) (24.5) (24.5) (23.9) (21.1) (21.7) (15.5) (18.3) (19.8) (21.0)
18. West - - - - - - - 5386 7098 9842 9600 9297 9270 9451 9801 10769 11699Bengal (47.6) (49.8) (50.5) (43.4) (39.7) (40.0) (36.7) (34.8) (32.4) (33.4)
19. NCT - - - - - - - 761 962 1012 1064 1106 1172 1275 1441 1630 1840Delhi # (32.8) (33.9) (28.7) (28.8) (21.9) (25.5) (25.1) (24.7) (22.7) (24.4)
Total 18515 23,042 26,234 29,431 33,317 37,673 45,746 59,044 72,196 87,297 90,181 89,340 91,159 95,387 97,5521,14,711 1,27,896(37.3) (35.2) (35.5) (35.6) (34.3) (34.4) (33.3) (35.9) (37.0) (37.9) (35.3) (33.1) (32.0) (29.4) (30.2) (30.5) (30.3)
Notes: 1. Figures in brackets are percentage to total revenue expenditure of the respective State Governments.
2. Figures for Chhattisgarh from 2001-02 to 2003-04 relate to salary expenditure whereas from 2004-05 onwards relate to wages and salary.
BE : Budget Estimates
RE : Revises Estimates
- : Not available
@ : Relates to salary expenditure.
$ : Figures since 2001-02 relate to bifurcated Bihar. Data relate to salary expenditure.
# : Figures since 1999-2000 relate to compensation of employees.
Source: Reserve Bank of India (2006). State Finance: A Study Budgets of 2006-07, Statement 45, p. 174.
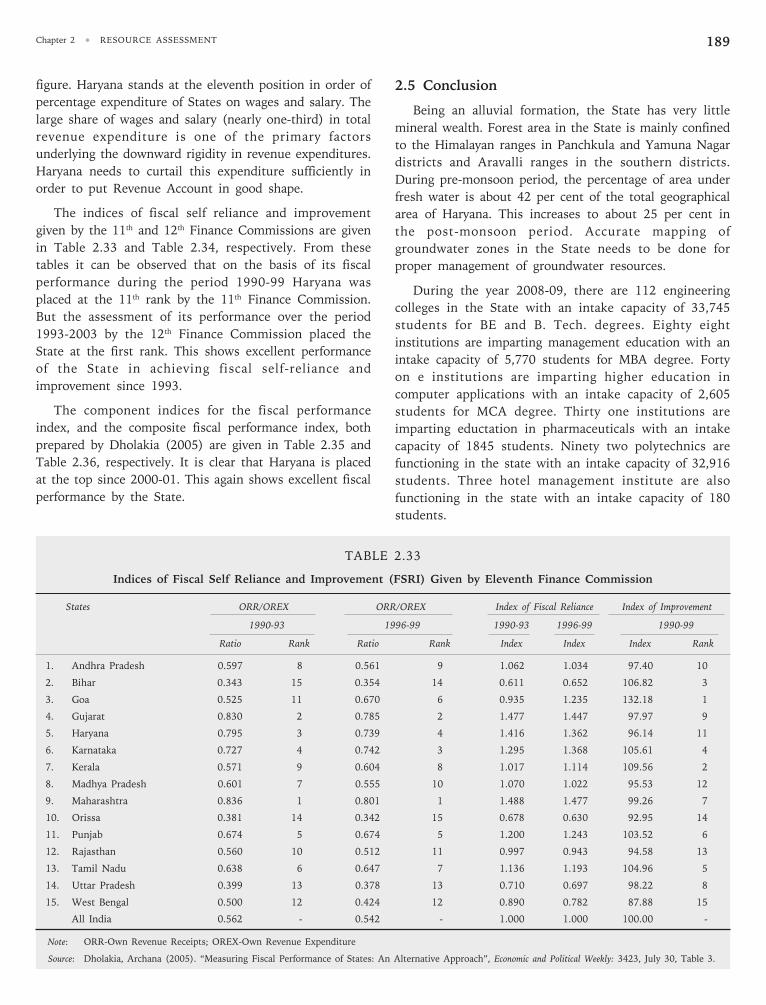
Chapter 2 • RESOURCE ASSESSMENT 189
TABLE 2.33
Indices of Fiscal Self Reliance and Improvement (FSRI) Given by Eleventh Finance Commission
States ORR/OREX ORR/OREX Index of Fiscal Reliance Index of Improvement
1990-93 1996-99 1990-93 1996-99 1990-99
Ratio Rank Ratio Rank Index Index Index Rank
1. Andhra Pradesh 0.597 8 0.561 9 1.062 1.034 97.40 10
2. Bihar 0.343 15 0.354 14 0.611 0.652 106.82 3
3. Goa 0.525 11 0.670 6 0.935 1.235 132.18 1
4. Gujarat 0.830 2 0.785 2 1.477 1.447 97.97 9
5. Haryana 0.795 3 0.739 4 1.416 1.362 96.14 11
6. Karnataka 0.727 4 0.742 3 1.295 1.368 105.61 4
7. Kerala 0.571 9 0.604 8 1.017 1.114 109.56 2
8. Madhya Pradesh 0.601 7 0.555 10 1.070 1.022 95.53 12
9. Maharashtra 0.836 1 0.801 1 1.488 1.477 99.26 7
10. Orissa 0.381 14 0.342 15 0.678 0.630 92.95 14
11. Punjab 0.674 5 0.674 5 1.200 1.243 103.52 6
12. Rajasthan 0.560 10 0.512 11 0.997 0.943 94.58 13
13. Tamil Nadu 0.638 6 0.647 7 1.136 1.193 104.96 5
14. Uttar Pradesh 0.399 13 0.378 13 0.710 0.697 98.22 8
15. West Bengal 0.500 12 0.424 12 0.890 0.782 87.88 15
All India 0.562 - 0.542 - 1.000 1.000 100.00 -
Note: ORR-Own Revenue Receipts; OREX-Own Revenue Expenditure
Source: Dholakia, Archana (2005). “Measuring Fiscal Performance of States: An Alternative Approach”, Economic and Political Weekly: 3423, July 30, Table 3.
figure. Haryana stands at the eleventh position in order of
percentage expenditure of States on wages and salary. The
large share of wages and salary (nearly one-third) in total
revenue expenditure is one of the primary factors
underlying the downward rigidity in revenue expenditures.
Haryana needs to curtail this expenditure sufficiently in
order to put Revenue Account in good shape.
The indices of fiscal self reliance and improvement
given by the 11th and 12th Finance Commissions are given
in Table 2.33 and Table 2.34, respectively. From these
tables it can be observed that on the basis of its fiscal
performance during the period 1990-99 Haryana was
placed at the 11th rank by the 11th Finance Commission.
But the assessment of its performance over the period
1993-2003 by the 12th Finance Commission placed the
State at the first rank. This shows excellent performance
of the State in achieving fiscal self-reliance and
improvement since 1993.
The component indices for the fiscal performance
index, and the composite fiscal performance index, both
prepared by Dholakia (2005) are given in Table 2.35 and
Table 2.36, respectively. It is clear that Haryana is placed
at the top since 2000-01. This again shows excellent fiscal
performance by the State.
2.5 Conclusion
Being an alluvial formation, the State has very little
mineral wealth. Forest area in the State is mainly confined
to the Himalayan ranges in Panchkula and Yamuna Nagar
districts and Aravalli ranges in the southern districts.
During pre-monsoon period, the percentage of area under
fresh water is about 42 per cent of the total geographical
area of Haryana. This increases to about 25 per cent in
the post-monsoon period. Accurate mapping of
groundwater zones in the State needs to be done for
proper management of groundwater resources.
During the year 2008-09, there are 112 engineering
colleges in the State with an intake capacity of 33,745
students for BE and B. Tech. degrees. Eighty eight
institutions are imparting management education with an
intake capacity of 5,770 students for MBA degree. Forty
on e institutions are imparting higher education in
computer applications with an intake capacity of 2,605
students for MCA degree. Thirty one institutions are
imparting eductation in pharmaceuticals with an intake
capacity of 1845 students. Ninety two polytechnics are
functioning in the state with an intake capacity of 32,916
students. Three hotel management institute are also
functioning in the state with an intake capacity of 180
students.
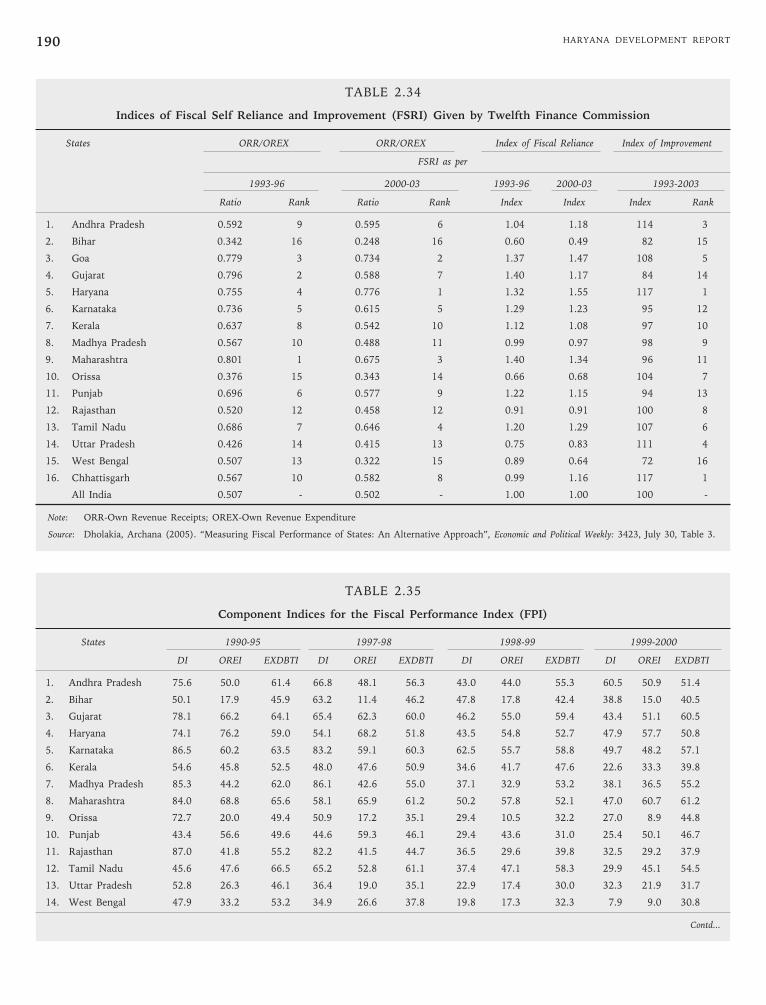
HARYANA DEVELOPMENT REPORT190
TABLE 2.34
Indices of Fiscal Self Reliance and Improvement (FSRI) Given by Twelfth Finance Commission
States ORR/OREX ORR/OREX Index of Fiscal Reliance Index of Improvement
FSRI as per
1993-96 2000-03 1993-96 2000-03 1993-2003
Ratio Rank Ratio Rank Index Index Index Rank
1. Andhra Pradesh 0.592 9 0.595 6 1.04 1.18 114 3
2. Bihar 0.342 16 0.248 16 0.60 0.49 82 15
3. Goa 0.779 3 0.734 2 1.37 1.47 108 5
4. Gujarat 0.796 2 0.588 7 1.40 1.17 84 14
5. Haryana 0.755 4 0.776 1 1.32 1.55 117 1
6. Karnataka 0.736 5 0.615 5 1.29 1.23 95 12
7. Kerala 0.637 8 0.542 10 1.12 1.08 97 10
8. Madhya Pradesh 0.567 10 0.488 11 0.99 0.97 98 9
9. Maharashtra 0.801 1 0.675 3 1.40 1.34 96 11
10. Orissa 0.376 15 0.343 14 0.66 0.68 104 7
11. Punjab 0.696 6 0.577 9 1.22 1.15 94 13
12. Rajasthan 0.520 12 0.458 12 0.91 0.91 100 8
13. Tamil Nadu 0.686 7 0.646 4 1.20 1.29 107 6
14. Uttar Pradesh 0.426 14 0.415 13 0.75 0.83 111 4
15. West Bengal 0.507 13 0.322 15 0.89 0.64 72 16
16. Chhattisgarh 0.567 10 0.582 8 0.99 1.16 117 1
All India 0.507 - 0.502 - 1.00 1.00 100 -
Note: ORR-Own Revenue Receipts; OREX-Own Revenue Expenditure
Source: Dholakia, Archana (2005). “Measuring Fiscal Performance of States: An Alternative Approach”, Economic and Political Weekly: 3423, July 30, Table 3.
TABLE 2.35
Component Indices for the Fiscal Performance Index (FPI)
States 1990-95 1997-98 1998-99 1999-2000
DI OREI EXDBTI DI OREI EXDBTI DI OREI EXDBTI DI OREI EXDBTI
1. Andhra Pradesh 75.6 50.0 61.4 66.8 48.1 56.3 43.0 44.0 55.3 60.5 50.9 51.4
2. Bihar 50.1 17.9 45.9 63.2 11.4 46.2 47.8 17.8 42.4 38.8 15.0 40.5
3. Gujarat 78.1 66.2 64.1 65.4 62.3 60.0 46.2 55.0 59.4 43.4 51.1 60.5
4. Haryana 74.1 76.2 59.0 54.1 68.2 51.8 43.5 54.8 52.7 47.9 57.7 50.8
5. Karnataka 86.5 60.2 63.5 83.2 59.1 60.3 62.5 55.7 58.8 49.7 48.2 57.1
6. Kerala 54.6 45.8 52.5 48.0 47.6 50.9 34.6 41.7 47.6 22.6 33.3 39.8
7. Madhya Pradesh 85.3 44.2 62.0 86.1 42.6 55.0 37.1 32.9 53.2 38.1 36.5 55.2
8. Maharashtra 84.0 68.8 65.6 58.1 65.9 61.2 50.2 57.8 52.1 47.0 60.7 61.2
9. Orissa 72.7 20.0 49.4 50.9 17.2 35.1 29.4 10.5 32.2 27.0 8.9 44.8
10. Punjab 43.4 56.6 49.6 44.6 59.3 46.1 29.4 43.6 31.0 25.4 50.1 46.7
11. Rajasthan 87.0 41.8 55.2 82.2 41.5 44.7 36.5 29.6 39.8 32.5 29.2 37.9
12. Tamil Nadu 45.6 47.6 66.5 65.2 52.8 61.1 37.4 47.1 58.3 29.9 45.1 54.5
13. Uttar Pradesh 52.8 26.3 46.1 36.4 19.0 35.1 22.9 17.4 30.0 32.3 21.9 31.7
14. West Bengal 47.9 33.2 53.2 34.9 26.6 37.8 19.8 17.3 32.3 7.9 9.0 30.8
Contd...
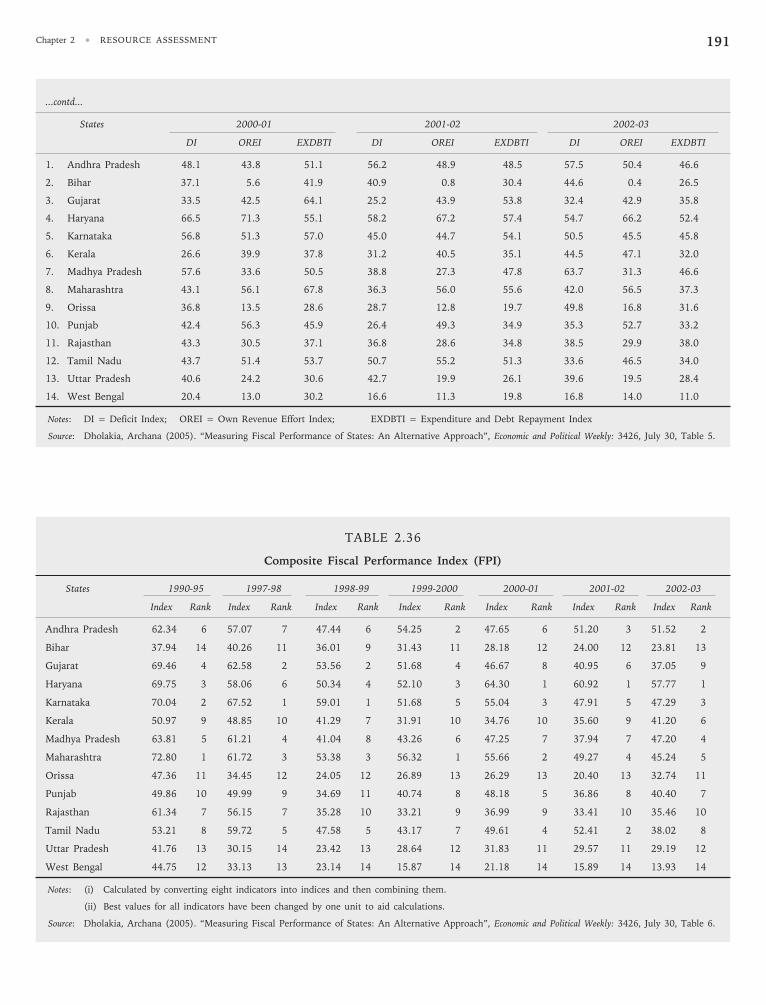
Chapter 2 • RESOURCE ASSESSMENT 191
...contd...
States 2000-01 2001-02 2002-03
DI OREI EXDBTI DI OREI EXDBTI DI OREI EXDBTI
1. Andhra Pradesh 48.1 43.8 51.1 56.2 48.9 48.5 57.5 50.4 46.6
2. Bihar 37.1 5.6 41.9 40.9 0.8 30.4 44.6 0.4 26.5
3. Gujarat 33.5 42.5 64.1 25.2 43.9 53.8 32.4 42.9 35.8
4. Haryana 66.5 71.3 55.1 58.2 67.2 57.4 54.7 66.2 52.4
5. Karnataka 56.8 51.3 57.0 45.0 44.7 54.1 50.5 45.5 45.8
6. Kerala 26.6 39.9 37.8 31.2 40.5 35.1 44.5 47.1 32.0
7. Madhya Pradesh 57.6 33.6 50.5 38.8 27.3 47.8 63.7 31.3 46.6
8. Maharashtra 43.1 56.1 67.8 36.3 56.0 55.6 42.0 56.5 37.3
9. Orissa 36.8 13.5 28.6 28.7 12.8 19.7 49.8 16.8 31.6
10. Punjab 42.4 56.3 45.9 26.4 49.3 34.9 35.3 52.7 33.2
11. Rajasthan 43.3 30.5 37.1 36.8 28.6 34.8 38.5 29.9 38.0
12. Tamil Nadu 43.7 51.4 53.7 50.7 55.2 51.3 33.6 46.5 34.0
13. Uttar Pradesh 40.6 24.2 30.6 42.7 19.9 26.1 39.6 19.5 28.4
14. West Bengal 20.4 13.0 30.2 16.6 11.3 19.8 16.8 14.0 11.0
Notes: DI = Deficit Index; OREI = Own Revenue Effort Index; EXDBTI = Expenditure and Debt Repayment Index
Source: Dholakia, Archana (2005). “Measuring Fiscal Performance of States: An Alternative Approach”, Economic and Political Weekly: 3426, July 30, Table 5.
TABLE 2.36
Composite Fiscal Performance Index (FPI)
States 1990-95 1997-98 1998-99 1999-2000 2000-01 2001-02 2002-03
Index Rank Index Rank Index Rank Index Rank Index Rank Index Rank Index Rank
Andhra Pradesh 62.34 6 57.07 7 47.44 6 54.25 2 47.65 6 51.20 3 51.52 2
Bihar 37.94 14 40.26 11 36.01 9 31.43 11 28.18 12 24.00 12 23.81 13
Gujarat 69.46 4 62.58 2 53.56 2 51.68 4 46.67 8 40.95 6 37.05 9
Haryana 69.75 3 58.06 6 50.34 4 52.10 3 64.30 1 60.92 1 57.77 1
Karnataka 70.04 2 67.52 1 59.01 1 51.68 5 55.04 3 47.91 5 47.29 3
Kerala 50.97 9 48.85 10 41.29 7 31.91 10 34.76 10 35.60 9 41.20 6
Madhya Pradesh 63.81 5 61.21 4 41.04 8 43.26 6 47.25 7 37.94 7 47.20 4
Maharashtra 72.80 1 61.72 3 53.38 3 56.32 1 55.66 2 49.27 4 45.24 5
Orissa 47.36 11 34.45 12 24.05 12 26.89 13 26.29 13 20.40 13 32.74 11
Punjab 49.86 10 49.99 9 34.69 11 40.74 8 48.18 5 36.86 8 40.40 7
Rajasthan 61.34 7 56.15 7 35.28 10 33.21 9 36.99 9 33.41 10 35.46 10
Tamil Nadu 53.21 8 59.72 5 47.58 5 43.17 7 49.61 4 52.41 2 38.02 8
Uttar Pradesh 41.76 13 30.15 14 23.42 13 28.64 12 31.83 11 29.57 11 29.19 12
West Bengal 44.75 12 33.13 13 23.14 14 15.87 14 21.18 14 15.89 14 13.93 14
Notes: (i) Calculated by converting eight indicators into indices and then combining them.
(ii) Best values for all indicators have been changed by one unit to aid calculations.
Source: Dholakia, Archana (2005). “Measuring Fiscal Performance of States: An Alternative Approach”, Economic and Political Weekly: 3426, July 30, Table 6.
HARYANA DEVELOPMENT REPORT192
The revenue deficit of the State has reduced from the
peak of Rs.1540 crores in 1998-99 to Rs.258.00 crores in
2004-05. In terms of percentage of gross state domestic
product (GSDP), the revenue deficit reduced from 3.5 per
cent in 1998-99 to 0.31 per cent in 2004-05. The Fiscal
Deficit has reduced from 5.1 per cent of GSDP in 1998-99
to 1.4 per cent in 2004-05. The Tax-GSDP Ratio has
improved from 7.83 per cent in 2000-01 to 8.96 per cent
in 2004-05. The notable feature of state financial
management is that Haryana is the first state in the
country which has not availed ways and means advances
and overdraft facility even for a single day since 2002. The
12th Finance Commission placed the State at the first rank
on the basis of fiscal performance during 1993-2003.
TABLE 3.1
Growth Rates of Change in Share by Industry toSDP in Haryana: 1993-94 to 2005-06
Description Period
1993-94 to 2005-06
Growth rate of change in share ofPrimary Sector to SDP at Current Prices -4.864
Growth rate of change in share ofPrimary Sector to SDP at Constant Prices -3.979
Growth rate of change in share ofSecondary Sector to SDP at Current Prices 0.976
Growth rate of change in share ofSecondary Sector to SDP at Constant Prices 0.489
Growth rate of change in share ofTertiary Sector to SDP at Current Prices 3.724
Growth rate of change in share ofTertiary Sector to SDP at Constant Prices 3.513
Source : Growth rates for three sector has been calculated from the datafrom Statistical Abstract of Haryana (Various Issues, Published byGovernment of Haryana, Chandigarh).
3.0 Introduction
On the basis of the analysis in Chapter 1 and Chapter 2
we identify the critical issues in the traditional as well as
newly emerging areas of Haryana’s economy.
3.1 Sectoral Issues for Sustainable Development
Sustainable development is a process of simultane-
ously ensuring continuation of the economic, social and
ecological basis of human life. In Chapter 1, we have
discussed the comparable trends in the development of
the economy of the State vis-à-vis other States in terms of
generally accepted development indicators. On the basis of
the analysis of the growth process in Haryana during last
four decades, the following sectoral issues emerge:
The growth rates of Haryana in aggregate as well as
sectoral have been slightly less than the targeted growth
rates. The decadal growth trends suggest that the
momentum of growth has increased in the past or even
may increase in future. The contribution of primary,
secondary, and tertiary sector to gross domestic product in
Haryana has been higher than their contribution to gross
domestic product in India since 1980-81 onwards. The
developments in growth of per capita income in Haryana
during the past and present period indicate that economic
growth in the State has been welfare oriented if we take
per capita income as an indicator of development. However,
an analysis of social indicators in Haryana reveals that there
exist wide disparities with respect to gender and class
equalities, women empowerment and poverty alleviation in
the State.
On the basis of the criteria developed for measuring
the sustainable development in the State, it can be said
that as far as material growth is concerned (in terms of
state domestic product and per capita income) the
performance of the State has been among the first five
States in India. The important issue here is to find out
whether the growth rate achieved in per capita income can
further be increased keeping in view the sustainability of
different sectors of Haryana economy.
The sectoral shift in Haryana has been constantly
moving in favour of tertiary sector vis-à-vis secondary and
primary sector. The most emerging challenge in the State
is to provide productive and gainful employment to its
inhabitants through agriculture and industry whose shares
are constantly declining.
Not only this, the relevant and more important sectoral
issue is to achieve an optimum balance among the three
sectors. In order to identify the critical sectoral issues our
strategy would be to discuss the progress and weakness of
each specific economic activity.
Chapter 3
Identification of Critical Issues
and the Newly Emerging Areas
HAR
YANA
HARYANA DEVELOPMENT REPORT194
As far as the agriculture and allied activities are
concerned, the expenditure on agriculture has increased at
an average annual rate of 9.50 per cent during 4th plan
period, whereas the share of expenditure on agriculture
has declined at a rate of 1.06 per cent per annum. This
paradoxical situation implies that the relative share and
importance of agriculture in Haryana’s economy is
declining.
In raising the productivity of wheat, rice, maize, cotton
or any other crop for that purpose the role of high
yielding variety and other related critical inputs such as
fertilisers, technology and water happens to be important.
The State has been providing necessary policy-initiatives
and inputs for the Green Revolution and its spread to all
the regions of State. The wheat-rice cropping pattern in
the State has led to many environmental problems in the
State, though some of the problems can be attributed to
geographical characteristics of the State and digging up of
canal system in the State. In personal interviews with the
farmers, in the nearby villages of Kurukshetra, Karnal and
Kaithal, we have found that farmers are well aware of the
environmental problems arising out of cultivating more of
rice on their fields. As a consequence of this, the water
level has gone down which may cause problems for future
generations. The diversification of crops is not taking
place because of lack of innovative marketing techniques
so essential for funding the market for alternative crops to
rice and wheat.
The analysis of all the data, related with agriculture
and allied sector reveals that there are the following
sectoral issues for sustainable development which need to
be thoroughly examined for making a suitable policy for
this sector:
(i) The expenditure on agriculture needs to be
accelerated in order to achieve sustainable
agricultural development in Haryana. From the
analysis it is clear that Government has been
neglecting agriculture as the relative expenditure
on agriculture in total expenditure has been
falling persistently.
(ii) The wheat-rice cropping pattern needs to be
diverted in favour of meaningful and viable
diversification of agriculture and allied sectors in
Haryana. If the same trend continues, it might
result into serious ecological problems making
the achievement of sustainable development in
agriculture a distant dream.
(iii) Though the net irrigated area has increased, this
cannot be said to be increasing at a desired rate.
Government of Haryana should step up its efforts
in providing more irrigation facilities to the
farmers in Haryana. Water being a critical input
may affect the agricultural productivity adversely
in future.
(iv) Another area of concern seems to be growing use
of fertilisers by the farmers in the State. In the
present age of globalisation, SPS clauses under
WTO trading regime are being enforced on the
trading system of the developing countries. The
greater emphasis on the application of fertilisers
in raising the agricultural productivity is not
desirable as the advanced countries may impose
severe restrictions based on SPS clauses of WTO
on the exports of agricultural products from
Haryana in particular and India in general. In
future, with the conclusion of agreement on
agriculture, the prospects for agricultural exports
from Haryana are bright. This will depend on the
compliance of the WTO rules related with SPS,
certification and standards. This issue will further
be examined in greater detail in section 3.2.5.
(v) In addition to this, marketing of agricultural
produce should be given a priority by the policy
makers in the State. The State should also look
into the financial requirements of the farmers
arising out of introduction and implementation of
latest technologies in agriculture in order to raise
agricultural productivity in the State.
In a nutshell, application of latest technology and the
adoption of latest marketing techniques along with sound
financial management for meeting the agricultural
requirements of the State are the new emerging areas
related with Agriculture and allied sector in the economy.
The knowledge of the WTO trading regime, that is, rules
related with SPS, certification and standardisation of
agricultural products is also of vital importance in
achieving sustainable sectoral development.
The well-being of villages in Haryana in the category of
large States comes in the top spot along with Kerala,
Tamilnadu, Andhra Pradesh and Maharashtra. After the
inception of the State in 1966, the successive
Governments in Haryana seem to have given priority to
rural development. As a consequence of this, the poverty
in rural area has come down to 8.27 per cent in the year
1999-2000 whereas the overall poverty line of the total
population in the State happens to be 8.74 per cent. This
does not imply that the government did not pay attention
to urban areas. The people living below poverty line in
urban areas also have been only 9.9 per cent. Such a low
Chapter 3 • IDENTIFICATION OF CRITICAL ISSUES AND THE NEWLY EMERGING AREAS 195
percentage of people living below poverty line in rural
area itself speaks about the pace of the rural development
which has been achieved during the plan periods from
Fourth to Tenth Five Year plan. If the same trends of
growth rates on rural development further continue,
Haryana is likely to achieve an optimum level of rural
development with 0 per cent people living below poverty
line by the year 2012.
The most important issue involved in this is related to
the improvement in quality of life for which the State
should spend more money on the social sector variables
of the economy. In future, the State should encourage a
private initiative that is the participation of the private
sector in the overall development of the economy. This
issue will be dealt at length in Chapter 4.
The development in the State cannot be sustainable if
it is not accompanied by adequate and proper irrigation
facilities. Not only this, the floods in the State should also
be controlled. Haryana does not seem to have made
satisfactory progress in providing irrigation facilities to the
State farmers as the growth rate during the period 1967
to 2001 has been less than 2 per cent per annum. It is
only through other sources that the farmers in the State
have been able to get water for their crops that is through
diesel sets and electric sets (their personal tubewells and
pumping sets) etc. For ensuring better irrigation facilities
as well as power to the secondary and tertiary sector, the
State Government needs to develop a visionary and
Comparative advantage favouring strategy for the
generation and distribution of electricity.
The performance of energy sector in the State has been
good during the period but there appears a certain gap
which needs to be filled by the State in order to achieve
sustainable development in the energy sector. Though,
overall framework of the development of this sector
depends upon the policy of the Central Government and
also the developments at the International level, there is a
clear role for the State Government to optimise its
resources in this sector.
Another crucial sector of the economy is the transport
sector. The developments in this sector have been positive
but the efficiency of this sector is very crucial in exploiting
the advantages of Location Theory which have not been
fully exploited by the State. Theory of Location is
instrumental in reaping the advantage of globalisation.
The manufacturing sector in the State has performed
very well in terms of first indicator that is multilateral.
total factor productivity in registered manufacturing sector
is based on value-added function. The data in chapters 1
and 2 show that manufacturing sector in the State has
grown at an increasing rate during the period since 1980-
1981. On the basis of the four indicators of growth of
manufacturing sector, it can be concluded that
manufacturing sector has made progress in the State but
this progress cannot be said to be impressive. A critical
review of different industrial policies of the State since its
inception reveals that manufacturing sector has not got
adequate attention of the State in creating proper
investment climate in the State which served as a
constraint on its potential growth. The relative share of
secondary sector in the State vis-à-vis tertiary sector is not
at optimum level. It needs to be further increased as the
total factor productivity growth occurs more in this sector
which provides impetus to overall growth in the State.
The Centre as well as the State(s) should introduce
reforms in service sector to make growth human
development oriented. Ensuring basic health and
education facilities is the responsibility of the State. Only
a big budget is not enough: a larger proportion of the
budget of the State should be spent on education and
common man. As revealed by data in Chapter 1, the
growth of education at all levels that is primary, secondary
and higher has been significant. The scope of technical
education has also been widened. But, the quality of
education, its funding, linkages with industry and other
sectors of the economy needs to be improved and
strengthened. The educational institutions in the State
should be developed with the collaboration of private
sector. Women in the State should be empowered by
providing more health and education facilities. They
should also be provided with employment opportunities.
All this will help in raising the sex ratio in the State.
The overall literacy rate was 23.2 per cent in 1961 in
Haryana which became 55.85 per cent in 1991 and further
rose to 67.91 per cent in 2001. The female literacy rate
was only 11.1 per cent. Still Haryana has to travel a long
way in achieving 100 per cent rate of literacy in both the
sexes. Almost 50 per cent of the women are still illiterate
in the State and this is a big constraint in achieving
sustainable development in the State. The education
policy of the State needs to be ambitious and visionary as
education is crucial in making Haryana number one State
of the Indian federation.
Another very important issue is improving the
performance of existing SEZs and development of new
SEZs. The acquisition of land for establishing SEZs has
become a political issue and the negotiations with farmers
have come to a stalemate which needs to be resolved at
the earliest. Of late, the government of Haryana is
HARYANA DEVELOPMENT REPORT196
emphasising the establishment of new SEZs in the
economy which is a very good step but efforts should be
made to improve their performance so that these can
contribute to the employment and equitable distribution
of income among the masses. For this, new policy
initiatives are required keeping in view the international
trends.
3.2 Developmental Issues in Upcoming Areas
Under this sub-heading, we would analyse and discuss
in detail the developmental issues in newly emerging
areas in the 21st century in which State has a big potential,
keeping in view the latest changes in technology, methods
of organisation and more importantly the advancing stock
of knowledge related to these areas. The analysis reveals
that Haryana in order to become number one State in the
country should follow the ‘Comparative Advantage
Following’ strategy of Development to enhance its
competitive edge nationally or even internationally. It
implies that the production of goods and services should
be in accordance with the principle of comparative
advantage as it leads to optimum allocation of resources
in the State/regions.
3.2.1 Tourism (Heritage Tourism, Health Tourism, etc.)
Tourism in the modern times has emerged as one of
the potent economic activity that not only supplements
the conventional mode of economy but also brings plenty
of opportunities for the cultures and its people to improve
their material standards. It is this consideration that
sought greater emphasis on tourism development in
Haryana. Haryana can be described as a late entrant on
the tourism map of the country. Despite that, whatever
has been created and developed in the name of tourism
has left remarkable precedents owing mainly to utilisation
of strategic highways and close proximity to Delhi—the
major tourist market for the State.
The other consideration that necessitates tourism
development in the State is growing stagnation mainly in
the agriculture sector. The tourism development is viewed
to supplement the rural income by thrusting on the
concept of rural tourism and farm tourism. Though the
development of tourism in the State is no less than an
achievement keeping in view the fact that now the State
has 43 vacation spots or holiday stopovers where there
was none in the early seventies (Dharmarajan and Seth,
1997) but with the advent of socio-economic changes
particularly after the nineties the achievement is no longer
a solace provider.
Tourism Development
The tourism development in the State, in view of
above stated background, is to be judged on the basis of
two major parameters. Firstly, its capability to produce
the tourists, and secondly, the attractions it inherits
having the potential to attract the tourists. The first
parameter seeks to explore the specific kind of living
conditions in an area that impels or motivates the people
to go for travel. Industrialisation, urbanisation, business
growth, disposable incomes and time, stressful and tense
living conditions and styles prepare a market of the
tourists who are anxious to visit the places which can
provide them some pleasant experiences which hitherto
were not available in the beat area. The industrialisation
in Haryana has witnessed a polarised growth mainly in the
areas of Gurgaon and Faridabad districts whereas the
other districts, despite government’s concerted efforts,
could not evoke the same response. The ‘Delhi factor’ i.e.
close proximity of these areas to Delhi metropolitan put
them in advantage over other areas. Delhi, being a highly
urbanised and industrialised centre qualifies to be treated
as the potential tourist producing market and the Haryana
tourism has been greatly benefited by this character of
Delhi. In a nutshell, these areas are forming a second ring
of industrialisation around the Delhi Metro becoming
eligible as tourist producing market. The other parts of
the State too are gradually receiving the percolation of
impacts of industrialisation like Rohtak and Sonipat who
are next to the Gurgaon-Faridabad ring (Boora, 2002).
The G.T. Road, besides the ‘Delhi factor’, is another
lifeline to the State’s development with the growth of
major towns like Panipat, Karnal and Ambala. Though the
metro-like character of these cities is yet to come but for
being centres of trade, culture and administration they
have developed as hub of economic activities. Though
nearly similar pattern exists in other cities as well, mainly
the cities along the sides of State highways but have
limited trade or the economic opportunities as compared
to the cities along the G.T. Road. Broadly, three layers of
development of the cities can be seen in Haryana. First,
areas around Delhi, secondly the areas (cities) on the G.T.
Road and thirdly, the cities on the State highways.
Though all these areas or the population in these areas
qualify to be included in the middle class—a class of
potential tourists, but all are not contributing in the same
weight and size to form a tourist producing market.
Despite the economic similarities, the differences in the
living conditions and the styles distinguish Delhi and
adjoining areas from other areas in the State. Overall,
Chapter 3 • IDENTIFICATION OF CRITICAL ISSUES AND THE NEWLY EMERGING AREAS 197
Haryana has to remain dependent on Delhi to ensure the
supply of the tourists.
Tourism Types and Resources
Highways
Since highway tourism is the most popular type of
tourism in Haryana, the major resource for that comes in
the form of highways passing through the State. Five most
important National Highways pass through the Haryana
State covering 1468 km. and crossing 15 of the 20
districts of Haryana. 3000 km of state highway network
crisscross the State.
NH No.1 in Haryana is 180 kms long, 4 lane metalled
all weather road, entering Haryana from Delhi at Kundli
Border and going upto Punjab border crossing Panipat,
Karnal, Kurukshetra, and Ambala. This is the lifeline of
Haryana and single entry point to the States of Punjab,
J&K, Himachal and UT of Chandigarh.
NH No.2 in Haryana is 74 kms in length crossing
Faridabad District and going towards the world famous
city of Agra crossing Mathura-Vrindavan twin towns—
birth place of Lord Krishna and Radha.
NH.No.8 in Haryana is also around 101 kms in length,
4 lane crossing three districts of Gurgaon, Rewari and
Narnaul going towards the Pink City of Jaipur—the land
of Forts and Rajas.
NH No.10 in Haryana is the longest, covering 313 kms
from Bahadurgarh to Dabwali in Sirsa district crossing
districts of Rohtak, Hisar and Fatehabad in between and
going upto Abohar Fazilka, the border district of Punjab
and Pakistan.
These Highways are emerging as centres of
development in the State because of increase in traffic on
them and resulting in complex interplay of a number of
economic factors. Technically, the Highway tourism is not
consistent with the conventional definition of tourism,
which is primarily based on the components of
accessibility, accommodation and attraction. Rather
Highway tourism signifies the availability of certain
facilities for the tourists who commute between two
destinations. These facilities range from food,
entertainment, recreation, roadside attractions to shopping
Malls, petrol stations, medical facilities etc. In a way,
these Highways are emerging as the new mini markets or
the destinations, the driving on which is becoming an
attraction. Highways are no longer the roads made for the
purpose of transportation but are becoming the central
points around which a number of economic activities take
place.
Thus, it can be said that the main strength of Haryana
tourism is the Highway tourism, which is spread over the
entire State providing vacation spots or recreation spots to
the tourists. The network of the Highway tourism
comprises nearly 43 tourist complexes offering a variety of
services to the tourists. The various entertainment and
recreational facilities offered by Haryana tourism at its
complexes include the swimming pool, boating, angling,
zoo, children’s park, meditation hall, golf course, music
and dance programmes, sauna bath, and camel ride etc.
Cultural Tourism and Resources
In Haryana, the cultural resources comprise religious
and historical places, fairs and festivals, etc. The cultural
tourism in the State primarily rests upon three cultural
festivals, namely, Surajkund Craft Fair, Mahabharata
Festival at Kurukshetra and Kartik Festival at Ballabhgarh.
The Surajkund craft fair has formed a niche for itself in the
tourism market while the other two are yet to attain the
desired status. The Surajkund Craft Mela began in 1987
with a rural ambience. The scheme to play up a Mela theme
started in 1989 and continues till today. More than five
lakh people visit the Mela that, in turn, brings good amount
of revenue to the State. The Kartik festival is organised in
the premises of Nahar Singh Fort at Ballabhgarh in district
Faridabad. The fort is magnificently constructed and
carefully renovated and offers a distinct experience to the
tourists. Various cultural activities like dance, music,
puppetry, etc. are performed in the festival. The
Mahabharata Utsava is celebrated on the banks of holy
Brahma Sarovar. It is around one-week celebration and
lakhs of people pay visit to the festival and enjoy the
specially organised musical evenings besides other
entertaining activities.
Besides, there are a number of dances of Haryana that
can enthrall and rejuvenate the tourists on different
occasions. One of the important dances of Haryana is the
Phag dance, which is performed on the eve of Holi—the
festival of colours—by men and women together on the
sounds of Tasha, Nagara and Dhol. The Loor dance is
performed mainly by the women around Holi festival and is
more popular in the regions of Bangar and Bagar. Jhoomar is
another popular dance of Haryana, which has a closer
resemblance with the ‘giddah’ of Punjab. It is performed
throughout the State. Khora dance, like Jhoomar, is
performed exclusively by women folks on the occasion of
wedding festival and harvesting. Another dance i.e. Daph
dance is a mixed dance performed to the beats of daph—a
one-sided drum. It is associated with harvest and spring.
Another important dance of Haryana is the Gugga dance,
which is a ritualistic dance, performed in the memory of
HARYANA DEVELOPMENT REPORT198
Gugga pir (saint) who is worshipped not only in Haryana
but in Rajasthan, Punjab and Himachal Pradesh also.
Ghumar dance, which is popular also in Rajasthan, is quite
popular in some parts of Hisar and Bhiwani districts of the
State. The women devotees while on their way to temple
perform it.
Apart from culture, religion too provides scope for the
growth of pilgrimage tourism in the State. The most
important pilgrimage destination in Haryana is Kurukshetra
whose fame and divinity has spread across the country. The
divine aura of Kurukshetra covers an area of 48 kosas (92
sq. km), which hides in its fold 360 places of pilgrimage. It
was on this land that Lord Brahma created man and this
universe, says legends. It was at Kurukshetra that Lord
Krishna gave the sermon of holy Bhagwad Gita and where
the battle of Mahabharata was fought between the
Kauravas and Pandavas. Jyotisar is another important
attraction in the vicinity of Kurukshetra and is the
fountainhead of Gita philosophy. It is considered as the
most sacred spot reminiscent of the great battle of
Mahabharata. Pehowa, known as ‘Prthu-dak’ in the ancient
scriptures, is a great centre of pilgrimage and is associated
with many legendary personalities of our ancient times like
Rishi Vishwamitra, Vashishtha, Sukra and Manu. Pandu-
Pindara village in district Jind, is another important centre
of pilgrimage where it is believed that Pandavas solemnised
shraddha for all their kinsmen and others who sacrificed
their lives during the battle of Mahabharata. Kapal Mochan
is another place of religious and historical significance in
district Yamunanagar. Besides Hindus, the place is revered
by the Sikh pilgrims also. Mansa Devi temple in district
Panchkula is located on a hill top, in the picturesque
surrounding of Shiwalik ranges. Another religious place is
Agroha. Besides the pilgrimage centres discussed above,
plenty of other important pilgrimage centres exist in
Haryana belonging to different religions like Islam, Sikhism
etc.
Adventure Sports
Haryana tourism catapulted into the arena of adventure
sports with the forming of its Adventure Club in 1991. The
club brought in a promise of rock climbing at Surajkund and
Morni Hills, canoeing and kayaking in large water bodies at
Surajkund, Badkhal Lake, Damadama lake and Tilyar lake,
cycling expeditions in the Kalesar forests, camping at
Hathnikund, the Kalesar forest, Damdama and Tajewala,
white water river rafting down the Yamuna, mountaineering
and parasailing at Pinjore.
Farm Tourism
Haryana Tourism has taken the initiative to introduce
the concept of farm tourism in India. This is first-of-its-
kind in India. The Department of Tourism, in partnership
with 20 farm owners in Haryana, is offering special
country holiday packages in these chosen farms. The
farms are located in the lap of mother nature near Delhi
and offer their mystical beauty and charm to sooth away
modern day bruises and burnouts. One can experience the
lifestyle of a real India rich in age-old traditions, ethnic
arts and crafts. A brief account of these farms with their
locations and activities offered, will give an understanding
of the concept of this form of tourism.
The Surjivan Farm is located Opposite “Classic Golf
Resort” off New Delhi—Jaipur Highway. The activities
offered here are visits to Herbal Garden, Nakshatra
Vatika, Organic Farming, Vermi Compost and Bee
Keeping, Cattle Feeding, Cow milking, Tambola, Gilli
Danda, Kanche, Pitthoo, Archery, Tug-of-war, etc. Golden
Dunes Retreat is located in village Chandu, near
Sultanpur Bird Sanctuary. The activities offered are
croquet and golf, Splash Pools, Cow milking, Archery,
Kite flying; rides of Tractor/Bullock cart/Camel/Horse and
games like Vegetables hunt, Flower hunt, Adventure
sports, Volley ball, Hurdles and Treasure hunt.
Kalki Mysticis is located in village Garhi Harsu near
Sultanpur Lake Tourist Complex, district Gurgaon. It
offers participation in village visit, visit to a special tomb
destination of pious “Pir Baba’’ and Mata ka Mandir, Cow
milking, Kite flying etc. Rides of Tractor/Bullock cart are
also available. Herambh Aushadh is located in village
Kanwarsika, Sohna, district Gurgaon. It offers education
tour to herbal medicine manufacturing plant and activities
like Parasailing, Village sight seeing, Crafts, Dairy farms
and poultry farms. Anugrah vatika is located in village
Binola near Gurgaon on Delhi Jaipur Highway and
provides visit to the Village Cattle farm, Poultry farm,
Mushroom farm and Honey bee farming. In addition, rides
of Tractor/Bullock cart are available along with Painting,
Kite flying.
Sheilma Farm is in village Khori Jamalpur, 1 km off
Ballabgarh-Sohna road near BSA Institute of Engineering &
Technology, District Faridabad and attraction offered are
village visit, small Swimming Pool Rides, bullock cart/
tractor rides, kite flying, marbles and bonfire.
Golden Creeper is in village Chandu near Sultanpur
Bird Sanctuary and provides activities like Splash Pool,
Croquette, Golf putting, Cow milking, Kite flying, Tractor
ride/Bullock cart/Camel ride/Horse ride, Vegetables/
Flower/Treasure hunts, and Volley ball, Hurdles, Table
tennis, Baseball, Tug-of-War, Tambola, Gilli-danda. Prakriti
Farm, Village Gailpur, Palwalnuh Road offers a number of
activities mainly village sight seeing, Bullock cart/Tractor/
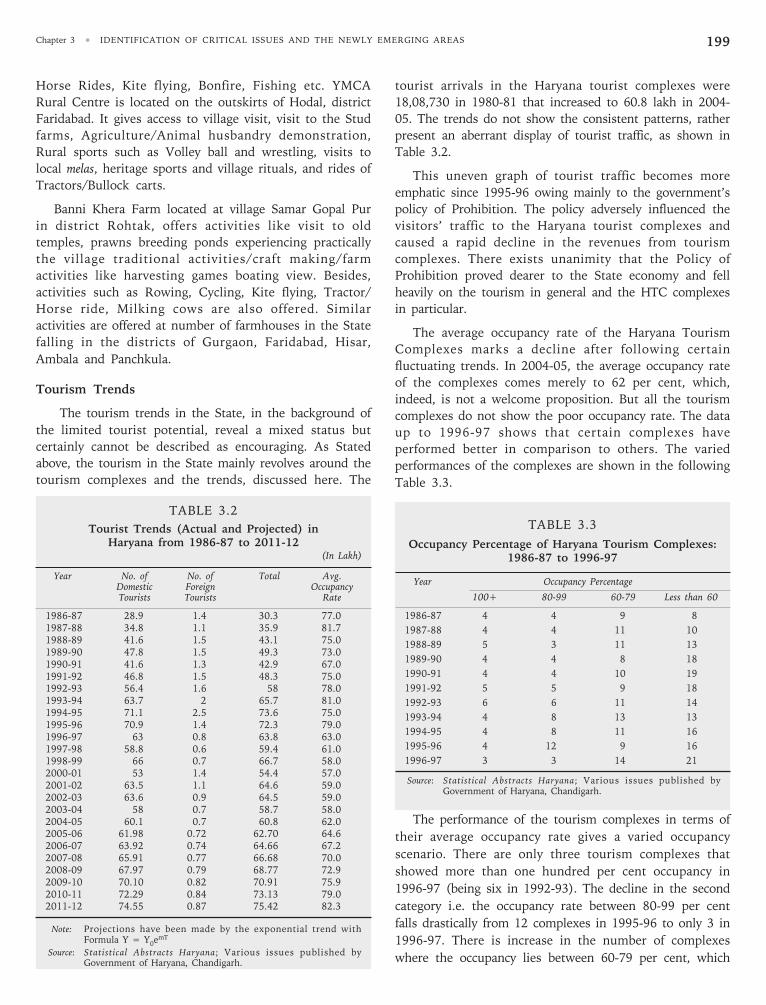
Chapter 3 • IDENTIFICATION OF CRITICAL ISSUES AND THE NEWLY EMERGING AREAS 199
tourist arrivals in the Haryana tourist complexes were
18,08,730 in 1980-81 that increased to 60.8 lakh in 2004-
05. The trends do not show the consistent patterns, rather
present an aberrant display of tourist traffic, as shown in
Table 3.2.
This uneven graph of tourist traffic becomes more
emphatic since 1995-96 owing mainly to the government’s
policy of Prohibition. The policy adversely influenced the
visitors’ traffic to the Haryana tourist complexes and
caused a rapid decline in the revenues from tourism
complexes. There exists unanimity that the Policy of
Prohibition proved dearer to the State economy and fell
heavily on the tourism in general and the HTC complexes
in particular.
The average occupancy rate of the Haryana Tourism
Complexes marks a decline after following certain
fluctuating trends. In 2004-05, the average occupancy rate
of the complexes comes merely to 62 per cent, which,
indeed, is not a welcome proposition. But all the tourism
complexes do not show the poor occupancy rate. The data
up to 1996-97 shows that certain complexes have
performed better in comparison to others. The varied
performances of the complexes are shown in the following
Table 3.3.
TABLE 3.3
Occupancy Percentage of Haryana Tourism Complexes:1986-87 to 1996-97
Year Occupancy Percentage
100+ 80-99 60-79 Less than 60
1986-87 4 4 9 8
1987-88 4 4 11 10
1988-89 5 3 11 13
1989-90 4 4 8 18
1990-91 4 4 10 19
1991-92 5 5 9 18
1992-93 6 6 11 14
1993-94 4 8 13 13
1994-95 4 8 11 16
1995-96 4 12 9 16
1996-97 3 3 14 21
Source: Statistical Abstracts Haryana; Various issues published byGovernment of Haryana, Chandigarh.
The performance of the tourism complexes in terms of
their average occupancy rate gives a varied occupancy
scenario. There are only three tourism complexes that
showed more than one hundred per cent occupancy in
1996-97 (being six in 1992-93). The decline in the second
category i.e. the occupancy rate between 80-99 per cent
falls drastically from 12 complexes in 1995-96 to only 3 in
1996-97. There is increase in the number of complexes
where the occupancy lies between 60-79 per cent, which
TABLE 3.2
Tourist Trends (Actual and Projected) inHaryana from 1986-87 to 2011-12
(In Lakh)
Year No. of No. of Total Avg.Domestic Foreign OccupancyTourists Tourists Rate
1986-87 28.9 1.4 30.3 77.01987-88 34.8 1.1 35.9 81.71988-89 41.6 1.5 43.1 75.01989-90 47.8 1.5 49.3 73.01990-91 41.6 1.3 42.9 67.01991-92 46.8 1.5 48.3 75.01992-93 56.4 1.6 58 78.01993-94 63.7 2 65.7 81.01994-95 71.1 2.5 73.6 75.01995-96 70.9 1.4 72.3 79.01996-97 63 0.8 63.8 63.01997-98 58.8 0.6 59.4 61.01998-99 66 0.7 66.7 58.02000-01 53 1.4 54.4 57.02001-02 63.5 1.1 64.6 59.02002-03 63.6 0.9 64.5 59.02003-04 58 0.7 58.7 58.02004-05 60.1 0.7 60.8 62.02005-06 61.98 0.72 62.70 64.62006-07 63.92 0.74 64.66 67.22007-08 65.91 0.77 66.68 70.02008-09 67.97 0.79 68.77 72.92009-10 70.10 0.82 70.91 75.92010-11 72.29 0.84 73.13 79.02011-12 74.55 0.87 75.42 82.3
Note: Projections have been made by the exponential trend withFormula Y = Y
0emT
Source: Statistical Abstracts Haryana; Various issues published byGovernment of Haryana, Chandigarh.
Horse Rides, Kite flying, Bonfire, Fishing etc. YMCA
Rural Centre is located on the outskirts of Hodal, district
Faridabad. It gives access to village visit, visit to the Stud
farms, Agriculture/Animal husbandry demonstration,
Rural sports such as Volley ball and wrestling, visits to
local melas, heritage sports and village rituals, and rides of
Tractors/Bullock carts.
Banni Khera Farm located at village Samar Gopal Pur
in district Rohtak, offers activities like visit to old
temples, prawns breeding ponds experiencing practically
the village traditional activities/craft making/farm
activities like harvesting games boating view. Besides,
activities such as Rowing, Cycling, Kite flying, Tractor/
Horse ride, Milking cows are also offered. Similar
activities are offered at number of farmhouses in the State
falling in the districts of Gurgaon, Faridabad, Hisar,
Ambala and Panchkula.
Tourism Trends
The tourism trends in the State, in the background of
the limited tourist potential, reveal a mixed status but
certainly cannot be described as encouraging. As Stated
above, the tourism in the State mainly revolves around the
tourism complexes and the trends, discussed here. The
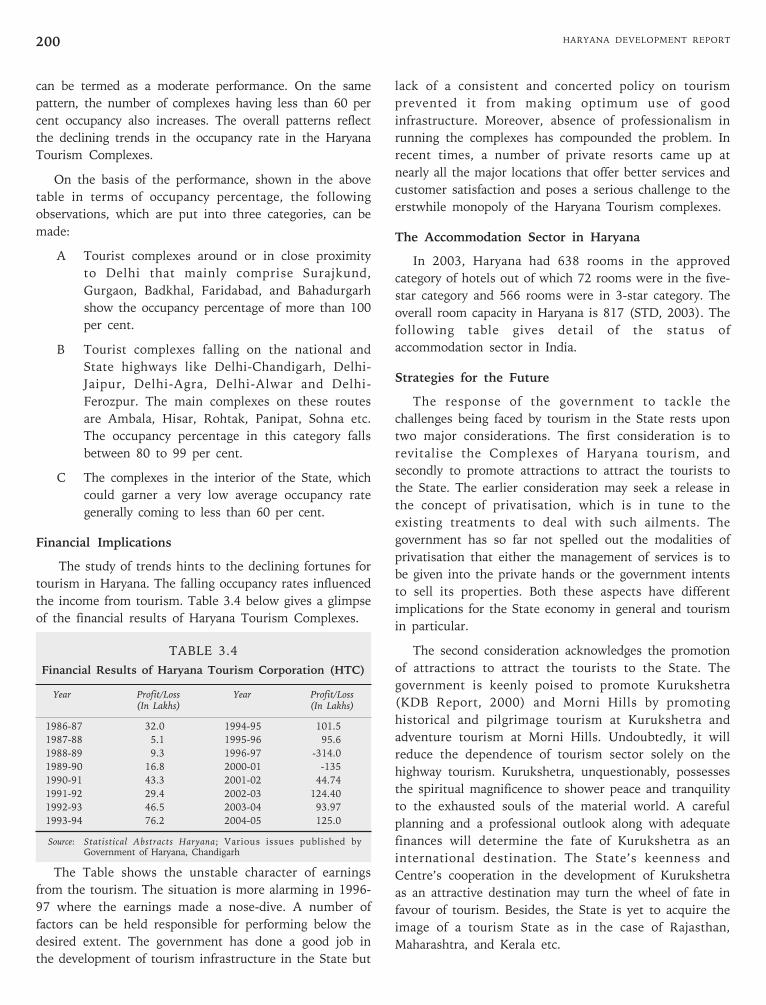
HARYANA DEVELOPMENT REPORT200
can be termed as a moderate performance. On the same
pattern, the number of complexes having less than 60 per
cent occupancy also increases. The overall patterns reflect
the declining trends in the occupancy rate in the Haryana
Tourism Complexes.
On the basis of the performance, shown in the above
table in terms of occupancy percentage, the following
observations, which are put into three categories, can be
made:
A Tourist complexes around or in close proximity
to Delhi that mainly comprise Surajkund,
Gurgaon, Badkhal, Faridabad, and Bahadurgarh
show the occupancy percentage of more than 100
per cent.
B Tourist complexes falling on the national and
State highways like Delhi-Chandigarh, Delhi-
Jaipur, Delhi-Agra, Delhi-Alwar and Delhi-
Ferozpur. The main complexes on these routes
are Ambala, Hisar, Rohtak, Panipat, Sohna etc.
The occupancy percentage in this category falls
between 80 to 99 per cent.
C The complexes in the interior of the State, which
could garner a very low average occupancy rate
generally coming to less than 60 per cent.
Financial Implications
The study of trends hints to the declining fortunes for
tourism in Haryana. The falling occupancy rates influenced
the income from tourism. Table 3.4 below gives a glimpse
of the financial results of Haryana Tourism Complexes.
TABLE 3.4
Financial Results of Haryana Tourism Corporation (HTC)
Year Profit/Loss Year Profit/Loss(In Lakhs) (In Lakhs)
1986-87 32.0 1994-95 101.5
1987-88 5.1 1995-96 95.6
1988-89 9.3 1996-97 -314.0
1989-90 16.8 2000-01 -135
1990-91 43.3 2001-02 44.74
1991-92 29.4 2002-03 124.40
1992-93 46.5 2003-04 93.97
1993-94 76.2 2004-05 125.0
Source: Statistical Abstracts Haryana; Various issues published byGovernment of Haryana, Chandigarh
The Table shows the unstable character of earnings
from the tourism. The situation is more alarming in 1996-
97 where the earnings made a nose-dive. A number of
factors can be held responsible for performing below the
desired extent. The government has done a good job in
the development of tourism infrastructure in the State but
lack of a consistent and concerted policy on tourism
prevented it from making optimum use of good
infrastructure. Moreover, absence of professionalism in
running the complexes has compounded the problem. In
recent times, a number of private resorts came up at
nearly all the major locations that offer better services and
customer satisfaction and poses a serious challenge to the
erstwhile monopoly of the Haryana Tourism complexes.
The Accommodation Sector in Haryana
In 2003, Haryana had 638 rooms in the approved
category of hotels out of which 72 rooms were in the five-
star category and 566 rooms were in 3-star category. The
overall room capacity in Haryana is 817 (STD, 2003). The
following table gives detail of the status of
accommodation sector in India.
Strategies for the Future
The response of the government to tackle the
challenges being faced by tourism in the State rests upon
two major considerations. The first consideration is to
revitalise the Complexes of Haryana tourism, and
secondly to promote attractions to attract the tourists to
the State. The earlier consideration may seek a release in
the concept of privatisation, which is in tune to the
existing treatments to deal with such ailments. The
government has so far not spelled out the modalities of
privatisation that either the management of services is to
be given into the private hands or the government intents
to sell its properties. Both these aspects have different
implications for the State economy in general and tourism
in particular.
The second consideration acknowledges the promotion
of attractions to attract the tourists to the State. The
government is keenly poised to promote Kurukshetra
(KDB Report, 2000) and Morni Hills by promoting
historical and pilgrimage tourism at Kurukshetra and
adventure tourism at Morni Hills. Undoubtedly, it will
reduce the dependence of tourism sector solely on the
highway tourism. Kurukshetra, unquestionably, possesses
the spiritual magnificence to shower peace and tranquility
to the exhausted souls of the material world. A careful
planning and a professional outlook along with adequate
finances will determine the fate of Kurukshetra as an
international destination. The State’s keenness and
Centre’s cooperation in the development of Kurukshetra
as an attractive destination may turn the wheel of fate in
favour of tourism. Besides, the State is yet to acquire the
image of a tourism State as in the case of Rajasthan,
Maharashtra, and Kerala etc.
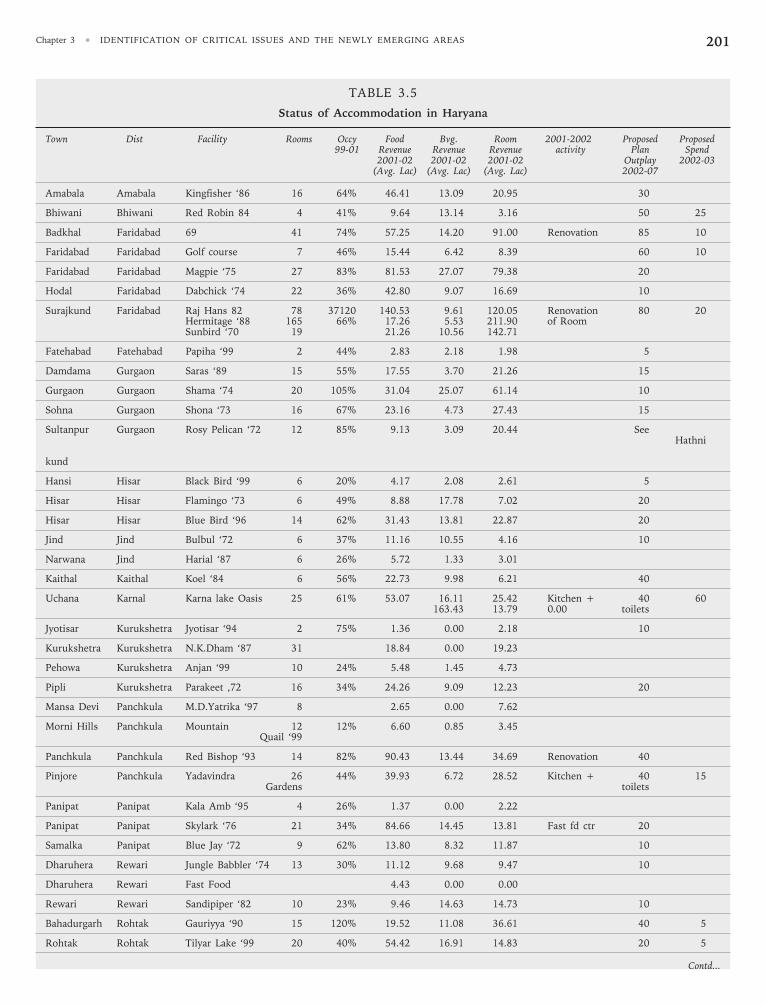
Chapter 3 • IDENTIFICATION OF CRITICAL ISSUES AND THE NEWLY EMERGING AREAS 201
TABLE 3.5
Status of Accommodation in Haryana
Town Dist Facility Rooms Occy Food Bvg. Room 2001-2002 Proposed Proposed99-01 Revenue Revenue Revenue activity Plan Spend
2001-02 2001-02 2001-02 Outplay 2002-03(Avg. Lac) (Avg. Lac) (Avg. Lac) 2002-07
Amabala Amabala Kingfisher ‘86 16 64% 46.41 13.09 20.95 30
Bhiwani Bhiwani Red Robin 84 4 41% 9.64 13.14 3.16 50 25
Badkhal Faridabad 69 41 74% 57.25 14.20 91.00 Renovation 85 10
Faridabad Faridabad Golf course 7 46% 15.44 6.42 8.39 60 10
Faridabad Faridabad Magpie ‘75 27 83% 81.53 27.07 79.38 20
Hodal Faridabad Dabchick ‘74 22 36% 42.80 9.07 16.69 10
Surajkund Faridabad Raj Hans 82 78 37120 140.53 9.61 120.05 Renovation 80 20Hermitage ‘88 165 66% 17.26 5.53 211.90 of RoomSunbird ‘70 19 21.26 10.56 142.71
Fatehabad Fatehabad Papiha ‘99 2 44% 2.83 2.18 1.98 5
Damdama Gurgaon Saras ‘89 15 55% 17.55 3.70 21.26 15
Gurgaon Gurgaon Shama ‘74 20 105% 31.04 25.07 61.14 10
Sohna Gurgaon Shona ‘73 16 67% 23.16 4.73 27.43 15
Sultanpur Gurgaon Rosy Pelican ‘72 12 85% 9.13 3.09 20.44 SeeHathni
kund
Hansi Hisar Black Bird ‘99 6 20% 4.17 2.08 2.61 5
Hisar Hisar Flamingo ‘73 6 49% 8.88 17.78 7.02 20
Hisar Hisar Blue Bird ‘96 14 62% 31.43 13.81 22.87 20
Jind Jind Bulbul ‘72 6 37% 11.16 10.55 4.16 10
Narwana Jind Harial ‘87 6 26% 5.72 1.33 3.01
Kaithal Kaithal Koel ‘84 6 56% 22.73 9.98 6.21 40
Uchana Karnal Karna lake Oasis 25 61% 53.07 16.11 25.42 Kitchen + 40 60163.43 13.79 0.00 toilets
Jyotisar Kurukshetra Jyotisar ‘94 2 75% 1.36 0.00 2.18 10
Kurukshetra Kurukshetra N.K.Dham ‘87 31 18.84 0.00 19.23
Pehowa Kurukshetra Anjan ‘99 10 24% 5.48 1.45 4.73
Pipli Kurukshetra Parakeet ,72 16 34% 24.26 9.09 12.23 20
Mansa Devi Panchkula M.D.Yatrika ‘97 8 2.65 0.00 7.62
Morni Hills Panchkula Mountain 12 12% 6.60 0.85 3.45Quail ‘99
Panchkula Panchkula Red Bishop ‘93 14 82% 90.43 13.44 34.69 Renovation 40
Pinjore Panchkula Yadavindra 26 44% 39.93 6.72 28.52 Kitchen + 40 15Gardens toilets
Panipat Panipat Kala Amb ‘95 4 26% 1.37 0.00 2.22
Panipat Panipat Skylark ‘76 21 34% 84.66 14.45 13.81 Fast fd ctr 20
Samalka Panipat Blue Jay ‘72 9 62% 13.80 8.32 11.87 10
Dharuhera Rewari Jungle Babbler ‘74 13 30% 11.12 9.68 9.47 10
Dharuhera Rewari Fast Food 4.43 0.00 0.00
Rewari Rewari Sandipiper ‘82 10 23% 9.46 14.63 14.73 10
Bahadurgarh Rohtak Gauriyya ‘90 15 120% 19.52 11.08 36.61 40 5
Rohtak Rohtak Tilyar Lake ‘99 20 40% 54.42 16.91 14.83 20 5
Contd...
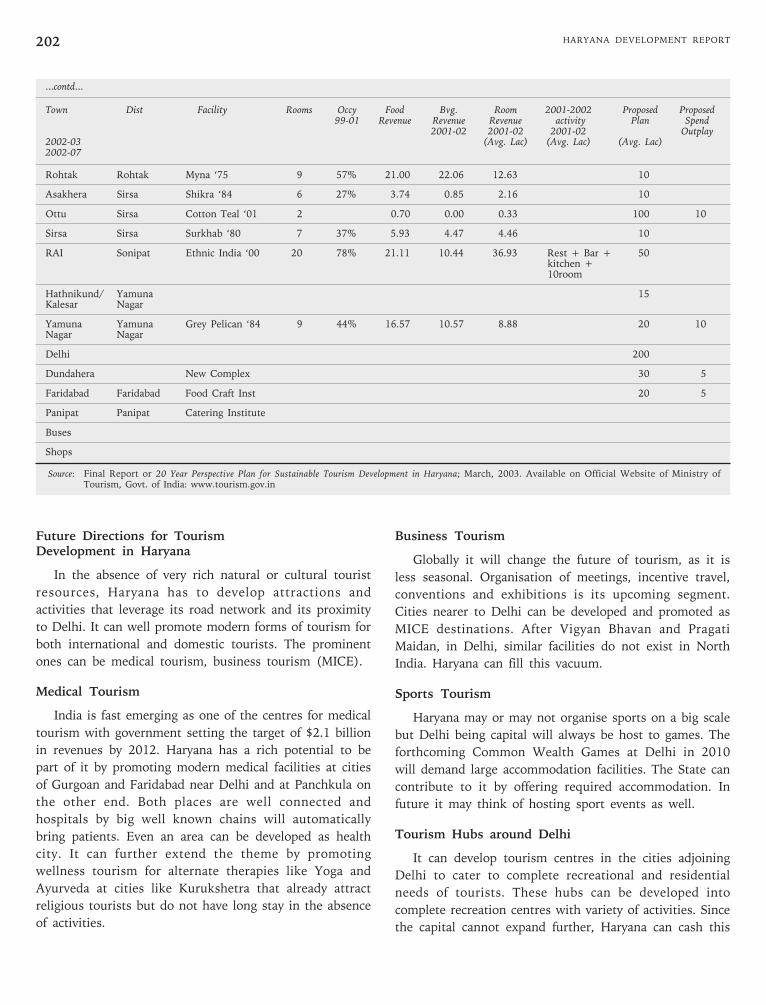
HARYANA DEVELOPMENT REPORT202
Future Directions for TourismDevelopment in Haryana
In the absence of very rich natural or cultural tourist
resources, Haryana has to develop attractions and
activities that leverage its road network and its proximity
to Delhi. It can well promote modern forms of tourism for
both international and domestic tourists. The prominent
ones can be medical tourism, business tourism (MICE).
Medical Tourism
India is fast emerging as one of the centres for medical
tourism with government setting the target of $2.1 billion
in revenues by 2012. Haryana has a rich potential to be
part of it by promoting modern medical facilities at cities
of Gurgoan and Faridabad near Delhi and at Panchkula on
the other end. Both places are well connected and
hospitals by big well known chains will automatically
bring patients. Even an area can be developed as health
city. It can further extend the theme by promoting
wellness tourism for alternate therapies like Yoga and
Ayurveda at cities like Kurukshetra that already attract
religious tourists but do not have long stay in the absence
of activities.
Business Tourism
Globally it will change the future of tourism, as it is
less seasonal. Organisation of meetings, incentive travel,
conventions and exhibitions is its upcoming segment.
Cities nearer to Delhi can be developed and promoted as
MICE destinations. After Vigyan Bhavan and Pragati
Maidan, in Delhi, similar facilities do not exist in North
India. Haryana can fill this vacuum.
Sports Tourism
Haryana may or may not organise sports on a big scale
but Delhi being capital will always be host to games. The
forthcoming Common Wealth Games at Delhi in 2010
will demand large accommodation facilities. The State can
contribute to it by offering required accommodation. In
future it may think of hosting sport events as well.
Tourism Hubs around Delhi
It can develop tourism centres in the cities adjoining
Delhi to cater to complete recreational and residential
needs of tourists. These hubs can be developed into
complete recreation centres with variety of activities. Since
the capital cannot expand further, Haryana can cash this
...contd...
Town Dist Facility Rooms Occy Food Bvg. Room 2001-2002 Proposed Proposed99-01 Revenue Revenue Revenue activity Plan Spend
2001-02 2001-02 2001-02 Outplay2002-03 (Avg. Lac) (Avg. Lac) (Avg. Lac)2002-07
Rohtak Rohtak Myna ‘75 9 57% 21.00 22.06 12.63 10
Asakhera Sirsa Shikra ‘84 6 27% 3.74 0.85 2.16 10
Ottu Sirsa Cotton Teal ‘01 2 0.70 0.00 0.33 100 10
Sirsa Sirsa Surkhab ‘80 7 37% 5.93 4.47 4.46 10
RAI Sonipat Ethnic India ‘00 20 78% 21.11 10.44 36.93 Rest + Bar + 50kitchen +10room
Hathnikund/ Yamuna 15Kalesar Nagar
Yamuna Yamuna Grey Pelican ‘84 9 44% 16.57 10.57 8.88 20 10Nagar Nagar
Delhi 200
Dundahera New Complex 30 5
Faridabad Faridabad Food Craft Inst 20 5
Panipat Panipat Catering Institute
Buses
Shops
Source: Final Report or 20 Year Perspective Plan for Sustainable Tourism Development in Haryana; March, 2003. Available on Official Website of Ministry ofTourism, Govt. of India: www.tourism.gov.in
Chapter 3 • IDENTIFICATION OF CRITICAL ISSUES AND THE NEWLY EMERGING AREAS 203
opportunity. It can even develop its properties in Delhi for
this purpose.
Eco Tourism
It is the buzz word in tourism globally. To promote
eco tourism in the State its understanding has to be
changed. If it is taken as sustainable tourism developed
for nature based areas then the scope is limited, but if it
is taken as an approach to all forms of tourism, it
definitely needs to be taken on priority to prolong the life
of all other forms of tourism mentioned above.
All the above may require initial concessions regarding
land availability and tax holidays. But later it will pump
the economy. Eco tourism shall be given more incentives
as it initially increases the costs for the consumer but
saves resources for future generations.
Problems of Tourism Development in Haryana
The State begun well by positioning itself in highway
tourism through Haryana Tourism Corporation but with
the development of the more and better highways,
consumers have been shifting towards private facilities. It
is evident from the falling occupancy figures of the
tourism corporations and increase in the number of
private service providers on the highways. But overall
tourism has been growing in the State. The major
problems of tourism development in the State are:
Absence of Long Term Plan on Tourism
A plan is required projecting the attractions and
activities to be promoted, visitors expected, and marketing
plans to ensure visitors, well defined role of public and
private players. A policy statement and action plan is
urgently needed.
Absence of Measurement of Tourists
The tourist arrival figures are based on visits to
Haryana Tourism Complexes and taking it as tourist
arrivals is too far fetched. A mechanism to estimate
number of tourists is needed for developing tourism
plans. As per the figures of NHAI toll bridge at Karnal,
30,000 vehicles cross it every day. Out of this 15,000 are
cars and similar vehicles and, 15,000 buses, trucks etc. If
a part of it comes as tourists the numbers would be
impressive. But more precise calculations are required at
major points.
Absence of Assessment of Impacts of Tourism
The impacts and costs associated with tourism are not
properly assessed for lack of adoption of tourism satellite
accounting systems. This is being promoted by World
Tourism Organisation and is being adopted the world
over. Government of India too is encouraging its
adoption. If used, this can provide fairly accurate idea of
contribution of tourism to the economy and can then get
appropriate weightage.
Non-Participation of Locals in Tourism
Active involvement of local population is critical for
the success of tourism venture like rural and farm
tourism. Proposed Rural tourism project at Jyotisar is yet
to take off and a Kerala like model to empower local
bodies can go long way in adopting similar projects and in
integrating it with other economic activities.
No field can progress without research and it applies
to tourism too. Continuous research is required to find
the changing tastes and behaviour of tourists. Internet
search gives access to only one detailed research by
Ministry of Tourism, Govt of India in 2001. More research
is required to highlight potential areas of development in
the State. Haryana Government should take initiative to
establish a research institute for the full exploitation of
tourism potential in the State.
There is an isolated growth of tourism in the State that
has prevented tourism to grow as a significant economic
activity. Intensive and extensive work plan to utilise the
cultural and commercial character of the region for
tourism is the need of the time. The further strengthening
of Highway tourism, proper grooming and marketing of
its three major festivals i.e. Surajkund, Kartik and Geeta
Jayanti festivals, a planned, professional and
comprehensive development of Kurukshetra and Morni
Hills, development of spots exclusively for recreation and
pleasure—all can pave way to contribute significantly to
the State’s economy.
3.2.2 IT Kiosks
We are in the beginning stage of IT revolution. It will
take decades before any significant number of households
can afford an Internet connection in the country. If we
succeed in developing the content or knowledge bases that
are useful to our farmers and peasants, small businesses,
weekly markets, dairies, and handicrafts, then just as the
public telephone is helping people to communicate
globally, so will the private and public Internet connections
enable our people to access the millions of ‘electronic
libraries’. The use of information and communication
technology (ICT) in the rural areas is a strategic move to
overcome many of planning and implementation problems.
It is generally observed that information asymmetries
HARYANA DEVELOPMENT REPORT204
amongst bargainers lead to costly delays and stalemates in
modern economic set-up. Market forces, as have been
evolved, generally succeed in bringing together certain
interests at specific levels but they fail when the transaction
costs are high. Investment in ICT infrastructure can help to
reduce these transaction costs for those who cannot pay
them. So the knowledge can become a means of power if
coalitions or networks of relevant actors evolve.
Computerisation of mandal revenue offices in a specific
State such as in Andhra Pradesh, and application of
information and communication technology for postal
services and health care system in rural areas and Honey
Bee-Network database are some of the examples of
specific attempts of computerisation made in the recent
past. Moreover, since 1995 the All India Society for
Electronics and Computer Technology has been
implementing an All India Coordinated Programme to set
up multipurpose electronics and computer centres in rural
and tribal areas of the country. Considering the use of
information and communication technology and its
application in rural areas, such as in decision to support
public administration, improving services to citizens and
empowering citizens to access information and
technology, the style of public administration has changed
substantially. Public administrators now focus primarily
on improving planning and monitoring development
programmes. The emphasis has been more on automating
the process of delivering services to citizens and to bring
about transparency in the system. The use of ICT can
provide up to date information on various aspects of rural
development programmes and can help in increasing the
bargaining power between the consumers and producers.
This would, in effect, reduce the role of the middleman on
one hand and improve productivity on the other. A large
number of innovations in farm practices, tool designs and
use of indigenous methods do not diffuse beyond local
boundaries because of the constraint of communication.
The use of ICT and web technologies now would make
visible the benefits of indigenous technologies to large
cross section of rural communities.
There is another area in which the impact of ICTs is
being felt is the social sectors such as health, education
and rural development in India. The technological
convergence of information technology, tele-
communication and entertainment electronics can open up
new vistas in the life of common man and the rural-urban
differences can be reduced to a minimum.
In a supra-national space, due to the impact of
globalisation, developing economies are increasingly at the
mercy of the international organisations who sometimes
profess to act as a countervailing force to international
trade and financial interests and at times undermine the
role of representative local bodies. This has brought about
the problems of accountability of the institutions. With
the necessary political orientation and support, ICT now
definitely form part of the developmental planning to
bridge the gap that may exist between different levels of
relations. The State should help to build up the
infrastructure required and assist in every possible
manner for changes in technology and organisation that
are needed for broad based processes of social and
economic transformation. The extended scientific activity
would enable the State to meet many of the objectives of
‘decentralised development planning’.
ICT can enhance the capability of the poor and help to
strengthen local level institutions by making them more
autonomous and less dependent on the State-coordinated
bodies. It can also help in increasing the bargaining power
between the producers of different goods and services and
can play an important role in extension education and
transparency in government expenditure, in improving the
health care system and in many other areas. But the job
would remain incomplete unless the demands are made
from below and local level institutions are strengthened to
behave in more responsible manner to solve the problems
of the poor who are constrained structurally by different
social and geographical conditions.
The State must be supportive in implementing the
redistribute policies more effectively by responding to the
needs of different communities. For instance, the
conditions of the poor in the tribal belt of hill-forest
regions are different from the conditions of poor people
who reside in the plain areas and therefore, there is a
need to organise ICT programmes keeping in view the
needs of different communities. Under these
circumstances, giving more voice to the poor and inducing
them to get involved in local self-governing institutions
for management of the local resources seem to be the
only choice. Technologies accompanied by institutional
reforms would help realising this objective and then the
scope of democracy would not be limited to voting but
would be extended to enable the citizens ‘to enjoy the
conditions for effective participation, enlightened
understanding and the setting of the political agenda’.
The Central Government plans to roll out ‘common
service centres’ or IT kiosks in one lakh villages across the
country by 2007 as part of the National e-Government
Plan. The National e-Government Plan is aimed at
improving the quality, accessibility and effectiveness of
government services to citizens and businesses with the
Chapter 3 • IDENTIFICATION OF CRITICAL ISSUES AND THE NEWLY EMERGING AREAS 205
help of ICT (information and communication
technologies). It has eight components and 26 mission
mode projects to be executed over a four-year period.
Mission mode projects comprise projects under the
Central Government, the State departments, and
integrated projects which involve multiple ministries,
departments or agencies. The Central Government
projects cover programmes such as national ID, central
excise, income tax, DCA-21, passports/visa and
immigration, pensions, banking and insurance, while the
State level projects include land records, property
registration, transport, agriculture, municipalities, gram
panchayats, commercial taxes, treasuries, police and
employment exchange. The integrated projects include
e-business, common service centres, India portal,
e-procurement and e-courts.
People living in far-flung villages will soon be able to
avail themselves of a slew of services ranging from
procuring land records to getting caste certificates for jobs
at the click of a mouse. The Department of IT will move a
proposal to the Cabinet on the approach and modalities
for the e-government plan including the implementation
framework, the types of services to be offered and the
roll-out plan for these kiosks for an integrated delivery of
government services.
The plan is to establish such kiosks in one lakh
villages in a ‘honeycomb model’, which means one out of
every six villages will house a common service centre
where people can avail themselves of a host of services
including searching for land records, getting grievances
addressed, procuring caste certificate for jobs or even
checking their children’s results online.
In the first phase, a State Wide Area Network (SWAN)
shall be set up and a sum of Rs. 3,300 crores has been
allotted by the Planning Commission. Over 17 States
including Tamil Nadu, Karnataka, West Bengal and
Uttarakhand have started implementing it and most of
them have been allocated the funds. SWAN is a digital
link on which the services will ride. It can be used to
assign a unique identity for individuals in BPL families to
better target the delivery of government welfare and other
programmes for the poor.
The State can take lessons from Rajiv Internet Village
Programme by Andhra Pradesh, Bhoomi Programme of
Karnataka, Bangalore, the Karnataka Government’s E-
Governance Initiative, and other low-cost small projects
for rural communication like Akshaya project in Kerala or
DakNet, ITC’s e-Choupal effort, The Telemedicine project
Gyandoot, The Hole in the wall experiment by NIIT etc.
Various recommendations from these programmes are
given further.
The objective is to enhance Internet usage in villages
for providing a range of services useful to the farmers,
rural poor and downtrodden sections of the society. The
programme will improve the quality of life of rural people
by providing them with IT enabled education, health care,
and better governance. The technology shall be useful for
rural citizens in increasing their agricultural yields,
enhancing their income levels, and to lead a comfortable
and decent life.
The IT Kiosk programme for Haryana should have
three broad components:
a. Electronic delivery of services through at least
1000 rural kiosks, that is, for every six villages
there should be one IT Kiosk centre.
b. Computer literacy to at least one person in each
family in rural areas
c. Broadband connectivity up to all villages by 2007
Rural kiosks should deliver a host of services related to
Agriculture, Health, Education, Gram Panchayats, Rural
development and welfare schemes and collection of power
bills, taxes etc., The wide usage of hindi in Information
Technology should be promoted. Establishment of IT
kiosks shall be a profitable business. The setup cost of the
kiosks can be recovered in less than one year. The
profitability increases with increase in number of
databases attached with the kiosks. They can also create
number of jobs for the data entry operators if the creation
of databases is outsourced to the external agencies. Thus
it is a means of livelihood as well a channel for delivery of
Government services and information. These kiosks can
render immense benefit to rural citizens like:
a. Easy access to information on agriculture,
education, health etc.,
b. Market prices, cropping pattern, weather forecast,
agriculture extension
c. Agricultural marketing: getting better prices for
produce
d. Examination results, Computer assisted learning
e. Health extension and immunisation through
UNICEF, telemedicine with the help of hospitals
etc.,
f. Access to all forms, copies of land records,
applications, certificates etc.
g. Collection of bills: electricity, telephone, power,
water, phone bills, property tax, RTO, etc.,
HARYANA DEVELOPMENT REPORT206
h. Registration of vehicles certificates
i. Private insurance services
j. Proof of ownership of landholding from
computerised land records
k. A disaster recovery service, and a third party audit,
besides the air-conditioned ambience with a TV
set, coffee vends, an ATM and a library,
l. New services such as railway reservations, filing
income-tax, cinema tickets, matrimonials, and bus
passes.
The motivation and commitment to telemedicine in
developing countries is very strong. This motivation is
often backed by a willingness to pay for systems which are
expected to improve health outcomes and lower medical
costs in the long run. Telemedicine services may be
perceived as more of a necessity in developing countries
than they are in the industrialised countries, resulting in a
greater willingness among the former to change
established methods of doctor-patient interaction and
health care administration.
The establishment of IT kiosks is a profitable business
for the governments also. The profitability increases with
more and more number of databases attached to the IT
kiosk centers. The governments are generally slow in
preparing the databases that leads to the increase in project
completion time causing increased costs and seriously hurts
the viability of business. Haryana government should
outsource all activities of preparing and maintaining of
databases to private parties. Even the services to the
citizens should also be provided by the private parties. The
government officials can be used for validating and
authenticating the information sold to the users. Strict
quality standards should be established for providing easy,
timely, cost-effective and reliable service to the IT Kiosk
users.
E-Governance Initiatives in Haryana
Government of Haryana has taken the following steps in
the year 2006 to promote E-Governance in the State:
(i) Major e-governance Applications Implemented in Haryana
State Government Mission Mode & Other Important e-
Governance Projects:
Land Records: HALRIS: Haryana Land Records
Information System at all districts, On-line Nakai Services
(Copy of Records-Of-Right) through HALRIS launched on
http://jamabandi.nic.in.
Property Registration: HARIS: Haryana Registration
Information System at 100 per cent sites.
Commercial Taxes: VATMaCS: Value Added Tax
Monitoring, Assessment & Collection System at all
districts. Integration of VAT system with treasuries and
multiple bank branches.
Gram Panchayats: BPL census survey, Web site of Rural
Development Department, Web enabled rural soft for
DRDA schemes, MIS, IT Plan of Panchayat Department.
MPs Local Area Development Scheme MIS.
Municipalities: HACIS: House Tax Assessment &
Collection Information System and Birth & Death
Certificates Issuing System. Software for Base Line Survey
under total sanitation campaign.
Treasuries: OTIS: On-line Treasuries Information
System at 100 per cent treasuries.
Road Transport: Driving Licence Software/“Sarthi” &
Vehicle Registration Software/“Vahan” at 30 locations.
Agriculture: DACNET projects and AgRIS project.
AGMARKNET projects at all 106 mandies, 135 officials of
Market Committees trained under AGMARKNet project.
Visiting South African delegation appreciated
AGMARKNET in Haryana. Web Portal for HSAMB.
Police: Suite of seven application software packages for
police network completed and 150 police personnel
trained on suite.
Employment Exchange: Registration & Vacancy Booking
System implemented.
Health Care: Suite of Software packages under of e-
Health Net implemented at CMOs.
Social Welfare: HaPPIS: Haryana Pensions Processing &
Information System for more than 12 lakh pensioners.
Interactive web portal. IGDS Scheme Monitoring, Web
portal of Women & Child Development, IT Plan of WGD
department
Education: Technical: Students Information &
Examination System, Web enabled MIS for Polytechnics,
Interactive website, Secondary: Transfer Requests
monitoring with integration to teachers PIS, 7th All India
Education Survey, Web enabled all School exams results,
admit cards, provisional certificates & result through
binocular. GGG-CAPES, Engineering Admissions
Counseling, ICT consultancy to universities.
Administration: Standard Suite of G2G Packages (PIS,
Payroll, Oak, Court Cases, Budget Control), CefMaTIS:
Chapter 3 • IDENTIFICATION OF CRITICAL ISSUES AND THE NEWLY EMERGING AREAS 207
Centralised File Movement and Tracking Information
System,
CORD: Computerisation of Revenue Department Suite
of G2G packages. Integrated web enabled Rooms
Reservation System for Haryana Bhawan .
Haryana Assembly Elections 2005: Duty Assignment and
Randomisation of Polling booths implemented for all 90-
assembly constituencies in Haryana. Extensive ICT
support to Haryana Panchayat Elections and Municipalities
elections. Dynamic websites of Haryana Vidhan Sabha and
Websites for State Election Commissioner, CEO Haryana.
HI-FI.Net: Haryana Integrated Finance Network. Budget
Preparation & Releases System for Annual Budget 2006-
2007 in a workflow environment implemented, Web
enabled Loan & Advances Monitoring System, POL
(Petrol, Oil, Lubricants) Monitoring System, and Daily
Ways and Means Position Monitoring system.
e-Food Net: Web Enabled Food grains Procurement &
Storage Monitoring System.
Chief Minister’s Office: The Public Demands Tracking
System, Announcements Implementation System, Transfer
Requests Processing System, Oak Monitoring System,
Centralised File Movement & Tracking Information
System, Public Grievances Tracking & Monitoring System
implemented.
Web enabled Labour Court Cases Software got
developed and implemented.
Advocate General Office Court Cases Tracking &
Monitoring System.
PWD Works Monitoring System as a web enabled
application, including Letter of Credit (LaC) MIS
(ii) Integrated Services Projects
E-DISHA: Ekal Seva Kendra G2C information and
Transactional services project has been initiated at all
districts. The Urban E-DISHA centrals (around 80-100)
have been planned across the State in major towns/cities
through PPP “Model. CSCs Project: Common Services
Centres will be established at cluster of villages under the
CSC scheme of Govt of India. The e-readiness assessment
of the State for the CSCs has been completed.
Web Services: Integrated Public services on official web
portal of Haryana www.haryana.qov.in.Maintenance of web
sites of all districts and various departments/organisations.
The Haryana Government portal is being enhanced and re-
designed to add content management features.
Employees Portal: Dynamic web portal http://aqhrv.nic.in
for serving the retired and in-service government
employees. Around 125 lakh live records for 2.93
employees.
E-Procurement: State has planned to introduce the web
based e-Procurement system in a phased manner. The
adoption of the model suggested by Cabinet Secretariat
and Administrative Reforms Department Gal has been
approved by the State IT-PRISM. The business model is
being finalised.
(iii) ICT Infrastructure at State Capital and Districts
ICT Infrastructure & Network Services: The NIC has
established an Intranet at the Haryana Capital Chandigarh
with more than 1000 nodes. The Maintenance,
Management & Operations activities of LANs at 06 sites
in Chandigarh (Civil Secretariat, New secretariat, 30 Bays
Building, CM Office, Vidhan Sabha, High Court, Finance
Department), MAN at Chandigarh based on Wireless RF
Network & leased lines of BSNL, and dedicated Internet
gateways (WAN) based on VSATs & leased lines at State
Hq and FTDMNDirecway VSATs at all Districts are
managed on day-to-day basis.
ADHAAR (SWAN): The State Wide Area Network is
being established in the State through the funding from
DIT, MCIT, Govt of India on BOOT model. The RFP has
been prepared and the same is under finalisation. The
Vertical POPs and Horizontal Connectivity requirements
are being finalised for SWAN RFP. The RFP will be
released to press by the end of June 2006.
Haryana State Data Centre: SAN based Haryana State
Data Centre, with two TB storage capacity, has been
established at Haryana Civil Secretariat. Its operations are
managed on 7 days basis.
DAM A Based VC setup at Haryana Civil Secretariat.
NIC Centre has been established at new District
Mewat (Nuh). Now the district IT centres are operational
at 100 per cent districts of Haryana.
E-Mail & Telecommuting Services: Around 3500 e-mail
accounts on http://hry.nic.in e-mail server and HODs
services. E-mail services at districts through RAS
continued. All activities of e-mail server and users on
network managed. Extensive support on E-mail/lnternet
and Telecommuting services to HODs, Administrative
Secretaries and field functionaries.
(iv) Capacity Building and e-Governance Road Map
Around 3000 officials imparted Basic IT Awareness
HARYANA DEVELOPMENT REPORT208
Training and G2G Suite of packages operations training
during year 2005-06. The training is an on-going activity.
The Capacity Building Road Map has been prepared for
the State and submitted to GoL
The e-Governance future Road Map has been prepared
for the State and submitted to GoL
(v) Software Export
Haryana has been rated as an Aspiring Leader in e-
Governance Readiness Index of the Country.
The exponential growth has been recorded in IT/ITES
exports up from about Rs. 400 Crore during 1998-1999 to
Rs. 7300 Crore during 2004-05. There has been around
33 per cent increase in the export of IT/ITES during the
year 2006-07 over the last year. The State has been
ranked third after Karnataka and Tamilnadu in IT/ITES
exports turnover.
(vi) Centre Government Mission Mode and Other Importante-Governance Projects being implemented in Haryana
Passport: Network management and operations at
Regional Passport Office, Chandigarh being managed by
NIC Haryana. The PCIS (Passport Control and Issuing
System) and PIRS (Passport Index Retrieval System).
Centralised Passport Applications Acceptance System
(Web Pass) is being implemented at all districts. Web
Enabling of Passport Information System for acceptance of
on-line applications through Internet.
Customs & Excise: The system for on-line submission of
export papers by exporters and Import software
implemented at ICT Ballabhgarh.
E-Courts: District Courts: Workflow based Sub
Ordinate Courts Judicial Information System (SOCJIS) at
Panchkula and Ambala Standard, suite of legacy packages
at 14 district courts. Punjab & Haryana High Court
Project: New website of High Court http://
hiqhcourt.chd.nic.in launched by Hon’ble Chief Justice of
Punjab & Haryana High Court.
Planning: DISNIC-PLAN Phase-II pilot project at Jhajjar.
IISFM (Integrated Information System for Finance
Management) for FCIs. All India Education Survey Project
completed successfully.
PMGSY: Prime Minister Gramin Sarak Yojna
Monitoring at 21 locations, Rural Habitations—Drinking
Water Mission Project (www.ddws.nic.in).
CIPA project implementation is being coordinated for
22 Police stations
AgRIS project initiated for Rohtak District. The
AgrisNet project proposal is being prepared for
Agriculture department.
Department of Science & Technology Haryana
organised one day conference on Science & Technology
for overall development on 17.02.2006
In this conference, the following areas were identified
for inviting proposals from Universities/Institutions/
Organisations for grant-in-aid:
1. Biotechnology
• Conservation of germ plasm of endangered/
special species of plants.
• Promotion of Bio-Nanotechnology and its
application.
• Promotion of rural and conventional
Biotechnology.
• Tissue culture of datepalm, mehndi, jojoba etc.
• Promotion of neutraceuticals.
• Cataloguing the genetic diversity among plants,
microbes and animals.
• Screening of Indian herbs for potential
therapeutic use like anti viral and anticancer.
• Survey of Haryana for ascertaining the infection
rate of Hepatitis B & C and liver cancer deaths.
• Bioremediation.
• Promotion & popularisation of Bio-pesticides and
Bio-fertilisers.
• Projects on Nanotechnology
• Biogeography
2. Health
• Production of diagnostic and testing kits.
• Promotion of telemedicines through mobile/STD
booths.
• Genomics basic information/promotion in
colleges.
• Development of rapid diagnostic kits for detection
of adulterants/micro-organisms/toxins/chemical
residues in roods, milk and milk products, cereal
products and, animal feeds etcetera.
Chapter 3 • IDENTIFICATION OF CRITICAL ISSUES AND THE NEWLY EMERGING AREAS 209
3. Food Processing
• Food Processing, fortification, preservation,
transportation and general health foods.
4. Waste Management
• Waste Management.
• Post harvest management practices, checking of
waste.
5. Environment and Energy
• Conservation of water through water harvesting,
recycling, remediation and water quality
management. Double flush system may be made
compulsory.
• Environment impact assessment (includes total
energy and environment).
• Energy audit of industry, buildings etc. and
energy conservation, standardisation of
equipments to save energy.
• Fly ash utilisation techniques for specific product
developments.
• Popularising effective air-cooling system for
houses without the use of power supply.
6. Other Emerging Areas
• Technology for the promotion of sports.
• Summer internship at labs to science toppers.
• Setting up of Herbal Parle
• Training and extension programmes on new and
emerging technologies and science competition/
Olympiads.
• Government-Industry-Institute linkage on
exchange basis.
• Integrated planning for roads.
• Plantation of Jatropha besides railway tracks and
roads.
• Promotion of Science and Technology for
physically challenged.
• An advertisement is published in the leading
newspapers and Research & Development
proposals are invited from various universities/
institutions/organisations in Haryana and Delhi.
The Department of Science & Technology Haryana has
prepared a comprehensive plan document which is
submitted to State Government for consideration. This
plan will be of great use for number of departments of the
State like revenue, rural development, DRDAs, PWD
(PH), PWD (B&R), Local Bodies, HUDA, HSIDC,
Agriculture, Education, Power etc.
Haryana State Council for Science and Technology
(HSCST) is engaged in planning, implementing and
monitoring policies for promotion of Science and
Technology in the State. Haryana State Remote Sensing
Application Centre (HARSAC), Hisar, is a premier agency
for utilisation and applications of satellite data in various
economic sectors of the State.
3.2.3 Pharmaceuticals
The Indian pharmaceutical industry, with US $4 billion
in domestic sales and over US $3 billion in exports, has
been showing steady and satisfactory growth in terms of
infrastructure development, technology base and product
use. The industry now produces bulk drugs belonging to
all major therapeutic groups requiring complicating
manufacturing processes and has also developed excellent
‘good manufacturing practices’ (GMP) oriented facilities
for the production of drugs by following cost-effective
technologies in the shortest possible time without
compromising on quality. This has happened due to
country’s strengths in organic synthesis and process
engineering. The country is now well known as a low cost
producer of anti retroviral and supplier of the same to
international organisations and more importantly to the
needy patients in Africa. The Department of Chemicals
and Petrochemicals is also working on the price
management of the drugs, including life saving drugs.
Government of India is also focusing on the R&D effort to
encourage the development of new molecules. The
international pharmaceutical industry is also very keen
and hopeful to see India playing a big role in the world’s
pharmaceutical industry because of the modifications/
amendments in the Indian Patents Act, 1970 through an
ordinance on December 26, 2004. This was done for the
third time (the earlier two amendments were enacted in
1999 and 2002) to introduce product patents for drugs,
food and chemicals.
By doing so, government has adhered to the January,
2005 deadline for implementation of the Product Patent
Regime, in conformity with the Trade Related Intellectual
Property Rights (TRIPS) agreement of the World Trade
Organisation (WTO).
Table 3.6 reveals that growth of exports of
pharmaceuticals in world’s exports has been more
pronounced than trade in manufactures, chemicals and all
other chemicals. The value of world’s exports in
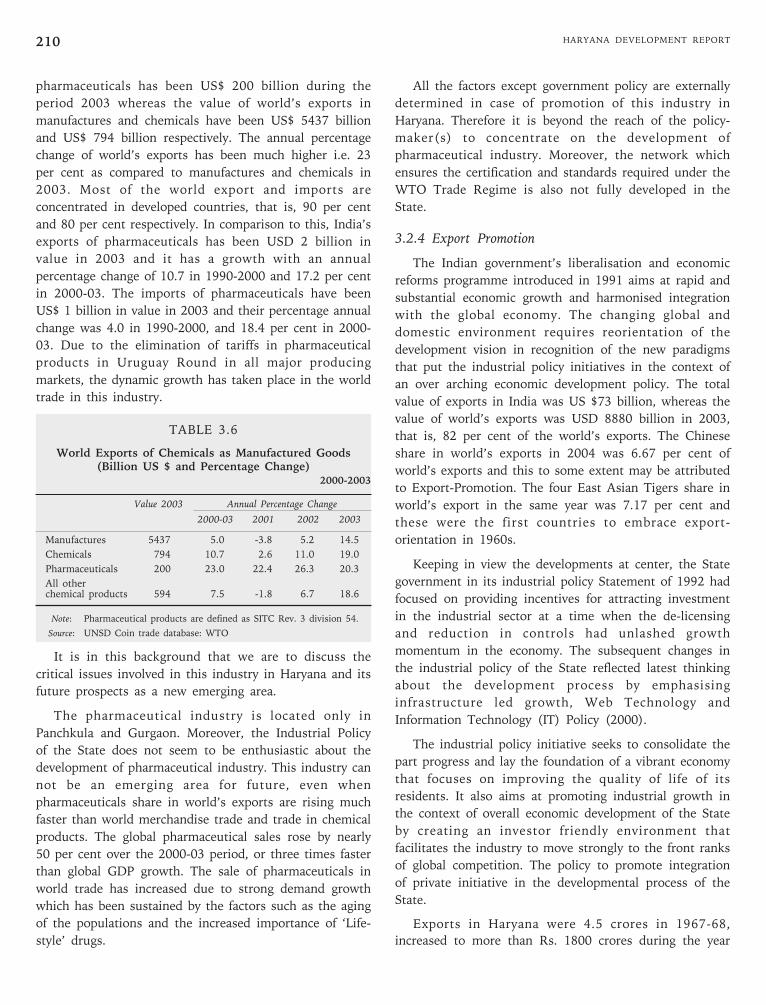
HARYANA DEVELOPMENT REPORT210
pharmaceuticals has been US$ 200 billion during the
period 2003 whereas the value of world’s exports in
manufactures and chemicals have been US$ 5437 billion
and US$ 794 billion respectively. The annual percentage
change of world’s exports has been much higher i.e. 23
per cent as compared to manufactures and chemicals in
2003. Most of the world export and imports are
concentrated in developed countries, that is, 90 per cent
and 80 per cent respectively. In comparison to this, India’s
exports of pharmaceuticals has been USD 2 billion in
value in 2003 and it has a growth with an annual
percentage change of 10.7 in 1990-2000 and 17.2 per cent
in 2000-03. The imports of pharmaceuticals have been
US$ 1 billion in value in 2003 and their percentage annual
change was 4.0 in 1990-2000, and 18.4 per cent in 2000-
03. Due to the elimination of tariffs in pharmaceutical
products in Uruguay Round in all major producing
markets, the dynamic growth has taken place in the world
trade in this industry.
TABLE 3.6
World Exports of Chemicals as Manufactured Goods(Billion US $ and Percentage Change)
2000-2003
Value 2003 Annual Percentage Change
2000-03 2001 2002 2003
Manufactures 5437 5.0 -3.8 5.2 14.5
Chemicals 794 10.7 2.6 11.0 19.0
Pharmaceuticals 200 23.0 22.4 26.3 20.3
All otherchemical products 594 7.5 -1.8 6.7 18.6
Note: Pharmaceutical products are defined as SITC Rev. 3 division 54.
Source: UNSD Coin trade database: WTO
It is in this background that we are to discuss the
critical issues involved in this industry in Haryana and its
future prospects as a new emerging area.
The pharmaceutical industry is located only in
Panchkula and Gurgaon. Moreover, the Industrial Policy
of the State does not seem to be enthusiastic about the
development of pharmaceutical industry. This industry can
not be an emerging area for future, even when
pharmaceuticals share in world’s exports are rising much
faster than world merchandise trade and trade in chemical
products. The global pharmaceutical sales rose by nearly
50 per cent over the 2000-03 period, or three times faster
than global GDP growth. The sale of pharmaceuticals in
world trade has increased due to strong demand growth
which has been sustained by the factors such as the aging
of the populations and the increased importance of ‘Life-
style’ drugs.
All the factors except government policy are externally
determined in case of promotion of this industry in
Haryana. Therefore it is beyond the reach of the policy-
maker(s) to concentrate on the development of
pharmaceutical industry. Moreover, the network which
ensures the certification and standards required under the
WTO Trade Regime is also not fully developed in the
State.
3.2.4 Export Promotion
The Indian government’s liberalisation and economic
reforms programme introduced in 1991 aims at rapid and
substantial economic growth and harmonised integration
with the global economy. The changing global and
domestic environment requires reorientation of the
development vision in recognition of the new paradigms
that put the industrial policy initiatives in the context of
an over arching economic development policy. The total
value of exports in India was US $73 billion, whereas the
value of world’s exports was USD 8880 billion in 2003,
that is, 82 per cent of the world’s exports. The Chinese
share in world’s exports in 2004 was 6.67 per cent of
world’s exports and this to some extent may be attributed
to Export-Promotion. The four East Asian Tigers share in
world’s export in the same year was 7.17 per cent and
these were the first countries to embrace export-
orientation in 1960s.
Keeping in view the developments at center, the State
government in its industrial policy Statement of 1992 had
focused on providing incentives for attracting investment
in the industrial sector at a time when the de-licensing
and reduction in controls had unlashed growth
momentum in the economy. The subsequent changes in
the industrial policy of the State reflected latest thinking
about the development process by emphasising
infrastructure led growth, Web Technology and
Information Technology (IT) Policy (2000).
The industrial policy initiative seeks to consolidate the
part progress and lay the foundation of a vibrant economy
that focuses on improving the quality of life of its
residents. It also aims at promoting industrial growth in
the context of overall economic development of the State
by creating an investor friendly environment that
facilitates the industry to move strongly to the front ranks
of global competition. The policy to promote integration
of private initiative in the developmental process of the
State.
Exports in Haryana were 4.5 crores in 1967-68,
increased to more than Rs. 1800 crores during the year
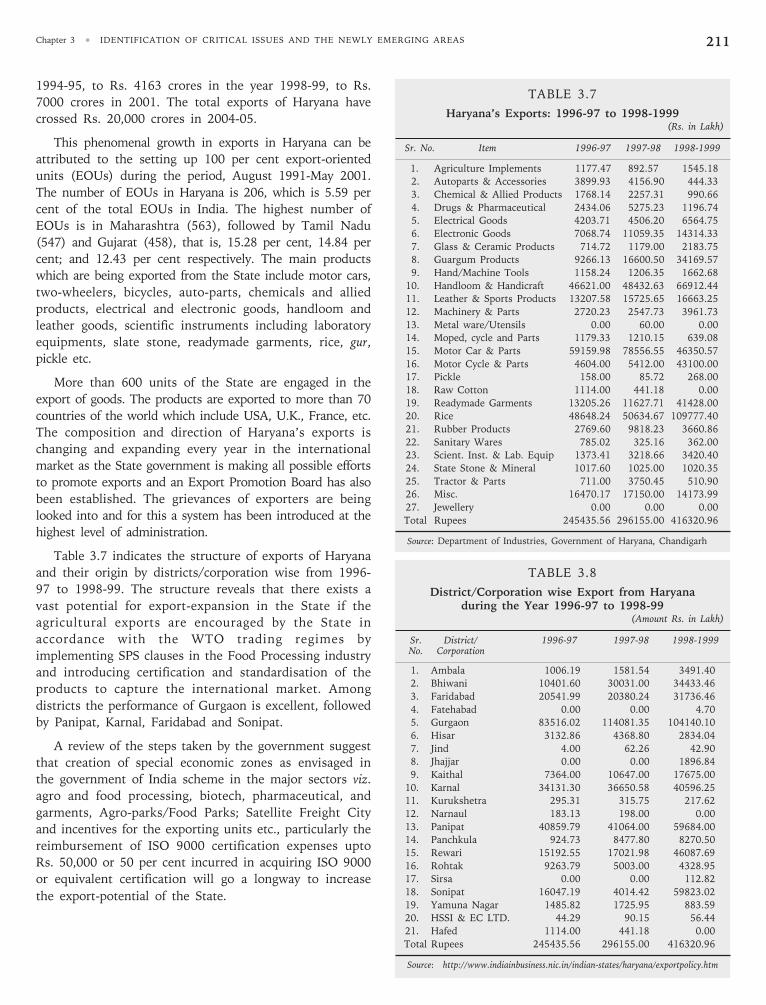
Chapter 3 • IDENTIFICATION OF CRITICAL ISSUES AND THE NEWLY EMERGING AREAS 211
TABLE 3.7
Haryana’s Exports: 1996-97 to 1998-1999(Rs. in Lakh)
Sr. No. Item 1996-97 1997-98 1998-1999
1. Agriculture Implements 1177.47 892.57 1545.18
2. Autoparts & Accessories 3899.93 4156.90 444.33
3. Chemical & Allied Products 1768.14 2257.31 990.66
4. Drugs & Pharmaceutical 2434.06 5275.23 1196.74
5. Electrical Goods 4203.71 4506.20 6564.75
6. Electronic Goods 7068.74 11059.35 14314.33
7. Glass & Ceramic Products 714.72 1179.00 2183.75
8. Guargum Products 9266.13 16600.50 34169.57
9. Hand/Machine Tools 1158.24 1206.35 1662.68
10. Handloom & Handicraft 46621.00 48432.63 66912.44
11. Leather & Sports Products 13207.58 15725.65 16663.25
12. Machinery & Parts 2720.23 2547.73 3961.73
13. Metal ware/Utensils 0.00 60.00 0.00
14. Moped, cycle and Parts 1179.33 1210.15 639.08
15. Motor Car & Parts 59159.98 78556.55 46350.57
16. Motor Cycle & Parts 4604.00 5412.00 43100.00
17. Pickle 158.00 85.72 268.00
18. Raw Cotton 1114.00 441.18 0.00
19. Readymade Garments 13205.26 11627.71 41428.00
20. Rice 48648.24 50634.67 109777.40
21. Rubber Products 2769.60 9818.23 3660.86
22. Sanitary Wares 785.02 325.16 362.00
23. Scient. Inst. & Lab. Equip 1373.41 3218.66 3420.40
24. State Stone & Mineral 1017.60 1025.00 1020.35
25. Tractor & Parts 711.00 3750.45 510.90
26. Misc. 16470.17 17150.00 14173.99
27. Jewellery 0.00 0.00 0.00
Total Rupees 245435.56 296155.00 416320.96
Source: Department of Industries, Government of Haryana, Chandigarh
TABLE 3.8
District/Corporation wise Export from Haryanaduring the Year 1996-97 to 1998-99
(Amount Rs. in Lakh)
Sr. District/ 1996-97 1997-98 1998-1999No. Corporation
1. Ambala 1006.19 1581.54 3491.40
2. Bhiwani 10401.60 30031.00 34433.46
3. Faridabad 20541.99 20380.24 31736.46
4. Fatehabad 0.00 0.00 4.70
5. Gurgaon 83516.02 114081.35 104140.10
6. Hisar 3132.86 4368.80 2834.04
7. Jind 4.00 62.26 42.90
8. Jhajjar 0.00 0.00 1896.84
9. Kaithal 7364.00 10647.00 17675.00
10. Karnal 34131.30 36650.58 40596.25
11. Kurukshetra 295.31 315.75 217.62
12. Narnaul 183.13 198.00 0.00
13. Panipat 40859.79 41064.00 59684.00
14. Panchkula 924.73 8477.80 8270.50
15. Rewari 15192.55 17021.98 46087.69
16. Rohtak 9263.79 5003.00 4328.95
17. Sirsa 0.00 0.00 112.82
18. Sonipat 16047.19 4014.42 59823.02
19. Yamuna Nagar 1485.82 1725.95 883.59
20. HSSI & EC LTD. 44.29 90.15 56.44
21. Hafed 1114.00 441.18 0.00
Total Rupees 245435.56 296155.00 416320.96
Source: http://www.indiainbusiness.nic.in/indian-states/haryana/exportpolicy.htm
1994-95, to Rs. 4163 crores in the year 1998-99, to Rs.
7000 crores in 2001. The total exports of Haryana have
crossed Rs. 20,000 crores in 2004-05.
This phenomenal growth in exports in Haryana can be
attributed to the setting up 100 per cent export-oriented
units (EOUs) during the period, August 1991-May 2001.
The number of EOUs in Haryana is 206, which is 5.59 per
cent of the total EOUs in India. The highest number of
EOUs is in Maharashtra (563), followed by Tamil Nadu
(547) and Gujarat (458), that is, 15.28 per cent, 14.84 per
cent; and 12.43 per cent respectively. The main products
which are being exported from the State include motor cars,
two-wheelers, bicycles, auto-parts, chemicals and allied
products, electrical and electronic goods, handloom and
leather goods, scientific instruments including laboratory
equipments, slate stone, readymade garments, rice, gur,
pickle etc.
More than 600 units of the State are engaged in the
export of goods. The products are exported to more than 70
countries of the world which include USA, U.K., France, etc.
The composition and direction of Haryana’s exports is
changing and expanding every year in the international
market as the State government is making all possible efforts
to promote exports and an Export Promotion Board has also
been established. The grievances of exporters are being
looked into and for this a system has been introduced at the
highest level of administration.
Table 3.7 indicates the structure of exports of Haryana
and their origin by districts/corporation wise from 1996-
97 to 1998-99. The structure reveals that there exists a
vast potential for export-expansion in the State if the
agricultural exports are encouraged by the State in
accordance with the WTO trading regimes by
implementing SPS clauses in the Food Processing industry
and introducing certification and standardisation of the
products to capture the international market. Among
districts the performance of Gurgaon is excellent, followed
by Panipat, Karnal, Faridabad and Sonipat.
A review of the steps taken by the government suggest
that creation of special economic zones as envisaged in
the government of India scheme in the major sectors viz.
agro and food processing, biotech, pharmaceutical, and
garments, Agro-parks/Food Parks; Satellite Freight City
and incentives for the exporting units etc., particularly the
reimbursement of ISO 9000 certification expenses upto
Rs. 50,000 or 50 per cent incurred in acquiring ISO 9000
or equivalent certification will go a longway to increase
the export-potential of the State.
HARYANA DEVELOPMENT REPORT212
The Government of Haryana has taken many bold and
appropriate steps for the promotion of exports. These
steps are as follows:
(i) Special Economic Zones
Special Economic Zones (SEZs) will be set up in the
State under Government of India’s scheme in the major
sectors viz., agro and food processing, biotech,
pharmaceuticals and garments. The basic idea to establish
the SEZs is to provide such facilities to exporters which
will make the import and exports free from all
encumbrances, rules and regulations etc. The movements
of goods to and from SEZs would be unrestricted and
without hindrance.
Private sector would be fully involved to set up SEZs
in the State. The State would also consider to set up Rice
Zone, Dairy zone, Mushroom zone and Herbal zones at
strategic locations.
(ii) Agro Parks/Food Parks
State Government has decided to set up four Agro
parks/Food parks at Narwana, Dabwali, Saha and Jhajjar.
In these Food Parks, integrated services shall be provided
to food processing units with special emphasis on
exporting units.
(iii) Satellite Freight City
Government of India will be approached for setting up a
Satellite Freight City near International Airport, Delhi. The
city will be developed in collaboration with Airport Authority
of India and Foreign airlines. This will further facilitate faster
clearance of air cargo from the northern region.
(iv) Inland Container Depot
It will be the endeavour of the State Government to
strengthen facilities in existing Inland Container Depot
(ICD) and also to set up new ICDs at different locations
through Haryana Warehousing Corporation and Private
Sector to facilitate transportation of exportable items to
Cargo complexes/ports. This shall supplement the already
existing facilities at Panipat, Rewari and Faridabad and the
planned venture at Murthal.
The following incentives and concessions have been
provided to the Export units in the State:
(i) Preference in Allotment of Plots
Ten per cent of plots in newly developed industrial
estates, are reserved for Export Oriented Units having
atleast 33 per cent export commitment and units having
minimum foreign equity of 33 per cent.
(ii) Power Connection
Preference would be given for release of electric
connection and to provide electricity without any cuts.
(iii) Conversion Charges
No conversion charges would be levied for change of
land use for the setting up of 100 per cent Export
Oriented Units.
Export Promotion Assistance Scheme(per unit annually)
Participation in Foreign Trade Fairs/Exhibitions not
only enlighten the entrepreneurs of the demand/
requirements of foreign markets, but also helps them to
absorb foreign technologies. The State Government would
provide the following assistance to SSI export Oriented
units for participation in foreign trade fairs/exhibitions:
(i) 50 per cent of stall charges upto a maximum of
Rs. 50,000/-.
(ii) 50 per cent of the air fare upto a maximum of Rs.
15000/- for one person.
Note: Both these above-mentioned schemes will
be applicable to those units, which come into
commercial production after 1.11.2001.
(iii) Rs. 50,000/- or 50 per cent of the total expenses,
whichever is lower, for launching website.
(iv) Rs. 25,000/- or 50 per cent of the expenses,
whichever is lower on air fare/counter charges for
sending samples to exporters.
(v) Rs. 50,000/- or 50 per cent of cost, whichever is
lower would be re-imbursed as assistance for
obtaining ISO-9000 or ISO-14000 certification.
Transport Assistance Scheme
Haryana is a land-locked State. As a result, the cost of
transport of export cargo to the ports affects their
competitiveness adversely. In order to offset this
disadvantage the State Government will extend assistance
to subsidise export freight cost in respect of selected
export products. The exemption will be grants on freight
charges paid from Inland Container Depot (ICD)/
Container Freight Stations (CFS) to the gateway airport.
The exemption on Airway Bill would be Re. 1 per kg
subject to maximum of Rs. 50,000/- per unit annually for
a period 5 years.
Purchase Tax
Purchase tax will not be levied on raw material and
packing material used in export production.
Chapter 3 • IDENTIFICATION OF CRITICAL ISSUES AND THE NEWLY EMERGING AREAS 213
Market Fee
Abolition of ‘Market Fee’ in respect of raw materials,
for export production will be considered.
Entrepreneurship Development
State Government would organise Entrepreneur/
Management Development courses with specific emphasis
on exports. Rs. 10,000 or 50 per cent of Tuition fee
(excluding boarding and lodging charges) whichever is
minimum shall be reimbursed to exporting SSI
entrepreneurs for attending courses on Technology,
Productivity, Quality, Management and other related
courses.
Export Award
With a view to honour exporting units, a scheme of
State Export Award has been instituted by the State
Government. Export Award is given to exporters declared
as First, Second and Third in each category, that is, Large
and Medium and Small Scale sector:
A number of consolation Awards are also given to the
next exporting units men-wise. Export Awards are
granted to the manufacturer exporters engaged in the
manufacture of items relating to the following trades:
i) Engineering.
ii) Food and Fruit processing, Agro Industries and
Floriculture.
iii) Chemical, Mineral and Rubber Goods.
iv) Textiles, Handloom and Readymade Garments.
v) Scientific Appliances including Electronics.
vi) Leather Goods, Ceramics and Handicrafts.
Trade Fairs/Buyer–Seller Meets
Export/exportable products shall be provided priority
in exhibiting at National/International Trade Fairs. Export
Promotion Board shall organise exhibitions and trade fair
in the State and outside including trade exhibition abroad.
Stalls for display of exhibits will be provided at
concessional rates to exporting SSI Units.
Labour Laws
In order to prevent labour problems in 100 per cent
Export Oriented Units, the State Government has brought
all the 100 per cent EOUs under Public Utility. The State
Government would further review the Labour Laws and
make necessary amendments in order to remove
bottlenecks in the way of export growth. Procedure of
hiring contract labour for seasonal industries would be
streamlined and simplified.
The visits of inspectors to industrial units have been
reduced to a bare minimum statutory requirement. The
State Government would encourage self regulatory in
EOUs. The inspection of industrial unit is now being done
after prior intimation to the Deputy Commissioner
concerned. Exporter’s Industries Associations shall be
invited to suggest measures for removal of further
bottlenecks for EOUs.
To facilitate hassle free interaction with senior
Government functionaries, the Government will issue
Gold Card to Chairman/MDs of the 100 per cent Export
Oriented Units, and Silver Card to the CEO of other
exporting units. The Card holders will be entitled to enter
Haryana Civil Secretariat without any hassle of gatepass
and meet any officer of any department on priority. The
Card holders correspondence will be replied within one
week and references will be disposed off within a period
of one month.
Haryana Warehousing Corporation is setting up a
Cargo Handling facility at Kandla port in collaboration
with APEDA.
State Government has decided to pay special attention
to the growth of exports in traditional areas viz.,
Handloom products and carpets, scientific instruments,
metal ware and utensils, ceramics etc. Steps would be
taken to modernise the production process, providing
facilities for design development and quality upgradation,
encourage production diversification in accordance with
the changing demand in importing countries,
establishment of trade centres with integrated facilities,
set up special institutes to meet training needs in the
areas and providing quality testing facilities etc.
Mega Projects having investment of Rs. 30 crores and
above will be offered customised package of incentives by
the High Powered Committee instituted under Industrial
Policy, 1999.
Rebate equivalents to 20 per cent of the land cost shall
be given if the industrial units starts commercial
production within 3 years of offer of possession of
industrial plots allotted by HSIDC/HUDA.
Escort services and single desk clearance for obtaining
easy clearances and approvals of various Government
Departments shall be facilitated to those units which
export 33 per cent of their production. Online clearances
and support network will be established linking all the
related departments/organisations. The IAG shall
coordinate approvals and facilitations.
HARYANA DEVELOPMENT REPORT214
The time schedule shall be framed for various
departments for giving necessary sanctions/approvals to
reduce time frame for project completion.
In addition to all these measures, certain institutional
changes need to be incorporated in the economy. Firstly, a
research cum administrative institution should be
established by the State to constantly review the
requirements of WTO Trading Regime in order to make
our exports standardised and certified in the World
Market. This should be done by involving the private
sector and academician in the universities.
Secondly, investor-friendly environment along with
latest infrastructural facilities be created in the State.
Thirdly, the ‘effective cities’ should be developed in the
State as they will be helping to export the advantages of
globalisation.
Fourthly, the time has come when the Government of
Haryana should create excellent marketing facilities for
agricultural products and these products should be
standardised, keeping in view SPS clauses of WTO.
Finally, we are confident that by investing in
agriculture related industries and telecommunication and
infrastructure in the State, the export potential of the
State will increase manifold by the year 2015.
3.2.5 Strengthening of Certification, Safety and QualityNetworks In the Context Of WTO Regime
The GATT has become the WTO’s umbrella agreement
and applies in all cases. The additional specific agreements
that address specific aspects of trade have been
negotiated. The Agreement on Technical Barriers to Trade
(TBT) is the most relevant agreement for standards and
certification programmes. The TBT applies the MFN and
NT principles to technical assessment procedures. If note
is that the TBT comes before the GATT in the hierarchy
of the WTO agreement.1
The Agreement on Technical Barriers to Trade (TBT)
aims to ensure that technical regulations, standards and
conformity assessment procedures do not create
unnecessary obstacles to trade. The Agreement
encourages members to use international standards where
these are available but it does not regime countries
Members to harmonise their domestic regulations and
standards upwards or downwards as a result of
international standardisation activities. It is subject to the
same principles as the GATT, that is, Articles I and III are
the cornerstone of it, and exceptions or Article XX also
apply to the TBT Agreement. It incorporates a Code of
Good Practices that has been developed on a ‘best
endeavour’ basis for voluntary standards.
Many developing countries find it difficult to
participate effectively in the standardisation process due to
lack of technical expertise and/or financial constraints.
Even though 89 per cent of all countries fall in the
category of developing and least developed countries and
since most of them are unable to attend the meetings of
the standardisation Committees, the developed countries
fix standards which are often difficult for developing
countries to comply with. This is because of the better
understanding of the role of Codex Alimentarius
Commission, upgrading of prediction and post-harvest
technologies, large investments and also education among
producers, processors and reporters.
There is no comprehensive body for setting SPS
standards in India. The existing standards which
correspond to SPS standards operate under the following:
(i) Prevention of Food Adulteration (PFA) Act 1954.
(ii) AGMARK standard which is a voluntary grading
system operated by the Directorate of Marketing
Inspection under Ministry of Agriculture.
(iii) Bureau of Indian standards, and
(iv) Export Inspection and Quality Control among
others.
The Government of India has set up a National Codex
Committee under the Department of Health, Ministry of
Health and Family Welfare which has identified six major
areas namely Fish and Marine Products, Meat and Meat
Products, Fruits and Vegetables, Spices and Condiments,
Milk products and Cereals, Nuts and Oil Seeds.
Multifarious actions like institutionalised training in
areas of HACCP, GMP (Fisheries, Fruits and Vegetables);
revision of PFA standards based on grade specification for
export (spices and condiments) including parameters for
microbial limits; maximum tolerance limit/MRLs for
pesticide residue and aflatoxin; physical characteristics and
cleanliness; allocation of food identifier codes (spices);
strengthening of analytical laboratories in all food sectors;
improving existing laboratories to reach BIS levels;
harmonisation of maximum tolerance limits for different
pesticides for different food groups/foods under PFA and
codex; multi centric study on use of edible colours in food
products (CFTRI and NIN). Shadow Committee on
1. This means that in the event of a conflict with provision of GATT the TBT Agreement will prevail. Bourgeois, Berrod (eds.). The Uruguay Round Results: AEuropean Lawyers’ Perspective. pp. 70-71.
Chapter 3 • IDENTIFICATION OF CRITICAL ISSUES AND THE NEWLY EMERGING AREAS 215
general principles, Steering Committee for setting up
standards for organic foods etc. have also started work.
In all major agricultural crops, especially in chemical and
microbiological areas, these standards are comparable with
international standards. The standards followed by certain
sectors like spices/marine are compatible with international
standards. Now Government of India is attempting to
develop national standards encompassing all areas of
operation. But the pace of its formulation and
implementation is necessarily slow because coordination
between various Ministries becomes difficult at times.
Though there are a number of laws on food standards,
enforcement remains a critical problem. The departments
responsible to enforce it often do not have adequate
resources, testing facilities or trained personnel. The
penalty provisions also do not have the desired deterrent
effect. The standardisation required for the implementation
of SPS clauses should be extended to SMEs through
institutional changes in the regional and national bodies.
The national standards and certification needs to be
correlated with regional standards etc. in all the regions/
States to boost India’s exports to the neighbourhood
trading-partners in addition to traditional partners in
trade. The South American, African and transitional
economies should also be explored for increasing export
potential.
In addition to this, the national standard bodies
initiative needs to be replicated across the board. In some
areas national standards are inferior (food quality) with the
result that bilateral export bans have been imposed.
Similarly, national labour laws (affecting wages, health and
safety) are out of sync with international social standards.
In other areas there are no national laws but these are
needed in flagrantly extractive practices, such as in the
forestry and fisheries sector. This is also an advantage as
when a policy decision is taken to institute them, such laws
can be based on international standards pertaining to
sustainable trade. The resources and standardisation
activities in India has been inadequate and low as compared
to other countries. India is a member of ISO. The staff
directly employed by India is only 1996 and the annual
budget is only 23,844 Swiss Francs. The number of
standards published as on 31 December 2004 was 17,764.
The voluntary standards in per cent of total number of
standards was 99; and the number of international
standards adopted as national standard was 1070 as on 31
December 2002, whereas in case of China it was 8931. The
institution for standardisation and certification in India are
less as compared to the countries like China and other
European countries. It is also vital to understand the
difference between SPS clauses and TBT. SPS clauses differ
from TBT in three important aspects, that is:
First, while the TBT Agreement requires that product
regulations be applied on a MFN basis, the SPS permits
members to impose different sanitary and phytosanitary
requirements on food, animal or plant products sources
from different countries, provided that they ‘do not
arbitrarily or unjustifiably discriminate between countries
where identical or similar conditions prevail’. The rational
for this is due to differences in climate, pests or diseases
and food safety conditions. Second, the provisions of the
SPS agreement explicitly permit governments to choose
not to use international standards. National standards
which are higher than international standards are allowed
and should they result in a greater restriction of trade, the
government may be asked to show scientific justification
for the measure, or they could demonstrate that the
international standard would not result in the level of
health protection it considers appropriate. Third, the SPS
Agreement introduces the precautionary approach and
permits member countries to adopt SPS measures on a
‘provisional basis’, in cases where ‘relevant scientific
evidence is insufficient’ by taking into account ‘pertinent
information’ that may be available from them or from
other members or from the relevant international
organisations.
After discussing the relationship between standards
and international trade, we are now in a position to
evaluate the importance of standardisation system which
is almost absent in developing economies and transitional
countries. Like other developing countries, the
participation of private sector in international
standardisation in India too needs to be extended and
improved. The synthesis between national and global
welfare maximisation, consumer preferences and scientific
evidence, the role of international standards and the
process of enforcing standards in the multilateral trading
system are crucial questions to be examined and answered
for the future growth of exports in India as well as in the
State of Haryana.
The strengthening of standardisation and certification is
a great challenge for both. For this, the central government
should enhance its resources and involve the private sector
in its adoption to the various products domestic as well as
exports. Haryana can simply implement the
‘standardisation’ developed by the national government. In
addition to this, agricultural scientists in the State should
focus in understanding and devising SPS standards in
conformity with WTO trading system. This will boost
agricultural exports from the State for which vast potential
HARYANA DEVELOPMENT REPORT216
exists. The State should encourage research in certification,
standardisa-tion and quality networks in the universities
and technical institutes. This will help the producers and
exporters in the State in understanding the relationship
between Standardisation and International Trade.
3.2.6 Reoriented Approach to Governance
The phenomenon of governance is the new system of
governance resulting from the growing trends towards
globalisation, privatisation and liberalisation. In the
process, the old system of governance has to part with its
power used in the name of development. Since last decade
or more the concept of new system of governance has
been experimented by many developed and developing
countries with the aim of achievement of overall
development goals in the country. The main objective of
the new system of governance is to drive the results from
growth potentials of the economy with required
adjustments, keeping in view market forces, in the
economy. The adjustments were also needed in the then
prevailing control on power and resources of the country.
This demanded new system of governance and policies to
achieve the desired results. The sectoral development
such as heavy industries, infrastructure and agricultural
development along with the participation of private sector
in driving near to the achievement of developmental goals
including the goal of reduction in poverty and deprivation
amongst the poor of the country.
New Governance—Concept and Characterisation
The World Bank in its document discusses two
approaches, (a) broader approach and (b) narrow
approach, for achieving the better development in a
country by exercising the powers in the right manner (The
World Bank, 1994). The approach with broader sense
indicates exercise of power in right manner for economic
development. And also helps in promoting the enhanced
participation in attainment of development. In doing so,
the role of other players becomes more important and the
centrality of power looses its importance. In other words
the contribution of other players like market, civil society
etc. become more significant for the development.
Therefore, in the new system of governance, different
players such as different governments at Centre, State and
local level, in the market, local traders along with national
and international companies, and most significant is civil
society covering community based organisations, NGOs—
local, national and international. Hence, it will not be
incorrect to say that in the new paradigm of governance,
multiplicity or plurality of institutions play an important
role in attainment of development at all levels. The World
Bank, UNDP, DFID, etc. have also supported new system
of governance with plurality of institutions from the
international agencies.
The World Bank’s objective of good governance is to
achieve sustainable socio-economic development. It has
advocated for better economic management instead of
changing the form of political system in the country. The
major areas of concern for achievement of good
governance as discussed by the Bank are (a) improving
the public sector management, (b) ensuring accountability
of public and private sectors, c) creating appropriate legal
framework for development, and (d) promoting
transparency and information. For the establishment of
good governance it is necessary that all these four pillars
of good governance must work mutually. Good
governance requires such a democratic system which
encourages inclusive and participatory institutions and
promotes transparent and accountable societies.
Therefore, to achieve the desired results of sustainable
development, legitimacy and capacity of governance
assumes more importance.
Recently, the Government of India (GoI) has also
recognised the importance of new system of governance
(GoI, 2002).2 In this context the GoI has recognised and
accepted some of the important features of good
governance by bringing improvement in its administration
on the lines of transparency, equality, participation and
accountability. Good governance in the Indian context is
to achieve the goals of human development. This can be
done through the introduction of multiple institutions.
Therefore the system of good governance should be
managed through the active participation of its players
like, State, market, civil society etc.
In this new system of good governance to achieve the
goals of development, it has identified three strategies.
The new concept of participation, decentralisation and the
involvement of civil society and voluntary organisations
are the constituents of these strategies. The effective
decentralisation through local self government,
involvement of civil society and voluntary organisations
would help in enhancement of socio-economic
development,
2. Government of India has come out with its approach to governance under the framework developed for implementation of the Tenth Five Year Plan(2002-07) in the country.
Chapter 3 • IDENTIFICATION OF CRITICAL ISSUES AND THE NEWLY EMERGING AREAS 217
Government’s Role in New Paradigm of Governance
In view of the World Bank,3 the government is more
powerful to institute and monopolise rule making. The
need for intervention by the government in economic
development arises due to various reasons. Only
government is powerful to establish the legal and
institutional system which can facilitate production and
exchange. Ensuring macro-economic stability through
appropriate fiscal and monetary policy is another
important area of government’s intervention.
At the time of failure of market economy, it is
government’s responsibility to intervene and provide basic
services like health, road, and education. It also helps in
bringing about equitable distribution of wealth through
redistributive measures. In the provision of sustainable
development for the future generation also, the role of
government is very important. Some of these arguments
are contradicted by many scholars.4
Civil Society and Right to Information
The challenges facing universal elementary education
in a country of the size of India are many and diverse.
This is more so when it relates to issues of access of the
girl child to education. Over the last decade, there has
been a significant rise in public awareness, political will
and an augmentation of national capacity, which is
highlighted by the wide variety of governmental polices
which have been introduced in the field of education. A
remarkable aspect of all this has been civil society-level
mobilisation in literacy campaigns. The 93rd
Constitutional Amendment is perhaps the most recent
high point of the political response to the popular demand
for education (Banerjee, 2001), initiated by civil society
and primarily led by NGOs. It is one of the very few items
of legislation on education that came into being due to
massive civil society mobilisation. In fact, one observer
who participated in the civil society gathering before
Parliament in November 2001 termed it ‘the largest ever
social mobilisation in Indian history, post-independence
for one single cause’, partly due to the fact that it brought
together a wide variety of civil society actors and
organisations (NGOs, judges, lawyers, teachers, parents,
children, trade unions, religious bodies, panchayats, etc.)
under one roof. What was even more commendable about
this initiative was that it was rights-based—in which the
failure of the government to deliver on its responsibilities
prompted a voluntary mobilisation of civil society to lobby
the government for the realisation of this right.
Governance and Gender at Local Level
In Netherlands, a development organisation produced a
manual on gender and local governance. In this model,
particular attention is paid to women’s interest. Without
women’s needs and interests being taken into account,
without opportunity for them to participate in and
influence decision-making, development interventions and
planning will not achieve sustainable results. For reasons
of justice, efficiency and diversity, and to change the
political system, women’s active participation is essential.
With a more human and gender-sensitive political
approach, citizens get more confidence in politics.
Good Governance and Financial Sector
For the achievement of goals of socio-economic
development and the reform in real sector, the mechanism
of new system of governance was introduced in the
financial sector. The main objectives of this mechanism
was: (a) reversal of excessive government control, (b)
plurality of actors, (c) autonomy of financial institutions,
(d) prescription of prudential norms, (e) continuation of
directed credit, (f) governance of the co-operative banking
system, (g) governance of the micro-finance sector; (h)
governance of the rural insurance intervention etc. From
the new system of governance, the human development
point of the rural finance sector is very important and
crucial, which is being discussed below.
Decentralised Democracy and Good Governance
The basic features of clean governance are: (a)
decentralised democracy at the grassroots level, (b) right
to information, and (c) organised local committees at an
economic level. Stressing the need for transparency in
governance, good governance agenda requires special
commitment, transparency in its primary institution of
governance—the public administration. Governments can
no longer afford to support rigid, bureaucratic, reactive,
rules driven administrative organisations. Rather today’s
administra-tive system ought to be flexible, consultative,
result-oriented and proactive, at the same time
encouraging and supporting creativity and innovation from
the bottom to the top in order to govern and provide
services to the citizens at large.
During the last century, there has been a considerable
rethinking on the ways the governments conduct their
business. They are now looking more and more towards
innovative solutions to respond to an increasing number
of new and complex environmental and global problems
and pressures, which are further accentuated in a
3. See, The World Bank (1997a; 1997b).
4. Some of the problems of State intervention as identified by Nicholas Stern (Meier and Rauch, 2000).
HARYANA DEVELOPMENT REPORT218
developing, multi-linguistic, and a multi-cultural country
like India, having diversity of social and religious systems
and tremendous ecological, cultural and external
constraints.
Decentralisation and Democratic Local Government
Decentralisation of government roles and powers
associated with democratic local government can be an
important means of improving the effectiveness of services
and enabling ordinary citizens to participate in the
management of their own communities. The democratic
dimension in decentralisation is a necessary element of a
process of sharing resources, power and responsibility.
However, without special attention to the empowerment of
the poor, decentralisation will do little to correct inequities
and reduce poverty. The same applies for enhancing the role
of women in the conduct of community affairs at local
government level. Checks and balances are essential through,
inter alia, accountability of the actors at different levels to the
people.
Democratic decentralisation is more likely to succeed
where certain conditions are in place. These include the
commitment of the political leadership; a political
environment based on pluralism, with a role for civil
society; an appropriate legal framework and adequate
capacities. Furthermore, the advantages must be perceived
at all levels: central government, local government, and
individuals.
Experience has shown that even if most of the
prerequisites are in place and resources are available, the
process of democratic decentralisation requires facilitation
and training in a new style that is demand-driven. Good
governance can be said to be equivalent to purposive and
development oriented governance with organisational
effectiveness and commitment to improving the quality of
life of the people in a transparent, participatory, just and
equitable manner approaches, rather than pre-designed
package.
Good governance and transparency will definitely
enhance credibility of NGOs. In India, in general, NGOs
have become another name for self-employment
programmes, sometimes even shameless plundering at the
expense of public exchequer or private charities.
Governance is a process by which the executives,
managers and field level functionaries can effectively and
meaningfully participate in the management and
administration of programmes to ensure maximum
efficiency, in accordance with the objectives of the
organisation.
Good governance is a way of creating and delivering
services that are required by citizens. Good governance is
a form of government in which government and citizens
collaborate as equal partners. A democracy works where
there is delivery of required services to all at affordable
price.
Good Governance in Haryana
Rural Development and Panchayats
The State of Haryana is known for its green, white and
industrial revolutions since its incarnation. The
Government is very keen for development of rural areas,
specifically creation and upgradation of rural
infrastructure. The State is very actively implementing
various centrally and State sponsored schemes related to
poverty eradication and employment generation in rural
areas. The State has proposed to incur expenditure of Rs
16 crore during 2005-06, for the implementation of
Swaranjayanti Gram Swarozgar Yojana (SGSY) focusing on
all aspects of self-employment. For the welfare of
marginalised people in the backward areas, it has
implemented a new centrally sponsored scheme of
Rashtriya Sam Vikas Yojana (RSVY) in the backward
districts.
Decentralisation and Governance
The State of Haryana has gone ahead in implementing
the decentralisation in rural as well as urban areas. With
objective of enhancement in the development process and
to strengthen the democratic system a good number of
powers (administrative and financial) along with the
funds, have been delegated to Panchayati Raj Institutions
(PRIs) and the Urban Local Bodies (ULBs). To achieve
this, it has proposed to provide a substantial financial
assistance during 2005-2006 to these bodies. During this
fiscal year, for the implementation of various development
programmes in the rural areas, the State government has
made the provision of Rs 277.49 crore.
Decentralised Governance and Urban Development
The State of Haryana is growing fast in urban areas.
About 29 per cent of its people reside in urban areas. The
urban development would improve the quality of citizens
in urban centres. The government is very keen in
integrated development in urban areas and the welfare of
urban people. For the provision of basic civic amenities to
its citizens, the financial position of urban governance
should be very strong. With the limited inelastic sources
of revenue available with these bodies, the fiscal health of
the governance at local level remained meagre. These
constraints prohibit the efficient and adequate provision of
basic services in urban areas. The State government is
keen and coming forward to financial status of municipal
bodies. In the absence of such support it becomes difficult
Chapter 3 • IDENTIFICATION OF CRITICAL ISSUES AND THE NEWLY EMERGING AREAS 219
to carry out any development. The State has proposed to
provide an annual grant of Rs 18.20 crore during 2005-
2006, based on Twelfth Finance Commission recommen-
dations. This grant would be used for the development
work in urban areas. In addition to this, Urban Renewal
Mission, a financial assistance of Rs 47.30 crore has
proposed to be provided for strengthening the urban
infrastructure in urban areas.
At the State level, under the provision of Article 243 I
and 243 Y of the 73rd and 74th Constitutional Amendment
Act (CAA), the State has implemented the
recommendations of 1st State Finance Commission Report.
It has provided substantial amount for the enhancement
of urban development in the urban areas. Similarly, under
the mandatory provision, the 2nd SFC has proposed to
grant an amount of Rs 50 crore on ad-hoc basis to urban
bodies.
Urban Governance and Housing for the Poor
Under the information and technology sector, the main
thrust is on the provison of citizen centric services for
transparency and efficient service delivery. A
comprehensive IT policy has been formulated by the IT
department. This would help in setting up of the
Technology Parks and Technology Cities. It would
facilitate and attract the private investors for the
investment in the IT sector in the State.
Governance and the Welfare of the Poor
"The poverty is a measure evil of the society. The
government of Haryana has been constantly making
efforts to eradicate poverty in the state by assisting people
living below poverty line through various schemes. The
poorest of the poor have been identified and pink colored
ration cards have been issued under the Govt. of India
scheme of Antyodaya Anna Yojana. Under this scheme, 35
kg wheat per family per month is being supplied to the
Antyodaya families at a rate of Rs. 2 per kilogram. The
transportation and dealers margin is born by the state
government at the rate 50 paisa per kilogram amounting
to Rs. 3.81 crore per annum.
In the case of welfare of backward classes, handicapped
persons, destitute women and weaker sections, state has
taken several initiatives. It has adopted a policy of one job
for one family, permits to unemployed for operating Maxi-
Cab. For the scavenger from their traditional occupation
of manual removal of night soil, and scheme of "Sulabh
Shauchalayas" introduced by the state.
With regard to the shelter to the poor, an amount of
Rs. 2215.56 lakhs has been incurred under "Indira Awas
Yojana (New construction). Under the scheme 8845
houses were constructed and 651 houses were in progress
for members of Scheduled Castes and also Non-scheduled
Castes rural poor living below the poverty line during the
year 2004-05.
For the provision of additional wage employment
opportunities to he rural poor, under "Sampooram
Grameen Razgar Yojana (SGRY)", a total fund of Rs.
7496.76 lakhs were made available for the year 2004-05.
Against the available funds, an amount of Rs. 6794.28
lakh has been utilised for generating 70.12 lakh mandays
in rural areas.
Swarna Jayanti Shahari Rozgar Yojana (SJSRY) aimed
at gainful employment to the urban unemployed and
under-employed poor beneficiaries. The provision of
employment opportunities were made through setting up
of self-employment ventures providing wage employment
through skill development training. At the closing of 2005
fiscal year an amount of Rs. 162.41 lakh in the form of
loan and subsidy were been provided to about 1845
beneficiaries. Though, the above programs show the good
intentions of the state to promote welfare of the poor
people but this can not be achieved without good
governance.
3.2.7 Involvement of NGOS in the Development Process
Historically, the evolution of NGOs can be traced back
in Western political thought. Civil society has only
recently reemerged as a central issue in debates
encompassing distinct subjects of inquiry such as the
‘State’ ‘economic development’ and democratic political
theory (Dahendorf, 1995; Leftwich, 1993; Peet and Watts,
1993 and Calhonu, 1993). The renewed and latest interest
in civil society is a direct product of popular widespread
concern about the failure of political regimes and
economic strategies, that characterised the 1980s. As
Batista (1994) has observed, civil society is “an appealing
concept at a transitional historic moment”, and it has
been both theoretically and practically approached in
various political traditions and contexts. Interestingly, as
Seligman (1992) reminds us, “much like today, the
emergence of the idea of civil society in the later
seventeenth century was the result of a crisis in social
order and a breakdown of existing paradigms of the idea
of order”. Civil society has become inventible in 1990s
due to its successful struggles with different forms of
totalitarian regimes of both capitalist and socialist variety.
The existence of strong civil societies has also been
pointed out as significant by aid donors and multilateral
development agencies such as the World Bank and the
HARYANA DEVELOPMENT REPORT220
International Monetary Fund as a necessary condition for
sustainable economic development (Landell–Mills, 1992).
Nevertheless, according to Leftwich (1993), it was not
until recently that these agencies started to display a
serious or consistent interest in promoting either good
governance of democracy in the nations in which they
operated projects. Leftwich sees a relationship between
the rise of pro-democracy movements in the developing
world and the collapse of official communist regimes, the
experience of structural adjustment lending and the
resurgence of neo-liberalism in the West, with a rising
interest among multilateral development agencies on civil
society. Williams and Young (1994) point out that the
roots of these agencies’ interest in civil society seem to
arise from their recognition that a “neutral and effective
State, cannot be sustained without a corresponding liberal
public sphere.”
In addition, as a concomitant and interwoven
phenomenon, there has been increased recognition of
non-governmental organisations (NGOs) as institutions
that are essential for the construction of strong civil
societies, especially in developing countries. NGOs are so
deemed because they are believed to enhance the access
of disparate segments of the citizenry to governance and
development processes (Ritchey-Vance, 1991; Clark,
1991).
Expressing the views of the World Bank, Landell-Mills
(1992) claims that a strong civil society can play a key role in
balancing the power of the State, facilitating accountability,
and underpinning popular democracy. Landell-Mills identifies
four ways in which civil society might be nurtured: (1) by
facilitating the dissemination of information, (2) by
strengthening the rule of law, (3) by expanding education
and the capacity of self-expression and (4) by generating
surplus resources to support associational activities without
compromising their autonomy. Robinson (1995) observes
that donor assistance has encompassed all four areas cited by
Landell-Mills. However, according to Robinson, given the
fact that the overall objectives of foreign political aid are
often multi-faceted are rarely altruistic, it would be difficult
to assess the impact of interventions designed to strengthen
civil society. On the other hand, different authors analysing
the recent utilisation of civil society by the World Bank as a
tool for improving governance, argue that such utilisation is
often tied to the goal of decreasing the presence of the State
in the economy, opening the way for the growth of private
enterprises (Williams and Young, 1994). Williams and
Young contend that the World Bank’s definition of civil
society, informed by its own brand of economic orthodoxy,
targets for destruction those affective communities and their
native visions of development. In the case of Africa, these
types of community ties have been considered critical for the
development of the associational life that is so critical for the
full development of a strong civil society (Azaraya, 1994).
White (1994) enumerates four complementary ways
that the growth of civil society can contribute to
democratic governance by: (1) altering the balance of
power between State and society to achieve a balanced
opposition in favour of the latter, (2) enforcing standards
of public morality and improving the accountability of
politicians and State officials, (3) transmitting the
demands of organised groups, and in the process
providing an alternative sphere of representation, (4)
instilling and upholding democratic values, (5)
disseminating information, and (6) generating a wide
range of interests that may cross-cut the principal
polarities of conflict.
Diaz-Albertini (1993) suggests that in the case of weakly
institutionalised societies in the Third World (i.e., societies
where pluralist and democratic practices are not the rule and
where political institution building is still an ongoing
process), the organisations of civil society, especially those
that are development-oriented, must face an additional task:
to create channels of communication, negotiation, and
bargaining among the different political actors, in both the
State and civil society.
According to Ritchey-Vance, the NGO universe
includes community-based grassroots organisations,
popular movements, and professional or technical support
institutions. Nevertheless, the term NGO is nowadays
commonly utilised in many studies about the contribution
of civil society’s organisations to the economic
development process (Diaz-Albertini, 1993; Clark, 1991;
Fisher, 1993; Lehman, 1990; Williams, 1990). Frantz
(1987) observes that many NGOs have emerged either
out of the process of facilitating the aims of a social
movement or out of the institutionalisation of that same
movement.
Landim (1987) stresses that NGOs’ actions are guided
by a basic characteristic which is an orientation to the
strengthening of civil society as whole. This would take
on special meaning when dealing with societies that have
strong authoritarian traditions and which traditionally
exclude most of the population from access to
participation, cultural expression, and minimal material
living conditions. Accordingly, Weyers (1981) suggests
that NGOs in developing countries help to bring
development down to the grassroots. Weyers argues that
NGOs can mobilise popular participation in self-help
projects, promote the development of national culture,
and link resources available at the national level with
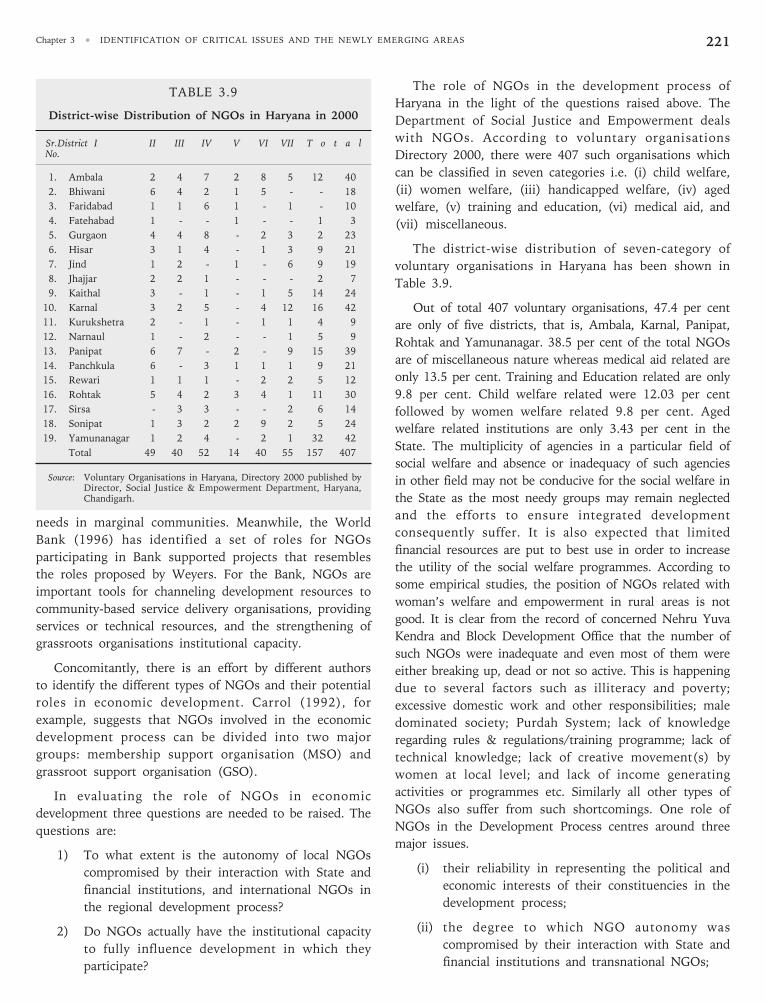
Chapter 3 • IDENTIFICATION OF CRITICAL ISSUES AND THE NEWLY EMERGING AREAS 221
needs in marginal communities. Meanwhile, the World
Bank (1996) has identified a set of roles for NGOs
participating in Bank supported projects that resembles
the roles proposed by Weyers. For the Bank, NGOs are
important tools for channeling development resources to
community-based service delivery organisations, providing
services or technical resources, and the strengthening of
grassroots organisations institutional capacity.
Concomitantly, there is an effort by different authors
to identify the different types of NGOs and their potential
roles in economic development. Carrol (1992), for
example, suggests that NGOs involved in the economic
development process can be divided into two major
groups: membership support organisation (MSO) and
grassroot support organisation (GSO).
In evaluating the role of NGOs in economic
development three questions are needed to be raised. The
questions are:
1) To what extent is the autonomy of local NGOs
compromised by their interaction with State and
financial institutions, and international NGOs in
the regional development process?
2) Do NGOs actually have the institutional capacity
to fully influence development in which they
participate?
TABLE 3.9
District-wise Distribution of NGOs in Haryana in 2000
Sr.District I II III IV V VI VII T o t a lNo.
1. Ambala 2 4 7 2 8 5 12 40
2. Bhiwani 6 4 2 1 5 - - 18
3. Faridabad 1 1 6 1 - 1 - 10
4. Fatehabad 1 - - 1 - - 1 3
5. Gurgaon 4 4 8 - 2 3 2 23
6. Hisar 3 1 4 - 1 3 9 21
7. Jind 1 2 - 1 - 6 9 19
8. Jhajjar 2 2 1 - - - 2 7
9. Kaithal 3 - 1 - 1 5 14 24
10. Karnal 3 2 5 - 4 12 16 42
11. Kurukshetra 2 - 1 - 1 1 4 9
12. Narnaul 1 - 2 - - 1 5 9
13. Panipat 6 7 - 2 - 9 15 39
14. Panchkula 6 - 3 1 1 1 9 21
15. Rewari 1 1 1 - 2 2 5 12
16. Rohtak 5 4 2 3 4 1 11 30
17. Sirsa - 3 3 - - 2 6 14
18. Sonipat 1 3 2 2 9 2 5 24
19. Yamunanagar 1 2 4 - 2 1 32 42
Total 49 40 52 14 40 55 157 407
Source: Voluntary Organisations in Haryana, Directory 2000 published byDirector, Social Justice & Empowerment Department, Haryana,Chandigarh.
The role of NGOs in the development process of
Haryana in the light of the questions raised above. The
Department of Social Justice and Empowerment deals
with NGOs. According to voluntary organisations
Directory 2000, there were 407 such organisations which
can be classified in seven categories i.e. (i) child welfare,
(ii) women welfare, (iii) handicapped welfare, (iv) aged
welfare, (v) training and education, (vi) medical aid, and
(vii) miscellaneous.
The district-wise distribution of seven-category of
voluntary organisations in Haryana has been shown in
Table 3.9.
Out of total 407 voluntary organisations, 47.4 per cent
are only of five districts, that is, Ambala, Karnal, Panipat,
Rohtak and Yamunanagar. 38.5 per cent of the total NGOs
are of miscellaneous nature whereas medical aid related are
only 13.5 per cent. Training and Education related are only
9.8 per cent. Child welfare related were 12.03 per cent
followed by women welfare related 9.8 per cent. Aged
welfare related institutions are only 3.43 per cent in the
State. The multiplicity of agencies in a particular field of
social welfare and absence or inadequacy of such agencies
in other field may not be conducive for the social welfare in
the State as the most needy groups may remain neglected
and the efforts to ensure integrated development
consequently suffer. It is also expected that limited
financial resources are put to best use in order to increase
the utility of the social welfare programmes. According to
some empirical studies, the position of NGOs related with
woman’s welfare and empowerment in rural areas is not
good. It is clear from the record of concerned Nehru Yuva
Kendra and Block Development Office that the number of
such NGOs were inadequate and even most of them were
either breaking up, dead or not so active. This is happening
due to several factors such as illiteracy and poverty;
excessive domestic work and other responsibilities; male
dominated society; Purdah System; lack of knowledge
regarding rules & regulations/training programme; lack of
technical knowledge; lack of creative movement(s) by
women at local level; and lack of income generating
activities or programmes etc. Similarly all other types of
NGOs also suffer from such shortcomings. One role of
NGOs in the Development Process centres around three
major issues.
(i) their reliability in representing the political and
economic interests of their constituencies in the
development process;
(ii) the degree to which NGO autonomy was
compromised by their interaction with State and
financial institutions and transnational NGOs;
HARYANA DEVELOPMENT REPORT222
(iii) the actual effectiveness of NGOs in influencing
the development process towards the interests of
their named constituencies.
Theoretical and empirical studies do not entirely reflect
the experience of NGOs participation in development
programmes; they do point out some of the important
difficulties surrounding the partnership between NGOs,
local State and the World Bank. The growing inclusion of
civil society organisations in the implementation
programmes reflects the assumption by the multilateral
development banks, especially. The World Bank, that both
local NGOs and local State have the social trust and social
capital necessary to conduct this type of partnership
advocating and emphasising the adoption of Participatory
Approach to Development Through NGOs—which can
also be termed as Community Based Development (CBD)
which takes into account the local and community needs
and expectations in development process. The evidence
gathered in such studies on NGOs in developing countries
including India and Haryana is no exception to it indicates
that NGOs were ineffectual in their attempts to influence
the process of policy-making. In addition to this, they
even seemed unable to maintain channels of political
accountability to their constituencies. The NGOs
participating in the development process exhibited the
same institutional weakness of the State that they were
trying to hold accountable. Moreover, most NGOs did not
have financial autonomy and were heavily dependent on
State funds to function.
These studies also reveal that the participation of
NGOs in Development had very little effect on engaging
the grassroots segments of civil society. The lack of
grassroots engagements left the NGOs isolated in an
internal struggle with the programme governing organs.
As a consequence of this, NGO representatives were
outnumbered by the State officials; they were technically
ill-prepared, and did not have the social leverage to obtain
meaningful concessions from the State government and
other donor agencies.
The NGOs leadership in developing countries/regions
seemed to have increasingly become adjusted to the
institutional arrangements proposed by the World Bank.
Meanwhile, the intervention of transnational actors (i.e.
The World Bank and Transnational NGOs) seemed to pose
additional challenge for the autonomous development of
both the local State’s and civil society’s institutions.
After discussing all this, it can be concluded that the
participation of NGOs cannot be considered a penance for
deficient popular involvement in the implementation of
development programmes. Nevertheless, it is also
necessary to resist the temptation of “throwing the baby
out with bath water”. Strong State and civil society
institutions should be established and encouraged to
improve the conditions for democratic governance.
Panchayati Raj institutions should be strengthened in the
State by giving them financial autonomy and providing
technical knowledge so that they can prepare and present
their case(s) of local development needs. This will also
increase the employment potential of the village economy
of Haryana by expanding and strengthening, the service
sector. This will also motivate the village-youth to
technical and computer education—inevitable for fulfilling
Haryana Vision-2015.
However, their (NGOs) present institutional
weaknesses in Haryana leave such a potential unfulfilled.
In addition, there are no indications that local NGOs will
be able to become financially autonomous. Furthermore,
it is necessary to indicate that, given the present
institutional reality in both State and civil society,
achieving a more participatory process of development in
Haryana will not be a quick process. However, to make
the participatory approach an integral part of the
development process, Government of Haryana should
concentrate on the following policy-reforms:
(i) The targets of development should be realistic
reflecting the strength of the existing social and
political institutions.
(ii) The government must recognise the need to
structure the participation of NGOs in its
programmes according to the specific realities of
each case. The model of participation should be
sensitive to the social and ethnic diversity of the
programmes beneficiaries. The identification of
institutional capability of both State and civil
society organisations must be a priority during the
design of economic development programmes.
(iii) The government should have clear targets
regarding the development of democratic and
administrative capacities in both the State and
civil society. Among these capacities, the State
should aim at developing conflict management
systems and channels of political accountability at
the grassroots as components of its participatory
models.
(iv) Finally, policy reforms should also be embraced
by the NGOs. Local NGOs should focus on the
strengthening of their own democratic channels,
which could allow their named constituencies to
become fully engaged in the economic
development process.
Chapter 4
Policy Directions
HAR
YANA
4.1 Achievement of Projected Growth Targets(Aggregates and Sectoral)
As per the latest data, Haryana has come up at first
rank according to the per capita income in its 40th year
after establishment in 1966. The decadal growth of
Gross State Domestic Product (GSDP) at constant
prices has increased from 5.5 per cent (in 1960-61 to
1969-70) to 6.71 per cent (in 1990-91 to 1999-2000)
steadily. In the same period, the decadal growth of per
capita Net State Domestic Product has increased from
2.6 per cent to 4.42 per cent. Clearly the momentum of
growth has been increasing with greater force in
Haryana in all the four decades.
During the period 1995-2004 also the average
growth rate of GSDP has been 6.65 per cent. In the
first three years of the Tenth plan, Haryana has been
able to achieve only 6.3 per cent growth rate of GSDP
whereas the target set by Planning Commission is 7.9
per cent. We are lagging in all the sectors, especially far
behind in primary sector where the State has achieved
only 2.9 per cent growth against 4.1 per cent set by the
Planning Commission.
To achieve the target growth rate with incremental
capital output ratio fixed at 3.58 at least 28.64 per cent of
the GSDP need to be invested every year. At current
prices, an amount of Rs. 23,618 crore will be required
in the fourth year of the Tenth Plan and, after that the
amount should be increased at a rate of 10 per cent to
clear the backlog. The total capital developmental
expenditure of the State has been only Rs.1019 crore,
which is only 4.31 per cent of the required investment.
It means that most of the investment has to be in the
form of private or foreign investment. However, huge
investment opportunities are available in agriculture,
construction, urbanisation, transport, communication,
banking, retail and information technology. The State
government will have to act strategically to attract the
investment. In the forthcoming paragraphs, some policy
interventions have been recommended sector-wise.
4.1.1 Primary Sector
The growth rate in the primary sector during 1990-
2000 has been 4.07 per cent. But average growth rate at
constant prices during 1995-2004 in this sector has
slipped down to just 2.69 per cent. In the first three
years of the Tenth Plan, this growth has been only 2.97
per cent at average. To achieve the growth target of 4.1
per cent as fixed by Planning Commission, at least 8.16
per cent of the share of primary sector in GSDP should
be invested every year. This will need an investment
outlay of Rs. 6235 crore every year. The share of State
expenditure on agriculture to total has been falling by
2.196 per cent per annum during 1990-2005. The major
causes of sluggish growth of agriculture in recent years
have been fall in investment, increase in the number of
small and marginal landholdings, repetition of the
cropping cycle, fall in the underground water level, soil
erosion, increasing salinity in the soil, excessive use of
chemical fertilisers and pesticides/insecticides. Clearly
the State needs a second Green Revolution. For this,
there is a need to augment investment in the
agriculture research and development.
The most important factor affecting agriculture
output is the availability of water. The length of main
canals increased only by 42 miles between 1981-1991 and
this increase was just 24 miles between 1991-2001. This
declining trend is a serious matter. However, the pace of
increase in distributary canals have been at a satisfactory
level. The net area under irrigation became highest in
year 2001 (2958 thousand hectares), and has been falling
thereafter till 2004. Each additional irrigated hectare of
HARYANA DEVELOPMENT REPORT224
land gives employment to eight additional labourers. If
the State gets its due share of water, one lakh hectares
of additional area can be brought under irrigation. Thus,
State may be able to produce additional grain worth
Rs.1000 crore. Southern Haryana is still starving for
water. The matter of SYL canal has taken a political
colour and does not seem to have any solution in near
future. It will not be prudent to increase the total area
under cultivation with more land, low-capital, low-
labour, less water strategy; rather we should focus on
efficient use of water. Since the State is not able to do
maintenance work of miners in a cost-effective manner,
investment must be diverted to use pipelines for carrying
water instead of miner canals with user-charges. This
will not only control the seepage but will also reduce
the salinity and water logging problems. One time
subsidy can also be given to the farmers for installing
drip or sprinkler irrigation systems.
Encouraging cultivation under green house sheds
and thus reducing all kind of weather risks can increase
the agricultural productivity. The optimal size of a
greenhouse shed is one canal. It requires an investment
of Rs. 5 lakh including shed, system for controlling
temperature and humidity, irrigation, etc. A number of
vegetables, flowers and fruits can be grown under
greenhouse shed to get high yield. Some private
companies provide consultancy, know-how, seeds and
marketing facilities with purchase contract. This is
known as high capital-low land-low labour-low inputs-
high yield strategy. The payback period for such
agriculture is presently less than one year. The 22 per
cent of landholdings by numbers (and 63 per cent by
area) are of more than 3 hectares. It means 3,78,362
number of farmers can build up a greenhouse shed with
the help of financial institutions, State agriculture and
horticulture departments and private agro-marketing
companies. Thus, there exists an opportunity of
investing minimum Rs. 18,918 crore. Since this
investment will be highly safe any financial institution
can lend for such purposes easily. The State can take
lead to create a conducive environment for such
cultivation. Even if the prices of farm outputs go down,
subsidies are slashed or payback period increases, the
profits will surely be generated. This type of farming
can also generate quality employment of 12 lakh
persons in supervision, packing and transport of farm
output. The greatest advantage is that the quantity of
farm inputs in terms of water and chemicals shall
diminish and then decrease, saving the environment.
The only input that will increase is the electricity, but
farmers will be happily ready to pay for the electricity
bills with high yields. They can install their own
generator sets also which could be run by bio-diesel or
power generated from bio-mass in future. The share of
agriculture exports from the State will also go up. The
future of the farmers lies in cultivation of fruits,
vegetables, flowers, herbs and organic foods.
The chemical fertiliser subsidies are more beneficial to
the fertiliser companies, government, bureaucrats,
politicians and big farmers. The government imposes a
very heavy customs duty on the imported feedstock and
thus earns money out of it. Thus, the cost of the
feedstock rises and government provides the subsidy(ies)
to the companies to cover the cost. The government
fixes the costs, prices and even dictates about the
standard costs. The fertiliser company has little scope to
innovate. Besides this, Y.K. Alagh committee has found
that most of the fertiliser plants have concealed capacity
and thus they are producing more than the declared
capacity to earn subsidy. The objective of the fertiliser
industry is not to minimise cost; but to maximise
production as they have fixed profits.
A study of the data regarding the farm subsidies and
foodgrains productivity in certain selected countries
would help us to show that the quantum of subsidy in
terms of US $ (as value of agricultural production) per
capita and per hectare of arable land is very much less
as compared to that of some of the advanced countries.
However, a developing country like India cannot afford
to spend huge amounts by way of subsidy. It is obvious
that in the interest of overall agricultural development
and to keep the fiscal deficit within manageable limits,
there would have to be a ceiling on quantum of
subsidy. In fact, the level of subsidy on fertilisers has
reached a level of Rs.13,975 crore (Budget Estimate for
1999-2000). Total food grain subsidy in 2004 was
around Rs. 25,000 crore. This level of subsidy does not
seem to be any more sustainable.
The government should abolish all subsidies for
chemical fertilisers in a specified period of time.
Simultaneously, it should allow the fertiliser
manufacturers to buy fuel, oil, naphtha and natural gas at
international prices with zero customs duty. The import of
fertilisers should be eased so that our companies can
compete with the best ones in the world. Even if the
prices of fertilisers increase and the farmers are not able
to purchase required chemical fertilisers they can be paid
the subsidy directly in cash against a simple purchase bill.
This will be a much cheaper way of providing subsidies to
the farmers and the government will be in a position to
track the beneficiaries to steer its policy in the future.
Chapter 4 • POLICY DIRECTIONS 225
In fact as per the provisions of WTO, the indirect
subsidies should be given to promote agriculture. For
example there can be provision of subsidies to promote
the efficient use of water in irrigation methods like drip or
sprinkler systems or crops, which need less water. All
direct subsidies should be converted in the indirect ones
such as agricultural research and irrigation or water
harvesting or water shed management infrastructure or
soil conservation or environmental protection or bio-
fertilisers to be in the “Green Box”.
Panchayats need to be strongly encouraged by subsidies
to build and maintain water-harvesting structures,
especially in view of the continuing deterioration in the
condition of ponds/water tables. Wherever additional
water resources are still available, the success of the pilot
tube well groups programmes suggests that this may be
the way of the future. Under this programmes the wells
are dug with public money and then a beneficiary group of
small and marginal farmers is formed and assigned
responsibility for repair and maintenance of the tube well.
In order to increase crop yields and reduce pesticide
use, there are also significant gains possible from moving
towards integrated pest management (IPM), which uses
information about the life cycle of crops and their pests to
determine the type and degree of crop protection needed
in local contexts. The subsidies should be redirected to
promote use of organic fertilisers, bio-catalysts and bio-
sprays. The global demand for organic coffee, cotton,
honey and wheat is increasing. There is a need to
establish testing laboratories and certifying mechanism to
promote the cultivation of these products. Farmers need
help to create websites to showcase their products. Roads
are needed for the foreign buyer to visit the fields.
There is a need to establish a new public sector
undertaking—Indian Organic Exports Promotion
Corporation—to promote these exports, and subsidies
should be provided on such exports. This will
spontaneously help the small farmer as he will grow these
products, which require intensive labour management.
The subsidy given for electricity, diesel and chemical
fertilisers should be reoriented in this direction. This will
lead to increased price of these inputs but he will be
compensated by the subsidies on organic produce. He will
be benefited by the access to growing market. The net
effect on the small farmer will be zero-plus but on the big
farmer it will be negative and there will not be any need
to tax his agricultural income.
4.1.2 Secondary Sector
The decadal growth of secondary sector has slowed
down from 15.08 per cent during 1981-1990 to 8.37 per
cent during 1991-2000 in Haryana. It was 7.02 per cent
during 1995-2004 and has been still less at 6.1 per cent
during the first three years of the Tenth Plan against
the target of 9.6 per cent. However, the share of
secondary sector increased from 11 per cent to 24.6 per
cent to 28.6 per cent in the decades of 80’s, 90’s and
thereafter respectively increasing at a meagre rate of
0.489 per cent and then started decreasing, now it
stands at just 27.8 per cent. Clearly, it is the tertiary
sector, which is responsible for the growth in the
State. To achieve the targeted growth rate with ICOR
7.77 at least 20.71 per cent of GSDP must be invested
in the sector. This will require an investment outlay of
Rs.17,411 crore per annum at current prices.
The total factor productivity in the manufacturing
sector based on value-added Function as well as on
Gross output function has been increasing during
1992-93 to 1999-2000. The index of industrial
production has also been increasing by a rate of 5.99
per cent during 1998 to 2003. In the first three years of
the Tenth Plan it has increased at an average growth
rate of 6.1 per cent.
The annual plan expenditure on energy has been
growing at a rate of 5.365 per cent during 1980-2005. The
per capita consumption of electricity has been increasing
at a rate of 6.36 per cent. The share of electricity
consumption in industrial and commercial sector has been
falling. More connections are being given to the domestic
sector as they are better payers or to the agriculture sector
as a political compulsion. The industrial sector has been
suffering as far as power is concerned. However, the
quality of electricity supply is very poor in the rural area
and farm sector. This is the main reason that farmers are
not willing to pay the power bills. There has been a
number of hidden costs in the form of more farm
supervision, damage to the water pumps, burning of
transformers and increased uncertainty. Since most of the
farmers have a flat rate system, thus there is no chance of
overuse of the electricity by the farmers. However, this
leads to the cultivation of water intensive crops. The SEBs
impute all power losses and thefts of all sectors including
their own corruption and inefficiencies on the farmers
which is not the reality. In last few years due to partial
reforms in the power sector the reporting of T&D losses
has improved. There is a huge investment opportunity in
the power sector due to ever increasing consumption and
paying capability of the users.
Although the ICOR ratio in this sector is very high but
the safe returns can be ensured by the introduction of
HARYANA DEVELOPMENT REPORT226
power reforms with proper blend of market mechanism,
strict punishment to the power thieves and reasonable
charges for the users. It is recommended that the State
should use the distributed power production model.
The electricity farming by solar power not by photo-
voltaic method but by focusing of sun rays by a concave
mirror, wind-mills, bio-mass energy (using dung),
biodiesel or solid plastic wastes generated from urban
areas should be the new methods of power generation.
The people i.e. farmers, co-operatives, municipal bodies,
private parties and shopkeepers should be allowed to
produce electricity by any method. The State should
focus only on the mechanism to ensure minimum
support price to the producers and regulate the
emission norms to contain air pollution. The small
producers can absorb the costs of overheads very easily
and the power can be produced at almost negligible
marginal cost in some cases (like solar energy). The
Power Trading Corporation can purchase it at a rate of
Rs. 2.5 per unit. This will convert the farmers into
power producers who will get the bill and will not be
blamed for not paying the bills.
If every producer is allowed to produce 3000 units
per month, that is, around four units per hour it will
ensure an income of Rs. 7500 per month to him. The
technology can be imported from a Canada based
company SolarGen Inc. or can be developed
indigenously. One such unit shall not cost more than
Rs. 1 lakh. The average population of villages in
Haryana is 1830, which implies that there are around
366 families in each village. Thus, a maximum of
around 90 families can take production of power, even
if they have to sell it to their own village. Thus, total
6,08,708 power production units can be installed to
provide electricity only to the rural area. This can
absorb safe investment of Rs. 6087 crore. Even if 20
families in each village are engaged in such a
distributed power production system, Rs. 1353 crore
may be invested. Even if extra power is generated it can
also be sold to the industries or to the other States.
Such a production system will take care of the equal
distribution of income. This will increase the demand
for batteries, inverters, electrical appliances and white
goods in the rural areas.
The ICOR in the construction is very low i.e. at just
0.99. The construction sector can also employ large
number of unskilled and semiskilled workers. It (sector)
is also related with the urbanisation strategy. The trends
of urbanisation show that population growth rate in the
urban areas of Haryana is increasing at a rate of 2.62 per
cent against the overall growth rate of 1.668 per cent.
The expected number of urban areas by year 2020 will
be 111. In 2001, 29 per cent of the total population was
living in urban areas; and this percentage will reach to
43.38 per cent by 2010. It means that every year around
1.61 lakh persons are adding to the cities. This requires
additional 32 thousand houses every year to be
constructed. Even if each house costs between 3 to 10
lakh rupees, it will require an investment Rs. 960 crore
to Rs. 3206 crore by the household sector only.
It should be understood that the prices of properties
increase by provision of roads, electricity, water and
sanitation by more than 40 to 80 times. The Haryana
Government should plan all the cities in such a way that
they are connected to a hub of villages by circular ring
roads with fast transport and connectivity system. The
existing 97 urban areas can be connected to the villages
by an average peripheral road of 60 kilometres so that
even the farthest villager can reach to the city and come
back within one hour. This will require building good
quality roads of 6500 kilometres. With this kind of
strategy, the industrial manufacturers will be induced to
start their production units in the rural areas; and the
congestion, pollution and rise in property prices and slum
areas in the cities will be controlled. The production
process will shift from urban to rural areas which can
absorb more pollution. The cities will become the centres
of services, maintenance, R&D, art and culture, education
and science. The fast connectivity shall ensure the supply
of skilled labour in both the areas in time. Such a system
shall also be highly conducive for growth of ITES like
BPOs and KPOs in the suburban areas as the youth living
there will demand less wages and will be more loyal.
The Haryana Government is planning to take the
advantage of NCR by developing three new cities near
Kharkhoda, Badli and Samalkha. In Bahadurgarh an
industrial shoe park and Rajiv Gandhi Education City
shall be developed in Kundli. A Haryana highway
circumventing Delhi shall be laid from Palwal to Sonipat
connecting four National Highways. On other side, HSIDC
has decided to develop two modern industrial cities in
Sonipat and Rewari. To attract the investment in the
State, four big private companies have been allotted the
land also. It is to be cautioned that all these activities can
take heavy toll on the eco-balance. Earlier, the expansion
of Delhi has seriously damaged the Ridge and southern
forests and now the expansion of Gurgaon is threatening
the greenery of Aravallis. So, whatever is being done in
the State for the development, extreme care should be
taken to save the ecology. The investment in Haryana
can be attracted easily because of its proximity to NCR
and it will not be difficult to invest about Rs. 2 lakh
Chapter 4 • POLICY DIRECTIONS 227
crore in next five years, generating employment to 10
lakh persons by the construction activities and the
process of urbanisation alone.
4.1.3 Tertiary Sector
The decadal growth rate of GSDP in Haryana has
been 8.38 per cent in 1990 to 2000. The share of
tertiary sector has increased from 30.2 per cent to 37.8
per cent between 1980 to 2000. Presently, this share
stands at 42.7 per cent in 2004. The average growth
rate of tertiary sector at constant prices during 1995 to
2004 has been 9.83 per cent. In the first three years of
the Tenth Plan it has been 9.07 per cent against the
targeted 10.3 per cent. To meet the target there should
be an investment of Rs. 6130 crore every year in the
tertiary sector.
There are huge investment opportunities in the
retail, communication and financial services. The Indian
retail sector is the most attractive one in the world. It
is around 10 per cent of the GDP. Using same
assumption about Haryana there exists a market of Rs.
7497 crore. If this grows at a rate of 8 per cent per
annum and the ICOR in the trade is 0.91 shall mean
that only trading can absorb investment of Rs. 546
crore per annum. There is a possibility of opening at
least 6 big shopping malls and 30 super markets in
Haryana State. Each mall can be of minimum 5000
square metres. Even if top ten companies decide to
enter in Haryana in the retail sector there is potential
of investing Rs. 6000 crore. But this investment may
spread over next 7 to 10 years.
The ICOR in the communication is comparatively
high, fixed at 8.33, that is, there is approximate return
of 12 per cent per annum. The demand for the land line
telephones and mobile phones is increasing. Haryana
ranked at ninth place according to teledensity among
16 major States in 2000 and it was just 3.35 per cent. In
Haryana 12.72 per cent households have a telephone. The
top nine districts (and also above Haryana average)
according to percentage of families having a telephone are
Panchkula (29.95), Ambala (25.31), Kurukshetra (17.96),
Yamunanagar (17.92), Faridabad (15.55), Panipat (14.4),
Rohtak (13.88), Gurgaon (13.78) and Karnal (13.7). One
of the objectives of the New Telecom Policy-99 was to
provide reliable telecom facility to all villages by 2002, but
out of 6,07,491 villages only 3,74,566 villages had village
public telephones in February 2000 (Mid-term appraisal of
the Ninth Plan, Planning Commission, New Delhi
2002). But the all-India rural teledensity is only 1.278,
compared to an overall teledensity of 66.13 for the US,
14.26 for the world, and 2.2 for the whole of India. The
NTP-99 also proposes to increase rural teledensity to
four by 2010. The data related with rural teledensity in
Haryana is not available but what is true about all-India
can be said about Haryana also. It is a good sign that
instead of land line phones the mobile phones are fast
penetrating rural India. Out of 2 million BSNL mobile
connections, 50 per cent are in rural India. If we
assume that 80 per cent of the families use the
telephone services in Haryana, a total market potential
of more than Rs. 1214 crore per annum will be spent
on such services as a conservative estimate. This will be
1.62 per cent of the GSDP at current prices. There is
an investment potential of Rs. 10,000 crore in Haryana.
If this is spread over next ten years then every year Rs.
1000 crore of investment is possible in Haryana.
Another big opportunity to invest in Haryana is in
financial services. The ICOR for this sector is very
lucrative standing at 1.56. The interest rates are generally
high in the informal sector particularly for the farmers. It
is observed that more than 60 per cent of the farmers pay
their interests/principals or installments of loans in time.
This figure is as low as 40 per cent in case of
businessmen. Still the banks are not able to meet the
targets of farm-lending. The investment in agriculture
with new technologies can reduce not only the variable
costs of farm outputs in short-run but also the risks of
farming. On the other hand it is big opportunity for
bankers to increase their scope.
4.2 Optimum Use of Natural Resources
4.2.1 Forests
The forest area in Haryana increased at a rate of 0.76
per cent during 1966-67 to 2000-01. The covered forest
area was highest in 1991 (1,69,000 hectares); after that it
began decreasing, and is presently 1,15,000 hectares,
which is 2.6 per cent of the total land area in Haryana. It
is clear that the phase of development after the
globalisation process has taken its toll and has seriously
affected the environment. It has also been reported that
the quality of the covered forest area has been
deteriorating continuously. The roads where the width
was increased or doubled, the trees were felled down but
forest department has not shown the decreased forest area
in its papers. The permanent pasturelands have also been
decreasing at the rate of 1.874 per cent per annum.
However, in the last ten years the area has increased by
12,000 hectares. The forest cover can be increased by
using barren and non-cultivable land (102 thousand
hectares), cultivable but barren land (18,000 hectares),
HARYANA DEVELOPMENT REPORT228
and fallow land (232 thousand hectares). It means that
forest covered area can be increased by maximum of 1.9
per cent more. However, persuading the farmers to
increase agro and farm forestry can increase the private
forest covered area. The State should declare the
minimum support price for the farm forest output and
introduce adequate competition in the timber
merchants.
The public policy in case of the protection of the
forest and environmental resources has failed due to
inherent problems of command and control regime. It
has been proved by Ronald Coase that effective property
rights of the natural resources given to the people can
protect the environment in an optimal way. The State
can act as a better regulator but may not be effective in
protection or maintenance of the resources. Wherever
possible, the protection and maintenance of the forests,
pastures, common properties should be handed over to
people with strict regulation and clear property rights.
This can generate a number of employment opportunities
also which have been discussed in Section 4.3.
4.2.2 Soil
The quality of the soil in Haryana has been found
deteriorating. In 1978, Haryana was at third rank
according to the quality of the soil index. Now the organic
matter in the soil has reached below 0.2 per cent in many
districts as a result of intensive farming, overuse of
insecticides and pesticides and burning of wheat husk by
the farmers. It has been reported that decreasing fertility
of the soil is resulting into decreased quality of the fodder
and food crops. In future not only the fertility of the soil
but that of animal and human being may also be seriously
affected. Due to this, production of milk may be
affected, which is the source of livelihood and
employment for large number of rural people.
The productivity of the wheat and rice has plateaued
and further increase may not be possible. Total cropped
area increased at the marginal rate 0.72 per cent during
1966-67 to 2002-03. The net sown area has been
decreasing marginally. The per hectare consumption of
fertiliser increased at the rate of 9.89 per cent during
1966-67 to 2003-04, but due to decreased fertility the
marginal productivity of fertiliser has been halved. The
negative effects of the green revolution have come up. As
now the farmers do not leave the land uncultivated even
for ten days. Therefore, there has been problem of
increased threats of insects and pests. The farmers are
also not prudent in the use of agro-chemicals. It was
found that the farmers have not been spraying the
insecticides and pesticides rather they pour them in the
farms. The farmers generally do not get their soil tested
and use excessive nitrogenous fertilisers, but the
requirements of the phosphates and potassium fertilisers
remain unmet. A serious policy intervention is required to
promote the use of organic, bio/compost fertilisers,
organic sprays and integrated pest management
practices. In a village in Andhra Pradesh, farmers were
able to save Rs. 30 Lakh by using mixture of neem
leaves and chilli powder to control the insects instead
of using chemical insectides. There is lot of indigenous
knowledge, which should be strengthened.
4.2.3 Industrial Pollution
The challenge before the policy makers is to switch
from the Command and Control regime to that of a mixed
instruments based regime. The Command and Control
regime suffers from a number of inherent limitations. The
standards related with pollution control are source
specific, either technology based or performance based.
The CAC policy gives very little options to the polluters
to search for cleaner technology or improved abetment
technologies. The penalties for non-compliance with the
standard are not related to the compliance costs. The
prosecution decisions and even court decisions are based
on compliance or non-compliance and not on the extent
of compliance. The fines are very nominal and are
independent of the quantity and quality of the emissions.
The Haryana State Pollution Control Board does not have
adequate trained manpower and equipments to detect
violations and prepare the cases. The judicial system is
characterised by lack of expertise on the part of the judges
on environmental matter, long delays in delivering
judgments. There is no viable alternative dispute
settlement or consolation mechanism or other channels
for enforcements. Like adverse publicity affecting farm’s
market prospects, innovative auditing procedures and
involvement of the local people, agencies, in monitoring
have not been tried. The ambient and the source
standards are laid down independently unrelated to the
volume of pollution generation activities. Hence, it is
quite understandable, quality of environment continues to
deteriorate even with a high degree compliance. Following
policy measures have been recommended:
1. The State Pollution Control Board should be held
accountable for any damage to the environment. Its
performance should be audited by an independent
agency like Centre for Science and Environment
(CSE) or TATA Energy Research Energy Institute
(TERI) or National Environmental Engineering
Research Institute (NEERI).
Chapter 4 • POLICY DIRECTIONS 229
2. The Board should collect detailed data on
production, assimilation and dispersion of
pollution for different areas. The marginal costs of
pollution abetments should be computed with the
help of economists for all industries, for all kind of
pollutions for air, water and solid waste.
3. Water is an exhaustible but renewable resource
but depletes. Any kind of subsidy given to the
users (households, farmers or industrialists) leads
to overuse of resources. All kind of subsidies
should be slashed slowly in phases. The water
provided through canals should be priced
according to the marginal productivity of water for
the crops. It has been found that in many districts
in Haryana the underground water level has gone
below even more than 200 feet. Even the third
layer of the water has been exploited. The
economic sense suggests that extraction rate of
water should be less than or equal to recharge
rate. Many geologists have opined that even if the
total rain water is harvested, still the underground
water level recharge rate cannot match the
extraction rate. The crisis is hovering on us, and
there is only one solution, that is, to decrease the
consumption of water. The farmers will have to
diversify into the crops which require less
irrigation. However, it does not seem to be
politically viable to increase the water charges as
farmer lobby is strong in Haryana. The technology
can be the answer to the problem. Dip irrigation
system and sprinkler systems can minimise the use
of water.
The consumption of water in the urban area for
domestic use has also been rising. Every urban
authority and local bodies providing water supply
service should install effluent treatments plants
(ETPs). The cost of operating ETPs is very high
due to high energy use. So their maintenance,
repair and operating may become unviable in long
run. Instead of power run ETPs, we can use
various bio-intermediation processes and corral
cultivation for water purification.
A proper pollution tax should be imposed on the
industries comprising of a lump sum tax, tax on
volume of water used, tax on volume of effluent
generated and separate tax for concentration of
the pollutants in the effluent water.
4. For controlling the air pollution, the tradable
permit system should be introduced. The firms
can decide to buy a permit for pollution, pay a
tax or can pollute and face the litigation. If the
firms have a choice, they will minimise their
costs by choosing the right method. This will
improve the innovation in the pollution
abatement technology. Over a period of time the
firms will reduce the costs and pollution both.
Theoretically, it can be proved that the marginal
cost of pollution abatement becomes equal to
pollution tax and equal to the price of permit in
an efficient system. Most of the air pollution is
vehicular in nature. It is a major problem of the
cities. The environmental laws should be strictly
implemented. Generally the motorists and vehicle
owners get the pollution-checked certificate after
paying a fee. The authorities use the fees as a
source of revenue generation not as a tool of
pollution control. The fee charged from the vehicle
owners should be according to the level of
emissions. This will force the vehicle owner to use
additional pollution control equipments or to
purchase less polluting vehicles.
5. The solid waste generated from the households
can be used for recycling, to make compost
fertilisers, energy production, bio-fuel production
or landfilling. The urban citizens should be
persuaded to keep three types of dustbins—one for
recyclable wastes, second for biodegradable wastes
and third for plastic wastes. This segregated solid
waste can generate a lot of employment. According
to one report, Haryana is one of those States
where everyday 30 gm per capita plastic waste is
produced. It can make 86,000 litres of diesel every
day from the urban plastic wastes. It is also
estimated that 3000 tonnes of compost fertilisers
can be prepared everyday in Haryana. The solid
waste is money lying unnoticed in the garbage.
6. For sustainable development, the State should
follow Hartwick-Solow approach. It suggests that
the stock of capital could be held constant by
reinvesting all hotelling rents from non-renewable
resources extraction in manmade capital.
Therefore, the State should ensure investment
equal to value of extracted mineral every year in
the search of new minerals.
7. It is found that there is a possibility of
substitution within the different natural
capitals. The manmade capitals are also
substitutable for each other but there is little
possibility of substitution between manmade and
natural capitals. So with every developmental
HARYANA DEVELOPMENT REPORT230
project, there is a definite loss of natural
environmental assets. To contain this loss, the
State should invest in a shadow project with
strong sustainability constraints.
8. The harvest levels of renewable resources should
be set less than or equal to population growth rate
for some pre-determined population size. For all
degradable pollutants assimilating capacity for
receiving eco-system should be established. The
waste discharges should be maintained below the
assimilation rates. The discharge of the
accumulative pollutants should be set close to
zero. All the earnings from non-renewable
extraction should be divided into an income
stream and an investment stream. The investments
stream should be invested on renewable resources.
The polluters pay principle (PPP) should guide the
policy for consumers, producers and distributors. The
polluters should have a choice of either purchasing a
pollution permits or to pay the pollution tax or to use a
technology to abate the pollution. If any of these three
does not help in compliance or meeting the standards, the
pollution control board should use CAC methods. The
State should train the environmental NGOs in pressure
making tactics on local bodies, politicians, corrupt
industries and bureaucrats. A number of research studies
have shown that there is positive correlation in the
environment quality and training of environmental NGOs.
The public action is the most effective deterrent to the
colluding corrupt bureaucracy and polluting industries.
4.3 Sustainable Development and GainfulEmployment of Human Resources
One of the most important roles of the State is to create
conditions in which people can find right kind of
employment according to their skills and knowledge. The
income earning of the people depends upon their basic
abilities, acquired skills, knowledge and education and
experience. It is also implied that the services of labour
have to be combined with appropriate capital—natural,
manmade, physical capital or financial for production of
goods and services. The employment is a right to
participate in the production process. How this right can be
assured to the individuals is the basic question before us?
Out of total population of 2.108 crore in 2001 of
Haryana, 31.24 per cent, that is, around 65.43 lakh is
between the age group of 20-39 years which we can call
the employable youth. If we assume they are growing at
a rate of 1.67 per cent per annum now this figure should
be roughly 71.08 lakh. By the year 2012 around 79.82
lakh people should be employed. The percentage of
population between age group 20-59 in 2001 was 45.62
that is around 96.17 lakh of which 39.62 per cent, that
is, 83.52 lakh were already employed. It means that there
was a gap of 12.65 lakh in 2001. Thus out of total
employable persons, 19.33 per cent persons were
unemployed in 2001. Say if we want to reduce the
unemployment rate up to 4 per cent in the economy,
then Haryana will have to generate employment for 15.33
per cent, that is for around 10 lakh to clear the back log
and then every year around 17 thousand new jobs should
be created to give sustainable employment. It is worth
noting that Haryana has been at first rank among 16
major States during 1991-2000 according to growth of
workforce rate (2.83 per cent) of main workers. In 2003
there were 9 lakh registered unemployed persons in the
Live Register of Employment Exchanges in Haryana.
The average growth rate at constant prices of
Haryana in the first three years of Tenth Plan has been
just 6.63 per cent. This has to be increased up to 8 per
cent in the current plan. The share of primary sector in
GSDP is 26.4 per cent and 51.29 per cent workers are
employed in the agriculture and 45.15 per cent in total
primary sector. The share of the primary sector in
GSDP has been falling at a rate of 3.979 per cent at
constant prices. The share of employment also has
decreased by 23.35 per cent during 1987-88 to 1999-
2000 in the primary sector. The share of secondary
sector in GSDP is 30.9 per cent and has been
increasing at a marginal rate of just 0.489 per cent
annually from 1993-94 onwards at constant prices. The
number of workers employed in non-agriculture sector
are 48.71 per cent of the total working population. Out
of this only 2.56 per cent are employed in household
industries and 10.10 per cent are marginal workers. It
is very sad that the share of employment in the
secondary sector has also been falling during 1987-88
to 1999-2000 at a rate of 1.96 per cent and 12.45 per
cent persons were employed in the secondary sector in
2000. The share of tertiary sector in GSDP in 2004 was
42.7 per cent increasing at a rate of 3.513 per cent and
the share of employment in this sector is 42.4 per cent.
The share in employment in tertiary sector increased by
49.31 per cent during 1987-88 to 1999-2000.
The standard of living of the people can be raised by
increasing their income. Not only income, but the
distribution of income is also very important. It is
observed that 45.2 per cent of people in primary sector
are getting only half the share of GSDP. 42.4 per cent
people in tertiary sector are getting almost equal to
their share in GSDP. Thus, there is a need to shift a
Chapter 4 • POLICY DIRECTIONS 231
big percentage of people around 25 per cent from
primary to secondary sector. The secondary sector in
Haryana, has been growing at a rate of 7.02 per cent at
constant prices in the first three years of Tenth Plan.
The number of registered factories in Haryana have
increased by 1.63 per cent and the workers employed in
these factories have increased by 3.52 per cent during
2000-2003. Presently, 5.52 lakh workers are employed
in the registered factories. Only 19.11 thousand
workers are employed in the Cotton/Man-made Fibre
Textile Mills (Non-SSI) in Haryana state, and this
employment is falling at a rate of 1.189 per cent due to
large inefficiencies and the competition in the sector.
The 66.64 thousand workers are employed in Khadi and
Village Industries and it is growing at a rate of 5.23
from 1967 onwards. The important highlight is that the
employment in this sector has increased by 43.12 per
cent in the current plan, and this provides tremendous
opportunities for employment. If the growth of
industrial sector can be maintained with same
employment elasticity as at present, the per annum
employment requirement can easily be taken care. But
serious intervention is required in the policies to clear
backlog and to improve quality of employment.
The employment in the organised sector in Haryana
increased three-folds from 1966-67 to 1995-96. The
increase was 3.25 times in the public sector, including
Central Government, State Government, Quasi
Government, and local bodies’ employees comprising 64
per cent of the total employees in the organised sector.
After 1996, the employment in the public sector has
been steadily decreasing at an average rate of 2.46 per
cent. The decreased employment in the public sector
has been partly compensated by increase in the private
sector at a rate of 6.26 per cent per annum after 1996.
Still, the total employment in 2004 was less than that
of in 1996. The total employment in the organised
sector in year 2004 was 6,51,382, that is, 3.14 per cent
of the population and 7.93 per cent of the total
employment. This implies that 92.07 per cent workers
are in the unorganised sector.
It is also reported by a number of sources that the
casual, ad hoc and contractual jobs are increasing as a
result of economic reforms and competition resulting
from globalisation. It seems very difficult to increase the
jobs in public sector. The employment elasticity of
growth in the private sector is also very low. The third
sector i.e. NGOs could be another area where large
number of jobs can be created. However, the biggest
opportunity to create employment lies in self-
employment in Haryana. An alternative strategy has
been presented with clear guidelines in the forthcoming
paragraphs.
We can call this strategy as Employment Through
Assets or ETA. The ETA strategy. It assumes that every
individual—illiterate or educated, skilled or unskilled,
rural or urban, belonging to any caste—seeking
employment knows his potential best and he/she
should be given an opportunity to realise it. The food
we eat depends on how old we are. Similarly, the input
a State or a household family needs for development
depends on the level of its economic development. In
case of a nation, to begin with, development will be
primarily based on material assets, then on skilled
labour, and later on, accumulated capital and ultimately
on technological prowess. The families also can develop,
grow and raise their standard of living by self-
employment, if they have some minimum natural
endowment, some minimum skill level, some minimum
access to health facilities and some minimum
education. Those who are already better off are buying
education from private schools. The government has
failed to provide quality education to the poor in
Haryana. Even those who are getting education in
government schools are not satisfied. Same is the case
with the provision of health facilities. It is generally felt
that people are more interested in purchasing health and
education from private institutions. Therefore, the need of
the hour is to provide income to the people not the health
or education by the government. The self-employment can
generate the income, provided people have the assets
(properties) they can exploit with their existing skills. So,
it is recommended that State should help people in
acquiring the permanent assets through which they can
generate income. The assets can be physical (natural and
man-made), financial or knowledge based (education,
training, skills or intellectual).
1. The State has 102 thousand acres of non-
cultivable and barren land. It can allocate a
considerable portion of this land to unemployed
youth for cultivation of biodiesel plants
(Jatropha, Pongamia or Karnzia) or horticulture.
A one time subsidy on the purchase of
implements and drip irrigation systems can also
be given if possible up to 100 per cent.
2. The forest department of the State can allocate
the forest area along with the roads which is
around 58 per cent of the total forests area
(1,15,000 hectares) to rural poor, landless
farmers or scheduled caste persons for growing
vegetables with the strict conditions that there
HARYANA DEVELOPMENT REPORT232
should not be any damage to the trees. Of
course, the cultivators should not be allowed to
keep animals, make permanent constructed
buildings (house or shop). Their property rights
should be clearly defined so as there is no harm
to the environment.
3. Some politicians have been found making money
in the contracts of extracting sand and crushed
stone from rivers. The State can give access to
extract sand or stone from river beds to poor
unemployed youth with strict conditions
complying environmental laws.
4. The State should enact a law, which recognises the
contract between crop raiser and landowners. This
contract should be considered a valid and sufficient
document to provide farm-credit or kisan credit
card by the banks and the crop insurance agencies.
This will lower the production costs of landless
farmers substantially. Thus, a buoyant market for
farm lands will be developed in Haryana. The land
reforms, redistribution of land and providing land
to landless by purchasing from other farmers are
difficult options and are not politically viable. But
landless farmers can have access to the land
resource by market-mechanism and can have all
the benefits as big farmers have by this legal
contract.
5. The State can also hand over various public parks
to unemployed youth who know gardening to
grow flowers in 40 per cent area with strict
conditions, certain rights and responsibilities. In
this way, the municipal corporations, Haryana
Urban Development Authority and other local
bodies can save costs and even earn some
revenues and provide environmental amenities to
public.
6. In the suburban areas or some big villages, where
people have the ability to pay, the water supply
systems can be handed over to private parties with
strict conditions that if they do not invest certain
percentage in rain water harvesting, water
purification or do not provide good service to the
people, the State has the right to change the
service provider. All initial cost should be borne by
the State, but no recurring subsidy on the variable
costs should be given.
7. There is a serious problem of shortage of latrines
in Haryana villages. In every village, the
government should make best quality latrines
and hand over them freely to people who can
run them and can recover variable costs. The
village people like to go outside for latrine in the
morning. If they are situated outside the village,
their need for morning walk shall also be
satisfied. The latrine facility shall be of great
utility for women, as many times, they have to
wait for dusk to make it. Thus, most of the
villagers shall happily pay for such facilities.
8. There is a great opportunity of generating
employment in the rural areas by production of
electricity. People should be allowed to produce
electricity using bio-mass (dung), biodiesel, solar
energy or wind mill. A small bio-mass plant does
not cost more than Rs. 40 thousand and can give
employment to four unskilled persons. The State
can provide training, and the banks can give loans
through micro-finance institutions. At this stage,
production of electricity using biodiesel may not be
economic. However, who are using generator sets
in cities can use bio-diesel and the farmers can
earn by selling seeds of biodiesel. The reputed
company Reliance Energy is thinking of entering
into cultivation of jatropha using high technology,
more investment and better irrigation facilities.
This is a signal that in coming years, the yields of
jatropha can increase and costs/prices can go down
the economies of scale in extraction of bio-diesel
from seeds in next five years. At that time, people
may think of producing electricity from biodiesel.
The aforementioned Canadian firm Solar Gen Inc.
has developed a device, which captures solar
energy using a concave mirror and produces
electricity by generating steam. It does not use the
photo-voltaic cells which are costly to produce. If
sun rays can be captured for 24 minutes, it can
supply electricity for one-hour. The amount of
energy generated depends upon the size of the
mirror. The cost of producing one unit is around
Rs. 0.40. We are far more richer than Canada in
terms of solar rays for most part of the year. In
some parts of the year, the Sun is available for
more than 14 hours. Even if we produce a device
half efficient to the Canadian one, we will be able
to fulfill our energy needs. The extra cheap energy
generated in this way will lead to increase in the
demand for electrical, electronic and consumer
durable goods. Many people will get employment
in production, repairing and maintenance of
these goods. Each electricity producer should be
allowed to produce around 3000 units of
Chapter 4 • POLICY DIRECTIONS 233
electricity per month using any method. This
power should be purchased from him by Power
Trading Corporation (PTC) and sold to other
consumers in the cities. This will lead to
increase in the quality employment in the rural
areas. The banks should provide loans to the
farmers for purchasing the biodiesel engines and
the PTC should give a counter guarantee to the
banks to purchase electricity from the farmers.
The banks can give even 100 per cent finance to
the farmers for this against the cost of the diesel
engine. The banks can also increase their
business by financing the companies making
diesel engines. The problem of recovering the
power bills, power thefts, increasing subsidies
and ever-sick SEBs will be permanently solved.
The politicians will also feel very much free from
the burden of providing free electricity. The
direct and indirect employment in the power
generation, power equipments manufacturing and
repairing shall be more than seventy lakh. The
agricultural diversification shall increase and thus,
the farmers will stop politicising the power and
MSP issues. The farmers will have the option to
use their own produced cheap electricity or to sell
it to the PTC. Thus, they will use this own asset
very prudently and this will automatically promote
the efficient use of water resources. It is also
visualised that a village should be centre of
production not only for primary goods but also for
secondary goods including electricity. The cities
should be centres of services, higher education,
knowledge based firms, art, culture and
architecture with high connectivity with rural
areas. They need to be freed from the pollution
generated by industrial production. Villages have
more potential to assimilate the pollution. With
this vision, we propose that farmers should be
allowed to produce electricity not only with bio-
diesel but also with other possible methods.
9. The feeling of having no asset is a major cause of
the poverty and biggest hindrance in starting of a
small business for self-employment. It is the time
that new kind of private assets are created, and
given to the unemployed free of cost if possible
instead of starting doubtful schemes like Rural
Employment Guarantee Scheme (REGS). There are
6764 villages in Haryana, each village can have a
mini cinema theatre for which a DVD player, a
flat screen TV, a generator set, a table, some
chairs and space will be required. All this will not
cost more than Rs. 70,000 and can give
employment to two persons thus generating total
13,000 jobs. The State can finance it 100 per cent
in one time subsidy instead of distributing doles
in the form of REGS.
10. The mobile PCOs can be another asset that can
be given to people. It will comprise one cart, an
electricity storage device (battery), a bill printing
machine and a mobile phone. All this will not cost
more than Rs. 15,000 and can generate
employment for 8000 persons. Such a system can
be financed by banks through MFIs or by the State
with some subsidy. A survey/research should be
conducted to identify the assets which can be given
to the poor for self employment.
11. A number of rural labourers go to nearby urban
areas in search of employment. The unskilled ones
or those who do not have their own implements
get less wages. The State should provide
implements to a targeted number of workers every
year. It should be done with little caution as too
much supply of skilled labour shall decrease their
wages and the producers of implements will be
unnecessary benefited. The low skilled ones can
also be absorbed in trading. If they are provided
with a cart and a weighing machine they can sell
farm products in the urban areas. It is reported
that many small vegetable vendors pay an interest
of 10 per cent per day for buying vegetables from
sabzi-mandi for a small sum of Rs. 500 to Rs. 1000.
The MFIs can help such vendors by introducing a
proper system. The vendors can also add value to
their farm products by washing, or drying, cutting
or packaging. The poor vendors coming from rural
areas without having a shop can be trained by
NGOs for value-addition and marketing of farm
products.
12. The Barefoot Engineering College in Rajasthan is
an example of raising income level of poor women
by providing training to them for repairing stoves,
gases, solar batteries and some other items. This
experiment can be replicated in Haryana also.
Simultaneously, a research should be conducted to
identify the skills which people can learn even
without formal education. If along with such
skills people need some complementary assets,
they should be financed by the State in the form
of subsidy or with cheaper credit by MFIs.
13. A number of employment opportunities are
emerging in the health services. In fact, each
HARYANA DEVELOPMENT REPORT234
village and even the cities can have health centres,
which can provide health services like
physiotherapy, naturopathy, acupressure,
gymnasium, ayurvedic medicines, etc. It means
that services related with pro-active health can be
provided by non MBBS and other than allopathy
based systems. This has already happened in many
cities of Haryana as several persons have taken
franchisee from Haridwar based Swami Ramdev. In
future, they may even start earning foreign
exchange by providing services to foreign tourists.
14. Private education is also an important area of
self-employment. The State should encourage the
individuals to start coaching at institutes,
computer centres, private libraries/information
centres or internet cafés or student hostels. Any
enterprise promoting skills, education or training
should be given sufficient incentives in the form of
easy credit and non-commercial electricity. Since,
the health and education are part of State duties,
the State should not levy any tax on the
enterprises providing such services. However, the
State can use them for certain social programmes
like Pulse Polio Drive.
15. As we have discussed in Chapter 3 that
installation of 1000 IT Kiosks can also provide
around five thousand jobs in Haryana and each IT
Kiosk can be run profitably in a sustainable way.
16. The Employment Exchanges should be
professionally managed. They should hire private
consultants to prepare and update their databases.
The exchanges can cater to the needs of public as
well as private sector. They should not limit
themselves as only the record keepers. Rather they
should assess the potential of each unemployed
coming to them on the basis of his education,
experience, skills, family background and already
existing earning assets by conducting a deep
interview using a standardised schedule
irrespective of the caste or category. For this, the
staff of the employment exchanges should be
trained and empowered. The recommendations
given by the exchange after interview should be
honoured by different State agencies to provide
the required asset as mentioned in earlier points.
The interview committee should have knowledge
and experience of business, industries, service
sector, agriculture and social development.
17. The State should train the NGOs to understand
objectives related with health, nutrition,
sanitation, education, environment, gender
issues, employment, social justice, child labour,
legal empowerment, consumer protection,
religious harmony, disaster management,
promotion of art and culture, care for weak,
elders, Dalits, women, minorities etc. The
district authority can also train the NGOs to
make proposals for projects and can persuade
them to source the funds from international
agencies. Since, the funds are routed generally
through district authorities, so there is a scope
for corruption. To curb it, an advisory body of
intellectuals, teachers, lawyers, doctors of the
district should audit the Statement of use of
funds to the NGOs. The NGOs offer a big
employment opportunity. In Europe, there are
many NGOs, which provide inspection, testing,
certification and grading services to the
producers for quality and eco-friendliness. They
compete with each other for making their good
reputation and are able to earn money also. They
are corruption free, give better services than the
governments and consumers as well as producers
both are benefited. The training of NGOs along
with the Right to Information Act can create so
much of pressure on the service providers that
quality of all the services can go up. It can be
the most effective way of containing the
corruption and infusing responsibility in
employees.
18. All the schemes of providing incentives to own
private assets for self-employment can be
connected with family planning schemes. Those
who are unemployed and unmarried should be
given the asset with the condition that if they have
more than two children in future the State can
take the asset back. Of course, it may be exempted
in case of girl child as Haryana has a poor sex
ratio. For example, in Uttar Pradesh, in one
district a policy of giving a gun licence to those
who have only one child was adopted. Allotting a
gun licence does not cost anything to the State but
sends the right signal in masses. In Haryana also,
the district authorities can issue weapon licences
to unemployed youth who can act as security
guards in private and public organisations or can
work as night watchmen in cities, sub-urban areas
and big villages having dense population. The
local police station can act as a regulator of the
private security guards in their identification,
verification, monitoring and collection of
Chapter 4 • POLICY DIRECTIONS 235
monthly dues from residents. A part of the
collection should be given as an incentive to the
local police station employees. The per month
charges to be paid to the watchmen should be
decided by the elected local bodies like
panchayats, municipal councils or resident welfare
associations. The security needs are growing in
Haryana as crime rate is increasing and these
will become highly important as Haryana
becomes more integrated with the capital to take
advantage of NCR. Such security needs can
generate large employment without no additional
expenses at all.
19. The protection of environment can also generate a
lot of employment opportunities. The investment
in rainwater harvesting structures, community
based ponds/johars, etc. should be enhanced.
The Tourism Departments in the University and
colleges can enter into a contract with the Haryana
Tourism Corporation to run the State tourist destinations
on a co-operative basis by the students. The students
doing professional courses like Bachelor in Tourism
Management, Master in Tourism Management, Hotel
Management etc. can convert the motels and tourism
lodges into Eco-lodges. They may prepare their websites,
innovate by adding cultural programmes as regular
features, may develop competencies by marketing the
typical Haryanvi food of saag, sattu, rabri, pattisa, lassi,
maize roti, bajra khichri, etc. In this way they can provide
excellent services at a low cost and can also earn while
learning for themselves as well as for HTCs. This
experiment has been quite successful in Uttarakhand. It
can be replicated in Haryana.
4.4 IT and Employment
There is a big challenge before the State to provide
jobs to the educated youth. The basic education is must
for everyone. In the earlier pages, most of the suggested
strategies relate to the employment of less educated ones.
The emerging areas of employment for the highly
educated youth are in the Information, Communication,
and Entertainment Economy, IT Enabled services, finance,
insurance, banking and related services. Next
paragraphs are devoted to the important issues and
conditions related with IT Development.
There are certain essential conditions required to be
successful in the competitive international IT markets. Let
us have a broad look at the important factors which could
prove critical in spreading the business area and use of IT
for developmental purposes.
In 1995-96, Haryana was at fifth place in software
exports among all States and exported just Rs. 62.99 crore
worth of software. During the period August 1991 to
August 2004 a total of Rs. 38,433 crore has been invested
in Haryana which is 2.9 per cent of the total investment in
all States. Out of this, Rs. 3875 crore have come through
foreign direct investment which is 1.6 per cent of the total
foreign direct investment in India. But it should be
understood that much of the foreign direct investment in
Haryana has come in only Gurgaon district and was
approved in Delhi and it is the result of proximity to the
capital. Haryana ranked at ninth place according to tele-
density among 16 major States in 2000 and it was just
3.35 per cent. Table 1.118 shows the data on houses,
household amenities and assets. It reveals that in Haryana
12.72 per cent households have a telephone. The top nine
districts (and also above Haryana average) according to
percentage of families having a telephone are Panchkula
(29.95), Ambala (25.31), Kurukshetra (17.96),
Yamunanagar (17.92), Faridabad (15.55), Panipat (14.4),
Rohtak (13.88), Gurgaon (13.78) and Karnal (13.7).
From Table 1.118 it is also revealed that 52.98 per cent
households have a television set. Ambala District has
the highest percentage (71.57) and Mahendergarh has
the lowest (37.35) percentage of television sets. It
means that even in the poorest district every one out of
three families have a television set. Although the
expected convergence of telephone, television, cable-
network and internet has not taken place in our
country still the penetration of televisions in
households can be very important from the mass
communication point of view for development. If
Haryana takes the lead in promoting the convergence of
mass communication technologies, it can have a
cutting edge advantage over other States.
Though the telecom sector has witnessed
substantial growth in the last decade, the spread of
telecommunications on a per capita basis has been slow,
in comparison with other developing countries. In
contrast with the urban areas, where costs of service are
lower and returns assured, investments in rural areas
represent higher risks and lower returns. This is, in fact,
one of the main reasons for the poor penetration of
telecommunications in rural India—less than 0.2 per
hundred inhabitants.
High speed, inexpensive, reliable and secure
broadband telecommunication links to global
destinations are a must. Telecoms had been a monopoly
of the Government of India. They had been very highly
priced and international links for private companies
were rarely provided on the fear that the security of the
HARYANA DEVELOPMENT REPORT236
country could be compromised. Through a series of
intellectual and educational campaigns, the monopoly
and the obsessive fear with regard to safety was ended
in the late 1990s. International bandwidth, first
through communications satellites and then undersea
cables, is now available abundantly from competing
carriers. Recently, competition was also introduced
worldwide, therefore the prices have now fallen to
about one-fourth of what they were during monopoly
times; they would fall further because of almost
limitless bandwidth becoming available inexpensively in
optical fibre cables laid on the ocean beds to link
countries and continents. It is believed that every one
kilometre of the optical fibre cable laid down shall
provide job to 10 persons. In the mid-1990s, the
bandwidth used to constitute about 25 per cent of the
cost of an IT contract delivered offshore. We can,
therefore, see what a relief it is and what a boost to
competition the reduced costs as a result of liberal
policy, are and their contribution to the
competitiveness of Indian IT and software companies.
Now companies like Reliance Infocom has opened its
centres named WEBWORLD in many districts of
Haryana with high speed internet.
World class IT and software professionals should be
available in abundance. About five years ago, there was
hardly any effort in the government or established
universities to produce IT and software engineers and
professionals with Masters in Computer Applications. It
was the private sector companies that had been training
tens of thousands of IT professionals. The private sector
effort in computer education is admirable. The top 2-3 of
these companies have come to be recognised as university
grade by global companies. From Table 1.73 and 1.74 we
observe that Haryana has 7 universities/deemed
universities and 70 professional education institutes.
There are total 41 engineering colleges which have a total
capacity of 10,631 students. These colleges produce 2735
graduates of computer engineering and 2719 of electronics
and communication. It has been noticed that IT and
telecom companies also hire the students from
mechanical, electrical and instrumentation streams. If we
include the BCAs, B.Sc. and M.Sc. (Comp. Sc.), MCSs,
MCAs, PGDCAs and the students doing three year
courses at private institutions then the total workforce
knowing computers is increasing by approximately around
10,000 numbers every year.
Infrastructure by way of power, international airline
connections, education facilities, hospitals and roads
and residential accommodation are necessary for global
companies to locate their development centres in India
and also to source their requirements to Indian
companies. It is clear that Haryana is weak on this
front but Gurgaon and Faridabad can take this
advantage as they are in the NCR region.
Progressive States like Andhra Pradesh stepped up
the training of engineers (engineering colleges went up
from 35 in 1997 to 215 in 2002) by permitting scores of
new colleges to be started for engineering, MCA and
MBA to provide skilled people and not necessarily
software engineers; a bachelor’s course in computer
application (BCA) was also started. The State
government broke new ground by establishing the first
non-government funded International Institution of
Information Technology (IIIT), not from its financial
resources but by getting a number of private companies
to come together and found the institute, conferring
upon it a deemed university status. The Government of
India took this example and resolved to put up 50 such
institutes either by itself or in the private sector.
Governments built huge buildings to provide for IT
companies to start business within seven days of their
registration. For example, the Cyber Towers in the
Hitec city in Madhapur, Hyderabad, provided 8,50,000
sq ft of office space in record time. High speed,
broadband telecom connection was part of the building
facility. The ingenuity of the government was such that
it did not put up any cash but it took equity position
equal to the value of the land that was made available
for the joint venture, with the private companies. This
became a model for several other governments.
Another allied business is the IT-enabled services
from call centres which canvass and conclude business
for, say, insurance or building loans, bank accounts or
tourism, for markets anywhere in the world. They
operate using telecommunications. The IT industry
requires engineers and masters in computer
applications, IT-enabled services require English-
speaking graduates with PC skills. Any graduate can be
turned into an IT-enabled service employee within six
months and Haryana has thousands of such people
coming out from the universities every year. It has been
noticed that big call centre companies operating in
metro cities are facing problems with the employees as
they keep on switching to other employers for a
promotion. These companies can find more loyal and
equally competent employees in cities like Ambala,
Panchkula, Panipat, Karnal, Kurukshetra, Yamunanagar,
Rohtak and Hisar. The State should encourage big
companies to invest in BPOs and KPOs in these cities.
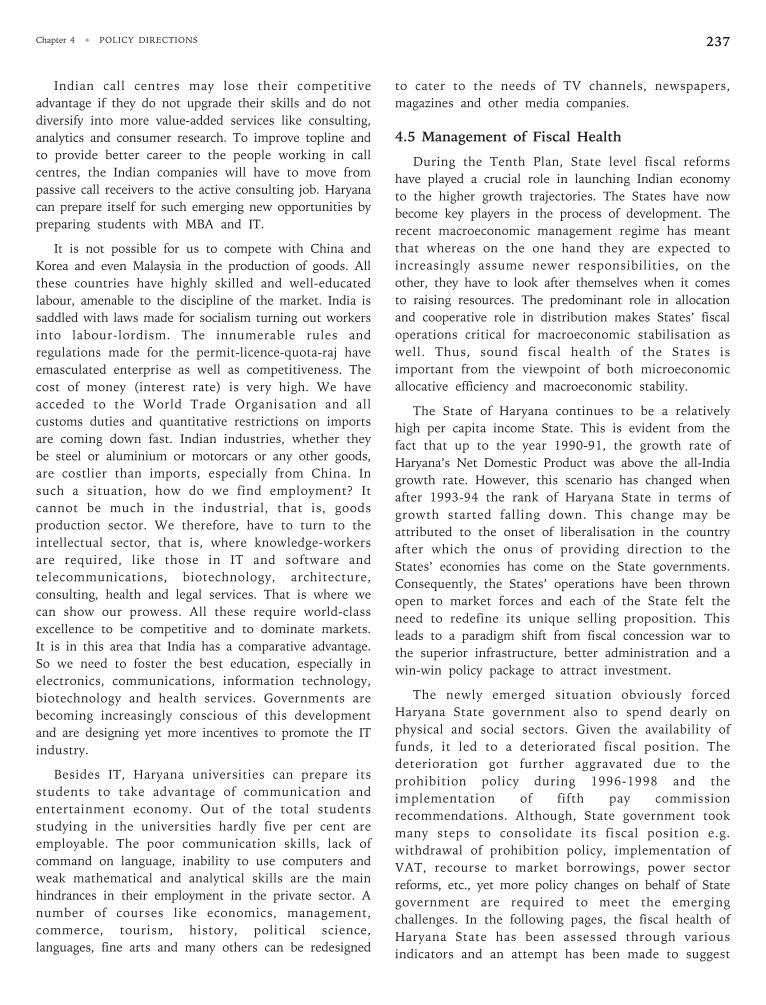
Chapter 4 • POLICY DIRECTIONS 237
Indian call centres may lose their competitive
advantage if they do not upgrade their skills and do not
diversify into more value-added services like consulting,
analytics and consumer research. To improve topline and
to provide better career to the people working in call
centres, the Indian companies will have to move from
passive call receivers to the active consulting job. Haryana
can prepare itself for such emerging new opportunities by
preparing students with MBA and IT.
It is not possible for us to compete with China and
Korea and even Malaysia in the production of goods. All
these countries have highly skilled and well-educated
labour, amenable to the discipline of the market. India is
saddled with laws made for socialism turning out workers
into labour-lordism. The innumerable rules and
regulations made for the permit-licence-quota-raj have
emasculated enterprise as well as competitiveness. The
cost of money (interest rate) is very high. We have
acceded to the World Trade Organisation and all
customs duties and quantitative restrictions on imports
are coming down fast. Indian industries, whether they
be steel or aluminium or motorcars or any other goods,
are costlier than imports, especially from China. In
such a situation, how do we find employment? It
cannot be much in the industrial, that is, goods
production sector. We therefore, have to turn to the
intellectual sector, that is, where knowledge-workers
are required, like those in IT and software and
telecommunications, biotechnology, architecture,
consulting, health and legal services. That is where we
can show our prowess. All these require world-class
excellence to be competitive and to dominate markets.
It is in this area that India has a comparative advantage.
So we need to foster the best education, especially in
electronics, communications, information technology,
biotechnology and health services. Governments are
becoming increasingly conscious of this development
and are designing yet more incentives to promote the IT
industry.
Besides IT, Haryana universities can prepare its
students to take advantage of communication and
entertainment economy. Out of the total students
studying in the universities hardly five per cent are
employable. The poor communication skills, lack of
command on language, inability to use computers and
weak mathematical and analytical skills are the main
hindrances in their employment in the private sector. A
number of courses like economics, management,
commerce, tourism, history, political science,
languages, fine arts and many others can be redesigned
to cater to the needs of TV channels, newspapers,
magazines and other media companies.
4.5 Management of Fiscal Health
During the Tenth Plan, State level fiscal reforms
have played a crucial role in launching Indian economy
to the higher growth trajectories. The States have now
become key players in the process of development. The
recent macroeconomic management regime has meant
that whereas on the one hand they are expected to
increasingly assume newer responsibilities, on the
other, they have to look after themselves when it comes
to raising resources. The predominant role in allocation
and cooperative role in distribution makes States’ fiscal
operations critical for macroeconomic stabilisation as
well. Thus, sound fiscal health of the States is
important from the viewpoint of both microeconomic
allocative efficiency and macroeconomic stability.
The State of Haryana continues to be a relatively
high per capita income State. This is evident from the
fact that up to the year 1990-91, the growth rate of
Haryana’s Net Domestic Product was above the all-India
growth rate. However, this scenario has changed when
after 1993-94 the rank of Haryana State in terms of
growth started falling down. This change may be
attributed to the onset of liberalisation in the country
after which the onus of providing direction to the
States’ economies has come on the State governments.
Consequently, the States’ operations have been thrown
open to market forces and each of the State felt the
need to redefine its unique selling proposition. This
leads to a paradigm shift from fiscal concession war to
the superior infrastructure, better administration and a
win-win policy package to attract investment.
The newly emerged situation obviously forced
Haryana State government also to spend dearly on
physical and social sectors. Given the availability of
funds, it led to a deteriorated fiscal position. The
deterioration got further aggravated due to the
prohibition policy during 1996-1998 and the
implementation of fifth pay commission
recommendations. Although, State government took
many steps to consolidate its fiscal position e.g.
withdrawal of prohibition policy, implementation of
VAT, recourse to market borrowings, power sector
reforms, etc., yet more policy changes on behalf of State
government are required to meet the emerging
challenges. In the following pages, the fiscal health of
Haryana State has been assessed through various
indicators and an attempt has been made to suggest
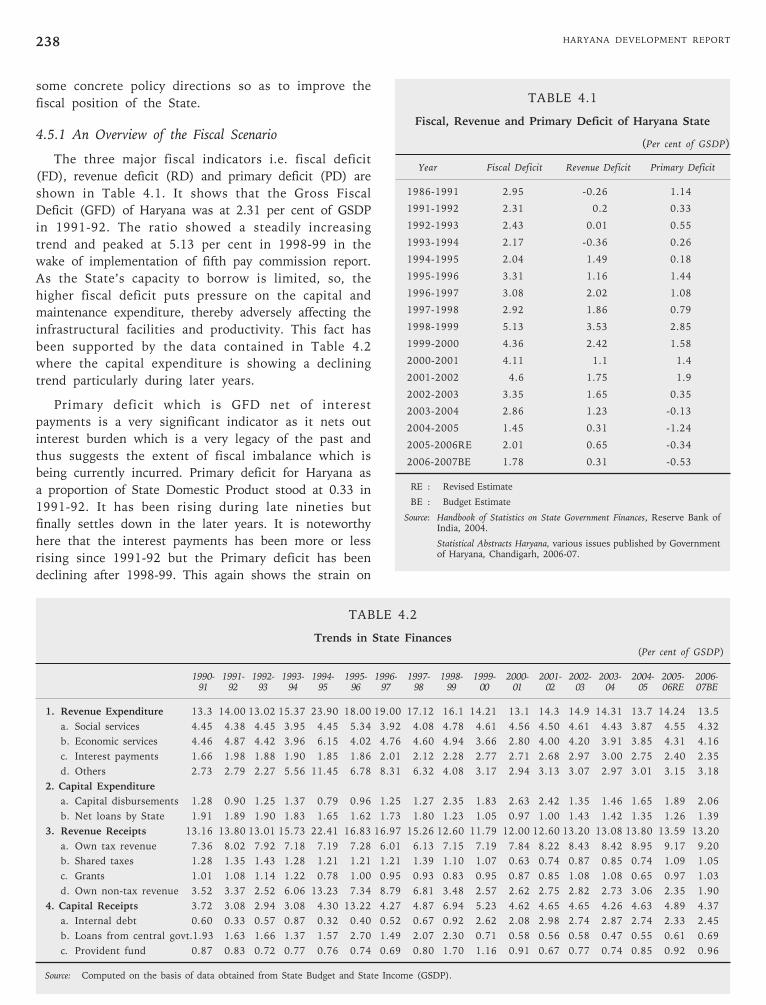
HARYANA DEVELOPMENT REPORT238
some concrete policy directions so as to improve the
fiscal position of the State.
4.5.1 An Overview of the Fiscal Scenario
The three major fiscal indicators i.e. fiscal deficit
(FD), revenue deficit (RD) and primary deficit (PD) are
shown in Table 4.1. It shows that the Gross Fiscal
Deficit (GFD) of Haryana was at 2.31 per cent of GSDP
in 1991-92. The ratio showed a steadily increasing
trend and peaked at 5.13 per cent in 1998-99 in the
wake of implementation of fifth pay commission report.
As the State’s capacity to borrow is limited, so, the
higher fiscal deficit puts pressure on the capital and
maintenance expenditure, thereby adversely affecting the
infrastructural facilities and productivity. This fact has
been supported by the data contained in Table 4.2
where the capital expenditure is showing a declining
trend particularly during later years.
Primary deficit which is GFD net of interest
payments is a very significant indicator as it nets out
interest burden which is a very legacy of the past and
thus suggests the extent of fiscal imbalance which is
being currently incurred. Primary deficit for Haryana as
a proportion of State Domestic Product stood at 0.33 in
1991-92. It has been rising during late nineties but
finally settles down in the later years. It is noteworthy
here that the interest payments has been more or less
rising since 1991-92 but the Primary deficit has been
declining after 1998-99. This again shows the strain on
TABLE 4.2
Trends in State Finances(Per cent of GSDP)
1990- 1991- 1992- 1993- 1994- 1995- 1996- 1997- 1998- 1999- 2000- 2001- 2002- 2003- 2004- 2005- 2006-91 92 93 94 95 96 97 98 99 00 01 02 03 04 05 06RE 07BE
1. Revenue Expenditure 13.3 14.00 13.02 15.37 23.90 18.00 19.00 17.12 16.1 14.21 13.1 14.3 14.9 14.31 13.7 14.24 13.5
a. Social services 4.45 4.38 4.45 3.95 4.45 5.34 3.92 4.08 4.78 4.61 4.56 4.50 4.61 4.43 3.87 4.55 4.32
b. Economic services 4.46 4.87 4.42 3.96 6.15 4.02 4.76 4.60 4.94 3.66 2.80 4.00 4.20 3.91 3.85 4.31 4.16
c. Interest payments 1.66 1.98 1.88 1.90 1.85 1.86 2.01 2.12 2.28 2.77 2.71 2.68 2.97 3.00 2.75 2.40 2.35
d. Others 2.73 2.79 2.27 5.56 11.45 6.78 8.31 6.32 4.08 3.17 2.94 3.13 3.07 2.97 3.01 3.15 3.18
2. Capital Expenditure
a. Capital disbursements 1.28 0.90 1.25 1.37 0.79 0.96 1.25 1.27 2.35 1.83 2.63 2.42 1.35 1.46 1.65 1.89 2.06
b. Net loans by State 1.91 1.89 1.90 1.83 1.65 1.62 1.73 1.80 1.23 1.05 0.97 1.00 1.43 1.42 1.35 1.26 1.39
3. Revenue Receipts 13.16 13.80 13.01 15.73 22.41 16.83 16.97 15.26 12.60 11.79 12.00 12.60 13.20 13.08 13.80 13.59 13.20
a. Own tax revenue 7.36 8.02 7.92 7.18 7.19 7.28 6.01 6.13 7.15 7.19 7.84 8.22 8.43 8.42 8.95 9.17 9.20
b. Shared taxes 1.28 1.35 1.43 1.28 1.21 1.21 1.21 1.39 1.10 1.07 0.63 0.74 0.87 0.85 0.74 1.09 1.05
c. Grants 1.01 1.08 1.14 1.22 0.78 1.00 0.95 0.93 0.83 0.95 0.87 0.85 1.08 1.08 0.65 0.97 1.03
d. Own non-tax revenue 3.52 3.37 2.52 6.06 13.23 7.34 8.79 6.81 3.48 2.57 2.62 2.75 2.82 2.73 3.06 2.35 1.90
4. Capital Receipts 3.72 3.08 2.94 3.08 4.30 13.22 4.27 4.87 6.94 5.23 4.62 4.65 4.65 4.26 4.63 4.89 4.37
a. Internal debt 0.60 0.33 0.57 0.87 0.32 0.40 0.52 0.67 0.92 2.62 2.08 2.98 2.74 2.87 2.74 2.33 2.45
b. Loans from central govt.1.93 1.63 1.66 1.37 1.57 2.70 1.49 2.07 2.30 0.71 0.58 0.56 0.58 0.47 0.55 0.61 0.69
c. Provident fund 0.87 0.83 0.72 0.77 0.76 0.74 0.69 0.80 1.70 1.16 0.91 0.67 0.77 0.74 0.85 0.92 0.96
Source: Computed on the basis of data obtained from State Budget and State Income (GSDP).
TABLE 4.1
Fiscal, Revenue and Primary Deficit of Haryana State
(Per cent of GSDP)
Year Fiscal Deficit Revenue Deficit Primary Deficit
1986-1991 2.95 -0.26 1.14
1991-1992 2.31 0.2 0.33
1992-1993 2.43 0.01 0.55
1993-1994 2.17 -0.36 0.26
1994-1995 2.04 1.49 0.18
1995-1996 3.31 1.16 1.44
1996-1997 3.08 2.02 1.08
1997-1998 2.92 1.86 0.79
1998-1999 5.13 3.53 2.85
1999-2000 4.36 2.42 1.58
2000-2001 4.11 1.1 1.4
2001-2002 4.6 1.75 1.9
2002-2003 3.35 1.65 0.35
2003-2004 2.86 1.23 -0.13
2004-2005 1.45 0.31 -1.24
2005-2006RE 2.01 0.65 -0.34
2006-2007BE 1.78 0.31 -0.53
RE : Revised Estimate
BE : Budget Estimate
Source: Handbook of Statistics on State Government Finances, Reserve Bank ofIndia, 2004.
Statistical Abstracts Haryana, various issues published by Governmentof Haryana, Chandigarh, 2006-07.
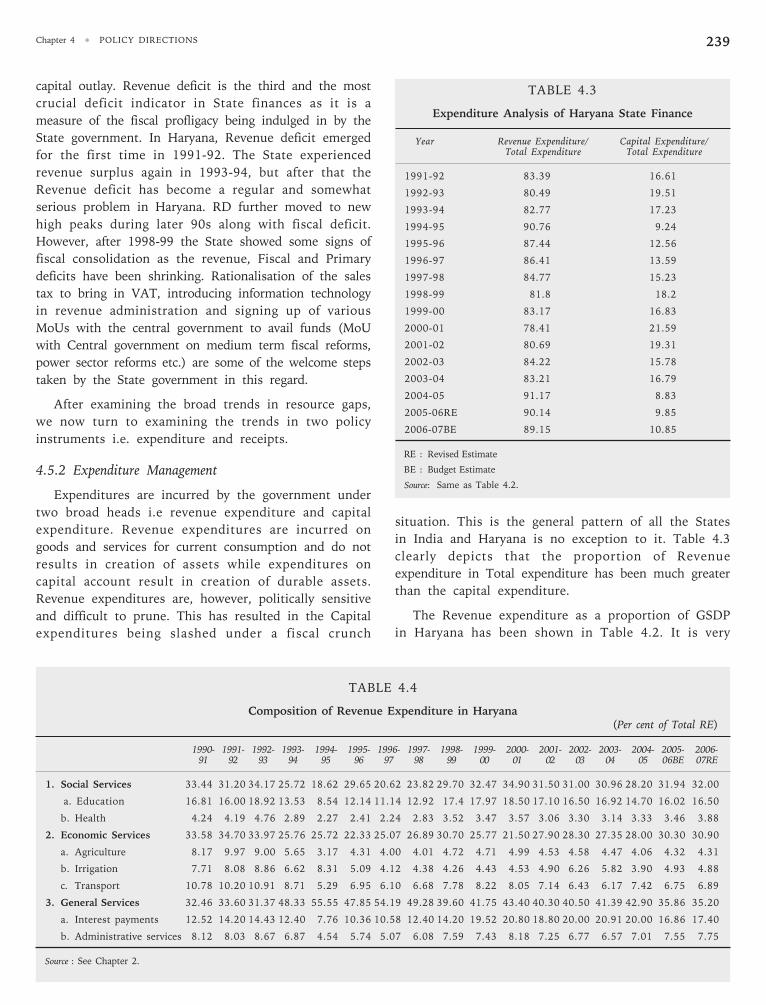
Chapter 4 • POLICY DIRECTIONS 239
capital outlay. Revenue deficit is the third and the most
crucial deficit indicator in State finances as it is a
measure of the fiscal profligacy being indulged in by the
State government. In Haryana, Revenue deficit emerged
for the first time in 1991-92. The State experienced
revenue surplus again in 1993-94, but after that the
Revenue deficit has become a regular and somewhat
serious problem in Haryana. RD further moved to new
high peaks during later 90s along with fiscal deficit.
However, after 1998-99 the State showed some signs of
fiscal consolidation as the revenue, Fiscal and Primary
deficits have been shrinking. Rationalisation of the sales
tax to bring in VAT, introducing information technology
in revenue administration and signing up of various
MoUs with the central government to avail funds (MoU
with Central government on medium term fiscal reforms,
power sector reforms etc.) are some of the welcome steps
taken by the State government in this regard.
After examining the broad trends in resource gaps,
we now turn to examining the trends in two policy
instruments i.e. expenditure and receipts.
4.5.2 Expenditure Management
Expenditures are incurred by the government under
two broad heads i.e revenue expenditure and capital
expenditure. Revenue expenditures are incurred on
goods and services for current consumption and do not
results in creation of assets while expenditures on
capital account result in creation of durable assets.
Revenue expenditures are, however, politically sensitive
and difficult to prune. This has resulted in the Capital
expenditures being slashed under a fiscal crunch
TABLE 4.3
Expenditure Analysis of Haryana State Finance
Year Revenue Expenditure/ Capital Expenditure/Total Expenditure Total Expenditure
1991-92 83.39 16.61
1992-93 80.49 19.51
1993-94 82.77 17.23
1994-95 90.76 9.24
1995-96 87.44 12.56
1996-97 86.41 13.59
1997-98 84.77 15.23
1998-99 81.8 18.2
1999-00 83.17 16.83
2000-01 78.41 21.59
2001-02 80.69 19.31
2002-03 84.22 15.78
2003-04 83.21 16.79
2004-05 91.17 8.83
2005-06RE 90.14 9.85
2006-07BE 89.15 10.85
RE : Revised Estimate
BE : Budget Estimate
Source: Same as Table 4.2.
TABLE 4.4
Composition of Revenue Expenditure in Haryana(Per cent of Total RE)
1990- 1991- 1992- 1993- 1994- 1995- 1996- 1997- 1998- 1999- 2000- 2001- 2002- 2003- 2004- 2005- 2006-91 92 93 94 95 96 97 98 99 00 01 02 03 04 05 06BE 07RE
1. Social Services 33.44 31.20 34.17 25.72 18.62 29.65 20.62 23.82 29.70 32.47 34.90 31.50 31.00 30.96 28.20 31.94 32.00
a. Education 16.81 16.00 18.92 13.53 8.54 12.14 11.14 12.92 17.4 17.97 18.50 17.10 16.50 16.92 14.70 16.02 16.50
b. Health 4.24 4.19 4.76 2.89 2.27 2.41 2.24 2.83 3.52 3.47 3.57 3.06 3.30 3.14 3.33 3.46 3.88
2. Economic Services 33.58 34.70 33.97 25.76 25.72 22.33 25.07 26.89 30.70 25.77 21.50 27.90 28.30 27.35 28.00 30.30 30.90
a. Agriculture 8.17 9.97 9.00 5.65 3.17 4.31 4.00 4.01 4.72 4.71 4.99 4.53 4.58 4.47 4.06 4.32 4.31
b. Irrigation 7.71 8.08 8.86 6.62 8.31 5.09 4.12 4.38 4.26 4.43 4.53 4.90 6.26 5.82 3.90 4.93 4.88
c. Transport 10.78 10.20 10.91 8.71 5.29 6.95 6.10 6.68 7.78 8.22 8.05 7.14 6.43 6.17 7.42 6.75 6.89
3. General Services 32.46 33.60 31.37 48.33 55.55 47.85 54.19 49.28 39.60 41.75 43.40 40.30 40.50 41.39 42.90 35.86 35.20
a. Interest payments 12.52 14.20 14.43 12.40 7.76 10.36 10.58 12.40 14.20 19.52 20.80 18.80 20.00 20.91 20.00 16.86 17.40
b. Administrative services 8.12 8.03 8.67 6.87 4.54 5.74 5.07 6.08 7.59 7.43 8.18 7.25 6.77 6.57 7.01 7.55 7.75
Source : See Chapter 2.
situation. This is the general pattern of all the States
in India and Haryana is no exception to it. Table 4.3
clearly depicts that the proportion of Revenue
expenditure in Total expenditure has been much greater
than the capital expenditure.
The Revenue expenditure as a proportion of GSDP
in Haryana has been shown in Table 4.2. It is very
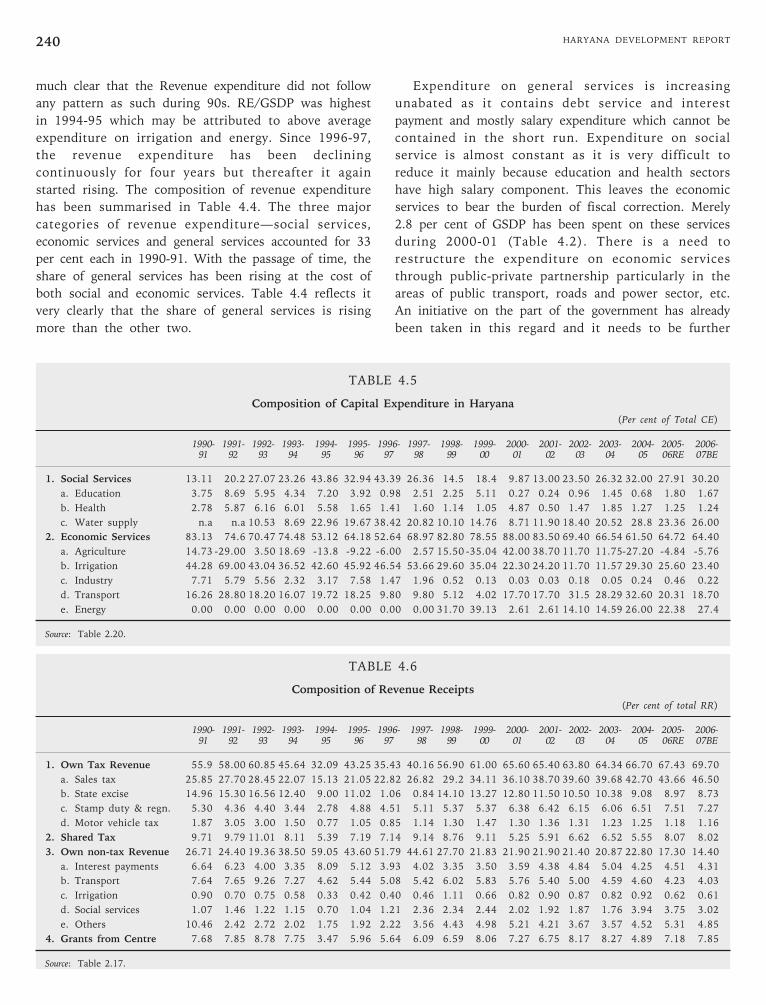
HARYANA DEVELOPMENT REPORT240
much clear that the Revenue expenditure did not follow
any pattern as such during 90s. RE/GSDP was highest
in 1994-95 which may be attributed to above average
expenditure on irrigation and energy. Since 1996-97,
the revenue expenditure has been declining
continuously for four years but thereafter it again
started rising. The composition of revenue expenditure
has been summarised in Table 4.4. The three major
categories of revenue expenditure—social services,
economic services and general services accounted for 33
per cent each in 1990-91. With the passage of time, the
share of general services has been rising at the cost of
both social and economic services. Table 4.4 reflects it
very clearly that the share of general services is rising
more than the other two.
Expenditure on general services is increasing
unabated as it contains debt service and interest
payment and mostly salary expenditure which cannot be
contained in the short run. Expenditure on social
service is almost constant as it is very difficult to
reduce it mainly because education and health sectors
have high salary component. This leaves the economic
services to bear the burden of fiscal correction. Merely
2.8 per cent of GSDP has been spent on these services
during 2000-01 (Table 4.2). There is a need to
restructure the expenditure on economic services
through public-private partnership particularly in the
areas of public transport, roads and power sector, etc.
An initiative on the part of the government has already
been taken in this regard and it needs to be further
TABLE 4.5
Composition of Capital Expenditure in Haryana
(Per cent of Total CE)
1990- 1991- 1992- 1993- 1994- 1995- 1996- 1997- 1998- 1999- 2000- 2001- 2002- 2003- 2004- 2005- 2006-91 92 93 94 95 96 97 98 99 00 01 02 03 04 05 06RE 07BE
1. Social Services 13.11 20.2 27.07 23.26 43.86 32.94 43.39 26.36 14.5 18.4 9.87 13.00 23.50 26.32 32.00 27.91 30.20
a. Education 3.75 8.69 5.95 4.34 7.20 3.92 0.98 2.51 2.25 5.11 0.27 0.24 0.96 1.45 0.68 1.80 1.67
b. Health 2.78 5.87 6.16 6.01 5.58 1.65 1.41 1.60 1.14 1.05 4.87 0.50 1.47 1.85 1.27 1.25 1.24
c. Water supply n.a n.a 10.53 8.69 22.96 19.67 38.42 20.82 10.10 14.76 8.71 11.90 18.40 20.52 28.8 23.36 26.00
2. Economic Services 83.13 74.6 70.47 74.48 53.12 64.18 52.64 68.97 82.80 78.55 88.00 83.50 69.40 66.54 61.50 64.72 64.40
a. Agriculture 14.73 -29.00 3.50 18.69 -13.8 -9.22 -6.00 2.57 15.50 -35.04 42.00 38.70 11.70 11.75-27.20 -4.84 -5.76
b. Irrigation 44.28 69.00 43.04 36.52 42.60 45.92 46.54 53.66 29.60 35.04 22.30 24.20 11.70 11.57 29.30 25.60 23.40
c. Industry 7.71 5.79 5.56 2.32 3.17 7.58 1.47 1.96 0.52 0.13 0.03 0.03 0.18 0.05 0.24 0.46 0.22
d. Transport 16.26 28.80 18.20 16.07 19.72 18.25 9.80 9.80 5.12 4.02 17.70 17.70 31.5 28.29 32.60 20.31 18.70
e. Energy 0.00 0.00 0.00 0.00 0.00 0.00 0.00 0.00 31.70 39.13 2.61 2.61 14.10 14.59 26.00 22.38 27.4
Source: Table 2.20.
TABLE 4.6
Composition of Revenue Receipts
(Per cent of total RR)
1990- 1991- 1992- 1993- 1994- 1995- 1996- 1997- 1998- 1999- 2000- 2001- 2002- 2003- 2004- 2005- 2006-91 92 93 94 95 96 97 98 99 00 01 02 03 04 05 06RE 07BE
1. Own Tax Revenue 55.9 58.00 60.85 45.64 32.09 43.25 35.43 40.16 56.90 61.00 65.60 65.40 63.80 64.34 66.70 67.43 69.70
a. Sales tax 25.85 27.70 28.45 22.07 15.13 21.05 22.82 26.82 29.2 34.11 36.10 38.70 39.60 39.68 42.70 43.66 46.50
b. State excise 14.96 15.30 16.56 12.40 9.00 11.02 1.06 0.84 14.10 13.27 12.80 11.50 10.50 10.38 9.08 8.97 8.73
c. Stamp duty & regn. 5.30 4.36 4.40 3.44 2.78 4.88 4.51 5.11 5.37 5.37 6.38 6.42 6.15 6.06 6.51 7.51 7.27
d. Motor vehicle tax 1.87 3.05 3.00 1.50 0.77 1.05 0.85 1.14 1.30 1.47 1.30 1.36 1.31 1.23 1.25 1.18 1.16
2. Shared Tax 9.71 9.79 11.01 8.11 5.39 7.19 7.14 9.14 8.76 9.11 5.25 5.91 6.62 6.52 5.55 8.07 8.02
3. Own non-tax Revenue 26.71 24.40 19.36 38.50 59.05 43.60 51.79 44.61 27.70 21.83 21.90 21.90 21.40 20.87 22.80 17.30 14.40
a. Interest payments 6.64 6.23 4.00 3.35 8.09 5.12 3.93 4.02 3.35 3.50 3.59 4.38 4.84 5.04 4.25 4.51 4.31
b. Transport 7.64 7.65 9.26 7.27 4.62 5.44 5.08 5.42 6.02 5.83 5.76 5.40 5.00 4.59 4.60 4.23 4.03
c. Irrigation 0.90 0.70 0.75 0.58 0.33 0.42 0.40 0.46 1.11 0.66 0.82 0.90 0.87 0.82 0.92 0.62 0.61
d. Social services 1.07 1.46 1.22 1.15 0.70 1.04 1.21 2.36 2.34 2.44 2.02 1.92 1.87 1.76 3.94 3.75 3.02
e. Others 10.46 2.42 2.72 2.02 1.75 1.92 2.22 3.56 4.43 4.98 5.21 4.21 3.67 3.57 4.52 5.31 4.85
4. Grants from Centre 7.68 7.85 8.78 7.75 3.47 5.96 5.64 6.09 6.59 8.06 7.27 6.75 8.17 8.27 4.89 7.18 7.85
Source: Table 2.17.
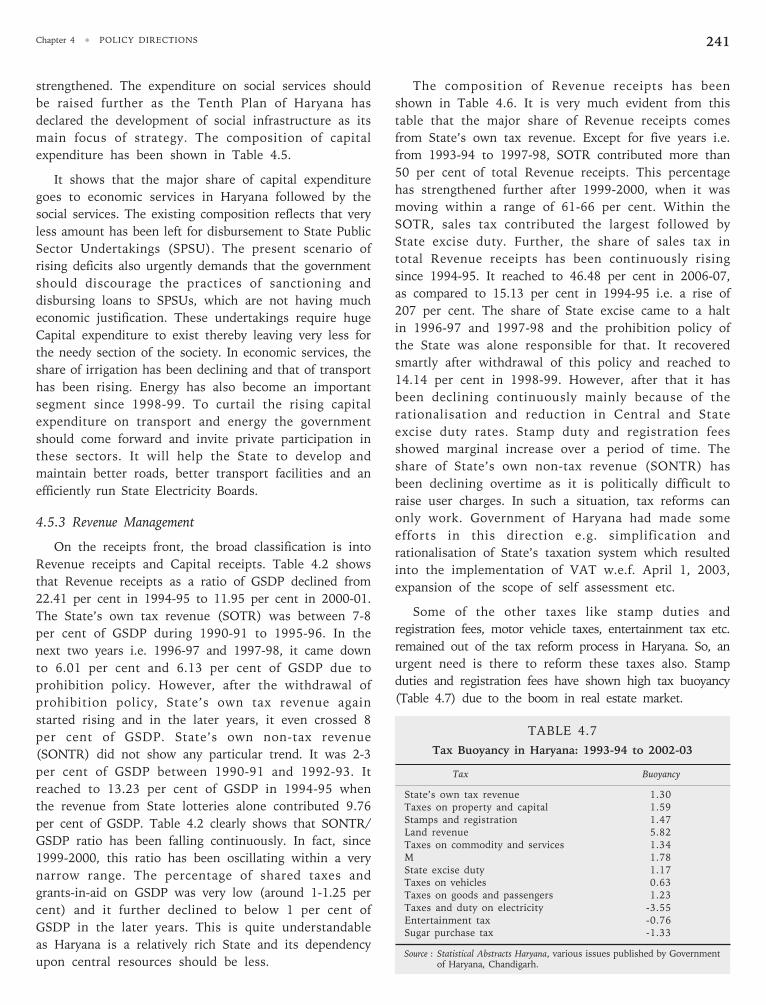
Chapter 4 • POLICY DIRECTIONS 241
strengthened. The expenditure on social services should
be raised further as the Tenth Plan of Haryana has
declared the development of social infrastructure as its
main focus of strategy. The composition of capital
expenditure has been shown in Table 4.5.
It shows that the major share of capital expenditure
goes to economic services in Haryana followed by the
social services. The existing composition reflects that very
less amount has been left for disbursement to State Public
Sector Undertakings (SPSU). The present scenario of
rising deficits also urgently demands that the government
should discourage the practices of sanctioning and
disbursing loans to SPSUs, which are not having much
economic justification. These undertakings require huge
Capital expenditure to exist thereby leaving very less for
the needy section of the society. In economic services, the
share of irrigation has been declining and that of transport
has been rising. Energy has also become an important
segment since 1998-99. To curtail the rising capital
expenditure on transport and energy the government
should come forward and invite private participation in
these sectors. It will help the State to develop and
maintain better roads, better transport facilities and an
efficiently run State Electricity Boards.
4.5.3 Revenue Management
On the receipts front, the broad classification is into
Revenue receipts and Capital receipts. Table 4.2 shows
that Revenue receipts as a ratio of GSDP declined from
22.41 per cent in 1994-95 to 11.95 per cent in 2000-01.
The State’s own tax revenue (SOTR) was between 7-8
per cent of GSDP during 1990-91 to 1995-96. In the
next two years i.e. 1996-97 and 1997-98, it came down
to 6.01 per cent and 6.13 per cent of GSDP due to
prohibition policy. However, after the withdrawal of
prohibition policy, State’s own tax revenue again
started rising and in the later years, it even crossed 8
per cent of GSDP. State’s own non-tax revenue
(SONTR) did not show any particular trend. It was 2-3
per cent of GSDP between 1990-91 and 1992-93. It
reached to 13.23 per cent of GSDP in 1994-95 when
the revenue from State lotteries alone contributed 9.76
per cent of GSDP. Table 4.2 clearly shows that SONTR/
GSDP ratio has been falling continuously. In fact, since
1999-2000, this ratio has been oscillating within a very
narrow range. The percentage of shared taxes and
grants-in-aid on GSDP was very low (around 1-1.25 per
cent) and it further declined to below 1 per cent of
GSDP in the later years. This is quite understandable
as Haryana is a relatively rich State and its dependency
upon central resources should be less.
The composition of Revenue receipts has been
shown in Table 4.6. It is very much evident from this
table that the major share of Revenue receipts comes
from State’s own tax revenue. Except for five years i.e.
from 1993-94 to 1997-98, SOTR contributed more than
50 per cent of total Revenue receipts. This percentage
has strengthened further after 1999-2000, when it was
moving within a range of 61-66 per cent. Within the
SOTR, sales tax contributed the largest followed by
State excise duty. Further, the share of sales tax in
total Revenue receipts has been continuously rising
since 1994-95. It reached to 46.48 per cent in 2006-07,
as compared to 15.13 per cent in 1994-95 i.e. a rise of
207 per cent. The share of State excise came to a halt
in 1996-97 and 1997-98 and the prohibition policy of
the State was alone responsible for that. It recovered
smartly after withdrawal of this policy and reached to
14.14 per cent in 1998-99. However, after that it has
been declining continuously mainly because of the
rationalisation and reduction in Central and State
excise duty rates. Stamp duty and registration fees
showed marginal increase over a period of time. The
share of State’s own non-tax revenue (SONTR) has
been declining overtime as it is politically difficult to
raise user charges. In such a situation, tax reforms can
only work. Government of Haryana had made some
efforts in this direction e.g. simplification and
rationalisation of State’s taxation system which resulted
into the implementation of VAT w.e.f. April 1, 2003,
expansion of the scope of self assessment etc.
Some of the other taxes like stamp duties and
registration fees, motor vehicle taxes, entertainment tax etc.
remained out of the tax reform process in Haryana. So, an
urgent need is there to reform these taxes also. Stamp
duties and registration fees have shown high tax buoyancy
(Table 4.7) due to the boom in real estate market.
TABLE 4.7
Tax Buoyancy in Haryana: 1993-94 to 2002-03
Tax Buoyancy
State’s own tax revenue 1.30Taxes on property and capital 1.59Stamps and registration 1.47Land revenue 5.82Taxes on commodity and services 1.34M 1.78State excise duty 1.17Taxes on vehicles 0.63Taxes on goods and passengers 1.23Taxes and duty on electricity -3.55Entertainment tax -0.76Sugar purchase tax -1.33
Source : Statistical Abstracts Haryana, various issues published by Governmentof Haryana, Chandigarh.
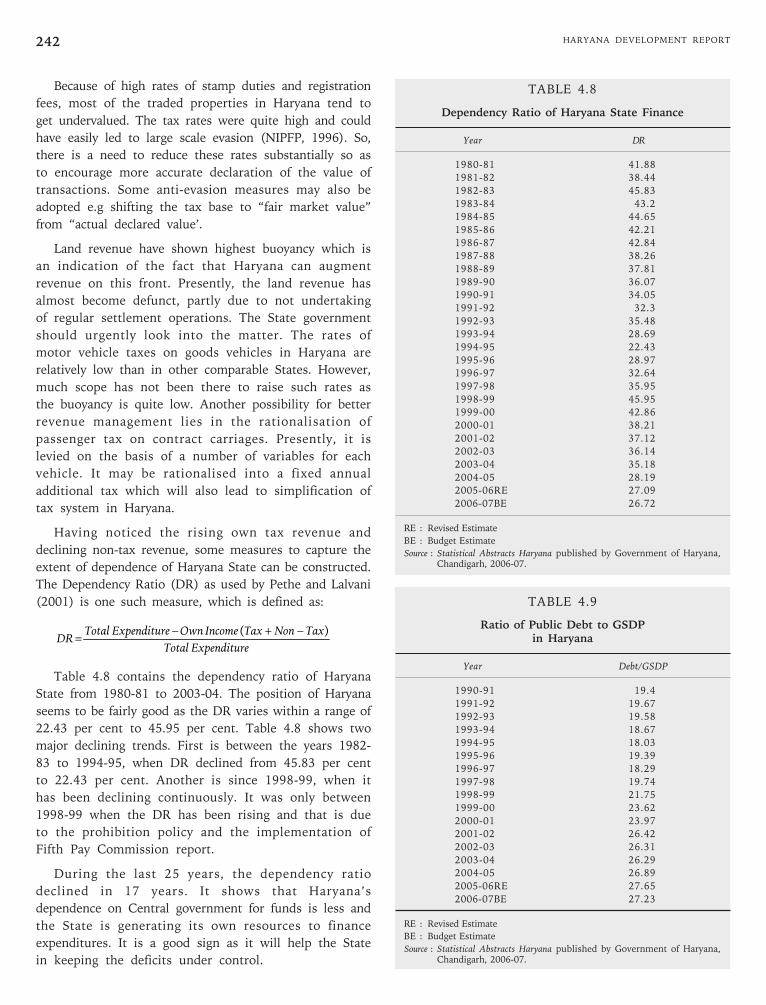
HARYANA DEVELOPMENT REPORT242
Because of high rates of stamp duties and registration
fees, most of the traded properties in Haryana tend to
get undervalued. The tax rates were quite high and could
have easily led to large scale evasion (NIPFP, 1996). So,
there is a need to reduce these rates substantially so as
to encourage more accurate declaration of the value of
transactions. Some anti-evasion measures may also be
adopted e.g shifting the tax base to “fair market value”
from “actual declared value’.
Land revenue have shown highest buoyancy which is
an indication of the fact that Haryana can augment
revenue on this front. Presently, the land revenue has
almost become defunct, partly due to not undertaking
of regular settlement operations. The State government
should urgently look into the matter. The rates of
motor vehicle taxes on goods vehicles in Haryana are
relatively low than in other comparable States. However,
much scope has not been there to raise such rates as
the buoyancy is quite low. Another possibility for better
revenue management lies in the rationalisation of
passenger tax on contract carriages. Presently, it is
levied on the basis of a number of variables for each
vehicle. It may be rationalised into a fixed annual
additional tax which will also lead to simplification of
tax system in Haryana.
Having noticed the rising own tax revenue and
declining non-tax revenue, some measures to capture the
extent of dependence of Haryana State can be constructed.
The Dependency Ratio (DR) as used by Pethe and Lalvani
(2001) is one such measure, which is defined as:
eExpenditurTotal
TaxNonTaxIncomeOwneExpenditurTotalDR
)( −+−=
Table 4.8 contains the dependency ratio of Haryana
State from 1980-81 to 2003-04. The position of Haryana
seems to be fairly good as the DR varies within a range of
22.43 per cent to 45.95 per cent. Table 4.8 shows two
major declining trends. First is between the years 1982-
83 to 1994-95, when DR declined from 45.83 per cent
to 22.43 per cent. Another is since 1998-99, when it
has been declining continuously. It was only between
1998-99 when the DR has been rising and that is due
to the prohibition policy and the implementation of
Fifth Pay Commission report.
During the last 25 years, the dependency ratio
declined in 17 years. It shows that Haryana’s
dependence on Central government for funds is less and
the State is generating its own resources to finance
expenditures. It is a good sign as it will help the State
in keeping the deficits under control.
TABLE 4.8
Dependency Ratio of Haryana State Finance
Year DR
1980-81 41.88
1981-82 38.44
1982-83 45.83
1983-84 43.2
1984-85 44.65
1985-86 42.21
1986-87 42.84
1987-88 38.26
1988-89 37.81
1989-90 36.07
1990-91 34.05
1991-92 32.3
1992-93 35.48
1993-94 28.69
1994-95 22.43
1995-96 28.97
1996-97 32.64
1997-98 35.95
1998-99 45.95
1999-00 42.86
2000-01 38.21
2001-02 37.12
2002-03 36.14
2003-04 35.18
2004-05 28.19
2005-06RE 27.09
2006-07BE 26.72
RE : Revised Estimate
BE : Budget Estimate
Source : Statistical Abstracts Haryana published by Government of Haryana,Chandigarh, 2006-07.
TABLE 4.9
Ratio of Public Debt to GSDPin Haryana
Year Debt/GSDP
1990-91 19.4
1991-92 19.67
1992-93 19.58
1993-94 18.67
1994-95 18.03
1995-96 19.39
1996-97 18.29
1997-98 19.74
1998-99 21.75
1999-00 23.62
2000-01 23.97
2001-02 26.42
2002-03 26.31
2003-04 26.29
2004-05 26.89
2005-06RE 27.65
2006-07BE 27.23
RE : Revised Estimate
BE : Budget Estimate
Source : Statistical Abstracts Haryana published by Government of Haryana,Chandigarh, 2006-07.
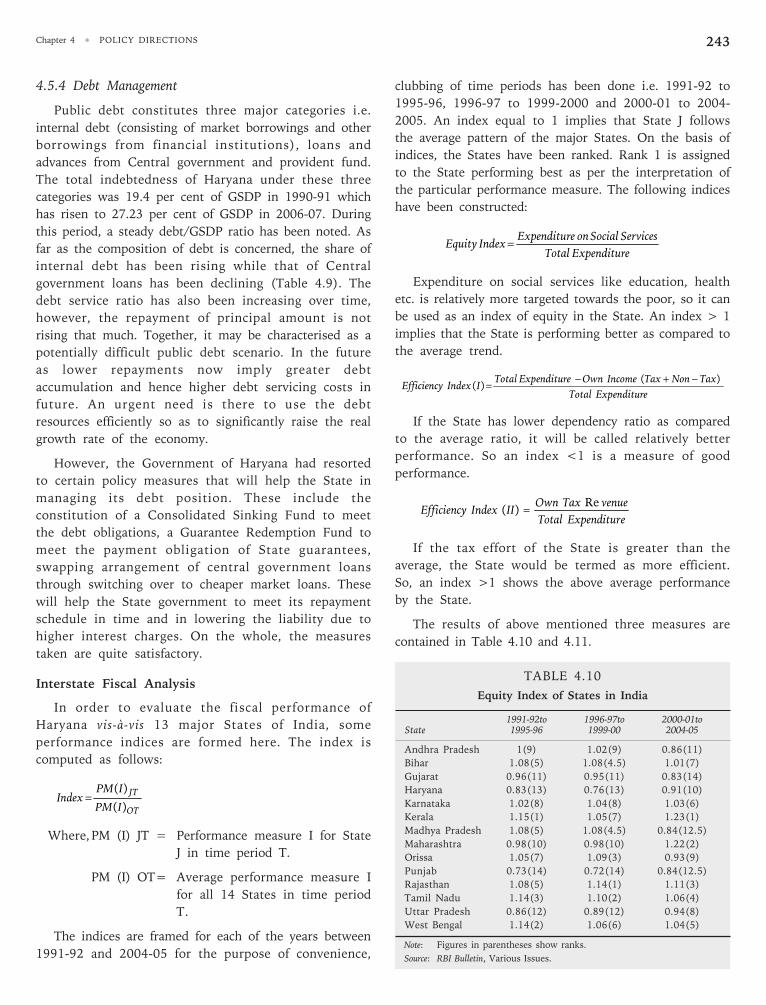
Chapter 4 • POLICY DIRECTIONS 243
4.5.4 Debt Management
Public debt constitutes three major categories i.e.
internal debt (consisting of market borrowings and other
borrowings from financial institutions), loans and
advances from Central government and provident fund.
The total indebtedness of Haryana under these three
categories was 19.4 per cent of GSDP in 1990-91 which
has risen to 27.23 per cent of GSDP in 2006-07. During
this period, a steady debt/GSDP ratio has been noted. As
far as the composition of debt is concerned, the share of
internal debt has been rising while that of Central
government loans has been declining (Table 4.9). The
debt service ratio has also been increasing over time,
however, the repayment of principal amount is not
rising that much. Together, it may be characterised as a
potentially difficult public debt scenario. In the future
as lower repayments now imply greater debt
accumulation and hence higher debt servicing costs in
future. An urgent need is there to use the debt
resources efficiently so as to significantly raise the real
growth rate of the economy.
However, the Government of Haryana had resorted
to certain policy measures that will help the State in
managing its debt position. These include the
constitution of a Consolidated Sinking Fund to meet
the debt obligations, a Guarantee Redemption Fund to
meet the payment obligation of State guarantees,
swapping arrangement of central government loans
through switching over to cheaper market loans. These
will help the State government to meet its repayment
schedule in time and in lowering the liability due to
higher interest charges. On the whole, the measures
taken are quite satisfactory.
Interstate Fiscal Analysis
In order to evaluate the fiscal performance of
Haryana vis-à-vis 13 major States of India, some
performance indices are formed here. The index is
computed as follows:
OT
JT
IPM
IPMIndex
)(
)(=
Where,PM (I) JT = Performance measure I for State
J in time period T.
PM (I) OT= Average performance measure I
for all 14 States in time period
T.
The indices are framed for each of the years between
1991-92 and 2004-05 for the purpose of convenience,
clubbing of time periods has been done i.e. 1991-92 to
1995-96, 1996-97 to 1999-2000 and 2000-01 to 2004-
2005. An index equal to 1 implies that State J follows
the average pattern of the major States. On the basis of
indices, the States have been ranked. Rank 1 is assigned
to the State performing best as per the interpretation of
the particular performance measure. The following indices
have been constructed:
eExpenditurTotal
ServicesSocialoneExpenditurIndexEquity =
Expenditure on social services like education, health
etc. is relatively more targeted towards the poor, so it can
be used as an index of equity in the State. An index > 1
implies that the State is performing better as compared to
the average trend.
eExpenditurTotal
TaxNonTaxIncomeOwneExpenditurTotalIIndexEfficiency
)()(
−+−=
If the State has lower dependency ratio as compared
to the average ratio, it will be called relatively better
performance. So an index <1 is a measure of good
performance.
eExpenditurTotal
venueTaxOwnIIIndexEfficiency
Re)( =
If the tax effort of the State is greater than the
average, the State would be termed as more efficient.
So, an index >1 shows the above average performance
by the State.
The results of above mentioned three measures are
contained in Table 4.10 and 4.11.
TABLE 4.10
Equity Index of States in India
1991-92to 1996-97to 2000-01toState 1995-96 1999-00 2004-05
Andhra Pradesh 1(9) 1.02(9) 0.86(11)
Bihar 1.08(5) 1.08(4.5) 1.01(7)
Gujarat 0.96(11) 0.95(11) 0.83(14)
Haryana 0.83(13) 0.76(13) 0.91(10)
Karnataka 1.02(8) 1.04(8) 1.03(6)
Kerala 1.15(1) 1.05(7) 1.23(1)
Madhya Pradesh 1.08(5) 1.08(4.5) 0.84(12.5)
Maharashtra 0.98(10) 0.98(10) 1.22(2)
Orissa 1.05(7) 1.09(3) 0.93(9)
Punjab 0.73(14) 0.72(14) 0.84(12.5)
Rajasthan 1.08(5) 1.14(1) 1.11(3)
Tamil Nadu 1.14(3) 1.10(2) 1.06(4)
Uttar Pradesh 0.86(12) 0.89(12) 0.94(8)
West Bengal 1.14(2) 1.06(6) 1.04(5)
Note: Figures in parentheses show ranks.
Source: RBI Bulletin, Various Issues.
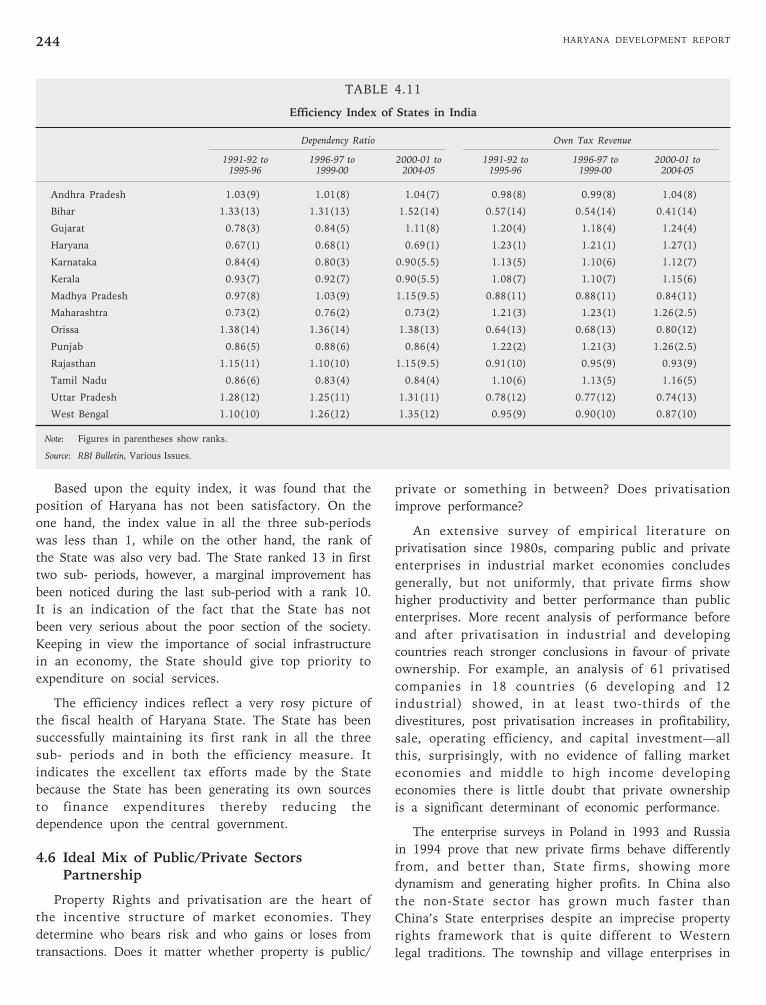
HARYANA DEVELOPMENT REPORT244
Based upon the equity index, it was found that the
position of Haryana has not been satisfactory. On the
one hand, the index value in all the three sub-periods
was less than 1, while on the other hand, the rank of
the State was also very bad. The State ranked 13 in first
two sub- periods, however, a marginal improvement has
been noticed during the last sub-period with a rank 10.
It is an indication of the fact that the State has not
been very serious about the poor section of the society.
Keeping in view the importance of social infrastructure
in an economy, the State should give top priority to
expenditure on social services.
The efficiency indices reflect a very rosy picture of
the fiscal health of Haryana State. The State has been
successfully maintaining its first rank in all the three
sub- periods and in both the efficiency measure. It
indicates the excellent tax efforts made by the State
because the State has been generating its own sources
to finance expenditures thereby reducing the
dependence upon the central government.
4.6 Ideal Mix of Public/Private SectorsPartnership
Property Rights and privatisation are the heart of
the incentive structure of market economies. They
determine who bears risk and who gains or loses from
transactions. Does it matter whether property is public/
private or something in between? Does privatisation
improve performance?
An extensive survey of empirical literature on
privatisation since 1980s, comparing public and private
enterprises in industrial market economies concludes
generally, but not uniformly, that private firms show
higher productivity and better performance than public
enterprises. More recent analysis of performance before
and after privatisation in industrial and developing
countries reach stronger conclusions in favour of private
ownership. For example, an analysis of 61 privatised
companies in 18 countries (6 developing and 12
industrial) showed, in at least two-thirds of the
divestitures, post privatisation increases in profitability,
sale, operating efficiency, and capital investment—all
this, surprisingly, with no evidence of falling market
economies and middle to high income developing
economies there is little doubt that private ownership
is a significant determinant of economic performance.
The enterprise surveys in Poland in 1993 and Russia
in 1994 prove that new private firms behave differently
from, and better than, State firms, showing more
dynamism and generating higher profits. In China also
the non-State sector has grown much faster than
China’s State enterprises despite an imprecise property
rights framework that is quite different to Western
legal traditions. The township and village enterprises in
TABLE 4.11
Efficiency Index of States in India
Dependency Ratio Own Tax Revenue
1991-92 to 1996-97 to 2000-01 to 1991-92 to 1996-97 to 2000-01 to1995-96 1999-00 2004-05 1995-96 1999-00 2004-05
Andhra Pradesh 1.03(9) 1.01(8) 1.04(7) 0.98(8) 0.99(8) 1.04(8)
Bihar 1.33(13) 1.31(13) 1.52(14) 0.57(14) 0.54(14) 0.41(14)
Gujarat 0.78(3) 0.84(5) 1.11(8) 1.20(4) 1.18(4) 1.24(4)
Haryana 0.67(1) 0.68(1) 0.69(1) 1.23(1) 1.21(1) 1.27(1)
Karnataka 0.84(4) 0.80(3) 0.90(5.5) 1.13(5) 1.10(6) 1.12(7)
Kerala 0.93(7) 0.92(7) 0.90(5.5) 1.08(7) 1.10(7) 1.15(6)
Madhya Pradesh 0.97(8) 1.03(9) 1.15(9.5) 0.88(11) 0.88(11) 0.84(11)
Maharashtra 0.73(2) 0.76(2) 0.73(2) 1.21(3) 1.23(1) 1.26(2.5)
Orissa 1.38(14) 1.36(14) 1.38(13) 0.64(13) 0.68(13) 0.80(12)
Punjab 0.86(5) 0.88(6) 0.86(4) 1.22(2) 1.21(3) 1.26(2.5)
Rajasthan 1.15(11) 1.10(10) 1.15(9.5) 0.91(10) 0.95(9) 0.93(9)
Tamil Nadu 0.86(6) 0.83(4) 0.84(4) 1.10(6) 1.13(5) 1.16(5)
Uttar Pradesh 1.28(12) 1.25(11) 1.31(11) 0.78(12) 0.77(12) 0.74(13)
West Bengal 1.10(10) 1.26(12) 1.35(12) 0.95(9) 0.90(10) 0.87(10)
Note: Figures in parentheses show ranks.
Source: RBI Bulletin, Various Issues.
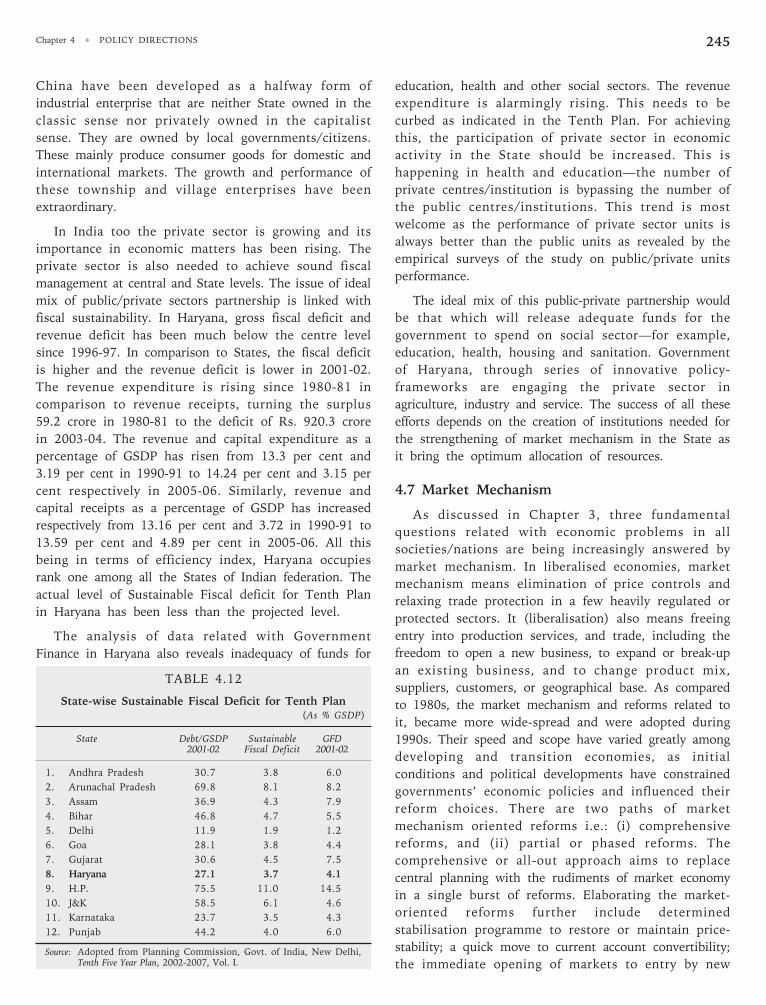
Chapter 4 • POLICY DIRECTIONS 245
China have been developed as a halfway form of
industrial enterprise that are neither State owned in the
classic sense nor privately owned in the capitalist
sense. They are owned by local governments/citizens.
These mainly produce consumer goods for domestic and
international markets. The growth and performance of
these township and village enterprises have been
extraordinary.
In India too the private sector is growing and its
importance in economic matters has been rising. The
private sector is also needed to achieve sound fiscal
management at central and State levels. The issue of ideal
mix of public/private sectors partnership is linked with
fiscal sustainability. In Haryana, gross fiscal deficit and
revenue deficit has been much below the centre level
since 1996-97. In comparison to States, the fiscal deficit
is higher and the revenue deficit is lower in 2001-02.
The revenue expenditure is rising since 1980-81 in
comparison to revenue receipts, turning the surplus
59.2 crore in 1980-81 to the deficit of Rs. 920.3 crore
in 2003-04. The revenue and capital expenditure as a
percentage of GSDP has risen from 13.3 per cent and
3.19 per cent in 1990-91 to 14.24 per cent and 3.15 per
cent respectively in 2005-06. Similarly, revenue and
capital receipts as a percentage of GSDP has increased
respectively from 13.16 per cent and 3.72 in 1990-91 to
13.59 per cent and 4.89 per cent in 2005-06. All this
being in terms of efficiency index, Haryana occupies
rank one among all the States of Indian federation. The
actual level of Sustainable Fiscal deficit for Tenth Plan
in Haryana has been less than the projected level.
The analysis of data related with Government
Finance in Haryana also reveals inadequacy of funds for
education, health and other social sectors. The revenue
expenditure is alarmingly rising. This needs to be
curbed as indicated in the Tenth Plan. For achieving
this, the participation of private sector in economic
activity in the State should be increased. This is
happening in health and education—the number of
private centres/institution is bypassing the number of
the public centres/institutions. This trend is most
welcome as the performance of private sector units is
always better than the public units as revealed by the
empirical surveys of the study on public/private units
performance.
The ideal mix of this public-private partnership would
be that which will release adequate funds for the
government to spend on social sector—for example,
education, health, housing and sanitation. Government
of Haryana, through series of innovative policy-
frameworks are engaging the private sector in
agriculture, industry and service. The success of all these
efforts depends on the creation of institutions needed for
the strengthening of market mechanism in the State as
it bring the optimum allocation of resources.
4.7 Market Mechanism
As discussed in Chapter 3, three fundamental
questions related with economic problems in all
societies/nations are being increasingly answered by
market mechanism. In liberalised economies, market
mechanism means elimination of price controls and
relaxing trade protection in a few heavily regulated or
protected sectors. It (liberalisation) also means freeing
entry into production services, and trade, including the
freedom to open a new business, to expand or break-up
an existing business, and to change product mix,
suppliers, customers, or geographical base. As compared
to 1980s, the market mechanism and reforms related to
it, became more wide-spread and were adopted during
1990s. Their speed and scope have varied greatly among
developing and transition economies, as initial
conditions and political developments have constrained
governments’ economic policies and influenced their
reform choices. There are two paths of market
mechanism oriented reforms i.e.: (i) comprehensive
reforms, and (ii) partial or phased reforms. The
comprehensive or all-out approach aims to replace
central planning with the rudiments of market economy
in a single burst of reforms. Elaborating the market-
oriented reforms further include determined
stabilisation programme to restore or maintain price-
stability; a quick move to current account convertibility;
the immediate opening of markets to entry by new
TABLE 4.12
State-wise Sustainable Fiscal Deficit for Tenth Plan(As % GSDP)
State Debt/GSDP Sustainable GFD2001-02 Fiscal Deficit 2001-02
1. Andhra Pradesh 30.7 3.8 6.0
2. Arunachal Pradesh 69.8 8.1 8.2
3. Assam 36.9 4.3 7.9
4. Bihar 46.8 4.7 5.5
5. Delhi 11.9 1.9 1.2
6. Goa 28.1 3.8 4.4
7. Gujarat 30.6 4.5 7.5
8. Haryana 27.1 3.7 4.1
9. H.P. 75.5 11.0 14.5
10. J&K 58.5 6.1 4.6
11. Karnataka 23.7 3.5 4.3
12. Punjab 44.2 4.0 6.0
Source: Adopted from Planning Commission, Govt. of India, New Delhi,Tenth Five Year Plan, 2002-2007, Vol. I.
HARYANA DEVELOPMENT REPORT246
private businesses; and initiating, at least, a wide range
of other changes, such as the privatisation of State-
owned companies, the demonopolisation of industry,
and the reforms of accounting standards, the fax
system, the legal system, the financial sector, and the
civil service.
Poland’s rapid reform in 1990, and many of the
programmes launched elsewhere in Central Eastern
Europe (CEE) and after 1992, in the Newly Independent
States (NIS) have approximated this comprehensive
model. The unification of East Germany with West
Germany provided an example of the instant transition.
But even in comprehensive model approach, the reforms
can be shown such as developing market supporting
institutions related with legal and financial systems may
take years, even decades, because it involves such a
fundamental change in skills, organisations, and attitudes.
Complexity and politics can usually impede the process,
as often happens in reforming social programmes.
The second model, of piecemeal and phased reform,
might start with localised experiments, which are
expanded as perceived, successes emerge. This model has
been adopted by Hungary, China, Vietnam, India etc.
Free-market reforms began explicitly since 1991. The East
Asia and South-East Asia because of their special
conditions embraced the piecemeal and phased reform
approach in adopting market-mechanism.
Many empirical studies reveal that in India, the
market mechanism was not allowed to function because
of planned economic development strategy adopted in
1951. This lesson of giving priority to market forces
through demand and supply construct has been ignored
by the planners and policy-makers. It is only in the
Tenth Plan (2002-2007) Volume-I that Planning
Commission of India has realised the importance of
market mechanism in achieving national objectives
when it States, “The Tenth Plan provides an
opportunity, at the start of the new millennium, the
build upon the gains of the part and also to address the
weaknesses that have emerged. There is a growing
impatience in the country at the fact that a large
number of our people continue to live in abject poverty
despite five decades of planning. To meet this challenge
squarely, the Tenth Plan must learn from past
experiences. It must strengthen what has worked well,
and at the same time also avoid repeating past
mistakes. There must be willingness to modify policies
and institutions based on past experience, keeping in
mind the changes that have taken place in the Indian
economy and in the rest of the world.”
This observation of the Planning Commission does
confirm the belief that ‘Market Mechanism’ has not been
allowed to be in operation in the Indian economy during
1960s and 1970s and onwards till the introduction of
economic reform in 1991 due to faulty and incorrect
policies. One such correction was done when the role of
the government was redefined in the Tenth Five Year Plan
document. The document states, “An important aspect of
the redefinition of strategy that is needed relates to the
role of government. This redefinition is necessary both at
the Central and State government level. It is now
generally recognised that government in the past tended
to take on too many responsibilities, imposing severe
strains on its limited financial and administrative
capabilities and also stifling individual initiative. An all-
pervasive Government role may have been necessary at a
stage where private sector capabilities were undeveloped,
but the situation has changed dramatically in this
respect. Now, India has a strong and vibrant private
sector. The public sector is much less dominant than it
used to be in many critical sectors and its relative
position is likely to decline further as government
ownership in many existing public sector organisations
is expected to decline substantially. It is clear that
industrial growth in future will depend largely upon
the performance of the private sector and the policies
must, therefore, provide an environment which is
conducive to such growth.”
Orientation towards ‘markets’ does not imply the
absence of government or no role to be played by the
government. Governments—at Central as well as State
levels do have roles for the social sector, infrastructure
development, rural infrastructure, road development. In
economic services like telecommunications, power,
ports, etc. the private sector can play a much greater
role, provided an appropriate policy framework is in
place. In these sectors, the role of government needs to
change to facilitate such investment as much as
possible while still remains a public sector service
provider for quite some time.
In all these areas, the role of the government as a
regulator ensuring a fair deal for consumers,
transparency and accountability, and a level playing field
is also extremely important.
Adoption of more market-friendly policies are
rewarded with resumed or accelerated growth in output
and productivity. China’s contrasting initial conditions
and strong macro economic control enabled it to take a
more gradual and phased approach to transition. But
the main engines of rapid growth in China have been
Chapter 4 • POLICY DIRECTIONS 247
the same as in the successful CEE countries and NIS:
rapid entry of new firms, including in service sector,
and growth in exports. Market-mechanism has also
been applied to housing sector, education, saving,
investment, health, banking and prudent fiscal
management.
The success of market-mechanism depends upon
building market-institution that promote growth and
reduce poverty. Effective institutions are needed to
make markets work. The effective institutions can be
created through good governance of firms, financial,
political, judicial system and land system. The
promotion of domestic as well as international
competition is also necessary. As a consequence of
adopting market-friendly policies, product market
competition and labour-market flexibility has increased
in India after 1990s. In Haryana also the number of
firms has increased from 1168 in 1966 to 9047 in 2003.
During 1990 to 2003, it has increased more than
double. The number of firms was 4843 in 1990 which
rose to 9047 in 2003, implying increased competition in
the State. Therefore, it can be said that the State has
become market-oriented after the introduction of
economic reforms; and this increased market-mechanism
has led to the attainment of higher and faster growth
rate of State Domestic Product during 1990s. Though,
the analysis of the data in social sector services and
agriculture-related sectors reveal that this has not been
applied there in the solution of sectoral problems. Thus,
what is needed that in the remaining period of Tenth
Five Year Plan and even after that, the Government of
Haryana should be committed in extending and
strengthening the market mechanism in the State. This
will certainly help in achieving the Sustainable
Development in the State by bringing a balance between
the material growth and social welfare growth.
4.8 Improvement in Plan Implementationand Delivery Mechanism
To achieve desired objectives of any plan, there are
two important factors, which play the major role. The
first and foremost is the availability of resources. The
other important factor is the implementation of the
programmes. The attainment of goals of the Plan also
depends on quality of design and effectiveness of the
Plan programmes. The success and failure of the Plan
programmes largely depend on the design and
implementation of the programmes. Presently, India is
going to complete its Tenth Five Year Plan (2002-2007)
by the end of 2007. The Eleventh Five Year Plan would
commence from 2007 to 2011. Before going ahead, it
would be very important to assess the success and failure
of the plan implementation and the delivery mechanism.
It would help in bringing improvement in the delivery
mechanism, which in turn helps in achieving intended
objectives of the Plan programmes. The past experience
indicates that there were a few drawbacks due to which
the desired goals couldn’t be achieved in its full strength.
In some of the Plans, objectives like launching
development projects couldn’t be achieved due to
inadequacies in design and implementation. Another
important factor is the delivery mechanism. Due to
inefficient delivery system, many a times the time and
cost overruns have been witnessed. It was widespread and
substantial in public sector infrastructure and investment
projects. The failure of the Plan programmes occurred
because of the intended benefits of the programmes have
not reached to the targeted people in general and the poor
in particular. It happened more in the social sector.
Services like literacy, basic health and the shelter
programmes have not enjoyed the fruits of the success.
Therefore, it becomes very important to assess the failures
and successes of the past plans, their implementation
and the delivery mechanisms. Another drawback was
the poor administrative planning and delivery
mechanism. Therefore, in the Ninth Plan, an area of
the priority was to improve planning and
implementation of the development projects. This
would help in reaching the intended benefits to the
beneficiaries and also reduce the overruns of time and
cost of the project.
There are many ways to improve the implementation
of the plan and the delivery mechanism. The World
Bank in its report has investigated these questions and
provided certain measures to bring the improvements in
the delivery mechanism. In the following section these
measures have been discussed in detail.
4.8.1. The Concept of User (Clients) andService Providers
For the improvement in the delivery mechanism of
the services provided to the public in general and the
poor in particular, the World Bank (2004a) in its report
discussed the concept of clients and providers. The
following para discusses this aspect with respect to the
provision of services such as housing, food supplies and
the health to the poor people of the society.
One of the basic objectives of the good governance
is look into welfare of the poor people by efficient
delivery of the services provided by to them. The value
HARYANA DEVELOPMENT REPORT248
of the public policy and the expenditure is generally
assessed in terms of amount of welfare received by the
poor people from the basic needs of shelter, food and
the health. If these services are not reaching to the
targeted section of the society and they are bypassed in
favour of private clinics, then the expenditure on these
services is waste.
The performance of delivery mechanism can be
improved to a larger extent if the poor people are given
due importance and should be treated as purchasers,
monitors, and as co-producers. The active role of this
section of the society can help in improving the
implementation and delivery mechanism of the services.
The public policy can help poor people by providing
better services to the poor; by increasing the demand,
because the providers’ income would also depend on the
demand for the services; by enhancing the income of the
poor, which in turn raise the purchasing power of the
poor; by providing better information and a more
competitive environment for better performance.
Another important factor, which can be very crucial, is
the action on the complaints registered by the poor.
In the past, in the developing as well developed
countries the role of poor client was largely neglected
by both, the government as well as the donors. In
present era of globalisation and decentralisation the role
of poor clients has been recognised. It is only in the
recent time the initiatives have been begun to increase
the participation of the communities and the civil
society in the service delivery mechanism.
Empowering of the poor people can influence the
service potential. It can be done by increasing purchasing
power of the individuals; by organising them into the
groups to increase their collective power; by providing
the information which would develop their capabilities
and entitlement to increase their aspirations.
The recognition to social capital is increasingly
assuming importance in some of the developed/
developing countries. In these countries some
settlements do constitute communities which have
norms to protect the poor, mutual trust and ability to
mobilise the information to act collectively.
The service provider accountability largely depends
on the meeting of needs and desires of the clients. In
some of the services, the payment can have four kinds
of beneficial effects. These are: (a) improving the
behaviour of the service provider; (b) enhancement of
supply and the sustainability; (c) Increasing vigilance
and stake in receiving better service from each
transaction; (d) making better choices about which
services to demand.
There are some obstacles such as discourtesy, social
distance, abruptness of care, discrimination against
women and ethnic minorities, service characteristics
mismatched to individuals tastes, preferences and needs,
which impedes the efficient delivery mechanism. The
service providers should take care of these factors while
delivering the services. This may enhance the purchasing
powers of the clients. Many studies conducted in the
countries such as Bangladesh, China, India, Lao PDR,
Thailand, and Vietnam indicate that the above
mentioned factors do matter and influence the service
delivery. It is observed that in some of the services, the
preference is tilted towards the private sector than
public sector. The factors such as courtesy, caring and
convenience of the private sector have advantage over
the public sector. It is observed from the findings of
many studies that the private service providers render
the services conveniently and take care of the time
hours, whereas limited hours facilities are provided by
the public sector.
To improve the service delivery in the public sector,
there is a need of not only the training but also the
motivation, which is lacking in the public sector (for
example in the case medical services, the doctor who is
serving in the public sector is generally not easily and
conveniently available. The medication is also not
satisfactory, besides, everything is done in a brusque
manner. At the same time if this doctor is in private sector,
he would be transformed into a well mannered and capable
doctor seeing patients with full care and more friendly
behaviour. Similarly, the support staff also behaves in the
same manner because they are paid salaries all the same,
irrespective of their attitudes toward patients. There is no
incentive left for the efficiency and sincerity.
In some of the public services which are also free of
cost, the discrimination takes place against the ethnic
minorities, women and the social distance. In the case of
artificial scarcity of free services (the medicines), there
would be excess demand and the rationing would be
through social status, personal connection and ethnicity. In
the process, poor people are always sufferers (the extreme
for example, the prostitutes are denied of the HIV/AIDS
medicines/treatment, whereas they are the part of the
battle against these problems. The scarcity of
commodities of low price results into illicit sale of
materials. Sometimes due to under payments for the
scarce commodities/services, the free service becomes
more expensive.
Chapter 4 • POLICY DIRECTIONS 249
The scarcity of the commodities leads to corruption.
The degree and level of corruption varies across the
countries. There are many such examples where the
rampant corruption is prevailing in the supply of free
public services. For instance, in Eastern Europe, the
health services are more prone to corruption. It
occupies higher rank among major services. It is
observed that in many cases there are underhand
dealings and the free medicines are sold to open
markets. The quantum of corruption prevailing in
different public services indicates that the health service
is the second highest corrupt service next to legal and
police.
In India, particularly in deep rural areas (desert
areas), where commuting between school and home is
lengthy and tiresome, the female teachers make use of a
proxy after bribing the education officials. Similarly, to
raise the female enrollment in the school, the girls are
exempted from paying the fees. And the girl students
are paid scholarship and the school kits too. In such
cases the chances of misuse of funds are enormous.
The ‘mid-day meal’ schemes of Government of India,
have both the stories of success as well as failure.
There is need to design the scheme in such a way that
should reduce the misappropriation of funds and
enhance the efficiency in the delivery of services.
In girls’ education, there are some instances wherein
the absence of facilities, the enrollment of girl students
is diverted from public to private schools. In
Bangladesh, the single sex girls’ school with toilet
facilities has diverted the enrollment from public to
private service providers.
4.8.2 Quality of Service and the Improvement in Delivery
The quality of service becomes more important when
poor people pay for them. They ensure the quantity and
quality of the goods and service they are purchasing. If
they are paying for the service, they ensure that the
money should go to that fund. There are some
instances, for example, in Zambia, the truck drivers pay
for the road fund and ensure its use for that purpose.
In another instance of successful service delivery is of
Rio de Janeiro, where the slum dwellers pay the water
bills with proud. It makes them happy as they are
included in the main society and they have the right
over the services. Similarly, it was observed in case of
farmers of Andhra Pradesh, where they feel their right
on the irrigation services after paying their dues for the
services. If we compare the farmers of Haryana and
Andhra Pradesh we notice that the farmers of Andhra
Pradesh are much poorer than the farmers of Haryana,
but they pay more (four times) for water. They are
happy because now the irrigation department is much
more accountable to them. They are happy because now
the irrigation department is much more accountable to
them. They know where the money goes and they have
a say in how it is spent. They will refuse to pay more,
only if the irrigation department makes some changes.
The preference for private service provider over the
public sector as observed in a detailed study is
reproduced below.
A study of consumer and producer attitude was
conducted in 6 districts in Andhra Pradesh. The study
included 72 in-depth interviews and 24 focus groups. It
showed that the private doctors enquire about the
health of the patients in more details, look after
everyone equally and treat better as compared to the
government doctors but charge more.
4.8.3 Benefiting the Poor through Competition
In the sphere of education or higher education
which is very expensive for the poor, if the numbers of
private institutions are allowed to provide the services,
the number of students enrolling in there would go up
and the poor students in the public institution can be
benefited by the subsidised education system. For
instance, in Jordan, the entry of private institutions
was restricted. On granting the permission to private
universities, the enrollment in these has gone up and
accounted for about one third of the total enrollment.
4.8.4 Improvement through Information
There are good as well as bad service providers in
private and public sectors. In the case of medical
services, both good and bad doctors are providing
services to the masses. There is need to provide detailed
information about the quality of services available in
private as well as public sector. This important role can
be played by the NGOs. This would increase the choice
of the users. The information about the service
providers would improve the choice of the people.
4.8.5 Community Participation and the ServiceDelivery Mechanism
The increase in participation of the people,
community, and the poor people in the implementation
of the development projects would help in increasing
the efficiency of the delivery mechanism and also
results in the reduction of corruption. For instance, in
one project in Rangareddy district in Andhra Pradesh, a
HARYANA DEVELOPMENT REPORT250
group of people constituting the monitoring
community, supervised the construction activity in the
local area. The active involvement of the people has
resulted in reduction of cost of construction through
minimising the overrun of time and the use of quantity
and quality of material. Similarly, the World Bank in its
report laid the emphasis on the strengthening of
participation. It is quoted “Strengthening participation
along the client-provider link can fix problems in the
long route of government provision. So the community
groups that take on complaining, monitoring, and other
means of making sure the things work properly would
be expected at some point to become institutionalised
within the government (more likely local government),
or possibly to be supplemented by government as it
improves. The local knowledge and inputs would
definitely improve the delivery mechanism of the
services provided.”
4.8.6 Local Services, Users’ Participation and theDelivery Mechanism
In some of the local services such as irrigation,
forestry management, and other local problems, the
local social capital’s role assumed great significance.
After the introduction of decentralisation, the
government has started to fund the development
projects in the local areas where the projects are
implemented by the user groups and the community
participation. In the case of water supply and sanitation
projects, the special-purpose user groups are
implementing the projects efficiently and the benefits of
the development projects started reaching to the
targeted people. Among the many examples of success,
the story of Cote d’Ivoire is worth mentioning. In this
place, when the delivery of the water supply in rural
areas has shifted from central government to user
groups, the delivery of the service has improved,
breakdown has reduced. The cost of service has also
declined. These models have brought improvement in
the delivery mechanism through improvement in the
accountability and increasing efficiency.
In another example, in West Bengal, the operation
and maintenance of irrigation pumps have been
transferred from State government to local governments
(Panchayats), the delivery system has improved and
achieved a great success.
4.8.7 Improvement in Delivery Mechanism throughLocal Governments
Withdrawal of better and skilled staff/officials
(administrators) at the local level can help in
monitoring the fund and use it efficiently to achieve
the desired goals of the development projects
implemented by the local government. Therefore, the
improving of local government’s capacity would also
help in improving the implementation of Plan
programmes and the delivery mechanism. This would
result in reaching the benefits of the projects to the
intended people in general and the poor in particular.
4.8.8 Delivery Mechanism and the Sustainability
The sustainability of the improved delivery
mechanism is very important in all the services but
more particular in local services such as water supply
and sanitation etc. In the water projects, the
maintenance of equipments is most crucial thing.
Therefore, the community participation is the most
needed requirement in maintaining the sustainability.
An assessment of central sector projects and some of
the major projects implemented by the Department of
Programme Implementation indicates that the factors
responsible for the time overrun cost are: poor project
formulation due to inadequate field investigation, lack
of adequate data, inadequate analysis of environmental
and rehabilitation implications, changes in prices and
exchange rate regimes, etc.; delays in clearance from
various regulatory agencies in land acquisition and in
procurement of materials (such delays are primarily due
to poor coordination and project planning, as these
problems are not explicitly considered or taken into
account at the planning stage), changes in design or
scope of projects midway through execution; inability of
the project management to take prompt decisions on
various aspects of these projects even when the
objective circumstances warrant such decisions;
management problems such as personnel, labour and
contractor disputes, mismatch of equipments;
inadequate and untimely release of funds; and
unforeseeable factors such as adverse geo mining
conditions and natural calamities.
A review of the Ninth Five Year Plan has observed
that due to lack of adequate database, local situation
and time and resource constraints, the programmes/
projects are designed on the basis of certain
assumptions. There is a strong need to have in-depth
fieldwork before designing of the project. This would
help in implementation of the projects. The past
experiences should be utilised to remove the
inadequacies in design and implementation of the
projects mid-term and concurrent evaluation of the
project would also help in effective implementation of
the projects.
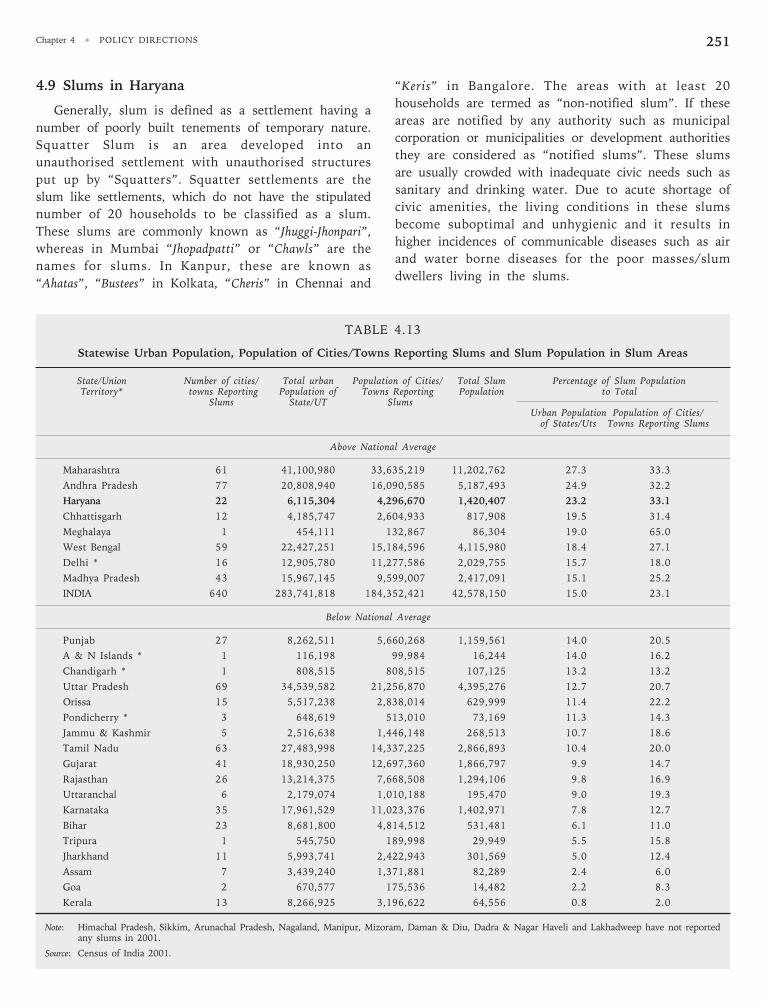
Chapter 4 • POLICY DIRECTIONS 251
4.9 Slums in Haryana
Generally, slum is defined as a settlement having a
number of poorly built tenements of temporary nature.
Squatter Slum is an area developed into an
unauthorised settlement with unauthorised structures
put up by “Squatters”. Squatter settlements are the
slum like settlements, which do not have the stipulated
number of 20 households to be classified as a slum.
These slums are commonly known as “Jhuggi-Jhonpari”,
whereas in Mumbai “Jhopadpatti” or “Chawls” are the
names for slums. In Kanpur, these are known as
“Ahatas”, “Bustees” in Kolkata, “Cheris” in Chennai and
“Keris” in Bangalore. The areas with at least 20
households are termed as “non-notified slum”. If these
areas are notified by any authority such as municipal
corporation or municipalities or development authorities
they are considered as “notified slums”. These slums
are usually crowded with inadequate civic needs such as
sanitary and drinking water. Due to acute shortage of
civic amenities, the living conditions in these slums
become suboptimal and unhygienic and it results in
higher incidences of communicable diseases such as air
and water borne diseases for the poor masses/slum
dwellers living in the slums.
TABLE 4.13
Statewise Urban Population, Population of Cities/Towns Reporting Slums and Slum Population in Slum Areas
State/Union Number of cities/ Total urban Population of Cities/ Total Slum Percentage of Slum PopulationTerritory* towns Reporting Population of Towns Reporting Population to Total
Slums State/UT SlumsUrban Population Population of Cities/
of States/Uts Towns Reporting Slums
Above National Average
Maharashtra 61 41,100,980 33,635,219 11,202,762 27.3 33.3
Andhra Pradesh 77 20,808,940 16,090,585 5,187,493 24.9 32.2
Haryana 22 6,115,304 4,296,670 1,420,407 23.2 33.1
Chhattisgarh 12 4,185,747 2,604,933 817,908 19.5 31.4
Meghalaya 1 454,111 132,867 86,304 19.0 65.0
West Bengal 59 22,427,251 15,184,596 4,115,980 18.4 27.1
Delhi * 16 12,905,780 11,277,586 2,029,755 15.7 18.0
Madhya Pradesh 43 15,967,145 9,599,007 2,417,091 15.1 25.2
INDIA 640 283,741,818 184,352,421 42,578,150 15.0 23.1
Below National Average
Punjab 27 8,262,511 5,660,268 1,159,561 14.0 20.5
A & N Islands * 1 116,198 99,984 16,244 14.0 16.2
Chandigarh * 1 808,515 808,515 107,125 13.2 13.2
Uttar Pradesh 69 34,539,582 21,256,870 4,395,276 12.7 20.7
Orissa 15 5,517,238 2,838,014 629,999 11.4 22.2
Pondicherry * 3 648,619 513,010 73,169 11.3 14.3
Jammu & Kashmir 5 2,516,638 1,446,148 268,513 10.7 18.6
Tamil Nadu 63 27,483,998 14,337,225 2,866,893 10.4 20.0
Gujarat 41 18,930,250 12,697,360 1,866,797 9.9 14.7
Rajasthan 26 13,214,375 7,668,508 1,294,106 9.8 16.9
Uttaranchal 6 2,179,074 1,010,188 195,470 9.0 19.3
Karnataka 35 17,961,529 11,023,376 1,402,971 7.8 12.7
Bihar 23 8,681,800 4,814,512 531,481 6.1 11.0
Tripura 1 545,750 189,998 29,949 5.5 15.8
Jharkhand 11 5,993,741 2,422,943 301,569 5.0 12.4
Assam 7 3,439,240 1,371,881 82,289 2.4 6.0
Goa 2 670,577 175,536 14,482 2.2 8.3
Kerala 13 8,266,925 3,196,622 64,556 0.8 2.0
Note: Himachal Pradesh, Sikkim, Arunachal Pradesh, Nagaland, Manipur, Mizoram, Daman & Diu, Dadra & Nagar Haveli and Lakhadweep have not reportedany slums in 2001.
Source: Census of India 2001.
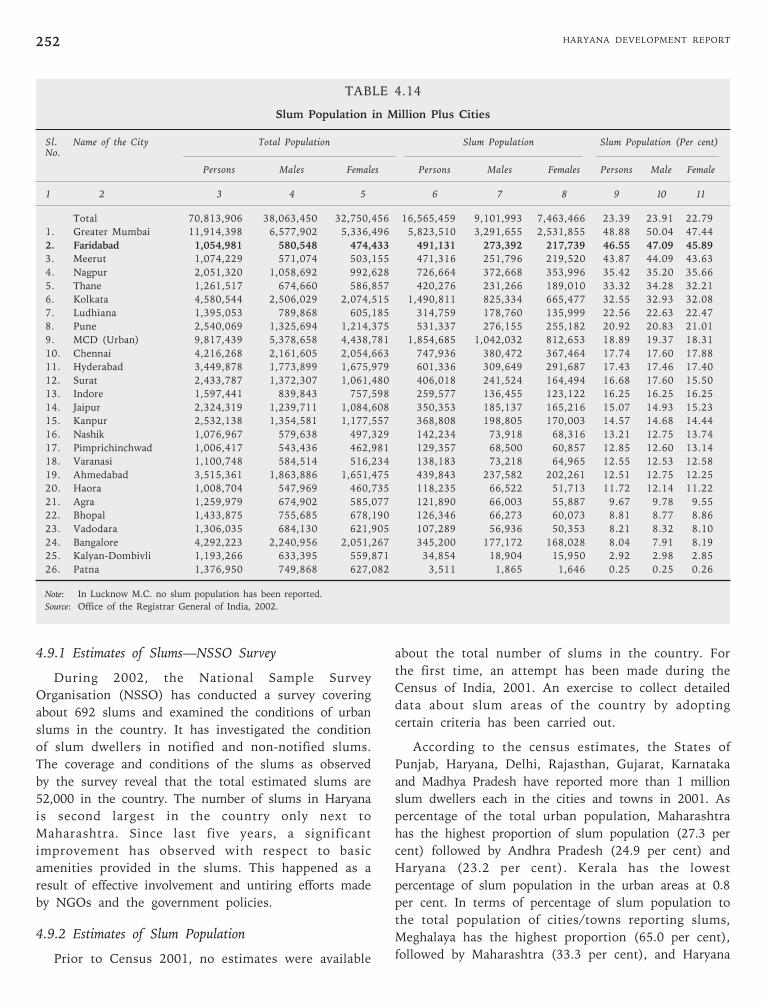
HARYANA DEVELOPMENT REPORT252
4.9.1 Estimates of Slums—NSSO Survey
During 2002, the National Sample Survey
Organisation (NSSO) has conducted a survey covering
about 692 slums and examined the conditions of urban
slums in the country. It has investigated the condition
of slum dwellers in notified and non-notified slums.
The coverage and conditions of the slums as observed
by the survey reveal that the total estimated slums are
52,000 in the country. The number of slums in Haryana
is second largest in the country only next to
Maharashtra. Since last five years, a significant
improvement has observed with respect to basic
amenities provided in the slums. This happened as a
result of effective involvement and untiring efforts made
by NGOs and the government policies.
4.9.2 Estimates of Slum Population
Prior to Census 2001, no estimates were available
about the total number of slums in the country. For
the first time, an attempt has been made during the
Census of India, 2001. An exercise to collect detailed
data about slum areas of the country by adopting
certain criteria has been carried out.
According to the census estimates, the States of
Punjab, Haryana, Delhi, Rajasthan, Gujarat, Karnataka
and Madhya Pradesh have reported more than 1 million
slum dwellers each in the cities and towns in 2001. As
percentage of the total urban population, Maharashtra
has the highest proportion of slum population (27.3 per
cent) followed by Andhra Pradesh (24.9 per cent) and
Haryana (23.2 per cent). Kerala has the lowest
percentage of slum population in the urban areas at 0.8
per cent. In terms of percentage of slum population to
the total population of cities/towns reporting slums,
Meghalaya has the highest proportion (65.0 per cent),
followed by Maharashtra (33.3 per cent), and Haryana
TABLE 4.14
Slum Population in Million Plus Cities
Sl. Name of the City Total Population Slum Population Slum Population (Per cent)No.
Persons Males Females Persons Males Females Persons Male Female
1 2 3 4 5 6 7 8 9 10 11
Total 70,813,906 38,063,450 32,750,456 16,565,459 9,101,993 7,463,466 23.39 23.91 22.79
1. Greater Mumbai 11,914,398 6,577,902 5,336,496 5,823,510 3,291,655 2,531,855 48.88 50.04 47.44
2. Faridabad 1,054,981 580,548 474,433 491,131 273,392 217,739 46.55 47.09 45.89
3. Meerut 1,074,229 571,074 503,155 471,316 251,796 219,520 43.87 44.09 43.63
4. Nagpur 2,051,320 1,058,692 992,628 726,664 372,668 353,996 35.42 35.20 35.66
5. Thane 1,261,517 674,660 586,857 420,276 231,266 189,010 33.32 34.28 32.21
6. Kolkata 4,580,544 2,506,029 2,074,515 1,490,811 825,334 665,477 32.55 32.93 32.08
7. Ludhiana 1,395,053 789,868 605,185 314,759 178,760 135,999 22.56 22.63 22.47
8. Pune 2,540,069 1,325,694 1,214,375 531,337 276,155 255,182 20.92 20.83 21.01
9. MCD (Urban) 9,817,439 5,378,658 4,438,781 1,854,685 1,042,032 812,653 18.89 19.37 18.31
10. Chennai 4,216,268 2,161,605 2,054,663 747,936 380,472 367,464 17.74 17.60 17.88
11. Hyderabad 3,449,878 1,773,899 1,675,979 601,336 309,649 291,687 17.43 17.46 17.40
12. Surat 2,433,787 1,372,307 1,061,480 406,018 241,524 164,494 16.68 17.60 15.50
13. Indore 1,597,441 839,843 757,598 259,577 136,455 123,122 16.25 16.25 16.25
14. Jaipur 2,324,319 1,239,711 1,084,608 350,353 185,137 165,216 15.07 14.93 15.23
15. Kanpur 2,532,138 1,354,581 1,177,557 368,808 198,805 170,003 14.57 14.68 14.44
16. Nashik 1,076,967 579,638 497,329 142,234 73,918 68,316 13.21 12.75 13.74
17. Pimprichinchwad 1,006,417 543,436 462,981 129,357 68,500 60,857 12.85 12.60 13.14
18. Varanasi 1,100,748 584,514 516,234 138,183 73,218 64,965 12.55 12.53 12.58
19. Ahmedabad 3,515,361 1,863,886 1,651,475 439,843 237,582 202,261 12.51 12.75 12.25
20. Haora 1,008,704 547,969 460,735 118,235 66,522 51,713 11.72 12.14 11.22
21. Agra 1,259,979 674,902 585,077 121,890 66,003 55,887 9.67 9.78 9.55
22. Bhopal 1,433,875 755,685 678,190 126,346 66,273 60,073 8.81 8.77 8.86
23. Vadodara 1,306,035 684,130 621,905 107,289 56,936 50,353 8.21 8.32 8.10
24. Bangalore 4,292,223 2,240,956 2,051,267 345,200 177,172 168,028 8.04 7.91 8.19
25. Kalyan-Dombivli 1,193,266 633,395 559,871 34,854 18,904 15,950 2.92 2.98 2.85
26. Patna 1,376,950 749,868 627,082 3,511 1,865 1,646 0.25 0.25 0.26
Note: In Lucknow M.C. no slum population has been reported.
Source: Office of the Registrar General of India, 2002.
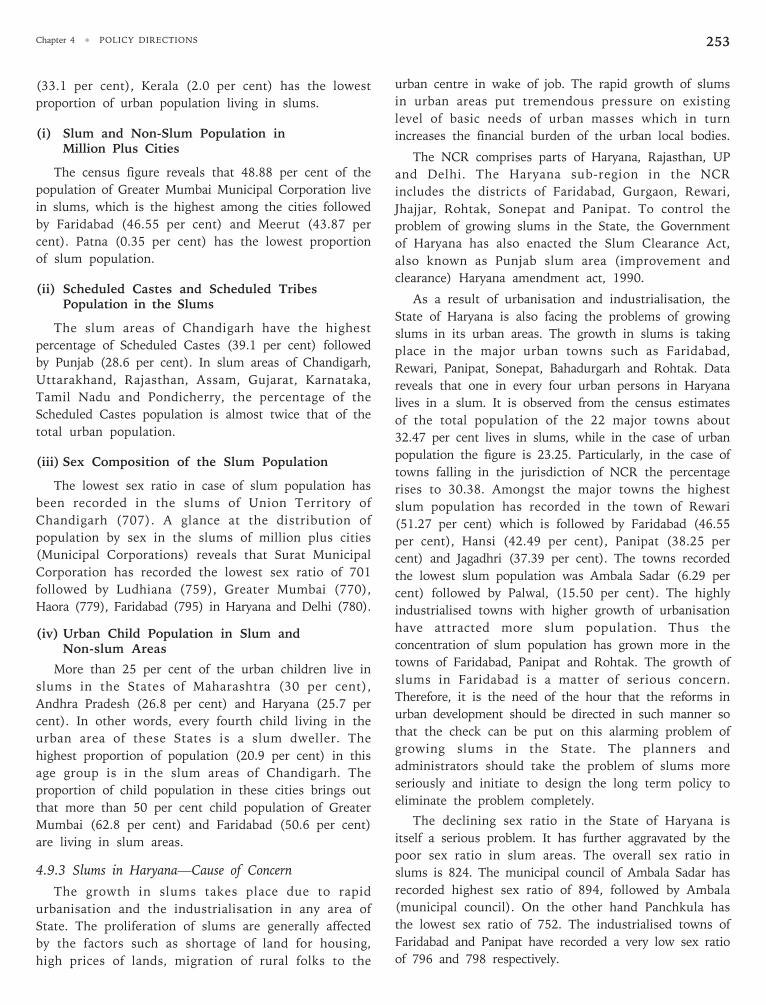
Chapter 4 • POLICY DIRECTIONS 253
(33.1 per cent), Kerala (2.0 per cent) has the lowest
proportion of urban population living in slums.
(i) Slum and Non-Slum Population inMillion Plus Cities
The census figure reveals that 48.88 per cent of the
population of Greater Mumbai Municipal Corporation live
in slums, which is the highest among the cities followed
by Faridabad (46.55 per cent) and Meerut (43.87 per
cent). Patna (0.35 per cent) has the lowest proportion
of slum population.
(ii) Scheduled Castes and Scheduled TribesPopulation in the Slums
The slum areas of Chandigarh have the highest
percentage of Scheduled Castes (39.1 per cent) followed
by Punjab (28.6 per cent). In slum areas of Chandigarh,
Uttarakhand, Rajasthan, Assam, Gujarat, Karnataka,
Tamil Nadu and Pondicherry, the percentage of the
Scheduled Castes population is almost twice that of the
total urban population.
(iii) Sex Composition of the Slum Population
The lowest sex ratio in case of slum population has
been recorded in the slums of Union Territory of
Chandigarh (707). A glance at the distribution of
population by sex in the slums of million plus cities
(Municipal Corporations) reveals that Surat Municipal
Corporation has recorded the lowest sex ratio of 701
followed by Ludhiana (759), Greater Mumbai (770),
Haora (779), Faridabad (795) in Haryana and Delhi (780).
(iv) Urban Child Population in Slum andNon-slum Areas
More than 25 per cent of the urban children live in
slums in the States of Maharashtra (30 per cent),
Andhra Pradesh (26.8 per cent) and Haryana (25.7 per
cent). In other words, every fourth child living in the
urban area of these States is a slum dweller. The
highest proportion of population (20.9 per cent) in this
age group is in the slum areas of Chandigarh. The
proportion of child population in these cities brings out
that more than 50 per cent child population of Greater
Mumbai (62.8 per cent) and Faridabad (50.6 per cent)
are living in slum areas.
4.9.3 Slums in Haryana—Cause of Concern
The growth in slums takes place due to rapid
urbanisation and the industrialisation in any area of
State. The proliferation of slums are generally affected
by the factors such as shortage of land for housing,
high prices of lands, migration of rural folks to the
urban centre in wake of job. The rapid growth of slums
in urban areas put tremendous pressure on existing
level of basic needs of urban masses which in turn
increases the financial burden of the urban local bodies.
The NCR comprises parts of Haryana, Rajasthan, UP
and Delhi. The Haryana sub-region in the NCR
includes the districts of Faridabad, Gurgaon, Rewari,
Jhajjar, Rohtak, Sonepat and Panipat. To control the
problem of growing slums in the State, the Government
of Haryana has also enacted the Slum Clearance Act,
also known as Punjab slum area (improvement and
clearance) Haryana amendment act, 1990.
As a result of urbanisation and industrialisation, the
State of Haryana is also facing the problems of growing
slums in its urban areas. The growth in slums is taking
place in the major urban towns such as Faridabad,
Rewari, Panipat, Sonepat, Bahadurgarh and Rohtak. Data
reveals that one in every four urban persons in Haryana
lives in a slum. It is observed from the census estimates
of the total population of the 22 major towns about
32.47 per cent lives in slums, while in the case of urban
population the figure is 23.25. Particularly, in the case of
towns falling in the jurisdiction of NCR the percentage
rises to 30.38. Amongst the major towns the highest
slum population has recorded in the town of Rewari
(51.27 per cent) which is followed by Faridabad (46.55
per cent), Hansi (42.49 per cent), Panipat (38.25 per
cent) and Jagadhri (37.39 per cent). The towns recorded
the lowest slum population was Ambala Sadar (6.29 per
cent) followed by Palwal, (15.50 per cent). The highly
industrialised towns with higher growth of urbanisation
have attracted more slum population. Thus the
concentration of slum population has grown more in the
towns of Faridabad, Panipat and Rohtak. The growth of
slums in Faridabad is a matter of serious concern.
Therefore, it is the need of the hour that the reforms in
urban development should be directed in such manner so
that the check can be put on this alarming problem of
growing slums in the State. The planners and
administrators should take the problem of slums more
seriously and initiate to design the long term policy to
eliminate the problem completely.
The declining sex ratio in the State of Haryana is
itself a serious problem. It has further aggravated by the
poor sex ratio in slum areas. The overall sex ratio in
slums is 824. The municipal council of Ambala Sadar has
recorded highest sex ratio of 894, followed by Ambala
(municipal council). On the other hand Panchkula has
the lowest sex ratio of 752. The industrialised towns of
Faridabad and Panipat have recorded a very low sex ratio
of 796 and 798 respectively.
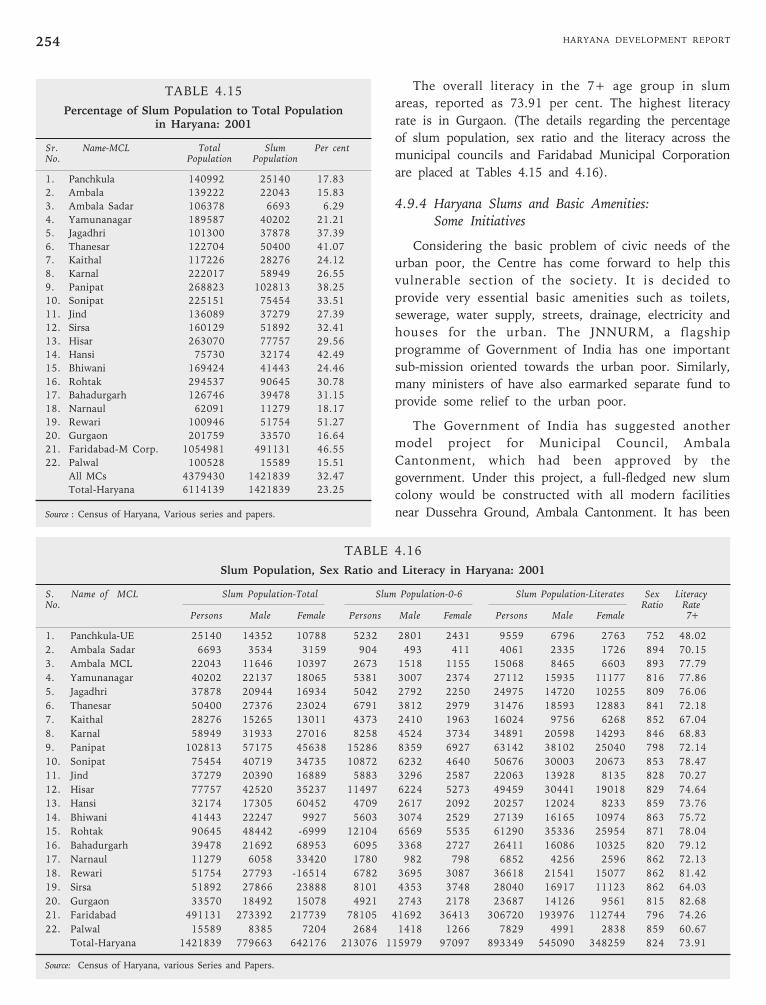
HARYANA DEVELOPMENT REPORT254
TABLE 4.15
Percentage of Slum Population to Total Populationin Haryana: 2001
Sr. Name-MCL Total Slum Per centNo. Population Population
1. Panchkula 140992 25140 17.83
2. Ambala 139222 22043 15.83
3. Ambala Sadar 106378 6693 6.29
4. Yamunanagar 189587 40202 21.21
5. Jagadhri 101300 37878 37.39
6. Thanesar 122704 50400 41.07
7. Kaithal 117226 28276 24.12
8. Karnal 222017 58949 26.55
9. Panipat 268823 102813 38.25
10. Sonipat 225151 75454 33.51
11. Jind 136089 37279 27.39
12. Sirsa 160129 51892 32.41
13. Hisar 263070 77757 29.56
14. Hansi 75730 32174 42.49
15. Bhiwani 169424 41443 24.46
16. Rohtak 294537 90645 30.78
17. Bahadurgarh 126746 39478 31.15
18. Narnaul 62091 11279 18.17
19. Rewari 100946 51754 51.27
20. Gurgaon 201759 33570 16.64
21. Faridabad-M Corp. 1054981 491131 46.55
22. Palwal 100528 15589 15.51
All MCs 4379430 1421839 32.47
Total-Haryana 6114139 1421839 23.25
Source : Census of Haryana, Various series and papers.
The overall literacy in the 7+ age group in slum
areas, reported as 73.91 per cent. The highest literacy
rate is in Gurgaon. (The details regarding the percentage
of slum population, sex ratio and the literacy across the
municipal councils and Faridabad Municipal Corporation
are placed at Tables 4.15 and 4.16).
4.9.4 Haryana Slums and Basic Amenities:Some Initiatives
Considering the basic problem of civic needs of the
urban poor, the Centre has come forward to help this
vulnerable section of the society. It is decided to
provide very essential basic amenities such as toilets,
sewerage, water supply, streets, drainage, electricity and
houses for the urban. The JNNURM, a flagship
programme of Government of India has one important
sub-mission oriented towards the urban poor. Similarly,
many ministers of have also earmarked separate fund to
provide some relief to the urban poor.
The Government of India has suggested another
model project for Municipal Council, Ambala
Cantonment, which had been approved by the
government. Under this project, a full-fledged new slum
colony would be constructed with all modern facilities
near Dussehra Ground, Ambala Cantonment. It has been
TABLE 4.16
Slum Population, Sex Ratio and Literacy in Haryana: 2001
S. Name of MCL Slum Population-Total Slum Population-0-6 Slum Population-Literates Sex LiteracyNo. Ratio Rate
Persons Male Female Persons Male Female Persons Male Female 7+
1. Panchkula-UE 25140 14352 10788 5232 2801 2431 9559 6796 2763 752 48.02
2. Ambala Sadar 6693 3534 3159 904 493 411 4061 2335 1726 894 70.15
3. Ambala MCL 22043 11646 10397 2673 1518 1155 15068 8465 6603 893 77.79
4. Yamunanagar 40202 22137 18065 5381 3007 2374 27112 15935 11177 816 77.86
5. Jagadhri 37878 20944 16934 5042 2792 2250 24975 14720 10255 809 76.06
6. Thanesar 50400 27376 23024 6791 3812 2979 31476 18593 12883 841 72.18
7. Kaithal 28276 15265 13011 4373 2410 1963 16024 9756 6268 852 67.04
8. Karnal 58949 31933 27016 8258 4524 3734 34891 20598 14293 846 68.83
9. Panipat 102813 57175 45638 15286 8359 6927 63142 38102 25040 798 72.14
10. Sonipat 75454 40719 34735 10872 6232 4640 50676 30003 20673 853 78.47
11. Jind 37279 20390 16889 5883 3296 2587 22063 13928 8135 828 70.27
12. Hisar 77757 42520 35237 11497 6224 5273 49459 30441 19018 829 74.64
13. Hansi 32174 17305 60452 4709 2617 2092 20257 12024 8233 859 73.76
14. Bhiwani 41443 22247 9927 5603 3074 2529 27139 16165 10974 863 75.72
15. Rohtak 90645 48442 -6999 12104 6569 5535 61290 35336 25954 871 78.04
16. Bahadurgarh 39478 21692 68953 6095 3368 2727 26411 16086 10325 820 79.12
17. Narnaul 11279 6058 33420 1780 982 798 6852 4256 2596 862 72.13
18. Rewari 51754 27793 -16514 6782 3695 3087 36618 21541 15077 862 81.42
19. Sirsa 51892 27866 23888 8101 4353 3748 28040 16917 11123 862 64.03
20. Gurgaon 33570 18492 15078 4921 2743 2178 23687 14126 9561 815 82.68
21. Faridabad 491131 273392 217739 78105 41692 36413 306720 193976 112744 796 74.26
22. Palwal 15589 8385 7204 2684 1418 1266 7829 4991 2838 859 60.67
Total-Haryana 1421839 779663 642176 213076 115979 97097 893349 545090 348259 824 73.91
Source: Census of Haryana, various Series and Papers.
Chapter 4 • POLICY DIRECTIONS 255
reported that under this scheme, 192 houses would be
constructed at a cost of Rs. 3.17 crore and 192 families
would be benefited. The government also is initiating
such measures which would help in improving the living
conditions of the urban poor in slum areas.
4.9.5 Plan to Relocate Slums in HaryanaDistricts on Cards
Expressing its deep concern about this problem the
Ministry for Housing and Urban Poverty Alleviation has
suggested another remedial measure in this direction and
has approved an amount of Rs. 65.77 crore plan for the
district to create a slum-free State. Under this project about
13 colonies having a population of nearly 50,000 have
been identified for the rehabilitation of slums under the
Integrated Housing and Slum Development Programme of
the ministry. Most of these slums are occupying prime
locations and have become an eyesore in the otherwise
fast developing city. The minister has also indicated that
there is no dearth of money with the ministry. The
Government of India is open to projects by State
governments aimed at uplifting the standards of the
poor. The ministry has cleared similar projects for
Ambala city and cantonment and Naraingarh to the tune
of Rs. 40 crore. Also, fund-allocation to change the way
slums in Bhiwani look is on the cards. The projects
cleared by the ministry are lying now with the State
government. The moment it gets a nod from them, it
will give them 25 per cent of the amount. It further
stressed that the relocation of slums should not be
impractical for the slum-dwellers in the State.
With respect to the allotment of land, it is the State
decision. The land chosen for the reallocation of slums
should not be too far off from the city or their place of
work, something that the slum-dwellers are likely to
reject. It would be far better if the places are given a
facelift at their present place of residence.
4.9.6 Health Project for Slum Dwellers
Good health is an important aspect of every person’s
life. Most of the slum-dwellers are affected by the poor
health, adult in general and children in particular. In
this direction, the government of Haryana has initiated
some measures to extend the health benefits to the
slum dwellers in Haryana cities through a unique
health project. The health project entails involving
private practitioners for making child health care and
family planning services accessible to the urban poor. A
pilot project is likely to be launched in four districts of
Ambala, Panipat, Hisar and Rewari. With central
financial assistance, the State government is assigned
the responsibilities to run this project. It was further
mentioned that nursing homes would be given
responsibilities of 1000 to 1500 families. Hospitals having
maternity home and child health services will be chosen
for the project. The private hospitals will provide primary
health care, emergency obstetrics and neo-natal care. A
survey has already been carried out in this regard.
Under the project, a nominal sum of Rs. 100 per
family member a year will be given to the private
practitioner. Two auxiliary nurses/midwife will have to
be provided for the project by the nursing home.
Nurses will regularly visit the families and medical
consultants will also visit them.
In case of minor ailments families, living in slums
will be provided medicines. The health project
beneficiaries would be able to avail subsidised medical
tests. The slum-dwellers who are eligible for the health
project would be issue health cards. The adolescent girls
would be given special attention. The slum dwellers
would be provided with special primary health care
service package, including referral support at fixed costs.
The provision would be made for good quality and
low-cost diagnostic services and essential medicines,
contraceptives, vaccines and other supplies. Under the
project, the services for mothers would include
immunisation, ante-natal care and identification of
maternal complications, delivery by trained personnel and
management of obstetric emergencies. The special
facilities of vaccination, vitamin A prophylaxis and
integrated management of childhood illness would be
provided for the slum children.
4.9.7 Slum Women to Get Better Healthcare
Janani Suvidha Yojana Under the scheme of “Janani
Suvidha Yojana” an amount of Rs. 1 crore has been
earmarked for Janani Suvidha Yojana which would be
implemented through NGOs. The benefits such as
ante-natal care and free delivery services would be
provided to the urban poor in slum areas. The State
government would pay the bills on behalf of the clients
availing services of primary healthcare.
The scheme is specially dovetailed to extend the
benefits to enable women living in urban slums to avail of
services like ante-natal care, free delivery services and
immunisation of children from selected qualified doctors
or nursing homes within their own residential areas
through pre-paid vouchers. The financial assistance in the
form of Rs. 1 crore had been earmarked for the scheme
HARYANA DEVELOPMENT REPORT256
which would be implemented through non-government
organisations working in the State. A resident woman
of the slum area would be selected as a link worker
between clients and private health care provider. She
would be given a performance-based honorarium. It is
important to note that the following schemes initiated
by the State government will benefit the women living
in slums:
The State government has declared 2006 as “Girl
Child Year”. In this year the State government has
planned to extend the following benefits to the girl
children:
(i) The EDUSAT connectivity would be provided
to all the 222 Government Girls Senior
Secondary Schools in the State this year;
(ii) The facilities of electricity connections would
be given to 1,500 Government Girls Primary
Schools. Presently only a few girls’ schools have
electricity connections;
(iii) Separate toilets would be provided for girls in
about 4,000 Government schools;
(iv) It had been decided to institute an award of
Rs. 1 lakh for those panchayats, which would
achieve 100 per cent enrollment of girls in age
group of 6-14 years, which in turn help in
enhancement of enrollment and retention in
schools;
(v) The facility of health check-up would be
provided to every girl child and it would include
immunisation coverage, treatment of anaemia,
de-worming, testing of eyes and dental check-
up.
(vi) Health counseling sessions would also be held
and recorded in health cards to be issued to all
girls up to the age of 18 years.
(vii) Mass publicity campaign would be launched to
enhance awareness against female foeticide to
check declining sex ratio.
(viii) The government would provide reservation for
girls in all ITIs and Technical Education
Institutions to the tune of 25 per cent.
Urbanisation, industrialisation, poverty, and slums
are integrated components of the growing economic
development in any country. The urban slums are not
going to go away in next quarter century or so. Reversal
of this phenomenon will begin after sufficient economic
progress had been made. Indian economy with ten per
cent growth has a sign of prosperity. However, rapid
growth in urban slums is a major cause of concern.
With fast growth in country’s economy vis-à-vis in the
State of Haryana there is a good chance that the new
and upcoming generation may stay away from slum
dwelling. There would be all possibility of slum-free
nation as well as slum-free State of Haryana.
4.10 Self-Sustained Development of UrbanLocal Bodies
In the era of globalisation, liberalisation and
privatisation, the concept of sustainable development has
become the cause of concern at national and international
level. Sustainable urban development mainly focuses on
the areas such as urban development and management,
environment, and quality of life. With the growth of
population, urbanisation become inevitable. Sustainable
growth requires an understanding of the way urban areas
carry out their activities such as resource use and the
movement of goods and people. The physical infrastructure
in addition to social and economic processes must be
evolved to meet the challenges of growth.
Sustainable development has been defined as
development that meets the needs of the present
generations without compromising the ability of future
generations to meet their own needs. However,
sustainable urban development implies a process by which
sustainability can be attained by emphasising
improvement, progress and positive change, in
environmental and social dimensions.
Sustainable urban development also highlights the
need for reform. The market mechanisms is needed to
achieve environmental goals and balance with social and
economic considerations such as a change in the
quality of growth; the conservation and minimisation of
the depletion of non-renewable resources; a merging of
economic decisions with those of the environment, and
a strong consideration of the needs of future
generations.
Over the period of time, several themes common to
all definitions of sustainable urban development have
emerged. The urbanisation of society is part of the
development process, as cities generate 60 per cent of
gross national product. Cities should be healthy,
providing basic housing needs and employment
opportunities.
Local governments are increasingly caught between
rising expectations that development initiatives be
sustainable as more and more services are being
Chapter 4 • POLICY DIRECTIONS 257
transferred to the municipal committee. Therefore, local
bodies should take initiative, in promoting sustainable
development in cities.
4.10.1 Urbanisation in India
The growth of urban population in India has been
increasing rapidly during the course of this century. While
the total population of India has grown by more than
three times since 1901 its urban population has also
increased substantially during the same period. The share
of Class I cities (with population 100,000 and above) to
total urban population has also increased during this
period. The concentration of population in the ‘million
plus’ cities has been particularly striking. Well-being of
the urban areas is very important. The cities in India,
could contribute more effectively to the country’s
economic growth and poverty reduction if they did not
suffer from severe infrastructure bottlenecks, service
deficiencies, distorted land and factor markets, weak
finances, and poor local governance.
4.10.2 Resources and Urban Development
Expanding human requirements and economic
activities are putting ever increasing pressures on land
resources by creating competition and conflicts and
resulting in to suboptimal use of both land and land
resources. If, in the future, human requirements are to
be met in a sustainable manner, it is essential to
resolve these conflicts and move towards more effective
and efficient use of land and its natural resources.
Rapid urban population growth and industrialisation
are putting severe strains on the water resources and
environmental protection capabilities of many cities.
Special attention needs to be given to the growing
effects of urbanisation on water demand and usage and
to the critical role played by local and municipal
authorities in managing its supply, use and overall
treatment of water. Scarcity of freshwater resources and
the escalating costs of developing new resources have a
considerable impact on national, industrial, agricultural,
and human settlement development and economic
growth. Better management of urban water resources,
including the elimination of unsustainable consumption
patterns, can make a substantial contribution to the
alleviation of poverty and improvement of the health and
quality of life of the urban and rural poor. A high
proportion of large urban agglomerations are located
around estuaries and in coastal zones. Such an
arrangement leads to pollution from municipal and
industrial discharges combined with overexploitation of
available water resources and threatens the marine
environment and the supply of freshwater resources.
4.10.3 Human Settlements
In industrialised countries, the consumption patterns
of cities are severely stressing the global ecosystem while
settlements in the developing world, need more raw
material, energy, and economic development to overcome
basic economic and social problems. Human settlement
conditions in many parts of the world, particularly the
developing countries are deteriorating mainly as a result
of the low levels of investments in the sector attributable
to the overall resource constraints in these countries.
While urban efficiency has a significant and direct
bearing on the country’s overall economy, few cities are
able to provide the kinds of urban services required on a
regular and sustainable basis. The initiatives such as
strengthening of the Urban Local Bodies (ULB) by
continuing the decentralisation process through
delegation of powers from State level bodies and
expansion of the capacity building programmes would
help in achieving the desired results.
Mobilise resources on a sustainable basis for urban
infrastructure investments through private financing by
linking ULBs to the financial markets through the
intermediation of the Urban Development Fund and
providing investment incentives in low income
neighbourhoods through the use of supporting capital
grants. It would provide a successful model for other
municipalities. Presently, there are few credit lines
available to urban municipalities such as those provided
by the Tamil Nadu Urban Development Fund, a financial
intermediary structured as a public private partnership.
The Government of India’s Tenth Plan (2002-2007)
emphasises urban reform as critical to growth and poverty
alleviation. The World Bank continues to support India’s
urban reform agenda, which urges a broader
decentralisation framework, strengthening citizens’
empowerment, urban management, governance and
resource mobilisation.
The Human Development Report reveals that the HDI
(Human Development Indicator) for the country has
improved significantly between 1980 and 2001, by
nearly 26 per cent in the eighties and another 24 per
cent in the nineties (Planning Commission, 2002).
Though the rural-urban gap in the level of human
development continues to be significant, it has declined
during the period. The index of gender inequality
measuring human development indicators for females as
a proportion of that of males has also improved. On the
HARYANA DEVELOPMENT REPORT258
whole, gender disparities across the States have
declined over the period.
4.10.4 Environment and Local Government(Public-Private Partnership)
In an unusual first-time effort to incorporate citizens’
partnership in governance, the Delhi government has
initiated the Bhagidari programme in 2002. Literally
meaning “collaborative partnership”, Bhagidari involves
the participation of citizens, civil society organisations and
public representatives from Delhi in various social
activities. In another first, the programme has won the
United Nations Public Service Award for 2005 for
improving transparency, accountability and responsiveness
in public service.
Major initiatives undertaken by the Bhagidari
Scheme during the year 2002 were water conservation
and water harvesting by Delhi Jal Board and Urban
Development Department, anti-plastic and anti-littering
campaign by Department of Environment and Forests,
preferential treatment to senior citizens, reforms in
hospital management and quality control by Health and
Family Welfare Department, Student Welfare Committee
for Government schools, and development of industries.
Among the environmental management efforts, Solid
Waste Management (SWM) projects dominate the scene.
Some local governments have tried to elicit the support of
communities, NGOs and private agencies for such
projects. In both Ahmedabad and Mumbai, a private
company is contracted to compost part of the city waste;
in Bangalore and Chennai, NGOs are involved in the
collection and disposal of waste on behalf of the
government; in Pune the government has encouraged
housing colonies to decompose their organic waste.
In the 10th Five Year Plan, the National Urban
Renewal Mission (NURM) was designed to meet the
challenge of rapid urbanisation in seven mega-cities and
28 smaller cities. The initiative has been allocated a sum
of Rs. 5,500 crore in the country’s annual budget 2005-
2006. The substantial increase in the budgetary allocation
for the social sector reflects the government’s strong
commitment to sustainable development in rural and
urban areas. The combined efforts of the government,
private sector, NGOs and private individuals will surely
go a long way in making the world a better place to live
in.
4.10.5 Urban Transport
It was not recognised that the development
programmes in urban transportation were critical to the
sustainability of the urban systems. This basic need has
been acknowledged now as the rapidly deteriorating
transport systems have been seen to affect the urban
lifeline.
It is now widely recognised that as cities grow in
population and size, the demand for transport increases
more than proportionately. A good network of roads,
coupled with an efficient mass urban transport system
makes a substantial contribution to the working efficiency
of the cities and enables them to become catalysts of
economic, social and political development. An efficient
transportation system is, thus, critical for productivity and
economic growth in cities
4.10.6 Delivery Mechanism of ULBs
The growing concentration of urban population in
larger towns is another urban concern. The tasks are
challenging, for it is mainly in the mega and metro cities
that land is a major constraint for undertaking
development work. A large part of civic amenities,
particularly water supply, sanitation and sewerage, are
managed with assets that have outlived their operational
efficiency. The required massive upgradation and
renovation of these assets, is constrained by high
population density and concentrated commercial
activities at the locations where these service assets are
installed. The lack of comprehensive urban planning in
the past to promote regular upgradation and renewal has
resulted in a large backlog of development activities.
The key urban concern is the growing gap between
demand and supply of basic services. While there has
been a steady growth in the housing stock,
infrastructure and services, the gaps between demand
and supply have been rising, even in terms of
conservative norms. Private sector participation in
construction and maintenance of water supply and
sanitation schemes, to the extent possible be
encouraged/mobilised. Adoption of improved low cost
technology be encouraged to save cost of construction
and maintenance.
The delivery and management system has to be
strengthened. In the light of the Constitution (74th
Amendment) Act, while State agencies may continue to
plan and implement capital works, the responsibility of
distribution may be progressively decentralised to local
bodies, and where feasible, to the private sector, within
the policy guidelines of the State governments. While
this process will be initiated with distribution works,
in due course capital works may be decentralised.
Concerted efforts should be made to enhance the
Chapter 4 • POLICY DIRECTIONS 259
capacity of the municipalities to bridge the gap between
their resources and commitments. At the same time,
city agencies may continue in mega and metro cities, as
long as they operate on sustainable basis.
Among the major legislative contributions was the
Constitution (74th Amendment) Act, 1992, also known
as the Nagarpalika Act, which was passed by Parliament
in 1992 and received the assent of the President on
April 20, 1993. This landmark legislation provides a
common framework for the structure and mandate of
ULBs for effective democratic decentralisation. The Act
provided a period of one year to amend or modify the
existing municipal laws to bring them in conformity
with the provisions of the Nagarpalika Act. The State
and UT Governments have taken measures to establish
State Finance Commissions (SFCs) and State Election
Commissions (SECs). All States have established the 1st
and 2nd generation of SFCs. Almost all States have
implemented the reports of 1st and 2nd SFCs. As per the
mandatory statutory provision some of the States have
initiated further in this direction and constituted 3rd
SFC in the States. Similarly, the elections have also
been conducted regularly with 5 years of intervals. The
responsibilities and functions along with the funds
have also been transferred in many States. The District
Planning Committees have been set up in most of the
States. However, the laws related to the DPCs have not
been framed and made operational in all the districts of
the States. In none of the States has the government
notified an area as a metropolitan area for the purposes
of the amendment.
4.10.7 Devolution of Resources by CentralFinance Commission
Under the constitutional provision, for
strengthening the decentralisation across the States,
the central Finance Commission has recommended
devolution of resources for the ULBs in the States.
Accordingly, the Tenth Finance Commission, Eleventh
Finance Commission and Twelfth Finance Commission
have recommended Rs. 1000 crore, Rs. 2000 crore and
Rs. 4000 crore for the ULBs in the States.
The Town Planning, Municipal and urban
Development Authority and other State Parastatals Acts
and regulations should be speedily amended and legal
framework strengthened to assign the planning and
development functions to the urban local bodies,
facilitate planning reforms, permit schemes like land
adjustment, for example, to promote the use of land as
a resource and include all the emerging needs of
planning and development in the light of the
Constitution (74th Amendment) Act. The municipal/
city/town development plan will form a key component
of plan financing at the local level and seek to
maximise the linkages between infrastructure, land use,
urban growth and economic growth.
As a follow up of 74th Constitution Amendment
Act, most of the State governments are likely to entrust
the responsibility of operation and maintenance of
urban water supply and sanitation systems to local
bodies and therefore it would be necessary for the State
Finance Commission to explicitly indicate the norms
and other financial implications make a realistic
assessment of requirement of funds and also to make
suitable recommendations for provision of finances by
different categories of towns.
The Mega City Scheme, introduced in 1993-94,
covers five megacities of Mumbai, Calcutta, Chennai,
Bangalore and Hyderabad. This macro approach to mega
city planning is essential to decide upon the projects
that may be undertaken under the Mega City Scheme
and those that may have to be marketed for
implementation by other agencies and sources of
financing, including the private sector. It is also
necessary to break up the massive activities during the
Ninth Plan and thereafter into a well-defined time
schedule, to ensure the completion of the total
infrastructure development on which the sustainability
of the mega city depends.
Slum Development is another major activity taken up
to upgrade the urban environment and see that the
proliferation of slum and squatter settlements does not
further deteriorate it. In the past, several schemes have
been introduced to improve the living conditions in the
slums, where an increasing proportion of the urban poor
and migrants live and often work. Recognising the poor
populations access to basic urban services in these
settlements, the UBSP and EIUS have been provided some
specific Plan support to improve the access to basic services.
The priority concern is not only to stop the growing
deterioration in the urban environment, reflected in key
urban indicators on housing conditions, pollution
levels, traffic congestion, informal sector, among others,
but to positively change the trend and ensure an
improved, healthy and congenial environment. The wide
gap between the demand and supply of basic civic
amenities like potable water, sanitation, transport and
housing, which has shown an increasing trend over the
last five decades, will be reduced, through creation of
new assets, upgradation and renewal of existing assets,
attaining better operational and management efficiency
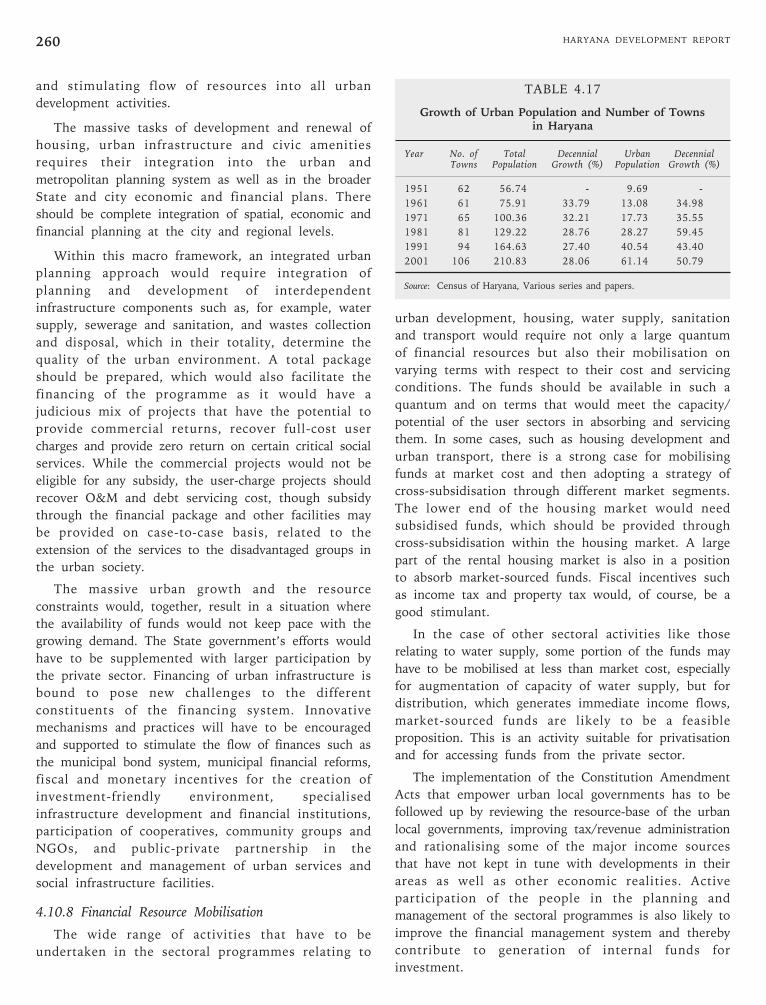
HARYANA DEVELOPMENT REPORT260
and stimulating flow of resources into all urban
development activities.
The massive tasks of development and renewal of
housing, urban infrastructure and civic amenities
requires their integration into the urban and
metropolitan planning system as well as in the broader
State and city economic and financial plans. There
should be complete integration of spatial, economic and
financial planning at the city and regional levels.
Within this macro framework, an integrated urban
planning approach would require integration of
planning and development of interdependent
infrastructure components such as, for example, water
supply, sewerage and sanitation, and wastes collection
and disposal, which in their totality, determine the
quality of the urban environment. A total package
should be prepared, which would also facilitate the
financing of the programme as it would have a
judicious mix of projects that have the potential to
provide commercial returns, recover full-cost user
charges and provide zero return on certain critical social
services. While the commercial projects would not be
eligible for any subsidy, the user-charge projects should
recover O&M and debt servicing cost, though subsidy
through the financial package and other facilities may
be provided on case-to-case basis, related to the
extension of the services to the disadvantaged groups in
the urban society.
The massive urban growth and the resource
constraints would, together, result in a situation where
the availability of funds would not keep pace with the
growing demand. The State government’s efforts would
have to be supplemented with larger participation by
the private sector. Financing of urban infrastructure is
bound to pose new challenges to the different
constituents of the financing system. Innovative
mechanisms and practices will have to be encouraged
and supported to stimulate the flow of finances such as
the municipal bond system, municipal financial reforms,
fiscal and monetary incentives for the creation of
investment-friendly environment, specialised
infrastructure development and financial institutions,
participation of cooperatives, community groups and
NGOs, and public-private partnership in the
development and management of urban services and
social infrastructure facilities.
4.10.8 Financial Resource Mobilisation
The wide range of activities that have to be
undertaken in the sectoral programmes relating to
urban development, housing, water supply, sanitation
and transport would require not only a large quantum
of financial resources but also their mobilisation on
varying terms with respect to their cost and servicing
conditions. The funds should be available in such a
quantum and on terms that would meet the capacity/
potential of the user sectors in absorbing and servicing
them. In some cases, such as housing development and
urban transport, there is a strong case for mobilising
funds at market cost and then adopting a strategy of
cross-subsidisation through different market segments.
The lower end of the housing market would need
subsidised funds, which should be provided through
cross-subsidisation within the housing market. A large
part of the rental housing market is also in a position
to absorb market-sourced funds. Fiscal incentives such
as income tax and property tax would, of course, be a
good stimulant.
In the case of other sectoral activities like those
relating to water supply, some portion of the funds may
have to be mobilised at less than market cost, especially
for augmentation of capacity of water supply, but for
distribution, which generates immediate income flows,
market-sourced funds are likely to be a feasible
proposition. This is an activity suitable for privatisation
and for accessing funds from the private sector.
The implementation of the Constitution Amendment
Acts that empower urban local governments has to be
followed up by reviewing the resource-base of the urban
local governments, improving tax/revenue administration
and rationalising some of the major income sources
that have not kept in tune with developments in their
areas as well as other economic realities. Active
participation of the people in the planning and
management of the sectoral programmes is also likely to
improve the financial management system and thereby
contribute to generation of internal funds for
investment.
TABLE 4.17
Growth of Urban Population and Number of Townsin Haryana
Year No. of Total Decennial Urban DecennialTowns Population Growth (%) Population Growth (%)
1951 62 56.74 - 9.69 -
1961 61 75.91 33.79 13.08 34.98
1971 65 100.36 32.21 17.73 35.55
1981 81 129.22 28.76 28.27 59.45
1991 94 164.63 27.40 40.54 43.40
2001 106 210.83 28.06 61.14 50.79
Source: Census of Haryana, Various series and papers.
Chapter 4 • POLICY DIRECTIONS 261
4.10.9 Self-sustainable Urban Local Bodies in Haryana
The State of Haryana has witnessed a tremendous
growth in its urban population during last two decades.
In 1981, there were about 28.27 lakh people residing in
urban areas, which have grown over the period and
reached to the figure of 61.14 lakh in 2001. The growth
of urban population and the number of towns are
shown in Table 4.17.
The two factors, rapid industrialisation and the
proximity to the National Capital–Delhi are responsible
for this high growth of urbanisation in the State. The
increasing urbanisation has put additional pressure on
the existing infrastructure. It has resulted in the
increased demand for basic infrastructure, housing and
the provision of basic civic amenities. The shifting of
polluting industries from Delhi to Haryana has
aggravated the problem. Another important factor
putting extra burden of the civic amenities provided by
the Urban local Bodies is the floating population. The
urban local bodies, with their limited available
resources, are not able to provide minimum level of
basic services to their citizens.
4.10.10 Structure and Composition of UrbanLocal Bodies
The State of Haryana has a long history of local
governments. The first Municipal Committee of Gohana
in Haryana was established in 1885. The number of
municipal bodies at the time of re-organisation of the
State was 56, which has increased to 68. In the post-
independence period after its incarnation, “The Haryana
Municipal Act, 1973” was promulgated in 1973. The main
task as envisaged in the Act was to regulate
composition, responsibilities, financial powers and
other related matters to urban local bodies. The Act,
has a number of Rules and Bye-laws to facilitate the
municipal bodies regarding matters such as,
maintenance of municipal accounts, delimitation of
wards, management of municipal properties and the
building activities. Earlier the ULBs in the State were
classified as A, B & C types of municipalities. The
present Act has categorised them (ULBs) into (i)
Municipal Committee (transitional area with population
not exceeding 50,000, (ii) Municipal Council (smaller
urban areas with population of 50,000 to 5 lakh, and
(iii) Municipal Corporation (larger urban areas with
population of five lakhs and more, governed by a
separate Municipal Act (Faridabad Municipal
Corporation is the only Municipal Corporation in the
State). The composition of ULBs with average
population and the area is depicted in Table 4.18. These
ULBs are providing civic amenities to about 61 lakh
inhabitants covering 68 towns and nearly 29 per cent of
the total population.
TABLE 4.18
Composition of Urban Local Bodies in Haryana
Urban Local Bodies No. Average Population Average AreaCovered (in Lakh) Covered (sq.kms.)
as on 1.4.2001 as on 1.4.2001(as per Census (as per Census
2001) 2001)
Municipal Corporation 1 10.55 204
Municipal Councils 21 1.58 16
Municipal Committees 46 0.31 5
Source : Various issues of Statistical Abstracts Haryana published byGovernment of Haryana, Chandigarh.
The number of urban local bodies across all the States
are 109 Municipal corporations, 1432 Municipalities and
the ULBs in transitional areas are 2182 Nagar
Panchayats.
Prior to 74th CAA, the civic bodies were discharging
their responsibilities related to the basic civic needs of
the people residing in urban areas. With the
introduction of 74th CAA and incorporation of the
functions enlisted in Twelfth Schedule in the Haryana
Municipal Act, 1994, the vast areas of responsibilities
have been assigned to the ULBs in the State. These
civic bodies meet the increased demand of the basic
needs. These functions vary from urban planning to
planning for economic and social development, drinking
water supply, public health, sanitation and solid waste
management, urban forestry, safeguarding interest of
weaker section of the society and the slum
improvement and upgradation and urban poverty
alleviation. The other functions include promotion of
cultural, education and aesthetic aspects, provision of
urban amenities like parks, garden and playgrounds,
cattle ponds and prevention of cruelty to animals, burial
grounds, maintenance of vital statistics such as
registration of birth and deaths, and the most
important assignment of public amenities such as street
lightings, bus stops and public conveniences.
Under the provision of the Act, 1994, ULBs are
armed with a number of taxation powers to raise the
resources for meeting the financial requirements in
discharging the responsibilities assigned to them. They
are empowered to levy obligatory as well as
discretionary taxes. The ULBs shall impose the taxes as
enlisted in Section 69 of the Haryana Municipal Act,
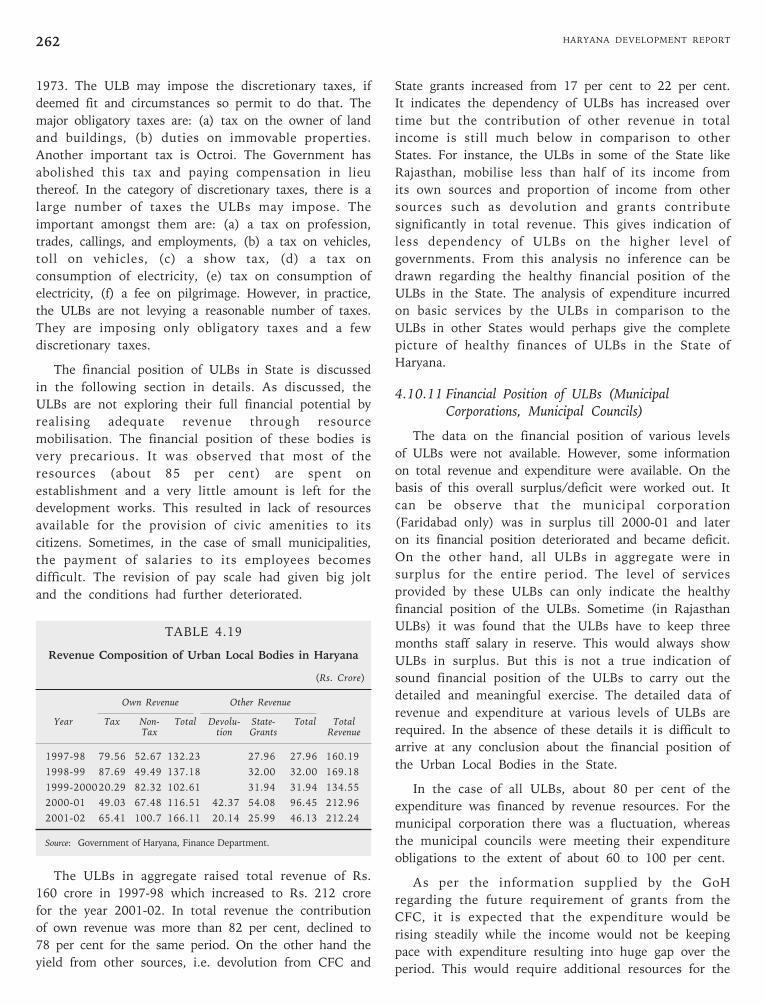
HARYANA DEVELOPMENT REPORT262
1973. The ULB may impose the discretionary taxes, if
deemed fit and circumstances so permit to do that. The
major obligatory taxes are: (a) tax on the owner of land
and buildings, (b) duties on immovable properties.
Another important tax is Octroi. The Government has
abolished this tax and paying compensation in lieu
thereof. In the category of discretionary taxes, there is a
large number of taxes the ULBs may impose. The
important amongst them are: (a) a tax on profession,
trades, callings, and employments, (b) a tax on vehicles,
toll on vehicles, (c) a show tax, (d) a tax on
consumption of electricity, (e) tax on consumption of
electricity, (f) a fee on pilgrimage. However, in practice,
the ULBs are not levying a reasonable number of taxes.
They are imposing only obligatory taxes and a few
discretionary taxes.
The financial position of ULBs in State is discussed
in the following section in details. As discussed, the
ULBs are not exploring their full financial potential by
realising adequate revenue through resource
mobilisation. The financial position of these bodies is
very precarious. It was observed that most of the
resources (about 85 per cent) are spent on
establishment and a very little amount is left for the
development works. This resulted in lack of resources
available for the provision of civic amenities to its
citizens. Sometimes, in the case of small municipalities,
the payment of salaries to its employees becomes
difficult. The revision of pay scale had given big jolt
and the conditions had further deteriorated.
TABLE 4.19
Revenue Composition of Urban Local Bodies in Haryana
(Rs. Crore)
Own Revenue Other Revenue
Year Tax Non- Total Devolu- State- Total TotalTax tion Grants Revenue
1997-98 79.56 52.67 132.23 27.96 27.96 160.19
1998-99 87.69 49.49 137.18 32.00 32.00 169.18
1999-2000 20.29 82.32 102.61 31.94 31.94 134.55
2000-01 49.03 67.48 116.51 42.37 54.08 96.45 212.96
2001-02 65.41 100.7 166.11 20.14 25.99 46.13 212.24
Source: Government of Haryana, Finance Department.
The ULBs in aggregate raised total revenue of Rs.
160 crore in 1997-98 which increased to Rs. 212 crore
for the year 2001-02. In total revenue the contribution
of own revenue was more than 82 per cent, declined to
78 per cent for the same period. On the other hand the
yield from other sources, i.e. devolution from CFC and
State grants increased from 17 per cent to 22 per cent.
It indicates the dependency of ULBs has increased over
time but the contribution of other revenue in total
income is still much below in comparison to other
States. For instance, the ULBs in some of the State like
Rajasthan, mobilise less than half of its income from
its own sources and proportion of income from other
sources such as devolution and grants contribute
significantly in total revenue. This gives indication of
less dependency of ULBs on the higher level of
governments. From this analysis no inference can be
drawn regarding the healthy financial position of the
ULBs in the State. The analysis of expenditure incurred
on basic services by the ULBs in comparison to the
ULBs in other States would perhaps give the complete
picture of healthy finances of ULBs in the State of
Haryana.
4.10.11 Financial Position of ULBs (MunicipalCorporations, Municipal Councils)
The data on the financial position of various levels
of ULBs were not available. However, some information
on total revenue and expenditure were available. On the
basis of this overall surplus/deficit were worked out. It
can be observe that the municipal corporation
(Faridabad only) was in surplus till 2000-01 and later
on its financial position deteriorated and became deficit.
On the other hand, all ULBs in aggregate were in
surplus for the entire period. The level of services
provided by these ULBs can only indicate the healthy
financial position of the ULBs. Sometime (in Rajasthan
ULBs) it was found that the ULBs have to keep three
months staff salary in reserve. This would always show
ULBs in surplus. But this is not a true indication of
sound financial position of the ULBs to carry out the
detailed and meaningful exercise. The detailed data of
revenue and expenditure at various levels of ULBs are
required. In the absence of these details it is difficult to
arrive at any conclusion about the financial position of
the Urban Local Bodies in the State.
In the case of all ULBs, about 80 per cent of the
expenditure was financed by revenue resources. For the
municipal corporation there was a fluctuation, whereas
the municipal councils were meeting their expenditure
obligations to the extent of about 60 to 100 per cent.
As per the information supplied by the GoH
regarding the future requirement of grants from the
CFC, it is expected that the expenditure would be
rising steadily while the income would not be keeping
pace with expenditure resulting into huge gap over the
period. This would require additional resources for the
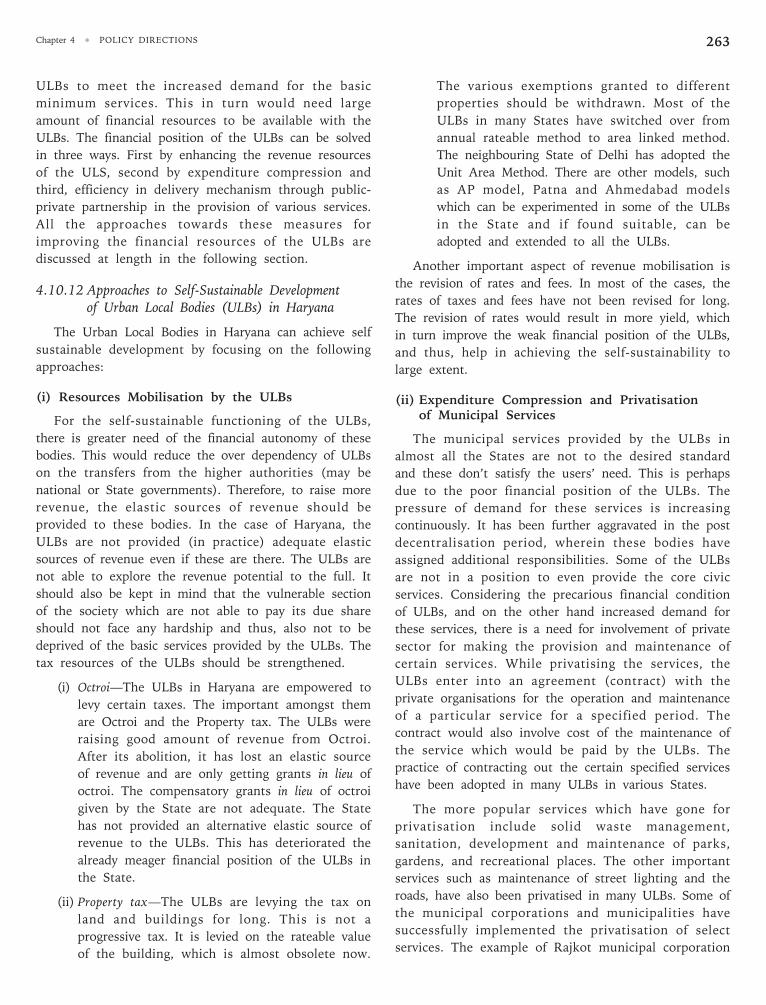
Chapter 4 • POLICY DIRECTIONS 263
ULBs to meet the increased demand for the basic
minimum services. This in turn would need large
amount of financial resources to be available with the
ULBs. The financial position of the ULBs can be solved
in three ways. First by enhancing the revenue resources
of the ULS, second by expenditure compression and
third, efficiency in delivery mechanism through public-
private partnership in the provision of various services.
All the approaches towards these measures for
improving the financial resources of the ULBs are
discussed at length in the following section.
4.10.12 Approaches to Self-Sustainable Developmentof Urban Local Bodies (ULBs) in Haryana
The Urban Local Bodies in Haryana can achieve self
sustainable development by focusing on the following
approaches:
(i) Resources Mobilisation by the ULBs
For the self-sustainable functioning of the ULBs,
there is greater need of the financial autonomy of these
bodies. This would reduce the over dependency of ULBs
on the transfers from the higher authorities (may be
national or State governments). Therefore, to raise more
revenue, the elastic sources of revenue should be
provided to these bodies. In the case of Haryana, the
ULBs are not provided (in practice) adequate elastic
sources of revenue even if these are there. The ULBs are
not able to explore the revenue potential to the full. It
should also be kept in mind that the vulnerable section
of the society which are not able to pay its due share
should not face any hardship and thus, also not to be
deprived of the basic services provided by the ULBs. The
tax resources of the ULBs should be strengthened.
(i) Octroi—The ULBs in Haryana are empowered to
levy certain taxes. The important amongst them
are Octroi and the Property tax. The ULBs were
raising good amount of revenue from Octroi.
After its abolition, it has lost an elastic source
of revenue and are only getting grants in lieu of
octroi. The compensatory grants in lieu of octroi
given by the State are not adequate. The State
has not provided an alternative elastic source of
revenue to the ULBs. This has deteriorated the
already meager financial position of the ULBs in
the State.
(ii) Property tax—The ULBs are levying the tax on
land and buildings for long. This is not a
progressive tax. It is levied on the rateable value
of the building, which is almost obsolete now.
The various exemptions granted to different
properties should be withdrawn. Most of the
ULBs in many States have switched over from
annual rateable method to area linked method.
The neighbouring State of Delhi has adopted the
Unit Area Method. There are other models, such
as AP model, Patna and Ahmedabad models
which can be experimented in some of the ULBs
in the State and if found suitable, can be
adopted and extended to all the ULBs.
Another important aspect of revenue mobilisation is
the revision of rates and fees. In most of the cases, the
rates of taxes and fees have not been revised for long.
The revision of rates would result in more yield, which
in turn improve the weak financial position of the ULBs,
and thus, help in achieving the self-sustainability to
large extent.
(ii) Expenditure Compression and Privatisationof Municipal Services
The municipal services provided by the ULBs in
almost all the States are not to the desired standard
and these don’t satisfy the users’ need. This is perhaps
due to the poor financial position of the ULBs. The
pressure of demand for these services is increasing
continuously. It has been further aggravated in the post
decentralisation period, wherein these bodies have
assigned additional responsibilities. Some of the ULBs
are not in a position to even provide the core civic
services. Considering the precarious financial condition
of ULBs, and on the other hand increased demand for
these services, there is a need for involvement of private
sector for making the provision and maintenance of
certain services. While privatising the services, the
ULBs enter into an agreement (contract) with the
private organisations for the operation and maintenance
of a particular service for a specified period. The
contract would also involve cost of the maintenance of
the service which would be paid by the ULBs. The
practice of contracting out the certain specified services
have been adopted in many ULBs in various States.
The more popular services which have gone for
privatisation include solid waste management,
sanitation, development and maintenance of parks,
gardens, and recreational places. The other important
services such as maintenance of street lighting and the
roads, have also been privatised in many ULBs. Some of
the municipal corporations and municipalities have
successfully implemented the privatisation of select
services. The example of Rajkot municipal corporation
HARYANA DEVELOPMENT REPORT264
which has gone for privatisation of service of street
lighting, solid waste removal, cleaning of public latrines
and maintenance of gardens and parks is being
generally quoted. The privatisation of these services in
Rajkot municipal corporation has resulted in the
savings of expenditure in the range of 15-70 per cent of
the original cost. Therefore, the privatisation of select
services can be adopted by the ULBs in Haryana as it
would also help in self-sustainable functioning of
ULBs.
(iii) Strengthening Municipal Administrationand Capacity Building
With the implementation of new municipal Act in
conformity of 74th CAA, the responsibilities of the ULBs
in the State have increased substantially. The extensive
list of functions as enlisted in 12th Schedule includes the
important responsibilities of urban planning and the
development. This requires high level of skill, education
and training for discharging such important
responsibilities. It also requires high level guidance,
direction and support. The higher level of staff has to
be fully equipped to perform the crucial functions
assigned to them. Considering the plethora of
responsibilities assigned to these ULBs, there is a need
of high level training and reorientation programmes to
be conducted for the municipal staff, so that they may
have to update themselves and discharge the crucial and
important tasks assigned to them.
(iv) Community Participation and the Role of NGOs
In the new era of decentralisation, where many
responsibilities are assigned to the ULBs, the community
participation and the role of NGOs assume great
importance. The involvement of Residential Welfare
Associations (RWAs) in the “Bhagidari Scheme” of
Delhi government has many success stories. Under the
scheme, the RWAs’ role become very important. It
(RWAs) acts as watch dog in the maintenance of many
civic services. In solid waste management, the RWAs is
playing an important role. The monitoring and
accountability by the citizens has also played a bigger
role in achieving self-sustainability of the ULBs.
Thus, we conclude that the self-sustainability of
ULBs can be achieved with the measures such as
resource mobilisation, privatisation of select municipal
services, involvement of RWAs and NGOs along with
the community participation.
5.1 Haryana in National Perspective(With Reference to Monitorable Targets
Specified in the National 10th Plan Document)
The Tenth Five Year Plan includes challenges and
opportunities for Haryana and represents another step in
moving forward outpacing many other States. Ever since
its coming into existence, the State has consistently
shown its capacity to meet challenges and transform them
into exemplary events of successes. In the period ahead,
the State is to tread on the path of progress keeping in
mind the realities of national and global market scenarios
and the need for ensuring equitable distribution of
benefits of progress. Achieving an accelerated growth by
fully exploiting the resource potential of the State with
emphasis on eradication of poverty and ensuring welfare
of weaker sections are the major objectives of the
development policy of the State. Strengthening economic
and social infrastructure and ensuring world-class
standards in these areas, as far as possible, by involving
much greater participation of the private sector in this
endeavour under the present re-aligned public-private role
model together while maintaining strict fiscal discipline
for optimum resource utilisation constitute the core
elements of the strategy for achieving these objectives.
5.1.1 Poverty
In the area of poverty eradication, Haryana has
displayed outstanding performance as compared to many
other States. It has always ranked among the top
performing States of India if we look at this problem in a
comparative historical context. Among the Indian States,
Haryana is found to rank mostly next only to Punjab and
Himachal Pradesh throughout the period 1973 to 2000.
The poverty ratio of the State stood at 8.74 per cent in
1999-2000 with rural ratio 8.27 per cent and urban ratio
9.99 per cent. Bringing down this ratio to 2 per cent level
Chapter 5
State Perspectives for 2012
HAR
YANA
by 2007 and eliminating poverty almost totally by 2012
are challenging, but feasible, targets. In order to eliminate
poverty in the State an accelerated growth rate (GSDP) of
about 10 per cent is required.
5.1.2 Employment
Unemployment is one of the major concerns of the
State. The State is conscious of the magnitude of this
problem. The annual growth rate of employment is not
sufficient even to absorb the additions to the labour force,
let alone reducing the piling backlog. The population
growth rate continues to be high. Growth rate of
workforce is a matter of grave concern. It is much above
the corresponding all India rate. During 1991-2000, it was
2.83 per cent as against the national average rate of 0.81
per cent. Although the unemployment rate (as percentage
of labour force) in Haryana, 4.7 per cent (rural) and 4.5
per cent (urban), is much less than the all India rates of
7.20 per cent (rural) and 7.70 per cent (urban). The
problem appears to be still more serious when we take
note of the unemployment rate among the youth (age 15-
29). It was 8.10 per cent (rural) and 8.30 per cent (urban)
in 1999-2000 as compared to the corresponding all India
rates of 11 per cent and 15.40 per cent. People in this age
group represent that part of the population which is
mostly expected to shoulder the responsibility of looking
after many others in the families. With total dependency
ratio in the State being as high as 770 (in 2001), the
unemployment among this segment of population
becomes still a matter of greater concern.
Traditionally, primary sector, with agriculture as its
major component, had been the major source of
employment in the past. Over time, its contribution has
gradually declined and the continuously expanding tertiary
sector has emerged as a source of increasing employment
opportunities. Such structural changes in employment are
HARYANA DEVELOPMENT REPORT266
a naturally expected phenomenon in the course of
development process and are important from the point of
view of shaping employment approach and deciding
priority areas for policy intervention.
The State recognises the urgent need to not only arrest
the rising trend of unemployment, but to actually reduce
it. Accordingly, rapid growth of sectors having large
employment potential, greater emphasis on
vocationalisation of education at secondary school stage,
expansion of job-oriented technical and professional
courses at the college stage, adequate provision of
infrastructural facilities, particularly in terms of financial
and marketing support for the promotion of non-wage
avenues of employment are to be the major planks of the
State’s employment strategy. Special emphasis will have to
be laid on the promotion of employment-intensive
activities and non-traditional avenues of employment.
Agro-based industries, irrigation, construction, tourism,
transport (including roads and bridges), small-scale
industries, retailing, and IT communication-enabled
services have huge employment potential. These should
receive due attention for their promotion. Efforts should
be made to set up public investment in extended
agriculture in terms of accelerating the switch from
cereals to oilseeds and pulses, horticulture, floriculture,
fishery, bee keeping, and cultivation of medicinal and
energy plants.
Since tertiary sector holds the promise of being the
major source of employment generation, it should be the
endeavour of the State policy to accord special priority to
the fullest exploration of its employment potential. The
performance of the tertiary sector has been quite
satisfactory during the Tenth Plan period. It recorded a
growth rate of 10 per cent (2002-03), 8.9 per cent (2003-
2004) and 11.8 per cent (2004-05) which is quite close to
the targeted growth rate of 10.3 per cent fixed under the
Plan. Given the vast growth potential of this sector, it
appears quite within the reach of the State to push this
rate to much above 12 per cent (by 2012) which
incidentally happens to be the nearest proximation of the
highest rate fixed under the Tenth Plan for Karnataka, the
top leading State in this respect.
On the whole, it may be said that with appropriate
sectoral focus and well directed policy interventions and
path-breaking employment initiatives, such as Prime
Minister’s vision of creating 10 million employment
opportunities annually (for India as a whole), and State’s
policy of opening greater and newer areas for investment
participation of private sector, it would be possible to
generate substantially more employment opportunities
than arising merely out of the growth process. It will not
only take care of additions to the labour force but also
reduce the backlog of unemployment.
5.1.3 Education
In Haryana, 75.25 per cent of the children in the
age-group 6-11 and 65.51 per cent in the age group 11-
14 were enrolled in schools in 2003-04. The
participation of female children in school-stage
education stood at about 77.31 per cent (age group 6-
11), and 62.40 per cent (age group 11-14). Over time,
the enrollment participation rates of females children,
in particular, have gone up remarkably, from 35 per
cent (1966-67) to 77.30 per cent (2003-04) in case of
age group 6-11, and from 16 per cent to 62.40 per cent
in case of age group 11-14 over the same period.
Indeed, these participation rates are still not very
encouraging. The State appreciates the significance of
ensuring substantial, fast improvement in this regard. It is
committed to providing at least primary level education to
almost each child in the school going age group by
according still greater priority to primary education in the
matter of State expenditure on education with special
emphasis on education of girl children and children form
weaker sections. The Sarva Shiksha Abhiyan is expected
to play a significant role in extending education to
children especially those belonging to weaker sections, in
the age-group 6-14 by providing them free books and
cycles.
5.1.4 Literacy
Haryana’s literacy rate showed an appreciable increase
of 12 per cent points over the decade of the 90s,
increasing from 55.85 per cent in 1991 to 67.91 per cent
in 2001, and outpacing the corresponding rates for India
as a whole (52.21 per cent in 1991, and 64.84 per cent in
2001). The literacy rate of the State, at its present level, is
regarded still very low particularly when it is looked at
sex-wise. In 2001, female literacy rate was just 56.3 per
cent as against the male literacy rate of 79.3 per cent. The
State should make greater directed attempts to raise this
rate close to 75 per cent by the year 2007, with special
focus on the literacy of women belonging to rural areas
and weaker sections.
5.1.5 Gender Disparity
Gender gaps in literacy and wage rates are indicators of
neglect and exploitation of women, particularly belonging
to weaker sections in the society. These gaps need to be
brought down substantially. In 1981, Haryana’s female
Chapter 5 • STATE PERSPECTIVES FOR 2012 267
literacy rate (22.3 per cent) was even less than half of
the corresponding rate for males (48.2 per cent), and
much less than the all India rate (29.8 per cent), thus
with more or less identical gender gap at both State
and the all India level. Overtime, the literacy situation
has improved for both males and females of Haryana. In
2001, the male and female literacy rates were 79.3 per
cent and 56.3 per cent, respectively, and these were
higher than the corresponding rates at the all India
level of 75.9 per cent (males) and 54.2 per cent
(females) with more or less the same gender gap, again.
The State of Haryana realises that these gender gaps
constitute another priority area for more concerted and
effective policy intervention if the situation is to improve
substantially and the gender gaps are to be brought down
by at least 5 per cent points in the immediate future.
5.1.6 Population Growth
Haryana is one of the few States in India whose
decadal growth rate of population has showed almost a
negligible change over the last three decades. It is a
matter of great concern for the State and requires an in-
depth analysis of its socio-economic genesis. The State’s
decadal growth rate was 28.75 per cent during 1971-81,
27.41 per cent during 1981-91, and 28.43 per cent during
1991-2001. The other States, which fall in this category,
are Jammu and Kashmir and Maharashtra with variation
in the decadal growth rate of just about 2 per cent over
this period. It is widely believed that the high growth rate
of population is due mainly to poverty and illiteracy of
people, and significantly, highly son-oriented psyche of
most parents belonging even to well-off educated families.
As such, the problem is, in fact, of long-term nature and
requires policy shift from short term, populist approach
relying mostly on casual and superficial pecuniary and
non-pecuniary initiatives to a long term hard, sincere and
realistic approach. The problem needs to be tackled
through change of mindset of parents, spread of
education, eradication of poverty, greater participation of
females in education and labour market, and their socio-
economic empowerment.
5.1.7 Infant Mortality Rate
Infant mortality rate and life expectancy at birth are
among the basic indicators that are used to evaluate
health status in a State. As regards life expectancy at
birth, Haryana’s performance has been satisfactory, and on
this count, Haryana is placed only after Kerala, Punjab and
Maharashtra among major States of India. But as regards
infant mortality rate, the situation has so far remained
less than satisfactory. Although there has been a
continuous decline in the infant mortality rate in Haryana,
from 94 in 1961 to 52 in 1981, and further to 62 in 2001,
yet it has remained below the all India rate throughout,
and continues to be still too high. In comparison to many
other States, including neighbouring States of Punjab and
Himachal Pradesh, Haryana ranks much behind so far as
bringing down the infant mortality rate is concerned. The
State realises the significance of the problem for a
concerted and vigorous campaign on a war-footing level.
The various health initiatives such as, immunisation
against BCG, DPT, Polio and Measles, and programmes of
supplementary nutrition, health check up and health-
education (particularly for popularisation of breast-
feeding) under the on going Integrated Child
Development Services scheme are introduced to bring
down the infant mortality rate substantially close to 50, at
least by 2007.
5.1.8 Forest and Tree Cover
The total area under forest cover including trees grown
on agricultural land for commercial purposes is about 3.6
lakh hectares, which constitutes 8.1 per cent of the total
area of the State. This is far less than what has been
prescribed under the National Forest Policy increasing
forest cover to 25 per cent by 2007 and 33 per cent by
2012. But this is to be seen in the context of the fact that
Haryana is one of the very few States which are
predominantly agricultural having a much greater
proportion of their land under agricultural use to meet
not only the growing food demand of its own people but
also of the country.
With the increasing population of Haryana since it
came into existence as a separate State in 1966, the forest
area per lakh of population has been continuously falling
due to increasing trend of urbanisation, escalating
pressure on land for growing more food, large-scale
cutting of trees to meet growing demand for timber and
fuel. The forest area today stands at about 1100 hectares
(per lakh of population), as compared to about 1400
hectares in 1966-67. Per capita forest area is 0.01 hectares
as against 0.09 hectares for India as a whole.
Whatever the reasons for relatively much lower level of
forests and trees in Haryana, the importance of forests for
the ecology of a State cannot be overlooked. In order to
increase the forest and tree cover and restore ecological
balance in the State, a rigorous campaign for plantation of
trees on a large scale on available lands wherever possible
—highway roadside stretches; waste lands; schools,
colleges and other public and private premises; and even
on agricultural land. Equally, more important is ensuring
HARYANA DEVELOPMENT REPORT268
by expansion in investment and output. It is easier for
people to switch jobs between manufacturing and services
but shifting of people from agriculture to manufacturing
requires a lot of Human Resource Development effort.
The share of services is increasing itself with its own
underlying strengths. The tertiarisation of the economy
without increasing industrial output is not sustainable and
would lead to poor quality jobs. Hence, it is high time
that the investment in secondary sector is increased to
have a higher growth rate as projected.
TABLE 5.1
Projected Composition of Gross State Domestic Productby Broad Sectors at Constant (1993-94) Prices
Year Per Capita Gross State Targeted Targeted Targeted TargetedIncome Domestic Percentage Growth Growth Growth
Product at Increase in Rate of Rate of Rate ofConstant GSDP over Primary Secondary Tertiary
Prices the Previous Sector Sector Sector(Rs. Crore) Year
2006-07 19259 52649 10.10 4.10 12.05 12.47
2007-08 20607 57966 10.10 4.46 11.43 12.42
2008-09 22050 63821 10.10 4.81 10.89 12.37
2009-10 23593 70267 10.10 5.17 10.41 12.32
2010-11 25244 77364 10.10 5.17 10.25 12.28
2011-12 27012 85178 10.10 5.17 10.09 12.24
Source: Based on Various issues of Statistical Abstracts Haryana published byGovernment of Haryana, Chandigarh, and Tenth Five Year PlanDocument
So, after fixing the targeted growth rate of
agriculture, the share of tertiary sector, which behaves
according to the national average, has been fixed. The
shares of sectors in Gross State Domestic Product and
their growth rates have been estimated simultaneously in
the Tables 5.1 and 5.2. The financial requirements to
achieve the targeted growth rates for each sector have
been estimated in the next step.
TABLE 5.2
Projected Shares of Broad Sectors
Year Primary Secondary Tertiary
2005-06 26.83 29.46 43.71
2006-07 25.37 29.99 44.65
2007-08 24.06 30.35 45.59
2008-09 22.91 30.57 46.53
2009-10 21.88 30.65 47.46
2010-11 20.90 30.69 48.40
2011-12 19.97 30.69 49.34
Source: Based on Various issues of Statistical Abstracts Haryana published byGovernment of Haryana, Chandigarh, and Tenth Five Year PlanDocument
their proper care and growth and protecting the
existing forests against indiscriminate onslaught. These
measures have to be the main planks of the forest
policy of the State.
5.1.9 Potable Drinking Water
Safe drinking water is an essential requirement for
health and improvement of quality of life and
enhancement of productivity of people. In this regard,
Haryana has made tremendous progress, over time vis-à-
vis most other States. Whereas in 1966, only 170 villages
out of a total 6759 villages were provided with safe
drinking water supply, by 1992 drinking water supply
extended to all the villages. At present, there are about
1800 villages in the State where water allowance is less
than the desired norm of 40 lpcd. Efforts are being made
to augment the drinking water facilities under various
schemes such as, PMGRY, Accelerated Rural Water
Supply Programme, Desert Development Programme and
various NABARD assisted projects. It is expected that the
problem will be solved substantially by the end of the 10th
Plan.
5.2 Projection of Gross State DomesticProduct and its Sectoral Composition
The Gross State Domestic Product of Haryana has
been projected with certain assumptions about policies
and parameters. If we want to double the PCI of people in
Haryana by 2012 then a seven per cent growth rate is
required for achieving this objective. With existing
population growth rate assuming a decline in the TFR
from 3.3 in 1998 to 2.1 in 2007, the Haryana economy
shall have to attain 10.10 per cent target growth rate
consistently till 2011-12. Now this growth rate has been
distributed over primary, secondary and tertiary sectors.
The growth rate of agriculture sector shall be increased
gradually up to 5.17 per cent by 2009-10 and policies will
be made to sustain it.
In 2000, the primary sector had 45.15 per cent of
employment with 33.90 per cent share in Gross State
Domestic Product. Now in 2005, as the share of primary
sector in Gross State Domestic Product has decreased to
28.37 per cent and the tertiary sector has almost equal
share in employment and Gross State Domestic Product,
there is a need to shift around 17 per cent persons from
primary sector to secondary sector which has a larger
share in Gross State Domestic Product (28.86 per cent)
and smaller in employment (12.45 per cent). Now people
from agriculture cannot be expelled to manufacturing, but
manufacturing sector can attract labour from agriculture
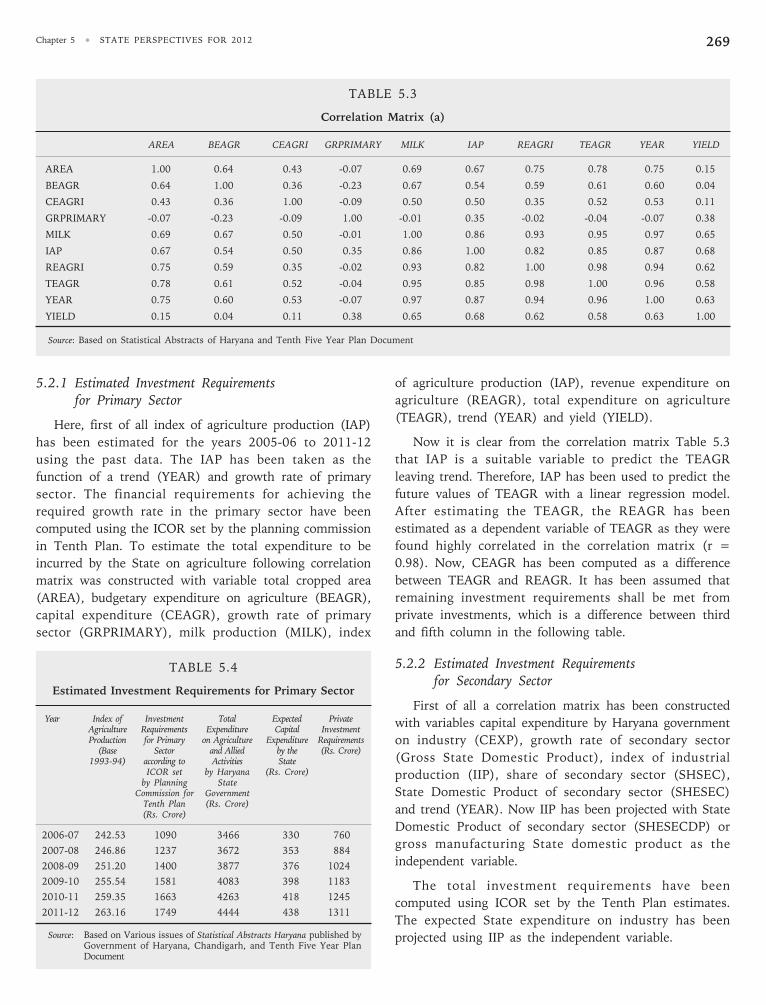
Chapter 5 • STATE PERSPECTIVES FOR 2012 269
TABLE 5.3
Correlation Matrix (a)
AREA BEAGR CEAGRI GRPRIMARY MILK IAP REAGRI TEAGR YEAR YIELD
AREA 1.00 0.64 0.43 -0.07 0.69 0.67 0.75 0.78 0.75 0.15
BEAGR 0.64 1.00 0.36 -0.23 0.67 0.54 0.59 0.61 0.60 0.04
CEAGRI 0.43 0.36 1.00 -0.09 0.50 0.50 0.35 0.52 0.53 0.11
GRPRIMARY -0.07 -0.23 -0.09 1.00 -0.01 0.35 -0.02 -0.04 -0.07 0.38
MILK 0.69 0.67 0.50 -0.01 1.00 0.86 0.93 0.95 0.97 0.65
IAP 0.67 0.54 0.50 0.35 0.86 1.00 0.82 0.85 0.87 0.68
REAGRI 0.75 0.59 0.35 -0.02 0.93 0.82 1.00 0.98 0.94 0.62
TEAGR 0.78 0.61 0.52 -0.04 0.95 0.85 0.98 1.00 0.96 0.58
YEAR 0.75 0.60 0.53 -0.07 0.97 0.87 0.94 0.96 1.00 0.63
YIELD 0.15 0.04 0.11 0.38 0.65 0.68 0.62 0.58 0.63 1.00
Source: Based on Statistical Abstracts of Haryana and Tenth Five Year Plan Document
5.2.1 Estimated Investment Requirementsfor Primary Sector
Here, first of all index of agriculture production (IAP)
has been estimated for the years 2005-06 to 2011-12
using the past data. The IAP has been taken as the
function of a trend (YEAR) and growth rate of primary
sector. The financial requirements for achieving the
required growth rate in the primary sector have been
computed using the ICOR set by the planning commission
in Tenth Plan. To estimate the total expenditure to be
incurred by the State on agriculture following correlation
matrix was constructed with variable total cropped area
(AREA), budgetary expenditure on agriculture (BEAGR),
capital expenditure (CEAGR), growth rate of primary
sector (GRPRIMARY), milk production (MILK), index
of agriculture production (IAP), revenue expenditure on
agriculture (REAGR), total expenditure on agriculture
(TEAGR), trend (YEAR) and yield (YIELD).
Now it is clear from the correlation matrix Table 5.3
that IAP is a suitable variable to predict the TEAGR
leaving trend. Therefore, IAP has been used to predict the
future values of TEAGR with a linear regression model.
After estimating the TEAGR, the REAGR has been
estimated as a dependent variable of TEAGR as they were
found highly correlated in the correlation matrix (r =
0.98). Now, CEAGR has been computed as a difference
between TEAGR and REAGR. It has been assumed that
remaining investment requirements shall be met from
private investments, which is a difference between third
and fifth column in the following table.
5.2.2 Estimated Investment Requirementsfor Secondary Sector
First of all a correlation matrix has been constructed
with variables capital expenditure by Haryana government
on industry (CEXP), growth rate of secondary sector
(Gross State Domestic Product), index of industrial
production (IIP), share of secondary sector (SHSEC),
State Domestic Product of secondary sector (SHESEC)
and trend (YEAR). Now IIP has been projected with State
Domestic Product of secondary sector (SHESECDP) or
gross manufacturing State domestic product as the
independent variable.
The total investment requirements have been
computed using ICOR set by the Tenth Plan estimates.
The expected State expenditure on industry has been
projected using IIP as the independent variable.
TABLE 5.4
Estimated Investment Requirements for Primary Sector
Year Index of Investment Total Expected PrivateAgriculture Requirements Expenditure Capital InvestmentProduction for Primary on Agriculture Expenditure Requirements
(Base Sector and Allied by the (Rs. Crore)1993-94) according to Activities State
ICOR set by Haryana (Rs. Crore)by Planning State
Commission for GovernmentTenth Plan (Rs. Crore)(Rs. Crore)
2006-07 242.53 1090 3466 330 760
2007-08 246.86 1237 3672 353 884
2008-09 251.20 1400 3877 376 1024
2009-10 255.54 1581 4083 398 1183
2010-11 259.35 1663 4263 418 1245
2011-12 263.16 1749 4444 438 1311
Source: Based on Various issues of Statistical Abstracts Haryana published byGovernment of Haryana, Chandigarh, and Tenth Five Year PlanDocument
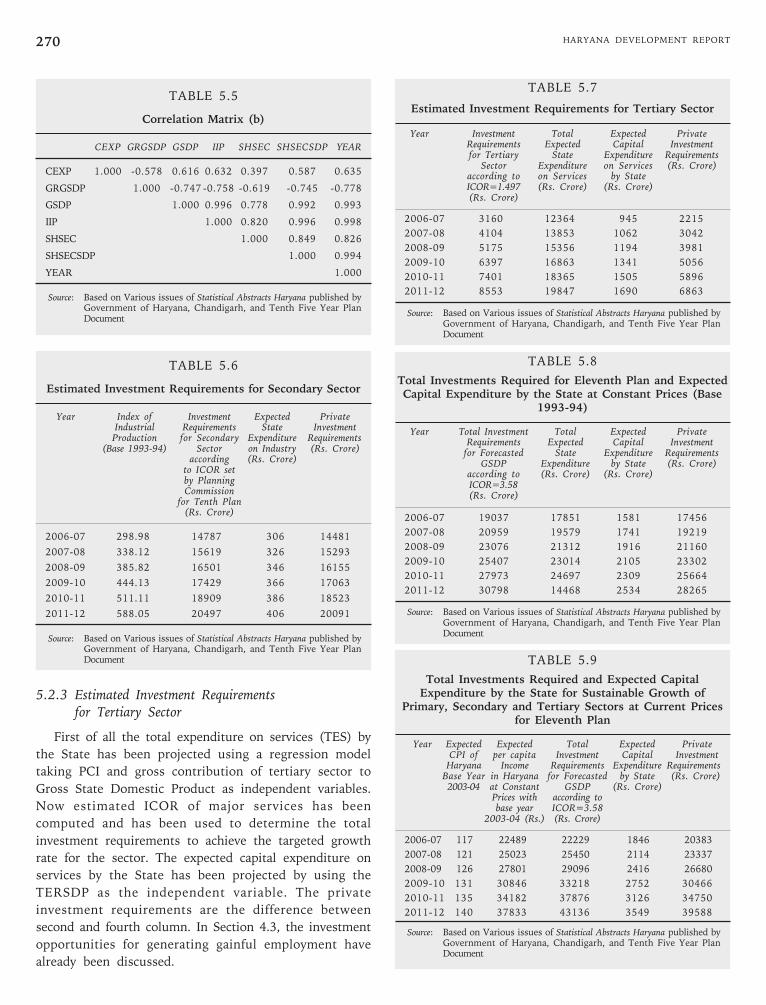
HARYANA DEVELOPMENT REPORT270
TABLE 5.5
Correlation Matrix (b)
CEXP GRGSDP GSDP IIP SHSEC SHSECSDP YEAR
CEXP 1.000 -0.578 0.616 0.632 0.397 0.587 0.635
GRGSDP 1.000 -0.747 -0.758 -0.619 -0.745 -0.778
GSDP 1.000 0.996 0.778 0.992 0.993
IIP 1.000 0.820 0.996 0.998
SHSEC 1.000 0.849 0.826
SHSECSDP 1.000 0.994
YEAR 1.000
Source: Based on Various issues of Statistical Abstracts Haryana published byGovernment of Haryana, Chandigarh, and Tenth Five Year PlanDocument
TABLE 5.6
Estimated Investment Requirements for Secondary Sector
Year Index of Investment Expected PrivateIndustrial Requirements State InvestmentProduction for Secondary Expenditure Requirements
(Base 1993-94) Sector on Industry (Rs. Crore)according (Rs. Crore)
to ICOR setby PlanningCommission
for Tenth Plan(Rs. Crore)
2006-07 298.98 14787 306 14481
2007-08 338.12 15619 326 15293
2008-09 385.82 16501 346 16155
2009-10 444.13 17429 366 17063
2010-11 511.11 18909 386 18523
2011-12 588.05 20497 406 20091
Source: Based on Various issues of Statistical Abstracts Haryana published byGovernment of Haryana, Chandigarh, and Tenth Five Year PlanDocument
5.2.3 Estimated Investment Requirementsfor Tertiary Sector
First of all the total expenditure on services (TES) by
the State has been projected using a regression model
taking PCI and gross contribution of tertiary sector to
Gross State Domestic Product as independent variables.
Now estimated ICOR of major services has been
computed and has been used to determine the total
investment requirements to achieve the targeted growth
rate for the sector. The expected capital expenditure on
services by the State has been projected by using the
TERSDP as the independent variable. The private
investment requirements are the difference between
second and fourth column. In Section 4.3, the investment
opportunities for generating gainful employment have
already been discussed.
TABLE 5.7
Estimated Investment Requirements for Tertiary Sector
Year Investment Total Expected PrivateRequirements Expected Capital Investmentfor Tertiary State Expenditure Requirements
Sector Expenditure on Services (Rs. Crore)according to on Services by StateICOR=1.497 (Rs. Crore) (Rs. Crore)(Rs. Crore)
2006-07 3160 12364 945 2215
2007-08 4104 13853 1062 3042
2008-09 5175 15356 1194 3981
2009-10 6397 16863 1341 5056
2010-11 7401 18365 1505 5896
2011-12 8553 19847 1690 6863
Source: Based on Various issues of Statistical Abstracts Haryana published byGovernment of Haryana, Chandigarh, and Tenth Five Year PlanDocument
TABLE 5.8
Total Investments Required for Eleventh Plan and ExpectedCapital Expenditure by the State at Constant Prices (Base
1993-94)
Year Total Investment Total Expected PrivateRequirements Expected Capital Investment
for Forecasted State Expenditure RequirementsGSDP Expenditure by State (Rs. Crore)
according to (Rs. Crore) (Rs. Crore)ICOR=3.58(Rs. Crore)
2006-07 19037 17851 1581 17456
2007-08 20959 19579 1741 19219
2008-09 23076 21312 1916 21160
2009-10 25407 23014 2105 23302
2010-11 27973 24697 2309 25664
2011-12 30798 14468 2534 28265
Source: Based on Various issues of Statistical Abstracts Haryana published byGovernment of Haryana, Chandigarh, and Tenth Five Year PlanDocument
TABLE 5.9
Total Investments Required and Expected CapitalExpenditure by the State for Sustainable Growth of
Primary, Secondary and Tertiary Sectors at Current Pricesfor Eleventh Plan
Year Expected Expected Total Expected PrivateCPI of per capita Investment Capital Investment
Haryana Income Requirements Expenditure RequirementsBase Year in Haryana for Forecasted by State (Rs. Crore)2003-04 at Constant GSDP (Rs. Crore)
Prices with according tobase year ICOR=3.58
2003-04 (Rs.) (Rs. Crore)
2006-07 117 22489 22229 1846 20383
2007-08 121 25023 25450 2114 23337
2008-09 126 27801 29096 2416 26680
2009-10 131 30846 33218 2752 30466
2010-11 135 34182 37876 3126 34750
2011-12 140 37833 43136 3549 39588
Source: Based on Various issues of Statistical Abstracts Haryana published byGovernment of Haryana, Chandigarh, and Tenth Five Year PlanDocument
Chapter 5 • STATE PERSPECTIVES FOR 2012 271
5.3 Equitable Regional Development
Balanced regional development of different parts of
the State, extension of benefits of economic progress to
the less developed regions and widespread diffusion of
industries are among the major aims of the development
strategy programmes of the State of Haryana. Accelerated
development loses its meaning if it does not cater to the
welfare of people living in different parts of the State.
Regional disparities do exist in Haryana. The State has
been striving hard to reduce these disparities and has
achieved much success in this regard. It is determined to
pursue its efforts in this direction with still greater zeal
and determination in terms of strengthening
development infrastructure necessary for supporting the
growth of agriculture and/or industries in these areas.
An essential element in the strategy for promoting
equitable regional development is the recognition of the
fact that all regions are not equally placed as regards
their suitability for growth of agriculture and various
other industries. Climatic conditions, soil fertility,
topography, water table, forest cover, mineral resources,
etc. are the natural factors which widely differ from one
place to another within the State. The objective of
State’s strategy for equitable regional development is to
exploit the resource potential of different areas to the
maximum possible extent together with efforts to
extend to them the benefits of education, health care,
housing, employment, empowerment of weaker sections
and other welfare measures. This is, indeed, an arduous
task. But the State is determined to accomplish it with
appropriate policy measures, in particular, encouraging
the participation of the private sector and the NGOs
wherever possible and desirable.
The State of Haryana is already known for its
performance in the field of agriculture. As regards
industrialisation also the State, on the whole, can be
termed as an industrially advanced State. The State had
already implemented many schemes for improving
irrigation facility in agriculturally backward parts.
Recognising its importance in the economy of the
State, this initiative needs to be carried forward with
still greater hope and determination in future. In
respect of industrialisation, recently the Government of
Haryana has declared 88 areas, covering each and every
district of the State, as industrially backward. A special
focus will be on strengthening necessary infrastructure
for promotion of industrial activities in these areas.
5.3.1 Infrastructure
(i) Irrigation
The State is according high priority to the provision
of adequate irrigation facilities for the prosperity of
farming community, as agriculture is the mainstay of
Haryana’s economy. Concrete steps have been taken to
ensure equitable distribution of water to the farmers of
the State and accordingly water supplies to Southern
Haryana have been enhanced.
To ensure equitable distribution of canal water, the
State has taken up the construction of BML-Hansi
Branch-Butana Branch Multipurpose Link Channel of
2,000 Cs. capacity. The channel will help in
improvement of sub-soil water level in the area through
which it will pass. To utilise the surplus water of river
Yamuna during the monsoon season, the Dadupur-
Shahabad-Nalvi Canal is being constructed. This will
recharge ground water in its command area of 92,532
hectares of district Yamuna Nagar, Ambala and
Kurukshetra districts besides providing irrigation
facilities to an area of 46,250 hectares and relief to tube
well operations during the kharif season. Construction
on the ground water recharge project for Masani Barrage
in Rewari district has also commenced. Similarly more
such projects/schemes have also been prepared and
approved for Rewari and Mahendragarh districts to
recharge ground water and to provide irrigation facilities.
The State is giving top priority to the conservation
and better management of surface water, rainwater
harvesting, recharging of groundwater and equitable
distribution of available water. All the canals are cleared
of weed and silt wherever required before the start of
every sowing season to ward off the shortage of water
at tails. Replacement of old irrigation structures, lining
of canals and repair of old lined watercourses are being
carried out to check the seepage and leakage of water.
The State has undertaken numerous schemes for
increasing capacity of canals, lining of canals,
rehabilitation of old lined water courses and
improvement in the functioning of the Lift Canals.
NABARD aid is being utilised for executing the
schemes of extension and construction of minors and
drains and rehabilitation of pumps on various Lift Canal
Systems. The Command Area Development Authority is
vigorously pursuing the programme for water
conservation through lining of field channels and is
also taking up a bio-drainage project in order to reclaim
some waterlogged areas of the State.
In an endeavour to harness the rivulets flowing
through Haryana during the monsoon season and
prevent loss to property by floods, the State has
prepared three project reports for low height cascade
dams on river Ghaggar and its tributaries at Kaushlya,
Dangrana and Dewanwala. The projects have already
been submitted to Central Water Commission for
appraisal and clearance. The State is also pursuing the
HARYANA DEVELOPMENT REPORT272
construction of upstream storages on river Yamuna
vigorously with the Government of India.
(ii) Energy
Energy in one form or the other is the mostimportant input for any development and directlydetermines the pace of economic growth. Haryana haslimited availability of natural sources of energy. There isno hydro generation potential in the State and even thecoal mines are located far away from the State. Windvelocity prevailing in the State is also not sufficient forpower generation. Although, the solar intensity isrelatively higher, the land area limitation does notencourage big scale harnessing of this resource as well.Therefore, the State has been depending on the limitedthermal generation capacity installed within the Stateand on hydropower from the jointly owned projects.The State’s efforts have been supplemented by theCentral Generation Projects from where the State getsits share on the formula evolved by the Government ofIndia for such projects.
The total installed capacity available to the State atpresent is 4033.30 MW. It includes 1587.40 MW fromState’s own projects, 937.50 MW from jointly ownedprojects and the balance as share in Central projectsand independent private power projects. The poweravailability from these sources during the year 2004-05was 21,713.6 million units.
Considering the need for maximising poweravailability in the State, various short term and longterm measures such as addition in capacity generation,improvement in operational efficiency, rehabilitation andextension of distribution network etc. need to be taken.A massive programme needs to be undertaken to addthe generation capacity in the State, through State aswell as private sector participation.
The Department of Renewable Energy is responsiblefor formulating policies and programmes necessary forpopularising the applications of various non-conventional and renewable sources of energy in theState. It is implementing various schemes concerningutilisation of solar energy, biogas, micro hydel, andbiomass energy etc.
The Integrated Rural Energy Programme (IREP) isbeing implemented in 38 cluster of villages of the 19districts. Under this programme, various types ofrenewable energy and energy efficient systems like solarcookers, solar lanterns, compact fluorescent lamps, SPVhome lighting systems, energy efficient motors etc. arebeing promoted through financial incentives,demonstration and extension activities in the selectedcluster of villages of IREP for helping rural people tomeet their cooking, heating and lighting energy needs
by adopting these systems.
Ministry of Non-Conventional Energy Sources,
Government of India is providing assistance to the State
nodal agencies for setting up of renewable energy parks
in the educational institutes to demonstrate the
working of various types of renewable energy based
systems to the public, particularly the students to
educate them about the clean and environment friendly
technologies which they can use in their daily life. As
much as 13 energy parks have been set up in the State
so far. Besides this, a State level energy park is being
set up at Gurgaon. It is proposed to set up district level
energy park in every district of the State.
For meeting heating and cooking energy
requirements through solar energy, HAREDA is
implementing solar water heating and solar cookers
(both box and dish type) schemes with the financial
assistance of State/Central government. For meeting
the hot water requirements in the domestic, industrial
and institutional sector, the solar water heating
technology is being promoted by creating awareness.
The State has also formulated a policy for promoting
generation of electricity through renewable energy
sources on 23rd November 2005. Under this policy,
various incentives like wheeling, banking, power
purchase agreement for 20 years or more depending upon
the plant life, exemption of local area development tax
and no conversion charges for setting up of plants in the
agricultural zones etc. have been provided to encourage
the independent power producers (IPP) to set up power
projects based on renewable energy in the State.
(iii) Roads and Bridges
Roads are the basic means of communication for the
development of any economy. In order to further
strengthen the road network and making it more
efficient as per traffic requirements, the main emphasis
is on the improvement and upgradation of road
network, construction of roads, bye passes, bridges and
road over bridges.
A programme for improvement of roads by way of
widening, strengthening, reconstruction, raising,
constructing of cement concrete pavements and
blocks, premix carpet, construction of side drains and
construction of culverts and retaining walls etc. need
to be taken.
During the year 2005-06, the State government has
decided to take up the following five roads on built-
operate-transfer (BOT) basis:
1. Yamuna Nagar Ladwa Karnal Road
2. Buria Khadri Deodhar Road
3. Gurgaon Faridabad Road
Chapter 5 • STATE PERSPECTIVES FOR 2012 273
4. Ballabhgarh Pali Dhoj Road
5. Chandimandir Jallah Road
The State has proposed two roads as interstate
corridors during the year 2005-06, viz (i) Kotputli
Mahendragarh Dadri Bhiwani Jind Kaithal Road and (ii)
Saharanpur Yamuna Nagar Radaur Pipli Pehowa Road
upto Punjab Border.
The department has prepared master plan for
construction of railway over bridges (ROBs) to curtail
delay and to increase the safety of passengers. Nine
railway over bridges are in progress. The detail of ROBs
identified in master plan is as under:
• ROBs in pipeline on State highways
8
• Identified on State highways 51
• ROBs in pipeline on national highways 4
• Identified on national highways 14
Total: 77
Nine railway over bridges (ROBs) were sanctioned
on 1st April 2005. It has been targeted that five ROBs
will get completed during the year 2005-06.
Development of roads and bridges leading to Kundli-
Manesar-Palwal expressway and upgradation of roads in
the National Capital Region of the State need to be
undertaken.
Total length of metalled roads including national
highways, State highways, major district roads (MDRs)
and other district roads (ODRs) in Haryana is 22,992
kilometers as on 31st January 2006.
(iv) Railways
Railways are an extremely efficient form of
transportation. The energy consumption for a given
freight movement on railways is about one quarter of
the consumption required for trucks. In addition, the
railways generate less pollution and involve fewer
accidents. If we consider the growth of rail route length
over the period 1980-81 to 1996-97 we find that
whatever increases took place at the all India level, only
0.87 per cent of that is accounted by Haryana.
Therefore, the railways density in the State needs to be
increased. Special emphasis should also be given to
electrify the railway routes.
(v) Dry Ports
An Inland Container Depot (ICD) is a common user
facility with public authority status equipped with fixed
installations and offering services for handling and
temporary storage of import/export laden and empty
containers carried under customs control and with customs
and other agencies competent to clear goods for home use,
warehousing, temporary missions, re-export, temporary
storage for onward transit and outright export. Trans-
shipment of cargo can also take place from such stations.
The first ICD (dry port) of Haryana is set up by the
Haryana Warehousing Corporation at Rewari. It provides
single window clearance to the importers/exporters of
Haryana, Rajasthan and western Uttar Pradesh. The ICD
has State of the art equipment with modern
communication systems like electronic data interchange.
All formalities relating to import and export are
completed at Rewari itself. The initial capacity of the ICD
is to handle 50,000 containers per annum and it takes
full advantages of the latest developments in freight
technology, communication and computerisation of
operations.
(vi) Civil Aviation
Civil Aviation Department, Haryana has got five Civil
Airstrips/Aerodromes in the State at Karnal, Hisar,
Bhiwani, Narnaul and Pinjore in addition to two
Defence Aerodromes at Ambala and Sirsa. The proposal
for making an International Cargo Airport at
Bahadurgarh in District Jhajjar is already taken up with
the Ministry of Civil Aviation, Government of India to
promote the export of processed agri-products etc. from
the northern region including State of Haryana. The
proposal for making an airstrip at village Lakhan Majra
and Chandi in district Rohtak has also been taken up
with the Ministry of Civil Aviation, Government of
India. In addition, following development plans have
been projected for the aerodromes at Karnal, Hisar and
Pinjore in 11th Five Year Plan (2007-2012):
Karnal (Rs. in Crore)
Extension of runway from 3000 feetto 4000 feet, construction of
boundary wall, re-carpeting of runway,
construction of new administrative block,ATC and residential quarters. Rs.6.50
Hisar
Extension of runway from 4000 feetto 6000 feet, construction of boundary
wall, re-carpeting of runway,
construction of new administrativeblock, ATC and residential quarters. Rs.5.50
Pinjore
Extension of runway from 3000 feet to
4000 feet, construction of boundary wall,
re-carpeting of runway, constructionof new administrative block, ATC
and residential quarters. Rs.7.50
HARYANA DEVELOPMENT REPORT274
The fund of Rs.7.00 crore has also been projected for
providing night landing facilities at the aerodromes at
Karnal, Hisar and also for updating the navigational
facilities at all the aerodromes in the State. Presently
three flying training centres are being run at Civil
aerodromes, Karnal, Hisar and Pinjore by the State
government. Keeping in view the shortage of pilots in
the country, setting up of Flying Training Academy by
private parties at civil aerodromes, at Hisar, Narnaul,
Bhiwani and Pinjore are also under active consideration.
Civil aviation in Haryana has never been given the
attention it deserves. It has never been considered a real
indicator of economic development. Passenger traffic is
just one part of the aviation revolution. Cargo is another
big opportunity.
Big corporates like Bharati and Reliance are now
planning to invest huge money in agri-business. The only
way to get value-addition is to move the produce quickly
to foreign markets. In Haryana, there is a need to develop
more than one airport. There should be an aviation grid
for the whole country. The national aviation map should
look like a power transmission grid map.
5.4 Reoriented Development ofAgriculture and Allied Activities
At national level, with a 20.2 per cent contribution
to the Gross Domestic Product, agriculture still
provides livelihood support to about 2/3rd of the
country’s population. The sector provides employment
to 56.7 per cent of country’s workforce and is the
single largest private sector occupation. It accounts for
about 14.7 per cent of total exports earning and
provides new materials to a large number of industries.
Besides, the rural areas are the biggest markets for low-
priced and middle-priced consumer goods, including
consumer durables and rural domestic products, which
are an important source of resource mobilisation. In the
last 55 years, the agricultural development in the
country has taken place in four phases that is increase
in net sown area, increase in foodgrain products due to
High Yielding Varieties and use of technologies, use of
minimum support prices for the procurement and the
liberalisation and globalisation of agriculture as a
consequence of the establishment of WTO.
Despite all this, the share of Agriculture in GDP at
National and State level has been continuously
declining. In Haryana, during the period 1993-94 to
2003-04 this share has declined at an average rate of –
3.97 per cent at constant prices. During the Tenth Five
Year Plan, the overall growth rate of State Domestic
Product in Haryana was fixed at 7.9 per cent as
compared to 4.1 per cent during the Ninth Plan. In
comparison to this the agricultural growth rate during
the Tenth Plan was fixed at 4.07 per cent, which needs
to be further increased if we make projections of
sectoral composition of State Domestic Product in
Haryana. According to the projections, the targeted
growth rate of primary sector needs to be 5.17 per cent
which can be achieved only through reoriented
development of agriculture and allied activities such as
contract farming, organic farming, and diversification of
agriculture, agro-forestry and agro-based industries.
5.4.1 Contract Farming
Contract farming is basically seen as an effective way
of generating supplies for processing industries and
exports with a substantial potential of additional value to
agriculture in India. In view of this potential and its wide
spread practice in regions all over the world, the State
governments in India have also started promoting contract
farming to strengthen their agriculture base. Under this
type of farming tomatoes, chillies, seed multiplication,
sugarcane and other commercial crops are being produced
in Punjab, Haryana Karnataka, Andhra Pradesh, Uttar
Pradesh etc. In some States such as Punjab, it has also
been used as a means of crop diversification, marketing
and providing financial support in terms of loans and
advances to the farmers.
In brief, it provides a promising alternative to the
farmers of different States because it reduces uncertainties
and prevailing risk and market imperfections in
agricultural sector. It also helps the farmer in facing the
challenges of liberalisation and globalisation in agriculture
but the perspective of contract farming depends upon
certain favourable conditions and it is more applicable to
the areas such as seed multiplication, organic foods,
vegetables, fruits and exotic produce/plants, export crops,
aromatics, herbal and medicinal plants etc. The successful
model for contract farming must be based on new
measures and regulated markets in which sponsored
issues for action must be clear. Contract farming must
clearly specify: quantities involved, delivery schedule,
points of delivery, modes and responsibilities of grading,
packing and transport and costs, prices, payment
modalities, incentives based on quality and/or time
performance, advances and their recoveries, insurance,
market fee and other related costs.
5.4.2 Organic Farming
The Government of India in 2001 accepted the Report
of the Task Force on Organic Farming, constituted by the
Chapter 5 • STATE PERSPECTIVES FOR 2012 275
Department of Agriculture and Cooperation. Organic
farming implies the use of organic farm waste and
Municipal Solid Waste for increasing agricultural
productivity as the possibility of increasing agricultural
output through Net Sown Area (NSA) almost seems to be
exhausted in Haryana and other States of India. It has
been estimated that for about 356 mt. crop, 170 mt. is
soil incorporated and about 136 mt. is available for
manuring. Moreover the technologies are available for
pelletisation and methanisation by which municipal
solid waste can be used for generating energy and
manure. Vermi-compost, which is rich in nutrients,
could also be made from the organic farm waste. The
adoption of organic farming can supplement the use of
fertilisers in crop production. Use of such composts
will also improve the health of soil by providing organic
matter for the required biological activities in addition
to improving the physical condition of the soil.
The orientation of farmers towards the production of
organic food for domestic use and exports will certainly
the government should encourage the Bird conservation
develop waterways, canals and plant tree rows along
these. This will increase the ecological wealth of the State
and would ensure conservation of forests, wildlife etc. The
village ponds should also be maintained. In Haryana,
the application of chemical pesticides and fertilisers is
increasing despite the fact that farmers are aware of their
dangerous side effects. Many birds die of poisoning in
Sonepat and other districts in the State. The farmers
should be educated to resort to biological control and
provided incentives for organic farming for sustainability
of agriculture in the State. Integrated plant nutrient
management of inorganic organic fertilisers, bio-fertilisers
and vermi-composts for sustained soil health and crop
productivity should be encouraged by the government.
5.4.3 Diversification of Agriculture
The Tenth Plan targets a 3.97 per cent growth in
agriculture through the regionally differentiated strategy
based on agro climatic conditions and natural resources
envisaged for the Ninth Plan, for increasing the pace of
growth in every region of the country. The target growth
rate of agriculture in Haryana was fixed at 4.07 per cent
during the Tenth Plan period. Diversification to high value
crops/activities and increasing cropping intensity have
been among the thrust areas for the Tenth Plan.
Although, Indian agriculture is moving rapidly towards
commercialisation-most farmers, especially small and,
marginal farmers tend to give a prime place to cereals in
the cropping system due to food scarcity, low risk and
easy market access for such produce. In order to
increase farmers’ income the diversification towards
high value and more remunerative crops considering the
agro-climatic conditions, endowment of land and water
resources and demand conditions is urgently needed.
The emphasis should be on fruits, vegetables, flowers,
agro forestry, tree-farming, dairying, etc.
In Haryana, the cropping pattern has moved in
favour of rice and wheat by replacing gram, bajra,
barley, millets and pulses. The cropping pattern in the
State has unnecessarily become energy intensive and is
affecting the static balance of the underground water
resources. The growth of infrastructure, irrigation and
other technological factors are responsible for a major
shift in cropping pattern in favour of wheat and rice in
the State. The total crop area under maize has declined
significantly during 1967-2003, whereas in cotton and
oil seeds it has increased during the same period. Still,
there is a vast scope for diversification of agriculture in
Haryana in order to tackle the problem of falling water
tables in some parts of the State, sustainable
agricultural development and for the improvement in
income and employment opportunities in the State.
5.4.4 Agro-Forestry
The Government of India initiated an Agro-Forestry
programme as an integrated sustainable land management
system on June 2, 1992. It announced the National
Conservation Plan in order to tackle multidimensional
agricultural problems facing the nation today. The forest
affects soil and water in many ways, leaves and branches
decrease wind strength, after the absorption of solar
radiation, increase the surface area for evaporation. The
roof growth and the decomposition of plant organic matter
by soil fauna and microbes, modify soil texture and
structure, affecting water penetration and drainage.
Changes in vegetation cover can therefore have significant
influence on hydrological cycle and climatic system. In
Haryana Agro-forestry is needed as the forest cover is
lowest in Haryana. Only 3.8 per cent of Haryana was under
forest cover in 1986-87, and 2.6 per cent in 2000-01.
Many studies in recent years have indicated that the
establishment of agro forest processing is required on
regional basis rather than on a State basis. The problem of
marketing forest products, particularly wood in the absence
of such industries within the region discourages
individual producers from undertaking this activity.
Horticulture also needs to be integrated with agriculture
in Haryana where its area is very small (less than 10 per
cent) but increasing due to the efforts of the State
government. Since the Forests and Agriculture have
much common characteristics, both of them should be
HARYANA DEVELOPMENT REPORT276
developed in an integrated way in the form of farm
forestry and agro-forestry under which crop productivity
and fertility of soil and environment improve. The two
sectors are ecologically and economically irreparable. In
Haryana, the government should encourage traditional as
well as modern agro forestry techniques such as agri-
silviculture (Taungya system); farm agricultural crops;
silvipastural combined tree, shrub and animal
production; home-garden systems (agri-silvipasture); and
alley cropping etc.
In brief, Haryana should prepare itself to exploit the
opportunities provided by Agro-Forestry by solving the
issues involved in it through NGOs and more inputs from
science and technology.
5.4.5 Agro-based Industries
In generating new employment opportunities the
role for labour-intensive sectors has been adequately
emphasised in the Tenth Plan. Agriculture and Allied
activities hold substantial potential for employment
generation. Horticulture, farm management programmes,
agri-clinics and seed production etc. are other potential
areas for employment generation.
Haryana is one of the largest contributors of food
grains out of total production of 13.069 million metric
tonnes. Haryana is endowed with varied agro-climatic
conditions ranging from scanty rainfall areas with sandy
soil to high rainfall areas with loamy to heavy soils.
Due to this, all horticultural crops can be grown
suiting the agro-climatic conditions of the region. The
area under fruit and vegetable cultivation has grown to
66,825 hectares. The agro-based industries in the State
can derive maximum benefits by processing
horticultural products being in close proximity to the
city of Delhi, which is a big market for perishable
commodities and also the main terminal for supply of
goods to domestic as well as export markets. Haryana
has a big potential for the exports of agro-based
industrial products and the government should take
initiatives in exploiting its close proximity with Delhi.
Having varied agro-climatic conditions and strategic
location near NCR, Haryana can be one of the most
competitive centres of agro-based industries in the
country. Floriculture, mushroom, herbal medicines,
cereal based industry, cotton based industry and forest
produce based industries etc. may be easily developed in
the State provided imaginative policy-initiatives related
with finance, energy, marketing and market-oriented
institutions are taken by the government in the State.
Better infrastructure facilities and collaborations with
foreign firms must be encouraged by the State. In
addition to this, weather-based support systems for
enhanced production and improvement in agro-met
advisory services, agro-eco-zone specific diversification
of agriculture and hi-tech production systems,
enhancing of fertiliser, water monetary and non-
monetary means should also be encouraged and
provided by the State.
Above all this, the government should ensure
appropriate increase in public and private investment in
agriculture.
The investments in rural infrastructure that supports
agricultural and allied activities must be enhanced.
Government should also encourage the development and
dissemination of agricultural technologies to the farmers
in the State. The research in agriculture with emphasis on
bio-technology should be strengthened, and new
institutions needed for agricultural development to
enhance its competitiveness may be created by the
government in the State.
5.5 Rural Infrastructure
To any growing economy, the availability of
infrastructure is very important. The provision of such
facility attracts investments in the sectors such as
industry, business and the services. More and more
investments in these sectors help in bringing the
development in the economy. The growth in the economy
largely depends on these factors. India, since its
independence, is trying to achieve adequate level of
infrastructure through the Five Year Plans. Different Plans
were targeted to achieve the desired level of infrastructure
in specific area. Recently, the Government of India has
initiated a major step through the ‘Bharat Nirman’
programme, for the upgradation of infrastructure,
particularly in rural areas.
Amongst the various components of the infrastructure,
the roads in the rural areas have assumed great
importance. The development of roads in rural areas
would not only provide the basic facility to the villagers
but also help in reaching the rural India in its true
sense. The rural economy which in other sense is agro-
economy and the construction of rural roads would
provide a major incentive for the development of rural
sector, that is, both farm and non-farm sectors. The
recent programme of PURA (provision of urban
amenities in rural areas) is also an important initiative
by the Government of India, in this direction.1
1. The President, Dr. Abdul Kalam, has emphasised on the rural infrastructure while delivering his Presentation at the National Workshop on Vision 2020 onNovember 12-13, 2005, at Indian Institute of Technology, Delhi.
Chapter 5 • STATE PERSPECTIVES FOR 2012 277
5.5.1 Rural Infrastructure (Rural Roads),an Initiative towards ‘Bharat Nirman’
For the upgradation of the basic lifeline of rural
areas, that is rural roads, the Government of India has
initiated a major time-bound flagship programme for the
country. The basic objective of the programme is to
explore the latent potential of the country which is
hidden in its rural areas. Through this programme it is
aimed to provide all weather rural road in every village
with a population of 1000 or 500 in hilly and tribal
areas, by the end of 2009 financial year. The target of
1.46 lakh kms with a provision of Rs 48 thousand crore
is set to achieve by the end of 2009. This would connect
about 67 thousand unconnected rural habitants of the
country as well as provide farm to market connectivity.
In addition to this, many new initiatives which
aimed to achieve highest quality of rural infrastructure
connected to this programme of Rural Roads are:
(a) District Rural Roads Plan—To give the complete
picture of all the roads in rural areas, a complete
‘District Rural Roads Plan’ has been prepared. In
this network, all the village roads, major district
roads, State roads, and the national highways have
been included. This would help in giving the
priority of construction of work as well as the
allocation of fund for the maintenance of the roads.
(b) Road Vision Document—A document is planned to
prepare, which would give perspective plan of
rural roads for the coming 20 years. The Indian
Road Congress has been assigned to complete
this task by the year end.
(c) Participation of Local Public Representatives—The
local panchayat representatives have been involved
in PMGSY (Prime Minister Gram Sadak Yojana)
of the Government of India. The public
representatives from Panchayats to Parliament
have been consulted for achieving the target of
annual proposals, in this regard.
(d) Rural Road Manual—With the help of Ministry of
Rural Development, three Committees have been
constituted to prepare a Rural Roads Manual.
The Committee would go in-depth about the
construction of rural roads and its various
related aspects. All the works related to the
construction of rural roads under the PMGSY
would be undertaken as per this manual.
(e) Standard Data Book—For the standardisation of
contracts and the estimation, Standard Data
Book on Rural Roads has been prepared.
(f) Standard Bidding Documents—For the standardi-
sation of tendering process under the PMGSY a
Standard Bidding Document has been prepared.
(g) Rural Roads-Online management—For the
management of rural roads throughout the
country, the online programme for the
management of rural roads have been prepared.
With the help of special software (C-DAC), the
road proposals under the PMGSY and the
construction of rural road works, the progress
and the monitoring would be done online. The
participation and suggestions by any citizens
would be welcome through the use of this
programme.
(h) Capacity Building—The various actors/players
such as contractors and the technocrats would
be imparted training under this programme.
(i) New Technology and the Rural Roads—So far such
an important sector of rural roads have been
ignored. Under the PMGSY, efforts have been
made to use the new technology along with the
new methodology and the materials have been
persuaded. The non-recyclable wastes (plastic)
have also been included in the material to be
used for the construction of rural roads.
(j) The quality of rural roads have been given due
importance. A three tier quality control system
has been planned for quality control and the
management. This would ensure the high
standard quality of rural roads. A specification
hand book of quality control has also been
prepared for this purpose.
(k) For the successful management of the
programme at the national level, the public-
academia partnership has been brought under
this concept. The Principal Technical Agency
(at the national level) and the State Technical
Agency (at the State level) would be working in
coordination.
(l) The quality coordinator of PMGSY has been
included in the Council of District Rural Road
Safety Committee. This would ensure the rural
road safety in the rural areas.
(m) Maintenance—The most important is the
maintenance of rural roads. Under the PMGSY,
the State governments are assigned this task.
They have been asked to allocate separate fund
in their budget for the provision of maintenance
of rural roads in their respective States.
HARYANA DEVELOPMENT REPORT278
5.5.2 Rural Communication (Telecom)
The second most important component of rural
infrastructure is the Rural Telecommunication. After
the rural roads, the telecom connectivity forms the
most crucial part of the rural connectivity. It connects
rural (agro) economy with the rest of the economic
development of the country. In this context also, the
Government of India has initiated important measures.
The telecom constitutes an important part of the effort
to upgrade the rural infrastructure. Under this
programme of ‘Bharat Nirman’, the efforts would be to
connect about 67 thousand revenue villages spread
across the country. Under this programme it would be
ensured to provide Village Public Telephone (VPT) to
every village by the end of 2007. About 14 thousand
remote and far flung villages would be covered by
digital satellite phone terminals.
5.5.3 Irrigation
With the limited and scarce irrigation facility, the
irrigation potential has not been realised so far. There is
enormous potential to be explored in this sector. The
wide gap between potential and actual realisation of
irrigation is prevailing across the entire rural areas. The
‘Bharat Nirman’, component of irrigation aimed to focus
on the creation of additional 1 crore hectare in the coming
four years, that is by the end of 2008-09. Under this
programme, about 42 lakh hectare potential areas are
planned to be covered through medium and major
projects. The Bharat Nirman programme has also
targeted to cover about 10 lakh hectare potential
irrigation areas through various water development and
management projects.
Under the renovation and modernisation of minor
irrigation scheme, it is planned to cover additional 10 lakh
hectare of potential areas. The unutilised ground water
resources would be used for this purpose.
5.5.4 Shelter-Rural Infrastructure (Rural Housing)
The basic requirement of the rural masses is shelter.
For the survival of the human beings, housing is most
needed. The housing for the poor in rural areas is most
crucial. It provides a dignified living standard and ensures
the security to the rural masses. To narrow the gap of
housing shortage, it is also covered under the
Millennium Development Goal of the UNDP. As per
the 2001 census, there is housing shortage of about
148 lakh. The gap has been identified and recognised by
the ‘Bharat Nirman’ programme. Under this
programme, it is aimed to construct and provide about
60 lakh houses in the coming four years. Such effort
would help in reducing the gap and put end to
shelterlessness. The Ministry of Rural Development is
implementing the rural housing programme ‘Indira
Awaas Yojana’ across the entire country. Under this
programme, the cost is shared between Centre and the
States in the ratio of 75:25. The priority is also given to
the weaker and marginalised section of the society in
the rural areas. The District Rural Development Agency
(DRDAs) have been assigned to release the fund for the
purpose. The importance of such shelter requirement is
duly recognised by the many State governments. They
have accorded top priority amongst the development
programmes. The effective implementa-tion of the
programme is monitored by the extensive network of
National, State and District level machinery.
5.5.5 Rural Energy (Rural Electrification)
Power (energy) is the most crucial component of the
infrastructure in the rural area. The adequate supply of
energy attracts investments, which in turn help in the
establishments of various industries in the rural areas.
For the upgradation of this component of rural
infrastructure, the Government of India has introduced
‘Rajiv Gandhi Grameen Vidhyuttikaran Yojana’ in the
fiscal year of 2005. Under this programme it is planned
to provide electricity in all the villages and the
habitants in the rural areas, in the coming four years.
Presently, this progamme is proposed to be
implemented under the programme of ‘Bharat Nirman’.
Under this it is aimed to provide access to electricity to
all rural households in the country. Under the
programme it is proposed to establish distribution
infrastructure called ‘Rural Electricity Distribution
Backbone (REDB). The basic objective of the programme
is to provide Village Electrification Infrastructure with
at least a distribution transformer in a village or
hamlet. And where the grid supply is not feasible,
standalone grids with generation capacity would be
provided.
The provision of such (energy) rural infrastructure
would help in farm as well as non-farm activities in the
rural areas. It would also help in the activities of
irrigation pumpsets, small and medium industries, khadi
and village industries, cold chains, health care and the
education facilities. This facility assumed great
importance in the overall development in the rural
areas, which in turn would provide employment
generation and would also help in rural poverty
reduction—one of the major Millennium Development
Goal of the UNDP. The Rural Electrification
Chapter 5 • STATE PERSPECTIVES FOR 2012 279
Corporation Limited (REC) has been assigned the
primary responsibility of the implementation of the
scheme in the rural areas.
5.5.6 Rural Infrastructure in Haryana
Similar to measures adopted by the Government of
India for the development of rural infrastructure in the
country, the Government of Haryana has also initiated
many developmental programmes and the schemes related
to the Rural Infrastructure in the State. Moreover, in
Haryana, it is most required to develop the rural
infrastructure for the overall development of the State,
whose economy is dependent on the rural sector to the
large extent. The Green and the White Revolutions in the
State had changed the economy in the past. In the
modern era of globalisation and liberalisation, it becomes
the need of the hour for the State to go for development
of rural infrastructure. Accordingly, the Government of
Haryana has implemented many schemes and programmes
in this regard. Some of the important development
measures are discussed in the following section.
5.5.7 Rural Energy (Bio-Gas Plants)
For the provision of clean and unpolluted energy to
the rural masses, the programme of biogas plant has
been introduced in the State. The programme was
initiated with the two folds objectives. One was to
provide energy for the domestic purposes and the
second important objective was to generate enriched
manure for the use in the agricultural activities. This
would be used as supplement to the chemical
fertilisers, increasingly used for the crop production. In
the last two years, about 2770 biogas plants have been
installed in the State.
Rural Power (Energy)
The use of electricity as a source of energy for
various development activities in the State is quite
common and has become very important. In last few
years the role of electricity has assumed great
importance in all the sectors of development of
agriculture, industrial, business and the domestic. The
State of Haryana doesn’t have the potential for the
generation of hydro energy. Due to non-availability of
coal mines in the State, and insufficient wind power
the generation of energy through these sources is also
not possible. In the circumstances of limited generation
capacity and the increasing demand the State has to
depend on the power share from the Central Generation
Projects which is based on the formula evolved by the
Government of India. To keep pace with the increasing
demand for power, there is need to enhance power
availability in the State. In this regard, the State
government has taken various short term and long term
measures. In addition to enhancing the availability, it
has also initiated other measures for the improvement
in operational efficiency. The State has also undertaken
reform in the power sector, which has increased the
power generation capacity of the State. With increased
power availability, it would be possible for the State to
meet the increased demand of all the consumers in the
State.
5.5.8 Renewable Energy
The State has also implemented various programmes
and policies for the exploration of energy through non-
conventional and renewable sources. There are many
programmes and schemes related to solar energy, biogas,
micro hydel and biomass, the State has initiated measures
to explore the energy through these sources.
In the State of Haryana about 38 clusters of villages in
19 districts are proposed to get benefited under the
scheme of Integrated Rural Energy Programme (IREP).
The basic objective of the scheme is to provide efficient
system of energy, like solar cookers, solar lanterns,
compact fluorescent lamps, home lighting systems, water
pumping systems, street lighting systems and energy
efficient motors, through incentive schemes to the
villagers. The implementation of the IREP would help the
rural masses in their cooking, heating and lighting
requirements.
For meeting the requirements of farmers in the
agriculture sector (irrigation needs), the Government of
India has initiated a programme through Ministry of Non-
Conventional Energy Sources. The Central Ministry also
providing central assistance for water pumping sets.
Similarly, the Government of Haryana has also initiated
important measures for this purpose.
In the Annual Plan 2005-06, the Central Ministry
(Ministry of Non-Conventional Energy Sources) is also
providing assistance to the State Nodal Agencies for
setting up of renewable Energy Parks in the educational
institutes to demonstrate the working of various types of
renewable energy based systems to the public,
particularly the students to educate them about the
clean and environment friendly technologies. Under this
programme, about 13 such parks have been set up in
the State. With the assistance of Central Ministry, a
State level energy park was proposed to be set up.
Similarly, the HUDA has also been assigned the
responsibility of infrastructure development in the
HARYANA DEVELOPMENT REPORT280
State. With the help of central financial assistance, it is
also proposed to set up two district level energy parks
in the State. The HAREDA is also implementing the
schemes of solar water heating and solar cookers with
the central assistance.
For meeting the hot water requirements in the
domestic, industrial and institutional sector, the solar
water heating technology is being promoted by creating
awareness.
The Central Ministry has also tried to fulfill the
requirements of the people living in cities and towns. A
new scheme of solar generator, has been launched by the
GOI, MNES. The scheme is also supported by the central
subsidy to the extent of about 40 per cent. The State
government is also requested to provide the matching
subsidy. This would enhance the popularity of the
programme amongst the people.
5.5.9 Rural Roads
The rural roads are the basic requirement of rural
infrastructure for the development of any economy of the
country. These are the basic means of communication in
the rural areas. The improvement and the upgradation of
road network in rural areas, construction of by passes,
bridges/culverts etc. are required to be strengthened for
the future development of the economy.
For strengthening of the rural road network in the
country and the State, in the year 2004-2005, a
programme for improvement of roads has been
undertaken and proposed to be completed in the
scheduled time.
The NABARD has also approved a loan of Rs 21 crore
for the project of ‘Rural Infrastructure Development
Fund (RIDF-VIII). Another project for the improvement
of roads in Haryana, under the NABARD scheme has
been approved with an amount of Rs 160 crore.
For the improvement of roads under the PMGSY, the
Central Government is providing assistance continuously
since 2000 onwards. Under the Central Road Fund Scheme,
the State of Haryana was provided with Rs 34 crore during
2003-04. In the next financial year an amount of Rs. 53
crore was spent for the roads in the State.
Similarly, for the improvement of State Highways in
the State of Haryana, the HUDCO has also sanctioned
loans of more than Rs. 350 crore. The execution
responsibility of this work was assigned to Haryana
State Roads and Bridges Development Corporation Ltd.
About 215 kms length of roads has been improved
under this scheme.
A well planned and efficient network of transport is
an essential component for a developing economy. The
Transport Department, Haryana is committed to provide
safe, adequate, well co-ordinated, economical, comfortable
and efficient transport services to the people of the State.
5.5.10 Rural Infrastructure and thePanchayati Raj Institution
The role of Panchayati Raj system has also assumed
significant importance in the rural infrastructure
development in the State. The financial and
administrative powers assigned to PRIs would ensure
social security, equality and social justice for the people
in the rural areas.
The active involvement of people through the people’s
participation has been initiated in the State. The concept
of Gram Vikas Samities has been implemented in the
States. These bodies are assigned responsibilities of
execution of development works in the rural areas.
For the efficient execution of the development works
in rural areas, the Haryana Rural Development Fund
Administration Board has been constituted in the State.
Another scheme of ‘Nirmal Gram Puraskar’ has been
launched by the GoI for full sanitisation and open-
defecation-free Gram Panchayats in the State. Under the
Restructured Rural Sanitation Scheme the government has
provided individual toilets and sanitary complex facilities
for the women in the rural areas.
5.5.11 Rural Infrastructure and theInstitutional Finance
For any development programme, the provision of
finances through the mechanism of institutional
finance is very essential. In the State of Haryana, the
Government has been persuading to the banking
institutions to give importance to the Agricultural and
Allied Sector, particularly to poverty alleviation
programmes. The Institutional Finances are made
available through Commercial Banks, Cooperative Banks
and other term lending institutions. This method of
finance reduces pressure on the budgetary resources of
the State government to great extent.
For the provision of credit facilities to the
agricultural credit societies, the Haryana Co-operative
Apex Bank is providing financial assistance to these
societies. The NABARD provides financial assistance to
Apex Bank in the State. At the end of 2004-05 financial
year, an assistance amounting to the order of Rs 3312
crore was provided by this Apex Bank in the State.
Chapter 5 • STATE PERSPECTIVES FOR 2012 281
5.6 Industries—Small, Medium and Large
Haryana State has been able to attract sizeable
investment from multinational companies, large business
houses, foreign investors, non-resident Indians and small
scale entrepreneurs. Haryana is an investor friendly
State and offers a rich reservoir of skilled, motivated
and relatively low-cost manpower with a good
infrastructure and harmonious industrial relations.
Having occupied just 1.37 per cent of the country’s
geographical area and 1.97 per cent of the country’s
total population, the State claims to have highest per
capita income in the country. Haryana currently
produces two third of passenger cars, 50 per cent of
tractors, 60 per cent of motor cycles and 50 per cent of
refrigerators manufactured in the country. About 25 per
cent of India’s total production of Sanitary-ware is from
Haryana. One out of every four bicycles in the country
is manufactured here. The number of large and medium
units in the State has increased from 162 in 1966 to
1212 today with a capital investment of Rs.225 billion
while employing 2 lakhs persons and producing goods
worth Rs.12,800 crore.
Haryana has fast developed into an industrial State,
where already 200 projects having foreign technical
collaboration have been set up and a number of other
project proposals have been received from several
multinational companies, big Indian industrial houses and
leading NRIs. Foreign collaborated projects like Maruti
Udyog Limited, Hero Honda, Modi Alcatel, Escorts, Sony
India, VXL India, Whirlpool Industries, Wipro Ltd.,
Perfitti India, DCM, Benetton, TDT Copper Ltd, Asahi
India Safety Glass etc. have already been operational in
the State. Some major public sector units in the State are
HMT Ltd, National Fertiliser Ltd, Indian Drugs and
Pharmaceutical Ltd, Bharat Electronics Ltd, IBPL etc. The
latest addition to this group is the Rs.4200 crore oil
refinery set up by Indian Oil Corporation in Panipat
district. New project proposals from multinational
companies such as United Development Incorporated
Panama, Tecumesh Products, USA, JELD Wen Inc USA,
Scholler GMBH (Germany), NHK Springs Co. Japan,
Casio Computer, Japan are in pipeline. During the last
6 years, 2962 Industrial Entrepreneur Memoranda have
been filed with Government of India for setting up
projects in Haryana which would require an investment
of Rs. 309 billion and 3.40 lakh persons will get
employment.
Small industries in the State have also been growing
very fast. Their number has increased from 4500 in
1966 to 80,000 today. Their level of output is worth
Rs.4500 crore per annum and they are generating
employment for 8.7 lakh persons. 20 per cent of the
country’s total export of scientific instruments, 60 per
cent of the demand of ammunition boxes of the
country’s defense forces and 62 per cent of the total
demand of woollen blankets of the Indian Army are met
by small units of Haryana. Small Scale Sector of the
State also manufactures the largest number of electrical
mixies and gas stoves in the country. Exports from the
State have crossed 200 billion mark in the year 2004-05.
The dominant export items are software, guargum,
pickles, handloom products, scientific instruments,
garments, automobiles and automotive components,
electrical appliances, rice etc.
5.6.1 Agro-based Industries
Haryana is one of the largest contributors of
foodgrains out of total production of 13.069 million
metric tonnes. The State also produces about 90 lakh
tonnes of sugarcane, 8.74 lakh bales of cotton and 6.53
lakh tonnes of oilseeds. Cash crops are being given
much emphasis on diversification grounds. Haryana is
blessed with varied agro-climatic conditions ranging
from scanty rainfall areas with sandy soils to high
rainfall areas with loam to heavy soils. As a result of
which all horticultural crops can be grown in the State.
The Industries can derive maximum benefits by
processing horticultural produce, being in close
proximity to the city of Delhi, which is a big market for
perishable commodities and also the main terminal for
supply of goods to domestic as well as export markets.
5.6.2 Floriculture and Herbal Medicines
Many floriculture firms have entered into
collaborations with foreign companies. Some projects have
already started production and export. The climate of
Haryana is suitable for growing a number of flower crops
namely marigold, roses, tube-roses, gladioli, coronation,
etc. The flowers of these crops are needed for homely
consumption and export. The Haryana Agricultural
University has developed several crops like isabgol,
mulahatti, sadabahar, mentha and lemon grass etc. which
can be successfully cultivated in Haryana. Some other
possible investment areas in agro-industry include guar
products, bakery products, mustard powder, high
protein flour from cotton seeds, fruit concentrates,
weaning food, cattle feed, chilli oleoresin, dialdehyde
starch, dehydrated potato chips. Tomato ketchup and
vegetable sauce, menthol, sunflower oil, sugarcane wax,
building boards, edible and non-edible rice bran oil, rice
bran stabiliser, amylose, amyloglucosidase, glucosidase,
HARYANA DEVELOPMENT REPORT282
pectionilytic enzymes, poultry feed, furfural enzyme,
fungal acid protease, lactic acid, oxalic acid, etc. The
Government should take initiatives to boost its own
and private sector investment in these areas.
Cereal, Cotton and Rice Based Industry
Haryana is a leading cereal, cotton and rice
producing State contributing 25 per cent of the
national production. There are 73 spinning mills and 2
composite mills in the State. Haryana is exporting good
quality of rice. Efforts can be made to increase rice
milling capacity.
5.6.3 Automobile Industry
The State of Haryana is producing 60 per cent of the
tractors, 75 per cent of cars and 70 per cent of motor
cycles. Haryana’s automobile industry is manufacturing
a wide range of vehicles and original equipments. Out
of major automobile companies in India manufacturing
passenger cars, trucks, buses, tractors, 2-3 wheelers, 8
are located in Haryana and out of 250 large and medium
units manufacturing original equipment, about 50 are
located in Haryana. Further, there are more than 3000
units in small scale sector which are manufacturing
automobile components.
5.6.4 Electronic and Information Technology
The existing electronics industry in the State is
manufacturing products covering almost the whole
spectrum namely components, consumer electronics,
communications, computers and control
instrumentation. The Electronic Industry in the country
is growing very fast in Haryana because the State is an
ideal location to invest because of excellent
infrastructure and also proximity to Delhi and
international airport. A Precision Mechanical Design
and Facility Centre has been established by Haryana
State Electronics Development Corporation with UNDP
assistance of US$ 2 million at Gurgaon. The project is
of institutional building nature and aims at providing
mechanical design and tooling facility for electronics
industry.
5.6.5 Scientific Instruments, Consumer Goodsand Medical Equipments
Due to proximity to Delhi, Haryana has always been
a natural choice for locating the consumer goods
industries in this part of the country. Production of
domestic electro-mechanic appliances, consumer
electronic items, high-class leather and handloom,
products and cosmetics can be fruitfully initiated from
Haryana. Ambala district is known world over for its
scientific instruments industry.
5.6.6 Vision 2012
The development of industrial infrastructure is a
must to facilitate economic development. The
government should follow an integrated approach to
develop industrial infrastructure thereby ensuring private
participation in this area. The main focus should be on
developing the industrial estates in the State of Haryana.
To achieve this aim HSIDC should be given the prime
role to identify the potential sites for industrial hubs and
make all possible efforts to convert that site into an
industrial estate. Manesar model township has been a
very good example where HSIDC played a leading role.
More such industrial towns should be developed in
future to meet out the projected industrial growth rate
in Haryana. To give boost to private sector investment in
industrial sector special economic zones should be
formulated. It will help the State to encourage foreign
direct investment in these SEZs. Haryana has an edge to
set up industrial parks in Panipat and Gurgaon. It
should be set up with all civic facilities so that
downstream industries can develop in such an area.
Haryana, being an agriculture based State, should
concentrate upon agro-based industries. To encourage
private sector investment in these industries, government
has already identified four sites to set up food parks. More
such efforts are required to develop agro and food
processing industries in the State. On the same lines,
gems and jewellery parks, apparel parks and leather parks
should be developed in the areas having better cost and
labour conditions. Again HSIDC should be given the task
to identify such areas in Haryana.
Power has always been a key factor in industrial
development. Although State government has promised to
add 3000 mw power generation capacity during Tenth and
Eleventh Five Year Plans, yet it does not seem adequate,
keeping in view the projected growth rates. To ensure
sustainable power supply to the industrial sector, the
State should enter into power supply contracts with
surplus States besides establishing its own stations.
The plant load factor should also be increased through
renovation and modernisation of existing power
stations. In the industrial parks, SEZs and other
industrial estates, private sector should be given a free
hand in the generation and supply of electricity.
Alongwith power, transport infrastructure should be
developed to support the industrial growth in the State.
Chapter 5 • STATE PERSPECTIVES FOR 2012 283
Surface transport should be given high priority and
more expressways should be developed along the lines
of Kundli-Manesar-Palwal expressway.
The State government should strengthen the
institutional mechanism to promote investment in the
industrial sector. To identify sectors for domestic and
foreign investment and to promote investment activities
in industries an Investment Promotion Board should be
set up. This board will work as a nodal agency to guide
the government in investment activities besides
recommending and appraising various potential industrial
projects in the State. To win over the confidence of the
private sector, some nominees of this sector should also
be on the board and a joint task force type entity
should be built.
In the present WTO regime, small and medium
industries are more prone to risk. To encourage SME
sector the State government should come up with some
schemes. It may be the setting up of small and medium
industries renewal fund or the setting up of
competitiveness center to guide and help this sector in
modernisation so as to reap the benefits of the free
trade regime. So far cluster development activities of the
State have been quite satisfactory and it should
continue with it. Due to financial constraints, small
and medium sector has been facing problems in product
development and promotion activities. State government
should take care of this fact and help this sector by
providing cheap loans for these activities so that they
can compete at the global level. To diversify the
economic activity in rural areas and to reduce the
pressure on the mainland, rural industrialisation should
be taken up in the State. Khadi and village industries
board can play a key role in this regard. Proper
incentive mechanism should be there for those who set
up or shift industries in rural or backward areas.
5.7 Tertiary Sector
The performance of tertiary sector in Haryana during
the Tenth Plan period has been more than satisfactory.
Only seven States have the targeted service sector
growth rates higher than Haryana during the Tenth
Plan. These States/UTs are Goa, Delhi, West Bengal,
Arunachal Pradesh, Karnataka, Sikkim and Chandigarh.
On the basis of the assumption that per capita income
at constant prices shall be increased at a rate of 7 per
cent per annum in Haryana during the years 2006-07 to
2011-12, we have estimated the targeted growth rate of
tertiary sector which varies from 12.24 per cent to
12.52 per cent which incidentally happens to be nearest
approximation of number one State of Goa in the Tenth
Plan document. The share of tertiary sector in State
Domestic Product will reach upto 49.34 per cent by the
year 2011-12. Here the million dollar question can be
raised. Is it desirable to have consistently increasing
share of tertiary sector in the State Domestic Product
and secondly what is the relationship between sectoral
growth and overall growth rate in an economy. In order
to answer the first question, let us first discuss the
relationship between the sectoral growth and the
overall growth in the economy. Koldor (1967) writes
“Fast rates of growth are almost invariably associated
with the fast rate of growth of the secondary sector,
mainly manufacturers.” Many other studies also
conclude that industrial sector is the engine of growth
and that the manufacturing sector plays the key role in
the process of economic development.
The studies in case of developing as well as
developed countries have indicated that there exists a
strong correlation between the industrial growth and
the overall growth rates. The same results we get in
case of services sector. This means that Kaldor
hypothesis may not be applicable in case of developing
countries. And the trend of rising share of tertiary
sector appears to be good for the economy, but if we
think in terms of productivity growth rates and the
overall growth, the literature suggest that there exists
strong positive relationship between productivity
growth in the manufacturing sector and the overall
growth in the economy. The famous Verdoorm’s Law
establishes a positive relationship between overall
growth and productivity growth in the manufacturing
sector. The empirical studies undertaken at various
times tend to support this law particularly in the
industrial sector—productivity growth in developing
countries can also be associated with the output
growth. The law does not hold well for non-industrial
sectors even in developing countries.
Therefore, in order to justify the increasing share of
tertiary sector in Haryana’s economy one has to analyse
the productivity growth in this sector. Although no
empirical studies have been undertaken yet, on the basis
of observations regarding the salaries and output
growth in the tertiary sector it can be suggested that
the increasing share of tertiary sector in the economy
should be viewed cautiously and Government of
Haryana should take policy initiatives in raising the
productivity growth in the manufacturing sector. In
absence of highly productive manufacturing sector,
growth of tertiary sector in the economy appears to be a
bubble which can vanish at any time. It is also
HARYANA DEVELOPMENT REPORT284
suggested that Government of Haryana should take
positive steps in raising the productivity growth in the
tertiary sector of the economy.
5.8 Science and Technology and Environment
For the socio-economic development of any country,
the role of science and technology (S&T) is very
important. In India, since Independence, the development
of S&T in the country has been recognised and assumed
great importance. Since then the efforts were made to go
for S&T in a major way with full support. The results
achieved were quite encouraging. In the beginning, it
had a very narrow base but as of now it has developed
its S&T infrastructure in big way. Many laboratories,
research and development (R&D) institutions have been
developed covering wide range of activities. Over the
years, the country has achieved growth in many high
technology areas, such as nuclear and space science,
electronics and defence. The efforts have also been made
to develop new areas of S&T, such as microelectronics,
informatics/telematics, biotechnology, renewable energy
sources, non-conventional energy sources, ocean
sciences and many other areas of basic research in S&T.
Though the country has achieved substantial growth in
S&T, there is still a lot more to be done. The future
research in S&T should work on the areas of alternative
strategies for utilisation of infrastructure and technical
manpower generated during last many years. The
country should do more efforts to help India, become a
global technical power. The development in the S&T
should also influence the growth in agriculture,
industry and the infrastructure and the services. The
overall development in these sectors would enhance the
income of the country which in turn will make the
economy more competitive across the world.
The new development of the S&T sector must focus
on the requirements and challenges of the other sectors
such as economic, industrial, trade etc. The new
development should not only benefit the richer class
but also benefit the poorest/weakest sections of the
society. The S&T research and development done in the
earlier period were focused more on the areas of interest
to the limited section of the society. Now the
challenges have to meet the benefits of the large
section of the society, which is none other than the
rural masses. At the same time the interest of the
urban people also need to be take care of.
India has a treasure of knowledge of traditional
science. Its contribution has been recognised in variety
of disciplines of science in the past history. Now this
knowledge has to be transmitted to the younger
generation of the country. This would ensure the
creativity and excellence amongst the youth and the future
of the country. It should also contribute to the future
discoveries and inventions, useful for the humankind
across the world.
Till recent past the country was facing the
challenges in many areas related to the daily life and its
requirements. The growing population in the country
poses many challenges regarding the food availability
(food security), economic growth and the social problems
of basic education/literacy and the health. These
mounting economic and social problems have affected the
growth of the economy, adversely. The research and
development in S&T should be aimed in such a way that
it should help in meeting these challenges. Keeping
these challenges in view, the research programmes
should be re-oriented and re-structured in this
direction. Therefore, there is need to sensitise the
policy makers in the government about the importance
of S&T in the overall development of the country. For
the encouragement of research and development in
S&T, there is need to have a very conducive atmosphere
for such research and development. The exceptional and
capable scientists should be encouraged and the full
support should be extended within the country
comparable to international standards. This can be done
by creating more and more centres/institutions of
excellence in the area of S&T. These centres would
provide places of higher learning in S&T and would
produce and supply S&T manpower for the future
requirements in the country. Since the research and
development in S&T is a continuous process, therefore,
the existing infrastructure facilities and the scientists
of high calibre could be utilised for the future planning
and development programmes in science and
technology. Over the years it has been felt that
hierarchical bureaucracy in S&T should be minimised.
More and more professionalism should be brought in
the S&T research and development.
For effective implementation of planning and
development programmes in S&T there is need to
introduce the decentralisation of decision making
powers and accountability of decision makers and the
administrators. The evaluation of targets and the
achievements also need to be introduced. For the
development of science as such the role of administrators
and the government officials should be minimised as
facilitators of science and technology. The main task of
the administrators is to ensure the smooth functioning,
Chapter 5 • STATE PERSPECTIVES FOR 2012 285
management, promotion and development of the science
and technology institutions.
Another aspect the science and technology is the
marketing of the S&T infrastructure. The linkages should
be established between industry and the research
institutions and the laboratories. The Private participation
may also be encouraged so that the private investor can
also join in setting up of new institutions of S&T research
and development. The selection of the new institutions
should be done carefully to avoid any duplication. There
should be enough freedom and flexibility in working of
the newly set-up research and development centres. The
basic objective of these institutions is to encourage and
strengthen the exchange of ideas and the more and more
interactions amongst the research and development
institutions of S&T and the final users of the research
products.
The standard of these institutions should be very
high and able to meet the global competitions and the
domestic needs. They should be able to draw the
attention of private financial institutions and the industry
to get financial support from them.
These new R&D institutions should concentrate and
develop the competitive strength in such a way that they
should be able to convert technological capabilities into
commercial strengths.
The new institutions should select the key areas of
research and development of S&T where the competitive
strength can be developed and the final research product
can be marketed through commercial strength.
Keeping these requirements in view, there is need to
develop the long term policy in this context. Each
government department should prepare the long term
S&T profile keeping in view the aims and the objectives
of the Technology Vision 2020 Document.2
The basic objective of these profiles is to integrate
their plans with efficiency and productivity of the
concerned departments. These are also aimed to bring
the improvement in the existing infrastructure. Such
measures as adopted would help in enhancing the
economic growth and social benefits to the society at
large. Therefore, for the wide societal benefits, the
interaction between the S&T system and the various
ministries/departments needs to be strengthened. For
the achievement of these objectives, it is essential that
each department should earmark separate budget for the
research and development programmes in S&T. The
technology should ensure that there should be greater
emphasis on eco-friendly technology with zero toxicity
and zero environmental impact for sustainable
development.3
The new technology must ensure clean and healthy
environment. The pollutants generated by one industry
can be used as the input for the other industry. The
establishment of such arrangement would helps in
development of industrial pollution free atmosphere.
Another important issue is to develop conducive
atmosphere of R&D in the educational institutions for
the development of creative skills and innovative
capabilities amongst the young generation of the
society. The emphasis should be on the issues of
management techniques, technology marketing and the
intellectual property rights. The efforts should be made
to generate maximum resources for R&D from the
sectors such as production and the services. These
efforts can be linked to the incentives.
Qualitative growth in the S&T is the most
important factor. The scientific and the technical
education should be oriented towards developing
creative skills and innovative capabilities. This would
help in creating a conducive environment for developing
the R&D in educational institutions. The emphasis
should be on capacity building and training of
scientists in modern management techniques. The
issues related to the technology marketing and
intellectual property rights that should also form part
of the training programmes. The industries should be
encouraged for R&D in the creativity, in the
productivity and the quality. This would help in
engaging the human resources (irrespective of the
skills) available in the industry effectively.
The research and development in S&T should assign
greater responsibilities to its manpower for the
development of energy efficient and environment-
friendly processes.
The automation and artificial intelligence along with
the fiscal and material resources can be used to achieve
the desired objectives.
For the exchange of ideas and in-depth interaction
amongst the S&T personnel, the mobility amongst
various R&D organisations, academic institutions and
industries needs to be encouraged. The appropriate
2. The Technology Vision 2020 Document is prepared by the Technology Information Forecasting and Assessment Council (TIFAC).
3. This was done in consonance with the principles of Agenda-21, adopted by member countries at the United Nations Conference on Environment andDevelopment (UNCED), held in Rio de Janerio in June, 1992
HARYANA DEVELOPMENT REPORT286
incentives for careers in scientific and technological
research should also be provided to draw the attention
of young scientists.
5.8.1 State and Union Territories Participationand the Science and Technology Activities
To take the locational advantage, the R&D
programmes in S&T in the States and UTs should be
encouraged to carry out the location specific R&D
programme for providing the S&T inputs in the key
sectors of socio-economic development by increasing the
demands from States and the UTs. The joint innovative
programmes with the industries and the NGOs should
also be encouraged.
For the effective implementation of the programmes,
the institutional framework needs to be reformed. It was
suggested that a three tier national apex level S&T
mechanism comprising of Cabinet Committee on S&T,
Science Advisory Committee to the Cabinet and the
Committee of Secretaries for S&T can be used for the
development of R&D in S&T.
In addition to the efforts made by the government in
the promotion of R&D programmes in S&T
infrastructure, the incentive efforts should be made to
generate maximum resources for the sectors such as
production and the services.
5.8.2 Prioritisation of S&T Research and Development
The S&T areas of national and international interests
should receive highest priority. The departments such as
Atomic Energy, Biotechnology, Agriculture and the related
products need to be at the top priority. There is need to
have huge investment in the R&D in these sectors.
5.8.3 WTO and the S&T
In the era of globalisation and the competitive
economy, the research and development programmes in
S&T have greater responsibilities. India’s capability in
building nuclear reactors, communication and remote
sensing satellites and guided missiles, just to mention
a few, has been clearly demonstrated. In the wake of
recent developments and the new demands that are
being placed on the S&T system, it is charged with
significantly new responsibilities and has a major role
to play in the country’s development.
5.8.4 Science and Technology-Education and Research
Starting from the early 1970s, there has been a
significant increase in the government support for
science and technology. India today has a wide base of
infrastructure for R&D. There are 200 universities,
about 400 national laboratories and 1300 in-house R&D
units of industries. As a result of this and other
endowments, India has become internationally
competitive in a number of areas. This progress must
be maintained and improved upon through appropriate
training of manpower in the emerging technologies
with infrastructural development as the basic input and
earmarking of funds for higher education by the
scientific departments in the form of direct support to
identified centres in the universities.
The academic community should gradually motivate
the faculty to do research by giving them a sense of
empowerment and autonomy of functioning within the
university system.
A major problem today is to find ways and means to
attract the most talented youngsters to basic science at a
young age. For this obviously, both the image of a career
in science and the available educational opportunities
must be attractive enough as compared to other more
lucrative options. This calls for a multi-pronged approach
like revival of the National Science Talent (NST) Scheme.
The industry can also play an active role in the process
of promoting S&T education and basic research. There are
some good quality research centres run by the industry in
some areas like pharmaceuticals.
A number of mission mode programmes can be
formulated, based on Technology Vision 2020
programme, with inputs from a wide cross-section of
economic ministries and in line with the criteria laid
down for prioritisation. The first is the Missions of
Technological Significance in the areas such as energy,
lasers, optics, drugs etc. The second is the Missions of
Societal Significance. These can be in the areas of
female health care, medical systems, AIDS education,
transport systems etc.
5.8.5 Science and Technology and theSocial Development
Efforts should be made for the development and
application of appropriate technology packages for rural
areas with active participation of voluntary agencies;
development of rural enterprises through science and
technology intervention and complementary development
of rural infrastructure through application of science
and technology.
In formulating such a strategy, the first
consideration is the unit of operations at the grass root
level. As the village or a Panchayat is too small to
Chapter 5 • STATE PERSPECTIVES FOR 2012 287
undertake a project, the Block has emerged as a viable
and stable administrative unit catering to the
development needs of about 1,00,000 people. Originally,
the development emphasis in a Block was on the
welfare and on the provision of minimum social
infrastructure. At the second stage, the focus shifted to
area development. At present, the concern is towards
poverty alleviation. Since the S&T inputs so far in all
these stages have been only marginal, in the next stage,
the focus must be on technology.
Voluntary organisations, which have a strong
science and technology base and high level of
professionalism, have to play a very important role in
implementing development projects with S&T inputs.
Special emphasis will be given to the promotion of
research and development and adaptation of
technologies for improving the life, working conditions
and opportunities for gainful employment of women,
especially in the rural areas.
One of the challenges before the S&T establishments
is to build the local capability to identify local priorities,
plan for solutions and participate as partners. In this,
the voluntary organisations, which have a strong science
and technology base and high level of professionalism,
have to play a very important role in implementing
development projects with S&T inputs. Their role would
be to help local Governments/Panchayats in ensuring
S&T inputs in the development plans being finalised by
the District Planning Committees. As the number of
such voluntary organisations is very limited at present,
there is a need to have more such S&T field groups. The
necessary technical backup for the development activity
can be ensured by formulating collaborative programmes
with the involvement of S&T institutions, working
scientists, technologists and the State S&T Councils.
Another aspect that should be taken care of, under
S&T application for societal development, is the
improvement of traditional technologies which have the
potential of employment generation and upgradation of
the quality of life of the common man. Special emphasis
will be given to the promotion of research and
development and adaptation of technologies for improving
the life, working conditions and opportunities for gainful
employment of women, especially in the rural areas.
Efforts should be made to have a complete documentation
of traditional knowledge, specially in the areas like health
care, medicinal plants, nutrition, agriculture, water
harvesting, building technologies, metallurgical practices,
non-farm occupations, etc. Regional centres for promoting
research and documentation in traditional sciences and
technologies may be set up in the existing institutions
around eminent experts/scientists to study
documentation, validation, upgradation and diffusion of
traditional knowledge.
5.8.6 Science and Technology in theStates and Union Territories
The State level S&T machinery has to take the role
of a major ‘prime mover’, while the Centre can play a
catalytic and advisory role in encouraging this initiative.
The focus should be on programmatic support
through strengthening the linkages/interaction between
the State S&T Councils and the Central S&T agencies
by suitably dovetailing each other’s programmes.
The State governments should be activated much
more to bring about a rapid socio-economic
development through the application of science and
technology through strengthening the linkages/
interaction between the State S&T Councils and the
Central S&T agencies by suitably dovetailing each
other’s programmes.
5.8.7 S&T and Employment
When one is concerned with aspects such as
technological innovations, implementation of newly
developed technologies and finding solutions to problems
of modernising and developing a society, especially in the
context of the process of liberalisation, the S&T
manpower assumes a special significance and will be
required in considerable strength—supply of S&T
personnel in general and of those in the specialised
areas, in particular, especially an assessment of training
requirements. The aspects that need consideration in
such an estimation process pertain to the out turn and
stock of S&T personnel and their training needs.
5.8.8 Environment and Forest
For a healthy life there is need to have healthy
environment. The essential constituents for the healthy
sustainable environment are clean air, pure water, and
conservation of forests and wild life and generations of
adequate greenery. The provision of these basics is
compulsory. In addition, it should also be ensured that
there is prevention of degradation of land, control of
floods and droughts, prevention desertification,
conservation of fragile eco-system, prevention of
deforestation, conserviation bio-diversity and mitigation
of water and air pollution. These are the challenges for
the policy makers, which have been recognised in the
past as well as in the present.
HARYANA DEVELOPMENT REPORT288
For the balanced and sustainable economic
development Tenth Five Year Plan had set the targets
for the environment and forest sector. These are:
increase in forest and tree cover to 25 per cent by 2007
and 33 per cent by 2012 as against the baseline cover of
23.03 per cent in 2001. Cleaning of major polluted
rivers by 2007 and other notified stretches by 2012.4 It
is unfortunate that despite afforestation programmes
(1.1 million hectares covered under the programme) the
total covered area remained inadequate.
Due to limited resources available for this sector,
the air and water quality monitoring programme are
implemented in limited number of towns. This has also
affected the air quality, which remained below the normal
standard.
Of the total tenth plan outlay allocated for programmes
related to environmental concerns, forestry development,
wild life protection, river and lake conservation and
animal welfare, 20.19 per cent was earmarked for the
environment sector, 35.32 per cent for forestry and eco-
development, 13.45 per cent for wildlife protection and
28.09 per cent for river and lake conservation, and 2.94
per cent for animal welfare
5.8.9 Healthy Environment and theQuality of Air and Water
As per the Central Pollution Control Board, the
sanitation status reports on Class-I and II towns found
that only 38 per cent of the sewage water is treated while
the remaining is discharged without any treatment. The
increasing urban population on the bank of rivers makes
the task more difficult. Additional resources are needed to
cover all the remaining areas. The CPCB also prepares
action plans for pollution control, which is implemented
by the State Pollution Control Boards (SPCBs).
For streamlining the management of bio-medical
waste, the GoI has introduced the Bio-medical Waste
(Management and Handling) Rules, 1998, which were
amended in 2003, has to be implemented effectively.
To create the awareness amongst the youngsters,
there is strong need to expand the environmental
education awareness programme throughout the
country. The eco-club concept should be popularised in
the schools and the colleges.
5.8.10 Environment—Training and Education
To impart education and training, a scheme of
Centre for Excellence in Environment was started in
the 80s. In order to strengthen awareness, research and
training in the priority areas of environmental science
and management, the scheme was further strengthened.
Accordingly, more number of these centres were started
in many cities and supported by Ministry of
Environment and Forests to the large extent.
5.8.11 Environment and HazardousIndustrial Waste
According to Hazardous Wastes (Management and
Handling) Rules, 1989/2000 and 2003, all hazardous
wastes are required to be treated and disposed off in the
manner prescribed. Maharashtra, Gujarat and Tamil
Nadu account for over 63 per cent of the total
hazardous wastes generated in the country. There is an
urgent need to provide the solution to this problem. As
per one of the objectives of the Tenth Plan it was
decided to set up 15 common TSDFs (Treatment,
Storage and Disposal Facilities) in the Tenth Plan
period for the safe management of industrial hazardous
waste. Five TSDFs have already been commissioned and
are working satisfactorily. Four more are in an advanced
stage of commissioning in West Bengal, Karnataka,
Haryana and Punjab.
5.8.12 Environment and the Public Private Partnership
The State government must ensure efficient
operation and maintenance of such assets to make them
effective. Public Private Partnership (PPP) efforts could
be considered to bring improvements in the scheme.
While the government will make the investment in
creating assets, the responsibility for operation and
maintenance could be entrusted to private agencies. The
necessary revenue could either be generated with
appropriate user charges levied on the households in
the command area or leasing out vacant land for
conversion into public park. Improving the finances of
the urban local bodies (ULBs) through collection of
appropriate user charges and other measures is essential
for the sustainability of the programme. This may call
for greater coordination between the municipal bodies
and the environmental departments of the State
government. The Ministry of Environment and Forests
should coordinate with Ministry of Urban Development
and a proper policy framework should be put in place. It
may be necessary to link the Central assistance to a
reform platform meant for improving urban governance.
4. See Tenth Five Year Plan Document Volume I and II (2002-2007)
Chapter 5 • STATE PERSPECTIVES FOR 2012 289
5.8.13 Forest and Environment and Panchayats
The combined outlay of the Centre and States in
forestry and wildlife for the Tenth Plan is Rs.14,344.34
crore. These resources need to be judiciously used to
maximise increase in forest and tree cover. Programmes
are initiated to launch a national mission on Bamboo
Technology and Trade Development, a national mission
on Bio-diesel and introduction of community forest
development by Panchayati Raj Institutions. Problems of
gregarious flowering of Muli Bamboo will be addressed
and peoples’ involvement ensured for greening areas and
rationalising forest laws. Urban development Planning has
to have inbuilt greening programme and forest
development plan will be integrated with tribal
development projects for ensuring development of fringe
villages.
5.8.14 Joint Forest Management (JFM)
Joint Forest Management (JFM) strategy for
management of forests with participation of communities
was started in 1990. It involves empowering communities
to plan and implement forest protection and conservation
programmes. Sharing of benefits is the basis of
participation, and mechanisms differ from State to
State. Participation of women and poorer sections of
society has to be ensured. Andhra Pradesh, Madhya
Pradesh and Chhattisgarh have been able to
demonstrate benefits of sharing forest resources
through empowerment of communities. Joint Forest
Management (JFM) is one of the thrust areas of the
Tenth Plan and communities in all the 1.73 lakh
villages situated near forests were to be involved in
managing them. Twenty-eight states have adopted JFM
so far. Till January 2004, 17.33 million hectare forest
area had been brought under 84,632 JFM committees.
5.8.15 Non-Timber Forest Produce (NTFP)Including Medicinal Plants
Non-timber forest produce (NTFP) has emerged as a
potentially significant source of income of the tribal
people. Under the 73rd Amendment of the
Constitution, NTFP has been allocated to the PRIs.
Sustainable management of this resource, with the
development of value addition chains, will improve the
income of the PRIs as well as that of the primary
collectors. Medicinal plants constitute an important
component of NTFP. Use of medicinal value of wild
plants caters to the rural health needs of most of the
forest dwellers. While the Department of AYUSH in the
Ministry of Health and Family Welfare deals with the
cultivation and propagation of medicinal plants in
modern medicines, conservation of wild resources for
ensuring availability of seed stock/mother tissues for
nurseries and harvesting of available wild material on a
sustainable basis should be the primary concern of
forest management.
5.9 Human Resource Development
An economy’s human resources are a vital
component in stimulating rapid economic growth.
Human resources are of critical importance in bringing
about structural and technological transformation
required for industrialisation and agricultural
development and raising per capita incomes rapidly.
People, not machines, make the crucial decisions that
result in improved allocation of resources and
implementation of new technology.
Investment in health and education, empowerment
of weaker sections including women and ensuring their
fullest gainful employment in the development process are
the core elements in human resource development
strategy. From this point of view, the State of Haryana
recognises the importance of strengthening social welfare
but, more significantly, as an essential ingredient of
human approach to the development process.
5.9.1 Health and Nutrition
The State of Haryana is committed to provide quality
health services to its people. Improvement in the health
status of the population has been one of the major thrust
areas in social development programmes of the State. It is
the endeavour of the State government to achieve success
in this regard through improving access to, and utilisation
of health, family welfare and nutrition services with
special focus on weaker sections of the population. Merely
establishing a network of even fully equipped hospitals,
dispensaries, primary health centres and family welfare
centres etc. is not sufficient for improving health
conditions in the State. It is equally important that
doctors, nurses and the technical and administrative
staff responsible for operating this network are
competent, dedicated and sensitive to the sufferings and
pains of patients under their care. This is an important
area for necessary, rather radical, policy action. Also in
resource allocation a much greater priority needs to be
given to health, which has been denied to it so far.
In Haryana, expenditure on health, as a percentage
of total public expenditure, is almost the lowest among
States of India. The only other State lagging behind
Haryana is Sikkim. This distortion in resource
allocation needs to be corrected. It may be regarded
HARYANA DEVELOPMENT REPORT290
largely responsible for Haryana’s moderate performance
on the health front. The infant mortality rate continues
to be too high as compared to most other States.
Overtime, life expectancy at birth has improved but at
its present level it is still low relatively to States like
Kerala, Punjab and Maharashtra. As regards bringing
down the population growth rate, the State has yet to
achieve a real success. Total fertility rate is high and
needs to be brought down from around three per cent
level (1998) to about two per cent level by 2007. Sadly,
Haryana is one of the few States in India whose
decennial growth rate of population has undergone
almost no change over the last three decades. This
problem is the source of many other acute socio-
economic problems. It requires an in-depth analysis to
identify its socio-economic causes for a meaningful,
effective policy action. A related matter of still more
serious concern is the State’s falling sex ratio.
Haryana’s sex ratio is the lowest among Indian States.
It is a reflection not only on the mindset of parents but
also, to some extent, on the adequacy and functioning
of family welfare services and the State of population,
education, and more seriously, the use of pre-natal
diagnostic facilities in the State.
There are a number of programmes and schemes
going on in the State for improving the health status of
the people. The Revised National Tuberculosis Control
Programme (RNTCP) has been implemented in the
State to control the problem of tuberculosis. The entire
population of the State is covered under this programme
which includes a network of more than 5000 Directly
Observed Treatment (DOT) Centres, 204 Microscope
Centres, and 45 TB Units. The State of Haryana has made
a national record for the fastest expansion of DOT
centres, and has been appreciated by the World Health
Organisation in this regard.
Efficient and effective implementation of the pulse
polio programme is another area in which the State has
performed well. Similarly, vigorous campaign on school
health programme is also being carried out in the State.
The reproductive and child health programme (Phase-II)
has been implemented since April 2005 to provide 24
hours delivery services and emergency obstetric care, and
child-care related other services.
The centrally sponsored Integrated Child
Development Services (ICDS) scheme has been
functioning well in the State. It is an early childhood
programme which provides a package of services such as
supplementary nutrition, immunisation, health check
up, referral services and nutrition and health education
under ICDS, a vast network of Anganwari Centres
provides supplementary nutrition to a large number of
children (6 months to 6 years of age), and pregnant and
nursing mothers. Recently, two new schemes, namely
“Improving Infant and Young Child Feeding” and “Best
Mother Awards” have been started to eradicate mal-
nutrition among children. National Programme for
Nutritional Support to Primary Education, a centrally
sponsored mid-day meal scheme, launched in the State
from 15 th August 2004, is another effort in the
direction of eradication of malnutrition among young
children going to primary classes (I to V) in
government, local bodies and private-aided schools in
the State.
5.9.2 Education
The system of education has a determining influence
on the rate at which economic progress is achieved and
the benefits can be derived from it. Education develops
critical faculties of the people and thereby enables them
to properly comprehend the various aspects of the
socio-political and economic phenomena around them,
and make correct judgements. For economic
development, various skills and right type of values and
attitudes are necessary. Education plays an important
role in developing these skills and shaping values and
attitudes of individuals. In fact, education is not merely
a way of cultural enrichment of individual’s personality
but more significantly, it is an engine of socio-
economic transformation of the economy.
Children represent the future of the country. From
this point of view, educating them is perhaps the most
essential responsibility of any State. This cannot be
achieved merely in terms of opening schools and
colleges. No less important is to ensure their access to
these institutions and create necessary conditions so
that the incidence of drop out is minimum possible.
Educational policy should concentrate on expanding
and strengthening educational network, recruiting
competent and dedicated teachers capable of motivating
the students and developing their potential to the
fullest possible extent, linking the content of education
to the needs of the society and making it relevant to
local conditions and conducive to intellectual and moral
aspects of personality development.
In simplest terms, the status of education in a State
is mostly evaluated in terms of some broad indicators
such as expenditure on education, rates of literacy and
enrollment ratios. Obviously, these indicators are
important to identify, at least in quantitative terms, the
direction and extent of required changes in respect of
priorities and thrust areas of educational policy.
Chapter 5 • STATE PERSPECTIVES FOR 2012 291
Haryana’s expenditure on education as a proportion
of total public expenditure constituted 14.50 per cent
(1998-1999) that was less than many other States. Even
the neighbouring States spent a higher proportion on
education: Rajasthan (19.53 per cent), Uttar Pradesh
(18.31 per cent), Himachal Pradesh (16.83 per cent) and
Punjab (15.76 per cent). Apparently, varying levels of
expenditure in case of different States would normally
be reflected in the behaviour of literacy rates and
enrollment ratios. This is, what emerges when we have
a comparative assessment of Haryana’s performance in
the field of education.
The literacy rate of Haryana has been continuously
increasing. It stood at 25.71 per cent in 1971, increased to
37.13 per cent by 1981, to 55.85 per cent by 1991, and to
67.91 per cent by 2001. At its present level, though it is
higher than the all-India literacy rate, it is still lower as
compared to States like Kerala (90.86 per cent), Goa
(82.01 per cent), Maharashtra (76.88 per cent), Himachal
Pradesh (76.48 per cent) and Punjab (69.65 per cent).
From the point of view of socio-economic upliftment of
the society, education of females and their active
participation in the development process is of utmost
importance. Comparing Haryana’s performance in respect
of female literacy rate, we find that the State is yet to
match many other States leading in this respect. Haryana’s
female literacy rate stood at 56.3 per cent in 2001. As
compared to this it was much higher in States like Kerala,
Mizoram and Maharashtra. It was higher even in
neighbouring States of Himachal Pradesh (68.1 per cent)
and Punjab (56.23 per cent). As regards the male literacy
rate, Haryana (79.3 per cent) occupies more or less the
same position relatively to other States as in case of
female literacy. These figures, on the whole, imply that
raising literacy level in the State by at least 10 per cent by
2012, with special focus on female literacy, should be the
most basic guiding principle of State policy.
In Haryana, gross enrolment (class 1 to 8) in case of
both boys and girls in the school going age-group (6-
14), as a proportion of their population, is lower
relatively to many other States including some of the
neighbouring States. It is lower than even the all-India
average. Considering the enrolment position of boys
during 2003-2004, we find that it was 71.53 per cent in
case of Haryana as compared to corresponding all India
average of 88.02 per cent, and of neighbouring State of
Himachal Pradesh 103.62 per cent and Rajasthan’s
103.65 per cent. Similarly, for girls it was 71.49 per
cent in case of Haryana in comparison to all India
average of 81.51 per cent and 102.61 for neighbouring
State of Himachal Pradesh. More or less same position
emerges when we consider enrolment ratios in the case
of scheduled caste students vis-à-vis some other States
including neighbouring States of Punjab, Rajasthan,
Himachal Pradesh and Uttar Pradesh. This is a matter
of policy introspection. There is an urgent need for
devising realistic and effective measures for attracting
greater proportion of children to schools and ensuring
that most of them continue in the school until the
completion of their education.
On the whole, the enrolment position of the State,
through improving overtime, has yet to achieve success
levels already attained by some other States. Raising the
enrollment ratios significantly, particularly of girls in
general, and students belonging to scheduled castes, should
be given due priority in the educational policy of the State.
5.9.3 Gender Parity and Empowerment
Gender parity and empowerment are important
aspects of human resource development policy. If a large
segment of population remains neglected in terms of its
involvement in the development process, and is
discriminated against in many crucial matters
pertaining to its socio-economic upliftment and
participation in decision making, then the progress of
society cannot be expected to result into a higher social
welfare level. The social sector development policy
should include ensuring gender parity and
empowerment (of weaker sections including women) as
its foremost aims.
Gender disparities adversely affect the average
achievement level of a State, measured by human
development index (HDI), in respect of some basic
parameters (namely, life expectancy at birth, adult
literacy rate, enrollment ratios and per capita gross
domestic product). In Haryana gender disparities do not
exist in large measure reflected in the behaviour of
these parameters between males and females. Table 5.10
shows the extent of gender disparities in Haryana.
The table contains relevant information as regards
disparity between male and female rates pertaining to
various aspects of human development. The broad
conclusion that may be drawn from this information is
that though Haryana has yet to go a long way for
eliminating gender disparities, its position in this regard,
on the whole, is still better relatively to India as a whole.
As far as its performance in human resource development
is concerned, it is one of the few States in the country
having human development index (HDI) more than 0.5
and falling in the range of ‘medium’ human development;
most States fall in the ‘low’ range and no State falls in
the ‘high’ range. Except its slightly lower performance
HARYANA DEVELOPMENT REPORT292
TABLE 5.11
Urbanisation Trends in Haryana
Census Total Urban Urban Increase inPopulation Population Population Population*
as Percentageof Total
Population
1971 10,036,431 1,771,959 17.67 -
1981 12,922,119 2,827,387 21.88 36.54
1991 16,463,648 4,054,744 24.63 34.66
2001 21,082,139 6,114,139 29.00 44.59
All India(2001) - - 27.78 -
Note: * As percentage of total decennial increase in State population.
Source: Census of India 2001, Series 7, Haryana, Provisional PopulationTotals, Paper-2 of 2001, Director of Census Operations Haryana.
level in respect of enrolment ratios of boys and girls (age
group 6-14), the State’s position with regard to literacy
rates, life expectance at birth and work participation rates
compares well with that of India as a whole. Haryana has
not only higher achievement levels in respect of these
parameters but, on the whole, somewhat lesser gender
disparities, too. Health and education are the most basic
dimensions of human resource. Literacy, longevity, work
productivity and earnings are closely linked with the
status of health and education. An accelerated pace of
directed policy action in these areas may be expected to
usher in a substantially improved State of human resource
development.
TABLE 5.10
Gender Disparities in Haryana
Human Resource Haryana All IndiaDevelopment Indicator
Male Female Male Female
Enrolment Ratio(Age 6-14) 2003-04 71.53 71.49 88.02 81.51
Literacy rate (2001) 79.30 56.30 75.90 54.20
Life Expectancy atBirth (2002-06) 64.64 69.30 63.90 66.90
Work ParticipationRate (2001) 68.22 31.78 51.90 25.70
Source: Director of Census operations, Haryana, available atwww.censusindia.net
5.10 Urban Development
There has been a continuous increase in the share of
urban population in State’s total population. This share
was 21.88 per cent in 1981. It increased to 24.63 in 1991
and to 29 per cent in 2001. As a result, urban areas of
the State are exposed to the burden of supporting an
increasing proportion of State’s population additions,
decade after decade. The 1991 census figures show that
the increase in urban population, as percentage of the
increase in State’s total population, constituted around
35 per cent during 1981-90. This increase went up to
44.59 per cent during 1991-2000. These urbanisation
trends can be seen from an inspection of the information
presented in Table 5.11.
There are only a few States having a higher
percentage of urban population as compared to Haryana
(29 per cent). The all India percentage is slightly less
(27.78 per cent) than that of Haryana. The higher
urban percentage States include Punjab (33.95 per
cent), Karnataka (33.98 per cent), Gujarat (37.35 per
cent), Maharashtra (42.40 per cent) and Tamil Nadu
(43.86 per cent). Significantly, these are the States
(including Haryana) whose per capita incomes are
mostly higher than any other State. As such the
increasing trend of urbanisation may be interpreted as
symbol of growing prosperity and opportunities, which
attracts rural people to migrate to these areas in search
of green pastures. But at the same time it also puts a
severe strain on the scarce resources and amenities
available in urban areas.
In order to cope with an increasing burden of
growing population there is a need to give due priority
to urban development in terms of strengthening social
and economic infrastructure. This can be achieved
through greater quality provision of facilities as regards
housing, electricity, education, health care, drinking
water, sanitation, sewerage, metalled roads and street
lighting in a well planned way. The State of Haryana
has all of these requirements on its priority agenda.
There is a commendable attempt on the part of State
government particularly in respect of provision of
dwelling units and residential plots in well planned
colonies especially for the households belonging to
weaker sections, and low and middle income groups
mainly through its own agencies, such as Haryana
Urban Development Authority (HUDA) and Haryana
Housing Board. The State is also encouraging the
participation of private sector and cooperative housing
societies in this endeavour in a significant way.
5.11 Poverty
Poverty reduction has been one of the most
important objectives of the development policy of the
State ever since it came into existence in 1966. Indeed,
the true measure of the growth performance of a State
lies in its ability to translate growth into substantial
reduction in its poverty levels. In this regard the State
of Haryana has exhibited appreciable performance as
compared to many other States. It has always ranked
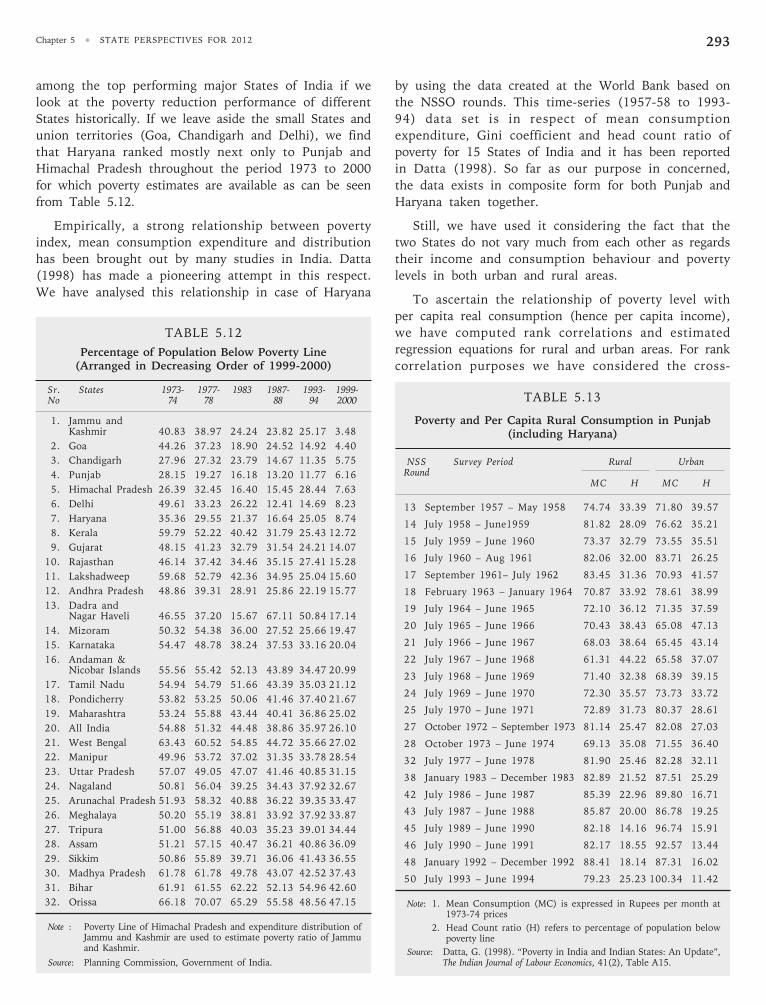
Chapter 5 • STATE PERSPECTIVES FOR 2012 293
among the top performing major States of India if we
look at the poverty reduction performance of different
States historically. If we leave aside the small States and
union territories (Goa, Chandigarh and Delhi), we find
that Haryana ranked mostly next only to Punjab and
Himachal Pradesh throughout the period 1973 to 2000
for which poverty estimates are available as can be seen
from Table 5.12.
Empirically, a strong relationship between poverty
index, mean consumption expenditure and distribution
has been brought out by many studies in India. Datta
(1998) has made a pioneering attempt in this respect.
We have analysed this relationship in case of Haryana
by using the data created at the World Bank based on
the NSSO rounds. This time-series (1957-58 to 1993-
94) data set is in respect of mean consumption
expenditure, Gini coefficient and head count ratio of
poverty for 15 States of India and it has been reported
in Datta (1998). So far as our purpose in concerned,
the data exists in composite form for both Punjab and
Haryana taken together.
Still, we have used it considering the fact that the
two States do not vary much from each other as regards
their income and consumption behaviour and poverty
levels in both urban and rural areas.
To ascertain the relationship of poverty level with
per capita real consumption (hence per capita income),
we have computed rank correlations and estimated
regression equations for rural and urban areas. For rank
correlation purposes we have considered the cross-
TABLE 5.12
Percentage of Population Below Poverty Line(Arranged in Decreasing Order of 1999-2000)
Sr. States 1973- 1977- 1983 1987- 1993- 1999-No 74 78 88 94 2000
1. Jammu andKashmir 40.83 38.97 24.24 23.82 25.17 3.48
2. Goa 44.26 37.23 18.90 24.52 14.92 4.40
3. Chandigarh 27.96 27.32 23.79 14.67 11.35 5.75
4. Punjab 28.15 19.27 16.18 13.20 11.77 6.16
5. Himachal Pradesh 26.39 32.45 16.40 15.45 28.44 7.63
6. Delhi 49.61 33.23 26.22 12.41 14.69 8.23
7. Haryana 35.36 29.55 21.37 16.64 25.05 8.74
8. Kerala 59.79 52.22 40.42 31.79 25.43 12.72
9. Gujarat 48.15 41.23 32.79 31.54 24.21 14.07
10. Rajasthan 46.14 37.42 34.46 35.15 27.41 15.28
11. Lakshadweep 59.68 52.79 42.36 34.95 25.04 15.60
12. Andhra Pradesh 48.86 39.31 28.91 25.86 22.19 15.77
13. Dadra andNagar Haveli 46.55 37.20 15.67 67.11 50.84 17.14
14. Mizoram 50.32 54.38 36.00 27.52 25.66 19.47
15. Karnataka 54.47 48.78 38.24 37.53 33.16 20.04
16. Andaman &Nicobar Islands 55.56 55.42 52.13 43.89 34.47 20.99
17. Tamil Nadu 54.94 54.79 51.66 43.39 35.03 21.12
18. Pondicherry 53.82 53.25 50.06 41.46 37.40 21.67
19. Maharashtra 53.24 55.88 43.44 40.41 36.86 25.02
20. All India 54.88 51.32 44.48 38.86 35.97 26.10
21. West Bengal 63.43 60.52 54.85 44.72 35.66 27.02
22. Manipur 49.96 53.72 37.02 31.35 33.78 28.54
23. Uttar Pradesh 57.07 49.05 47.07 41.46 40.85 31.15
24. Nagaland 50.81 56.04 39.25 34.43 37.92 32.67
25. Arunachal Pradesh 51.93 58.32 40.88 36.22 39.35 33.47
26. Meghalaya 50.20 55.19 38.81 33.92 37.92 33.87
27. Tripura 51.00 56.88 40.03 35.23 39.01 34.44
28. Assam 51.21 57.15 40.47 36.21 40.86 36.09
29. Sikkim 50.86 55.89 39.71 36.06 41.43 36.55
30. Madhya Pradesh 61.78 61.78 49.78 43.07 42.52 37.43
31. Bihar 61.91 61.55 62.22 52.13 54.96 42.60
32. Orissa 66.18 70.07 65.29 55.58 48.56 47.15
Note : Poverty Line of Himachal Pradesh and expenditure distribution ofJammu and Kashmir are used to estimate poverty ratio of Jammuand Kashmir.
Source: Planning Commission, Government of India.
TABLE 5.13
Poverty and Per Capita Rural Consumption in Punjab(including Haryana)
NSS Survey Period Rural UrbanRound
MC H MC H
13 September 1957 – May 1958 74.74 33.39 71.80 39.57
14 July 1958 – June1959 81.82 28.09 76.62 35.21
15 July 1959 – June 1960 73.37 32.79 73.55 35.51
16 July 1960 – Aug 1961 82.06 32.00 83.71 26.25
17 September 1961– July 1962 83.45 31.36 70.93 41.57
18 February 1963 – January 1964 70.87 33.92 78.61 38.99
19 July 1964 – June 1965 72.10 36.12 71.35 37.59
20 July 1965 – June 1966 70.43 38.43 65.08 47.13
21 July 1966 – June 1967 68.03 38.64 65.45 43.14
22 July 1967 – June 1968 61.31 44.22 65.58 37.07
23 July 1968 – June 1969 71.40 32.38 68.39 39.15
24 July 1969 – June 1970 72.30 35.57 73.73 33.72
25 July 1970 – June 1971 72.89 31.73 80.37 28.61
27 October 1972 – September 1973 81.14 25.47 82.08 27.03
28 October 1973 – June 1974 69.13 35.08 71.55 36.40
32 July 1977 – June 1978 81.90 25.46 82.28 32.11
38 January 1983 – December 1983 82.89 21.52 87.51 25.29
42 July 1986 – June 1987 85.39 22.96 89.80 16.71
43 July 1987 – June 1988 85.87 20.00 86.78 19.25
45 July 1989 – June 1990 82.18 14.16 96.74 15.91
46 July 1990 – June 1991 82.17 18.55 92.57 13.44
48 January 1992 – December 1992 88.41 18.14 87.31 16.02
50 July 1993 – June 1994 79.23 25.23 100.34 11.42
Note: 1. Mean Consumption (MC) is expressed in Rupees per month at1973-74 prices
2. Head Count ratio (H) refers to percentage of population belowpoverty line
Source: Datta, G. (1998). “Poverty in India and Indian States: An Update”,The Indian Journal of Labour Economics, 41(2), Table A15.
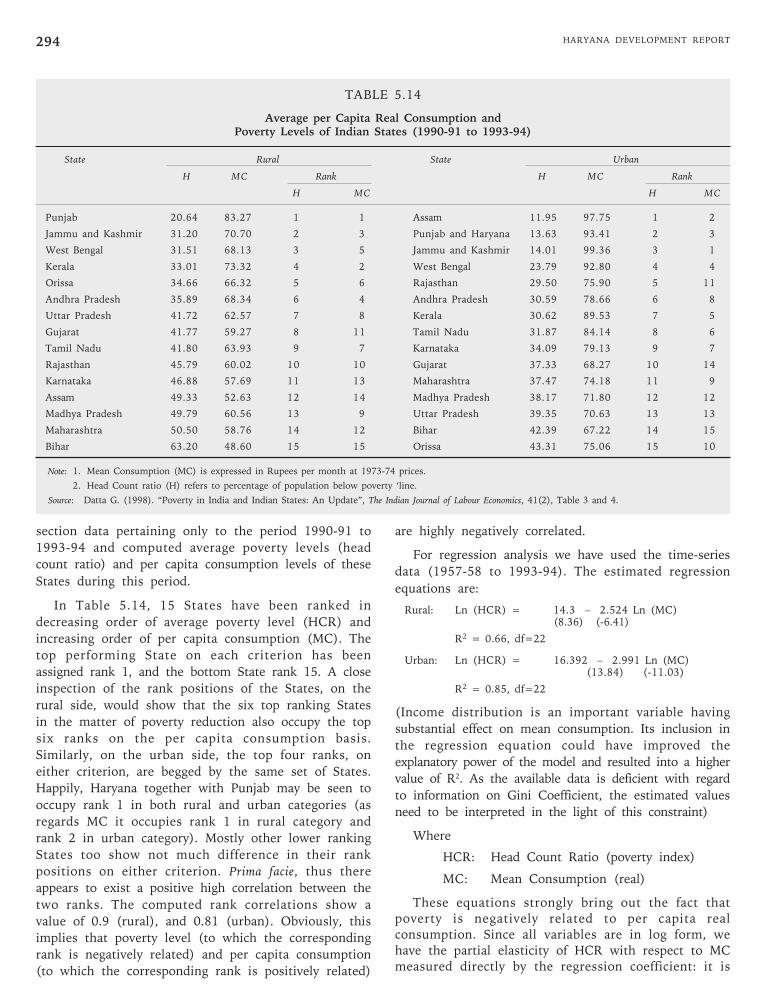
HARYANA DEVELOPMENT REPORT294
TABLE 5.14
Average per Capita Real Consumption andPoverty Levels of Indian States (1990-91 to 1993-94)
State Rural State Urban
H MC Rank H MC Rank
H MC H MC
Punjab 20.64 83.27 1 1 Assam 11.95 97.75 1 2
Jammu and Kashmir 31.20 70.70 2 3 Punjab and Haryana 13.63 93.41 2 3
West Bengal 31.51 68.13 3 5 Jammu and Kashmir 14.01 99.36 3 1
Kerala 33.01 73.32 4 2 West Bengal 23.79 92.80 4 4
Orissa 34.66 66.32 5 6 Rajasthan 29.50 75.90 5 11
Andhra Pradesh 35.89 68.34 6 4 Andhra Pradesh 30.59 78.66 6 8
Uttar Pradesh 41.72 62.57 7 8 Kerala 30.62 89.53 7 5
Gujarat 41.77 59.27 8 11 Tamil Nadu 31.87 84.14 8 6
Tamil Nadu 41.80 63.93 9 7 Karnataka 34.09 79.13 9 7
Rajasthan 45.79 60.02 10 10 Gujarat 37.33 68.27 10 14
Karnataka 46.88 57.69 11 13 Maharashtra 37.47 74.18 11 9
Assam 49.33 52.63 12 14 Madhya Pradesh 38.17 71.80 12 12
Madhya Pradesh 49.79 60.56 13 9 Uttar Pradesh 39.35 70.63 13 13
Maharashtra 50.50 58.76 14 12 Bihar 42.39 67.22 14 15
Bihar 63.20 48.60 15 15 Orissa 43.31 75.06 15 10
Note: 1. Mean Consumption (MC) is expressed in Rupees per month at 1973-74 prices.
2. Head Count ratio (H) refers to percentage of population below poverty ‘line.
Source: Datta G. (1998). “Poverty in India and Indian States: An Update”, The Indian Journal of Labour Economics, 41(2), Table 3 and 4.
section data pertaining only to the period 1990-91 to
1993-94 and computed average poverty levels (head
count ratio) and per capita consumption levels of these
States during this period.
In Table 5.14, 15 States have been ranked in
decreasing order of average poverty level (HCR) and
increasing order of per capita consumption (MC). The
top performing State on each criterion has been
assigned rank 1, and the bottom State rank 15. A close
inspection of the rank positions of the States, on the
rural side, would show that the six top ranking States
in the matter of poverty reduction also occupy the top
six ranks on the per capita consumption basis.
Similarly, on the urban side, the top four ranks, on
either criterion, are begged by the same set of States.
Happily, Haryana together with Punjab may be seen to
occupy rank 1 in both rural and urban categories (as
regards MC it occupies rank 1 in rural category and
rank 2 in urban category). Mostly other lower ranking
States too show not much difference in their rank
positions on either criterion. Prima facie, thus there
appears to exist a positive high correlation between the
two ranks. The computed rank correlations show a
value of 0.9 (rural), and 0.81 (urban). Obviously, this
implies that poverty level (to which the corresponding
rank is negatively related) and per capita consumption
(to which the corresponding rank is positively related)
are highly negatively correlated.
For regression analysis we have used the time-series
data (1957-58 to 1993-94). The estimated regression
equations are:
Rural: Ln (HCR) = 14.3 – 2.524 Ln (MC)(8.36) (-6.41)
R2 = 0.66, df=22
Urban: Ln (HCR) = 16.392 – 2.991 Ln (MC)(13.84) (-11.03)
R2 = 0.85, df=22
(Income distribution is an important variable having
substantial effect on mean consumption. Its inclusion in
the regression equation could have improved the
explanatory power of the model and resulted into a higher
value of R2. As the available data is deficient with regard
to information on Gini Coefficient, the estimated values
need to be interpreted in the light of this constraint)
Where
HCR: Head Count Ratio (poverty index)
MC: Mean Consumption (real)
These equations strongly bring out the fact thatpoverty is negatively related to per capita realconsumption. Since all variables are in log form, wehave the partial elasticity of HCR with respect to MCmeasured directly by the regression coefficient: it is
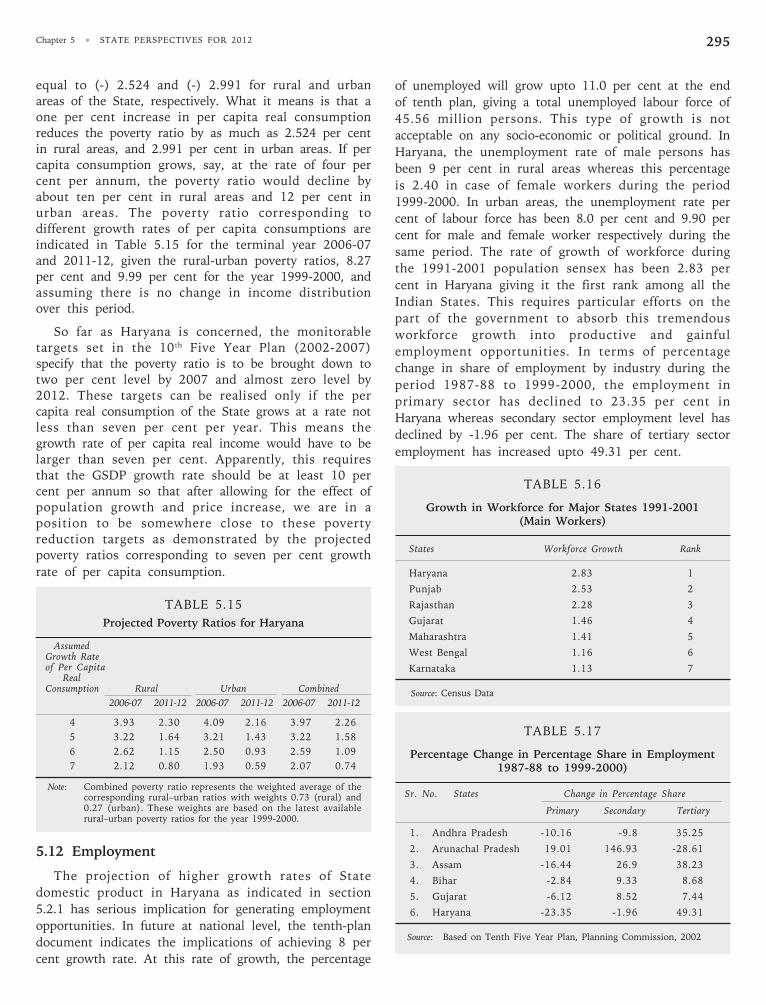
Chapter 5 • STATE PERSPECTIVES FOR 2012 295
of unemployed will grow upto 11.0 per cent at the end
of tenth plan, giving a total unemployed labour force of
45.56 million persons. This type of growth is not
acceptable on any socio-economic or political ground. In
Haryana, the unemployment rate of male persons has
been 9 per cent in rural areas whereas this percentage
is 2.40 in case of female workers during the period
1999-2000. In urban areas, the unemployment rate per
cent of labour force has been 8.0 per cent and 9.90 per
cent for male and female worker respectively during the
same period. The rate of growth of workforce during
the 1991-2001 population sensex has been 2.83 per
cent in Haryana giving it the first rank among all the
Indian States. This requires particular efforts on the
part of the government to absorb this tremendous
workforce growth into productive and gainful
employment opportunities. In terms of percentage
change in share of employment by industry during the
period 1987-88 to 1999-2000, the employment in
primary sector has declined to 23.35 per cent in
Haryana whereas secondary sector employment level has
declined by -1.96 per cent. The share of tertiary sector
employment has increased upto 49.31 per cent.
TABLE 5.16
Growth in Workforce for Major States 1991-2001(Main Workers)
States Workforce Growth Rank
Haryana 2.83 1
Punjab 2.53 2
Rajasthan 2.28 3
Gujarat 1.46 4
Maharashtra 1.41 5
West Bengal 1.16 6
Karnataka 1.13 7
Source: Census Data
TABLE 5.17
Percentage Change in Percentage Share in Employment1987-88 to 1999-2000)
Sr. No. States Change in Percentage Share
Primary Secondary Tertiary
1. Andhra Pradesh -10.16 -9.8 35.25
2. Arunachal Pradesh 19.01 146.93 -28.61
3. Assam -16.44 26.9 38.23
4. Bihar -2.84 9.33 8.68
5. Gujarat -6.12 8.52 7.44
6. Haryana -23.35 -1.96 49.31
Source: Based on Tenth Five Year Plan, Planning Commission, 2002
equal to (-) 2.524 and (-) 2.991 for rural and urbanareas of the State, respectively. What it means is that aone per cent increase in per capita real consumptionreduces the poverty ratio by as much as 2.524 per centin rural areas, and 2.991 per cent in urban areas. If percapita consumption grows, say, at the rate of four percent per annum, the poverty ratio would decline byabout ten per cent in rural areas and 12 per cent inurban areas. The poverty ratio corresponding todifferent growth rates of per capita consumptions areindicated in Table 5.15 for the terminal year 2006-07and 2011-12, given the rural-urban poverty ratios, 8.27per cent and 9.99 per cent for the year 1999-2000, andassuming there is no change in income distributionover this period.
So far as Haryana is concerned, the monitorabletargets set in the 10 th Five Year Plan (2002-2007)specify that the poverty ratio is to be brought down totwo per cent level by 2007 and almost zero level by2012. These targets can be realised only if the percapita real consumption of the State grows at a rate notless than seven per cent per year. This means thegrowth rate of per capita real income would have to belarger than seven per cent. Apparently, this requiresthat the GSDP growth rate should be at least 10 percent per annum so that after allowing for the effect ofpopulation growth and price increase, we are in aposition to be somewhere close to these povertyreduction targets as demonstrated by the projectedpoverty ratios corresponding to seven per cent growth
rate of per capita consumption.
TABLE 5.15
Projected Poverty Ratios for Haryana
AssumedGrowth Rateof Per Capita
RealConsumption Rural Urban Combined
2006-07 2011-12 2006-07 2011-12 2006-07 2011-12
4 3.93 2.30 4.09 2.16 3.97 2.26
5 3.22 1.64 3.21 1.43 3.22 1.58
6 2.62 1.15 2.50 0.93 2.59 1.09
7 2.12 0.80 1.93 0.59 2.07 0.74
Note: Combined poverty ratio represents the weighted average of thecorresponding rural–urban ratios with weights 0.73 (rural) and0.27 (urban). These weights are based on the latest availablerural–urban poverty ratios for the year 1999-2000.
5.12 Employment
The projection of higher growth rates of State
domestic product in Haryana as indicated in section
5.2.1 has serious implication for generating employment
opportunities. In future at national level, the tenth-plan
document indicates the implications of achieving 8 per
cent growth rate. At this rate of growth, the percentage
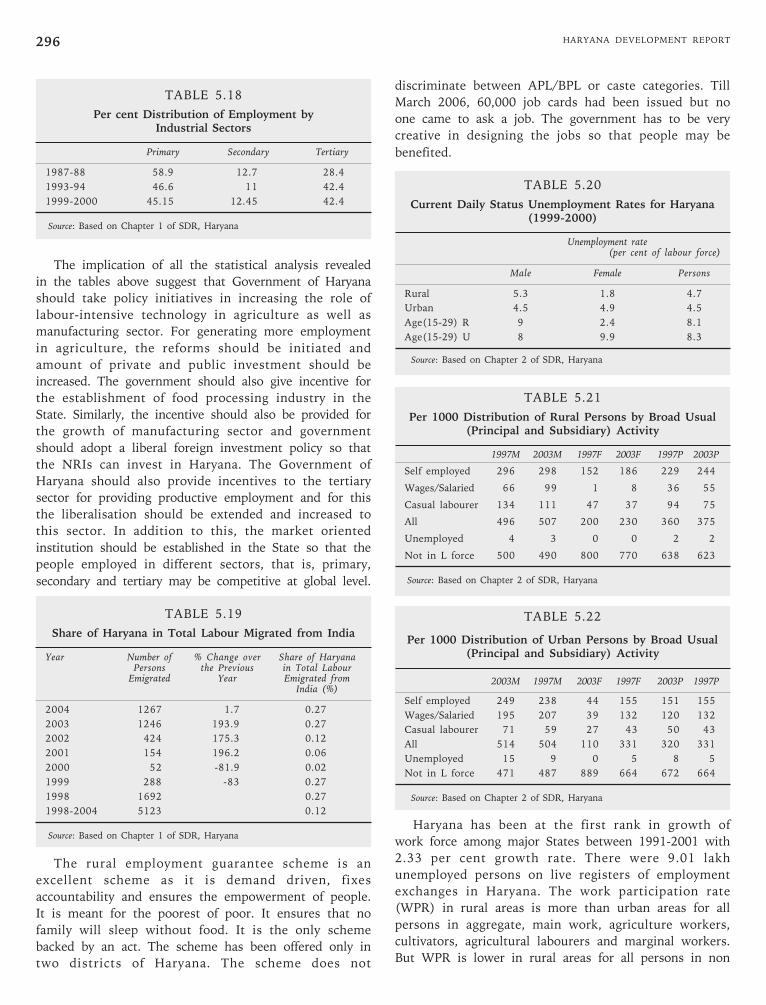
HARYANA DEVELOPMENT REPORT296
discriminate between APL/BPL or caste categories. Till
March 2006, 60,000 job cards had been issued but no
one came to ask a job. The government has to be very
creative in designing the jobs so that people may be
benefited.
TABLE 5.20
Current Daily Status Unemployment Rates for Haryana(1999-2000)
Unemployment rate(per cent of labour force)
Male Female Persons
Rural 5.3 1.8 4.7
Urban 4.5 4.9 4.5
Age(15-29) R 9 2.4 8.1
Age(15-29) U 8 9.9 8.3
Source: Based on Chapter 2 of SDR, Haryana
TABLE 5.21
Per 1000 Distribution of Rural Persons by Broad Usual(Principal and Subsidiary) Activity
1997M 2003M 1997F 2003F 1997P 2003P
Self employed 296 298 152 186 229 244
Wages/Salaried 66 99 1 8 36 55
Casual labourer 134 111 47 37 94 75
All 496 507 200 230 360 375
Unemployed 4 3 0 0 2 2
Not in L force 500 490 800 770 638 623
Source: Based on Chapter 2 of SDR, Haryana
TABLE 5.22
Per 1000 Distribution of Urban Persons by Broad Usual(Principal and Subsidiary) Activity
2003M 1997M 2003F 1997F 2003P 1997P
Self employed 249 238 44 155 151 155
Wages/Salaried 195 207 39 132 120 132
Casual labourer 71 59 27 43 50 43
All 514 504 110 331 320 331
Unemployed 15 9 0 5 8 5
Not in L force 471 487 889 664 672 664
Source: Based on Chapter 2 of SDR, Haryana
Haryana has been at the first rank in growth of
work force among major States between 1991-2001 with
2.33 per cent growth rate. There were 9.01 lakh
unemployed persons on live registers of employment
exchanges in Haryana. The work participation rate
(WPR) in rural areas is more than urban areas for all
persons in aggregate, main work, agriculture workers,
cultivators, agricultural labourers and marginal workers.
But WPR is lower in rural areas for all persons in non
TABLE 5.18
Per cent Distribution of Employment byIndustrial Sectors
Primary Secondary Tertiary
1987-88 58.9 12.7 28.4
1993-94 46.6 11 42.4
1999-2000 45.15 12.45 42.4
Source: Based on Chapter 1 of SDR, Haryana
The implication of all the statistical analysis revealed
in the tables above suggest that Government of Haryana
should take policy initiatives in increasing the role of
labour-intensive technology in agriculture as well as
manufacturing sector. For generating more employment
in agriculture, the reforms should be initiated and
amount of private and public investment should be
increased. The government should also give incentive for
the establishment of food processing industry in the
State. Similarly, the incentive should also be provided for
the growth of manufacturing sector and government
should adopt a liberal foreign investment policy so that
the NRIs can invest in Haryana. The Government of
Haryana should also provide incentives to the tertiary
sector for providing productive employment and for this
the liberalisation should be extended and increased to
this sector. In addition to this, the market oriented
institution should be established in the State so that the
people employed in different sectors, that is, primary,
secondary and tertiary may be competitive at global level.
TABLE 5.19
Share of Haryana in Total Labour Migrated from India
Year Number of % Change over Share of HaryanaPersons the Previous in Total Labour
Emigrated Year Emigrated fromIndia (%)
2004 1267 1.7 0.27
2003 1246 193.9 0.27
2002 424 175.3 0.12
2001 154 196.2 0.06
2000 52 -81.9 0.02
1999 288 -83 0.27
1998 1692 0.27
1998-2004 5123 0.12
Source: Based on Chapter 1 of SDR, Haryana
The rural employment guarantee scheme is an
excellent scheme as it is demand driven, fixes
accountability and ensures the empowerment of people.
It is meant for the poorest of poor. It ensures that no
family will sleep without food. It is the only scheme
backed by an act. The scheme has been offered only in
two districts of Haryana. The scheme does not
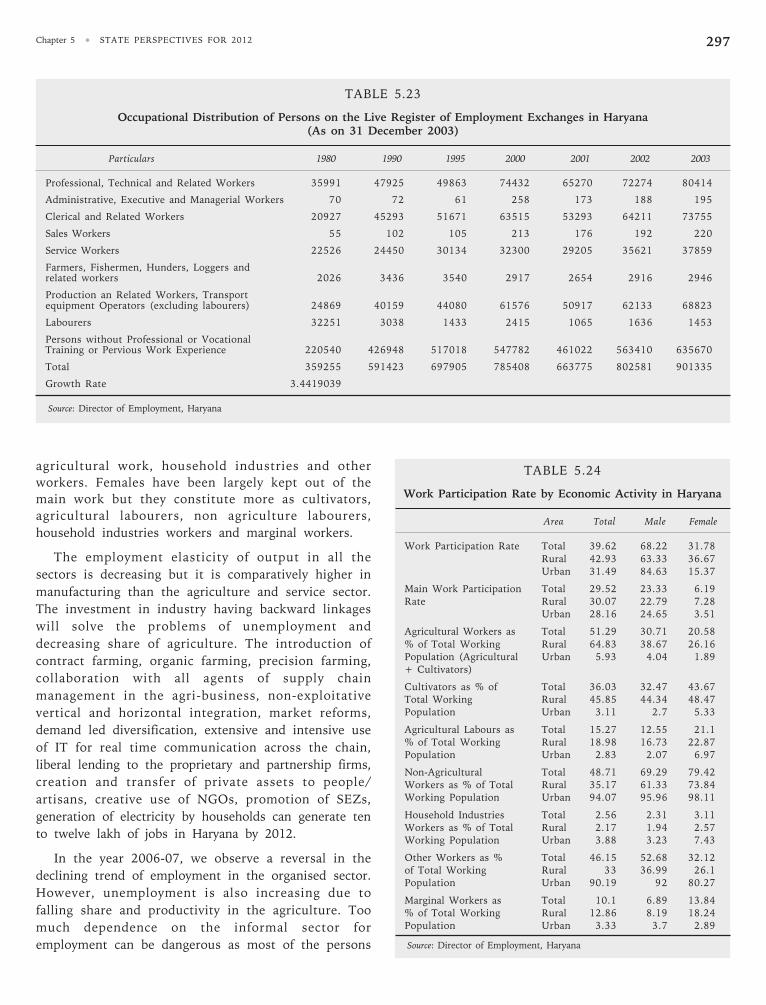
Chapter 5 • STATE PERSPECTIVES FOR 2012 297
agricultural work, household industries and other
workers. Females have been largely kept out of the
main work but they constitute more as cultivators,
agricultural labourers, non agriculture labourers,
household industries workers and marginal workers.
The employment elasticity of output in all the
sectors is decreasing but it is comparatively higher in
manufacturing than the agriculture and service sector.
The investment in industry having backward linkages
will solve the problems of unemployment and
decreasing share of agriculture. The introduction of
contract farming, organic farming, precision farming,
collaboration with all agents of supply chain
management in the agri-business, non-exploitative
vertical and horizontal integration, market reforms,
demand led diversification, extensive and intensive use
of IT for real time communication across the chain,
liberal lending to the proprietary and partnership firms,
creation and transfer of private assets to people/
artisans, creative use of NGOs, promotion of SEZs,
generation of electricity by households can generate ten
to twelve lakh of jobs in Haryana by 2012.
In the year 2006-07, we observe a reversal in the
declining trend of employment in the organised sector.
However, unemployment is also increasing due to
falling share and productivity in the agriculture. Too
much dependence on the informal sector for
employment can be dangerous as most of the persons
TABLE 5.23
Occupational Distribution of Persons on the Live Register of Employment Exchanges in Haryana(As on 31 December 2003)
Particulars 1980 1990 1995 2000 2001 2002 2003
Professional, Technical and Related Workers 35991 47925 49863 74432 65270 72274 80414
Administrative, Executive and Managerial Workers 70 72 61 258 173 188 195
Clerical and Related Workers 20927 45293 51671 63515 53293 64211 73755
Sales Workers 55 102 105 213 176 192 220
Service Workers 22526 24450 30134 32300 29205 35621 37859
Farmers, Fishermen, Hunders, Loggers andrelated workers 2026 3436 3540 2917 2654 2916 2946
Production an Related Workers, Transportequipment Operators (excluding labourers) 24869 40159 44080 61576 50917 62133 68823
Labourers 32251 3038 1433 2415 1065 1636 1453
Persons without Professional or VocationalTraining or Pervious Work Experience 220540 426948 517018 547782 461022 563410 635670
Total 359255 591423 697905 785408 663775 802581 901335
Growth Rate 3.4419039
Source: Director of Employment, Haryana
TABLE 5.24
Work Participation Rate by Economic Activity in Haryana
Area Total Male Female
Work Participation Rate Total 39.62 68.22 31.78Rural 42.93 63.33 36.67Urban 31.49 84.63 15.37
Main Work Participation Total 29.52 23.33 6.19Rate Rural 30.07 22.79 7.28
Urban 28.16 24.65 3.51
Agricultural Workers as Total 51.29 30.71 20.58% of Total Working Rural 64.83 38.67 26.16Population (Agricultural Urban 5.93 4.04 1.89+ Cultivators)
Cultivators as % of Total 36.03 32.47 43.67Total Working Rural 45.85 44.34 48.47Population Urban 3.11 2.7 5.33
Agricultural Labours as Total 15.27 12.55 21.1% of Total Working Rural 18.98 16.73 22.87Population Urban 2.83 2.07 6.97
Non-Agricultural Total 48.71 69.29 79.42Workers as % of Total Rural 35.17 61.33 73.84Working Population Urban 94.07 95.96 98.11
Household Industries Total 2.56 2.31 3.11Workers as % of Total Rural 2.17 1.94 2.57Working Population Urban 3.88 3.23 7.43
Other Workers as % Total 46.15 52.68 32.12of Total Working Rural 33 36.99 26.1Population Urban 90.19 92 80.27
Marginal Workers as Total 10.1 6.89 13.84% of Total Working Rural 12.86 8.19 18.24Population Urban 3.33 3.7 2.89
Source: Director of Employment, Haryana
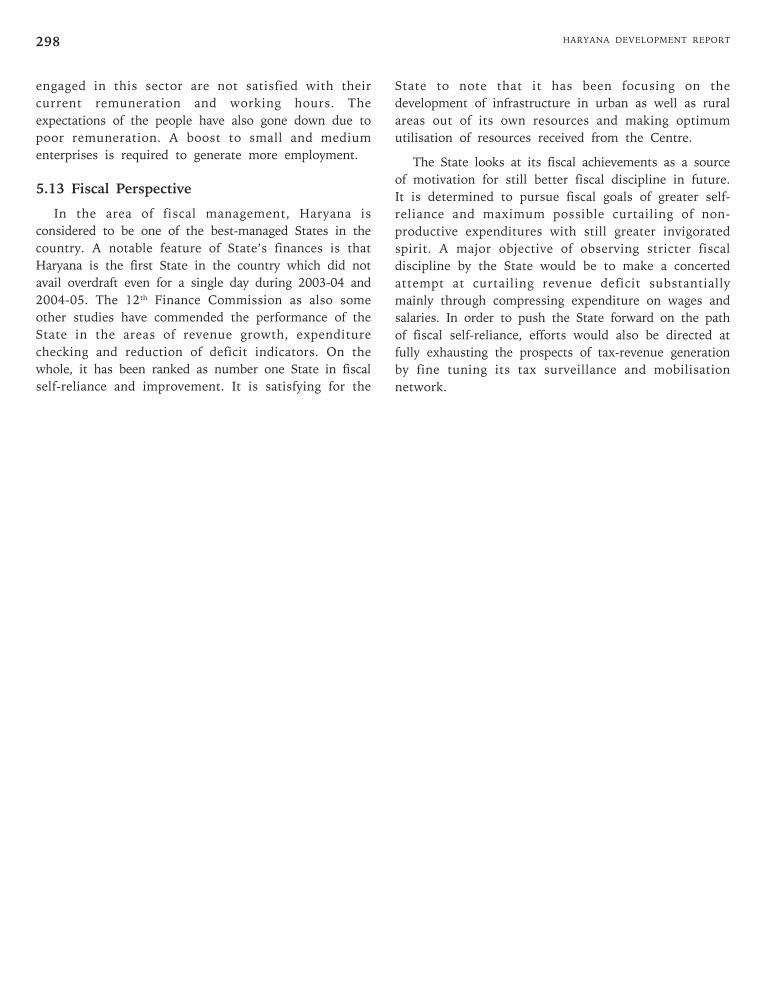
HARYANA DEVELOPMENT REPORT298
engaged in this sector are not satisfied with their
current remuneration and working hours. The
expectations of the people have also gone down due to
poor remuneration. A boost to small and medium
enterprises is required to generate more employment.
5.13 Fiscal Perspective
In the area of fiscal management, Haryana is
considered to be one of the best-managed States in the
country. A notable feature of State’s finances is that
Haryana is the first State in the country which did not
avail overdraft even for a single day during 2003-04 and
2004-05. The 12th Finance Commission as also some
other studies have commended the performance of the
State in the areas of revenue growth, expenditure
checking and reduction of deficit indicators. On the
whole, it has been ranked as number one State in fiscal
self-reliance and improvement. It is satisfying for the
State to note that it has been focusing on the
development of infrastructure in urban as well as rural
areas out of its own resources and making optimum
utilisation of resources received from the Centre.
The State looks at its fiscal achievements as a source
of motivation for still better fiscal discipline in future.
It is determined to pursue fiscal goals of greater self-
reliance and maximum possible curtailing of non-
productive expenditures with still greater invigorated
spirit. A major objective of observing stricter fiscal
discipline by the State would be to make a concerted
attempt at curtailing revenue deficit substantially
mainly through compressing expenditure on wages and
salaries. In order to push the State forward on the path
of fiscal self-reliance, efforts would also be directed at
fully exhausting the prospects of tax-revenue generation
by fine tuning its tax surveillance and mobilisation
network.
Chapter 6
Conclusions and Recommendations
HAR
YANA
6.1 Conclusions
The State of Haryana came into existence on 1
November 1966. Since then it has been achieving an all
round development. Its importance lies in the fact that 30
per cent of its total area, comprising the districts of
Faridabad, Mewat, Gurgaon, Rewari, Jhajjar, Rohtak,
Sonipat and Panipat, falls into the National Capital Region
(NCR) of India. Differently stated, 40 per cent of the total
area of the National Capital Region (NCR) is that of
Haryana.
In the 60s Haryana progressed rapidly with a growth
rate of 5.5 per cent per annum against the all India’s
growth rate of 3.0 per cent. In the 70s, while the national
average annual rate of growth increased from 3.0 per cent
in the 60s to 3.6 per cent, in case of Haryana it declined
from 5.5 per cent to 4.8 per cent. Haryana progressed
rapidly during the 1980s with an average annual growth
rate of 6.68 per cent as against all India’s growth rate of
5.60 per cent. In the 1990s Haryana grew at an average
annual rate of 6.71 per cent as against all-India’s growth
rate of 6.03 per cent per annum. It is interesting to note
that during the overall period from 1980-81 to 1990-2000,
Haryana recorded the highest growth rate of 7.80 per cent
per annum in the country as against all India’s growth
rate of 5.66 per cent per annum. In the years 2000-01,
2001-02, 2002-03, 2003-04, 2004-2005 and 2005-06 the
rate of growth in the State has been 6.8, 5.4, 5.0, 8.6, 8.4
and 8.5 per cent, respectively.
The State of Haryana achieved the fastest acceleration
in secondary sector growth during 1980s with an average
annual growth rate of 15 per cent. However, in the 1990s,
this annual growth rate declined to 8.37 per cent. During
the period 1981-2000, as a whole, the fastest acceleration
in the secondary sector growth in India took place in
Haryana with an average annual growth rate of 12.58 per
cent. In the years 2000-01, 2001-02, 2002-03, 2003-04,
2004-05 and 2005-06 the rate of growth in the secondary
sector has been 5.7, 5.7, 4.1, 7.7, 8.1 and 8.3 per cent,
respectively.
As regards the tertiary sector, in the 1980s Haryana
had an average annual growth rate of 7.49 per cent. In the
subsequent decade of 1990s it increased to a growth rate
of 8.38 per cent. In the years 2000-01, 2001-02, 2002-03,
2003-04, 2004-05 and 2005-06 the rate of growth in the
tertiary sector has been 11.4, 9.3 10.0, 8.9, 11.8, and
12 per cent, respectively.
Haryana’s per capita SDP at constant prices (1993-94)
increased significantly during the 1980s and 1990s. In the
1980s, it grew by an annual average rate of 4.12 per cent
as against all India’s rate of 3.36 per cent. In the 1990s, it
grew by 4.42 per cent per annum as against all India’s
rate of 4.07 per cent. It is interesting to note that since
2002-03, with the exception of such small States as Goa,
Delhi, and Pondicherry, Haryana has been recording the
highest per capita NSDP in the country. In the years
2000-01, 2001-02, 2002-03, 2003-04 and 2004-05 the rate
of growth in the State has been 4.1, 2.7, 3.4, 7.1 and 7.1
per cent, respectively.
The economy of the State has undergone major
structural changes. There has been a shift from the
primary sector to secondary and tertiary sectors. At
constant (1993-94) prices, the share of primary sector has
declined from 42.5 per cent during 1993-94 to 28.2 per
cent during 2004-05. The share of secondary sector has
increased from 26.2 per cent to 27.4 per cent over the
same period. Likewise, the share of tertiary sector has
increased from 31.3 per cent to 44.4 per cent.
The high rate of economic growth in the State has
been accompanied by a reduction in poverty. There has
been an appreciable decline in the percentage of
HARYANA DEVELOPMENT REPORT300
population below the poverty line from over 35 per cent
in the 1970s to less than nine per cent in the late 1990s.
An encouraging trend that emerged between 1993-94 and
1999-2000 in the State is that rural poverty decreased
much faster than urban poverty. The population below
poverty line in rural Haryana has significantly declined
from 28.02 per cent in 1993-94 to 8.27 per cent in 1999-
2000 as against all India’s average figure of 27.09 per
cent. There have been improvements in the social
indicators as well. The literacy rate has increased from
almost 26 per cent in 1971 to 68 per cent in 2001.
Agriculture can occasionally be a leading sector in
economic growth, either on the basis of a spurt in
agricultural productivity or on the basis of cash crop
exports. In the case of Haryana, agricultural-productivity-
led growth occurred in one major historical period, the
Green Revolution, dated from 1965-66 to the early 1980s.
The Green Revolution was centered on short stemmed,
high yield wheat, and to a lesser extent paddy rice, with
both crops depending on irrigation and intensive
application of fertiliser. Haryana, alongwith Punjab, was
the epicentre of the Green Revolution in India.
The agricultural sector in the State has a direct bearing
on overall growth, income levels and well-being of the
people. Change in agricultural productivity overtime in the
State is a good index of the progress made in this vital
sector by the State, and the consequent fall out on the
State’s economy. Haryana recorded very high rate of
growth in agricultural productivity. The trend in increase
in agricultural productivity of the State corresponds fairly
closely to the trend of rapid decrease in population below
the poverty line of the State.
The agricultural production index in Haryana has
increased from 106.37 in 1980-81 to 243.42 in 2004-05.
Apparently, the increase in production was due almost
entirely to increase in yield. The yield index almost
doubled over this period. Whereas the non-food grains
index increased from 104.72 to 318.73, the index of food
grains increased from 107.02 to only 217.72, over the
period 1980-2005. And, within food grains, the index of
cereals grew up sharply from 103.89 to 245.20 and of
pulses declined steeply from 125.54 to 27.50 over this
period. As a result of higher production of foodgrains the
State of Haryana is one of the largest contributors of
foodgrains to the central pool. In 2005-06 the
contribution of Haryana in the procurement of wheat was
30.60 per cent of the total procurement made in the
country and it was next only to Punjab whose share was
60.90 per cent. Similarly, Haryana has also been
significantly contributing in the procurement of rice in the
country. Whereas the all India average yield per hectare in
respect of wheat and rice during 2003-04 was 2713 and
2077 kilograms, respectively, in Haryana the
corresponding yield was 3937 and 2749 kilograms.
Haryana is emerging very fast as one of the leading
States in the field of Horticulture. The main thrust is
being given for the development on floriculture and
mushroom apart from fruits and vegetables. In 1990-91,
the area under fruits stood at 12,640 hectares producing
99.8 thousand tonnes. These figures increased to 24,071
hectares and 247.6 thousand tonnes, during 2004-05.
Likewise, during this period the area under vegetables
increased from 55,360 hectares in 1990-91 to 2.08 lakh
hectares in 2004-05, and the production increased from
8.02 lakh tonnes to 27.67 lakh tonnes. The area under
floriculture has also increased from 50 hectares in 1990-
1991 to 4810 hectares in 2004-05. This period also
witnessed remarkable growth in mushroom production
which increased from 850 tonnes to 6163 tonnes.
A matter of serious concern today is that the
agriculture scene in Haryana is dominated by paddy-wheat
rotation. It is causing degradation in soil fertility and
further fall in the underground water level. No significant
achievement has been made in respect of crop
diversification.
The livestock sector by contributing milk, eggs and
meat to the food basket plays a critical role in fulfilling
the animal protein requirement of the people. Livestock is
one of the important components of primary sector of the
economy and there still exists a substantial scope for
growth in this sector. Haryana is the milk pail of India
and is famous for its breed of “Hariana Cows” and
“Murrah Buffaloes”. The State government is laying
emphasis on increasing the production capacity of the
animal through genetic improvement of the animals.
Great stress is being laid on the improvement of breed of
the cattle and buffaloes to increase the milk yield through
artificial insemination with exotic and other improved
semen.
Salt affected land, scrub land, waterlogged land, barren
land and sandy area constitute the main wasteland in the
State. The majority of salt-affected lands are associated
with waterlogged areas. These are mainly spread over the
central and southern parts of the State. Absence of natural
drainage outlet and use of poor quality ground water for
agriculture purpose render highly fertile soils salt affected.
Barren lands are generally associated with Aravalli ranges.
Land becomes barren with scrub due to loss of soil
fertility caused by waterlogging and poor quality of
ground water. Sandy areas in the form of sand dunes are
Chapter 6 •
CONCLUSIONS AND RECOMMENDATIONS 301
mainly located in areas bordering Rajasthan State. Arid
climate with no irrigation facilities rendered the soil
unproductive with development of barren sand dunes.
About 70 per cent area of the State has marginal to saline
ground water.
Canal water is main source of irrigation as well as
domestic supplies to the State. The availability of water
from both the sources, that is, surface and sub surface, is
much below the requirement. Whereas the supply of
surface water is more or less constant with a small
variation depending upon water level in the Bhakra and
Pong reservoirs and the flow of water in river Yamuna,
the availability of sub surface water is declining due to
more withdrawal than its recharging. Canal irrigated area
in Haryana in 2004-05 has been 48 per cent of the total
net area irrigated. The share of tubewells in total irrigated
area has been increasing continuously. It was 50.5 per
cent of total net area irrigated in 2004-05. The area under
irrigation, as percentage of gross area sown was 84 per
cent in 2004-05.
Being an alluvial formation, the State has very little
mineral wealth. Iron ore, limestone and slate are the only
three principal minerals economically exploited at present.
Other minerals are lime, kankar, china clay, dolomite,
quartz and silica. Limestone and kankar are used in
cement manufacturing. The Geological Survey of India has
estimated the resources of crystalline limestone to be of
the order of 17.5 million tonnes. Slate is found in Rewari,
Mahendragarh and Gurgaon districts. Iron ore reserves are
of the order of five million tonnes. The ore is of high
grade, varying from 50 per cent to 65 per cent in iron
contents.
The proximity of villages to the administration centres
enhances their growth potential. The inconveniences, if
any, faced by the villagers are readily reported and
consequently the probability of introducing corrective
measures is usually higher. The access to various places of
the economy determines substantially the performance
and efficiency of the government. Absence of access
signifies prevalence of a self-reliant village economy
having little development opportunities and low growth
potential. Increasing access augments the possibility of
diversification and higher growth. The villages located in
Haryana are most effectively connected with rest of the
economy. The infrastructure level of the villages, both
social and physical, is extremely important in the
realisation of development potential. In this regard
Haryana is among the best performing large States.
At the time of formation of the State, Haryana had
only 162 large and medium indutrial units. Now, by the
end of 2005, this number has grown to 1260. At present,
these units are operating with capital investment of more
than Rs.22,000 crore, employing more than 2 lakh
persons and producing goods worth Rs.12,800 crores. The
export amount which was only Rs.4.5 crores in 1966 has
crossed Rs.20,000 crore in 2004-05. During the period
August 1991-May 2001, as many as 206 fully export-
oriented units were established in the State alone which
constituted 5.59 per cent of the total such units in the
country. Industrial Model Township, Manesar near
Gurgaon has already become the destination of many
multinational companies. The area between Kundli and
Sonipat town falls under a highly industrialised zone. A
multi-functional complex is also being developed at
Kundli. It is in this complex that export promotion
industrial park, food park, cold chain complex have been
developed by the HSIIDC. Industrial Growth Centre at
Bawal has also emerged as the destination of multi-
national companies.
Haryana’s index of industrial production is far above
the all India average. Haryana today produces more than
50 per cent of passenger cars, 25 per cent of tractors, 50
per cent of motor cycles and 50 per cent of refrigerators
manufactured in the country. About 25 per cent of India’s
total production of sanitary-ware is from Haryana. One
out of every four bicycles in the Country is manufactured
here.
The number of large and medium units in the State
has increased from 162 in 1966 to 1290 by June 2006.
The growth of small industries in the State has also been
phenomenal. Their number has increased from 4500 in
1966 to 80,000 today. They are producing goods worth
Rs.4500 crore per annum while generating employment
for 8.7 lakh persons. 20 per cent of the country’s total
export of scientific instruments, 60 per cent of the
demand of ammunition boxes of the country’s defence
forces and 60 per cent of the total needs of woolen
blankets of the Indian army are met by small units of
Haryana. Haryana’s small scale sector also enjoys the
reputation of manufacturing the largest number of
electrical mixies and gas stoves in the country.
Engineering goods, chemicals, software, handloom
products, agro-based lamps, scientific instruments, leather
products, automobiles and tractors are exported from
Haryana.
State Government has formulated new industrial policy
in June 2005. The basic objective of the policy is to
develop and promote industries and to create employment
opportunities in the manufacturing and service sector.
This policy has three pronged strategy. The first is to
HARYANA DEVELOPMENT REPORT302
develop infrastructure, the second is to provide incentives
and concessions to the industry in backward/rural areas in
order to check exodus of rural population to the urban
areas and the third is to simplify the rules and regulations
making investment procedure easy and hassle free.
Under the Government of India Schemes, three cluster
development projects, Panipat for textiles, Gurgaon for
Automobiles and Faridabad for Light Engineering are
under consideration. Government is considering to set up
Central Institute of Plastic and Engineering Technology in
collaboration with the Government of India to promote
and develop plastic industry in Haryana. State
Government has approached the Government of India,
Ministry of Food Processing for establishing National
Institute for Food Technology Management besides one
mega food park in Haryana. This will boost agro-based
food processing industry in the State. Also, in the private
sector the first irradiation food park has been set up at
Bahalgarh in district Sonipat. This food park would prove
a boon for exporters and the farmers as the agricultural
products, food items, vegetables, fruits, onions, potatoes,
pulses, basmati rice, wheat flour and other edible products
would be preserved by using irradiation technology.
In an excellent recent study Veeramani and Goldar
(2005) place various States under three distinct categories
of investment climate (IC) scenarios for the purpose of
determining total factor productivity (TFP) estimates in
the manufacturing sector in these States. The TFP
estimates have been based on both value added function
as well as, gross output function. In this study Haryana
has been classified under the ‘good investment climate’
category alongwith States like Gujarat, Andhra Pradesh,
Karnataka and Punjab. It is satisfying to note that Haryana
occupied no less than second position for most part of the
period, 1980-81 to 1999-2000, in respect of TFP
performance. This adequately brings out the extent of
efficiency prevailing in the manufacturing sector of the
State.
The State of Haryana has been able to attract sizeable
investment from multinational companies, large business
houses, foreign investors, non-resident Indians and small
scale entrepreneurs. Haryana is an investor friendly State
and offers a rich reservoir of skilled, motivated and
relatively low cost manpower with a good infrastructure
and harmonious industrial relations. The State has about
1000 projects with foreign technical financial
collaboration.
Technical manpower is essential input for
industrialisation, modernisation, promotion of trade and
business. Technical manpower is also required for
research and development. Technically qualified persons
can also set their own business and get self-employed. By
the end of year 2001-02, there were 29 degree level
Engineering Institutions and 29 diploma/post diploma
level Institutions. In 2004-05 there were 124 institutions
offering Engineering /MBA/MCA/BHM and CT and
M.Tech Programmes with an annual intake of 18,834
students. The number of Polytechnics was 38 with annual
intake capacity of 8,640 students. The intake capacity in
degree courses in engineering colleges in the State was
10,631 students.
The Human Development Index (HDI) for the country
as a whole has improved from 0.302 in 1981 to 0.472 in
2001. The HDI for Haryana has improved from 0.360 in
1981 to 0.509 in 2001. As per HDI Haryana was ranked at
15 in 1981, 16 in 1991 and 5 in 2001.
A reduction of gender inequality in access to resources
and opportunities leads to an increase in the rate of
economic growth, which, in turn, is poverty reducing. This
is because of the fact that greater gender equality enables
women to take up income earning opportunities, and
participate in the growth process. Gender disparities are
very closely associated with poverty levels. For example,
improving women’s access to education or land in rural
areas is likely to lead to a significant increase in
agricultural productivity. In addition, lower gender
disparities increase women’s power to allocate family
resources. This benefits children’s health and education,
inducing a reduction in inter-generational poverty.
Furthermore, gender equality in access to education helps
to reduce infant mortality and fertility. Significant steps
have been taken in this direction in Haryana and its
women are much more empowered now than in the
1960s or 1970s. The State has been implementing various
schemes for the socio-economic advancement and
development of women in the State to eliminate all types
of discrimination against women and the girl child and
ensure empowerment and gender justice for them. But
the declining sex ratio in the State is of particular concern.
Improvement in the health status of the population has
been one of the major thrust areas in social development
programmes of the State. This was to be achieved through
improving access to health services with special focus on
under developed and under privileged sections of the
society. The infant mortality rate (IMR) is considered to
be a sensitive indicator of not only the health status of the
population but also the level of human development in
the context of education, economic conditions, nutrition,
etc. Poverty, malnutrition, a decline in breastfeeding and
inadequacy or lack of sanitation are all associated with
Chapter 6 •
CONCLUSIONS AND RECOMMENDATIONS 303
high infant mortality. High infant mortality and high
fertility are related concepts. Haryana has registered
declining infant mortality rates over the period 1971-2001.
But there is cause for concern over the higher IMR for
female children than for male children in Haryana.
Life expectancy at birth or longevity is an overall
indicator of the economic and social well-being of the
people. As a society advances, the life expectancy of its
people also increases. Haryana is one of the top four
States, after Kerala, Punjab and Maharashtra, in this
regard.
The decadal growth rate of population of Haryana was
28.43 per cent in 2001. This growth rate of population
continues to be high for the State. The population
situation calls for urgent attention. However, this higher
growth rate can be attributed to some extent to
substantial migration as well.
A total fertility rate (TFR) = 2.1 is considered to be
the replacement level of fertility, which needs to be
achieved in all States for population stabilisation. In case
of Haryana, TFR was 3.3 in 1998 which is much higher
than most of the States in the country.
In Haryana total dependency ratio in 2001 was 770
which was much higher (886) in 1991. In case of young,
it was 637 and for old 133 in 2001 and the respective
figures in 1991 were 741 and 145. This means that the
young as well as old dependency ratio in the State has
decreased.
The total work participation rate of Haryana in the year
2001 was 39.62 per cent, of which 42.93 per cent was in
rural areas and 31.49 per cent in urban areas. Agricultural
workers constituted 51.29 per cent of the total working
population of the State in 2001. Cultivators constituted
36.03 per cent of the total working population.
Agricultural labour constituted 15.27 per cent of the total
working population. The percentage of non agricultural
workers in the total working population was 48.71. This
percentage was 35.17 in rural areas and 94.07 in urban
areas. It clearly shows that in rural areas people are
mostly dependent on agricultural activities while in urban
areas people are mostly dependent on non-agricultural
activities.
In 1987-88, in Haryana, the per cent shares of primary,
secondary and tertiary sectors in total employment were
58.90, 12.70 and 28.40, respectively, as against the
corresponding all-India average figures of 58.82, 10.85
and 30.33. This position has altered in favour of the
tertiary sector over the subsequent period. 12 years later,
in 1999-2000, the per cent shares in employment of
primary, secondary and tertiary sectors stood at 45.15,
12.45 and 42.40, respectively, in Haryana and at 52.43,
10.87 and 36.71, respectively, at the all-India level.
Apparently, whereas in 1987-88, the contribution of
tertiary sector in Haryana was below the national average,
this position changed fast to not only far exceed the
average all India level but also place Haryana among the
top ranking States by enabling it move up from twelfth to
sixth rank. This is a particularly impressive performance
when we observe that among the three top ranking States
are the smaller States of Delhi, Tripura and Pondicherry.
Among the major States, Haryana (42.40 per cent) had
only Kerala (49.76 per cent) and Punjab (43.22 per cent)
ahead of it in this regard.
Haryana with less than 5 per cent unemployment rate
may be ranked among the low level unemployment States
particularly when we compare it with States like Kerala
(19 to 22 per cent), West Bengal (10 to 17 per cent),
Tamil Nadu (9 to 13 per cent), Assam (7 to 12 per cent)
and Bihar (7 to 10 per cent).
Balanced regional development of different parts of the
State, extension of the benefits of economic progress to
the less developed regions and widespread diffusion of
industries are among the major aims of planned
development. Successive Five Year Plans seek to realise
these aims. Balanced regional development, as far as
possible, must go together with fast economic growth if
the latter has to be really meaningful. In striving for such
a balance, certain inherent difficulties have to be met.
Sometimes the sense of lagging behind in development
may be due to inadequate or tardy development of specific
fields such as agriculture, irrigation, power, industry,
employment, education, etc. This is the case with Haryana
also where there are regions which are less developed
than others. There are regional disparities in the State as
regards irrigation. Recently the State Government has
declared 88 areas in the State as industrially backward.
There are regional disparities in the industrial
development of various parts of the State. While in 2003
there were 2567 registered working factories employing
1,86,638 workers in Faridabad district, there were only 60
such factories employing 4,250 workers in Mahendragarh
district. The lowest number of industrial workers is in
Kaithal district where 124 factories employed 2,710
workers. Similarly in Kurukshetra district 3,163 workers
are employed in 164 working factories, in Fatehabad
3,723 workers are employed in 117 factories. On the
other hand, more than one lakh people are employed in
1,031 factories in Gurgaon district and about 40,000
workers are employed in 1238 factories in Yamuna Nagar
HARYANA DEVELOPMENT REPORT304
district. In Panipat district 35,813 workers are employed
in 741 factories, in Sonipat district 29,440 workers are
employed in 528 factories and in Karnal district 27,879
workers are employed in 449 factories.
Another indicator of regional disparities is the
percentage of urban population. In Faridabad district
55.63 per cent population live in urban areas, followed by
Panchkula (44.47 per cent), Panipat (40.51 per cent) and
Yamuna Nagar (40 per cent) districts. On the other hand
the urban population of Mahendragarh district is only
13.46 per cent followed by Fatehabad (17.63 per cent),
Rewari (17.82 per cent), Bhiwani (18.97 per cent) and
Kaithal (19.36 per cent) districts.
The State of Haryana seems to be a late entrant on the
tourism map of India. Though the development of
tourism in the State is not less than an achievement
keeping in view the fact that now the State has 43
vacation spots or holiday stop-overs where there was none
in the early seventies but with the advent of socio-
economic changes particularly after the 90s the
achievement is no longer a solace provider.
The industrialisation in Haryana has witnessed a
polarised growth mainly in the areas of Gurgaon and
Faridabad districts whereas the other districts, despite
government’s concerted efforts, could not evoke the same
response. The ‘Delhi factor’ i.e. close proximity of these
areas to Delhi metropolitan put them in advantage over
other areas. Delhi, being a highly urbanised and
industrialised center qualifies to be treated as the potential
tourist producing market and the Haryana tourism has
been greatly benefited by this character of Delhi city.
Highway tourism is the most popular type of tourism in
Haryana, the major resource for that comes in the form of
Highways passing through the State. Five most important
National Highways pass through the State.
These highways are emerging as centres of development
in the State because of increase in traffic on them and
resulting in complex interplay of a number of economic
factors. Technically, the highway tourism is not consistent
with the conventional definition of tourism, which is
primarily based on the components of accessibility,
accommodation and attraction. Rather highway tourism
signifies the availability of certain facilities for the tourists
who commute between two destinations. These facilities
range from food, entertainment, recreation, roadside
attractions to shopping malls, petrol stations, medical
facilities etc. In a way, these highways are emerging as the
new mini markets or the destinations, the driving on which
is becoming an attraction.
Further, Haryana has also been promoting Cultural
tourism through Surajkund Craft Fair, Mahabharat
Festival at Kurukshetra and Kartik Festival at Ballabgarh.
Tourists in the State are being enthralled by various
dances such as Phag, Loor, Jhoomer, Khora, Daph, Gugga
dance, etc. Pilgrimage tourism at many places like Jyotisar,
Pehowa, Pandu-Pindara, Kapal Mochan, etc. are also
attracting tourists in the State.
The establishment of IT Kiosks is a profitable business.
The profitability increases with more and more number of
databases attached to the IT Kiosk centres. The
governments are generally slow in preparing the databases
that leads to the increase in project completion time
causing increased costs and seriously hurts the viability of
business. Haryana government should outsource all
activities of preparing and maintaining of databases to
private parties. Even the services to the citizens should
also be provided by the private parties. The government
officials can be used for validating and authenticating the
information sold to the users. Strict quality standards
should be established for providing easy, timely, cost-
effective and reliable service to the IT Kiosk users.
The State of Haryana has decided to set up four Agro
parks/food parks at Narwana, Dabwali, Saha and Jhajjar.
In these food parks integrated services shall be provided
to food processing units with special emphasis on
exporting units.
Haryana has decided to pay special attention to the
growth of exports in traditional areas viz. handloom
products and carpets, scientific instruments, metal ware
and utensils, ceramics, etc. Steps would be taken to
modernise the production process, providing facilities for
design development and quality upgradation, encourage
production diversification in accordance with the changing
demand in importing countries, establishment of trade
centres with integrated facilities, set up special institutes
to meet training needs in the areas and provide quality
testing facilities etc.
The State of Haryana has gone ahead in implementing
the decentralisation in rural as well as urban areas. With
the objective of enhancement in the development process
and to strengthen the democratic system a good number
of powers (administrative and financial) along with the
funds, have been delegated to Panchayati Raj Institutions
(PRIs) and the Urban Local Bodies (ULBs).
The State is not far behind in putting its effort for the
efficient delivery of services and transparency in the
system. The tool of e-governance is being utilised for the
Chapter 6 •
CONCLUSIONS AND RECOMMENDATIONS 305
socio-economic development in the State. Therefore, the
State government is making all its efforts for the
promotion of Information Technology sector.
In the area of financial management, Haryana is one of
the best managed states in the country. The notable
feature of State finances is that Haryana is the first State
in the country which has not availed of overdraft even for
a single day during 2003-04 and 2004-05. The 12th
Finance Commission of India has also commended the
performance of Haryana in the areas of revenue growth,
expenditure checking and reduction of deficit indicators.
The State has been focusing on the development of
infrastructure in urban as well as rural areas out of its
own resources.
As regards the deficit position, Haryana has, on the
whole, performed much better as compared to most other
States. With its GFD/GSDP ratio equal to just 1.8 per
cent, it stands at the top among all States. Similarly, with
regard to PD/GSDP ratio, it is the only State which has a
negative value for this ratio. As regards the other deficit
ratios, the State occupies fifth position on the basis of
RD/GSDP ratio and seventh position on the RD/RR ratio
criterion. In sharp contrast to these achievements, it
stands among the bottom three States when compared on
the RD/GFD ratio basis. Its revenue deficit position is a
matter of serious concern and requires greater, concerted
action particularly on the expenditure side of the revenue
account.
As regards the State’s own tax and non-tax revenue
position, it ranks among the top six States on the ONTR/
GSDP ratio criterion, and bottom four States on the OTR/
GSDP ratio basis. On the whole, considering both own tax
and non-tax revenue together, the State figures among the
top four States which is a measure of its relatively
satisfactory performance in the direction of achieving self-
reliance in resource generation.
In respect of non-developmental expenditure, the State
may be said to be among the top five States which are
spending a relatively lesser proportion of their GSDP for
non-developmental purposes. But as regards
developmental expenditure, the State’s performance is
highly disappointing as it ranks among the two States at
the bottom. The same is true in respect of social sector
expenditure and capital outlay as well where it has all
States ahead of it.
Haryana figures among the top three States showing
excellent performance on the basis of DEBT/GSDP ratio.
It is ranked among the top seven States which are
spending a relatively lesser proportion of their revenue
receipts for interest payments as compared to other
States.
The indices of Fiscal Self Reliance and Improvement
given by 11th Financial Commission and the 12th Financial
Commission show that during the period 1990-1999
Haryana was placed at 11th rank. But during the period
1993-2003 Haryana attained the first rank in the country.
This shows excellent performance by the State in
achieving fiscal self-reliance and improvement.
But still there is much more growth potential in
Haryana than has been achieved to date.
6.2 Recommendations
1. The NCR area of the State needs to be extended
to the radius of 125 kilometers or so from the
border of Delhi State and within this area world
class infrastructure needs to be created.
2. In order to improve the conditions of farmers the
State economy needs to be diversified with
progressive shift of population from agriculture to
secondary and tertiary sectors; policy of
corporatisation of agriculture through contract
farming be introduced; and big corporations in
agro-business be involved. The farming
community needs to be involved through
cooperative activities in agriculture production,
processing and marketing. In order to eliminate
poverty in the State an accelerated growth rate
(GSDP) of about 10 per cent is required
3. To realise Haryana State’s full share of Ravi-Bias
water, the Satluj-Yamuna Link (SYL) canal needs
to be completed at the earliest. Necessary steps
need to be taken for the conservation and better
management of surface water, rain water
harvesting, and recharging of ground water and
improvement of sub-soil water level in the State.
Steps should also be taken to popularise drip
irrigation system particularly for quality
improvement and early ripening of horticultural
produce. Necessary steps need to be taken to
bring the entire sown area under irrigation
4. Since the existing paddy-wheat rotation in the
agriculture sector in the State is causing
degradation in soil fertility and further fall in the
ground water level, there is an urgent need of
crop diversification in the State. The cultivation of
Jatropha and the setting up of Jatropha based bio-
diesel units in the State should be given priority.
The State should also promote agro-based
HARYANA DEVELOPMENT REPORT306
industries. Efforts should be made to set up
public investment in extended agriculture in
terms of accelerating the switch from cereals to
oilseeds and pulses, horticulture, floriculture,
fishery, bee keeping, and cultivation of medicinal
and energy plants.
5. Accurate mapping of ground water zones as per
their suitability for domestic, irrigation and
industrial uses is highly desirable for proper
management of ground water resources and to
safeguard human beings from consumption of
poor quality ground water. To check further
deterioration in the quality of ground water in the
State, regular monitoring of their chemical quality
is necessary.
6. Infrastructure in the State, be it irrigation, power,
roads, dry ports, airports or any other sector,
needs the massive overdose of restructuring and
investments. In order to bridge the demand-
supply gap of electricity, necessary steps need to
be taken to set up power generation plants. Steps
need to be taken for the electrification and
construction of new rail tracks and ring rail along
the Kundli-Manesar-Palwal (KMP) Expressway in
the State. There is a necessity for four laning of
all the State and national highways passing
through the State and strengthening and widening
of all link roads in the State. Special emphasis
should also be given for the construction of fly
overs and rail over bridges. Airports and dry ports
need to be set up and developed in the State.
7. The State should take necessary steps for the
metro rail links from Delhi to Faridabad, Delhi to
Gurgaon, Delhi to Bahadurgarh, Delhi to
Kharkhoda and Delhi to Sonipat. Kharkhoda
town, which is only seven kilometers from Delhi,
needs to be fully developed as a modern
residential and industrial town. Kharkhoda is full
of development potentials.
8. Highly specialised courses at post graduate/under
graduate/diploma level need to be introduced in
emerging areas like Nano Science and technology,
VLSI Design and embedded systems, Integrated
product Design and Manufacturing, Print and
Graphic communication, Optical Engineering,
Product Design, Mechotronics and Aircraft
Maintenance Engineering, etc.
9. Since tertiary sector holds the promise of being
the major source of employment generation, it
should be the endeavour of the State policy to
accord special priority to the fullest exploration of
its employment potential. The performance of the
tertiary sector has been quite satisfactory during
the Tenth Plan period. It recorded a growth rate
of 10 per cent in 2002-03, 8. 9 per cent in 2003-
2004, and 11.8 per cent in 2004-05, which is
quite close to the targeted growth rate of 10.3 per
cent fixed under the Plan. Given the vast growth
potential of this sector, it appears quite within
the reach of the State to push this rate to around
12 per cent (by 2012) which incidentally happens
to be the nearest proximation of the highest rate
fixed under the Tenth Plan for Karnataka, the top
leading State in this respect. There is a need to
take necessary steps to boost the service sector
including information technology, biotechnology
and tourism.
10. Haryana is one of the few States in India whose
decadal growth rate of population has showed
almost a negligible change over the last three
decades. It is a matter of great concern for the
State and requires an in-depth analysis of its
socio-economic genesis.
11. The sharply declining sex ratio in the State is a
matter of serious concern. It is important to
identify the specific areas of the State where the
problem is particularly alarming. It needs to be
tackled with appropriate, effective and sustainable
measures. This problem cannot be approached
simply in terms of raising literacy rates and
providing pecuniary incentives. The Census 2001
data on sex ratio and literacy rates pertaining to
67 Tehsils of Haryana brings out the fact that sex
ratio and literacy rate are rather inversely related.
For instance, the sex ratio has been recorded the
highest in respect of Tehsils of Punahana (910)
and Ferozepur Jhirka (902) even as these have
the lowest literacy rates, 37.58 per cent and 40.61
per cent, respectively. As we come across areas of
population having increasing levels of sex ratio,
these areas tend to include low literacy areas in
an increasing proportion, and high literacy areas
in a decreasing proportion. This intriguing
phenomenon needs to be intensively probed to
find out the underlying reasons.
12. The State pollution control board should be held
accountable for any damage to the environment.
Its performance should be audited by an
independent agency like Centre for Science and
Chapter 6 •
CONCLUSIONS AND RECOMMENDATIONS 307
Environment (CSE) or Tata Energy Research
Institute (TERI) or N.E.E.R.I. The board should
collect detailed data on production, assimilation
and dispersion of pollution for different areas.
The marginal costs of pollution abetments should
be computed with the help of economists for all
industries, for all kind of pollutions—air, water
and solid waste.
13. Water provided through canals should be priced
according to the marginal productivity of water
for the crops. In many districts in Haryana the
underground water level has gone below even
more than 200 feet. Even the third layer of the
water has been exploited. Extraction rate of water
should be less than or equal to recharge rate.
Even if the total rain water is harvested, still the
underground water level recharge rate cannot
match the extraction rate. The crisis is hovering
on us, there is only one solution that is to
decrease the consumption of water. The State
needs to diversify into the crops which require
less irrigation. The technology can be the answer
to the problem. Dip irrigation system and
sprinkler systems can minimise the use of water.
14. The consumption of water in the urban areas for
domestic use has also been rising. Every urban
authority and local bodies providing water supply
service should install effluent treatments plants
(ETPs). Bio-intermediation processes and corral
cultivation for water purification can also be used.
15. A proper pollution tax should be imposed on the
industries comprising of a lumpsum tax, tax on
volume of water used, tax on volume of effluents
generated and separate tax for concentration of the
pollutants in the effluent water.
For controlling air pollution, the tradable permits
system should be introduced. The firms can
decide to buy a permit for pollution, pay a tax or
can pollute and face the litigation. If the firms
have a choice, they will minimise their costs by
choosing the right method. This will improve the
innovation in the pollution abatement technology.
Over a period of time, the firms will reduce the
costs and pollution both. Theoretically, it can be
proved that the marginal cost of pollution
abatement becomes equal to pollution tax and
equal to the price of permit in an efficient system.
Most of the air pollution is vehicular in nature. It
is a major problem of the cities. The
environmental laws should be strictly
implemented. Generally the motorists and vehicle
owners get the pollution-checked certificate after
paying a fee. The authorities use the fee as a
source of revenue generation not as a tool of
pollution control. The fee charged from the
vehicle owners should be according to the level of
emissions. This will force the vehicle owner to
use additional pollution control equipments or to
purchase less polluting vehicles.
16. The solid waste generated from the households
can be used for recycling, to make compost
fertilisers, energy production, bio-fuel production
or land-filling. The urban citizens should be
persuaded to keep three types of dustbins—one
for recyclable wastes, second for bio-degradable
wastes and third for plastic wastes. This
segregated solid waste can generate a lot of
employment.
17. For sustainable development the State should
follow Hartwick-Solow approach. It suggests that
the stock of capital could be held constant by
reinvesting all Hotelling rents from non-
renewable resources extraction in manmade
capital. Therefore, the State should ensure
investment equal to value of extracted mineral
every year in the search of new minerals.
18. There is possibility of substitution within the
different natural capitals. The manmade capitals
are also substitutable for each other but there is
little possibility of substitution between manmade
and natural capitals. So with every developmental
project, there is a definite loss of natural
environmental assets. To contain this loss, the
State should invest in a shadow project with
strong sustainability constraints.
19. The harvest levels of renewable resources should
be set less than or equal to population growth
rate for some pre-determined population size. For
all degradable pollutants assimilating capacity for
receiving eco-system should be established. The
waste discharges should be maintained below the
assimilation rates. The discharge of the
accumulative pollutants should be set close to
zero. All the earnings from non-renewable
extraction should be divided into an income
stream and an investment stream. The
investments stream should be invested on
renewable resources.
References
HAR
YANA
Abed, George T. and Sanjeev Gupta (2002). Governance, Corruption and EconomicPerformance, Washington D.C., Intentional Monetary Fund.
Agarwal, A.K. (2001). “Capacity Building in the Urban Sector: DecentralizedTraining in Karnataka”, in Good Urban Governance Campaign-IndiaLaunch Learning from one another, UNCHS (Habitat), New Delhi,September 4 to 6.
Agarwal, Bina (2001). “Participatory Exclusions, Community Forestry, andGender: An Analysis for South Asia and a conceptual Framework”,World Development , 29(10), pp.1623-48.
Aggarwal, S.C. (2004). “Labour Quality in Indian Manufacturing: A State LevelAnalysis”, Economic and Political Weekly, December 11.
Ahluwalia, Montek S. (2000). “Economic Performance of States in Post-Reforms Period”, Economic and Political Weekly, May 6.
———. (2002). “State Level Performance Under Economic Reforms in India”,in Anne O. Krueger (ed.), Economic Policy Reforms and the IndianEconomy. New Delhi: Oxford University Press.
Andrew, Mathew and J. Edgardo Campos (2003). “The Management of PublicExpenditures and its Implications for Service Delivery”, Backgroundpaper for the WDR 2004.
Arkinson, Anthony B. and John Micklewright (1991). “UnemploymentCompensation and Labor Market Transitions: A Critical Review”,Journal of Economic Literature 29(4), pp.1679-727.
———. (1992). Economic Transformation in Eastern Europe and the Distribution of Income.Cambridge, U.K.: Cambridge University Press.
Aschauer, David A. (1989). “Is Public Expenditure Productive?”, Journal ofMonetary Economics 23: 177-200, March.
Azaraya, V. (1994). "Civil Society and Disengagement in African", in J.W.Harbenson, D. Rothchild, and N. Chazan (eds.), Civil Society and theState in African 83-102. Boulder: Lynne Rienner Publishers, Inc.
Azfar, Omar, and Tugrul, Gurgur (2001). Does Corruption Affect Health andEducation Outcomes in Philippines? MD: University of Maryland, IRIS.
Balakrishnan, Suresh (2002). Citizens Report Cards, and Basic Services for the Poor.Bangalore: Public Affairs Centre. Processed.
Barbone, Luca and Domenico Marchetti, Jr. (1995). “Transition and the FiscalCrisis in Central Europe”, Economics of Transition 3(1): 59-74.
Barbone, Luca and Hana Polackova (Forthcoming). “Public Finances andEconomic Transition”, Policy Research Working Paper, CentralEurope Department, World Bank, Washington, D.C.
Bardhan, Pranab and Dilip Mookharjee (2002). Decentralizing Anti-poverty ProgramDelivery in Developing Countries. Berkeley, C.A.: University of Californiaand Berkely, Institute of International. Processed.
Barr, Nicholas (1992). “Economic Theory and the Welfare State: A Survey andInterpretation”, Journal of Economic Literature 30(2): 741-803.
———. (ed.) (1994). Labor Markets and Social Policy in Central and Eastern Europe: TheTransition and Beyond. New York and Oxford: Oxford University Press.
Basu, Amitava (2001). “Road Map for Municipal Reforms”, in Good UrbanGovernance Campaign-India Launch Learning from one another, UNCHS(Habitat), New Delhi, September 4 to 6.
Batista, I. (1994). "Civil Society: A Paradigm or a New Slogan?", The EcumenicalReview 46(1): 12-20.
Berg, Andrew (1993). “Measurement and Mismeasurement of Economic ActivityDuring Transition to the Market” in Mario I. Blejer, Guillermo A.Calvo, Fabrizio Coricelli and Alan H. Gelb (eds.), Eastern Europe in
Transition: From Recession to Growth?, World Bank Discussion Paper No.196. Washington, D.C.
Bhanumurthy, N.R. and Arup Mitra (2004). “Economic Growth, Poverty, andInequality in Indian States in the Pre-reform and Reform Periods”,Asian Development Review, 21(2), pp.79-99.
Bhattachary, B.B. and Arup Mitra (1990). “Excess Growth of Tertiary Sector inIndian Economy: Issues and Implications,” Economic and PoliticalWeekly, November 3.
Bhattacharya, B.B. and S. Sakthivel (2004). “Regional Growth and Disparity inIndia: Comparison of Pre- and Post-Reform Decades”, Economic andPolitical Weekly, March 6.
Bhide, S. and Ric Shand (1999). “Inequalities in Income Growth in India:Before and After Reforms”, South Asian Economic Journal, 1(1).
Blasi, Joseph R. (1996). “Russian Enterprises After Privatization”, Paperpresented at the ASSA meeting in San Franscisco, Calif, January.
Bohra, O.P. (1998). State-Local Fiscal Relation in India, National Book Shop andDolphin Publications, New Delhi.
Boora, S.S. (2002). "Tourism Development in Haryana", Journal of Haryana Studies34(1&2): 1-11, Jan-Dec.
Bose, Ashish (2005). “Beyond Hindu-Muslim Growth Rates: UnderstandingSocio-Economic Reality”, Economic and Political Weekly, January 29.
Calhoun, C. (1993). "Civil Society and the Public Sphere", Public Culture 5: 267-80.
Cashin, Paul and Ratna Sahay (1996). “Internal Migration, Centre-State Grants,and Economic Growth in the States of India”, IMF Staff Papers,43(1), March, pp.123-71.
Chakraborty, Debashis and Arup Gupta (2005). “How well are the VillageEquipped: Creating a Future Growth Potential Index at the StateLevel”, in Bibek Debroy and P.D. Kaushik (eds.), Energising RuralDevelopment through ‘Panchayats’, New Delhi, Academic Foundation.
Chandhoke, Neera (2003). “Governance and the Pluralisation of the State:Implications for Democratic Citizenship”, Economic and Political Weekly38(28): 2957-68.
Chauhan, U. and N. Lal (1999). “Public-Private Partnerships for Urban Poor inAhmedabad: A Slum Project”, Economic and Political Weekly, March 6-13.
Chowdary, T.H. (2002). “EPW Commentary”, September 21.
Clark, J. (1990). Democratizing Development: The Role of Voluntary Organizations. WestHartford, CT: Kumarian Press.
Dahrendorf, R. (1995). "A Precarious Balance: Economic Opportunity, CivilSociety, and political Liberty", The Responsive Community 5(1): 4-30.
Dasgupta, D., Pradip Maiti, Robin Mukherjee, Subrata Sarkar, and SubhenduChakraborti (2000). “Growth and interstate Disparities in India”,Economic and Political Weekly, XXXV(27), July 1.
Datta, Gaurav (1997). “Poverty in India and Indian States: An Update”, The IndianJournal of Labour Economics, 41(2).
———. (1999). “Has Poverty Declined Since Economic Reforms?” Economic andPolitical Weekly, 34(50).
Deaton, A., and J. Dreze (2002). “Poverty and Inequality in India: A Re-examination”, Economic and Political Weekly, September 7, pp.3729-48.
Deichmann, Uwe, and Somnik V. Lall (2003). “Are You Satisfied? CitizensFeedback and Delivery of Urban Services”, World Bank: WashingtonD.C. Processed.
HARYANA DEVELOPMENT REPORT310
Dev, S. Mahendra and C. Ravi (2007). “Poverty and Inequality: All India andStates, 1983-2005”, Economic and Political Weekly, XLII(6), February10-16, pp.509-21.
Development Planning Unit (SPARC)(2000). “A Journey Towards Citizens: TheByculla Area Resource Centre, Mumbai”, May.
Devoy, R. and K.R. Ghorpade (2000). “Financing Infrastructure: TheExperience of Urban Development Funds” in Singh and Tai (ed.),Financing and Pricing of Urban Infrastructure. New Delhi: New AgeInternational.
Dharmarajan, S. and R. Seth (1997). “Kudos for Haryana”, Tourism in India:Trends and Issues, New Delhi: Har-Anand Publications.
Dholkia, Archna (2005). “Measuring Fiscal Performance of States: AnAlternative Approach”, Economic and Political Weekly, July 30.
Director of Census Operations, Haryana (2001). Census of India 2001, Series-7,Haryana, Provisional Population Totals, Paper–2 of 2001,Chandigarh.
———. (2004). Census of India 2001, Haryana, Data Sheet, Chandigarh.
Dreze, Jean and Amartya Sen (2002). India: Development and Participation, NewDelhi, Oxford University Press.
Diaz-Albertini, J. (1993). "Nonprofit Advocacy in Weakly InstitutionalizedPolitical System: The Case of NGOs in Lima, Peru", Non-Profit andVoluntary Sector Quarterly 22(4): 317-37.
Edwards, Michael and David Hulme (1998). Non-Governmental Organisations:Performance and Accountability, London: Earthscan Publications.
Frantz, T.R. (1987). "The Role of NGOs in Strengthening of Civil Society",World Development 15 (Supplement): 121-87.
Fisher, J. (1993). The Road From Rio: Sustainable Development and the Non-GovernmentalMovement in the Third World. Westport, CT: Praeger Publishers.
Gauri, Varun (2003). “A Rights-Based Approach to Health Care andEducation”, Background Paper for the WDR 2004.
Gilson, L. (1997). “The Lessons of User Fee Experience in Africa”, Health Policyand Planning, 12(4), pp.273-85.
Government of Haryana (1997). Report of First Haryana Finance Commission.Chandigarh.
————. (2005). Economic Survey 2004-05. Chandigarh: Finance Department.
————. (2005a). Economic Survey of Haryana 2004-05. Chandigarh: PlanningDepartment.
————. (2005b). Statistical Abstract Haryana 2003-04. Chandigarh: PlanningDepartment.
————. (2006). Economic Survey of Haryana 2005-06. Chandigarh: PlanningDepartment.
————. (2007). Economic Survey of Haryana 2006-07. Chandigarh: PlanningDepartment.
Government of India (1992). Eighth Plan Document, Vol. I and II. New Delhi:Planning Commission.
————. (1997). Ninth Five Year Plan Document. New Delhi: Planning Commission.
————. (2000). Report of the Eleventh Finance Commission (for 2002-2005), June.
————. (2002). Tenth Five Year Plan (2002-2007). New Delhi: PlanningCommission, Government of India.
————. (2004). Report of the Twelfth Finance Commission (for 2005-2010).November.
————. (2005). Economic Survey 2004-05. New Delhi: Ministry of Finance.
————. (2008). Economic Survey 2007-08. New Delhi: Ministry of Finance.
Government of NCT of Delhi (2003). Report on Bhagidari Scheme, New Delhi.
Gray, Cheryl (1996). “In Search of Owners: Lessons of Experience withPrivatization and Corporate Governance in Transition Economies”,World Bank Policy Research Working Paper No. 1595. Washingtion DC:World Bank.
Haryana Tourism Corporation Ltd. (various years). Annual Reports. Chandigarh:Government of Haryana.
Ickes, Barry W. and Randi Ryterman (1995). The Organisation of Markets and Its Rolein Macroeconomic Stabilization During Transition. Working Paper.Pennsylvania: The Department of Economics, The PennsylvaniaState University.
International Institute for Population Sciences (2007). “NFHS-3 Fact Sheets:India and 29 states”, accessible at http://www.nfhsindia.org/factsheet.html.
James, K.S. and Sajini B. Nair (2005). “Accelerated Decline in Fertility in Indiasince the 1980s: Trends among Hindus and Muslims”, Economic andPolitical Weekly, January 29.
Jayal, Niraja Gopal (2001). “Reinventing the State: The Emergence of AlternativeModels of Governance in India in the 1990s” in Jayal and Pai(eds.), KDB (Kurukshetra Development Board) Report, 2000. Kurukshetra:KDB.
Krishna, K.L. (2004). “Patterns and Determinants of Economic Growth in IndiaStates”, Working Paper No.144. New Delhi: Indian Council forResearch on International Economic Relations.
Krishna N.J. (2000). “Widening Regional Disparities in India: SomeIndicators”, Economic and Political Weekly XXXV(7), February 12-18.
Kumar, A.K. Shiva (2007). “Why Are Levels of Child Malnutrition NotImproving?”, Economic and Political Weekly XLII(15): 1337-45, April 14.
Kurukshetra Development Board (KDB) (2000). Kurukshetra Development BoardReport, 2000. Kurukshetra.
Landell-Mills, P. (1992). "Governance, Cultural Change and Empowerment", TheJournal of Modern African Studies 30(4): 543-67.
Landim, L. (1987). "Non-Governmental Organizations in Latin America", WorldDevelopment 15 (Supplement): 29-38.
Leftwich, A. (1993). "Governance, Democracy and Development in the ThirdWorld", Third World Quarterly 14(3): 605-24.
Lehman, D. (1990). Democracy and Development in Latin America. Philadelphia, PA,Temple University Press.
Lin, Justin Yifu (2003). “Development Strategy, Viability, and EconomicConvergence”, Economic Development and Cultural Change 53(2): 277-308, January.
Lin, Justin Yifu, and Mingxing Liu (2003). “Development Strategy, Viability,and Challenges of Development in Lagging Regions”, Presented atthe World Bank’s Annual Bank Conference on Development Economics(ABCDE) held in Bangalore, India, May 21-22.
Lin, Justin Yifu, and Yang Yao (2001). “Chinese Rural Industrialization in theContext of the East Asian Miracle”, in Joseph L. Stight/and ShahidYusuf (eds.), Rethinking the East Asian Miracle, (Oxford: the OxfordUniversity Press), pp.143-195.
Martinussen, J. (1997). Society, State and Market: A Guide to Competing Theories ofDevelopment, London: Zed Books.
Meier, Gerald M. and James E. Rauch (2000). Leading Issues in EconomicDevelopment, New York: Oxford University Press.
Mishra, Yatish (2001). “Telecom Infrastructure in Rural India”, Indian Journal ofPublic Administration, Volume 47.
Nagraj, R., Aristomene Varoudakis and Marie-Anjee Veganzones (1998). “Long-Run Growth Trends and Convergence Across Indian States”, OECDTechnical Papers, No. 131, January, pp.1-58.
Nayyar, Gaurav (2005). “Growth and Poverty in Rural India: An Analysis onInter-State Differences”, Economic and Political Weekly, April 6.
Oklay, Peter et. al (1991). Projects with People: The Practice of Participation in RuralDevelopment, Geneva: International Labour Office.
Patel, Tulsi (2004). “Missing Girls in India”, Economic and Political Weekly,February 28.
Peet, R. and M. Watts (1993). "Introduction: Development Theory andEnvironment in an Age of Market Triumphalism", Economic Geography69(3): 227-53
Planning Commision (2001). National Human Development Report 2001, Governmentof India, New Delhi.
———. (2002). Tenth Five Year Plan 2002-2007, Government of India, New Delhi.
Patnaik, Utsa and Prabhat Patnaik (2001). “The State, Poverty, and Developmentin India”, in Niraja Gopal, Jayal and Sudha Pai (eds.), DemocraticGovernance in India: Challenges of Poverty, Development, and Identity, NewDelhi: Sage Publications.
Phadke, H.A. (1990). Haryana: Ancient and Medieval, New Delhi: HarmanPublications.
Pistor, Katharina (1995). “Law Meets the Market: Matches and Mismatches inTransition Economies”, The World Bank.
REFERENCES 311
Probe Qualitative Research Team (2002). “Healthcare Seeking Behaviour inAndhra Pradesh”, Probe Qualitative Research: Bombay.
Rao, M. Govinda, R.T. Shand and K.P. Kalirajan (1999). “Convergence ofIncomes across India States: A Divergent View”, Economic andPolitical Weekly, January 29.
Registrar General and Census Commission, India (2004). Census of India 2001,Series-1, India, Report and Tables on Age, Volume-1, New Delhi.
Ritchey-Vance, M. (1991). The Art of Association: NGOs and Civil Society in Colombia.Rosslyn: Inter-American Foundation.
Robinson, M. (1995), Strengthening Civil Society in Africa: The Role ofForeign Political Aid, IDS Bulletin 26(2): 70-80.
Sachs, Jeffrey D., Nirupam Bajpai and Ananthi Ramiah (2002).“Understanding Regional Growth in India”, CID Working Paper No.88, March, Center for International Development, HarvardUniversity.
Seligman, A.B. (1992). The Idea of Civil Society. New York: The Free Press
Shand, Ric and S. Bhide (2000). “Source of Economic Growth: RegionalDimensions of Reforms”, Economic and Political Weekly, October 14.
Vaidya, Chetan and Hitesh Vaidya (2002). “Management Innovations forMunicipal Resource Mobilization in India”, India Infrastructure,4(11), June.
Veeramani, C. and Bishwanath Goldar (2005). “Manufacturing Productivity inIndian States: Does Investment Climate Matter?”, Economic andPolitical Weekly, June 11.
Weyers, H. (1981). "Co-operation between Non-Governmental VolunteerServices and the United Nations Volunteers Programme", in DavidHorton Smith and Frederick Elikin (eds.), Volunteers, VoluntaryAssociation, and Development. pp.75-92. Leinden, E.J. Brill.
White, G. (1994). "Civil Society, Democratization, and Development (I):Clearing the Analytical Ground", Democratization 1 (3): 375-90.
Williams, A. (1990). "A Growing Role for NGOs in Development", Financeand Development 27(4): 31-33.
William, D. and T. Young (1994). "Governance, the World Bank and LiberalTheory", Political Studies 42: 84.
World Bank, (1981). Brazil: Integrated Development of the Northwest Frontier. LatinAmerica and Caribbean Regional Office, Washington, DC: WorldBank (International Bank of Reconstruction and Development).
————. (1993a). The Economics of the Welfare State. 2nd ed. Stanford, Calif.:Stanford University Press and Oxford: Oxford University Press.
————. (1994). Governance: The World Bank' s Experience. Washington, DC:World Bank.
————. (1995b). “Better Urban Services: Finding the Right Incentives”,World Bank, Washington D.C.
————. (2004a). The World Development Report 2004: Making Services Work for PoorPeople. Washington, D.C.
————. (2004b). World Development Report 2005: A Better Investment Climate forEveryone. New York: Oxford University Press.
http://www.expresshealthcaremgmt.com/2003/02/28/tech.shtml
http://www.indiatimes.com/2002/09/21
http://www.thehindubusinessline.com/2005/04/02/
http://www.thehindubusinessline.com/2005/10/08/
http://www.un.org/esa/agenda21/natlinfo/countr/india/social.htm