REPORT - DEVELOPMENT EXPERIENCE ...
49
REPORT BASELINE STUDY OF THE USAID / FOOD FOR PEACE PROJECT IN KASAI ORIENTAL October 2020
-
Upload
khangminh22 -
Category
Documents
-
view
0 -
download
0
Transcript of REPORT - DEVELOPMENT EXPERIENCE ...

REPORT BASELINE STUDY OF THE
USAID / FOOD FOR PEACE PROJECT
IN KASAI ORIENTAL
October 2020

ACKNOWLEDGMENTS
Thanks to USAID / FFP for their generous financial support and to Save the Children US for supporting this baseline
study.
A big thank you to everyone who helped make this report possible: Dr Diaw Chimere (Chief of Party SP) and Signature
Program team, Jeff Matenda (Health & Nutrition Technical DRC) and Nutrition team, Alex Fikiri (Country MEAL
Manager DRC / Senegal), Dieu-Merci Yesse (National MEAL Coordinator RDC) and the Center MEAL team, Barke
Arjika (Director of Operations RDC) and the Center Operations team.
Thanks also to the National Nutrition Program (PRONANUT) for the supervision of the survey, to the Chief Doctors
of Health Zones of the six targeted Central Offices of the project (Cilundu, Kabeya Kamwanga, Kasansa, Tshilenge,
Miabi, and Tshishimbi) for their implication, to the data collectors of the evaluation, local authorities and all mothers
of children and key interviewees who volunteered their time for the successful completion of this assessment.
Report prepared by : Dieu-merci Yesse Kompanyi, (National MEAL Coordinator)
Report prepared for : USAID/FFP Project
Cover photo credit : Dieu-merci Yesse / Save the Children International
Supervision and collection team - Kitwadi, Jean Paul (Nutrition Specialist)
- Bulungu Nana (Social Behavior Change Officer)
- Kabeya Lendl (Field MEAL Coordinator)
- Kanyinda Pascal (MEAL Officer)
- Tshaona Patrick (MEAL Specialist)

1. SUMMARY
a. OVERVIEW OF THE BASELINE ASSESSMENT
This baseline study is part of an activity planned under the Save the Children implemented project entitled “Increasing
Nutrition Security in Kasai Oriental, DRC”, funded by the United States Agency for International Development
(USAID), and covering the period between August 2020 and July 2021. This emergency project aims to contribute to
the reduction of morbidity and mortality due to malnutrition in children under the age of five in targeted vulnerable
communities in the province of Kasai Oriental by supporting the Ministry of Health in the implementation and scale-
up of integrated management of acute malnutrition (IMAM). From this perspective, this project will increase access to
nutritional inputs and build the capacity of health care providers and community volunteers to identify, refer and treat
acute malnutrition as well as support and protect Infant and Young Child Feeding (IYCF) best practices for pregnant
and lactating women, including adolescent girls in the six targeted health zones in the Kasai Oriental Province.
This study is based on mixed evaluation methods including a representative household survey, as well as the collection
of additional information from targeted support structures to provide information on the main FFP indicators and
those specific to the project. This study also included a qualitative analysis in order to collect data to enrich the context
in which the project will be carried out, to enrich and deepen the results of the household survey.
The sample for the population-based survey was selected using a two-stage cluster sampling approach to be statistically
representative of the project areas. The survey questionnaire was developed through a series of consultations with
the project team, the program development and quality team (PDQ), including the MEAL specialist and the Technical
Advisors (TA). Training, pre-tests and pilot tests were performed to test the questionnaire and prepare the team for
data collection. The fieldwork took place over a nine-day period, from October 1 to October 9, 2020. Interviews were
conducted in 677 households. The qualitative study was designed and conducted at the same time as the household
survey. The SCI country team, with the support of the SCUS team, developed and finalized the methodology, cluster
selection and interview guide for the qualitative study. Data collection for the qualitative study took place during the
same period in 43 health areas of the six health zones targeted by the project, in which 107 interviews were carried
out with key people targeted at the level of the intervention zones.
b. MAIN FINDINGS The following is a summary of the characteristics of the study population and estimates of basic indicators on child
nutrition, household food security, and survival and resilience strategies. The main findings are highlighted and
recommendations formulated for better project implementation and consideration during the selection and targeting
of beneficiaries.

Household characteristics:
The number of people living in the 677 households surveyed is 4,965 people, with an average household size of 7.33
people per household. The majority of the surveyed population (94%) is represented by adults aged 20 and over, while
the 14 to 19-year-old category represents 6% of the surveyed population. The average age (in years) of the survey
sample is estimated at 29.1. The majority of households (70%) are native or resident in the targeted areas. A quarter
(25%) represents the returnee population, while internally displaced persons and refugees represent 4% and 1%
respectively. The majority of people surveyed (97%) are women. Six out of 10 heads of households (59%) have a
primary education level. Almost two in 10 heads of households (18%) have a university level while 23% of the heads of
households surveyed have no level of education or have never attended school.
Exclusive Breastfeeding:
The indicators of the nutritional status of children show that the prevalence of exclusive breastfeeding (EB) in the
project areas is slightly higher (57.8%) than that reported in the MICS survey 2017- 2018 (55.0%) for the province of
Kasai. More than half (53.7%) of infants aged 4 to 5 months are breastfed and receive complementary foods, contrary
to the World Health Organization guidelines on exclusive breastfeeding for the first 6 months. Although continued
breastfeeding is a common practice, 81% of mothers breastfeed their babies within one hour of birth.
Prevalence of acute malnutrition (based on MUAC measurements)
The analysis of the prevalence of acute malnutrition based on the Upper Arm Perimeter (MUAC) of all children aged
six to 59 months shows a prevalence above the emergency thresholds (Acute malnutrition rate = 25,8%). Data from
the analysis show higher rates for children in the six to 23-month age group (27.7%) compared to the 24 to 59-month
age group (25.3%). Although the difference between the two sexes is not statically significant, in absolute terms, acute
malnutrition appears to be higher in girls (26.4%) than in boys (25.5%).
Food consumption score
The food consumption score indicates that only 28% of households in six health zones have an acceptable level of food
consumption while 72% have either a borderline (30%) or poor (42%) level of food consumption. Households with
both adult males and females tend to score better on these indicators compared to households with either adult males
or females only.
Reduced Coping Strategies Index (rCSI):
The average rCSI score is 20,46 in the project areas. About 6 out of 10 households (59.8%) are using multiple negative
coping strategies.This result confirms that the various shocks suffered in the last five years have led a large proportion
of households in the project intervention area to resort to emergency strategies. Per the IPC acute food insecurity
indicator thesholds, households in the sureveyed area show rCSI scores consistent with IPC phase 3.
Almost all households in the project areas use some kind of cash transfer to purchase food. Household assets, cash
savings and social capital are important factors for resilience capacities. The resilience capacities of households with
either adult males or females only are lower than households with both adult males and females.

Table 1 : Summary of findings
Target population
Base value
Exclusive Breastfeeding (EB) and Minimum Dietary Diversity (MDD) Indicators
% of children 0 to 5 months who have been exclusively
breastfed in the 6 health zones
Girls and Boys aged 0 to 5
months 57,8%
% of children 6-23 months consuming food from four or more
food groups
Girls and Boys aged 6 to 23
months 5,3%
Acute malnutrition indicator
Prevalence of Acute Malnutrition in Children Under 5
Girls and Boys under 5
years old
25,8%
(22,7 - 29,2
95% C.I.)
Girls and Boys under 2
years old
27,7%
(20,9 - 35,6
95% C.I.)
Food security indicators
% of households with an acceptable food consumption
score
Households with a child
under 2 years old
28%
(22,97 – 33,02
95% C.I.)
Average Reduced Coping Strategies Index (rCSI) Score
Households with a child
under 2 years old 20,46
c. CONCLUSIONS AND RECOMMENDATIONS
The results of the baseline study show that the level of education of the head of household, or specifically of the
woman, is strongly associated with greater household dietary diversity. Improving household dietary diversity,
indicating an improvement in the socio-economic situation of households, could also translate into access to quality
food for women and children. Efforts are therefore needed to support and increase adherence to recommended infant
and young child feeding practices, including activities, although knowledge does not always translate into practice.
Many women in this survey do not have a say in decisions about their own health or that of their children; therefore,
nutrition education and awareness for improved maternal and child nutrition (MCN) are needed.
Analysis of the reduced coping strategies indicates that project households face an above-average severity level
(consistent with IPC phase 3) due to the shocks. The results of this baseline assessment show that in all areas of the

project, with the exception of the Kansasa health zone, the average rCSI score is 20.46 out of a total possible score
of 56. This proves that households are using a wide range of negative coping strategies.
These practices negatively impact the short and long term nutritional status of children. Given these findings, efforts
to promote food production or food access opportunities, especially for women, would go a long way in helping
households improve their capacity to access food in difficult times.
In conclusion, the baseline assessment of the USAID project succeeded in bringing out the baseline values for the key
indicators and provided rigorous evidence on the prevailing nutritional situation in the six targeted health zones (Miabi,
Cilundu, Kabeya Kamuanga, Kasansa, Tshitenge and Tshishimbi) before the implementation of activities. This report
was able to collect the data and define the benchmark indicators as well as those of the health facilities. This
comparative data will provide for evidence-based learning content and will also allow for comparisons to be made
during implementation and final evaluation phases.
This activity also made it possible to confirm that the objectives of the FFP project will make it possible to respond
directly to the real nutritional needs of the health zones assessed. Thus, the provision of technical support through
training, support and logistics (transport of inputs and storage) is essential. From the findings, we can here confirm that
the targeting of beneficiaries during project design was relevant.

Contents
ACKNOWLEDGMENTS ............................................................................................................................................... 2
1. SUMMARY ............................................................................................................................................................... 3
a. OVERVIEW OF THE BASELINE ASSESSMENT............................................................................................. 3
b. MAIN FINDINGS ................................................................................................................................................ 3
Household characteristics: ......................................................................................................................................... 4
Exclusive Breastfeeding: .............................................................................................................................................. 4
Prevalence of acute malnutrition (based on MUAC measurements) ............................................................ 4
Food consumption score ............................................................................................................................................. 4
Reduced Index of Coping Strategies (rCSI) (RiA): ............................................................................................... 4
c. CONCLUSIONS AND RECOMMENDATIONS .......................................................................................... 5
LIST OF TABLES ............................................................................................................................................................. 8
LIST OF FIGURES ........................................................................................................................................................... 8
ABBREVIATIONS AND ACRONYMS ........................................................................................................................ 9
PROJECT SUMMARY ................................................................................................................................................... 11
2. OBJECTIVE, COVERAGE METHODOLOGY AND LIMITS OF THE ASSESSMENT .............................. 12
I- OBJECTIVE OF THE ASSESSMENT ........................................................................................................... 12
II- ASSESSMENT METHODOLOGY .......................................................................................................... 12
III. 1. Sampling strategy......................................................................................................................................... 13
III. 2. Selection and training of interviewers & supervisors ............................................................................ 16
III. 3. Data Collection ........................................................................................................................................... 16
III. 4. Organization of supervision ...................................................................................................................... 16
III. 5. Ethical considerations ................................................................................................................................. 17
III. 6. CHALLENGES AND LIMITATIONS ....................................................................................................... 17
3. RESULTS ................................................................................................................................................................ 19
3. 1. Demographic characteristics ......................................................................................................................... 19
3. 2. Exclusive Breastfeeding (EB) and Minimum Acceptable Diet (MAD) ..................................................... 22
3. 2. a. Exclusive Breastfeeding (EB) .................................................................................................................. 22
3.2.b. Initiation of breastfeeding (early breastfeeding) .................................................................................... 22
3. 2. c. Minimum Acceptable Diet (MAD) ........................................................................................................ 23
3.3. Food security and livelihoods .......................................................................................................................... 24
3.3.1. Food consumption score (FCS) ............................................................................................................... 24
3.3.2. Coping Strategies Index (CSI) .................................................................................................................. 25
3. 4. Discussion ........................................................................................................................................................ 31
3. 5. Targeted health facility data........................................................................................................................... 36
4. CONCLUSION .................................................................................................................................................... 49
5. RECOMMENDATIONS ...................................................................................................................................... 49

LIST OF TABLES Table 1 : Summary of findings ........................................................................................................................................ 5
Table 2 : Sample size calculation formula .................................................................................................................. 14
Table 3 : Population and zones targeted for data collection .................................................................................. 14
Table 4 : Sociodemographic characteristics of the mothers or caregivers interviewed .................................... 19
Table 5 : % of infants 0 to 5 months exclusively breastfed (RiA) .......................................................................... 22
Table 6 : Proportion of infants 0-23 months of age who were breastfed within 1 hour of birth .................... 22
Table 7 : Trend in consumption of food groups by children aged 6-23 months ................................................. 23
Table 8 : Households according to the used coping strategy severity scale ........................................................ 25
Table 9 : Coping strategies used by the households surveyed .............................................................................. 25
Table 10: Age and sex distribution of the sample .......................................................................................................... 26
Table 11: Prevalence of Acute Malnutrition, based on Brachial Perimeter (MUAC) by age group .............................. 26
Table 12: Prevalence of Acute Malnutrition based on MUAC and Gender ................................................................... 27
Table 13: HF staff........................................................................................................................................................... 36
Table 14: Summary information on HF ...................................................................................................................... 38
Table 15: Summary of IYCF activity data ................................................................................................................... 40
Table 16: Anthropometric equipment and inputs .................................................................................................... 42
Table 17: Training data ................................................................................................................................................. 44
Table 18: Number of people admitted to health facilities (including supported sites) for the management of acute malnutrition ...................................................................................................................................................................... 45
LIST OF FIGURES
Figure 1 : Food group consumed by children aged 6 to 23 months...................................................................... 23
Figure 2 : Proportion of children aged 6 to 23 who consumed milk-based meals in the last 24 hours ...................... 24
Figure 3 : Food consumption score (FCS) of the households surveyed ............................................................... 24
Figure 4 : Seniority in the HF....................................................................................................................................... 36
Figure 5 : HF respondent's education level ............................................................................................................... 36
Figure 6 : Type of services offered by the HFs visited .................................................................................................... 37
Figure 7 : Data on nutrition services (IYCF and IMAM) ................................................................................................. 40
Figure 9 : HF supports other acute malnutrition care sites ................................................................................... 45
Figure 8 : Organization of the management of acute malnutrition ........................................................................ 45

ABBREVIATIONS AND ACRONYMS
ACF : Action Contre la Faim
CODESA : Comité de Développement de la Santé
rCSI : Reduced Coping Strategies Index
DDS : Dietary diversity score
DRC : Democratic Republic of Congo
EB : Exclusif Breastfeeding
ENA : Emergency Nutrition Assessment
FAO : Food and Agriculture Organisation of the United Nations
FCS : Food consumption score
FFP : Food for Peace
AM : Acute Malnutrition
HF : Health Facility
HH : Households
HZ : Health Zone
IDIs : In-depth interviews
IMAM : Integrated Management of Acute Malnutrition
IPC : Integrated Food Security Phase Classification
IYCF : Infant and Young Children Feeding
KAP : Knowledge, Attitudes and Practices
KIIs : Key informants
KO : Kasaï Oriental
MDD : Minimum Dietary Diversity
MAM : Moderate Acute Malnutrition
MCN : Maternal and child nutrition
MEAL : Monitoring-Evaluation, Learning, Accountability and Research
MICS : Multiple Indicator Cluster Surveys
MUAC : Mid-Upper Arm Circumference
OCHA : United Nations Office for the Coordination of Humanitarian Affaires
ORS : Oral Rehydratation Solution
PDQ : Program Development and Quality
PHD : Provincial Health Division
PPS : probability proportional to size
PRONANUT : Programme National de Nutrition
rCSI : Reduced Coping Strategies Index
RECO : Relais communautaires
RMEAL : Monitoring-Evaluation, Learning, Accountability and Research Manager
RUTF : Ready to Use Therapeutic Food
SAM : Severe Acute Malnutrition
SCI : Save the Children international
SP : Signature programme
SPP : Size proportional to population
TA : Technical Advisor
UNICEF : United Nations International Children's Emergency Fund
US : United States
USAID : United States Agency for International Development
WHO : World Health Organisation

PROJECT SUMMARY
Name of the project : Increased Nutritional Security in Kasai Oriental Province
Global Objective : Contribute to the reduction of morbidity and mortality due to malnutrition
in children under five in vulnerable communities of Kasai Oriental by
supporting the Provincial Health Division (PHD) and PRONANUT in scaling
up the IMAM
Duration : 12 months
Start and end date : August 2020 - July 2021
Intervention Zones : Six health zones in five territories of the Kasai Oriental province (Miabi,
Cilundu, Kabeya Kamuanga, Kasansa, Tshitenge and Tshishimbi)
PEC MAS target : 26,911 children

2. OBJECTIVE, COVERAGE METHODOLOGY AND LIMITS OF THE
ASSESSMENT
I- OBJECTIVE OF THE ASSESSMENT
The main objective of the baseline assessment was to identify, articulate and document existing nutrition and food
security needs and to inform Save the Children’s programmatic decisions. The assessment also helped establish the
basis for the project's key indicators and will serve as the basis for measuring project performance over time.
The specific objectives for this baseline study:
• Measure the key indicators as defined in the logical framework of the project “Increase the nutritional security
of vulnerable populations in the province of Kasai Oriental” through a baseline assessment.
• Collect and analyze the available secondary data in order to establish the accountability and the relevance for
an effective implementation of the project.
• Identify the main external factors that can influence or affect the implementation of the project.
• Prepare a baseline assessment report reflecting an in-depth analysis by detailing the mechanisms for evaluating
and monitoring project indicators.
II- ASSESSMENT METHODOLOGY
To achieve the specific objectives above, a cross-sectional study was carried out in the targeted intervention areas, in
particular in the health areas of the six project health zones in the province of Kasai Oriental. The participatory
methodology was used to ensure meaningful participation of project implementing partners, beneficiary populations
and all other parties interested in the project. Primary and secondary data were collected using a mixed method to
assess the implementation of activities and interventions planned through this project.
Primarily aimed at collecting baseline values for the indicators, the main method of collecting baseline assessment data
was a quantitative household survey with children aged 0-59 months. To understand all the different attitudes and
beliefs of the communities, a qualitative approach was used alongside the quantitative approach.
II. a Qualitative study
Qualitative data was collected through interviews with key informants (KIIs) and in-depth interviews (IDIs) with key
stakeholders, including beneficiaries, members of health facilities (HF), local implementation partners, project staff and
other stakeholders to supplement the information gathered through the quantitative approach. Secondary data
(documents and other important information) was reviewed to establish key information relevant to the effective
implementation of the project.

II. b Quantitative survey
Quantitative data was collected and used to measure project indicators expressed in numbers or percentages
(quantitative indicators). The data were obtained using a questionnaire survey on a well-defined sample of households
(677 households).
This benchmark quantitative assessment focused on the following indicators:
Exclusive Breastfeeding Rate (EB):
- % of children zero to five months who are exclusively breastfed
Prevalence of acute malnutrition:
- Prevalence of acute malnutrition in children under five
Food Security :
- % of children 6 to 23 months receiving minimum dietary diversity
- Proportion of households with an acceptable food consumption score
- Average Reduced Coping Strategies index
III. 1. Sampling strategy
III. 1. a. Study design
The assessment was a cross-sectional two-stage cluster survey using both quantitative and qualitative data collection
methods. The clusters are selected on the basis of size proportional to population (SPP). The first step of sampling was
to identify the number of clusters to include in the survey, while the second step of sampling was to choose the
participating households from among the sampled clusters. The main source of information was the household survey
using a structured questionnaire to mothers / caregivers of infants and children aged 0-59 months.
The main tool for understanding or defining previous and current Knowledge, Attitudes and Practices (KAP) for
Recommended Nutrition and Infant and Young Child Feeding (IYCF) practice was adopted from the guidelines of FAO
for the evaluation of KAPs in nutrition.1
The study assessed the basic level of the beneficiary populations of the project, on the basis of which the project will
set indicators to assess the change in social behavior such as a change in knowledge or attitudes, but also the medium
and long term results, such as the prevalence of acute malnutrition and the change in actual behavior and resulting
practices that will be assessed at the end of the project through an assessment or final surveys that will use the same
methodology.
1 FAO. (2016) Guide pour évaluer les Connaissances, Attitudes et Pratiques liées à la nutrition 188 (89)

III. 1. b. Study population
The target population of the survey consisted of mothers and / or babysitters in households with children aged zero
to 59 months in the six health zones targeted by the project. Major community groups that play crucial roles in
integrated community nutrition and maternal health were also part of the target study group for qualitative data
collection; these are mothers and fathers of children under six months of age, older women (grandmothers / mothers-
in-law), community leaders and members of IYCF support groups and community volunteers.
III. 1. c. Calculation of sample size
In calculating the sample size for this study, we examined the following key factors using the sample size calculations
proposed in the USAID methodology:
Table 2 : Sample size calculation formula
Percentage of change expected 5%
P1,est 9% (0.09)
P2,est 4% (0.04)
Z1−∝ 95% (1.64)
Z1− 80% (0.84)
Dest 2
Number of children 600
Adjustment for non-respondents 10%
Number of children to be surveyed 667
According to the USAID / FFP methodology, 667 children across the six targeted health zones (Cilundu, Kabbeya
Kamwanga, Kasansa, Tshilenge, Miabi, and Tshishimbi) should be affected by the assessment; but, during the collection,
the teams went up to 677. The number of children to be included in the final sample for each targeted health zone was
calculated according to the size of the population of children under five (as detailed in the table below). The number
of clusters needed was estimated using the ENA application for SMART (version 11 January, 2020).
Table 3 : Population and zones targeted for data collection
Health Zone
Population
(Children <
5 years)
Proportion
(Children < 5
years)
Number of
clusters
Reserve
clusters
Number (Child
per cluster)
Cilundu 41,980 15,1 5 (1 - 5) 2 83
K. Kamuanga 41,721 15,0 7 (6 - 12) 0 116
Kasansa 47,574 17,1 8 (13 - 20) 0 134
Miabi 33,668 12,1 3 (21 - 23) 2 51
Tshilenge 68,399 24,7 11(24 - 34) 0 183
Tshishimbi 44,082 15,9 6 (35 - 40) 1 100
Total 277,424 100,0 40 ( 1 - 40) 5 667

III. 1. c.1. Two-step cluster size proportional (PPS) sampling
Two-stage cluster sampling was applied. First, the clusters (health zones and areas) were selected based on the
probability proportional to size (PPS) to ensure that the clusters or health areas with a large number of populations
have the same selection probability than health areas or clusters with a lower population. The sampling frame for the
first stage of sampling consisted of selecting the villages or assessment areas, and was completed during the mapping
process and the development of the sampling frame during the training of the interviewers, three days before the start
of data collection. The list of updates was generated by consulting various stakeholders in the field (community leaders).
The second stage of sampling was to select households from the list of participating households within the selected
clusters.
III. 1. c.2. Selection of clusters
Each selected cluster was made up of a housing group; therefore, an entire village or a neighborhood in the targeted
health zone or area. From an exhaustive and recent list of populations by village and by neighborhood in the targeted
area, a sampling framework was prepared using the knowledge available locally on the size and accessibility of villages
or neighborhoods. Thus, to prepare this sampling framework, two operations were carried out on the list of
populations by village, made up of all the villages in the health area, namely:
- Removal of inaccessible villages or neighborhoods
Villages or neighborhoods with difficult access (presence of a natural barrier, insecurity in the village or neighborhood,
long distance to be covered on foot with more than 25 km back and forth).
- Merger of small villages or neighborhood
Villages or neighborhoods that do not have a sufficient number of households for the size of the planned cluster (17
households) have been merged with other villages or neighborhoods to represent a single survey unit in the sampling
frame. This merger was made according to the criterion of proximity.
The segmentation technique was used to narrow the area to be covered by the investigation team. The goal of this
procedure is to divide into small segments and randomly choose a segment to include in the cluster. This division was
made based on existing administrative units (neighborhoods, etc.), natural landmarks (rivers, roads, mountains, etc.)
or public places (markets, schools, churches, etc.).
III. 1. d. Selection of Households
In all of the health zones, exhaustive household lists were not available from village heads, and populations in the cluster
(or segment of the cluster) were divided by the average household size (5.1) to have a number of households per
segment, and a sampling interval of five households was applied (systematic random sampling methodology). A
household is defined as the set of one or more people sharing the dish of the same pot, remaining under one roof and
under the responsibility of a single authority.
Only households where mothers and / or caregivers are present were visited.
III. 1. e. Selection of children to be surveyed
Data collection was effective on household children aged zero to 59 months. The MUAC and the edema sample were
taken on the basis of the questionnaire designated for this purpose. For children absent during the shift of the team,
the investigators made sure to return to this household before the end of the day.
III. 2. Selection and training of interviewers & supervisors
The training of interviewers and work session with supervisors were organized in three areas, each grouping two
health zones. In total, 30 investigators, of minimum graduate level of study, with experience in the collection of
nutritional data / KAP, and made available to SCI by the six Central Health Offices, were trained for two days with a
view to allow them to familiarize themselves with data collection tools and benefit from a theoretical orientation on
data collection methodology. This training was supported by a real-life capacity test to select the 24 interviewers to
be retained and a pre-survey before launching the actual collection. The restitution of programming, typing and
omission errors was ensured and allowed to correct the questionnaires.
To enable the interviewers to accomplish their mission in the field, they were provided with presentations on the
survey’s objectives, the methodology on the survey approach, and on the detailed sampling (selection of health areas,
selection of households and children). Thus, nutrition and food security indicators, and essential information were
shared with them. Then, there followed the theory and the practice in room on the anthropometric measurements
(MUAC), the verification of nutritional edemas, the exploitation of the survey questionnaires, its translation into local
language, the use of mobile technologies for data collection (Kobo Collect), the supervision of the evaluation, the
distribution of investigators, the ethical provisions in the conduct of the survey, and finally the reminder on the
screening of maternal and child malnutrition. At the end of the training, a simulation was carried out through a pre-
survey.
III. 3. Data Collection
The start of the actual data collection covered the period from Monday 05 to 09 October, 2020. Before the training
and collection phase, preparatory work consisted of carrying out a risk assessment of the activity. This involved
operating and harmonizing the collection tools, configuring the questionnaires on the electronic collection application
(KOBO) and finally following the required (logistical) support. The data was collected offline via the KOBO Collect
mobile application, respecting barrier gestures to prevent the risk of the spread of COVID-19 during the collection
process.
III. 4. Organization of supervision
Close supervision of the survey was provided jointly by six SC staff, each in a health zone, assisted by three officers
from the National Nutrition Program (PRONANUT) to ensure that the collection is done in accordance with
nutritional standards.

At the end of each working day, the supervisors randomly checked the quality of the data collected, ensuring the
pooling. Then they clean the data before sending it to the server for storage. On average, seven households were
visited per day.
III. 5. Ethical considerations
The data collection for the FFP baseline study was conducted in compliance with ethical protocols, including SCI's child
protection policies to ensure the safety of all respondents as well as COVID-19 barrier measures, including wearing a
mask and using hydro alcoholic gel for hand disinfection.
The protocols implemented during the baseline study include:
- Briefings on SCI's child protection policy held with the various stakeholders involved in the baseline study
activities;
- Obtaining consent from mothers and children, and documenting completed and informed consents;
- Carrying-out a risk assessment (details attached) and popularization and adherence to the “Do no harm”
principles, made to avoid exposing people to additional risks by the actions of the assessment;
- Adherence to the anti-harassment policy to ensure that investigators treat respondents with the utmost
respect and do not harass respondents on the basis of race, color, religion, sex, sexual orientation, national
origin, age, disability, marital status, parental status, political affiliation or any other basis;
- Informing respondents that participation is completely voluntary, and that they do not have to answer to
specific questions if they feel uncomfortable, and that they can interrupt the interview at any time without
giving a prior reason;
- All the children suffering from acute and severe malnutrition, detected according to the MUAC and / or
presenting nutritional edema, were referred to the nearest health center for adequate management.
III. 6. CHALLENGES AND LIMITATIONS
- Many villages drawn randomly in the same cluster were located quite far from each other, which could increase
the time and distance to be covered by the investigators. This had repercussions on the amount planned for
the reimbursement of transport to facilitate the movement of the investigators in the field (with clusters /
remote villages)
- Fairly low level of adaptation for most investigators carrying-out electronic data collection (in terms of
electronic data collection but also in the collection of anthropometric measurements)
- Repetitive breakdowns of the motorcycle of the Kabeya Kamwanga HZ Supervisor
- Some programming errors in the electronic form
- The heavy rain having constrained the good progress of the collection on Tuesday the 6th of October, 2020
- Difficulty charging the tablets due to lack of means (fuel and generators) in certain areas
- Low bandwidth in some areas to submit the form with the finalized data (Internet connection)

- The level of education of most respondents who find it difficult to express their opinion better. The
consequence of this has been an increase in the length of the interview in some areas.
1Image of parents and malnourished children in sensibilization session on malnutrition in the breastfeeding area built by SC at the Cilundu General
Hospital.
©Photo credit: Dieu-merci Yesse / Save The Children DRC.

3. RESULTS
3. 1. Demographic characteristics
Table 4 : Sociodemographic characteristics of the mothers or caregivers interviewed
Cilundu
Kabeya
Kamuanga Kasansa Miabi Tshilenge Tshishimbi Together
Sex
Female 97% (n=90) 91% (n=106) 100% (n=131) 95% (n=54) 99% (n=179) 99% (n=98) 97% (n=658)
Male 3% (n=3) 9% (n=10) 0% (n=0) 5% (n=3) 1% (n=2) 1% (n=1) 3% (n=19)
Total 100% (n=93) 100 % (n=116) 100% (n=131) 100% (n=57) 100% (n=181) 100% (n=99) 100% (N=677)
Age Groups
14-17 2% (n=2) 0% (n=0) 2% (n=3) 2% (n=1) 1% (n=1) 1% (n=1) 1% (n=8)
18-19 8% (n=7) 3% (n=4) 5% (n=6) 4% (n=2) 3% (n=5) 7% (n=7) 5% (n=31)
20-24 28% (n=26) 28% (n=32) 17% (n=22) 35% (n=20) 25% (n=45) 25% (n=25) 25% (n=170)
25-29 22% (n=20) 24% (n=28) 35% (n=46) 18% (n=10) 23% (n=41) 24% (n=24) 25% (n=169)
30-34 13% (n=12) 14% (n=16) 22% (n=29) 23% (n=13) 19% (n=34) 27% (n=27) 19% (n=131)
35 and over 28% (n=26) 31% (n=36) 19% (n=25) 19% (n=11) 30% (n=55) 15% (n=15) 25% (n=168)
Total 100% (n=93) 100% (n=116) 100% (n=131) 100% (n=57) 100% (n=181) 100% (n=99) 100% (N=677)
Average age (in
completed years)
28,5
30,7
28,4
27,9
30,1
27,9
29,1
Marital status
Maried 99% (n=92) 97% (n=113) 100% (n=131) 95% (n=54) 99% (n=179) 98% (n=97) 98% (n=666)
Widow 1% (n=1) 3% (n=3) 0% (n=0) 5% (n=2) 0,1% (n=1) 0% (n=0) 2 % (n=7)
Single 0% (n=0) 0% (n=0) 0% (n=0) 0% (n=0) 0,1% (n=1) 0,5% (n=1) 0% (n=2)
Divorcee 0% (n=0) 0% (n=0) 0% (n=0) 0% (n=0) 0% (n=0) 0,5% (n=1) 0% (n=1)

Cilundu
Kabeya
Kamuanga Kasansa Miabi Tshilenge Tshishimbi Together
Total 100% (n=93) 100% (n=116) 100% (n=131) 100% (n=57) 100% (n=18) 100% (n=99) 100% (N=677)
Residence status
Resident 71% (n=66) 1% (n=1) 100% (n=131) 24% (n=14) 97% (n=175) 85% (n=84) 70% (n=471)
Returned 28% (n=26) 81% (n=94) 0% (n=0) 74% (n=42) 0% (n=0) 7% (n=7) 25% (n=169)
Internally displaced 0% (n=0) 18% (n=21) 0% (n=0) 2% (n=1) 3% (n=5) 3% (n=3) 4% (n=30)
Refugee 1% (n=1) 0% (n=0) 0% (n=0) 0% (n=0) 0% (n=1) 5% (n=5) 1% (n=7)
Total 100% (=93) 100% (n=116) 100% (n=131) 100% (n=57) 100% (n=181) 100% (n=99) 100% (N=677)
Educational level
Primary studies 53% (n=49) 50% (n=57) 71% (n=93) 23% (n=13) 72% (n=130) 55% (n=54) 59% (n=396)
Secondary studies 3% (n=7) 37% (n=43) 20% (n=25) 2% (n=1) 18% (n=32) 12% (n=12) 18% (n=120)
No level of education 30% (n=28) 1% (n=1) 0% (n=0) 74% (n=42) 2% (n=4) 0% (n=0) 11% (n=75)
Never attended school 9% (n=8) 10% (n=12) 8% (n=11) 2% (n=1) 8% (n=15) 33% (n=33) 12% (n=80)
Technical studies 0% (n=1) 2% (n=2) 1% (n=2) 0% (n=0) 0% (n=0) 0% (n=0) 0% (n=5)
University studies 0% (n=0) 0% (n=1) 0% (n=0) 0% (n=0) 0% (n=0) 0% (n=0) 0% (n=1)
Total 100% (n=93) 100% (n=116) 100% (n=131) 10% (n=57) 100% (n=181) 100% (n=99) 100% (n=677)
Number of children in the household
0 children 0% (n=0) 3% (n=3) 0% (n=0) 0% (n=0) 0% (n=0) 0% (n=0) 0% (n=3)
1-2 children 20% (n=19) 16% (n=18) 24% (n=31) 14% (n=8) 31% (n=57) 32% (n=32) 24% (n=165)
3-4 children 39% (n=36) 41% (n=47) 26% (n=34) 39% (n=22) 28% (n=50) 36% (n=35) 33% (n=224)
5-6 children 27% (n=25) 24% (n=28) 31% (n=41) 26% (n=15) 28% (n=50) 28% (n=28) 28% (n=187)
7 children and over 14% (n=13) 17% (n=20) 19% (n=25) 21% (n=12) 13% (n=24) 4% (n=4) 15% (n=98)
Total 100% (n=93) 100% (n=116) 100% (n=131) 100% (n=57) 100% (n=181) 100% (n=99) 100% (n=677)
Main source of income
Agriculture 74% (n=69) 82% (n=95) 86% (n=113) 40% (n=23) 69% (n=125) 82% (n=81) 75% (n=506)
Mining square 13% (n=12) 1% (n=1) 2% (n=3) 37% (n=21) 16% (n=30) 2% (n=2) 10% (n=69)
Trade 7% (n=6) 8% (n=10) 5% (n=7) 12% (n=7) 5% (n=10) 11% (n=11) 8% (n=51)
Other (to be specified) 4% (n=4) 4% (n=5) 5% (n=6) 4% (n=1) 8% (n=14) 2% (n=2) 5% (n=32)
Cilundu
Kabeya
Kamuanga Kasansa Miabi Tshilenge Tshishimbi Together
Daily work 0% (n=0) 3% (n=3) 1% (n=1) 5% (n=3) 1% (n=1) 0% (n=0) 1% (n=8)
None 2% (n=2) 1% (n=1) 0% (n=0) 2% (n=1) 1% (n=1) 3% (n=3) 1% (n=8)
Assistance (NGO) 0% (n=0) 1% (n=1) 0% (n=0) 0% (n=0) 0% (n=0) 0% (n=0) 0% (n=1)
Breeding 0% (n=0) 0% (n=0) 1% (n=1) 0% (n=0) 0% (n=0) 0% (n=0) 0% (n=1)
Total 100% (n=93) 100% (n=116) 100% (n=131) 100% (n=57) 100% (n=18) 100% (n=99) 100% (n=677)
Presence of a disability
None 94% (n=87) 95% (n=110) 95% (n=126) 93% (n=53) 98% (n=177) 98% (n=97) 96,5% (n=650)
Physical handicap 3% (n=3) 5% (n=6) 2% (n=2) 7% (n=4) 0,5% (n=1) 1% (n=1) 3% (n=17)
I do not know 0% (n=0) 0% (n=0) 2% (n=2) 0% (n=0) 0,5% (n=1) 0% (n=0) 0,5% (n=3)
Blind or partially blind 0% (n=0) 0% (n=0) 0% (n=0) 0% (n=0) 0,5% (n=1) 1%(n=1) 0% (n=2)
Deaf or partially deaf 0% (n=0) 0% (n=0) 1% (n=1) 0% (n=0) 0,5% (n=1) 0% (n=0) 0% (n=2)
Other (to be specified) 3% (n=2) 0% (n=0) 0% (n=0) 0% (n=0) 0% (n=0) 0% (n=0) 0% (n=2)
Total 100% (n=93) 100% (n=) 100% (n=131) 100% (n=57) 100% (n=181) 100% (n=99) 100% (n=677)
Children by age group
0 to 5 months 12% (n=24) 17% (n=33) 32% (n=65) 7% (n=13) 12%(n=40) 20% (n=24) 100% (N=199)
6 to 23 months 14%(n=42) 16%(n=49) 14%(n=41) 10% (n=30) 31%(n=95) 15%(44) 100% (n=301)
24 to 59 months 15%(n=27) 19%(n=34) 15%(n=25) 8%(n=14) 26%(n=46) 17%(n=31) 100%(n=177)
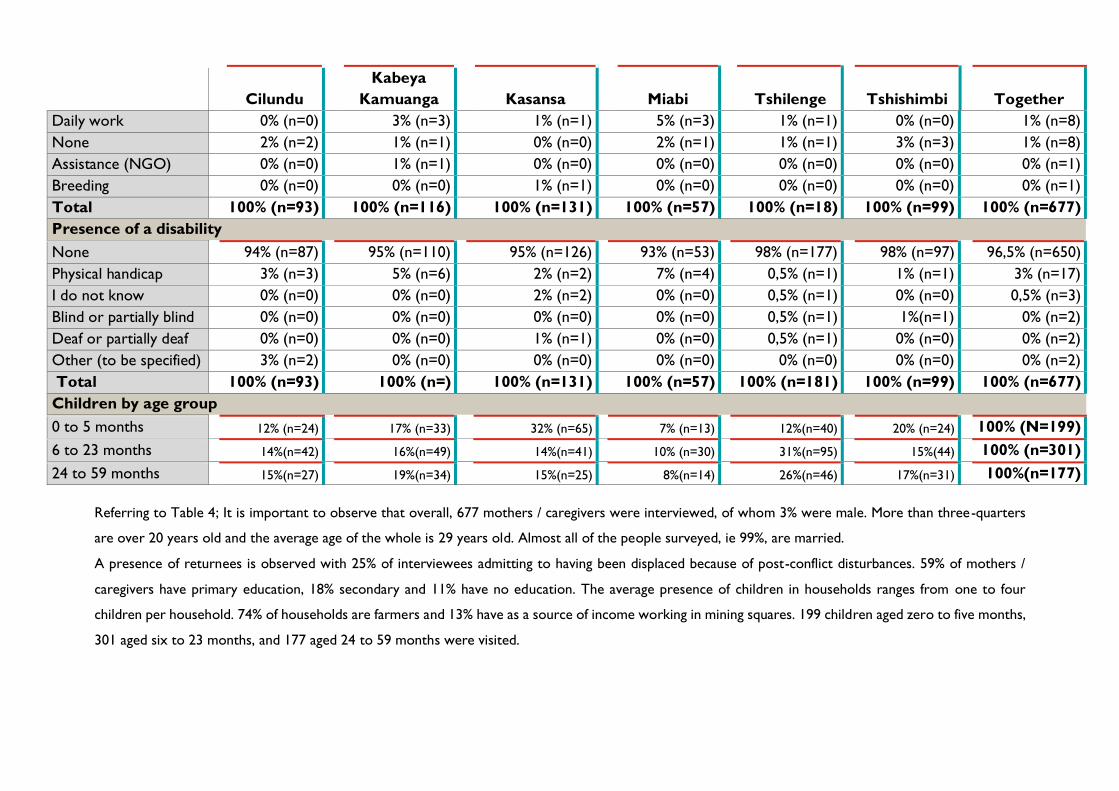
Referring to Table 4; It is important to observe that overall, 677 mothers / caregivers were interviewed, of whom 3% were male. More than three-quarters
are over 20 years old and the average age of the whole is 29 years old. Almost all of the people surveyed, ie 99%, are married.
A presence of returnees is observed with 25% of interviewees admitting to having been displaced because of post-conflict disturbances. 59% of mothers /
caregivers have primary education, 18% secondary and 11% have no education. The average presence of children in households ranges from one to four
children per household. 74% of households are farmers and 13% have as a source of income working in mining squares. 199 children aged zero to five months,
301 aged six to 23 months, and 177 aged 24 to 59 months were visited.

3. 2. Exclusive Breastfeeding (EB) and Minimum Dietary Diversity (MDD) 3. 2. a. Exclusive Breastfeeding (EB)
Table 5 : % of infants zero to five months exclusively breastfed (RiA)
Project Zone
(N=199)
Cilundu
(N=24)
Kabeya Kamuanga
(N=33)
Kasansa
(N=65)
Miabi
(N=13)
Tshilenge
(N=40)
Tshishimbi
(N=24)
Girls 47%
(47/100)
40%
(4/10)
5,3%
(1/19)
75,9%
22/29
12,5%
(1/8)
73,7%
(14/19)
33,3%
(5/15)
Boys 75,6%
(68/94)
35,7%
(5/14)
42,9%
(6/14)
100%
(36/36)
66,7% (2/3)
61,9%
(13/21)
66,7%
(6/9)
Total 57,8 %
(115/199)
37,5%
(9/24)
21,2%
(7/33)
89,2%
(58/65)
23%
(3/13)
67,5%
(27/40)
45,8%
(11/24)
On average, 57.8% (N: 199) of infants under six months of age were fed exclusively breast milk during the last 24
hours before the survey. The results in the tables below show a disparity between the different health zones and
rates lower than 50% (lower than the provincial average) in four of the six targeted health zones. On average, EB
rates are higher in boys than in girls.
3.2.b. Initiation of breastfeeding (early breastfeeding)
Table 6 : Proportion of infants 0-23 months of age who were breastfed within one hour of birth
Health Zone <1 Hour after birth
1 23 hours after
birth 24 hours after birth
I do not know
Together (N=276) 81%
(n=223) 17%
(n=47) 1%
(n=3) 1%
(n=3)
Cilundu 78% (n=21) 18% (n=5) 4% (n=1) 0% (n=0)
Kabeya Kamuanga 90% (n=43) 10% (n=5) 0% (n=0) 0% (n=0)
Miabi 85% (n=28) 12% (n=4) 0% (n=0) 3% (n=1)
Kasansa 79% (=62) 17% (n=13) 3% (n=2) 1% (n=1)
Tshilenge 74% (n=37) 24% (n=12) 0% (n=0) 2% (n=1)
Tshishimbi 80% (n=32) 20% (n=8) 0% (n=0) 0% (n=0)
81% (n = 223) of infants zero-23 months of age who were breastfed within one hour of birth and 17% (n = 47) between 1 23
hours after birth.

3. 2. c. Minimum Dietary Diversity (MDD)
3. 2. c.1. Minimum dietary practices of dietary diversity
Figure 2 : Food group consumed by children aged 6 to 23 months
The results show that in the 24 hours prior to the survey, only 5.3% (n = 16) of children aged six to 23 months
consumed four or more food groups. The majority, 86% (n = 259), ate between one and three food groups.
Table 7 : Trend in consumption of food groups by children aged six-23 months
Food groups
Togethe
r
(n=301)
Cilundu
(n=42)
Kabeya
Kamuang
a
(n=49)
Kasansa
(n=41)
Miabi
(n=30)
Tshileng
e
(n=95)
Tshishimb
i
(44)
Cereals, roots and
tubers
66% 60% 51% 46% 97% 63% 95%
Legumes and nuts 96% 93% 100% 95% 97% 95% 100%
Dairy products 1% 0% 0% 2% 0% 2% 0%
Meat-based foods 24% 21% 4% 27% 3% 43% 18%
Eggs 6% 7% 0% 12% 0% 4% 11%
Fruits and vegetables
rich in vitamin A
68% 61% 83% 80% 53% 61% 70,5%
Other fruits and
vegetables.
7% 10% 0% 10% 3% 5% 13%
86.0%
5.3%
8.6%
1 to 3 groups
4 groups and more
Zero groups

Figure 3 : Proportion of children aged six to 23 who consumed milk-based meals in the last 24 hours
3.3. Food security and livelihoods
3.3.1. Food consumption score (FCS)
18%
0.33%
4.30%
0.60%
0%
0.33%
1.60%
14%
24%
1.60%
0% 5% 10% 15% 20% 25% 30%
Lait maternel
Jus de fruits ou autres forme de jus
Lait maternisé
Lait commercialisé en poudre
Lait commércialité en concerve
Lait frais de vache
Lait caillé de vache
Yogourt
Bouillie mince
Autres liquides
28%
12%
4%
68%
7%
32%36%
30%
17% 16%
24%
33%
40% 41%42%
71%
80%
7%
60%
28%
23%
0%
10%
20%
30%
40%
50%
60%
70%
80%
90%
Together Cilundu KabeyaKamuanga
Kasansa Miabi Tshilenge Tshishimbi
Acceptable Limite Poor
Figure 4 : Food consumption score (FCS) of the households surveyed

Household food consumption score (FCS) of children aged six to 59 months (n = 301)
Together
(N=301)
Cilundu
(n=42)
Kabeya
Kamuanga
(n=49)
Kasansa
(n=41)
Miabi
(n=30)
Tshilenge
(n=95)
Tshishimbi
(n=44)
Acceptable 28%
(n=83)
12%
(n=5)
4%
(n=2)
68%
(n=28)
7%
(n=2)
32%
(n=30)
36%
(n=16)
Limite 30%
(n=91)
17%
(n=7)
16%
(n=8)
24%
(n=10)
33%
(n=10)
40%
(n=38)
41%
(n=18)
Poor 42%
(n=127)
71%
(n=30)
80%
(n=39)
7%
(n=3)
60%
(n=18) 28%(n=27)
23%
(n=10)
3.3.2. Reduced Index of Coping Strategies (rCSI)
Table 8 : Households according to the Reduced Coping Strategies Index (rCSI)
Health Zones
No strategy
Crisis
strategies 1
and < 10
Stress
strategy
>10 and <
20
Emergency
strategy
> 20
Total Average
Score
# of
HH %
# of
HH %
# of
HH %
# of
HH %
# of
HH
Cilundu 0 0,0% 12 12,9% 46 49,5% 35 37,6% 93 19,75
Kasansa 17 13,0% 51 38,9% 57 43,5% 6 4,6% 131 10,08
Kabeya Kamuanga 1 0,9% 7 6,0% 17 14,7% 91 78,4% 116 28,31
Miabi 0 0,0% 12 21,1% 16 28,1% 29 50,9% 57 22,26
Tshishimbi 1 1,0% 38 38,4% 29 29,3% 31 31,3% 99 16,28
Tshilenge 3 1,7% 14 7,7% 39 21,5% 125 69,1% 181 22,02
Assessment area 22 3,2% 134 19,8% 204 30,1% 317 46,8% 677 20,46
Table 9 : Coping strategies used by the households surveyed
HZ Percentage (%)
Reduces the
amount of food consumed per
meal
Reduce the
number of meals consumed in a day
Eat less
preferred and cheaper foods
Borrowing food or
relying on a friend or relative for help
Restrict
consumption for adults to favor small
children
Cilundu 94,6% 83,9% 95,7% 65,6% 68,8%
Kabeya
Kamwanga 93,1% 86,2% 88,8% 59,5% 89,7%
Kasansa 71,0% 62,6% 81,7% 49,6% 41,2%
Miabi 77,2% 47,6% 100,0% 42,1% 59,6%
Tshilenge 93,4% 88,4% 79,0% 84,0% 77,3%
Tshishimbi 77,8% 51,5% 98,0% 48,5% 46,5%%
Average 84,5% 70,0% 90,5% 58,2% 56,2%
HZ Together (N=677)

Prevalence of acute malnutrition by MUAC
Distribution of the population of children aged six to 59 months by age and sex
Table 10: Age and sex distribution of the sample
AGE (month) Boys Girls Total Ratio
n % n % n % Boy; girl
6-17 40 52,6 36 47,4 76 11,1 1,1
18-29 104 58,4 74 41,6 178 26,0 1,4
30-41 99 52,9 88 47,1 187 27,3 1,1
42-53 92 55,4 74 44,6 166 24,3 1,2
54-59 46 59,7 31 40,3 77 11,3 1,5
Total 381 55,7 303 44,3 684 100,0 1,3
According to the table above, the sex ratio of the sample is 1.3 (slightly higher than the expected value of 1.2) and
demonstrating a disparity between the age group of 18 to 29 months and 54 to 59 months. Details of sex distribution
are shown in the same table.
Prevalence of malnutrition in children under five
Given the COVID-19 adaptation measures, data on the weight and height of children in the targeted areas could not
be collected. MUAC measurement varies very little in children between six and 59 months and can therefore be used
regardless of age. This measure is particularly useful for identifying children at high risk of mortality. It is also a
secondary indicator of acute malnutrition. This property appears to be linked to the association between MUAC and
muscle mass. MUAC was thus taken for all the children in the sample and analyzed as an indicator of malnutrition for
all children aged six to 59 months.
Table 11: Prevalence of Acute Malnutrition, based on Brachial Perimeter (MUAC) by age group
Severe wasting
(< 115 mm)
Moderate wasting
(>= 115 mm and <
125 mm)
Normal
(> = 125 mm )
Age (month) Total n n % n % n %
6-11 28 3 10,7 3 10,7 22 78,6
12-23 113 20 17,7 13 11,5 80 70,8
24-35 178 14 7,9 35 19,7 129 72,5
36-53 292 28 9,6 41 14,0 223 76,4
54-59 79 7 8,9 14 17,7 58 73,4
Total 690 72 10,4 106 15,4 512 74,2
Due to the low quality of the data on nutritional edema, SAM rate did not take edema into account.
The result of this survey reveals a high prevalence of Acute Malnutrition of 25.8%, exceeding the acceptable threshold.
This suggests a precarious situation in the project area with almost three out of 10 children having either the severe
form or the moderate form. 10.4% are severely malnourished and at high risk of mortality while 15.4% are moderately
malnourished. The 12-23 month and 24-35-month age groups have high rates of Acute Malnutrition, 29.2% and 27.6%

respectively. The Acute Malnutrition is higher (27.7%) in the category of children aged six to 23 months than in the
age category of 24 to 59 months (25.3%)
Table 12: Prevalence of Acute Malnutrition based on MUAC and Gender
Type of malnutrition All
n = 690
Boys
n = 381
Girls
n = 303
Prevalence of acute malnutrition
(MUAC < 125 mm)
(178) 25,8 %
(22,7 - 29,2 95%
C.I.)
(97) 25,5 %
(21,3 - 30,1 95% C.I.)
(80) 26,4 %
(21,8 - 31,6 95%
C.I.)
Prevalence of moderate acute
malnutrition (MAM)
(< 125 mm and >= 115 mm)
(106) 15,4 %
(12,9 - 18,2 95%
C.I.)
(61) 16,0 %
(12,7 - 20,0 95% C.I.)
(44) 14,5 %
(11,0 - 18,9 95%
C.I.)
Prevalence of severe acute
malnutrition
(< 115 mm )
(72) 10,4 %
(8,4 - 12,9 95%
C.I.)
(36) 9,4 %
(6,9 - 12,8 95% C.I.)
(36) 11,9 %
(8,7 - 16,0 95%
C.I.)
Statistical analysis shows that there is only a slight difference observed in the rates of Acute Malnutrition according
to the sexes, with higher rates in girls than in boys, but this is not significant (p > 0.05) in the area targeted by the
project as shown in table 12 above.
Table 13: Prevalence of combined GAM and SAM based on MUAC cut offs by health zone
Health zone Prevalence of GAM
(MUAC < 125 mm)
Prevalence of SAM
(MUAC < 115 mm)
Survey areas 25,8 %
(22,7 - 29,2 95% C.I.)
10,4 %
(8,4 - 12,9 95% C.I.)
Cilundu 31,9 %
(24,8 - 40,0 95% C.I.)
16,3 %
(11,1 - 23,3 95% C.I.)
Kabeya Kamuanga 30,7 %
(23,0 - 39,7 95% C.I.)
11,4 %
(6,8 - 18,5 95% C.I.)
Kasansa 18,6 %
(13,7 - 24,6 95% C.I.)
9,3 %
(5,9 - 14,2 95% C.I.)
Miabi 32,1 %
(22,9 - 42,9 95% C.I.)
9,9 %
(5,1 - 18,3 95% C.I.)
Thilenge 22,3 %
(16,2 - 29,9 95% C.I.)
7,9 %
(4,5 - 13,6 95% C.I.)
Tshishimbi 29,0 %
(19,6 - 40,6 95% C.I.)
7,2 %
(3,1 - 15,9 95% C.I.)
Result of qualitative analyses
Category of respondents
Key people Total surveyed
Village chief 33
President CODESA 27
Religious leader 25

Leader of the Children's Listening Club 17
Chief Doctor of Zone 5
Grand Total 107
The above information shows that the majority of respondents were village chiefs followed relatively by CODESA
presidents and religious leaders. Children's listeners' clubs and MCZ rank second to last and last, respectively.
In relation to the health problems of the population, pregnant women and children under five in this community (or
a village): most of the respondents presented malnutrition as a major problem in the community among so many
other such as : fever, cholera, poor nutrition, accessibility to drinking water, no drinking water and high cost.
As for the health of pregnant women problems, the majority of responses come close to :
- Close births
- Poor diet which leads to weight loss and premature births
- Malnutrition, diarrhea, genital and urinary tract infection, malaria.
Among the problems raised concerning the health of children under five years old at the community level, the people
interviewed noted in order of importance:
- Malnutrition, diarrhea diseases, malaria, anemia and ARI
- For lack of means, many children in the community are malnourished, others die from malaria and anemia,
Regarding food (in the form of a meal), what do pregnant and breastfeeding women and children under five in this
community most commonly eat, for the great majority, women and children eat:
- Bread (Foufou in the local language) with green leaves as a basic meal
- Staple food (meals) : Nshima in the local language, cassava and corn flour, green vegetables, fretins (nsensa
in the local language), rarely some meat.
Reasons why these foods are to a large extent is related to the low financial income of the household and the low
variety of foods in the projet area according to the testimonies of the interviewees.
The same large majority of households attest that children under five mainly consume :
- Cereal-based foufou as staple foods, Cassava (foufou), Vegetables, Maize, and fruits”.
It was said that children often stay at home while parents go to the fields or other activities. Some parents leave
the food with this child and others acknowledged that they only get the children used to eating when they return.
Furthermore, more than half of the interviewees had attested that children under six months consume more breast
milk, and this is the motivation for which mothers take their children to the fields with a guardian The majority of
women agreed that breast milk is important for good growth of children. For children under six months of age who
stay at home, mothers said they extract the milk and store it in a clean cup.
One parent said, "We only give the children under five years product of our harvest for lack of funds to diversify and increase the frequency of meals".
During the qualitative appraisal, several verbatim has been noticed : “The health problems in the local language of
this community are: "When the woman is thin, weight loss, malnutrition = diboba"; “Anemia = mashi majika”
cikengo, “when we see a woman losing her health with signs like: weight loss, swelling of the feet; the community
calls it in the local language: diboba ”; and for children “… weight loss and swelling of the feet and eyes, is called in
the local language diboba”; “skin change, fatigue, cikenga”, “weight loss, fatigue, crying, NZALA , DIBOBA ”. It is
mediocre health characterized by weight loss and edema in the community, called NSADI or DISAMA DIA
DIBOBA”.
More statements from respondents agree that these problems affect five to seven out of 10 in their communities :
- DISAMA DIA DIBOBA seven out of 10 children under five show the signs"; with signs like " children do not
play, puny, malnutrition.
When we see the child losing his health and showing stunted growth, we make the effort, despite the difficulties, to
make him eat a variety of foods and increase the number of meals so that he recovers quickly.
In relation to the availability of food in this community, the main source of food is supplied locally through the fields
(agriculture) for all the communities, and a small minority resorts to the purchase of basic necessities for its diet.
“The majority are in the fields; it is the same who produce corn, peanuts and other foods…”, “by working the
fields of others we produce, others buy cassava, corn, vegetable oil”.
Maize and cassava are foods mainly produced in the communities as well as beans, soybeans, rice, etc. with low
production. “… We buy the food, others we cultivate. We produce locally maize, cassava, beans”.
The amount spent on eating varies from 1,000FC to 17,000FC, with an average of 6,000FC (more or less 3,000FC
depending on household size and socio-economic level).
A large part of the respondents confirmed to have noticed that, at a given period, they did not have enough food to
eat “yes, when there is no food, even money to buy”, “yes, for lack of stock, so that when we produce food it goes
directly to sale for lack of possibilities "," no, we work a lot but the production remains insufficient because the soil
is affected by drought "," the time when society took charge of the population of my village, people neglected the
field, and the effect of neglecting the field led to the people starting to suffer ”.
A part of respondents had declared that they borrow food or money from friends / neighbors, another part used
daily contracts in the field to alleviate the situation, and that some sleep hungry, as explained in the responses
below: "we sleep hungry", "borrow food or money", "loan, contract, work for someone", "recourse to neighboring
villages".
When it comes to breastfeeding a newborn in this community, almost half of the interviewees confirmed that,
according to the habits of their communities, the newborn is breastfed within an hour following childbirth "0h00 of
childbirth", "Just in the hour immediately following childbirth". While most had also stated that the newborn is
breastfed after childbirth without determining the "postpartum" time.
In connection with the question "When do we usually add food to what we give to a child under five years old in
this community", Less than half of respondents declared that mothers add foods from six months of age “we add

the foods like corn porridge at 6 months”, “we add the foods as tea porridge at six months”; however, the majority
of them had attested noticing that most mothers introduce food before five months of age "Some at three months,
four months and five months, peanut flour", "after five months, but following a poor diet it is even done at three
months: flour cassava, cowbell ”.

3. 4. Discussion
Demographic characteristics :
In total, 677 mothers and caregivers were surveyed. Tshilenge (27%) and Kasansa (19%) are the health zones where
a large number of mothers were reached.
The sex distribution of the study population shows a minimal proportion of around 3% of male participants. Kabeya
Kamwanga is the Zone with the most male caregivers encountered (8.6%). In most cases in the six health zones, the
mothers of the children interviewed are aged between 20-24 years (25.1%), 25-29 years (25.0%) and 30-34 (19.4%).
The average age of mothers is 29.1 years old. In the six zones, there is no significant difference between the average
ages.
Regarding marital status, almost all of the mothers surveyed are married and a small proportion (1%) are widows.
About seven out of 10 households visited are residents, 2.5 returnees and 0.5 IDPs. Indeed, 4% of the households
visited are IDPs; they are located in the health zones of Tshishimbi and Tshilenge. The largest numbers of returnees
were seen in Kabeya Kamwanga (81%) and Miabi (73.7%).
In all the households in the area targeted by the baseline assessment, children were present. More than two thirds
of households have more than three children. Households with seven or more children are estimated at 14.5%. The
main source of household income comes from agricultural products (74.7%), followed by work in the mines (10%)
and finally income from small businesses (7.5%).
In Miabi, work in the mines is the main source of income for more than 30% of the visited households. Livestock is
hardly mentioned by the visited households (0.1%). 2.5% of mothers surveyed have a physical disability. These are
concentrated in Kabeya Kamwanga.
Regarding nationality, all of mothers and guardians of children (100%) are national Congoleese.
Exclusive Breastfeeding and early breastfeeding
Exclusive breastfeeding is an important factor in improving the future health of children and may increase their
chances of survival. An infant who is not exclusively breastfed could be at a significantly higher risk that could lead to
negative consequences on the health and development of the child (such as dying from diarrhea or pneumonia)
compared to a child who exclusively breastfeeds for the first six months of life. In addition, breastfeeding strengthens
the immune system of infants and can protect them later in life against chronic diseases. WHO and UNICEF
recommend that infants be exclusively breastfed (EB) for the first six months of life for optimal growth, health and
development.2
Table 5 presents the results of the household survey on the prevalence of exclusive breastfeeding; At the question
whether or not the child was breastfed in the last 24 hours prior to the survey3; Out of the 199 children aged zero-
five months surveyed in six target health zones, 57.8% were exclusively breastfed the day before the survey.
The results of the multivariate analysis showed that EB is also associated with age and educational level factors.
Approximately 1/3 of the mothers questioned whose age varies between 14 and 17 years old and those over 45
2 OMS. (2017) 10 faits sur l’allaitement maternel 3FANTA assisted USAID’s Office. (2015) Indicator list and handbook for FFP projects, 133(21) WHO. 2010. Indicators for assessing infant and young child feeding practices, Part 2, Measurement, 91(78)

years old do not exclusively breastfeed infants aged zero-five months for the first six months of life. Mothers with no
education and those who have never attended school have a strong tendency to not exclusively breastfeed, what
shows that the level of education / schooling would influence the practice of exclusive breastfeeding. The lowest
prevalence of exclusive breastfeeding occurs in the health zones of Kabeya Kamwanga (21.2%), Miabi (23%) and
Cilundu (37.5%), which are considered to be in the stress phase / alert according to the severity scale based on IPC
/ OCHA phases4.
Although six out of 10 newborns are exclusively breastfed; the limitations of exclusive breastfeeding in the surveyed
area result mainly from the fact that the babies received pure water in the past 24 hours or other fluids; practice
more revealed in Kabeya Kamwanga, Miabi and Tshilenge.
It should be noted that the prevalence of exclusive breastfeeding presented above took into account the infant who
received breast milk as well as those who received oral rehydration solution (ORS), vitamins, minerals and / or
medication, but have not received any other food or liquid, including water.
Initiation of breastfeeding (early breastfeeding)
The results of this assessment showed that approximately 19% of infants born in the past 24 months were delayed
to the breast. This situation was typical in all six health zones, but higher in the health zones of Tshilenge (24%) and
Tshishimbi (20%), more precisely in the health areas of Bakwa Mpemba and Tshilanda.
While according to the WHO, providing breast milk to infants within 1 hour of birth (early initiation of
breastfeeding) ensures that the infant receives colostrum, or “first milk,” rich in protective factors, the likely
reasons for late breastfeeding cited by some key informants and the literature review are: (1) the common practice
of separating the newborn from the mother immediately after birth, (2) pre-lactation feeding, (3) sick mothers and /
or children as well as (4) cesarean section5.
Referring to the accuracy of the number of hours for cases of late breastfeeding, we have found that one out of five
newborns are put to the breast beyond two hours after birth. In the central village in the HZ of Cilundu, a mother
testified that she had breastfed her son four days after birth as well as two others after one day in Katanda & Bena
Ngandu in the HZ of Kasansa.
A head nurse specified that the place of delivery influences breastfeeding within one hour of birth. He said
"Mothers who breastfeed babies within an hour of giving birth is higher for mothers who gave birth in health
facilities and lower for mothers who gave birth outside of health facilities."
On average, eight out of 10 children aged six to 23 months received solid, semi-solid or soft foods during the day
before the survey. WHO defines the age range for this indicator from six to eight months, but given the small sample
of 55 children of this age; we redefined to include all children from six to 23 months (301).
4 Global NUTRITION CLUSTER. (2020) Nutrition Humanitarian Needs Analysis Guidance 5International Journal of Medical and Health Research. (Mars 2018). Cesarienne en milieu rural du Kasai Oriental (RD Congo): perceptions et vécu à Kasansa
et à Tshilenge

Minimum Dietary Diversity (MDD)
Figure 2 shows the results of the MDD indicator; the proportion of children aged six to 23 months with a minimum
dietary diversity of four or more distinct food groups in the last 24 hours before the survey is 5.3% overall.
Improving infant and young child feeding practices (IYCF) plays a critical role in improving infant nutrition,
health and child development and it is for this reason that the WHO recommends consuming at least four
food groups. In this case, if a child is fed of at least four food groups the day before, we can assume that; in
most populations, the child may have a higher probability of consuming at least one food of animal origin
and at least one fruit or vegetable in addition to usual or staple foods (cereals, roots or tubers).
Multivariate analysis proves that the educational level (schooling) of primary mothers is significantly
associated with a minimal dietary diversity compared to mothers who had no education. This may be
because educated mothers are more likely to have more information, understand educational messages
conveyed through different channels, create income-generating activities, and learn about feeding young
children.
In the intervention areas of the FFP project, 68% of children aged six - 23 months ate vegetables rich in
vitamin A and fruits during the last 24 hours, 96% received foods rich in iron and 24% ate foods of animal
origin. Whatever the child's age and whatever the breastfeeding situation, it is found that dairy products,
eggs and other fruits and vegetables were not consumed by more than nine out of 10 or 90% of children
aged six - 23 months. In general, the diversity of the diet seems chronically insufficient with an average of
food groups consumed by children aged six to 23 months of 2.4.
The diversity of the diet of children aged six to 23 months was determined on the basis of a 24-hour recall
method and showed that all seven food groups are poorly consumed in the six health zones. Fruits and
vegetables rich in vitamin A (68%) as well as legumes and nuts (96%) are the most common food consumed
by children. Note that the results presented in Table 7 were developed using recommended USAID
guidelines for indicators to assess infant and young child feeding practices (IYCF).6
Food consumption score (FCS)
Regarding the result on the food consumption score, out of the ten households visited, nearly five of
them (49.2%) had an acceptable score, i.e. adequate food intake, two a borderline score (19.8%) ie.
inadequate quality and three a poor score (31.0%) or inadequate quantity and quality.
6 WHO. 2007. Indicateurs pour évaluer les pratiques alimentaires de nourrisson et le jeune enfant 27(6)

The ACS7 calculation was based on a seven-day recall of the nine food groups and their standard weight
(weighting) and frequency of consumption; a composite score was used as a proxy indicator for food
consumption and therefore access to food.
Reduced Coping Strategies Index (rCSI)
The Reduced Coping Strategies Index counts the frequency and severity of behaviors that people engage in
when they don't have enough food or enough money to buy food.8
It is calculated to understand the adaptation capacities of households as well as their vulnerability to food
insecurity. Thus, we analyze the survival strategies (according to their frequency and severity) developed
by households to cope with this phenomenon.9
When households face difficulties in meeting their food needs, they resort to what are called food
adaptation strategies. In all health zones, the average reduced coping strategy index is low at 20.46 points.
Most of the households (96.8%) used at least one strategy; with almost half of the households surveyed
(46,8%) engaging or using emergency strategies such as borrowing food or relying on help from a friend or
relative as well as eating less or cheaper food.
Prevalence of malnutrition in children under five
According to the MUAC, 25.8% [22.7 - 29.2] of children suffer from Acute Malnutrition, which describes a
precarious nutritional situation with high risks of mortality among young children. The analysis of the
prevalence of Acute Malnutrition according to MUAC by sex shows that both girls and boys run the same
risk of being affected by Acute Malnutrition in the project implementation area. There is no significant
difference between the two sexes (p> 0.05). Analyzing a little more in detail, the analysis of the data by age
group shows that, children aged six-23 months are more affected by Acute Malnutrition with a rate of 27.7%
than those aged 24-59 months for which the rate is 25.3% but the difference is not statistically significant
with a value of p ˃ 0.05. Note that this survey was carried out during the food shortage period (August to
October / November), when household food security is the most nutritionally vulnerable compared to
other times of the year (January to July). The problem of the nutritional situation observed in the areas
targeted by the project interventions is not in itself an immediate triggering phenomenon. The hypotheses
to explain the high Acute Malnutrition rate could be the following:
• Food insecurity almost in all households due to the sale of a large part of their agricultural
production;
7 FANTA assisted USAID’s Office. (2015) Indicator list and handbook for FFP projects, 133(16) 8 Maxwell et Caldwell. (2008) The Coping Strategies Index : Field Methods Manual 9 WFP. (2009), EFSA Handbook 297 (80)

• Diamond exploitation and the transport of gravel in the mines by a large majority of the population
to the detriment of agricultural activities;
• Unsuitable habits and diet (consumption of unripe cassava, etc., diet not adapted to needs);
• Polygamy and unplanned and close births for mothers, young girls and adolescents;
• Access constraint to drinking water in some villages in the area;
• The low awareness of populations on essential family practices and on IYCF.

3. 5. Targeted health facility data
Figure 6 : Seniority in the HF
A total of 28 ITs and five ITAs were interviewed, of which more than half are of higher education. The majority of
respondents in the HFs have a significant seniority in these structures.
Table 13: HF staff
Doctors
Nurse Midwife CHW Matron Cleaners
/ hygienists
M F Total M F Total M F Total M F Total M F Total M F Total
Health Zone: CILUNDU
Makuambuyi (10) 0 0 0 3 0 3 0 0 0 0 0 0 0 4 4 1 0 1
Monka (7) 0 0 0 3 0 3 0 0 0 0 0 0 0 2 2 1 0 1
Health Zone: KABEYA KAMUANGA
Ciaciacia HF (11) 3 0 3 3 0 3 0 0 0 0 0 0 0 1 1 2 0 2
GRH (12) 0 0 0 4 1 5 0 1 1 0 0 0 0 3 3 2 0 2
Cincianku Hospital Center (12)
3 0 3 3 0 3 0 0 0 2 0 2 0 2 2 0 0 0
Dibula (9) 0 0 0 2 0 2 0 0 0 2 0 2 0 3 3 0 0 0
Ciondo (8) 0 0 0 2 0 2 0 0 0 0 2 2 0 2 2 1 1
Health Zone: KASANSA
Kasansa (7) 0 0 0 2 2 4 0 0 0 0 0 0 0 0 0 1 1 2
Kalonji south (10) 0 0 0 3 1 4 0 0 0 0 0 0 0 0 0 2 2 4
Lukalaba/est (6) 0 0 0 3 1 4 0 0 0 0 0 0 0 0 0 0 1 1
Mukongo (5) 0 0 0 1 2 3 0 0 0 0 0 0 0 0 0 0 1 1
Katenga (6) 0 0 0 2 2 4 0 0 0 0 0 0 0 0 0 0 1 1
Katenga (6) 0 0 0 2 2 4 0 0 0 0 0 0 0 0 0 0 1 1
Dinsanga (6) 0 0 0 2 2 4 0 0 0 0 0 0 0 0 0 0 1 1
Nsenga Nsenga (5) 0 0 0 3 0 3 0 0 0 0 0 0 0 0 0 0 1 1
Health Zone: MIABI
Central 2 (6) 0 0 0 2 1 3 0 0 0 0 0 0 0 1 1 1 0 1
Lukunza (6) 0 0 0 2 1 3 0 0 0 0 0 0 0 0 0 0 1 1
Bena mukendi (7) 0 0 0 3 1 4 0 0 0 1 0 1 0 0 0 0 1 1
Bakua cijiba HF (15) 0 0 0 3 1 4 0 1 1 8 0 8 0 0 0 1 1 2
Health Zone: TSHILENGE
24.2%
39.4%
15.2%
21.2%
<1 year >5 years 1-2 years 3-5 years
Figure 5 : HF respondent's education level
48%52%
Secondary
University

Cilenge (9) 0 0 0 4 2 6 0 0 0 0 0 0 0 1 1 0 1 1
Cimpuma (5) 0 0 0 2 0 2 0 0 0 0 0 0 0 1 1 0 1 1
Bena bilonda (6) 0 0 0 2 1 3 0 0 0 0 0 0 0 1 1 0 1 1
Cienda HF (6) 0 0 0 2 0 2 0 0 0 0 0 0 0 2 2 0 1 1
Luamuela2 (7) 0 0 0 2 1 3 0 0 0 0 0 0 0 1 1 0 1 1
Kabimba HF (7) 0 0 0 2 1 3 0 0 0 0 0 0 0 3 3 0 0 0
Nkusu (6) 0 0 0 2 1 3 0 0 0 0 0 0 0 1 1 0 1 1
Kampaci (5) 0 0 0 2 1 3 0 0 0 0 0 0 0 0 0 0 1 1
Bena mulumba HF (6) 0 0 0 3 0 3 0 0 0 0 0 0 0 2 2 0 0 0
Kalonji kinya (6) 0 0 0 1 1 2 0 0 0 0 0 0 0 2 2 0 1 1
Health Zone: TSHISHIMBI
Ditalala (6) 0 0 0 2 1 3 0 0 0 0 0 0 0 1 1 0 1 1
Kamisangi (5) 0 0 0 2 0 2 0 0 0 1 0 1 0 1 1 0 0 0
Tshianga HF (6) 0 0 0 3 0 3 0 0 0 0 0 0 0 0 0 0 2 2
Mukeba HF (6) 0 0 0 3 0 2 0 0 0 0 0 0 0 0 0 0 1 1
Overall average number of HF staff: 10
Of all the HF visited, the average number of staff is ten and the majority are male staff. A weak presence of CHWs
and Physicians is observed. The other staff cited in the majority of HFs are receptionists.
Figure 7 : Type of services offered by the HFs visited
100%
100%
100%
96.90%
96.90%
96.90%
93.90%
93.90%
93.90%
81.80%
63.60%
42.40%
0% 20% 40% 60% 80% 100% 120%
Consultation
Curative care
Reproductive health
Pre and postnatal consultation
PEV
Nutritional care (UNTI / UNTA / UNS)
Monitoring
Vit A supplementation
Health promotion and awareness activities
Screening and treatment of chronic diseases (Tuberculosis,leprosy, hypertension, diabetes, AIDS, etc.)
Capacity building
Laboratory service

Table 14: Summary information on HF
Health area Village Name of the health
facility Type of facility
Number of
villages covered by
the HF
Population covered by the HF
Partner who supports the HF
Men Women Boys
(under 5) Girls
(under 5) Total
Health Zone: CILUNDU Bakwa mbuyi Bk mbuyi Makuambuyi HF 8 ND ND ND ND ND PROSANI/USAID
Monka Q. Central Monka HF 6 12014 12504 2800 2914 30232
CARE INTERNATIONAL, PAM, PROSANI
Health Zone: KABEYA KAMUANGA
Ciaciacia Tshintomba Health facility ciaciacia HFR 14 5221 8740 1430 1824 17215
SC,PROSANI, THE GOVERNMENT,
CORDAID,UNFPA,PAD
Keena nkuna Mission GRH HF 7 6528 8998 730 1436 17692 SC
Cincianku Bena bowa Cincianku Hospital Center HFR 20 6015 6518 1402 1518 15453 SC AND PROSANI USAID
Dibula Dibula Dibula HF 22 3262 4065 761 948 9036 SC, APEDE, PROSSANI
Ciondo Ciondo Ciondo Hf 15 2562 3221 597 750 7130 SC AND APEDE
Health Zone: KASANSA
Kasansa Bena masengu Kasansa HF 11 7936 6283 1323 992 16534
PROFS, SC, PROSANI, UNICEF, ENABEL,
CORDAID, FDSS
Kalonji south Bena ngandu Kalonji sud HF 27 7722 8535 1626 2439 20322
PRODS, IGA, UNICEF,
SC, FDSS, PMI
Lukalaba est Nsulu wa lomba Lukalaba/est HF 3 8122 10259 429 2564 21374 PRODESS , USAID
Mukongo Lushonyi Mukongo HF 5 3021 3816 636 477 7950 USAID, PRODESS, CRS, CORDAID, SC
Katenga Katenga Katenga HF 3 5570 7094 1526 2181 16371 PRODS, SC, PROSANI
Katenga Katenga Katenga HF 3 5570 7094 1526 2181 16371 PRODS, SC, PROSANI
Dinsanga Bena kapianba Dinsanga HF 9 4037 4462 851 1274 10624 PROSANI, PRODESS
Nsenga nsenga Bena nzeba Nsenga nsenga HF 9 3446 5169 863 1292 10770 SC, PRODESS, USAID,CRS
Health Zone: MIABI
Central 2 Kakangayi Central 2 HF 10 3680 3831 858 893 9262 UE, SC, CONOPRO, CORDAID
Lukunza Bena kasonga 2 Lukunza Hf 6 4037 4196 934 977 10144
UE, UNICEF,
PROSANI,FDSS,PAM
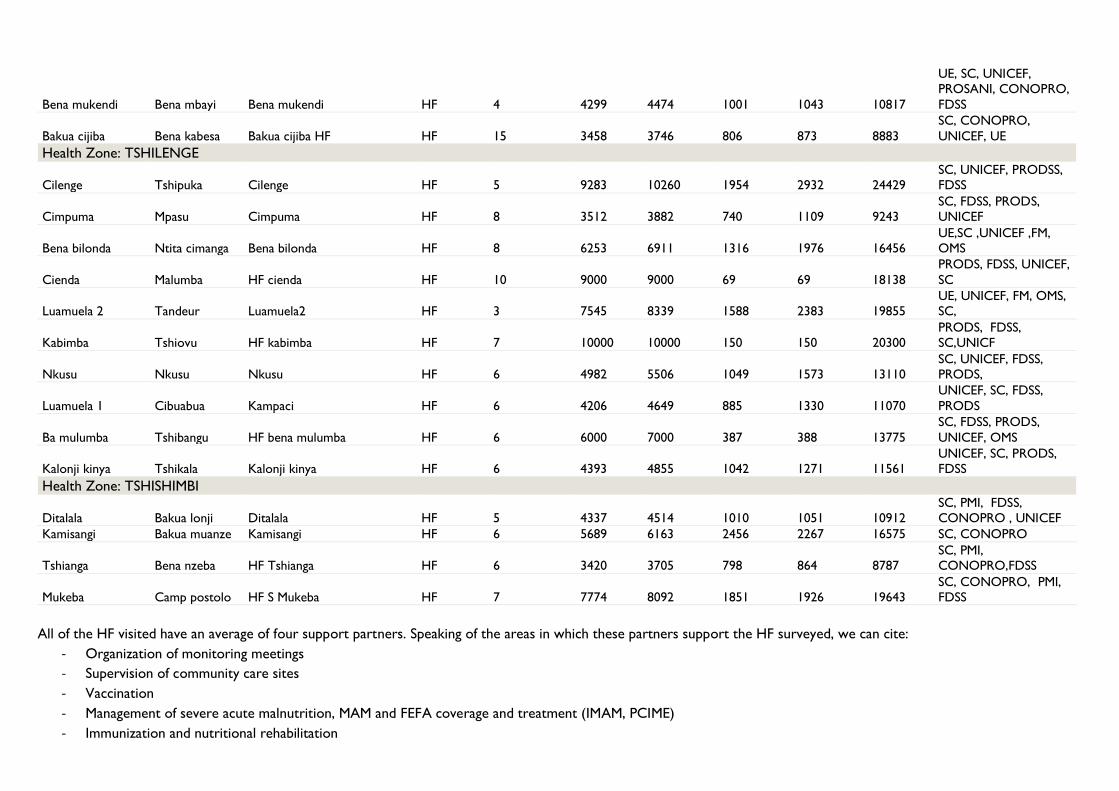
Bena mukendi Bena mbayi Bena mukendi HF 4 4299 4474 1001 1043 10817
UE, SC, UNICEF, PROSANI, CONOPRO,
FDSS
Bakua cijiba Bena kabesa Bakua cijiba HF HF 15 3458 3746 806 873 8883
SC, CONOPRO,
UNICEF, UE
Health Zone: TSHILENGE
Cilenge Tshipuka Cilenge HF 5 9283 10260 1954 2932 24429 SC, UNICEF, PRODSS, FDSS
Cimpuma Mpasu Cimpuma HF 8 3512 3882 740 1109 9243 SC, FDSS, PRODS, UNICEF
Bena bilonda Ntita cimanga Bena bilonda HF 8 6253 6911 1316 1976 16456 UE,SC ,UNICEF ,FM, OMS
Cienda Malumba HF cienda HF 10 9000 9000 69 69 18138
PRODS, FDSS, UNICEF,
SC
Luamuela 2 Tandeur Luamuela2 HF 3 7545 8339 1588 2383 19855 UE, UNICEF, FM, OMS, SC,
Kabimba Tshiovu HF kabimba HF 7 10000 10000 150 150 20300 PRODS, FDSS, SC,UNICF
Nkusu Nkusu Nkusu HF 6 4982 5506 1049 1573 13110 SC, UNICEF, FDSS, PRODS,
Luamuela 1 Cibuabua Kampaci HF 6 4206 4649 885 1330 11070
UNICEF, SC, FDSS,
PRODS
Ba mulumba Tshibangu HF bena mulumba HF 6 6000 7000 387 388 13775
SC, FDSS, PRODS,
UNICEF, OMS
Kalonji kinya Tshikala Kalonji kinya HF 6 4393 4855 1042 1271 11561 UNICEF, SC, PRODS, FDSS
Health Zone: TSHISHIMBI
Ditalala Bakua lonji Ditalala HF 5 4337 4514 1010 1051 10912
SC, PMI, FDSS,
CONOPRO , UNICEF
Kamisangi Bakua muanze Kamisangi HF 6 5689 6163 2456 2267 16575 SC, CONOPRO
Tshianga Bena nzeba HF Tshianga HF 6 3420 3705 798 864 8787 SC, PMI, CONOPRO,FDSS
Mukeba Camp postolo HF S Mukeba HF 7 7774 8092 1851 1926 19643
SC, CONOPRO, PMI,
FDSS
All of the HF visited have an average of four support partners. Speaking of the areas in which these partners support the HF surveyed, we can cite:
- Organization of monitoring meetings
- Supervision of community care sites
- Vaccination
- Management of severe acute malnutrition, MAM and FEFA coverage and treatment (IMAM, PCIME)
- Immunization and nutritional rehabilitation

- Malaria
- Drug supply
- HIV
- Tuberculosis
- Family Planning
- Epidemiological surveillance
- Capacity building (training)
Figure 8 : Data on nutrition services (IYCF and IMAM)
Table 15: Summary of IYCF activity data
Health Zone Number of existing relays
Number of active relays
HF providers or staff who are trained in IYCF and / or IYCF-U
RECOs associated with
the HF who have received orientation / training in IYCF and / or
IYCF-U
Existence of IYCF
support groups that are supported by the
HF
How many IYCF support groups have been set up
How many IYCF
support groups are currently
functional
Makuambuyi 65 32 2 2 Yes 8 8
Monka 150 75
2 15 Yes 13 13
Ciaciacia HF 120 78 1 5 Yes 14 10
GRH 125 63 10 5 Yes 7 7
Cincianku Hospital
Center 144 104
1 10 Yes 12 8
Dibula 75 38 2 5 Yes 18 12
Nutritional activities implemented by health facilities
Culinary demonstration
Individual counseling of FEFAs
Community awareness on IYCF
Screening for malnutrition
Nutritional care (UNTI / UNTA / UNS)
Activités nutritionnelles mises en place par les FOSA Cilundu Kabeya Kamuanga Kasansa Miabi Tshilenge Tshishimbi
Démonstration culinaire100% 60% 62,50% 100% 40% 25%
Counseling individuelle des FEFA100% 60% 90% 100% 90% 100%
Sensibilisation communautaire sur AN JE100% 100% 100% 100% 60% 100%
Dépistage de la malnutrition 100% 100% 100% 100% 100% 100%
Prise en Charge N utritionnelle (UN TI/UN TA/UN S)100% 100% 100% 100% 100% 100%
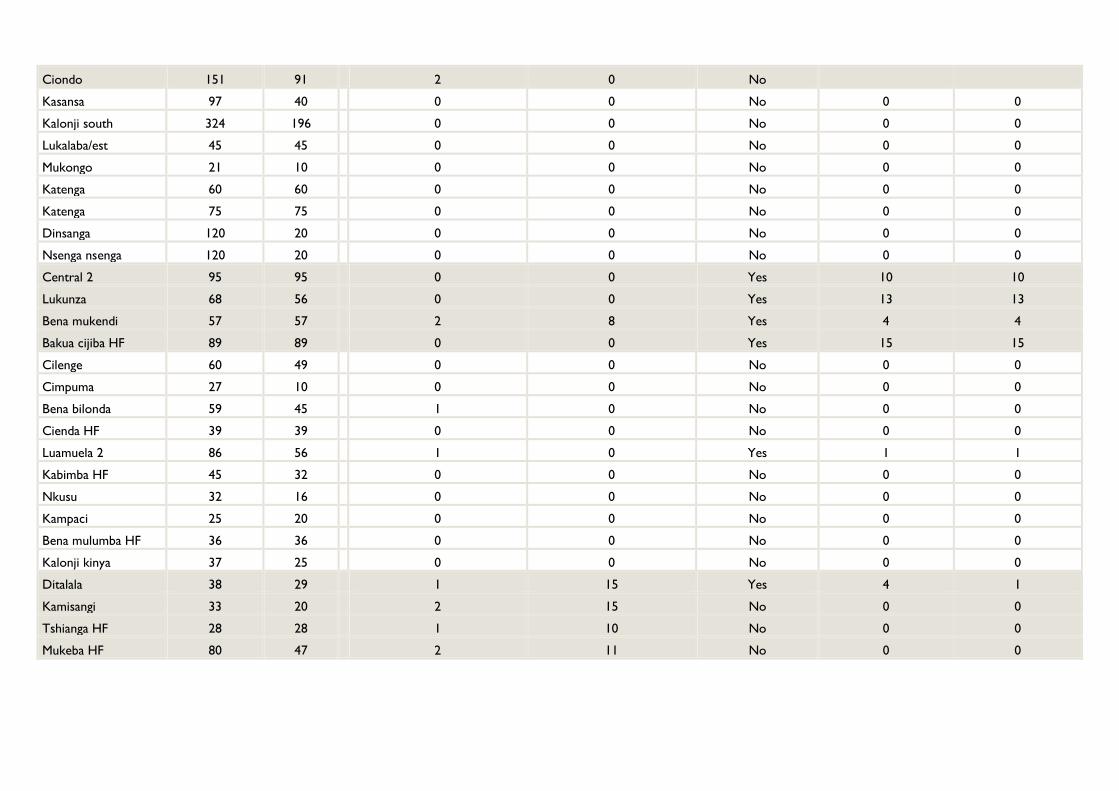
Ciondo 151 91 2 0 No
Kasansa 97 40 0 0 No 0 0
Kalonji south 324 196 0 0 No 0 0
Lukalaba/est 45 45 0 0 No 0 0
Mukongo 21 10 0 0 No 0 0
Katenga 60 60 0 0 No 0 0
Katenga 75 75 0 0 No 0 0
Dinsanga 120 20 0 0 No 0 0
Nsenga nsenga 120 20 0 0 No 0 0
Central 2 95 95 0 0 Yes 10 10
Lukunza 68 56 0 0 Yes 13 13
Bena mukendi 57 57 2 8 Yes 4 4
Bakua cijiba HF 89 89 0 0 Yes 15 15
Cilenge 60 49 0 0 No 0 0
Cimpuma 27 10 0 0 No 0 0
Bena bilonda 59 45 1 0 No 0 0
Cienda HF 39 39 0 0 No 0 0
Luamuela 2 86 56 1 0 Yes 1 1
Kabimba HF 45 32 0 0 No 0 0
Nkusu 32 16 0 0 No 0 0
Kampaci 25 20 0 0 No 0 0
Bena mulumba HF 36 36 0 0 No 0 0
Kalonji kinya 37 25 0 0 No 0 0
Ditalala 38 29 1 15 Yes 4 1
Kamisangi 33 20 2 15 No 0 0
Tshianga HF 28 28 1 10 No 0 0
Mukeba HF 80 47 2 11 No 0 0

Table 16: Anthropometric equipment and inputs
HF
Anthropometric equipment available
for care at the HF (in quantities)
Inputs available for care at the HF level (and quantities)
Scale Toise MUAC RUTF (# of
bags) ASPE (# of bags)
F100 (# of boxes)
F75 (# of boxes)
RESOMA
L (# of bags)
AMOXICILLIN (pieces)
MEBENDAZOLE (pieces)
VITAMI
N A (gels)
Makuambuyi 2 1 2 1002 6750 0 0 0 45 0 1200
Monka 1 3 3 3900 0 0 0 0 60 0 1000
Ciaciacia HF 2 1 10 2850 5250 0 6 0 6800 6700 1000
GRH 10 1 30 1200 0 0 0 0 1500 1000 3000
Cincianku
Hospital Center 4 2 15 2508 0 0 5 1 30 1900 1000
Dibula 2 1 30 2006 1200 0 0 0 157 0 2500
Ciondo 1 1 0 1350 1050 0 0 0 0 0 1000
Kasansa 4 2 2 664 0 0 0 0 0 0 0
Kalonji south 2 2 2 1164 0 0 0 0 15 0 3000
Lukalaba/est 4 2 2 527 0 0 0 0 0 0 0
Mukongo 5 1 10 1500 0 0 0 0 15 0 1000
Katenga 2 1 10 7503 0 0 0 0 0 0 3000
Katenga 2 1 10 750 0 0 0 0 0 0 3000
Dinsanga 2 3 25 300 0 0 0 0 15 0 3000
Nsenga Nsenga 4 1 12 1050 0 0 0 0 12 0 2000
Central 2 1 1 10 255 5700 0 0 0 50 1200 1200
Lukunza 2 2 20 1500 6900 0 0 0 32 5000 1000
Bena Mukendi 3 3 10 1257 0 0 0 0 37 1650 697
Bakua Cijiba HF 1 1 2 0 3000 0 0 0 84 2000 1404
Cilenge 1 2 20 0 0 0 0 0 0 0 0
Cimpuma 1 2 15 0 0 0 0 0 0 0 0
Bena Bilonda 1 1 25 0 0 0 0 0 0 1000 1500
Cienda HF 3 1 3 0 0 0 0 0 7 550 1973
Luamuela 2 4 1 5 850 0 0 0 0 50 1000 1000

Kabimba HF 2 2 4 1050 0 0 0 0 40 2700 0
Nkusu 1 1 30 0 0 0 0 0 0 0 0
Kampaci 2 1 15 1100 0 0 0 0 100 0 0
Bena Mulumba HF 3 1 5 300 0 0 0 0 140 263 0
Kalonji Kinya 3 2 15 153 0 0 0 0 110 0 1000
Ditalala 0 0 0 0 0 0 4000 0
Kamisangi 2 1 10 0 0 0 0 0 30 0 100
Tshianga HF 1 2 30 3 0 0 0 0 6240 4400 72
Mukeba HF 2 2 6 0 0 0 0 0 66 300 1000
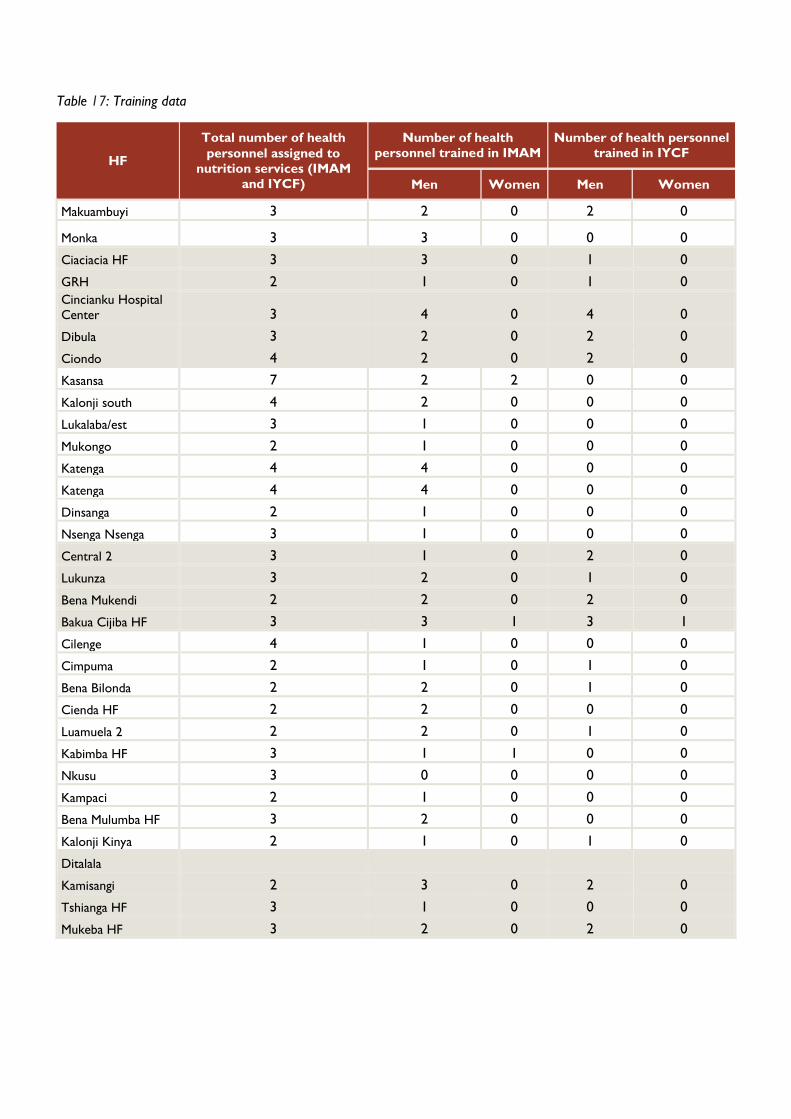
Table 17: Training data
HF
Total number of health
personnel assigned to
nutrition services (IMAM and IYCF)
Number of health personnel trained in IMAM
Number of health personnel trained in IYCF
Men Women Men Women
Makuambuyi 3 2 0 2 0
Monka 3 3 0 0 0
Ciaciacia HF 3 3 0 1 0
GRH 2 1 0 1 0
Cincianku Hospital Center 3 4 0 4 0
Dibula 3 2 0 2 0
Ciondo 4 2 0 2 0
Kasansa 7 2 2 0 0
Kalonji south 4 2 0 0 0
Lukalaba/est 3 1 0 0 0
Mukongo 2 1 0 0 0
Katenga 4 4 0 0 0
Katenga 4 4 0 0 0
Dinsanga 2 1 0 0 0
Nsenga Nsenga 3 1 0 0 0
Central 2 3 1 0 2 0
Lukunza 3 2 0 1 0
Bena Mukendi 2 2 0 2 0
Bakua Cijiba HF 3 3 1 3 1
Cilenge 4 1 0 0 0
Cimpuma 2 1 0 1 0
Bena Bilonda 2 2 0 1 0
Cienda HF 2 2 0 0 0
Luamuela 2 2 2 0 1 0
Kabimba HF 3 1 1 0 0
Nkusu 3 0 0 0 0
Kampaci 2 1 0 0 0
Bena Mulumba HF 3 2 0 0 0
Kalonji Kinya 2 1 0 1 0
Ditalala
Kamisangi 2 3 0 2 0
Tshianga HF 3 1 0 0 0
Mukeba HF 3 2 0 2 0

en?
96.90% of the health facilities visited provide treatment for acute malnutrition; and among them only 9.30% support
other care sites.
Table 18: Number of people admitted to health facilities (including supported sites) for the management of acute
malnutrition
HF
April - June 2020 July - September 2020
Men Women Boys Girls Men Women Boys Girls
Makuambuyi 0 72 26 29 0 102 51 51
Monka 0 159 10 11 0 283 16 16
Ciaciacia HF 0 0 56 51 0 0 17 19
GRH 30 30 32 28 23 21 34 18
Cincianku Hospital
Center 0 0 41 35 0 0 11 12
Dibula 0 0 53 42 0 0 48 41
Ciondo 0 0 0 0 0 0 0 0
Kasansa 0 0 21 28 0 0 18 20
Kalonji south 0 0 20 32 0 0 40 48
Lukalaba/est 0 0 19 31 0 0 27 33
Mukongo 0 0 8 14 0 0 5 19
Katenga 0 0 4 4 0 0 17 13
Katenga 0 0 4 4 0 0 17 13
Dinsanga 0 0 37 19 0 0 22 17
Nsenga nsenga 0 0 14 20 0 0 17 17
Central 2 0 0 0 0 0 0 0 0
Lukunza 0 17 49 51 0 36 23 27
Bena mukendi 0 5 5 5 0 5 5 5
Bakua cijiba HF 0 0 0 0 0 0 0 0
Cilenge 34 40 34 40 36 49 36 49
Cimpuma 30 40 30 40 12 23 12 23
Bena bilonda 0 0 32 29 0 0 44 50
Cienda HF 0 0 63 23 0 0 11 16
Luamuela2 0 0 17 26 0 0 35 34
Kabimba HF 0 0 25 22 0 0 30 23
Figure 10 : Organization of the management of acute malnutrition
Figure 9 : HF supports other acute malnutrition care sites
3.1%
96.9%
No Yes
9.3%
90.7%
Yes No

Nkusu 20 29 20 29 25 35 25 35
Kampaci 25 33 25 33 15 25 15 25
Bena mulumba HF 0 0 19 11 0 0 13 24
Kalonji kinya 16 17 16 17 16 20 16 20
Ditalala
Kamisangi 0 316 17 14 0 225 33 28
Tshianga HF 0 10 67 78 0 27 63 70
Mukeba HF 0 0 62 74 0 0 58 64
Total 155 768 826 840 127 851 759 830
Accumulation 2589 2567
As shown in Table 18, during the period from April to September 2020, approximately 5,156 people were admitted
to the health facilities visited in the six health zones for the management of acute malnutrition. The disaggregated
data shows a reconciliation between data for the April - June 2020 (2589) and July - September 2020 (2567) periods.
Over 60% of admissions are represented by children. Male children were more admitted (91.9%) against a low
proportion of 8.1% of girls.

Indicator Baseline Initial target Proposed
target
Acute Malnutrition : is a population-based indicator and represents
total acute malnutrition defined by the presence of bilateral edema
and / or wasting expressed by MUAC <125 mm.
25,8% 14,5% >10%
Severe Acute Malnutrition (SAM): SAM is defined by the presence
of bilateral edema or severe emaciation expressed by an MUAC
<115 mm
10,4% 4,5% >2%
Proportion of infants who were breastfed within 1 hour of birth
(Number of infants born within 24 hours and breastfed within 1
hour of birth / Number of infants born within 24 hours)
81% 51,9% 95%
Proportion of children aged zero-five months who are exclusively
breastfed (Number of children aged zero-five months who
received only breast milk during the day before the survey /
Number of children aged zero-five months)
57,8% 47,3% 70%
Proportion of children aged 12 - 24 months who are still breastfed
(Number of children aged 12-24 months who were breastfed
during the day before the survey / Number of children aged 12 -
24 months)
Not Known 66% 60%
Proportion of children aged six to eight months who receive solid,
semi-solid or soft foods (Number of children aged six to eight
months who received solid, semi-solid or soft food during the day
before 'survey / Number of children aged six to eight months)
68% 79,3% 75%
Proportion of children aged six-23 months who receive at least
four separate food groups (Number of children aged six-23
months who received at least four food groups during the day
before the survey / Number of children aged six-23 months
5,3% 17,2 10%
Proportion of children aged six - 23 months who receive solid,
semi-solid or soft foods with a minimum frequency or more
(depending on whether they were breastfed or not) (Number of
children aged six - 23 months who received solid, semi-solid or
soft foods at a minimum frequency or more during the day before
the survey / Number of children aged six - 23 months)
80% 34,6% 85%
Proportion of breastfed children aged six - 23 months who had a
minimum dietary diversity score and minimum frequency of meals
5,3% 17,2% 17,2%
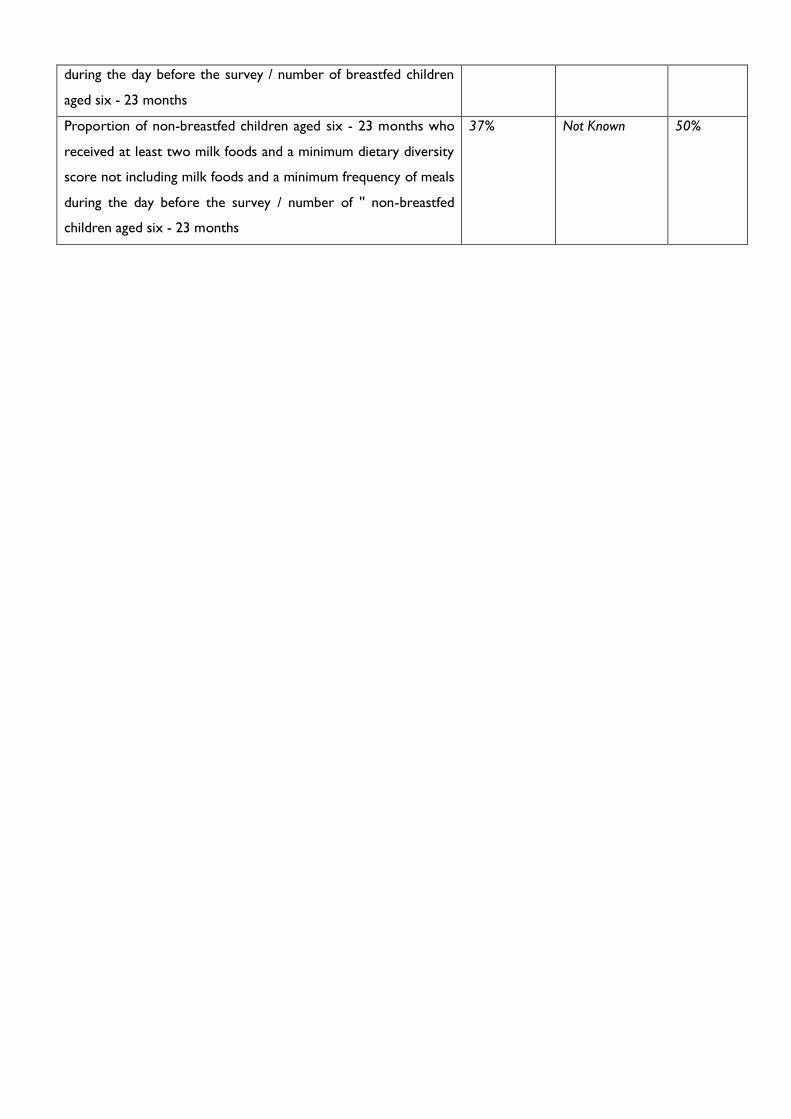
during the day before the survey / number of breastfed children
aged six - 23 months
Proportion of non-breastfed children aged six - 23 months who
received at least two milk foods and a minimum dietary diversity
score not including milk foods and a minimum frequency of meals
during the day before the survey / number of '' non-breastfed
children aged six - 23 months
37% Not Known 50%

4. CONCLUSION
The USAID / FFP project baseline assessment succeeded in highlighting baseline values for key indicators
and provided rigorous evidence on the prevailing nutritional situation in the six targeted health zones (Miabi,
Cilundu, Kabeya Kamuanga, Kasansa, Tshitenge and Tshishimbi) before the implementation of the activities.
This report was able to collect and define these benchmarks as well as to collect a large amount of data
and data on health facilities. The purpose of this survey was to establish the basis of the key indicators of
the project and constitutes the basis for measuring the performance of the project over time in the six
health zones. This involved in particular measuring the key indicators as defined in the logical framework of
the project "Increase the nutritional security of vulnerable populations in the province of Kasai Oriental"
through a baseline assessment. This benchmark assessment highlights the following indicators:
- Exclusive Breastfeeding Rate (EB): 57.8% of children zero to five months are exclusively breastfed
- Dietary diversity score (DDS): 5.3% of children aged six to 23 months receive a minimum acceptable
diet
- The prevalence of severe acute malnutrition in children under five is estimated at 10.4%
- 49.2% of households have an acceptable food consumption score
- The Reduced Index of Coping Strategies (rCSI) is 20,46
5. RECOMMENDATIONS
- Advocate to put in place multisector approaches that integrate food security, health, water, hygiene
and sanitation, social protection to effectively fight against chronic malnutrition, which results in
stunted growth.
- Build the capacities of healthcare providers on the protocol for the management of acute
malnutrition.
- Establish community dynamics by involving community leaders and key actors.