Survey of the development and emotional well-being ... - Dawba

1
Report on the Development of the University Experience Survey
Ali Radloff, Hamish Coates, Richard James, Kerri-Lee Krause
December 2011

2
Contents Contents ........................................................................................................................................ 2
Executive Summary ...................................................................................................................... 4
Overview ................................................................................................................................... 4
Recommendations ..................................................................................................................... 4
Introduction ................................................................................................................................... 6
Overview of the UES project .................................................................................................... 6
Context of the UES project ....................................................................................................... 7
Development of the UES .............................................................................................................. 8
Overview of the 2011 development .......................................................................................... 8
Development of the conceptual structure ................................................................................. 9
Development of items and focus areas ................................................................................... 11
Context and demographic questions ....................................................................................... 13
Validation of the University Experience Questionnaire (UEQ) ................................................. 14
Overview of the validation processes ..................................................................................... 14
Pre-pilot focus groups ............................................................................................................. 14
Other pre-pilot validation ........................................................................................................ 16
Post-pilot validation ................................................................................................................ 17
Development of the final UEQ ............................................................................................... 18
Methods developed for the UES ................................................................................................. 19
Overview ................................................................................................................................. 19
Confidentiality and privacy ..................................................................................................... 20
Student population definition .................................................................................................. 20
Student selection and sampling ............................................................................................... 22
UEQ operationalisation ........................................................................................................... 23
Deployment approach ............................................................................................................. 24
Fieldwork ................................................................................................................................ 25
Quality assurance .................................................................................................................... 28
National and institutional reporting ........................................................................................ 29
Uses of UES data .................................................................................................................... 29
References ................................................................................................................................... 31
Appendices .................................................................................................................................. 33
Appendix A: Delivered University Experience Questionnaire (UEQ) ................................... 33
Appendix B: Report on findings from secondary sources of information .............................. 35
Appendix C: Independent review of the University Experience Survey ................................ 57
Appendix D: University Experience Questionnaire psychometric analyses .......................... 68
Appendix E: Key findings for key analysis groups ................................................................ 83
3
Appendix F: University Experience Survey Project Advisory Group (UES PAG) composition and Terms of Reference .......................................................................................................... 95
Appendix G: UES Consortium Terms of Reference for ‘development of a University Experience Survey measuring dimensions of higher education students’ university experience’ .............................................................................................................................. 96
Appendix H: UES Design Consultation Paper ..................................................................... 100

4
Executive Summary
Overview In 2011, the Department of Education, Employment and Workplace Relations (DEEWR) commissioned a Consortium led by the Australian Council for Educational Research (ACER) and including the University of Melbourne’s Centre for the Study of Higher Education (CSHE) and the Griffith Institute for Higher Education (GIHE) to develop an instrument and methodology for a new national survey of the experience of university students—the University Experience Survey (UES). The ‘UES Consortium’ was led by Professors Hamish Coates, Richard James and Kerri-Lee Krause. Ali Radloff managed the project. The UES is one of a number of initiatives being developed by the Australian Government to help ensure the ongoing improvement in the quality of teaching and learning in Australian universities. The project brief required the Consortium to develop an instrument and method for allocating performance-based funds for continuous quality improvement. Other possible secondary uses for UES data such as public reporting were proposed during the development of the UES. The survey instrument and methods were developed between April and November 2011, anticipating that the UES would be conducted annually with first- and final-year undergraduate students in Australian Table A Universities from 2012 onwards. The UES Development Report includes information on the design, production and validation of the survey instrument, methodology and reporting. Government policy changes in November 2011 which discontinued earlier plans for performance-based funding for teaching and learning necessarily stimulated fresh interest in investigating potential uses for UES data. While the nationally developed UES may have the potential to be used for a range of reasons, further instrument development would be required to ensure that the UES collects valid data and delivers relevant results.
Recommendations A number of recommendations for the future UES have been formed by the Consortium, building on design, technical development and extensive consultation with the sector: Recommendation 1: Focus areas of the UES
It is recommended that the UES measures three core areas of student experience: Learner Engagement, Teaching and Support, and Educational Development.
Recommendation 2: Baseline version of the UEQ
It is recommended that the version of the UEQ reproduced in Appendix A of this UES Development Report be used as a baseline instrument to be further developed to enhance its relevance to informing student choice and continuous improvement. It is also recommended that institutions be able to add approved optional items to the standard form to assist with continuous quality improvement.
Recommendation 3: Population definition
It is recommended that the UES focus both on first-year and final-year undergraduate, bachelor pass students’ experiences.

5
Recommendation 4: Student selection strategy
It is recommended that scientific sampling methods—and, where necessary a census—be used to select students for the UES, and that sampling be designed to yield discipline-level reports for each university.
Recommendation 5: Mode of survey delivery
It is recommended that the UES be administered using a range of modes, primarily online, but also with the use of Computer Assisted Telephone Interviewing (CATI) and paper surveying.
Recommendation 6: Administration approach
To ensure consistency and efficiency it is recommended that the UES be administered independent of universities.
Recommendation 7: Fieldwork timing
It is recommended, in terms of fieldwork timing, that students are surveyed at the beginning of their second semester of bachelor degree study and in their penultimate semester of bachelor degree study.
Recommendation 8: Target response rate
It is recommended that a ‘UES Response Rate Strategy’ be developed and implemented in conjunction with the sector as a whole. A target response rate of 35 per cent is proposed for use with the UES to assist in securing a sufficient number and range of responses, and this target response rate should be reviewed as the UES develops.
Recommendation 9: Protocols and standards for data use
It is recommended that certain standards and agreements be developed to guide how governmental agencies and universities use UES data.
Recommendation 10: Further development of the UES
It is recommended that the UES be reviewed and refined during 2012 with a focus on informing student choice and continuous improvement relevant to key stakeholders in light of recent policy changes.

6
Introduction
Overview of the UES project In 2011, the Department of Education, Employment and Workplace Relations (DEEWR) commissioned a Consortium led by the Australian Council for Educational Research (ACER) and including the University of Melbourne’s Centre for the Study of Higher Education (CSHE) and the Griffith Institute for Higher Education (GIHE) to develop an instrument and methodology for a new national survey of the experience of university students—the University Experience Survey (UES). The Terms of Reference for this development project are reproduced in Appendix G. The project team was led by Professors Hamish Coates, Richard James and Kerri-Lee Krause. Ali Radloff managed the development. The development team was advised by two expert consultants—Professors Sally Kift (Queensland University of Technology) and Sid Nair (University of Western Australia). Expert advice and consultation was conducted with international higher education and survey experts, and with the Australian university sector. The UES is one of a number of initiatives being developed by the Australian Government to help ensure the ongoing improvement in the quality of teaching and learning in Australian universities. The project brief required the Consortium to develop an instrument and method for allocating performance-based funds for continuous quality improvement. Other possible secondary uses for UES data such as public reporting were proposed during the development of the UES. Performance-based funding (PBF) in Australian higher education has a short but dynamic history. In 1996, Anderson, Johnson and Milligan outlined options for PBF through measuring various teaching and learning indicators. This thinking was furthered in the Learning and Teaching Performance Fund (Nelson, 2003), established to reward universities that provided evidence of excellence in teaching and learning. In the 2009-2010 Federal Budget the Australian Government announced several new initiatives to help improve quality in Australian Higher Education including the re-introduction of PBF resting on institutional outcomes on indicators of student attainment, participation, engagement and quality (DEEWR, 2009a). The UES was developed to provide evidence on educational effectiveness for the purpose of this new PBF regime. With the broad ‘PBF context’ in mind, the project team developed a highly-focussed and relatively short actuarial instrument that is operationally efficient to implement, resonates with students and universities, and which measures widely-accepted determinants and characteristics of the quality of the student experience. The survey was designed to focus on aspects of the student experience that are measurable and that are linked with learning and development outcomes. Importantly, the UES was designed to provide reliable, valid and generalisable information to the Australian Government and to universities. Because of its high-stakes accountability rationales, the UES instrument was focused on aspects of the student experience for which universities could reasonably be assumed to have responsibility. The UES instrument—the University Experience Questionnaire (UEQ)—and the UES survey methods were developed from April to November 2011. It is anticipated that the UES will be

7
conducted annually with first- and final-year undergraduate students studying at Australian Table A Universities. This UES Development Report provides an overview of the development of the UES that took place in 2011. It includes information on the development and validation of the UEQ, survey methodology and reporting and incorporates recommendations for future administrations that were formed by the UES Consortium after extensive consultation with the sector and findings from the pilot administration. The report does not provide technical advice on how UES data might be analysed statistically and reported (for instance, see: Marks & Coates, 2007, Coates & Ainley, 2007; Coates, 2008). Towards the end of this development project, the Australian Government announced in November 2011 as part of broader policy reforms that it would no longer allocate PBF based on student experience or quality of learning outcomes, including the UES. It flows from this policy change that—subject to further policy development—UES data will no longer be used by the Australian Government to allocate performance-based funds. This policy change, linked closely with the primary and motivating rationale for the technical development, provokes questions about the continuing rational and sustainability of the instrument and collection. Put simply: Net its driving policy rationales, does the UES still have a valuable role to play in Australian higher education? A broad and long-term view suggests that the answer is a clear ‘yes’—that there is enduring value in a government-sponsored national collection of information on students’ experience of higher education—but that further improvement and positioning work is required. At the UES National Forum in May 2011 the government proposed that UES results could be published on the ‘MyUniversity’ website. The UES Consortium recommends that further development be undertaken to ensure that the UES provides information that would be useful for potential students. As the UES survey instrument was developed with the primary purpose of allocating performance-based funds, the instrument will need further development to ensure it collects data that is as useful as possible for informing potential students about where they might study. The initial UES policy intent saw the results stimulating each institution’s own continuous improvement through external performance-based funding. Even without PBF, UES results could still be used by institutions for internal improvement, along with data from a wide-range of other collections. Of course, continuous quality improvement is by definition tightly linked with strategy and operations, and it takes time—typically three to five years—to embed data collections into within-institution quality, management and leadership systems. As a well-designed government-sponsored instrument, the UES has the potential to find its place among other surveys currently in the marketplace.
Context of the UES project A Review of Australian Higher Education (Bradley, Noonan, Nugent and Scales, 2008) was conducted in 2007 and made recommendations about many facets of teaching and learning. The need for national information about students’ experience at university was recognised, and it was recommended that “the Australian Government require all accredited higher education providers to administer the Graduate Destination Survey, Course Experience Questionnaire and the Australasian Survey of Student Engagement [AUSSE] from 2009 and report annually on the

8
findings” (2008: 80). The review’s endorsement of the AUSSE highlighted the policy value of cross-institutional information about current students’ learning and development—a major new development for Australian higher education. In its 2009 response to the review, Transforming Australia’s Higher Education System, the Australian Government announced its intention to introduce performance funding for universities. In December 2009, the Australian Government released a discussion paper outlining an Indicator Framework for Higher Education Performance Funding (DEEWR, 2009b). This proposed a series of potential performance indicators for measuring quality and equity in Australian public universities for use under a new performance funding system, one of which was a new University Experience Survey to measure the quality of student experience. In October 2010, the Australian Government released a draft Performance Framework that included the UES as a performance indicator to assess institutional performance. Australia has a rich history in designing survey instruments for higher education, providing a strong foundation and setting high expectations for the UES. Yet despite this background, very few prior instruments and data collections had been designed specifically for the allocation of performance-based funds. With this rationale in mind, the UES was designed to measure the most relevant aspects of the student experience that research has shown to be associated with high-level learning outcomes for students, to measure aspects of undergraduate students’ experience at university in ways that can be generalised across all institutions, educational contexts and different demographic groups, and to focus on aspects of the student experience that can be shaped and influenced by universities. Given the high-stakes accountability rationales, at all stages it has been considered important that development and deployment of the UES meets the highest technical standards and is operationally efficient. To ensure public confidence, the UES instrument and methods have been designed and managed in ways that are efficient, transparent, and fully auditable. To achieve these goals, the development has drawn upon a great amount of feedback from the sector. Consultations have been conducted with various stakeholders to inform the development of the instrument, and an independent technical review of the UES development was commissioned (see Appendix C).
Development of the UES
Overview of the 2011 development The UES development process drew upon the UES Consortium’s extensive expertise in higher education research and management, and in designing and conducting complex national and international surveys. The development involved extensive consultation with experts in the field and the sector more broadly. The process of developing the final UEQ included an initial validation of the draft survey instrument through consultation with experts and the sector more broadly and by conducting focus groups with students. Based on this content validation a draft version of the UEQ was piloted with students, which was then further refined following the pilot administration based on findings from psychometric testing, further review of items and an independent technical review. Throughout the development period, the UES Consortium has undertaken extensive consultation with the sector and other key stakeholders. The consultative manner in which the
9
UES was developed has increased buy-in across the sector, and has also helped to ensure the relevance and validity of the collection by involving institutions and people in the development who may later use the survey. In 2011, input and feedback into the UES development was sought and received from higher education experts, the UES Project Advisory Group and the sector at large. Throughout the UES development and deployment, the UES Consortium sought formal input into the UES development, methodology and instrument via:
• feedback on an initial and revised version of a design paper—the UES Design Consultation Paper (see Appendix H);
• presentations at conferences and key meetings, in particular the May 2011 UES National Forum;
• conversations across the Australian higher education sector and internationally; • focus groups with Australian university students; • discussions with staff working in the university sector; • a pilot administration to close to 150,000 students in 24 Table A Australian universities; • consultations with national and international domain and technical experts; and • the ongoing role of the UES Project Advisory Group in providing guidance to the
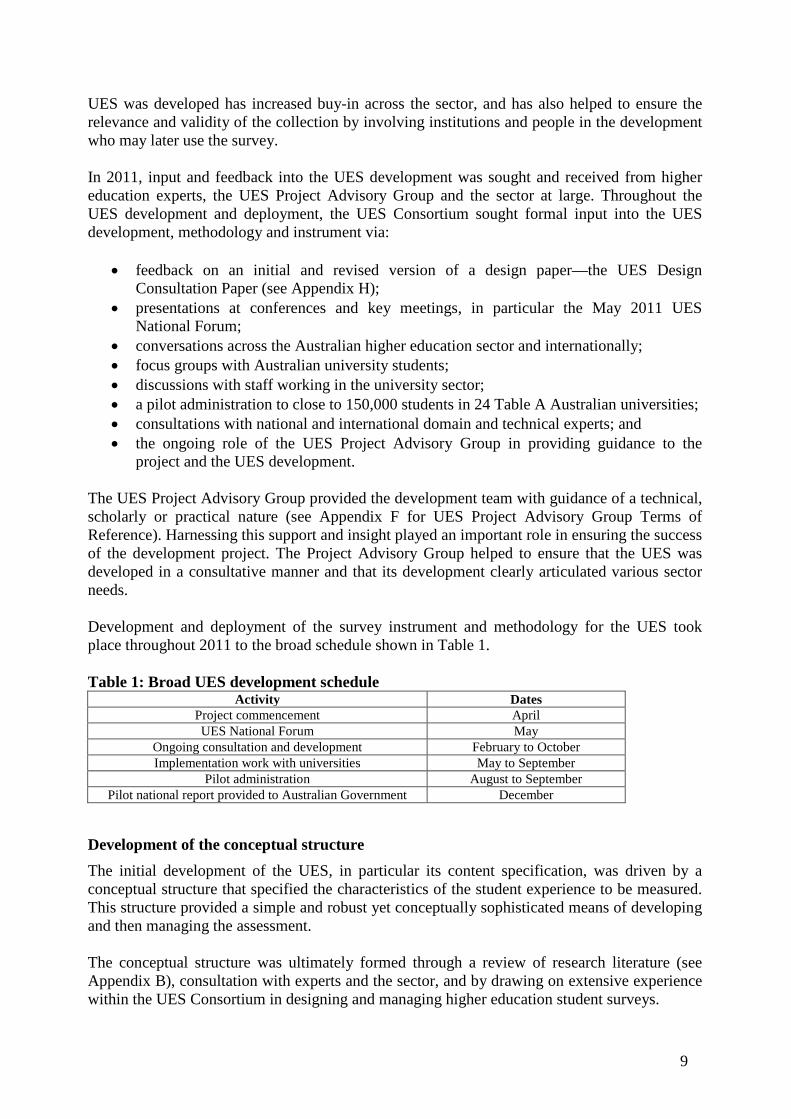
project and the UES development. The UES Project Advisory Group provided the development team with guidance of a technical, scholarly or practical nature (see Appendix F for UES Project Advisory Group Terms of Reference). Harnessing this support and insight played an important role in ensuring the success of the development project. The Project Advisory Group helped to ensure that the UES was developed in a consultative manner and that its development clearly articulated various sector needs. Development and deployment of the survey instrument and methodology for the UES took place throughout 2011 to the broad schedule shown in Table 1. Table 1: Broad UES development schedule
Activity Dates Project commencement April UES National Forum May
Ongoing consultation and development February to October Implementation work with universities May to September
Pilot administration August to September Pilot national report provided to Australian Government December
Development of the conceptual structure The initial development of the UES, in particular its content specification, was driven by a conceptual structure that specified the characteristics of the student experience to be measured. This structure provided a simple and robust yet conceptually sophisticated means of developing and then managing the assessment. The conceptual structure was ultimately formed through a review of research literature (see Appendix B), consultation with experts and the sector, and by drawing on extensive experience within the UES Consortium in designing and managing higher education student surveys.

10
Clearly, something as broadly conceived as the ‘student experience’ could be measured in a wide variety of ways. The areas which the UES measures builds on practical experience, a distillation of research insights, and a structure that has been considered by both the UES Consortium and the sector to be clarifying and useful. In settling on a conceptual structure to guide the development of the UEQ, feedback taken from consultation with experts and stakeholders was essential to ensure that the UES was conceptualised and contextualised in appropriate ways. Because of this, a key consultation point, therefore, was to determine the focus of the survey instrument. As part of the design process stakeholders were asked to reflect on their own experiences in providing advice to the UES Consortium on dimensions to be measured by the survey instrument with the advice that items should relate to:
• current research into what matters in higher education teaching, learning and the student experience;
• first-year and later-year university education, and the student experience; • the potential uses of the data for accountability, transparency and other policy
initiatives; and • the extent to which universities can influence or can legitimately be seen as having
responsibility over certain facets of the student experience. The conceptual structure developed for the UEQ was ultimately formed through review of research, consultation, and by drawing on extensive experience in designing and managing higher education student surveys. Figure 1 sketches the structure, which received broad stakeholder support throughout the development process. Simply, the structure reflects the proposition that educational development is a product of both student involvement and institutional support and that these broad aspects of the student experience are complexly intertwined.
Figure 1: UES conceptual structure The three concepts—Learner Engagement, Teaching and Support and Educational Development—are underpinned by significant research and practice, both in Australia and abroad, and received strong support during consultation with the higher education sector. Learner Engagement includes the extent to which students are engaged and are helped to
Teaching and Support
Educational Development
Learner Engagement

11
engage with their studies. Teaching and Support refers to students’ judgements on the quality of provision or delivery of education by their university and teaching staff. Educational Development denotes student self-reports on their perceived learning and skills developed through their experience in higher education experience. Initial feedback and input from universities and other stakeholders on the focus and content of the UES instrument was received during the May 2011 UES National Forum. Written feedback was then invited from Table A universities on the UES Design Consultation Paper. This feedback was collated and used to revise the paper, and revised version was circulated to a broader group of stakeholders for further feedback. All feedback received at the forum, on the Design Consultation Paper and informally was factored into the focus and content of the pilot survey instrument. Altogether, this work converged to suggest that the UES should measure aspects of the student experience that research has linked with high quality student experience, and with student retention, completion, and high quality learning and outcomes. Extensive research and consultation throughout the development of the UES suggests that the UES should focus measurement on three core areas of student experience: Learner Engagement, Teaching and Support, and Educational Development. Recommendation 1: Focus areas of the UES It is recommended that the UES measures three core areas of student experience: Learner Engagement, Teaching and Support, and Educational Development.
Development of items and focus areas The UEQ was designed to measure specific facets of the student experience within this broader organising structure. A preliminary list of possible areas was proposed, drawing on background reviews of research, policy and practice. Following validation of the survey instrument, including psychometric testing and re-evaluation of the focus and aims of the survey (see Appendix D), the focus of the survey turned to the three broad concepts of student experience rather than to a number of specific measurement areas. Once the conceptual structure and the focus of the survey instrument had been determined, the UES Consortium started drafting the content of the survey instrument based around this framework. While drafting possible items to include in the pilot survey instrument, the Consortium used specific parameters to guide item development and selection. These guidelines are shown in Table 2. In addition to these guidelines, efforts were made to ensure that items in the draft survey instrument could be benchmarked with other national and international collections by comparing and mapping draft items in the UES with other major collections.

12
Table 2: Item development and selection guidelines for the UES Label Guideline Validity Items must measure aspects of the student experience that current research has linked with
student success and/or positive learning outcomes. Reliability Items must measure aspects of the student experience with high reliability and be consistent
in their measurement in aspects of the student experience. Transparency Items should measure aspects of the student experience that prospective students would find
helpful in making decisions regarding which institution or course in which to enrol. Accountability Items should be focused primarily on aspects of the student experience that universities have
the ability to influence and for which they have responsibility. Generalisability Items should be applicable to students from a variety of demographic backgrounds,
including students from non-school pathways, Indigenous students, international students, rural and regional students among others. Items should be equally applicable to students studying on-campus and full-time as to students studying externally, via mixed mode of attendance and/or studying part-time.
Data Usage Items should be appropriate to use for performance based funding purposes, but should also be able to be used for the purposes of continuous improvement.
As shown in Table 2, items were selected and later refined based on their generalisability to students from diverse demographic backgrounds, and students studying via different modes. It is important that the UES captures the diversity of student backgrounds as well as the diversity of universities in Australia. The UES was designed for national use with all students at all Table A universities in Australia—a challenging requirement given considerable individual and institutional diversity. It is necessary, accordingly, that the survey instrument and methods be appropriate, relevant and meaningful for all Australian Table A universities as well as all students studying at those universities regardless of their demographic background, educational contexts (including mode of study) and field of study. In addition to the UES being designed in a way that was appropriate and relevant for a diverse range of universities and students, because of the proposed high-stakes uses of the data it was important that the UES focus on those aspects of the student experience that can reasonably be considered to lie within the control of universities. It is important, therefore, that questionnaire items were developed to be valid, reliable and applicable to a wide range of students and focus on aspects of the student experience that universities are responsible for and are able to improve. After the Consortium drafted, refined and revised potential items to use in the UES, these were consolidated into a first draft of the pilot survey instrument. This version of the instrument was circulated to members of the Project Advisory Group and the Australian Government for input and feedback and was again revised based on feedback received ready for testing with students in focus groups. Following the pilot administration to close to 150,000 students at 24 Australian Table A universities, the survey was further revised based on findings from psychometric testing and with further review against the guidelines outlined in Table 2. A copy of the final UEQ can be found in Appendix A.
13
Context and demographic questions In addition to measuring dimensions relating to the three conceptual areas, the UEQ was designed to collect information on certain aspects of students’ educational contexts as well as demographic information. This information can be used to manage survey administration and quality control, support various technical procedures, and allow analysis and reporting for student subgroups. As part of the UES pilot administration, participating universities were asked to provide population lists that contained the following demographic and context information from the Higher Education Information Management System (HEIMS) collection to assist with quality assurance and help to streamline the data collection in future years.
• Student ID (Commonwealth Higher Education Student Support Number (CHESSN)) (E488);
• Higher Education Provider code(E306); • Campus location (E525); • Course campus postcode (E559); • Course of study type code (E310); • Field of education code (E461); • Field of education supplementary code (E462); • Residential address – suburb/town (E469); • Gender code (E315); • Aboriginal and Torres Strait Islander code (E316); • Location code of permanent home residence (E320); • New basis for admission to current course (E327); • Country of birth code (E346); • Language spoken at home code (E348); • Tertiary entrance score (E369); • Disability (E386); • Highest educational participation prior to commencement (E493); • Highest educational attainment of parent/guardian1 (E573); • Highest educational attainment of parent/guardian2 (E574); • Mode of attendance code (E329); • Equivalent Full-Time Student Load (E339); • Citizen/resident indicator (E358); and • Course of study commencement date (E534).
In the UEQ version piloted in 2011, students were asked parallel questions relating to their demographic background and educational contexts. Analyses looking at the similarities between the information provided in the HEIMS collection and the responses given by students in the survey were conducted (see Appendix D), and showed a great amount of overlap. Because of this only a few demographic questions have remained in the final UEQ (see Appendix A). These have been retained in the instrument for quality assurance purposes or where HEIMS does not currently collect demographic or contextual information of interest to the sector.

14
Validation of the University Experience Questionnaire (UEQ)
Overview of the validation processes Validation of the UES instrument to international standards was essential to ensure the transparency and integrity of the development process, as well as public and institutional confidence in outcomes. The UES Consortium worked with all Australian Table A universities to conduct focus groups, collect feedback from students and staff at universities and establish the face and content validity of the survey instrument prior to the UEQ being piloted with institutions. Following pilot surveying psychometric testing was conducted to further validate and refine the instrument and items. The process of item validation used in the UES was an inclusive one, involving institutions and engaging higher education and technical experts. As with other aspects of research design, survey instruments invariably reflect a compromise between practical, methodological and substantive considerations. Because of this, a highly iterative and consultative validation process was implemented to find a balance between these forces, and ensure that the final UEQ (see Appendix A) provided a valid and reliable measurement of the key aspects of students’ experience. The development of the survey instrument was guided by a number of general design considerations to enhance the power of measurement and ease of administration. These align with the standards set for international data collections, characteristics of large-scale existing context assessments and link with other survey design specifications recorded during the background reviews and broad consultation. In summary, the UES instrument used in the pilot was designed to:
• measure the three main conceptual areas of student experience; • have high levels of face, content and construct validity; • provide reliable and precise measurement of target constructs; • be efficient to administer, analyse and report; • align with and enhance existing instruments and practices; and • provide a basis for ongoing research and development.
Initial validation of the UEQ took place during instrument conceptualisation and construction. This included consultation with stakeholders and feedback from leading national and international experts on university education. Following this initial validation, further validation, primarily through gathering feedback from stakeholders, universities and students themselves was conducted.
Pre-pilot focus groups Focus groups were undertaken with students to capture insights into the range and characteristics of the items. These students were sampled by universities to try to provide a broad representation of key demographic subgroups as much as possible given the timing of the focus groups during holiday periods and the availability of some groups of students.

15
The focus groups used well-tested resources and methodologies, so as to help determine whether the items measured appropriate phenomena, whether they were pitched at the right level, and were seen by respondents in the target population as being appropriate and useful. Through the process of probing and exploring responses, the focus groups help explore reactions to the items, while simultaneously generating rich qualitative feedback to enhance the face and content validity of the instruments. Seven universities volunteered to run focus groups with students. From this a total of eight focus groups were administered. One university ran a focus group with teaching staff to get their perspective on the draft survey instrument. The universities that ran focus groups were:
• Edith Cowan University; • Flinders University; • Murdoch University; • RMIT University; • Swinburne University; • University of Notre Dame (one at Fremantle campus, another at Sydney campus); and • University of Western Australia (focus group with teaching staff).
A total of 32 students participated in the focus groups, of which eight students were male, one student had an Indigenous background, four were studying part-time and six students were studying externally or via mixed mode. Students’ age ranged from 17 years through to 71 and while half of students’ basis of entry into their current qualification was through a secondary certificate, five students had a complete or incomplete tertiary or higher education qualification and nine were mature aged students. Focus group moderators were provided with materials, incentive gift vouchers and detailed running notes in order to ensure that focus groups were conducted in a standard way in all universities. The moderators were also provided with a script of the directions and questions they could use to stimulate discussion about the survey instrument among student participants. The focus group included three stages: timed survey completion; critical reading of the survey items; and follow-up questions to help aid discussion. The moderators made clear to students participating that the main purpose of the focus group was to make sure that they understood the survey and to understand their interpretation of the items. Moderators provided students with a plain language statement that provided information on the background of the UES and gave information on why the focus groups were being conducted and how their feedback would be used to inform the development of the UEQ. Students were first asked to complete the questionnaire while the moderator recorded completion time. Given the limited timeframe and availability of computing resources at some institutions, the survey was not completed by students using the online survey system; however the survey was presented exactly as it would appear on screen. This assisted with making the survey students completed as authentic as possible given resourcing limitations. The average time taken by students to complete the survey was around 10 minutes, but ranged from around seven to 20 minutes in total. After this stage of the focus groups, students were then asked to read through the questionnaire again with a more critical eye, noting whether they

16
had any difficulties in understanding an item’s meaning, or in answering a question, whether they feel the item is applicable to their university experience and any other observations they had. Following this, students were asked to share their overall observations and any specific comments with the group. Moderators were provided with specific questions to use should students require prompting to discuss their thoughts. The focus groups took a total of between 45 and 60 minutes. Overall, feedback from the focus groups suggested that students found the survey easy to answer and well-structured. Students also generally remarked that the survey was interesting to complete and covered most of the areas that they thought were appropriate to measure when considering the student experience at university. Other general feedback that was given by many students was that some terminology used in the survey caused some confusion. Based on this feedback, two different versions of the pilot questionnaire were created that used slightly different terminology for students at different universities to ensure no confusion occurred, as words such as ‘course’ have different meanings at different universities. Other feedback received through the focus groups that was factored into revisions to the draft UEQ included, but were not limited to the following:
• that some questions might include a ‘not applicable’ or similar option; • suggested clarifications on the wording of some items to ensure they were understood; • items about extracurricular activities seen as very important by students and suggested
these questions be expanded; • some items were considered too similar to each other and that differences should be
highlighted; • using the word ‘teachers’ was not considered appropriate terminology and it was
suggested that phrases such as ‘lecturers, tutors and demonstrators’ should take its place;
• suggested additional response options for the items that asked about plans for the future; • suggested separating out where your study has been based on one or more campuses
into single campus and multi campus as this can have a large impact on student experience; and
• ensure the questions clearly focus on a particular timeframe.
Other pre-pilot validation In addition to the focus groups that were run with students, the UES Consortium asked Project Advisory Group members and contacts from all Australian universities to provide feedback on the draft survey instrument following revisions made based on feedback received from the focus groups. Feedback was received from many members of the Project Advisory Group and six universities also provided feedback on the instrument. The feedback provided at this stage was in addition to feedback given on an earlier draft of the instrument. The main points of feedback received from the Project Advisory Group and universities to this version of the instrument were that:
• some questions appeared to be a little subjective;

17
• some items seemed to be measuring the same constructs and may be too similar to each other;
• some items should reference a specific timeframe; • it was unclear why some of the demographic questions, in particular a question about
homelessness was included in the questionnaire; • some changes may need to be made to the formatting and style of the survey to ensure
this survey can be completed by students with vision impairment and other disabilities; and
• some additional items were suggested for inclusion. After taking into account the feedback received from focus groups, from universities the Project Advisory Group and other stakeholders, and making final adaptations to the survey based on this broad ranging feedback, the instrument was sent to the Project Advisory Group for their final review. Following this review, a link to the online survey instrument was provided to the Australian Government for final review and sign-off before commencing the pilot fieldwork with university students during August and September 2011.
Post-pilot validation Further validation took place following the pilot survey with students. The data captured through the pilot enabled psychometric testing of the survey instrument and items, design and development of statistical routines, and testing of fieldwork resources and processes. Rigorous psychometric procedures were used to ensure that the survey instrument yields estimates that measure the three conceptual areas of students’ experience and have the desired level of precision. A range of psychometric analyses were conducted to explore the characteristics of students’ interactions with the items, the empirical behaviour of the items, and relationships between items and target constructs. A suite of analytical approaches were deployed to undertake the psychometric analyses. These include congeneric measurement modelling, item response modelling, and classical test analyses. The precise nature of the analyses has been tailored to the nature of items and instruments, and includes review of:
• item descriptive statistics; • links between items; • coding (and scaling for any composite variables); • construct (internal, convergent and divergent) validity and concurrent (where possible); • reliability (for any composite variables); • response category performance; • reliability generalisability; • test processes for standard error calculation; • differential item functioning; • planned and unplanned item non-response; and • response interference effects.
To establish the criterion validity of the instrument, a review of concurrent validity was undertaken by comparing results from the UES against those of other benchmark data collections were possible and appropriate. Studies of predictive validity are not possible during

18
this initial development stage, but it is essential to establish foundations for enabling such validation to take place at a later stage. A range of final technical reviews were done to bring together the various validation activities detailed in this document, to check the instrument’s measurement properties, and to develop a range of resources for managing and analysing the items and instrument. A full summary of results from the psychometric testing undertaken can be found in Appendix D
Development of the final UEQ The version of the UEQ piloted during August and September 2011 was refined based on the psychometric analyses in Appendix D, as well as review of each item in terms of its applicability for its use for performance funding. Each piloted item was also reviewed against the generic measurement criteria specified by the UES Consortium at the start of the development process (see Table 2). This ensured that each item could be seen to be valid, reliable, and appropriate for a diverse range of students and institutions and that the data would be suitable for its design rationales. A final version of the instrument was distilled based on this analysis and review. The items in this questionnaire are produced in Appendix A. It is important to note that this questionnaire is not the same as that which was piloted with students. Many items were deleted for technical reasons, and others were refined based on psychometric testing and further review of the items. To meet required measurement standards and be applicable to students and institutions from a diverse range of backgrounds, the instrument was made to be necessarily short and highly-focused on the aspects of the student experience that universities can affect and improve. Because of the diversity of institutions and students involved as well as the proposed uses of the data, it was important that the UES instrument be developed to be highly-focused and short, and concentrate on only the most important and generic aspects of the student experience that are as independent of context as possible. Another benefit of a shorter survey instrument is the potential increase in response rates due to the link between survey length and response rates. The version of the UEQ that was piloted with students at 24 Australian universities was tested to ensure content validity, construct validity and reliability, and concurrent validity. The three broad concept areas measured in the UEQ—Learner Engagement, Teaching and Support and Educational Development—all displayed acceptable validity and reliability. A range of tests were conducted, including principal component analyses, item response modelling, item-total analyses, and differential item functioning (bias) analyses. Details on the psychometric analyses and results are given in Appendix D. To ensure the UEQ is as useful as possible for universities, the UES Consortium proposes that the UEQ be administered in a way that allows universities to add institution-specific items to the questionnaire and ask students additional questions that will allow them to better interpret the results from the UES and to complement the data from the UES. As the UEQ is a new instrument that is entering a ‘busy survey space’ for Australian universities, to reduce survey burden on students, streamline the administration of surveys by universities and help augment the UES’s use for continuous improvement purposes, the Consortium recommends that the UES be administered to students in a way in which allows

19
universities to add institution-specific items and/or shared optional items to the UES instrument. Recommendation 2: Baseline version of the UEQ It is recommended that the version of the UEQ reproduced in Appendix A of this UES Development Report be used as a baseline instrument to be further developed to enhance its relevance to informing student choice and continuous improvement. It is also recommended that institutions be able to add approved optional items to the standard form to assist with continuous quality improvement.
Methods developed for the UES
Overview The 2011 UES development project not only involved the production of a survey instrument for use in performance-based funding but also the development of an efficient and robust methodology to administer the UEQ. This section provides an overview of the administration and methodology of the UES. Further information on the administration processes used in the pilot are included in the UES Administration Manual. The survey process was managed by ACER with the assistance of participating institutions. Various technical procedures were used to ensure the quality of survey processes and hence the integrity of survey outcomes. Table 3 provides an overview of the administration schedule for the UES pilot.

20
Table 3: Overview of the UES 2011 development schedule
Phase/Activity APR MAY JUN JUL AUG SEP OCT NOV DEC Preparation Instrument and system development
Consultations with sector and stakeholders
UES National Forum, Melbourne Tuesday 3 May
Institution gains internal approvals
ACER sends administration manual to institution
Institution sends population list to ACER
ACER identifies population, selects students, allocates links
Fieldwork First contact email sent to students
Follow-up email sent to non-respondents
Final email sent to students who haven’t yet responded
Students reply directly to ACER
Reporting ACER prepares UES data file
ACER analyses data and produces results
Preparation of UES Report for Government
Preparation of institutional UES reports
Review of UES survey deployment
Confidentiality and privacy It is important to note that while the UES Consortium includes, and consulted with, staff from a number of Table A universities as part of the pilot survey, only personnel at ACER had access to identifiable survey data and student information. ACER is an independent research agency that handles confidential and highly sensitive data for many large-scale and high-stakes projects. Consortium personnel who are employed by Table A universities only had access to de-identified and aggregated tables and figures, and not to any raw or aggregated reports that could be used to identify institutions. Privacy was to be carefully observed in any transfer of individually identifying details between institutions and ACER.
Student population definition While the UES was initially intended to be developed as a survey of first-year university students, following the UES National Forum, held in early May 2011, it was clear that the
21
sector felt that students from later years of study ought to be included in the survey population. Including later-year students in the population will allow universities to monitor and improve quality with this cohort, potentially make comparisons across year levels, and provide additional data for teaching and institutional management. Supported strongly by universities and following consultation with the Project Advisory Group, the UES pilot included both first-year and later-year students. For the UES pilot, ‘first-year student’ was defined as students who:
• are enrolled in undergraduate study; • are studying onshore; • commenced study in the relevant target year; and • at the time of surveying will have been enrolled for at least one semester.
In the UES pilot ‘later-year student’ was defined as students who:
• are enrolled in undergraduate study; • are studying onshore; and • commenced study prior to the target year.
It is important to note that the target population included in the UES pilot included both domestic and onshore international students. The UES target population also includes students studying part-time as well as full-time, and those studying externally or via mixed mode of study. The population definition used in the UES pilot was very broad, as it was difficult to come to an agreed definition as to who is a ‘first-year student’ and even more difficult to agree on whom is a ‘final-year student’. The Consortium recommends that in general the UES target population includes both first-year and later-year undergraduate students, includes both domestic and international onshore students, and allows universities to include offshore students. Therefore, in terms of a specific definition of who should be included in the UES target population, the UES Consortium recommends the following definitions be used to define a ‘first-year student’:
• students who are currently enrolled in Bachelor Pass level courses at an Australian Table A university;
• students who commenced study in the relevant target year; • students who are studying onshore (although universities may choose to include
offshore students in their population); and • students who have completed one session or semester of study (or the equivalent for
students studying part time) at the time of surveying. The UES Consortium also recommends that ‘later-year student’ be defined as students who:
• are currently enrolled in Bachelor Pass level courses at an Australian Table A university;
• are studying onshore (although universities may choose to include offshore students in their population); and

22
• are in their final session or semester of study or who are within 0.5 EFTSL of possible completion of their degree if studying part-time.
Recommendation 3: UES population definition It is recommended that the UES focus both on first-year and final-year undergraduate, bachelor pass students’ experiences.
Student selection and sampling The UES could potentially be run as a census of all students or by administering the UEQ to a sample of students. While ‘default census’ and ‘convenience sampling’ methods have been the predominant data collection approaches in Australian higher education until more refined methods were propagated via the AUSSE (Coates, 2008), the default census is not necessarily the most valid nor efficient means of securing data for policy or management. In the last five years ACER has worked with higher education institutions in Australia and internationally to build capacity and confidence in scientific sampling, which has been proven to yield excellent outcomes. In practice, there is no strict bifurcation between a population census or sample survey given diverse institutional structures, response rates and reporting requirements. In broad terms, deciding between whether a census or a sample should be administered in a population is a complex process that necessarily takes into account many technical, practical and contextual factors such as:
• support by participating institutions; • the size and characteristics of the population; • the diverse characteristics of institutions; • mechanisms for providing students with opportunities for feedback; • relationship with other data collections, in particular student surveys; • analytical and reporting goals, in particular sub-group breakdowns; • anticipated response rates and data yield; • consistency and transparency across institutions; • cost/efficiency of data collection processes; and • the availability of supplementary data for weighting and verification.
The UES Consortium has experience with both census approaches as well as the application of scientific sampling techniques, and was able to leverage existing techniques to implement a population census or sample survey. In the UES pilot administration, as the data collected was only to be used for the purposes of testing survey instrument and processes, institutions that chose to participate were given the option of administering a census or a sample. This choice allowed institutions the flexibility to conduct other surveys concurrently with different populations of students if they needed to, and also allowed them to conduct a census of students if they so wished. Out of 24 Table A universities that participated in the 2011 pilot five chose to conduct a census of all students in the target population. A small number of universities made specific requests that only certain sub-groups of students be sampled in order to allow them to target students who had not been included in other recent national or institutional surveys.

23
For universities who participated in the pilot using a sample of students, a systematic random stratified sample was drawn from a population list, with this list provided in a specified format by the university to ACER. Sampling was conducted separately for each university to a common design involving stratification by student year, gender, type of course being studied, mode of attendance, field of education, and citizenship status. This method ensured the sample was as representative as possible of the target population in each institution. Post-stratification weights were calculated for within each institution by student year, sex and mode of study. As part of technical design and development the Consortium reviewed and simulated various sample designs for generating robust statistical estimates for disciplinary fields and institutions overall. Broadly, the independent technical review (see Appendix C) affirmed the design and techniques used since 2007 for the AUSSE (ACER, 2011a). A range of minimum response yields were explored for the UES, taking account of the distributional properties of the UEQ scales, assumptions about group size and homogeneity (the extent of similarity among students in terms of the variables being measured), desired precision, and confidence expectations. These yields were then multiplied for expected response rates for each group (drawing from evidence from hundreds of institutional replications via AUSSE). Required target sample sizes were then specified assuming institutional aggregations (which is not advised) and for disciplinary fields. Of course, collection strategy must be closely knitted with analysis and reporting, and the intended use of survey data. In future, the UES Consortium recommends the use of a scientific sampling strategy that ensures enough data can be collected to allow for reporting to both an institutional level and within institutions to a subject area level. Based on experience, in many instances the application of scientific selection methods will result in a census being conducted. Similar quality control procedures are used in all contexts. The proposed strategy meets widely accepted international standards. Recommendation 4: Student selection strategy It is recommended that scientific sampling methods—and, where necessary a census—be used to select students for the UES, and that sampling be designed to yield discipline-level reports for each university.
UEQ operationalisation The Consortium was commissioned to develop the UEQ as a wholly online instrument and the 2011 pilot was administered wholly online. When designed and managed well, contemporary online survey platforms are robust, efficient, can be embedded within existing institutional systems (if required), and yield high-quality data. ACER has worked with all Table A universities over five years to enhance the properties and outcomes of online surveys. The UES should be able to be completed by all sampled students, regardless of disability, disadvantage or distance. As some students, particularly those studying at a distance, may not be able to access online surveys, it is recommended that the UES be administered using a range of modes, primarily online, but also with the use of Computer Assisted Telephone Interviewing (CATI) and paper surveying. To ensure that students with a visual disability are able to complete the survey online it is recommended that the survey be delivered using a system that is compatible with screen reading software programs.

24
Recommendation 5: Mode of survey delivery It is recommended that the UES be administered using a range of modes, primarily online, but also with the use of Computer Assisted Telephone Interviewing (CATI) and paper surveying.
Deployment approach As defined by Coates, Tilbrook, Guthrie and Bryant (2005), surveys like the UES tend to be conducted in Australian tertiary education using one of two broad deployment approaches, specifically:
• an independent deployment, which most if not all survey activities are conducted by an independent agency; or
• a devolved deployment, in which institutions and a coordinating agency collaborate on survey operations.
The independent deployment methodology has been designed and developed by ACER (see ACER et al, 2009) and tested and validated through dozens of institutional replications over the last five years, including through several national projects. In summary, it involves participating universities providing ACER with a list of all students in the target sample at their institution, along with students’ current email addresses and names. After receiving institutions’ population lists, ACER identifies the target population, selects students, allocates online survey links, and invites students to participate in the survey via email. Invitations come from ACER and responses are returned directly to ACER via the online survey system. Since 2005, ACER (see Coates 2009; ACER, 2011a, 2011b) has refined a devolved approach, which since 2006 has been applied by ACER in hundreds of institutional replications. This involves participating universities supplying ACER with a de-identified student list that excludes student contact details. ACER selects students, allocates online survey links to student records, and sends this list back to universities who merge in student contact details. Universities then manage the deployment of the survey by sending email invites to sampled students and follow-up with non-respondents via email. Online responses are returned directly to ACER. Each approach has benefits and limitations. Based on review of contexts and policy, consultation, and analysis of technical and operational matters, the UES Consortium concluded that an independent approach to deployment should be tested to ensure validity, consistency and efficiency. This approach received support from most universities who are keen to see that the UES is conducted in an efficient, reliable and transparent way. As the UES was designed for the purpose of allocating performance funds, it was important that there were no opportunities for data to be compromised or for universities to be accused of ‘gaming’ the data. An independent approach would almost certainly be more cost effective for both institutions and the Australian Government. Analysis of costs based on extensive fieldwork experience with all institutions over the last 10 years suggests that an independent approach is around five times less expensive for institutions, requires only around half as much money for central administration, and reflects a net savings in the order of several millions of dollars. The reason for this is that a semi-devolved approach requires more administrative work from individual universities as it involves them sending out invitations to students and following up with students. The further quality assurance processes that would be required to ensure no ‘gaming’ of the data would also be quite costly. An independent, centrally administered approach would

25
be more cost effective, due to the bulk of the administration being conducted by a single party rather than by each individual institution. Recommendation 6: Administration approach To ensure consistency and efficiency it is recommended that the UES be administered independent of universities. Although the UES Consortium recommends an independent approach be used, and this had broad support from the sector, a small number of universities were unable to apply this approach for the 2011 pilot due to internal policies or privacy requirements. Of the 24 universities that participated in the pilot five were unable to participate in an independent administration. Both independent and devolved approaches used in the pilot yielded usable data, though the devolved approach was much most resource intensive for ACER and institutions and, while many checks to verify processes were made, was not able to be fully independently verified due to limitations on project scope. To ensure that future administrations of the UES can be conducted with all universities independently, the Consortium recommends that the Australian Government formally advise universities of the requirement to participate in the UES independently, possibly through a Ministerial Notice. University systems, processes and privacy agreements may need to be adapted. It is important to note that the UES was deployed according to the 2007 National Statement on Ethical Conduct in Human Research (NHMRC, ARC & AVCC, 2007) and the Australian Council for Educational Research Code of Ethics (ACER, 2010). ACER routinely collects sensitive test, evaluation and other data and has well established and tested procedures for protecting sensitive materials. Participating institutions were responsible for securing any internal human research ethics or other approvals.
Fieldwork The UEQ pilot was administered during late August and early September 2011. A total of 24 Table A Australian universities chose to participate. These institutions are listed in Table 4. The UEQ was administered to 148,197 commencing and continuing undergraduate students enrolled in one of the participating universities. These students represented a total of 405,742 undergraduate students in the target population. A total of 19,657 usable responses were received from sampled students in the pilot survey, yielding an overall response rate of 13.2 per cent. This data yield was more than sufficient for the purpose of refining the instrument through psychometric testing (nominally, only a few thousand responses are required for psychometric validation). Table 4: List of participating institutions
Australian Catholic University Southern Cross University The Australian National University The University of Adelaide
Bond University The University of Melbourne CQ University The University of New South Wales
Curtin University The University of Queensland Deakin University University of South Australia Griffith University University of Southern Queensland
La Trobe University University of Tasmania Macquarie University University of the Sunshine Coast

26
Monash University University of Western Sydney Murdoch University University of Wollongong
Queensland University of Technology Victoria University It must be stressed that the purpose of the 2011 UES pilot was not to generate national baseline data or even generate large response yields from each institution. Rather, the purpose was to produce data to test the survey methods and conduct psychometric analyses of the instrument. Because of this a representative and sufficiently large response yield was neither sought nor required. Preparations, including compiling population lists, sampling and testing the online survey system, were made in June and July 2011. As the UEQ was administered wholly online each sampled student was invited to participate in the survey via an email invitation. For most universities participating independently this email was sent directly from ACER and for the five universities unable to participate independently, this email was sent from a university staff member. The UEQ distribution included three emails to students, summarised in Table 5. Each email provided information on the UES project, and included a link to one of four rotations of the online survey. Detailed information on fieldwork processes was given in the UES Administration Manual. Table 5: Summary of UES distribution strategy
Activity Week starting First email to all sampled students Monday August 22
First follow-up email to non-respondents Monday August 29 Second and final follow-up email to non-respondents Monday September 5
Fieldwork ends Monday September 19 While the UEQ was piloted during late August and early September, the timing of future administrations may be different given the increasing number of universities running a trimester program and the increasing flexibility of university delivery. Ideally, it would be more appropriate to administer the survey to students once they have completed a certain ‘amount of study’ rather than at a set time of the calendar year. The UES Consortium recommends that if administratively feasible students should be surveyed at the beginning of their second semester of bachelor degree study once they have completed a full session or semester of study or equivalent if studying part-time and in their penultimate semester of bachelor degree study. Recommendation 7: Fieldwork timing It is recommended, in terms of fieldwork timing, that students are surveyed at the beginning of their second semester of bachelor degree study and in their penultimate semester of bachelor degree study. In the 2011 pilot, all completed online responses were sent directly to ACER for processing. As this occurred, ACER logged and collated returns, and monitored and tracked response rates. ACER provided regular updates on the response process and provided institutions with information that allowed targeting of follow-up emails. Response data was reviewed and verified using procedures developed for a range of national and international surveys. For the purposes of validating the UEQ instrument (psychometrically) and methods (contextually and practically) in 2011 participation from only a very small number of

27
institutions and respondents was required—perhaps a half dozen institutions and a few thousand responses. From a general technical perspective, however, and for future administrations of the UES securing an appropriate number and range of responses to a sample survey is important to assuring the authority and validity of the results. Institutional surveys compete for time in students’ busy lives, and it is vital to deploy sophisticated methods to engage them in response. The importance of understanding how to engage students in responding to surveys derives from the growing role played by survey feedback in developing and assuring the quality of Australian higher education. Surveys have become an increasingly significant way for students to have their voices factored into the conversations that determine the strategies, policies and practices that shape higher education. Providing feedback from such participation is also a direct means by which institutions can legitimate students’ and graduates’ involvement in their institution’s learning communities. An important role for participating universities is to assist in promoting the UES to students. It is recommended that institutions promote the UES on student portals and in lectures and tutorials in addition to emails and letters. Research has shown that students are very eager to provide feedback on their study, and efforts should be made to provide them with the opportunity. Research suggests that people are more likely to respond to surveys if they believe that the outcomes will benefit them, their opinions matter and will be heard, and the survey is conducted in a consistent, valid and transparent manner (ACER, 2008). Publication of UES results will assist with the transparency of the survey process and help students to feel that their voice has been heard. In addition to this, universities could also communicate to students about the findings, and their plans for improvement based on the responses from students. Other methods such as offering incentive prizes and ensuring the survey is promoted to students via a number of different media which may also help to increase student response. The principles outlined here are important practices to keep in mind. The UES Consortium recommends that a ‘UES Response Rate Strategy’ be developed in conjunction with the sector as a whole. There are numerous ways to increase student response and increasing and sustaining student responses to the target response rate relies on a multi-faceted approach to survey management (ACER, 2008). Engaging students in research requires commitments throughout the survey cycle, from the pre-survey planning phase through promotion of the survey before fieldwork begins; ensuring students remain engaged in the survey during fieldwork and stimulating completion and returns of the survey (ACER, 2011b). Drawing from technical research (see, for instance Coates, Tilbrook, Guthrie and Bryant, 2005; Coates, 2009; Coates & Ainley, 2007) and based on an independent technical review of the UES pilot, a recommended target response rate of 35 per cent has been proposed for future years of the UES. The independent technical review recommended setting a target response rate of 35 per cent on the basis that the response rate needs to be sufficiently high to ensure reasonable validity, that it is achievable as demonstrated by good survey practice at universities and that information is available to adjust for non-response across universities, fields of study and various demographics (see Appendix C for further details). Setting response rates is a means of ensuring the quality of survey processes and outcomes. Hence the response rate required in future years of the UES will, of course, be influenced by the purposes, contexts and uses of the survey data.

28
Recommendation 8: Target response rate It is recommended that a ‘UES Response Rate Strategy’ be developed and implemented in conjunction with the sector as a whole. A target response rate of 35 per cent is proposed for use with the UES to assist in securing a sufficient number and range of responses.
Quality assurance A major form of quality assurance for the UES stems from the capability of the Consortium and consultants, from the use of well-tested methodologies, from a clear vision for the essential characteristics of a successful UES, and from relationships between the Consortium and the sector. Over several years ACER has designed, developed and tested several quality assurance practices that are essential to implementing high-quality data collections of tertiary students, and to providing confidence in results. These practices have been based on forensic review of existing national and institutional practices, and on detailed study of methodology and best practice. The approach has been workshopped and discussed extensively with senior and operational staff at all Australian universities, building capacity and buy-in around the practices. As the 2011 UES pilot was managed independently ACER’s existing risk management procedures were used. ACER administers a wide range of high-stakes, large-scale and secure assessments, and had the in-house capacity to support an effective national deployment of the UES. Even though institutions were not involved in the 2011 pilot they played a vital role in promoting the UES to students in future administrations. Because of the high-stakes rationales driving the UES, the UES Consortium recommends development of a Code of Practice that stipulates standards for data use and reporting. Recommendation 9: Protocols and standards for data use It is recommended that certain standards and agreements be developed to guide how governmental agencies and universities use UES data. To provide confidence in UES processes and outcomes, it is imperative to use the most rigorous and advanced quality assurance protocols. Drawing on extensive research and ongoing experience with all Table A universities, a number of quality assurance processes were embedded within the UES methodology, including:
• ongoing and open consultation and communication with institutions; • the use of dedicated and well-qualified personnel; • the use of standard and well-tested procedures; • double processing of complex or high-stakes operations; • the application of strict financial controls; • the use of tested infrastructure and collaborative arrangements; • the use of standardised and proven materials; • drawing on insights from independent experts; and • regular auditing, cross-checking and reporting.

29
National and institutional reporting After fieldwork was completed in September 2011 ACER compiled and verified responses then built, tidied and validated relevant data files. A range of descriptive cross-checks and validation processes were performed to check responses, sampling adequacy and data quality. An overall raw data file that excluded open-ended responses and information that could be used to identify an individual student or their institution was produced and delivered to the Australian Government along with this report. A range of descriptive statistical analyses were conducted to confirm the properties of the data set (see Appendix E). These identified key findings for key analysis groups, and highlighted potential international comparisons. Institutional data files and reports based on student responses to the UEQ were developed for participating institutions. Institutional reports included national benchmarks (noting that these were computed as simple average scores). To assist with the production of useful reports, it would be very useful to learn from institutions of the more useful contexts for benchmarking. Clarification of benchmarking contexts influences instrument design, survey methods and reporting.
Uses of UES data The UES was developed as a tool for Australian Government to measure university performance in the area of student experience and reward this through the allocation of performance funding for continuous improvement. Although the UES Consortium in collaboration with the Australian university sector have developed a tool that will provide the Australian Government with valid and reliable information on students’ experience at university, it was unclear whether a survey tool would be sufficiently robust at this stage to be used in funding allocation decisions. An independent technical review of the UES (see Appendix C) suggested that until the UES has developed a proven track record, it would not be sufficiently robust to be used for allocating public funding. In light of the recent policy changes flagged in the opening sections of this UES Development Report it is possible that the UES may be used primarily for public reporting and for continuous quality improvement. Consequential validity is an integral part of any data collection process—that is, that data is used in intended ways. As flagged at the outset, therefore, further work would be required to modify and expand the UES to ensure it is fit for the purpose of providing valid information potential new rationales. A survey developed for the primary purpose of public reporting or internal improvement would quite likely be very different in terms of its design and instrumentation. Recommendation 10: Further development of the UES It is recommended that the UES be reviewed and refined during 2012 with a focus on informing student choice and continuous improvement relevant to key stakeholders in light of recent policy changes. Regardless of how the data will be used, it is important that the way in which the data are used and reported reflect the survey instrument’s focus on students’ overall university-wide experience rather than on their experience in specific subjects or of particular teachers. This does not mean that data cannot be reported by different disciplines or subject areas, rather that any reports need to show that the UES is measure of students’ overall university experience, both within a particular course and within the overall university community.

30
It is also important that any use of the data takes into account the diversity of institutional contexts and student groups. The UES Consortium recommends that any data made publicly available are presented in a way that avoids simplistic ranking of institutions that could be misleading to the public and to potential students. Technical work is required on UES analysis and reporting regimes.

31
References Anderson, D., Johnson, R. & Milligan, B. (1996). Performance-based Funding of Universities. Canberra: Australian Government. Australian Council for Educational Research (ACER) (2008). Engaging students in the AUSSE. Accessed 1 September 2011 from www.acer.edu.au/research/ausse/enhancement. Australian Council for Educational Research (ACER) (2010). Australian Council for Educational Research Code of Ethics. Melbourne: ACER. Australian Council for Educational Research (ACER) (2011a). Australasian Survey of Student Engagement (AUSSE). Accessed 1 September 2011 from www.acer.edu.au/research/ausse Australian Council for Educational Research (ACER) (2011b). AUSSE Administration Manual. Melbourne: ACER. Australian Council for Educational Research, Capstan, Centre for Higher Education Policy Studies, Educational Testing Service, National Institute for Educational Policy Research of Japan, Statistics Canada, Westat Inc., Center for Postsecondary Research, Council for Aid to Education, IEA Data Processing and Research Center, SoNET Systems, University of Florence School of Engineering. (2009). Assessment Design for OECD Assessment of Higher Education Learning Outcomes (AHELO) Feasibility Study. Camberwell: ACER. Bradley, D., Noonan, P., Nugent, H. & Scales, B. (2008). Review of Australian Higher Education: Final report. Canberra: Commonwealth of Australia. Coates, H. & Ainley, J. (2007). Graduate Course Experience, 2006: The report of the Course Experience Questionnaire (CEQ). Parkville: GCA. Coates, H. (2008). Attracting, Engaging and Retaining: New conversations about learning. Australasian Student Engagement Report. Camberwell: Australian Council for Educational Research. Coates, H. (2009). Development of the Australasian Survey of Student Engagement (AUSSE). Higher Education, 60(10), 1-17. Department of Education, Employment and Workplace Relations (DEEWR) (2009a). Transforming Australia’s Higher Education System. Canberra: Commonwealth of Australia. Department of Education, Employment and Workplace Relations (DEEWR) (2009b). Indicator Framework for Higher Education Performance Funding. Canberra: Commonwealth of Australia. Department of Education, Employment and Workplace Relations (DEEWR) (2010). Performance Framework. Canberra: Commonwealth of Australia. Marks, G.N. & Coates, H. (2007). Refinement of the Learning and Teaching Performance Fund Adjustment Process. Canberra: Department of Education, Science and Training.

32
National Health and Medical Research Council, Australian Research Council, Australian Vice-Chancellors’ Committee (NHMRC, ARC, AVCC) (2007). National Statement on Ethical Conduct in Human Research. Canberra: Australian Government. Nelson, B. (2003). Our universities: Backing Australia’s future. Canberra: Department of Education, Science and Training.

33
Appendices
Appendix A: Delivered University Experience Questionnaire (UEQ)
Item stem Response options What is the name of your university? DROP-DOWN LIST At university during 2011, to what extent have you:
- received support from your university to settle into study? - used university services (e.g. phone hotlines, online support,
learning skills service, careers service, childcare, health service) to support your study?
- had a sense of belonging to your university?
Not at all Very little Some Quite a bit Very much
In 2011, how frequently have you: - asked questions or contributed to discussions online or face-
to-face? - worked with other students as part of your study? - interacted with students outside study requirements? - interacted with students who are very different from you?
Never Sometimes Often Very often
During 2011, to what extent have your lecturers, tutors and demonstrators:
- engaged you actively in learning? - demonstrated concern for student learning? - provided clear explanations on coursework and assessment? - stimulated you intellectually? - commented on your work in ways that help you learn? - seemed helpful and approachable? - set assessment tasks that challenge you to learn?
Not at all Very little Some Quite a bit Very much
Thinking of this year, overall how would you rate the following learning resources at your university?
- Online learning materials - Assigned books, notes and resources - Library resources and facilities
Poor Fair Good Excellent
In 2011, to what extent has the program of study/course been delivered in a way that is:
- well structured and focused? - relevant to your education as a whole?
Not at all Very little Some Quite a bit Very much
During 2011, to what extent have you found administrative staff or systems (e.g. online administrative services, frontline staff, enrolment systems) to be:
- available? - helpful?
Not at all Very little Some Quite a bit Very much
During 2011, to what extent have you found student support staff and services (e.g. online or phone support, counsellors, learning advisors, careers advisors) to be:
- available? - helpful?
Had no contact Not at all Very little Some Quite a bit

34
Item stem Response options Very much
To what extent has your experience at university developed your: - ability to think critically and analytically? - ability to solve complex problems? - ability to work effectively with others? - confidence to learn independently? - written communication skills? - spoken communication skills? - knowledge of the field(s) you are studying? - development of work-related knowledge and skills?
Not at all Very little Some Quite a bit Very much
Thinking of this year, overall at your university, how would you rate the quality of:
- the teaching you have experienced? - academic advice you have received? - the course(s) you are studying?
Poor Fair Good Excellent
What have been the best aspects of your university experience? TEXT BOX
What aspects of your university experience most need improvement? TEXT BOX
Are you male or female? Male Female
Where has your study been mainly based in 2011? On one campus On two or more campuses Mix of external/ distance and on-campus External/distance
In what year did you first start your current program of study/course?
Before 2007 2007 2008 2009 2010 2011
How many years of your current program of study/course have you completed?
None, in first year One year Two years Three years More than three years
What are your major areas of study (e.g. accounting, primary education, psychology)? You may list up to three areas of study.
THREE TEXT BOXES
35
Appendix B: Report on findings from secondary sources of information Nigel Palmer, Centre for the Study of Higher Education
Introduction
In 2010 the Australian Government commissioned the development of a survey focussing on the student experience with the broad aims of improving transparency, supporting Performance Funding, and stimulating continuous improvement. The survey complements other initiatives proposed as part of the Advancing Quality in Higher Education initiative, which include the Collegiate Learning Assessment, a composite Teaching Quality Indicator and working with Graduate Careers Australia (GCA) to review and improve the Australian Graduate Survey (AGS) (DEEWR, 2011a). Surveys of the student experience play an important role for institutions in higher education quality assurance. In recent decades they have been used by governments to monitor and incentivise performance. They also offer important insights into the extent to which the university experience measures up with the expectations and needs of students themselves. The purpose of this paper is to inform development of the Australian Government’s University Experience Survey (UES) through outlining challenges in defining the student experience, broader aims for which surveys of the student experience might be developed, and background on the characteristics and use of existing instruments. While no single instrument reflecting the student experience can serve every conceivable purpose, this paper takes stock of opportunities to build on the strengths of existing measures.
Defining the student experience
‘Student experience(s)’ are unique for each individual, across the range of contexts through which students engage as part of their university studies: there is no such thing as the student experience. The university student population in Australia is also diverse and changing. Just as it is difficult to identify the student experience, in a similar sense it is difficult to identify the student. In other words, the ‘student experience’ is not identifiable as a single construct. However, while there is no such thing as the student experience, there are certainly aspects of the student experience that can usefully be identified, and evidence sought in them for differences, commonalities and variations over time. Table 6: Defining the Student Experience (from Baird & Gordon, 2009)
Life experiences of all students while they are students. All experiences of an individual student while a student, including wider life experiences. All experiences of an individual student while in their identity as a ‘student’. All experiences of facets of the university experienced by an individual student (e.g. a sense of ‘belonging’, wider social activities tagged to the university). ‘Consumer’ experiences of an individual student, e.g. administrative procedures, catering, IT support, availability of amenities, car parking accessibility, child care etc. All experiences of an individual student that contribute to their personal development as learners (sometimes described as the ‘student learning experience’).
The list of identifiable aspects of the student experience is potentially endless, ranging from pre-enrolment engagement, experience of first-year and subsequent years of study, graduate

36
studies and graduate outcomes. Baird and Gordon point out that on some definitions it is difficult to distinguish individual experiences as a ‘student’ from broader life experiences, as outlined in Table 6 (2009: 195). In line with the broad aims of the development of the UES, aspects identified here are those most salient and useful from each of the three broad perspectives on the definition and measurement of the student experience, including:
• informing institutional quality assurance and management activities; • evaluating success in meeting student expectations of the student experience; and • establishing system incentives as a means of promoting quality and innovation in higher
education. The following sections address the definition and measurement of aspects of the student experience from each of these perspectives.
Performance measures and aspects of the student experience Transparency and accountability of public investment in higher education is a primary consideration of government. Governments also face a range of stakeholder expectations as to what a university experience is able to offer, and these extend beyond the immediate expectations and needs of students to include those of employers, disciplines and professional groups, parents and the broader community. Finally, governments are also challenged with balancing the need to address improvements in particular areas of activity with promoting innovation and diversity in the provision of higher education more broadly. While not all means of engagement between government and institutions need be based on performance arrangements, measures of performance are instrumental in supporting both quality and innovation in the provision of higher education. Financial performance and enrolments have for some time featured prominently among metrics for system level evaluation and comparison of institutional performance among higher education providers. Beyond these measures, consideration of additional indicators can assist in building a detailed profile of institutional activity. They can also assist in developing system incentives for particular areas. Higher education performance measures can be instrumental in supporting a vibrant and innovative educational sector, can help align the activities of higher education providers with prevailing social and economic priorities, and can assist in improving overall standards in the provision of education, and outcomes for students. Over time, the emphasis of higher education performance measures in Australia has shifted from relying on a relatively narrow set of institutional performance indicators to encompass a much broader view of the means by which institutional performance may be reflected (DEEWR, 2011b). Just as it is difficult to identify ‘the student experience’ as a single construct, similarly no single indicator can adequately reflect all aspects of quality and performance in higher education (Chalmers, 2008: 10). In 1989 the Australian Government convened a group of experts to develop and report on a trial study of indicators useful in evaluating the performance of institutions at the department and faculty level, and of students at the level of academic award, discipline group and field of study (Linke et al., 1991: xi). Their final report, informed by the work of Cave et al. (1991) and Ramsden (1991b) among others, classified performance indicators as those reflecting institutional context (including staff and student background, resource input and expenditure), institutional performance (including characteristics and outcomes of teaching and learning, and measures of academic staff achievement in research and professional services) and participation and social equity (including representation of disadvantaged groups and range of course provision).

37
Following the Linke et al. report, the Australian Government has employed a range of competitive, conditional and performance-based funding mechanisms to support system incentives for improvement in key areas of higher education. These include competitive research grants and performance based funding designed to drive and shape institutional behaviour, and include indicators adopted to reflect learning and teaching quality. In April 2004 the Australian Government released the Learning and Teaching Performance Fund Issues Paper, outlining the development of an initiative to reward institutions demonstrating excellence in teaching and learning. The aim of the initiative was to promote the overall quality of the sector, enabling excellence in learning and teaching to be placed alongside excellence in research (DEST, 2004). More recently, the final report of the Review of Australian Higher Education concluded that measures relating to both the quality of teaching and the extent of student engagement in their education should be included in any framework for assessing institutional performance. While concerns had been raised regarding the transparency, appropriateness and rigor associated with the development and use of indicators for the Learning and Teaching Performance Fund (Access Economics, 2005), the final report of the Review noted that the Fund had successfully encouraged a greater focus on the teaching and learning activities of universities. Despite its limitations, the development and publication of institutional indicators for teaching and learning performance had drawn attention to the relevant activities of providers, and had encouraged the development and use of targeted initiatives in support of ongoing improvements in this area. The Review concluded that transparent, public reporting of such data on an annual basis would be an effective means of providing a focus for further improvements in this area (Bradley et al., 2008: 78), a strategy due to be borne out in part by the planned launch of the Australian Government’s My University website (Australian Government, 2011b). Noting that funds allocated for research are generally performance based, the Review proposed that 2.5% of the total funding for teaching and learning be quarantined for performance funding purposes (Recommendation 32, Bradley et al., 2008: 161). In December 2009, the Department released a further discussion paper, An Indicator Framework for Higher Education Performance Funding, to inform the development of a set of Performance Funding Guidelines. The paper outlined a framework of indicators that could be used to agree performance targets with universities for the purposes of Performance Funding, many aspects of which are now reflected in arrangements for mission-based Compacts between institutions and the Australian Government (DEEWR, 2011b). More recently, the Australian Government announced the Advancing Quality in Higher Education initiative as part of the 2011-12 Federal Budget. The initiative builds on the attainment, participation, engagement and quality targets and other initiatives announced in 2009, with the broad aims of improving transparency in university performance, to inform ongoing development of performance funding arrangements and to support the continuous improvement efforts for higher education providers (DEEWR, 2011a). Every iteration in the development of institutional performance measures, and their implementation through policy and practice, has shaped the definition and measurement of aspects of the student experience in this area. A key recommendation from the Review of Australian Higher Education was to overhaul Commonwealth financing of higher education, employing principles of simplicity and transparency, and to reward providers for performance against agreed outcomes via funding based on achievement of targets (Recommendation 25, Bradley et al., 2008: 152,160). Informed by developments in the use of performance measures to support system incentives to date, the final report of the Review proposed a range of
38
indicators reflecting the quality of the student experience. These are included in Table 7 along with those proposed by Linke et al. (1991) and Chalmers (2007, 2010). While these elements describe aspects of the student experience that are salient and useful for the development and use of indicators for performance measures, they do not in themselves describe every aspect of a quality student experience. In describing broader aspects, the following sections outline those that are potentially salient and useful in supporting the quality assurance and management activities of institutions, and in accounting for the extent to which student expectations are being met in the provision of higher education.
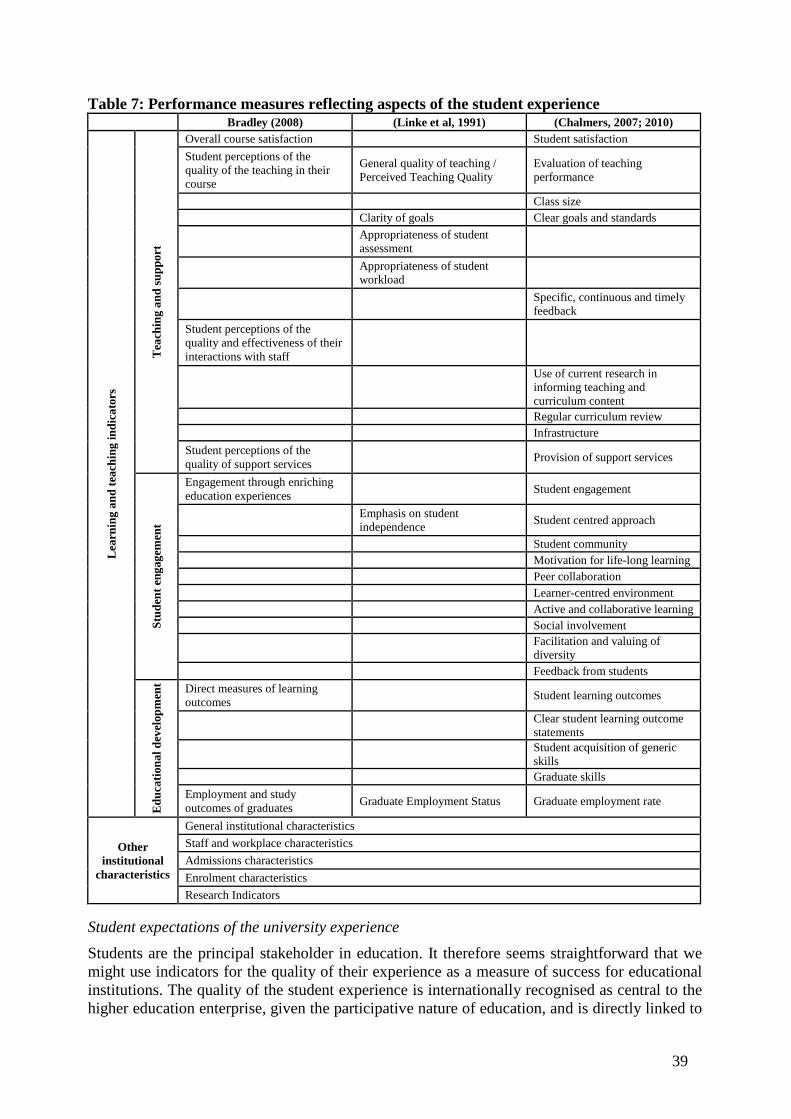
39
Table 7: Performance measures reflecting aspects of the student experience Bradley (2008) (Linke et al, 1991) (Chalmers, 2007; 2010)
Lea
rnin
g an
d te
achi
ng in
dica
tors
Tea
chin
g an
d su
ppor
t Overall course satisfaction Student satisfaction Student perceptions of the quality of the teaching in their course
General quality of teaching / Perceived Teaching Quality
Evaluation of teaching performance
Class size Clarity of goals Clear goals and standards
Appropriateness of student assessment
Appropriateness of student workload
Specific, continuous and timely feedback
Student perceptions of the quality and effectiveness of their interactions with staff
Use of current research in informing teaching and curriculum content
Regular curriculum review Infrastructure Student perceptions of the quality of support services Provision of support services
Stud
ent e
ngag
emen
t
Engagement through enriching education experiences Student engagement
Emphasis on student independence Student centred approach
Student community Motivation for life-long learning Peer collaboration Learner-centred environment Active and collaborative learning Social involvement
Facilitation and valuing of diversity
Feedback from students
Edu
catio
nal d
evel
opm
ent Direct measures of learning
outcomes Student learning outcomes
Clear student learning outcome statements
Student acquisition of generic skills
Graduate skills Employment and study outcomes of graduates Graduate Employment Status Graduate employment rate
Other institutional
characteristics
General institutional characteristics Staff and workplace characteristics Admissions characteristics Enrolment characteristics Research Indicators
Student expectations of the university experience Students are the principal stakeholder in education. It therefore seems straightforward that we might use indicators for the quality of their experience as a measure of success for educational institutions. The quality of the student experience is internationally recognised as central to the higher education enterprise, given the participative nature of education, and is directly linked to

40
the quality of student outcomes and prospects for student success (Coates et al., 2008; Gordon et al., 2008; Willcoxson et al., 2011). Students themselves have an interest in adequate measures of the quality of the student experience, not least in helping them make informed choices about prospective destinations for study, an area that has been relatively under-developed to date. A range of expectations are held by students, parents and the broader community regarding aspects of the student experience and the benefits a course of study may yield, and student expectations in particular play an important role in perceptions of the quality of the student experience (Scott, 2008). From a student perspective these would reasonably include the kind of intrinsic and extrinsic expectations they might have about a course of study at the point of commencement. Baird and Gordon suggest that the student experience can usefully be addressed through consideration of the basic goals common to all students deciding to enrol at a particular institution, from which they derive three common themes (2009: 195):
• personal development and transformation through learning; • direct future benefit in terms of employability, social standing and contributions to
society and communities; and • a match or ‘fit’ between the student and the university, in terms of areas of study or
institutional/departmental culture. Conceptualising the basic goals common for all students also serves to support the development and use of measures of the student experience. The principal means of evaluating the extent to which student expectations are being met is currently by means of the widespread use of student surveys, the most prominent of which are addressed in this paper. Good ‘face validity’ between student surveys and the issues and concerns salient for students not only demonstrates the efficacy of student experience measures, but is also instrumental in promoting engagement in student surveys, which in turn promotes higher quality responses and improved response rates (Nair et al., 2008). While the quantitative data yielded by student surveys provides an important means of evaluation and comparison, qualitative data provide an important means of establishing and reviewing the ‘fit’ between the kinds of things evaluated in quantitative terms using survey instruments and the qualitative information offering additional insight into the interests and needs of students. Among the most valuable resources to this end are open-ended responses collected in surveys of the student experience. Arguably the most useful resource of this type available to date in the Australian context are the accumulated responses to the open items of the Course Experience Questionnaire (CEQ). The CEQ includes the following two open-ended items: ‘What were the best aspects of your course?’ and ‘What aspects of your course were most in need of improvement?’ (Coates & Edwards, 2010: 60). Scott (2006) undertook a systematic review of these responses, allowing a valuable insight into the perceived importance (salience) of aspects of the student experience. Scott (2006) also identified an opportunity to derive an additional indicator of the perceived quality of each of these aspects (or, conversely, quality concerns), in deriving a ratio of hits for ‘Best Aspect’ (BA) relative to those for ‘Needs Improvement’ (NI) (Scott, 2006: 37). In line with findings from this analysis Scott (2008: 24) summarises the most salient student expectations as including:
• personal and vocational relevance; • employment prospects on graduation; • reasonable accessibility;

41
• opportunities to engage with responsive and capable staff; • coherence and clarity in what is studied and assessed; • prompt and helpful feedback on assessment; • efficient, conveniently accessed and responsive administrative, IT, library and student
support systems; all working together to support the delivery of each course; • prompt and effective management of administrative queries; • opportunities to meet and work with a supportive peer group; and • clear and responsible management of student expectations (i.e. ‘truth in advertising’).
The final report of the Review of Australian Higher Education emphasised that the evaluation of student satisfaction should be measured against student expectations. Building on Scott (2008), the review concluded that a range of characteristics could reasonably be included among student expectations on commencing a course of study, and therefore potentially reflect dimensions of a quality student experience (Bradley et al., 2008: 79). In their 2010 survey of student perceptions of higher education quality the Australian National Union of Students identified a comparable range of issues and concerns (Hastings, 2010). Aspects of the student experience identified as salient from the perspective of students identified in Scott (2008), Hastings (2010) and in the final report of the Review of Australian Higher Education (Bradley et al., 2008), are summarised in Table 8.

42
Table 8: Aspects reflecting student expectations of the university experience Bradley (2008) Scott (2008) Hastings (2010)
Teaching and support
Class size Two-way communication about matters that pertain to academic progress
Prompt and helpful feedback on assessment
Coherence and clarity in what is studied and assessed
Teachers who are accessible and responsive to learners
Opportunities to engage with responsive and capable staff
Accessibility of teaching staff
Access to well-designed and engaging courses that lead to good vocational outcomes
Personal and vocational relevance
Good-quality teaching and learning spaces and library and information technology support
Efficient, conveniently accessed and responsive administrative, IT, library and student support systems all working together to support the delivery of each course
Quality and availability of teaching facilities and resources
Clear and responsible management of student expectations
Integrity of student feedback mechanisms
An accessible and sophisticated online learning environment Reasonable accessibility Appropriateness of
online delivery Responsive administrative and student support services
Prompt and effective management of administrative queries
Student engagement
Level of academic challenge in curriculum
Physical places and facilities that allow informal socialisation Quality of campus life
Access to extra-curricular activities such as clubs and societies
Presence of a supportive peer group Opportunities to meet and work with a supportive peer group
A welcoming and inclusive environment
Being treated as an individual
Educational Development
Interaction with teachers that builds a commitment to the students’ chosen disciplines
Employment prospects on graduation
Continuous improvement and the student experience Measures of the student experience directly inform higher education providers’ quality assurance and management activities. They help identify those areas that are performing well and those in need of improvement, and provide an evidence base for informing innovation and strategic management over time. There have been significant efforts devoted to date in evaluating and comparing aspects of the student experience in support of managing and assuring quality across the various activities of institutions (Ramsden, 2003; Coates, 2005; Westerheijden, 2007; Baird & Gordon, 2009; Gibbs, 2010). In assuring quality, attention has been largely focussed around core teaching and learning activities, and to a lesser extent around process and outcome indicators relevant to a broader range of activities. Given the focus for quality assurance and quality enhancement tends to be informed by a fitness-for-purpose approach, aspects of the student experience identified as salient from this perspective also tend to be more process oriented than when viewed from other perspectives.

43
Ways of conceiving the dimensionality of teaching and learning as part of the student experience range from the very general to the very detailed. Scott (2008), for example, proposed a quality assurance and research framework for learning and teaching comprising the four intersecting elements of course design, delivery, support and outcomes (Scott, 2008: 11). Barrie et al. (2008) by contrast identified 42 dimensions specific to course and topic level student evaluation of teaching, based on those established by Abrami et al. (2007). In practice, dimensions of the student experience addressed in quality assurance and management activities often tend to be those informed by the structure and assumptions inherent in available measures, in particular those employed for public reporting and funding purposes. Informed by the challenge of identifying in practical terms those aspects of the student experience directly related to supporting outcomes while at university and beyond, Baird and Gordon propose a framework for evaluating improvements to the student experience specific to quality assurance and quality enhancement activities (2009: 198-199). In many respects this framework is comparable to the broad dimensions identified by Chalmers (2007), and those addressed by Gibbs (2010). In their review of the broader aspects of the student experience addressed in audits by the Australian Universities Quality Agency (AUQA) between 2007 and 2009, Alcock et al. recommend that any broad definition of the student experience should take into account aspects along similar lines (2009: 3). Aspects of the student experience identified from a quality assurance and quality enhancement perspective are summarised in Table 9.

44
Table 9: Quality assurance and learning and teaching aspects of the student experience Dimensions of Quality (Gibbs, 2010) Student experience dimensions (Alcock et al. 2009) Quality Improvements (Baird and Gordon, 2009)
Tea
chin
g an
d su
ppor
t
• Class size • Quality of teaching as judged by students • Formative assessment and feedback • Nature of the curriculum • Student support • Quality enhancement processes and other process
dimensions of quality • Peer ratings (as they pertain to process dimensions)
• Library and learning resources • Space and facilities • ICT • Student Support and student wellbeing • Learning Support • Learning centres for academic and language skills support • Equity support services • Student administration, administration systems • Overall Strategies for Quality Improvement (including
benchmarking and identifying examples of good practice) • Feedback from students • Student organisations, student representation and student
advocacy • Student grievances/ complaints • Student Conduct (policies and procedures) • Addressing plagiarism
• Class size • Peer review of teaching • Student evaluation of teaching • Assessment criteria • Balancing and review of assessment tasks • Assessment policies that provide rubrics and criteria for
student assessment guidelines for examiners • Alternative forms of assessment to better measure the
achievement of learning outcomes • Use of employer feedback in assessment development • Effective moderation • Use of student learning portfolios and trialling new
learning activities • Contact with teaching staff • Improvements to curriculum and to learning activities and
external review of curricula • Ensuring equivalence in curricula for programmes taught
across locations • Adequate physical learning spaces and lab facilities • Access to library • Information technology and other electronic methods of
exchange (including availability and downtime) • Access to electronic resources • Use of videos, podcasts and virtual labs • Student learning groups and spaces • Off campus learning centres and partner facilities • Student support services • Availability of student learning resources and support • Embedded learning support and early diagnosis of
students’ support needs • Establishing priority access for particular services and
groups • Ways of valuing and accepting students as part of a
learning community • Promoting Inter-cultural understanding • Support to improve students’ self-knowledge and ability
to cope with their personal circumstances • Campus facilities, including security, transport and access
to child care facilities • Quality of consumer services and retail precincts

45
Dimensions of Quality (Gibbs, 2010) Student experience dimensions (Alcock et al. 2009) Quality Improvements (Baird and Gordon, 2009) • Programmes to assist students to understand academic or
professional literacies • Appropriate timetabling and scheduling of classes • Better processes for student appeals, e.g. in regard to
grades • Policies and procedures for plagiarism detection, appeals
and grievance provisions
Stud
ent
enga
gem
ent • Student approaches to study (as reflected in course
experience measures) • Student engagement (in learning related activities) • Intellectual challenge • Patterns of engagement in learning (eg hours per week
engaged in study)
• Campus Life • Activities that assist students to reflect on their own learning
Edu
catio
nal
deve
lopm
ent
• Student performance in assessment • Degree classifications • Graduate destinations • Employability
• Degree pathways • Transition to university • Orientation • First year experience • Transition beyond university and support for transition to
work (careers units) • Alumni characteristics and evaluations • Work experience
• Development of a professional identity • Students’ values and ethics

UES Development Report 46 |
The broad aims for the development of a survey of the student experience include supporting transparency, identifying and rewarding performance and supporting the continuous improvement efforts of higher education providers. A key challenge in the development of a survey of the university experience is identifying dimensions of the student experience consistent with these aims, and that adequately capture aspects of the student experience that are salient, meaningful and useful from the perspective of government, higher education providers and from the perspective of students themselves. Given the diversity of the student experience and of students, defining the student experience is not a straightforward matter. There are however commonalities between different perspectives on the student experience, and the different purposes for which a survey of the student experience might be developed. In broad terms these may be grouped as follows:
• Learning and teaching activities, including those around student assessment; • Student engagement in learning; • Educational development and outcomes; • Learning and teaching facilities and support services; • Campus infrastructure and administrative services; and • Opportunities to engage in a broader range of personal, professional and academic development
activities. In developing a survey of the university experience, it is important to be clear on the extent to which these aspects are already addressed by existing instruments, and to identify opportunities to draw on previous experience in this area in building on the strengths of existing measures. Existing surveys of aspects of the student experience employ instruments developed for a particular purpose, informed by their own background and methodology in each case. Together these reflect different means of conceptualising the student experience, and different means of evaluating the student learning experience in particular. The following section provides an overview of the various means of evaluating dimensions of the student experience, the characteristics of available measures of the student experience and their use.
Measures of aspects of the student experience
Student surveys play a central role in reflecting aspects of the student experience. Available instruments may be classified into three broad types:
• those that invite students to reflect on, evaluate and rate their level of satisfaction with aspects of their experience (evaluative surveys);
• those inviting students to report on their activities as students, from which an indication of their engagement in university study may be derived (surveys of engagement); and
• targeted surveys specific to particular groups of students, or aspects or phases of the student experience.
The two most prominent national surveys currently in use in Australia are the CEQ and the Australian Survey of Student Engagement (AUSSE). Complementing these are surveys designed to evaluate students’ experience and satisfaction in a specific context, either for a particular group of students or

UES Development Report 47 |
from a particular point of view. The use of surveys of smaller student cohorts within institutions is widespread, the most common being student evaluations of teaching (Barrie et al., 2008). Larger scale cohort-specific instruments include the Postgraduate Research Experience Questionnaire (PREQ) (Edwards et al., 2010), the Postgraduate Survey of Student Engagement (POSSE) (Edwards, 2011) and the International Student Barometer (Varghese & Brett, 2011). They also include surveys designed to reflect key transition points in the student experience, such as the First Year Experience Questionnaire (James et al., 2010), and surveys that ask students to reflect on their experience after they have completed their university studies, including the Graduate Destination Survey (GDS) (GCA, 2010) and Graduate Pathways Survey (GPS) (Coates & Edwards, 2011).
Student experience surveys In Australia, student experience surveys tend to focus on evaluations inputs and outcomes of teaching and learning. Evidence for the content validity of this form of evaluative measure can be found in studies of the widespread use of topic-level student evaluations of teaching (Marsh, 1987; Barrie et al., 2008). The emphasis on teaching and learning related aspects of the student experience is supported by findings that it is these aspects that are most closely correlated with overall student satisfaction with a course of study (Richardson, 2005: 389). Examples selected here include the Australian CEQ, and the National Student Survey (NSS) from the United Kingdom. The Course Experience Questionnaire (CEQ) The CEQ surveys recent graduates on perceptions of their university experience. The CEQ comprises part of the AGS, which also includes the GDS and PREQ. The GDS has been administered for all student groups since 1972, CEQ since 1992 and PREQ since 1999. While they are distinct instruments, they are bundled together as the AGS for ease of administration. Together, they represent a census of recent higher education graduates in Australia (including both domestic and international students) (Coates et al., 2006: 38). At the heart of the AGS surveys in general, and the CEQ in particular, are structured assumptions regarding the relations between student experiences of teaching and the quality of their learning outcomes. The CEQ has its theoretical and empirical basis in research on the student evaluation of teaching, showing aggregate level associations between the quality of student learning and students’ perceptions of teaching. As such they have been described as learner-focussed tools for the evaluation of the learning environment (Ramsden, 2003: 126;131). Measures like the CEQ are designed to invite students to reflect on and evaluate aspects central to the process of learning and the quality of learning outcomes. In this respect such surveys are distinguishable from those that concentrate on physical, administrative, or social support aspects of the student experience. They are also distinguishable from surveys of student engagement, where students are invited to report on their study-related activities, from which a reflection of their level of engagement may be derived. The CEQ was originally designed to provide a means of supporting program-level comparison of student evaluations of teaching between comparable academic units around the following five key specifications (Ramsden, 1991a: 133):
• coverage of all the important aspects of the quality of teaching and curriculum about which students can form accurate judgements;
• a high degree of validity and freedom from manipulation (implying relevance to students, controlled administration, rigorously tested items and scales, and evidence of appropriate associations with external criteria, such as student learning);

UES Development Report 48 |
• economy of production and administration (implying a small number of reliable scales and items);
• general applicability to all higher education courses in Australia (implying that items not relevant to every discipline, such as those referring to particular teaching methods like laboratories and practical classes, would be excluded); and
• ability to differentiate between student perceptions of academic units at several levels of aggregation.
While the CEQ is designed to measure the most significant aspects of the student learning experience, it is not designed as a measure of all aspects of the student experience. Rather than seeking to measure the full range of factors that combine to form student experience, the development of the CEQ was premised on the association between the quality of student learning and student perceptions of teaching as reflected in formal student evaluation. Student evaluation of aspects of the student experience such as computing, library, recreational and sporting facilities show a low correlation with their perceptions of the quality of teaching and learning. Perceptions of the academic features of degree programs in turn do appear to be a good predictor for overall course satisfaction (Wilson et al., 1997; Richardson, 2005: 403). Items and scales are informed by the aim of capturing the defining elements of teaching and its organisation (Ramsden, 1991a). The CEQ attempts to provide a ‘domain-neutral’ indicator of university course quality (Coates et al., 2006). Ramsden reported positive findings for the stability, internal consistency and structure of items within scales on the instrument (Ramsden, 1991a: 134). CEQ scales indicate moderate to high levels of internal consistency as reflected in item response and classical psychometric analyses, and are therefore widely regarded as reliable instruments (Wilson et al., 1997: 38-50; Griffin et al., 2003; Coates et al., 2006; Coates & Edwards, 2010: 60). The CEQ has been developed in a number of iterations, including the development of additional scales and a comprehensive review of the instrument and its administration (Griffin et al., 2003; Coates et al., 2006). In responding to the CEQ students are invited to reflect on and evaluate their own experience in response to a set of attitudinal statements on a five-point Likert scale from ‘strongly disagree’ to ‘strongly agree’. Several additional scales were developed in the late 1990s, widening the focus beyond the formal teaching environment to include broader aspects of students’ experience of learning and teaching in higher education. Items from the good teaching scale (GTS), generic skills scale (GSS) and overall satisfaction item (OSI) comprise the ‘core’ items of the CEQ along with eight additional optional scales (McInnis et al., 2001; Coates et al., 2006: 39). More recently, the Australian Government has announced plans to further review the CEQ along with the GDS, with a view to improving data collection methods and timeliness of information, along with exploring ways in which these surveys might better capture aspects of the student experience for external, Indigenous and international students (Australian Government, 2011a). The National Student Survey (NSS) The CEQ also formed the basis for the development of the UK’s National Student Survey (NSS). The NSS has been administered in England, Wales and Northern Ireland since 2005. The NSS invites final year undergraduates to provide feedback on their courses in the same manner as the CEQ, along a comparable set of scales. While the CEQ is administered to graduates roughly four months following completion of their degree, the NSS is administered to students in the final year of study (Sharpe, 2007). Psychometric properties of the NSS are comparable to those of the CEQ (Surridge, 2008).

UES Development Report 49 |
Student engagement surveys Surveys of student engagement (Kuh, 2009; Coates, 2010) focus on student reports of their participation in educationally purposeful activities, and the support received from institutions. To focus measurement and increase the usefulness of results, student engagement surveys tend to have a more behavioural focus than those that invite student to reflect on and evaluate aspects of their experience. Surveys of engagement do not assess student learning directly, but rather tap into learner involvement in ‘good practices’ in undergraduate education, and those associated desirable outcomes for students. Evidence for the validity of this form of measure can be found in studies of the relationship between educationally purposive activities and student outcomes (Pascarella & Terenzini, 2005; Kuh, 2009; Coates, 2010, 2011). Examples selected here include the AUSSE and the North American National Survey of Student Engagement (NSSE). Australasian Survey of Student Engagement (AUSSE) The AUSSE (Coates, 2010) is based on its North American counterpart, the National Survey of Student Engagement (NSSE). The Student Engagement Questionnaire, representing the undergraduate component of the survey, is conducted with first- and third-year onshore students (with the Postgraduate Student Engagement Questionnaire or PSEQ being administered for coursework postgraduate students) (Coates, 2010; Edwards, 2011). The AUSSE surveys students on around 100 specific learning activities and conditions along with information on individual demographics and educational contexts. Coates (2007: 122) describes engagement as “a broad construct intended to encompass salient academic as well as certain non-academic aspects of the student experience.” The instrument contains items grouped by six student engagement scales:
• Academic Challenge – the extent to which expectations and assessments challenge students to learn;
• Active Learning – students’ efforts to actively construct knowledge; • Student and Staff Interactions – the level and nature of students’ contact and interaction with
teaching staff; • Enriching Educational Experiences – students’ participation in broadening educational
activities; • Supportive Learning Environment – students’ feelings of support within the university
community; and • Work Integrated Learning – integration of employment-focused work experiences into study.
The instruments also contain items that map onto seven outcome measures. Average Overall Grade is measured by a single item, and the other six are composite measures which reflect responses to several items:
• Higher-Order Thinking – participation in higher-order forms of thinking; • General Learning Outcomes – development of general competencies; • General Development Outcomes – development of general forms of individual and social
development; • Career Readiness – preparation for participation in the professional workforce; • Average Overall Grade – average overall grade so far in course;

UES Development Report 50 |
• Departure Intention – non-graduating students’ intentions on not returning to study in the following year; and
• Overall Satisfaction – students’ overall satisfaction with their educational experience. Evidence for the content and construct validity of student engagement measures is drawn from studies of the extent to which an overall impression of student engagement may be drawn from the activities students report they are engaged in (Astin, 1984). Astin’s proposal of student involvement as a construct refers to the amount of physical and psychological energy students devote to the academic experience (1984: 297). At the core of surveys of student engagement is the evaluation of “educationally purposive activities” and correlations with positive outcomes including satisfaction, persistence, academic achievement and social engagement (Trowler, 2010: 2). This emphasis is supported by findings that measures of student engagement correlate well with demonstrable student outcomes (Krause & Coates, 2008: 493; Scott, 2008: 32). The National Survey of Student Engagement (NSSE) The NSSE is in widespread use in the United States and Canada. The NSSE was developed from the College Student Experience Questionnaire (CSEQ). The CSEQ explicitly links students’ ratings of their participation in teaching and learning activities (student engagement) with self-report of progress towards development of key outcomes (Barrie et al., 2008: 9). The NSSE was originally designed as a means of supporting quality improvement efforts at the faculty and department level (Pike, 2006). Given the development of the AUSSE was based on the NSSE, both instruments share the same conceptual foundations (Kuh, 2009), comparable evidence of validity (Pike, 2006; Gordon et al., 2008; LaNasa et al., 2009; Pascarella et al., 2010), and demonstrate comparable psychometric properties (Carle et al., 2009).
Targeted student experience surveys There are also measures designed to evaluate the student experience in a specific context or from a particular point of view. Some aspects of the student ‘journey’ are particularly salient. These are sometimes referred to as ‘transition points’. The most significant of these include the student experience of first-year study and student perceptions and expectations post graduation. Surveys of the first-year experience include the First Year Experience Questionnaire (FYEQ) (Krause et al., 2005; Krause & Coates, 2008; James et al., 2010). Surveys of the student experience post-graduation include the Graduate Pathways Survey (GPS) and Graduate Destination Survey (GDS) (Coates & Edwards, 2009, 2011). Targeted surveys specific to particular groups of students include cohort-specific instruments (such as the Postgraduate Research Experience Questionnaire (PREQ) (Edwards et al., 2010) and the International Student Barometer (Varghese & Brett, 2011). The First Year Experience Questionnaire (FYEQ) The FYEQ provides valuable information regarding the student experience of the transition to university study, and the quality of the educational experience for first-year students (McInnis et al., 1995; McInnis et al., 2000; Krause et al., 2005; James et al., 2010). Since 1994 the Centre for the Study of Higher Education at the University of Melbourne has been engaged in a series of national studies of the first-year student experience. Conducted in five-year intervals, the studies allow a unique insight into the student experience of the transition to university study. Reports of the survey devote particular attention to important subgroups such as international, Indigenous and rural students, and students reflecting low socioeconomic background. Many institutions employ their own surveys of first year students on a relatively frequent basis, often based on the FYEQ, which may also include additional items adapted from the CEQ (Barrie et al., 2008).

UES Development Report 51 |
Comparable surveys internationally include the United Kingdom’s First Year Experience Survey (Yorke & Longden, 2008) and the CIRP Freshman and Your First College Year surveys in the United States (Ruiz et al., 2010). The College Student Experiences Questionnaire (CSEQ), along with its companion instrument the College Student Expectations Questionnaire (CSXQ), represents an interesting innovation from the United States in enabling comparison between engagement, satisfaction and student expectations. The CSEQ is designed to reflect the quality of student learning environments through surveying undergraduates on their student experiences, perceptions of the campus environment, and progress toward important educational goals. The CSEQ companion instrument, the CSXQ, is designed to measure university expectations among commencing students. Part of the rationale underpinning both is that together they are able to assess not only student expectations, but also the degree to which those expectations are met (Williams, 2007). While the CSXQ is designed to be administered for commencing students, the CSEQ may be employed to survey later-year students, and potentially also recent graduates. Graduate Destination Survey (GDS) The GDS is administered as part of the AGS and appears alongside the CEQ and PREQ (the former distributed to coursework graduates and the latter to research award graduates). The GDS is a study of the activities of new university graduates around four months after the completion of their qualifications. Every year, new graduates who completed requirements for awards in the previous calendar year are surveyed regarding their major activities, including their further study and labour market status and intentions (GCA, 2010). In particular, the GDS seeks information on six main areas (Coates et al., 2006: 38-39):
• the qualification just completed; • paid work in the final year of study; • the respondent’s work and study activities at the time of the survey; • employment in the year after completion of the current qualification; • study in the year after completion; and • limited demographic data.
Development of the GDS was prompted by careers advisors interested in acquiring information on the destinations of university graduates. While early developments operated largely at the institutional level, it was suggested in the late 1960s that the newly established Graduate Careers Council of Australia (GCCA) (now known as GCA) manage the national collection of data on graduate outcomes, and the GDS was administered as a unified national survey from 1972. By 1979, all major universities and numerous institutes of technology and colleges of advanced education were participating in the survey, and the GDS has been administered to all recent graduates on an annual basis ever since (Coates et al., 2006: 38-39).
Other graduate surveys Comparable graduate surveys in use in Australia include the University & Beyond (U&B) survey and the Graduate Pathways Survey (GPS). U&B was conducted by Graduate Careers Australia in 2008 (GCA, 2010). The Graduate Pathways Survey (GPS) was a national study of Australian bachelor degree graduates conducted in 2008. The GPS survey instrument, the Graduate Pathways Questionnaire (GPQ), captures information on respondents’ qualifications and demographic characteristics, surveying students on their education and employment activities in their first (2003), third (2005) and fifth (2008) years after graduation (Coates & Edwards, 2009, 2011).

UES Development Report 52 |
The Canadian Universities Survey Consortium (CUSC) surveys target specific undergraduate sub-samples based on a three-year cycle, alternating between first year students, all undergraduates, and all graduating students. The CUSC surveys sample students and graduates on a range of aspects, including involvement in academic and extra-curricular activities, skill growth and development, satisfaction with their university and future education and employment (Canadian University Survey Consortium, 2010). Other comparable surveys in use in North America include the British Colombia College and Institute Student Outcomes Survey (Barrie et al., 2008: 10). Used to collect information on the activities of students following departure from a higher education institution, the United Kingdom Destinations of Leavers from Higher Education (DLHE) survey is comparable in many respects to Australia’s GDS. The DLHE has been administered by the United Kingdom’s Higher Education Statistics Agency (HESA) since 2002, replacing the First Destinations Supplement (FDS), and DLHE destinations data is also linked to a longitudinal survey also administered by the HESA (Higher Education Statistics Agency, 2010).
Summary A good measure of the student experience would capture aspects common to both the institutional and student focussed approaches to conceptualising the student experience. It should usefully inform the quality assurance and management activities of institutions. It should also be amenable for use as a transparent and defensible indicator of institutional performance along important dimensions of the student experience in a way that creates positive incentives for improvements in those areas, without detracting from institutional activity that might otherwise be invested in support of those or other areas. It should also provide a comparative means for evaluating the extent to which providers are meeting student, employer and community expectations regarding graduate outcomes and the quality of student experience. While there may be distinguishable purposes informing measures of the student experience, there are also factors common to each. Drawing on aspects identified in the first section of this paper and informed by the development and use of existing measures, opportunities exist for the development of a survey that captures dimensions of the student experience in a meaningful and useful way. These may be broadly grouped as educational development, valued outcomes for students and opportunities to engage in a broader range of student experiences. Underpinning each of these is the extent to which institutions effectively support a quality student experience. Together, educational development, institutional support and student involvement combine to support a quality student experience, and represent broad dimensions for capturing aspects of the student experience that are valuable, salient and useful.
References
Abrami, P., d’Apollonia, S. & Rosenfield, S. (2007). The Dimensionality of Student Ratings of Instruction: What We Know and What We Do Not. The scholarship of teaching and learning in higher education: An evidence-based perspective, 385-456.
Access Economics (2005). Review of higher education outcome performance indicators. Canberra, Australia: Department of Education, Science and Training, Commonwealth of Australia.

UES Development Report 53 |
Alcock, C. A., Cooper, J., Kirk, J., & Oyler, K. (2009). The Tertiary Student Experience: A Review of Approaches Bsed on the First Cycle of AUQA Audits 2002-2007 (No. 20). Melbourne, Australia: Australian Universities Quality Agency.
Astin, A. W. (1984). Student Involvement: A Developmental Theory for Higher Education. Journal of College Student Personnel, 25, 297-308.
Australian Government (2009). Transforming Australia’s Higher Education System. Canberra, Australia: Department of Education, Employment and Workplace Relations, Commonwealth of Australia.
Australian Government (2011a). Advancing Quality in Higher Education Information Sheet: A strengthened Australian Graduate Survey. Canberra, Australia: Department of Education, Employment and Workplace Relations, Commonwealth of Australia.
Australian Government (2011b). Advancing Quality in Higher Education Information Sheet: The My University website. Canberra, Australia: Department of Education, Employment and Workplace Relations, Commonwealth of Australia.
Baird, J., & Gordon, G. (2009). Beyond the Rhetoric: A framework for evaluating improvements to the student experience. Tertiary Education & Management, 15 (3), 193-207.
Barrie, S., Ginns, P., & Symons, R. (2008). Student surveys on teaching and learning: Final Report. Sydney, Australia: Carrick Institute for Learning and Teaching in Higher Education.
Bradley, D., Noonan, P., Nugent, H., & Scales, B. (2008). Review of Australian Higher Education: Final Report. Canberra, Australia: Department of Education Employment and Workplace Relations, Commonwealth of Australia.
Canadian University Survey Consortium (2010). CUSC 2010 First-Year University Student Survey: Master Report. Vancouver, Canada: Canadian University Survey Consortium.
Carle, A. C., Jaffee, D., Vaughan, N. W., & Eder, D. (2009). Psychometric Properties of Three New National Survey of Student Engagement Based Engagement Scales: An Item Response Theory Analysis. Research in Higher Education, 50, 775-794.
Cave, M., Hanney, S., Kogan, M., & Trevett, G. (1991). The use of performance indicators in higher education; a critical analysis of developing practice (2nd ed.). London, UK: Jessica Kingsley Publishers.
Chalmers, D. (2007). A review of Australian and international quality systems and indicators of learning and teaching. Sydney, Australia: Carrick Institute for Learning and Teaching in Higher Education.
Chalmers, D. (2008). Indicators of university teaching and learning quality. Sydney, Australia: Australian Learning and Teaching Council.
Chalmers, D. (2010). National Teaching Quality Indicators Project- Final Report. Crawley, Western Australia: Australian Learning and Teaching Council.
Coates, H. (2005). The value of student engagement for higher education quality assurance. Quality in Higher Education, 11 (1), 25-36.
Coates, H. (2007). A model of online and general campus-based student engagement. Assessment and Evaluation in Higher Education, 32 (2), 121-141.
Coates, H. (2010). Development of the Australasian survey of student engagement (AUSSE). Higher Education, 60 (1), 1-17.
Coates, H. (2011). An overview of psychometric properties of the AUSSE Student Engagement Questionnaire (SEQ). Melbourne: Australian Council for Educational Research.
Coates, H., & Edwards, D. (2009). The 2008 graduate pathways survey: graduates education and employment outcomes five years after completion of a bachelor degree at an Australian university. Canberra, Australia: Department of Education, Employment and Workplace Relations, Commonwealth of Australia.

UES Development Report 54 |
Coates, H., & Edwards, D. (2011). The Graduate Pathways Survey: New Insights on Education and Employment Outcomes Five Years after Bachelor Degree Completion. Higher Education Quarterly.
Coates, H., Edwards, D., & Nesteroff, S. (2008). Beyond happiness: managing engagement to enhance satisfaction and grades. Melbourne, Australia: Australian Council for Educational Research.
Coates, H., Tilbrook, C., Guthrie, B., & Bryant, G. (2006). Enhancing the GCA National Surveys: An examination of critical factors leading to enhancements in the instrument, methodology and process. Canberra, Australia: Department of Education, Science and Training, Commonwealth of Australia.
DEEWR (2011a). Advancing Quality in Higher Education. Retrieved June 1st, 2011, from http://www.deewr.gov.au/HigherEducation/Policy/Pages/AdvancingQuality.aspx
DEEWR (2011b). Mission-based Compacts and Performance Funding for Universities. Retrieved June 2nd, 2011, from http://www.deewr.gov.au/HigherEducation/Policy/Pages/Compacts.aspx
DEST (2004). Learning and Teaching Performance Fund (Issues Paper). Canberra, ACT: Department of Education Science and Training, Commonwealth of Australia.
Edwards, D. (2011). Monitoring risk and return: Critical insights into graduate coursework engagement and outcomes. Camberwell, Australia: Australian Council for Educational Research.
Edwards, D., Coates, H., Guthrie, B., Radloff, A., & Tilbrook, C. (2010). Postgraduate research experience 2009: the report of the postgraduate research experience questionnaire. Melbourne, Australia: Graduate Careers Australia.
Graduate Careers Australia (GCA) (2010). Graduate destinations 2009: the report of the Graduate Destination Survey. Carlton Vic: Graduate Careers Australia.
Gibbs, G. (2010). Dimensions of Quality. York, UK: The Higher Education Academy. Gordon, J., Ludlum, J., & Hoey, J. J. (2008). Validating NSSE against student outcomes: Are they
related? Research in Higher Education (1), 19-39. Coates, H. & Edwards, D. (2010). Graduate course experience 2009: the report of the Course
Experience Questionnaire. Carlton Vic: Graduate Careers Australia. Griffin, P., Coates, H., McInnis, C., & James, R. (2003). The Development of an Extended Course
Experience Questionnaire. Quality in Higher Education, 9 (3), 259-266. Hand, T., Trembath, K. M., & Elsworthy, P. (1998). Enhancing and Customising the Analysis of the
Course Experience Questionanaire. Canberra, Australia: Department of Employment, Education, Training and Youth Affairs, Commonwealth of Australia.
Hastings, G. (2010). National Union of Students Undergraduate Student Perceptions of Education Quality Survey 2010. Melbourne, Australia: National Union of Students.
Higher Education Statistics Agency (2010). Destinations of Leavers from Higher Education Institutions: 2008/09 Destinations. Cheltenham, UK: Higher Education Statistics Agency.
James, R., Jennings, C., & Krause, K.-L. (2010). The first year experience in Australian universities : findings from 1994 to 2009. Melbourne, Australia: Centre for the Study of Higher Education, University of Melbourne.
Krause, K.-L., & Coates, H. (2008). Students’ engagement in first-year university. Assessment & Evaluation in Higher Education, 33 (5), 493-505.
Krause, K.-L., Hartley, R., James, R., & McInnis, C. (2005). The first year experience in Australian universities: Findings from a decade of national studies. Canberra: Department of Education, Science and Training, Commonwealth of Australia.
Kuh, G. D. (2009). The National Survey of Student Engagement: Conceptual and Empirical Foundations. New Directions for Institutional Research (141), 5-20.

UES Development Report 55 |
LaNasa, S. M., Cabrera, A. F., & Trangsrud, H. (2009). The Construct Validity of Student Engagement: A Confirmatory Factor Analysis Approach. Research in Higher Education, 50, 315-332.
Linke, R. D., Department of Employment Education and Training, & Performance Indicators Research Group (1991). Performance Indicators in Higher Education; Report of a Trial Evaluation Study Commissioned by the Commonwealth Department of Employment, Education and Training. Canberra, ACT: Performance Indicators Research Group; Department of Employment Education and Training.
Marsh, H. W. (1987). Students’ evaluations of university teaching: research findings, methodological issues, and directions for future research. International Journal of Educational Research, 11 (3).
McInnis, C., Griffin, P., James, R., & Coates, H. (2001). Development of the Course Experience Questionnaire (CEQ) (No. 01/1). Canberra, Australia: Department of Education Science and Training, Commonwealth of Australia.
McInnis, C., James, R., Beattie, K., McNaught, C., Simmons, C., & Ferber, S. (1995). Enhancing the first year experience. Melbourne, Australia: Centre for the Study of Higher Education, University of Melbourne.
McInnis, C., James, R. H., & Hartley, R. (2000). Trends in the first year experience in Australian universities. Canberra, Australia: Department of Education, Training and Youth Affairs, Commonwealth of Australia.
Nair, C. S., Adams, P., & Mertova, P. (2008). Student Engagement: The Key to Improving Survey Response Rates. Quality in Higher Education, 14 (3), 225-232.
Pascarella, E. T., Seifert, T. A., & Blaich, C. (2010). How Effective Are the NSSE Benchmarks in Predicting Important Educational Outcomes? Change: The Magazine of Higher Learning, 42, 16-22.
Pascarella, E. T., & Terenzini, P. T. (2005). How college affects students: a third decade of research. San Francisco, USA: Jossey-Bass.
Pike, G. R. (2006). The dependability of NSSE scalelets for college- and department-level assessment. Research in Higher Education (2), 177-195.
Ramsden, P. (1991a). A Performance Indicator of Teaching Quality in Higher Education: The Course Experience Questionnaire. Studies in Higher Education, 16 (2), 129-150.
Ramsden, P. (1991b). Report on the Course Experience Questionnaire trial. In R. D. Linke (Ed.), Performance indicators in higher education: report of a trial evaluation study commissioned by the Commonwealth Department of Employment, Education and Training. (Vol. 2: supplementary Papers). Canberra: Australian Government Publishing Service.
Ramsden, P. (2003). Student surveys and quality assurance, Australian Universities Quality Forum 2003: National quality in a global context (pp. 121-130): Australian Universities Quality Agency.
Richardson, J. T. E. (2005). Instruments for obtaining student feedback: a review of the literature. Assessment & Evaluation in Higher Education, 30 (4), 387-415.
Ruiz, S., Sharkness, J., Kelly, K., DeAngelo, L., & Pryor, J. (2010). Findings from the 2009 Administration of the Your First College Year (YFCY): National Aggregates. Los Angeles, CA: Cooperative Institutional Research Program (CIRP).
Scott, G. (2006). Accessing the Student Voice: Using CEQuery to Identify what Retains Students and Promotes Engagement in Productive Learning in Australian Higher Education: Final Report: Department of Education, Science and Training, Commonwealth of Australia.
Scott, G. (2008). University student engagement and satisfaction with learning and teaching: Commissioned research and analysis report for the Review of Higher Education. Canberra,

UES Development Report 56 |
Australia: Department of Education, Employment and Workplace Relations, Commonwealth of Australia.
Sharpe, A. (2007). Comparative review of British, American and Australian national surveys of undergraduate students. York, UK: Higher Education Academy.
Surridge, P. (2008). The National Student Survey 2005-2007: Findings and trends. York, UK: Higher Education Funding Council for England.
Trowler, V. (2010). Student engagement literature review. York, UK: The Higher Education Academy. Varghese, M., & Brett, K. (2011). International Student Barometer – 2010. Canberra, Australia:
Universities Australia. Westerheijden, D. F. (2007). From Design and Implementation to Impact of Quality Assurance: An
Overview of Some Studies into what Impacts Improvement. Tertiary Education & Management, 13 (4), 295-312.
Willcoxson, L., Cotter, J., & Joy, S. (2011). Beyond the first-year experience: the impact on attrition of student experiences throughout undergraduate degree studies in six diverse universities. Studies in Higher Education.
Williams, J. M. (2007). College Student Experiences Questionnaire Assessment Program. Kansas City, USA: Center for Postsecondary Research.
Wilson, K. L., Lizzio, A., & Ramsden, P. (1997). The development, validation and application of the Course Experience Questionnaire. Studies in Higher Education, 22 (1), 33-53.
Yorke, M., & Longden, B. (2008). The first-year experience of higher education in the UK: Final Report. York, UK: Higher Education Academy.
UES Development Report 57 |
Appendix C: Independent review of the University Experience Survey Professor Dennis Trewin AO, Statistical Consultant
Terms of Reference
I was asked to review the proposed University Experience Survey (UES) from the point of view of its statistical validity. This is the main purpose of this report. Although not specifically asked to, I have also made some comments at the end of this Report on the governance arrangements for the UES and its proposed use for allocating funding to Universities.
My Qualifications
My main qualification for this review was that I was Australian Statistician from 2000 until 2007. This was a culmination of a long career in official statistics. Much of my early career was in survey methods. I was Director of Statistical Methods at the Australian Bureau of Statistics (ABS) in the late 1970s and have retained that interest since then. I have formally been accredited as a statistician by the Statistical Society of Australia. I have undertaken a number of statistical reviews since leaving the ABS. For example, I am currently undertaking a quality audit for Statistics Sweden focussing on their twelve most important statistical outputs. Other relevant external appointments are Past President of the International Statistical Institute, Past President of the International Association of Survey Statisticians, Chairman of the Policy and Advocacy Committee of the Academy of the Social Sciences of Australia, and Associate Commissioner of the Productivity Commission for the Inquiry into the Not-for-Profit Sector. I have active associations with three Australian Universities. I don’t think they represent a conflict of interest. First, I am a Council member at the University of Canberra .I am also Chairman of their Audit and Risk Management Committee. I work as a Statistical Adviser at James Cook University primarily working on a report on the State of the Tropical Regions. At Swinburne University I chair the Advisory Board for the Institute for Social research.
My Approach
I have studied the various documents you sent me. I also visited the ACER Offices on 18 October when I had an opportunity to ask a range of questions including those relating to knowledge gained from the pilot test. A draft of this report was sent to Hamish Coates and Ali Radloff for comment. It has been finalised in light of those comments. The following framework was used for the preparation of this report. It is based on the business process model used for statistical collections, starting from design through to estimation and analysis based on the actual data collection. The framework has been used to identify the main potential sources of error in the UES.

UES Development Report 58 |
TOTAL SURVEY ERROR APPROACH
Survey Design Questionnaire Design Scale Development Sample Design
S U
R V
E Y
M A
N A
G E
M E
N T
SELECTION
PROCESSING
Integrity of Sample Selection
Adjustment for Non-response Sample Errors Measurement of non-sampling errors
Response Management (avoidance of gaming) Minimisation of Non-response Minimisation of Item Non-response
Edit and Validation Checks Coding Checks
ESTIMATION
COLLECTION
DESIGN

UES Development Report 59 |
General Comments
Using this framework, I consider the main potential sources of error to be those listed below. Please note that these are potential sources of errors only. They may not be significant in practice if the right mitigation steps are taken. My comments in the following sections indicate the extent to which they are likely to be sources of error.
1. Poor questionnaire design leading to inaccurate or incomplete responses, or answers that are not relevant to the desired concepts.
2. The survey framework does not have complete coverage of current undergraduate university students
3. The survey design is poor leading to a sample that is (a) unrepresentative and/or (b) inefficient so that the survey estimates are less accurate than they might be.
4. The integrity of the sample selection is at risk of ‘gaming’ by universities. There will be some incentive to do this if the UES is to be used for funding allocation purposes.
5. There is a high non-response rate leading to the possibility of non-response bias. 6. There is significant item non-response. 7. Some question responses require manual coding and there is the possibility of coding errors or
inconsistent coding across the persons undertaking coding. 8. The validation checks undertaken as part of input processing are inadequate. 9. The validation checks on preliminary outputs are inadequate. 10. The estimation methods do not take sufficient account of the actual sample obtained which may
be influenced by non-response for example.
Design
Potential error sources 1 to 3 come under this heading. Questionnaire design is crucial. There are many examples of surveys producing invalid results because of poor questionnaire design. However, for reasons explained below, I believe ACER is taking the required steps to ensure the questionnaire design has high validity. The development of the questionnaire is being done very professionally. I was impressed by the use of focus groups to assist with the development of the pilot questionnaire. Participants were asked to complete draft questionnaire before focus group discussions commenced so they were talking from actual experience. The subsequent cognitive testing is also consistent with world best practice. My only minor quibble is that an on-line version was not used at the focus groups. However, the paper version was a simulation of the on-line version, and the on-line version was used in the cognitive testing. Consistent with best practice, a pilot test was conducted. An on-line version was used for this test. The pilot test results were still being analysed at the time of my visit and, no doubt, there will be some important learnings for the questionnaire design from the analysis of the pilot test. However, ACER staff impressions were that the questionnaire worked quite well in the pilot test. This still needs to be proven.
UES Development Report 60 |
The steps being undertaken to create and validate the survey framework should ensure that this is not a major source of error. Under both the independent and devolved approaches, ACER has access to a list of students with an ID number, and, as I understand it, details on university, course of study, and demographics. This allows ACER to select a sample consistent with the design objectives. Also, it allows checks to be undertaken on receipt of completed questionnaires to ensure the Universities have provided the survey instrument to the selected students. The efficient design of the survey is dependent on ACER obtaining this auxiliary information about the students. There is reliance on the Universities to provide a complete list of the students that are in the scope of their survey. However, you advised me how you used information available from the Australian Government to check whether this has been done properly or not and follow up the Universities if necessary. This should ensure that the survey framework is of a good standard. Past experience suggests this is an important step. The final survey design has not been finalised yet so it is not possible to make an assessment at this point of time. However, I could tell from discussions and ACER’s past work you have the capacity to do this well. Nevertheless, it might be useful to have a draft survey design reviewed independently to ensure the final survey design is effective given the survey goals. There is a lot of benchmark information about the student population available from the Australian Government in addition to the information contained within the lists provided by the Universities. The independent review should also assess whether this benchmark information is being used effectively to improve the accuracy of the survey estimates. The survey design is very dependent on the survey objectives. What is not often realised is that the accuracy of survey estimates is largely dependent on the size of the sample rather than the fraction of the population that is being sampled. Consequently, the sample size should be much the same for the smallest and largest universities if you want estimates of the same accuracy. For similar reasons, it will be necessary to have a much larger sample if it is desired to obtain estimates for fields of study for each University (or some other breakdown). My comments in Section 12 on international students are also relevant. One issue that is debated is whether there should be a census or a sample. The answer to this question depends to a large extent on the survey objectives and available funds and the ease of selecting a sample. A census is the more appropriate methodology when there is a desire for very detailed statistics and a census is affordable. However, the debate is somewhat academic. With the likely response rates, even a census will in practice be a sample of the whole population.
Sample Selection
Potential source of error 4 is discussed under this heading. The approach you used in the pilot test for sample selection is the so-called ‘independent’ approach rather than a ‘devolved’ approach. I strongly support the independent approach. It allows ‘gaming’ to be controlled. I have been advised by several sources that this has been a real problem with past surveys of university students and is a potential area of criticism unless it can be demonstrated that steps have been taken to control gaming. With the independent approach, I believe you can protect the integrity of the sample selection. However, non-response may still be a problem as discussed below.

UES Development Report 61 |
The aim is to obtain a representative sample. Representative means the ability to obtain unbiased estimates from the sample. This will happen with a census or a probability sample if there is no non-response. However, the existence of non-response raises questions about whether the sample is representative or not.
Data Collection
Potential sources of error 5 and 6 are discussed under this heading. In my opinion the potential for non-response bias is the biggest accuracy concern facing the UES. As discussed below, a high non-response rate does not necessarily lead to significant non-response bias but it certainly increases the risk of non-response bias. As a simple example, if non-respondents are 10% on average higher than respondents on a particular survey characteristic, there will be an downward bias of 8% in the estimates if the response rate is 20% compared with a negligible downward bias of 0.2% if the response rate is 90%. The response rate for the pilot test was 14%. This is not good enough when UES goes live. Steps will have to be taken to increase response rates if the survey is to be considered to be of reasonable validity. What is a reasonable response target? The response rate for the similar AUSSE is 28% so that should be achievable at least. The graduate destination survey achieved response rates in excess of 50% but there was a lot of effort involved and some evidence that the last 10% of responses had negligible impact on the estimates. It is worth noting the large differences in the response rates between Universities. In both the pilot test and the AUSEE, they range from less than 10% to more than 40% suggesting that Universities are approaching the survey quite differently. There are probably things that can be learned from the best practice. In theory, this suggests that response rates of 40% are achievable if best practice was followed by all the Universities. My suggestion is that a target response rate of 35% be set for the Universities. The use of target response rates seemed to have a positive impact on the graduate destination survey. It set a target of 50%. I am suggesting a lower but realistic target, assuming there is information to adjust for differential non-response across Universities, fields of study, demographics, etc. Also, studies of the Graduate Destination Survey suggest the last 10% of responses do not have much impact on the accuracy of the estimates. Nevertheless, to ensure the sample is representative, there should be some tests of this based on external information that is available. ACER has a good idea on what needs to be done to improve response rates. However, it needs the support of other stakeholders such as the Universities, the Australian Government and the National Union of Students. All these groups need to be seen to be actively supporting the survey. In particular, there is evidence to show that active promotion of the survey within Universities, including reminders by teaching staff, can have a very positive impact on response rates. Facebook might be examined for its potential to improve response rates. I do not have the experience to make specific suggestions on how this might be done but can observe that a high proportion of university students use Facebook. Perhaps it might be possible to use it for promotion of the UES to students. SMS messaging might also be used for promotion and improving awareness.

UES Development Report 62 |
Non-contact can often be a significant contributor to non-response. I worry about complete reliance on email. Certainly, University email addresses should not be used. There is evidence that this type of email is rarely accessed. Private email addresses should be used. If there is target response rate, this provides an incentive for the Universities to take steps to ensure they are using valid email addresses. What is the best way of picking up additional responses – the telephone and mail questionnaires can both be effective. Perhaps, it can be left to the Universities to decide what they need to do to meet the target non-response rates. Whilst at the ABS I was involved in several focus group studies of both businesses and people that discussed what was most likely to lead them to complete survey questionnaires. There were three overwhelming factors – (1) convincing them that their effort in completing the questionnaire was worthwhile, (2) the questionnaire being relatively easy to complete, and (3) feedback of the survey results. The importance of (1) cannot be over-stated. Words should be developed that convince students of the usefulness of the survey and that their response counts. It should be tested against students. I suggested something along the following lines in earlier correspondence. “Please take 10 minutes to tell us about your university experience this year by clicking on the next button below. We would really appreciate your response. The information is most important as it will help universities understand the things they should do to improve to improve student experience. The information will be published on the ‘My Universities’ web site. It will also help government understand what things they can do to improve students’ experience. Your response is private, and all responses are returned directly to the Australian Council for Educational Research (ACER). ACER is an independent, not-for-profit national education research organisation. Your response is confidential as neither the universities nor ACER identify individual respondents in reports. Although your response is important to the quality of the survey, participation in the UES is voluntary and you are free to withdraw consent at any time. The University Experience Survey (UES) is run according to the ACER Code of Ethics (url link).” It would be good practice to have some form of verification or audit of the collection process given the important role Universities play in the data collection and the incentive for gaming given that data from UES might be used for allocating funding to Universities. ACER is the most knowledgeable about the data collection process and what constitutes a valid sample. Their right to verify or audit the data collection processes within Universities should be part of the agreements with universities. The knowledge this might be done will hopefully encourage Universities to follow good practices. Things that ACER might examine include:
(i) Checks that the selected sample has actually been deployed by the Universities, (ii) The follow-up procedures for non-respondents are adequate. (iii) The response received seems reasonably representative of the student population at the
University. If not, it may be necessary to select a supplementary sample.
Based on what I was told about the pilot test, item non-response was relatively small and is unlikely to be a significant source of error in the UES.
Data Processing
Potential sources of error 7 and 8 come under this heading.

UES Development Report 63 |
Coding error is managed through use of double coding. This is good practice but it is important that the information obtained through the double coding is captured in an appropriate way and is used wisely to improve the coding process. In my experience, it can be used to:
(a) Identify coders who are making more frequent errors so that they can be retrained or perhaps subject to even more severe actions, and
(b) To identify processes that are not working as well as they might be so that rectification steps might be taken.
I presume validation checks will be developed for the final survey. The pilot test data will be useful for developing and testing the most important validation checks. ACER is experienced at this type of work so I presume it will be done well.
Estimation
Potential error sources 9 and 10 come under this heading. Validation checks on outputs are a very effective way of identifying potential problems with survey outputs. These can take many forms e.g. internal consistency checks, face validity checks to ensure comparisons across Universities or other population sub-groups make intrinsic sense. ACER is an experienced publisher of estimates from education surveys including those of university students. It has a track record as a high quality publisher of statistics and I have no reason to doubt that this work will not be done professionally. The estimation methods have not yet been developed. This is a crucial part of the survey and potentially a source of significant error or inefficiency. This is another area where it might be useful to have an independent review before the methods are finalised. If it is agreed that this should be done, I would suggest it should be the same reviewer who examines the survey design. There are two aspects of the survey estimation method that I will comment on– (1) adjustment for potential non-response bias, and (2) making effective use of benchmark information to improve the accuracy of estimates. With respect to non-response, the most effective technique is post-stratification and compilation of the weights to be used to derive the estimates for each post-stratum. Unlike many surveys, there is information available to apply post-stratification techniques. ACER is familiar with the techniques and has used it successfully in past surveys. For example, in the AUSSE survey, it has used year of study, attendance type and gender as post-stratification variables. There is a choice of variables that can be used for post-stratification .It is probably wise not to use them all as it would create very small cells which can lead to its own problems. There are techniques for deciding which variables might be used for post-stratification as well as the ‘explanatory’ power of adding additional variables. One possible technique is logit regression using the fact whether a student is a respondent or non-respondent as the dependent variable. Pilot test data, or possibly AUSSE data, could be used for this purpose.

UES Development Report 64 |
Previous studies have shown that international students and those from a non-English speaking background have lower response rates. This should be taken account of in the design and/or estimation procedures for the survey. Alternatively, you could use the results from analysis from the Course Experience Questionnaire. It showed that Field of study (or field of education as described in CEQ) is the variable that provided most explanatory powers. It definitely should be used as a post-stratification variable perhaps at the expense of one of the variables used in AUSSE. Institution was important of course but it will be a stratification variable. In addition to the post-stratification variables used in AUSSE, other variables such as field of study might also be considered. With respect to the benchmark variables, there is known information known about students disaggregated by University, field of study, etc. This information could be used to improve the accuracy of estimates. It would also ensure estimates from UES are consistent with external data on number of students by University and the other variables used in post-stratification. The ABS uses these type of techniques in their Monthly labour Force Survey for example. External estimates of the population disaggregated by State (capital city/other), gender and 5 yearly age are used as benchmarks. There is duplication with what might be done to adjust for non-response so they should be applied concurrently once the estimation methodology has been determined. In effect, a sample weight is estimated for each student based on their stratification (e.g. University) and post-stratification characteristics. This sample weight is applied to all subsequent tabulations. It should be noted that there is a strong chance that there will be redundancy as the same variables will be used to adjust for non-response and population benchmarks. I understand that one of the goals of the UES is to derive composite variables based on the scaled responses to individual questions. ACER is much more knowledgeable than me on this type of psychometric analysis. It has successfully undertaken similar analysis on other survey data sets. However, I will make the following observations.
(i) I have noted above the potential bias problems that might be caused if non-response leads to a sample that is not sufficiently representative. However, this should not be a concern for the development of psychometric models based on survey study. Studies have reinforced this as long as the range of population characteristics are reasonably represented.
(ii) However, when estimating the distributions based on the composite variables, the sample weights should be the same as those used for other variables.
Presentation on the Accuracy of Estimates
It is good practice to provide information on the design of the survey and sources of error for those readers who want this information to help them interpret the estimates. I realise from talking to ACER and studying past practice that it is your intention. In these comments I have used the 2009 Report from AUSEE as the starting point.

UES Development Report 65 |
I thought the description of the methodology in this Report was excellent. It provided all the information that was required and presented in an easily digested form. There was some information on sources of error but not as many metrics as desirable. I think there are two types of error where metrics are desirable.
(i) Sampling errors (ii) Non-response bias
With respect to sampling errors, I was shown the presentation in Figure 2 on the ‘Excellence’ variable in a 2006 Briefing to the Australian Vice-Chancellor’s Committee. This was an excellent presentation of sampling errors that could well be used in UES for some of the key estimates. However, there will be many estimates derived from UES and it will not be possible to use this form of presentation for all the estimates. My suggestion is that this form of presentation be supplemented by something like the following.
This presentation relies on the fact that there is an inverse relationship between the size of the estimate and the relative size of the sampling error (presented as relative standard errors). It will be necessary to calculate standard errors for a sufficient number of estimates to derive this graph. Although it is a somewhat crude way of presenting standard errors, it is sufficient for most analysts. There are many techniques for estimating standard errors and ACER should use those tools with which it is familiar. With respect to possible non-response bias the AUSSE Report provide a lot of details on non-response rates and the methods used to address potential non-response bias. However, it would also be useful to include any quantitative information that is available to show that non-response bias is not a major issue.
Relative Standard Error Error
Size of Estimate

UES Development Report 66 |
Recommendations [from the independent review]
1. Steps should be taken to improve response rates. This is a collective effort involving the ACER, the Government sponsor, the Universities and the National Union of Students so requires the endorsement of the Project Steering Committee and the Project Advisory Group.
2. A target response rate of 35% should be used at the institution level. The achieved sample should be checked for representativeness and, if not representative, steps taken to address this issue Recommendation 5 may be relevant.
3. The independent sampling method should be used to prevent gaming. If response rates are not acceptable for certain universities, further work to improve response rates may need to be devolved but in close collaboration with ACER.
4. There should be provisions to allow ACER to verify and audit the data collection work done by the Universities.
5. The steps used to check the survey framework in the pilot test should also be applied to the final survey to ensure the integrity of the framework.
6. There should be investigations of what data is available for adjustment of non-response and to benchmark of estimates. Logit regression or some similar technique could be used to assist with the development of the most effective estimation method. Alternatively the results from analysis of similar surveys such as the CEQ could be used. These indicate that field of study should definitely be used as a post-stratification variable.
7. An independent expert should be used to review the survey design and estimation proposals. 8. As has been the past practice of ACER, the Report should contain sufficient material on the survey
methods and data accuracy to allow the reader to reliably interpret the estimates. 9. Before the survey design is completed, the Australian Government and the other key stakeholders
need to agree on the design objectives. (see Section 12)
International Students
It is not clear whether it is intended to include international students in the final survey or not. I would have thought they should be included as their experience is relevant to the performance of Universities. If they are to be included, I would suggest they be surveyed separately although concurrently with domestic students. There are several reasons. These include:
• The introductory letter seeking their co-operation will be different. • There may be some adjustments to the questionnaire. Some of the questions will be different. • The estimation methods may well be different. For example, information on the country of
origin of the student may be important for estimation.
Other Issues
There are three other issues that I would like to raise as a result of my investigations.
1. Will the UES be sufficiently robust to use in funding allocations?

UES Development Report 67 |
2. Does the Governance structure take sufficient account of the need for technical expertise?
One question I asked myself is whether the UES is sufficiently robust to be used in funding allocation decisions. The short answer I reached was NO at least until it had a proven track record. This use of the survey will put it under intense scrutiny. I asked three Universities about the possible use of UES in funding decisions and all three were negative. It could be expected that most Universities will scrutinise the data heavily and point to flaws. There will quality issues they can point to (eg low response rates) that will exist despite the best efforts of ACER or any other survey provider for that matter. It is best not to have that pressure on the initial survey. Furthermore, the effective sample sizes for some universities will be quite small and standard errors quite large. Many of the differences between the Universities own measures will not be significantly different. At least initially, it makes more sense to me if the objective is to provide information to include on the ‘My University’ web site or perhaps to use in the periodic AUQA audits. I was not clear which variables will be used in funding decisions. Will it be individual variables collected in the survey such as (student retention)? Will it be a composite variable derived using psychometric models that reflect education development? This of course depends on studies of the validity of any derived models. The pilot test data should be adequate for these purposes. Second, I have looked at the governance arrangements for UES. A notable absence was anyone with a background which provides a technical understanding of surveys especially in the education sector. Although ACER is a very competent provider of education survey services, the Project Advisory Group would benefit from independent advice. Third, the availability of a student ID number provides incredible potential for tracking students over time and providing data on retention rates, education outcomes, etc disaggregated by institution and the characteristics of students. This requires an ‘information model’ to be established to support statistical analysis. For confidentiality reasons, the Australian Government may want this work done in house but, if they haven’t already done so, it would be prudent for them to engage experts to help them with this work.
UES Development Report 68 |
Appendix D: University Experience Questionnaire psychometric analyses
Overview
All questionnaire instruments should provide valid, reliable and efficient measurement of the constructs they purport to measure. This imperative is magnified given that the University Experience Questionnaire (UEQ) is designed for high-stakes allocation of Performance Funding. The following report provides an overview of the psychometric validation of the UEQ reproduced in Appendix A.
Population and response report
The UEQ was administered during August and September to 148,197 first and later year undergraduate students currently enrolled in one of 24 Australian Table A universities and representing 405,742 undergraduate students. The universities that volunteered to participate in the UEQ pilot are listed in Table 10 along with their sample size, information on whether they conducted a sample or census, their response rate and the type of administration that was used at their institution. It must be stressed that the purpose of the 2011 UES pilot was not to generate baseline data or even generate large response yields from each institution. Rather, the purpose was to produce data to test the survey methods and conduct psychometric analyses of the instrument. Hence a representative and sufficiently large response yield was not sought nor required.
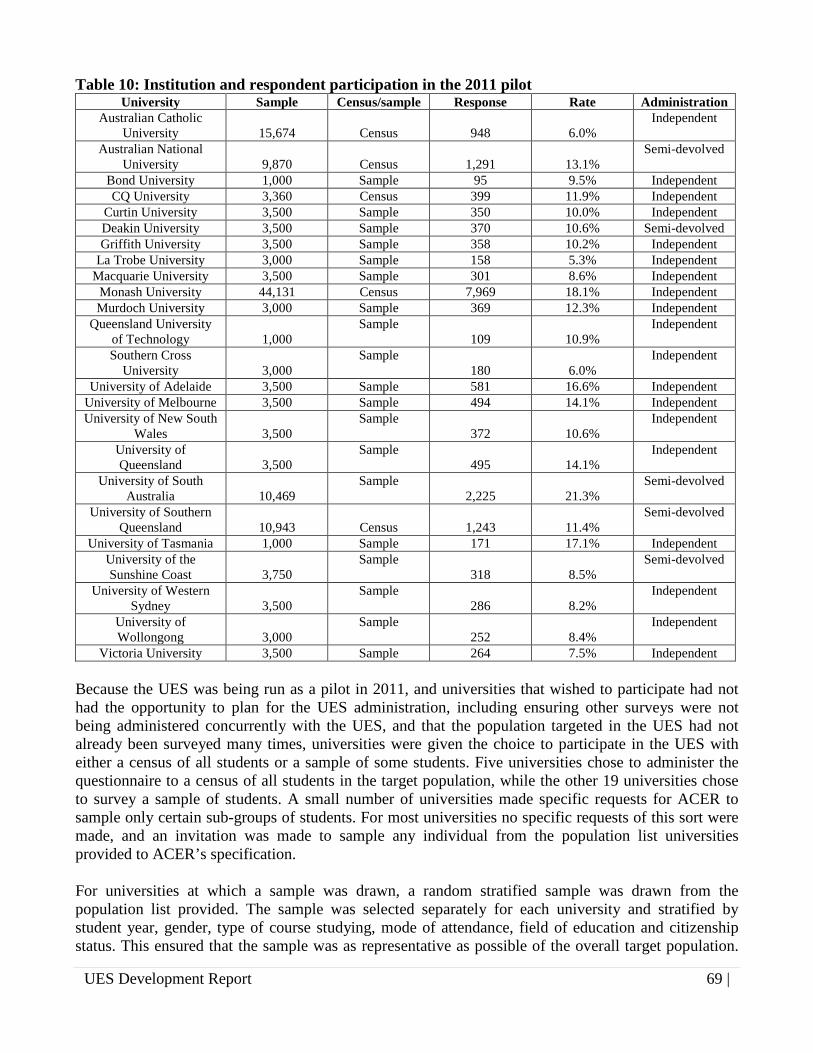
UES Development Report 69 |
Table 10: Institution and respondent participation in the 2011 pilot University Sample Census/sample Response Rate Administration
Australian Catholic University 15,674 Census 948 6.0%
Independent
Australian National University 9,870 Census 1,291 13.1%
Semi-devolved
Bond University 1,000 Sample 95 9.5% Independent CQ University 3,360 Census 399 11.9% Independent
Curtin University 3,500 Sample 350 10.0% Independent Deakin University 3,500 Sample 370 10.6% Semi-devolved Griffith University 3,500 Sample 358 10.2% Independent
La Trobe University 3,000 Sample 158 5.3% Independent Macquarie University 3,500 Sample 301 8.6% Independent
Monash University 44,131 Census 7,969 18.1% Independent Murdoch University 3,000 Sample 369 12.3% Independent
Queensland University of Technology 1,000
Sample 109 10.9%
Independent
Southern Cross University 3,000
Sample 180 6.0%
Independent
University of Adelaide 3,500 Sample 581 16.6% Independent University of Melbourne 3,500 Sample 494 14.1% Independent University of New South
Wales 3,500 Sample
372 10.6% Independent
University of Queensland 3,500
Sample 495 14.1%
Independent
University of South Australia 10,469
Sample 2,225 21.3%
Semi-devolved
University of Southern Queensland 10,943 Census 1,243 11.4%
Semi-devolved
University of Tasmania 1,000 Sample 171 17.1% Independent University of the Sunshine Coast 3,750
Sample 318 8.5%
Semi-devolved
University of Western Sydney 3,500
Sample 286 8.2%
Independent
University of Wollongong 3,000
Sample 252 8.4%
Independent
Victoria University 3,500 Sample 264 7.5% Independent Because the UES was being run as a pilot in 2011, and universities that wished to participate had not had the opportunity to plan for the UES administration, including ensuring other surveys were not being administered concurrently with the UES, and that the population targeted in the UES had not already been surveyed many times, universities were given the choice to participate in the UES with either a census of all students or a sample of some students. Five universities chose to administer the questionnaire to a census of all students in the target population, while the other 19 universities chose to survey a sample of students. A small number of universities made specific requests for ACER to sample only certain sub-groups of students. For most universities no specific requests of this sort were made, and an invitation was made to sample any individual from the population list universities provided to ACER’s specification. For universities at which a sample was drawn, a random stratified sample was drawn from the population list provided. The sample was selected separately for each university and stratified by student year, gender, type of course studying, mode of attendance, field of education and citizenship status. This ensured that the sample was as representative as possible of the overall target population.
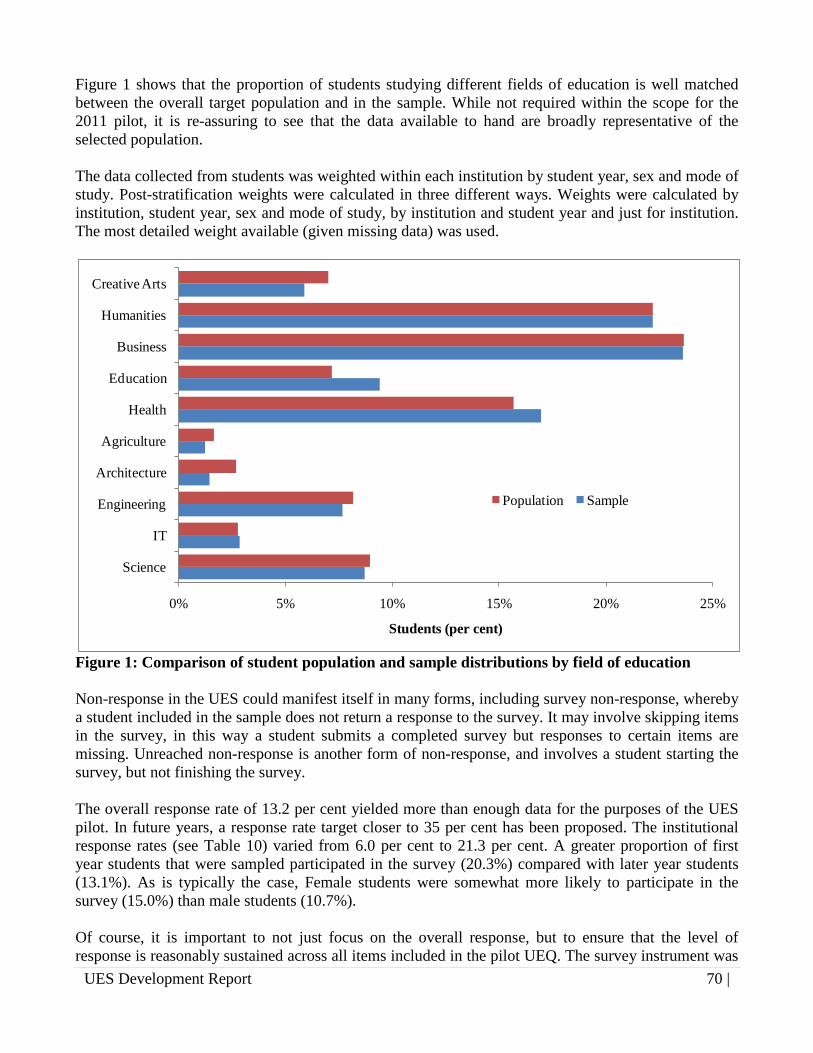
UES Development Report 70 |
Figure 1 shows that the proportion of students studying different fields of education is well matched between the overall target population and in the sample. While not required within the scope for the 2011 pilot, it is re-assuring to see that the data available to hand are broadly representative of the selected population. The data collected from students was weighted within each institution by student year, sex and mode of study. Post-stratification weights were calculated in three different ways. Weights were calculated by institution, student year, sex and mode of study, by institution and student year and just for institution. The most detailed weight available (given missing data) was used.
Figure 1: Comparison of student population and sample distributions by field of education Non-response in the UES could manifest itself in many forms, including survey non-response, whereby a student included in the sample does not return a response to the survey. It may involve skipping items in the survey, in this way a student submits a completed survey but responses to certain items are missing. Unreached non-response is another form of non-response, and involves a student starting the survey, but not finishing the survey. The overall response rate of 13.2 per cent yielded more than enough data for the purposes of the UES pilot. In future years, a response rate target closer to 35 per cent has been proposed. The institutional response rates (see Table 10) varied from 6.0 per cent to 21.3 per cent. A greater proportion of first year students that were sampled participated in the survey (20.3%) compared with later year students (13.1%). As is typically the case, Female students were somewhat more likely to participate in the survey (15.0%) than male students (10.7%). Of course, it is important to not just focus on the overall response, but to ensure that the level of response is reasonably sustained across all items included in the pilot UEQ. The survey instrument was
0% 5% 10% 15% 20% 25%
Science
IT
Engineering
Architecture
Agriculture
Health
Education
Business
Humanities
Creative Arts
Students (per cent)
Population Sample

UES Development Report 71 |
displayed on four pages in the online survey system (Pages A, B, C and D—see Table 11). To mitigate order effects and ensure a strong response across the survey, four different versions of the instrument were administered to students. As shown in Figure 2, although responses were given by at least 90 per cent of participating students to one item or more on each page of the survey, the response to items on the second, third and fourth pages drops off. This downward trend in response by length of the questionnaire is also shown in Figure 3 which provides the response rate to individual items by their order of presentation. Table 11: Diagram of rotated instrument versions
Version First screen Second screen Third screen Fourth screen 1 Page A Page B Page C Page A 2 Page C Page A Page B Page B 3 Page B Page C Page A Page C 4 Page D Page D Page D Page D
Figure 2: Responses to pages in the online instrument
8173
69
12
10094 91 90
0
20
40
60
80
100
Page A Page B Page C Page D
Stud
ents
(per
cen
t)
Answered all items on each page (per cent)
Answered at least one item on each on each page (per cent)

UES Development Report 72 |
Figure 3: Responses to items in the online instrument by order
70%
75%
80%
85%
90%
95%
100%
1 3 5 7 9 11 13 15 17 19 21 23 25 27 29 31 33 35 37 39 41 43 45 47 49 51 53 55 57 59 61 63 65 67 69 71 73 75 77 79 81 83
Res
pons
e (pr
e ce
nt)
Item order in version
Version 1Version 2Version 3Version 4

UES Development Report 73 |
Overall, the response to the items was strong, and a sufficient number of survey responses were received overall for psychometric testing and revision of the survey instrument. Typically, as a rule of thumb, at least 200 good responses per item are required for validation work, and there is clearly more data than this.
Content validation
Content validity refers to the extent to which an instrument provides coverage of defined aspects of a target construct. Throughout the development process in 2011, steps were taken to account for the content validity of the UEQ that was piloted and subsequently revised based on assessment of its validity, reliability and appropriateness for the use for performance funding. The facets of the student experience that the UEQ measures is necessarily broad and could encompass innumerable aspects of the university experience. In the UES project, after broad consultation with experts and the sector at large, a definition of the student experience as encompassing three broad conceptual areas—Learner Engagement, Teaching and Support, and Education Development, was adopted. The items included in the UEQ were selected based on the links research has shown between these aspects of the student experience and positive learning outcomes for students. The items selected were also assessed by research experts and practitioners. Because the questionnaire was designed for high stakes use in Performance Funding a number of additional technical criteria (see Table 12) were used to select items suitable given the UES intended context of use. Table 12: UEQ item development and selection guidelines
Label Guideline Validity Items must measure aspects of the student experience that current research has linked with
student success and/or positive learning outcomes. Reliability Items must measure aspects of the student experience with high reliability and be consistent in
their measurement in aspects of the student experience. Transparency Items should measure aspects of the student experience that prospective students would find
helpful in making decisions regarding which institution or course in which to enrol. Accountability Items should be focused primarily on aspects of the student experience that universities have the
ability to influence and for which they have responsibility. Generalisability Items should be applicable to students from a variety of demographic backgrounds, including
students from non-school pathways, Indigenous students, international students, rural and regional students among others. Items should be equally applicable to students studying on-campus and full-time as to students studying externally, via mixed mode of attendance and/or studying part-time.
Data Usage Items should be appropriate to use for performance based funding purposes, but should also be able to be used for the purposes of continuous improvement.
Table 13 shows the three conceptual areas measured in the UEQ, the items that map onto each scale, a commonly used (lower bounds) measure of internal consistency (α), and item-total correlations. The mapping and statistics affirm the content coverage of the UEQ items of the target conceptual terrain.

UES Development Report 74 |
Table 13: UES scales, constituent items and item correlations Scale Items Correlation
Learner Engagement (α=0.74)
Sense of belonging to your university 0.42 Ask questions or contribute to discussions 0.35 Work with students as part of course 0.59 Interact with students outside course 0.63 Interact with students who are very different to you 0.57
Teaching & Support (α=0.94)
Receive support to settle in 0.58 Use university services to support study 0.43 Teachers engage you in learning 0.75 Teachers show concern for learning needs 0.75 Teachers provide clear explanations 0.72 Teachers stimulate you intellectually 0.73 Teachers comment on work to help you learn 0.73 Teachers are helpful and approachable 0.74 Teachers set challenging assessment 0.70 Quality of teaching 0.73 Quality of academic learning advice 0.73 Quality of overall educational experience 0.75 Quality of online learning resources 0.55 Quality of assigned books and resources 0.61 Quality of library resources and facilities 0.47 Course structure and focus 0.73 Course relevance to overall education 0.67 Administrative staff and services: Helpful 0.55 Support services staff: Helpful 0.56
Educational Development (α=0.91)
Improve critical and analytical thinking 0.77 Improve ability to solve complex problems 0.76 Improve ability to work effectively with others 0.68 Improve confidence to learn independently 0.71 Improve written communication skills 0.73 Improve spoken communication skills 0.71 Improve knowledge of field 0.67 Improve work-related knowledge and skills 0.64
Construct validation
While both content validity relies on judgement, construct validity is established through psychometric modelling. An integrated set of psychometric procedures were used during instrument development to analyse the data from the pilot UES administration. Construct validity can be determined in various ways. One of the most important considerations is that the items within each scale provide ‘unidimensional’ measurement of the target construct. This is most commonly done by using factor (or principal components) analysis, or item response modelling. Results from this type of validation exercise can be extensive so a small selection is detailed in this report. Tests of scale reliability - the capacity of items to work together and provide consistent measurement - also affirm the effectiveness of the scales. Cronbach’s alpha (α) provides a commonly measure of internal consistency and reliability of the scales in the UES. Alpha reliability is highest among the Teaching and Support scale (α=0.94) and the Educational Development scale (α=0.91). This indicates excellent internal consistency for these two scales. While the reliability coefficient for the Learner Engagement scale is somewhat lower (α=0.74) this is still be considered to be an acceptable level of internal consistency.
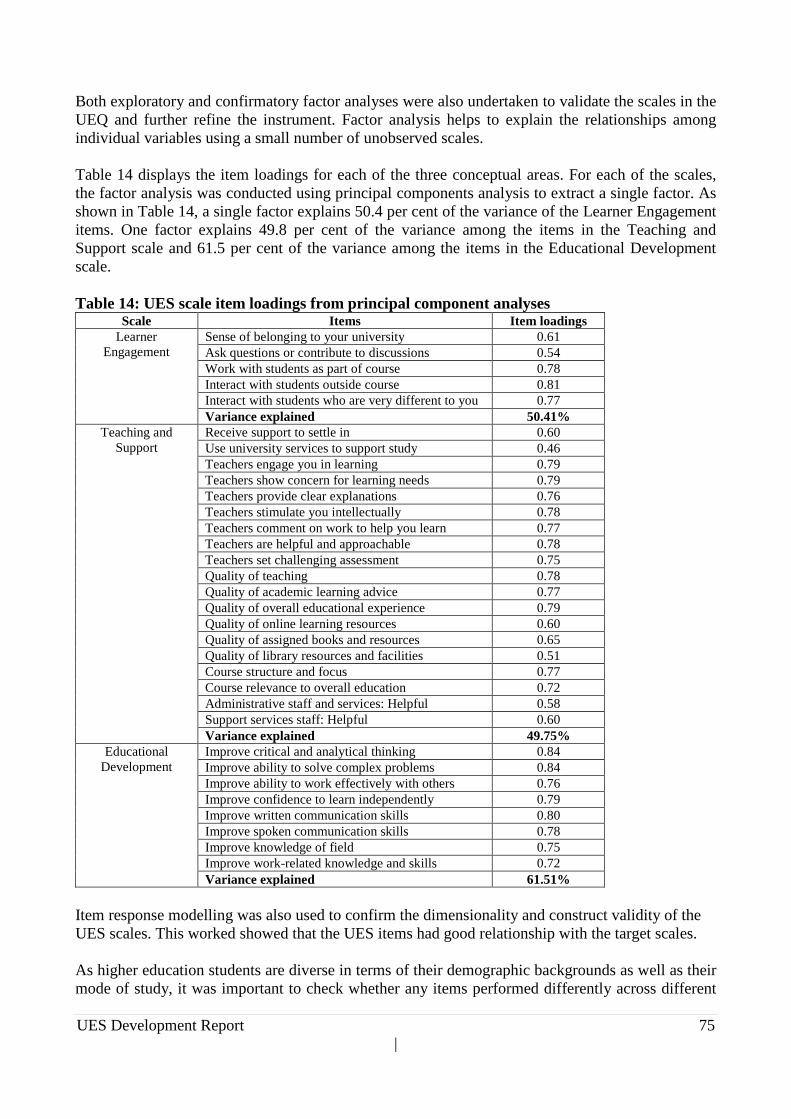
UES Development Report 75 |
Both exploratory and confirmatory factor analyses were also undertaken to validate the scales in the UEQ and further refine the instrument. Factor analysis helps to explain the relationships among individual variables using a small number of unobserved scales. Table 14 displays the item loadings for each of the three conceptual areas. For each of the scales, the factor analysis was conducted using principal components analysis to extract a single factor. As shown in Table 14, a single factor explains 50.4 per cent of the variance of the Learner Engagement items. One factor explains 49.8 per cent of the variance among the items in the Teaching and Support scale and 61.5 per cent of the variance among the items in the Educational Development scale. Table 14: UES scale item loadings from principal component analyses
Scale Items Item loadings Learner
Engagement Sense of belonging to your university 0.61 Ask questions or contribute to discussions 0.54 Work with students as part of course 0.78 Interact with students outside course 0.81 Interact with students who are very different to you 0.77 Variance explained 50.41%
Teaching and Support
Receive support to settle in 0.60 Use university services to support study 0.46 Teachers engage you in learning 0.79 Teachers show concern for learning needs 0.79 Teachers provide clear explanations 0.76 Teachers stimulate you intellectually 0.78 Teachers comment on work to help you learn 0.77 Teachers are helpful and approachable 0.78 Teachers set challenging assessment 0.75 Quality of teaching 0.78 Quality of academic learning advice 0.77 Quality of overall educational experience 0.79 Quality of online learning resources 0.60 Quality of assigned books and resources 0.65 Quality of library resources and facilities 0.51 Course structure and focus 0.77 Course relevance to overall education 0.72 Administrative staff and services: Helpful 0.58 Support services staff: Helpful 0.60 Variance explained 49.75%
Educational Development
Improve critical and analytical thinking 0.84 Improve ability to solve complex problems 0.84 Improve ability to work effectively with others 0.76 Improve confidence to learn independently 0.79 Improve written communication skills 0.80 Improve spoken communication skills 0.78 Improve knowledge of field 0.75 Improve work-related knowledge and skills 0.72 Variance explained 61.51%
Item response modelling was also used to confirm the dimensionality and construct validity of the UES scales. This worked showed that the UES items had good relationship with the target scales. As higher education students are diverse in terms of their demographic backgrounds as well as their mode of study, it was important to check whether any items performed differently across different

UES Development Report 76 |
sub-groups (commonly referred to as ‘item bias’). All measurement instruments contain bias, but what is most important is understanding the magnitude and prevalence of bias in the instrument. Because the UEQ was designed to be a single instrument delivered to a diverse group of students, and because of its use for Performance Funding, it is vital to understand any bias that exists. Bias is an aspect of validity, because if an instrument is biased for a certain group of students or in a certain context, then it may not be seen as providing valid measurement for that group or in that context. Differential item functionality (or DIF) measures bias in an instrument by testing whether respondents from different populations with the same scale scores provide the same responses to a particular item. Based on conversations with the sector, and concerns raised by universities, for the UEQ an important bias consideration was whether the instrument performs differently with students studying externally or at a distance compared with students studying on-campus. Other important bias considerations included whether the instrument performs differently with mature-aged students as opposed to younger students, and whether there are differences in performance between metropolitan universities and universities located in regional areas. For the differential item functioning analyses, students who indicated on the questionnaire that they were currently studying externally or at a distance were considered ‘external’ while students who indicated on the questionnaire that they were studying at one or more campuses were considered ‘not external’. Students studying via mixed-mode were excluded from this analysis. Mature-aged students were those who gave their age as 26 years or older, while students 25 or younger were considered not to be mature-aged. For the analyses looking at potential bias in regional institutions compared to metropolitan institutions, regional institutions included those universities who had campuses based only in regional areas, while non-regional institutions included only universities exclusively based in metropolitan areas. An analysis of items in the UES found that no items were biased for regional institutions; however a handful of items appeared to perform differently among external students and among mature-aged students. These included the following items where both external students and mature-aged students performed more poorly than anticipated:
- work with students as part of course; - interact with students outside of course; - interact with students who are very different from you; and - improve ability to work effectively with others.
Mature-aged students also performed better than expected on the item ‘ask questions or contribute to discussions’. Figure 4 provides an example of an item that is biased in performance for students studying externally. The solid line is the expected score for this item, the blue dashed line indicates the actual scores for internal students and the green dashed line the score for external students. Figure 5 provides a further example of an item that is not biased, this time for students that are mature-aged versus those who are not.

UES Development Report 77 |
Figure 4: Example of differential item functioning for internal and external student groups
Figure 5: Example of differential item functioning for mature aged and younger students

UES Development Report 78 |
Figure 6 provides an example plot of the likelihood of a student selecting a particular response category as a function of measured level of student experience. This graph displays the item that asks students about the extent to which they feel a sense of belonging to their university. The graph shows one line for each response category. The horizontal axis provides a standardised range of scores for this item. The graph shows that each response category (‘Not at all’, ‘Very little’, ‘Some’, ‘Quite a bit’, ‘Very much’) is at some point most likely to be chosen by a student. This gives evidence about the efficiency and sufficiency of the response scale for the UES construct and population. Similar reviews were conducted for each item.
Figure 6: Example of unidimensional response curve
Concurrent validation
Criterion validity is concerned with the relationship between performance on an instrument and with a specific criterion. There are two types of criterion validity: concurrent validity, which is when the criterion is measured at around the same time as the target instrument; and predictive validity, which is when the criterion is measured at a future point in time. As the UES has only just been developed, measuring predictive validity is not yet feasible; however measures of concurrent validity can be undertaken. One way in which concurrent validity can be explored in the UES is through the demographic and educational contexts of students. Universities that participated in the UES pilot provided ACER with a population list that included specific student demographics and information on students’ educational contexts. As each student that completed the survey used a unique survey link to participate in the survey, information from the population lists provided could be linked to an individual student in the data file. As students were asked to respond to a number of questions about

UES Development Report 79 |
their demographics and educational contexts, it is possible to compare the information provided by universities to students’ self-reports. Table 15 provides a summary of the extent to which HEIMS data provided by universities matches the responses provided by students. Overall there is a high level of consistency between the HEIMS data and student responses; however, interestingly there are somewhat larger discrepancies for students’ mode of study and disability. The discrepancy between students’ mode of study as reported in HEIMS and in the survey is likely due to changes in students’ mode of study between the time at which HEIMS data was collected and the administration of the pilot survey. Also interesting is that over a third of students who are recorded as having a disability in HEIMS data indicate that they do not have a disability in the UES. This may again be due to changes in circumstance between the time HEIMS data were collected and the UES, but is probably also due, at least in part, to the difference in how this question is asked of students. Table 15: Extent to which HEIMS data and student self-reports match
Item Match (per cent) Male 99.8
Female 99.7 Indigenous 91.8
Non-Indigenous 99.7 Internal mode of study 94.9 External mode of study 82.0 Mixed mode of study 26.8
Domestic student 98.7 International student 97.2
First in family 92.6 Not first in family 92.1
Disability 63.9 No disability 96.3
Figure 7 shows the extent to which HEIMS data on students’ broad field of study matches with students’ self-reported field of study. Again the overlap is strong, however for some fields of study, more than one third of responses do not match the HEIMS data. Again, there may be many reasons for this mismatch in data. Students self report their fields of study by providing an open-ended response which is then coded onto different fields of study and may describe their main area of study in a way that causes it to be coded onto a different field to that which they are actually studying. They also may have changed the field in which they are studying, or be undertaking studies in a number of different fields.

UES Development Report 80 |
Figure 7: Match between HEIMS field of education and self-reported field of education Taking the measurement of concurrent validity even further, some international comparisons could be made between responses on the UES and those in other international surveys, such as United Kingdom’s National Student Survey (NSS), the United States’ National Survey of Student Engagement (NSSE), and the OECD’s Assessment of Higher Education Learning Outcomes (AHELO). This could allow benchmarking of Australia with international contexts. In addition to these surveys, items on the UES could be compared with items from other national surveys, such as the Course Experience Questionnaire (CEQ), the Australasian Survey of Student Engagement (AUSSE) and Australian Quality Training Framework (AQTF) Learner Questionnaire. More specifically, although items are not worded in exactly the same way as items on other survey instruments due to the consultation and validation process, many of the items in the UES measure similar aspects of education as items in other survey instruments which allows for benchmarking and comparisons to be made. Table 16 provides a list indicating which items in the UES could potentially be benchmarked with an item in other large-scale national or international surveys of higher education students.
65.4%
84.9%80.7%
74.4%
60.2%
94.7% 92.8%88.3%
84.7%
64.9%
0%
10%
20%
30%
40%
50%
60%
70%
80%
90%
100%
Science IT Engineering Architecture Agriculture Health Education Business Humanities Creative Arts
Mat
ch (p
er c
ent)
ScienceITEngineeringArchitectureAgricultureHealthEducationBusinessHumanitiesCreative Arts

UES Development Report 81 |
Table 16 Indication of items in UES that benchmark with other survey instruments
Items Benchmark surveys/instruments
CEQ AUSSE NSS FYEQ AQTF At university during 2011, to what extent have you: Received support from your university to settle into study X Used university services (e.g. phone hotlines, online support, learning skills service, careers service, childcare, health service) to support your study
Had a sense of belonging to your university X In 2011, how frequently have you: Asked questions or contributed to discussions online or face-to-face X Worked with other students as part of your study X Interacted with students who are very different from you X During 2011, to what extent have your lecturers, tutors and demonstrators: Engaged you actively in learning Demonstrated concern for student learning X Provided clear explanations on coursework and assessment X X X X Stimulated you intellectually X X X Commented on your work in ways that help you learn X X X Seemed helpful and approachable X Set assessment tasks that challenge you to learn X Thinking of this year, overall how would you rate the following learning resources at your university? Online learning materials Assigned books, notes and resources X Library resources X X Teaching spaces X Student spaces and common areas Computer labs and resources X X X In 2011, to what extent has the program of study/course been delivered in a way that is: Well structured and focused Relevant to your education as a whole X During 2011, to what extent have you found administrative staff or systems (e.g. online administrative services, frontline staff, enrolment systems) to be: Available Helpful X During 2011, to what extent have you found student support staff and services (e.g. online or phone support, counsellors, learning advisors, careers advisors) to be: Available X Helpful X To what extent has your experience at university developed your: Ability to think critically and analytically X X Ability to solve complex problems X X X Ability to work effectively with others X X X Confidence to learn independently X X

UES Development Report 82 |
Items
Benchmark surveys/instruments CEQ AUSSE NSS FYEQ AQTF
Written communication skills X X X Spoken communication skills X X Knowledge of the field(s) you are studying Development of work-related knowledge and skills X X Thinking of this year, overall at your university, how would you rate the quality of: The teaching you have experienced Academic advice you have received X The course you are studying X X X X X

UES Development Report 83 |
Appendix E: Key findings for key analysis groups
Response category frequencies
Table 17 to Table 19 provide summarise weighted responses given by students who participated in the UES pilot administration to each of the items in the UEQ. The frequencies are given separately for first and later year students and for all students combined. Table 17: Learner Engagement item weighted response category frequencies
Item Response scale First year (%) Later year (%) All students (%) Sense of belonging to your university
Not at all 4.5 7.5 6.3 Very little 13.3 14.8 14.2
Some 28.9 29.1 29.0 Quite a bit 31.9 28.4 29.8 Very much 21.5 20.2 20.7
Ask questions or contribute to discussions
Never 3.7 3.6 3.6 Sometimes 33.4 30.6 31.7
Often 35.9 35.0 35.4 Very often 27.0 30.8 29.3
Work with students as part of course
Never 4.2 5.1 4.7 Sometimes 26.2 24.9 25.4
Often 39.7 35.6 37.2 Very often 29.9 34.4 32.6
Interact with students outside course
Never 13.2 13.3 13.2 Sometimes 33.9 32.3 32.9
Often 29.5 28.1 28.7 Very often 23.4 26.3 25.2
Interact with students who are very
different to you
Never 8.5 8.8 8.7 Sometimes 35.4 34.9 35.1
Often 32.9 33.0 33.0 Very often 23.2 23.4 23.3
Table 18: Teaching and Support item weighted response category frequencies
Item Response scale First year (%) Later year (%) All students (%) Receive support to
settle in Not at all 6.0 12.4 9.9
Very Little 13.9 19.2 17.1 Some 34.0 34.2 34.1
Quite a bit 32.5 24.5 27.7 Very much 13.5 9.6 11.2
Use university services to support
study
Not at all 8.2 11.6 10.2 Very Little 15.6 17.4 16.7
Some 29.5 28.8 29.1 Quite a bit 29.5 26.4 27.7 Very much 17.1 15.8 16.3
Teachers engage you in learning
Not at all .8 1.3 1.1 Very Little 4.9 6.5 5.9
Some 26.1 25.8 25.9 Quite a bit 45.8 43.9 44.7 Very much 22.4 22.5 22.5
Teachers show concern for learning
needs
Not at all 1.8 2.7 2.4 Very Little 8.2 9.9 9.2
Some 28.7 28.8 28.8 Quite a bit 39.6 37.7 38.4 Very much 21.8 20.9 21.2

UES Development Report 84 |
Item Response scale First year (%) Later year (%) All students (%) Teachers provide clear explanations
Not at all .9 1.8 1.4 Very Little 6.6 7.6 7.2
Some 26.7 26.2 26.4 Quite a bit 40.8 40.1 40.4 Very much 25.0 24.3 24.6
Teachers stimulate you intellectually
Not at all 1.2 2.0 1.7 Very Little 6.3 6.8 6.6
Some 25.1 25.3 25.2 Quite a bit 42.1 39.7 40.7 Very much 25.4 26.2 25.9
Teachers comment on work to help you
learn
Not at all 2.4 3.8 3.2 Very Little 10.8 12.6 11.9
Some 31.0 30.7 30.8 Quite a bit 35.5 34.1 34.6 Very much 20.3 18.8 19.4
Teachers are helpful and approachable
Not at all 1.0 2.1 1.7 Very Little 4.6 5.6 5.2
Some 21.7 22.8 22.3 Quite a bit 38.5 38.6 38.5 Very much 34.2 31.0 32.3
Teachers set challenging assessment
Not at all .8 1.6 1.3 Very Little 3.2 4.0 3.7
Some 18.7 19.7 19.3 Quite a bit 43.5 44.3 44.0 Very much 33.7 30.4 31.7
Quality of teaching Poor 2.1 3.8 3.1 Fair 13.5 15.0 14.4
Good 52.5 50.9 51.5 Excellent 31.8 30.3 30.9
Quality of academic learning advice
Poor 4.0 6.5 5.5 Fair 22.1 23.2 22.7
Good 51.9 49.4 50.4 Excellent 22.0 20.9 21.3
Quality of overall educational experience
Poor 2.6 4.2 3.6 Fair 16.7 17.7 17.3
Good 53.4 51.5 52.2 Excellent 27.4 26.6 26.9
Quality of online learning resources
Poor 2.6 3.7 3.2 Fair 15.8 17.5 16.8
Good 50.0 50.6 50.4 Excellent 31.7 28.2 29.6
Quality of assigned books and resources
Poor 2.5 4.1 3.4 Fair 21.6 23.9 23.0
Good 54.4 53.0 53.5 Excellent 21.5 19.1 20.0
Quality of library resources and
facilities
Poor 2.8 3.1 3.0 Fair 13.1 14.3 13.9
Good 47.6 48.0 47.8 Excellent 36.5 34.5 35.3
Course structure and focus
Not at all 1.2 2.1 1.8 Very Little 4.0 5.6 5.0
Some 22.8 25.4 24.3 Quite a bit 46.6 43.9 45.0 Very much 25.4 23.1 24.0
Course relevance to overall education
Not at all .6 .9 .8 Very Little 3.2 3.7 3.5
Some 20.1 20.4 20.3

UES Development Report 85 |
Item Response scale First year (%) Later year (%) All students (%) Quite a bit 43.0 41.7 42.2 Very much 33.1 33.3 33.2
Administrative staff and services: Helpful
Not at all 2.2 3.8 3.2 Very Little 6.2 8.9 7.8
Some 24.7 26.4 25.7 Quite a bit 40.3 37.5 38.6 Very much 26.6 23.3 24.6
Support services staff: Helpful
Had no contact 25.3 22.8 23.8 Not at all 1.6 3.1 2.5
Very Little 4.2 6.0 5.3 Some 18.4 20.4 19.6
Quite a bit 28.2 27.4 27.7 Very much 22.2 20.2 21.0

UES Development Report 86 |
Table 19: Educational Development weighted response category frequencies
Item Response scale First year (%) Later year (%) All students (%) Improve critical and analytical thinking
Not at all .8 1.0 .9 Very Little 3.6 3.5 3.5
Some 19.8 16.7 17.9 Quite a bit 45.4 43.1 44.0 Very much 30.4 35.8 33.6
Improve ability to solve complex
problems
Not at all 1.1 1.1 1.1 Very Little 4.7 4.8 4.7
Some 23.3 20.5 21.6 Quite a bit 44.3 43.6 43.9 Very much 26.7 30.0 28.6
Improve ability to work effectively with
others
Not at all 2.0 2.1 2.1 Very Little 6.7 6.8 6.7
Some 24.2 22.9 23.4 Quite a bit 39.2 38.4 38.7 Very much 27.8 29.8 29.0
Improve confidence to learn
independently
Not at all 1.2 1.4 1.3 Very Little 4.2 4.0 4.1
Some 16.6 15.6 16.0 Quite a bit 40.5 38.5 39.3 Very much 37.4 40.6 39.3
Improve written communication skills
Not at all 1.2 1.3 1.3 Very Little 5.6 5.3 5.4
Some 22.0 18.2 19.7 Quite a bit 42.0 40.5 41.1 Very much 29.2 34.7 32.5
Improve spoken communication skills
Not at all 2.1 2.4 2.3 Very Little 8.4 7.8 8.0
Some 26.2 23.8 24.8 Quite a bit 38.6 38.3 38.4 Very much 24.6 27.8 26.5
Improve knowledge of field
Not at all .5 .6 .5 Very Little 1.9 2.4 2.2
Some 12.6 11.9 12.2 Quite a bit 38.5 39.0 38.8 Very much 46.5 46.1 46.2
Improve work-related knowledge
and skills
Not at all 1.4 2.1 1.8 Very Little 6.6 8.4 7.7
Some 22.6 23.4 23.1 Quite a bit 39.8 37.6 38.5 Very much 29.7 28.4 28.9

UES Development Report 87 |
Scale descriptive statistics
The tables and graphs that follow provide further details of the descriptive scale scores for different groups. As noted elsewhere, the 2011 UES pilot was not designed or conducted to obtain baseline data. Hence, even though a large number of institutions and students participated in the fieldwork the results must be considered heuristic at best. Generally, given the sample size and score distributions most results likely to be ‘statistically significant’ if they are at least five (5) scale points different. Similarly, given score distributions, differences of at least five score points could be considered to reflect a small effect size. Table 20: Scale score descriptive statistics for first and later year students
Learner Engagement Teaching & Support Educational Development
Mean
Standard Deviation Mean
Standard Deviation Mean
Standard Deviation
First year 60.3 21.0 69.2 16.3 74.1 17.6 Later year 60.7 21.7 66.7 17.5 75.0 18.1 Total 60.5 21.4 67.7 17.1 74.6 17.9
It is important to note that demographics and contexts do not explain statistically much of the variation in mean scale scores. For instance, the institution a student attends only explains around 6% of their engagement, 1% of their teaching and support, and 0.8% of their educational development. Field of education helps to explain the largest amount of variability (see Figure 11 for example). This situation is not peculiar to the UES. Rather, it is typical that most (typically around two-thirds) of variability in students’ responses to feedback questionnaires is explainable by individual rather than student/teacher/institution groups.

UES Development Report 88 |
Figure 8: Learner Engagement average scale scores by university
0
10
20
30
40
50
60
70
80
90
Uni 1 Uni 2 Uni 3 Uni 4 Uni 5 Uni 6 Uni 7 Uni 8 Uni 9 Uni 10 Uni 11 Uni 12 Uni 13 Uni 14 Uni 15 Uni 16 Uni 17 Uni 18 Uni 19 Uni 20 Uni 21 Uni 22 Uni 23 Uni 24
Ave
rage
are
a sc
ore
First year Later year

UES Development Report 89 |
Figure 9: Teaching and Support average scale scores by university
0
10
20
30
40
50
60
70
80
90
100
Uni 1 Uni 2 Uni 3 Uni 4 Uni 5 Uni 6 Uni 7 Uni 8 Uni 9 Uni 10Uni 11Uni 12Uni 13Uni 14Uni 15Uni 16Uni 17Uni 18Uni 19Uni 20Uni 21Uni 22Uni 23Uni 24
Ave
rage
are
a sc
ore
First year Later year

UES Development Report 90 |
Figure 10: Educational Development average scale scores by university
0
10
20
30
40
50
60
70
80
90
100
Uni 1 Uni 2 Uni 3 Uni 4 Uni 5 Uni 6 Uni 7 Uni 8 Uni 9 Uni 10Uni 11Uni 12Uni 13Uni 14Uni 15Uni 16Uni 17Uni 18Uni 19Uni 20Uni 21Uni 22Uni 23Uni 24
Ave
rage
are
a sc
ore
First year Later year

UES Development Report 91 |
Figure 11: Teaching and support scale scores by selected subject areas within institution
0
10
20
30
40
50
60
70
80
90
100
Tea
chin
g &
supp
ort
scor
e

Table 21: UES average scale scores for selected fields of education
Learner Engagement Teaching & Support Educational Development First year Final year First year Final year First year Final year
Natural & Physical Sciences 59.8 60.8 71.0 69.3 72.8 76.5
Mathematics 57.0 60.1 72.8 68.4 68.5 74.6 Biological Sciences 63.4 64.8 73.3 69.7 78.9 77.6 Medical Sciences and Technology 63.9 67.5 74.6 72.8 78.1 79.8
Computing & Information
Systems 61.3 57.0 67.0 62.6 72.1 68.7
Engineering - Other 55.6 54.4 65.0 60.3 70.8 69.7 Engineering -
Process & Resources
60.2 66.0 68.6 64.6 74.9 70.2
Engineering - Mechanical 64.7 61.5 63.4 61.8 73.6 71.4
Engineering - Civil 67.7 68.9 62.3 68.1 70.2 75.0 Engineering - Electrical & Electronic
62.5 66.8 65.6 62.6 71.5 70.8
Engineering - Aerospace 62.8 62.9 66.5 63.8 70.8 69.9
Architecture & Urban
Environments 61.6 63.6 66.7 66.6 74.0 74.3
Agriculture & Forestry 58.3 66.9 71.5 68.3 73.6 80.4
Environmental Studies 57.2 64.3 71.0 74.2 74.5 79.8
Health Services & Support 62.3 64.3 68.3 69.0 74.2 77.1
Public Health 55.6 62.3 72.8 72.2 77.0 76.2 Medicine 69.5 71.7 64.9 64.2 75.1 77.4 Nursing 62.0 64.5 68.7 66.3 75.1 75.6
Pharmacy 67.3 62.5 71.3 69.7 77.3 77.9 Dentistry 59.9 69.0 68.1 66.6 75.3 84.2
Veterinary Science 75.8 72.3 74.8 71.9 84.2 80.6 Physiotherapy 69.4 70.8 72.3 74.4 76.4 81.9 Occupational
Therapy 69.3 65.8 69.8 68.6 75.7 80.5
Teacher Education - Other 57.5 56.3 70.5 67.9 75.1 77.5
Teacher Education - Early Childhood 61.5 65.1 70.1 67.2 74.7 77.4
Teacher Education - Primary & Secondary
64.3 65.7 69.7 63.2 76.1 75.3
Accounting 59.3 58.6 66.1 64.5 69.7 69.0 Business
Management 58.7 59.4 68.4 65.4 73.2 73.4
Sales & Marketing 64.7 57.0 66.7 63.3 75.1 72.6 Management &
Commerce - Other 57.4 57.2 68.3 66.0 70.5 72.3
Banking & Finance 55.6 57.1 67.5 67.6 72.0 74.7

UES Project Plan 93 |
Learner Engagement Teaching & Support Educational Development First year Final year First year Final year First year Final year
Political Science 66.5 58.8 74.2 72.2 78.3 78.1 Humanities (incl.
History & Geography)
58.1 56.6 70.5 69.2 74.8 76.2
Language & Literature 58.0 60.8 68.6 67.7 71.9 75.4
Social Work 57.9 58.1 73.1 68.2 78.6 78.9 Psychology 62.5 59.7 71.2 69.0 74.1 76.0
Law 53.3 52.7 68.7 65.2 74.8 74.6 Justice Studies &
Policing 42.5 51.4 75.1 71.8 77.0 79.9
Economics 61.3 62.1 61.2 65.3 70.0 74.2 Sport & Recreation 68.6 61.7 79.7 65.7 90.0 70.8
Art & Design 62.6 62.0 68.9 66.5 70.8 73.5 Music &
Performing Arts 66.1 65.6 69.6 68.0 75.4 71.0
Communication, Media &
Journalism 56.7 59.1 68.0 68.4 72.2 75.6
Tourism, Hospitality &
Personal Services 68.3 70.4 89.0 72.7 99.0 74.5
Table 22: UES average scale scores for student gender
Learner Engagement Teaching & Support Educational Development First year Final year First year Final year First year Final year
Male 59.8 60.4 68.0 65.6 72.5 73.4 Female 60.7 61.0 70.4 67.9 75.4 76.2
Table 23: UES average scale scores for campus attendance
Learner Engagement Teaching & Support Educational Development First year Final year First year Final year First year Final year
On one campus 63.0 63.0 69.7 67.3 74.5 75.2
On two or more campuses 61.5 63.7 67.1 66.4 73.0 75.3
Mix of external/ distance and on-campus
54.7 59.4 69.4 66.0 75.2 75.3
External/distance 38.5 40.2 68.2 64.5 71.7 73.6 Table 24: UES average scale scores for attendance type
Learner Engagement Teaching & Support Educational Development First year Final year First year Final year First year Final year
Part time 49.0 47.9 69.7 66.9 72.7 73.3 Full time 62.2 63.3 69.3 66.9 74.4 75.4

UES Project Plan 94 |
Table 25: UES average scale scores for average hours per week preparing for class
Learner Engagement Teaching & Support Educational Development First year Final year First year Final year First year Final year
None 51.5 43.9 57.6 55.1 61.0 58.0 1 to 5 hours 56.8 56.3 66.7 63.6 71.1 72.1
6 to 10 hours 60.2 59.7 69.2 65.8 74.0 74.1 11 to 15 hours 60.4 61.6 70.2 67.3 74.7 75.4 16 to 20 hours 61.9 63.0 70.2 69.4 75.8 76.9 21 to 25 hours 63.1 63.7 73.1 69.6 78.0 78.6 26 to 30 hours 62.6 63.2 70.4 70.6 74.5 78.2
More than 30 hours 64.8 68.5 71.6 70.8 77.3 78.9 Table 26: UES average scale scores for Aboriginal or Torres Strait Islander origin status
Learner Engagement Teaching & Support Educational Development First year Final year First year Final year First year Final year
Not of Aboriginal or Torres Strait Islander origin 60.4 60.8 69.4 67.0 74.2 75.1
Yes, Aboriginal origin 61.4 55.6 71.5 61.3 76.9 72.2 Yes, Torres Strait
Islander origin 58.8 73.8 68.7 76.9 73.5 82.5
Yes, both Aboriginal and Torres Strait Islander origin 46.8 67.2 55.1 56.8 58.3 74.6
Table 27: UES average scale scores for student socioeconomic status (SES)
Learner Engagement Teaching & Support Educational Development First year Final year First year Final year First year Final year
Low SES 58.3 59.8 70.4 68.2 75.0 76.5 Middle SES 60.8 61.3 69.6 67.6 74.6 76.1 High SES 62.1 61.0 69.0 65.9 74.1 74.1
Table 28: UES average scale scores for domestic and international students
Learner Engagement Teaching & Support Educational Development First year Final year First year Final year First year Final year
Not permanent resident or citizen
of Australia or New Zealand
59.9 60.4 69.5 67.0 73.4 72.9
Permanent resident or citizen
of Australia or New Zealand
60.5 60.9 69.4 66.9 74.4 75.6
Table 29: UES average scale scores for student first-in-family status
Learner Engagement Teaching & Support Educational Development First year Final year First year Final year First year Final year
Not first in family 61.7 62.7 69.2 66.9 74.0 75.0 First in family 59.5 58.7 70.1 66.9 74.8 75.3

UES Project Plan 95 |
Appendix F: University Experience Survey Project Advisory Group (UES PAG) composition and Terms of Reference
PAG composition and meetings 1. A PAG has been formed to provide advice and input into the development of the UES. The PAG
will oversee the design and assure the quality of the development and deployment of the UES. 2. The PAG will include representatives from peak bodies including Universities Australia, the
Australian Technology Network of Universities (ATN), Group of Eight (Go8), Innovative Research Universities (IRU) and the National Union of Students, among others.
3. The UES PAG will form a working group to advise on more technical matters pertaining to the
development and deployment of the UES. Terms of Reference 4. The PAG is a consultative group that provides guidance of a technical, scholarly or practical nature. 5. The Project Advisory Group is managed by the UES Consortium, consisting of the Australian
Council for Educational Research (ACER), the Centre for the Study of Higher Education (CSHE) and the Griffith Institute of Higher Education (GIHE).
6. The UES Consortium and Department of Education, Employment and Workplace Relations
(DEEWR) are responsible for suggesting membership to the PAG. The overriding principle guiding the selection of members for the PAG is relevant expertise and representation of key stakeholders and interest groups.
7. The Project Advisory Group will be chaired by an attending member of the UES Consortium. 8. Project Advisory Group composition will be approved by the UES Consortium in consultation with
the DEEWR. PAG members will be asked to sign a confidentiality agreement. 9. The PAG could be consulted on matters such as instrument and dimension development, validation
activities, administrative and methodological matters, consultation matters, deployment of the UES and reporting for the UES.
10. The PAG will meet at key stages of the UES development and deployment. Around four
teleconference meetings will be scheduled throughout 2011 along with a possible face-to-face meeting in later 2011. Other informal input from the PAG may be requested throughout the UES development and deployment.
11. In addition to the scheduled teleconference meetings to be held in 2011, the PAG will review and
provide informal feedback on documents when requested and its members may participate in other meetings organised as part of the consultation process for the UES development.
12. The UES Consortium is responsible for organising and supporting meetings of the PAG and
responsible for managing the logistics of the teleconferences and face-to-face meetings.

UES Project Plan 96 |
Appendix G: UES Consortium Terms of Reference for ‘development of a University Experience Survey measuring dimensions of higher education students’ university experience’ Services 1. In consultation with the Department, You will construct and develop a survey of university student
experience that can be used as an instrument for use in Performance Funding. This project will involve You working with universities to contact and collect relevant data from current first year undergraduate students in Australian universities. In addition, You will be responsible for analysing the data and the representativeness of the respondents.
2. The purpose of this project is to develop a University Experience Survey that can be used as an indicator of student experience in the Performance Funding arrangements.
3. Delivery of this project will be in four distinct stages:
4. Stage 1: Research and development of the survey instrument
a. Provide draft project proposal to DEEWR b. Examine existing research on measuring student experience and student satisfaction. c. Consider existing surveys and scales of student experience/student engagement both within
Australia and internationally d. Report on findings from secondary sources of information e. Construct the survey, with specific consideration given to:
i. how the survey instrument will be used for the purposes of performance funding and associated timelines
ii. ability to disaggregate results by discipline, where appropriate iii. reflecting student views on academic challenge iv. enabling international performance comparisons v. providing institution-specific reports for university planning and continuous improvement
purposes vi. surveying first year students, and, potentially, later year students vii. the potential to finalise and release survey results in the same year the survey is
undertaken viii. maximising the survey response rate ix. implementation of the survey on an ongoing basis
5. Stage 2: Testing of the survey instrument
a. Test the instrument to determine its ability to meet the tender criteria b. Revise survey instrument as required
6. Stage 3: Implementation of the Survey
a. Liaise with institutions regarding implementation of the survey b. Conduct the survey across all Table A universities that participate in Performance Funding,
ensuring an appropriate sample size to enable disaggregation of results 7. Stage 4: Analysis of survey results
a. Review survey responses, analyse and collate results

UES Project Plan 97 |
b. Provide a draft analysis of the survey results to the Department c. Complete the final report and provide to DEEWR d. Provide institution-specific reports to institutions
8. The project has four stages and nine key milestones. The Contract Materials to be produced is set out in
Item H.1 of Schedule 1. The Contract Materials and project milestones to be completed at each Project Phase by You are outlined in the following table:
Project Stage Project Milestone Contract material Date Stage 1: Research and development of the survey instrument
M1: Draft project plan finalised
CM1: Draft project plan incorporating risk management plan and data analysis plan provided to the Project Officer
25 March 2011
M2: Cross Institutional Forum
CM2: Plan for cross-institutional forum provided to the Project Officer
25 March 2011
M3: Report on the findings from secondary sources of information completed
CM3: Summary of main findings from literature review and background research provided to the Project Officer
31 March 2011
M4: Sector Consultation
CM4: UES design paper provided to the Project Officer
31 March 2011
M5: Survey instrument developed
CM5: Draft questionnaire provided to the Project Officer
17 June 2011
Stage 2: Testing of the survey instrument
M6: Validation of survey instrument
CM6: Report on testing of survey instrument provided to the Project Officer
29 July 2011
Stage 3: Implementation of the survey
M7: University contacts and final questionnaire
CM7: University contact details and university administration manual provided to the Project Officer
29 July 2011
CM8: Final questionnaire provided to the Project Officer Note: The acceptance of the questionnaire for pilot testing and final data collection is subject to approval of the Project Delegate
29 July 2011
Stage 4: Analysis of the survey results
M8: Draft final report and non-response analysis produced
CM9: Non-response analysis and draft final report accepted by Project Officer
31 October 2011
M9: Final report produced
CM10: Final report and data set accepted. Note: Acceptance of the final report is subject to approval of the Project Delegate
30 November 2011
Your Responsibilities 9. You are required to implement a Project Steering Committee for the project which will include membership
from all consortia members and DEEWR representatives.

UES Project Plan 98 |
10. You are required to inform and liaise with Us regarding any substantive issues on which You will be
consulting with the higher education sector and consultation materials must be approved by Us before being sent to the stakeholders within the higher education sector.
11. You are required to liaise closely with the Department throughout all stages of the project, including
involving the Department in consultations at Our discretion and meeting with the Department (in person or via teleconference) once We have received the following Contract Materials:
a. Draft Questionnaire (CM5) b. Report on testing of the survey instrument (CM6) c. Final questionnaire (CM8) d. Draft final report (CM9)
12. You are also required to provide weekly updates via email on the progress of the survey implementation
including response details.
13. You will be responsible for the four project stages outlined in B.8.
14. You will be responsible for any publication, mailing/distribution and prize costs associated with conducting the data collections. The acceptance of the questionnaire for pilot testing and final data collection is subject to approval of the Project Delegate.
15. You will be responsible for the preparation and distribution of the individual institutional reports. These
reports should be developed in consultation with the Department.
16. The Report on non-response and draft final report (CM9 above) include the following:
i. The non-response report will detail response rates and representativeness of the achieved sample. The report will also provide key findings for key analysis groups and will identify issues and sub-groups for further statistical analysis.
ii. The draft report must include advanced analysis of collected data and should identify key areas of student experience.
iii. This report should include:
1. An executive summary; 2. An overview of the project, relevant contexts and previous research, specifically into student
experience; 3. An overview of how the University Experience Survey can be used for measuring performance
of student experience for Performance Funding purposes; 4. An overview of how the University Experience Survey can be used for international
comparisons; 5. An overview of methodology including the study design, non-response treatment, psychometric
properties of the instrument, and analysis techniques; 6. Relevant descriptive statistics and outcomes of more advanced statistical analysis, including
tables and graphs where appropriate; and 7. A detailed discussion of results with key reference to the research areas outlined in B.9 and any
other significant findings emerging from the research. 17. The Final Report and Data Set (CM10, above) must include the following:

UES Project Plan 99 |
i. This report should incorporate into the draft final report all of the Department’s comments and suggestions.
ii. The final data set must incorporate all raw data collected from the survey respondents, with the exception of respondent contact details. The final data set must also contain all derived variables used for reporting. The final data set must be provided in an agreed format together with a description of the file format, variables, weights and data derivations.
iii. Acceptance of the final report is subject to approval by the Project Delegate.
iv. You must deliver to the above Contract Materials to the Project Officer.

UES Project Plan 100 |
Appendix H: UES Design Consultation Paper
Design Consultation Paper
May 2011

101 |
Contents Contents ................................................................................................................................................ 101
Introduction ........................................................................................................................................... 102
Overview ........................................................................................................................................... 102
Context .............................................................................................................................................. 102
Development overview ..................................................................................................................... 103
What the Student Experience Questionnaire could measure ................................................................ 105
Overview ........................................................................................................................................... 105
An emerging conceptual structure .................................................................................................... 105
Specific areas the SEQ could measure .............................................................................................. 106
Context and demographic questions ................................................................................................. 107
Validation of the SEQ ....................................................................................................................... 108
UES methods......................................................................................................................................... 111
Overview ........................................................................................................................................... 111
Confidentiality and privacy ............................................................................................................... 112
Student population definition ............................................................................................................ 112
Student selection ............................................................................................................................... 112
SEQ operationalisation ..................................................................................................................... 113
Deployment approach ....................................................................................................................... 113
Fieldwork .......................................................................................................................................... 114
Quality assurance .............................................................................................................................. 115
National and institutional reporting .................................................................................................. 116
Providing feedback ............................................................................................................................... 118
References ............................................................................................................................................. 119

102 |
Introduction
Overview The Department of Education Employment and Workplace Relations (DEEWR) has contracted a consortium, led by the Australian Council for Educational Research (ACER) and including the University of Melbourne’s Centre for the Study of Higher Education (CSHE) and the Griffith Institute for Higher Education (GIHE), to develop the University Experience Survey (UES).1
The project team is led by Associate Professor Hamish Coates and Professors Richard James and Kerri-Lee Krause.
The UES is being developed for use in Performance Funding and for use by universities (specifically, first year students at Table A universities), for institution’s continuous improvement purposes, and for informing prospective students (for instance, via the My University website). The current project focuses on development of the UES instrument and data collection methods. This Design Consultation Paper outlines and seeks feedback on key characteristics of the UES. The document does not provide a comprehensive overview of the UES, but focuses on the more relevant aspects and in particular those in need of consultation. The document explores the national and international context for the development of the UES, provides an overview of the dimensions the UES could measure, and gives timelines and logistical information for the implementation of the UES pilot in 2011. Feedback is very welcome on all aspects of this document. This feedback will play a formative role in revising UES materials and processes, and preparing for the pilot in 2011. Consultation questions are included at key points to guide this dialogue. Information on how to contribute is provided towards the end of this document. This is the second version of the UES Design Consultation Paper prepared for public feedback. The first version was distributed to all Table A universities. Written feedback has been received, and all Table A institutions have participated in a UES National Forum convened on Tuesday 3 May or subsequent teleconferences. Where possible, this second version of the UES Design Consultation Paper has been revised in light of this feedback.
Context In Transforming Australia’s Higher Education System, the Australian Government (2009) announced its intention to introduce performance funding for universities. In December 2009, DEEWR released a discussion paper outlining an Indicator Framework for Higher Education Performance Funding. This proposed a series of potential performance indicators for measuring quality and equity in Australian public universities for use under a new performance funding system, one of which was a new University Experience Survey to measure the quality of student experience. In October 2010, the
1 NB: Early feedback from institutions suggests that the title “Student Feedback Survey” may be more appropriate than “University Experience Survey” as the former does not presuppose that “universities” are the main level of aggregation. Data is likely to be used at a range of levels of aggregation, most notably field of education. Further, the survey may be used by non-university higher education providers. The title “UES” is retained in this document for consistency with existing policy documentation.

103 |
Australian Government released a draft Performance Framework that included the UES to assess institutional performance. Australia has a rich history in designing survey instruments for higher education, providing a strong foundation and setting high expectations for the UES. Yet very few prior instruments and data collections have been designed specifically for the allocation of performance-based funds. The UES will be designed for use in Performance Funding and for use by universities for continuous improvement purposes. It will be a highly-focussed instrument that is operationally efficient to implement. The UES will support and advance the Australian Government’s higher education Performance Funding initiatives that are designed to stimulate productivity and quality improvement. To do this, the UES must measure the most salient aspects of student experience known to be associated with high-level learning outcomes. In this way, the UES will allow the sector and individual institutions to monitor and support cycles of improvement in the quality of university teaching and learning. The UES will measure facets of first-year and later-year experience including learning and education that can be generalised across institutions and contexts, and that can be shaped and influenced by institutions. In doing so it will use methods that are scalable and at the same time locally relevant. As well as being generalised in this way, the UES will also be informed by international developments (for instance: OECD AHELO, CHE, U-Multirank, NSSE, AUSSE, etc.). Within this context, the current project is focusing on the development of a technically robust, methodologically sound survey with a questionnaire that measures what matters to the student experience.
Development overview The UES is a large-scale policy initiative that must be appropriately positioned within relevant contexts. Because one purpose of the UES will be to allocate public funds, it is even more important that its development and deployment involves the highest technical standards and meets high standards of validity, reliability and efficiency. To ensure confidence from the sector, it is essential that the collection is designed and managed in ways that are efficient, transparent and fully auditable. The UES design team – consisting of ACER, CSHE, GIHE and three expert consultants (Professors Sally Kift (Queensland University of Technology), Sid Nair (University of Western Australia) and Graham Webb (University of New England) – will draw on their own extensive expertise of higher education and in designing and conducting complex national surveys. Only ACER will have access to raw identified data. The consortium will also draw on extensive consultation with the sector and other key stakeholders. To ensure the highest standards, the UES will be developed in a highly consultative manner. Input from higher education experts, an advisory group and the sector at large will be sought. Throughout the UES development and deployment, the consortium will seek input via:
• feedback to this UES Design Consultation Paper; • presentations at conferences and key meetings; • interviews and discussions across the sector, and internationally;

104 |
• student focus groups and interviews; • operational discussions with staff across the system; and • pilot administration to students.
A Project Advisory Group has been formed to oversee design and assure the quality of the development and deployment. Harnessing the support and insights from higher education and content experts through the Project Advisory Group has the potential to play an important role ensuring the success of the UES. The Project Advisory Group includes representatives from peak bodies including Universities Australia, the Australian Technology Network of Universities (ATN), Group of Eight (Go8), Innovative Research Universities (IRU) and the National Union of Students, among others. The Project Advisory Group meets at key stages of the UES development and deployment. The development and deployment of the UES takes place over the course of 2011. The broad schedule is provided in Table 1. Table 30: UES development, key dates
Activity Dates Project commencement February UES Design Consultation Paper (this paper) circulated April UES National Forum May Ongoing consultation and development February – July Implementation work with universities May – August Pilot administration August Pilot national report provided to DEEWR November Preparation for 2012 administration October 2011 – March 2012
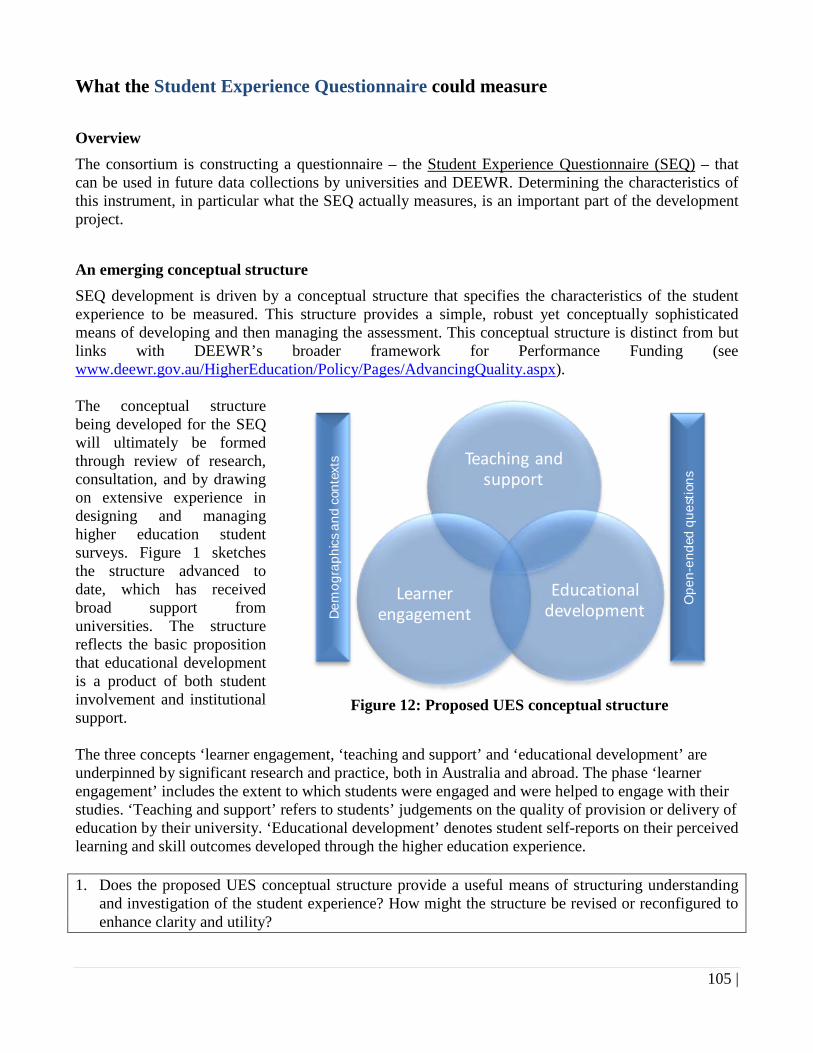
105 |
What the Student Experience Questionnaire could measure
Overview The consortium is constructing a questionnaire – the Student Experience Questionnaire (SEQ) – that can be used in future data collections by universities and DEEWR. Determining the characteristics of this instrument, in particular what the SEQ actually measures, is an important part of the development project.
An emerging conceptual structure SEQ development is driven by a conceptual structure that specifies the characteristics of the student experience to be measured. This structure provides a simple, robust yet conceptually sophisticated means of developing and then managing the assessment. This conceptual structure is distinct from but links with DEEWR’s broader framework for Performance Funding (see www.deewr.gov.au/HigherEducation/Policy/Pages/AdvancingQuality.aspx). The conceptual structure being developed for the SEQ will ultimately be formed through review of research, consultation, and by drawing on extensive experience in designing and managing higher education student surveys. Figure 1 sketches the structure advanced to date, which has received broad support from universities. The structure reflects the basic proposition that educational development is a product of both student involvement and institutional support.
Figure 12: Proposed UES conceptual structure
The three concepts ‘learner engagement, ‘teaching and support’ and ‘educational development’ are underpinned by significant research and practice, both in Australia and abroad. The phase ‘learner engagement’ includes the extent to which students were engaged and were helped to engage with their studies. ‘Teaching and support’ refers to students’ judgements on the quality of provision or delivery of education by their university. ‘Educational development’ denotes student self-reports on their perceived learning and skill outcomes developed through the higher education experience. 1. Does the proposed UES conceptual structure provide a useful means of structuring understanding
and investigation of the student experience? How might the structure be revised or reconfigured to enhance clarity and utility?
Teaching and support
Educational development
Learner engagement
Ope
n-en
ded
ques
tions
Dem
ogra
phic
s an
d co
ntex
ts

106 |
Specific areas the SEQ could measure Within this broader organising structure it is necessary to define specific facets that the SEQ could measure. While the SEQ could be designed to measure a wide range of areas, it will be short and tightly focused on the most significant facets of first-year and later-year education. The SEQ is not an expansive sociological instrument, but an efficient and well-targeted actuarial tool designed to measure phenomena of most relevance to performance funding for continuous improvement. A preliminary list of possible areas has been proposed, drawing on background reviews of research, policy and practice. These are presented in Figure 2, organised using the conceptual structure in Figure 1. These may be administrated to both first-year and later-year students, or with a single cohort only.
Figure 13: Proposed UES focus areas Table 2 provides brief descriptions for each of the areas. Each area is based on firm research foundations and application in large-scale surveys. Titles are intended to provide succinct and accessible means of communicating and interpreting the facet being measured. Table 31: Description of proposed UES focus areas
Concept Focus area Description
Learner engagement
Orientation and transitions Extent to which orientation and integration activities support adjustment. Learner engagement Learners’ participation in active and collaborative forms of learning.
Enriching experiences Extent to which students are involved in broadening educational experiences.
Teaching and support
Student interactions Level and nature of students’ interactions with teaching and non-teaching staff, and with other students.
Teaching and assessment Overall teaching quality, including challenge, stimulation and clarity, and assessment.
Administrative support services
Level of individually focused learning and administrative support.
Curriculum quality Quality of curriculum, including links with industry and future work. Teaching resources Quality of teaching resources and infrastructure. Overall experience Overall satisfaction with their educational experience.
Educational development
Retention intentions Students’ plans to continue with current study, and future intentions. Learning outcomes Students’ development of generic and discipline-specific skills. Developmental outcomes Formation of general forms of individual and social development.
Work and career readiness The extent to which students’ have skills to participate in professional or academic work.
Clearly, something as broad as the ‘student experience’ could be measured in a wide variety of ways. The areas proposed here build on practical experience, a distillation of research insights, and a structure
Lear
ner e
ngag
emen
t
Orientation and transitions Learner engagement Enriching experiences
Teac
hing
and
supp
ort
Student interactions Teaching and assessment Administrative support services Curriculum quality Teaching resources Overall experience Ed
ucat
iona
l dev
elop
men
t Retention intentions Learning outcomes Developmental outcomes Work and career readiness

107 |
that has been considered clarifying and useful. Feedback from consultation is essential to ensure that the UES is conceptualised and contextualised in appropriate ways. A key consultation point, therefore, is to determine the focus of the SEQ. The areas listed in Figure 2 and Table 2 provide a foundation for such deliberation. As part of the design process stakeholders are asked to reflect on their own experiences in providing advice to the consortium on dimensions to be measured by the SEQ. In so doing, it is helpful to keep in mind that items and scales should relate to:
• current research into what matters in higher education teaching, learning and the student experience;
• first-year and later-year education, and the student experience; • Performance Funding; • use in My University website, and other policy initiatives; and • the extent that universities can influence or have responsibility for this facet of the student
experience. Feedback from institutions so far suggests that there would be considerable value in having a lean instrument that includes a number of ‘core scales’ that are administered by all institutions. Some additional scales would then be ‘optional’ with these being selected by or administered to a subset of institutions. Alternatively, the selection of optional scales could be rotated over consequent years to enable time for improvement prior to re-administration. The approach taken hinges on a range of other factors, such as deployment method (independent or devolved – see below), the selection of students (census, or sample – see below), and the number of scales involved. 2. Do the proposed UES focus areas capture what it is important for the SEQ to measure, and are
these labelled in informative ways? Are there any gaps or redundancies in this list? Which should be prioritised for use in performance-based funding? Which could be included to provide more general information for continuous improvement?
The consortium has extensive experience designing, validating and reporting material to measure the facets of the student experience listed in Table 2. The consortium also has ready access to validated items of direct potential relevance to each of these facets of the student experience. Where possible, the consortium aims to draw on existing item materials as this helps ensure validity and relevance for benchmarking with other national and international collections.
Context and demographic questions In addition to measuring dimensions relating to students’ experience and quality of teaching, the SEQ will collect information on certain aspects of students’ educational contexts as well as demographic information. This information will be used to manage survey administration and quality control, support various technical procedures, and allow analysis and reporting for student subgroups. To reduce questionnaire length, it is proposed that context and demographic information is taken from universities’ existing data collections and appended to students’ SEQ responses. Proposed contextual and demographic information includes:
• Student identifier (CHESSN or similar);

108 |
• students’ sex; • students’ age; • students’ field of education, major or academic organisational unit; • whether a student is of Aboriginal or Torres Strait Islander origin; • whether a student is a domestic or international student; • main language spoken at home; • whether a student has a disability; • students’ home suburb/locality and postcode; • mode of study (internal, external or mixed mode); • whether a student is studying part- or full-time; • students’ living arrangements (parent’s home, university college, etc.); • students’ highest educational participation prior to enrolling in their course; • basis for students’ admission to their course (or other measure of learner preparedness); • parents’ highest educational attainment and/or first in family; • non-study related commitments, including hours per week undertaking paid work and caring for
dependents; • mode and distance/time of travel to campus; • access to and skill level relating to technology and broadband internet; and • students’ ethnicity or cultural diversity.
3. What context and demographic questions should be included in the SEQ or captured from existing
databases?
Validation of the SEQ Validation of the SEQ to the highest international standards is essential to ensure the transparency and integrity of the process, and public and institutional confidence in outcomes. The consortium will work with institutions to undertake a multifaceted empirical testing and review process that establishes the face and content validity of the draft SEQ. The process of item validation will be an inclusive one, involving institutions and engaging higher education and technical experts. As with other aspects of research design, survey instruments invariably reflect a compromise between practical, methodological and substantive considerations. A highly iterative and consultative validation process is one means of finding a balance between these forces. Student Experience Questionnaire development will be guided by a number of general design considerations to enhance the power of measurement and ease of administration. These will align with the standards set for international data collections, characteristics of large-scale existing context assessments and link with other survey design specifications recorded during the background reviews. In summary, the UES instrument will be designed to:
• measure the target constructs; • have high levels of face, content and construct validity; • provide reliable and precise measurement of target constructs; • be efficient to administer, analyse and report; • align with and enhance existing instruments and practices; and • provide a basis for ongoing research and development.

109 |
Initial validation will take place during instrument conceptualisation and construction. This includes consultation from stakeholders and feedback from leading national and international experts on university education. A number of further steps will be conducted to validate the SEQ and ensure it provides measurement with required levels of precision, including:
• focus groups with students; • cognitive interviews with a small heterogeneous sample of students; • small-scale testing; • psychometric analysis and technical review; and • preliminary criterion validity review.
Focus groups will be undertaken with students to capture insights into the range and characteristics of the items. These students will be sampled so as to provide a broad representation of key demographic subgroups. Using well-tested resources and focus group methodologies, this testing will help determine whether the items measure appropriate phenomena, whether they are pitched at the right level, and are seen by potential respondents as being appropriate and useful. Through the process of probing and exploring responses, the focus groups will help explore reactions to the items, while simultaneously generating rich qualitative feedback to enhance the face and content validity of the instruments. In addition to the focus groups, cognitive interviews will be conducted with members of the target population. These interviews will be conducted using a verbal probing method. In this type of cognitive interview, after the interviewer asks the proposed survey question out loud, and the interviewee responds using the proposed response set, the interviewer then asks for other specific information relevant to the question or provided answer. In essence, the interviewer probes further into the basis for the response given by the interviewee. Together, the focus groups and cognitive interviews will be used to study and revise, as necessary, the response burden imposed by the SEQ. Other clarifying changes will be made as required. A small-scale test will be conducted to collect data to undertake an initial psychometric examination of the SEQ items, and to provide further information that would help refine items and scales. For this, the consortium will work with a small number of universities to test survey operations. Participating institutions would be asked to deploy the online instrument to around 100 students. Data will be entered, verified and compiled into files for analysis. The data captured through the pilot enables psychometric testing of the survey instrument and items, design and development of statistical routines, and testing of fieldwork resources and processes. The application of rigorous psychometric procedures is essential to ensure that the SEQ yields estimates that measure target constructs and have the desired level of precision. Without careful psychometric validation and calibration it is not possible to confirm that the SEQ provides data that is defensible and fit for purpose. A range of psychometric analyses will be conducted to explore the characteristics of student’s interactions with the items, the empirical behaviour of the items, and relationships between items and target constructs. ACER has extensive international experience in designing and conducting validation analyses which produce effective items, scales and instruments. A suite of analytical approaches will be deployed to undertake the psychometric analyses. These include congeneric measurement modelling,

110 |
item response modelling, and classical test analyses. The precise nature of the analyses will be tailored to the nature of items and instruments, and will include review of:
• item descriptive statistics; • links between items; • coding (and scaling for any composite variables); • construct (internal, convergent and divergent) validity and concurrent (where possible); • reliability (for any composite variables) • response category performance; • reliability generalisability; • test processes for standard error calculation; • differential item functioning; • planned and unplanned item non-response; and • response interference effects.
Preliminary work will be conducted as part of the instrument development to establish the criterion validity of the instrument. This will involve review of concurrent validity that will be conducted by comparing results from the UES against those of several other benchmark collections (notably the AUSSE and FYEQ). Study of predictive validity is not possible during initial development, but it is essential to establish foundations for enabling such validation to take place at a later stage, perhaps even in 2011. Along with testing the SEQ, procedures for scoring items and scales will be developed at this stage. Appropriate psychometric procedures will be fully specified (either simple summative methods and/or more robust psychometric methods). A reporting metric will be developed. A detailed and documented codebook will be developed to manage the operation of the items, map items to the conceptual framework, assist with any item sampling, underpin data file production, and guide analysis and reporting. A range of final technical reviews will be undertaken to bring together the various validation activities, cross check the SEQ’s measurement properties, and develop a range of resources for managing and analysing the items and instrument. The items will be reviewed in terms of the generic measurement criteria specified at the start of the development. The item mapping initiated at the start and managed through the development process will be verified. Final modifications and additions will be made to the SEQ content as required. 4. What other, if any, forms of testing should be conducted to ensure the validity and reliability of the
SEQ? How might these additional quality controls be conducted? What technical standards should be applied?
A report will be prepared summarising the conduct and outcomes of the research processes tested in the pilot, and the key measurement and practical properties of the SEQ. This report will describe how the combination of survey items in the surveys and existing documentation achieves the overall measurement goals described in the framework. Instructions will be prepared for managing production, implementation, analysis and reporting.

111 |
UES methods
Overview The 2011 UES development project not only involves the production of the SEQ but also the development of an efficient and robust data collection process. The information below provides an overview of the administration and methodology of the UES. Much more information will be included in the UES Administration Manual which will be provided to participating institutions in May or June 2011. The survey process will be managed by ACER with the assistance of participating institutions. Technical procedures are used to ensure the quality of survey processes and hence the integrity of survey outcomes. Table 3 provides an overview of the administration schedule for the SEQ. Table 32: Overview of the UES schedule
Phase/Activity APR MAY JUN JUL AUG SEP OCT NOV DEC Preparation Instrument and system development
Consultations with sector and stakeholders
UES National Forum, Melbourne Tuesday 3 May
3
Institution gains internal approvals
ACER sends administration manual to institution
Institution sends population list to ACER
ACER identifies population, selects students, allocates links
Fieldwork First contact email sent to students
Follow-up email sent to students who haven’t yet responded
Final email sent to students who haven’t yet responded
Students reply directly to ACER
Reporting ACER prepares UES data file
ACER analyses data and produces results
Preparation of UES Report for DEEWR
Preparation of institutional UES reports
Review of UES survey deployment

112 |
Confidentiality and privacy It is important to note that while the UES consortium includes, and will consult with, staff from Table A universities, only ACER personnel will have access to survey data. ACER is an independent research agency that handles confidential and highly sensitive data for many large-scale and high-stakes projects. Consortium personnel who are employed by Table A universities will only have access to de-identified and aggregated tables and figures, and not to any raw or aggregated reports that could be used to identify institutions. Privacy needs to be carefully observed in any transfer of individually identifying details between institutions and ACER.
Student population definition Universities and the Project Advisory Group strongly support the inclusion of both first-year and later-year students in the UES. For the UES, ‘first-year student’ is defined as students who:
• are enrolled in undergraduate study; • are studying onshore; • commenced study in the relevant target year; and • at the time of surveying will have been enrolled for at least one semester.
A ‘later-year student’ is defined as students who:
• are enrolled in undergraduate study; • are studying onshore; and • commenced study prior to the target year.
It is important to note that the UES target population includes both domestic and international onshore students. The UES target population also includes students studying part-time as well as full-time, and those studying externally or via mixed mode of study. 5. For the purposes of the UES, is this an appropriate definition of a ‘first-year student’ and ‘later-year
student’? What changes should be made?
Student selection The UES could be run as a census of all students or by administering the SEQ to a sample of students. While ‘default census’ and ‘convenience sampling’ methods have been the predominant data collection approaches in Australian higher education, these are not necessarily the most valid or efficient means of securing data for performance assessment and quality improvement. In the last five years consortium members have worked with higher education institutions in Australia and internationally to build capacity and confidence in scientific sampling, which has been proven to yield excellent outcomes. Deciding between a census or a sample is a complex process that necessarily takes into account many technical, practical and contextual factors. Relevant considerations include:
• support by participating institutions; • the size and characteristics of the population;

113 |
• providing students with opportunities for feedback; • relationship with other data collections, in particular student surveys; • analytical and reporting goals, in particular sub-group breakdowns; • anticipated response rates and data yield; • consistency and transparency across institutions; • cost/efficiency of data collection processes; and • the availability of supplementary data for weighting and verification.
The consortium has experience with both census approaches as well as the application of scientific sampling techniques, and is able to leverage existing techniques to implement a population census or sample survey as determined through consultation. For all of the reasons listed above, feedback from institutions generally supports the use of a census rather than a sample. There may be certain instances with a few very large student cohorts where a census is not required. Regardless of which approach is used, it is essential that proper statistical procedures are used to evaluate the quality and level of response. 6. What are the benefits and limitations of running the UES with a sample of students, or as a census
of all students?
SEQ operationalisation Building on the consortium’s extensive national experience and methodological research over the last decade, the SEQ will be operationalised as a wholly online survey instrument. When designed and managed well, contemporary online survey platforms are robust, efficient, can be embedded within existing institutional systems (if required), and yield high-quality data. The consortium has worked with providers over five years to enhance the properties and outcomes of online surveys. To reduce the length of the SEQ and mitigate item ‘order effects’ it is anticipated that several ‘rotated’ versions of the online instrument will be used. This will allow the SEQ to maintain content coverage and enable certain contextualisation of the instrument. This technology is used routinely in large-scale (institutional, national, cross-national) assessments.
Deployment approach Surveys like the UES tend to be conducted in Australian tertiary education using one of two broad deployment approaches, specifically:
• an independent deployment, which most if not all survey activities are conducted by an independent agency; or
• a devolved deployment, in which institutions and a coordinating agency collaborate on survey operations.
An independent deployment of the UES would involve participating universities providing ACER with a list of all students in the target sample at their institution, along with students’ current email addresses and names. After receiving institutions’ population lists, ACER would identify the target population, (possibly) sample students, allocate online survey links, and invite students to participate in the survey

114 |
via email. Invitations could come from universities and/or DEEWR. Responses will be returned directly to ACER via the online survey system. A devolved approach involves participating universities supplying ACER with a de-identified student list that excludes student contact details. ACER samples students (possibly), allocates online survey links to student records, and sends this list back to universities who merge in student contact details. Universities will then manage the deployment of the survey by sending email invites to sampled students and follow-up with non-respondents via email. Online responses are returned directly to ACER. Each approach has benefits and limitations. Ultimately, the consortium believes that given the stakes and uses to which UES data may be put an independent approach to deployment should be tested to ensure validity, consistency and efficiency. Subject to satisfying privacy laws, this approach has received support from most universities who are keen to see that the UES is conducted in an efficient, reliable and transparent way. Universities have also affirmed that protocols need to be developed around how the UES is marketed to students. 7. What are the benefits and limitations of using an independent or devolved approach to deployment? It is important to note that the UES will be deployed according to the 2007 National Statement on Ethical Conduct in Human Research (NHMRC, ARC & AVCC, 2007) and the Australian Council for Educational Research Code of Ethics (ACER, 2010). ACER routinely collects sensitive test, evaluation and other data and has well established and tested procedures for protecting sensitive materials. Participating institutions are responsible for securing any internal human research ethics or other approvals.
Fieldwork The SEQ pilot test is scheduled to be administered during August 2011. Preparations, including compiling population lists, sampling and testing the online survey system, are scheduled for June to July 2011. As the SEQ will be administered wholly online each sampled student will be invited to participate in the survey via an email invitation. The SEQ distribution includes three emails to students which are summarised in Table 4. More information on the fieldwork process is included in the UES Administration Manual. Table 33: Summary of proposed UES distribution strategy
Activity Week starting First email to all sampled students August 1 First follow-up email to non-respondents August 8 Second and final follow-up email to non-respondents August 15 Fieldwork ends August 19
All completed online survey forms will be sent directly to ACER for processing. As this occurs, ACER will log and collate returns and monitor and track response rates. ACER will provide regular updates on the response process and will be able to provide institutions with information that allows targeting of follow-up emails.

115 |
Securing an appropriate number and range of responses to a sample survey is important to assuring the authority and validity of the results. Institutional surveys compete for time in students’ busy lives, and it is vital to deploy sophisticated methods to engage them in response. The importance of understanding how to engage students in responding to surveys derives from the growing role played by survey feedback in developing and assuring the quality of Australian higher education. Surveys have become an increasingly significant way for students to have their voices factored into the conversations that determine the strategies, policies and practices that shape higher education. Providing feedback from such participation is also a direct means by which institutions can legitimate students’ and graduates’ involvement in their institution’s learning communities. In summary, students are more likely to participate in a survey if they feel that:
• the outcomes are of personal or societal benefit; • their voice matters and will be heard; • the survey and questionnaire themselves look appealing and interesting; and • the process is conducted in a consistent, valid and transparent way.
An important role for participating universities is to assist in promoting the UES to students. It is recommended that institutions promote the UES on student portals and in lectures and tutorials in addition to emails and letters. Research has shown that students are very eager to provide feedback on their study, and efforts should be made to provide them with the opportunity. Students can be uncontactable via their institution’s email account for a range of reasons, however, and there is much benefit in finding a range of ways to alert them that the survey is underway. 8. What are the best ways to ensure a strong response from students? What innovative approaches
could be tested to capture the attention of 2011 students?
Quality assurance Over several years ACER has designed, developed and tested several quality assurance practices that are essential to implementing high-quality data collections of tertiary students, and providing confidence in results. These practices have been based on forensic review of existing national and institutional practices, and on detailed study of methodology and best practice. The approach has been workshopped and discussed extensively with senior and operational staff at all Australian universities, building capacity and buy-in around the methods developed. A major form of quality assurance for the UES stems from the capability of the consortium and consultants, from the use of well-tested methodologies, from a clear vision for the essential characteristics of a successful UES, and from relationships between the consortium and the sector. If the UES is managed independently, ACER’s existing risk management procedures will be used. ACER administers a wide range of high-stakes, large-scale and secure assessments, and has the in-house capacity to support an effective national deployment of the UES. If a devolved deployment approach is to be used, then careful and close supervision of fieldwork operations will be critical to the success of the survey. Using high-level support procedures established

116 |
over five years, ACER will be in regular contact with universities throughout this phase to help guide and support their operations. This close liaison with universities plays a critical role in ensuring the integrity of survey processes and hence project outcomes. In many major projects, the technical oversight provided by ACER specialists helped prevent several major process errors. Even if institutions are not involved in the pilot survey processes in 2011 they will still play a vital role in promoting the UES and using results. A code of practice will be developed to regulate such involvement and ensure it plays out in appropriate ways. To provide confidence in UES processes and outcomes, it is imperative to use the most rigorous and advanced quality assurance protocols. Drawing on extensive research and ongoing experience with all Table A universities, a number of quality assurance processes will be embedded within the UES methodology regardless of the way in which the SEQ is deployed. These include strategies such as:
• ongoing and open consultation and communication with institutions; • the use of dedicated and well-qualified personnel; • the use of standard and well-tested procedures; • double processing of complex or high-stakes operations; • the application of strict financial controls; • the use of tested infrastructure and collaborative arrangements; • the use of standardised and proven materials; • drawing on insights from independent experts; and • regular auditing, cross-checking and reporting.
9. Are the proposed forms of quality assurance for the UES appropriate given the nature and intended
use of the assessment? What other forms of quality assurance might be considered? What criteria and standards should be applied?
National and institutional reporting After fieldwork is completed in August 2011, ACER will compile responses to the online SEQ and generate, build, tidy and validate raw data files. A range of descriptive cross-checks and validation processes will be performed to check responses, sampling adequacy and data quality. The overall raw data file will be produced and provided to DEEWR, and based on this a national report will be produced and provided to DEEWR. A final copy of the report will be provided to DEEWR by the end of November. In future years, DEEWR anticipates that results from the UES may be used for a range of monitoring and planning purposes, including Performance Funding, the My University website, Compacts, and teaching and learning standards. Information about these initiatives is available at: http://www.deewr.gov.au/HigherEducation/Policy/Pages/AdvancingQuality.aspx Institutional data files and reports based on student responses to the SEQ will be provided to participating institutions once DEEWR accepts the final report. Institutional reports will include national benchmarks, as well as some international benchmarks where appropriate. To assist with the production of useful reports, it would be very useful to learn from institutions of the more useful

117 |
contexts for benchmarking. Clarification of benchmarking contexts influences instrument design, survey methods and reporting. 10. What contexts should be considered for benchmarking? In what specific ways should the UES and
SEQ be designed and developed to align with these contexts?

118 |
Providing feedback This document is intended to provide an overview of key features of the UES design, and a basis for consultation about survey materials and processes. We welcome your feedback on any aspect of the proposed instrument and collection. The document is intended to be brief and not exhaustive, so comments on other facets of the UES not covered in this briefing are also very welcome. To provide your feedback, please email the UES consortium at [email protected] by Thursday 26 May 2011. Mail responses clearly marked ‘UES FEEDBACK’ should be sent to:
A/Professor Hamish Coates Australian Council for Educational Research (ACER) 19 Prospect Hill Road (Private Bag 55) Camberwell, Victoria, 3124, Australia
Feedback will not generally be published, but may be referenced in project reports unless it is clearly marked ‘CONFIDENTIAL’. If you would like to speak with a member of the UES consortium please email [email protected] with a list of suggested times, a list of key topics (if possible), and telephone contact details, and an appointment will be made. Please provide your response by Thursday 26 May 2011. Feedback will inform overall UES design, development of survey instruments and infrastructure. The UES is at a formative stage, but as it takes shape, further information will be provided on the UES Exchange (http://ues.acer.edu.au). Universities and other stakeholders have been sent username and password details for this site. At any time, if you have any questions about the UES or would like further information, please contact the UES consortium at [email protected].

119 |
References Australian Council for Educational Research (ACER) (2010). Australian Council for Educational Research Code of Ethics. Melbourne: ACER. Department of Education, Employment and Workplace Relations (DEEWR) (2009).Transforming Australia’s Higher Education System. Canberra: Commonwealth of Australia. National Health and Medical Research Council, Australian Research Council, Australian Vice-Chancellors’ Committee (NHMRC, ARC, AVCC) (2007). National Statement on Ethical Conduct in Human Research. Canberra: Australian Government.
Copyright © 2022 FDOKUMEN