National Young-Driver Survey: Teen Perspective and Experience With Factors That Affect Driving...
15
DOI: 10.1542/peds.2007-2595 2008;121;e1391 Pediatrics Elliott García-España, Sara Kinsman, D. Alex Quistberg, James G. Ross and Michael R. Kenneth R. Ginsburg, Flaura K. Winston, Teresa M. Senserrick, Felipe That Affect Driving Safety National Young-Driver Survey: Teen Perspective and Experience With Factors http://pediatrics.aappublications.org/content/121/5/e1391.full.html located on the World Wide Web at: The online version of this article, along with updated information and services, is of Pediatrics. All rights reserved. Print ISSN: 0031-4005. Online ISSN: 1098-4275. Boulevard, Elk Grove Village, Illinois, 60007. Copyright © 2008 by the American Academy published, and trademarked by the American Academy of Pediatrics, 141 Northwest Point publication, it has been published continuously since 1948. PEDIATRICS is owned, PEDIATRICS is the official journal of the American Academy of Pediatrics. A monthly by guest on May 13, 2014 pediatrics.aappublications.org Downloaded from by guest on May 13, 2014 pediatrics.aappublications.org Downloaded from
Transcript of National Young-Driver Survey: Teen Perspective and Experience With Factors That Affect Driving...
DOI: 10.1542/peds.2007-2595 2008;121;e1391PediatricsElliott
García-España, Sara Kinsman, D. Alex Quistberg, James G. Ross and Michael R. Kenneth R. Ginsburg, Flaura K. Winston, Teresa M. Senserrick, Felipe
That Affect Driving SafetyNational Young-Driver Survey: Teen Perspective and Experience With Factors
http://pediatrics.aappublications.org/content/121/5/e1391.full.html
located on the World Wide Web at: The online version of this article, along with updated information and services, is
of Pediatrics. All rights reserved. Print ISSN: 0031-4005. Online ISSN: 1098-4275.Boulevard, Elk Grove Village, Illinois, 60007. Copyright © 2008 by the American Academy published, and trademarked by the American Academy of Pediatrics, 141 Northwest Pointpublication, it has been published continuously since 1948. PEDIATRICS is owned, PEDIATRICS is the official journal of the American Academy of Pediatrics. A monthly
by guest on May 13, 2014pediatrics.aappublications.orgDownloaded from by guest on May 13, 2014pediatrics.aappublications.orgDownloaded from
ARTICLE
National Young-Driver Survey: Teen Perspective andExperience With Factors That Affect Driving SafetyKenneth R. Ginsburg, MD, MSEda,b, Flaura K. Winston, MD, PhDa,c,d, Teresa M. Senserrick, PhDa, Felipe Garcıa-Espana, PhDa,
Sara Kinsman, MD, PhDa,b, D. Alex Quistberg, BAa, James G. Ross, MSe, Michael R. Elliott, PhDa,f,g
aCenter for Injury Research and Prevention, Children’s Hospital of Philadelphia, Philadelphia, Pennsylvania; bCraig-Dalsimer Division of Adolescent Medicine and cDivisionof General Pediatrics, Department of Pediatrics, Children’s Hospital of Philadelphia and University of Pennsylvania, Philadelphia, Pennsylvania; dLeonard David Institutefor Health Economics, University of Pennsylvania, Philadelphia, Pennsylvania; eMacro International, Inc, Calverton, Maryland; fDepartment of Biostatistics, University ofMichigan School of Public Health, Ann Arbor, Michigan; gSurvey Methodology Program, Institute for Social Research, University of Michigan, Ann Arbor, Michigan
The authors have indicated they have no financial relationships relevant to this article to disclose.
What’s Known on This Subject
Motor vehicle crashes are the leading cause of fatality and acquired disability in adoles-cents, and young inexperienced drivers are overrepresented in crashes. The perspectiveof teens on motor vehicle crash risk has not been explored previously.
What This Study Adds
This research adds to the efforts to change adolescents’ driving behavior by providing abetter understanding of their attitudes and beliefs. It also offers insight into the expo-sures that shape their attitudes, which can help adults promote messages relevant tothe social atmosphere and environmental settings of adolescents.
ABSTRACT
BACKGROUND.Motor vehicle crashes are the leading cause of fatality and acquireddisability in adolescents. Young, inexperienced drivers are overrepresented incrashes.
OBJECTIVE.Our goal was to explore the adolescent perspective on driving safety toprovide a better understanding of factors that influence safety and teenagers’ expo-sure to driving hazards.
METHODS.Adolescents generated, prioritized, and explained their viewpoint by usingthe teen-centered method. These viewpoints were obtained from a school-basednationally representative survey of 9th-, 10th-, and 11th-graders (N � 5665) from 68high schools, conducted in spring 2006, that included teen-generated items. Themain outcome measures were rating of risk and prevalence of witnessing drivinghazards.
RESULTS.Drinking while driving was ranked as the greatest hazard (87% of the re-spondents reported that it made a lot of difference), although only 12% witnessed itoften. Ranked next as dangers while driving were text-messaging, racing, impair-ment from marijuana, and road rage. Sixty percent viewed inexperience as a signif-icant hazard, although only 15% reported seeing it often. Cell phone use was viewedas a significant hazard by 28%, although 57% witnessed it frequently. Only 10%viewed peer passengers as hazardous, but 64% frequently observed them. Distractingpeer behaviors, among other distractions, were viewed as more dangerous. Subpopu-lations varied in the degree they perceived hazards. For example, black and Hispanicadolescents viewed substance use while driving as less hazardous than did whiteadolescents but witnessed it more frequently.
CONCLUSIONS.Adolescents generally understand the danger of intoxicated driving.However, some groups need to better recognize this hazard. Distractions take teen-agers’ focus off the road, but not all are viewed as hazardous. Although inexperience is the key factor that interactswith other conditions to cause crashes, adolescents do not recognize what merits experience. Future research isneeded to explore how to help teens become safer drivers and how to make clinicians, families, and communitiesmore effective in setting, promoting, and monitoring safety standards.
TEENAGED DRIVERS ARE overrepresented in motor vehicle crashes, and crashes are the leading cause of fatality andacquired disability in adolescents.1 The majority of these crashes are caused by driver error that is primarily
related to inexperience,2 although speed-related factors2 and alcohol use3 contribute heavily. Low use of safetyrestraints, which contributes to the high rate of fatalities,4–8 compounds these problems.
Between 1995 and 2005, the number of drivers aged 15 to 20 years who were involved in motor vehicle fatalities3
was reduced modestly. This was achieved, in part, by delaying licensure through graduated driver licensing (GDL)
www.pediatrics.org/cgi/doi/10.1542/peds.2007-2595
doi:10.1542/peds.2007-2595
The views presented are those of theauthors and not necessarily the views ofthe Children’s Hospital of Philadelphia orState Farm.
KeyWordsadolescent, driving safety, motor vehiclecrashes, traffic accidents, survey, qualitativeresearch, teen drivers, automobile driving,adolescent behavior, risk-taking, safety,alcohol driving, United States
AbbreviationsGDL—graduated driver licensingTCM—teen-centered methodNYDS—National Young Driver SurveyCI—confidence intervalRR—relative risk
Accepted for publication Dec 4, 2007
Address correspondence to Kenneth R.Ginsburg, MD, MSEd, Children’s Hospital ofPhiladelphia, Center for Injury Research andPrevention, 34th Street and Civic CenterBoulevard, Suite 1150, Philadelphia, PA 19104.E-mail: [email protected]
PEDIATRICS (ISSN Numbers: Print, 0031-4005;Online, 1098-4275). Copyright © 2008 by theAmerican Academy of Pediatrics
PEDIATRICS Volume 121, Number 5, May 2008 e1391 by guest on May 13, 2014pediatrics.aappublications.orgDownloaded from
laws and to reducing teenaged drinking and driv-ing.1,3,9–16 These results point to the importance of soundpolicy as a foundation for teen-driver safety. Recentresearch has suggested that parents can play an impor-tant role in enhancing and reinforcing that policythrough their teens’ licensure process17,18 and could playa larger role in monitoring them after licensure.19,20
Driver education and training initiatives have largelybeen unsuccessful in reducing crashes that involve teen-aged drivers.21,22 This may be due, in part, to a lack ofeffective content on specific challenges for novice teen-aged drivers, such as detection and appropriate responseto hazards and appropriate speed adjustment for drivingconditions.23–25 Other issues that need more attention aresubstance use (in addition to alcohol)17,26,27; distrac-tions28,29 (including teen passengers)30–34; text-messagingor talking on a hand-held telephone while driving35–39;inexperience40–43; and fatigue.44–46
Driver education and training also may not be opti-mally effective, because they are largely designed with-out teen input. Little is known of what teenagers per-ceive as driving dangers, factors to enhance safety, orways to present interventions that resonate withyouths.44,47–52 To effectively influence teenaged drivers’safety, we must understand risk and safety from theirviewpoint.
Our specific aims for this study were to explore teenperspectives regarding risk and safety, both as a driverand as a teen-driven passenger. By focusing on the teenperspective, we hoped to better understand the factorsthat influence driving safety. To achieve this goal weused the teen-centered method (TCM),53–56 a researchapproach that facilitates adolescents to generate, priori-tize, and explain their views. This method allows themto describe a wide array of perceived safety factors andthen report how frequently they witnessed them. In thisarticle we have focused on the results of a nationallyrepresentative survey that included previously well-re-searched items along with items of greatest concern tothe teenaged informants. We report the survey results bydescribing the teens’ perceived driving safety factors andoffer an overview of their exposure to those factors. Wealso introduce how subpopulations differ in risk, safetyperceptions, and reported exposures.
METHODS
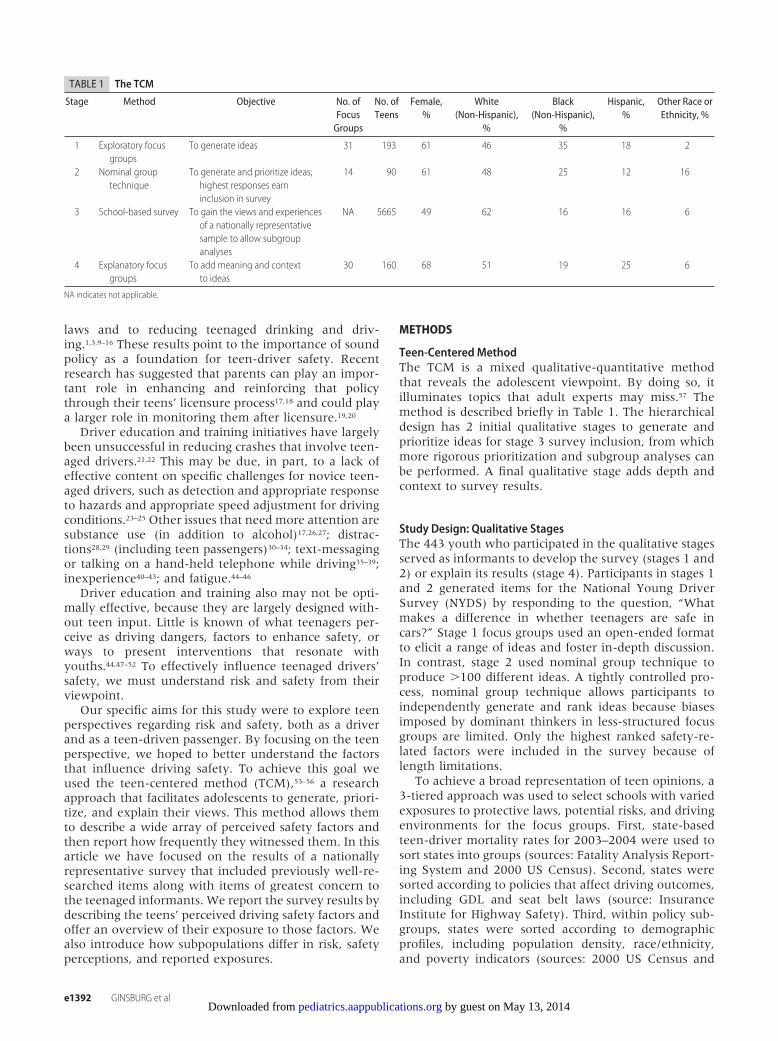
Teen-Centered MethodThe TCM is a mixed qualitative-quantitative methodthat reveals the adolescent viewpoint. By doing so, itilluminates topics that adult experts may miss.57 Themethod is described briefly in Table 1. The hierarchicaldesign has 2 initial qualitative stages to generate andprioritize ideas for stage 3 survey inclusion, from whichmore rigorous prioritization and subgroup analyses canbe performed. A final qualitative stage adds depth andcontext to survey results.
Study Design: Qualitative StagesThe 443 youth who participated in the qualitative stagesserved as informants to develop the survey (stages 1 and2) or explain its results (stage 4). Participants in stages 1and 2 generated items for the National Young DriverSurvey (NYDS) by responding to the question, “Whatmakes a difference in whether teenagers are safe incars?” Stage 1 focus groups used an open-ended formatto elicit a range of ideas and foster in-depth discussion.In contrast, stage 2 used nominal group technique toproduce �100 different ideas. A tightly controlled pro-cess, nominal group technique allows participants toindependently generate and rank ideas because biasesimposed by dominant thinkers in less-structured focusgroups are limited. Only the highest ranked safety-re-lated factors were included in the survey because oflength limitations.
To achieve a broad representation of teen opinions, a3-tiered approach was used to select schools with variedexposures to protective laws, potential risks, and drivingenvironments for the focus groups. First, state-basedteen-driver mortality rates for 2003–2004 were used tosort states into groups (sources: Fatality Analysis Report-ing System and 2000 US Census). Second, states weresorted according to policies that affect driving outcomes,including GDL and seat belt laws (source: InsuranceInstitute for Highway Safety). Third, within policy sub-groups, states were sorted according to demographicprofiles, including population density, race/ethnicity,and poverty indicators (sources: 2000 US Census and
TABLE 1 The TCM
Stage Method Objective No. ofFocusGroups
No. ofTeens
Female,%
White(Non-Hispanic),
%
Black(Non-Hispanic),
%
Hispanic,%
Other Race orEthnicity, %
1 Exploratory focusgroups
To generate ideas 31 193 61 46 35 18 2
2 Nominal grouptechnique
To generate and prioritize ideas;highest responses earninclusion in survey
14 90 61 48 25 12 16
3 School-based survey To gain the views and experiencesof a nationally representativesample to allow subgroupanalyses
NA 5665 49 62 16 16 6
4 Explanatory focusgroups
To add meaning and contextto ideas
30 160 68 51 19 25 6
NA indicates not applicable.
e1392 GINSBURG et al by guest on May 13, 2014pediatrics.aappublications.orgDownloaded from
2003–2004 Public Elementary/Secondary School Uni-verse Survey).
Experienced focus-group moderators conducted allqualitative sessions (stages 1, 2, and 4). Each moderatorreceived 16 hours of training on adolescent group dy-namics and how to limit adult biases. The study protocolwas approved by the institutional review board of theChildren’s Hospital of Philadelphia. Parental consent wasrequired, and adolescents actively assented to participa-tion. Participating class teachers received $50 for class-room use.
Survey Study DesignThe stage 3 NYDS was conducted in spring 2006 with anationally representative sample of 5665 9th-, 10th-,and 11th-graders who were attending the 19 873 USpublic high schools. The NYDS was designed to gatherdata on perceptions, attitudes, and experiences that arelikely to affect driving safety. Measures from previouslyvalidated surveys were incorporated into this survey,including demographic measures that are thought tocorrelate with driving safety (eg, age, gender, race, pop-ulation density), social or behavioral measures that mayinfluence safety (eg, self-reported school performance,substance use, seatbelt use), and driving experience, in-cluding crash history. The teen-generated safety-relateditems from stages 1 and 2 were included in 2 majorsurvey sections, which are the focus of this article.
The first teen-generated section explored attitudes byasking respondents how much of a difference each of 25safety-related factors made “in whether or not teens aresafe in cars” on a 3-point scale (“no difference,” “somedifference,” or “a lot of difference”). The second sectionasked how often they were exposed to 32 safety-relatedfactors. Exposures were determined by asking how oftenthey see the different factors, with possible answers of“rarely or never,” “sometimes or occasionally,” and “of-ten or always.” The second section was able to include 7additional teen-generated items, because pilot testingdemonstrated that it was quicker for respondents toreport how often they witnessed the factors than it wasto rate the degree to which each factor influenced safety.To avoid asking respondents to self-report antisocial orpotentially illegal behaviors, we asked how often theywitnessed or observed the factors. Some research hassuggested that teenagers’ reports of witnessed behaviorscan serve as a limited proxy measure of personal behav-ior.58,59
Although all students could complete a majority ofthe survey, a section regarding driver training, behavior,and crash history was completed only by teens whowere learning to drive or driving on their own. Thesurvey was a paper-and-pencil questionnaire, adminis-tered with an optically scannable answer sheet. It waswritten at a 4th- to 5th-grade reading level. A 3- vs 5-point Likert scale was used when applicable for easierreadability. Pilot testing in 5 high schools in Illinois andPennsylvania revealed that it was easy to comprehendand could be completed in 20 minutes. The institutionalreview boards of the Children’s Hospital of Philadelphia
and Macro International, Inc, the survey contractor, ap-proved the survey protocol.
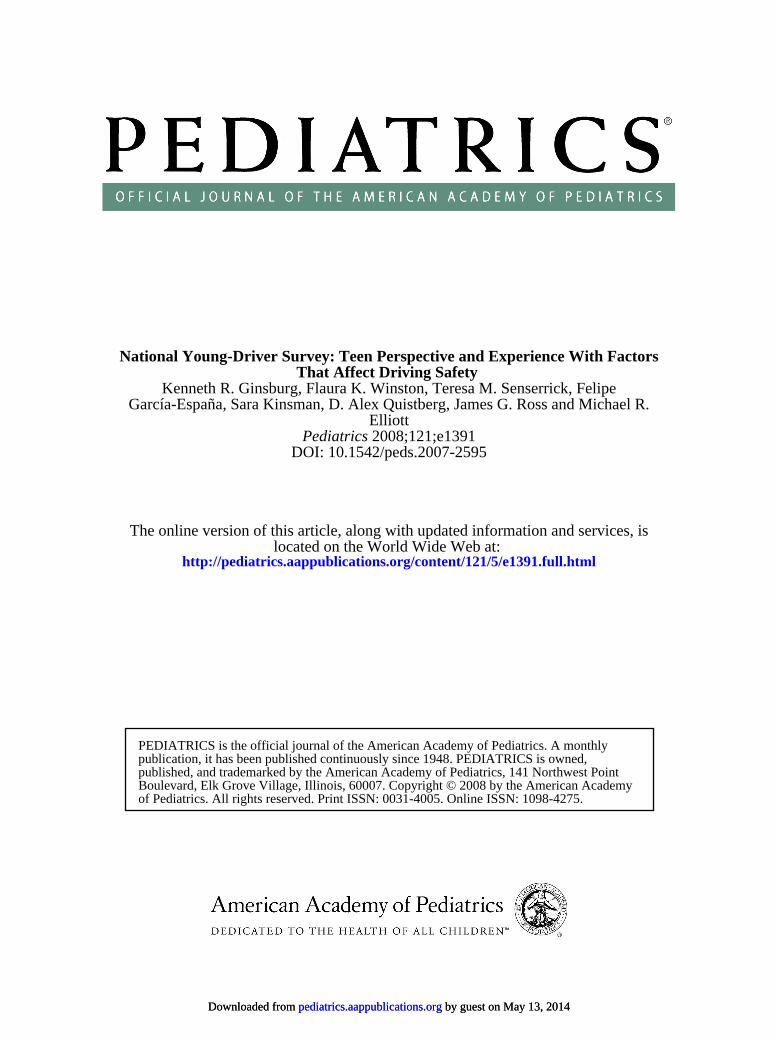
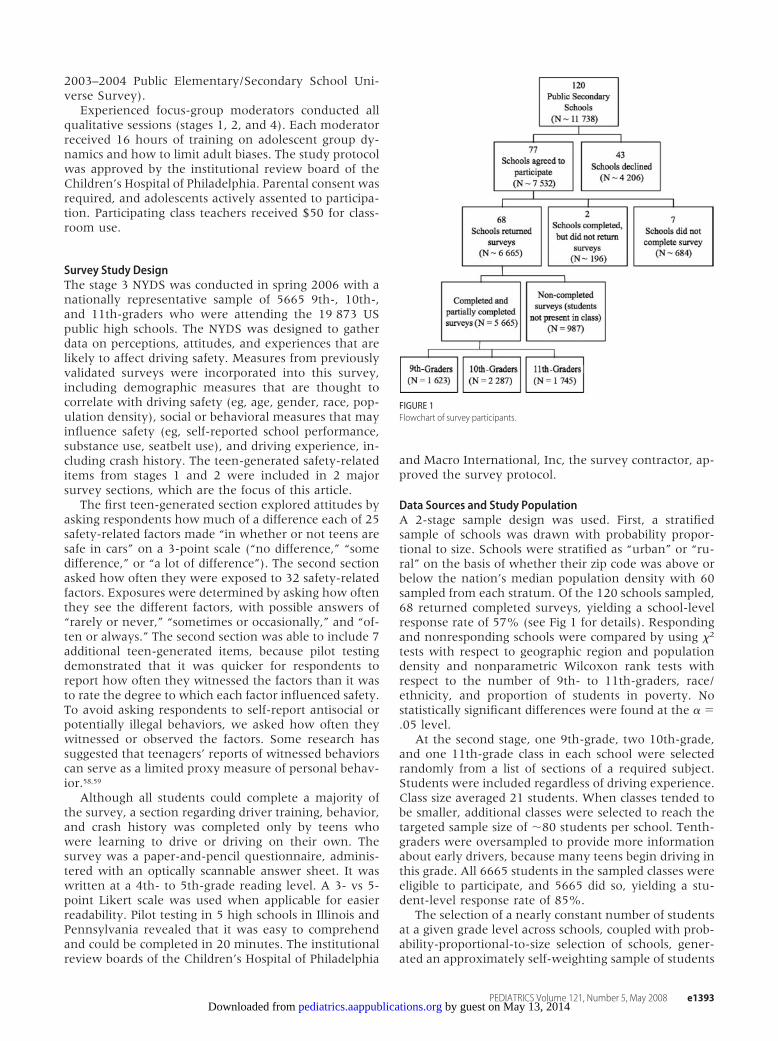
Data Sources and Study PopulationA 2-stage sample design was used. First, a stratifiedsample of schools was drawn with probability propor-tional to size. Schools were stratified as “urban” or “ru-ral” on the basis of whether their zip code was above orbelow the nation’s median population density with 60sampled from each stratum. Of the 120 schools sampled,68 returned completed surveys, yielding a school-levelresponse rate of 57% (see Fig 1 for details). Respondingand nonresponding schools were compared by using �2
tests with respect to geographic region and populationdensity and nonparametric Wilcoxon rank tests withrespect to the number of 9th- to 11th-graders, race/ethnicity, and proportion of students in poverty. Nostatistically significant differences were found at the � �.05 level.
At the second stage, one 9th-grade, two 10th-grade,and one 11th-grade class in each school were selectedrandomly from a list of sections of a required subject.Students were included regardless of driving experience.Class size averaged 21 students. When classes tended tobe smaller, additional classes were selected to reach thetargeted sample size of �80 students per school. Tenth-graders were oversampled to provide more informationabout early drivers, because many teens begin driving inthis grade. All 6665 students in the sampled classes wereeligible to participate, and 5665 did so, yielding a stu-dent-level response rate of 85%.
The selection of a nearly constant number of studentsat a given grade level across schools, coupled with prob-ability-proportional-to-size selection of schools, gener-ated an approximately self-weighting sample of students
FIGURE 1Flowchart of survey participants.
PEDIATRICS Volume 121, Number 5, May 2008 e1393 by guest on May 13, 2014pediatrics.aappublications.orgDownloaded from
within each grade. To account for 10th-grade class over-sampling and differing response rates among schools,weights equal to the inverse of the probability of inclu-sion were constructed. Thus, a student with a 1-in-200probability of selection was weighted to represent 200students, whereas a student with a 1-in-1000 probabilityof selection was weighted to represent 1000 students.These weights were further adjusted by poststratifica-tion, so the distribution of gender, age, and race/ethnic-ity in the sample matched known distributions for allschools in the sampling frame. When the data areweighted, the sample is representative of all 10.6 millionpublic high school students in 9th to 11th grades.
Statistical AnalysisTo ascertain relative rankings of the factors that affectsafety, we calculated the percentage, with 2-sided 95%confidence interval (CI), of responses “this makes a lot ofdifference . . .” for each item. Likewise, to create rank-ings of reported exposures, we calculated the percentageand 95% CI of responses “often or always” for each item.We placed items’ proportions and CIs in a descendingorder. To develop statistically different ranks, each meanand CI were compared with the previous ones. If anoverlap of CIs occurred, we concluded that the itemswere similar. When the CIs did not overlap, we con-cluded that the item represented a new rank.
Between-groups comparison was accomplished byusing unadjusted stratum-specific relative risks (RRs)with 95% CI for each safety perception and exposureitem according to gender, race, grade (as a proxy forage), school performance, population density, drivingstatus, seat belt use, alcohol consumption, and crashinvolvement. Population density was defined on thebasis of the percentage rural/urban of each zip code; zipcodes were classified as rural (0% urban) or nonrural (atleast part of the location within an urban area). Allanalyses used weighted estimators to account for thedisproportional probabilities of selection and response.To adjust inference to account for weighting and clus-tering of subjects according to school, robust (sandwich-type) estimators were employed in all analyses by usingSAS-callable SUDAAN: Software for the Statistical Anal-ysis of Correlated Data 9.1 (Research Triangle Institute,Research Triangle Park, NC).
RESULTS
Sample PopulationTable 2 shows the characteristics of the 5665 surveyparticipants according to gender, race, grade, academicperformance, population density, driving status, seat beltuse, alcohol use, and passenger crash history.
Perceptions of How Factors Affect Driving SafetyThe adolescent respondents rated each of 25 items mosthighly prioritized in stage 2 in terms of how much of adifference it made in driving safety. Table 3 lists items inorder of the percentage of respondents who reported thateach would “make a lot of difference” in driving safety anddivides them into statistically significant rankings.
Overall, the teenagers described a variety of factorsthat they perceived to make a difference in drivingsafety, including issues that affect the driver’s state ofmind: substances (marijuana or alcohol use), fatigue,nervousness caused by parental supervision, and emo-tions (happiness, sadness, or rage). Other factors in-cluded distractions, comprising those related to technol-ogy (cell phone, text-messaging), entertainment (music,dancing), and passengers. Also mentioned were envi-ronmental issues such as poor road conditions, risk be-haviors such as speeding or racing, and safety choicessuch as seat belt use.
All items were highly prioritized by teens in earlierstages to earn inclusion in the survey. Ranks are offeredto point out relative importance of items but should notbe overinterpreted (ie, an item ranked first is not neces-sarily much more important than items ranked in thesecond tier). The adolescent respondents divided the 25items into 9 distinct ranks, with drinking and drivingbeing considered the most risky. The driver text-messag-ing and racing other cars shared second rank. The driversmoking marijuana and exhibiting road rage sharedthird rank. Driver inexperience ranked toward the mid-dle. The driver selecting music or playing it loudly, pas-sengers dancing and singing, and driver cell-phone usewere ranked relatively low. Adolescent passengersranked lowest as a driving safety risk.
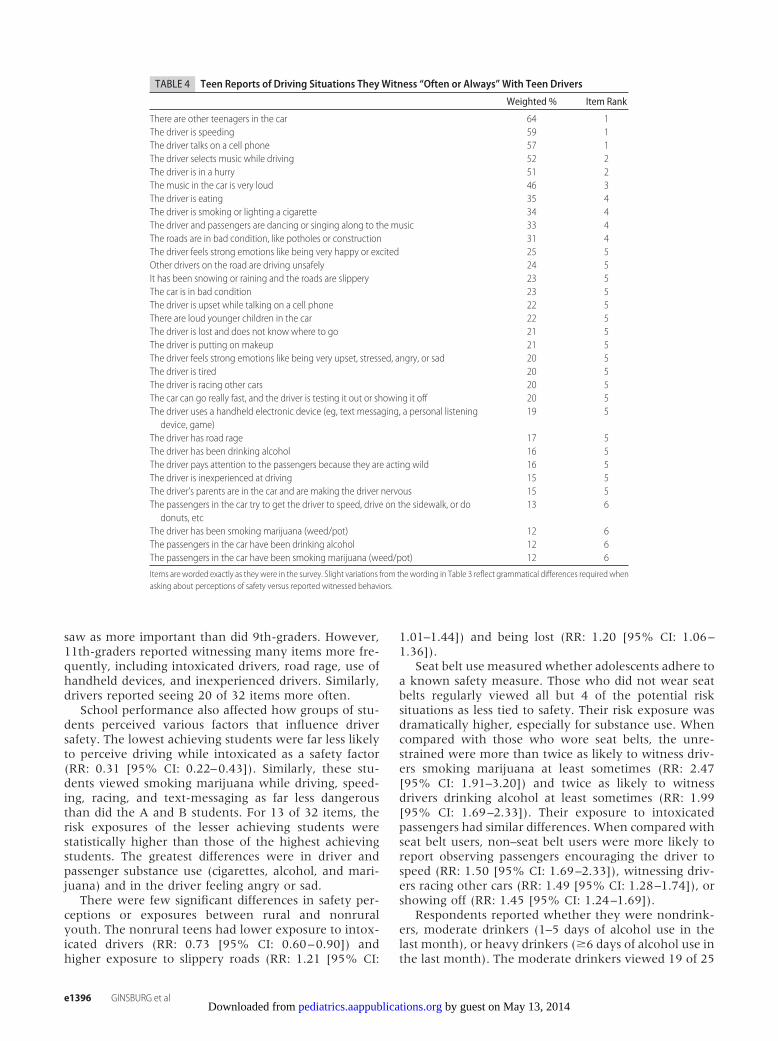
Reported Exposures to Safety and Risk FactorsTable 4 reveals the teenagers’ exposure to 32 items,inclusive of the previous 25 items. Additional items in-cluded the driver eating or smoking cigarettes, engagingin upsetting cell-phone conversations, applying makeup,having younger passengers, and being lost. These itemsare listed in order of the percentage of respondents whooften or always saw these behaviors among teenagers in
TABLE 2 Baseline Characteristics of Survey Participants (N � 5665)
Unweighted n(Weighted %)
Male gender 2734 (51.0)Race/ethnicityWhite 3667 (61.8)Black 761 (15.8)Hispanic 657 (16.5)
Grade9th 1663 (37.7)10th 2287 (32.8)11th 1745 (29.4)
Academic performanceA’s and B’s 3805 (73.1)C’s 1035 (21.5)D’s and F’s 259 (5.4)
Nonrural population density 3229 (77.2)Learning to drive or driving independently 4252 (74.0)Wear seat belt 3781 (70.0)No. of days in past 30 d had at least 1 drink of alcohol0 3729 (67.7)1–5 1223 (23.0)�6 543 (9.3)
Crashes as passenger in past 12 mo 1101 (20.2)
e1394 GINSBURG et al by guest on May 13, 2014pediatrics.aappublications.orgDownloaded from

their communities. They are then divided among statis-tically significant rankings. The items, as a whole, can beviewed as the teenagers’ description of the environmen-tal context within cars, because they describe what teen-agers witness. The respondents divided the 32 items into6 distinct ranks. The adolescents have the highest expo-sure to teen passengers, speeding, and cell-phone usewhile driving. Distractions such as smoking, eating, andlistening to loud music were also commonly reported.They reported low exposure to inexperienced driversand substance abuse by drivers or passengers.
Subpopulation DifferencesTables 5 and 6 present selected subgroup analyses fordifferent groups’ perceptions of factors that affect safetyand exposures, respectively. The RRs and 95% CIs com-pared with the designated index group are offered whenstatistical significance was reached. Table 5 displaysadolescents’ views on each item’s effect on safety. Alow RR suggests that a subgroup perceived that anissue affects safety less compared with the indexgroup’s perception. In the case of risk behaviors,therefore, a low RR may be a cause for concern. Incontrast, Table 6 shows reported exposures, and a lowRR may be reassuring.
Gender played a role in both how respondents per-ceived the factors affecting safety and how often theyreported witnessing them. It seems to have had a lowereffect on safety perceptions, with RRs ranging from 0.83to 1.20, than it did on exposures, for which the RR had
a wider range (0.69–1.44). In general, the girls perceiveditems as having a greater effect on safety. The boys wereless likely to report witnessing passengers dancing andsinging in the car (RR: 0.69 [95% CI: 0.62–0.76]) andseveral other items. They were more likely to have re-ported seeing drivers smoking marijuana (RR: 1.27[95% CI: 1.03–1.57]), passengers instigating speeding(RR: 1.40 [95% CI: 1.14–1.71]), and inexperienced driv-ers (RR: 1.44 [95% CI: 1.23–1.68]).
Race had an effect on how adolescents reported in-fluence on safety for 6 of 25 items (Table 5). Althoughexposures to 10 of the 32 items differed according torace, the range of RRs was narrow (0.77–1.15) (Table 6).It should be noted that black and Hispanic youth vieweddrinking alcohol while driving as being less risky thandid white youth. Black youth were exposed to drivingunder the influence of alcohol and marijuana more thanwhite youth (RR: 1.13 [95% CI: 1.07–1.20]). Both mi-nority groups viewed speeding as a greater threat thandid the white adolescents (RRs: 1.26 [95% CI: 1.09–1.46] [black] and 1.34 [95% CI: 1.19–1.51] [Hispanic]),with less reported exposure.
Grade level was used as a proxy measure for age, withthe understanding that most 9th-graders are teen-driverpassengers and 11th-graders have the most driving ex-perience. Few items about safety perceptions varied ac-cording to grade level. An exception was parents makingthe driver nervous, which 10th-graders (RR: 1.25 [95%CI: 1.08–1.44]), who were likely in their learning pe-riod, and 11th-graders (RR: 1.22 [95% CI: 1.01–1.47])
TABLE 3 Teen Perceptions of What Situations Make “a Lot of Difference” in Driving Safety
Weighted % Item Rank
The driver has been drinking alcohol 87 1The driver is text messaging, playing a video game, or using some other kind of handheldelectronic device
79 2
The driver is racing other cars 77 2The driver has been smoking marijuana (weed/pot) 72 3The driver is angry enough to have road rage 70 3The driver pays attention to the passengers because they are acting wild 65 4Other drivers on the road are driving unsafely 65 4The car can go really fast, and the driver is testing it out or showing it off 63 4The passengers in the car are trying to get the driver to speed, drive on the sidewalk, ordo donuts, etc
62 4
The driver is inexperienced with driving 60 4The driver and passengers are not wearing seat belts 54 5It has been snowing or raining and the roads might be slippery 52 5The driver is speeding 49 5The passengers in the car have been smoking marijuana (weed/pot) 48 5The passengers in the car have been drinking alcohol 47 5The driver is tired 42 6The driver is feeling strong emotions like being very upset, stressed, angry, or sad 39 6The driver is in a hurry 37 6The driver is talking on a cell phone 28 7The driver’s parents are in the car and make the driver nervous 24 7The driver and passengers are dancing or singing along to the music 21 7The driver is feeling strong emotions like being very happy or excited 15 8The music in the car is very loud 14 8The driver is selecting music while driving 13 8There are other teenagers in the car 10 9
Items are worded as they were in the survey, which used the adolescents’ precise language.
PEDIATRICS Volume 121, Number 5, May 2008 e1395 by guest on May 13, 2014pediatrics.aappublications.orgDownloaded from
saw as more important than did 9th-graders. However,11th-graders reported witnessing many items more fre-quently, including intoxicated drivers, road rage, use ofhandheld devices, and inexperienced drivers. Similarly,drivers reported seeing 20 of 32 items more often.
School performance also affected how groups of stu-dents perceived various factors that influence driversafety. The lowest achieving students were far less likelyto perceive driving while intoxicated as a safety factor(RR: 0.31 [95% CI: 0.22–0.43]). Similarly, these stu-dents viewed smoking marijuana while driving, speed-ing, racing, and text-messaging as far less dangerousthan did the A and B students. For 13 of 32 items, therisk exposures of the lesser achieving students werestatistically higher than those of the highest achievingstudents. The greatest differences were in driver andpassenger substance use (cigarettes, alcohol, and mari-juana) and in the driver feeling angry or sad.
There were few significant differences in safety per-ceptions or exposures between rural and nonruralyouth. The nonrural teens had lower exposure to intox-icated drivers (RR: 0.73 [95% CI: 0.60–0.90]) andhigher exposure to slippery roads (RR: 1.21 [95% CI:
1.01–1.44]) and being lost (RR: 1.20 [95% CI: 1.06–1.36]).
Seat belt use measured whether adolescents adhere toa known safety measure. Those who did not wear seatbelts regularly viewed all but 4 of the potential risksituations as less tied to safety. Their risk exposure wasdramatically higher, especially for substance use. Whencompared with those who wore seat belts, the unre-strained were more than twice as likely to witness driv-ers smoking marijuana at least sometimes (RR: 2.47[95% CI: 1.91–3.20]) and twice as likely to witnessdrivers drinking alcohol at least sometimes (RR: 1.99[95% CI: 1.69–2.33]). Their exposure to intoxicatedpassengers had similar differences. When compared withseat belt users, non–seat belt users were more likely toreport observing passengers encouraging the driver tospeed (RR: 1.50 [95% CI: 1.69–2.33]), witnessing driv-ers racing other cars (RR: 1.49 [95% CI: 1.28–1.74]), orshowing off (RR: 1.45 [95% CI: 1.24–1.69]).
Respondents reported whether they were nondrink-ers, moderate drinkers (1–5 days of alcohol use in thelast month), or heavy drinkers (�6 days of alcohol use inthe last month). The moderate drinkers viewed 19 of 25
TABLE 4 Teen Reports of Driving Situations TheyWitness “Often or Always” With Teen Drivers
Weighted % Item Rank
There are other teenagers in the car 64 1The driver is speeding 59 1The driver talks on a cell phone 57 1The driver selects music while driving 52 2The driver is in a hurry 51 2The music in the car is very loud 46 3The driver is eating 35 4The driver is smoking or lighting a cigarette 34 4The driver and passengers are dancing or singing along to the music 33 4The roads are in bad condition, like potholes or construction 31 4The driver feels strong emotions like being very happy or excited 25 5Other drivers on the road are driving unsafely 24 5It has been snowing or raining and the roads are slippery 23 5The car is in bad condition 23 5The driver is upset while talking on a cell phone 22 5There are loud younger children in the car 22 5The driver is lost and does not know where to go 21 5The driver is putting on makeup 21 5The driver feels strong emotions like being very upset, stressed, angry, or sad 20 5The driver is tired 20 5The driver is racing other cars 20 5The car can go really fast, and the driver is testing it out or showing it off 20 5The driver uses a handheld electronic device (eg, text messaging, a personal listeningdevice, game)
19 5
The driver has road rage 17 5The driver has been drinking alcohol 16 5The driver pays attention to the passengers because they are acting wild 16 5The driver is inexperienced at driving 15 5The driver’s parents are in the car and are making the driver nervous 15 5The passengers in the car try to get the driver to speed, drive on the sidewalk, or dodonuts, etc
13 6
The driver has been smoking marijuana (weed/pot) 12 6The passengers in the car have been drinking alcohol 12 6The passengers in the car have been smoking marijuana (weed/pot) 12 6
Items are worded exactly as they were in the survey. Slight variations from thewording in Table 3 reflect grammatical differences required whenasking about perceptions of safety versus reported witnessed behaviors.
e1396 GINSBURG et al by guest on May 13, 2014pediatrics.aappublications.orgDownloaded from
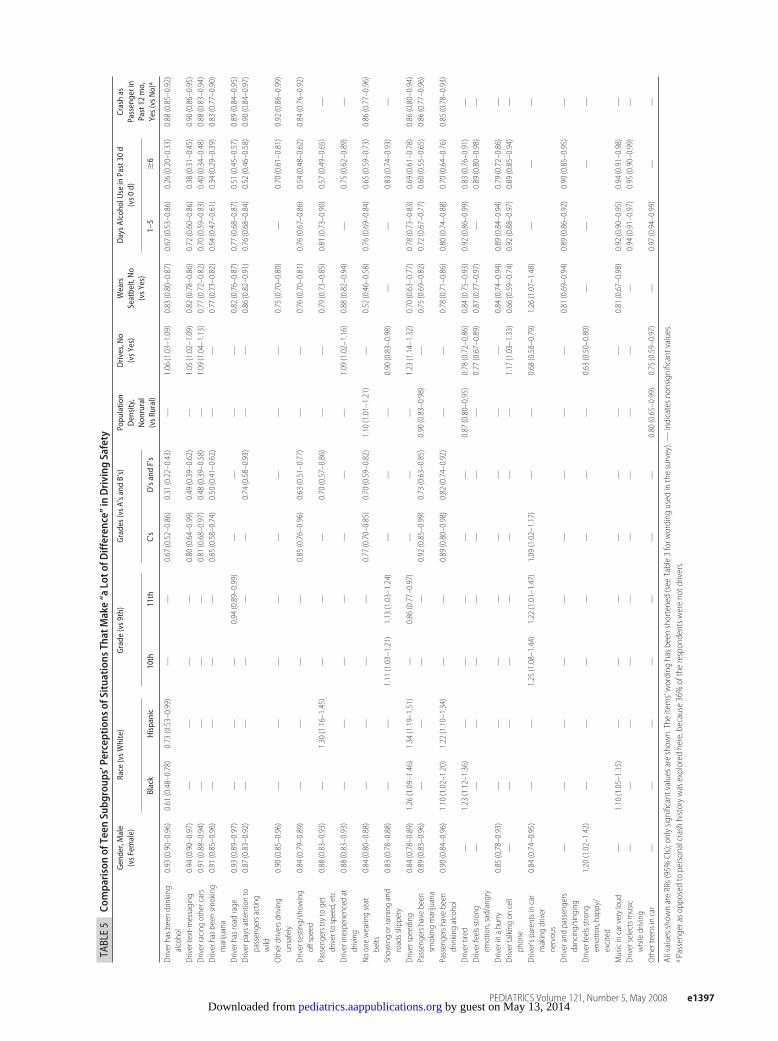
TABLE5
Compa
risonof
Teen
Subg
roup
s’Percep
tion
sof
Situations
ThatMake“a
Loto
fDifferen
ce”inDriving
Safety
Gender,Male
(vsF
emale)
Race
(vsW
hite)
Grade
(vs9
th)
Grades(vs
A’sa
ndB’s)
Popu
latio
nDensity,
Non
rural
(vsR
ural)
Drives,No
(vsY
es)
Wears
Seatbelt,No
(vsY
es)
DaysA
lcoh
olUse
inPast30
d(vs0
d)Crashas
Passengerin
Past12
mo,
Yes(vs
No)
aBlack
Hispanic
10th
11th
C’s
D’sandF’s
1–5
�6
Driverhasb
eendrinking
alcohol
0.93
(0.90–0.96)
0.61
(0.48–0.78)
0.73
(0.53–0.99)
——
0.67
(0.52–0.86)
0.31
(0.22–0.43)
—1.06
(1.03–1.09)
0.83
(0.80–0.87)
0.67
(0.53–0.86)
0.26
(0.20–0.33)
0.88
(0.85–0.92)
Drivertext-m
essaging
0.94
(0.90–0.97)
——
——
0.80
(0.64–0.99)
0.49
(0.39–0.62)
—1.05
(1.02–1.09)
0.82
(0.78–0.86)
0.72
(0.60–0.86)
0.38
(0.31–0.45)
0.90
(0.86–0.95)
Driverracing
othercars
0.91
(0.88–0.94)
——
——
0.81
(0.68–0.97)
0.48
(0.39–0.58)
—1.09
(1.04–1.13)
0.77
(0.72–0.82)
0.70
(0.59–0.83)
0.40
(0.34–0.48)
0.88
(0.83–0.94)
Driverhasb
eensm
oking
marijuana
0.91
(0.85–0.96)
——
——
0.65
(0.58–0.74)
0.50
(0.41–0.62)
——
0.77
(0.73–0.82)
0.54
(0.47–0.61)
0.34
(0.29–0.39)
0.83
(0.77–0.90)
Driverhasroadrage
0.93
(0.89–0.97)
——
—0.94
(0.89–0.99)
——
——
0.82
(0.76–0.87)
0.77
(0.68–0.87)
0.51
(0.45–0.57)
0.89
(0.84–0.95)
Driverpaysattentionto
passengersacting
wild
0.87
(0.83–0.92)
——
——
—0.74
(0.58–0.93)
——
0.86
(0.82–0.91)
0.76
(0.68–0.84)
0.52
(0.46–0.58)
0.90
(0.84–0.97)
Otherdriversd
riving
unsafely
0.90
(0.85–0.96)
——
——
——
——
0.75
(0.70–0.80)
—0.70
(0.61–0.81)
0.92
(0.86–0.99)
Drivertesting/show
ing
offspeed
0.84
(0.79–0.89)
——
——
0.85
(0.76–0.96)
0.63
(0.51–0.77)
——
0.76
(0.70–0.81)
0.76
(0.67–0.86)
0.54
(0.48–0.62)
0.84
(0.76–0.92)
Passengerstry
toget
drivertospeed,etc
0.88
(0.83–0.93)
—1.30
(1.16–1.45)
——
—0.70
(0.57–0.86)
——
0.79
(0.73–0.85)
0.81
(0.73–0.90)
0.57
(0.49–0.65)
—
Driverinexperienced
atdriving
0.88
(0.83–0.93)
——
——
——
—1.09
(1.02–1.16)
0.88
(0.82–0.94)
—0.75
(0.62–0.89)
—
Noonewearingseat
belts
0.84
(0.80–0.88)
——
——
0.77
(0.70–0.85)
0.70
(0.59–0.82)
1.10
(1.01–1.21)
—0.52
(0.46–0.58)
0.76
(0.69–0.84)
0.65
(0.59–0.73)
0.86
(0.77–0.96)
Snow
ingorrainingand
roadsslippery
0.83
(0.78–0.88)
——
1.11
(1.03–1.21)
1.13
(1.03–1.24)
——
—0.90
(0.83–0.98)
——
0.83
(0.74–0.93)
—
Driverspeeding
0.84
(0.78–0.89)
1.26
(1.09–1.46)
1.34
(1.19–1.51)
—0.86
(0.77–0.97)
——
—1.23
(1.14–1.32)
0.70
(0.63–0.77)
0.78
(0.73–0.83)
0.69
(0.61–0.78)
0.86
(0.80–0.94)
Passengershave
been
smokingmarijuana
0.89
(0.83–0.96)
——
——
0.92
(0.85–0.99)
0.73
(0.63–0.85)
0.90
(0.83–0.98)
—0.75
(0.69–0.82)
0.72
(0.67–0.77)
0.60
(0.55–0.65)
0.86
(0.77–0.96)
Passengershave
been
drinking
alcohol
0.90
(0.84–0.96)
1.10
(1.02–1.20)
1.22
(1.10–1.34)
——
0.89
(0.80–0.98)
0.82
(0.74–0.92)
——
0.78
(0.71–0.86)
0.80
(0.74–0.88)
0.70
(0.64–0.76)
0.85
(0.78–0.93)
Drivertired
—1.23
(1.12–1.36)
——
——
—0.87
(0.80–0.95)
0.78
(0.72–0.86)
0.84
(0.75–0.93)
0.92
(0.86–0.99)
0.83
(0.76–0.91)
—Driverfeelsstro
ngem
otion,sad/angry
——
——
——
——
0.77
(0.67–0.89)
0.87
(0.77–0.97)
—0.89
(0.80–0.98)
—
Driverinahurry
0.85
(0.78–0.93)
——
——
——
——
0.84
(0.74–0.94)
0.89
(0.84–0.94)
0.79
(0.72–0.86)
—Drivertalkingon
cell
phone
——
——
——
——
1.17
(1.03–1.33)
0.66
(0.59–0.74)
0.92
(0.88–0.97)
0.89
(0.85–0.94)
—
Driver’sparentsincar
makingdriver
nervous
0.84
(0.74–0.95)
——
1.25
(1.08–1.44)
1.22
(1.01–1.47)
1.09
(1.02–1.17)
——
0.68
(0.58–0.79)
1.26
(1.07–1.48)
——
—
Driverandpassengers
dancing/sin
ging
——
——
——
——
—0.81
(0.69–0.94)
0.89
(0.86–0.92)
0.90
(0.85–0.95)
—
Driverfeelsstro
ngem
otion,happy/
excited
1.20
(1.02–1.42)
——
——
——
—0.63
(0.50–0.80)
——
——
Musicincarveryloud
—1.10
(1.05–1.15)
——
——
——
—0.81
(0.67–0.98)
0.92
(0.90–0.95)
0.94
(0.91–0.98)
—Driverselectsm
usic
whiledriving
——
——
——
——
——
0.94
(0.91–0.97)
0.95
(0.90–0.99)
—
Otherteensincar
——
——
——
—0.80
(0.65–0.99)
0.75
(0.59–0.97)
—0.97
(0.94–0.99)
——
AllvaluesshownareRRs(95%CIs);onlysig
nificantvaluesareshow
n.Theitems’wording
hasb
eenshortened(see
Table3forw
ording
used
inthesurvey).—
indicatesn
onsig
nificantvalues.
aPassengeraso
pposed
topersonalcrashhistorywasexplored
here,because36%oftherespondentsw
erenotdrivers.
PEDIATRICS Volume 121, Number 5, May 2008 e1397 by guest on May 13, 2014pediatrics.aappublications.orgDownloaded from
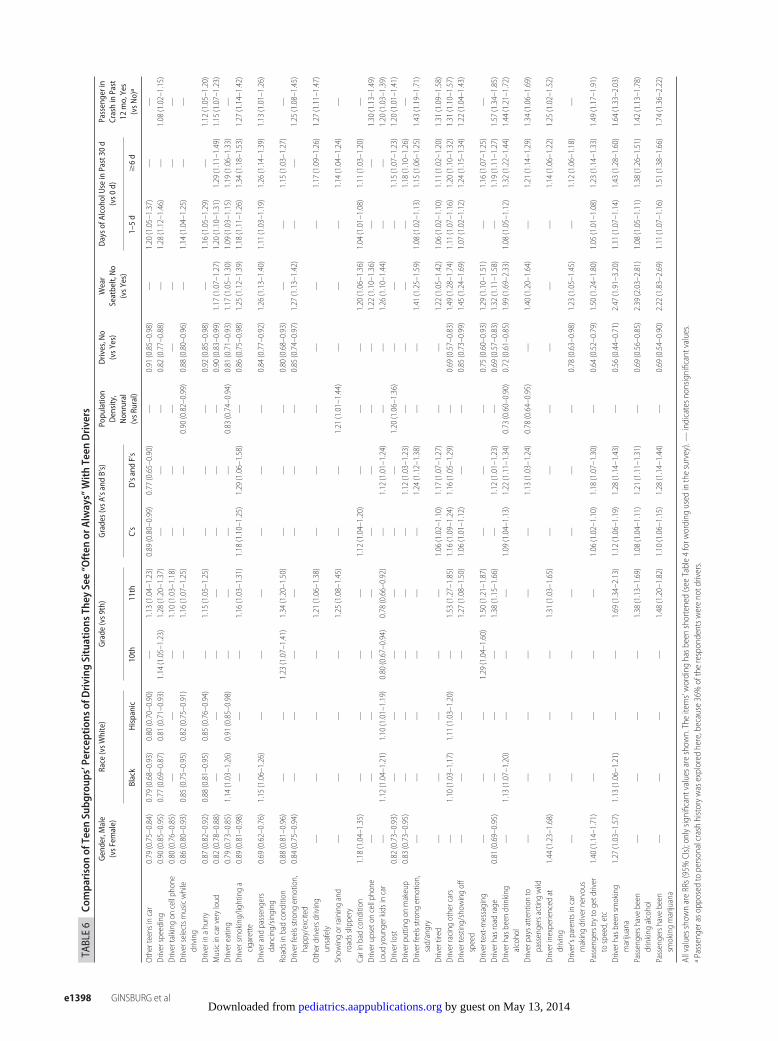
TABLE6
Compa
risonof
Teen
Subg
roup
s’Percep
tion
sof
Driving
Situations
They
See“O
ften
orAlways”WithTeen
Drivers
Gender,Male
(vsF
emale)
Race
(vsW
hite)
Grade
(vs9
th)
Grades(vs
A’sa
ndB’s)
Popu
latio
nDensity,
Non
rural
(vsR
ural)
Drives,No
(vsY
es)
Wear
Seatbelt,No
(vsY
es)
Dayso
fAlcoh
olUse
inPast30
d(vs0
d)Passengerin
CrashinPast
12mo,Yes
(vsN
o)a
Black
Hispanic
10th
11th
C’s
D’sandF’s
1–5d
�6d
Otherteensincar
0.79
(0.75–0.84)
0.79
(0.68–0.93)
0.80
(0.70–0.90)
—1.13
(1.04–1.23)
0.89
(0.80–0.99)
0.77
(0.65–0.90)
—0.91
(0.85–0.98)
—1.20
(1.05–1.37)
——
Driverspeeding
0.90
(0.85–0.95)
0.77
(0.69–0.87)
0.81
(0.71–0.93)
1.14
(1.05–1.23)
1.28
(1.20–1.37)
——
—0.82
(0.77–0.88)
—1.28
(1.12–1.46)
—1.08
(1.02–1.15)
Drivertalkingon
cellphone
0.80
(0.76–0.85)
——
—1.10
(1.03–1.18)
——
——
——
—Driverselectsm
usicwhile
driving
0.86
(0.80–0.93)
0.85
(0.75–0.95)
0.82
(0.75–0.91)
—1.16
(1.07–1.25)
——
0.90
(0.82–0.99)
0.88
(0.80–0.96)
—1.14
(1.04–1.25)
——
Driverinahurry
0.87
(0.82–0.92)
0.88
(0.81–0.95)
0.85
(0.76–0.94)
—1.15
(1.05–1.25)
——
—0.92
(0.85–0.98)
—1.16
(1.05–1.29)
—1.12
(1.05–1.20)
Musicincarveryloud
0.82
(0.78–0.88)
——
——
——
—0.90
(0.83–0.99)
1.17
(1.07–1.27)
1.20
(1.10–1.31)
1.29
(1.11–1.49)
1.15
(1.07–1.23)
Drivereating
0.79
(0.73–0.85)
1.14
(1.03–1.26)
0.91
(0.85–0.98)
——
——
0.83
(0.74–0.94)
0.81
(0.71–0.93)
1.17
(1.05–1.30)
1.09
(1.03–1.15)
1.19
(1.06–1.33)
—Driversm
oking/lightinga
cigarette
0.89
(0.81–0.98)
——
—1.16
(1.03–1.31)
1.18
(1.10–1.25)
1.29
(1.06–1.58)
—0.86
(0.75–0.98)
1.25
(1.12–1.39)
1.18
(1.11–1.26)
1.34
(1.18–1.53)
1.27
(1.14–1.42)
Driverandpassengers
dancing/sin
ging
0.69
(0.62–0.76)
1.15
(1.06–1.26)
——
——
——
0.84
(0.77–0.92)
1.26
(1.13–1.40)
1.11
(1.03–1.19)
1.26
(1.14–1.39)
1.13
(1.01–1.26)
Roadsinbadcondition
0.88
(0.81–0.96)
——
1.23
(1.07–1.41)
1.34
(1.20–1.50)
——
—0.80
(0.68–0.93)
——
1.15
(1.03–1.27)
—Driverfeelsstro
ngem
otion,
happy/excited
0.84
(0.75–0.94)
——
——
——
—0.85
(0.74–0.97)
1.27
(1.13–1.42)
——
1.25
(1.08–1.45)
Otherdriversd
riving
unsafely
——
——
1.21
(1.06–1.38)
——
——
——
1.17
(1.09–1.26)
1.27
(1.11–1.47)
Snow
ingorrainingand
roadsslippery
——
——
1.25
(1.08–1.45)
——
1.21
(1.01–1.44)
——
—1.14
(1.04–1.24)
—
Carinbadcondition
1.18
(1.04–1.35)
——
——
1.12
(1.04–1.20)
——
—1.20
(1.06–1.36)
1.04
(1.01–1.08)
1.11
(1.03–1.20)
—Driverupsetoncellphone
——
——
——
——
—1.22
(1.10–1.36)
——
1.30
(1.13–1.49)
Loud
youngerkidsincar
—1.12
(1.04–1.21)
1.10
(1.01–1.19)
0.80
(0.67–0.94)
0.78
(0.66–0.92)
—1.12
(1.01–1.24)
——
1.26
(1.10–1.44)
——
1.20
(1.03–1.39)
Driverlost
0.82
(0.73–0.93)
——
——
——
1.20
(1.06–1.36)
——
—1.15
(1.07–1.23)
1.20
(1.01–1.41)
Driverputtingon
makeup
0.83
(0.73–0.95)
——
——
—1.12
(1.03–1.23)
——
——
1.18
(1.10–1.26)
—Driverfeelsstro
ngem
otion,
sad/angry
——
——
——
1.24
(1.12–1.38)
——
1.41
(1.25–1.59)
1.08
(1.02–1.13)
1.15
(1.06–1.25)
1.43
(1.19–1.71)
Drivertired
——
——
—1.06
(1.02–1.10)
1.17
(1.07–1.27)
——
1.22
(1.05–1.42)
1.06
(1.02–1.10)
1.11
(1.02–1.20)
1.31
(1.09–1.58)
Driverracing
othercars
—1.10
(1.03–1.17)
1.11
(1.03–1.20)
—1.53
(1.27–1.85)
1.16
(1.09–1.24)
1.16
(1.05–1.29)
—0.69
(0.57–0.83)
1.49
(1.28–1.74)
1.11
(1.07–1.16)
1.20
(1.10–1.32)
1.31
(1.10–1.57)
Drivertesting/show
ingoff
speed
——
——
1.27
(1.08–1.50)
1.06
(1.01–1.12)
——
0.85
(0.73–0.99)
1.45
(1.24–1.69)
1.07
(1.02–1.12)
1.24
(1.15–1.34)
1.22
(1.04–1.43)
Drivertext-m
essaging
——
—1.29
(1.04–1.60)
1.50
(1.21–1.87)
——
—0.75
(0.60–0.93)
1.29
(1.10–1.51)
—1.16
(1.07–1.25)
—Driverhasroadrage
0.81
(0.69–0.95)
——
—1.38
(1.15–1.66)
—1.12
(1.01–1.23)
—0.69
(0.57–0.83)
1.32
(1.11–1.58)
—1.19
(1.11–1.27)
1.57
(1.34–1.85)
Driverhasb
eendrinking
alcohol
—1.13
(1.07–1.20)
——
—1.09
(1.04–1.13)
1.22
(1.11–1.34)
0.73
(0.60–0.90)
0.72
(0.61–0.85)
1.99
(1.69–2.33)
1.08
(1.05–1.12)
1.32
(1.22–1.44)
1.44
(1.21–1.72)
Driverpaysattentionto
passengersactingwild
——
——
——
1.13
(1.03–1.24)
0.78
(0.64–0.95)
—1.40
(1.20–1.64)
—1.21
(1.14–1.29)
1.34
(1.06–1.69)
Driverinexperienced
atdriving
1.44
(1.23–1.68)
——
—1.31
(1.03–1.65)
——
——
——
1.14
(1.06–1.22)
1.25
(1.02–1.52)
Driver’sparentsincar
makingdrivernervous
——
——
——
——
0.78
(0.63–0.98)
1.23
(1.05–1.45)
—1.12
(1.06–1.18)
—
Passengerstry
togetdriver
tospeed,etc
1.40
(1.14–1.71)
——
——
1.06
(1.02–1.10)
1.18
(1.07–1.30)
—0.64
(0.52–0.79)
1.50
(1.24–1.80)
1.05
(1.01–1.08)
1.23
(1.14–1.33)
1.49
(1.17–1.91)
Driverhasb
eensm
oking
marijuana
1.27
(1.03–1.57)
1.13
(1.06–1.21)
——
1.69
(1.34–2.13)
1.12
(1.06–1.19)
1.28
(1.14–1.43)
—0.56
(0.44–0.71)
2.47
(1.91–3.20)
1.11
(1.07–1.14)
1.43
(1.28–1.60)
1.64
(1.33–2.03)
Passengershave
been
drinking
alcohol
——
——
1.38
(1.13–1.69)
1.08
(1.04–1.11)
1.21
(1.11–1.31)
—0.69
(0.56–0.85)
2.39
(2.03–2.81)
1.08
(1.05–1.11)
1.38
(1.26–1.51)
1.42
(1.13–1.78)
Passengershave
been
smokingmarijuana
——
——
1.48
(1.20–1.82)
1.10
(1.06–1.15)
1.28
(1.14–1.44)
—0.69
(0.54–0.90)
2.22
(1.83–2.69)
1.11
(1.07–1.16)
1.51
(1.38–1.66)
1.74
(1.36–2.22)
AllvaluesshownareRRs(95%CIs);onlysig
nificantvaluesareshow
n.Theitems’wording
hasb
eenshortened(see
Table4forw
ording
used
inthesurvey).—
indicatesn
onsig
nificantvalues.
aPassengeraso
pposed
topersonalcrashhistorywasexplored
here,because36%oftherespondentsw
erenotdrivers.
e1398 GINSBURG et al by guest on May 13, 2014pediatrics.aappublications.orgDownloaded from
items as impacting less on safety, and the heavy drinkersviewed 22 items likewise. The greatest difference be-tween the groups was in how they assessed the risk ofsubstance use while driving. When compared with non-drinkers, heavy drinkers reported lower perceived riskassociated with driver alcohol use (RR: 0.26 [95% CI:0.20–0.33]) and marijuana use (RR: 0.34 [95% CI:0.29–0.39]). The heavy drinkers viewed road rage asless dangerous (RR: 0.51 [95% CI: 0.45–0.57]) com-pared with nondrinkers. Heavy drinkers reported in-creased exposure to 24 of 32 items, with the greatestdifferences related to substance use, suggesting that at-risk health behaviors tend to cluster.
Respondents who had been a passenger in a crash inthe last year viewed 12 of 25 items as having a moder-ately lower (RRs ranged from 0.83 to 0.92) impact onsafety. Conversely, they reported greater exposure to 22of the 32 items. The most notable differences includedexposure to substances, road rage, passengers actingwildly or goading the driver to speed, and the driverhaving strong negative emotions.
DISCUSSIONThe NYDS offers an opportunity for a nationally repre-sentative cross-section of teenagers to share their per-spectives on factors that affect driving safety and reporttheir exposure to driving safety hazards. They recog-nized many previously researched hazards, includingsubstance use and distractions, but did not appreciatehow distractions interplay with inexperience. Thebreadth of these teen-generated survey items adds toknown risk and protective factors. These items also offera better grasp of the environmental context in cars andthe social atmosphere in which teenagers make drivingdecisions. For example, although distractions are knownto contribute to crashes, this research reveals new onesnot previously considered by adult investigators and al-lowed teenagers to rate their relative importance andobserved frequency. In addition, the survey exploredsubgroup differences, positioning policy makers and ed-ucators to target interventions more effectively.
A great deal of previous research has shown the ma-jor contributing factors to adolescent crashes and publichealth efforts and laws have contributed to mitigatingthese factors.60 Implementing alcohol-related (such asminimum legal drinking age and lowered blood-alcohollimits for youth)3,61 and GDL62 laws and having teenagersrecognize the extreme danger of driving while intoxi-cated have contributed substantially to decrease teencrashes.61,63,64 However, other areas need much furtherprogress. A first step is to gain a deeper understandingof what affects adolescents’ safety within cars and amore accurate understanding of their exposure torisky situations. Our research has begun to achievethis and identified some specific target factors and teensubgroups.
Much of our data substantiate existing knowledgewhile offering insights into how varied factors may affectsafety. For example, although distractions have longbeen known to increase crash risk,65 we now betterunderstand their nature, ranging from peer interactions
to communication technologies. In other cases, the datareveal important gaps in teenagers’ understanding of safetyissues. For example, although inexperience plays a primaryrole in crashes,40,66 the informants seem to underplay itsimportance and prevalence. In other cases, the data revealdiscordant views among adolescent subgroups with impli-cations for how to target intervention strategies.
The NYDS demonstrates that, in general, America’sadolescents understand the hazard of driving while in-toxicated. They view it as the greatest danger, and ex-posure is infrequent. In fact, substance use is not theleading cause of crashes among teenagers.2 Among theyoungest drivers (16- to 17-year-olds), substanceswere involved in 15% of fatal crashes.1,3 The impact ofsubstance use increases among 21- to 30-year-old drivers,when drinking may increase and other factors such asinexperience and vulnerability to distractions may lessen.1
The downward trend of teens driving under the in-fluence1,3 is likely related to minimum legal drinking agelaws accompanied by public health awareness cam-paigns that also offer alternatives (eg, designated driv-ers).67,68 However, our data reveal that certain subgroupsare either not receiving or rejecting the message. Fewerminority youths recognized substance use as an impor-tant driving hazard and reported increased exposures toit. It is unlikely that culture is the driving force behindthese racial differences. Future work should disentanglerace from socioeconomic and other factors. Neverthe-less, public health interventions often focus on racial orethnic groups, and our data suggest that these groupsmerit targeted efforts. We also need to better affect atti-tudinal and behavioral changes in our risk-taking andscholastically underperforming youth.
Our data reveal a striking lack of awareness of howinexperience among adolescent drivers affects safety.Although 60% believed that inexperience heavily influ-ences safety, only 15% reported exposure to inexperi-enced drivers in a sample that solely included passengersand young drivers, nearly all of whom would be consid-ered inexperienced by experts. Therefore, an initial step isto understand how teenagers judge “experience.” Ourqualitative data suggest that it is simply determined bydriver licensure, not by miles driven or exposure to difficultdriving circumstances. The second step is to make adoles-cents aware of how inexperience affects safety.
Inexperience is heavily mitigated during the learnerperiod when a parent is present.69,70 A teen’s risk is at itslifetime highest level on the first day of independentdriving. This risk continues to be disproportionately highfor the first 6 months of independent driving and doesnot reach adult levels until the age of 25 years.71 Thesteep decline that begins after the first month of drivingdemonstrates that inexperience contributes most heavily tocrashes. Developmental factors, including cognitive imma-turity, emotional liability, and risk taking, also affect crashrates.72 However, if these developmental factors were theprimary forces contributing to crashes, a much slower de-cline in crash rates would be expected.72 GDL laws existlargely to limit exposure to risky situations (peers, night-time driving) during the earliest phases of independentdriving while young drivers gain experience.30
PEDIATRICS Volume 121, Number 5, May 2008 e1399 by guest on May 13, 2014pediatrics.aappublications.orgDownloaded from

To help adolescents become more receptive and ad-herent to GDL laws, we must make them aware thatthese laws exist to protect young, inexperienced drivers.Distractions take the highest toll on inexperienced driv-ers who need to give their full attention to the road.Anything that diminishes their cognitive capabilities, in-cluding substances, fatigue, and emotional reactions,must be avoided.
Because of substantial increased crash risk, manyGDL laws limit teenaged passengers until drivers gainexperience.33 At first glance, adolescents do not seem torecognize passengers as a problem; only 10% believedthat other teens in the car contribute substantially todanger, although 64% saw teen passengers often. How-ever, a closer look reveals clear distinctions on how theyview peers’ presence in cars as a potential hazard. Al-though peer presence was perceived as low risk, theperceived danger increased incrementally in the follow-ing order: if they “dance and sing,” are intoxicated,encourage speeding, or “act wild.” These insights provideimportant information on how teen passengers may in-crease crash risk. For these perceptions to be confirmed,however, actual crash data must be analyzed.
Similarly, teenagers perceive a hierarchy of increasingdanger for other behaviors. For example they do notview cell phones as dangerous, but they considered usethat triggers emotional responses to be dangerous andtext-messaging to be hazardous. The hierarchies ourinformants offered suggest that adult researchers mayhave lumped conditions together too casually andcould better reach teenagers by addressing the nu-ances they perceive. Nevertheless, higher level risks(eg, passengers acting wild) cannot occur if lower riskconditions are not allowed (eg, no teen passengersduring early independent driving).
It is notable that some factors deemed most danger-ous by teenagers (eg, drinking) are rarely seen, whereasothers perceived as relatively benign (eg, teen passen-gers and cell-phone use) are commonly encountered.Possibly, frequently seen issues are judged as low riskprecisely because, although often witnessed, they arerarely associated with an untoward event. Commonexposure could lead to extinction of safety messageswhen dire predicted consequences do not material-ize73,74 and even change youths’ perceptions aboutriskiness. This poses the challenge of creating educa-tion strategies that acknowledge adolescents’ real-lifeexperiences while helping them to recognize in-creased risks. In addition, it challenges us to explorewhether the highest yield in behavioral change wouldcome from reducing community exposures (eg, prev-alence of impaired driving) versus addressing adoles-cents’ beliefs and attitudes.
Adults may be better poised to reach teenagers withmessages they view as reliable and authentic whenequipped with a clear understanding of how adolescentsperceive safety and risk. Adolescent input can ensurethat programs or interventions resonate with youths. An-titobacco efforts serve as a clear example of how adoles-cents can shape an effective campaign. The “Truth” cam-paign was a national tobacco countermarketing strategy
formulated by youth under adult facilitation. Its successstands in contrast to other antismoking efforts that back-fired by highlighting the riskiness of smoking or labeling itas an adult-only behavior.75,76 Our study elucidates theadolescent perspective and, therefore, may allow adults tomore effectively address driving safety.
Clinicians are ideally positioned to deliver preventionmessages. The American Academy of Pediatrics’ policystatement on teen drivers suggested how pediatricianscan work with adolescent patients, parents, communi-ties, and legislators to address driving safety.72 Thesesuggestions included screening for and treating condi-tions known to increase risk (eg, attention-deficit/hyper-activity disorder), guiding teens away from risky condi-tions, encouraging seatbelt use, and implementation ofrestrictions by parents and communities on young driv-ers while they gain experience. The authors suggestedthat pediatricians should introduce families to a parent-teen agreement, a tool that helps parents restrict chal-lenging driving exposures until adolescents gain experi-ence and demonstrate responsibility.72
LIMITATIONSThe major limitations of these data are that they rely onperceptions and that both safety perceptions and expo-sures are self-reported. It is not an observational study inwhich behaviors were closely monitored or an interven-tion-design study that recorded outcomes. Although ad-olescents’ perceptions of safety factors are illuminating,we cannot say with certainty that addressing these fac-tors would enhance safety. Future research will need todevelop and test interventions that respond to the issuesraised here by teenagers. Moreover, to afford teensgreater comfort in reporting antisocial behavior, wechose to have them report what they saw in their com-munity. Therefore, it is important to interpret the expo-sure data as how many times teens report seeing abehavior “often” rather than as a percentage of youthwho exhibit the behavior. Finally, the safety factorsreported here were generated by participants usingthe TCM. Qualitative research holds the potential forimposed investigator bias. However, the careful selec-tion criteria here limited that potential, and the pop-ulation-based sample validated the ideas across alarger sample.
CONCLUSIONSAdolescents have offered a glimpse into their percep-tions of the environment within cars that affects driverand passenger safety. We learn from the perceptionsthey shared, the experiences they reported witnessing,and their omissions. It is clear that many, but not all,recognized some of the most important risk factors suchas driving while intoxicated. However, this critical mes-sage needs to be relayed more effectively to somegroups, particularly minority populations. These youthoffered a rich description of the distractions that taketheir focus off the road and described the perceiveddegree with which they affect safety. Although inexpe-rience is the known factor interacting with other risk
e1400 GINSBURG et al by guest on May 13, 2014pediatrics.aappublications.orgDownloaded from
factors and conditions to create crashes, teenagers do notrecognize what merits “experience.”
This research adds important data to the efforts tochange adolescent driving behavior, because it providesa better understanding of their attitudes and beliefs. Inaddition, it offers insight into the exposures that shapetheir attitudes. Adults may be better positioned to reachadolescents with health-promoting messages whenequipped with an understanding of the social atmo-sphere and environmental settings that contribute totheir perceptions of safety and risk. Future research isneeded to explore how to make clinicians, families, andcommunities more effective in conveying safety mes-sages, setting safety standards, and monitoring thosestandards. In parallel, we must learn how to make teen-agers receptive to these messages and to offer them theknowledge and skills to become safer drivers.
ACKNOWLEDGMENTSThis article was written as part of the Youthful DriverResearch Initiative, a collaborative research programbetween the Center for Injury Research and Preven-tion at the Children’s Hospital of Philadelphia andState Farm Insurance Companies. State Farm providedfinancial support for this research. The sponsor had norole in study design, analysis of the data, or writing ofthe manuscript. The sponsor provided staff to conductthe focus groups during the qualitative phases of theproject.
We acknowledge Monica Moore and the qualitativeteam at State Farm for collecting the qualitative data. Wethank Brenda Clark, Stephanie Flaherty, RonaldoIachin, and Mirna Moloney of Macro International, Incfor coordinating and administering the survey. We alsothank Dr Dennis Durbin for help with study design,Lauren Hafner for help with study design and manage-ment of the project, and other staff at the Center forInjury Research and Prevention for project support.Above all, we thank the high schools and teenagers whoparticipated in the project.
REFERENCES1. Insurance Institute for Highway Safety. Fatality facts 2005:
teenagers. Available at: www.iihs.org/research/fatality�facts_2005/teenagers.html. Accessed November 21, 2006
2. Williams AF, Ferguson SA, Wells JK. Sixteen-year-old driversin fatal crashes, United States, 2003. Traffic Inj Prev. 2005;6(3):202–206
3. National Highway Transportation Safety Administration. TrafficSafety Facts 2005 Data: Young Drivers. Washington, DC: US De-partment of Transportation; 2006
4. Marin PS, Brown BV. Are teens driving safer? Available at:www.childtrendsdatabank.org/PDF/teen%20driving.pdf. Ac-cessed March 12, 2008
5. McCartt AT, Northrup VS. Factors related to seat belt useamong fatally injured teenage drivers. J Safety Res. 2004;35(1):29–38
6. Fell JC, Baker TK, McKnight AS, et al. Increasing Teen Safety BeltUse: A Program and Literature Review. Calverton, MD: NationalHighway Traffic Safety Administration; 2005. DOT HS 809 899
7. Glassbrenner D, Carra JS, Nichols J. Recent estimates of safetybelt use. J Safety Res. 2004;35(2):237–244
8. Houston DJ, Richardson LE. Getting Americans to buckle up:the efficacy of state seat belt laws. Accid Anal Prev. 2005;37(6):1114–1120
9. Wagenaar AC, O’Malley PM, LaFond C. Lowered legal bloodalcohol limits for young drivers: effects on drinking, driving,and driving-after-drinking behaviors in 30 states. Am J PublicHealth. 2001;91(5):801–804
10. Voas RB, Tippetts AS, Fell JC. Assessing the effectiveness ofminimum legal drinking age and zero tolerance laws in theUnited States. Accid Anal Prev. 2003;35(4):579–587
11. Wagenaar AC, Toomey TL. Effects of minimum drinking agelaws: review and analyses of the literature from 1960 to 2000.J Stud Alcohol Suppl. 2002;(14):206–225
12. Tippetts AS, Voas RB, Fell JC, Nichols JL. A meta-analysis of.08 BAC laws in 19 jurisdictions in the United States. Accid AnalPrev. 2005;37(1):149–161
13. Insurance Institute for Highway Safety. US licensing systemsfor young drivers. Available at: www.iihs.org/laws/state�laws/grad�license.html. Accessed May 18, 2007
14. Dee TS, Grabowski DC, Morrisey MA. Graduated driver licens-ing and teen traffic fatalities. J Health Econ. 2005;24(3):571–589
15. Chen LH, Baker SP, Li G. Graduated driver licensing programsand fatal crashes of 16-year-old drivers: a national evaluation.Pediatrics. 2006;118(1):56–62
16. Lin ML, Fearn FKT. The provisional license: nighttime andpassenger restrictions—a literature review. J Safety Res. 2003;34(1):51–61
17. Shope JT, Waller PF, Raghunathan TE, Patil SM. Adolescentantecedents of high-risk driving behavior into young adult-hood: substance use and parental influences. Accid Anal Prev.2001;33(5):649–658
18. Williams AF, Leaf WA, Simons-Morton BG, Hartos JL. Parents’views of teen driving risks, the role of parents, and how theyplan to manage the risks. J Safety Res. 2006;37(3):221–226
19. Sherman K, Lapidus G, Gelven E, Banco L. New teen driversand their parents: what they know and what they expect. Am JHealth Behav. 2004;28(5):387–396
20. Simons-Morton BG, Ouimet MC. Parent involvement in nov-ice teen driving: a review of the literature. Inj Prev. 2006;12(suppl 1):i30–i37
21. Hirsch P. Adolescent driver risk taking and driver education:evidence of a mobility bias in public policymaking. J Safety Res.2003;34(3):289–298
22. Lonero LP. Reinventing Driver Education: Strategic Directions forDriver Ed in the 21st Century. Baltimore, MD: NorthportAssociates; 2005
23. Ferguson SA. Other high-risk factors for young drivers: howgraduated licensing does, doesn’t, or could address them. JSafety Res. 2003;34(1):71–77
24. Fisher DL, Pollatsek A, Pradhan A. Can novice drivers betrained to scan for information that will reduce their likelihoodof a crash? Inj Prev. 2006;12(suppl 1):i25–i29
25. Mayhew DR, Simpson HM. The safety value of driver educa-tion and training. Inj Prev. 2002;8(suppl 2):ii3–ii8
26. Buchan BJ, Urmann C, Hamilton NL, Tims FM. Marijuana Useand Impaired Driving Behavior Among Adolescents in PinellasCounty, Florida. St Petersburg, FL: Operation PAR, Inc; 2000
27. Elliott MR, Shope JT, Raghunathan TE, Waller PF. Genderdifferences among young drivers in the association betweenhigh-risk driving and substance use/environmental influences.J Stud Alcohol. 2006;67(2):252–260
28. Lerner N, Boyd S. On-Road Study of Willingness to Engage inDistracting Tasks. Washington, DC: National Highway TrafficSafety Administration; 2005. DOT HS 809 863
29. Klauer SG, Dingus TA, Neale VL, Sudweeks JD, Ramsey DJ.The Impact of Driver Inattention on Near-Crash/Crash Risk: An
PEDIATRICS Volume 121, Number 5, May 2008 e1401 by guest on May 13, 2014pediatrics.aappublications.orgDownloaded from

Analysis Using the 100-Car Naturalistic Driving Study Data. Blacks-burg, VA: Virginia Tech Transportation Institute; 2006
30. Williams AF. Teenage drivers: patterns of risk. J Safety Res.2003;34(1):5–15
31. Lerner N, Singer J, Simons-Morton B. The effects of teenpassengers on teen driver speeds and headways. Presented at:49th Annual Meeting of the Human Factors and ErgonomicsSociety; September 26, 2005; Orlando, FL
32. Simons-Morton BG, Lerner N, Singer J. The observed effects ofteenage passengers on the risky driving behavior of teenagedrivers. Accid Anal Prev. 2005;37(6):973–982
33. Chen LH, Baker SP, Braver ER, Li G. Carrying passengers as arisk factor for crashes fatal to 16- and 17-year-old drivers.JAMA. 2000;283(12):1578–1582
34. Preusser DF, Ferguson SA, Williams AF. The effect of teenagepassengers on the fatal crash risk of teenage drivers. Accid AnalPrev. 1998;30(2):217–222
35. Glassbrenner D. Driver Cell Phone Use in 2005: Overall Results.Washington, DC: National Highway Traffic Safety Admin-istration; 2005. DOT HS 809 967
36. Strayer DL, Drews FA. Profiles in driver distraction: effects ofcell phone conversations on younger and older drivers. HumFactors. 2004;46(4):640–650
37. Strayer DL, Drews FA, Crouch DJ. A comparison of the cellphone driver and the drunk driver. Hum Factors. 2006;48(2):381–391
38. Hosking S, Young K, Regan MA, Brown J, Leicester P. TheEffects of Text Messaging on Young Novice Driver Performance. Clay-ton, Victoria, Australia: Monash University Accident ResearchCentre; 2005
39. Shinar D, Tractinsky N, Compton R. Effects of practice, age,and task demands, on interference from a phone task whiledriving. Accid Anal Prev. 2005;37(2):315–326
40. McKnight AJ, McKnight AS. Young novice drivers: careless orclueless? Accid Anal Prev. 2003;35(6):921–925
41. Mayhew DR, Simpson HM, Pak A. Changes in collision ratesamong novice drivers during the first months of driving. AccidAnal Prev. 2003;35(5):683–691
42. Falkmer T, Gregersen NP. A comparison of eye movementbehavior of inexperienced and experienced drivers in real traf-fic environments. Optom Vis Sci. 2005;82(8):732–739
43. Lee SE, Olsen E, Simons-Morton BG. Eyeglance behavior ofnovice teen and experienced adult drivers. Presented at: 85thannual meeting of the Transportation Research Board; January22–26, 2006; Washington, DC
44. Groeger JA. Youthfulness, inexperience, and sleep loss: theproblems young drivers face and those they pose for us. InjPrev. 2006;12(suppl 1):i19–i24
45. Carskadon MA, Mindell JA, Drake C. 2006 Sleep in America Poll:Teens. Washington, DC: National Sleep Foundation; 2006
46. Carskadon MA. Risks of driving while sleepy in adolescentsand young adults. In: Adolescent Sleep Patterns. New York, NY:Cambridge University Press; 2002:148–158
47. Senserrick T. Reducing young driver road trauma: guidanceand optimism for the future. Inj Prev. 2006;12(suppl 1):i56 –i60
48. Winston FK, Senserrick T. Competent independent driving asan archetypal task of adolescence. Inj Prev. 2006;12(suppl 1):i1–i3
49. Williams AF. Young driver risk factors: successful and unsuc-cessful approaches for dealing with them and an agenda for thefuture. Inj Prev. 2006;12(suppl 1):i4–i8
50. Juarez P, Schlundt DG, Goldzweig I, Stinson N. A conceptualframework for reducing risky teen driving behaviors amongminority youth. Inj Prev. 2006;12(suppl 1):i49–i55
51. Gillan JS. Legislative advocacy is key to addressing teen drivingdeaths. Inj Prev. 2006;12(suppl 1):i44–i48
52. Berg HY. Reducing crashes and injuries among young drivers:what kind of prevention should we be focusing on? Inj Prev.2006;12(suppl 1):i15–i18
53. Ginsburg KR, Slap GB, Cnaan A, Forke CM, Balsley CM,Rouselle DM. Adolescents perceptions of factors affectingtheir decisions to seek health care. JAMA. 1995;273(24):1913–1918
54. Ginsburg KR, Menapace AS, Slap GB. Factors affecting thedecision to seek health care: the voice of adolescents. Pediatrics.1997;100(6):922–930
55. Ginsburg KR, Alexander PM, Hunt J, Sullivan M, Zhao HQ,Cnaan A. Enhancing their likelihood for a positive future: theperspective of inner-city youth. Pediatrics. 2002;109(6):1136–1143
56. Ginsburg KR, Alexander PM, Hunt J, Sullivan M, Cnaan A.Enhancing their likelihood for a positive future: focus groupsreveal the voice of inner-city youth. Pediatrics. 2002;109(6).Available at: www.pediatrics.org/cgi/content/full/109/6/e95
57. Rich M, Ginsburg KR. The reason and rhyme of qualitativeresearch: why, when, and how to use qualitative methods inthe study of adolescent health. J Adolesc Health. 1999;25(6):371–378
58. Ellickson PL, Bird CE, Orlando M, Klein DJ, McCaffrey DF.Social context and adolescent health behavior: does school-level smoking prevalence affect students’ subsequent smokingbehavior? J Health Soc Behav. 2003;44:525–535
59. Martens MP, Page JC, Mowry ES, Damann KM, Taylor KK,Cimini MD. Differences between actual and perceived studentnorms: an examination of alcohol use, drug use, and sexualbehavior. J Am Coll Health. 2006;54(5):295–300
60. Shope JT. Influences on youthful driving behavior and theirpotential for guiding interventions to reduce crashes. Inj Prev.2006;12(suppl 1):i9–i14
61. Shults RA, Elder RW, Sleet DA, et al. Reviews of evidenceregarding interventions to reduce alcohol-impaired driving[published correction appears in Am J Prev Med. 2002;23(1):72]. Am J Prev Med. 2001;21(4 suppl):66–88
62. Baker SP, Chen LH, Li G. National Evaluation of Graduated DriverLicensing Programs. Washington, DC: National Highway Trans-portation Safety Administration; 2006. DOT HS 810 614
63. Ferguson SA, Williams AF. Awareness of zero tolerance lawsin three states. J Safety Res. 2002;33(3):293–299 www.atherom1009
64. Greening L, Stoppelbein L. Young drivers’ health attitudes andintentions to drink and drive. J Adolesc Health. 2000;27(2):94–101
65. Young KL, Regan MA, Hammer M. Driver Distraction: A Reviewof the Literature. Clayton, Victoria, Australia: Monash UniversityAccident Research Center; 2003
66. Maycock G, Lockwood C, Lester J. The Accident Liability of CarDrivers. Crowthorne, Berkshire, United Kingdom: TransportResearch Laboratory Research Report 315; 1991
67. Ditter SM, Elder RW, Shults RA, et al. Effectiveness ofdesignated driver programs for reducing alcohol-impaireddriving: a systematic review. Am J Prev Med. 2005;28(5suppl):280 –287
68. Williams AF. Alcohol-impaired driving and its consequences inthe United States: the past 25 years. J Safety Res. 2006;37(2):123–138
69. Forsyth E, Maycock G, Sexton B. Cohort Study of Learner andNovice Drivers. Part 3: Accidents, Offences and Driving Experience inthe First Three Years of Driving. Crowthoren, Bershire, UnitedKingdom: Transport Research Laboratory; 1995. PRIII
70. Gregersen NP, Nyberg A, Berg HY. Accident involvementamong learner drivers: an analysis of the consequences ofsupervised practice. Accid Anal Prev. 2003;35(5):725–730
e1402 GINSBURG et al by guest on May 13, 2014pediatrics.aappublications.orgDownloaded from
71. McCartt AT, Shabanova VI, Leaf WA. Driving experience,crashes and traffic citations of teenage beginning drivers. AccidAnal Prev. 2003;35(3):311–320
72. American Academy of Pediatrics, Committee on Injury, Vio-lence, and Poison Prevention, Committee on Adolescence;Weiss JC. The teen driver. Pediatrics. 2006;118(6):2570–2581
73. Gerrard M, Gibbons FX, Benthin AC, Hessling RM. A longitu-dinal study of the reciprocal nature of risk behaviors andcognitions in adolescents: what you do shapes what you think,and vice versa. Health Psychol. 1996;15(5):344–354
74. Reyna VF, Farley F. Risk and rationality in adolescent decision-making: implications for theory, practice, and public policy.Psychol Sci Pub Interest. 2006;7(1):1–44
75. Farrelly MC, Health CG, Davis KC, Messeri P, Hersey JC,Haviland ML. Getting to the truth: evaluating national tobaccocoutermarketing campaigns [published correction appears inAm J Public Health. 2003;93(5):703]. Am J Pub Health. 2002;92(6):901–907
76. Hicks JJ. The strategy behind Florida’s “truth” campaign. TobControl. 2001;10(1):3–5
PEDIATRICS Volume 121, Number 5, May 2008 e1403 by guest on May 13, 2014pediatrics.aappublications.orgDownloaded from
DOI: 10.1542/peds.2007-2595 2008;121;e1391PediatricsElliott
García-España, Sara Kinsman, D. Alex Quistberg, James G. Ross and Michael R. Kenneth R. Ginsburg, Flaura K. Winston, Teresa M. Senserrick, Felipe
That Affect Driving SafetyNational Young-Driver Survey: Teen Perspective and Experience With Factors
ServicesUpdated Information &
htmlhttp://pediatrics.aappublications.org/content/121/5/e1391.full.including high resolution figures, can be found at:
References
html#ref-list-1http://pediatrics.aappublications.org/content/121/5/e1391.full.at:This article cites 54 articles, 16 of which can be accessed free
Citations
html#related-urlshttp://pediatrics.aappublications.org/content/121/5/e1391.full.This article has been cited by 9 HighWire-hosted articles:
Rs)3Peer Reviews (PPost-Publication
http://pediatrics.aappublications.org/cgi/eletters/121/5/e1391
R has been posted to this article: 3One P
Subspecialty Collections
ence_-_poison_prevention_subhttp://pediatrics.aappublications.org/cgi/collection/injury_violInjury, Violence & Poison Prevention
_health:medicine_subhttp://pediatrics.aappublications.org/cgi/collection/adolescentAdolescent Health/Medicinethe following collection(s):This article, along with others on similar topics, appears in
Permissions & Licensing
mlhttp://pediatrics.aappublications.org/site/misc/Permissions.xhttables) or in its entirety can be found online at: Information about reproducing this article in parts (figures,
Reprints http://pediatrics.aappublications.org/site/misc/reprints.xhtml
Information about ordering reprints can be found online:
rights reserved. Print ISSN: 0031-4005. Online ISSN: 1098-4275.Grove Village, Illinois, 60007. Copyright © 2008 by the American Academy of Pediatrics. All and trademarked by the American Academy of Pediatrics, 141 Northwest Point Boulevard, Elkpublication, it has been published continuously since 1948. PEDIATRICS is owned, published, PEDIATRICS is the official journal of the American Academy of Pediatrics. A monthly
by guest on May 13, 2014pediatrics.aappublications.orgDownloaded from