Resource Efficiency Audit Report - DEVELOPMENT ...
31
USAID PATTA PROJECT Resource Efficiency Audit Report Agri Tech-Multan (Manufacturer of Agricultural Machinery) DECEMBER 2020 This publication was produced for review by the USAID. It was prepared by Arch Associates for an assignment commissioned by CFNA under the USAID PATTA Project.
-
Upload
khangminh22 -
Category
Documents
-
view
0 -
download
0
Transcript of Resource Efficiency Audit Report - DEVELOPMENT ...

USAID PATTA PROJECT
Resource Efficiency Audit Report
Agri Tech-Multan
(Manufacturer of Agricultural Machinery)
DECEMBER 2020
This publication was produced for review by the USAID. It was prepared by Arch Associates for an assignment commissioned by CFNA under the USAID PATTA Project.
USAID PATTA PROJECT
Resource Efficiency Audit Report
Agri Tech, Multan
DISCLAIMER The author’s views expressed in this publication do not necessarily reflect the views of the United States Agency for International Development, the United States Government or CFNA.
Resource Efficiency Audit Report – Agro Tech, Multan
USAID PATTA Project Page 1 of 31
Data Page Contract Number: AID-391-C-17-00004
Contractor Name: CFNA
Name of the Component: Pakistan Agricultural Technology Transfer Activity (PATTA)
USAID Technical Office:
Date of Report: December 01, 2020
Document Title: Resource Efficiency Audit Report Agri Tech, Multan
Author’s Name: Mr. Atif Ahmad Khan (Team Lead)
Mr. MUHAMMAD Abid (Energy Auditor)
Study Design and Methodology:
Mr. Atif Ahmad Khan (Team Lead)
SOW Title and Work Plan & Action ID:
USAID Pakistan PATTA Project
Resource Efficiency Audit
Project Area: Energy Audit of Manufacturing Units
Key Words: Distribution system, Energy efficiency, Electric motors, Energy cost, ECO’s, kWh savings, Payback period, savings, Preventive maintenance plan,

Resource Efficiency Audit Report – Agro Tech, Multan
USAID PATTA Project Page 2 of 31
Abstract Energy plays an important role in achieving the desired economic growth in a manufacturing unit. The whole framework of developmental goals is webbed around uninterrupted and continuous supply of energy. Energy is a crucial requirement of the developing and underdeveloped economies and social structures. Some of the major problems concerning energy generation and higher energy costs are the depleting nature of fossil resources, high investment in power generation solutions and renewable energy solutions. Also, annual energy demand increases without proper energy planning and energy generation solutions, which causes severe load shedding and energy prices to go higher.
Pakistan is nowadays passing through slow economic activity due to increase in energy price and high inflation rate. The sharp increase in electric and gas tariff is forcing all type of industries to look for avenues which helps in cost reduction. Resource Efficiency in general and Energy Efficiency specifically is the most potent domain which helps small and medium size industries to seek cost reduction opportunities with No and Low investment
The energy audit helps to keep the day-by-day increase in energy demand at lower side after implementing the cost effective measures of energy conservation at machine level. Meanwhile, energy conservation promises to fill the gap between supply and demand of energy. Several measures for conservation of energy are very important for consideration. Saving a watt is always cheaper than increasing the supply by a watt. Efficient utilization of energy resource is not only conservational but it also saves capital investment. Thus energy conservation is really the cheapest option at least until its potential is exhausted.
This energy audit report provides the complete details of the manufacturing unit in terms of energy use, its electricity consumption details, dependency on the other fuels, the costs of electricity and also highlights various areas of energy efficiency improvement, importance of energy audit and its benefits along with cost benefit analysis. In the findings section, various areas of improvement have been identified and highlighted along with the potential energy savings and complete cost benefit analysis. The use of energy efficient equipment to save energy is also proposed in the recommendations sections.
Keywords: energy conservation, energy efficiency, load shedding, costs, cost benefit analysis, energy demand, recommendations, payback period.
Resource Efficiency Audit Report – Agro Tech, Multan
USAID PATTA Project Page 3 of 31
Abbreviations/Acronyms °C Degree Celsius
A Ampere
bar Unit of Pressure
BEE Business Enabling Environment
ECO Energy Conservation Opportunities
Emiss. Emissivity
MEPCO Multan Electric Power Company
HVLP High Volume Low Pressure
kJ Kilo Joule
kVA Kilo Volt Ampere (Apparent Power)
kVAr Kilo Volt Ampere Reactive (Reactive Power)
kW Kilo Watt
kWh Kilo Watt Hour
LPF Low Power Factor
MD Maximum Demand
MDI Maximum Demand Indication
PKR Pakistani Rupees
PMP Preventive Maintenance Plan
RH Relative Humidity
RMS Root Mean Square
Std Standard
US United States
USAID United States Agency for International Development
V Voltage
WAPDA Water and Power Development Authority
Watt Wattage

Resource Efficiency Audit Report – Agro Tech, Multan
USAID PATTA Project Page 4 of 31
Contents
ABSTRACT ................................................................................................ II
EXECUTIVE SUMMARY ........................................................................ VIII
1.0 INTRODUCTION ................................................................................ 1
1.1 ......................................................................................................... General Information 1 1.2 ......................................................................................................... Scope of the Report 1 1.3 ......................................................................... Data Collection, Analysis and Reporting 1 1.4 .................................................................................................. Limitations of the Report 1 1.5 ......................................................................................... Energy Audit and Audit Team 2
2.0 ENERGY STUDY ............................................................................... 3
2.1 .................................................................................................. Purpose of Energy Audit 3 2.2 .............................................................................................. Objectives of Energy Audit 3 2.3 ........................................................................................ Scope of Energy Audit Activity 3
3.0 AUDIT METHODOLOGY ................................................................... 4
3.1 .................................................................................................. The Orientation Session 4 3.2 ........................................................................................................ Data Acquisition Plan 4 3.3 ................................................................................................................ Data Collection 4
DATA COLLECTED FROM THE MANUFACTURING UNIT: ..................... 4
DATA COLLECTED DURING ENERGY AUDIT ACTIVITY: ...................... 4
3.4 ................................................................................................................... Data Analysis 5 3.5 ........................................................................................................... Recommendations 5 3.6 ............................................................................................................. Instruments Used 5 3.7 ................................................................................................... Limitations of the Study 5
4.0 ENERGY FINDINGS .......................................................................... 6
4.1 ................................................................................................................... Energy Model 6 4.2 .................................................................. Resource (Material & Energy) Saving Areas 6 4.3 ........................................................... Electrical Distribution System—Capacitor Banks 6 4.4 ................................................................................................................. Electric Motors 7 4.5 .................................................................................................................... Power Factor 8 4.6 .................................................................................................. Power Quality Concerns
Error! Bookmark not defined. 4.7 .......................................................................................................................... Insulation
Error! Bookmark not defined. 4.8 .......................................................................................... Electrical Distribution System 12 4.9 ................................................................................................................. Electric Motors 12 4.10 .................................................................................................................. Power Factor 14
Resource Efficiency Audit Report – Agro Tech, Multan
USAID PATTA Project Page 5 of 31
4.11 ................................................................................................ Power Quality Concerns Error! Bookmark not defined.
OPTION 1: USING PC AND SOFTWARE PROVIDED WITH THE DELIVERY ERROR! BOOKMARK NOT DEFINED.
4.12 ............................................................................................................. Lighting System 14 4.13 ............................................................................................. Thermal Energy Efficiency
Error! Bookmark not defined. 4.14 ......................................................... Preventive Maintenance of Electrical Equipment 15 4.15 ................................................................................................ Compressed Air System
Error! Bookmark not defined.
5.0 ANNEXURE/APPENDICES ............................................................. 17
5.1 .................................................................. Approximate Prices for Electrical Equipment 17
7.0 REFERENCES ................................................................................... 19

Resource Efficiency Audit Report – Agro Tech, Multan
USAID PATTA Project Page 6 of 31
List of Tables Table 1: Quantitative summary of improvement areas...................................................................... viii Table 2: Energy types in use .................................................................................................................... 7 Table 3: Energy generation details of diesel generator ........................................................................ 7 Table 4: Annual energy purchase data ................................................................................................... 8 Table 5: Electric motors measured data ............................................................................................... 11 Table 6: Lux measurements at different areas .................................................................................... 13 Table 7: Replacement comparison of installed low efficiency motors with energy efficient ......... 18
Table 8: Causes of failure of motors ..................................................................................................... 19 Table 9: Detailed specifications of power quality filter ........................................................................ 20 Table 10: Comparison between present lights and LED’s ................................................................. 21

Resource Efficiency Audit Report – Agro Tech, Multan
USAID PATTA Project Page 7 of 31
Exchange Rate
1 USD = 160 PKR

Resource Efficiency Audit Report – Agro Tech, Multan
USAID PATTA Project Page 8 of 31
Executive Summary Energy is a major cost element in the manufacturing of agricultural implements. Owing to ever increasing cost of electricity in Pakistan, energy cost has become the major concern for small and medium enterprises to remain cost competitive. In this backdrop, USAID PATTA Project hired the services of a Consultant to undertake energy audits of its companies who are part of agriculture supply chain.
Agri Tech is a small manufacturing unit with total energy cost equivalent to PKR 0.3 million per month. The major electric loads in Agri Tech are welding plants in Fabrication shop and motors in Machine Shop. Agri Tech has connected load of 100 KVA from Multan Electric Power Company (MEPCO) and operates at a load of 50 KVA. For back up electricity, diesel based 150 KVA Generator (Make Cummins) is also installed. For its thermal needs, Agri Tech uses Liquid Petroleum Gas (LPG) as fuel to operate Oven. On average two cylinders are consumed per month
Review of last twelve months Electric bills show that no power factor penalty was imposed on the company.
The auditors conducted energy audit using power analyzer, temperature gun and lux meter. Moreover, the previous history of electric consumption was analyzed using monthly energy bills of MEPCO and diesel consumption of backup supply – diesel generator. In addition to this, real time energy consumption of electric loads and thermal losses of oven were recorded.
Also, special experiments are conducted to identify energy losses in motors when operated under No Load and routine load conditions. Similarly, Oven was operated, and its Thermal Energy losses was measured by recording surface temperatures from all four sides of Oven.
It was found during the audit that improvements can be made in the areas of power factor improvement at motors, electrical distribution system, electric motoring, lighting systems, insulation of dryer for energy conservation w.r.t. resource efficiency.
The capacitor banks are not adequately working resulting in energy losses.
The existing lighting system is quite inefficient w.r.t. orientation of lights, lux in the area and day light use. Motors in Machine Shops are operating at low load indicating that oversized motors are installed , are low efficiency electric motors and not operating at optimum load therefore consuming more energy. The power factor in all the motors which were tested is much below the MEPCO recommended power factor of 0.90.
The management of the Agri Tech has shown interest to adopt the recommended measures for energy conservation. The audit team recommends improving the motor loading, reduce losses at capacitor banks by replacing weak capacitors and right sizing of capacitors, insulation of Dryer, Day Light use.
By undertaking recommended energy conservation measures, it is estimated that minimum Agri Tech can reduce its electric energy bill by more than 7 %. This in turn will result in minimum of cost saving of PKR One Million annually.

Resource Efficiency Audit Report – Agro Tech, Multan
USAID PATTA Project Page 9 of 31
Table 1: Quantitative summary of improvement areas
Table 2: Qualitative summary of improvement areas
S.# Area for Energy Savings
1 Performance limit for material consumption for machining, grinding jobs for different equipments should be defined and monitored
2 Electrical Load can be reduced by adequate Day Light use and by correcting the orientation of Lights in Work Shop area.
S:No Energy Saving AreaSavings in
Kwh/YearSavings in Rs/Year
1 By Improving Motor Loading Profile 64260 642600
2 By Reducing Excessive Watts Consumption 3150 31500
3 By Suppression of Harmonics Distortion 1254 12540
4 By Replacement of Existing Lights in EE Lights 19476 194760
5 By Welding Plant off load condition 4350 43500
6 By Insulation of Oven 0 13889
Total Savings 92490 938789
Total Energy Savings
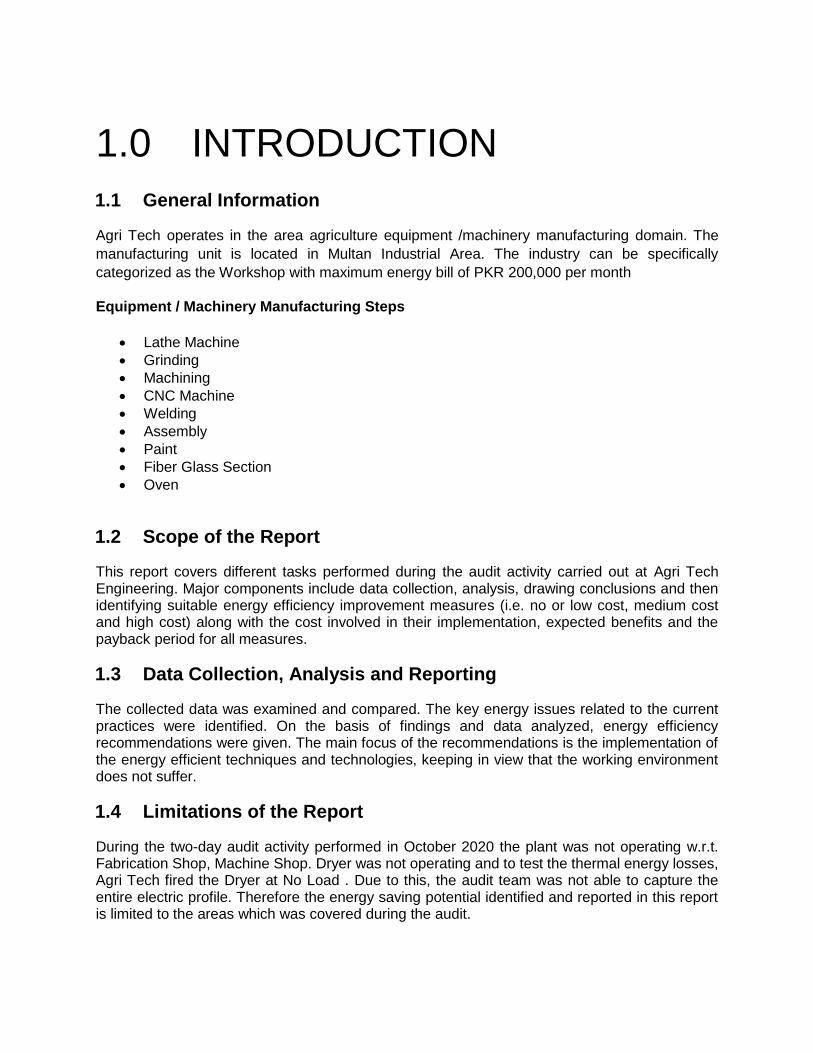
1.0 INTRODUCTION
1.1 General Information
Agri Tech operates in the area agriculture equipment /machinery manufacturing domain. The
manufacturing unit is located in Multan Industrial Area. The industry can be specifically
categorized as the Workshop with maximum energy bill of PKR 200,000 per month
Equipment / Machinery Manufacturing Steps
Lathe Machine
Grinding
Machining
CNC Machine
Welding
Assembly
Paint
Fiber Glass Section
Oven
1.2 Scope of the Report
This report covers different tasks performed during the audit activity carried out at Agri Tech Engineering. Major components include data collection, analysis, drawing conclusions and then identifying suitable energy efficiency improvement measures (i.e. no or low cost, medium cost and high cost) along with the cost involved in their implementation, expected benefits and the payback period for all measures.
1.3 Data Collection, Analysis and Reporting
The collected data was examined and compared. The key energy issues related to the current practices were identified. On the basis of findings and data analyzed, energy efficiency recommendations were given. The main focus of the recommendations is the implementation of the energy efficient techniques and technologies, keeping in view that the working environment does not suffer.
1.4 Limitations of the Report
During the two-day audit activity performed in October 2020 the plant was not operating w.r.t. Fabrication Shop, Machine Shop. Dryer was not operating and to test the thermal energy losses, Agri Tech fired the Dryer at No Load . Due to this, the audit team was not able to capture the entire electric profile. Therefore the energy saving potential identified and reported in this report is limited to the areas which was covered during the audit.

Also the conditions and energy consumption practices of the site may change with the passage of time, so this information relates to the specific conditions and is based upon information that existed at the time of data collection in the industry.
1.5 Energy Audit and Audit Team
Energy audit was carried out with the aim to identify certain areas to optimize the expensive energy consumption at the industry and move towards sustainable business growth. The audit experts gathered industry data, field observations and had necessary discussions to develop the expert opinions, which are presented in this report. Audit activities were conducted by audit team during the month of October 2020. The detailed field activities were carried out with full cooperation of the technical staff of the industry. Information on current energy use and data on energy consumption in different area was collected from the industry management for the period of June-Sep 2020.

2.0 ENERGY STUDY 2.1 Purpose of Energy Audit
This energy audit is designed to identify the energy wastages, pinpoint potential areas of energy efficiency improvement and recommend solutions along with cost benefit analysis to help make the industry more energy efficient and productive with the same production levels but at a lesser energy cost. An energy efficient industry is healthier, more profitable and costs less to operate.
The energy audit study also reveals to the owner, manager and supervisors of the manufacturing unit the options available for reducing energy waste, the costs involved and the benefits achievable by implementing these energy-conserving opportunities (ECOs).
Every day increase in electricity rates and fuel prices are driving industry’s bills up. Also, older machines working after their designed life contribute more in energy wastage and going up of utility bills. The energy saving potential of an industry varies depending upon the condition of the machines, technology used, total running hours of machines and process demand etc.
2.2 Objectives of Energy Audit
The objectives of the energy audit are to identify the end use of energy in manufacturing unit and its ECOs and as a feasibility study leading to the implementation of an energy management program. The audit procedures can be expanded as needed in the various phases of the energy program, with the application of each succeeding phase yielding more information on energy use and more opportunities for raising energy efficiency. The main objectives focused in our study of agricultural equipment manufacturing units are listed as below:
Estimation of the costs and energy efficiency opportunities to reduce energy costs in each area of energy use
Assessment of the energy saving potential in selected areas Development of effective measures for the implementation of the identified potential energy
savings Provide itemized proposal; if requested by the industry for the implementation of the
recommended measures to ensure energy conservation Development of energy efficiency programs during the energy audit
2.3 Scope of Energy Audit Activity
The scope of energy audit activity was:
Identification of energy losses in Electrical Distribution
Identification of electrical energy losses in production processes
Identification of areas where material consumption can be reduced
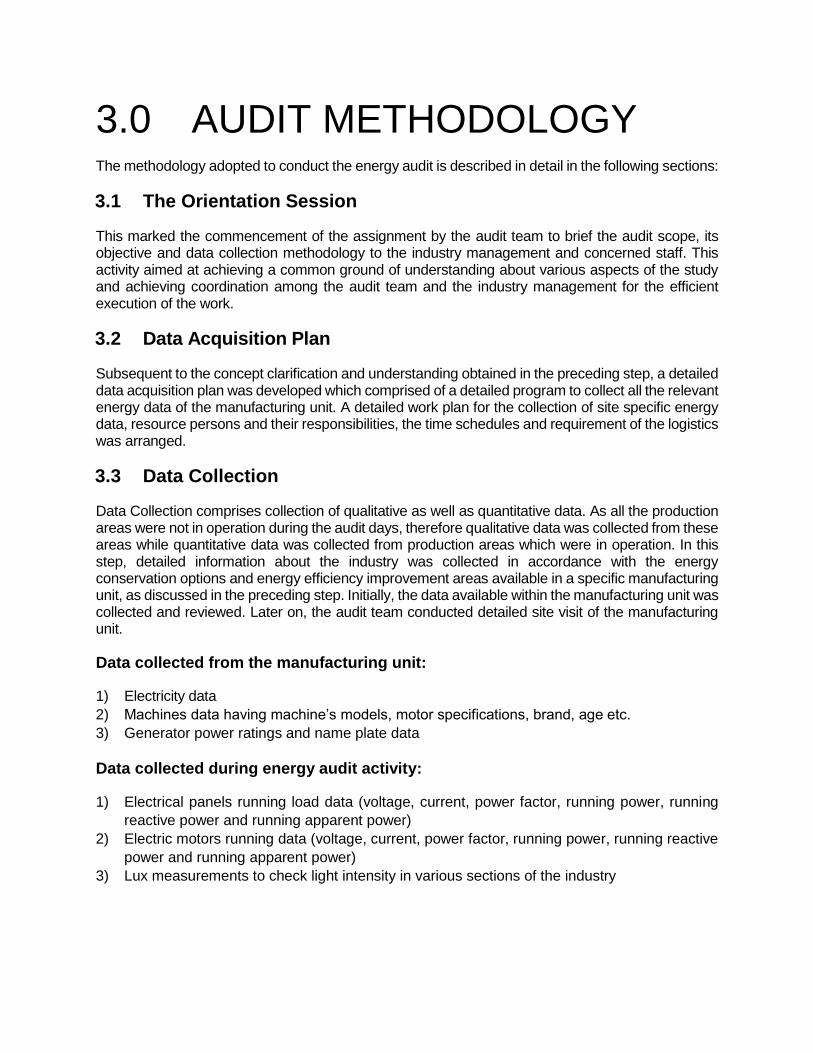
3.0 AUDIT METHODOLOGY The methodology adopted to conduct the energy audit is described in detail in the following sections:
3.1 The Orientation Session
This marked the commencement of the assignment by the audit team to brief the audit scope, its objective and data collection methodology to the industry management and concerned staff. This activity aimed at achieving a common ground of understanding about various aspects of the study and achieving coordination among the audit team and the industry management for the efficient execution of the work.
3.2 Data Acquisition Plan
Subsequent to the concept clarification and understanding obtained in the preceding step, a detailed data acquisition plan was developed which comprised of a detailed program to collect all the relevant energy data of the manufacturing unit. A detailed work plan for the collection of site specific energy data, resource persons and their responsibilities, the time schedules and requirement of the logistics was arranged.
3.3 Data Collection
Data Collection comprises collection of qualitative as well as quantitative data. As all the production areas were not in operation during the audit days, therefore qualitative data was collected from these areas while quantitative data was collected from production areas which were in operation. In this step, detailed information about the industry was collected in accordance with the energy conservation options and energy efficiency improvement areas available in a specific manufacturing unit, as discussed in the preceding step. Initially, the data available within the manufacturing unit was collected and reviewed. Later on, the audit team conducted detailed site visit of the manufacturing unit.
Data collected from the manufacturing unit:
1) Electricity data
2) Machines data having machine’s models, motor specifications, brand, age etc.
3) Generator power ratings and name plate data
Data collected during energy audit activity:
1) Electrical panels running load data (voltage, current, power factor, running power, running
reactive power and running apparent power)
2) Electric motors running data (voltage, current, power factor, running power, running reactive
power and running apparent power)
3) Lux measurements to check light intensity in various sections of the industry

3.4 Data Analysis
The audit data was examined and compared with the standard practices being exercised locally and internationally. The key energy issues related to the current practices were identified. Detailed analysis was conducted to conclude the audit findings.
3.5 Recommendations
Recommendations were made on the basis of the findings of data analysis. The main focus of the recommendations is the implementation of the energy efficient technologies, keeping in view the process, working energy improvements and resource optimization.
3.6 Instruments Used
Various instruments used during the audit are listed below:
1) Power Analyzer: For running parameters at various panels and motors etc.
2) Temperature gun: To observe the running temperature of motors, panels and wirings etc.
3) Lux meter: To observe the running lux in various sections.
3.7 Limitations of the Study
The energy audit team conducted the audit activities with the level of care and skill that is ordinarily exercised by the members of the consulting profession. These reports cover the maximum possible energy consumption practices and management that may exist.
In evaluating the subject site, the audit team relies in good faith on the information provided by the industry management or employees. It is assumed that the information provided is factual and accurate and the team accepts no responsibility for any deficiency, misstatements or inaccuracies contained in the report as a result of the omission or misrepresentation of any person interviewed or contacted.
It should be recognized that the passage of time affects the information provided in the audit report. The energy consumption practices and management of the site may change. Opinions relating to the specific conditions are based upon information that existed at the time of the formulation of conclusions.
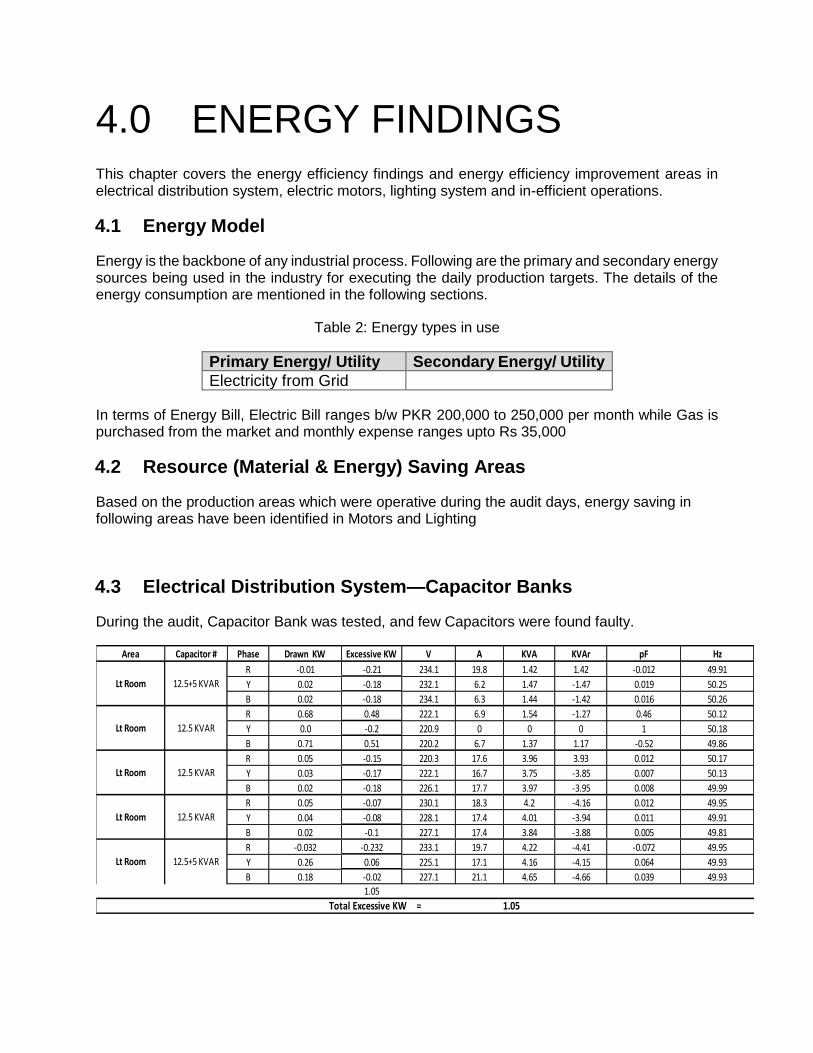
4.0 ENERGY FINDINGS This chapter covers the energy efficiency findings and energy efficiency improvement areas in electrical distribution system, electric motors, lighting system and in-efficient operations.
4.1 Energy Model
Energy is the backbone of any industrial process. Following are the primary and secondary energy sources being used in the industry for executing the daily production targets. The details of the energy consumption are mentioned in the following sections.
Table 2: Energy types in use
Primary Energy/ Utility Secondary Energy/ Utility
Electricity from Grid
In terms of Energy Bill, Electric Bill ranges b/w PKR 200,000 to 250,000 per month while Gas is purchased from the market and monthly expense ranges upto Rs 35,000
4.2 Resource (Material & Energy) Saving Areas
Based on the production areas which were operative during the audit days, energy saving in following areas have been identified in Motors and Lighting
4.3 Electrical Distribution System—Capacitor Banks
During the audit, Capacitor Bank was tested, and few Capacitors were found faulty.
Area Capacitor # Phase Drawn KW Excessive KW V A KVA KVAr pF Hz
R -0.01 -0.21 234.1 19.8 1.42 1.42 -0.012 49.91
Y 0.02 -0.18 232.1 6.2 1.47 -1.47 0.019 50.25
B 0.02 -0.18 234.1 6.3 1.44 -1.42 0.016 50.26
R 0.68 0.48 222.1 6.9 1.54 -1.27 0.46 50.12
Y 0.0 -0.2 220.9 0 0 0 1 50.18
B 0.71 0.51 220.2 6.7 1.37 1.17 -0.52 49.86
R 0.05 -0.15 220.3 17.6 3.96 3.93 0.012 50.17
Y 0.03 -0.17 222.1 16.7 3.75 -3.85 0.007 50.13
B 0.02 -0.18 226.1 17.7 3.97 -3.95 0.008 49.99
R 0.05 -0.07 230.1 18.3 4.2 -4.16 0.012 49.95
Y 0.04 -0.08 228.1 17.4 4.01 -3.94 0.011 49.91
B 0.02 -0.1 227.1 17.4 3.84 -3.88 0.005 49.81
R -0.032 -0.232 233.1 19.7 4.22 -4.41 -0.072 49.95
Y 0.26 0.06 225.1 17.1 4.16 -4.15 0.064 49.93
B 0.18 -0.02 227.1 21.1 4.65 -4.66 0.039 49.93
1.05
Lt Room 12.5+5 KVAR
12.5+5 KVAR
12.5 KVAR
Lt Room
Lt Room
Lt Room 12.5 KVAR
12.5 KVARLt Room
Total Excessive KW = 1.05

4.4 Electric Motors
Standard or low efficiency class motors are being used in most of the machines in the industry. These motors consume more energy because of low efficiency ratings as compared to the high efficiency motors.
During the survey, the previous data was also taken into consideration and minimum and maximum loads on different motors were measured. Based on these measurements and history data analysis, It was concluded that the motors running in the industry are very old, not energy efficient and belonged to low efficiency class motors. These motors should be replaced with appropriate sized energy efficient motors of IE1 or IE2 class.
During the energy survey, energy measurements were performed on electric motors and running data was prepared and analyzed. The maximum possible measurements were recorded at most of the machines. These energy measurements were performed using power analyzer and included voltage, current, power factor, power, reactive power and apparent power of the motor.
Table 5.1: Electric motors measured data
S. No.
DepartmentMachine
Name
Motor
No.
Installed
(HP)
Installed
Kw
Measured
KW
3 phase
KWV A KVA KVAr PF Hz Loading
1 Lathe Department Lathe Machine # 1 1 0.745 0.16 0.48 215 1.0 0.24 0.23 0.31 50.18 64
2 Lathe Department Mellin Machine # 1 7.5 5.5875 0.23 0.69 215 2.1 0.45 0.41 0.68 49.83 12
3 Lathe Department Mallin Machine # 2 7.5 5.5875 0.14 0.42 216.1 4.3 0.96 0.21 0.15 49.97 8
4 Lathe Department Multi Machine # 1 3 2.235 0.07 0.21 215.1 1.4 0.29 0.31 0.18 50.18 9
5 Lathe Department Multi Machine # 2 3 2.235 0.05 0.15 216.1 2.6 0.58 0.56 0.17 50.11 7
6 Lathe Department Lathe Machine # 2 2 1.49 0.09 0.27 220.0 2.5 0.59 0.54 0.178 49.99 18
7 Lathe Department Lathe Machine # 3 2 1.49 0.13 0.39 214.0 2.2 0.58 0.53 0.26 49.91 26
8 Lathe Department Lathe Machine # 4 2 1.49 0.06 0.18 223.0 1.8 0.40 0.39 0.129 50.29 12
9 Lathe Department Lathe Machine # 5 2 1.49 0.11 0.33 229.4 1.5 0.35 0.36 0.23 50.29 22
10 Lathe Department Lathe Machine # 6 5.5 4.0975 0.07 0.21 228.1 4.4 1.05 1.05 0.11 49.91 5
12 Lathe Department Lathe Machine #7 2 1.49 0.14 0.42 232.1 2.2 0.46 0.44 0.25 50.38 28
14 Lathe Department Lathe Machine # 8 2 1.49 0.15 0.45 227.1 3.1 0.67 0.63 0.28 50.11 30
16 Lathe Department Lathe Machine # 12 2 1.49 0.53 1.59 234.1 6.4 0.76 0.73 0.27 50.07 107
17 Lathe Department Lathe Machine # 11 2 1.49 0.1 0.3 229.8 3.0 0.72 0.66 0.13 50.05 20
18 Lathe Department Shapper Machine # 1 3 2.235 0.21 0.63 225.1 4.0 0.95 0.89 0.19 50.13 28
19 Lathe Department Lathe Machine # 9 2 1.49 0.23 0.69 225.2 3.7 0.29 0.28 0.68 50.14 46
20 Lathe Department Lathe Machine # 10 7.5 5.5875 0.09 0.27 228.1 4.4 1.03 1.02 0.11 50.04 5
21 Lathe Department Mellin Machine # 3 1 0.745 0.06 0.18 225.1 1.8 0.34 0.33 0.13 49.48 24
22 Press Department Press Machine # 1 7.5 5.5875 0.56 1.68 228.1 3.7 0.79 0.59 0.71 49.91 30
23 Press Department Press Machine # 2 2 1.49 0.02 0.06 222.0 2.2 0.53 0.51 0.39 50.13 4
24 Lathe Department Hydraulic Machine # 1 15 11.175 0.9 2.7 221.9 12.1 2.21 2.02 0.39 49.93 24
25 Lathe Department Hydraulic Machine # 2 5.5 4.0975 0.05 0.15 220.1 4.5 1.03 1.01 0.1 49.47 4
Motors running at 0-59 % Load 23 motors running at low loaded 92 %
Motors running at 60-100 % Load 1 motors normally load 4 %
Motors running at above 100 % Load 1 motors running overloaded 4 %

It is important to mention that some of the motors had been rewound due to burning. It is also pertinent to mention that burnt and rewound motor consumes more energy as compared to the newly manufactured or original motor that is not rewound or burnt. It has been observed that each rewinding decreases the motor efficiency from 2% to 5% and if rewinding is not properly done then this may further decrease from 5% to 8%.
It is clear from the above table that rewound motors are using more reactive power as compared to the original/new electric motors. It was observed that motor starters and safeties were missing and a few motors were running without fans. The purpose of the fan is to dissipate the heat produced during running. If the fan is absent, the temperature rises and the motor loses its efficiency and in some cases, motor burns.
4.5 Power Factor
The power factor plays an important role in energy efficiency of the power distribution system. By improving the power factor, the energy can be saved. At utilization side, the power factor on some of the motors was found to be on the lower side.
Loads of different motors were measured during the survey. The details of these measurements carried out during the energy audit survey are given in above table. The power factor was found to be on the lower side in most of the motors; especially those running at lower and higher power loads. 0.1 is the min PF recorded and 0.7 is the maximum
The above data clearly indicators that PFI should be done either at Distribution end or at motor end.
4.6 Welding Plants
It was observed during the audit, the welding plants were in ON-mode even when not in use. Below data of Energy Losses identified during testing of welding plants.
S# Dept./Area Machine Name Machine # Onload Ampares Offload Ampares Voltage
1 Welding Section welding Machine 1 27.8 3.2 440.1
2 Welding Section welding Machine 2 25.2 3.3 439.1
3 Welding Section welding Machine 3 23.6 0.1 395.3
4 Welding Section welding Machine 4 6.9 0 408.1
6.6
6.6 1.45 KwTotal Loss in terms of Kw while off-Loading Plant

4.7 Voltage Imbalance
No Voltage Imbalance was found as a result of Electrical Testing.
4.8 Lighting
A significant potential is noted if Agri Tech replaces it Lighting with Efficient lights. Below data indicates the saving potential
S # Area Phase Voltage Ampare Measured KW P.F
R 240.1 8.4 -2.02 -0.91
Y 240.1 4.9 -0.39 0.18
B 238.3 6.9 -0.084 0.466
R 237.1 11.6 1.99 0.494
Y 236.1 13.1 0.14 0.047
B 240.1 7.9 0.39 0.025
R 230.1 50.1 10.3 0.81
Y 228.3 48.1 7.9 0.67
B 233.1 41.1 4.36 0.61
R 241.1 30.1 -6.46 -0.99
Y 237.2 21.6 2.02 0.43
B 238.4 21.1 3.05 0.634
Lathe Machine Department
1
PressSection
2
Welding Section
3
Welding Section
S# Department /Section Type of Light Rated Capacity Quantity Total Recommended Recommended Total Watts
Watts Numbers Watts Quantity WattsMercury Bulb 200 8 1600 8 100 800
LED Light 50 3 150 3 36 108
LED Light 200 4 800 3 100 300
Mercury Bulb 200 20 4000 20 100 2000
LED Bulb 100 3 300 3 50 150
4 Lathe Section Mercury Bulb 200 26 5200 22 100 2200
Press Section
Welding Section
1
2
.
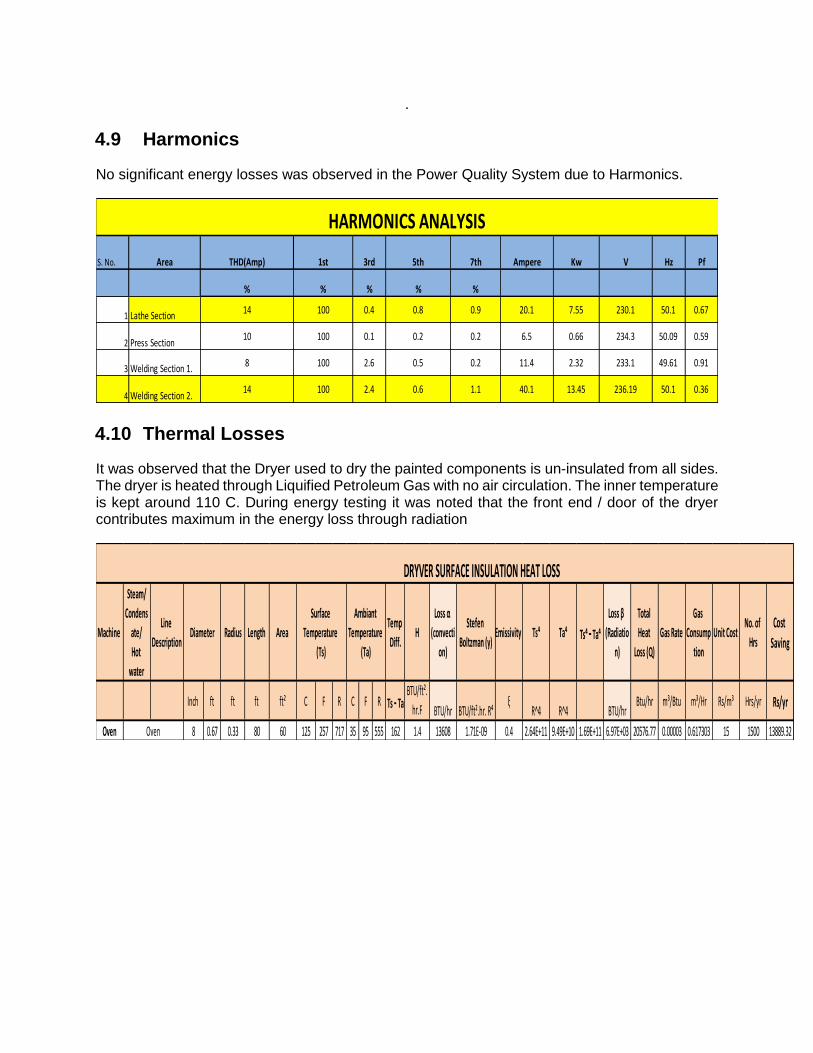
4.9 Harmonics
No significant energy losses was observed in the Power Quality System due to Harmonics.
4.10 Thermal Losses
It was observed that the Dryer used to dry the painted components is un-insulated from all sides. The dryer is heated through Liquified Petroleum Gas with no air circulation. The inner temperature is kept around 110 C. During energy testing it was noted that the front end / door of the dryer contributes maximum in the energy loss through radiation
S. No. Area THD(Amp) 1st 3rd 5th 7th Ampere Kw V Hz Pf
% % % % %
1 Lathe Section 14 100 0.4 0.8 0.9 20.1 7.55 230.1 50.1 0.67
2 Press Section10 100 0.1 0.2 0.2 6.5 0.66 234.3 50.09 0.59
3 Welding Section 1. 8 100 2.6 0.5 0.2 11.4 2.32 233.1 49.61 0.91
4 Welding Section 2.14 100 2.4 0.6 1.1 40.1 13.45 236.19 50.1 0.36
HARMONICS ANALYSIS
Machine
Steam/
Condens
ate/
Hot
water
Line
DescriptionRadius Length Area
Temp
Diff.H
Loss α
(convecti
on)
Stefen
Boltzman (y)Emissivity Ts⁴ Ta⁴ Ts⁴ - Ta⁴
Loss β
(Radiatio
n)
Total
Heat
Loss (Q)
Gas Rate
Gas
Consump
tion
Unit Cost No. of
Hrs
Cost
Saving
Inch ft ft ft ft² C F R C F R Ts - TaBTU/ft².
hr.F BTU/hr BTU/ft².hr. R⁴ξ
R^4 R^4 BTU/hrBtu/hr m³/Btu m³/Hr Rs/m³ Hrs/yr Rs/yr
Oven 8 0.67 0.33 80 60 125 257 717 35 95 555 162 1.4 13608 1.71E-09 0.4 2.64E+11 9.49E+10 1.69E+11 6.97E+03 20576.77 0.00003 0.617303 15 1500 13889.32
Diameter
Surface
Temperature
(Ts)
Ambiant
Temperature
(Ta)
Oven
DRYVER SURFACE INSULATION HEAT LOSS

RESOURCE ENERGY AUDIT
EVIDENCE Below pictures shows the different phases of Resource Efficiency Audit activities at Agri Tech.
4.11 Energy Auditing
ENERGY CONCLUSIONS AND
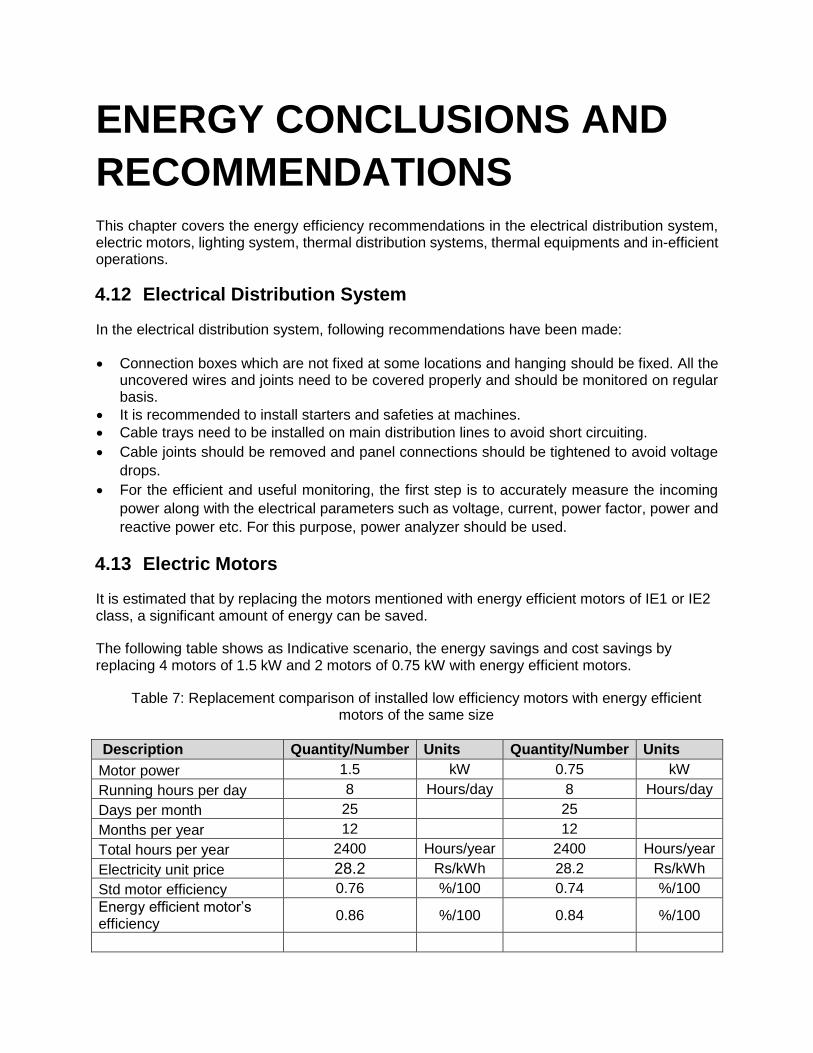
RECOMMENDATIONS This chapter covers the energy efficiency recommendations in the electrical distribution system, electric motors, lighting system, thermal distribution systems, thermal equipments and in-efficient operations.
4.12 Electrical Distribution System
In the electrical distribution system, following recommendations have been made:
Connection boxes which are not fixed at some locations and hanging should be fixed. All the uncovered wires and joints need to be covered properly and should be monitored on regular basis.
It is recommended to install starters and safeties at machines.
Cable trays need to be installed on main distribution lines to avoid short circuiting.
Cable joints should be removed and panel connections should be tightened to avoid voltage
drops.
For the efficient and useful monitoring, the first step is to accurately measure the incoming
power along with the electrical parameters such as voltage, current, power factor, power and
reactive power etc. For this purpose, power analyzer should be used.
4.13 Electric Motors
It is estimated that by replacing the motors mentioned with energy efficient motors of IE1 or IE2 class, a significant amount of energy can be saved.
The following table shows as Indicative scenario, the energy savings and cost savings by replacing 4 motors of 1.5 kW and 2 motors of 0.75 kW with energy efficient motors.
Table 7: Replacement comparison of installed low efficiency motors with energy efficient motors of the same size
Description Quantity/Number Units Quantity/Number Units
Motor power 1.5 kW 0.75 kW
Running hours per day 8 Hours/day 8 Hours/day
Days per month 25 25
Months per year 12 12
Total hours per year 2400 Hours/year 2400 Hours/year
Electricity unit price 28.2 Rs/kWh 28.2 Rs/kWh
Std motor efficiency 0.76 %/100 0.74 %/100 Energy efficient motor’s efficiency
0.86 %/100 0.84 %/100

Total energy saving per year
385.56 kWh 202.70 kWh
Total cost saving per year 10,872.71 Rs 5,716.22 Rs
Total no. of motors 4 2
Total energy saved 1,542.23 kWh 405.41 kWh
Total cost saved 43,491 Rs 11,432 Rs
Total investment 72,000 Rs 30,000 Rs
Payback period 1.66 Year 2.62 Year
Total annual energy savings
1,948 kWh/year
Total annual cost savings 54,923 Rs/year
Total investment 102,000 Rs
Payback period 1.86 Year
Note:
The above table does not include the following:
Motors rewinding cost
O&M cost
Old motors sale price
Other issues related to burning of motors
As the operating hours increases, the pay back will decrease
Following brands may be considered when replacing electric motors:
Siemens
ABB
Leroy Somer
WEG
Generally, motors burn due to excessive loads and temperature rise. Motor bearings and their alignment play an important part in their abnormal operation. In more than 50% cases, the failure of motor is due to a mechanical cause like improper alignment and the failure of bearings. Different causes of motor failure along with their contributions towards the failure are shown in the table below.

Table 8: Causes of failure of motors
Heat is produced in motors due to friction which is a result of poor lubrication and misalignment but mainly it is produced due to core and copper losses.
4.14 Power Factor
Agri Tech needs to install capacitors in order to improve the motor loading.
4.15 Lighting System
It is recommended that Agri Tech below actions in the sequence defined below
Determine the required lux value for each production area and work station e.g. Lux required at Production Machines at the point of Inspection is different compared to Lux required at the machine panel and in the production hall.
Evaluate the current orientation of light and if the maximum light is not illuminating the work station or inspection area and most of the light is on the non-productive area (machine top), then first change the orientation and then re-measure the Lux
Replace current lighting with efficient lighting for the same Lux value
The below table shows the comparison of replacing energy savers/tube lights with the energy efficient LED’s. The burning rate of the energy savers is too high and replacement on critical machines is an issue. While on the other side, LED’s have a running life of 50,000 hours and there is no need to replace them.
Table 10: Comparison between present lights and LED’s
Description
Present Scenario Improved Scenario
Power (Watt)
Quantity Total
Power (Watt)
Power (Watt)
Quantity Total
Power (Watt)
Energy saver 25 10 250 7 10 70
Bulbs 100 3 300 27 3 81
Motor Fault Contribution (%)
Shaft and coupling 2
Rotor bar 5
External factors (environment, voltage etc.) 16
Stator winding (due to voltage, water, overload etc.) 16
Bearing 51
Unknown 10
Total 100
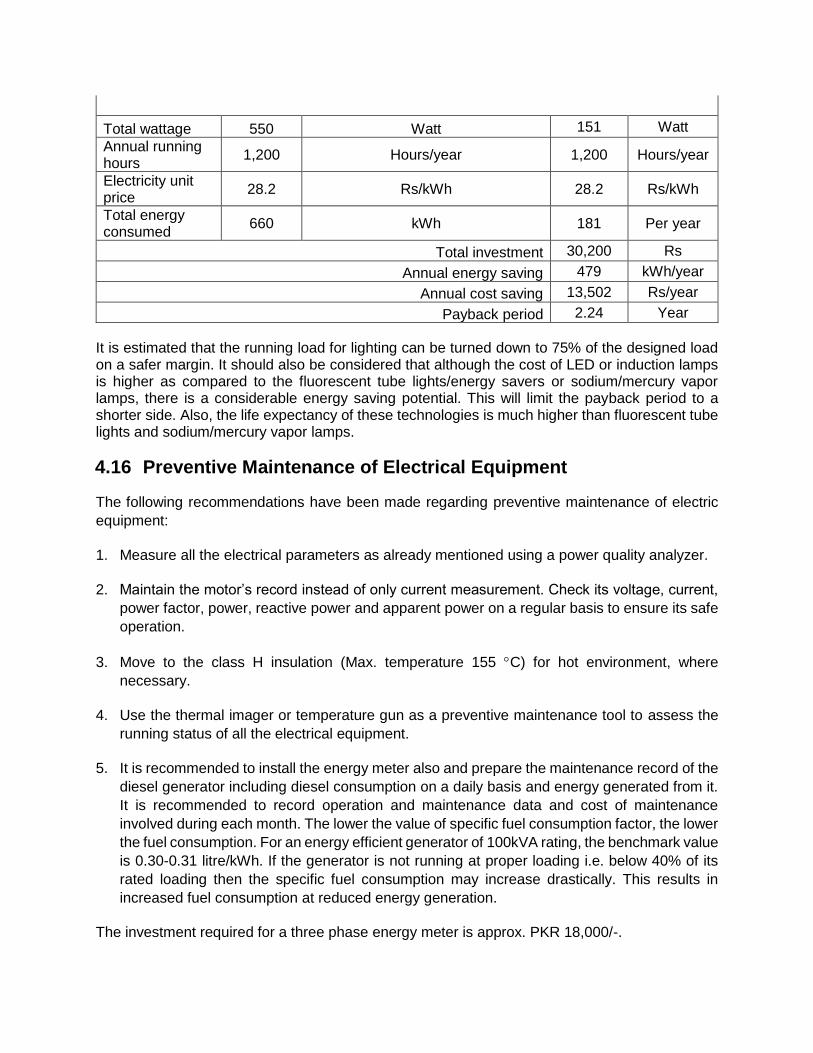
Total wattage 550 Watt 151 Watt
Annual running hours
1,200 Hours/year 1,200 Hours/year
Electricity unit price
28.2 Rs/kWh 28.2 Rs/kWh
Total energy consumed
660 kWh 181 Per year
Total investment 30,200 Rs
Annual energy saving 479 kWh/year
Annual cost saving 13,502 Rs/year
Payback period 2.24 Year
It is estimated that the running load for lighting can be turned down to 75% of the designed load on a safer margin. It should also be considered that although the cost of LED or induction lamps is higher as compared to the fluorescent tube lights/energy savers or sodium/mercury vapor lamps, there is a considerable energy saving potential. This will limit the payback period to a shorter side. Also, the life expectancy of these technologies is much higher than fluorescent tube lights and sodium/mercury vapor lamps.
4.16 Preventive Maintenance of Electrical Equipment
The following recommendations have been made regarding preventive maintenance of electric
equipment:
1. Measure all the electrical parameters as already mentioned using a power quality analyzer.
2. Maintain the motor’s record instead of only current measurement. Check its voltage, current,
power factor, power, reactive power and apparent power on a regular basis to ensure its safe
operation.
3. Move to the class H insulation (Max. temperature 155 C) for hot environment, where
necessary.
4. Use the thermal imager or temperature gun as a preventive maintenance tool to assess the
running status of all the electrical equipment.
5. It is recommended to install the energy meter also and prepare the maintenance record of the
diesel generator including diesel consumption on a daily basis and energy generated from it.
It is recommended to record operation and maintenance data and cost of maintenance
involved during each month. The lower the value of specific fuel consumption factor, the lower
the fuel consumption. For an energy efficient generator of 100kVA rating, the benchmark value
is 0.30-0.31 litre/kWh. If the generator is not running at proper loading i.e. below 40% of its
rated loading then the specific fuel consumption may increase drastically. This results in
increased fuel consumption at reduced energy generation.
The investment required for a three phase energy meter is approx. PKR 18,000/-.

With the implementation of a suitable preventive maintenance plan, not only energy can be saved but system reliability can also be enhanced. Moreover, optimize transmission efficiency, minimize rewind losses, perform periodic checks and maintain motor records about their rewinding and performance after rewinding.

5.0 ANNEXURE/APPENDICES
5.1 Approximate Prices for Electrical Equipment
Item Specifications Make Approximate
Price (Rs)
Energy Meter Single Phase Three Phase
PEL, Syed Bhais, 8,000-12,000 25,000
Capacitors
12.5 kVAr 25 kVAr 50 kVAr
ENTES (Germany) 6,075 15,000 32,500
Amber Classic (Pak) 9,650 15,100 35,500
Shizuki (Japan) 12,500 18,700 29,200
Breaker of Capacitors
12.5 kVAr 25 kVAr 50 kVAr
ENTES (Germany) 1,800 2,700 3,750
China made 850 850 2,500
Japan made 1,800 2,100 2,800
Power Factor Control Relay
6 Step
China made 4,500
Dealav, Malysia 15,500
ENTES, Turkey 16,500
Techno, Italy 28,000
RTR, Spain 19,600
Power Meter ENTES, Turkey 25,000
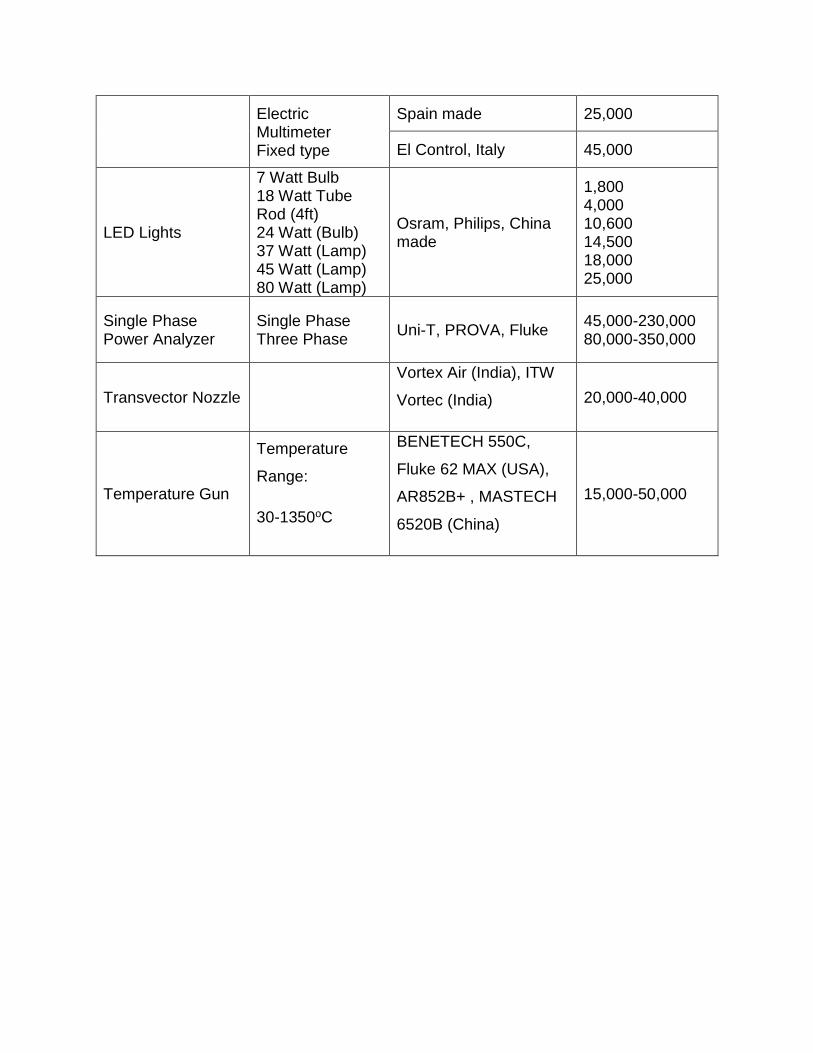
Electric Multimeter Fixed type
Spain made 25,000
El Control, Italy 45,000
LED Lights
7 Watt Bulb 18 Watt Tube Rod (4ft) 24 Watt (Bulb) 37 Watt (Lamp) 45 Watt (Lamp) 80 Watt (Lamp)
Osram, Philips, China made
1,800 4,000 10,600 14,500 18,000 25,000
Single Phase Power Analyzer
Single Phase Three Phase
Uni-T, PROVA, Fluke 45,000-230,000 80,000-350,000
Transvector Nozzle
Vortex Air (India), ITW
Vortec (India) 20,000-40,000
Temperature Gun
Temperature
Range:
30-1350oC
BENETECH 550C,
Fluke 62 MAX (USA),
AR852B+ , MASTECH
6520B (China)
15,000-50,000

7.0 References
1) MEPCO energy data www.lesco.com.pk 2) Fluke Corporation: Energy Measurement Instruments and Measurements Techniques www.fluke.com 3) USDOE: United States Department of Energy, Energy Audit Guidelines and Best Practices Guide: www.energy.gov 4) Schneider Electric: Power Quality Filtration Solutions: www.schneider-electric.com 5) WEG Energy Efficiency Electric Motors: www.weg.net 6) Siemens Electric Motors and Power Quality Filtration Solutions: www.siemens.com 7) The ABB Group: The Energy Efficient Electric Motors and Filtration Solutions www.abb.com

USAID PATTA Project