A GIS-Based Framework for Multi-Criteria Evaluation and Ranking of Transportation Corridor ...
27
1 A GIS-Based Framework for Multi-Criteria Evaluation and Ranking of Transportation Corridor Alternatives I. KAYSI †*, S. SADEK‡, and H. AL-NAGHI § † Professor, Faculty of Engineering and Architecture, American University of Beirut. ‡ Professor, Faculty of Engineering and Architecture, American University of Beirut. § Research Assistant, Faculty of Engineering and Architecture, American University of Beirut * Corresponding author. Email: [email protected] Abstract Different improvements can be identified for any given transportation network. Limited funding is typically available for proposed transportation projects, and thus identifying, ranking, and prioritizing the different transportation alternatives is essential. Extensive travel demand, mapping and engineering studies are conducted in analyzing every transportation alternative for corridor planning and operational improvement; such costly and time consuming traditional methods may not identify the best alternative to proceed into the engineering design level. Therefore, a more efficient approach is needed to improve the detailed corridor planning process. This research aimed to incorporate a range of evaluation criteria into a structured GIS-based framework for corridor planning and analysis. The organization of evaluation components was based on two relatively independent levels, alignment and operational analysis. With a wide spectrum of evaluation factors incorporated in the developed framework (geometric, environmental, economic), identifying the best alternative becomes a complex problem. A decision support approach based on the Analytic Hierarchy Process (AHP) was used to structure the multi-criteria evaluation task and to provide a tool for ranking various alternatives. The developed evaluation framework was simplified and organized in two levels, by separating corridor alignment analysis from operational options, and developing evaluation and ranking procedures for both levels. Ongoing research aims to develop a comprehensive evaluation framework integrating both levels in the numerous cases where corridor analysis cannot be conducted in isolation of operational scenarios. Keywords: Corridor planning; Alignment; GIS; AHP.
Transcript of A GIS-Based Framework for Multi-Criteria Evaluation and Ranking of Transportation Corridor ...

1
A GIS-Based Framework for Multi-Criteria
Evaluation and Ranking of Transportation Corridor
Alternatives
I. KAYSI †*, S. SADEK‡, and H. AL-NAGHI §
† Professor, Faculty of Engineering and Architecture, American University of Beirut.
‡ Professor, Faculty of Engineering and Architecture, American University of Beirut.
§ Research Assistant, Faculty of Engineering and Architecture, American University of Beirut * Corresponding author. Email: [email protected]
Abstract
Different improvements can be identified for any given transportation network. Limited
funding is typically available for proposed transportation projects, and thus identifying,
ranking, and prioritizing the different transportation alternatives is essential. Extensive
travel demand, mapping and engineering studies are conducted in analyzing every
transportation alternative for corridor planning and operational improvement; such
costly and time consuming traditional methods may not identify the best alternative to
proceed into the engineering design level. Therefore, a more efficient approach is
needed to improve the detailed corridor planning process. This research aimed to
incorporate a range of evaluation criteria into a structured GIS-based framework for
corridor planning and analysis. The organization of evaluation components was based
on two relatively independent levels, alignment and operational analysis. With a wide
spectrum of evaluation factors incorporated in the developed framework (geometric,
environmental, economic), identifying the best alternative becomes a complex problem.
A decision support approach based on the Analytic Hierarchy Process (AHP) was used
to structure the multi-criteria evaluation task and to provide a tool for ranking various
alternatives. The developed evaluation framework was simplified and organized in two
levels, by separating corridor alignment analysis from operational options, and
developing evaluation and ranking procedures for both levels. Ongoing research aims to
develop a comprehensive evaluation framework integrating both levels in the numerous
cases where corridor analysis cannot be conducted in isolation of operational scenarios.
Keywords: Corridor planning; Alignment; GIS; AHP.

2
1 Introduction
Different transportation improvements can be identified in land transportation networks
and these mainly include: upgrading and improving existing corridors, introducing new
corridors, and implementing new operational modes on existing or new corridors.
Usually, limited funding is available for proposed transportation projects, and thus
identifying, ranking, and prioritizing the different transportation alternatives is essential.
Upgrading and improving existing corridors is usually considered as the primary option,
including corridor widening to increase capacity, upgrades to enable a new mode of
transport, and grade separation at crossings. In many cases, considering a new corridor
alignment is essential either when no existing corridor is available or when no
appropriate improvement can be implemented on an existing corridor, or simply to
introduce a new transportation mode like railways that may require an exclusive right-
of-way. On the other hand, either on existing or on new corridors, operational scenarios
need to be investigated where the corridor may serve as a Highway, Toll Road, HOV
(High-Occupancy Vehicles), BRT (Bus Rapid Transit), HOT (High-Occupancy Toll), or
a Railway.
Extensive travel demand, mapping, and engineering studies are conducted in analyzing
transportation alternatives for corridor planning and operational improvement; such
costly and time consuming traditional methods may not identify the best alternative to
proceed into the engineering design level. Therefore, a more efficient approach is
needed to improve the detailed corridor planning process from the identification of
different alternatives to their evaluation and ranking.
2.1 Corridor Alignment Analysis and Design
Alignment analysis and design for transportation facilities have traditionally
been limited to the geometric design and cost estimate, where the design process
consists of several steps, starting with the conceptual design that is done on large scale
maps to identify broad design constraints and overall cost estimates, then functional and
preliminary designs, while the final design is done based on a field survey to identify
property and utility impacts and to refine the cost estimate.
In addition to cost estimates and engineering considerations in alignments design
and evaluation, an increasing emphasis on environmental aspects of transportation has

3
been placed since the 1980s and has been paralleled with a focus on the essential role of
community involvement (Bailey et al., 2001). Other corridor planning methodologies
were developed based on issues regarding corridor sustainability while ensuring
environmental, social, and economic feasibility (Green, et al., 2001). The approach
aimed to achieve sustainable growth within the corridor with respect to economic
growth and potential, land-use development and social needs, as well as transportation
and environmental capacity.
GIS is a data rich tool that has overlaying, indexing, and spatial analysis
capabilities. So far, it has been the core evaluation tool for many sector studies; in
particular, transportation studies have been significantly enhanced by taking advantage
of the GIS capabilities. Previous research efforts have addressed the development of a
highway alignment analysis framework based on geotechnical considerations and using
GIS (Bedran 1997). The main criteria considered in the study were geometric design
issues (vertical and horizontal curves), earthworks (cut and fill volumes), and
geotechnical (slope stability). For that purpose, a GIS base map with all relevant data
layers was developed and used within a customized application that links ArcView GIS
with AutoCivil. Moreover, the work was further improved to include environmental
considerations (Sadek et al., 2000). The environmental components were mainly
community disruption considerations and noise impact whereby the Traffic Noise
Model (TNM) was used in the analysis.
On the other hand, with the capability of GIS of storing geographic data such as
topographic, environmentally sensitive regions, land boundaries, and its capability of
performing complex spatial analysis across different layers of data, it was recently used
to develop a tool for highway alignment optimization by integrating GIS with genetic
algorithms which can search very effectively through complex spaces with a large
number of local optima (Jha & Schonfeld, 2004).
2.3 Identification and Evaluation of Corridor Operational Alternatives
In addition to alignment evaluation, certain corridor studies involve an
identification and evaluation of operational alternatives along the proposed alignment.
For instance, a feasibility assessment for a toll highway was developed in the case of the
New Batinah Expressway (NBE) in Oman, where the study included an analysis of

4
technological options for toll collection and the demand variation with the imposition of
tolls. Different operational scenarios and alternatives were studied and evaluated in
terms of economic efficiency and financial viability (Kaysi & Kanaan, 2001).
Moreover, the Georgia Department of Transportation's Multimodal
Transportation Tool (MTPT) was developed to aid in the analysis of transportation
needs of rural areas. It is also used to identify potential implementation and to develop a
prioritized project list by mode (Mazur et al., 2001). MTPT evaluates six primary modes
that are: Local Transit, Intercity Bus and Passenger Rail, Commuter Rail, Aviation,
Bicycles and Pedestrian, and Highways. GIS was used to take advantage of existing
data and has played an important role in the storage and processing of spatial data, and
presentation of results.
2.4 Methodologies for Ranking Transportation Alternatives
Benefit-cost analysis (BCA) has been the dominating method of project
evaluation in the US. In this approach, all evaluation factors have to be quantified in
dollar terms, frequently resulting in difficulties related to determination of various
parameter values needed within the decision process.
The scope of many relevant studies extends to cover transportation and non-
transportation benefits as well as capital and operating costs. Several rational methods
that support decisions regarding transportation projects prioritization and programming
have been employed in several states in the USA. Such methods varied widely in the
degree of objectivity, evaluation factors, reliance on data, and output formats. The Ohio
Department of Transportation uses a standalone scoring approach for projects based on
a set of data-driven criteria, independent of the scores of other competing projects, and
therefore lacks a direct measure of relative merit. On the other hand, the Delaware
prioritization process adopted ten equally weighted factors for evaluation, including:
safety, mobility, transit, bicycles, pedestrians, support of existing communities, other
community/environmental impacts, other economic impacts, sustainability, and
mitigation (Turochy 2001).
When multiple criteria may not be directly merged into a single monetary
measure, the decision can be made using different techniques; the simplest is the
preference matrix that is a criteria scoring table for each alternative being considered for

5
comparison. Each score is weighted according to its perceived importance, with the total
of these weights typically equaling 100 (Krajewski & Ritzman, 1998).
Another widely used technique is the DEA (Data Envelopment Analysis) that is
an application of linear programming used to measure the relative efficiency of
operating units with the same goals and objectives.
On the other hand, the AHP (Analytic Hierarchy Process) is the most creative
multi-criteria decision making technique. While it is not a traditional decision tree, it
structures evaluation factors descending from an overall goal to criteria, sub-criteria and
alternatives in successive levels (Saaty 1990). AHP was framed as a multicriteria
procedure and integrated with GIS to develop a transit station site assessment system
with the flexibility to account for the population and employment in the study area, as
well as the socioeconomic, demographic, and trip making characteristics of the targeted
population (Banai 2000).
3 EVALUATION METHODOLOGY
The objective of this research is to structure the methodology of identifying and
evaluating alternative options for transportation corridors. Different factors are
considered in the analysis, including: financial, economic, environmental,
social/political, and system efficiency factors. All such factors depend on both
alignment and operational alternatives; if there are different alignment alternatives and
different operational scenarios, combined options may need to be considered. For
instance, when evaluating corridor alignment alternatives, improving existing corridors
may need to be considered and evaluated against proposed new corridor alignments. On
the other hand, when evaluating operations, multiple operational options can be
considered as well as phased operations (conversion between operational alternatives).
In this research, evaluation criteria components are separated in a practical and
convenient two stage analysis comprising alignment analysis and operations analysis as
illustrated in Fig. 1 where some evaluation criteria are directly related to corridor
alignments analysis, while others are associated with evaluation of operational options.
Further research is underway to consider possible combinations of alignment
alternatives and operational options, or the resort to iterative approaches.

6
Fig. 1 Evaluation Framework
La
nd
Bu
ild
ing
s a
cq
uis
itio
ns
Cu
t/fill
Pa
ve
me
nt/
tra
ck
Bri
dg
es/t
un
ne
ls
Ove
rpa
sse
s/u
nd
erp
asse
s
En
v.
Se
nsitiv
e A
rea
sL
ake
s,
fore
sts
, a
rch
eo
log
ica
l
Ge
om
etr
ic D
esig
n
Ele
me
nts
Ve
rtic
al a
nd
ho
rizo
nta
l cu
rve
s
Le
ng
th o
f co
rrid
or
Ca
pita
lL
oco
mo
tive
s/B
use
s/V
eh
icle
s
Op
era
tio
na
lV
eh
icle
op
era
tio
n c
ost
Re
ve
nu
eR
ide
rsh
ip p
ote
ntia
l, t
olls,
fare
s
Sa
vin
gs
Tra
ve
l tim
e (
IRR
)
Po
ten
tia
l o
f co
mm
eri
ca
l d
eve
lop
me
nts
Po
ten
tia
l fo
r fr
eig
ht
tra
nsp
ort
atio
n
Jo
bs c
rea
ted
, e
tc…
Co
nn
ectivity t
o o
the
r m
od
es o
f tr
an
sp
ort
Re
latio
n t
o n
atio
na
l vs r
eg
ion
al n
etw
ork
Imp
lem
en
tatio
n
Tim
efr
am
eO
pe
ratio
n s
tart
-up
tim
e
Div
ert
ed
tra
ffic
Sh
ift
of
mo
de
s
Vib
ratio
n
Air
Po
llu
tio
n
No
ise
Nu
mb
er
of
citie
s s
erv
ed
Ta
rge
t p
op
ula
tio
n
Urb
an
co
nn
ectivity
Co
mm
un
ity d
isru
ptio
n
Exp
rop
ria
tio
n
En
vir
on
me
nta
l
Co
mp
on
en
t
Re
ve
nu
e C
om
po
ne
nt
Co
st
Co
mp
on
en
t
Eco
no
mic
Po
liti
ca
l
Co
ns
ide
rati
on
s /
So
cia
l Im
pa
cts
Po
ten
tia
l S
tru
ctu
res
Ea
rth
wo
rkC
os
t C
om
po
ne
nt
Slo
pe
sta
bility
En
gin
ee
rin
g
Co
ns
ide
rati
on
s
Ove
rall S
ys
tem
Pe
rfo
rma
nc
e
Co
nve
rsio
n
En
vir
on
me
nta
l
Co
mp
on
en
t
Re
lie
f to
exis
tin
g
Ne
two
rk
Co
nn
ectivity
Rid
ers
hip
/De
ma
nd
Tra
ve
l T
ime
Sa
fety

7
In some cases where the corridor operation is already defined (e.g. regular highway operation), the
alignment evaluation framework criteria may be expanded to include operational evaluation components
where the impacts of the same operational option may vary for each alignment alternative. Such an
example is presented in the Case Study of the South Mountain Highway where three new alignments
alternatives are evaluated under regular highway operations.
3.1. Alignment Analysis
Alignment analysis includes all criteria that depend on alignment variation regardless of
operations, and it is mainly based on: political/social considerations, cost components and environmental
components that are related to alignments. For this purpose, a GIS-based tool is developed to identify and
to evaluate alternative alignments. This tool contains all relevant information in different data layers that
are required to complete the analysis, including: demographic, topographic, geologic, administrative
databases, in addition to road network plan and satellite imagery.
3.1.1. Cost Components
Cost is a key criterion for decision making on any alignment alternative, and is easily quantified
through computational estimations that are mainly related to expropriation, earthwork, and potential
structures.
3.1.1.1. Expropriation Costs
Expropriation cost is calculated based on land and buildings acquisition within corridor limits and
the expropriation bandwidth for setbacks. Usually, in any given alignment, land values change slightly
within areas close to the highway, whereas avoiding buildings within any alignment may considerably
reduce expropriation costs. GIS can be very beneficial in the expropriation costs calculation, where every
alignment is buffered by desired ROW (right of way) width, and with a landuse database that can be used
to estimate land values. Intersecting the buffered alignment on the landuse map can produce a spreadsheet
with expropriation costs.
On the other hand, building expropriation costs are a function of three variables/factors: location
(zone), size (surface area and number of floors), and type and condition (old/new/rehabilitated). High-
resolution satellite imagery could be used to identify the number of buildings within the right of way of an
alignment, to calculate floor area, and to estimate number of floors.
The number of floors is estimated from the building height based on its shadow's length on the
satellite imagery (Hui et al., 2000). The geometrical relation is as follows:
8
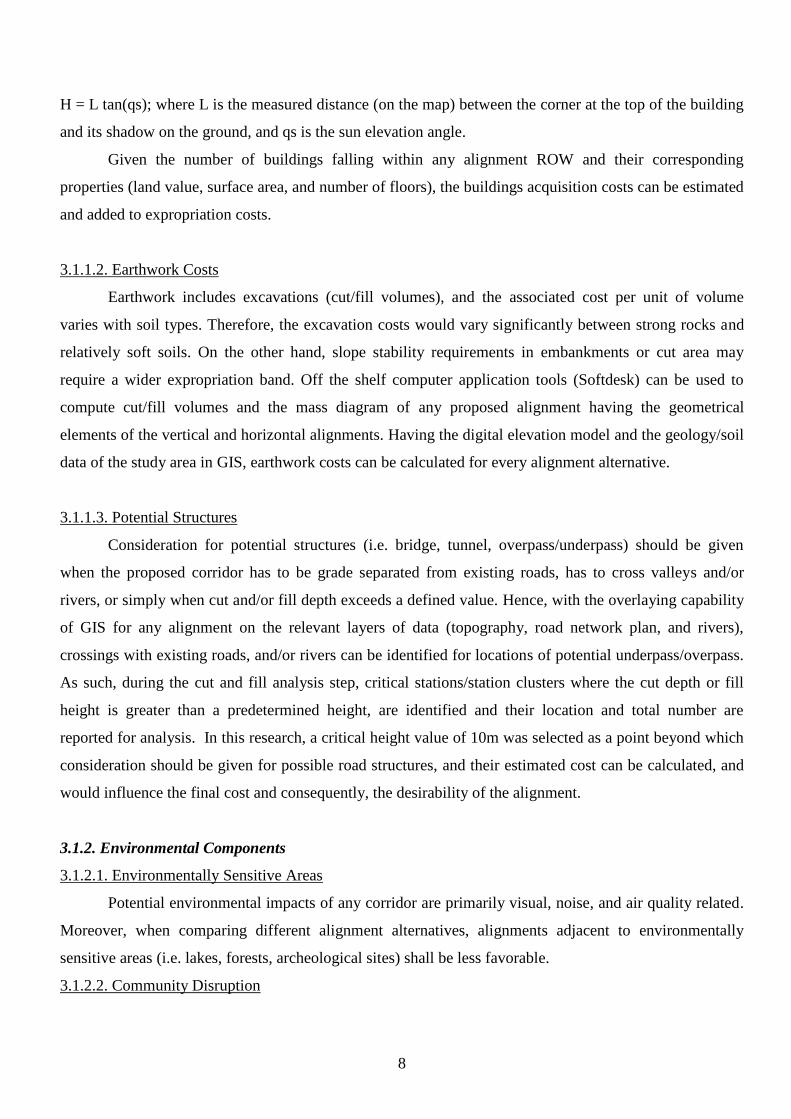
H = L tan(qs); where L is the measured distance (on the map) between the corner at the top of the building
and its shadow on the ground, and qs is the sun elevation angle.
Given the number of buildings falling within any alignment ROW and their corresponding
properties (land value, surface area, and number of floors), the buildings acquisition costs can be estimated
and added to expropriation costs.
3.1.1.2. Earthwork Costs
Earthwork includes excavations (cut/fill volumes), and the associated cost per unit of volume
varies with soil types. Therefore, the excavation costs would vary significantly between strong rocks and
relatively soft soils. On the other hand, slope stability requirements in embankments or cut area may
require a wider expropriation band. Off the shelf computer application tools (Softdesk) can be used to
compute cut/fill volumes and the mass diagram of any proposed alignment having the geometrical
elements of the vertical and horizontal alignments. Having the digital elevation model and the geology/soil
data of the study area in GIS, earthwork costs can be calculated for every alignment alternative.
3.1.1.3. Potential Structures
Consideration for potential structures (i.e. bridge, tunnel, overpass/underpass) should be given
when the proposed corridor has to be grade separated from existing roads, has to cross valleys and/or
rivers, or simply when cut and/or fill depth exceeds a defined value. Hence, with the overlaying capability
of GIS for any alignment on the relevant layers of data (topography, road network plan, and rivers),
crossings with existing roads, and/or rivers can be identified for locations of potential underpass/overpass.
As such, during the cut and fill analysis step, critical stations/station clusters where the cut depth or fill
height is greater than a predetermined height, are identified and their location and total number are
reported for analysis. In this research, a critical height value of 10m was selected as a point beyond which
consideration should be given for possible road structures, and their estimated cost can be calculated, and
would influence the final cost and consequently, the desirability of the alignment.
3.1.2. Environmental Components
3.1.2.1. Environmentally Sensitive Areas
Potential environmental impacts of any corridor are primarily visual, noise, and air quality related.
Moreover, when comparing different alignment alternatives, alignments adjacent to environmentally
sensitive areas (i.e. lakes, forests, archeological sites) shall be less favorable.
3.1.2.2. Community Disruption

9
In addition, when an alignment traverses a residential area or runs adjacent to a public facility (i.e.
school, hospital) where it could limit access and mobility within a neighborhood, community disruption
becomes a concern.
3.1.3. Engineering Considerations
3.1.3.1. Geometric Design Elements
The geometric design of corridor alignments deals with proportioning of its physical elements,
including horizontal alignment and vertical alignment.
3.1.3.1.1. Horizontal Alignment
The number of horizontal curves with radii less than a preset value is reported since these curves
may constrain the design speed of the proposed corridor. For the case study, the reference value was taken
to be 200m, reflecting the minimum acceptable radius for a design speed of 80 Km/hr.
3.1.3.1.2. Vertical Alignment
Three slope categories associated with no impact, slight impact, and significant impact on
passenger vehicle operating speeds are defined; such categories are also based on the alignment design
speed. The cumulative lengths or route segments with slopes falling within each category are presented as
part of the summary report. In the case study, the three categories of slope values for a design speed of 80
km/hr were taken to be below 5%, between 5-8%, and greater than 8%.
3.1.3.2. Total Length of Corridor
The total length of the alignment is calculated and presented in the summary, as part of the
evaluation criteria.
3.1.3.3. Slope Stability
For each station along the route alignment, a preliminary slope stability evaluation is provided.
The number of critical sections/stations is reported as follows:
Number of sections with Factors of Safety, F.S.<1.0
Number of sections with 1.0<F.S.<1.5
Number of sections with F.S.>1.5
This is simple, albeit very useful information at this stage. The cost of stabilization of potentially critical
slopes will affect the desirability of particular alignments (Sadek et al., 2000).

10
3.2. Operational Analysis
When selecting a preferred corridor alignment alternative, different operational scenarios can be
considered and require analysis and evaluation. As illustrated in Fig. 3.1, the various components related
to operational analysis are operating costs, revenues, environmental impacts, and overall system
performance.
3.2.1. Potential Corridor Operations
In addition to functioning as conventional highway corridors, many other operational options may
be identified and considered for the preferred alignment. Such options include: BRT (Bus Rapid Transit),
HOV (High-Occupancy Vehicles), Toll Road, HOT (High-Occupancy Toll), HRT (Heavy Rail Transit), or
LRT (Light Rail Transit). Moreover, a combination of operational options can also be considered (i.e.
highway with dedicated exclusive lanes for transit). Finally, conversion options may be considered, such
as start up and future upgrade operations (i.e. bus to rail, light rail to heavy rail).
3.2.2. Cost Components
In addition to the costs calculated in the alignment analysis, two types of costs are considered in
the operational analysis, which are capital costs and operational costs. Capital cost varies considerably
with the operational alternative and it includes the cost of possible vehicles (locomotives, buses, rolling
stocks), station maintenance and rehabilitation, and equipment. On the other hand, highways have no such
costs beyond pavement, and the operational costs consist of vehicle operating costs and other costs such as
road maintenance.
3.2.3. Revenue Components
Revenue can be either direct or indirect, where direct revenues are based on fares and tolls, while
indirect "revenues" are economic benefits that result from savings in travel time and vehicle operating
costs, potential commercial developments along the corridor and at stations, jobs created, and other factors
that impact the overall economy and may be evaluated in dollar terms. Therefore, ridership estimation is
very essential in evaluating revenues from operational scenarios on a defined corridor. Moreover, the
estimated ridership values are impacted by the alignment variation and can be considered when evaluating
different alignment alternatives. Therefore, a GIS-EMME/2 translator was developed to assist in modeling
different scenarios interactively between base maps in GIS and EMME/2 transportation demand modeling
software (Kaysi & Al-Naghi, 2002).

11
Moreover, the potential of freight transport can be considered as a major revenue component for
corridors where potential rail operations are being evaluated.
3.2.4. Environmental Components
The environmental criteria involved in evaluating operational alternatives are mainly related to
vehicular emissions, noise and vibrations impacts, and safety.
3.2.4.1. Air pollution
Annual mobile source emissions (in tons of SO2, CO, NO2, lead as well as greenhouse gas
emissions) for every alternative may be calculated and compared where the alternative that is rated least
desirable is the one showing the minimum reductions in emissions. When comparing rail technologies,
electric propulsion equipment are more environmentally friendly compared to diesel propulsion equipment
that cause air and noise pollution.
3.2.4.2. Noise and Vibrations Impacts
Both noise and vibration involve fluctuation in motion and are considered sensory effects that can
be measured in decibels. Evaluating noise impacts of any operational alternative is based on maintaining
an acceptable noise environment for the landuse of the affected areas, taking into account the unusual
noise characteristics resulting in human annoyance. In this regard, research was conducted for the Federal
Railroad Administration (FRA) to provide a standardized set of procedures for the noise and vibration
impacts on the human and natural environment (USDOT 1998).
3.2.4.3. Safety
Safety analysis is a complex issue and can be viewed in several different ways; however, it is
mainly related to accidents and crashes potentials. In fact, safety measures can be considered early in the
analysis of highway alignment alternatives where geometric design elements (slopes, sight distance and
intersections) are of high importance. While most of crashes are due to human error, some operational
options have higher risks than others. While quantitative assessments of the anticipated safety effects of
proposed alternatives may not be easily accomplished, a qualitative understanding of safety can be
incorporated in the evaluation framework.
For example, BRT systems are gaining popularity and are seen as an alternative to rail systems;
however, it has a number of safety concerns, especially when operating in city centers, where BRT has
increased risk of striking pedestrians and/or vehicles illegally using bus-only lanes, or at intersections.

12
3.2.5. Overall System Performance
This measure reflects the benefits achieved for the whole transportation system, such as the
connectivity between modes of transport, relief to existing network traffic with traffic being diverted from
existing congested corridors, shift of modes (auto to transit), as well as the reduction of energy
consumption and user travel time. For example, projects (such as mass transit) associated with an expected
decrease in highway traffic are more favorable than projects that are expected to attract more traffic (such
as roadway widening).
Moreover, the timeframe for implementation (schedule) is a key criterion for the comparison
between alternatives where system compatibility/conversion can allow phasing between different
operational scenarios (light rail to heavy rail, bus to rail).
3.3. Alignment Refinement
After selecting a preferred operational option for the identified alignment, a refinement to modify
the alignment layout may be required to comply with engineering specifications related to the selected
operational scenario, including but not limited to: geometric design (vertical and horizontal curves),
maximum speed, sight distance, and corridor right of way. All these parameters vary for every operational
type and technology choice. Eventually, the final alignment should be within an acceptable margin from
the preliminary evaluated alignment and is considered as part of the detailed final design and can be
checked against criteria set for the alignment analysis.
4 RANKING OF ALTERNATIVES
When considering evaluation of corridor alternatives, the proposed evaluation methodology is
divided into two stages, alignment analysis and operational analysis. The framework presented in this
study groups different factors according to their direct impact on operational scenarios or alignment
alternatives. Although this tends to simplify the evaluation process, the wide range of factors incorporated
in the analysis complicates the ranking of different alternatives. Therefore, a systematic and structured
analytic procedure AHP (Analytical Hierarchy Process) is used for this purpose. For the purpose of this
study, an educational version of Expert Choice is chosen for the AHP models used.
The AHP method supports an inductive-reasoning logic to consider particular specific alignment
and/or operational alternative in light of the general evaluation framework. First of all, the hierarchy is
structured from the top, through the intermediate levels, to the lowest level. Next a set of pair-wise
comparison matrices is constructed for each of the lower levels-one matrix for each element in the level
immediately above. Every element in the lower level affects every element in the upper level. The

13
elements in the lower level are compared to each other based on their effect on the governing element
above. This yields a square matrix of judgments. The pair-wise comparisons are done in terms of which
element dominates the other. This method would aid in deriving or modifying weights of each element to
reflect the conditions specific to locality on the general framework (Saaty 1990).
The Expert Choice software has been in existence since 1983 and is currently used by numerous
government and commercial organizations worldwide. In fact, it is based on the AHP and offers a
systematic framework, where the elements of the problem are laid out in a hierarchy, the judgments are
entered, and the priorities for action are derived. It engages decision makers in breaking down decisions
into smaller parts, proceeding from the goal to objectives to covering objectives and so on down to the
alternatives of action. In making the judgments, the elements of the problem are looked at in isolation, one
element compared against another with respect to a parent element. The decision maker then makes only
simple pair-wise comparison judgment throughout the hierarchy to derive the priorities of the elements.
Expert Choice then synthesizes all the judgments into a unified whole in which alternatives are clearly
prioritized from best to worst.
5 CASE STUDY: SOUTH MOUNTAIN HIGHWAY
The approach developed in this research could be used for any area/region for which the pertinent
data is available. This study begins by discussing the types of data needed for the proposed evaluation
methodology, and how these data are collected and represented within GIS. Moreover, a representative
case study located within the Beirut Metropolitan Region (BMR) is considered in this research.
Beirut is the demographic and economic center of Lebanon, and as such, the majority of transport
projects are concentrated in the BMR. The BMR is the largest urban center in Lebanon covering an area of
approximately 230 km2 (Fig. 2). It stretches along the coast for approximately 25 km and inland over the
adjacent hills and plateaus bounded by the 400m elevation contour to the East.

14
Fig. 2 Beirut Metropolitan Region (BMR)
5.1. Database Model
A digital model of the study area is the first step towards implementation of the proposed
evaluation framework. Therefore, a geographically referenced digital model of the Beirut Metropolitan
Region (BMR) was developed as a prototype example.
The base map includes the following data layers:
Administrative Boundaries
Traffic Analysis Zones
Road Network Plan
Rail Lines
Geology and Faults
Soil
Contour Lines
Rivers / Channels
Landuse / Land cover
Satellite Imagery

15
In this case study, an optimal new highway alignment is investigated. The South Mountain
Highway (SMH) is determined to serve as a conventional highway that extends from the Beirut peripheral
highway and is planned to connect the towns of Khalde and Damour in the BMR. Given the origin and
destination corresponding to the proposed highway, three alternative alignments were proposed and
overlaid over the BMR base map in GIS as shown in Fig. 3.
Fig. 3 Alignment alternatives for the South Mountain Highway
5.3.1. Alignment Analysis
Given the three proposed alignments centerlines, the GIS-based framework proposed in this study
was used to evaluate each alternative against a set of criteria including: cost, environmental issues, and
engineering considerations.
Cost Evaluation:

16
The total cost of each alternative alignment was calculated including land and building acquisition,
excavation and fill costs, road structures, road works and pavement. Land acquisition costs were evaluated
by intersecting 60 meter ROW buffer around each alignment alternative with landuse databases and the
intersected area was multiplied by the land value for each region. Building acquisition cost was done using
the satellite imagery to count the buildings lying within the expropriation buffer and then by computing its
surface area and multiply it by the number of floors. Building cost per square meter was assumed to vary
with landuse category; however, since no field data was available at this analysis stage, all buildings were
considered to be in good conditions, and the number of floors was estimated based on the building height
computed from the shadow length measured on the satellite image as in Fig. 4.
Fig. 4 Ikonos satellite imagery showing buildings shadows
The summary of the cost calculation for the alignment alternatives is presented in Table 1 with a
breakdown for each component.
Table 1 Cost components and total cost ($)

17
COMPONENTS A2 SMH A1
Buildings Acquisition 2,860,000 2,400,000 200,000
Land Acquisition (60 m ROW) 23,695,000 22,811,400 24,552,000
Property Acquisition Sub-TOTAL $26,555,000 $25,211,400 $24,752,000
Excavation + Fill 3,440,000 4,215,000 11,770,000
Additional Fill 380,000 0 5,420,000
Road Structures 1,350,000 1,350,000 1,800,000
Road Works + Pavement 15,186,780 15,967,980 17,186,400
TOTAL $46,911,780 $46,744,380 $60,928,400
Environmental Evaluation:
The only environmental criterion which was included in the assessment framework, for the purpose
of the case study presented, is based on noise impact and community disruption. Other considerations
such as air quality may be included in later applications by developing models which relate emissions to
vehicle speeds, vehicle characteristics, traffic volumes, and other factors, possibly in conjunction with
dispersion models. The extension of the assessment framework to include air quality criteria should be
made easier by the fact that most of the base-data needed is available or can be generated within the
described framework. The noise level contours were calculated using the U.S. Federal Highway
Administration’s Traffic Noise Model (FHWA TNM version 1.0). Based on route alignment
characteristics, traffic volumes, speeds, and vehicle type/classification, TNM calculates noise levels at
different input “receivers”. In order to calculate noise level contours, an appropriate number of virtual
receivers are positioned around the roadway. Man-made structures are automatically incorporated within
the model as barriers that lie between roadways and receivers and have the effect of reducing noise levels.
The relevant noise level ranges reported were taken as follows (Figure 5): less than 65 dB, 65 to 70 dB, 70
to 75 dB, 75 to 80 dB and greater than 80dB (Sadek et al. 2000). A tabulated breakdown of the results
noise category and corresponding number of impacted structures within the study area is listed in Table 2.
Community disruption was evaluated by counting the number of buildings lying within a 10 meter
buffer from the road edge. This was easily done using GIS buffering capabilities and the results were 1,
13, and for 12 for alternatives A1, A2 and SMH respectively.

18
Fig. 5 Results of the noise exposure analysis
Table 2 Number of structures impacted by noise
NOISE
LEVELS
Number of Impacted Structures
within Study Area
SMH-A2 SMH SMH-A1
< 65 dB
≥ 65 and < 70 dB
≥ 70 and < 75 dB
≥ 75 and < 80 dB
≥ 80 dB
0
13
668
855
106
0
21
71
10
15
1
4
66
4
0
TOTAL 1,642 117 75
19
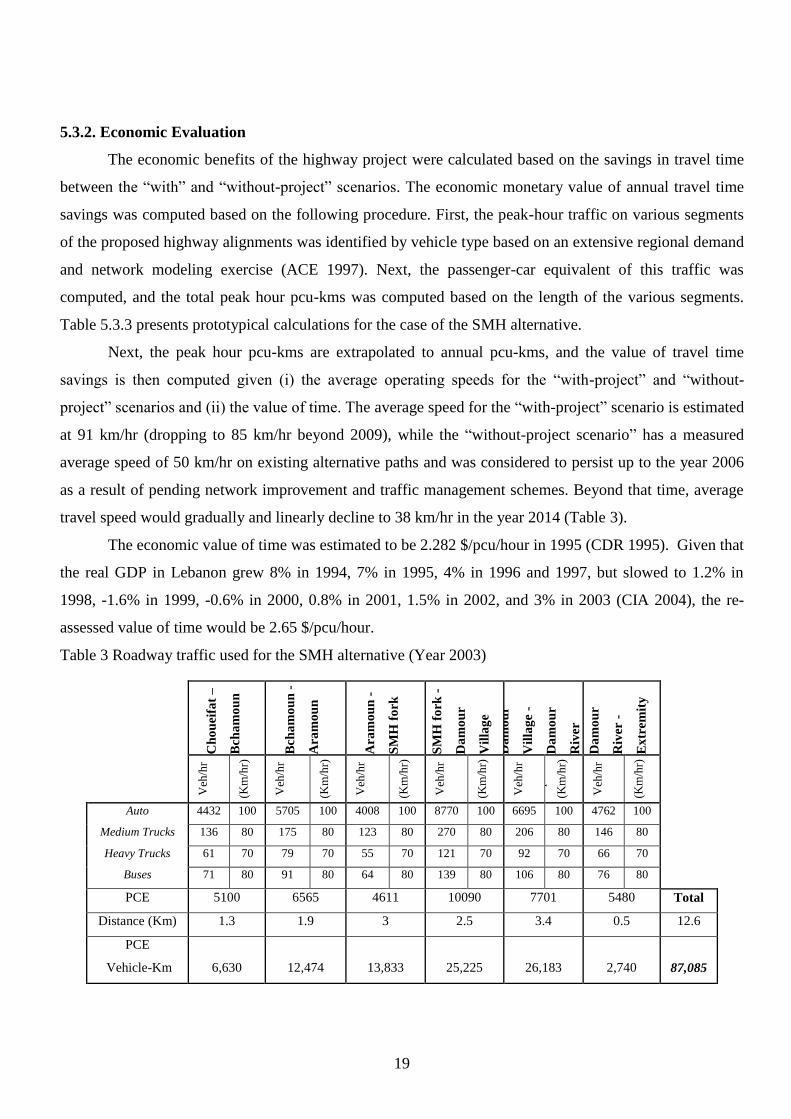
5.3.2. Economic Evaluation
The economic benefits of the highway project were calculated based on the savings in travel time
between the “with” and “without-project” scenarios. The economic monetary value of annual travel time
savings was computed based on the following procedure. First, the peak-hour traffic on various segments
of the proposed highway alignments was identified by vehicle type based on an extensive regional demand
and network modeling exercise (ACE 1997). Next, the passenger-car equivalent of this traffic was
computed, and the total peak hour pcu-kms was computed based on the length of the various segments.
Table 5.3.3 presents prototypical calculations for the case of the SMH alternative.
Next, the peak hour pcu-kms are extrapolated to annual pcu-kms, and the value of travel time
savings is then computed given (i) the average operating speeds for the “with-project” and “without-
project” scenarios and (ii) the value of time. The average speed for the “with-project” scenario is estimated
at 91 km/hr (dropping to 85 km/hr beyond 2009), while the “without-project scenario” has a measured
average speed of 50 km/hr on existing alternative paths and was considered to persist up to the year 2006
as a result of pending network improvement and traffic management schemes. Beyond that time, average
travel speed would gradually and linearly decline to 38 km/hr in the year 2014 (Table 3).
The economic value of time was estimated to be 2.282 $/pcu/hour in 1995 (CDR 1995). Given that
the real GDP in Lebanon grew 8% in 1994, 7% in 1995, 4% in 1996 and 1997, but slowed to 1.2% in
1998, -1.6% in 1999, -0.6% in 2000, 0.8% in 2001, 1.5% in 2002, and 3% in 2003 (CIA 2004), the re-
assessed value of time would be 2.65 $/pcu/hour.
Table 3 Roadway traffic used for the SMH alternative (Year 2003)
Ch
ou
eifa
t –
Bch
am
ou
n
Bch
am
ou
n -
Ara
mo
un
Ara
mo
un
-
SM
H f
ork
SM
H f
ork
-
Da
mo
ur
Vil
lag
e
Da
mo
ur
Vil
lag
e -
Da
mo
ur
Riv
er
Da
mo
ur
Riv
er -
Ex
trem
ity
Veh
/hr
Sp
eed
(Km
/hr)
Veh
/hr
Sp
eed
(Km
/hr)
Veh
/hr
Sp
eed
(Km
/hr)
Veh
/hr
Sp
eed
(Km
/hr)
Veh
/hr
Sp
eed
(Km
/hr)
Veh
/hr
Sp
eed
(Km
/hr)
Auto 4432 100 5705 100 4008 100 8770 100 6695 100 4762 100
Medium Trucks 136 80 175 80 123 80 270 80 206 80 146 80
Heavy Trucks 61 70 79 70 55 70 121 70 92 70 66 70
Buses 71 80 91 80 64 80 139 80 106 80 76 80
PCE 5100 6565 4611 10090 7701 5480 Total
Distance (Km) 1.3 1.9 3 2.5 3.4 0.5 12.6
PCE
Vehicle-Km 6,630 12,474 13,833 25,225 26,183 2,740 87,085

20
Finally, the Internal Rate of Return (IRR) value is computed based on the annual cost/benefit
streams for the project horizon (year 2014). For the SMH alternative, the computed IRR value is 14%,
representing a good rate of return in the context of similar infrastructure projects. The resulting economic
feasibility for the other alternatives, A1, and A2 were IRR =10% and 13% respectively.
5.3.3. Alternatives Ranking Using AHP
Unlike the internal rate of return ranking methodology that only reflects the economic evaluation,
the application of the proposed AHP methodology with a selected set of evaluation criteria from both
alignment and operational analysis considers: costs, environmental, and engineering components. A sub-
tree showing the combination of criteria used for the evaluation of the three proposed alignments operating
as highways is illustrated in Fig. 6 below.
Fig. 6 A sub-tree of the evaluation hierarchy used
The GIS-based evaluation methodology described in this study for the selected criteria in the sub-tree was
applied and Table 4 summarizes on the findings for the relevant evaluation criteria.

21
Table 4 Summary of the reports of various assessment criteria
CRITERIA SMH-A2 SMH SMH-A1
Community Disruption:
Number of structures within road width + 10m
13
12
1
Noise:
Number of structures within study area with noise level ≥ 65
dB 1,642 117 75
Geometric Design Issues :
No. of horizontal curves with radii < 200m
Cumulative length of route segments
0-5% slope
5-8% slope
>8%
Total route length
6
12053m
0
0
12053m
7
11405m
1268 m
-
12673 m
7
8030m
4182 m
1428 m
13640m
Earthworks / Geotechnical:
Slope Stability
# of sections with FS<1.0
# of sections 1.0<FS<1.5
Cut and Fill
Cumulative Cut Volume
Cumulative Fill Volume
Potential # of Road Structures
0
0
3.06x10⁶ m
3
3.82x10⁶ m
3
9
0
0
4.38x10⁶ m
3
4.05x10⁶ m
3
9
8
11
6.35x10⁶ m
3
17.19x10⁶ m
3
12
.
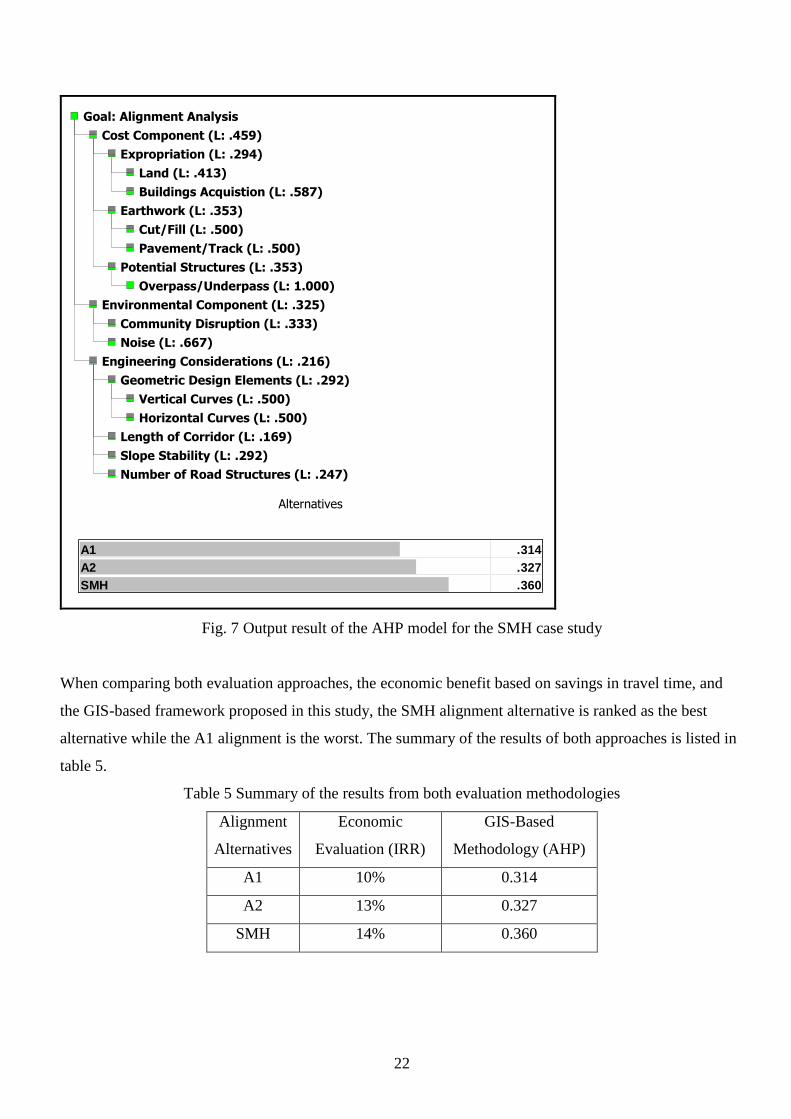
The results tabulated in Table 4 were input into the AHP model in Expert Choice and the results
are presented in Fig. 7. The SMH alternative is identified as the best alternative.
22
Model Name: AHP_Alignment_cs2
Treeview
Goal: Alignment Analysis
Cost Component (L: .459)
Expropriation (L: .294)
Land (L: .413)
Buildings Acquistion (L: .587)
Earthwork (L: .353)
Cut/Fill (L: .500)
Pavement/Track (L: .500)
Potential Structures (L: .353)
Overpass/Underpass (L: 1.000)
Environmental Component (L: .325)
Community Disruption (L: .333)
Noise (L: .667)
Engineering Considerations (L: .216)
Geometric Design Elements (L: .292)
Vertical Curves (L: .500)
Horizontal Curves (L: .500)
Length of Corridor (L: .169)
Slope Stability (L: .292)
Number of Road Structures (L: .247)
Alternatives
A1
.314
A2
.327
SMH
.360
* Ideal mode
Page 1 of 111/02/2005 05:06:23 Õ
Hani Al-NaghiHani Al-Naghi
Fig. 7 Output result of the AHP model for the SMH case study
When comparing both evaluation approaches, the economic benefit based on savings in travel time, and
the GIS-based framework proposed in this study, the SMH alignment alternative is ranked as the best
alternative while the A1 alignment is the worst. The summary of the results of both approaches is listed in
table 5.
Table 5 Summary of the results from both evaluation methodologies
Alignment
Alternatives
Economic
Evaluation (IRR)
GIS-Based
Methodology (AHP)
A1 10% 0.314
A2 13% 0.327
SMH 14% 0.360

23
The results are similar since both SMH and A2 are of approximately similar costs and are 25% less than
the cost of the A1 alternative, which is longer in length, has more slope instability occurrences, and
requires more road structures. In terms of environmental issues, the A2 alternative is the worst in both
noise levels and community disruption. Therefore, when considering the economic evaluation approach,
A2 and SMH had high IRR values of 13% and 14%, respectively. When engineering and environmental
issues incorporated in the evaluation using the GIS-based approach, A1 and the SMH alternatives are
ranked as the highest priority, with A1 being more suitable on environmental issues, while the SMH is
more suitable on engineering considerations. Since cost is the dominant objective, the SMH will have the
highest priority.
Fig. 8 presents the Performance Sensitivity graph displaying how the alternatives perform with
respect to all objectives as well as overall. The "left y-axis" shows each objective's priority, while the
"right y-axis" shows the alternative priorities with respect to each objective. As shown in Fig. 5.27, the
SMH alternative is the most preferable alternative while the A2 alternative competes with A1 on cost and
engineering considerations, while A1 competes on environmental considerations.
Fig. 8 Performance Sensitivity Graph.
Finally, the Gradient Sensitivity graphs presented in Figs 9 to 11 show the alternatives' priorities
with respect to one objective at a time. These figures indicate "key tradeoffs" when two or more
alternatives intersect each other.

24
Fig. 9 Sensitivity with respect to priority of “Cost Component”
Fig. 9 indicates that when the priority of cost decreases below 0.4 the A1 alternative would become
preferable to the A2 alternative; however, the SMH would remain the most preferable alternative as long
as the cost priority is less than 0.8. On the other hand, Fig. 10 indicates that as long as the priority of the
environmental component is between 0.2 and 0.5 the SMH will remain the most preferable alternative.
Should the priority of the environmental component, reflecting noise exposure levels in this case study,
exceed 0.5 then alternative A1 will be preferred. Fig. 11 shows that the SMH alternative is the most
preferable for all priority values below 0.58 for engineering considerations.

25
Fig. 10 Sensitivity with respect to priority of “Environmental Component”
Fig. 11 Sensitivity with respect to priority of “Engineering Considerations”

26
6 Summary and Conclusions
This study aimed to incorporate a range of evaluation criteria into a structured GIS-based
framework for corridor planning and analysis. The organization of evaluation components was based on
two relatively independent levels, alignment and operational analysis. With a wide spectrum of evaluation
factors incorporated in the developed framework, identifying the best alternative becomes a complex
problem; in this regard a decision support approach (Analytic Hierarchy Process) was used to structure the
multi-criteria evaluation task and to provide a tool for ranking various alternatives.
The developed evaluation framework was simplified and organized in two phases, by separating
corridor alignment analysis from operational options. Therefore, it considers the corridor alignment
analysis as the primary concern regardless of the operational scenario, and by focusing on criteria that are
more related to alignment issues. In cases when the operational mode is previously decided upon, the
alignments alternatives analysis can be limited to the evaluation criteria considered in the phase one of the
developed framework. However, a comprehensive evaluation framework integrating all criteria still needs
to be considered in the numerous cases where alignment analysis cannot be conducted in isolation of
operational scenarios. Therefore, the developed framework can be upgraded to provide feedback between
the two levels of evaluation and to consider different combinations where different alignments alternatives
are evaluated against different operational options.

27
REFERENCES
Bailey, K. & Brumm, J. & Grossardt, T. 2001. Towards Structured Public Involvement in Highway
Design: A Comparative Study of Visualization Methods and Preference Modeling using CAVE
(Casewise Visual Evaluation), Journal of Geographic Information and Decision Analysis, Vol. 5,
No. 1, pp. 1-15.
Banai, R. 2000. Transit Station Area Land Use/Site Assessment with Multiple Criteria: An Integrated GIS-
Expert System Prototype, Journal of Public Transportation, vol.3, no. 1.
Bedran, M. 1997. A Geographically Referenced Model of the Beirut Metropolitan Region (BMR)
Incorporating Pertinent Geotechnical Properties. MS Thesis, Dept. of Civ. and Env. Engrg.,
American University of Beirut, Beirut, Lebanon.
Dixon, K. & Sarasua, W. & Mazur, G. 2001. A GIS Based Tool for Rural Multimodal Transportation
Planning, TRB Paper: 01-2680.
Mazur, G. Dixon, K. and Sarasua, W. 2002. Statewide Planning Tool To Support Multimodal Decision-
Making, Eighth TRB Conference on the Application of Transportation Planning Methods, TRB.
Green, C. & Aberman, L. & Dominik, T. 2001. Sustainable Corridors: Methodology for their Planning
and Development, CSIR, Contract report No. CR-2001/48, Durban Unicity.
Hui, A. & Liew, S. & Kwoh, L. & Lim, H. 2000. Extraction and Utilization of Geometrical and
Contextual Information in very High Resolution IKONOS Satellite Imagery, GISdevelopment.net.
Jha, M. & Schonfeld, P. 2004. A highway alignment optimization model using geographic information
systems, Transportation Research Part A: Policy and Practice, Vol. 38 No. 6, Elsevier Ltd.
Kaysi, I. & Al-Naghi, H. 2002. A GIS-Based Translator for Multimodal Transportation Planning Software
EMME/2, ICCCBE, Taipei, Taiwan.
Kaysi, I. & Kanaan, A. 2001. Structuring Feasibility Assessment of Toll Highways: The Case of the New
Batinah Expressway in Oman, 9th
World Conference on Transportation Research, Seoul – Korea.
Krajewski, L. & Ritzman, L. 1998. Operations Management, 5th
Ed., Addison-Wesley.
Saaty, T. 2001. Decision Making for Leaders: The Analytic Hierarchy Process for Decisions in a Complex
World, Analytic Hierarchy Process Series, Vol. 2.
Sadek, S. & Kaysi, I. & Bedran, M. 2000. Geotechnical and Environmental considerations in highway
layouts: an Integrated GIS Assessment Approach, Journal of Applied Earth Observations &
Geoinformation, Vol. 2, No. 3/4.
Turochy, R., 2001. Prioritizing Proposed Transportation Improvements: Methods, Evaluation and
Research Needs, Transportation Research Record No. 1777, TRB.