7 Annexes - Amber Rail Freight Corridor
260
139 7 Annexes 7.1 Memorandum of Understanding of establishing of ExBo for RFC Amber 7.2 Memorandum of Understanding of establishing of MaBo for RFC Amber 7.3 Framework for Capacity Allocation 7.4 Letter of Intent concerning the establishment of Advisory Groups for RFC Amber 7.5 Advisory Group Rules of Consultation for RFC Amber 7.6 Transport Market Study for RFC Amber 7.7 The description of the KPIs for RFC Amber 7.8 Process descriptions for Corridor-OSS (C-OSS contract annex 2) for RFC Amber
-
Upload
khangminh22 -
Category
Documents
-
view
3 -
download
0
Transcript of 7 Annexes - Amber Rail Freight Corridor
139
7 Annexes
7.1 Memorandum of Understanding of establishing of ExBo for RFC Amber
7.2 Memorandum of Understanding of establishing of MaBo for RFC Amber
7.3 Framework for Capacity Allocation
7.4 Letter of Intent concerning the establishment of Advisory Groups for RFC Amber
7.5 Advisory Group Rules of Consultation for RFC Amber
7.6 Transport Market Study for RFC Amber
7.7 The description of the KPIs for RFC Amber
7.8 Process descriptions for Corridor-OSS (C-OSS contract annex 2) for RFC Amber


1
Decision of the Executive Board of Amber Rail Freight Corridor
adopting the Framework for capacity allocation
on the Rail Freight Corridor
(updated harmonised framework capacity allocation, elaborated by the Network of Executive
Boards, version 31.10.2018, adopted on 19th November 2018)

2
Having regard to
• Regulation (EU) No 913/2010 of the European Parliament and of the Council and in
particular Article 14 thereof;
• Directive 2012/34/EU of the European Parliament and of the Council and in particular
Chapter IV (Section 3) thereof;
Whereas:
• Directive 2012/34/EU provides the general conditions and objectives of infrastructure
capacity allocation;
• Article 14 of Regulation (EU) No 913/2010 provides the particular conditions
applicable in the context of rail freight corridors;
• Article 14(1) of Regulation (EU) No 913/2010 requires the Executive Board to define
the framework for the allocation of infrastructure capacity on the rail freight corridor;
• Articles 14(2) to (10) of Regulation (EU) No 913/2010 establish the procedures to be followed by the Management Board, Infrastructure Managers and Allocation Bodies,
with reference to the general rules contained in Directive 2012/34/EU;
• The Executive Board invites the Management Board to cooperate with the other Management Boards in order to harmonise as far as possible the time limit mentioned
in Article 14(5) of Regulation (EU) No 913/2010;
• The Executive Board invites the Management Board to cooperate with the relevant
stakeholders in order to harmonise the conditions for capacity allocated but ultimately
not used, taking into account Article 14(7) of Regulation (EU) No 913/2010.
Acting in accordance with its internal rules of procedure,
THE EXECUTIVE BOARD HAS ADOPTED THIS DECISION:

3
Chapter I
PURPOSE, SCOPE AND CHARACTER OF THE FRAMEWORK
Article 1
1. This framework for the allocation of infrastructure capacity on the rail freight corridor
(“Corridor Framework”) concerns the allocation of pre-arranged paths as defined according
to Article 14(3) of Regulation (EU) No 913/2010 (“the Regulation”), and of reserve capacity
as defined according to Article 14(5) of the Regulation, displayed by the Corridor One-
Stop-Shop (“C-OSS”) for freight trains crossing at least one border on a rail freight corridor.
It describes the key activities of the C-OSS and Management Board in this respect, and also
identifies the responsibilities of the Regulatory Bodies in accordance with Article 20 of the
Regulation.
2. The scope of application of the Corridor Framework is the railway network defined in the
rail freight corridor implementation plan where principal, diversionary and connecting lines
are designated.
3. The Executive Board may decide to allow specific rules within this Corridor Framework
for networks which are applying the provisions permitted in accordance with Article 2(6)
of Directive 2012/34/EU.
4. In addition, specific rules and terms on capacity allocation may be applicable on parts of
the rail freight corridor for the timetable periods 2020 to 2024. These rules and terms are
described and defined in Annex 4.
Article 2
The document to be published by the Management Board in accordance with Article 18 of the
Regulation – hereinafter referred to as the Corridor Information Document (“CID”) – shall
reflect the processes in this Corridor Framework.
Chapter II
PRINCIPLES FOR THE OFFER OF PRE-ARRANGED PATHS AND RESERVE
CAPACITY
Article 3
1. The offer displayed by the C-OSS contains pre-arranged paths and reserve capacity. The
pre-arranged paths and reserve capacity are jointly defined and organised by the IMs/ABs
in accordance with Article 14 of the Regulation. In addition, they shall take into account as
appropriate:
− recommendations from the C-OSS based on its experience;
− customer feedback concerning previous years (e.g. received from the Railway Undertaking Advisory Group);
− customer expectations and forecast (e.g. received from the Railway Undertaking
Advisory Group);
- results from the annual users satisfaction survey of the rail freight corridor;
− findings of any investigation conducted by the Regulatory Body in the previous
year;

4
2. The infrastructure managers and allocation bodies (IMs/ABs shall ensure that the pre-
arranged path catalogue and reserve capacity are appropriately published. Before
publication of the pre-arranged path catalogue and reserve capacity, the Management Board
shall inform the Executive Board about the offer and its preparation.
3. Upon request of the Regulatory Bodies and in accordance with Articles 20(3) and 20(6) of
the Regulation, IMs/ABs shall provide all relevant information allowing Regulatory Bodies
to assess the non-discriminatory designation and offer of pre-arranged paths and reserve
capacity and the rules applying to them.
Article 4
1. The pre-arranged paths shall be handed over to the C-OSS for exclusive management at the
latest by X-111, and reserve capacity at the latest by X-2. The Management Board is required
to decide whether, and if so to what extent, unused pre-arranged paths are to be returned by
the C-OSS to the relevant IMs/ABs at X-7.5 or kept by the C-OSS after X-7.5 in order to accept late requests, taking into account the need for sufficient reserve capacity. The
Management Board shall publish in the CID the principles on which it will base its decision.
Article 5
1. The pre-arranged paths managed by the C-OSS for allocation in the annual timetable and
the reserve capacity are dedicated solely to the rail freight corridor. Therefore, it is essential
that the displayed dedicated capacity is protected between its publication in the pre-arranged
path catalogue and the allocation decision by the C-OSS at X-7.5 against unilateral
modification by the IMs/ABs.
2. Following the allocation decision by the C-OSS at X-7.5, an IM/AB and an applicant may
agree to minor modifications of the allocated capacity that do not impact the results of the
allocation decision. In that case, the modified capacity shall have the same level of
protection as that applied to the original capacity.
Article 6
1. Certain pre-arranged paths may be designated by the Management Board for the application
of the network pre-arranged path priority rule “Network PaP rule” (defined in Annex 1)
aimed at better matching traffic demand and best use of available capacity, especially for
capacity requests involving more than one rail freight corridor. The Network PaP rule may
apply to pre-arranged path sections linked together within one single or across several rail
freight corridors. These sections are designated to promote the optimal use of infrastructure
capacity available on rail freight corridors. A pre-arranged path on which the Network PaP
rule applies is called “Network PaP”.
2. The designation of Network PaPs, in terms of origin and destination and quantity should
take into account the following as appropriate:
− scarcity of capacity;
− the number and characteristics of conflicting requests as observed in previous years;
− number of requests involving more than one rail freight corridor as observed in
previous years;
1 X indicates the date of the timetable change; figures refer to months. Therefore X-11 is 11 months before the
timetable change etc.

5
− number of requests not satisfied, etc. as observed in previous years.
3. Explanations for the designation of Network PaPs, the rail freight corridor sections to be
covered by Network PaPs and an indicative share of Network PaPs as a proportion of all
pre-arranged paths offered on the rail freight corridor shall be published in the CID.
4. Where Network PaPs relate to more than one rail freight corridor, the Management Board
shall cooperate with the Management Board(s) of the other relevant rail freight corridor(s)
to engage the IMs/ABs in the designation process. If one rail freight corridor identifies a
need for Network PaPs on several rail freight corridors, the other rail freight corridor(s)
involved should if possible meet the request. These Network PaPs can only be designated
if the Management Boards of all relevant rail freight corridors agree.
Chapter III
PRINCIPLES OF ALLOCATION OF PRE-ARRANGED PATHS AND RESERVE
CAPACITY
Article 7
1. The decision on the allocation of pre-arranged paths and reserve capacity on the rail freight
corridor shall be taken by the C-OSS, in accordance with Article 13 of the Regulation.
The activities under the timetabling processes concerning pre-arranged paths and reserve
capacity are set out in Annex 2.
III-A GENERAL PRINCIPLES RELATED TO THE FUNCTIONING OF THE C-OSS
Article 8
1. The CID to be published by the Management Board shall describe at least the competences,
the form of organisation, the responsibilities vis-à-vis applicants and the mode of
functioning of the C-OSS and its conditions of use.
2. The corridor capacity shall be published and allocated via an international path request
coordination system, which is as far as possible harmonised with the other rail freight
corridors.
III-B PRINCIPLES OF ALLOCATION
Article 9
1. The C-OSS is responsible for the allocation of pre-arranged paths and reserve capacity on
its own rail freight corridor.
2. An applicant requesting pre-arranged paths or reserve capacity covering more than one rail
freight corridor may select one C-OSS to act as a single point of contact to co-ordinate its
request, but that C-OSS remains responsible for the allocation of capacity on its own rail
freight corridor only.
3. Where the same pre-arranged paths are jointly offered by more than one rail freight corridor,
the Management Board shall coordinate with the other Management Board(s) concerned to
designate the C-OSS responsible for allocating those paths and publish this in the CID.

6
Article 10
1. After receipt of all path requests for pre-arranged paths at X-8 (standard deadline for
submitting path requests for the annual timetable) the C-OSS shall decide on the - allocation
of pre-arranged paths by X-7.5 and indicate the allocation in the path register accordingly.
2. Requests for pre-arranged paths that cannot be met pursuant to Article 13(3) of the
Regulation and that are forwarded to the competent IMs / ABs in accordance with Article
13(4) are to be considered by IMs/ABs as having been submitted before the X-8 deadline.
The IMs/ABs shall take their decision and inform the C-OSS within the timescales set out
in Annex VII of Directive 2012/34/EU and described in Annex 2 of this Corridor
Framework. The C-OSS shall complete the processing of the request and inform the
applicant of the decision as soon as possible after receiving the decision from the competent
IMs/ABs.
3. The Management Board is invited to decide the deadline for submitting requests for reserve
capacity to the C-OSS in a harmonised way at 30 days before the running date.
4. Without prejudice to Article 48(1) of Directive 2012/34/EU, the C-OSS shall endeavour to
provide a first response to requests for reserve capacity within five calendar days of
receiving the path request.
III-C PRINCIPLES OF FAIRNESS AND INDEPENDENCE
Article 11
1. The C-OSS shall respect the commercial confidentiality of information provided to it.
2. In the context of the rail freight corridor, and consequently from the point of view of
international cooperation, C-OSS staff shall, within their mandate, work independently of
their IMs/ABs in taking allocation decisions for pre-arranged paths and reserve capacity on
a rail freight corridor. However, the C-OSS staff should work with the IMs/ABs for the
purpose of coordinating the allocation of pre-arranged paths and reserve capacity with the
allocation of feeder/outflow national paths.
III-D PRIORITIES TO BE APPLIED BY THE C-OSS IN CASE OF
CONFLICTING REQUESTS
Article 12
1. In the event of conflicting requests, the C-OSS may seek resolution through consultation
as a first step, if the following criteria are met:
- The conflict is only on a single rail freight corridor;
- Suitable alternative pre-arranged paths are available.
2. Where consultation is undertaken, the C-OSS shall address the applicants and propose a
solution. If the applicants agree to the proposed solution, the consultation process ends.
3. If for any reason the consultation process does not lead to an agreement between all
parties by X-7.5 the priority rules described in Annex 1 apply.
Article 13

7
1. Where consultation under Article 12 is not undertaken, the C-OSS shall apply the priority
rules and the process described in Annex 1 immediately.
2. The priority rules concern only pre-arranged paths and are applied only between X-8 and
X-7.5 in the event of conflicting applications.
3. Once the allocation decision is made for requests received by X-8, the C-OSS shall propose
suitable alternative pre-arranged paths, if available, to the applicant(s) with the lower
priority ratings or, in the absence of suitable alternative pre-arranged paths, shall without
any delay forward the requests to the competent IMs/ABs in accordance with Article 13(4)
of the Regulation. These path requests are to be considered by IMs/ABs as having been
submitted before the X-8 deadline.
4. Experience of the conflict resolution process should be assessed by the Management Board
and taken into consideration for the pre-arranged path planning process in following
timetable periods, in order to reduce the number of conflicts in following years.
Article 14
With regard to requests placed after X-8, the principle “first come, first served” shall apply.
Chapter IV
APPLICANTS
Article 15
1. An applicant may apply directly to the C-OSS for the allocation of pre-arranged paths or
reserve capacity.
2. Applicants shall accept the rail freight corridor’s general terms and conditions as laid down
in the CID in order to place requests for pre-arranged path and reserve capacity. A copy of
these general terms and conditions shall be provided free of charge upon request. The
applicant shall confirm that:
− it accepts the conditions relating to the procedures of allocation as described in the CID,
− it is able to place path requests via the system referred to in Article 8,
− it is able to provide all data required for the path requests.
The conditions shall be non-discriminatory and transparent.
3. The allocation of pre-arranged paths and reserve capacity by the C-OSS to an applicant is
without prejudice to the national administrative provisions for the use of capacity.
4. Once the pre-arranged path/reserve capacity is allocated by the C-OSS, the applicant shall
appoint the railway undertaking(s) which will use the train path/reserve capacity on its
behalf and shall inform the C-OSS and the IMs / ABs accordingly. If this appointment is
not provided by the applicant by 30 days before the running day at the latest, regardless of
whether it is a prearranged path or reserve capacity, the allocated path shall be considered
as cancelled.
5. The CID shall describe the rights and obligations of applicants vis-à-vis the C-OSS, in
particular where no undertaking has yet been appointed.

8
Chapter V
REGULATORY CONTROL
Article 16
1. The application of this Corridor Framework on the annual allocation of capacity shall be
subject to the control of the Regulatory Bodies.
2. Article 20 of the Regulation requires the relevant Regulatory Body in each rail freight
corridor to collaborate with other relevant Regulatory Bodies. The Executive Board invites
the Regulatory Bodies involved on the corridor to set out the way in which they intend to
cooperate on regulatory control of the C-OSS, by developing and publishing a cooperation
agreement defining how complaints regarding the allocation process of the C- OSS are to
be filed and how decisions following a complaint are to be taken. The Executive Board also
invites the Regulatory Bodies to set out the procedures they envisage for co-operation across
rail freight corridors.
3. Where a cooperation agreement has been developed and published, the CID should provide
a link to it.
Chapter VI
FINAL PROVISIONS
Article 17
The Management Board shall inform the Executive Board on an annual basis, using the
indicators identified in Annex 3, of the quantitative and qualitative development of pre-
arranged paths and reserve capacity, in accordance with Article 9(1)c and 19(2) of the
Regulation. On this basis, the Executive Board shall evaluate the functioning of the Corridor
Framework annually and exchange the findings with the other rail freight corridors applying
this Corridor Framework. The Regulatory Bodies may inform the Executive Board of their
own observations on the monitoring of the relevant freight corridor.
Article 18
1. The Executive Board has taken this Decision on the basis of mutual consent of the
representatives of the authorities of all its participating States, in accordance with the
provisions of Article 14(1) of the Regulation. This Decision is legally binding on its
addressees and shall be published.
2. This Corridor Framework replaces any previous Corridor Framework. It shall come into
force on 14 December 2019 for the timetable period 2020.
3. Changes to this Corridor Framework can be made but only after consultation with the
Management Board and with all rail freight corridors’ Executive Boards and Regulatory
Bodies.
Article 19
1. The priority rule and the process described in Annex 1, which are based on frequency and
distance criteria, shall be evaluated by the rail freight corridor at the latest in the second half
of 2021. This evaluation shall be based on a general assessment undertaken by the rail
freight corridor taking into account its experience in terms of allocation. The evaluation

9
shall also take into account the experiences from the specific rules and terms as referred to
in Article 1(4).
2. In accordance with the results of the evaluation of the priority rule, as described above, any potential modification would take effect for the timetable period 2023 and onwards.
Article 20
A reference to this Corridor Framework will be included in the CID and in the network
statements of the IMs/ABs.
Article 21
This Decision is addressed to the IMs/ABs and the Management Board of the rail freight
corridor.
Approved by the Executive Board of Amber Rail Freight Corridor with mutual consent, decision
entering into force 14th December 2018

10
ANNEXES
1. Description of the priority rule at X-8 in the event of conflicting requests for pre-arranged
paths
2. Activities within the timetabling processes concerning pre-arranged paths and reserve
capacity
3. Evaluation of the allocation process.
4. Specific rules and terms on capacity allocation applicable on parts of the rail freight
corridor according to Art. 1(4)

11
ANNEX 1
Description of the priority rule at X-8 in the event of conflicting requests for pre- arranged
paths.
For the purpose of this Annex, a request comprises a train run from origin to destination,
including sections on one or more rail freight corridors as well as feeder and/or outflow paths,
on all of its running days. In certain cases, which are due to technical limitations of the IT
system used, a request may have to be submitted in the form of more than one dossier. These
cases must be described in the CID.
If no “Network PaP” is involved in the conflicting requests
The priority is calculated according to this formula:
K = (LPAP + LF/O ) x YRD
LPAP = Total requested length of all PaP sections on all involved RFCs included in one request.
LF/O = Total requested length of the feeder/outflow path(s) included in one request; for the sake
of practicality, is assumed to be the distance as the crow flies.
YRD = Number of requested running days for the timetable period. A running day will only be
taken into account for the priority calculation if it refers to a date with a published PaP offer for
the given section.
K = The rate for priority
All lengths are counted in kilometres.
The method of applying this formula is:
in a first step the priority value (K) is calculated using only the total requested length of pre-
arranged path (LPAP) multiplied by the Number of requested running days (YRD);
− if the requests cannot be separated in this way, the priority value (K) is calculated using
the total length of the complete paths (LPAP + LF/O) multiplied by the number of
requested running days (YRD) in order to separate the requests;
− if the requests cannot be separated in this way, a random selection is used to separate
the requests. This random selection shall be defined in the CID.
If a “Network PaP” is involved in at least one of the conflicting requests:
■ If the conflict is not on a “Network PaP”, the priority rule described above applies
■ If the conflict is on a “Network PaP”, the priority is calculated according to the following
formula:

12
K = (LNetPAP + LOther PAP + LF/O ) x YRD
K = Priority value
LNetPAP = Total requested length (in kilometres) of the PaP defined as “Network PaP” on either
RFC included in one request.
LOther PAP = Total requested length (in kilometres) of the PaP (not defined as “Network PaP”)
on either RFC included in one request.
LF/O = Total requested length of the feeder/outflow path(s) included in one request; for the sake
of practicality, is assumed to be the distance as the crow flies.
YRD = Number of requested running days for the timetable period. A running day will only be
taken into account for the priority calculation if it refers to a date with a published PaP offer for
the given section.
The method of applying this formula is:
- in a first step the priority value (K) is calculated using only the total requested length of
the “Network PaP” (LNetPAP) multiplied by the Number of requested running days (YRD)
- if the requests cannot be separated in this way, the priority value (K) is calculated using
the total length of all requested “Network PaP” sections and other PaP sections (LNetPAP
+ LOther PAP) multiplied by the Number of requested running days (YRD) in order to
separate the requests
- if the requests cannot be separated in this way, the priority value (K) is calculated using
the total length of the complete paths (LNetPAP + LOther PAP + LF/O) multiplied by the Number of requested running days (YRD) in order to separate the requests
If the requests cannot be separated in this way, a random selection is used to separate the
requests. This random selection shall be defined in the CID.

13
ANNEX 2
Activities under the timetabling processes concerning pre-arranged paths and reserve
capacity.
Date/period
Activity
X-19 – X-16 Preparation phase
X-16 – X-12 Construction phase
X-12 – X-11 Approval and publication
X-11 Publication of pre-arranged paths provided by the IMs/ABs and identification
among them of the designated Network PaPs
X-11 – X-8 Application for the Annual Timetable
X-8 Deadline for submitting path requests
X-8 – X-7.5 Pre-booking phase
X-7.5 Forwarding requests with “flexible approaches” (e.g. Feeder/Outflow)
“special treatments” and requests where the applicant has neither received the
requested pre-arranged path nor accepted – if applicable – an appropriate
alternative pre-arranged path to IMs/ABs
X-7.5 Possible return of some remaining (unused) pre-arranged paths to the
competent IMs/ABs – based on the decision of the rail freight corridor
Management Board – for use during the elaboration of the annual timetable
by the IMs/ABs
X-7.5 – X-5.5 Path construction phase for the “flexible approaches”
X-5.5 Finalisation of path construction for requested “flexible approaches” by the
IMs/ABs and delivering of the results to C-OSS for information and
development of the draft timetable
X-5 Publication of the draft timetable for pre-arranged paths – including sections
provided by the IMs/ABs for requested “flexible approaches” by the C-OSS -
and for tailor-made alternatives in case the applicant has neither received the
requested pre-arranged path nor accepted – if applicable – an appropriate
alternative pre-arranged path
X-5 – X-4 Observations from applicants
X-4 – X-3.5 Post-processing and final allocation
X-7,5 – X-2 Late path request application phase
X-4 – X-1 Late path request allocation phase
X-4 – X-2 Planning (production) reserve capacity for ad-hoc traffic
X-2 Publication reserve capacity for ad-hoc traffic
X-2 – X+12 Application and allocation phase for ad hoc path requests
X+12 – X+15 Evaluation phase

14
ANNEX 3
Evaluation of the allocation process
The process of capacity allocation on the rail freight corridor shall be evaluated throughout the
allocation process, with a focus on continuous improvement of the working of the C-OSS. The
evaluation shall take place after the major deadlines:
X-11: Publication of PaPs
X- 8: Deadline for submitting path requests in the annual timetabling process
X-7.5: Deadline for treatment of PaP requests for the annual timetable by the C-OSS
X-2: Publication of reserve capacity for ad-hoc traffic
The evaluation shall be undertaken by the Management Board. Furthermore, the Management
Board shall compile an annual evaluation report which includes recommendations for
improvements of the capacity allocation process. The Annual report shall be addressed to the
Executive Board.
The results of the monitoring shall be published by the Management Board, and to be included
in the reporting as referred to in Article 19 of the Regulation.
The following basic indicators shall at least be evaluated using the methodology outlined
below:
Indicator Calculation formula Timing
Volume of offered
capacity
Km*days offered At X-11 and X-2
Volume of
requested capacity
Km*days requested At X-8
Volume of
requests
Number of requests At X-8
Volume of
capacity (pre-
booking phase)
Km*days -(pre-booking
phase)
At X-7.5
Number of
conflicts
Number of requests
submitted to the C-OSS
which are in conflict with at
least one other request
At X-8
15
ANNEX 4
Specific rules and terms on capacity allocation applicable on parts of the rail freight
corridor according to Art. 1(4)
This Annex will apply on the following parts of the rail freight corridor:
- Rotterdam-Antwerp, on the RFC “North Sea-Mediterranean”
- Mannheim-Miranda de Ebro, on the RFC “Atlantic”
- Munich-Verona, on the RFC “Scandinavian-Mediterranean”
For additional routes, the Management Board shall make a proposal to the Executive Board
for approval.
The decision shall be published by the Management Board in accordance with Article 18 of
the Regulation.
The timeline of Annex 2 shall be adapted as follows for the reserve capacity provided in
accordance to Article 1(4):
- [X-4 – X-2: Planning (production) reserve capacity for ad-hoc traffic] shall be replaced
by [Until X-11: Planning (production) reserve capacity]
- [X-2: Publication reserve capacity for ad-hoc traffic” shall be replaced by [X-11:
Publication of reserve capacity]
- [X-2 – X+12: Application and allocation phase for ad hoc path requests] shall be
replaced by [M-4 – M-1: Application for reserve capacity and start of allocation phase]
In its request, the applicant has to indicate the timetable period of the request. If one or several
operation days (following the first day of operation) are part of subsequent timetable periods,
the applicant may announce this in its request. The request may not exceed a period of 36
months.
The C-OSS must consider the request in all timetable periods concerned:
- For the first timetable period, the C-OSS has to allocate a path, if available;
- For subsequent timetable periods, the concerned IMs may conclude a framework
agreement in compliance with Article 42 of Directive 2012/34/EU and Commission
Implementing Regulation (EU) 2016/545 where possible.

16
GLOSSARY OF ABBREVIATIONS
− AB: Allocation Body
− IM: Infrastructure Manager
− C-OSS: Corridor One Stop Shop
− PaP: Pre-arranged path
− X: Starting date of a timetable
− F/O: Feeder / Outflow
− RD: Running days
− RFC: Rail Freight Corridor
− Network PaP: Pre-arranged path on which the “Network PaP rule” applies.
− CID: Corridor Information Document
− TCRs: Planned Temporary Capacity Restrictions
− M-x: x Months prior to first day of operation

Letter of Intent establishing the Railway Advisory Group of RFC Amber No.11
1
Letter of Intent
of the Management Board to establish the Advisory Group of
Railway Undertakings
of Rail Freight Corridor Amber No.11
“Koper – Ljubljana – Zalaszentiván – Sopron/Csorna – / (Hungarian-
Serbian border) – Kelebia – Budapest - / - Komárom – Leopoldov / Rajka –
Bratislava – Žilina – Katowice / Kraków – Warszawa / Łuków – Terespol –
(Polish-Belarusian border)”
in accordance with Regulation (EU) 913/2010
Warsaw 12 December 2017

Letter of Intent establishing the Railway Advisory Group of RFC Amber No.11
2
According to article 8 paragraph 8 of Regulation (EU) 913/2010, the Management Board
of the above-mentioned Rail Freight Corridor Amber No.11 shall set up an Advisory Group
of Railway Undertakings, which
• may issue an opinion on any proposal by the Management Board which has
consequences for these undertakings;
• may issue own-initiative opinions.
The Management Board shall take any of these opinions into account.
Participation in the Advisory Group is on a voluntary basis. Railway Undertakings may
become members or resign their memberships of the Advisory Group at will.
The purpose of this Letter of Intent is to identify a framework for cooperation and
partnership between the Management Board and Railway Undertakings and their
representative organizations in the context of the above-mentioned Advisory Group and
with the aim to ensure that the development of the corridor and the services provided along
the corridor meet the demands of Railway Undertakings as much as possible.
In case of intention to become a member of the Advisory Group of Railway Undertakings
of Rail Freight Corridor Amber No.11 the below presented “Confirmation of Intent” shall
duly be filled.
Done at , 2018 ...…………………………..
Chairperson of RFC Amber No.11

Letter of Intent establishing the Railway Advisory Group of RFC Amber No.11
3
Confirmation of Intent
to become a member of the Advisory Group of Railway Undertakings of Rail
Freight Corridor Amber No.11
The undersigned hereby confirm that the organizations they represent intend to cooperate
with the Management Board of Rail Freight Corridor Amber No.11 in the framework of
the Advisory Group of Railway Undertakings, in accordance with Regulation (EU)
913/2010 and the Rules of Consultation annexed to this Letter of Intent. The Rules of
Consultation are laid down in a separate document due to the fact that they intend to
provide guidance based on common principles for the regulation of exchange between the
Management Board and the Advisory Groups. The undersigned organizations reserve the
right to resign their memberships at will.
In case new members aim to join the Advisory Group the current confirmation shall duly
be updated.
The opinions of the Group (including majority and minority opinions, if applicable) shall
be communicated to the Management Board by one Member of the Railway Advisory
Group (RAG Spokesperson).
Done at , 2018

Letter of Intent establishing the Railway Advisory Group of RFC Amber No.11
4
Contact Person Name of company
(Member)
Address of
company
Signature

Letter of Intent establishing the Terminal Advisory Group of RFC Amber No.11
1
Letter of Intent
of the Management Board to establish the Advisory Group of
Terminal Managers and Terminal Owners
of Rail Freight Corridor Amber No.11
“Koper – Ljubljana – Zalaszentiván – Sopron/Csorna – / (Hungarian-
Serbian border) – Kelebia – Budapest - / - Komárom – Leopoldov / Rajka –
Bratislava – Žilina – Katowice / Kraków – Warszawa / Łuków – Terespol –
(Polish-Belarusian border)”
in accordance with Regulation (EU) 913/2010
Warsaw, 12 December 2017

Letter of Intent establishing the Terminal Advisory Group of RFC Amber No.11
2
According to article 8 paragraph 7 of Regulation (EU) 913/2010, the Management Board
of the above-mentioned Rail Freight Corridor Amber No.11 shall set up an Advisory Group
made up of managers and owners of the Terminals of the freight corridor, which
• may issue an opinion on any proposal by the Management Board which has
consequences for investment and the management of terminals;
• may issue own-initiative opinions.
The Management Board shall take any of these opinions into account.
Participation in the Advisory Group is on a voluntary basis. Managers of Terminals and
Owners of the Terminals of the rail freight corridor may become members or resign their
memberships of the Advisory Group at will.
The purpose of this Letter of Intent is to identify a framework for cooperation and
partnership between the Management Board and the managers and owners of Terminals
and their representative organizations in the context of the above-mentioned Advisory
Group and with the aim to ensure that the development of the corridor and the services
provided along the corridor meet the demands of managers and owners of Terminals as
much as possible.
In case of intention to become a member of the Advisory Group of Managers of Terminals
and Owners of the Terminals of Rail Freight Corridor Amber No.11 the below presented
“Confirmation of Intent” shall duly be filled.
Done at , 2018 …………………………..
Chairperson of RFC Amber No.11

Letter of Intent establishing the Terminal Advisory Group of RFC Amber No.11
3
Confirmation of Intent
to become a member of the Advisory Group of Managers of Terminals and Owners
of the Terminals of Rail Freight Corridor Amber No.11
The undersigned hereby confirm that the organizations they represent intend to cooperate
with the Management Board of Rail Freight Corridor Amber No.11 in the framework of
the Advisory Group of Terminal Managers and Owners, in accordance with Regulation
(EU) 913/2010 and the Rules of Consultation annexed to this Letter of Intent. The Rules
of Consultation are laid down in a separate document due to the fact that they intend to
provide guidance based on common principles for the regulation of exchange between the
Management Board and the Advisory Groups.
The undersigned organizations reserve the right to resign their memberships at will.
In case new members aim to join the Advisory Group the current confirmation shall duly
be updated.
The opinions of the Group (including majority and minority opinions, if applicable) shall
be communicated to the Management Board by one Member of the Terminal Advisory
Group (TAG Spokesperson).
Done at , 2018

Letter of Intent establishing the Terminal Advisory Group of RFC Amber No.11
4
Contact person Name of company
(Member)
Address of
Company
Signature

Rules of Consultation between the MB and the AGs of RFC Amber
1
Rules of Consultation between the Management Board and the
Advisory Groups of RFC Amber No.11
in line with Regulation (EU) No. 913/2010
I. Basic provisions
1. The Management Board (hereinafter referred to as ‘MB’) sets up one Advisory Group
(hereinafter referred to as ‘AG’) made up of managers and owners of the terminals of
Amber Rail Freight Corridor (hereinafter referred to as ‘Amber RFC’).
2. The MB sets up one further AG made up of railway undertakings (hereinafter referred
to as ‘RUs’) interested in the use of Amber RFC.
3. Participation in the AGs is on a voluntary basis.
4. The AGs may issue an opinion on any proposal by the MB which has direct
consequences for AG Members. The AGs may also issue own-initiative opinions. The MB
shall take any of the opinions of the AGs into account.
5. The MB is responsible for organization and financing of at least one regular AG meeting
per year per AG and of consultation between MB and AGs. The MB and the AG may
jointly decide about additional meetings if necessary.
6. Meetings of the AGs are financed by the AG Members themselves. Members of the
AGs will not be reimbursed by the corridor organization for their expenses.
7. The MB defines only the rules applicable between the MB and the AGs, but the MB
does not define the process of communication and the procedure for opinion-making inside
the AGs.
II. Formulation and representation of the opinions of the AGs
8. Each AG elects its own representative (hereinafter referred to as ‘Spokesperson’) for a
defined time period, and informs the Secretariat of the Amber RFC (hereinafter referred to
as ‘Secretariat’) and the responsible MB Member in charge of management of AGs of
Amber RFC about the name and contact details of the AG Spokespersons. The
Spokespersons of the AGs collect the opinions of AG Member companies, and
communicate the opinion of the AGs to the MB.

Rules of Consultation between the MB and the AGs of RFC Amber
2
9. A sole opinion of an AG shall be communicated to the MB, and not individual opinions
of AG Members.
10. The possibility for joining and leaving both AGs shall always be open. The Secretariat
and the responsible MB Member in charge of management of AGs shall be informed by
the Spokesperson of names and contact details of newly joined and/or leaving AG
Members.
III. Procedure of consultation between MB and AGs
11. The MB prefers to communicate with the AGs via the Spokespersons of the AGs. This
shall, however, not exclude the possibility of direct communication of any AG member
with the MB if needed.
12. For the AGs the contact point on the side of the MB is the Secretariat whose contact
details are to be found below as well as on the website of the corridor. Therefore, the AG
and further external Parties should address the Secretariat in written form in case of sending
the opinion of the AG, asking for clarifications, etc. Every written initiative has to be
answered by the MB in written form via the Secretariat. In case of change in the contact
details of the Secretariat it is the responsibility of the MB to communicate that towards the
AGs in written form.
13. The Secretariat shall always be put in copy of any communication with the responsible
MB Member in charge of management of AGs.
Contact details of the Secretariat:
Amber RFC Secretariat
Adress: VPE Rail Capacity Allocation Office Ltd.
H-1054 Budapest, Bajcsy-Zsilinszky út 48.
Hungary
Phone: + 36 30 184 7884
E-mail: [email protected]
14. The Secretariat circulates the documents for consultation by sending them to each AG
Member by e-mail but receives the opinions of the AGs only from the Spokespersons of
the AGs.
15. The language of communication between the MB and the AGs shall be English.
16. Forms of communication between Advisory Group members and the Management
Board are:
− E-mail communication (Amber RFC website with dedicated area),
− National conferences,
− Amber RFC RAG/TAG international conferences with AG members organized
by MB.

Rules of Consultation between the MB and the AGs of RFC Amber
3
17. Regular meetings of the AGs are held at least once per year. The MB and the AG may
jointly decide about additional meetings, if necessary. Regular meetings are organized by
the Secretariat in cooperation with the hosting IM. .
18. AG Members and their experts, MB Members and their experts, Executive Board
Members and their experts and representatives of the European Commission may take part
in the AG meetings depending on the items on the agenda.
The AGs may decide to invite further persons to an AG meeting depending on the items
on the agenda.
IV. Utilization of opinions of the AGs
19. The MB takes any opinion of the AGs into account.
20. If the MB cannot meet the requests or expectations expressed by an AG opinion, the
MB gives an explanation to the AG, and continues consultation with the aim to reach
agreement.
21. In the event of disagreement between the MB and an AG, the latter may refer the matter
to the EB. The EB shall act as an intermediary and provide its opinion in due time. The
final decision however shall be taken by the MB.

TRANSPORT MARKET STUDY
2018
PL - SK - HU - SI

Client
Maarten Gutt
PKP PLK S.A.
Polskie Linie Kolejowe
Krzysztof Jamrozik
POLAND Emilia Skowronska
Miroslav Matúšek
Železnice Slovenskej
republiky, Bratislava
Lauko Ladislav
SLOVAKIA [email protected]
VPE Réka Németh
Vasúti Pályakapacitás- [email protected]
elosztó Kft. Nóra Hobot
HUNGARY [email protected]
Lőrinc Czakó
MÁV Zrt. [email protected]
Magyar Államvasutak Ágnes Lengyelné Kerekes
HUNGARY [email protected]
GYSEV
Kövesdi Szilárd
Andrea Mosóczi
Márk Háry
GYSEV Raaberbahn
HUNGARY
Franc Klobucar
SŽ-I [email protected]
Slovenske železnice-
Infrastruktura, d.o.o. Miran Pirnar
SLOVENIA [email protected]

Contents
Glossary/Abbreviations ............................................................................................................ 1
List of tables ............................................................................................................................. 5
List of figures and graphs ........................................................................................................ 7
Introduction ............................................................................................................................ 10
1 Objective of Transport Market Study ........................................................................... 12
1.1 Aspects of establishing the Amber RFC .............................................................. 12
1.2 Structure of TMS objectives................................................................................. 14
2 Metodology of work and methods of investigation ...................................................... 16
2.1 Working process of TMS elaboration .................................................................. 16
2.2 Baselines for the TMS elaboration ....................................................................... 17
2.3 Methods used in TMS elaboration ....................................................................... 19
3 Characteristics of Amber Rail Freight Corridor ........................................................... 20
3.1 Legislative aspects of Amber RFC establishment ................................................ 20
3.2 Amber RFC governance structure ........................................................................ 21
3.3 RFC graphical representation of proposed routing .............................................. 24
4 Economic analysis ......................................................................................................... 27
4.1 Basic general characteristics of the countries of the Amber RFC ........................ 27
4.2 Economic indicators ............................................................................................. 32
4.3 Industry ................................................................................................................. 35
4.4 Results and summary of the findings of Chapter 4 .............................................. 40
5 Analysis of transport and traffic indicators ................................................................... 42
5.1 Liberalization of rail transport services market .................................................... 42
5.2 The European Railway Performance Index .......................................................... 44
5.3 Analysis of transport infrastructure of the Amber RFC countries ....................... 48
5.4 Rail transport analysis .......................................................................................... 53
5.4.1 Poland 53
5.4.2 Slovakia 56
5.4.3 Hungary 58
5.4.4 Slovenia 62
5.5 Analysis of transport indicators of the Amber RFC countries ............................. 64
5.6 Analysis of intermodal transport terminals .......................................................... 73

5.7 Results and summary of the findings of Chapter 5 .............................................. 81
6 Prognosis of transport performance development ........................................................ 83
7 Analysis of Port of Koper in the Republic of Slovenia ................................................. 91
7.1 Basic information about the Port of Koper .......................................................... 92
7.2 Analysis of the Port of Koper throughput ............................................................ 96
8 Transport potential of selected countries ...................................................................... 99
9 Amber RFC graphical representation ......................................................................... 105
9.1 Technical parameters of Amber RFC ................................................................. 111
9.2 Basic information on Małaszewicze dry port ..................................................... 124
9.3 Summary basic comparison of RFC infrastructure ............................................ 127
9.4 Result and summary of the findings of Chapter 9 .............................................. 129
10 Last mile ..................................................................................................................... 131
11 Comparative analysis of rail and road freight transport within the Amber RFC ........ 135
11.1 Socio-economic benefits of the Amber RFC establishment .............................. 137
12 SWOT analysis of Amber RFC .................................................................................. 139
12.1 Characteristics of SWOT analysis process ........................................................ 139
12.2 SWOT analysis of Amber RFC .......................................................................... 141
12.3 Resulting SWOT strategy of the Amber RFC .................................................... 144
13 Strategic map of Amber RFC ..................................................................................... 147
14 Amber RFC Marketing Strategy ................................................................................. 151
15 Conclusions and recommendations ............................................................................ 157
List of appendices ................................................................................................................ 161

TRANSPORT MARKET STUDY
AMBER RAIL FREIGHT CORRIDOR
2018 1
GLOSSARY/ABBREVIATIONS
AB Allocation Body
European Agreement on Important International Combined Transport AGTC
Lines and Related Installations
AT Republic of Austria
BCh Беларуская чыгунка (Belarusian Railway – national railway company)
Balanced scorecard (BSC) is a visual tool used to measure the
BSC effectiveness of an activity against the strategic plans of a company.
Balanced scorecards are often used during strategic planning to make sure
the company's efforts are aligned with overall strategy and vision.
BY Belarus
Compania Naƫională de Căi Ferate (Manager of infrastructure in CFR
Romania)
CNC The Core Network Corridors
Corridor One Stop Shop
A joint body designated or set up by the RFC organizations for applicants
C-OSS to request and to receive answers, in a single place and in a single
operation, regarding infrastructure capacity for freight trains crossing at
least one border along the Freight Corridor (EU Regulation No. 913/ 2010,
Art. 13).
CZ Czech Republic
DB Netz DB Netz AG (German railway infrastructure manager company)
DE Federal Republic of Germany
EC European Commission
European Railway Traffic Management System
ERTMS is a major industrial project being implemented by the European
Union, which will serve to make rail transport safer and more ERTMS
ETCS
competitive. It is made up of all the train-borne, trackside and lineside
equipment necessary for supervising and controlling, in real-time, train
operation according to the traffic conditions based on the appropriate Level
of Application.
European Train Control System
This component of ERTMS guarantees a common standard that enables
trains to cross national borders and enhances safety. It is a signalling and
control system designed to replace the several incompatible safety
Definition Glossary/
abbreviations

TRANSPORT MARKET STUDY
AMBER RAIL FREIGHT CORRIDOR
2018 2
systems currently used by European railways. As a subset of ERTMS, it
provides a level of protection against overspeed and overrun depending
upon the capability of the line side infrastructure.
EU European Union
GCI The Global Competitiveness Index
GDP Gross Domestic Product
GYSEV GYSEV Raaberbahn (Austrian – Hungarian railway company)
HDI Human Development Index
HR Croatia
HU Hungary
HŽ Hrvatske Željeznice (Croatian Railways)
IEF Index of Economy Freedom
IM Infrastructure Manager
Infrastructure - Technical specification for interoperability relating to the
infrastructure subsystem of the rail system in the European Union
INF TSI Commission reugulation (EU) No 1299/2014 of 18 November 2014 on the
technical specifications for interoperability relating to the ‘infrastructure’
subsystem of the rail system in the European Union.
IT Italy
ITT Intermodal transport terminal rail-road, rail-water
Lietuvos geležinkeliai (Railway Infrastructure Directorate of SC LG
“Lithuanian Railways“)
LT Lithuania
MÁV Zrt. Magyar Államvasutak (Hungarian State railways)
N/A Not Available
ÖBB INFRA Österreichische Bundesbahnen (The Austrian Federal Railways)
PaPs Pre- Arranged Paths
The Path Coordination System (PCS) is an international path request
coordination system for path applicants, e.g. Railway Undertakings
PCS (RUs), Infrastructure Managers (IMs) and Allocation Bodies (ABs). The
internet-based application optimises international path coordination by
ensuring that path requests and path offers are harmonised by all involved
parties.

TRANSPORT MARKET STUDY
AMBER RAIL FREIGHT CORRIDOR
2018 3
PLK Polskie Linie Kolejowe (Infrastructure manager in Poland)
RC Reserve Capacity
RFI Rete Ferroviaria Italiana (Italian railways manager of infrastructure)
RNE Rail Net Europe
RO Romania
RS Serbia
RU Railway Undertaking
RUS Russian Federation
RŽD Российские железные дороги (Russian Railways)
SI Slovenia
SK Slovak Republic
SŽ-I Slovenske Železnice - Infrastruktura (Infrastructure manager in Slovenia)
Správa železniční dopravní cesty (Manager of infrastructure in Czech SŽDC
TAF TSI
TAP TSI
TEN-T
Republic)
Telematics application for freight service – Technical specification for
interoperability relating to the telematics applications for freight
subsystem of the rail system in the European Union
Commission regulation (EU) No 1305/2014 of 11 December 2014 on the
technical specification for interoperability relating to the telematics
applications for freight subsystem of the rail system in the European Union
Telematics application for passenger service – Technical specification for
interoperability relating to the subsystem ´telematics applications for
passenger services´ of the trans-European rail system
Commission Regulation (EU) No 527/2016 amending Commission
Regulation (EU) No 454/2011
The Trans-European Transport Network (TEN-T) is a European
Commission policy directed towards the implementation and development
of a Europe-wide network of roads, railway lines, inland waterways,
maritime shipping routes, ports, airports and rail-road terminals.

TRANSPORT MARKET STUDY
AMBER RAIL FREIGHT CORRIDOR
2018 4
TEU
TEU - Twenty- foot Equivalent Unit (a measure used for capacity in
container transportation)
TMS Transport market study
UA Ukraine
UŽ Укрзалізниця (Ukrainian Railways)
VPE Vasúti Pályakapacitás-elosztó Kft. (Rail Capacity Allocation Body)
ŽS Železnice Srbije (Serbian Railways)
ŽSR Železnice Slovenskej republiky (Infrastructure manager in Slovakia)

TRANSPORT MARKET STUDY
AMBER RAIL FREIGHT CORRIDOR
2018 5
LIST OF TABLES
Table 1: Statistical and analytical indicators monitored in TMS ....................................................... 18
Table 2: Real GDP growth rate and prognosis in % .......................................................................... 32
Table 3: GDP per capita in purchasing power standards ................................................................... 32
Table 4: Overview of analysed indexes in countries of Amber RFC ................................................. 34
Table 5: Overview of ETI index and individual sub-indexes for Amber RFC countries ................... 35
Table 6: Analysis of GDP share ......................................................................................................... 35
Table 7: Length of operated railway lines in km ................................................................................ 48
Table 8: Total length of motorways in km ......................................................................................... 48
Table 9: Length of other roads in km ................................................................................................. 48
Table 10: Expenditures on railway infrastructure maintenance (mill. EUR – current prices) ........... 49
Table 11: Expenditures on road infrastructure maintenance (mill. EUR – current prices) ................ 49
Table 12: Analysis of air and water transport infrastructure .............................................................. 53
Table 13: Analysis of transport performances on PLK lines ............................................................. 54
Table 14: Structure of rail carriers with valid access agreement ....................................................... 54
Table 15: Analysis of transport performances on ŽSR lines.............................................................. 56
Table 16: Structure of rail carriers with valid access agreement ....................................................... 57
Table 17: Analysis of transport performances on GYSEV lines........................................................ 59
Table 18: Analysis of transport performances on MÁV Zrt. lines ..................................................... 59
Table 19: Structure of rail carriers with valid access agreement ....................................................... 60
Table 20: Analysis of transport performances on SŽ-I lines .............................................................. 62
Table 21: Structure of rail carriers with valid access agreement ....................................................... 62
Table 22: Import and Export value from/to Poland in mill. € ............................................................ 65
Table 23: Import and export quantity from/to Poland in 1000 t ........................................................ 65
Table 24: Import and export value from/ to Slovakia in mill. € ......................................................... 67
Table 25: Import and export quantity from/ to Slovakia in 1000 t ..................................................... 67
Table 26: Import and export value from/ to Hungary in mill. € ......................................................... 69
Table 27: Import and export quantity from/ to Hungary in 1000 t ..................................................... 69
Table 28: Import and export value from/ to Slovenia in mill. € ......................................................... 71
Table 29: Import and export quantity from/ to Slovenia in 1000 t ..................................................... 71
Table 30: Basic information on intermodal transport terminals in the Republic of Poland ............... 75
Table 31: Basic information on intermodal transport terminals in the Slovak Republic ................... 77
Table 32: Basic information on intermodal transport terminals in Hungary ..................................... 78
Table 33: Basic information on intermodal transport terminals in Slovenia ..................................... 80
Table 34: Prognosis – Realistic scenario ............................................................................................ 86

TRANSPORT MARKET STUDY
AMBER RAIL FREIGHT CORRIDOR
2018 6
Table 35: Prognosis – Optimistic scenario ......................................................................................... 87
Table 36: Prognosis – Pessimistic scenario ........................................................................................ 88
Table 37: Overview of scheduled routes from Port of Koper ............................................................ 95
Table 38: Investment development in Port of Koper in 2012 - 2016 ................................................. 97
Table 39: Overview of basic information on countries under consideration ..................................... 99
Table 40: Analysis of GDP development in individual countries under consideration ................... 100
Table 41: Import and export value from/ to the EU in mill. € ......................................................... 101
Table 42: Import and export quantity from/to the EU in 1000 t ...................................................... 102
Table 43: Traffic points of Amber RFC ........................................................................................... 123
Table 44: Transshipment terminals of PKP CARGO Group in Małaszewicze ............................... 126
Table 45: Basic parameters of RFC corridors .................................................................................. 129
Table 46: Comparative analysis of average running times .............................................................. 135
Table 47: Comparative analysis of charges ...................................................................................... 136
Table 48: Strengths of Amber RFC .................................................................................................. 142
Table 49: Weaknesses of Amber RFC ............................................................................................. 143
Table 50: Opportunities set for SWOT analysis of Amber RFC ..................................................... 143
Table 51: Threats set for SWOT analysis of Amber RFC ............................................................... 144
Table 52: Draft for marketing communication application .............................................................. 156

TRANSPORT MARKET STUDY
AMBER RAIL FREIGHT CORRIDOR
2018 7
LIST OF FIGURES AND GRAPHS
List of figures:
Figure 1: Graphical representation of methodical working process of TMS ..................................... 17
Figure 2: Organizational structure of Amber RFC ............................................................................. 22
Figure 3: Graphical representation of Amber RFC routing ............................................................... 24
Figure 4: Graphical representation of Amber RFC routes on PKP PLK network ............................. 25
Figure 5: Graphical representation of Amber RFC routes on ŽSR network ...................................... 25
Figure 6: Graphical representation of Amber RFC routes on MÁV and GYSEV network ............... 26
Figure 7: Graphical representation of Amber RFC routes on SŽ-I network ...................................... 26
Figure 8: Geographical representation of the Republic of Poland ..................................................... 28
Figure 9: Geographical representation of the Slovak Republic.......................................................... 29
Figure 10: Geographical representation of Hungary .......................................................................... 30
Figure 11: Geographical representation of the Republic of Slovenia ................................................ 31
Figure 12: The most important industrial areas in the Republic of Poland ........................................ 36
Figure 13: The most important industrial areas in the Slovak Republic ............................................ 37
Figure 14: The most important industrial areas in Hungary............................................................... 38
Figure 15: The most important industrial areas in the Republic of Slovenia ..................................... 39
Figure 16: Liberalization index for passenger and freight rail transport, 2011 .................................. 43
Figure 17: RPI ranking in 2017 .......................................................................................................... 45
Figure 18: Correlation between public cost and a given railway system’s performance level .......... 47
Figure 19: Railway corridors of the Republic of Poland .................................................................... 50
Figure 20: Railway corridors of the Slovak Republic ........................................................................ 51
Figure 21: Railway corridors of Hungary .......................................................................................... 51
Figure 22: Railway corridors of the Republic of Slovenia ................................................................. 52
Figure 23: Graphical representation of import and export of goods in tonnes – Republic
of Poland ................................................................................................................................... 66
Figure 24: Graphical representation of import and export of goods in tonnes – Slovak Republic .... 68
Figure 25: Graphical representation of import and export of goods in tonnes – Hungary................. 70
Figure 26: Graphical representation of import and export of goods in tonnes – Republic
of Slovenia ................................................................................................................................ 72
Figure 27: Graphical representation of import and export of goods in tonnes - summary ................ 73
Figure 28: Terminals located on the territory of the Republic of Poland ........................................... 74
Figure 29: Terminal located on the territory of the Slovak Republic ................................................ 76
Figure 30: Terminals located on the territory of Hungary ................................................................. 78

TRANSPORT MARKET STUDY
AMBER RAIL FREIGHT CORRIDOR
2018 8
Figure 31: Terminals located on the territory of Slovenia ................................................................. 79
Figure 32: Individual terminals and their location within the Port of Koper ..................................... 94
Figure 33: Preliminary graphical representation of Amber RFC routing ......................................... 106
Figure 34: Graphical representation of Amber RFC routes on PKP PLK network ......................... 107
Figure 35: Graphical representation of Amber RFC routes on ŽSR network .................................. 108
Figure 36: Graphical representation of Amber RFC routes on MÁV and GYSEV network ........... 109
Figure 37: Graphical representation of Amber RFC routes on SŽ-I network .................................. 110
Figure 38: Graphical representation of Marshalling yards and Intermodal terminals on
Amber RFC ............................................................................................................................. 120
Figure 39: Rail border crossings – with countries outside the EU ................................................... 121
Figure 40: Position of ports and airports .......................................................................................... 122
Figure 41: Layout of PKP CARGO Group transshipment terminals and railway stations in
Małaszewicze .......................................................................................................................... 126
Figure 42: Key China-Europe rail freight transport directions and border crossings ...................... 127
Figure 43: Graphical representation of corridors Rail Net Europe .................................................. 128
Figure 44: Components of „last mile infrastructure“ ....................................................................... 132
Figure 45: Typical railport configuration and logistics services ...................................................... 133
Figure 46: Comparison of challenges of rail freight to road transport ............................................. 137
Figure 47: Theoretical graphical representation of SWOT analysis ................................................ 139
Figure 48: Matrix of model strategies for the Amber RFC .............................................................. 145
Figure 49: Map Balanced Score Card of Amber RFC ..................................................................... 149
Figure 50: Map Balanced Score Card of Amber RFC ..................................................................... 150

TRANSPORT MARKET STUDY
AMBER RAIL FREIGHT CORRIDOR
2018 9
List of graphs:
Graph 1: Comparison of modal split in passenger transport in Poland .............................................. 55
Graph 2: Comparison of modal split in freight transport in Poland ................................................... 56
Graph 3: Comparison of modal split in passenger transport in Slovakia ........................................... 58
Graph 4: Comparison of modal split in freight transport in Slovakia ................................................ 58
Graph 5: Comparison of modal split in passenger transport in Hungary ........................................... 61
Graph 6: Comparison of modal split in freight transport in Hungary ................................................ 61
Graph 7: Comparison of modal split in passenger transport in Slovenia ........................................... 63
Graph 8: Comparison of modal split in freight transport in Slovenia ................................................ 64
Graph 9: Comparison of prognosis scenarios of total freight transport performances ....................... 89
Graph 10: Comparison of prognosis scenarios of freight transport performances on the Amber
RFC lines .................................................................................................................................. 89
Graph 11: Overview of achieved throughputs in tons in Port of Koper............................................. 96
Graph 12: Overview of reached throughput in quantified amount in the Port of Koper ................... 97
TRANSPORT MARKET STUDY
AMBER RAIL FREIGHT CORRIDOR
2018 10
INTRODUCTION
The current economic development in EU countries has an impact on continuous increase in
demand for transport services. The continuous increase in demand for transport services results from
a higher consumption of EU population and a higher production of manufacturing enterprises. The
demand is directly influenced also by the need to transport the final products and the intermediate
products from Asia to Europe and vice versa. Several European companies cooperate with the
companies in Asia and their trading income, level of innovations and social benefits depend on their
cooperation. This demand then creates an offer that results in a market for transport services. There
are many offers from several modes of transport in this market where each mode of transport has its
advantages and disadvantages for the transport process, the customer, the society and the
environment.
Rail freight is considered to be the most environmentally friendly mode of transport of goods,
with an important role in the freight transport market. It contributes to the development of human
society and combines economic and social progress while respecting the environment. Due to
exogenous (e.g. entry of competition in road and air transport, technological innovations oriented to
other modes of transport, change in transport requirements) and endogenous (e.g. inefficiency,
overemployment, low level of innovations and modernization, technological lag) factors, rail freight
lost the competitiveness in the transport services market resulting in decrease in the transport
performances of rail sector. At the same time a shift of transport performances to other more
environmentally demanding modes of transport has occurred. This shift leads to a higher production
of the negative external costs of transport and need for higher state subsidies to the transport
infrastructure from public funds. This unfavourable state has to be addressed by individual states and
EU.
EU, to promote the competitiveness of rail freight transport, in particular in the field of
infrastructure quality, safety, time and administrative effectiveness, international cooperation, has
established the European Rail Freight Corridors. The establishment of the European Rail Freight
Corridors should bring, in particular, better, more complete, more reliable and less expensive services
to railway undertakings. Such services of the single European railway infrastructure consequently
contribute to the better services of the railway undertakings providing freight services. Increased
commercial activity, reliable, fast, safe and cost competitive service lead to a shift of transport
performances from more environmentally demanding modes of transport to rail freight transport. In
addition to its environmental advantage, rail freight transport can provide more reliable, safer, less
expensive and faster transport service in case of harmonizing the transport and technological
processes in comparison with other modes of transport. The shift of transport

TRANSPORT MARKET STUDY
AMBER RAIL FREIGHT CORRIDOR
2018 11
performances to rail leads to overall decrease in social costs (infrastructure owner costs, carrier costs
and negative external costs of transport) generated by transport.
Increasing requirements on quality and availability of rail freight service led to intention to
establish the new European rail freight corridor Amber. The corridor establishment brings the
connection between Adriatic seaports in the Republic of Slovenia and inland ports on the Danube and
terminals in Hungary and the Slovak Republic and Poland, but it brings also the perspective of railway
transport development with Serbia and the improvement of the railway transport in Europe
– Asia direction. The perspective, quality and efficiency of the new corridor need to be assessed and
subsequently, based on the assessment, to take measures to increase competitiveness and growth of
the overall efficiency of the corridor. The proposed strategy is developed based on acquisition,
processing and subsequent evaluation of technical, technological, transport and economic indicators
obtained from various sources.
Based on the above mentioned facts, it is necessary to elaborate a Transport Market Study
(TMS) for the Amber RFC which will evaluate the objective current situation, the perspectives and
the effectiveness of the corridor. At the same time, it is necessary to propose the strategic measures
leading to a higher effectiveness of the corridor based on the evaluations of individual parts of the
study.
TRANSPORT MARKET STUDY
AMBER RAIL FREIGHT CORRIDOR
2018 12
1 OBJECTIVE OF TRANSPORT MARKET STUDY
The establishment of European rail freight corridors at EU level should contribute to the shift
of transport performances from more environmentally demanding transport modes to less
environmentally demanding rail freight transport, decreasing of non-investment state subsidies to the
railway infrastructure, promoting investment state subsidies in the railway infrastructure, ensuring
good economic conditions for railway undertakings and meeting the needs of customers. These
corridors ensure, in particular, equal, non-discriminatory and easier conditions of access to the whole
railway infrastructure of individual Member States for all railway undertakings. Harmonisation and
synergy between particular railway infrastructures contribute to better quality, more available, more
comprehensive and cost-effective services provided to railway undertakings. Cost effective services
motivate railway undertakings to higher acquisition activity, thus more suitable modal split will be
ensured for the whole society.
The chapter is aimed at the interpretation of basic objectives and effects of establishing the
eleventh European rail freight corridor. At the same time, the chapter defines the main objective of
TMS and the resulting partial objectives.
1.1 Aspects of establishing the Amber RFC
The main objectives of establishing the rail freight corridors, defined by the European
Commission (hereinafter referred to as EC) are:
1. Strengthening competitiveness of rail freight transport compared with other modes of transport.
2. Effective modal split with an emphasis on environmentally friendly rail freight transport.
3. Coordination of investment in more qualitative railway infrastructure with possibility of
financial support from EU funds.
4. Harmonisation and synergy between national rail systems.
5. Strengthening cooperation in allocation of railway infrastructure capacity to international
freight trains between single infrastructure managers.
6. Conformity with existing objectives of other specific RFC corridors.
The establishment of the Amber RFC is to lead to the fulfilment of the partial objectives that
can be summarized in the following points:
1. General growth of transit rail freight performances.
2. General growth of international rail freight performances (import, export).
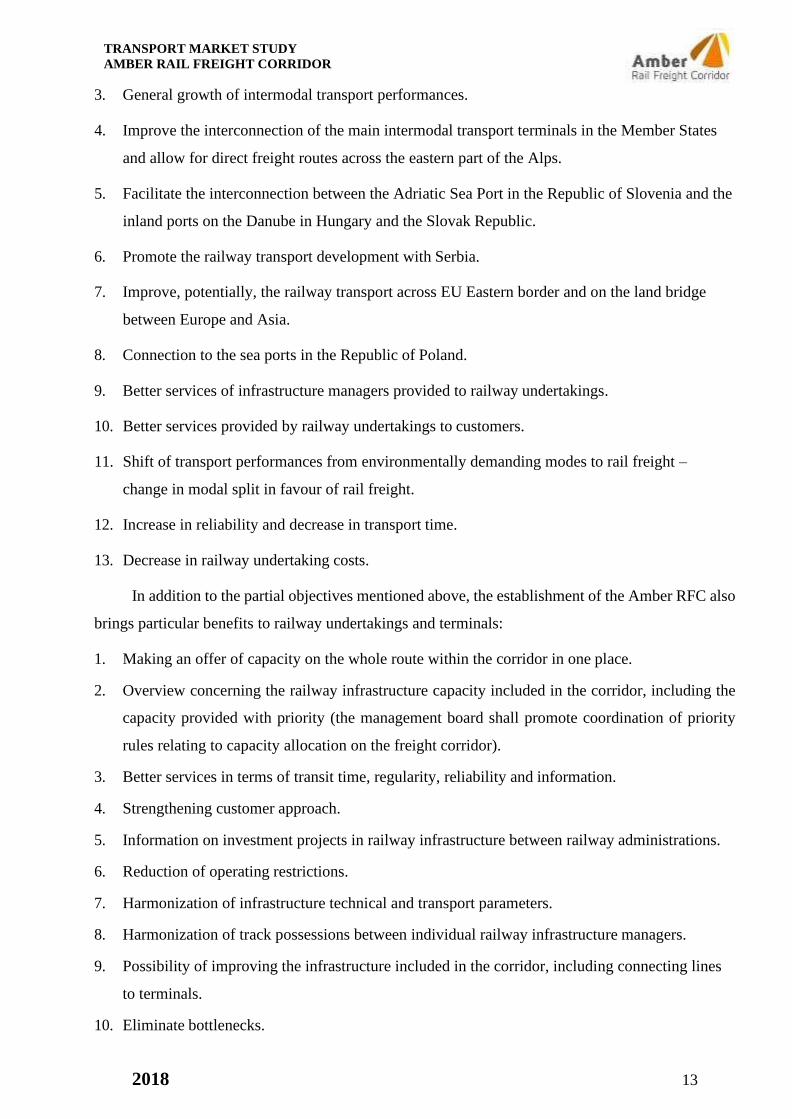
TRANSPORT MARKET STUDY
AMBER RAIL FREIGHT CORRIDOR
2018 13
3. General growth of intermodal transport performances.
4. Improve the interconnection of the main intermodal transport terminals in the Member States
and allow for direct freight routes across the eastern part of the Alps.
5. Facilitate the interconnection between the Adriatic Sea Port in the Republic of Slovenia and the
inland ports on the Danube in Hungary and the Slovak Republic.
6. Promote the railway transport development with Serbia.
7. Improve, potentially, the railway transport across EU Eastern border and on the land bridge
between Europe and Asia.
8. Connection to the sea ports in the Republic of Poland.
9. Better services of infrastructure managers provided to railway undertakings.
10. Better services provided by railway undertakings to customers.
11. Shift of transport performances from environmentally demanding modes to rail freight –
change in modal split in favour of rail freight.
12. Increase in reliability and decrease in transport time.
13. Decrease in railway undertaking costs.
In addition to the partial objectives mentioned above, the establishment of the Amber RFC also
brings particular benefits to railway undertakings and terminals:
1. Making an offer of capacity on the whole route within the corridor in one place.
2. Overview concerning the railway infrastructure capacity included in the corridor, including the
capacity provided with priority (the management board shall promote coordination of priority
rules relating to capacity allocation on the freight corridor).
3. Better services in terms of transit time, regularity, reliability and information.
4. Strengthening customer approach.
5. Information on investment projects in railway infrastructure between railway administrations.
6. Reduction of operating restrictions.
7. Harmonization of infrastructure technical and transport parameters.
8. Harmonization of track possessions between individual railway infrastructure managers.
9. Possibility of improving the infrastructure included in the corridor, including connecting lines
to terminals.
10. Eliminate bottlenecks.
TRANSPORT MARKET STUDY
AMBER RAIL FREIGHT CORRIDOR
2018 14
11. Chance to strengthen priority rules in operative traffic control for freight trains carrying out
transport performances on the corridor.
12. Possibility to express the opinion of railway undertakings on the quality of infrastructure
manager services and the Amber RFC.
The defined objectives and benefits of the Amber RFC establishment are, in particular, to
increase the competitiveness of rail freight services compared with other modes of freight transport,
especially road goods transport. The benefits are better, more reliable and more available rail freight
services and the reduction of operating and technological costs of railway undertakings. The
fulfilment of corridor’s objectives requires the cooperation of all stakeholders – transport policy
(state, government), ministries concerned, infrastructure managers, intermodal operators, carriers and
external suppliers of the railway sector.
1.2 Structure of TMS objectives
The main objective of TMS: is to provide a clear understanding of the current conditions of
the multimodal freight market along the Corridor together with short and long term freight traffic
forecast consequent to the implementation of the corridor at the beginning of year 2019, and also to
propose a measurement of the expected modal shift from road to rail. Based on the elaboration of the
transport market study, evaluate the current state, perspective, prognosis and opportunities of the new
corridor. In accordance with the findings of these analyses, propose a strategy which will lead to the
development of the Amber RFC and provision quality services of the EU railway systems.
The TMS main objective justification: To fulfil the main objectives of establishing the new
European rail freight corridor Amber, mentioned in subchapter 1.1, it is necessary to examine and
evaluate the current state of the transport and technical situation within the countries participating in
the Amber RFC. The establishment of each rail freight corridor requires, based on an analysis of
current state, the development of strategic direction in order to fulfil the basic objectives.
In order to achieve the TMS main objective of the Amber RFC, the following structure
was set:
1. Introduction to issues.
2. Objectives of the transport market study.
3. Methodology of the study.
4. Corridor characteristics – legislative structure, corridor structure, graphical representation of the
corridor in individual countries, technical parameters of corridor lines, capacity analysis,
TRANSPORT MARKET STUDY
AMBER RAIL FREIGHT CORRIDOR
2018 15
comprehensive basic comparison of RFC infrastructures, description of EU TEN-T corridor
concerned, summary of obtained data.
5. Analysis of economic indicators – GDP analysis and prognosis, purchasing power parity, human
development index, index of competitiveness of economies, index of economic freedom, analysis
of significant industrial areas, summary of obtained data.
6. Analysis of transport indicators – analysis of investment and non-investment subsidies, analysis
of selected economic indicators of transport infrastructure, analysis of intended investment in
transport infrastructure, analysis of transport performances (train km, gross tkm, number of
trains) on corridor lines and on the whole network, modal split, summary of obtained data.
7. Prognosis of transport performances: pessimistic, realistic and optimistic scenarios, results of
prognosis.
8. Comparative analysis of rail and road freight transport within the corridor.
9. Analysis of strategic opportunities of the corridor – possibilities of cooperation with other
corridors, transport opportunities from countries outside the EU.
10. Last mile: overview of sidings, intermodal terminals, ports, loading and unloading facilities.
11. Socio-economic benefits of the corridor.
12. SWOT analysis – draft of strategy based on SWOT.
13. Draft of marketing strategy – external environment analysis, internal environment analysis,
draft of marketing strategy.
14. Strategic map of the corridor.
15. Conclusion and recommendations.
The processing of all these partial objectives is necessary to fulfil the main objective of the
TMS of the new rail freight corridor Amber.

TRANSPORT MARKET STUDY
AMBER RAIL FREIGHT CORRIDOR
2018 16
2 METODOLOGY OF WORK AND METHODS OF INVESTIGATION
The chapter in the first part graphically represents the selected working process of elaborating
the TMS of the Amber RFC. Subsequently, the chapter provides sources of information necessary for
elaborating the primary and secondary objectives. Based on the working process, the used methods
necessary for elaborating the particular partial objectives of TMS are listed in the chapter.
2.1 Working process of TMS elaboration
For the elaboration of TMS, based on determining the main objective and resulting partial
objectives, the methodological working process, shown in Fig. 1, was chosen.
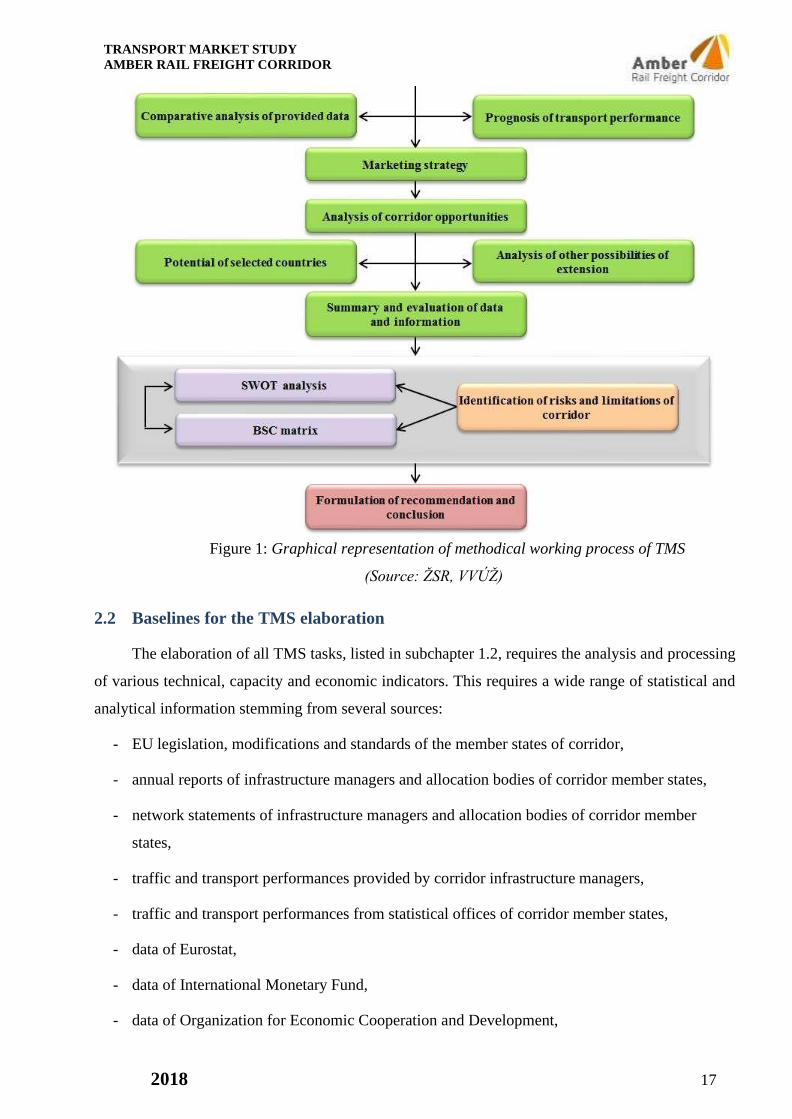
2018 17
TRANSPORT MARKET STUDY
AMBER RAIL FREIGHT CORRIDOR
Figure 1: Graphical representation of methodical working process of TMS
(Source: ŽSR, VVÚŽ)
2.2 Baselines for the TMS elaboration
The elaboration of all TMS tasks, listed in subchapter 1.2, requires the analysis and processing
of various technical, capacity and economic indicators. This requires a wide range of statistical and
analytical information stemming from several sources:
- EU legislation, modifications and standards of the member states of corridor,
- annual reports of infrastructure managers and allocation bodies of corridor member states,
- network statements of infrastructure managers and allocation bodies of corridor member
states,
- traffic and transport performances provided by corridor infrastructure managers,
- traffic and transport performances from statistical offices of corridor member states,
- data of Eurostat,
- data of International Monetary Fund,
- data of Organization for Economic Cooperation and Development,

2018 18
TRANSPORT MARKET STUDY
AMBER RAIL FREIGHT CORRIDOR
- data of World Bank,
- economic indicators provided by statistical offices of corridor member states,
- reports and studies of TEN-T Core Network Corridors,
- other available economic, traffic and transport information necessary for study elaboration,
- data from questionnaires sent to infrastructure managers,
- Manual Update of the Handbook on External Costs of Transport“ (final report for the
European Commission - 2014),
- sector publications (articles, reports, press releases, etc. with relevance for RFC corridors),
- scientific literature.
The statistical and analytical data require for elaborating the individual parts of TMS of the
Amber RFC, with which it was possible to elaborate the individual parts of the study and then to
propose the optimal strategy, are shown in Table 1.
Table 1: Statistical and analytical indicators monitored in TMS
Scope Indicator
Technical parameters Maximum length of train, class of line, signalling equipment, electrification
system, loading gauge, average speed of train, speed limits, profile
Transport
performances
Development of transport performances on corridor lines (national transport and
international transport) Development of transport performances on all lines of member state (national
transport and international transport)
General indicators Population, industry (the most important industry areas in countries of Amber
RFC), transport infrastructure
Macroeconomic
indicators
GDP development and prognosis in member states, GDP per capita in purchasing
power parity, Human development index, Index of competitiveness of
economies, Index of economic freedom
Microeconomic
indicators
Level of infrastructure charges for type trains
Transit time
Modal Split Development of modal split between individual modes of transport (freight and
passenger transport on national territories)
Capacity analysis Development of transport capacity utilization of individual lines
Development of transport capacity utilization of individual corridor lines
Other indicators Investment, technical and technological measures, proposal of extension of lines
and terminals, etc.
Corridor indicators Corridor benefits and opportunities

2018 19
TRANSPORT MARKET STUDY
AMBER RAIL FREIGHT CORRIDOR
2.3 Methods used in TMS elaboration
The individual partial objectives of TMS of the Amber RFC were worked out using the
following methods:
- method of investigating written sources used for selecting appropriate literature for processing
the theoretical and legislative part of TMS,
- method of scientific abstraction – in examining the basic theoretical and legislative basis for
establishment of the European freight corridors,
- method of information gathering and processing – used for information collection and its
subsequent processing,
- benchmarking – in comparison of some transport and technical statistical data,
- method of analysis – in processing and searching required transport and technical statistical
data,
- method of graphic representation – used for graphic and visual layout of acquired and
processed statistical data and other results of the study,
- method of comparative analysis – comparison in analytical part,
- method of synthesis – for summarizing information and data obtained,
- method of induction and deduction – used in all parts of TMS, in creating logical judgements
based on theoretical, legislative and empirical knowledge,
- brainstorming – consultations with practitioners,
- methods of statistical analysis – used in searching and processing required transport, technical
and economical statistical data,
- prognostic method – used in development of TMS prognostic scenarios.
TRANSPORT MARKET STUDY
AMBER RAIL FREIGHT CORRIDOR
2018 20
3 CHARACTERISTICS OF AMBER RAIL FREIGHT CORRIDOR
The third part of TMS is aimed at the precise technical characteristics of the Amber RFC. The
first part defines the legislative aspects of the establishment of the corridor in question. Consequently,
the corridor routing in the individual railway infrastructures of the member states is graphically
represented. An important part of the chapter is a description of technical parameters of the lines
included in the corridor.
3.1 Legislative aspects of Amber RFC establishment
The Amber rail freight corridor No 11 is being established based on Commission Implementing
Decision (EU) no. 2017/177 of 31 January 2017, that was issued of the basis of “Letter of Intent” as
request of 4 Ministries competent for Rail Transport of Hungary, Republic of Poland, Slovak Republic
and Republic of Slovenia.
The establishment of Amber rail freight corridor is on the compliance with Article 5 of
Regulation (EU) No 913/2010 of the European Parliament and of the Council of 22 September 2010
concerning a European rail network for competitive freight. This Regulation lays down rules for the
establishment and organisation of international rail freight corridors with a view to the development of
a European rail network for competitive freight.
The implementation of international RFCs forming a European rail network for competitive
freight is conducted in a manner consistent with the trans-European Transport Network (TEN-T)
according to Regulation (EU) No 1315/2013 of the European Parliament and of the council of 11
December 2013 on Union guidelines for the development of the Trans-European Transport Network
and repealing Decision No 661/2010/EU.
In order to speed up TEN-T investments and strengthening public and private sector financing,
while increasing legal certainty and respecting the principle of technological neutrality,
REGULATION (EU) No 1316/2013 of the European Parliament and of the council decision of 11
December 2013 establishing the instrument of Connecting Europe and amending Regulation (EU) No
(EC) No 913/2010 and repealing Regulations (EC) 680/2007 and (EC) no. 67/2010.
All the above mentioned legal acts are in line with Directive 2012/34/ EU of the European
Parliament and of the Council of 21 November 2012 on the establishment of a single European railway
area.

TRANSPORT MARKET STUDY
AMBER RAIL FREIGHT CORRIDOR
2018 21
In order to establish and support the European railway network as regards freight transport, some
technical and operational initiatives have been launched. These are, for example:
- development of interoperability through the technical specification of interoperability relating to
the infrastructure subsystem of the rail system in European Union (INF TSI),
- development of interoperability through the technical specification of interoperability relating to
Traffic Operation and Management (TOM TSI) and TSI relating to Telematics Applications for
Freight Services (TAF TSI), and Telematics Applications for Passenger Services (TAP TSI).
3.2 Amber RFC governance structure
For proper functioning of the European rail freight corridors, control and management
mechanisms in the form of bodies have been introduced for each corridor. At the same time, the
coordination of established bodies contributes to meeting the basic objectives of RFC corridors and
responds to the challenges of effective daily operation and the provision of the best possible services
to customers.
RFC bodies:
Executive Board – made up of representatives of the authorities of the Member States concerned.
Management Board – made up of the representatives of the infrastructure managers and Allocation
Body
Railway Advisory Group (RAG) – made up of railway undertakings interested in the use of the
freight corridor.
Terminal Advisory Group (TAG) – made up of managers and owners of the terminals of the freight
corridor including, sea and inland waterway ports.
Corridor One Stop Shop (C-OSS) – will be established by the corridor launching according to
Commission Implementing Regulation No 2017/177 of 31 January 2017.
Amber RFC Working Groups:
- Traffic management, Train Performance and Operations,
- Marketing,
- Timetable and One Stop Shop,
- Temporary Capacity restrictions,
- Infrastructure, Interoperability and ERTMS,

TRANSPORT MARKET STUDY
AMBER RAIL FREIGHT CORRIDOR
2018 22
- Legal Task Force.
Organizational support, coordination of activities and review of documents elaborated by
Working Groups are provided by the Coordination Group. Administrative part is ensured by the RFC
Secretariat.
Figure 2: Organizational structure of Amber RFC
(Source: marketing Amber)
Excerpt of the tasks of Executive Board:
- is responsible for defining the corridor main objectives, supervises and takes measures,
- determines the framework for infrastructure capacity allocation within the corridor,
- approves documents and plans elaborated by the Management Board,
- periodically analyses the corridor implementation plan,
- submits to the European Commission a report on the results of executing the implementation
plan every two years starting from the corridor establishment.
TRANSPORT MARKET STUDY
AMBER RAIL FREIGHT CORRIDOR
2018 23
Excerpt of the tasks of Management Board:
- fulfilment of all Management Board tasks defined in Regulation (EU) No 913/2010,
- determination of the legal form of the Amber RFC,
- fulfilment of other tasks defined by decisions of the Management Board and Internal rules and
procedures of the corridor,
- ensuring organisational, technical and operational conditions to make the Amber RFC
operational on time,
- management of whole Amber RFC organizational structure,
- seeking good co-operation with the Executive Board of the Amber RFC, with the Advisory
Groups and customers of the corridor and with the management boards of other RFCs.
The Management Board monitors the performance and quality of rail freight services within the
corridor and once a year publishes the results on the web site of the corridor together with the results
of the satisfaction survey of corridor users. In order to ensure a non-discriminatory access to railway
infrastructure and fair economic competition it cooperates with regulatory bodies of member states, at
the same time it performs the task of the Regulatory Body.
Main tasks of Corridor One Stop Shop (C-OSS): the C-OSS is the only body where applicants may
request and receive infrastructure capacity for international freight trains on Amber RFC. The handling
of the requests takes place in a single place and a single operation. The C-OSS is responsible for
performing the handling of capacity requests for international freight trains and for the publication and
allocation decision with regard to requests for PaPs and RC (Reserve Capacity) on behalf of the IMs /
ABs concerned.
RFC Amber routing: Koper – Ljubljana/Zalaszentiván – Sopron/Csorna/(Hungarian-Serbian border)
– Kelebia – Budapest – Komárom – Leopoldov/Rajka – Bratislava – Žilina – Katowice/Kraków –
Warszawa/Łuków – Terespol – (Polish-Belorusian border) as the principal route for the Amber rail
freight corridor.
Member states: Poland, Slovakia, Hungary, Slovenia
Deadline for making Amber RFC operational: by 30.01.2019
Seat of Corridor One Stop Shop (C-OSS): Poland

TRANSPORT MARKET STUDY
AMBER RAIL FREIGHT CORRIDOR
2018 24
3.3 RFC graphical representation of proposed routing
The routing of the Amber RFC is based on the document Letter of intent concerning the
establishment of the Amber Rail Freight Corridor No 11 by the Ministries competent for Rail Transport
and subsequently on Commission implementing decision (EU) 2017/177 of 31 January 2017. The
graphical representation of the proposed routing according to given documents is shown in the
following Figure.
Figure 3: Graphical representation of Amber RFC routing
(Source: ŽSR, VVÚŽ)
For more detailed representation, the graphical representation of the proposed routing within the
railway infrastructure of individual participated countries is shown in Fig. 4 - Fig. 7.

TRANSPORT MARKET STUDY
AMBER RAIL FREIGHT CORRIDOR
2018 25
Figure 4: Graphical representation of Amber RFC routes on PKP PLK network
(Source: ŽSR, VVÚŽ)
Figure 5: Graphical representation of Amber RFC routes on ŽSR network
(Source: ŽSR, VVÚŽ)

TRANSPORT MARKET STUDY
AMBER RAIL FREIGHT CORRIDOR
2018 26
Figure 6: Graphical representation of Amber RFC routes on MÁV and GYSEV network
(Source: ŽSR, VVÚŽ)
Figure 7: Graphical representation of Amber RFC routes on SŽ-I network
(Source: ŽSR, VVÚŽ)

TRANSPORT MARKET STUDY
AMBER RAIL FREIGHT CORRIDOR
4 ECONOMIC ANALYSIS
The chapter is focused on the characterization and the subsequent analysis of selected economic
indicators that influence the demand for transport services. An important part is the graphical analysis
of important industrial areas located in the territories of countries under consideration.
4.1 Basic general characteristics of the countries of the Amber RFC
The aim of the subchapter is to provide basic general data on all countries participating in the
Amber RFC.
Republic of Poland
Capital: Warsaw
Area: 312 679 km² (69th place in the world) of which water 8 220 km² (3,07 %)
Population: 38 116 000, census in 2017
Official language: Polish
Administrative division: 16 regions, 373 counties
Currency: Polish zloty =100 groshes (PLN)
Neighbouring countries: the Slovak Republic, the Republic of Lithuania, the Russian Federation,
the Czech Republic, the Federal Republic of Germany, the Republic of Belarus, Ukraine.
Geographical location: Central Europe
Figure 8 is a graphical representation of the geographical location of the Republic of Poland
with marked borders and significant cities. The geographical location of the country is particularly
advantageous from the transport point of view in the direction from the Baltic Sea and the eastern
part of Europe. The area of country, industry and tourism directly create increased demands for
quality, safe, reliable and available transport services.
2018 27

TRANSPORT MARKET STUDY
AMBER RAIL FREIGHT CORRIDOR
2018 28
Figure 8: Geographical representation of the Republic of Poland
(Source: ŽSR, VVÚŽ)
Slovak Republic
Capital: Bratislava
Area: 49 036 km² (127th place in the world) of which water 931 km² (1.9 %)
Population: 5 435 343, estimate 2016
Official language: Slovak
Administrative division: 8 self-governing regions, 79 districts
Currency: Euro = 100 cents (EUR)
Neighbouring countries: the Czech Republic, the Republic of Poland, the Republic of Austria,
Hungary, Ukraine.
Geographical location: Central Europe

TRANSPORT MARKET STUDY
AMBER RAIL FREIGHT CORRIDOR
2018 29
Figure 9 is a graphical representation of the geographical location of the Slovak Republic with
marked borders and significant cities. By its location, the country creates the appropriate conditions
for rail transit traffic, mainly in the direction east (Asia) – west (Western Europe). The geographical
location and available transport infrastructure in the country directly contribute to the direction of
foreign investment that creates demand for transport services.
Figure 9: Geographical representation of the Slovak Republic
(Source: ŽSR, VVÚŽ)
Hungary
Capital: Budapest
Area: 93 030 km² (108th place in the world) of which water 1 685 km² (~ 2 %)
Population: 9 830 485, estimate 2016
Official language: Hungarian
Administrative division: 7 regions, 19 counties and Budapest

TRANSPORT MARKET STUDY
AMBER RAIL FREIGHT CORRIDOR
2018 30
Currency: Hungarian Forint = 100 fillér (HUF)
Neighbouring countries: the Republic of Austria, the Slovak Republic, Romania, the Republic of
Serbia, the Republic of Croatia, the Republic of Slovenia, Ukraine.
Geographical location: Central Europe
Figure 10 is a graphical representation of the geographical location of Hungary with marked
borders and some of significant cities. By its location, the country creates the appropriate conditions
for rail transit traffic, mainly in the direction south – west and north of Europe. The transport
infrastructure of Hungary has the potential to realize a significant part of transportations from
countries outside the EU and the Republic of Turkey to the countries of Western Europe.
Republic of Slovenia
Capital: Ljubljana
Figure 10: Geographical representation of Hungary
(Source: ŽSR, VVÚŽ)
Area: 20 273 km² (154th place in the world) of which water 122 km² (0,7 %)

TRANSPORT MARKET STUDY
AMBER RAIL FREIGHT CORRIDOR
2018 31
Population: 2 065 895, estimate 2016
Official language: Slovenian
Administrative division: 212 municipalities (občine)
Currency: Euro = 100 cents (EUR)
Neighbouring countries: the Republic of Austria, Hungary, the Republic of Croatia, the Republic
of Italy
Geographical location: Central Europe
Figure 11 is a graphical representation of the geographical location of the Republic of Slovenia
with marked borders and significant cities. The Republic of Slovenia is one of the important gateways
for the goods incoming from Asia to Europe. The requirements for the continuation of the transport
of goods from Asia continuously increase and create great opportunities for rail freight transport.
Figure 11: Geographical representation of the Republic of Slovenia
(Source: ŽSR, VVÚŽ)

TRANSPORT MARKET STUDY
AMBER RAIL FREIGHT CORRIDOR
2018 32
4.2 Economic indicators
Within the economic indicators, the indicators: GDP, GDP per capita in purchasing power
parity and HDI, GCI, IEF indices for the individual countries of Amber RFC, are analysed in the
following sections. At the same time, the analysed indicators are briefly characterized.
GDP – Gross domestic product
Gross Domestic Product (GDP) is defined as the value of all final products and services
produced by all units of the national accounting of the monitored territory over the given period.
Within the above GDP indicator, the following table shows GDP growth rate in % for the individual
states included in the Amber RFC, including the forecast for 2018 - 2020.
Table 2: Real GDP growth rate and prognosis in %
Description Real GDP growth rate (%) Prognosis of GDP (%)
Year 2010 2011 2012 2013 2014 2015 2016 2017 2018 2019 2020
Poland 3,6 5,0 1,6 1,4 3,3 3,8 2,9 4,2 3,8 3,4 3,6
Slovakia 5,0 2,8 1,7 1,5 2,8 3,9 3,3 3,3 3,8 4,0 4,0
Hungary 0,7 1,7 -1,6 2,1 4,2 3,4 2,2 3,7 3,6 3,1 3,1
Slovenia 1,2 0,6 -2,7 -1,1 3,0 2,3 3,1 4,7 4,0 3,3 3,2
Source: Eurostat
From the above-mentioned analysis of GDP growth rate, we can confirm the slowdown in
economic growth in 2012 and 2013 in all analysed countries. GDP growth revival has been recorded
since 2014. The GDP growth rate forecasts a positive growth trend above 3 % in 2018 as well as in
2019 and 2020 for all monitored countries.
GDP per capita in purchasing power parity
Table 3 shows the trend of index of GDP per capita in purchasing power parity in relation to
the average of EU 28 that is equal to 100 for the period 2010 – 2016. If the index of a country is
higher than 100, the level of GDP per capita in the country under consideration is higher than EU
average and vice versa. The basic data are expressed in purchasing power parity, i.e. common
currency that eliminates differences in price levels between countries allowing meaningful volume
comparisons of GDP between countries.
Table 3: GDP per capita in purchasing power standards
Description GDP per capita in Purchasing Power Standards (PPS)
Year 2010 2011 2012 2013 2014 2015 2016
EU28 100 100 100 100 100 100 100
Poland 62 65 67 67 67 68 68
Slovakia 74 75 76 77 77 77 77
Hungary 65 66 66 67 68 68 67
Slovenia 83 83 82 82 82 82 83
Source: Eurostat

TRANSPORT MARKET STUDY
AMBER RAIL FREIGHT CORRIDOR
2018 33
The highest index of GDP per capita in PPS among member states of the Amber RFC reached
Slovenia at the level 83 in 2016. The Republic of Poland recorded a steady trend in 2012 – 2014 and
then increased degree in the period 2015 – 2016. In Hungary, there was a slight decline in 2016 at the
level 67 compared to the previous year. GDP per capita in PPS on the territory of the Slovak Republic
is stable since 2013. A steady trend of GDP per capita in purchasing power parity confirms price
stability in the analysed countries.
IEF – Index of Economy Freedom
This index belongs to indicators aimed at measuring the economic freedom in relation to the
overall performance of the economy. More than 50 world institutions are involved in the creation of
the index, which analyse the indicators in the areas of impact of state interventions in the economy,
the protection of property rights, the interventions in conditions of entry into business. Based on the
long-term monitoring of this index, it is confirmed that countries with a higher level of economic
freedom achieve higher performance of the economy, higher GDP growth rates and higher GDP per
capita compared to countries with low level of economic freedom. The scale of values of index of
economic freedom creates the Heritage Foundation, which covers 180 countries in the world with
scores from 0 to 100, with 100 being the highest value of the economic freedom index.
GCI – The Global Competitiveness Index
According to the Global Competitiveness Index, it is possible to express how the quality of
business environment contributes to increasing the performance of economy and it is assessed
according to four basic areas. These areas include economic growth, government efficiency, business
environment efficiency, infrastructure efficiency. The World Economic Forum Global
Competitiveness Index assesses 137 countries in the world with scores ranging from 1 to 7, with 7
being the highest value of the global competitiveness index.
HDI – Human Development Index
The index is currently used most often to compare the level of human development. It is
considered to be the most comprehensive indicator of quality of life. The Human Development Index
assesses health and life expectancy, education and living standards. The index is also used by the
United Nations Development Programme (UNPD). It is assessed within 188 countries ranging from
0 to 1, with the value of human development index being higher.
Table 4 analyses the above-described IEF, GCI, HDI indicators separately for each country of
the Amber RFC.

TRANSPORT MARKET STUDY
AMBER RAIL FREIGHT CORRIDOR
2018 34
Table 4: Overview of analysed indexes in countries of Amber RFC
Index (Year) IEF (2017) GCI (2017 – 2018) HDI (2015)
Country score Rank/180 score Rank/137 score Rank/188
Poland 68,3 45 4,59 39 0,855 36
Slovakia 65,7 57 4,33 59 0,845 40
Hungary 65,8 56 4,33 60 0,836 43
Slovenia 59,2 97 4,48 48 0,890 25
Source: The Heritage Foundation, World Economic Forum, United Nations Development Programme
From the mentioned values of Economic Freedom Index and Global Competitiveness Index,
the Republic of Poland achieved the best rating among the analysed countries. Poland ranked in 45th
place in comparison with the Economic Freedom Index values and in 39th place in comparison of
values of the Global Competitiveness Index. The best ranking within the Human Development Index
among countries was achieved by Slovenia which ranked in 25th place in 2015. Overall, based on the
date in Table 4, it is possible to confirm sufficiently appropriate macro environment in all analysed
countries for investment, business and innovations which contribute to the economic development
and subsequent demand for transport services. The results also confirm the competitiveness of the
economies of the analysed countries towards the other evaluated countries of the world.
ETI – Enabling Trade Index
The index is created by the World Economic Forum in cooperation with the World Bank and
various national institutions which ensure the completion of necessary data. The index is made up of
four sub-indexes:
- Market access,
- Border administration,
- Transport and communications infrastructure,
- Business Environment.
Each of these sub-indexes is divided into pillars ranging from 1 to 7, composed of basic
indicators (55 in total) as well as indicators that are specific for given range. There are 136 countries
in ranking, where the countries with the ranking closest to 7 are ranked the best. The rank of the best
ranked countries goes upwards from 1 to the worst ranked countries up to 136.

TRANSPORT MARKET STUDY
AMBER RAIL FREIGHT CORRIDOR
2018 35
Table 5: Overview of ETI index and individual sub-indexes for Amber RFC countries
Country
Rank/136
(2016)
Score
Subindex scores
Market
Access
Border
Administration
Transport and
communications
Infrastructure
Business
Environment
Poland 31 5,0 5,0 5,7 4,6 4,5
Slovakia 34 4,9 4,9 5,6 4,6 4,6
Hungary 38 4,9 4,9 5,7 4,5 4,5
Slovenia 32 5,0 5,0 5,8 4,6 4,5
Source: World Economic Forum, World Bank, National statistics office
Based on the ETI index, we can confirm the above-average ranking of countries in terms of
enabling business activities, while at the same time the above-average value of sub-index in the area
of transport and communications infrastructure has been demonstrated. Appropriate measures of EU,
individual member states in the field of transport infrastructure and transport infrastructure managers
will again be reflected in ranking of analysed countries, whereby the overall value of ETI index will
be increased.
Table 6 analyses the share of GDP within primary, secondary and tertiary spheres of the national
economy for the period 2010 – 2016 for the countries of the Amber RFC.
Table 6: Analysis of GDP share
Country Item/ Year 2010 2012 2014 2015 2016
Poland
Agriculture, value added (% of GDP) 2,9 3,0 2,9 2,5 2,7
Industry, value added (% of GDP) 33,2 33,6 33,2 34,1 33,7
Services, etc., value added (% of GDP) 63,9 63,4 63,9 63,4 63,6
Slovakia
Agriculture, value added (% of GDP) 2,8 3,5 4,4 3,8 3,7
Industry, value added (% of GDP) 35,2 35,4 34,6 34,5 34,8
Services, etc., value added (% of GDP) 62,0 61,1 61,0 61,7 61,5
Hungary
Agriculture, value added (% of GDP) 3,5 4,6 4,7 4,4 4,4
Industry, value added (% of GDP) 29,9 30,0 30,6 31,7 30,5
Services, etc., value added (% of GDP) 66,6 65,4 64,7 63,9 65,1
Slovenia
Agriculture, value added (% of GDP) 2,0 2,0 2,3 2,3 2,2
Industry, value added (% of GDP) 30,6 31,7 32,8 32,6 32,3
Services, etc., value added (% of GDP) 67,4 66,3 64,9 65,1 65,5
Source: The World Bank, Data
On the basis of the data analysed in Table 6, we can confirm the high share of the tertiary sphere
of the national economy in the total GDP of the surveyed countries. The data document the high
development of countries and the potential for sustainable development, as the tertiary sphere of the
national economy is less harmful to the environment.
4.3 Industry
The transport services market is different in the individual countries. Differences are mainly
influenced by the geographical location of the country, by the deployment of industrial and logistics
centers as well as the main sectors of the economy.

TRANSPORT MARKET STUDY
AMBER RAIL FREIGHT CORRIDOR
2018 36
The most important industries in the Republic of Poland:
Extractive industries – rich sources of mineral resources, black coal, brown coal, oil and natural gas,
lead, zinc, copper, rock salt.
Metallurgical industry – rolled material and sheets for cars, processing of copper, zinc, lead.
Mechanical engineering and automotive industry – means of transport, cars, especially for export,
railway sets and sea vessels.
Chemical industry, pharmaceutical industry and food industry.
Figure 12 illustrates the most important industrial areas in the Republic of Poland.
Figure 12: The most important industrial areas in the Republic of Poland
(Source: General information on industry in Poland)

TRANSPORT MARKET STUDY
AMBER RAIL FREIGHT CORRIDOR
2018 37
The most important industries in the Slovak Republic:
Metallurgical industry – rolled material and sheets for automobiles, pipe and tube production.
Mechanical engineering – manufacturing of bearings, automobile components.
Automotive industry – four car factories.
Electrotechnical industry – manufacturing of screens, televisions, home appliances.
Tourism – especially the area of the High and Low Tatras, Bratislava, national parks.
Chemical industry and food industry.
Figure 13 illustrates the most important industrial areas in the Slovak Republic.
Figure 13: The most important industrial areas in the Slovak Republic
(Source: General information on industry in Slovakia)
The most important industries in Hungary:
Mechanical engineering – mainly production of means of transport.
Chemical industry – mainly petroleum processing.
Textile production – especially furriery and work clothes.
Tourism – especially the area around Balaton, Budapest.
Food and agriculture – major exporter of meat, poultry, cereals and wines.
Figure 14 illustrates the most important industrial areas in Hungary.

TRANSPORT MARKET STUDY
AMBER RAIL FREIGHT CORRIDOR
2018 38
Figure 14: The most important industrial areas in Hungary
(Source: General information on industry in Hungary)
The most important industries in the Republic of Slovenia:
Mining industry – ferrous ores and metals, and other mining(lead and zin ores) and quarrying
products.
Metallurgical industry – non-ferrous metals.
Mechanical engineering – means of transport, tools, home appliances.
Textile and pharmaceutical industries.
Furniture industry – important export goods of the country.
Tourism – especially in seaside areas.

TRANSPORT MARKET STUDY
AMBER RAIL FREIGHT CORRIDOR
2018 39
Figure 15 illustrates the most important industrial areas in the Republic of Slovenia.
Figure 15: The most important industrial areas in the Republic of Slovenia
(Source: SURS – Statistical office of Republic of Slovenia)

TRANSPORT MARKET STUDY
AMBER RAIL FREIGHT CORRIDOR
2018 40
4.4 Results and summary of the findings of Chapter 4
On the basis of the collected and evaluated main statistical economic data in the Amber RFC
countries, it is possible to conclude:
- positive economic development in the Amber RFC countries: it can be assumed based on the
trend of positive GDP development in Table 2. The GDP development in the Amber RFC
countries is assumed at the level of 3.1 – 4.0 %, which is more than the estimated average of
GDP development in EU (2.8 – 2.9 %). Positive economic development can also be expected
on the basis of the advantageous location of the Amber RFC countries within the analysed
indices (Tables 4 and 5),
- increase in living standards of the population: it is assumed based on the Amber RFC countries
ranking in the Human Development Index. At the same time, the positive trend of GDP
development (expected based on the analysis in Table 2), the amount of foreign investments
and the increase in a share of science and research in GDP contribute to increase in living
standard,
- increase in industrial production: influenced by the attractive position of the Amber RFC
countries within the international indices analysed in Tables 4 and 5. Industry structure, history,
skilled labour force, geographic position and infrastructure of the Amber corridor countries also
have a significant impact on industrial growth. These factors motivate foreign investors to direct
their investment activities to the Amber RFC countries,
- increase in demand for services: the positive economic development in the Amber RFC
countries (shown in Tables 2 and 3) takes a share in the consumption of services, as the
purchasing power and consumer behaviour of the population are increased. This fact is
confirmed in Germany and USA where an increase in demand for services due to the economic
development – transition from secondary to tertiary national economy – was recorded,
- construction of industrial and logistics centres and intermodal transport terminals: results from
the need to transport intermediate products, final products as well as foreign direct investment
and greening transport. Increase in quality and extension of logistics services require the
completion of new centres. The construction is also influenced by the attractive position of the
Amber RFC countries within the Enabling Trade Index. The final products from the Amber
RFC countries are worldwide distributed (e.g. production of cars in Hungary, Slovakia and
Poland). Also, there is the need to distribute goods from Asia primarily by intermodal transport
(e.g. goods distributed to the Amber RFC countries and other EU members from the Port of
Koper in Slovenia),
TRANSPORT MARKET STUDY
AMBER RAIL FREIGHT CORRIDOR
2018 41
- increase in demand for transport services: influenced by the positive economic development
and the position of the Amber RFC countries according to the analysed indices (analysis in
Tables 3, 4 and 5 – above-average position of the Amber RFC countries), the change in
consumer behaviour, the population movement resulting from a higher purchasing power,
higher production of final products, the need to transport intermediate products to the factories
(in particular automotive, machine and metallurgical industries),
- requirements of a higher level of transport services, e.g. reliability, safety, shorter transport
times, etc.: the economy in the Amber RFC countries forms primarily a secondary economic
sphere (production and assembly of final products; electrical engineering, machine,
metallurgical and automotive industries; Figures 12-15). This sphere requires reliable, flexible
and safe transport services that are directly related to the production and logistics processes.
Without the provision of high-quality transport services, the needs of customers (manufacturing
companies, consumers, suppliers) cannot be satisfactory met, which could threaten the
competitiveness of the business environment of the Amber RFC countries,
- pressure on transport ecology: the economic growth directly affects the consumer needs of the
population, thereby the transport performances in goods and passenger road transport are still
increased. The increase in these performances increases the production of negative external
costs. Reduction of negative external costs (e.g. CO2 production) is planned by the European
Commission in the next period through the legislative measures (e.g. a Regulation of the
European Parliament and of the Council setting emission performance standards for new
passenger cars and for new light commercial vehicles as part of the Union’s integrated approach
to reduce CO2 emissions from light-duty vehicles and amending Regulation (EC) No
715/2007),
- more financial resources for the transport sector: GDP growth (data in Table 2) in the Amber
RFC countries will be reflected in the revenues to the state budgets in a positive way. Increase
in public revenues positively influences the possibilities of state investments. Due to constantly
increasing demand for high-quality transport services and better public revenues, it will be
possible to assign more financial means for the transport sector.
The economic analysis carried out for the Amber RFC countries has shown sufficient potential
for rail freight services. The economic growth puts increased demands on logistics and transport
processes. The population mobility, purchasing power and environmental awareness, which
significantly affect the demand for ecological rail transport services, are constantly increasing.
TRANSPORT MARKET STUDY
AMBER RAIL FREIGHT CORRIDOR
2018 42
5 ANALYSIS OF TRANSPORT AND TRAFFIC INDICATORS
The first part of the chapter analyses the achieved level in the process of liberalization of the
rail transport services market and the European Railway Performance Index. Consequently, an
analysis of the transport infrastructure of the countries of the Amber RFC is carried out and graphical
representation of other corridors passing through the surveyed countries can be found in Figures 19 -
22. The analysis of transport performances and selected transport indicators, which are the basis for
the development of the Amber RFC strategy, are an important part of the chapter. The presented data
create a comprehensive realistic view of the state of the railway system in individual countries.
5.1 Liberalization of rail transport services market
The market opening rate of rail transport services in EU countries was expressed by means of
the liberalization index issued by IBM Germany in 2011. The index provides qualified data on the
legislative and practical possibilities for the entry of new railway undertakings into the rail transport
services market. The index also points to barriers and shortcomings to the entry of new railway
undertakings into the rail transport services market in individual EU countries. The index was also
calculated for Switzerland and Norway. The liberalization index is calculated fairly, therefore it
provides a detailed view of the liberalization process in the analysed countries. The liberalization
index examines, in particular, the view of new entering railway undertakings by answering questions:
- What are the legal bases for external railway undertakings in the target country?
- What are the opportunities and barriers to entry to the rail market?
- What is the dynamic and strong competition on the rail transport services market?
The liberalization index is based on data from two types of indicators:
1. LEX indicator – shares 20 % in the overall result of the index. It examines the organization
of the rail sector, in particular the vertical separation of the infrastructure manager and the railway
undertakings. An important criterion is a degree of market access control and power of market
institutions. The most important part of LEX consists of the assessment and the resulting strength of
the regulatory authorities of the analysed countries. Thematic areas examined in LEX:
- access to the railway market on the basis of Directive No 91/440, as amended by Directive
2001/12,
- national legislation,
- organizational classification of railway undertakings operating in the market under
consideration,

TRANSPORT MARKET STUDY
AMBER RAIL FREIGHT CORRIDOR
2018 43
- regulatory body.
2. ACCESS indicator – shares 80 % in the overall result of the index. It is focused on the
analysis of conditional and complete barriers to access of new railway undertakings to the railway
market. ACCESS thematic areas:
- conditions for obtaining the license and the safety certificate,
- access mode,
- access to the railway network,
- information barriers,
- system of charging for rail infrastructure and service facilities,
- access to service facilities.
The ACCESS indicator also evaluates the extent to which liberalization of the rail transport
services market shares in the modal split and the development of the number of railway undertakings.
In particular, the shift in transport performances in favour of rail transport is being monitored. The
indicator separately assesses the segments of freight, suburban and long distance rail passenger
transport. All analysed and examined areas of the liberalization index are scored and then counted,
taking into account the ratios of individual countries:
- over 800 points advanced state,
- from 600 to 799 opening up the market as planned,
- from 300 to 599 points delayed state.
Figure 16 shows the liberalization index for passenger and freight rail transport in EU countries,
Switzerland and Norway, issued by IBM Germany in 2011.
Figure 16: Liberalization index for passenger and freight rail transport, 2011
(Source: IBM Germany, 2011)

TRANSPORT MARKET STUDY
AMBER RAIL FREIGHT CORRIDOR
2018 44
IBM Germany Liberalization Index, 2011 is currently the most up-to-date and the most
objective tool to demonstrate the achieved level of liberalization process of rail transport services
market in the evaluated countries. Figure 16 demonstrates the divergence in the level of rail transport
market liberalization in EU countries due to the different implementation of EU legislative measures
in the national legislation of the member states. The rail markets of the Polish, Slovak and Hungarian
Republics have reached an advanced state in the market opening process. In evaluation, the Republic
of Slovenia has reached the state – opening the market as planned. On the basis of the facts, we can
confirm the appropriate conditions for doing business in the rail transport sector and providing
transport services of the railway system in the Amber RFC countries. Based on the knowledge and
experience, we can confirm the increasing level of the liberalization process in EU countries as well
as in the Amber RFC countries.
5.2 The European Railway Performance Index
Data on the Railway Performance Index were obtained from the website:
https://www.bcg.com/publications/2017/transportation-travel-tourism-2017-european-railway-
performance-index.aspx. Elaboration and evaluation of the study „The European Railway
Performance Index” were carried out by the Boston Consulting Group.
BCG’s 2017 European Railway Performance Index (RPI) report provides insights for
stakeholders seeking to answer this question. The RPI enables the most comprehensive benchmarking
of European railway operations by considering the three critical components of railway performance:
intensity of use, quality of service, and safety. The 2017 RPI report follows from the first two editions,
published in 2012 and 2015. Over the five-year period covered by the three RPI studies, countries
have generally remained within the same performance tiers.
Safety and quality of service (especially punctuality) are the most important factors underlying
changes in a system’s performance. Countries experiencing a decrease in overall performance
typically have seen a decrease in their safety rating, while those with improving performance have
usually experienced an increase in their quality of service rating.
The RPI measures the performance of railway systems in three dimensions for both passenger
and freight traffic:
- Intensity of Use: To what extent is rail transport used by passengers and freight companies?
- Quality of Service: Are the trains punctual and fast, and is rail travel affordable?
- Safety: Does the railway system adhere to the highest safety standards?
The analysis was confined to these dimensions to create an indicator that is comprehensive
yet easy to understand. Each dimension comprises at least two subdimensions, and all were given

TRANSPORT MARKET STUDY
AMBER RAIL FREIGHT CORRIDOR
2018 45
equal weight. The data were rescaled to represent a score of 0 to 10 for each subdimension. To create
the index, the ratings for each dimension and subdimension based on their weighting were combined.
The index’s simplicity results in three methodological biases:
- Passenger performance is overweighted relative to freight performance because reliable
information about the quality of service for freight operators especially in terms of price and
punctuality is unavailable. Consequently, the RPI for a particular country may not necessarily
reflect high quality in the country’s freight services.
- Large countries are favoured relative to smaller countries because the quality-of-service
dimension takes into account the share of high-speed-rail travelers. That is significant because
high-speed travel is more common in countries with railway networks that cover long distances.
- Countries in which consumers have low purchasing power are favoured relative to those in
which purchasing power is higher, because average fares were not adjusted on the basis of
purchasing power parity (PPP). Nevertheless, a PPP adjustment would have only a small
impact on countries’ rankings, since it would mainly reinforce differences between tiers.
The following figure shows each country’s performance, overall and for each of the three
dimensions, as weighted in accordance with the methodology. The exhibit also shows each country’s
RPI ranking in 2012 and 2015, for comparison.
Figure 17: RPI ranking in 2017
(Source: the Boston Consulting Group)

TRANSPORT MARKET STUDY
AMBER RAIL FREIGHT CORRIDOR
2018 46
Tier One - the railways in tier one perform well in at least two dimensions, although the results
were not uniform.
Tier Two - countries in tier two have high-performing railway systems overall. The similarity
among their RPI ratings, however, obscures a wide range of results among the three dimensions. The
highest-ranked systems have high safety scores, but low scores for quality and intensity of use.
Tier Three - the railway systems in almost all the tier three countries have poor safety ratings.
One exception is Ireland: its safety rating is among the highest in the index. Slovenia, Hungary, and
Slovakia are rated very good for intensity of use, while Lithuania, Latvia, and Poland are close behind
with ratings of good. Portugal, Romania, and Bulgaria in addition to Ireland have poor ratings for
intensity of use.
Changes in safety and quality have the greatest impact. Safety and quality of service (especially
punctuality) appear to be the most important factors underlying changes in a system’s performance.
There were only small variations in intensity of use from year to year, and these have little impact on
overall performance. A decrease in safety is typically the factor responsible for an overall decrease
in performance. Countries with improving performance usually experience an increase in their quality
of service rating.
The growth of the railway system effectiveness was also recorded in the countries which spend
higher investments (investment and non-investment subsidies) in the railway system. Overall, as in
2012 and 2015, this year’s study shows a correlation between public cost and a given railway system’s
performance level as measured by the RPI (Figure 18). In addition, it reveals differences in the value
that countries receive in return for their public cost. Denmark, Finland, France, Germany, the
Netherlands, Sweden, and Switzerland capture relatively high value for their money. These countries
outperform relative to the average ratio of performance to cost for all countries. In contrast,
Luxembourg, Belgium, Latvia, Slovakia, Portugal, Romania, and Bulgaria get relatively low value
for their money.

TRANSPORT MARKET STUDY
AMBER RAIL FREIGHT CORRIDOR
2018 47
Figure 18: Correlation between public cost and a given railway system’s performance level
(Source: the Boston Consulting Group)
The analysis not only confirmed the correlation between public cost and performance, but also
found that it applies over time. Countries that recently increased their public cost have been rewarded
with the highest performance improvements (this is especially true for Finland). During the same
period, stagnating levels of public cost in France and Great Britain, and decreasing levels in Italy and
Sweden, have coincided with the incipient trend of declining performance.
Based on the results of RPI, it is necessary to ensure:
- at least to keep the level of financial resources allocated to the railway system in the countries
with increasing performance,
- adapt the legislation and the transport policy of countries with a lower RPI in favour of the
railway system (e.g. reduction of charges, support of intermodal transport, internalization of
part of negative external costs of transport),
- increase investment and non-investment subsidies in the railway system in the countries with
decrease in performance level (e.g. modernization of lines, electrification, eliminating
bottlenecks),
- take measures to increase the safety and reliability of rail transport (e.g. modernization of
signalling equipment, support of new IT technologies, increase of penalties for railway safety
intruders, take interoperability measures),
- ensure a more efficient maintenance and management of rail transport in the countries with
decrease in performance level (use innovations in the field of railway infrastructure

TRANSPORT MARKET STUDY
AMBER RAIL FREIGHT CORRIDOR
2018 48
diagnostics, efficient management of internal processes, use of new equipment for railway
infrastructure management).
5.3 Analysis of transport infrastructure of the Amber RFC countries
The sustainable economic development of the country depends, inter alia, on the quality, density
and development of transport infrastructure as a tool necessary for the movement of goods and people.
Each country manages and invests in the development and construction of its transport infrastructure.
A high-quality and accessible transport infrastructure contributes to the overall development of the
national economy. Tables 7-9 show an analysis of the development of rail and road infrastructure of
the Amber RFC countries.
Table 7: Length of operated railway lines in km
Country 1995 2000 2005 2010 2012 2013 2014 2015
Poland 23 986 22 560 19 507 19 702 19 617 18 959 18 942 18 510
Slovakia 3 665 3 662 3 658 3 622 3 631 3 631 3 627 3 626
Hungary 7 714 8 005 7 950 7 893 7 877 7 898 7 892 7 894
Slovenia 1 201 1 201 1 228 1 228 1 209 1209 1 209 1 209
Source: Annual reports of the relevant ministries
Table 8: Total length of motorways in km
Source: Annual reports of the relevant ministries
Table 9: Length of other roads in km
Source: Annual reports of the relevant ministries
Based on the statistical data in Tables 7-9, we can confirm the decline in the length of railway
infrastructure in the monitored period in Poland and Slovakia. On the contrary, the increase in the
length of the transport infrastructure is recorded on motorways. The most significant increase is
recorded in the Republic of Poland. The trend of motorway construction is mainly influenced by
performances in individual motoring and road goods transport.
Country 1995 2000 2005 2010 2012 2013 2014 2015
Poland 246 358 552 857 1 365 1 482 1 556 1 559
Slovakia 198 296 328 416 419 420 420 463
Hungary 335 448 859 1 477 1 515 1 767 1 782 1 884
Slovenia 293 427 569 771 769 770 770 773
Country 1995 2000 2005 2010 2012 2013 2014 2015
Poland 372 233 372 725 381 463 406 122 412 035 413 530 415 470 419 636
Slovakia 17 670 17 442 43 417 42 910 42 948 42 943 42 938 42 951
Hungary 29 738 29 533 N/A 198 090 200 426 203 309 204 057 202 998
Slovenia N/A 37 976 37 916 38 303 38 216 38 104 38 114 38 124

TRANSPORT MARKET STUDY
AMBER RAIL FREIGHT CORRIDOR
2018 49
Tables 10 and 11 provide an analysis of the development of expenditures on railway and road
infrastructure maintenance in the Amber RFC countries.
Table 10: Expenditures on railway infrastructure maintenance (mill. EUR – current prices)
Country 1995 2000 2005 2010 2012 2013 2014 2015
Poland 584,8 59,4 82,3 212,8 307,3 387,1 614,2 578,6
Slovakia 60,0 70,9 90,6 120,4 80,6 60,9 70,5 110,5
Hungary 137,8 78,6 233,9 439,5 434,9 418,3 490,1 473,1
Slovenia N/A 7,0 7,0 68,0 87,0 71,0 101,0 110,0
Source: Annual reports of the relevant ministries
Table 11: Expenditures on road infrastructure maintenance (mill. EUR – current prices)
Country 1995 2000 2005 2010 2012 2013 2014 2015
Poland 286,4 448,6 1 263,5 2 636,5 428,0 438,1 383,1 415,4
Slovakia 24,6 66,6 100,3 174,7 192,6 203,6 181,2 201,0
Hungary 96,8 106,8 283,4 328,5 295,9 370,3 272,8 282,1
Slovenia 53,0 79,0 99,0 137,0 120,0 123,0 113,0 126,0
Source: Annual reports of the relevant ministries
The demonstrated overall long-term trend in the growth of expenditures on the analysed
transport infrastructure maintenance in the monitored period is mainly influenced by an increase in
transport performances, aging of transport infrastructure and, in some cases, by neglected diagnostics
which has a preventive role in transport infrastructure maintenance. Maintenance costs of transport
infrastructure will continue to increase as a trend of increase in transport performances of rail and
road transport is expected. The increasing trend of transport performances is influenced by the long-
term economic development of the Amber RFC countries as shown in Chapter 4. The expenditures
on maintenance will also be affected by the technical and technological parameters of the new and
upgraded transport infrastructure that meets the conditions of a quality and safe transport
infrastructure.
Figures 19-22 graphically represent the passing railway corridors for the Amber RFC countries.

TRANSPORT MARKET STUDY
AMBER RAIL FREIGHT CORRIDOR
2018 50
Figure 19: Railway corridors of the Republic of Poland
(Source: ŽSR, VVÚŽ)

TRANSPORT MARKET STUDY
AMBER RAIL FREIGHT CORRIDOR
2018 51
Figure 20: Railway corridors of the Slovak Republic
(Source: ŽSR, VVÚŽ)
Figure 21: Railway corridors of Hungary
(Source: ŽSR, VVÚŽ)

TRANSPORT MARKET STUDY
AMBER RAIL FREIGHT CORRIDOR
2018 52
Figure 22: Railway corridors of the Republic of Slovenia
(Source: ŽSR, VVÚŽ)

TRANSPORT MARKET STUDY
AMBER RAIL FREIGHT CORRIDOR
2018 53
Table 12 provides an analysis of the most important airports, container terminals, sea and inland
waterways ports located in the Amber RFC countries.
Table 12: Analysis of air and water transport infrastructure
Country Airport Sea port Container
terminal - Port
Inland waterways
port
Poland
Warsaw
Kraków
Gdańsk
Katowice
Wrocław
Poznań
Rzeszów
Szczecin
Bydgoszcz
Łódź
Lublin
Zielona Góra
Radom Olsztyn
Szczecin
Świnoujście
Kolobrzeg
Darlowo
Wladyslawowo
Elblag
Gdańsk
Gdynia
Kraków
Warsaw
Włocławek
Bydgoszcz
Gliwice
Opole
Wrocław
Głogów
Nowa Sól
Szczecin
Poznań
Konin
Bratislava
Košice
Slovakia Žilina
Sliač
-
-
Bratislava
Komárno
Poprad Štúrovo Piešťany
Hungary
Budapest
Debrecen
Győr
Pécs-Pogány
Fertőszentmiklós
Nyíregyháza
Siófok
-
-
Győr
Komárom
Budapest
Százhalombatta
Dunaújváros
Paks
Fadd-Dombori
Szeged
Sármellék
Baja
Mohács
Slovenia
Ljubljana
Maribor
Portorož
Piran
Izola
Koper
-
Source: maps of TEN-T
5.4 Rail transport analysis
The subchapter is aimed at the analysis of the most important rail data that are necessary to
determine the Amber RFC routing and draft of its strategic direction. The data also serve as a basis
for drafting the measures to promote rail freight transport. The subchapter also contains a modal split
analysis.
5.4.1 Poland
All data contained in the subchapter was provided by PLK. An important indicator from the
point of view of infrastructure managers is the development of transport performances in rail

TRANSPORT MARKET STUDY
AMBER RAIL FREIGHT CORRIDOR
2018 54
passenger and freight transport. The transport performances demonstrate the utilization of railway
infrastructure over time. On the basis of the above mentioned, Table 13 analyses the development of
total transport performances in the Republic of Poland in the period 2013 – 2016. At the same time,
Table 14 contains an analysis of the development of number of railway undertakings providing
railway infrastructure services in the Republic of Poland.
Table 13: Analysis of transport performances on PLK lines
Mode of transport Carrier Transport
performance/Year 2013 2014 2015 2016
Passenger
transport
National
carrier*
train-km in thous. 43 140 39 481 46 940 58 292
gross tkm in mill. 21 445 16 161 18 459 21 576
Private
carrier
train-km in thous. 92 925 92 106 93 388 96 843
gross tkm in mill. 16 740 15 497 15 359 16 335
Total train-km in thous. 136 065 131 587 140 328 155 135
gross tkm in mill. 38 185 31 658 33 818 37 911
Freight transport
National
carrier*
train-km in thous. 45 814 44 491 42 653 39 461
gross tkm in mill. 64 445 63 573 62 730 56 748
Private
carrier
train-km in thous. 25 711 26 883 28 589 30 862
gross tkm in mill. 34 427 35 565 38 302 42 620
Total train-km in thous. 71 525 71 374 71 242 70 323
gross tkm in mill. 98 872 99 138 101 032 99 368
*As 'national' we assumed the incumbent railway undertaking from PKP Group
Table 14: Structure of rail carriers with valid access agreement
The analysis of transport performances in the Republic of Poland has shown their gradual
increase in rail passenger transport (Total: train-km) and freight transport (Total: gross tkm, 2013
compared to 2016). The increase in passenger transport performances is more important than in rail
freight. In rail freight transport there is a significant decrease in performances of the national carrier
(train-km, gross tkm). At the same time, there is a gradual increase in the number of private carriers
which has been positively shown in increase in the transport performances. The noticed increase in
transport performances is mainly influenced by international transit rail transport.
The analysis of rail transport in the Republic of Poland requires, for the needs of its benefits for
the Amber RFC, the processing of additional data. By reason of presenting and maintaining the
Number of carriers with valid access agreement/Year 2013 2014 2015 2016
Passenger carrier national 1 1 1 1
private 13 14 14 15
Freight carrier national 1 1 1 1
private 61 67 68 69
Total national 2 2 2 2
private 74 81 82 84

TRANSPORT MARKET STUDY
AMBER RAIL FREIGHT CORRIDOR
2018 55
transparency and integrity of rail transport data in the Republic of Poland, the analysis of other data
is carried out in Appendix A in the .xls format. The individual sheets in the Appendix contain the
following data:
- technical parameters of the potential lines for the Amber RFC,
- analysis of transport base in the whole country,
- analysis of planned investments in transport infrastructure,
- analysis of charges,
- analysis of transport performances in rail passenger and freight transport on the potential lines
of the Amber RFC,
- analysis of average running times on the potential lines of the Amber RFC.
Appendix B contains the supplementary data concerning analysis of investment subsidies in the
Republic of Poland.
Based on these analyses, it will be possible to decide on the inclusion of the individual lines in
the Amber RFC. The results of analyses will be used to formulate the conclusions resulting from the
Chapter 5. Consequently, the draft of strategy will be based on the summary results.
The graphs 1 and 2 show a graphical comparison of the modal split in the Republic of Poland
in passenger transport in 2010 compared to 2016 and in freight transport in 2010 compared to 2016.
The comparison is made in the band of 6 years giving a sufficient time span of the market response
to the changes of modal split following the adoption of measures to support rail transport within the
EU.
Graph 1: Comparison of modal split in passenger transport in Poland
(Source: Statistics Poland /www.stat.gov.pl/, Transport – activity results in 2016)

TRANSPORT MARKET STUDY
AMBER RAIL FREIGHT CORRIDOR
2018 56
Graph 2: Comparison of modal split in freight transport in Poland
(Source: Statistics Poland /www.stat.gov.pl/, Transport – activity results in 2016)
Based on the comparison of modal split in the Republic of Poland, we can confirm the decrease
in share of the transport performances in rail transport system in favour of road goods transport and
individual motoring due to large investments in road infrastructure.
5.4.2 Slovakia
All data contained in the subchapter were provided by ŽSR. An important indicator from the
point of view of infrastructure managers is the development of transport performances in rail
passenger and freight transport. The transport performances demonstrate the utilization of railway
infrastructure over time. Based on the above mentioned, the analysis of total transport performances
in the Slovak Republic in the period 2013-2016 is carried out in Table 15. At the same time, Table
16 contains an analysis of the development of number of railway undertakings providing railway
infrastructure services in the Slovak Republic.
Table 15: Analysis of transport performances on ŽSR lines
Mode of
transport Carrier Transport performance/Year 2013 2014 2015 2016
Passenger
transport
National carrier train-km in thous. 30 356 30 724 31 801 31 438
gross tkm in mill. 8 371 8 556 9 373 9 264
Private carrier train-km in thous. 1 215 1 351 2 789 3 170
gross tkm in mill. 136 190 803 1 089
Total train-km in thous. 31 570 32 075 34 590 34 608
gross tkm in mill. 8 508 8 746 10 176 10 352
Freight
transport
National carrier train-km in thous. 11 557 11 240 11 436 11 367
gross tkm in mill. 15 256 15 186 15 210 15 149
Private carrier train-km in thous. 2 518 2 979 3 237 3 739
gross tkm in mill. 2 376 2 795 3 243 3 766
Total train-km in thous. 14 075 14 219 14 673 15 106
gross tkm in mill. 17 632 17 981 18 453 18 915

TRANSPORT MARKET STUDY
AMBER RAIL FREIGHT CORRIDOR
2018 57
Table 16: Structure of rail carriers with valid access agreement
Number of carriers with valid access agreement/Year 2013 2014 2015 2016
Passenger carrier national 1 1 1 1
private 1 4 5 5
Freight carrier national 1 1 1 1
private 42 43 43 41
Passenger and freight carrier national 1 1 1 1
private 0 0 2 3
The analysis of transport performances in the Slovak Republic showed a successive increase in
rail passenger transport (Total: train-km, gross tkm) and freight transport (Total: train-km, gross tkm).
In rail freight transport, there is a slight decrease in performances of the national carrier (train- km,
gross tkm: 2013 compared to 2016). The recorded increase in transport performances in rail freight
transport is influenced by, in particular, international transit rail transport and the situation in the
metallurgical industry and mechanical engineering in SR. Within the development of the number of
carriers, there was recorded a slight decrease in 2016 compared to 2015 and 2014.
The analysis of rail transport in the Slovak Republic requires, for the needs of its benefits for
the Amber RFC, the processing of additional data. By reason of presenting and maintaining the
transparency and integrity of rail transport data in the Slovak Republic, the analysis of other data is
carried out in Appendix A in the .xls format. The individual sheets in the Appendix contain the
following data:
- technical parameters of the potential lines for the Amber RFC,
- analysis of transport performances in rail passenger and freight transport on the potential lines
of the Amber RFC,
- analysis of average running times on the potential lines of the Amber RFC.
Supplementary data of rail transport analysis in the Slovak Republic are listed in Appendix C
which contains the following data:
- analysis of line capacity utilization,
- analysis of average revenues,
- investments in railway infrastructure,
- average charges for railway infrastructure – rail freight transport.
Based on these analyses, it will be possible to decide on the inclusion of individual lines in the
Amber RFC. The results of the analyses will be used to formulate the conclusions resulting from the
Chapter 5. Consequently, the draft of strategy will be based on the summary results.

TRANSPORT MARKET STUDY
AMBER RAIL FREIGHT CORRIDOR
2018 58
The graphs 3 and 4 show a graphical comparison of the modal split in the Slovak Republic in
passenger transport in 2010 compared to 2016 and in freight transport in 2010 compared to 2016. The
comparison is made in the band of 6 years giving a sufficient time span of the market response to the
changes of modal split following the adoption of measures to support rail transport within the EU.
Graph 3: Comparison of modal split in passenger transport in Slovakia
(Source: Statistical office of the SR /www.statistics.sk/,EC - Statistical pocketbook 2017)
Graph 4: Comparison of modal split in freight transport in Slovakia
(Source: Statistical office of the SR /www.statistics.sk/)
Based on the modal split comparison in the Slovak Republic, we can confirm the decrease in
the share of transport performances in rail freight transport in favour of road goods transport. In
passenger transport system, an increase in the share of transport performances in favour of rail
passenger transport was recorded, particularly to the disadvantage of individual motoring.
5.4.3 Hungary
All data contained in the subchapter were provided by GYSEV Zrt, MÁV Zrt. and VPE. Tables
17 and 18 analyse the development of total transport performances in Hungary in the period 2013 –
2016. At the same time, Table 19 contains an analysis of the development of the number of railway
undertakings providing railway infrastructure services in Hungary.

TRANSPORT MARKET STUDY
AMBER RAIL FREIGHT CORRIDOR
2018 59
Table 17: Analysis of transport performances on GYSEV lines
Mode of
transport Carrier
Transport
performance/Year 2013 2014 2015 2016
Passenger
transport
National carrier train-km in thous. 5 017,7 4 935,0 4 974,6 5 163,4
gross tkm in mill. 979,3 928,1 889,1 886,6
Private carrier train-km in thous. 0,9 0,9 0,8 0,3
gross tkm in mill. 0,4 0,2 0,5 0,2
Total train-km in thous. 5 018,6 4 935,9 4 975,4 5 163,8
gross tkm in mill. 979,7 928,4 889,6 886,8
Freight
transport
National carrier train-km in thous. 0,0 0,0 0,0 0,0
gross tkm in mill. 0,0 0,0 0,0 0,0
Private carrier train-km in thous. 1 028,7 981,7 919,2 913,9
gross tkm in mill. 1 066,9 999,1 916,4 904,1
Total train-km in thous. 1 028,7 981,7 919,2 913,9
gross tkm in mill. 1 066,9 999,1 916,4 904,1
On GYSEV infrastructure a gradual increase in rail freight transport performances (train-km,
gross tkm) can be realised especially on the lines of the North-South axis of GYSEV’s infrastructure
of the RFC since the full electrification of lines Csorna – Szombathely – Zalaszentiván took place
and freight trains of Metrans from Dunajska Streda Terminal come via GYSEV infrastructure.
Increasing tendency can be shown on the field of rail passenger transport (Total: gross tkm).
Table 18: Analysis of transport performances on MÁV Zrt. lines
Mode of
transport Carrier
Transport
performance/Year 2013 2014 2015 2016
Passenger
transport
National carrier train-km in thous. 73 846 76 478 76 775 77 020
gross tkm in mill. 18 056 17 847 17 262 17 124
Private carrier train-km in thous. 9 22 17 15
gross tkm in mill. 4 9 7 7
Total train-km in thous. 73 855 76 500 76 792 77 035
gross tkm in mill. 18 060 17 856 17 269 17 131
Freight
transport
National carrier train-km in thous. 0 0 0 0
gross tkm in mill. 0 0 0 0
Private carrier train-km in thous. 17 414 17 024 17 142 16 842
gross tkm in mill. 19 723 20 817 20 904 20 785
Total train-km in thous. 17 414 17 024 17 142 16 842
gross tkm in mill. 19 723 20 817 20 904 20 785
The analysis of transport performances carried out on MÁV Zrt. infrastructure showed an
overall trend of the increase in transport performances in rail passenger transport (Total: train-km).
An overall increase in transport performances is recorded in rail freight transport (Total: gross tkm,
2013 compared to 2016).

TRANSPORT MARKET STUDY
AMBER RAIL FREIGHT CORRIDOR
2018 60
Table 19: Structure of rail carriers with valid access agreement
Number of carriers with valid access agreement/Year 2013 2014 2015 2016 2017
Passenger carrier national 2 2 2 2 2
private 1 1 2 2 2
Freight carrier national 0 0 0 0 0
private 34 34 39 41 43
Passenger and freight
carrier
national 2 2 2 2 2
private 35 35 41 43 45
The analysis of the development of the number of active providers of transport services in
Hungary showed a gradual increase. An increase in the number of transport service providers is a
sign of sufficient transport opportunities in rail transport in Hungary, particularly in transit traffic.
Such an increase will positively affect the quality of railway services and the subsequent increase in
transport performances.
The analysis of rail transport in Hungary requires, for the needs of its benefits for the Amber
RFC, the processing of additional data. Due to presenting and maintaining the transparency and
integrity of rail transport data in Hungary, the analysis of other data is carried out in Appendix A in
the .xls format. The individual sheets in Appendix for the Hungarian railway infrastructure contain
the following data:
- technical parameters of the potential lines for the Amber RFC,
- analysis of transport performances in rail passenger and freight transport on the potential lines
of the Amber RFC,
- analysis of planned investments in transport infrastructure,
- analysis of charges,
- analysis of average running times between border stations.
Supplementary data of rail transport analysis in Hungary are listed in Appendix D which
contains the following data:
- analysis of investment subsidies focused on railway infrastructure,
- analysis of non-investment subsidies,
- analysis of selected economic indicators of transport infrastructure – GYSEV,
- analysis of selected economic indicators of transport infrastructure – MÁV Zrt.
Based on these analyses, it will be possible to decide on the inclusion of the individual lines in
the Amber RFC. The results of analyses will be used to formulate the conclusions resulting from
Chapter 5. Consequently, the strategy draft will be based on the summary results.

TRANSPORT MARKET STUDY
AMBER RAIL FREIGHT CORRIDOR
2018 61
Graphs 5 and 6 show a graphical comparison of modal split in Hungary in 2016 compared to
2010 in passenger transport and in 2016 compared to 2010 in freight transport. The comparison is
made in the band of 6 years giving a sufficient time span of the market response to the changes of
modal split following the adoption of measures to support rail transport within the EU.
Graph 5: Comparison of modal split in passenger transport in Hungary
(Source: Hungarian Central Statistical Office /www.ksh.hu/)
Graph 6: Comparison of modal split in freight transport in Hungary
(Source: Hungarian Central Statistical Office /www.ksh.hu/, Eurostat, EC – Statistical
pocketbook 2017)
Based on the modal split comparison in Hungary, we can confirm a decrease in share of
transport performances in rail passenger transport in favour of road transport. In the freight transport
system, an increase in share of transport performances in favour of rail freight transport was recorded,
especially on the RFC Amber’s infrastructure, mainly thanks to the continuous modernisation
measures of the infrastructure managers concerned. An increase was also recorded in road goods
transport.
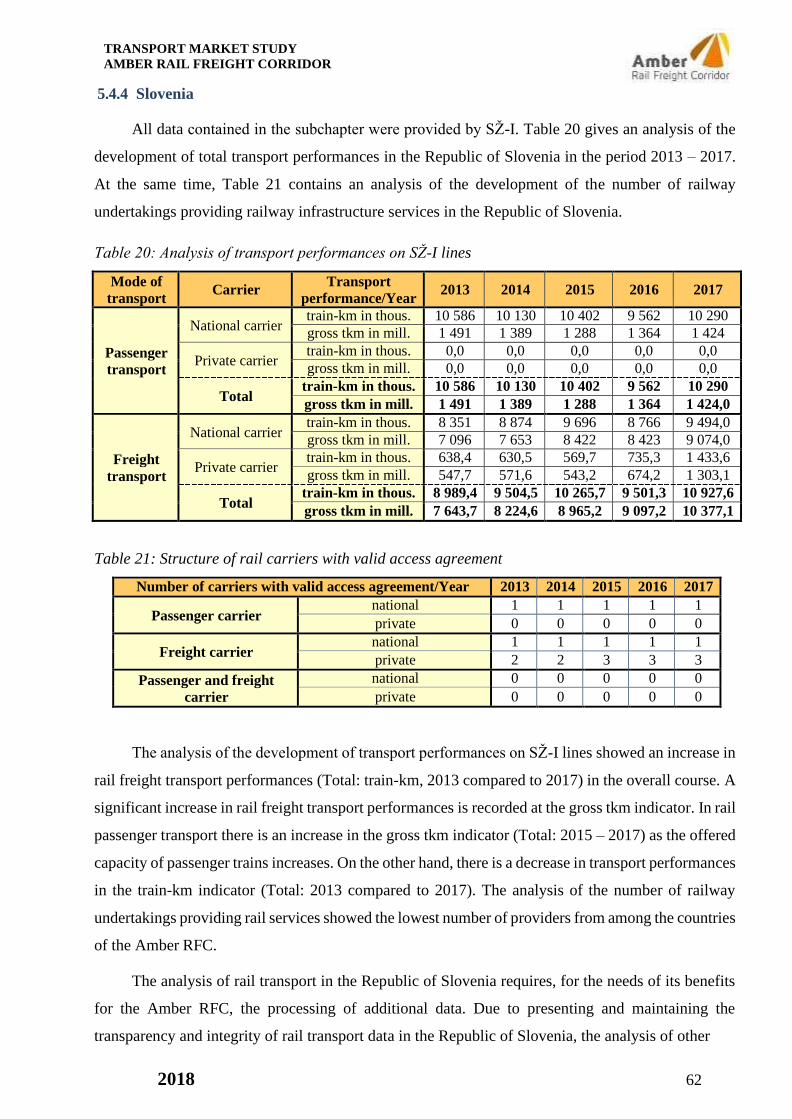
TRANSPORT MARKET STUDY
AMBER RAIL FREIGHT CORRIDOR
2018 62
5.4.4 Slovenia
All data contained in the subchapter were provided by SŽ-I. Table 20 gives an analysis of the
development of total transport performances in the Republic of Slovenia in the period 2013 – 2017.
At the same time, Table 21 contains an analysis of the development of the number of railway
undertakings providing railway infrastructure services in the Republic of Slovenia.
Table 20: Analysis of transport performances on SŽ-I lines
Mode of
transport Carrier
Transport
performance/Year 2013 2014 2015 2016 2017
Passenger
transport
National carrier train-km in thous. 10 586 10 130 10 402 9 562 10 290
gross tkm in mill. 1 491 1 389 1 288 1 364 1 424
Private carrier train-km in thous. 0,0 0,0 0,0 0,0 0,0
gross tkm in mill. 0,0 0,0 0,0 0,0 0,0
Total train-km in thous. 10 586 10 130 10 402 9 562 10 290
gross tkm in mill. 1 491 1 389 1 288 1 364 1 424,0
Freight
transport
National carrier train-km in thous. 8 351 8 874 9 696 8 766 9 494,0
gross tkm in mill. 7 096 7 653 8 422 8 423 9 074,0
Private carrier train-km in thous. 638,4 630,5 569,7 735,3 1 433,6
gross tkm in mill. 547,7 571,6 543,2 674,2 1 303,1
Total train-km in thous. 8 989,4 9 504,5 10 265,7 9 501,3 10 927,6
gross tkm in mill. 7 643,7 8 224,6 8 965,2 9 097,2 10 377,1
Table 21: Structure of rail carriers with valid access agreement
Number of carriers with valid access agreement/Year 2013 2014 2015 2016 2017
Passenger carrier national 1 1 1 1 1
private 0 0 0 0 0
Freight carrier national 1 1 1 1 1
private 2 2 3 3 3
Passenger and freight
carrier
national 0 0 0 0 0
private 0 0 0 0 0
The analysis of the development of transport performances on SŽ-I lines showed an increase in
rail freight transport performances (Total: train-km, 2013 compared to 2017) in the overall course. A
significant increase in rail freight transport performances is recorded at the gross tkm indicator. In rail
passenger transport there is an increase in the gross tkm indicator (Total: 2015 – 2017) as the offered
capacity of passenger trains increases. On the other hand, there is a decrease in transport performances
in the train-km indicator (Total: 2013 compared to 2017). The analysis of the number of railway
undertakings providing rail services showed the lowest number of providers from among the countries
of the Amber RFC.
The analysis of rail transport in the Republic of Slovenia requires, for the needs of its benefits
for the Amber RFC, the processing of additional data. Due to presenting and maintaining the
transparency and integrity of rail transport data in the Republic of Slovenia, the analysis of other

TRANSPORT MARKET STUDY
AMBER RAIL FREIGHT CORRIDOR
2018 63
data is carried out in Appendix A in the .xls format. The individual sheets in Appendix A for the
Slovenian railway infrastructure contain the following data:
- technical parameters of the potential lines for belonging to the Amber RFC,
- analysis of transport performances in rail passenger and freight transport on the potential lines
belonging of the Amber RFC,
- analysis of planned investments in transport infrastructure,
- analysis of charges,
- analysis of average running times between border stations.
Supplementary data of rail transport analysis in the Republic of Slovenia are listed in Appendix
E which contains the following data:
- statistical average of capacity utilization,
- analysis of investment subsidies focused on railway infrastructure,
- infrastructure access charges.
The results of analyses will be used to formulate the conclusions resulting from Chapter 5.
Consequently, the strategy draft will be based on the summary results.
Graphs 7 and 8 show a graphical comparison of modal split in the Republic of Slovenia in 2015
compared to 2010 in passenger transport and in 2016 compared to 2010 in freight transport. The
comparison is made in the band of 6 years giving a sufficient time span of the market response to the
changes of modal split following the adoption of measures to support rail transport within the EU.
Graph 7: Comparison of modal split in passenger transport in Slovenia
(Source: Republika Slovenija –Statistični Urad /www.stat.si/, Eurostat, EC – Statistical
pocketbook 2017)

TRANSPORT MARKET STUDY
AMBER RAIL FREIGHT CORRIDOR
2018 64
Graph 8: Comparison of modal split in freight transport in Slovenia
(Source: Republika Slovenija –Statistični Urad /www.stat.si/, Eurostat)
Based on the modal split comparison in the Republic of Slovenia there is a decrease in share of
transport performances in rail passenger transport. At the same time, there is a slight decrease in
performances in individual motoring. In the freight transport system, an increase in share of transport
performances in favour of rail freight transport to the disadvantage of road goods transport was
recorded.
5.5 Analysis of transport indicators of the Amber RFC countries
The potential of rail freight transport is influenced by goods flows, particularly at international
level. The goods flows between neighbouring countries create demand for transport services and rail
freight transport is more time-efficient, cost-efficient and socially-efficient than other modes of
transport. At medium and long distances, the efficiency is currently demonstrated also in single wagon
load transport. Therefore, it is necessary to examine the transport potential between the individual
countries of the Amber RFC and then between the neighbouring countries of the established corridor.
The results of the analysis are necessary for the formulation of strategic objectives and tasks of the
Amber RFC as well as for the identification of the transport potential of international rail transport
between EU countries. The analysis of transport potential from countries outside the EU for the
Amber RFC is addressed in Chapter 8.
Table 22 analyses the import and export of goods from/to the Republic of Poland, expressed in
euro, between the Amber RFC countries and the EU countries. Subsequently, the analysis of the
import and export of goods from/to the Republic of Poland, expressed in tonnes, between the Amber
RFC countries and the EU countries, is carried out in Table 23.

TRANSPORT MARKET STUDY
AMBER RAIL FREIGHT CORRIDOR
2018 65
Table 22: Import and Export value from/to Poland in mill. €
Country/ Year 2010 2012 2014 2015 2016
Import value from Poland in mill. €
Total EU 28 countries 89 694 104 896 120 193 135 797 143 344
Slovakia 2 672 3 410 3 804 4 217 4 432
Hungary 3 472 3 424 4 079 4 528 4 632
Slovenia 418 477 547 623 696
Total Amber RFC countries 6 562 7 310 8 429 9 369 9 761
Export value to Poland in mill. €
Total EU 28 countries 99 810 113 135 127 018 138 017 142 928
Slovakia 3 650 5 238 5 515 5 797 5 400
Hungary 2 646 3 069 3 262 3 476 3 907
Slovenia 806 810 977 1 115 1 124
Total Amber RFC countries 7 102 9 117 9 754 10 387 10 431
Source: European Commission - Trade – EU Trade Helpdesk – Statistics
Table 23: Import and export quantity from/to Poland in 1000 t
Source: European Commission - Trade – EU Trade Helpdesk – Statistics
The analysis of the transport flows in Tables 22 and 23 showed the increase in transport
indicators in all monitored indicators and countries. On the basis of the trend of economic growth,
the same trend can be assumed in the years 2018 – 2021. By this, the sufficient transport potential for
rail freight transport within the European transport market has been shown within the Republic of
Poland.
As the transport performance indicator in tonnes is more significant for the needs of evaluation
of rail freight potential, Figure 23 illustrates the goods flows between the neighbouring countries of
the Republic of Poland for 2016, including the percentage share.
Country/ Year 2010 2012 2014 2015 2016
Import quantity from Poland in 1000 t
Total EU 28 countries 63 018 66 935 78 083 82 889 85 918
Slovakia 2 763 2 519 3 362 3 520 3 910
Hungary 1 348 1 419 1 678 2 098 2 289
Slovenia 185 187 213 235 268
Total Amber RFC countries 4 296 4 125 5 253 5 853 6 466
Export quantity to Poland in 1000 t
Total EU 28 countries 63 809 67 053 70 232 70 844 72 922
Slovakia 3 803 4 296 4 596 4 438 4 621
Hungary 1 520 1 787 1 861 1 749 2 065
Slovenia 279 300 327 308 332
Total Amber RFC countries 5 603 6 383 6 784 6 495 7 018

TRANSPORT MARKET STUDY
AMBER RAIL FREIGHT CORRIDOR
2018 66
Figure 23: Graphical representation of import and export of goods in tonnes – Republic of Poland
Table 24 analyses the import and export of goods from/to the Slovak Republic, expressed in
euro, between the Amber RFC countries and the EU countries. Subsequently, the analysis of import
and export of goods from/to the Slovak Republic, expressed in tonnes, between the Amber RFC
countries and the EU countries is carried out in Table 25.

TRANSPORT MARKET STUDY
AMBER RAIL FREIGHT CORRIDOR
2018 67
Table 24: Import and export value from/ to Slovakia in mill. €
Country/ Year 2010 2012 2014 2015 2016
Import value from Slovakia in mill. €
Total EU 28 countries 38 606 47 988 49 770 53 003 55 798
Poland 3 446 4 400 4 469 4 611 4 857
Hungary 2 749 4 166 4 258 4 346 4 516
Slovenia 313 347 324 351 411
Total Amber RFC countries 6 509 8 914 9 051 9 308 9 784
Export value to Slovakia in mill. €
Total EU 28 countries 37 019 45 703 48 166 53 321 53 633
Poland 3 258 3 745 4 202 4 611 4 509
Hungary 3 842 4 792 4 196 4 551 4 624
Slovenia 726 834 1 106 1 349 1 024
Total Amber RFC countries 7 826 9 370 9 504 10 510 10 157
Source: European Commission - Trade – EU Trade Helpdesk – Statistics
Table 25: Import and export quantity from/ to Slovakia in 1000 t
Source: European Commission - Trade – EU Trade Helpdesk – Statistics
The analysis of transport flows in Tables 24 and 25 showed, in overall comparison, increase in
transport indicators with a slight fluctuating decrease. However, the increase is recorded at the
indicator of transported tonnes within the Amber RFC countries. On the basis of the trend of economic
growth, the upward trend in the years 2018 – 2021 can be assumed for both indicators examined. By
this, the sufficient transport potential for the rail freight transport within the European transport
market has been shown within the Slovak Republic and thus sufficient transport potential for the use
of the Amber RFC services.
Country/ Year 2010 2012 2014 2015 2016
Import quantity from Slovakia in 1000 t
Total EU 28 countries 28 075 28 690 30 131 31 354 32 540
Poland 3 886 4 558 4 208 3 776 4 156
Hungary 2 934 3 348 4 131 4 668 5 080
Slovenia 230 257 220 248 273
Total Amber RFC countries 7 050 8 164 8 559 8 692 9 510
Export quantity to Slovakia in 1000 t
Total EU 28 countries 22 386 23 706 24 589 27 543 27 435
Poland 3 430 3 136 3 687 4 018 4 125
Hungary 3 293 3 706 3 072 3 381 3 464
Slovenia 431 489 467 631 594
Total Amber RFC countries 7 155 7 331 7 226 8 030 8 184

TRANSPORT MARKET STUDY
AMBER RAIL FREIGHT CORRIDOR
2018 68
Since the transport performance indicator in tonnes is more significant for the needs of the
evaluation of rail freight potential, Figure 24 shows the goods flows between the neighbouring
countries of the Slovak Republic for 2016, including the percentage share.
Figure 24: Graphical representation of import and export of goods in tonnes – Slovak Republic
In order to assess the Amber RFC transport potential, the analysis of import and export of goods
from/to Hungary, expressed in euro, between the Amber RFC countries and the EU countries is
carried out in Table 26. Subsequently, the analysis of import and export of goods from/to the

TRANSPORT MARKET STUDY
AMBER RAIL FREIGHT CORRIDOR
2018 69
Hungary, expressed in tonnes, between the Amber RFC countries and the EU countries is carried
out in Table 27.
Table 26: Import and export value from/ to Hungary in mill. €
Country/ Year 2010 2012 2014 2015 2016
Import value from Hungary in mill. €
Total EU 28 countries 51 901 57 255 61 557 67 424 69 991
Poland 2 379 2 766 2 871 2 943 3 349
Slovakia 3 433 3 969 3 766 4 185 4 195
Slovenia 805 1 000 1 031 1 014 1 012
Total Amber RFC countries 6 617 7 735 7 668 8 142 8 556
Export value to Hungary in mill. €
Total EU 28 countries 44 005 50 604 58 338 63 368 64 935
Poland 3 406 3 488 4 359 4 774 4 810
Slovakia 3 364 4 524 4 074 3 881 4 001
Slovenia 914 929 1 186 1 255 1 312
Total Amber RFC countries 7 684 8 941 9 619 9 910 10 123
Source: European Commission - Trade – EU Trade Helpdesk – Statistics
Table 27: Import and export quantity from/ to Hungary in 1000 t
Source: European Commission - Trade – EU Trade Helpdesk – Statistics
The analysis of transport flows in Tables 26 and 27 confirmed, in overall comparison, increase
in the transport indicators only slightly fluctuating. On the basis of the economic growth trend, the
upward trend in the years 2018 – 2021 can be assumed for both indicators examined. The total
increase in transport flows in tonnes is recorded between the EU countries and Hungary, with more
significant increase in goods transport recorded between Hungary and the Amber RFC countries.
Moreover, the increase in value of transported goods is shown. On the basis of the facts, the sufficient
transport potential for rail freight transport within the European transport market is
Country/ Year 2010 2012 2014 2015 2016
Import quantity from Hungary in 1000 t
Total EU 28 countries 27 624 29 863 30 220 31 419 32 243
Poland 1 425 1 632 1 674 1 622 1 905
Slovakia 2 781 2 953 2 647 2 998 3 189
Slovenia 1 020 1 256 1 013 1 060 1 106
Total Amber RFC countries 5 226 5 841 5 333 5 681 6 199
Export quantity to Hungary in 1000 t
Total EU 28 countries 22 198 22 763 26 181 26 410 27 446
Poland 1 583 1 582 1 910 2 235 2 509
Slovakia 3 153 4 118 4 832 4 814 5 148
Slovenia 865 679 812 922 1 083
Total Amber RFC countries 5 601 6 379 7 555 7 971 8 740

TRANSPORT MARKET STUDY
AMBER RAIL FREIGHT CORRIDOR
2018 70
shown in case of Hungary and, therefore, the sufficient transport potential for the use of the Amber
RFC services, too.
Since the transport performance indicator in tonnes is more significant for the needs of rail
freight transport, Figure 25 shows the goods flows between the neighbouring countries of Hungary
for 2016, including the percentage share.
Figure 25: Graphical representation of import and export of goods in tonnes – Hungary
To determine the transport potential, Table 28 analyses the import and export of goods from/to
the Republic of Slovenia, expressed in euro, between the Amber RFC countries and the EU countries.
Subsequently, the analysis of import and export of goods from/to the Republic of

TRANSPORT MARKET STUDY
AMBER RAIL FREIGHT CORRIDOR
2018 71
Slovenia, expressed in tonnes, between the Amber RFC countries and the EU countries is carried
out in Table 29.
Table 28: Import and export value from/ to Slovenia in mill. €
Country/ Year 2010 2012 2014 2015 2016
Import value from Slovenia in mill. €
Total EU 28 countries 14 176 16 390 19 064 20 055 20 777
Poland 646 665 788 864 839
Slovakia 544 685 1 205 1 304 1 031
Hungary 654 794 1 040 1 124 1 225
Total Amber RFC countries 1 844 2 144 3 032 3 292 3 095
Export value to Slovenia in mill. €
Total EU 28 countries 15 796 17 211 18 067 18 999 19 823
Poland 425 471 572 628 683
Slovakia 359 468 481 479 469
Hungary 755 921 931 898 966
Total Amber RFC countries 1 538 1 860 1 984 2 005 2 118
Source: European Commission - Trade – EU Trade Helpdesk – Statistics
Table 29: Import and export quantity from/ to Slovenia in 1000 t
Source: European Commission - Trade – EU Trade Helpdesk – Statistics
Based on the findings from Tables 28 and 29, we can confirm the upward trend in transport
performances between the Amber RFC countries and the Republic of Slovenia. Moreover, the
increase in transport performances between the EU countries and the Republic of Slovenia is
confirmed for both transport indicators in overall course. Based on the expected economic growth
trend, the upward trend in the years 2018 – 2021 can be assumed for both indicators. The analysis
showed increase in the value of goods transported. The analysis carried out confirms the sufficient
Country/ Year 2010 2012 2014 2015 2016
Import quantity from Slovenia in 1000 t
Total EU 28 countries 10 490 11 566 12 807 13 542 14 242
Poland 249 288 321 278 280
Slovakia 250 394 500 487 457
Hungary 499 560 683 819 960
Total Amber RFC countries 998 1 241 1 505 1 584 1 697
Export quantity to Slovenia in 1000 t
Total EU 28 countries 12 766 13 557 14 539 15 236 16 175
Poland 213 207 280 271 285
Slovakia 248 270 281 247 323
Hungary 995 1 115 1 013 1 022 1 002
Total Amber RFC countries 1 456 1 592 1 573 1 539 1 610

TRANSPORT MARKET STUDY
AMBER RAIL FREIGHT CORRIDOR
2018 72
transport potential for rail freight transport within the European transport market and, therefore,
sufficient transport potential for the use of the Amber RFC services in the Republic of Slovenia, too.
Within transport capacities, there is sufficient potential for transport between the Republic of Slovenia
and the other countries of the Amber RFC, particularly in intermodal transport and single wagon load
transport.
As the transport performance indicator in tonnes is more significant for the needs of evaluation
of rail freight potential, Figure 26 illustrates the goods flows between the neighbouring countries of
the Republic of Slovenia for 2016, including the percentage share.
Figure 26: Graphical representation of import and export of goods in tonnes – Republic of Slovenia

TRANSPORT MARKET STUDY
AMBER RAIL FREIGHT CORRIDOR
2018 73
The following figure shows all registered transport flows between the Amber RFC countries
and all EU countries in tonnes for the year 2016.
Figure 27: Graphical representation of import and export of goods in tonnes - summary
5.6 Analysis of intermodal transport terminals
The basic objectives of the transport policy of the Amber RFC countries include reducing
greenhouse gas emissions and finding ways to reduce the environmental burden of transport. One
way to meet these objectives is the intermodal transport. The intermodal transport is efficient, safe,
reliable and cost-competitive. The provision of intermodal transport services requires, inter alia,
adequate location of intermodal transport terminals and sufficient transport infrastructure (appropriate
connection of terminals to road and rail infrastructure) and advanced technical equipment (wagons,
unit loads and loading units).
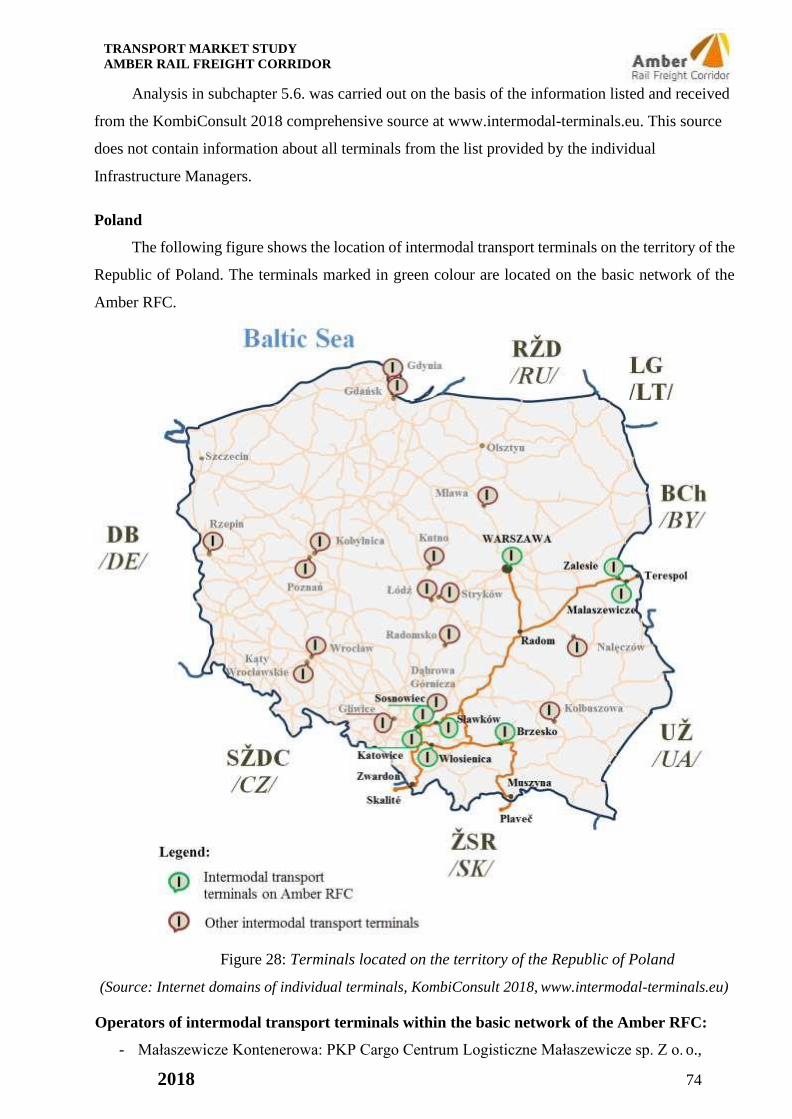
TRANSPORT MARKET STUDY
AMBER RAIL FREIGHT CORRIDOR
2018 74
Analysis in subchapter 5.6. was carried out on the basis of the information listed and received
from the KombiConsult 2018 comprehensive source at www.intermodal-terminals.eu. This source
does not contain information about all terminals from the list provided by the individual
Infrastructure Managers.
Poland
The following figure shows the location of intermodal transport terminals on the territory of the
Republic of Poland. The terminals marked in green colour are located on the basic network of the
Amber RFC.
Figure 28: Terminals located on the territory of the Republic of Poland
(Source: Internet domains of individual terminals, KombiConsult 2018, www.intermodal-terminals.eu)
Operators of intermodal transport terminals within the basic network of the Amber RFC:
- Małaszewicze Kontenerowa: PKP Cargo Centrum Logisticzne Małaszewicze sp. Z o. o.,

TRANSPORT MARKET STUDY
AMBER RAIL FREIGHT CORRIDOR
2018 75
- EUROPORT Małaszewicze Duże: EUROSPORT Sp. z o.o.,
- Terminal przeładunkowy Wólka (Zalesie): PKP - Cargo Connect Sp. z o.o.,
- Transgaz S.A., Zalesie: Transgaz S.A. Terminal Gazów,
- Containerterminal Warszawa: Cargosped Sp. Z o.o.,
- Warszawa Główna Towarowa- Container Terminal: Spedcont,
- Terminal Kontenerowy Warszawa: PKP Cargo Connect Sp. z o.o.,
- Loconi Intermodal Terminal Kontenerowy Warszawa: Loconi Intermodal S.A.,
- Polzug Terminal Kontenerowy Pruszków: POLZUG Intermodal Polska Sp. z o.o.,
- Euroterminal Sławków: Euroterminal Sławków Ltd,
- Brzeski terminal kontenerowy: Karpiel sp. Z o. o.,
- Terminal kontenerowy Włosienica: Baltic Rail AS,
- Terminal Sosnowiec Południowy: Spedcont.
Tables 30 gives basic information on intermodal transport terminals located on the basic
network of the Amber RFC.
Table 30: Basic information on intermodal transport terminals in the Republic of Poland
Intermodal transport terminals on Amber RFC Connectivity*
Area (m2)
Storage Capacity Road Rail Water
Małaszewicze Terminal Kontenerowy 40 000 1 632 TEU
EUROPORT Małaszewicze Duże 86 000 1 300 TEU
Terminal przeładunkowy Wólka (Zalesie) 57 000 N/A
Transgaz S.A., Zalesie N/A 1 000 m3
Containerterminal Warszawa 24 000 1 200 TEU
Warszawa Główna Toworowa- Container Terminal 18 600 1 000 TEU
Terminal Kontenerowy Warszawa 30 000 N/A
Loconi Intermodal Terminal Kontenerowy
Warszawa
68 000 2 000 TEU
Polzug Terminal Kontenerowy Pruszków 44 600 1 500 TEU
Euroterminal Sławków 93 000 3 500 TEU
Brzeski terminal kontenerowy 100 000 5 000 TEU
Terminal kontenerowy Włosienica 100 000 780 TEU
Terminal Sosnowiec Południowy N/A N/A
*Note: YES/NO
Source: Internet domains of individual terminals, KombiConsult 2018, www.intermodal-terminals.eu,
www.utk.gov.pl

TRANSPORT MARKET STUDY
AMBER RAIL FREIGHT CORRIDOR
2018 76
Continuation of Table 30:
Intermodal transport terminals on Amber RFC
Number of tracks /
Usable length of tracks (m) Gantry
cranes
(number)
Reach
stacker
(number) 1 520 mm 1 435 mm
Małaszewicze Terminal Kontenerowy 2/1 766 2/1 746 3 2
EUROPORT Małaszewicze Duże -/1 300 -/1 300 N/A N/A
Terminal przeładunkowy Wólka (Zalesie) -/2 254 -/3 104 N/A N/A
Transgaz S.A., Zalesie - N/A N/A N/A
Containerterminal Warszawa - 1/320 0 3
Warszawa Główna Towarowa - Container Terminal - 2/715 2 0
Terminal Kontenerowy Warszawa - -/3 680 N/A N/A
Loconi
Warszawa
Intermodal Terminal Kontenerowy - 2/1 040 0 3
Polzug Terminal Kontenerowy Pruszków -/650 0 8
Euroterminal Sławków -/17 521 -/24 256 1 4
Brzeski terminal kontenerowy - 6/3 200 0 1
Terminal kontenerowy Włosienica - 1/400 0 1
Terminal Sosnowiec Południowy - N/A N/A N/A
Source: Internet domains of individual terminals, KombiConsult 2018, www.intermodal-terminals.eu,
www.utk.gov.pl
Slovakia
The following figure shows the location of intermodal transport terminals on the territory of the
Slovak Republic. The terminals marked in green colour are located on the basic network of the Amber
RFC.
Figure 29: Terminal located on the territory of the Slovak Republic
(Source: Internet domains of individual terminals, KombiConsult 2018, www.intermodal-terminals.eu)

TRANSPORT MARKET STUDY
AMBER RAIL FREIGHT CORRIDOR
2018 77
Operators of intermodal transport terminals within the basic network of the Amber RFC:
- Terminal Košice – Haniska pri Košiciach: Metrans Danubia, a. s.,
- Terminal Žilina: Rail Cargo Operator,
- Terminal Žilina-Teplička,
- Bratislava ÚNS: Rail Cargo Operator,
- Bratislava Pálenisko: SPaP, a. s.,
- Rail Hub Terminal Dunajská Streda: Metrans (Danubia) a. s.
Table 31 gives the basic information on intermodal transport terminals located on the basic
network of the Amber RFC.
Table 31: Basic information on intermodal transport terminals in the Slovak Republic
Intermodal transport terminals on
Amber RFC
Connectivity* Area (m2)
Storage Capacity
(TEU) Road Rail Water
Terminal Košice 25 000 3 000
Terminal Žilina 16 000 N/A
Bratislava ÚNS 34 500 N/A
Bratislava Pálenisko 24 000 1 400
Rail Hub Terminal Dunajská Streda 280 000 25 000
*Note: YES/NO
Source: Internet domains of individual terminals, KombiConsult 2018, www.intermodal-terminals.eu
Continuation of Table 31:
Intermodal transport terminals on
Amber RFC
Number of
tracks
Usable length of
tracks (m)
Gantry cranes
(number)
Reach stacker
(number)
Terminal Košice 2 300 2 2
Terminal Žilina 4 1 520 0 3
Bratislava ÚNS 3 912 1 1
Bratislava Pálenisko 2 450 3 3
Rail Hub Terminal Dunajská Streda 9 5 450 4 6
Source: Internet domains of individual terminals, KombiConsult 2018, www.intermodal-terminals.eu
Hungary
The following figure shows the location of intermodal transport terminals on the territory of
Hungary. The terminals marked in green colour are located on the basic network of the Amber RFC.

TRANSPORT MARKET STUDY
AMBER RAIL FREIGHT CORRIDOR
2018 78
Figure 30: Terminals located on the territory of Hungary
(Source: Internet domains of individual terminals, KombiConsult 2018, www.intermodal-terminals.eu)
Operators of intermodal transport terminals within the basic network of the Amber RFC:
- Sopron Container Terminal: GYSEV Cargo Zrt.,
- Kombiterminál Törökbálint: Törökbálint Container Terminal Kft.,
- Budapest BILK: Budapest BILK Co. Ltd.,
- Mahart Container Center, Budapest: MAHART Container Center Ltd.
Table 32 gives the basic information on intermodal transport terminals located on the basic
network of the Amber RFC.
Table 32: Basic information on intermodal transport terminals in Hungary
Intermodal transport terminals on
Amber RFC
Connectivity* Area (m2)
Storage Capacity
(TEU) Road Rail Water
Sopron container terminal 40 500 1 500
Kombiterminál Törökbálint 35 000 6 000
Budapest BILK 223 000 220 000
Mahart Container Center, Budapest 105 000 5 800
*Note: YES/NO
Source: Internet domains of individual terminals, KombiConsult 2018, www.intermodal-terminals.eu

TRANSPORT MARKET STUDY
AMBER RAIL FREIGHT CORRIDOR
2018 79
Continuation of Table 32:
Intermodal transport terminals on
Amber RFC
Number of
tracks (m)
Usable length of
tracks (m)
Gantry cranes
(number)
Reach stacker
(number)
Sopron container terminal 6 1 960 2 2
Kombiterminál Törökbálint 3 600 N/A 3
Budapest BILK 11 6 800 2 8
Mahart Container Center, Budapest 5 2 120 N/A 9
Source: Internet domains of individual terminals, KombiConsult 2018, www.intermodal-terminals.eu
Slovenia
The following figure shows the location of intermodal transport terminals on the territory of
Slovenia. The terminals marked in green colour are located on the basic network of the Amber RFC.
Figure 31: Terminals located on the territory of Slovenia
(Source: Internet domains of individual terminals, KombiConsult 2018, www.intermodal-terminals.eu)
Operators of intermodal transport terminals within the basic network of the Amber RFC:
- Koper Luka KT: Luka Koper D.D – Port of Koper PLC,
- Ljubljana Moste: Slovenske železnice - Tovorni promet, d.o.o.,
- Celje: Slovenske železnice - Tovorni promet, d.o.o.
Table 33 gives the basic information on intermodal transport terminals located on the basic
network of the Amber RFC.

TRANSPORT MARKET STUDY
AMBER RAIL FREIGHT CORRIDOR
2018 80
Table 33: Basic information on intermodal transport terminals in Slovenia
Intermodal transport
terminals on Amber RFC
Connectivity* Area (m2)
Storage Capacity
(TEU) Road Rail Water
Koper Luka KT 270 000 19 130
Ljubljana Moste 99 250 1 270
Celje 6 500 80
*Note: YES/NO
Source: Internet domains of individual terminals, KombiConsult 2018, www.intermodal-terminals.eu
Continuation of Table 33:
Intermodal transport
terminals on Amber RFC
Number of
tracks (m)/
Usable length of
tracks (m)
Gantry cranes
(number)
Reach stacker
(number)
Koper Luka KT 9 4 640 3 8
Ljubljana Moste 4 2 000 1 2
Celje 20 5 000 0 1
Source: Internet domains of individual terminals, KombiConsult 2018, www.intermodal-terminals.eu
Analysis of intermodal transport terminals within the Amber RFC countries showed:
- appropriate location of terminals within the Amber RFC rail network,
- significant part of intermodal transport terminals located in the Amber RFC countries is
connected with the Amber RFC infrastructure,
- potential of increase in the transport performances of intermodal transport trains on the
Amber RFC lines,
- sufficient technical base of intermodal transport terminals,
- sufficient capacity to handle TEU,
- perspective of cooperation between the Amber RFC and intermodal transport terminals.

TRANSPORT MARKET STUDY
AMBER RAIL FREIGHT CORRIDOR
2018 81
5.7 Results and summary of the findings of Chapter 5
Based on the data presented in the individual subchapters of the fifth part of TMS, we can state
determine:
- realised process of liberalization of rail transport services market in the Amber RFC countries:
confirmed by Liberalization Index (Figure 16),
- potential for cooperation between RFCs network: results from the geographic connection of
individual RFC corridors, some common line sections and strategic objectives of the corridors,
- general overall increase in rail freight transport performances in the Amber RFC countries:
shown by the analysis of transport performances in the individual countries of the Amber RFC,
- general overall increase in rail passenger transport performances in the Amber RFC countries:
shown by the analysis of transport performances in the individual countries of the Amber RFC
and increasing demand of passengers influenced by a higher quality of services, a higher offer
of transport services, poor technical condition of road infrastructure and congestions,
- general increase in rail freight transport performances on the lines considered to be included in
the Amber RFC in the Polish, Slovak and Slovenian Republics: shown by the analysis of
transport performances in rail freight transport on the lines to be included in the Amber RFC.
Increase in performances will be affected by the Amber RFC services, its strategic routing,
increasing quality of transport services (influenced by the liberalization process) and economic
development (described in Chapter 4),
- general increase in rail passenger transport performances on the lines considered to be included
in the Amber RFC in the Polish, Slovak and Slovenian Republics: shown by the analysis of
transport performances in rail passenger transport on the lines to be included in the Amber RFC.
Increase in performances will be affected by the increasing quality of transport services
(influenced by the liberalization process) and economic development (described in Chapter 4),
- change of modal split in favour of rail freight transport in Hungary and the Republic of Slovenia
(road transport increased in Republic of Poland, Slovak republic and Hungary): affected by
higher quality of transport services, RFC corridor services, investments in the railway system
and higher demand (higher demand for rail freight services results also from the conclusions of
Chapter 4),
- change of modal split in favour of rail passenger transport in the Slovak Republic (road transport
increase in the Republic of Poland and Hungary): affected by higher quality of

TRANSPORT MARKET STUDY
AMBER RAIL FREIGHT CORRIDOR
2018 82
transport services, higher offer of transport services, investments in the railway system and
higher demand (higher demand for rail passenger services results also from the conclusions of
Chapter 4),
- intention of all Amber RFC infrastructure managers and ministries involved to invest in the
lines considered for the Amber RFC: results from the transport policy of individual countries,
the EU’s objectives in the development and modernization of the European rail network and
operational needs (increase in transport performances, cost reduction, shortening of travel time),
- general reduction of the railway infrastructure charges for rail freight services: on the basis of
the implementation of Directive 2012/34/EU of the European Parliament and of the Council
establishing a single European railway area, and the harmonization of transport infrastructure
charging,
- overall increase of providers of rail transport services: can be assumed based on the analysis of
development of number of carriers in the Amber RFC countries, at the same time, it is affected
by the achieved level of the liberalization process (Figure 16) and the higher interest in business
in railway transport. An increase in business interest is due to higher demand and the results of
the economic analysis carried out in Chapter 4,
- transport potential for the Amber RFC services between the Amber RFC countries and the EU
countries: due to the increasing trade between the Amber RFC countries and the other EU
member states, graphically shown in Figure 27,
- growth in demand for transport services within the Amber RFC countries: due to the increasing
trade between the Amber RFC countries, graphically shown in Figures 23-26,
- potential for the development of intermodal transport: affected by the location of intermodal
transport terminals within the Amber RFC, the higher quality of services provided, the system
measures of the EU and member states designed to support intermodal transport, the
investments of intermodal operators, the growth of transport requirements from the Port of
Koper to Central and Western Europe,
- potential for the development of single wagon load transport in international traffic: increasing
number of business entities, dense railway network of the Amber RFC countries, the
construction of new sidings, measures to support sidings by the countries.
On the basis of the facts listed, the strategic tools and measures to support rail freight services,
to support the growth in demand for rail services and the Amber RFC services will be proposed in
the final chapter of the TMS.

TRANSPORT MARKET STUDY
AMBER RAIL FREIGHT CORRIDOR
2018 83
6 PROGNOSIS OF TRANSPORT PERFORMANCE DEVELOPMENT
Several aspects affecting infrastructure, quality of services and external costs result from
transport performances. Therefore, it is necessary to know the development of transport performances
in order to form the objectives and the subsequent strategy of the Amber RFC. The development of
transport performances is assumed on the basis of the prognosis that includes three scenarios for the
Amber RFC: realistic, optimistic and pessimistic.
Forecasting deals with prediction of the future development of organization, society, economy,
transport, environment, etc. The aim is to get an idea of the future state which is based on rational
ways of prediction. The forecasts obtained are of great importance for strategic management, risk
management and planning.
Forecasting has connection with:
- planning,
- targeting,
- organizing,
- decision-making.
Forecast creation process:
1. Problem formulation.
2. Formulation and definition of necessary information and data.
3. Data collection.
4. Data reduction and condensation.
5. Forecast model creation.
6. Forecast generation using the selected algorithm and using GDP.
7. Forecast evaluation.
Bases for forecast:
1. Model used for forecast: AAA algorithm with exponential alignment.
2. Confidence interval: 95 %.
3. Time span of forecast: 2019 – 2026 (8 years).
4. Examined indicator: transport performances in rail passenger and freight traffic.
5. Input data: provided by individual infrastructure managers, annual reports.
6. Presentation of results:
- in tabular form for each scenario separately,
- overall comparison of individual forecast scenarios in the form of graph.
7. It is a long-term forecast in terms of time.
TRANSPORT MARKET STUDY
AMBER RAIL FREIGHT CORRIDOR
2018 84
8. Forecast was created using an appropriate forecasting software.
Forecast risks:
1. Economic cycle – recession, period of crisis during forecasted period.
2. Inaccuracy of provided data.
3. Insufficient interval of data provided.
4. Low level of investment in railway infrastructure – inadequate state of railway infrastructure
required by customers (e.g. capacity, frequent possessions).
5. Change in transport infrastructure charging – increase in rail charges and decrease in charges
for other modes of transport.
6. Significant shift of transport performances to other modes of transport.
The forecast was elaborated based on the available information on rail transport performances
and using the AAA algorithm. It calculates or predicts a future value based on existing (historical)
values by using the AAA version of the Exponential Smoothing algorithm. The predicted value is a
continuation of the historical values in the specified target date, which should be a continuation of the
timeline. This prognosis method does not take into account e.g. major changes in the infrastructure
(e.g. new construction of lines, changes of infrastructure parameters, such as longer trains, etc.) nor
major changes in the competition between modes. You can use this function to predict future sales,
transport performances, inventory requirements, or consumer trends.
Arguments used within the forecast:
Target date Required. The data point for which you want to predict a value. Target date can be
date/time or numeric – the period 2019-2026.
Values Required. Values are the historical values, for which you want to forecast the next points –
transport performances of passenger and freight trains (gross tkm, train-km) on the railway
infrastructure of the Amber RFC countries (2015-2017), forecast of GDP development in individual
corridor member states (in %, the period 2019-2026, forecast of the European Commission and the
European Central Bank).
Timeline Required. The independent array or range of numeric data. The dates in the timeline must
have a consistent step between them and can’t be zero – the period 2015-2017.
Seasonality Optional. A numeric value. The default value of 1 means program detects seasonality
automatically for the forecast and uses positive, whole numbers for the length of the seasonal pattern.
0 indicates no seasonality, meaning the prediction will be linear – the used value 1 based on which
the algorithm calculated seasonality.

TRANSPORT MARKET STUDY
AMBER RAIL FREIGHT CORRIDOR
2018 85
Table description:
Table 34 – realistic scenario, prognosis of the development of total transport performances of rail
system in individual countries and on lines included in the Amber RFC.
Table 35 – optimistic scenario, prognosis of the development of total transport performances of rail
system in individual countries and on lines included in the Amber RFC.
Table 36 – pessimistic scenario, prognosis of the development of total transport performances of
rail system in individual countries and on lines included in the Amber RFC.
The difference between the individual prognosis scenarios is due to setting the input parameters
of deviation and sensitivity for individual scenarios. For processing the prognosis, the mean degree
of deviation was selected at the level of 5 points – most frequently used for traffic forecasting.
Subsequently, the software and algorithm used calculated the outputs for individual prognosis
scenarios, listed in Tables 34, 35 and 36.

TRANSPORT MARKET STUDY
AMBER RAIL FREIGHT CORRIDOR
2018 86
Table 34: Prognosis – Realistic scenario
IM Mode of
transport Scope
Transport
performance/ Year 2019 2020 2021 2022 2023 2024 2025 2026
PLK
Passenger transport
total
train-km in thous. 170 740 177 667 184 594 191 521 198 448 205 375 212 302 219 229
gross tkm in mill. 41 606 43 050 44 494 45 939 47 383 48 828 50 272 51 716
on RFC
train-km in thous. 14 572 14 854 15 136 15 418 15 699 15 981 16 263 16 545
gross tkm in mill. 3 978 4 093 4 208 4 323 4 438 4 552 4 667 4 782
Freight
transport
total
train-km in thous. 83 443 85 572 87 701 89 830 91 959 94 088 96 217 98 345
gross tkm in mill. 119 977 123 705 127 433 131 160 134 888 138 616 142 344 146 071
on
RFC
train-km in thous. 9 495 9 906 10 318 10 729 11 141 11 553 11 964 12 376
gross tkm in mill. 14 013 14 699 15 384 16 070 16 756 17 442 18 128 18 813
ŽSR
Passenger
transport
total
train-km in thous. 37 205 38 377 39 549 40 721 41 892 43 064 43 064 45 408
gross tkm in mill. 11 590 12 297 13 004 13 710 14 417 15 124 15 831 15 830
on RFC
train-km in thous. 11 654 12 050 12 446 12 842 13 238 13 633 14 029 14 425
gross tkm in mill. 4 429 4 682 4 934 5 187 5 439 5 691 5 944 6 196
Freight
transport
total
train-km in thous. 15 908 16 277 16 646 17 015 17 384 17 753 18 122 18 491
gross tkm in mill. 19 922 20 369 20 815 21 262 21 709 22 155 22 602 23 049
on RFC
train-km in thous. 5 480 5 785 6 090 6 395 6 701 7 006 7 311 7 616
gross tkm in mill. 6 488 6 844 7 201 7 557 7 914 8 270 8 627 8 983
MAV
Zrt. +
GYSEV
Passenger
transport
total
train-km in thous. 85 850 86 883 87 915 88 948 89 981 91 014 92 047 93 080
gross tkm in mill. 18 111 18 264 18 571 18 826 19 212 19 736 19 998 20 157
on
RFC
train-km in thous. 22 216 22 684 23 098 23 415 23 821 24 189 24 608 24 891
gross tkm in mill. 5 212 5 424 5 616 5 931 6 187 6 442 6 887 7 184
Freight
transport
total
train-km in thous. 18 086 18 234 18 621 19 148 19 823 20 184 20 531 21 038
gross tkm in mill. 22 707 23 158 23 800 24 485 25 012 25 354 25 700 26 053
on
RFC
train-km in thous. 7 752 7 952 8 255 8 878 9 101 9 601 10 015 10 858
gross tkm in mill. 9 235 10 158 10 800 11 425 11 980 12 357 12 977 13 324
SŽ-I
Passenger
transport
total train-km in thous. 9 695 9 393 9 121 8 962 8 797 8 536 8 342 8 123
gross tkm in mill. 1 324 1 278 1 232 1 203 1 197 1 176 1 141 1 109
on RFC
train-km in thous. 6 895 6 939 6 982 7 026 7 070 7 114 7 158 7 202
gross tkm in mill. 746 713 701 697 683 675 669 654
Freight
transport
total
train-km in thous. 10 279 10 486 10 693 10 900 11 108 11 315 11 522 11 730
gross tkm in mill. 9 970 10 485 10 999 11 514 12 029 12 543 13 058 13 572
on RFC
train-km in thous. 8 093 8 404 8 716 9 027 9 339 9 650 9 962 10 273
gross tkm in mill. 8 067 8 444 8 822 9 199 9 577 9 955 10 332 10 710
Total
Passenger transport
total
train-km in thous. 303 490 312 320 321 179 330 152 339 118 347 989 355 755 365 840
gross tkm in mill. 72 631 74 889 77 301 79 678 82 209 84 864 87 242 88 812
on
RFC
train-km in thous. 55 337 56 527 57 662 58 701 59 828 60 917 62 058 63 063
gross tkm in mill. 14 365 14 912 15 459 16 138 16 747 17 360 18 167 18 816
Freight
transport
total
train-km in thous. 127 716 130 569 133 661 136 893 140 274 143 340 146 392 149 604
gross tkm in mill. 172 576 177 717 183 047 188 421 193 638 198 668 203 704 208 745
on
RFC
train-km in thous. 30 820 32 047 33 379 35 029 36 282 37 810 39 252 41 123
gross tkm in mill. 37 803 40 145 42 207 44 251 46 227 48 024 50 064 51 830

TRANSPORT MARKET STUDY
AMBER RAIL FREIGHT CORRIDOR
2018 87
Table 35: Prognosis – Optimistic scenario
IM Mode of
transport Scope
Transport
performance/Year 2019 2020 2021 2022 2023 2024 2025 2026
PLK
Passenger
transport
total
train-km in thous. 181 941 190 196 198 327 206 365 214 329 222 234 230 088 237 900
gross tkm in mill. 48 355 51 491 54 344 57 023 59 580 62 046 64 441 66 779
on
RFC
train-km in thous. 15 919 16 538 17 101 17 629 18 133 18 619 19 090 19 550
gross tkm in mill. 4 656 5 006 5 307 5 581 5 838 6 082 6 315 6 542
Freight
transport
total
train-km in thous. 88 977 93 021 96 668 100 096 103 379 106 558 109 657 112 693
gross tkm in mill. 127 925 134 402 140 310 145 903 151 288 156 523 161 645 166 674
on
RFC
train-km in thous. 10 358 10 769 11 181 11 593 12 004 12 416 12 828 13 239
gross tkm in mill. 15 327 16 013 16 699 17 384 18 070 18 756 19 442 20 128
ŽSR
Passenger
transport
total
train-km in thous. 39 005 40 200 41 394 42 589 43 784 44 979 46 173 47 368
gross tkm in mill. 12 410 13 131 13 851 14 572 15 292 16 013 16 734 17 454
on RFC
train-km in thous. 12 427 12 831 13 234 13 638 14 042 14 445 14 849 15 252
gross tkm in mill. 4 791 5 048 5 305 5 563 5 820 6 077 6 335 6 592
Freight
transport
total
train-km in thous. 16 450 16 834 17 217 17 600 17 983 18 366 18 748 19 131
gross tkm in mill. 20 400 20 858 21 317 21 775 22 233 22 691 23 149 23 607
on
RFC
train-km in thous. 5 754 6 070 6 386 6 703 7 019 7 334 7 650 7 966
gross tkm in mill. 6 767 7 135 7 503 7 871 8 239 8 607 8 975 9 343
MAV
Zrt. +
GYSEV
Passenger
transport
total
train-km in thous. 90 143 91 227 92 311 93 395 94 480 95 565 96 649 97 734
gross tkm in mill. 18 745 18 903 19 221 19 485 19 884 20 427 20 698 20 862
on
RFC
train-km in thous. 23 327 23 818 24 253 24 586 25 012 25 398 25 838 26 136
gross tkm in mill. 5 394 5 614 5 813 6 139 6 404 6 667 7 128 7 435
Freight
transport
total
train-km in thous. 18 990 19 146 19 552 20 105 20 814 21 193 21 558 22 090
gross tkm in mill. 23 502 23 969 24 633 25 342 25 887 26 241 26 600 26 965
on
RFC
train-km in thous. 8 140 8 350 8 668 9 322 9 556 10 081 10 516 11 401
gross tkm in mill. 9 697 10 666 11 340 11 996 12 579 12 975 13 626 13 990
SŽ - I
Passenger transport
total
train-km in thous. 10 241 10 187 10 063 9 899 9 821 9 934 10 164 10 289
gross tkm in mill. 1 477 1 434 1 406 1 384 1 372 1 389 1 426 1 483
on
RFC
train-km in thous. 7 324 7 378 7 432 7 486 7 539 7 592 7 645 7 698
gross tkm in mill. 846 804 796 783 792 813 839 852
Freight
transport
total
train-km in thous. 11 437 11 678 11 919 12 159 12 398 12 637 12 875 13 113
gross tkm in mill. 10 510 11 037 11 565 12 092 12 620 13 147 13 675 14 202
on
RFC
train-km in thous. 8 635 8 952 9 270 9 587 9 905 10 223 10 540 10 858
gross tkm in mill. 8 486 8 871 9 256 9 641 10 026 10 411 10 796 11 180
Total
Passenger transport
total
train-km in thous. 321 330 331 810 342 094 352 248 362 414 372 711 383 074 393 291
gross tkm in mill. 80 987 84 960 88 822 92 464 96 128 99 875 103 299 106 578
on
RFC
train-km in thous. 58 997 60 566 62 020 63 339 64 726 66 054 67 423 68 636
gross tkm in mill. 15 688 16 472 17 221 18 066 18 853 19 639 20 618 21 421
Freight
transport
total
train-km in thous. 135 855 140 679 145 356 149 960 154 574 158 754 162 838 167 027
gross tkm in mill. 182 336 190 266 197 825 205 112 212 028 218 603 225 068 231 448
on
RFC
train-km in thous. 32 886 34 141 35 505 37 205 38 484 40 054 41 533 43 464
gross tkm in mill. 40 277 42 685 44 798 46 893 48 914 50 749 52 839 54 641

TRANSPORT MARKET STUDY
AMBER RAIL FREIGHT CORRIDOR
2018 88
Table 36: Prognosis – Pessimistic scenario
IM Mode of
transport Scope
Transport
performance/Year 2019 2020 2021 2022 2023 2024 2025 2026
PLK
Passenger
transport
total
train-km in thous. 159 538 165 138 170 861 176 677 182 567 188 517 194 517 200 559
gross tkm in mill. 34 856 34 609 34 644 34 855 35 187 35 609 36 103 36 654
on
RFC
train-km in thous. 13 225 13 170 13 170 13 206 13 266 13 344 13 436 13 539
gross tkm in mill. 3 299 3 179 3 108 3 064 3 037 3 023 3 019 3 023
Freight
transport
total
train-km in thous. 77 909 78 122 78 733 79 564 80 539 81 617 82 776 83 998
gross tkm in mill. 112 030 113 007 114 555 116 418 118 489 120 708 123 043 125 468
on
RFC
train-km in thous. 8 631 9 043 9 455 9 866 10 278 10 690 11 101 11 513
gross tkm in mill. 12 699 13 385 14 070 14 756 15 442 16 128 16 813 17 499
ŽSR
Passenger
transport
total
train-km in thous. 35 095 36 232 37 370 38 508 39 646 40 783 41 921 43 059
gross tkm in mill. 10 686 11 372 12 058 12 744 13 431 14 117 14 803 15 489
on RFC
train-km in thous. 10 794 11 178 11 562 11 947 12 331 12 715 13 100 13 484
gross tkm in mill. 4 038 4 283 4 528 4 773 5 018 5 263 5 508 5 754
Freight
transport
total
train-km in thous. 15 223 15 574 15 926 16 278 16 630 16 981 17 333 17 686
gross tkm in mill. 19 254 19 685 20 117 20 548 20 979 21 410 21 841 22 273
on
RFC
train-km in thous. 5 161 5 452 5 743 6 035 6 326 6 618 6 910 7 202
gross tkm in mill. 6 153 6 494 6 836 7 178 7 520 7 862 8 204 8 546
MAV
Zrt. +
GYSEV
Passenger
transport
total
train-km in thous. 84 133 85 145 86 157 87 169 88 181 89 194 90 206 91 218
gross tkm in mill. 17 749 17 899 18 200 18 449 18 828 19 341 19 598 19 754
on
RFC
train-km in thous. 21 772 22 230 22 636 22 947 23 345 23 705 24 116 24 393
gross tkm in mill. 5 108 5 316 5 504 5 812 6 063 6 313 6 749 7 040
Freight
transport
total
train-km in thous. 17 634 17 778 18 155 18 669 19 327 19 679 20 018 20 512
gross tkm in mill. 22 253 22 695 23 324 23 995 24 512 24 847 25 186 25 532
on
RFC
train-km in thous. 7 558 7 753 8 049 8 656 8 873 9 361 9 765 10 587
gross tkm in mill. 9 050 9 955 10 584 11 197 11 740 12 110 12 717 13 058
SŽ - I
Passenger transport
total
train-km in thous. 8 964 8 840 8 726 8 576 8 398 8 297 8 164 7 964
gross tkm in mill. 1 164 1 135 1 101 1 094 1063 1048 1016 984
on
RFC
train-km in thous. 6 412 6 446 6 480 6 514 6 548 6 583 6 617 6 652
gross tkm in mill. 642 631 619 603 587 571 549 536
Freight
transport
total
train-km in thous. 9 066 9 238 9 412 9 586 9 761 9 936 10 111 10 287
gross tkm in mill. 9 350 9 847 10 344 10 841 11 338 11 835 12 332 12 828
on
RFC
train-km in thous. 7 490 7 793 8 095 8 398 8 700 9 002 9 305 9 607
gross tkm in mill. 7 581 7 948 8 315 8 681 9 048 9 414 9 781 10 147
Total
Passenger transport
total
train-km in thous. 287 730 295 355 303 114 310 930 318 792 326 790 334 808 342 800
gross tkm in mill. 64 454 65 014 66 003 67 142 68 508 70 115 71 520 72 881
on
RFC
train-km in thous. 52 203 53 024 53 848 54 614 55 489 56 347 57 268 58 068
gross tkm in mill. 13 087 13 409 13 759 14 252 14 705 15 170 15 826 16 353
Freight
transport
total
train-km in thous. 119 831 120 713 122 227 124 097 126 257 128 214 130 238 132 483
gross tkm in mill. 162 887 165 234 168 340 171 803 175 317 178 800 182 402 186 101
on
RFC
train-km in thous. 28 841 30 041 31 341 32 955 34 177 35 671 37 081 38 908
gross tkm in mill. 35 483 37 781 39 805 41 812 43 750 45 514 47 516 49 250

TRANSPORT MARKET STUDY
AMBER RAIL FREIGHT CORRIDOR
2018 89
Graph 9 for graphical comparison shows the overall prognosis of the development of rail freight
transport performances in the Amber RFC countries for all scenarios. Subsequently, graph 10 for
graphical comparison shows the overall development of rail freight transport performances forecasted
on the lines included in the Amber RFC for all scenarios.
Graph 9: Comparison of prognosis scenarios of total freight transport performances
Graph 10: Comparison of prognosis scenarios of freight transport performances on the Amber
RFC lines

TRANSPORT MARKET STUDY
AMBER RAIL FREIGHT CORRIDOR
2018 90
Based on the graphical representation of the prognosis of the development of total rail freight
transport performances, we can conclude in both comparisons the forecasted linear increase in
transport performances in all scenarios. The prognosis shows a more significant difference between
the pessimistic and the realistic scenario, mainly influenced by the risks of the forecast model and the
input data.
Based on the findings from the forecast, we can conclude:
- increase in transport performances in rail freight transport system,
- higher increase in rail freight transport performances on the lines included in the Amber RFC,
- general increase in rail passenger transport performances (total: gross tkm, train-km),
- increase in transport performances and resulting savings in negative social costs generated by
transport,
- increased demands on capacity and technical parameters of lines included in the Amber RFC,
- requirements for modernization, reconstruction and optimization of the Amber RFC railway
infrastructure and related rail, road, water and intermodal infrastructure,
- higher quality of communication and information technologies required,
- pressure on higher reliability of the rail system,
- requirement to meet the technical specifications for interoperability in rail passenger and
freight transport,
- increase in international rail freight transport performances by approximately 3 – 6 % per
year,
- pressure on the harmonisation of charges between rail and road freight transport,
- development of transport performances below the pessimistic scenario in the event of
a significant impact of defined forecast risks.

TRANSPORT MARKET STUDY
AMBER RAIL FREIGHT CORRIDOR
2018 91
7 ANALYSIS OF PORT OF KOPER IN THE REPUBLIC OF SLOVENIA
The Port of Koper lies in the Republic of Slovenia, in the northern part of the Adriatic Sea. Due
to its exceptional location, it connects the Central and Eastern Europe with the Mediterranean. It is
currently one of the most important seaports in the Southern Europe. It is also an important intermodal
centre connected to the Trans-European Transport Network.
Vision until 2030: the Port of Koper (Luka Koper) wants to be the leading operator of port services
between the seaports in the Southern Europe and the global provider of logistics solutions for the
region of Central and Eastern Europe.
Mission: provide a reliable port system, development and support of global logistics solutions to the
heart of Europe according to the demands of the economy and the most demanding clients.
Basic objectives resulting from the vision and mission:
- Flexible, modern and competitive port provider,
- Reliable and efficient contractor of quality port services,
- A successful business system of long-term stability,
- Promoter of complete logistics solutions,
- Optimal use of a single track railway: on average 82 freight trains per day, i.e. 14.2 million
tonnes of cargo by rail,
- Diligent institutionalised stakeholder of sustainable development.
Due to its location, the Port of Koper is connected to the following major European transport
networks and corridors:
1. CNC corridors:
- Baltic – Adriatic Corridor,
- Mediterranean Corridor.
2. Rail Freight Corridors (RFCs) :
- RFC 5 (Baltic – Adriatic): Gdynia – Katowice – Ostrava / Žilina – Bratislava / Vienna /
Klagenfurt – Udine – Venice / Trieste/ Bologna / Ravenna / Graz – Maribor – Ljubljana –
Koper / Trieste,
- RFC 6 (Mediterranean): Almería – Valencia / Madrid – Zaragoza / Barcelona – Marseille –
Lyon – Turin – Milan – Verona – Padua / Venice – Trieste / Koper – Ljubljana – Budapest –
Zahony (Hungarian – Ukrainian border),

TRANSPORT MARKET STUDY
AMBER RAIL FREIGHT CORRIDOR
2018 92
- RFC 10 (Alpine-Western Balkan): Salzburg – Villach – Ljubljana –/ Wels/Linz – Graz –
Maribor – Zagreb – Vinkovci/Vukovar – Tovarnik – Beograd – Sofia – Svilengrad (Bulgarian-
Turkish border),
- RFC 11 (Amber): Koper – Ljubljana/Zalaszentivan – Sopron/Csorna/(Hungarian – Serbian
border) – Kelebia – Budapest – Komárom – Leopoldov/Rajka – Bratislava – Žilina –
Katowice/Kraków – Warszawa/Łuków – Terespol – (Polish – Belarusian border)
3. Transport networks according to the European agreement on important international combined
transport lines and related installations.
7.1 Basic information about the Port of Koper
The Port of Koper is managed and developed by Luka Koper d. d., a public limited company
(in 2016 there were 886 employees). It is responsible for maintaining the high level of shipping and
cargo traffic operations in the Port of Koper. The services are available day and night, 365 days a
year. The Port of Koper includes 12 terminals with a total quay length of 3 300 meters designed for
handling and storing the part load consignments, oversize loads, containers, RO-RO technology, cars
and dry bulk and liquid cargoes.
The Port of Koper is part of the North Adriatic Ports Association (NAPA), which also includes
the ports of Trieste, Venice, Ravenna and Rijeka. The combination of these ports represents the most
inexpensive waterway connecting the Europe with the Far East (http://www.portsofnapa.com/about-
napa). It is a multimodal gateway created for major European markets. The Association also deals
with coordinated planning of road, rail and maritime infrastructures as well as harmonization of
regulations and procedures in the field of port services provision.
The Port of Koper, with its significant position in the Southern Europe, is the member of the
following international organization:
1. ESPO (The European Sea Ports Organisation) represents the port authorities, port associations
and port administrations of the seaports of 23 Member States of the European Union and
Norway at EU political level.
2. MedCruise (The Association of Mediterranean Cruise ports) has 72 members representing more
than 100 Mediterranean ports, including the area of the Black Sea, the Red Sea and the Near
Atlantic, as well as 32 associated members representing other associations.
3. FEPORT (The Federation of European Private Port Companies and Terminals) was established
in 1993 and represents the interests of a large variety of terminal operators and stevedoring
companies performing operation in the ports. It currently includes more than 400 terminals in
the seaports of the European Union and more than 1200 companies.

TRANSPORT MARKET STUDY
AMBER RAIL FREIGHT CORRIDOR
2018 93
Basic technical characteristics of the Port of Koper:
Total port area: 2 800 000 m2
Enclosed warehousing area: 247 000 m2
Covered storage area: 76 000 m2
Open storage area: 900 000 m2
Pier total length: 3 300 m
Maximum sea depth: 18 m
Basic technical characteristics of the container terminal:
Total terminal area: 270 000 m2
Stacking area: 180 000 m2
Pier length: 596 m
Railway tracks (number x length in m): 5 x 700 m, 2 x 270 m, 2 x 300 m
Storage capacity – marine terminal: 19 130 TEU
Storage capacity – empty containers: 9 547 TEU
Equipment Lift capacity (ton)
3 STS panamax cranes 40 (40 feet)/ 45 (2 x 20 feet) under spreader
4 STS post-panamax cranes 51 (40 feet)/ 65 (2 x 20 feet) under spreader
4 STS Super post-panamax cranes 51 (40 feet)/ 65 (2 x 20 feet) under spreader
22 Rubber – Tyred G/C (storage area) 40 t
3 Rail Mounted Gantries (railway) 40 t
12 Reach Stackers 42 – 45 t
8 ECH – empty container handler 7 – 9 t
The basic port activity is carried out at specialised terminals, which are technically and
organisationally suitable for handling and warehousing of specific cargo groups. The port has a
railway and road connection, production facilities, workshops, garages and other necessary
complementary facilities.
In addition to basic services, the additional services are provided in the port (e.g. stripping and
stuffing of containers, dewaxing and waxing of vehicles, mechanical, painting and body repair
services, bananas palletization, wood protection against mould and pests etc.).

TRANSPORT MARKET STUDY
AMBER RAIL FREIGHT CORRIDOR
2018 94
The Port of Koper has 12 specialized terminals:
- Container Terminal
- Car and Ro-Ro terminal
- General cargo terminal
- Reefer terminal
- Timber terminal
- Dry bulk terminal
- Silo terminal
- Alumina terminal
- Iron ore and coal terminal
- Liquid cargoes terminal
- Livestock terminal
- Cruise terminal
The following figure shows the structure of the Port of Koper. The white line indicates the
main road infrastructure and the black line indicates the railway infrastructure network.
Figure 32: Individual terminals and their location within the Port of Koper
(Source: http://www.portsofnapa.com/port-of-koper)

TRANSPORT MARKET STUDY
AMBER RAIL FREIGHT CORRIDOR
2018 95
The railway infrastructure within the Port of Koper ensures the efficiency and broad
possibilities of transporting all goods handled in all twelve terminals of the port. The infrastructure
also provides necessary transport services for Central and Eastern Europe.
The following table shows the individual scheduled routes including their frequency from the
Port of Koper.
Table 37: Overview of scheduled routes from Port of Koper
Country Route Frequency
Austria
Koper – Graz (Adria Transport) 10 x weekly
Koper – Villach – antenna to Viena, Linz, Salzburg,
Wolfurt (RCO/ Adria Kombi)
up to 5 trains/ week
Koper – Enns (Metrans) 2 x weekly (via Ybbs –
Krems)
Hungary
Koper – Budapest BILK (Adria Kombi) 7 trains weekly
Koper – Budapest Mahart (Metrans) Up to 14 trains/ week
Koper – Budapest Törökbálint (Integrail) 3 trains/ week
Koper – Budapest Mahart (Integrail) 2 x weekly
Koper – Budapest Mahart (EP Cargo) 2 x weekly
Slovakia
Koper – Bratislava (Adria Kombi) 4 trains/ week
Koper – Dunajská Streda – various destinations
(Metrans)
Up to 14 trains/ week
Koper – Žilina –KIA (Metrans) Up to 7 trains/ week
Czech
republic
Koper – Dobra u Fridku Mystku (Adria Kombi –
dedicated)
4 trains/ week
Koper – Ostrava (Metrans) 2 x weekly
Koper – Paskov (AWT dedicated) 1 x weekly
Koper – Dunajska Streda – Zlin – Prague (Metrans –
via Dunajska Streda
Daily
Poland Koper – Wroclaw (Siechnice) – Ostrava – Koper
(Baltic Rail)
2 trains/ week
Germany Koper – Ljubljana – München (Adria Kombi) 5 trains/ week
Koper - München (Adria Kombi) 3 x weekly (direct service)
Slovenia Koper – Ljubljana – Celje – Maribor (Adria Kombi) 2 trains/ day
Bulgaria Koper – Sofia (Adria Kombi) Spot train
Romania Koper – Arad (Adria Transport) 1 train/ week
Italy Koper – Padova (Adria Kombi dedicated) 1 train/ week
Serbia
Koper – Novi Sad (via Budapest) (Adria Kombi/
Transagent d.o.o.)
Weekly service
Koper – Ljubljana – Beograd (Adria Kombi) 2 x weekly
Croatia Koper – Ljubljana – Zagreb (Adria Kombi) 2 x weekly
Source: www.luka-kp.si

TRANSPORT MARKET STUDY
AMBER RAIL FREIGHT CORRIDOR
2018 96
7.2 Analysis of the Port of Koper throughput
The significant location and the technical and technological facilities of the Port of Koper have
a favourable effect on the demand for the services provided. The interest in the services of the Port
of Koper by the transport operators can be determined using the analysis of the reached throughput.
Based on the need to determine the demand for the port services provided and demonstrate strategic
importance for the Amber corridor, the following graph analyses the throughput reached in the Port
of Koper in the period 2005 – 2017. The analysis is focused on the throughput of goods handled in
tons.
Graph 11: Overview of achieved throughputs in tons in Port of Koper
(Source: Annual reports of Luka Koper, Port of Koper)
The analysis showed the overall increase in throughput over the analysed period. In total, 23
366 959 tons of goods were handled in 2017 (by 6% more than in 2016) which represents an increase
of 78.84 % in comparison with 2005. During 2014 – 2017 there was an increase in all monitored
goods except for General cargo, where a fluctuating trend was recorded. The most significant increase
among the surveyed goods was achieved in the container transport. In 2017, container throughput
accounted for 38.8 % of total throughput, while in 2005, it accounted for only
13.5 %. Based on these facts, we can deduce potential for increase in container transport in the coming
years.

TRANSPORT MARKET STUDY
AMBER RAIL FREIGHT CORRIDOR
2018 97
The following graph shows the progress of the reached throughput in number of pieces, TEU,
and passengers in the period 2005 - 2017.
Graph 12: Overview of reached throughput in quantified amount in the Port of Koper
(Source: Annual reports of Luka Koper, Port of Koper)
Based on the figures in the graph, we can confirm an increase of throughput in the number of
containers and vehicles. On the contrary, the number of passengers has a decreasing trend and the
number of vessels has a fluctuating trend. In 2017, 911 528 TEU were handled in the Port of Koper,
which is by 731 783 TEU more than in 2005. With the throughput of TEU the Port of Koper is now
classified as the first in the Adriatic region. In the case of the number of pieces of vehicles handled,
there is increase by 123.1 % in 2017 compared to 2005.
Investments are necessary to maintain the current state and the subsequent development of the
Port of Koper within the competitive fight. The following table shows the development of investments
in real estate, machinery and equipment in the Port of Koper.
Table 38: Investment development in Port of Koper in 2012 - 2016
Year 2012 2013 2014 2015 2016
Luka Koper, d. d. 17 768 219 14 522 369 28 485 811 36 871 798 60 313 916
Luka Koper Group TOTAL 18 639 095 14 825 864 29 958 975 37 402 753 61 781 064
Source: Annual Report of Luka Koper
Investments have a generally increasing trend. The Luka Koper,d.d. made investments in the
amount of EUR 60 313 916 EUR in 2016, what is by 23 442 118 EUR more than in the previous year.
In 2016, Luka Koper, d.d. invested EUR 18.1 million in the ordered 12 new high-capacity

TRANSPORT MARKET STUDY
AMBER RAIL FREIGHT CORRIDOR
2018 98
cranes. From the point of view of increasing competitiveness and capacity, it is the most effective
valuation of investment resources with planning for the future. Within the container terminal, the
funds have been invested in the new RMG technology that allows simultaneous handling of five train
sets as well as the use of cranes for large container handling (capacity 20 000 TEU). By 2020, the
capacity of the container terminal is planned to increase to 1.3 million TEU per year.
The important facts and opportunities for the Amber corridor:
- nearly two thirds of the cargo arrives to and leaves the port by rail,
- the Hungarian railway operating company Integrail will establish a new container block train
connection between the Port of Koper container terminal and the Budapest Mahart Container
Center terminal. The service runs from 15 March 2018 through two trains a week.
- the Slovenian railway operator Adria Kombi introduced a new direct railway service between
Luka Koper Container Terminal and DUSS-Terminal München-Riem. The service runs from
March 6, 2018 three times per week in both directions. The Germany represent an important
market for the Port of Koper, from the fruit and vegetable supplies from the Mediterranean
countries to the transport of Volkswagen vehicles. The Bavaria is one of the most developed
and the export-oriented Germany regions that represent a big potential for the Port of Koper.
- in September, 2017, the Czech railway operator, EP Logistics started a new direct block train
connection between Luka Koper Container Terminal to Budapest Mahart Terminal.
On the basis of the presented facts about the Port of Koper, which concerned the location,
division, technical and technological equipment and demand for its services, we can confirm its
strategic importance for the Amber corridor. The port is an important gateway especially for the goods
transported in TEU from Asia to the European hinterland, mainly to Central and Eastern Europe. This
creates the possibilities to get transportations for the Amber corridor, as an increase in the intermodal
transport performances can be expected in the next period. The development of the port, its services
and the resulting demand from transport operators create a perspective for effective and efficient
cooperation between the Port of Koper and the Amber corridor. Within the cooperation, it will be
possible to provide better intermodal transport and logistics services, which will lead to higher rail
freight performances. The transportations for the automotive and machine industries are a great
opportunity for cooperation between the Port of Koper and the Amber corridor. An increased need
for transport of mineral resources, mainly gasses and iron ore is expected in the future. This implies
the need for the necessary cooperation (strategic partnership) between the Port of Koper and the
Amber corridor, which can also contribute to an increase in the port throughput and its overall
development and position.

TRANSPORT MARKET STUDY
AMBER RAIL FREIGHT CORRIDOR
2018 99
8 TRANSPORT POTENTIAL OF SELECTED COUNTRIES
Worldwide growth in international trade, including trade between EU countries and selected
countries, directly creates demand for transport services. Continuously increasing demand for
transport services, particularly in the international transport of goods, creates a number of possibilities
for the provision of rail transport services. The opportunity to acquire a significant share in the
transport market is mainly due to the requirements for long and medium distance transport in
international transport. Many suppliers from selected countries currently prefer and require the high
quality, reliable and cost-effective transport services. For the described reasons and the geographical
routing of the Amber RFC, it is necessary to examine the transport potential of the selected countries,
on the basis of which the measures for support of rail freight services can be identified. An
examination of the transport potential is carried out for the following countries:
- China,
- Russia,
- Belarus,
- Serbia,
- Turkey,
- Ukraine
The selection of countries was based on the geographical location of the Amber RFC, the
current trade in international trend and possible cooperation between countries.
Table 39 contains a summary of the basic data on selected analysed countries.
Table 39: Overview of basic information on countries under consideration
Country China Russia Belarus Serbia Turkey Ukraine
Population (2016) 1 379 000 000 144 342 396 9 507 120 7 057 412 79 512 426 45 004 645
Area (km2) 9 596 961 17 075 200 207 595 88 361 783 356 603 628
Length of operated railway lines (km) 121 000 86 000 5 470 3 809 12 532 21 640
Length of motorway (km) 136 000 806 - 782 2 289 199
Road length (km) 4 696 300 1 396 000 86 900 44 637 426 906 169 496
Source: Eurostat, National statistics office
The economic growth directly affects the production of final products and services in individual
countries. This production consequently creates demand for transport services which is important
for the provision of rail transport services. Table 40 therefore analyses the GDP development in the
analysed countries in the period 2010 – 2016.

TRANSPORT MARKET STUDY
AMBER RAIL FREIGHT CORRIDOR
2018 100
Table 40: Analysis of GDP development in individual countries under consideration
Country Measure/ Year 2010 2012 2014 2015 2016
China GDP growth (annual %) 10,6 7,8 7,3 6,9 6,7
GDP (current US $) in trillion 6,101 8,561 10,482 11,065 11,199
Russia GDP growth (annual %) 4,5 3,6 0,7 -2,8 -0,2
GDP (current US $) in trillion 1,525 2,210 2,064 1,366 1,283
Belarus Real GDP growth rate-volume 7,8 1,7 1,7 -3,8 -2,6
GDP in million EUR, current prices* - - - - -
Serbia Real GDP growth rate-volume 0,6 -1,0 -1,8 0,8 2,8
GDP in million EUR, current prices* 29 766 31 683 33 319 33 491 34 617
Turkey GDP growth (annual %) 8,5 4,8 5,2 6,1 3,2
GDP (current US $) in billion 771,877 873,982 934,168 859,794 863,712
Ukraine GDP growth (annual %) 4,2 0,2 -6,5 -9,8 2,3
GDP (current US $) in billion 136,013 175,781 133,503 91,031 93,27
*GDP and main components (output, expenditure and income)
Source: Eurostat, World Bank national accounts data, OECD National Accounts data files
The GDP analysis in Table 40 showed an upward trend in the countries concerned, except
Russia and Ukraine. The highest GDP was recorded in the China and Russia, while the lowest in
Serbia. The GDP growth rate was highest in China and Turkey. The lowest growth rate was recorded
in Belarus and Russia. Based on the analysis carried out, it is possible to assume the GDP growth in
individual countries with different growth rates, with possible negative development, too.
Table 41 analyses the import and export of goods in total value (in euros) to/from the EU
countries and specifically from/to the Amber RFC countries and from/to selected countries in the
period 2010 – 2016.

TRANSPORT MARKET STUDY
AMBER RAIL FREIGHT CORRIDOR
2018 101
Table 41: Import and export value from/ to the EU in mill. €
Country Country/ Year 2010 2012 2014 2015 2016
Import value from the EU in mill. €
China Total EU 28 countries 283 931 292 122 302 518 350 847 344 915
Total Amber RFC countries 16 443 16 794 18 978 22 416 23 837
Russia Total EU 28 countries 162 079 215 131 182 384 136 388 118 892
Total Amber RFC countries 23 817 34 334 27 672 19 590 15 551
Turkey Total EU 28 countries 43 062 48 822 54 415 61 663 66 765
Total Amber RFC countries 2 471 2 809 3 415 4 290 4 355
Belarus Total EU 28 countries 2 672 4 619 3 444 3 725 2 948
Total Amber RFC countries 175 225 203 233 227
Serbia Total EU 28 countries 4 349 5 053 7 110 7 879 8 739
Total Amber RFC countries 988 1 125 1 406 1 584 1 920
Ukraine Total EU 28 countries 11 547 14 647 13 734 12 844 13 159
Total Amber RFC countries 2 489 3 779 3 496 3 018 3 377
Export value to the EU in mill. €
China Total EU 28 countries 113 454 144 227 164 623 170 357 169 664
Total Amber RFC countries 3 488 4 279 4 681 4 395 4 741
Russia Total EU 28 countries 86 308 123 469 103 225 73 745 72 338
Total Amber RFC countries 10 311 14 078 12 335 9 011 8 879
Turkey Total EU 28 countries 61 929 75 491 74 719 78 962 77 890
Total Amber RFC countries 4 205 4 722 4 662 5 429 5 434
Belarus Total EU 28 countries 6 631 7 847 7 458 5 704 4 983
Total Amber RFC countries 305 309 339 267 230
Serbia Total EU 28 countries 7 881 9 660 10 357 11 155 11 664
Total Amber RFC countries 2 225 2 750 3 136 3 206 3 424
Ukraine Total EU 28 countries 17 413 23 866 16 988 14 033 16 565
Total Amber RFC countries 5 034 6 647 5 282 4 713 5 369
Source: European Commission – Trade – EU Trade Helpdesk – Statistics
The analysis carried out in Table 41 showed the value increase in import of goods from China,
Turkey, Serbia, Ukraine to the EU countries and the Amber RFC countries. On the contrary, the
decrease in import was recorded from Russia and Belarus. This negative trend is highly influenced
by EU sanctions against Russia. Export of goods from the Amber RFC countries and the EU countries
to the analysed countries showed a directional inequality. The highest export was made to the China,
while the lowest one to Belarus.
Table 42 analyses the import and export of goods in total weight (in tonnes) to/from the EU
countries and specifically from/to the Amber RFC countries and from/to analysed countries in the
period 2010 –2010 – 2016.

TRANSPORT MARKET STUDY
AMBER RAIL FREIGHT CORRIDOR
2018 102
Table 42: Import and export quantity from/to the EU in 1000 t
Country Country/ Year 2010 2012 2014 2015 2016
Import quantity from the EU in 1000 t
China Total EU 28 countries 54 040 49 275 59 161 59 311 59 571
Total Amber RFC countries 2 666 2 816 3 606 3 550 4 081
Russia Total EU 28 countries 402 496 393 610 403 956 404 071 425 812
Total Amber RFC countries 61 072 59 410 57 737 54 833 54 939
Turkey Total EU 28 countries 24 363 22 451 24 885 27 239 29 738
Total Amber RFC countries 968 1 097 1 244 1 373 1 421
Belarus Total EU 28 countries 8 749 10 889 10 805 12 900 13 148
Total Amber RFC countries 321 284 267 401 604
Serbia Total EU 28 countries 5 261 4 505 5 636 6 012 7 516
Total Amber RFC countries 1 145 918 1 492 1 353 1 839
Ukraine Total EU 28 countries 46 407 51 882 56 513 54 656 54 975
Total Amber RFC countries 15 172 16 478 16 829 15 764 16 468
Export quantity to the EU in 1000 t
China Total EU 28 countries 33 228 40 892 43 338 46 142 49 407
Total Amber RFC countries 654 766 1 026 1 103 1 254
Russia Total EU 28 countries 24 436 29 325 24 928 16 649 15 115
Total Amber RFC countries 3 341 4 301 3 949 2 397 2 170
Turkey Total EU 28 countries 39 523 45 715 47 050 44 839 46 874
Total Amber RFC countries 1 754 1 677 1 504 1 369 1 846
Belarus Total EU 28 countries 2 484 3 040 3 297 3 350 3 034
Total Amber RFC countries 87 84 79 60 57
Serbia Total EU 28 countries 5 444 5 480 5 627 6 821 6 796
Total Amber RFC countries 2 017 1 606 1 891 2 012 2 336
Ukraine Total EU 28 countries 7 990 9 771 8 896 9 504 9 492
Total Amber RFC countries 3 167 3 982 4 049 4 720 4 859
Source: European Commission – Trade – EU Trade Helpdesk – Statistics
The transport performance analysis in Table 42 showed an increase in import of goods from all
selected analysed countries to the EU countries and the Amber RFC countries. At the same time, a
significant share of import of goods within the Amber RFC countries was showed. The most
important importers of goods are Russia, China and Ukraine. Export of goods from the Amber RFC
countries and the EU countries to the analysed countries showed a directional inequality. The highest
export was achieved to the China and Turkey, while the lowest one to Belarus.
The development of indicators in Tables 41 and 42 is highly influenced by the political, trade
and economic relations of all parties concerned. As a result of economic growth in most countries
surveyed, we can assume an increase in import of goods and an increase in demand for international
transport services.

TRANSPORT MARKET STUDY
AMBER RAIL FREIGHT CORRIDOR
2018 103
On the basis of the analysis carried out in Tables 40-42, it can be concluded:
- economic growth in most of selected countries: shown by the analysis of the economic
development of individual examined countries and the growth of international trade, the
expected GDP growth in China is at 6 % and Turkey at 3 %,
- increase in number of goods transported from/to the EU 28 countries (including a share of the
Amber RFC countries) from the selected countries: results from the analysis of trade between
the Amber RFC countries and the selected countries. The analysis showed general growth in
imports and exports of goods within the selected countries, e.g. the increase in imports from
Turkey to the Amber RFC countries from 968 000 tons in 2010 to 1 421 000 tons in 2016.
- increase in demand for transport services from China, Ukraine and Russia: affected by the trade
between the Amber RFC countries and the selected countries, economic development of
selected countries and consumption of the Amber RFC countries (higher consumption results
from the economic analysis carried out in Chapter 4),
- growth of international trade of the Amber RFC countries with Serbia,
- sufficient increase in demand for transport services from Serbia: confirmed by the growth of
trade, imports of 1 839 000 tons of goods from Serbia in 2016 to the Amber RFC countries and
exports of 2 336 000 tons goods from the Amber RFC countries to Serbia,
- pressure on fast, reliable and safe transport of goods from the selected countries to the Amber
RFC countries as well as the EU countries: affected by the higher value of the goods transported,
pressure on keeping the agreed arrival times, motivation of shift of transport performances from
water to rail freight transport,
- sufficient potential for international rail transport from/to the selected countries from the EU 28
countries (including a share of the Amber RFC countries): confirmed by the gradual increase
in number of goods transported within the selected countries and the EU countries,
- strategic importance of the Amber RFC for transportations East Asia – Central Europe: results
from the geographical routing of the Amber RFC and technical condition of the railway lines,
- lowest transport potential for the Amber RFC can be expected from/to Belarus: shown by the
results of import and export analysis with Belarus showing the lowest number from the selected
countries,
- import of goods to the EU countries from the analysed countries has a generally increasing
trend and such a trend can be expected also in the future, based on the GDP development in the
analysed countries..
For the Amber RFC, the sufficient possibilities of new transport opportunities within the
analysed countries are being created. New transport opportunities, that would be suitable for the

TRANSPORT MARKET STUDY
AMBER RAIL FREIGHT CORRIDOR
2018 104
transport by rail, can be expected in Serbia, Ukraine, Turkey and Russia. Within these countries, the
opportunities for international cooperation and the subsequent provision of comprehensive transport
services are created, in particular through intermodal transport and transport of bulk substrates, gases
and oil. Based on the development of transport flows, a directional inequality can be assumed.
Within acquisition the transportations and significant position of rail freight transport on the
international transport services market, high quality railway infrastructure, available, reliable and
cost-attractive services and technological undemandingness of transport of goods are necessary. In
particular, it is necessary to take measures to reduce the technological lost times at the border
crossings with selected countries resulting from the legislation and technical parameters of lines and
rolling stock. It is important to eliminate the bottlenecks at border crossings.
TRANSPORT MARKET STUDY
AMBER RAIL FREIGHT CORRIDOR
2018 105
9 AMBER RFC GRAPHICAL REPRESENTATION
All analysed data, from which the results and conclusions presented in the previous Chapter
were subsequently defined, were necessary to define exactly the Amber RFC routing and to divide
all proposed lines into the principal, diversionary and connecting lines of the established corridor.
The results of the draft for the precise routing of the established Amber RFC and the technical
parameters of the lines are given in the continuation of Chapter 9.
The subchapter contains a graphical representation of all lines (principal, diversionary,
connecting) which will included in the Amber RFC in individual member states of the corridor. In
the following figure, routing of the whole Amber RFC is shown for overall geographic overview of
the corridor routing within the railway infrastructure of the member states.

TRANSPORT MARKET STUDY
AMBER RAIL FREIGHT CORRIDOR
2018 106
Figure 33: Preliminary graphical representation of Amber RFC routing
(Source: ŽSR, VVÚŽ)
Republic of Poland
The initial routing of the principal line of the Amber RFC corridor in the Republic of Poland is
at the Terespol border crossing with the Republic of Belarus in the direction Łuków – Dęblin –
Radom. For connection of the capital of the Republic of Poland – Warszawa with the principal line,
the connection Radom - Warszawa is being considered and at the same time with the diversionary
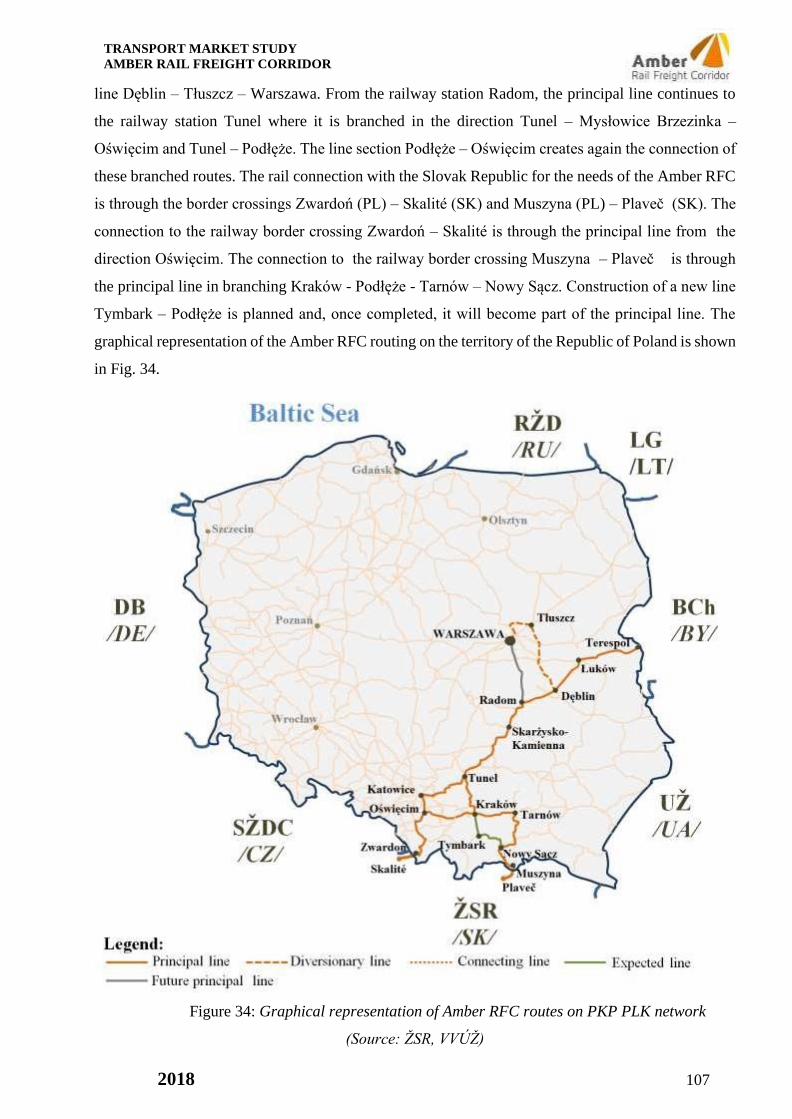
TRANSPORT MARKET STUDY
AMBER RAIL FREIGHT CORRIDOR
2018 107
line Dęblin – Tłuszcz – Warszawa. From the railway station Radom, the principal line continues to
the railway station Tunel where it is branched in the direction Tunel – Mysłowice Brzezinka –
Oświęcim and Tunel – Podłęże. The line section Podłęże – Oświęcim creates again the connection of
these branched routes. The rail connection with the Slovak Republic for the needs of the Amber RFC
is through the border crossings Zwardoń (PL) – Skalité (SK) and Muszyna (PL) – Plaveč (SK). The
connection to the railway border crossing Zwardoń – Skalité is through the principal line from the
direction Oświęcim. The connection to the railway border crossing Muszyna – Plaveč is through
the principal line in branching Kraków - Podłęże - Tarnów – Nowy Sącz. Construction of a new line
Tymbark – Podłęże is planned and, once completed, it will become part of the principal line. The
graphical representation of the Amber RFC routing on the territory of the Republic of Poland is shown
in Fig. 34.
Figure 34: Graphical representation of Amber RFC routes on PKP PLK network
(Source: ŽSR, VVÚŽ)

TRANSPORT MARKET STUDY
AMBER RAIL FREIGHT CORRIDOR
2018 108
Slovak Republic
The continuation of the Amber RFC on the territory of the Slovak Republic is realized in two
branches through the railway border crossings Muszyna (PL) – Plaveč (SK) and Zwardoń (PL) –
Skalité (SK). From the railway border crossing Plaveč, the principal line continues in transit in the
direction north - south in the direction Prešov – Kysak – Košice – Čaňa št. hr. (SR) – Hidasnémeti
(HU) to Hungary. The corridor is connected from the transport point of Košice to Hungary also via
an diversionary line in the direction of Košice – Michaľany – Slovenské Nové Mesto –
Sátoraljaújhely. Another proposed principal line passes through the border crossing Zwardoń –
Skalité and continues Žilina – Trenčín – Leopoldov where the principal line is branched into the
following branches:
- Leopoldov – Bratislava – Bratislava-Petržalka – Rusovce (SK) – Rajka (HU),
- Leopoldov – Galanta – Nové Zámky/ – Komárno (SK) – Komárom (HU),
– Nové Zámky/ - Štúrovo (SK) – Szob (HU).
For technological and operative reasons, these branches are connected by the connecting line
Bratislava – Dunajská Streda – Komárno. Note: When it comes to terminals, generally all terminals
along designated lines should become designated to the corridor as well, except if a terminal does not
have any relevance for the traffic in the corridor or where a private terminal decides not to take part
in a corridor. The feeder lines from/to the terminals are designated as 'connecting lines'. The graphical
representation of the Amber RFC routing on the territory of the Slovak Republic is shown in Fig. 35.
Figure 35: Graphical representation of Amber RFC routes on ŽSR network
(Source: ŽSR, VVÚŽ)

TRANSPORT MARKET STUDY
AMBER RAIL FREIGHT CORRIDOR
2018 109
Hungary
The capital of Hungary – Budapest is located on the principal line as the important connection
point of the lines from the Slovak Republic in the subsequent continuation of the corridor principal
line to the Republic of Slovenia where this principal line provides the connection with the Balkan
area through the Republic of Serbia through the railway border crossing Kelebia. Based on the
transport potential and demand from carriers, the route Hatvan – Kelebia was designed and
subsequently incorporated within the Amber RFC as the principal line in routing Hatvan – Szolnok
– Cegléd – Kinskunfélegyháza – Kiskunhalas – Kelebia The direction of the principal line from the
border crossing Čaňa (SK) – Hidasnémeti (HU) is through the transport node Miskolc leading to
Budapest through the railway station Füzesabony. Miskolc is also connected with the Slovak Republic
by a diversionary line from direction of Slovenské Nové Mesto (SK) – Sátoraljaújhely (HU) –
Mezőzombor – Miskolc. The further connection of Budapest with the Republic of Slovakia is through
the border crossings Štúrovo (SK) – Szob (HU), Komárno (SK) – Komárom (HU) and Rusovce
(SK) – Rajka (HU) which are located on the principal line. These border crossings continue in the
direction Csorna – Szombathely – Zalaszentiván – Zalalövő and then continue to the Republic of
Slovenia through the border crossing station Hodoš on the Slovenian side. From both Csorna and
Szombathely branches of the principal line continues to Sopron. The graphical representation of the
Amber RFC routing on the territory of Hungary is shown in Fig. 36. GYSEV lines are indicated in
yellow.
Figure 36: Graphical representation of Amber RFC routes on MÁV and GYSEV network
(Source: ŽSR, VVÚŽ)

TRANSPORT MARKET STUDY
AMBER RAIL FREIGHT CORRIDOR
2018 110
All track sections on the route Hidasnémeti s. b. – Budapest are to be classified as the principal
lines of the Amber RFC. Justification: the route is a direct continuation of the principal lines from the
Republic of Poland and the Slovak Republic; individual track sections on the route meet the technical
requirements for the principal line (electrification, maximum train length, traffic density of the line);
the classification of the lines creates better opportunities for investments in their modernization;
potential of higher transport performances due to better corridor services; there are several transport
possibilities on the eastern corridor route, e.g. from the Port of Koper, transport of final products from
the factory in Haniska near Košice, goods transport from Asia to Hungary, etc.
Republic of Slovenia
The principal line on the territory of the Republic of Slovenia passes in the direction
southwest and is directed at Zalalövő (HU) – Hodoš (SI) – Pragersko – Celje – Ljubljana – Divača
– Koper. The connecting lines to the principal line are directed at Velenje – Celje and Novo Mesto
– Ljubljana. The graphical representation of Amber RFC on the territory of Slovenia is shown in
Fig. 37.
Figure 37: Graphical representation of Amber RFC routes on SŽ-I network
(Source: ŽSR, VVÚŽ)

TRANSPORT MARKET STUDY
AMBER RAIL FREIGHT CORRIDOR
2018 111
9.1 Technical parameters of Amber RFC
For a rapid and graphic-visual representation of the technical parameters of the lines included
in RFC Amber, the particular railway lines and terminals in the given countries are shown using the
following signs:
Description of stations:
Border station of neighbouring country on the principal line
Border station of neighbouring country on the diversionary line
Station lying on a principal line (selected station)
Station lying on a diversionary line (selected station)
Station lying on a connecting line (selected station)
Type of line: Description of capacity utilization schemes:
Corridor double-track line Information not provided
Corridor single-track line Track capacity use 49 %
3 KV DC Track capacity use 50% - 89 %
15 KV AC (16 2/3 Hz) Track capacity use above 90 %
25 KV AC (50 Hz) Railway station/ Border station
Non-electrified
Intermodal freight mode:
Intermodal freight code (P/C) Interoperational gauge
1 P/C 50/370 G1 Interoperational gauge G1
2 P/C 70/390 G2 Interoperational gauge G2
3 P/C 70/400 0B PpB/0-SM
4 P/C 80/400 1B PpB/1-SM
5 P/C 80/401 1C PpC/1-SM
6 P/C 82/412 2C PpC/2-SM
7 P/C 90/410 9, G2, G
8 P/C 99/429 ERTMS equipment
9 P/C C21/C340 G GSM-R
E ETCS
Z Zugfunk
Description of technical parameters of line:
10 km, 120 km/h, 700 m, D4 Distance, maximum speed, maximum length of train, axle load
9, G2, G 9, G2, G

TRANSPORT MARKET STUDY
AMBER RAIL FREIGHT CORRIDOR
2018 112
Technical data of the lines are listed in Appendix A
j
Capacity:
Poland
PKP PLK S.A.
Polskie Koleje Państwowe
Polskie Linie Kolejowe
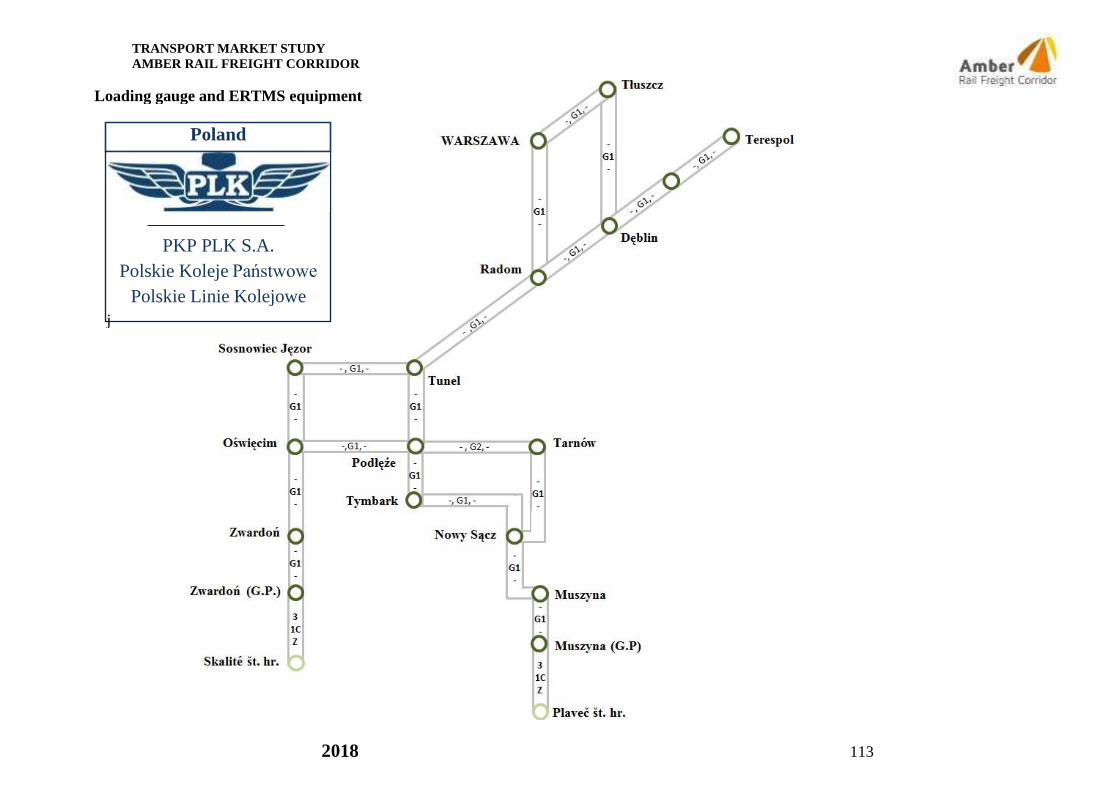
TRANSPORT MARKET STUDY
AMBER RAIL FREIGHT CORRIDOR
2018 113
Loading gauge and ERTMS equipment
j
PKP PLK S.A.
Polskie Koleje Państwowe
Polskie Linie Kolejowe
Poland

2018 114
TRANSPORT MARKET STUDY
AMBER RAIL FREIGHT CORRIDOR
Slovakia
ŽSR
Železnice Slovenskej
republiky, Bratislava
Note:
Different maximum speed (km/h) in the section: 1Žilina – Krásno nad Kysucou: 19,3 km, 140 km/h Krásno nad Kysucou – Čadca: 10 km, 100 km/h 2Púchov – Trenčianska Teplá: 26,8 km, 160 km/h Trenčianska Teplá – Trenčín: 7,5 km, 120 km/h 3Bratislava hl. St. – Bratislava Rača: 7,4 km, 100 km/h
Capacity:

2018 115
TRANSPORT MARKET STUDY
AMBER RAIL FREIGHT CORRIDOR
Loading gauge and ERTMS equipment
Slovakia
ŽSR
Železnice Slovenskej
republiky, Bratislava

2018 116
TRANSPORT MARKET STUDY
AMBER RAIL FREIGHT CORRIDOR
MÁV
Magyar Államvasutak
GYSEV
Győr-Sopron-Ebenfurti Vasút / Raaberbahn –
Raab-Oedenburg-Ebenfurter Eisenbahn
VPE
Vasúti Pályakapacitás-elosztó Kft.
*Note:
Different technical parameters on line section:
Komárom - Tata: 160 km/h
Tata - Budaörs: 140 km/h
Budaörs - Kelenföld: 120 km/h
Kelenföld - Ferencváros: 80 km/h
Vác - Szob sb.: 100 km/h
Rákospalota-Újpest- Vác: 120 km/h
Kőbánya felső - Angyalföld elágazás - 2 tracks, 80 km/h
Angyalföld elágazás - Rákospalota-Újpest: 1 track, 60 km/h
Olaszliszka-Tolcsva - Sátoraljaújhely: 80 km/h
Mezőzombor - Olaszliszka-Tolcsva: 100 km/h
Szerencs - Mezőzombor: C2, 120 km/h
Felsőzsolca - Szerencs: C3, 120 km/h
Őriszentpéter s.b. - Andráshida elágazás: 40,1 km, D3
Andráshida elágazás - Zalaszentiván: 12,6 km, C3
Újszász - Újszász elágazás: 13,0 km, 2 tracks, C2
Paládicspuszta elágazás - Abony elágazás: 23,4 km, 2 tracks,
D4
Városföld - Kiskunfélegyháza: 13,7 km, 2 tracks, D3
Nyársapát elágazás - Városföld: 42,4 km, 1 track, D3
Harkakötöny elágazás - Balotaszállás elágazás: 1,8 km, 1
track, C2, 700 m., 40 km/h
Hungary

2018 117
TRANSPORT MARKET STUDY
AMBER RAIL FREIGHT CORRIDOR
Loading gauge and ERTMS equipment
Hungary
MÁV Zrt.
Magyar Államvasutak
GYSEV
Győr-Sopron-Ebenfurti Vasút / Raaberbahn –
Raab-Oedenburg-Ebenfurter Eisenbahn
VPE
Vasúti Pályakapacitás-elosztó Kft.
Capacity:

2018 118
TRANSPORT MARKET STUDY
AMBER RAIL FREIGHT CORRIDOR
Slovenia
SŽ-I
Slovenske železnice
Capacity:

2018 119
TRANSPORT MARKET STUDY
AMBER RAIL FREIGHT CORRIDOR
Loading gauge and ERTMS equipment
Slovenia
SŽ-I
Slovenske železnice

TRANSPORT MARKET STUDY
AMBER RAIL FREIGHT CORRIDOR
2018 120
The rail freight services are directly linked to the marshalling yard services (in particular wagon
loads) and intermodal terminal services (in particular loading, unloading, transhipment and
administration as regards the transport units of intermodal transport). The graphical representation of
the location of marshalling yards and intermodal terminals on the lines included in the Amber RFC
is shown in Fig. 38.
Figure 38: Graphical representation of Marshalling yards and Intermodal terminals on Amber RFC
(Source: ŽSR, VVÚŽ)

TRANSPORT MARKET STUDY
AMBER RAIL FREIGHT CORRIDOR
2018 121
Figure 39 shows the position of rail border crossings with countries outside the EU.
Subsequently, Figure 40 shows the position of major ports and airports located in the territory of the
Amber RFC countries.
Figure 39: Rail border crossings – with countries outside the EU
(Source: ŽSR, VVÚŽ)

TRANSPORT MARKET STUDY
AMBER RAIL FREIGHT CORRIDOR
2018 122
Figure 40: Position of ports and airports
(Source: ŽSR, VVÚŽ)

TRANSPORT MARKET STUDY
AMBER RAIL FREIGHT CORRIDOR
2018 123
Table 43 contains a list of significant transport points located in the territory of the Amber
RFC countries and lines.
Table 43: Traffic points of Amber RFC
Node name *ITT Marshalling yard Other services
Poland
Terminal kontenerowy Warszawa
Główna Towarowa Loconi Intermodal Terminal
Kontenerowy Warszawa
Warszawa Główna Towarowa
Warszawa Praga
EUROTERMINAL Sławków Jaworzno
Szczakowa
Brzeski Terminal Kontenerowy/ KARPIEL Brzesko
Tarnów Filia
Kraków Nowa Huta
PKP Cargo Centrum Logistyczne Małaszewicze
EUROPORT Małaszewicze
Terminal przeładunkowy
Wólka/Tradetrans
Tranzgaz
Małaszewicze/Cargotor
Oświęcim
Terminal Sosnowiec Południowy
Czechowice Dziedzice
Dęblin
Slovak
Republic
Bratislava SPaP, ÚNS Bratislava východ
Žilina Žilina-Teplička
Hungary
Őriszentpéter/loading place
Andráshida/loading place
Zalalövő/loading place
Zalaegerszeg/scale & refuelling & loading place
Zalaszentiván/loading place
Sopron Intermodal Terminal Sopron marshalling yard
Győr ÁTI Depo
Győr-Rendező
Győr-Rendező/scale & loading place
Győrszentiván/loading place Nagyszentjános/loading place
Ács/loading place
Komárom-Rendező
Komárom/refuelling & loading place
Komárom-Rendező/scale & loading place
Almásfüzitő/loading place
Tata/loading place
Tatabánya/loading place
Bicske/loading place
Herceghalom/loading place Biatorbágy/loading place
Budaörs/loading place
Budapest Szabadkikötő Logisztikai Zrt.
Ferencváros
Ferencváros/scale & refuelling & loading place Soroksári út rendező/scale & loading place
BILK Soroksári út rendező Soroksár/loading place

TRANSPORT MARKET STUDY
AMBER RAIL FREIGHT CORRIDOR
2018 124
Hungary
Dunaharaszti /loading place
Taksony/loading place
Délegyháza/loading place Kiskunlacháza/loading place
Dömsöd/loading place
Kunszentmiklós-Tass/loading place
Bösztör/loading place
Szabadszállás/loading place Fülöpszállás/loading place
Csengőd/loading place
Kiskőrös/scale & loading place
Soltvadkert/loading place
Kiskunhalas/scale & refuelling;
Balotaszállás/loading place Kisszállás/loading place
Kelebia/scale & loading place
Rákos/scale & loading place
Hatvan-Rendező
Isaszeg/loading place
Gödöllő/loading place
Aszód/loading place
Hatvan/refuelling & loading place
Hatvan-Rendező/scale
Hort-Csány/loading place
Vámosgyörk/loading place
Kál-Kápolna/loading place
Füzesabony/scale & refuelling & loading place
Miskolc-Rendező
Mezőkövesd/loading place
Mezőkeresztes-Mezőnyárád/loading place
Nyékládháza/loading place
Miskolc-Tiszai/loading place
Miskolc-Rendező/scale & refuelling
Miskolc-Gömöri/loading place
Felsőzsolca/loading place
Hidasnémeti/loading place
Slovenia
Ljubljana Moste Ljubljana Zalog
Port of Koper Koper Koper tovorna
Celje tovorna Celje tovorna
Gorenje Velenje
Revoz Novo mesto
Source: Member from countries of Amber RFC
9.2 Basic information on Małaszewicze dry port
The Małaszewicze dry port, located close to Terespol railway station, which is extensively used
in international connections running via the nearby PL/BY border crossing of Terespol-Brest,
operates on the Core Network Corridor North Sea-Baltic, Rail Freight Corridor North Sea-Baltic and
Amber Rail Freight Corridor. It is a special place because of the EU border and customs border. Here
lies the junction point between CIM and SMGS communication systems and 1435 mm and 1520 mm
railway gauges. The difference of the gauges determines the transshipment of goods at the terminals
in the area of the dry port. Małaszewicze is the biggest dry port at the eastern border of EU, it is a
railway gate leading to European markets. Crucial transshipment terminals located in Małaszewicze,
including a container terminal, are managed by PKP CARGO Group

TRANSPORT MARKET STUDY
AMBER RAIL FREIGHT CORRIDOR
2018 125
Key technical specifications of the terminals of PKP CARGO Group
Total area: 1 237 000 m2
Outdoor storage area – the yard: 134 694 m2
Closed storage area: 5 300 m2
Roofed area: 3 000 m2
Storage capacity: 2 000 TEU
Transshipment capacity: 10 057 500 tonnnes per year
Container terminal: 120 000 TEU per year
Railway tracks (usable): 14 112 m (1520 mm)
18 952 m (1435 mm)
Dual gauge railway tracks: 670 m (1435 + 1520 mm)
Equipment
Gantry cranes: 12 units
Rubber tire gantry cranes: 1 unit
Rubber tire digger: 16 units
Rubber tire loader: 5 units
Reach stackers: 3 units
Bucket elevators: 4 units
Plug in points for refrigerated containers
Forklifts with loading capacity of 1,6 to 4,5 t
Transshipment terminals
Transshipment activity is run on specialized terminals prepared technically and
organizationally for transshipping and storing defined types of cargo. PKP CARGO Groups has at its
disposal 7 transshipment terminals:

TRANSPORT MARKET STUDY
AMBER RAIL FREIGHT CORRIDOR
2018 126
Table 44: Transshipment terminals of PKP CARGO Group in Małaszewicze
Transshipment point Cargo type
Container Terminal1 20”, 30”, 40”, 45” containers, HC, semitrailers
Terminal in Kowalewo1 cargo on pallets, big bag cargo, bundles, bags, bulk cargo (grain, pellet)
Terminal in Podsędków1 coal, wood, woodchips
Terminal in Raniewo1 coal, wood, woodchips
Universal Terminal1 coal, wood, woodchips, ore, metals, unit goods (machines, vehicles etc.)
Terminal in Wólka2 coal, wood, woodchips, fertilizers, chemicals, steel products
Terminal in Zaborze2 coal, wood, woodchips, fertilizers, chemicals, steel products
Source: PKP Cargo Group
1 run by PKP CARGO Centrum Logystyczne Malaszewicze 2 run by PKP Cargo CONNECT
The scheme below presents the layout of PKP CARGO Group transshipment terminals in the
area of the Małaszewicze dry port.
Figure 41: Layout of PKP CARGO Group transshipment terminals and railway stations in
Małaszewicze
(Source: PKP Cargo)
It should be also mentioned that apart from the above mentioned key terminals there are also
other transshipment points and terminals in the area of the dry port.
Małaszewicze dry port – a bridge connecting China and Europe
Over a few recent years there has been noticed a substantial change in the cargo turnover in
Małaszewicze which is due to launching freight transport from China and making railway transport a
part of the vast concept of the New Silk Road (One Belt One Road). The increasing importance of
the railway transport is a result of an advantageous relation of price to time of transport and
punctuality.

TRANSPORT MARKET STUDY
AMBER RAIL FREIGHT CORRIDOR
2018 127
The vital factor having a direct influence on the cargo turnover operations between China and
Europe transported by rail is the transport time. A freight train form China arrives to Europe in 11-
14 days, while e.g. sea transport takes 40-50 days. These times respectively affects the possibility of
a quick cargo delivery to the customers, including flexible shaping of „door-to-door” deliveries.
The fact, that the trains heading for Europe are crossing only two customs borders, i.e. the one
between China and the area of Eurasian union and the next one between Eurasian union and EU
customs area is an additional advantage for using the services of Małaszewicze container terminal by
entrepreneurs, which also relatively decreases the amount of customs formalities related to the
transport. Moreover, there is a customs-free zone functioning in the area of the Małaszewicze dry
port, where cargo can be stored without the obligation to pay tax and customs charges. There is no
storage time limit.
Figure 42: Key China-Europe rail freight transport directions and border crossings
(Source: PKP Cargo)
The dry port in Małaszewicze is a land bridge connecting Europe with China. Its special
location creates possibilities of bringing together the concepts of Amber Corridor and the New Silk
Road. This way the goal of transport mode diversification between China and Europe would be
reached. The application of land transport, mainly rail or combined sea-land transport, for the cargo
transported from Asia fits the EU transport policy concept of developing sustainable transport
systems.
9.3 Summary basic comparison of RFC infrastructure
The European RFC corridors have been designed primarily on the basis of direction of the main
transport flows of goods within the EU and the whole Europe in order to increase the attractiveness,
reliability and efficiency of the rail system, taking utmost account of the customer

TRANSPORT MARKET STUDY
AMBER RAIL FREIGHT CORRIDOR
2018 128
requirements. Each corridor has its specific role and strategic routing adapted to the transport
requirements of the customers. In Table 45, a basic comparison of the infrastructure of the European
RFC corridors is made for clarity and Figure 43 shows map of European RFC by Rail Net Europe.
Figure 43: Graphical representation of corridors Rail Net Europe
(Source: Rail Net Europe)
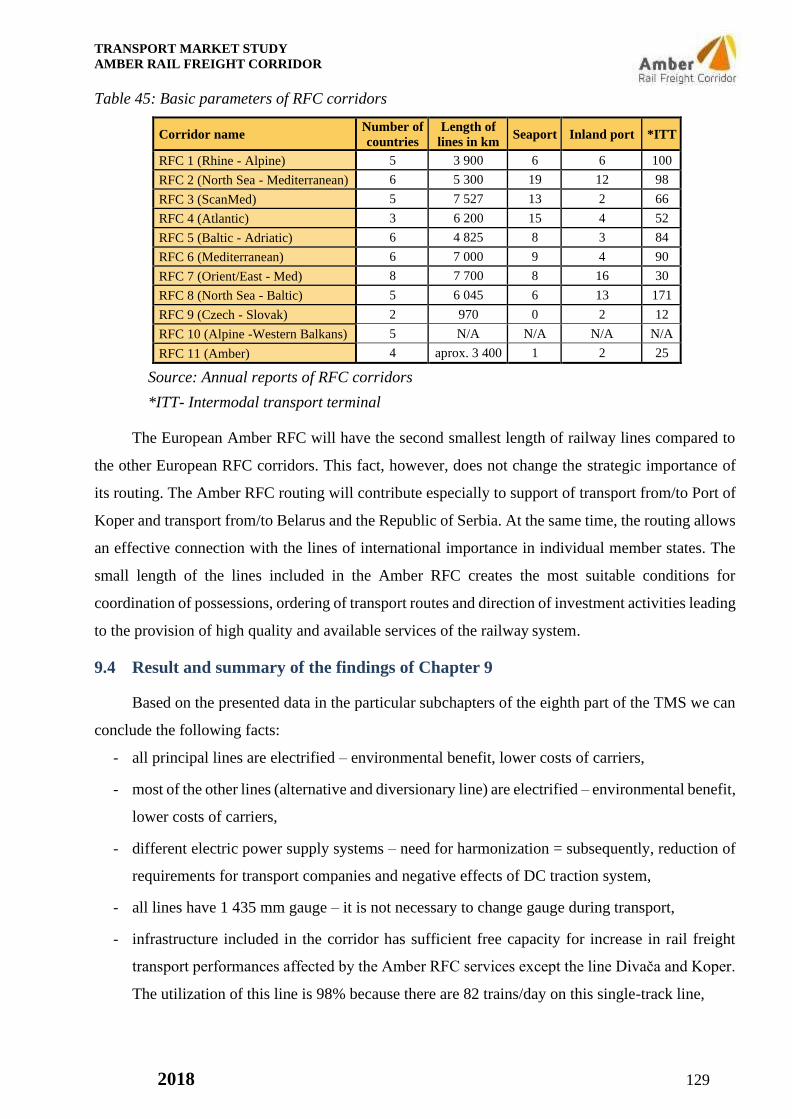
TRANSPORT MARKET STUDY
AMBER RAIL FREIGHT CORRIDOR
2018 129
Table 45: Basic parameters of RFC corridors
Corridor name Number of
countries
Length of
lines in km Seaport Inland port *ITT
RFC 1 (Rhine - Alpine) 5 3 900 6 6 100
RFC 2 (North Sea - Mediterranean) 6 5 300 19 12 98
RFC 3 (ScanMed) 5 7 527 13 2 66
RFC 4 (Atlantic) 3 6 200 15 4 52
RFC 5 (Baltic - Adriatic) 6 4 825 8 3 84
RFC 6 (Mediterranean) 6 7 000 9 4 90
RFC 7 (Orient/East - Med) 8 7 700 8 16 30
RFC 8 (North Sea - Baltic) 5 6 045 6 13 171
RFC 9 (Czech - Slovak) 2 970 0 2 12
RFC 10 (Alpine -Western Balkans) 5 N/A N/A N/A N/A
RFC 11 (Amber) 4 aprox. 3 400 1 2 25
Source: Annual reports of RFC corridors
*ITT- Intermodal transport terminal
The European Amber RFC will have the second smallest length of railway lines compared to
the other European RFC corridors. This fact, however, does not change the strategic importance of
its routing. The Amber RFC routing will contribute especially to support of transport from/to Port of
Koper and transport from/to Belarus and the Republic of Serbia. At the same time, the routing allows
an effective connection with the lines of international importance in individual member states. The
small length of the lines included in the Amber RFC creates the most suitable conditions for
coordination of possessions, ordering of transport routes and direction of investment activities leading
to the provision of high quality and available services of the railway system.
9.4 Result and summary of the findings of Chapter 9
Based on the presented data in the particular subchapters of the eighth part of the TMS we can
conclude the following facts:
- all principal lines are electrified – environmental benefit, lower costs of carriers,
- most of the other lines (alternative and diversionary line) are electrified – environmental benefit,
lower costs of carriers,
- different electric power supply systems – need for harmonization = subsequently, reduction of
requirements for transport companies and negative effects of DC traction system,
- all lines have 1 435 mm gauge – it is not necessary to change gauge during transport,
- infrastructure included in the corridor has sufficient free capacity for increase in rail freight
transport performances affected by the Amber RFC services except the line Divača and Koper.
The utilization of this line is 98% because there are 82 trains/day on this single-track line,
TRANSPORT MARKET STUDY
AMBER RAIL FREIGHT CORRIDOR
2018 130
- most included railway lines do not reach the required demands for running long trains
(750 m),
- some principal railway lines included do not reach the highest level of axle load – need for
reconstruction/modernization,
- the Slovak Republic has all principal lines at the highest level of axle load,
- need for complete the ERTMS (European Rail Traffic Management System) on the principal
corridor lines – complying with the interoperability requirements,
- routing creates the transport potential for international rail freight transport in the south –
north/east direction,
- routing creates the transport potential for international rail freight transport in the direction of
countries outside the EU – EU/the Amber RFC countries,
- possible connection of broad-gauge line in the Republic of Poland with the main corridor
route in the Republic of Poland,
- routing improves connection of intermodal transport terminals in the member states
concerned and provides direct routing for intermodal consignments from the Port of Koper,
- facilitates transport connection between the Adriatic sea port in the Republic of Slovenia and
inland waterway ports on the Danube in Hungary and the Slovak Republic,
- supports the development of rail transport with the Republic of Serbia,
- potentially improves rail transport across the EU eastern border and on the land bridge
between Europe and Asia.
From the overall point of view, the proposed routing, division of particular lines, including the
technical parameters of the lines are satisfying and fulfilling the conditions for providing the high-
quality rail freight services. Routing creates the suitable conditions for modal split change in favour
of rail freight transport in the individual countries of the Amber RFC. The establishment of the Amber
RFC, based on the submitted proposal, will contribute to the EU strategic objectives in the field of
effective modal split and to reduction of negative external transport costs.

TRANSPORT MARKET STUDY
AMBER RAIL FREIGHT CORRIDOR
2018 131
10 LAST MILE
The rail freight transport is the most advantageous in the process of transport of bulk substrates
from the economic and time point of view. Also, the lowest amount of negative external costs of
transport is produced in this transport. Most often it is the transport of bulk substrates, gases, liquids,
chemicals, cars, coiled sheet, etc. Rail freight transport has also had a significant position in the
process of transport of single consignments. Endogenous and exogenous impacts have led to a long-
term decrease in rail system performances in the process of transport of single consignments. A
graduating international trade, showed in the previous parts of TMS between the Amber RFC
countries, the EU countries and countries outside the EU, brings many opportunities for
transportations having the character of single consignments. At present, there is an upward trend in
the individual needs of manufacturing and trading companies demanding specific goods, which has a
nature of transport of single consignments. This is due to marketing strategies aimed at individual
requirements of customers. It is often the transport of goods by 1 – 8 road trains over 12 tons/day.
These transportations are required by, in particular, the small and medium-sized enterprises and
commercial companies.
At present and in the future, based on global direction, market liberalization, international trade
activities and economic development, we can expect:
- construction of small and medium-sized production sites within the EU countries and Asia,
- construction of new logistic centres, central and distribution warehouses, large business
houses,
- increase in demand for transport services for the transport of goods in international transport
between production sites and logistics infrastructure,
- increase in demand for quality of transport services, particularly in terms of reliability and
safety,
- need for a sufficient technical base necessary for transport of single consignments,
- pressure on reducing the negative external costs generated by increased demands for the
transport of goods.
These facts create a sufficient transport potential which can largely take over the railway
system. However, the use of existing rail freight transport opportunities requires a sufficient technical
base that meets the technical and technological requirements on high quality, reliable, safe, available
and flexible transport services. It is also an infrastructure that creates the necessary
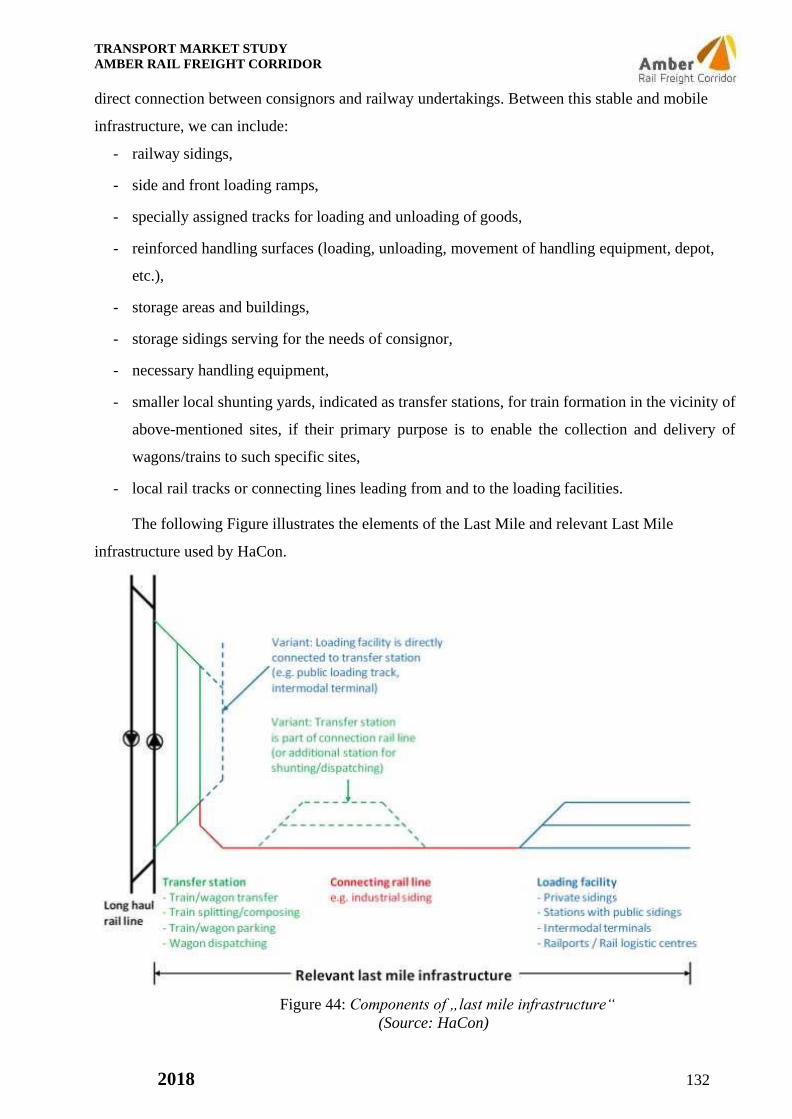
TRANSPORT MARKET STUDY
AMBER RAIL FREIGHT CORRIDOR
2018 132
direct connection between consignors and railway undertakings. Between this stable and mobile
infrastructure, we can include:
- railway sidings,
- side and front loading ramps,
- specially assigned tracks for loading and unloading of goods,
- reinforced handling surfaces (loading, unloading, movement of handling equipment, depot,
etc.),
- storage areas and buildings,
- storage sidings serving for the needs of consignor,
- necessary handling equipment,
- smaller local shunting yards, indicated as transfer stations, for train formation in the vicinity of
above-mentioned sites, if their primary purpose is to enable the collection and delivery of
wagons/trains to such specific sites,
- local rail tracks or connecting lines leading from and to the loading facilities.
The following Figure illustrates the elements of the Last Mile and relevant Last Mile
infrastructure used by HaCon.
Figure 44: Components of „last mile infrastructure“
(Source: HaCon)

TRANSPORT MARKET STUDY
AMBER RAIL FREIGHT CORRIDOR
2018 133
Types of last-mile infrastructure:
- Private sidings,
- Stations with public sidings,
- Intermodal terminals,
- Railports.
One main intention to establish railports was to substitute private and public sidings which were
no longer served by rail. Thus, they are principally open for everybody and for all types of cargo.
They do not only provide pure transhipment but also additional services like storage, consignment or
road pre-/end-haulage. An example of typical railport configuration and logistics services used by DB
Schenker Rail is shown in Figure 45.
Figure 45: Typical railport configuration and logistics services
(Source: DB Schenker Rail)
The generated demand for transport services within the requirements for single consignments
(or part-load consignments) provides several opportunities for rail freight transport services.
However, the specific elements of these transports require high quality and available infrastructure.
One of the elements of this infrastructure is the above mentioned last mile infrastructure the operation
and building of which is necessary for the competitiveness of rail freight transport to

TRANSPORT MARKET STUDY
AMBER RAIL FREIGHT CORRIDOR
2018 134
other modes of transport. High quality and available last mile infrastructure has a positive impact on
the quality of rail system services and thus contributes to its competitiveness and customers’ interest.
However, for the use of Last mile infrastructure, it is necessary a participation of railway undertakings
that are able to use this infrastructure within their business activities and creation of services.
Operation, building, propagation and provision of services within Last mile require a sufficient
investment and non-investment support from the state and competent government authorities. Support
is necessary also from the legislative point of view to promote a shift of transport performances from
more environmentally demanding modes of transport to environmentally friendly rail freight
transport. Support of Last mile infrastructure and services can be ensured also from enviro resorts and
funds, regional government budgets and harmonization of railway infrastructure charging.
In order to better meet the requirements of international transport customers, especially in the
process of transport of single consignments and strong position of road goods transport, it is very
important that reliable and transparent information services are provided within the rail freight
transport in the short term. Insufficient access to information on Last mile infrastructure is a
significant obstacle for rail freight transport in effective planning, especially in cross-border transport.
Based on this need, the web portal within the whole EU with GIS functions has been developed which
is capable to present in a transparent way all important information for various types of Last mile
infrastructure. The current version of the portal is running on the internet domain
,,www.railfreightlocations.eu“. GYSEV has participated as a pilot region in the elaboration of this
information portal. The web page enables to search according to more detailed criteria, zooming the
map or direct selection from the list. By selecting the endpoint on the map, the available detailed
information on the relevant part of the Last mile infrastructure is displayed. Detailed information on
the relevant part of the Last mile infrastructure illustrated by the satellite image currently includes:
- basic data: type of Last mile infrastructure, address, specific data, opening hours, etc.,
- railway infrastructure technical parameters,
- availability of modes of transport provided,
- availability of services provided,
- links to websites that can be another source of information.
The list of the Last mile for the Amber RFC is listed in Appendix F.
The data in Appendix F show the need to extend and subsequently precise of the Last mile
infrastructure for the Amber RFC. This step is necessary for provision of required transport services
and increase in rail system performances in the process of transport of single consignments.

TRANSPORT MARKET STUDY
AMBER RAIL FREIGHT CORRIDOR
2018 135
11 COMPARATIVE ANALYSIS OF RAIL AND ROAD FREIGHT
TRANSPORT WITHIN THE AMBER RFC
The comparative analysis serves for comparison of the transport time and charges within the
transport routes on the selected railway routes of the Amber RFC with comparable routes of road
transport. The comparison of these two indicators will provide information on charge and time
competitiveness of international rail freight transport on the Amber RFC lines.
Input assumptions of comparative analysis:
- 4 model transport routes,
- observing a mandatory rest according to the European Agreement concerning work of crews
of vehicles engaged in international road transport and restrictions on running time,
- average speed in international road goods transport,
- average speed of trains in international rail freight transport within the Amber RFC lines,
- average railway infrastructure charges and road goods transport charges on the lines of the
Amber RFC and the relevant road network,
- distances in kilometres of individual model routes.
Table 46 provides a comparative analysis of the average running time between international rail
and road freight transport for proposed model transport routes.
Table 46: Comparative analysis of average running times
Route km in road
transport
km in rail
transport
Average transport
time by truck
Average transport
time by rail
Koper – Košice 870 955 24 h 15 min 19 h 06 min
Terespol - Budapest 799 976 23 h 04 min 19 h 30 min
Warszawa - Miskolc 585 692 10 h 30 min. 13 h 48 min
Żywiec - Maribor 589 657 10 h 34 min. 13 h 06 min
The comparative analysis of average running time in Table 46 carried out on the model transport
routes showed a shorter technological time of transport in international road goods transport on the
routes Warszawa – Miskolc and Żiwiec - Maribor. A shorter technological time of transport in favour
of rail transport was achieved on the routes Koper – Košice and Terespol – Budapest. The analysis
showed that the total technological times of transport in rail freight transport approach the
technological times of transport in road goods transport, especially in case of block train technology.
The effects of services and fulfilment of the Amber RFC vision and mission will contribute to time
competitiveness of international rail freight transport and at the same time, the established corridor
will create the suitable conditions for high quality, reliable and safe services of the rail system. For
effective use of rail freight transport, it is necessary to remain in removing

TRANSPORT MARKET STUDY
AMBER RAIL FREIGHT CORRIDOR
2018 136
barriers that hinder faster transport in international rail transport. The process of interoperability of
the rail system within the EU countries helps remove barriers, too. In case of transport of bulk
substrates, the rail freight transport can be considered to be competitive in the total transport time as
the road infrastructure does not have sufficient capacities for the individual transport of bulk
substrates.
Table 47 provides a comparative analysis of transport infrastructure charges between rail and
road freight transport for proposed model transport routes. The charge is calculated for road freight
vehicle with a total weight of 40 t and weight of goods of 22 t, for freight train with a total weight 1
500 t and weight of goods of 1 000 t. The analysis does not include any supplementary charges in
road and rail transport.
Table 47: Comparative analysis of charges
Route
Road freight transport Rail freight transport
charge 40 t vehicle
charge in €/km
charge in €/km/tonne
charge 1 500 t train
charge in €/km
charge in €/km/tonne
Koper – Košice 244,12 0,2806 0,0128 1886,4 1,975 0,0020
Terespol - Budapest 76,5 0,0957 0,0044 3406,24 3,490 0,0035
Warszawa - Miskolc 31,9 0,0545 0,0025 2130,41 3,079 0,0031
Żywiec - Maribor 126,9 0,2154 0,0098 1648,46 2,509 0,0025
The comparative analysis of charge burden in Table 47 showed higher charges per 1 km of
route for rail freight. However, charge comparison per one tonne of goods transported/ route km
showed a lower charge burden for international rail freight. At the same time, most of road
infrastructure is charged in the model calculation, while road infrastructure is often not charged on
the whole transport section. Lower charges in rail freight per one tonne of goods transported occur
only in case of larger amount of goods transported as the charges in road freight transport are less
dependent on weight. With a decrease in the amount of goods, the charges per tonne of goods in rail
transport are significantly increasing. The positive result of the analysis was influenced by EU and
national measures. The main measures were the liberalization of transport infrastructure charges and
the reduction of charges based on marginal costs. The calculation showed sufficient competitiveness
of charges in international rail freight transport against road freight transport when goods are
transported in block trains.
The Figure below shows a comparison of some challenges rail freight transport faces compared
to road freight transport.
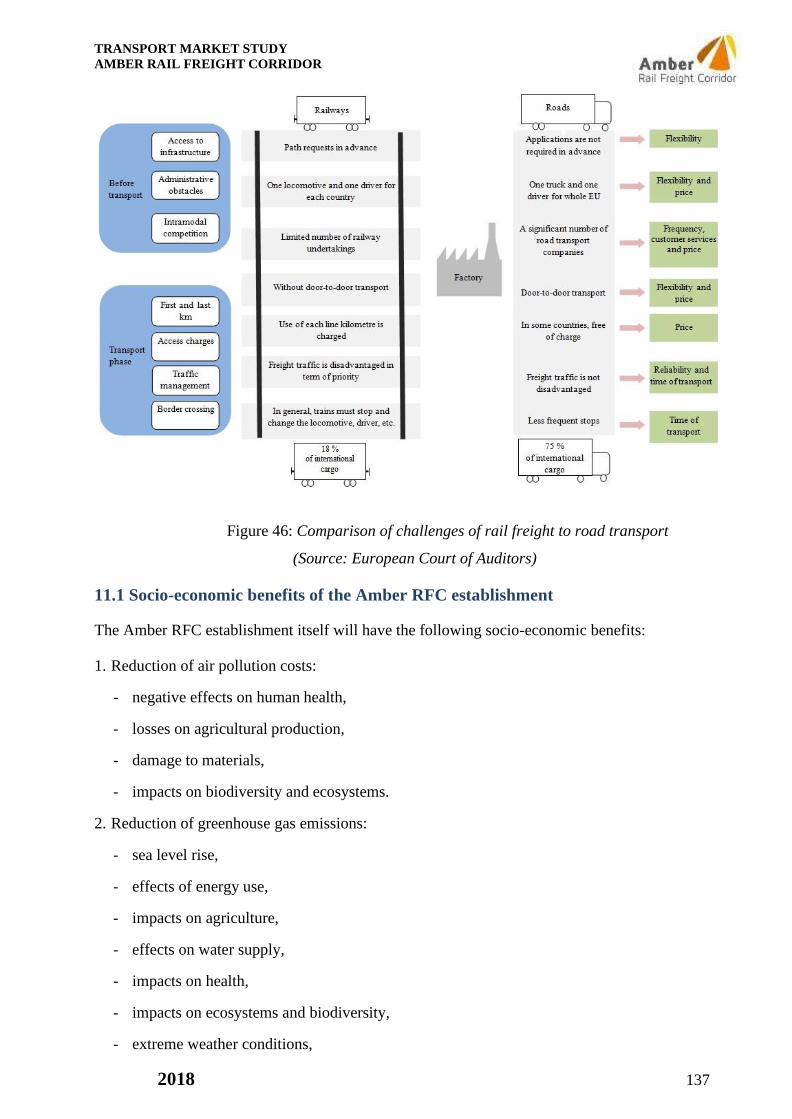
TRANSPORT MARKET STUDY
AMBER RAIL FREIGHT CORRIDOR
2018 137
Figure 46: Comparison of challenges of rail freight to road transport
(Source: European Court of Auditors)
11.1 Socio-economic benefits of the Amber RFC establishment
The Amber RFC establishment itself will have the following socio-economic benefits:
1. Reduction of air pollution costs:
- negative effects on human health,
- losses on agricultural production,
- damage to materials,
- impacts on biodiversity and ecosystems.
2. Reduction of greenhouse gas emissions:
- sea level rise,
- effects of energy use,
- impacts on agriculture,
- effects on water supply,
- impacts on health,
- impacts on ecosystems and biodiversity,
- extreme weather conditions,
TRANSPORT MARKET STUDY
AMBER RAIL FREIGHT CORRIDOR
2018 138
- disasters, that is, disaster risk
3. Reduction of unwanted noise emissions and consequent negative consequences.
4. Reduction of traffic accidents:
- material damages,
- administrative costs,
- treatment costs,
- losses on production or on human capital,
- risk value.
5. Reduction of congestion.
6. Reduction of water pollution risk.
7. Reduction of vibrations and consequent negative consequences.
8. Reduction of land use and vegetation.
9. Improving quality of rail system services.
10. Reduction of running times and train delays in international rail freight transport.
11. Higher level of information exchange between infrastructure managers and carriers.
12. Cost reduction for transport companies.
13. Price competitiveness against other modes of transport.
14. Improving fluency and reliability of international rail freight transport.
15. Growth of rail system revenues.
16. Decrease in road infrastructure maintenance costs.
17. Increase of infrastructure manager revenues.
18. Decrease in non-investment subsidies in railway infrastructure from public sources.
19. Increase in investment subsidies in railway infrastructure modernization.
20. Ensuring a sustainable development of the Amber RFC countries and the EU countries.

TRANSPORT MARKET STUDY
AMBER RAIL FREIGHT CORRIDOR
2018 139
12 SWOT ANALYSIS OF AMBER RFC
The Amber RFC will put into operation on 30.01.2019. In order to determine its direction and
development, it is important to make the most objective assessment of the current inputs of the
internal and external environments by which it is affected. The several methods and tools deal with
the strategic planning of which SWOT analysis was selected for the purpose of selecting the strategic
direction of the Amber RFC.
12.1 Characteristics of SWOT analysis process
Method of SWOT analysis consists in identifying the internal environment of the studied
subject using its strengths and weaknesses and in identifying the impact of external environment using
opportunities and threats, Based on recognized results a review of internal and external environment
analysis will be obtained, while the most appropriate strategy for the studied subject will be made up
based on given scores. Elaboration SWOT analysis is conditioned by completion of collection and
subsequent evaluation of all available data collected. Then, the created basis of SWOT analysis is
qualitatively and quantitatively assessed by independent experts and stakeholders, in this case by
individual members of Amber RFC. Without assessment of several experts and stakeholders, SWOT
analysis has only subjective character of its maker and it is inconsistent for the adoption of strategic
direction and decision-making.
Figure 47: Theoretical graphical representation of SWOT analysis

TRANSPORT MARKET STUDY
AMBER RAIL FREIGHT CORRIDOR
2018 140
Internal environment analysis S-W
The goal of the internal environment analysis is to identify the main strengths and weaknesses
of the studied subject. Following their analysis, the quantitative scores are assigned to their qualitative
importance. It is necessary, as priority, to build the strategy on the recognized strengths through which
competitive advantage is achieved. In case the assessed subject has insignificant and negligible
strengths, its strategy is to be aimed at reducing the value of weaknesses which may be a potential
threat for the subject.
Among the most influential strengths we can include:
- such strengths which are specific for the studied subject and it is difficult to implement them
for other subjects,
- tradition of a particular subject,
- qualified personnel,
- positive image of the subject perceived by customers via annual satisfaction surveys,
- product quality or service quality,
- developing research and development, etc.
On the other hand, the subject’s weaknesses are characterized as critical factors which should
be minimized to the lowest possible level. Among the weaknesses we can include:
- high prices that do not correspond to the product/service quality,
- negative image perceived by customers,
- poor organization and organizational skills of management,
- insufficient adaption of service portfolio to market needs, etc.
External environment analysis O – T
Finding the possibilities for new opportunities is one of the main reasons of the external
environment analysis. The market opportunities are defined by three possibilities:
- Enforcing on the market with entirely new product/service (general possibility not directly
applicable to Amber RFC).
- Enforcing on the market with existing product/service in innovative way.
- Enforcing on the market with scarce product/service.

TRANSPORT MARKET STUDY
AMBER RAIL FREIGHT CORRIDOR
2018 141
Since the opportunities may have different forms on the market, the subject has to ensure their
early and correct identification in the methodology of SWOT analysis elaboration. Among the
opportunities we can include:
- streamline business processes in the market using available technologies,
- maximum use of offered infrastructure capacities and public resources,
- product innovation using state of the art technologies and customisation according to customer
needs,
- drawing subsidies, etc.
The threats (risks) are the opposite of opportunities in the external environment that may have
adverse effects on the direction of the studied subject and its development. Among the threats that
may affect the company we include, in particular:
- legislative changes or lack of adequate legislative measures,
- lack of harmonised measures in the necessary procedures,
- political, economic, social, cultural, environmental and demographic changes,
- embargoes, tariffs, sanctions.
- new entrants into the market under consideration,
- management of overlapping sections, etc.
12.2 SWOT analysis of Amber RFC
The following four tables give strengths, weaknesses, opportunities and threats of internal and
external environment of Amber RFC. In tables, there are assigned importance to each indicator and
scores achieved (resulting importance for individual parts of SWOT analysis is an average value of
importance assigned by individual parties of SWOT). These two figures are then multiplied, while
their product determines the final evaluation of indicator. The data presented in the tables are the
resulting average values obtained from the infrastructure managers affected by the Amber RFC, the
TMS elaborator and the academic environment.
Explanation of Prioritization
Strengths and weaknesses:
- Importance. Importance shows how important a strength or a weakness is for the organization
as some strengths (weaknesses) might be more important than others. A number from 0.01

TRANSPORT MARKET STUDY
AMBER RAIL FREIGHT CORRIDOR
2018 142
(not important) to 0.99 (very important) should be assigned to each strength and weakness. The
sum of all weights should equal 1.0,
- Rating. A score from 1 to 6 is given to each factor to indicate whether it is a major (6) or a
minor (1) strength for the organization. The same rating should be assigned to the weaknesses
where -1 would mean a minor weakness and -6 a major weakness,
- Score. Score is a result of importance multiplied by rating. It allows prioritizing the strengths
and weaknesses. You should rely on your most important strengths and try to convert or defend
your weakest parts of the organization.
Opportunities and threats:
- Importance. It shows to what extent the external factor might impact the business. Again, the
numbers from 0.01 (no impact) to 0.99 (very high impact) should be assigned to each item. The
sum of all weights should equal 1.0,
- Probability. Probability of occurrence is showing how likely the opportunity or threat will have
any impact on business. It should be rated from 1 (low probability) to 6 (high probability). (For
Threats -1 (low probability) to -6 (high probability)),
- Score. Importance multiplied by probability will give a score by which you’ll be able to
prioritize opportunities and threats. Pay attention to the factors having the highest score and
ignore the factors that will not likely affect your business.
Table 48: Strengths of Amber RFC
S (Strengths) Importance Rating Score
Interconnection of railway infrastructure within the countries included in Amber RFC 0,07 5 0,35
Railway system reliability 0,08 5 0,41
Available information on technical specification of corridor railway lines 0,04 5 0,18
Access to the important seaport Koper in the Republic of Slovenia 0,10 5 0,51
Thanks to the corridor strategic location and routing, good connection with other
RFC corridors is guaranteed 0,08 5 0,41
Existing cooperation between individual infrastructure managers within Amber RFC countries
0,08 5 0,40
Railway infrastructure safety 0,10 6 0,54
Good technical conditions of railway infrastructure 0,08 5 0,41
Available free capacity 0,07 5 0,39
Connection by rail with countries outside the EU through BY/PL (Brest/Terespol) railway border crossing
0,10 6 0,60
Flexibility of railway infrastructure (e.g. suitable alternative routes) 0,05 6 0,28
Schengen area 0,03 6 0,21
Procurement of railway infrastructure capacity from one place C-OSS 0,05 4 0,19
Connection of railway transport with terminals within Amber RFC 0,06 5 0,31
TOTAL 1 - 5,19

TRANSPORT MARKET STUDY
AMBER RAIL FREIGHT CORRIDOR
2018 143
Table 49: Weaknesses of Amber RFC
W (Weaknesses) Importance Rating Score
Insufficient implementation of TEN-T infrastructure minimum standards 0,09 -4 -0,38
Enforcement of various interests of infrastructure managers of member states 0,12 -3 -0,34
Traffic restrictions related to possession causing temporary capacity constraint 0,17 -5 -0,78
Reducing the quality of rail freight services provided within Amber RFC 0,14 -3 -0,42
Poor technical condition in some sections of railway lines 0,15 -5 -0,69
Bottlenecks of capacity utilization 0,10 -5 -0,44
Insufficient technical parameters of railway infrastructure – requirements for modernization
0,11 -5 -0,57
Long waiting times at border crossings 0,13 -4 -0,50
TOTAL 1 - -4,11
Table 50: Opportunities set for SWOT analysis of Amber RFC
O (Opportunities) Importance Probability Score
Trend of using more environmentally friendly mode of transport (opportunity for rail transport)
0,08 4 0,35
Complete modernization of railway lines which limit the increase of line capacity
0,12 4 0,51
Investment of railway undertakings in sidings and siding operation 0,08 4 0,34
Increase in costs of road goods transport, e.g. toll charges 0,10 5 0,47
Increase in impact of transport policy of individual countries in favour of rail 0,10 5 0,47
Favourable economic growth of countries included in Amber RFC resulting in increase of import / export
0,12 5 0,56
Improving mutual cooperation between RFC corridors 0,06 5 0,30
Potential for corridor extension to the north of the Republic of Poland towards seaports
0,08 4 0,32
Connection of major economic active regions within the Amber RFC 0,09 4 0,38
Investment and modernization (e.g. construction of new line, double-tracking,
station upgrade-signalling equipment, etc.) 0,08 3 0,23
Connection between inland ports on the Danube in Hungary and Slovakia 0,05 4 0,21
Connection with the lines in the Czech Republic 0,03 5 0,17
TOTAL 1 - 4,32

TRANSPORT MARKET STUDY
AMBER RAIL FREIGHT CORRIDOR
2018 144
Table 51: Threats set for SWOT analysis of Amber RFC
T (Threats) Importance Probability Score
Building logistic centres without connection to railway infrastructure 0,06 -3 -0,17
Lack of qualified personnel in operation 0,08 -4 -0,37
Insufficient coordination in infrastructure development work 0,09 -4 -0,37
Reducing transport volumes of international freight trains 0,10 -4 -0,34
Tendency of transport policy of individual countries to rail transport disadvantage
0,06 -3 -0,16
Unfavourable economic development within Amber RFC countries 0,07 -3 -0,21
Reducing investment subsidies for rail transport 0,07 -4 -0,30
Reducing non-investment subsidies for rail transport 0,06 -3 -0,19
Higher transport time compared to road goods transport 0,10 -5 -0,44
Lower flexibility compared to road goods transport 0,10 -5 -0,46
Insufficient coverage of railway corridor routes to cover customer needs 0,11 -5 -0,57
Stagnation (unsolved problems) in the field of maintenance and modernization 0,10 -2 -0,25
TOTAL 1 - -3,82
12.3 Resulting SWOT strategy of the Amber RFC
The quantitative scores were assigned to strengths, weaknesses, opportunities and threats (risks)
in SWOT analysis for the Amber RFC. Quantified assessment of internal and external environment
analysis needs to be put in comparison of vectors from which we find a particular position which
represents model strategy for the Amber RFC.
Based on determining the resultant vector it is possible to determine a strategy:
- offensive,
- defensive,
- union: in case of the Amber RFC, this strategy cannot be applied,
- exit: in case of the Amber RFC, the strategy cannot be applied.
Using quantified evaluation of internal and external environment it was found by comparison
of vectors: Offensive strategy, as model strategy for the Amber RFC. Graphical representation of
matrix of model strategies with initial strategy for the Amber RFC is shown in diagram below.

TRANSPORT MARKET STUDY
AMBER RAIL FREIGHT CORRIDOR
2018 145
Figure 48: Matrix of model strategies for the Amber RFC
*Note: vector routing is the result of the difference between Opportunities and Threats, as well as the
difference between Strengths and Weaknesses
Offensive strategy is considered to be the most attractive strategic alternative. It can be used by
an entity whose position is ideal with the predominant strengths over the weaknesses. Such an entity
is able to use its strengths to realize the opportunities offered by the external environment. However,
an entity must monitor its weaknesses and avoid defined risks. Based on the resultant strategy, it is
necessary to take the following measures for the Amber RFC:
- increase the reliability of rail system services,
- developing the high-quality and available services of C-OSS,
- developing the cooperation with other RFC corridors,
- support for intermodal transport services,
- reducing the charges for local service trains,
- in operative transport management, to proceed to prioritize international freight trains,
- quality, flexible, reliable and cost-effective services of Koper seaport,
- close cooperation between infrastructure managers,

TRANSPORT MARKET STUDY
AMBER RAIL FREIGHT CORRIDOR
2018 146
- coordination of investment projects in railway infrastructure within the Amber RFC lines,
- increased awareness of the corridor, its services and perspectives,
- exchange of information concerning operation, control and possessions,
- measures to reduce the technological times of operations for transport of goods from/to
counties outside the EU,
- providing the best resources, e.g. human, IT,
- investment in interoperability,
- exclusive or dominant access to the most capable suppliers of MB Amber RFC.
The above mentioned measures result from the strategy and its characteristics. However, the
Amber RFC itself cannot influence all measures mentioned. Therefore, it is necessary that the
subjects, that can affect the individual measures, deal with the suggested measures (e.g. the ministries
concerned, infrastructure managers, governments of individual countries, EC). The proposed strategic
measures resulting from the SWOT analysis results are proposed to be implemented through the
method “Attacks on competitive advantages” which is implemented with the aim to take over the
market share of weaker competitors or reduce the competitive advantage of strong rivals. The attack
is conducted by various methods, e.g. price reduction, effective advertising, marketing
communication mix, new services, etc.
TRANSPORT MARKET STUDY
AMBER RAIL FREIGHT CORRIDOR
2018 147
13 STRATEGIC MAP OF AMBER RFC
In order to fulfil the basic objectives of the Amber RFC, it is necessary to set out the strategic
steps for their fulfilment. One of the appropriate methods for creating strategic processes is the
Balanced Score Card – BSC. BSC is a complex strategic method that looks at the subject under
consideration through four perspectives and their mutual relationships. It is a financial, customer,
process, learning and growth perspective. BSC is based on the vision and strategy of the object under
consideration and on that basis for each perspective the mission and strategic objectives, to which
certain metrics and their target values are assigned, will be determined. All perspectives are logically
connected and linked and this method, therefore, provides a complex view of the object under
consideration and its performance.
Amber RFC main visions are:
- growth of rail freight transport performances,
- fulfilling the EU transport objectives and reducing the negative external costs of transport,
- strengthening rail freight position within the individual member states of the Amber RFC,
- expand cooperation with rail carriers as well as between IM,
- strengthening and developing the cooperation between RFC corridors,
- maintaining and developing the rail freight services,
- developing the services concerning free capacity allocation,
- fulfilling the basic objectives of the liberalization of rail freight services market.
Amber RFC mission consists particularly in:
- providing and improving the rail freight services (cooperation between IM, provision of
important information on access to railway infrastructure, cooperation on sidings, etc.),
- creating a positive perception of rail freight transport and the Amber RFC (participations in
various events, etc.),
- development and modernization of railway infrastructure,
- participation in transport policy development within the individual countries of the Amber
RFC as well as at the EU level,
- promoting the development of rail freight transport as an environmentally friendly and
perspective mode of transport compared to road transport,

TRANSPORT MARKET STUDY
AMBER RAIL FREIGHT CORRIDOR
2018 148
- decreasing the transport performances of more environmentally demanding modes of
transport,
- available non-discriminatory access to railway infrastructure and its capacity,
- effective transport of goods from/to EU, form/to countries outside the EU,
- reducing public spending,
- high satisfaction of all customers of the Amber RFC.
The following figure shows the BSC strategic map for the Amber corridor. The strategic map
is based on the vision and mission of the Amber RFC and its four perspectives.

TRANSPORT MARKET STUDY
AMBER RAIL FREIGHT CORRIDOR
2018 149
Figure 49: Map Balanced Score Card of Amber RFC

TRANSPORT MARKET STUDY
AMBER RAIL FREIGHT CORRIDOR
2018 150
Continue of Figure 49:
Figure 50: Map Balanced Score Card of Amber RFC

TRANSPORT MARKET STUDY
AMBER RAIL FREIGHT CORRIDOR
2018 151
14 AMBER RFC MARKETING STRATEGY
The draft for strategic direction of the Amber RFC is contained in chapters 12 and 13. In
addition to the drafts in the above mentioned chapters, it is necessary to propose a marketing strategy
which main task will be, in the first phase of the Amber RFC operation, its propagation. The chapter
deals with a draft of marketing strategy in the field of propagation – marketing communication mix.
The Amber RFC is a provider of services that are characterized by:
- immateriality,
- inseparability,
- heterogeneity,
- impossibility of ownership,
- responsibility,
- longevity.
The draft of marketing communication will include:
- vision,
- mission,
- branding strategy.
The marketing strategy draft itself requires knowledge of the external and internal environment
influencing on the Amber RFC. The external environment will be analysed based on the PEST
(political, economic, socio-cultural and technological) analysis. The internal environment will then
be examined using Porter’s Five Forces of Competitive Analysis.
A) PEST analysis (external environment):
1. Political and legislative impact:
- European Union, European Commission,
- current legislation of the member states on business, transport, tax policy, labour law, sanctions,
technical conditions,
- individual interests of the member states and the European Union in the field of transport
policy, transport business, technical conditions,
- legislation of countries outside the EU (Ukraine, Belarus, Serbia, Turkey, China),
- international cooperation of the EU countries with countries outside the EU,
- international and internal customs legislation,
- intentions in foreign investment of individual EU countries, the Amber RFC countries, the
USA, etc.,

TRANSPORT MARKET STUDY
AMBER RAIL FREIGHT CORRIDOR
2018 152
- measures in the field of protection of national producers on the part of EU member states and
the European Union,
- international law and its principles.
2. Economic impacts:
- economic development of the corridor member states,
- economic development of other EU countries,
- economic development of Serbia, Ukraine, Belarus, China and Turkey,
- economic development of the Czech Republic,
- development of unemployment in the Amber RFC member states and other EU member
states,
- amount of investment allocated to the railway infrastructure development in the Amber RFC
countries,
- amount of investment allocated to the development of other transport infrastructure in the
Amber RFC countries,
- development of international trade,
- development of demand for international goods transport services,
- financial condition of the Amber RFC infrastructure managers,
- financial condition of infrastructure managers of the Amber RFC neighbouring countries.
3. Socio-cultural impacts:
- awareness of the population of the needs of greening transport,
- awareness of producers and forwarders of the needs of greening transport,
- population growth in the Amber RFC member states – higher demands on services and
consumption,
- population decline in the Amber RFC member states – lower consumption,
- population growth in other EU member states – higher demands on services and consumption,
- population decline in other EU member states – lower consumption,
- change of purchasing behaviour of the population – preferring national products versus
favouring substitutes made outside the home country.
4. Technological and technical impacts:
- modification of railway infrastructure technical standards,
- modification of technical standards of other modes of transport,
- interoperability of rail system,
- development in the field of railway signalling safety technology,
- development of rail transport means,
- development of transport means of other modes of transport,

TRANSPORT MARKET STUDY
AMBER RAIL FREIGHT CORRIDOR
2018 153
- change of technological processes at border crossings,
- development of IT for data exchange in the field of transport services and transport operation,
- pressure on reducing the infrastructure technical restrictions,
- need of transport infrastructure modernization.
5. Environmental impacts:
- pressure on reducing the greenhouse gas emissions,
- reducing the transport accidents and associated pollution of natural resources,
- pressure on increasing the energy consumption from renewable energy sources,
- pressure on reducing the energy consumption from fossil fuels.
B) Porter’s Five Forces of Competitive Analysis (internal environment):
1. Existing, current competitors:
- road freight transport,
- air freight transport,
- maritime freight transport in the direction of goods from/to China,
- RFC 5 corridor,
- road infrastructure managers in the Amber RFC member states,
- Gdańsk + Gdynia and Trieste seaports.
2. Substitution products:
- road network,
- road freight services,
- air freight services (e.g. consignments transported by intermodal transport: electronics, spare
parts, etc.),
- multimodal transport services without the use of rail transport,
- maritime freight services in the direction of goods from/to China,
- allocation of international routes individually through infrastructure managers.
3. Suppliers of:
- energies,
- telecommunication and internet services,
- professional studies, surveys and analyses,
- IT and SW equipment,
- support services in the field of rail operation,
- repair services,
- materials of railway superstructure and substructure,
- construction companies carried out the modernization, reconstruction, repair, maintenance
and renewal of railway infrastructure,

TRANSPORT MARKET STUDY
AMBER RAIL FREIGHT CORRIDOR
2018 154
- office and administrative supplies.
4. Potential competitors:
- road freight transport over 12 tonnes,
- road freight transport up to 3,5 tonnes,
- road freight transport from 3,5 to 12 tonnes,
- air freight transport,
- maritime freight transport in the direction of goods from/to China,
- RFC 5 corridor.
5. Stakeholders:
- railway undertakings,
- intermodal operators.
These analyses serve for a draft of vision, mission and use of communication mix tools.
The vision is a starting point of the strategic management process and represents a set of specific
ideals and priorities of the entity. It is an image of its successful future based on the fundamental
values or the philosophy with which the goals and plans of the entity are connected. The vision gives
an answer to the question: how will the entity look in the future. The vision must be clearly
formulated, realistic and well communicable. The basis of each vision is the result to be achieved in
the customer’s interest. The specific content of the vision then depends on the entity itself and the
sector in which the subject operates. Three basic objectives of vision:
- express the general direction,
- motivate people to move right,
- quickly and effectively coordinate efforts of people.
Draft of the Amber RFC vision: Provision of effective, available and flexible services for
corridor users on the up-to-date, interoperable and safe railway infrastructure in order to increase the
overall attractiveness of rail services and thus to contribute to an increase in rail freight transport
performances and subsequent fulfilment of environmental objectives of the EU and the whole human
population.
Well formulated mission can be a useful tool for strategy formulation, but also for day-to-day
management decisions. The entity’s mission presents not only the intention of entity existence itself,
but also, towards other entities of market, the standards of behaviour of the whole organization, and,
last but not least, the values respected by entity. The mission has the following functions:
- expresses the basic strategic intention of the owners and top management of the organization,

TRANSPORT MARKET STUDY
AMBER RAIL FREIGHT CORRIDOR
2018 155
- has an external information character towards the public and stakeholders, suppliers, customers,
interest groups, etc.,
- has an internal information character as the basic standard of management and employees
behaviour.
Draft of the Amber corridor mission: Continuously build quality services for transport of
goods, environment and public resources. Provide quality, available and non-discriminatory services
to all corridor users and cooperate effectively with terminals. Cooperate with EU authorities, corridor
member states authorities, intermodal operators and other RFC corridors. Create full-value mutual
business relationships with major suppliers. Contribute to railway infrastructure development in line
with customer needs and creation of competitive environment in the European and international
transport system.
Brand Amber RFC – is a promise to the customer to provide specific benefits that are related to
the product. Brand is name, title, sign, expression or their combination. Its purpose is to distinguish
the product or service of one provider or group of providers from competitors. Brand is not created
only by a logo, a visual style, a specific product, but also services and service associated with the
main product, company and its image and brand communication.
Requirements: Amber RFC brand evaluation
- short, appropriate graphic processing - fulfilled,
- simply rememberable – fulfilled,
- easily identifiable - fulfilled,
- original, overtime - fulfilled,
- not inspiring negative associations - fulfilled,
- registered and legislatively protected – not fulfilled, need to supplement,
- applicable internationally - fulfilled.
The name of the corridor, including its logo, is recommended to be used in all documents
dealing with the issue of the corridor and the RFC corridors, international rail freight transport,
legislation, correspondence, commercial relation and marketing communication. The logo and name
meet the conditions for the given type of propagation and clearly identify the surveyed corridor.
Colours fit to its basic name – the Amber RFC.
The following table contains a draft for the use of marketing communication tools for the Amber
RFC based on its main objectives and services provided. At the same time, the marketing
communication strategy is designed based on the analysis of external and internal environment of the
Amber RFC.

TRANSPORT MARKET STUDY
AMBER RAIL FREIGHT CORRIDOR
2018 156
Table 52: Draft for marketing communication application
Point Use Application
Advertising yes Leaflets, brochures, emails sent to railway undertakings, intermodal
operators and forwarders
Sales support no -
On-line sales yes Through the C-OSS office, propagation of C-OSS on websites of
infrastructure managers
Public relations yes Through email, social networks, discussion forums
Sponsorship no -
On-line marketing communication yes Through email, social networks, discussion forums, website, EC
websites, websites of infrastructure managers
Guerrilla marketing no -
Product placement yes -
Content marketing yes Through email, social networks, discussion forums
Experiential marketing yes Propagation by scientific and professional articles dealing with
transport of goods, transport, ecology, savings in social transport
Green marketing yes Environmental benefits published at website, in studies, TMS,
promotional products, conferences

TRANSPORT MARKET STUDY
AMBER RAIL FREIGHT CORRIDOR
2018 157
15 CONCLUSIONS AND RECOMMENDATIONS
The aim of the presented transport market study was a comprehensive assessment of transport,
traffic, technological and social effectiveness of the Amber RFC. Consequently, on the basis of
verified and consistent knowledge available, propose the strategy for the establishment of the Amber
RFC. The strategic recommendation itself for the Amber RFC is listed in Chapter 12, while Chapter
13 contains a draft of strategic map for the surveyed corridor. The international rail freight corridor
Amber will be established on 30.01.2019 and it should ensure, in particular, coordination between the
various parties concerned, more effective transport management, increase awareness and overall
quality of rail system services, non-discriminatory access to infrastructure, increase in transport
performances, support shift of transport performances from more environmentally demanding modes
of transport to rail freight transport as well as improve continuity of transport across member states,
focusing on sufficient priorization of rail freight transport.
On the basis of the economic, transport, traffic and technical analyses carried out, the
comparison of modal split and other important qualitative and quantitative transport indicators, we
can conclude that the establishment of the Amber RFC is, from socio-economic point of view,
justified and necessary for the development of international rail freight services. The socio- economic
benefits of the Amber RFC establishment are presented in subchapter 11.1.
The basic routing of the Amber RFC was determined by Commission Implementing Decision
(EU) No 2017/177 of 31 January 2017. Another objective of the study was the assessment of the
given basic routing according to the Implementing Decision, where the individual routes are divided
by importance (TMS results: Koper – Ljubljana- Zalaszentiván/ -Sopron – Csorna/ - Rajka
–Bratislava – Leopoldov – Žilina - Katowice/ -Komárom – Budapest/ -Komárom -Budapest – Kelebia
(Hungarian-Serbian border)/ -Budapest- Vác – Nové Zámky – Leopoldov/ Budapest- Mezőzombor-
Hidasnémeti- Košice- Plaveč – Muszyna- Nowy Sącz /-Tymbark –Podłęże/-Tarnów
– Podłęże/ -Podłęże- Tunel- Dęblin- Terespol – (Polish-Belorusian border). A draft of exact routing
and technical parameters of the individual lines is contained in Chapter 9. The routing draft itself is
based on the research and analysis of the available statistical data.
The routing and geographical location of the Amber RFC provide a sufficient transport potential
within the corridor countries, the EU countries as well as new transport opportunities from/to the
Serbia and other countries outside the EU examined. In the TMS the routing creates the suitable
conditions for corridor extension which is conditioned, in particular, by transport requirements. The
analyses of assessing the transport opportunities showed an increase in demand

TRANSPORT MARKET STUDY
AMBER RAIL FREIGHT CORRIDOR
2018 158
for transport services, particularly in international trade, with an upward trend in the following period.
The research showed the competitiveness of international rail freight services on the Amber RFC
lines at the time of transport and charging, compared to road freight transport. However, it is necessary
to support services for single wagon load transport which are, inter alia, influenced by the Last mile
infrastructure. The average speed of international freight trains will increase due to the Amber RFC
services which will contribute to the attractiveness of the rail system services. Based on the routing,
the Amber RFC can be included in the EU strategic transport infrastructure. Proven economic
development in the examined countries as well as the forecast of transport performance development
showed an increase in transport performance after the corridor establishment. The corridor
establishment will contribute to meeting the EU transport policy objectives and creating the single
European railway area necessary to modal split change. The modal split change will greatly contribute
to decrease in social transport costs. At the same time, the sustainable development of the EU
countries will be ensured.
Based on the comprehensive results of the presented transport market study, in order to ensure
the further development of the single European railway area, fulfilling the EU and the Amber RFC
objectives in the field of transport policy, we recommend to:
- provide services planned by the Amber RFC: drafting the international timetable, provision of
capacity, one contact point,
- designate the Amber RFC infrastructure based on the results in Chapter 9: classification of
individual lines was carried out based on the analysis of transport performances, geographic
location, technical parameters of the lines and traffic flows,
- adopt a strategy draft based on the results of the SWOT analysis: since SWOT analysis is a tool
for finding strategic direction,
- proceed to measures proposed in the SWOT analysis: the measures proposed in SWOT analysis
are based on the current state and should contribute to the fulfilment of the basic objectives of
the Amber RFC,
- as part of the strategy, proceed on the basis of the BSC strategic map: the draft of strategic map
is based on the current state and the fulfilment of the individual parts of BSC will lead to meet
the individual objectives of the Amber RFC (vision, mission, strategic objectives),
- take measures relating to marketing: marketing proposals should contribute to the promotion of
the Amber RFC and its basic services,
- create a corridor website and an interactive corridor map: at least to provide the basic
information on the Amber RFC, corridor routing, technical characteristics of the lines and
corridor services.

TRANSPORT MARKET STUDY
AMBER RAIL FREIGHT CORRIDOR
2018 159
Based on the TMS’s comprehensive results, in order to further development of the Amber RFC
and the fulfilment of its strategic objectives resulting from the corridor mission and vision, we propose
the following measures:
- ensure proper and effective maintenance of railway infrastructure included in the Amber RFC
– individual infrastructure managers,
- ensure proper and effective transport management, coordination of possessions – individual
infrastructure managers of the Amber RFC,
- adaptation of transport management rules to the needs of rail freight transport – individual
infrastructure managers of the Amber RFC,
- in ensure proper transport management and capacity allocation,
- increase number and quality of international rail freight capacities - C-OSS office: due to low
free capacity on some line sections of the Amber RFC lines,
- increase and adapt the investment resources in modernization of the basic and connecting
transport infrastructure within the corridor – Member States,
- start active cooperation with other RFC – the Amber RFC, individual infrastructure managers,
- cooperate permanently and effectively with intermodal operators, railway undertakings and
carriers – the Amber RFC,
- complete the information on the Last mile infrastructure of the Amber RFC and take measures
for its modernization, reconstruction and support – the Amber RFC, infrastructure managers,
countries,
- elaborating a draft of interactive questionnaire available on the Amber RFC internet domain to
obtain effective and quick feedback and specification for a particular customer and his/her needs
– the Amber RFC and RNE,
- continuously improve the quality of marketing activity, especially marketing communication
– the Amber RFC, infrastructure managers, carriers and intermodal operators,
- as appropriate, cooperation with scientific and educational institutions to address strategy and
strategic management – the Amber RFC,
- regular evaluation of fulfilment of the Amber RFC main objectives.
Proposal of measures for support of the Amber RFC development and fulfilment of its strategic
objectives resulting from its mission and vision in the technical field:
- unification of the traction system within the Amber RFC principal lines (elaborating the
analysis and possible implementation and investment plan),

TRANSPORT MARKET STUDY
AMBER RAIL FREIGHT CORRIDOR
2018 160
- improving the technical parameters of the principal lines to increase the level of axle load and
maximum train length according to TEN-T and AGTC requirements,
- reduce the technological time of consignment dispatch from/to countries outside the EU: change
of legislation, transport requirements, harmonization of transport and technical regulations,
- improve the exchange of information between infrastructure managers and railway
undertakings.
At EU and international level, to support green rail freight transport, we propose to take the
following measures:
- internalisation of negative external costs of transport – the European Parliament and the
Council, the European Commission, individual member states,
- extend the network of local and regional intermodal transport terminals and small Marshalling
yards that can provide high quality and competitive intermodal transport services – individual
member states, the EU,
- initiative and reconsideration of the possibility of harmonizing the rail infrastructure charging
model within the lines included in the RFC corridors – individual member state, the EU,
- proceed to reduce transport infrastructure charges for local service trains, siding trains, trains
serving terminals – individual infrastructure managers, individual member states based on
liberalization charging principles.
These recommendations and suggestions are based on the results of the TMS and empirical
knowledge of the professional public, university staff, staff of the infrastructure managers and
carriers. The suggestions are intended to ensure a higher quality of railway system services and, in
particular, international rail freight services. A well-set and distributed service will contribute to
higher demand for rail freight services, effective modal split, savings in negative external costs of
transport and sustainable development. This will contribute to fulfilling the vision and mission of the
Amber RFC and thus meeting the EU’s transport objectives.

TRANSPORT MARKET STUDY
AMBER RAIL FREIGHT CORRIDOR
2018 161
LIST OF APPENDICES
Appendix A – Analysis of rail transport, xls. format
Appendix B – Supplementary data – Poland
Appendix C – Supplementary data – Slovakia
Appendix D – Supplementary data – Hungary
Appendix E – Supplementary data - Slovenia
Appendix F – List of Last mile
Appendix G – Modal split
Appendix H – Maximum gradient on the Amber RFC lines

TRANSPORT MARKET STUDY
AMBER RAIL FREIGHT CORRIDOR
2018 162
Appendix B
Supplementary data - Poland
The following table provides an analysis of investments in railway and road infrastructure in
the Republic of Poland in the period 2014 – 2017.
Table 1: Analysis of investment subsidies in Poland
State expenditures-whole infrastructure 2014 2015 2016 2017
Investment subsidies in mill. PLN (1 EUR = 4,144 PLN)
rail 75,98 25,20 4 932,59 5 750,28
road 9 405,46 11 488,17 15 731,41 19 002,74
Source: member of corridor from Poland
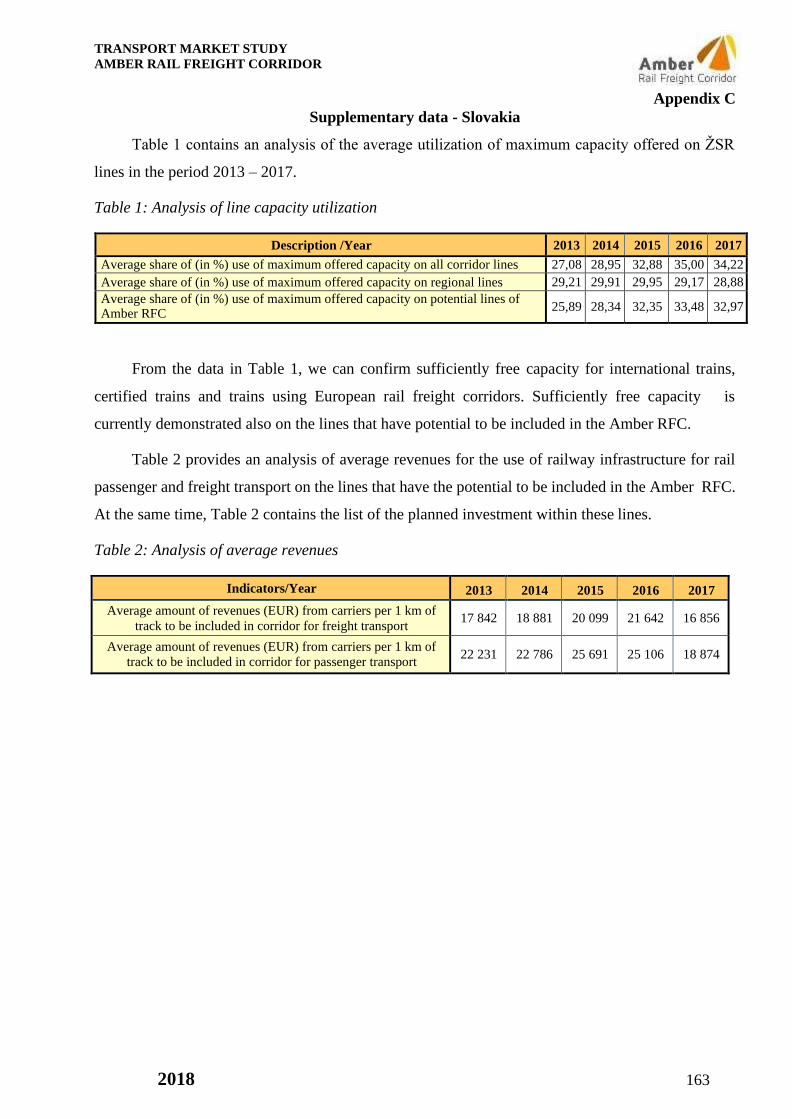
TRANSPORT MARKET STUDY
AMBER RAIL FREIGHT CORRIDOR
2018 163
Appendix C
Supplementary data - Slovakia
Table 1 contains an analysis of the average utilization of maximum capacity offered on ŽSR
lines in the period 2013 – 2017.
Table 1: Analysis of line capacity utilization
Description /Year 2013 2014 2015 2016 2017
Average share of (in %) use of maximum offered capacity on all corridor lines 27,08 28,95 32,88 35,00 34,22
Average share of (in %) use of maximum offered capacity on regional lines 29,21 29,91 29,95 29,17 28,88
Average share of (in %) use of maximum offered capacity on potential lines of Amber RFC
25,89 28,34 32,35 33,48 32,97
From the data in Table 1, we can confirm sufficiently free capacity for international trains,
certified trains and trains using European rail freight corridors. Sufficiently free capacity is
currently demonstrated also on the lines that have potential to be included in the Amber RFC.
Table 2 provides an analysis of average revenues for the use of railway infrastructure for rail
passenger and freight transport on the lines that have the potential to be included in the Amber RFC.
At the same time, Table 2 contains the list of the planned investment within these lines.
Table 2: Analysis of average revenues
Indicators/Year 2013 2014 2015 2016 2017
Average amount of revenues (EUR) from carriers per 1 km of
track to be included in corridor for freight transport 17 842 18 881 20 099 21 642 16 856
Average amount of revenues (EUR) from carriers per 1 km of
track to be included in corridor for passenger transport 22 231 22 786 25 691 25 106 18 874

TRANSPORT MARKET STUDY
AMBER RAIL FREIGHT CORRIDOR
2018 164
Table 3: Investments in railway infrastructure
Expected investments
Impact of investment
Expected
investment
amount (EUR)
Expected
investment time
span
Modernization of corridor st.
border ČR/SR – Čadca – Krásno
nad Kysucou, section Čadca – st.
border ČR/SR, 3rd construction
Modernization of existing double-track
railway line which is a part of the TEN-T
network and the European railway corridor
no VI. The length of section is 4,904 km
83 211 776
2019/2021
Modernization of corridor st.
border ČR/SR – Čadca – Krásno
nad Kysucou, section Čadca –
Krásno nad Kysucou (out of) 1st
and 2nd construction
Modernization of existing double-track
railway line which is a part of the TEN-T
network and the European railway corridor
no VI. The length of section is 9,4 km
220 000 000
2021/2023
Modernization of the railway line
Púchov - Žilina, for the line speed
up to 160 km/h
Modernization of the line Púchov – Žilina,
for the line speed up to 160 km/h Stage I
(Púchov - Považská Teplá)
392 720 001
2016/2020
Completion of Žilina – Teplička
marshalling yard and following
railway infrastructure at Žilina
node, realization
Modernization of the railway node Žilina
is necessary prerequisite for the full
development of a transit railway corridor in
the north – south direction meeting the
requirements of TSI – technical
specifications for interoperability of
conventional rail systems in Europe.
390 723 415
2019/2022
Table 4: Average charges for railway infrastructure – rail freight transport
Line section
Charges (€)
Transport of
containers
Transport of
chemicals
Transport of
standard goods
Access charges for
intermodal train
(ca. 40x40´containers
600 m, 1200 t,)
Access charges for
block train (ca.500 m, 1800 t,
chemicals )
Access charges for
single loading wagons
(ca.500 m, 1500 t,)
114 B Čadca - Zwardoń PL 72,58 91,43 82,01
106 D Žilina–Čadca–Mosty u Jablunkova (only to Čadca)
117,27 145,81 131,54
107 A Muzsyna PL – Plaveč – Kysak 232,74 304,34 268,54
109 B Hidasnémeti HU – Čaňa – Barca 51,72 68,76 60,24
105 A Košice – Kraľovany (len po Kysak) 116,79 131,6 124,2
D Barca St 1 – Košice nákl.stanica (koľ.101) 66,75 70,12 68,44
106 A Kraľovany – Žilina - Púchov (od Žilina zriaď. stanica)
167,32 209,51 188,42
105 A Púchov - Bratislava hlavná stanica 475,86 624,69 550,27
128 A Leopoldov – Galanta 123,22 150,89 137,06
120A Szob HU – Štúrovo – Bratislava hl.st. (od Nových Zámkov)
284,95 370,91 327,93
120 B Komárom HU – Komárno – Nové Zámky 119,56 151,09 135,32
124 A Komárno – Bratislava-Nové Mesto 252,94 324,89 288,91

TRANSPORT MARKET STUDY
AMBER RAIL FREIGHT CORRIDOR
2018 165
Appendix D
Supplementary data - Hungary
Tables 1 and 3 give an overview of the investment and non-investment subsidies in railway
infrastructure of Hungary in the period 2013 – 2017.
Table 1: Analysis of investment subsidies focused on railway infrastructure
On the lines listed in Appendix A Sheet MÁV Zrt.
GYSEV VPE 1 (name of section, railway station, etc.)
Investment subsidies in mill. €
2013 2014 2015 2016 2017+
MÁV Zrt.
Győr - Ferencváros 0,86 2,51 0,85 2,55 1,13
Őriszentpéter s.b. - Zalaszentiván 0,32 1,36 0,85 2,04 0,00
Kőbánya felső - Felsőzsolca 1,22 2,56 2,41 4,06 1,3
Felsőzsolca - Hidasnémeti s.b. 0,00 0,06 0,1 0,34 0,00
Ferencváros - Kelebia s.b. 0,54 0,43 3,31 0,39 0,13
Hatvan - Újszász 0,35 0,68 0,49 0,68 0,83
Újszász - Újszász elágazás 0,01 0,01 0,35 0,00 0,06
Újszász elágazás - Paládicspuszta elágazás 0,00 0,00 0,11 0,00 0,02
Paládicspuszta elágazás - Abony elágazás 0,03 0,06 0,16 0,04 0,02
Abony elágazás - Nyársapát elágazás 0,03 0,00 0,00 0,00 0,00
Nyársapát (incl.)- Városföld (excl.) 0,11 0,36 0,12 0,33 0,24
Városföld (incl.) - Kiskunfélegyháza (excl.) 0,07 0,16 0,05 0,16 0,17
Kiskunfélegyháza (excl.) - Harkakötöny elágazás (excl.) 0,10 0,01 0,01 0,17 0,06
Other 78,62 72,58 76,6 71,17 53,14
TOTAL 82,26 80,78 85,41 81,93 57,10
GYSEV
Rajka s.b. - Hegyeshalom 0 0,177 2,578 0 0
Sopron - Győr 0 1,472 0,306 0 0
Hegyeshalom - Porpác 0,637 4,672 39,503 0 0
Porpác – Szombathely 0 0 0,224 0 0
Szombathely - Zalaszentiván 0 0,07 1,591 48,245 0
TOTAL 0,637 6,391 44,202 48,245 0
Table 2: Analysis of non-investment subsidies
Non-investment subsidies in mill. EUR 2013 2014 2015 2016 2017
MÁV Zrt. 138,40 140,93 149,38 145,76 128,71
GYSEV 5,036 9,269 17,627 N/A N/A

TRANSPORT MARKET STUDY
AMBER RAIL FREIGHT CORRIDOR
2018 166
Tables 3 and 4 contain data on the selected economic and charge indicators of railway
infrastructure, separately for GYSEV and MÁV Zrt.
Table 3: Analysis of selected economic indicators of transport infrastructure – GYSEV
Indicators/Year 2013 2014 2015 2016 2017
Average amount of revenues (EUR) from carriers per 1 km
of track to be included in corridor for freight transport
15 645
15 870
13 429
11 035
12 911
Average amount of revenues (EUR) from carriers per 1 km
of track to be included in corridor for passenger transport
42 034
32 988
34 211
32 263
33 864
Average operational cost (EUR) per 1 km of corridor lines 90 107 91 948 91 282 87 811 94 224
Average operational cost (EUR) per 1 km of other lines 19 839 19 161 19 559 19 074 20 190
Average non-investment subsidy from public resources
(EUR) per 1 km of railway infrastructure 23 012 22 753 23 860 25 107 29 171
Table 4: Analysis of selected economic indicators of transport infrastructure – MÁV Zrt.
Indicators/Year 2013 2014 2015 2016 2017
Average amount of revenues (EUR) from
carriers per 1 km of track to be included in
corridor for freight transport
62 287
62 620
66 434
65 858
53 483
Average amount of revenues (EUR) from
carriers per 1 km of track to be included in
corridor for passenger transport
131 948
129 382
135 792
139 740
103 057
Average operational cost (EUR) per 1 km of
corridor lines 122 873,2 122 953 129 438 130 645 128 137
Average operational cost (EUR) per 1 km of other lines
31 775,5 29 920,2 33 483,1 29 327,9 35 916,16
Average non-investment subsidy from
public resources (EUR) per 1 km of railway
infrastructure
19 100
19 449
20 615
20 116
17 762

TRANSPORT MARKET STUDY
AMBER RAIL FREIGHT CORRIDOR
2018 167
Appendix E
Supplementary data - Slovenia
The following table gives an analysis of capacity utilization of SŽ-I lines in the period 2013 –
2017.
Table 1: Statistical average of capacity utilization
Description/Year 2013 2014 2015 2016 2017
Average share (in %) of use of offered maximum
capacity on corridor lines 69,15 69,15 70,58 70,58 74,29
Average share (in %) of use of offered maximum
capacity on regional lines 52,25 52,58 53,72 53,72 55,86
Average share (in %) of use of offered maximum capacity on lines considered in the Amber RFC
65,17 65,17 66,00 66,00 69,34
The analysis of statistical capacity utilization showed a gradual increase in utilization of
available line capacity on the corridor lines and lines considered for the Amber RFC. The utilization
of the line between Divača and Koper is 98% because there are 82 trains/day on this single-track line.
At the moment this line doesn't have enough free capacity for foreseen increase in transport
performances at Amber RFC. Studies for the construction of the second track on the line Koper –
Divača are on going and the upgrade of the line between Divača and Koper is an absolute priority.
Table 2: Analysis of investment subsidies focused on railway infrastructure
On the lines of the Amber RFC Investment subsidies in mill. €
2013 2014 2015 2016
Infrastructure maintenance* 59,69 77,12 64,56 52,89
Modernization of railway crossings* 0,40 0,77 0,13 0
GSMR* 3,83 50,47 86,39 0
ECTS* (corr D) 9,46 13,62 19,48 0
Maintenance works for public benefit* 23,98 0,94 2,16 0
Anti-noise barriers* 0,04 0,41 0,69 0
Interventions / interventions projects* 0,64 0,40 0,47 0
New railway line Koper - Divača 2,38 1,87 1,62 0
Upgrading of railway line Pragersko - Hodoš 66,64 144,22 160,87 0
Upgrading of line section Pragersko - Ptuj 0,02 0,01 0 0
Upgrading of line section Poljčane - Pragersko 1,51 6,01 19,39 0
Investment measures - upgrading Koper - Divača 46,68 29,90 38,05 0
Upgrading of line section Dolga gora - Poljčane 2,00 0 26,53 0
Upgrading of line section Zidani most - Celje 0 3,43 2,59 0
On other lines
Infrastructure maintenance* 0 0 0 12,41
New railway line Trst - Divača 0,33 1,31 1,58 0
Modernisation of Kočevje railway line 7,32 1,59 0,07 0
New railway line Ljubljana - Kranj - Jesenice 0,33 0,37 0,8 0
*Ministry of finance of Republic of Slovenia: Explanation of the annual accounts of the SI budgets for year
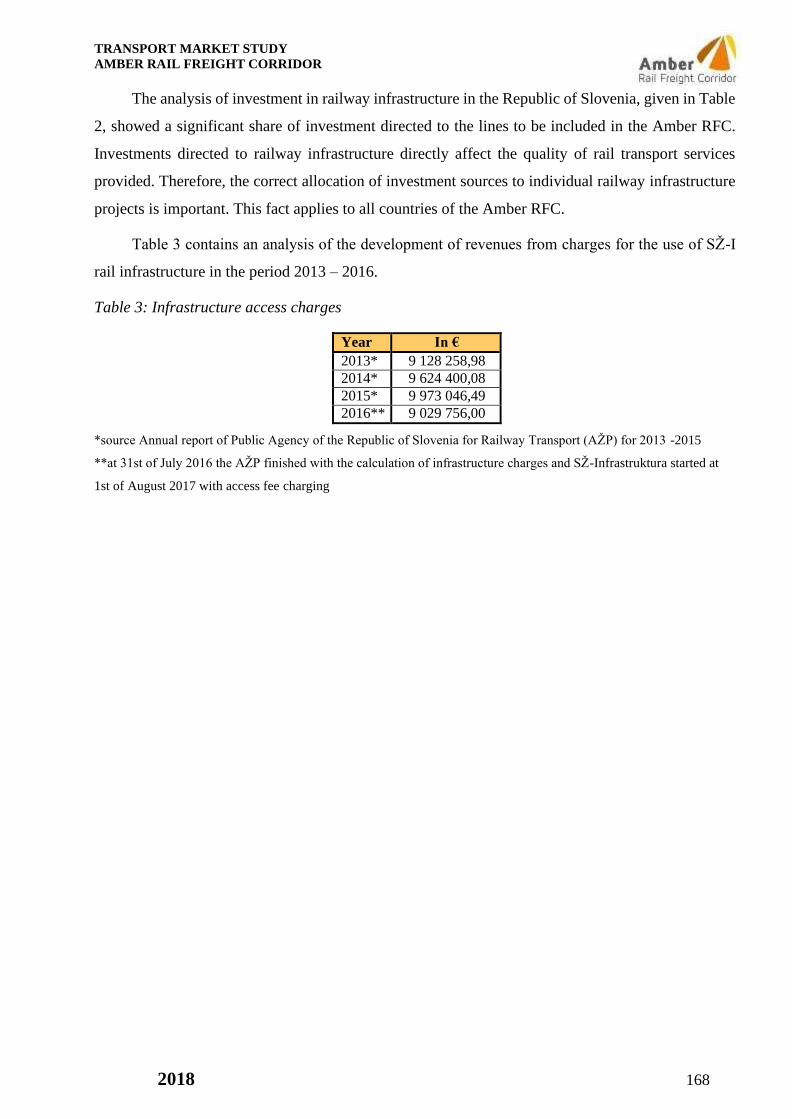
TRANSPORT MARKET STUDY
AMBER RAIL FREIGHT CORRIDOR
2018 168
The analysis of investment in railway infrastructure in the Republic of Slovenia, given in Table
2, showed a significant share of investment directed to the lines to be included in the Amber RFC.
Investments directed to railway infrastructure directly affect the quality of rail transport services
provided. Therefore, the correct allocation of investment sources to individual railway infrastructure
projects is important. This fact applies to all countries of the Amber RFC.
Table 3 contains an analysis of the development of revenues from charges for the use of SŽ-I
rail infrastructure in the period 2013 – 2016.
Table 3: Infrastructure access charges
Year In €
2013* 9 128 258,98
2014* 9 624 400,08
2015* 9 973 046,49
2016** 9 029 756,00
*source Annual report of Public Agency of the Republic of Slovenia for Railway Transport (AŽP) for 2013 -2015
**at 31st of July 2016 the AŽP finished with the calculation of infrastructure charges and SŽ-Infrastruktura started at
1st of August 2017 with access fee charging

TRANSPORT MARKET STUDY
AMBER RAIL FREIGHT CORRIDOR
2018 169
Appendix F
List of the Last mile of the Amber RFC
Republic of Poland
Object Type of equipment Address of equipment Contact details
Area of Małaszewicze / Terespol
PKP Cargo Centrum
Logistyczne
Małaszewicze
Intermodal transport
terminal
ul. Kolejarzy 22B
21-540 Małaszewicze Poland
PKP CARGO Centrum Logistyczne
Małaszewicze sp. z o.o.
T +48 83 343 75 63 F +48 83 343 75 63
www.clmalaszewicze.pl
EUROPORT
Małaszewicze Duże
Intermodal transport
terminal
ul. Warszawska 1C,
21 540 Małaszewicze Duże
Poland
EUROPORT
Małaszewicze Duże
T + (+48) 83 343 89 59 T +48 83 375 03 40 [email protected]
www.cleuroport.pl
Terminal
przeladunkowy
Wólka
Intermodal transport
terminal
21 512 Zalesie
Poland
Terminal przeladunkowy Wólka
T + 48 22 534 04 13
T +48 83 375 04 49
www.tradetrans.eu
Transgaz S.A.
Intermodal transport
terminal
21 512 Zalesie
Poland
Transgaz S.A
T +48 83 374-15-37, 374-15-38
T +48 600 078 499
www.transgaz.pl
Area of Warszawa
Terminal
Kontenerowy
Warszawa – PKP
Cargo Connect Sp.
z o.o.
Intermodal transport
terminal
ul. Marywilska 39
03 328 Warszawa
Poland
PKP Cargo Connect Sp. z o.o. T +48 22 534 04 13
www.tradetrans.eu
Loconi Intermodal
Terminal
Kontenerowy
Warszawa
Intermodal transport
terminal
ul. Jagiellońska 88
00 992 Warszawa
Poland
Loconi intermodal Terminal, Warszawa
T +48 58 354 71 58
T +48 50 21 77 722;
T +48 51 57 70 348
www.loconi.pl
Polzug Terminal
Kontenerowy
Pruszków
Intermodal transport
terminal
ul. Skorupki 5
00 546 Warszawa
Poland
Polzug Terminal Kontenerowy Pruszków
T +48 22 33 63 400
www.polzug.de
Terminal
Kontenerowy
Warszawa
Główna Towarowa
SPEDCONT Sp. z o.o.
Intermodal transport
terminal
ul. J. Ordona 2a
01-237 Warszawa
Poland
Spedcont
Ireneusz Marczak
T + 48 22 836 81 31 T + 48 42 613 74 23
www.spedcont.pl
Area of Katowice

TRANSPORT MARKET STUDY
AMBER RAIL FREIGHT CORRIDOR
2018 170
Terminal
Kontenerowy Gliwice
- PKP CARGO
CONNECT Sp. z o.o.
Intermodal transport terminal
ul. Władysława Reymonta 32
44 100 Gliwice
Poland
Terminal Kontenerowy Gliwice - PKP CARGO
CONNECT
T +48 32 23 18 877
Terminal Sosnowiec
Poludniowy
(Spedycja Polska
Spedcont Sp. z o.o.)
Intermodal transport
terminal
ul. Kościelna 60
41-200 Sosnowiec Poland
Spedcont
Krzysztof Ptak
T +48 42 613 74 23 F +48 32 293 30 63
www.spedcont.pl
Euroterminal
Sławków
Intermodal transport
terminal
CHL Groniec
41-260 Sławków Poland
Euroterminal Sławków
T +48 32 71 42 400
T +48 32 714 24 54 [email protected]
www.euterminal.pl
Polzug Terminal
Dąbrowa Górnicza
Intermodal transport
terminal
ul. Koksownicza 6
42 523 Dąbrowa Górnicza Poland
Polzug Terminal Dąbrowa Górnicza.
T +48 32 792 70 91
T +48 32 75 01 570 [email protected]
www.polzug.de
PCC Intermodal -
Terminal PCC
Gliwice
Intermodal transport
terminal
Portowa 28
44 100 Gliwice
Poland
PCC Intermodal S.A. Terminal
T + 48 32 30 18 471
www.pccintermodal.pl
Brzeski Terminal
Kontenerowy –
Karpiel sp. z o.o.
Intermodal transport
terminal
ul. Przemysłowa 6
32 800 Brzesko Poland
Brzeski Terminal Kontenerowy – Karpiel
T +48 14 68 45 050
T +48 784 497 327
www.karpiel.info.pl
Terminal
kontenerowy
Włosienica
Intermodal transport terminal
ul. Długa 1
32 642 Włosienica
Poland
Terminal kontenerowy Włosienica
T + 48 33 84 29 001
T + 48 53 79 99 735
www.balticrail.com
www.railpolska.pl
PCC INTERMODAL
- Terminal
Kolbuszowa
Intermodal transport
terminal
ul. Ks Ludwika Ruczki 3C
36 100
Kolbuszowa
Poland
PCC INTERMODAL
T +48 58 58 58 200
Lubelski Terminal
Kontenerowy
Intermodal transport
terminal
Drzewce 1
24 150 Nałęczów
Poland
Lubelski Terminal Kontenerowy
T +48 60 24 74 641
Erontrans Terminal
Kontenerowy w
Radomsku
Intermodal transport
terminal
ul. Młodzowska 3
97 500 Radomsko
Poland
Erontrans Terminal Kontenerowy
T +48 58 773 93 00
Loconi Intermodal
S.A. Terminal
Kontenerowy
Radomsko
Intermodal transport
terminal
ul. Kraszewskiego 36
97 500 Radomsko
Poland
Loconi Intermodal S.A
T +48 502 177 614
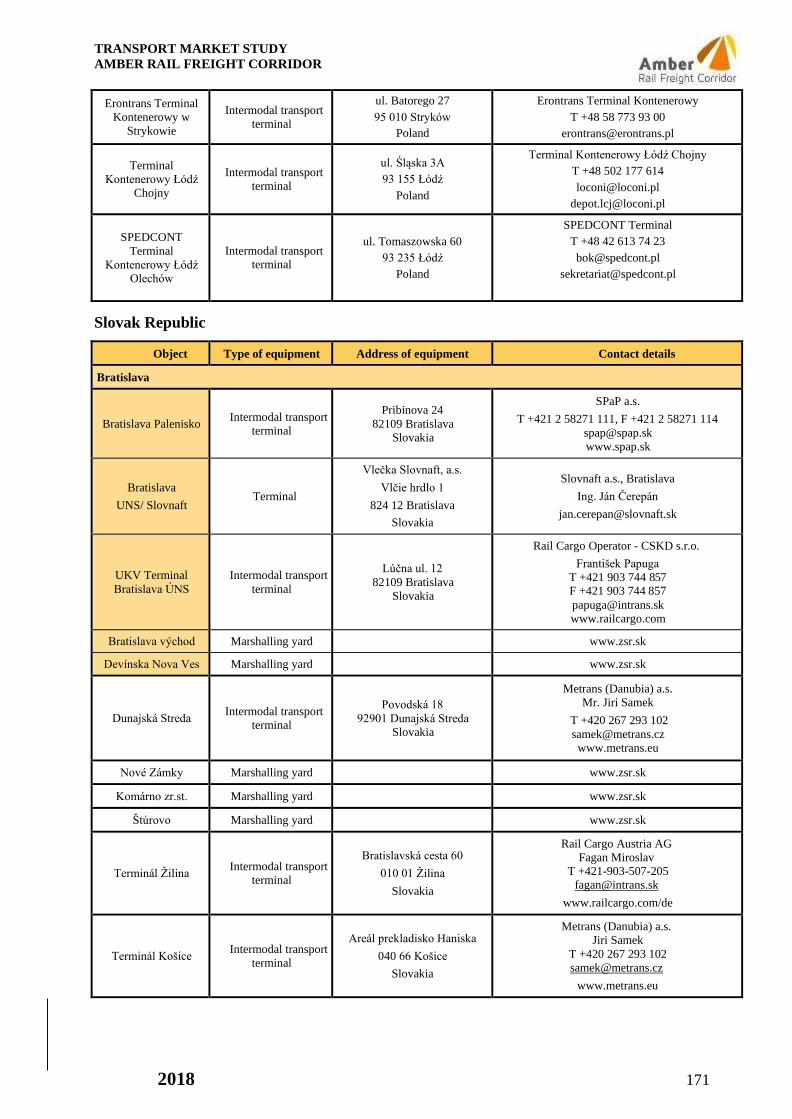
TRANSPORT MARKET STUDY
AMBER RAIL FREIGHT CORRIDOR
2018 171
Erontrans Terminal
Kontenerowy w
Strykowie
Intermodal transport
terminal
ul. Batorego 27
95 010 Stryków
Poland
Erontrans Terminal Kontenerowy
T +48 58 773 93 00
Terminal
Kontenerowy Łódź
Chojny
Intermodal transport
terminal
ul. Śląska 3A
93 155 Łódź
Poland
Terminal Kontenerowy Łódź Chojny
T +48 502 177 614
SPEDCONT
Terminal
Kontenerowy Łódź
Olechów
Intermodal transport terminal
ul. Tomaszowska 60
93 235 Łódź
Poland
SPEDCONT Terminal
T +48 42 613 74 23
Slovak Republic
Object Type of equipment Address of equipment Contact details
Bratislava
Bratislava Palenisko
Intermodal transport
terminal
Pribinova 24
82109 Bratislava
Slovakia
SPaP a.s.
T +421 2 58271 111, F +421 2 58271 114
www.spap.sk
Bratislava
UNS/ Slovnaft
Terminal
Vlečka Slovnaft, a.s.
Vlčie hrdlo 1
824 12 Bratislava
Slovakia
Slovnaft a.s., Bratislava
Ing. Ján Čerepán
UKV Terminal
Bratislava ÚNS
Intermodal transport
terminal
Lúčna ul. 12
82109 Bratislava
Slovakia
Rail Cargo Operator - CSKD s.r.o.
František Papuga
T +421 903 744 857 F +421 903 744 857
www.railcargo.com
Bratislava východ Marshalling yard www.zsr.sk
Devínska Nova Ves Marshalling yard www.zsr.sk
Dunajská Streda
Intermodal transport
terminal
Povodská 18
92901 Dunajská Streda
Slovakia
Metrans (Danubia) a.s.
Mr. Jiri Samek
T +420 267 293 102
www.metrans.eu
Nové Zámky Marshalling yard www.zsr.sk
Komárno zr.st. Marshalling yard www.zsr.sk
Štúrovo Marshalling yard www.zsr.sk
Terminál Žilina
Intermodal transport
terminal
Bratislavská cesta 60
010 01 Žilina
Slovakia
Rail Cargo Austria AG
Fagan Miroslav
T +421-903-507-205
www.railcargo.com/de
Terminál Košice
Intermodal transport
terminal
Areál prekladisko Haniska
040 66 Košice
Slovakia
Metrans (Danubia) a.s.
Jiri Samek
T +420 267 293 102
www.metrans.eu
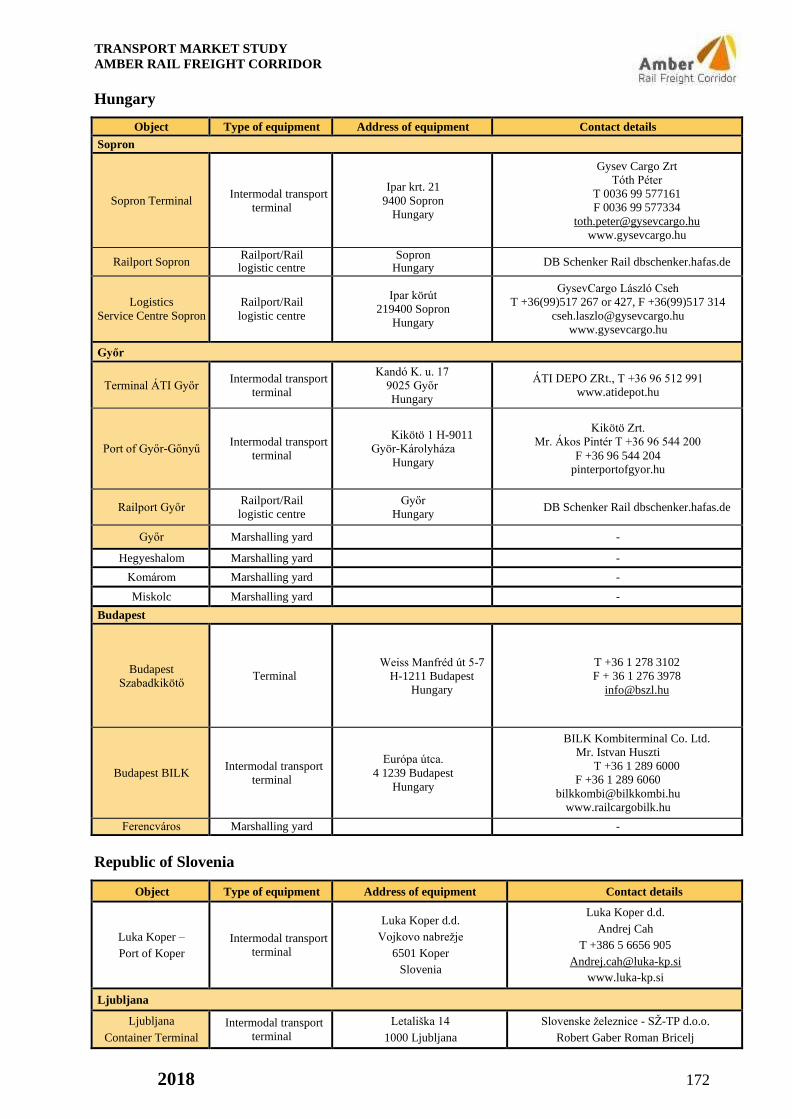
TRANSPORT MARKET STUDY
AMBER RAIL FREIGHT CORRIDOR
2018 172
Hungary
Object Type of equipment Address of equipment Contact details
Sopron
Sopron Terminal
Intermodal transport
terminal
Ipar krt. 21
9400 Sopron
Hungary
Gysev Cargo Zrt
Tóth Péter
T 0036 99 577161
F 0036 99 577334
www.gysevcargo.hu
Railport Sopron Railport/Rail logistic centre
Sopron Hungary
DB Schenker Rail dbschenker.hafas.de
Logistics
Service Centre Sopron
Railport/Rail
logistic centre
Ipar körút
219400 Sopron
Hungary
GysevCargo László Cseh
T +36(99)517 267 or 427, F +36(99)517 314
www.gysevcargo.hu
Győr
Terminal ÁTI Győr
Intermodal transport
terminal
Kandó K. u. 17
9025 Győr
Hungary
ÁTI DEPO ZRt., T +36 96 512 991
www.atidepot.hu
Port of Győr-Gőnyű
Intermodal transport
terminal
Kikötö 1 H-9011
Györ-Károlyháza
Hungary
Kikötö Zrt.
Mr. Ákos Pintér T +36 96 544 200
F +36 96 544 204
pinterportofgyor.hu
Railport Győr Railport/Rail
logistic centre
Győr
Hungary DB Schenker Rail dbschenker.hafas.de
Győr Marshalling yard -
Hegyeshalom Marshalling yard -
Komárom Marshalling yard -
Miskolc Marshalling yard -
Budapest
Budapest
Szabadkikötő
Terminal
Weiss Manfréd út 5-7
H-1211 Budapest
Hungary
T +36 1 278 3102
F + 36 1 276 3978
Budapest BILK
Intermodal transport
terminal
Európa útca.
4 1239 Budapest
Hungary
BILK Kombiterminal Co. Ltd.
Mr. Istvan Huszti
T +36 1 289 6000
F +36 1 289 6060
www.railcargobilk.hu
Ferencváros Marshalling yard -
Republic of Slovenia
Object Type of equipment Address of equipment Contact details
Luka Koper –
Port of Koper
Intermodal transport
terminal
Luka Koper d.d.
Vojkovo nabrežje
6501 Koper
Slovenia
Luka Koper d.d.
Andrej Cah
T +386 5 6656 905
www.luka-kp.si
Ljubljana
Ljubljana
Container Terminal
Intermodal transport
terminal
Letališka 14
1000 Ljubljana
Slovenske železnice - SŽ-TP d.o.o.
Robert Gaber Roman Bricelj

TRANSPORT MARKET STUDY
AMBER RAIL FREIGHT CORRIDOR
2018 173
Slovenia T +00386 1 29 13136, 12620
F +386 1 29 12 619
[email protected] [email protected]
www.slo-zeleznice.si/en
Ljubljana Zalog Marshalling yard Slovenske železnice - SŽ-TP d.o.o.
www.slo-zeleznice.si/en
Maribor
Land Terminal
Marshalling yard
Vodovodna ul.34
2000 Maribor
Slovenia
Slovenske železnice - SŽ-TP d.o.o.
Robert Gaber
T +00386 1 29 13136
F +386 1 29 12 619
www.slo-zeleznice.si/en
Celje
Land Terminal
Marshalling yard
Kidričeva ulica 34
3000 Celje
Slovenia
Slovenske železnice - SŽ-TP d.o.o.
Robert Gaber
T +00386 1 29 13136
F +386 1 29 12 619
www.slo-zeleznice.si/en
Sežana
Private Terminal
Partizanska cesta 79
6210 Sežana
Slovenia
Adria terminali, d.o.o.
Aleš Miklavec
T 00 386 5 731 22 01
http://www.adria-terminali.si/
Novo mesto
Private Terminal
Belokranjska 4
8000 Novo mesto
Slovenia
Revoz, podjetje za proizvodnjo in
komercializacijo avtomobilov Novo mesto, d.d
(shortened Revoz, d.d.)
Janez Rom
T 00 386 7 331 50 00
http://www.revoz.si/en/
Velenje
Private Terminal
Partizanska 12
3320 Velenje
Slovenia
Gorenje, gospodinjski aparati, d.d.
(shortened Gorenje, d.d.)
Slavica Papinutti
T 00 386 3 899 10 00
http://www.gorenje.co.uk/
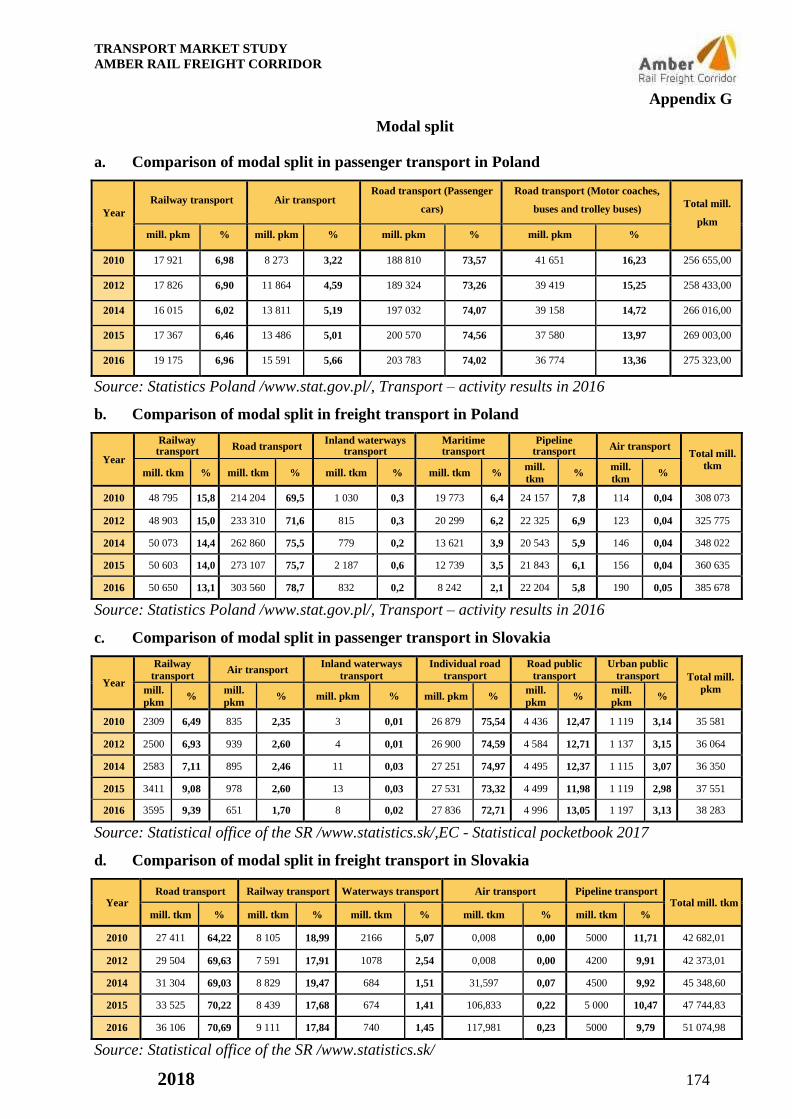
TRANSPORT MARKET STUDY
AMBER RAIL FREIGHT CORRIDOR
2018 174
Appendix G
Modal split
a. Comparison of modal split in passenger transport in Poland
Year
Railway transport
Air transport Road transport (Passenger
cars)
Road transport (Motor coaches,
buses and trolley buses)
Total mill.
pkm
mill. pkm % mill. pkm % mill. pkm % mill. pkm %
2010 17 921 6,98 8 273 3,22 188 810 73,57 41 651 16,23 256 655,00
2012 17 826 6,90 11 864 4,59 189 324 73,26 39 419 15,25 258 433,00
2014 16 015 6,02 13 811 5,19 197 032 74,07 39 158 14,72 266 016,00
2015 17 367 6,46 13 486 5,01 200 570 74,56 37 580 13,97 269 003,00
2016 19 175 6,96 15 591 5,66 203 783 74,02 36 774 13,36 275 323,00
Source: Statistics Poland /www.stat.gov.pl/, Transport – activity results in 2016
b. Comparison of modal split in freight transport in Poland
Year
Railway transport
Road transport Inland waterways
transport Maritime transport
Pipeline transport
Air transport
Total mill.
tkm mill. tkm % mill. tkm % mill. tkm % mill. tkm %
mill.
tkm %
mill.
tkm %
2010 48 795 15,8 214 204 69,5 1 030 0,3 19 773 6,4 24 157 7,8 114 0,04 308 073
2012 48 903 15,0 233 310 71,6 815 0,3 20 299 6,2 22 325 6,9 123 0,04 325 775
2014 50 073 14,4 262 860 75,5 779 0,2 13 621 3,9 20 543 5,9 146 0,04 348 022
2015 50 603 14,0 273 107 75,7 2 187 0,6 12 739 3,5 21 843 6,1 156 0,04 360 635
2016 50 650 13,1 303 560 78,7 832 0,2 8 242 2,1 22 204 5,8 190 0,05 385 678
Source: Statistics Poland /www.stat.gov.pl/, Transport – activity results in 2016
c. Comparison of modal split in passenger transport in Slovakia
Year
Railway
transport Air transport
Inland waterways
transport
Individual road
transport
Road public
transport
Urban public
transport
Total mill.
pkm mill.
pkm %
mill.
pkm % mill. pkm % mill. pkm %
mill.
pkm %
mill.
pkm %
2010 2309 6,49 835 2,35 3 0,01 26 879 75,54 4 436 12,47 1 119 3,14 35 581
2012 2500 6,93 939 2,60 4 0,01 26 900 74,59 4 584 12,71 1 137 3,15 36 064
2014 2583 7,11 895 2,46 11 0,03 27 251 74,97 4 495 12,37 1 115 3,07 36 350
2015 3411 9,08 978 2,60 13 0,03 27 531 73,32 4 499 11,98 1 119 2,98 37 551
2016 3595 9,39 651 1,70 8 0,02 27 836 72,71 4 996 13,05 1 197 3,13 38 283
Source: Statistical office of the SR /www.statistics.sk/,EC - Statistical pocketbook 2017
d. Comparison of modal split in freight transport in Slovakia
Year
Road transport Railway transport Waterways transport Air transport Pipeline transport Total mill. tkm
mill. tkm % mill. tkm % mill. tkm % mill. tkm % mill. tkm %
2010 27 411 64,22 8 105 18,99 2166 5,07 0,008 0,00 5000 11,71 42 682,01
2012 29 504 69,63 7 591 17,91 1078 2,54 0,008 0,00 4200 9,91 42 373,01
2014 31 304 69,03 8 829 19,47 684 1,51 31,597 0,07 4500 9,92 45 348,60
2015 33 525 70,22 8 439 17,68 674 1,41 106,833 0,22 5 000 10,47 47 744,83
2016 36 106 70,69 9 111 17,84 740 1,45 117,981 0,23 5000 9,79 51 074,98
Source: Statistical office of the SR /www.statistics.sk/

TRANSPORT MARKET STUDY
AMBER RAIL FREIGHT CORRIDOR
2018 175
e. Comparison of modal split in passenger transport in Hungary
Rok
Railway transport Inland waterways transport Road transport Air transport Total mill. pkm
mill. pkm % mill. pkm % mill. pkm % mill. pkm %
2010 7 692 9,36 14 0,02 68 845 83,82 5 586 6,80 82 137
2012 7 806 9,83 11 0,01 68 661 86,46 2 934 3,69 79 412
2014 7 738 9,41 9 0,01 70 163 85,32 4 323 5,26 82 233
2015 7 609 8,98 9 0,01 72 221 85,25 4 875 5,75 84 714
2016 7 653 8,70 10 0,01 74 300 84,44 6 032 6,85 87 995
Source: Hungarian Central Statistical Office /www.ksh.hu/
f. Comparison of modal split in freight transport in Hungary
Year
Road transport Railway transport Inland waterways transport Pipeline transport Total mill. tkm
mill. tkm % mill. tkm % mill. tkm % mill. tkm %
2010 33 721 66,71 8 809 17,43 2 393 4,73 5623 11,12 50 546
2012 33 735 66,47 9 230 18,19 1 982 3,91 5802 11,43 50 749
2014 37 517 67,86 10 158 18,37 1 811 3,28 5801 10,49 55 287
2015 38 352 69,11 10 010 18,04 1 824 3,29 5 305 9,56 55 491
2016 40 006 68,55 10 528 18,04 1 975 3,38 5850 10,02 58 359
Source: Hungarian Central Statistical Office /www.ksh.hu/, Eurostat, EC – Statistical pocketbook
2017
g. Comparison of modal split in passenger transport in Slovenia
Year
Passenger cars Buses and Coaches Railways Tram and Metro Total mill. pkm
mill. pkm % mill. pkm % mill. pkm % mill. pkm %
2010 25 600 83,0 3 200 10,4 813 2,6 1 226 3,98 30 839,00
2012 25300 83,5 3 200 10,6 742 2,4 1 060 3,50 30 302,00
2014 25600 82,9 3 400 11,0 697 2,3 1 179 3,82 30 876,00
2015 26 000 82,2 3 600 11,4 709 2,2 1 332 4,21 31 641,00
Source: Republika Slovenija –Statistični Urad /www.stat.si/, Eurostat, EC – Statistical pocketbook
2017
h. Comparison of modal split in freight transport in Slovenia
Year
Road transport Railway transport Air transport Total mill. tkm
mill. tkm % mill. tkm % mill. tkm %
2010 15 931 82,32 3421 17,68 1,5 0,01 19 353,5
2012 15 888 82,07 3470 17,92 1,1 0,01 19 359,1
2014 16 273 79,83 4110 20,16 1,1 0,01 20 384,1
2015 17 909 81,09 4175 18,90 1 0,00 22 088,1
2016 18 707 81,10 4360 18,89 0,9 0,00 23 075,1
Source: Republika Slovenija –Statistični Urad /www.stat.si/, Eurostat

TRANSPORT MARKET STUDY
AMBER RAIL FREIGHT CORRIDOR
Gradient in Poland
Maximum gradient on the Amber RFC lines
Appendix H

TRANSPORT MARKET STUDY
AMBER RAIL FREIGHT CORRIDOR
2018 176

TRANSPORT MARKET STUDY
AMBER RAIL FREIGHT CORRIDOR
2018 177
Gradient in Slovakia

TRANSPORT MARKET STUDY
AMBER RAIL FREIGHT CORRIDOR
2018 178
Gradient in Hungary

TRANSPORT MARKET STUDY
AMBER RAIL FREIGHT CORRIDOR
2018 179
Gradient in Slovenia

Assessment of KPIs for TT2020

2
Outcome from the MB meeting why KPIs are needed for:
• planning and setting RFC objectives • steering RFC business activities • increasing the added value and the quality of international rail freight • assessing the achievement of objectives • achieving the customers’ expectations and • preparing useful reports
in order to assess the overall performance of RFC organization.

3
Background
Article 19 (2) of Regulation (EU) 913/2010 requires the Management Board (MB) of the Rail Freight Corridors (hereinafter: RFCs) to monitor the performance of rail freight services on the freight corridor and publish the results of this monitoring once a year.
The RFCs are free to choose their own Key Performance Indicators (KPIs) to fulfil this requirement of the Freight Regulation – fallowing the harmonisation of the used KPIs.
RNE guideline „Key Performance Indicators of Rail Freight Corridors“ provides recommendations for using a set of KPIs commonly applicable to all RFCs.
In accordance with Article 14 of the Freight Regulation the Executive Board with his Framework for Capacity Allocation (FCA) is also a decision-making body for monitoring the capacity allocation procedure.

4
Selection and publication of KPIs:
The selection of the KPIs shall remain within the responsibility of RFCs decision-making bodies (MB by taking ExBo FCA)
The KPIs of the RFCs may include a set of commonly agreed KPIs and individual KPIs.
The description of the KPIs (including definition, calculation formula, targets, source of data and data processing tool, publication of the results, etc.) should be published in the Corridor Information Document (CID).

5
Set of KPIs applicable for Amber RFC*
• The CG assessed which KPI should be used by Amber RFC for TT2020 and a recommendation for MB was made. There was hesitation about KPIs no 7 and 8 but at the end of the day they are recommended, too.
• The KPIs will be produced, as appropriate, by C-OSS representative (supported by WG TT/C-OSS where needed) and by WG TM,TP&O.
• Once ready, the KPIs will be delivered to WG Marketing, which will
integrate the KPIs in the yearly performance monitoring report of Amber RFC.
*RNE IT tools (PCS and TIS, the data processing tool is RNE OBI) shall be used for the KPIs calculation.
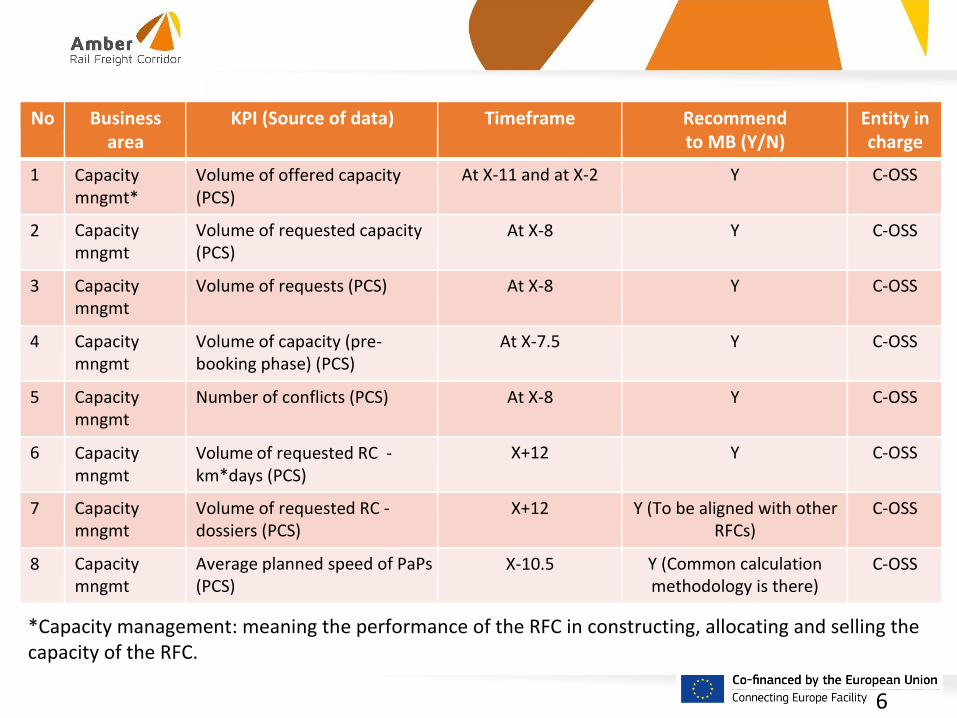
6
No Business area
KPI (Source of data) Timeframe Recommend to MB (Y/N)
Entity in charge
1 Capacity mngmt*
Volume of offered capacity (PCS)
At X-11 and at X-2 Y C-OSS
2 Capacity mngmt
Volume of requested capacity (PCS)
At X-8 Y C-OSS
3 Capacity mngmt
Volume of requests (PCS) At X-8 Y C-OSS
4 Capacity mngmt
Volume of capacity (pre- booking phase) (PCS)
At X-7.5 Y C-OSS
5 Capacity mngmt
Number of conflicts (PCS) At X-8 Y C-OSS
6 Capacity mngmt
Volume of requested RC - km*days (PCS)
X+12 Y C-OSS
7 Capacity mngmt
Volume of requested RC - dossiers (PCS)
X+12 Y (To be aligned with other RFCs)
C-OSS
8 Capacity mngmt
Average planned speed of PaPs (PCS)
X-10.5 Y (Common calculation methodology is there)
C-OSS
*Capacity management: meaning the performance of the RFC in constructing, allocating and selling the capacity of the RFC.

7
No Business area
KPI (Source of data) Timeframe Recommend to MB (Y/N)
Entity in charge
9 Operations *
Punctuality at origin (TIS) In January after the timetable year
concerned
Y WG TM,TP&O
10 Operations Punctuality at destination (TIS)
In January after the timetable year
concerned
Y WG TM,TP&O
11 Operations Overall number of trains on the RFC (TIS)
In January after the timetable year
concerned
Y WG TM,TP&O
12 Operations Delay reasons (TIS) The KPI is connected to Punctuality at origin and Punctuality at destination.
To be determined Y WG TM,TP&O
*Operations: meaning the performance of the traffic running along the RFCs monitored in terms of punctuality and volume of traffic.

8
No Business area
KPI (Source of data) Timeframe Recommend to MB (Y/N)
Entity in charge
13 Market* dev.
Overall number of trains per border (IMs’ national tools)
In January after the timetable year
concerned
Y WG TM,TP&O
14 Market dev.
Ratio of the capacity allocated by the C-OSS and the total allocated capacity (PCS for the nominator; IMs’ national tools for the denominator)
In December before the start of the timetable year
Y WG TT/C-OSS C-OSS
*Market development: the capability of the RFC in meeting the market demands will be monitored.
SŽ – Infrastruktura, d. o. o. MÁV Hungarian State Railways Private Company Limited by Shares Győr-Sopron-Ebenfurti Railways Private Company Limited by Shares VPE – Hungarian Rail Capacity Allocation Office Železnice Slovenskej republiky, Bratislava v skrátenej forme “ŽSR”
PLK Polskie Linie Kolejowe Spółka Akcyjna
Annex 2
PROCESS DESCRIPTIONS FOR CORRIDOR-OSS
(in reference to clause 3.1 and 4 of the C-OSS contract)
1. CONSTRUCTION AND PREPARATION OF PRE-ARRANGED PATHS (PAP)
2. ALLOCATION: HANDLING PAP AND PAP PLUS (INCL. FEEDER ETC.)
3. POST-ALLOCATION: MONITORING
4. PREPARATION AND ALLOCATION OF RESERVE CAPACITY (RC)
5. OTHER PROVISIONS

SŽ – Infrastruktura, d. o. o. MÁV Hungarian State Railways Private Company Limited by Shares Győr-Sopron-Ebenfurti Railways Private Company Limited by Shares VPE – Hungarian Rail Capacity Allocation Office Železnice Slovenskej republiky, Bratislava v skrátenej forme “ŽSR”
PLK Polskie Linie Kolejowe Spółka Akcyjna
1. CONSTRUCTION AND PREPARATION OF PRE-ARRANGED PATHS (PAP)
1. Call for PAP construction
1.1. The C-OSS starts the process of PAP construction by addressing the concerned IM/AB
in August/September and requiring the elaboration of the national PAP segments incl.
border harmonization until end of December on basis of the conclusions of the capacity
estimation for the corridor. In the event a common offer on an overlapping section with
another RFC was decided by the Management Board, the C-OSS contacts the C-OSS of
that RFC in order to coordinate the construction and publication of the common offer.
1.2. To ensure a consolidated way of PAP construction the C-OSS may give indications on
the required amount and train parameters of PAP and/or a particular type of PAP to be
used if he has received respective recommendation by the Management Board (MB) based
on the analysis of the transport market study, wishes of customers or other sources and
taking into account the estimated market demand and C-OSS’s own experience. The C-
OSS may also indicate the direction of the construction (backwards/forwards) with regard
to identified reference points. C-OSS transmits these figures/data together with
milestones/deadlines to all IM/AB together with the mandate to start PAP
planning/construction.
2. Monitor PAP construction
2.1. The C-OSS relies on a consecutive bilateral harmonization of the border times of the
national PAP segments between the concerned IM/AB. The IM/AB shall inform the C-OSS
about the interim results of the border harmonization and any difficulties occurring. The C-
OSS shares this information continuously with all IMs/AB along the corridor and - if
necessary- provides support and guidance to the IM/AB in case of difficulties.
3. Review and finalize PAP offer
3.1. The C-OSS assembles the path segments delivered by the IM/AB in one document
(excel) and checks the consistency of the PAPs. The C-OSS detects any need for
adaptations and approaches the IMs/AB concerned to introduce the adaptations.
3.2. If necessary the C-OSS organizes a meeting for finalizing the PAP offer with all
concerned parties (C-OSS, all IMs/AB, TT experts and/or national OSS, and - depending
on their involvement - terminals).
4. Information and involvement of the MB

SŽ – Infrastruktura, d. o. o. MÁV Hungarian State Railways Private Company Limited by Shares Győr-Sopron-Ebenfurti Railways Private Company Limited by Shares VPE – Hungarian Rail Capacity Allocation Office Železnice Slovenskej republiky, Bratislava v skrátenej forme “ŽSR”
PLK Polskie Linie Kolejowe Spółka Akcyjna
4.1. The C-OSS forwards the final PAP offer to the Management Board in December for
validation and as a draft version to RNE for inclusion in PCS. In case of a still pending need
for adaptation of the PAP offer the C-OSS especially addresses the concerned IM/AB and
asks for an evaluation / delivery of revised PAP until 20th December at the latest. The C-
OSS will inform the Management Board and RNE about the outcome immediately.
4.2. The validation by the Management Board shall be done until end of the year. No
reaction is assumed as validation.
5. Publish and promote PAP
5.1. After validation by the Management Board the C-OSS takes the necessary actions for
publishing the PAPs in PCS and other further communication channels (e.g. website of
corridor, events, messages to be published by IMs/AB ect.). For this purpose the C-OSS
provides a user-friendly format of the PAP path catalogue.
5.2. The C-OSS promotes the PAP by presenting them to the customers (e.g. customer
letter, RAG/TAG, customer meetings, conferences etc.).
2. ALLOCATION: HANDLING PAP AND PAP PLUS (INCL. FEEDER /ADJUSTMENTS/
PAP ON MULTIPLE CORRIDORS)
A. Registration and Checking of PAP applications
1. Collect path applications referring to PAP
1.1. The C-OSS receives and collects all path requests for PAP placed via PCS. All PAP on
the corridor are displayed in PCS and can therefore only be requested via PCS as unique
booking tool. The applicant submits the path request by choosing a concrete PAP and
opening a PCS dossier for it. The path request may contain feeder/outflow paths and/or
minor adjustments to the displayed PAP (differing train parameters, other stops which do
not affect the published border times of PAP). The C-OSS reads the dossier and ensures
further treatment.
1.2. Applications for PAP placed directly at involved IM/AB (e.g. by using national booking
tools, by traditional OSS network, by reference in a PCS dossier) will only be considered
by the C-OSS if the concerned IM/AB has on a voluntarily basis redirected the applicant to
place a correct PAP request in PCS and the request in PCS Is received by the C-OSS on
time.

SŽ – Infrastruktura, d. o. o. MÁV Hungarian State Railways Private Company Limited by Shares Győr-Sopron-Ebenfurti Railways Private Company Limited by Shares VPE – Hungarian Rail Capacity Allocation Office Železnice Slovenskej republiky, Bratislava v skrátenej forme “ŽSR”
PLK Polskie Linie Kolejowe Spółka Akcyjna
1.3. Applications for PAP placed via other channels to the C-OSS (e.g. e-mail, fax,
telephone, RNE paper template) will have to be redirected to PCS. The C-OSS will inform
the applicant accordingly and provide basic support for using PCS. The C-OSS is not
entitled to open PCS dossiers for the applicant.
2. Register the path application
2.1. The C-OSS establishes and maintains a path register for all incoming PAP applications
in PCS containing a dossier number, name of applicant, requested PAP segment,
requested running days and specifying the follow-up activities of the C-OSS concerning
the concrete path request. This register has to be made available to the concerned IM/AB
at any time (see contact list) and in a simplified form allowing for business confidentiality to
all concerned applicants.
2.2. In the register the C-OSS shall distribute the path applications to the following
categories:
1 Pure PAP
Request fully in line with PAP or PAP segment (See chapter B)
2 PAP plus feeder/adjustment
Request fully in line with PAP or PAP segment and feeder path required in addition
(PAP see Chapter B, Feeder see Chapter C); request referring to PAP segment(s)
but requiring minor changes of running times and/or parameters which do not affect
the PAP border times (See chapter C)
3 PAP with involvement of other corridors
Request is fully in line with PAP or PAP segments and requiring PAP on other
corridors (see Chapter B and C) as well as including feeder/outflow on other corridors.
3. Check applications with regard to C-OSS competence
3.1. The C-OSS evaluates his competence for the further treatment of the incoming PAP
applications immediately after receipt and sorts out the following request types:
− Applications for passenger trains
− Applications with major changes (e.g. changing all fixed PAP border times). Depending
on which PaP segment the major change is required, the C-OSS might treat it partly.
For example, if the major change refers to the last PaP segment of a journey, the C-
OSS will treat the first PaP segments.
The C-OSS will conduct/be responsible for any application of PAP and RC for corridor
infrastructure capacity for freight trains crossing at least one border on a corridor and for
which the capacity request was done in PCS and decide on capacity allocation in
accordance with the FCA . .
3.2. The C-OSS forwards those applications immediately to the concerned IM/AB (see
contact list in annex) for further exclusive treatment and refrains from any further activity
concerning these applications.

SŽ – Infrastruktura, d. o. o. MÁV Hungarian State Railways Private Company Limited by Shares Győr-Sopron-Ebenfurti Railways Private Company Limited by Shares VPE – Hungarian Rail Capacity Allocation Office Železnice Slovenskej republiky, Bratislava v skrátenej forme “ŽSR”
PLK Polskie Linie Kolejowe Spółka Akcyjna
3.3. The C-OSS informs the applicant that he is not competent for this request and that it
has been handed over to the concerned IM/AB for further exclusive treatment.
3.4. If the path request contains elements of another corridor and/or there is common offer
with another RFC, the C-OSS will immediately contact the other concerned C-OSS to
commit on a ""coordinating C-OSS"" who will ensure the further management of the PCS
dossier (in principle this should be the C-OSS according to the start PAP segment
requested). In any case the ""coordinating C-OSS"" will forward the element of the PAP
request concerning the other corridor to the concerned C-OSS without further delay and
ask for the result of the allocation decision of the other C-OSS to be communicated to the
"coordinating C-OSS“ until end of April at the latest.
4. Check the quality of the path request
4.1. The C-OSS checks immediately after receipt if the path request is complete and
consistent (e.g. technical parameters, running times etc.). If special national mandatory
parameters are required the concerned IM/AB (see contact list) will support the C-OSS in
checking the consistency with regard to these parameters. The C-OSS assumes that the
applicant has accepted the published PAP characteristics by requesting the selected PAP.
4.2. In case of missing or inconsistent data the C-OSS will directly contact the leading
applicant and require the relevant data updating/changes within 5 working days.
4.3. The C-OSS checks if the leading applicant has clarified the request within the required
timeframe. If the applicant does not clarify the required data the C-OSS will inform the
leading applicant that further treatment of the request is not possible.
5. Check the legitimation of the applicants
5.1. The C-OSS checks the legitimation of the applicants per involved path segments
immediately after receipt of the path request on basis of a list of applicants per IM/AB if
applicable.
5.2. If the C-OSS detects a missing legitimation he informs without further delay the
concerned IM/AB (see contact list in the annex) and asks for checking the legitimation
within 5 working days. This check should be done in the same timeframe than the
clarification of the request by the applicant (according to A 4.2). The C-OSS informs the
applicant that he will refrain from any further treatment as long the legitimation isn’t clarified.
5.3. The C-OSS checks if the concerned IM/ AB could clarify the legitimation. In case of no
answer by the concerned IM/AB until X-7.5 the C-OSS will not consider the pending request
in the PAP pre-allocation but park it until clarification is done. If requested by the applicant,
a partial treatment of the path request on international segments not affected by
missing/unclear legitimation will be ensured by the C-OSS.

SŽ – Infrastruktura, d. o. o. MÁV Hungarian State Railways Private Company Limited by Shares Győr-Sopron-Ebenfurti Railways Private Company Limited by Shares VPE – Hungarian Rail Capacity Allocation Office Železnice Slovenskej republiky, Bratislava v skrátenej forme “ŽSR”
PLK Polskie Linie Kolejowe Spółka Akcyjna
5.4. Applicants shall assign the RU responsible for train run as early as possible but at least
until the individual deadlines stipulated in the national laws or rules of the concerned IM/AB
(as long as no corridor specific deadline has been agreed upon in the Management Board).
6. Confirm further handling of path requests or execute rejection of path request
6.1. The C-OSS sends a message to the applicant to confirm the receipt of the path
application by the C-OSS and announce further treatment according to the defined
category after having positively executed the checks (depending on the PCS function
availability).
6.2. The C-OSS updates the path register accordingly to the results of the checks (incl.
closing of dossiers, which means path rejection)
7. Handle late path requests (if applicable) and change request
7.1. The C-OSS considers all PAP applications which are placed in PCS after publication
of the path catalogue at X-11 until the RNE deadline for path applications for the annual
timetable at X-8.
The C-OSS updates the published path catalogue by withdrawing the booked/allocated
PaP. The non-booked PaPs will be treated in accordance with chapter B point 4.3.
7.2. Change requests for PAP placed by the applicant after the X-8 deadline until X-5 will
be treated by the C-OSS according to the following rule: "Downsizing" changes to the PAP
request (e.g. cancellation of running days, shortening of route by deleting entire PAP
segments, lower parameters) which do neither affect the international character of the PAP
nor the ranking of the request in the allocation decision according to B 1.2. will be handled
by the C-OSS and documented in the PCS dossier and the path register accordingly.
"Substantial" changes to the PAP request affecting the border times and the ranking of the
request in the allocation decision according to B 1.2 will be assumed as
withdrawal/complete cancellation of the PAP request. Those change requests will then be
forwarded to the concerned IM/AB for further treatment as late requests in remaining
capacity.
7.3. The C-OSS will inform the applicant that late and/or change path request will be handed
over to the concerned IM/AB for further exclusive treatment and that the C-OSS will refrain
from any follow-up. The allocation decision will be taken after the finalization of the annual
timetable at X-3,5 only. The Corridor OSS will communicate the path offer to the applicant
on behalf of the concerned IM/AB if the C-OSS has been the entry point of the request.
B. Allocation decision on PAP
1. Execute the allocation decision

SŽ – Infrastruktura, d. o. o. MÁV Hungarian State Railways Private Company Limited by Shares Győr-Sopron-Ebenfurti Railways Private Company Limited by Shares VPE – Hungarian Rail Capacity Allocation Office Železnice Slovenskej republiky, Bratislava v skrátenej forme “ŽSR”
PLK Polskie Linie Kolejowe Spółka Akcyjna
1.1. The C-OSS will evaluate/consider for the allocation decision on an equal basis all valid
path requests out of the categories specified hereafter and placed on-time before the
deadline at X-8:
Category 1 all requests aiming at pure PAP;
Category 2 the core PAP part of the PAP plus feeder requests; in case of requests with
adjustments the C-OSS only considers PAP path segments not substantially
affected by the required adjustment (e.g. adjustment not influencing the fixed
border times);
Category 3 the PAP part of the ""own"" corridor.
1.2. The C-OSS decides which PAP segment is to be allocated to which applicant. In case
of conflicting applications the C-OSS decides on basis of the priority rules described in the
FCA. The allocation decision has to be taken until end of April.
1.3. The C-OSS may offer alternative PAP to an applicant with lower priority. The applicant
has to commit to this offer within 5 working days – otherwise the application with lower
priority will be forwarded to the concerned IM/AB to be handled in the regular elaboration
process of the annual timetable (for a tailor-made offer or national catalogue path). The C-
OSS may in case of competing requests also contact the applicant with higher priority and
propose a shifting of the PAP / an alternative solution if this enables both competing
applicants to receive a satisfying offer. The alternative solutions depend on the agreement
of both applicants to be given to the C-OSS until end of April.
1.4. In case of PAP requests involving 2 or more corridors, the C-OSS has to consider the
allocation decision of the other concerned C-OSS. If the published TT does not fit at
connecting point of both corridors the "coordinating C-OSS” may offer an alternative PAP
itself or require an alternative PAP from the other involved C-OSS to build a harmonized
TT offer for the applicant. The applicant has to commit to this alternative offer within 5
working days - otherwise the application will be forwarded to all concerned IM/AB to be
handled in the regular elaboration process of the annual timetable (for a tailor-made offer).
2. Inform coordinating C-OSS
2.1. In case of PAP requests involving 2 or more corridors the C-OSS sends the result of its
pre-allocation decision to the coordinating C-OSS, 2 working days before end of April.
3. Update path register and path catalogue
3.1. The C-OSS marks the result of the allocation decision in the path register at the latest
in the first days of May of each year. In case of PAP plus feeders/adjustments and PAP on
multiple corridors the indication in the path register will be done as a pre-allocation only (as
connectivity of feeders and adjustments and/or with other corridors still to be checked).
4. Inform concerned IMs/AB

SŽ – Infrastruktura, d. o. o. MÁV Hungarian State Railways Private Company Limited by Shares Győr-Sopron-Ebenfurti Railways Private Company Limited by Shares VPE – Hungarian Rail Capacity Allocation Office Železnice Slovenskej republiky, Bratislava v skrátenej forme “ŽSR”
PLK Polskie Linie Kolejowe Spółka Akcyjna
4.1. The C-OSS will inform the concerned IM/AB on the pre-allocation decision
automatically via PCS for inclusion in the draft timetable.
4.2. Path applications which could not be met due to conflicts and the execution of the
priority rules mentioned above (applications with lower priority) are forwarded by the C-
OSS to the concerned IM/AB at the latest in the first days of May with the demand to provide
a draft offer until one week before the RNE deadline for the draft offer. Those applications
with lower priority will be handled by the concerned IM/AB as on-time applications for the
annual timetable and will therefore be included in the regular construction process of the
annual timetable.
4.3. All non-booked PAP will be referred to the MB by the C-OSS. Until the end of April
the MB will decide if the non-booked PAP will:
a) be returned to the concerned IMs/AB to allow for an efficient use of the not requested
PAP capacity in the regular annual timetable process – in which case the C-OSS will
hand over the non-booked PAP to the concerned IMs/AB also until the second
working day of May ; or
b) be used as late PAP – in which case they will be retained by the C-OSS to run the
late PAP requests process in accordance with RNE guidelines.
5. Inform applicants
5.1. The C-OSS provides interim information to the applicants on the status of their
application at the beginning of May. The interim information informs the applicants with
higher priority about the allocation decision in their favor and announces the formal draft
path offer which will be given on behalf of the concerned IM/AB by the C-OSS with the draft
timetable offer in X-5 via PCS.
5.2. The C-OSS informs the applicants with lower priority that did not accept an alternative
PAP offer at the beginning of May that their path requests have been forwarded to the
concerned IM/AB for further treatment in the regular process for establishing the annual
timetable and that the C-OSS will provide the draft path offer on behalf of the concerned
IM/AB with the draft timetable offer in X-5 via PCS.
5.3. The C-OSS informs the applicants for PAP plus feeder and/or adjustments and/or
involving multiple corridors on the pre-allocation of the PAP segment at the beginning of
May and announces the forwarding of the feeder and/or adjustments to the concerned
IM/AB. Without further notice the applicant agrees to be contacted by the concerned IM/AB
bilaterally for the fine-tuning of the feeder/adjustment/connecting paths. The C-OSS will
also announce the provision of a consolidated answer by X-5 for those requests.
C. Monitoring PAP Plus
1. Forward of feeders and/or adjustments and/or connections with other corridors

SŽ – Infrastruktura, d. o. o. MÁV Hungarian State Railways Private Company Limited by Shares Győr-Sopron-Ebenfurti Railways Private Company Limited by Shares VPE – Hungarian Rail Capacity Allocation Office Železnice Slovenskej republiky, Bratislava v skrátenej forme “ŽSR”
PLK Polskie Linie Kolejowe Spółka Akcyjna
1.1. The C-OSS forwards the requested feeder path and/or adjustment to the concerned
IM/AB at the latest in the first days in May for elaboration of a timetable offer fitting to the
PAP already reserved (pre-allocated).
1.2. The C-OSS will document the forwarding in the path register without further delay.
1.3. In case of feeders affecting two or more IM/AB the C-OSS may monitor the construction
process e.g. by indication of construction direction (if required by the applicant).
1.4. Questions occurring during the path elaboration process (e.g. concerning
feeders/connection construction) may be discussed and arranged between concerned
IM/AB and applicant bilaterally - if this procedure is agreed upon by the customer. In this
case the C-OSS has to be informed without further delay about any adjustment resulting
from this coordination. Therefore this information shall be documented in the path register
in written form by the concerned IM/AB.
2. Receive the TT offer elaborated by the concerned IM/AB
2.1. At the latest one week before the RNE deadline for the draft timetable, the draft
timetable offers for feeders and adjusted PAP segment(s) shall be handed over from the
concerned IM/AB to the C-OSS. Also tailor-made TT offers for applicants with lower priority
and for connection of 2 or more corridors shall by handed over from the concerned IM/AB
to the C-OSS.
2.2. If no draft TT offer has been delivered at all until 4 days before the internal deadline
(see point 2.1) the C-OSS shall make a reminder to the concerned IM/AB. If no answer is
given, the C-OSS shall then inform the Management Board legal representative of the
IM/AB which did not deliver the required path offer and ask for clarification within 3 working
days.
2.3. If no draft TT offer has been delivered even after intervention of the concerned legal
representative of the Management Board here above mentioned, the C-OSS will ask the
applicant if to keep the pre-allocated PAP or to forward the entire path request to the
concerned IM/AB for delivering a tailor-made path (including corridor segment and feeder)
in the regular elaboration process of the annual timetable.
2.4. The C-OSS will consolidate the timetable (PAP plus feeder and/or adjustments and/or
connections with other corridors) and update the path register to display a consolidated
overview of the PAP plus offer and inform all concerned IM/AB automatically via PCS.
D. Communicating offer to applicant
1. Communicate the draft timetable offer

SŽ – Infrastruktura, d. o. o. MÁV Hungarian State Railways Private Company Limited by Shares Győr-Sopron-Ebenfurti Railways Private Company Limited by Shares VPE – Hungarian Rail Capacity Allocation Office Železnice Slovenskej republiky, Bratislava v skrátenej forme “ŽSR”
PLK Polskie Linie Kolejowe Spółka Akcyjna
1.1. At the RNE deadline for draft TT (X-5) the C-OSS communicates the draft timetable
offer for every valid PAP request to the applicants via PCS. The C-OSS hereby stresses
the fact that he is acting on behalf of the concerned IM/AB and that the appropriate contract
will have to be concluded between the concerned IM/AB and the applicant on basis of
applicable national law and of the IM/AB’s conditions. If the publication via national tools is
still necessary, the IM/AB have to ensure that there are no differences to the PCS
publication. In any case it has to be made clear that the legally binding TT including
feeder/outflow path is shown in PCS.
2. Handle applicant observations for PAP
2.1. The C-OSS monitors the applicant observations placed by the applicant on the draft
timetable offer PAP in PCS. For that purpose the C-OSS requires an answer by the
concerned IM/AB until one week before the deadline for the final TT offer (at X-3,5). This
procedure only concerns justified observations related to the original path request -
whereas modifications to the original path requests will be handed over to the concerned
IM/AB for further exclusive treatment without further involvement of the C-OSS.
3. Communicate the final timetable offer
3.1. At the RNE deadline for final TT (X-3,5) the C-OSS communicates the final timetable
offer for every valid PAP request to the applicants via PCS. The C-OSS hereby stresses
the fact that he is acting on behalf of the concerned IM/AB and that the appropriate contract
will have to be concluded between the concerned IM/AB and the applicant on basis of
applicable national law and of the IM/AB’s conditions. If the publication via national tools is
still necessary, the IM/AB have to ensure that there are no differences to the PCS
publication. In any case it has to be made clear that the legally binding TT is shown in PCS.
3. POST-ALLOCATION: MONITORING
A. Documentation of indicators for PAP
1. Number of PAP offered
1.1. The C-OSS analyses the published PAP path catalogue and documents the number of
offered PAP at least per national segments. The number of running days should be
considered in this analysis. This analysis is done until end of January.

SŽ – Infrastruktura, d. o. o. MÁV Hungarian State Railways Private Company Limited by Shares Győr-Sopron-Ebenfurti Railways Private Company Limited by Shares VPE – Hungarian Rail Capacity Allocation Office Železnice Slovenskej republiky, Bratislava v skrátenej forme “ŽSR”
PLK Polskie Linie Kolejowe Spółka Akcyjna
2. Number of PAP requested until X-8
2.1. The C-OSS registers all requests referring to PAP and placed at the C-OSS in due time
(before the RNE deadline for the annual timetable at X-8) according to article 13.5 of EU
Regulation 913/2010. The registration is done in PCS and includes information on the date
of the request and the name of applicant.
2.2. Whereas in the path register the names of the applicants are shown - the C-OSS will
only indicate the number and the core characteristics of the path requests for monitoring
reasons (such as requests affecting 1,2,3,4 IMs/ABs, requests with/without feeders,
requests aiming at x running days; PAP adjustments requested). If possible for internal
reasons a rate/percentage of requested PAP in relation to the path catalogue shall be
shown (e.g. x % of the PAP offered have been requested). The indication is done until end
of April. Rejected applications (incl. the reason) should also be listed.
3. Number of conflicting requests
3.1. On basis of the conflicting requests (double booking) detection done in PCS, the C-
OSS indicates the number of conflicts (in relation/percentage of path requests) and the
sections where conflicts occur (and the number of applications concerned). The indication
is done until end of May. If possible it shall also be indicated by which means the conflicts
could be solved (coordination, alternative PAP accepted by customer, tailor-made paths
requested from concerned IM/AB).
3.2. If return of PaPs is decided by the MB, the C-OSS documents the number of returned
PAPs to the IM/AB after the pre-allocation at X-7, 5.
4. Number of PAP allocated
4.1. The C-OSS indicates the number of the PAP offered at X-5 by the C-OSS on behalf of
the concerned IM/AB. The indication is done after the publication of the draft TT offer on
basis of PCS dossiers shifted in the draft TT offer phase (at the latest until end of July). It
shows explicitly the share/ percentage of PAP and PAP plus feeder.
4.2. The C-OSS indicates the number of the PAP allocated at X-3,5 by the C-OSS on behalf
of the concerned IM/AB. The indication is done after the publication of the final TT offer on
basis of PCS dossiers shifted in the final TT offer phase (at the latest until end of August).
It shows explicitly the share/ percentage of PAP and PAP plus feeder.
4.3. With regard to PAP offered but not contracted by the applicants as well as PAP
cancellations the C-OSS will indicate the number of contracted PAP (= PAP in active TT
in PCS) in relation to the PAP offered (indicator 5) until end of November in the evaluation
report.
5. Number of late paths requests for PAP if applicable

SŽ – Infrastruktura, d. o. o. MÁV Hungarian State Railways Private Company Limited by Shares Győr-Sopron-Ebenfurti Railways Private Company Limited by Shares VPE – Hungarian Rail Capacity Allocation Office Železnice Slovenskej republiky, Bratislava v skrátenej forme “ŽSR”
PLK Polskie Linie Kolejowe Spółka Akcyjna
5.1. If late PAP are decided by the MB, the C-OSS indicates the number of late paths
requests received by the C-OSS after X-8 until X-2 (forwarded to IM/AB) The indication is
done until end of October. The registration is done in PCS and includes information on the
date of the request and the name of applicant.
B. Documentation of indicators for reserve capacity
1. Number of capacity slots offered
1.1. The C-OSS indicates the contingent of “capacity slots” for RC requests per
day/segment (flexible RC approach) offered as reserve capacity after X-2. The number of
running days offered should be considered in the indication. The indication is done until
end of October (X+10).
2. Number of capacity slots allocated
2.1. The C-OSS indicates the number of capacity slots allocated by the C-OSS on behalf of
the concerned IM/AB. For this purpose the C-OSS maintains and updates a register
monthly to show the number of paths allocated out of reserve capacity for one timetable
year.
C. Documentation of other capacity-related indicators
1. The C-OSS will deliver other indicators related to corridor capacity that may be adopted
by the MB and fall within the competence of the C-OSS.
1.1. The timing and format of the delivery will be agreed between the MB and the C-OSS.
2. The C-OSS will be consulted by the MB prior to adoption of any such indicator.
D. Evaluation report for the MB and ExBo
1. Elaborate the report
1.1. The C-OSS summarizes the indicators collected for PAP and for reserve capacity and,
as the case may be, for other capacity-related indicators, in one report (power point
summary). The report shall be available end of November.
1.2. For internal reasons only the C-OSS shall also analyses the compliance of the IM/AB
with the C-OSS process (e.g. on-time delivery of feeders, support in checking the requests
etc.) by showing defaulting behavior.

SŽ – Infrastruktura, d. o. o. MÁV Hungarian State Railways Private Company Limited by Shares Győr-Sopron-Ebenfurti Railways Private Company Limited by Shares VPE – Hungarian Rail Capacity Allocation Office Železnice Slovenskej republiky, Bratislava v skrátenej forme “ŽSR”
PLK Polskie Linie Kolejowe Spółka Akcyjna
1.3. The C-OSS collects any available information on the customers' satisfaction on basis
of outcome of a questionnaire decide by the MB.
2. Present the report
2.1. The C-OSS participates on request to the relevant meetings of the MB and the ExBo
to present the report.
2.2. The C-OSS collects the feedback of the MB and the ExBo on the report and if necessary
develops measures for improvement within the MB.
4. PREPARATION AND ALLOCATON OF RESERVE CAPACITY (RC)
1. Call for Reserve Capacity
1.1. The C-OSS starts the process of RC by addressing the concerned IM/AB in July and
requiring the indication of a contingent of “capacity slots” for RC requests per day/segment
(flexible RC approach) until end of July on basis of the conclusions of the capacity
estimation for the corridor.
1.2. The C-OSS may also ask IMs/AB for guaranteed reference journey times per
segment(s). Milestones/deadlines will be transmitted as well.
2. Review and finalize RC Offer and inform the MB
2.1. The C-OSS assembles the RC path segments delivered by the IM/AB in one document
(excel) and detects need for adaptations. In case of inconsistencies the C-OSS clarifies
them in cooperation with the concerned IM/AB.
2.2. The C-OSS forwards the assembled RC offer to the MB on end of September for
validation by the MB and as a draft version to RNE for inclusion in PCS. No reaction is
assumed as approval. In case of a need for adaptation the C-OSS especially addresses
the MB legal representative of the concerned IM/ AB and asks for an evaluation/delivery of
revised RC without further delay.
3. Publish RC offer
3.1. The C-OSS publishes the RC offer in PCS and on the website of Amber corridor at
X-2.

SŽ – Infrastruktura, d. o. o. MÁV Hungarian State Railways Private Company Limited by Shares Győr-Sopron-Ebenfurti Railways Private Company Limited by Shares VPE – Hungarian Rail Capacity Allocation Office Železnice Slovenskej republiky, Bratislava v skrátenej forme “ŽSR”
PLK Polskie Linie Kolejowe Spółka Akcyjna
4. Allocate and administrate RC
4.1. The C-OSS collects all path requests for RC placed via PCS until 30 days before the
day of operation. Applications placed via other channels (e.g. e-mail, fax etc.) will have to
be redirected to PCS. The C-OSS informs the applicant accordingly. The application will
only be considered with the date of the PCS application.
4.2. The C-OSS checks the application with regard to C-OSS competence, quality of
request and legitimation of applicants. ""Wrong requests"" (= national paths, passenger
paths) will be forwarded to the concerned IM/AB for further treatment and the applicant will
be informed accordingly. Requests with unclear/missing data will be presented to the
applicant and to the concerned IM/AB for clarification. The clarification has to be provided
within 5 working days. If no clarification could be reached the C-OSS rejects the path
application. The delivery of feeder/outflow paths is based on the construction process as
described in Art. 48 of EU Directive 2012/34.
4.3. The C-OSS forwards the request to the concerned IM/AB in the order that the C-OSS
can forward to the applicant a harmonized offer. In this matter the C-OSS gives each IM/AB
a timeframe for his offer which has to respect the offer of the precedent IM/AB. The C-OSS
executes the allocation decision on basis of the date when the request has been placed
following the "first come, first served principle".
4.4. The C-OSS updates the electronic versions of the RC path catalogue by withdrawing
the allocated paths and informs the concerned IM /AB.
4.5. The C-OSS communicates the path offer to the applicants on behalf of the concerned
IM/AB. He specifies that he is acting on behalf of the concerned IMs/AB and that the
appropriate contract will have to be concluded between the concerned IMs/AB and the
applicant on basis of applicable national law and of the IMs/AB’s conditions.
5 OTHER PROVISIONS
1. In addition to the tasks described in chapters 1-4, the C-OSS performs the following
activities.
1.1. The C-OSS acts as a single point of contact for the applicants and coordinator of
information

SŽ – Infrastruktura, d. o. o. MÁV Hungarian State Railways Private Company Limited by Shares Győr-Sopron-Ebenfurti Railways Private Company Limited by Shares VPE – Hungarian Rail Capacity Allocation Office Železnice Slovenskej republiky, Bratislava v skrátenej forme “ŽSR”
PLK Polskie Linie Kolejowe Spółka Akcyjna
1.2. The C-OSS supplies the following information contained in the CID and published on
Amber RFC website:
a) network statements for national networks regarding Amber RFC, as included in
Book 2
b) list, characteristics, conditions and method of access to the terminals along
Amber RFC, as included in Book 3
c) functioning of the C-OSS, capacity allocation, authorised applicants and traffic
management, including in the events of disturbance, as described in Book 4
d) implementation plan of Amber RFC, as included in Book 5.
1.3. If requested by applicants, the C-OSS provides assistance, if possible, with regard to
capacity in the running timetable, other than RC, for freight trains crossing at least one
border on a corridor, contact the involved IMs/AB and facilitate the coordination of the
allocation process done by the involved IMs/AB.
2. Main activities and deadlines for the process are visualised on the charts below
Activities and deadlines for the process
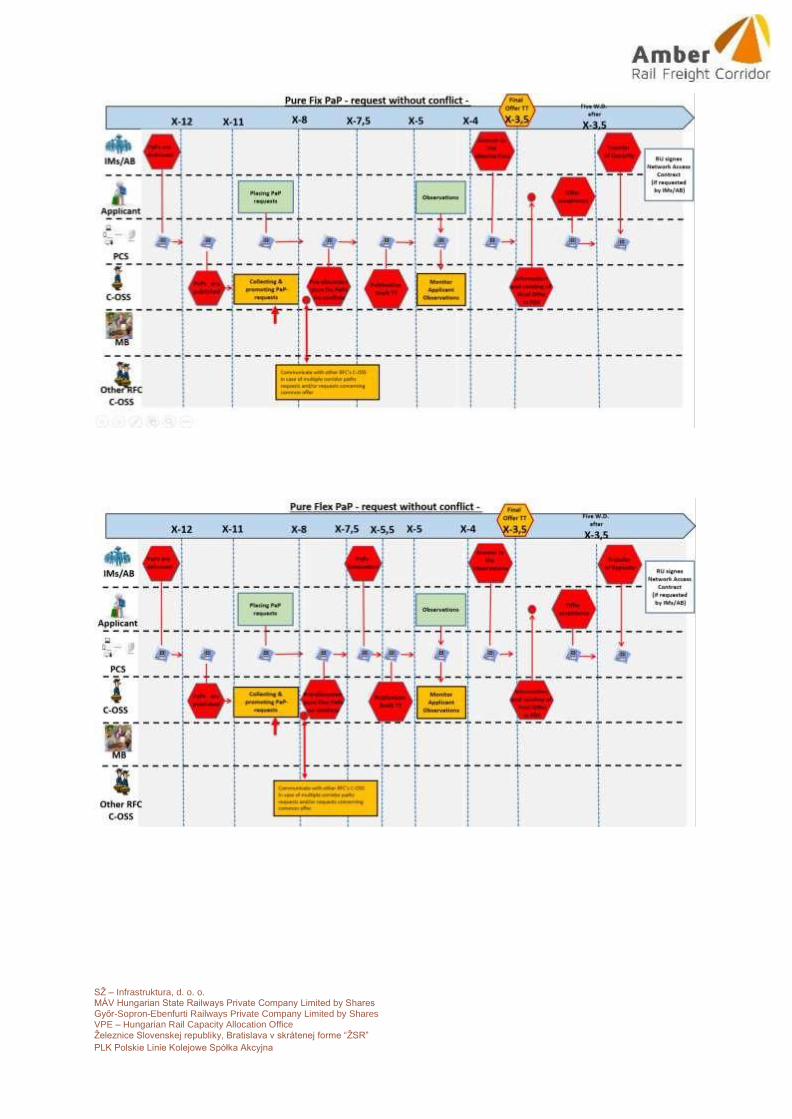
SŽ – Infrastruktura, d. o. o. MÁV Hungarian State Railways Private Company Limited by Shares Győr-Sopron-Ebenfurti Railways Private Company Limited by Shares VPE – Hungarian Rail Capacity Allocation Office Železnice Slovenskej republiky, Bratislava v skrátenej forme “ŽSR”
PLK Polskie Linie Kolejowe Spółka Akcyjna
Annex 1.1 to Annex 2 of C-OSS Contract
Detailed workflow description for the Collaborative Model on the
overlapping sections of
Amber RFC and RFC Orient/East – Med
Agreement between the Management Board of Amber RFC and Management Board of RFC
Orient/East - Med (OEM RFC)
In 2019 the Amber RFC will be operational and will offer PaPs for TT 2020. Amber RFC will have
common offer on overlapping sections with RFC Orient/East – Med.
In order to optimize the usage of the scarce capacity in the bottleneck sections and to avoid negative
competition between the corridors a Collaborative Model was chosen to regulate the workflow of C-
OSS managers. The C-OSS of the involved RFCs will be responsible for uploading and allocating the PaP
offer on the overlapping sections as described below. The responsible C-OSS will publish PaPs for
sections in accordance with responsibility marking another RFC as "Participating RFC" in the PaP
dossiers. Applicants will still experience a single point of contact as C-OSS mangers work strongly
together.
C-OSS of RFC Orient/East-Med will be responsible for publication and uploading the PaP offer on
overlapping sections with Amber RFC on sections: Bratislava-Rajka, Galanta via Nové Zámky –
Štúrovo, Nové Zámky to Komárom, Sopron-Győr, Győr-Ferencváros, Štúrovo-Ferencváros,

SŽ – Infrastruktura, d. o. o. MÁV Hungarian State Railways Private Company Limited by Shares Győr-Sopron-Ebenfurti Railways Private Company Limited by Shares VPE – Hungarian Rail Capacity Allocation Office Železnice Slovenskej republiky, Bratislava v skrátenej forme “ŽSR”
PLK Polskie Linie Kolejowe Spółka Akcyjna
The following picture gives a brief overview on the main cornerstones of the Collaborative Model.

SŽ – Infrastruktura, d. o. o. MÁV Hungarian State Railways Private Company Limited by Shares Győr-Sopron-Ebenfurti Railways Private Company Limited by Shares VPE – Hungarian Rail Capacity Allocation Office Železnice Slovenskej republiky, Bratislava v skrátenej forme “ŽSR”
PLK Polskie Linie Kolejowe Spółka Akcyjna
The following process description regulates all tasks and processes necessary to provide our
applicants with the best possible support by optimizing the allocation between involved RFCs. The
described tasks and processes are relevant for the C-OSS of involved corridors.
Topic Responsible Actor
Description
Understanding the applicants’ capacity needs
Capacity wishes of applicants
C-OSS of the involved RFCs for their sections
C-OSSs send “capacity wish list template” to applicants operating on their sections. Applicants aggregate their capacity wishes for all RFCs in one document and send it back to any C- OSS.
PaP construction
Preparation of PaP Kick-Off workshop with IMs if necessary
C-OSS of the involved RFCs
Harmonization of the expectations of the PaPs to be constructed by the IMs. Basis is the capacity wish list template and last year’s experiences.
Kick-Off PaP construction if necessary
C-OSS of the involved RFCs for their sections
Individual workshops on involved RFCs. No need for C-OSS cross-participation due to coordination beforehand.
PaP construction IMs IMs construct the PaP segments.
PaP harmonization C-OSS of the involved RFCs
C-OSSs together will monitor the process and check harmonization of RFC’s PaP offer.
PaP publication
PCS upload C-OSS of the involved RFCs For their sections
Upload of PaP offer to PCS. Each C-OSS for its sections in accordace with described responsibility.
Website
C-OSS of the involved RFCs for their corridor
RFC OEM PaP catalogue shows also harmonized Amber RFC PaPs on overlapping sections Amber RFC PaP catalogue shows also harmonized RFC OEM PaPs on overlapping sections
Applicant request PaP
Applicant request Applicant Applicant orders PaPs via PCS.
Pre-Allocation PaP
C OSS of the concerned RFCs collaborates as a network within the operational cooperation framework between the involved RFCs. Each C-OSS is responsible for selling the capacity on overlapping sections as described above. Advantages: • C-OSS of the concerned RFCs have a coordinated offer • Collaboration leads to the best capacity offer for applicants • Applicants have a single point of contact as all C-OSS collaborate and act as one virtual C-OSS • Clear sales competences between the C-OSS

SŽ – Infrastruktura, d. o. o. MÁV Hungarian State Railways Private Company Limited by Shares Győr-Sopron-Ebenfurti Railways Private Company Limited by Shares VPE – Hungarian Rail Capacity Allocation Office Železnice Slovenskej republiky, Bratislava v skrátenej forme “ŽSR”
PLK Polskie Linie Kolejowe Spółka Akcyjna
No conflict Pre-Allocation at x-7,5
C-OSS of the involved RFCs for their sections
Pre-Allocation is done in PCS.
Conflict solving
C-OSS of the involved RFCs together
PCS displays to all C-OSS the conflicts. Coordination between C-OSS necessary: Each C- OSS calculates for the conflict path in its sections the K-value. Then, all K-values are summed up for the priority calculation.
Alternative PaP / path C-OSS of the involved RFCs for their sections
Communication of alternative options (different PaP or tailor-made path to be constructed later by the IMs) is done by the C-OSS with the conflict in its sections.
Draft and Final offer PaP
Check and Publication of Draft- / Final offer
C-OSS of the involved RFCs for their setions
Each C-OSS double-checks the offer of the IMs and publishes them via PCS.
Reserve Capacity Publication
PCS upload
C-OSS of the involved RFCs For their sections
Upload of RC offer to PCS. Each C-OSS for its sections.
Website
C-OSS of involved RFCs for their corridor
RC Catalogue will be published on the website
Applicants request Reserve Capacity
Applicant request Applicant Applicant orders Reserve Capacity via PCS.
Pre-Allocation Reserve Capacity
Pre-Allocation rules
C-OSS of the involved RFCs for their sections
“First come – First serve”.
TT Construction
C-OSS of the involved RFCs together
Order of TT construction in case more than one RFCs are involved shall depend on the construction starting point.
Deadlines for ordering
C-OSS of the involved RFC for their sections
All involved RFCs have the same 30-day rule.
Draft and Final offer Reserve Capacity
Check and Publication of Draft- / Final offer
C-OSS of the involved RFCs for their sections
Each C-OSS double-checks the offer of the IMs and publishes them via PCS.
After Sales / Applicants contact
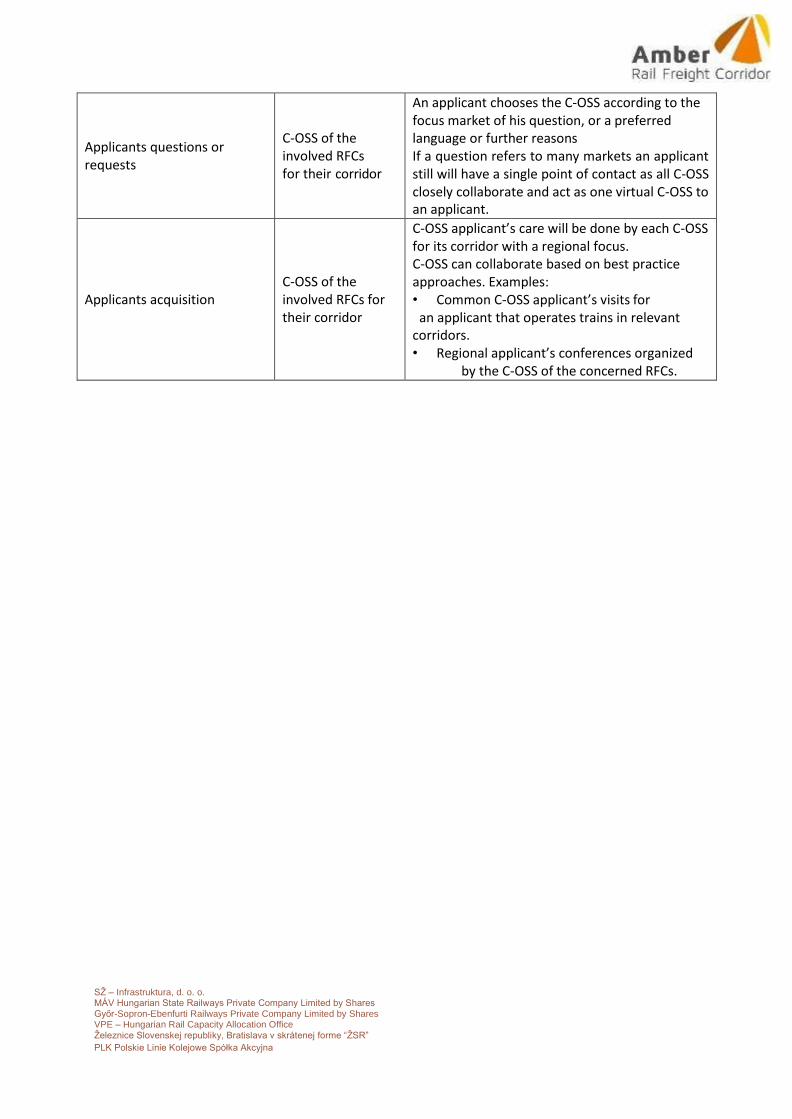
SŽ – Infrastruktura, d. o. o. MÁV Hungarian State Railways Private Company Limited by Shares Győr-Sopron-Ebenfurti Railways Private Company Limited by Shares VPE – Hungarian Rail Capacity Allocation Office Železnice Slovenskej republiky, Bratislava v skrátenej forme “ŽSR”
PLK Polskie Linie Kolejowe Spółka Akcyjna
Applicants questions or requests
C-OSS of the involved RFCs for their corridor
An applicant chooses the C-OSS according to the focus market of his question, or a preferred language or further reasons If a question refers to many markets an applicant still will have a single point of contact as all C-OSS closely collaborate and act as one virtual C-OSS to an applicant.
Applicants acquisition
C-OSS of the involved RFCs for their corridor
C-OSS applicant’s care will be done by each C-OSS for its corridor with a regional focus. C-OSS can collaborate based on best practice approaches. Examples: • Common C-OSS applicant’s visits for
an applicant that operates trains in relevant corridors. • Regional applicant’s conferences organized
by the C-OSS of the concerned RFCs.

SŽ – Infrastruktura, d. o. o. MÁV Hungarian State Railways Private Company Limited by Shares Győr-Sopron-Ebenfurti Railways Private Company Limited by Shares VPE – Hungarian Rail Capacity Allocation Office Železnice Slovenskej republiky, Bratislava v skrátenej forme “ŽSR”
PLK Polskie Linie Kolejowe Spółka Akcyjna
Annex 1.2 to Annex 2 of C-OSS Contract
Detailed workflow description for the Collaborative Model on the
overlapping sections of
Amber RFC and RFC Mediterranean
Agreement between the Management Board of Amber RFC and the General Assembly of RFC
Mediterranean
In 2019 the Amber RFC will be operational and will offer PaPs for TT 2020. Amber RFC will have
common offer on overlapping sections with RFC Mediterranean
In order to optimize the usage of the scarce capacity in the bottleneck sections and to avoid negative
competition between the corridors a Collaborative Model was chosen to regulate the workflow of C-
OSS managers. The C-OSS of the involved RFCs will be responsible for uploading and allocating the PaP
offer on the overlapping sections as described below. The responsible C-OSS will publish PaPs for
sections in accordance with responsibility marking another RFC as "Participating RFC" in the PaP
dossiers. Applicants will still experience a single point of contact as C-OSS managers work strongly
together.
C-O SS of RFC Mediterranean will be responsible for publication and uploading the PaP offer on
overlapping sections with Amber RFC on the following sections with Pap ID defined by C-OSS of
Amber RFC :
- Koper- Divača-Ljubljana
- Lubljana-Zidani Most – Pragersko
- Pragersko-Ormož –Hodoš
On the following sections, each C-OSS will publish the Paps offered to their RFC’s on the Hungarian
Network:
- Hodoš-Zalaszentiván
- Ferencváros- Szerencs -Mezőzombor.

SŽ – Infrastruktura, d. o. o. MÁV Hungarian State Railways Private Company Limited by Shares Győr-Sopron-Ebenfurti Railways Private Company Limited by Shares VPE – Hungarian Rail Capacity Allocation Office Železnice Slovenskej republiky, Bratislava v skrátenej forme “ŽSR”
PLK Polskie Linie Kolejowe Spółka Akcyjna
The following picture gives a brief overview on the main cornerstones of the Collaborative Model.

SŽ – Infrastruktura, d. o. o. MÁV Hungarian State Railways Private Company Limited by Shares Győr-Sopron-Ebenfurti Railways Private Company Limited by Shares VPE – Hungarian Rail Capacity Allocation Office Železnice Slovenskej republiky, Bratislava v skrátenej forme “ŽSR”
PLK Polskie Linie Kolejowe Spółka Akcyjna
The following process description regulates all tasks and processes necessary to provide our
applicants with the best possible support by optimizing the allocation between involved RFCs. The
described tasks and processes are relevant for the C-OSS of involved corridors.
Topic Responsible Actor
Description
Understanding the applicants’ capacity needs
Capacity wishes of applicants
C-OSS of the involved RFCs for their sections
C-OSSs send “capacity wish list template” to applicants operating on their sections. Applicants aggregate their capacity wishes for all RFCs in one document and send it back to any C- OSS.
PaP construction
Preparation of PaP Kick-Off workshop with IMs if necessary
C-OSS of the involved RFCs
Harmonization of the expectations of the PaPs to be constructed by the IMs. Basis is the capacity wish list template and last year’s experiences.
Kick-Off PaP construction if necessary
C-OSS of the involved RFCs for their sections
Individual workshops on involved RFCs. No need for C-OSS cross-participation due to coordination beforehand.
PaP construction IMs IMs construct the PaP segments.
PaP harmonization C-OSS of the involved RFCs
C-OSSs together will monitor the process and check harmonization of RFC’s PaP offer.
PaP publication
PCS upload C-OSS of the involved RFCs For their sections
Upload of PaP offer to PCS. Each C-OSS for its sections in accordace with described responsibility.
Website
C-OSS of the involved RFCs for their corridor
RFC Med PaP catalogue shows also harmonized Amber RFC PaPs on overlapping sections. Amber RFC PaP catalogue shows also harmonized RFC Med PaPs on overlapping sections
Applicant request PaP
Applicant request Applicant Applicant orders PaPs via PCS.
Pre-Allocation PaP
C OSS of the concerned RFCs collaborates as a network within the operational cooperation framework between the involved RFCs. Each C-OSS is responsible for selling the capacity on overlapping sections as described above. Advantages: • C-OSS of the concerned RFCs have a coordinated offer • Collaboration leads to the best capacity offer for applicants • Applicants have a single point of contact as all C-OSS collaborate and act as one virtual C-OSS • Clear sales competences between the C-OSS

SŽ – Infrastruktura, d. o. o. MÁV Hungarian State Railways Private Company Limited by Shares Győr-Sopron-Ebenfurti Railways Private Company Limited by Shares VPE – Hungarian Rail Capacity Allocation Office Železnice Slovenskej republiky, Bratislava v skrátenej forme “ŽSR”
PLK Polskie Linie Kolejowe Spółka Akcyjna
No conflict Pre-Allocation at x-7,5
C-OSS of the involved RFCs for their sections
Pre-Allocation is done in PCS.
Conflict solving
C-OSS of the involved RFCs together
PCS displays to all C-OSS the conflicts. Coordination between C-OSS necessary: Each C- OSS calculates for the conflict path in its sections the K-value. Then, all K-values are summed up for the priority calculation.
Alternative PaP / path C-OSS of the involved RFCs for their sections
Communication of alternative options (different PaP or tailor-made path to be constructed later by the IMs) is done by the C-OSS with the conflict in its sections.
Draft and Final offer PaP
Check and Publication of Draft- / Final offer
C-OSS of the involved RFCs for their setions
Each C-OSS double-checks the offer of the IMs and publishes them via PCS.
Reserve Capacity Publication
PCS upload
C-OSS of the involved RFCs For their sections
Upload of RC offer to PCS. Each C-OSS for its sections.
Website
C-OSS of involved RFCs for their corridor
RC Catalogue will be published on the website
Applicants request Reserve Capacity
Applicant request Applicant Applicant orders Reserve Capacity via PCS.
Pre-Allocation Reserve Capacity
Pre-Allocation rules
C-OSS of the involved RFCs for their sections
“First come – First serve”.
TT Construction
C-OSS of the involved RFCs together
Order of TT construction in case more than one RFCs are involved shall depend on the construction starting point.
Deadlines for ordering
C-OSS of the involved RFC for their sections
All involved RFCs have the same 30-day rule.
Draft and Final offer Reserve Capacity
Check and Publication of Draft- / Final offer
C-OSS of the involved RFCs for their sections
Each C-OSS double-checks the offer of the IMs and publishes them via PCS.
After Sales / Applicants contact

SŽ – Infrastruktura, d. o. o. MÁV Hungarian State Railways Private Company Limited by Shares Győr-Sopron-Ebenfurti Railways Private Company Limited by Shares VPE – Hungarian Rail Capacity Allocation Office Železnice Slovenskej republiky, Bratislava v skrátenej forme “ŽSR”
PLK Polskie Linie Kolejowe Spółka Akcyjna
Applicants questions or requests
C-OSS of the involved RFCs for their corridor
An applicant chooses the C-OSS according to the focus market of his question, or a preferred language or further reasons If a question refers to many markets an applicant still will have a single point of contact as all C-OSS closely collaborate and act as one virtual C-OSS to an applicant.
Applicants acquisition
C-OSS of the involved RFCs for their corridor
C-OSS applicant’s care will be done by each C-OSS for its corridor with a regional focus. C-OSS can collaborate based on best practice approaches. Examples: • Common C-OSS applicant’s visits for
an applicant that operates trains in relevant corridors. • Regional applicant’s conferences organized
by the C-OSS of the concerned RFCs.