Annexes: Aspects of data on diverse relationships between ...
247
ASPECTS OF DATA ON DIVERSE RELATIONSHIPS BETWEEN AGRICULTURE AND THE ENVIRONMENT DG-ENV contract no.: 07-0307/2012/633993/ETU/B1 Annexes
-
Upload
khangminh22 -
Category
Documents
-
view
0 -
download
0
Transcript of Annexes: Aspects of data on diverse relationships between ...

0
ASPECTS OF DATA ON DIVERSE RELATIONSHIPS BETWEEN
AGRICULTURE AND THE ENVIRONMENT
DG-ENV contract no.: 07-0307/2012/633993/ETU/B1
Annexes

1

2
Annexes:
Aspects of data on diverse relationships between agriculture and the environment
Contract No. 07-0307/2012/633993/ETU/B1 30 April 2014
ALTERRA b.v. Droevendaalsesteeg 3 P.O. Box 47 6700 AA Wageningen The Netherlands Phone: +31 317 48 07 00 Fax: +31 317 41 90 00
In cooperation with:

3

4
Contents
ANNEX 1 DEFINITIONS OF GRASSLANDS IN EU POLICY .................. 1
ANNEX 2: OVERVIEW OF POLICIES ............................................................. 2
ANNEX 3: THE CURRAGH OF KILDARE – AN EXAMPLE OF THE LIMITS OF
HIGHER PLANT DIVERSITY IN ASSESSING ECOLOGICAL VALUE ON
LONGSTANDING GRASSLANDS ..................................................................... 8
ANNEX 4: RECOMMENDATIONS ON HOW TO DEFINE ‘HIGHLY BIODIVERSE
GRASSLANDS’ IN DIRECTIVE 2009/28/EC ON THE PROMOTION OF THE USE
OF ENERGY FROM RENEWABLE SOURCES (RED) .................................. 12
ANNEX 5 DEFINITION OF PERMANENT GRASSLANDS ACCORDING TO
CAP, OF UNCULTIVATED AND SEMI-NATURAL LAND IN EIA DIRECTIVE AND
OF HIGHLY BIODIVERSE GRASSLAND IN RED AS ELABORATED IN
DIFFERENT EU COUNTRIES AND THEIR LANGUAGES. .......................... 18
ANNEX 6 SUMMARY OF METADATA CHARACTERISTICS OF GRASSLAND
DATA SOURCES ............................................................................................... 19
ANNEX 7 FURTHER INFORMATION ON STATISTICAL DATA SOURCES21
ANNEX 8 EU AND GLOBAL DATA SETS BASED ON REMOTE SENSING AND
AREAL PHOTOGRAPHY ................................................................................ 30
ANNEX 9 OTHER RELEVANT EU WIDE DATA ELABORATION ACTIVITIES
ON GRASSLANDS ............................................................................................ 51
ANNEX 10 COUNTRY EXPERTS CONSULTED ....................................... 58
ANNEX 11 QUESTIONNAIRE ON ECOLOGICALLY VALUABLE GRASSLANDS
(EVG) IN NATIONAL DATA SOURCES ......................................................... 61
ANNEX 12 COUNTRY SUMMARIES ON DATA AVAILABILITY ON EVG 66
Austria ........................................................................................................................... 66
Belgium ......................................................................................................................... 70
Bulgaria ......................................................................................................................... 72

5
Cyprus ........................................................................................................................... 73
Denmark ........................................................................................................................ 74
Estonia ........................................................................................................................... 76
Finland .......................................................................................................................... 78
France............................................................................................................................ 83
Germany ........................................................................................................................ 86
Greece............................................................................................................................ 88
Hungary ........................................................................................................................ 90
Ireland ........................................................................................................................... 91
Italy ............................................................................................................................... 93
Latvia ............................................................................................................................ 96
Luxembourg ................................................................................................................. 101
Netherlands .................................................................................................................. 101
Portugal ........................................................................................................................ 103
Romania ....................................................................................................................... 105
Slovakia ........................................................................................................................ 108
Spain ............................................................................................................................. 109
Sweden ......................................................................................................................... 114
UK ................................................................................................................................ 115
ANNEX 13 COMMON LAND REGISTRATION IN FSS AND OTHER NATIONAL
DATA SOURCES ............................................................................................. 118
ANNEX 14 ECOLGICALLY VALUABLE GRASSLANDS AREA ESTIMATES
FROM EXISTING SOURCES ......................................................................... 122
ANNEX 15 SUMMARY OF RESULTS OF EXPERT QUESTIONNAIRE ON THE
ISSUE OF FARMLAND AT RISK OF ABANDONMENT ............................. 126
ANNEX 16 DETAILED NATIONAL EXPERT RESPONSES TO
QUESTIONNAIRE OF FARMLAND AFFORESTATION ............................. 137
Bulgaria ........................................................................................................ 137

6
Denmark ....................................................................................................... 139
Estonia ………………………………………………………………………………………………………..142
Hungary ........................................................................................................ 145
Ireland ………………………………………………………………………………………………………..149
Lithuania ....................................................................................................... 154
Poland …………………………………………………………………………………………………………156
Romania ........................................................................................................ 158
Spain ………………………………………………………………………………………………………..159
UK ………………………………………………………………………………………………………..171
ANNEX 17 EU-LEVEL INFORMATION AND STUDIES ON ENVIRONMENTAL
EFFECTS OF AFFORESTATION .................................................................. 182
ANNEX 18 INVENTORY OF BUFFER STRIPS AS A MEASURE UNDER THE
NITRATES DIRECTIVE ................................................................................. 187
ANNEX 19: INVENTORY OF BUFFER STRIPS AND PROTECTION AREAS AS A
MEASURE UNDER THE NATIONAL ACTION PLANS (NAP) FOR SUSTAINABLE
PESTICIDE USE (SUD). .................................................................................. 190
ANNEX 20: INVENTORY OF BUFFER STRIPS APPLICATION IN THE EU RIVER
BASIN NETWORK (RBN) .............................................................................. 201
ANNEX 21 TABULAR INFORMATION ON EVALUATION OF 4 BEST
PRACTICE EXAMPLES FOR RBS ................................................................ 205
ANNEX 22: RBS LITERATURE ................................................................. 237

1
ANNEX 1 DEFINITIONS OF GRASSLANDS IN EU POLICY
Title Description Source-reference Permanent grasslands in CAP Permanent grassland is defined as ‘land used to grow grasses or other herbaceous forage naturally
(self-seeded) or through cultivation (sown) and that is not included in the crop rotation of the holding for five years or longer
Commission Regulation EU No 796/2004
Permanent grassland in CAP post 2013
Permanent pasture is land used to grow grasses or other herbaceous forage naturally (self-seeded) or through cultivation (sown) and that has not been included in the crop rotation of the holding for five years or more; it may include other species such as shrubs and/or trees which can be grazed provided that the grasses and other herbaceous forage remain predominant as well as, subject to a decision by Member States to include land which can be grazed and which forms part of established local practices where grasses and other herbaceous forage are traditionally not predominant in grazing areas.
Amended Commission Proposal: COM(2011) 625 (Status September 2013)
Annex I habitats that depend on agricultural practices
The farmland habitats in Annex 1 of the Habitats Directive are semi-natural grasslands, and the aim of this Directive is to ensure they are maintained in a favourable conservation status. The most recent selection of Annex 1 habitats dependent on agricultural practices was elaborated by Luick et al., 2012)*. All the selected habitats depend to a higher or lower degree for their existence on livestock farming practices. The Habitats that would fall under the wide definition of grasslands taken in this paper make up roughly 30% of all habitats covered in the Annex 1 and include coastal habitats, heath and scrub habitats, Sclerophyllus scrub, sub-Mediterranean and temperate scrub, natural and semi-natural grasslands, raised bogs and mires and fens and forest habitats that are (partly) in agricultural use.
Habitat Directive (92/43/EEC) and the amendment Directive (2006/105/EC).
Highly biodiverse and species-rich grasslands
Highly biodiverse grasslands are defined as follows in the RED: (i) natural, namely grassland that would remain grassland in the absence of human
intervention and which maintains the natural species composition and ecological
characteristics and processes; [note: only the fraction of these grasslands which are in
agricultural use would be covered by the present study]
(ii) non-natural, namely grassland that would cease to be grassland in the absence of human
intervention and which is species-rich and not degraded, unless evidence is provided that
the harvesting of the raw material is necessary to preserve its grassland status.
Renewable Energy Directive (RED) (Directive 2009/28/EC). The sustainability criteria related to biofuels counting towards the target are also requested in the Fuel Quality Directive (98/70/EC).
Semi-natural grasslands EIA Directive has included protection of “uncultivated land semi-natural” from conversion and agricultural intensification. However, semi-natural farmland is not defined as such in the Directive.
EIA Directive (85/337/EEC)
*In Opperman, R., Beaufoy, G. & Jones, G. (eds.) (2012). High Nature Value Farming in Europe. 35 European countries in Europe – Experiences and perspectives. Verlag regionalkultur. Ubstadt Weiher. ISBN 978-3-89735-657-3

2
ANNEX 2: OVERVIEW OF POLICIES
Table 1 Policies targeting ecologically valuable grasslands in the EU
Policy description Relation with ecologically valuable grasslands
Pillar 1: CC Cross Compliance requires farmers to comply with the SMR’s and GAECs to receive direct payments
Compulsory GAEC standards ensure a minimum level of maintenance on their farmland, including the maintenance of the permanent grassland area. However minimum management in some MS as simple mechanical clearance, meaning that beneficial grazing can be lost. In the new CAP 2014-2020 stricter requirements are set to ploughing of valuable grasslands inside (obligatory) and outside (voluntarily for MS) Natura 2000 sides; but the option to require minimum grazing regimes and retention of farmland habitats have been removed. Several SMRs put limits on manure and plant protection inputs and require sustainable management practices.
Pillar 1: Art. 68
Article 68 of Council Regulation 73/2009 covers special support for specific types of farming which are important for the protection of the environment and for specific agricultural activities entailing additional agri-environmental benefits, or for farmers in economically vulnerable or environmentally sensitive areas.
Support can be given to farmers that are important for the management of ecologically valuable grasslands. This may help to prevent the abandonment and enhance the continuation of management entailing additional agri-environmental benefits. An example is the Burren scheme in Ireland, focused on EVG and funded from Art 68
Pillar 1: CC-SMR: BHD
In the Birds and Habitats Directive (BHD) several protected habitats are included that represent valuable grasslands
Legal protection of valuable grassland habitats within Natura 2000 sites, and the possibility for MS to also protect these habitats outside designated sites
Pillar 1 (CAP 2014-2020): extra protection valuable grasslands
In the new CAP an obligatory measure is included to prevent permanent grasslands in Natura 2000 sites from being ploughed. MS are also free to identify environmentally valuable permanent grasslands outside Natura 2000 sites for which this obligation applies.
This provides an additional instrument to prevent EVG from being lost. The proper identification of these EVG becomes more important to make this measure effective. However, EVG can also be destroyed by heavy fertilisation and overseeding, so a ban on ploughing does not give complete protection
Pillar 1 (CAP 2014-2020): Payments coupled to specific production systems
In the new CAP additional payments can be made to farmers with specific production systems which could be HNV farmers or ecological farming systems which are likely to manage EVG
HNV farms could be identified as specific production systems. Since most of the EVG are managed by HNV farmland systems this measures increases the chance for maintenance of these EVG.
Pillar 1 (CAP 2014-2020): top-up for Areas of Natural Constraint (ANC)
In the new CAP a new delimitation for ANC can be elaborated (with effect from 2018 at the latest) (based on 8 biophysical criteria, to a maximum of 10% of the agricultural area). Special support can be allocated to these areas to preserve or improve the environment.
This provides an opportunity to reconsider the LFA delimitation including more ecologically valuable grassland and creating an additional opportunity to give top-up premia to EVG. However, the option to designate special additional LFA was already available. Also the key to targeting EVG or HNV farmland is the farm-level eligibility criteria that are applied to LFA payments, not the LFA boundaries.
Pillar 2: AES (214)
Farmers might opt voluntarily for applying agri-environmental measures, supporting farming practices beneficial for environment, biodiversity and landscape
Farmers can receive special support for the maintenance of ecologically valuable grasslands. Several MS have AES targeted specifically at EVG

3
Pillar 2: HNV farmland in RDP
The Commission’s proposal (October 2011) on support for rural development by the European Agricultural Fund for Rural Development (EAFRD) outlines that Agri-environment schemes are to give specific attention to the additional needs of farming systems that are of high nature value. Also Priority 4
Most if not all ecologically valuable grassland are located in HNV farmland areas
Pillar 2: LFA (11,212)
In less favoured areas farmers receive extra support in case they respect the natural handicaps (see also next)
Many ecologically valuable grassland are located in LFAs and some schemes already give priority to grasslands, though not to EVG
EIA Directive Requirement for assessment of environmental impacts of agricultural projects
Projects involving intensification or conversion (including afforestation) of semi-natural farmland are explicitly cited for EIA but policy implementation at national level remains limited. Not an SMR
LIFE Nature Programme
finances projects that support the implementation of the Natura 2000. Specific actions related to agriculture include conservation of valuable grasslands by re-introducing appropriate levels of grazing, restoring wet grasslands and clearing of shrubs and other invasive plants.
These actions benefit EVG, specifically where they are relevant for populations of bird species listed in Annex I of the Wild Birds Directive (e.g. the great bustard, bittern, common crane), as well as species listed in Annex II and IV of the Habitats Directive such as grasshoppers, crickets and butterflies (COM 2010).
Table 2 Overview of management options targeted by CAP policies with a potential
direct or indirect positive on-farm biodiversity impact in grazed natural and semi-natural and improved grasslands
Source: Poláková, 2011 (page. 54) Key for “Potential on-farm impacts on biodiversity: ●●=direct; ●=indirect *Management can be included in the the compensation measure for ‘less favoured areas’(211 and 212) Key for Pillar 2 measure numbers: Farm modernisation (121); Infrastructure development (125); LFA measure (211, 212); Natura 2000 (213); Agri-environment (214); Non-productive investment (216); Conservation and up-grading of rural heritage (323).

4
Table 3 Relevant policies targeting farmland at risk of abandonment
Policy description Relation with abandonment CAP Pillar 1: CC Cross Compliance requires farmers
to comply with the SMR’s and GAECs to receive direct payments
To comply with GAEC farmers must ensure a minimum level of maintenance on their farmland. But if the burden of CC is too great and payments too low, this can drive abandonment
CAP 2014 – 2020 Coupled payments
For certain regions / sectors payments coupled to production might be maintained / reintroduced
Coupled payments are important to support extensive grazing systems. Mostly the land itself is not eligible for CAP-payments but through payments per cow / sheep / goat farmers are encouraged to continue the extensive grazing practices.
CAP 2014-2020, pillar 1: young farmer support
The young farmers support offers an extra financial top-up for farmers younger than 35 years
The support might encourage young farmers to start and continue their farm and thus prevent farm abandonment. However, most farmers in areas threatened by abandonment are much older and therefore will not benefit from these payments.
CAP 2014 – 2020, payment for farmers in areas with natural constraints
In areas with natural constraints MS may pay an extra top up to farmers, additional to the 2
nd pillar
LFA payment
The payment encourages to continue farming in regions with natural constraints and thus preventing abandonment, if the payments are high enough
CAP second pillar: LFA In less favoured areas farmers receive extra support (eligibility criteria mean that the proportion of farmers within LFAs who receive this support can vary greatly between MS)
To support continuation of farming in a less favoured area, threatened by abandonment. In some MS (e.g. Spain) the RDP evaluations have shown that the LFA measure has negligible effects in preventing abandonment.
CAP second pillar: Axis 1 Investment aids
Farmers are offered support to make investments to improve their farm infrastructure
can help to support farm viability e.g. through improvements to farm infrastructure.
CAP second pillar: Afforestation of agricultural land
Continuation of the 2007-13 Regulation 1698/2005 and the draft EAFRD regulation (June 2013) dictates that a similar combination of payments for establishment, maintenance, and compensation for loss of agricultural income should be given.
Can provide an alternative to total help to prevent land abandonment as evidence is given of the biggest uptake of the measure is on land threatened with abandonment. Afforestation is a pause in the abandonment process while farmers are paid to plant trees and maintain them, but these payments are for a limited number of years of course. If the plantations are not economically viable they may be abandoned when the payments finish.

5
Table 4 Policies for afforestation in four broad phases
1992-99 Regulation 2080/92 Obligatory implementation for MS
The concrete environmental objective is to combat the greenhouse effect and absorb carbon. The
other is to promote forms of countryside management more compatible with environmental balance,
a vague and unclear objective.
Weak requirement for environmental safeguards, but MS are given an interesting option for zonal
afforestation plans that could enable effective environmental targeting
High up-take, especially in Spain (50% of EU total), Ireland, Portugal and UK.
2000-2006 Regulation 1257/99 Implementation for MS is no longer obligatory
The Regulation makes full references to international and Community undertakings re forestry, and
measures should be based on national or subnational forest programmes or equivalent. The specific
problems of climate change should be taken in to account.
There is a new requirement for RDP documents that also includes general environmental aspects.
Environmental objectives in the Regulation are less concrete than in 1992-99
There is stronger environmental wording, but the requirements for concrete mechanisms are not
explicit.
Funds heavily mortgaged to pay compensation payments from 1992-99 commitments, thus limiting
new expenditure in this period
Up-take reduced
2007-13 Regulation 1698/2005 Optional implementation for MS
Compensation payment for loss of income reduced to 15 years and support for establishment costs
decreased from 100% up to maximum 80%.
Objectives modified, all afforestation should enhance biodiversity (according to the Regulation
recitals, but not in the Articles)
Areas should be designated for afforestation with environmental objectives
Care should be taken to avoid afforestation harmful to the biodiversity or causing other environmental
damage (mechanisms are not proposed)
Cross-compliance applies to first afforestation of agricultural land, but not to non-agricultural. The EIA
Directive is not included as an SMR
Additional RDP measure for afforestation of non-agricultural land, including abandoned land (although
similar measures existed before)
Up take far lower than 1992-99, with exception of UK. Ireland withdrew forestry measures from rural
development programmes and supported only through state aid. Hungary and Poland become
significant new users of the measure.
2014-15 onwards According to the text of the consolidated draft EAFRD regulation dated 26
th September 2013
(Interinstitutional File 2011/0282 (COD)), the afforestation measure is to be maintained with a similar
combination of payments for establishment, maintenance, and compensation for loss of agricultural
income.
There will be an integrated forestry measure that covers “the extension and improvement of forest resources through afforestation of land and creation of agroforestry systems combining extensive

6
agriculture with forestry systems”
The draft regulation does not set out specific objectives for afforestation. It states simply that “forestry is an integral part of rural development and support for sustainable and climate friendly land use should encompass forest area development and sustainable management of forests”
The regulation establishes over-arching priorities for rural development policy that include elements of relevance for farmland afforestation, such as restoring, and preserving and enhancing biodiversity, preventing soil erosion and improving soil management and fostering carbon conservation and sequestration in agriculture and forestry
Both agricultural and non-agricultural land will be eligible for afforestation aids
Payments to compensate for loss of agricultural income - it is not stated whether this applies only in
the case of agricultural land - and for maintenance will be available for a period of 12 years
Public authorities will be able to claim establishment costs only
In order to ensure that afforestation of agricultural land is in line with the aims of environmental
policy, the Commission shall be empowered to adopt delegated acts concerning the definition of the
minimum environmental requirements. The final proposed texts were published on 11th
March 2014
in C(2014) 1460 final with the following minimum environmental requirements in Article 6:
(a) the selection of species to be planted, of areas and of methods to be used shall avoid the inappropriate afforestation of sensitive habitats such as peat lands and wetlands and negative effects on areas of high ecological value including areas under high natural value farming. On sites
designated as Natura 2000 pursuant to Council Directive 92/43/EEC1 and Directive 2009/147/EC of
the European Parliament and of the Council2 only afforestation consistent with the management objectives of the sites concerned and agreed with the Member State's authority in charge of implementing Natura 2000 shall be allowed;
(b) the selection of species, varieties, ecotypes and provenances of trees shall take account of the need for resilience to climate change and to natural disasters and the biotic, pedologic and hydrologic condition of the area concerned, as well as of the potential invasive character of the species under local conditions as defined by Member States. The beneficiary shall be required to protect and care for the forest at least during the period for which the premium for agricultural income foregone and maintenance is paid. This shall include tending, thinnings or grazing as appropriate, in the interest of the future development of the forest and regulating competition with herbaceous vegetation and avoiding the building up of fire prone undergrowth material. As regards fast-growing species, Member States shall define the minimum and maximum time before felling. The minimum time shall not be less than 8 years and the maximum shall not exceed 20 years;
(c) in cases where, due to difficult environmental or climatic conditions, including environmental degradation, the planting of perennial woody species cannot be expected to lead to the establishment of forest cover as defined under the applicable national legislation, the Member State may allow the beneficiary to establish and maintain other woody vegetation cover. The beneficiary shall provide the same level of care and protection as applicable to forests;
(d) in the case of afforestation operations leading to the creation of forests of a size exceeding a certain threshold, to be defined by Member States, the operation shall consist of either:
(i) the exclusive planting of ecologically adapted species and/or species resilient to climate change in the bio-geographical area concerned, which have not been found, through an assessment of impacts, to threaten biodiversity and ecosystem services, or to have a negative
1 Council Directive 92/43/EEC of 21 May 1992 on the conservation of natural habitats and of wild fauna and
flora (OJ L 206, 22.7.1992, p. 7).
2 Directive 2009/147/EC of the European Parliament and of the Council of 30 November 2009 on the conservation of wild birds (OJ L 20, 26.1.2010, p. 7).

7
impact on human health; or
(ii) a mix of tree species which includes either:
– at least 10 % of broadleaved trees by area, or
– a minimum of three tree species or varieties, with the least abundant making up at least 10 % of the area.

8
ANNEX 3: THE CURRAGH OF KILDARE – AN EXAMPLE OF THE LIMITS OF HIGHER PLANT DIVERSITY IN ASSESSING ECOLOGICAL VALUE ON LONGSTANDING GRASSLANDS
As explained in Chapter 2, while all permanent grasslands have a certain range of ecological value (varying not only in breadth of those values, but also in the intensity of the value provided in each case), it is implicit in the terms of this study that EVG are only a subset of this overall population of grassland types – those which are high in biodiversity. Specifically, we posit that the EVG subset is not only predominantly composed of semi-natural grasslands, but that all semi-natural grasslands are EVG. In the UK, semi-natural grassland includes what are called semi-improved grasslands, which are of long-standing, but are impoverished in higher plant species. In the case of such grasslands, the high biodiversity is found in other species groups, including fungi and invertebrates.
Photo: James Allen, Creative Commons Licence
The Curragh of Kildare is a flat grassland of around 2000 ha, which has been maintained in its present condition for over 2000 years by controlled grazing; as such it is perhaps the oldest and most extensive area of [semi-natural] grassland in Ireland. Historically, the area was [common pasture, currently with rights to graze 6013 sheep]. In 1299 an Act was passed to prevent the pasturing of pigs on the area and in 1807 Thomas Rawson remarked “what a turf it must be to bear 20 sheep an acre” [49.4 sheep or 7.41 LU/ha!]. The botanical interest of the Curragh is, at first sight, unpromising. Centuries of grazing, sometimes intensive, have left a species-poor, dry, acidic sward characterised by Cynosurus cristatus, Centaurea nigra. Swards dominated by Nardus stricta occur in several areas. In the 1980s Nitare developed a scheme whereby unfertilised [grasslands] of conservation value could be identified by the presence of certain …. saprophytic fungi [which are] very sensitive indicators of habitat quality. Feehan & McHugh found 19 Hygrocybe species, which

9
placed the Curragh in the upper range of Nitare’s classification as a nationally important pastureland. Support for its ancient grassland status comes from a survey of rove beetles of the family Staphylinidae. Good & Butler found a total of 51 species, with two – Amischa bifoveolata and Tachyporus tarsus – of particular interest and occurring as dominant members of the rove beetle community. They were considered to indicate a mature, undisturbed (no fertilisers or ploughing) ecosystem. Periodic reporting on the extent and condition of all Annex 1 habitats over all of a Member State’s territory is one of the obligations imposed by the Habitats Directive. In the UK, there is a broad overlap between these habitats and those listed in the UK Biodiversity Action Plan process (under a different classification; correspondence tables have been published) as priority habitats. Such data should be reliably precise at at least the UK and regional levels. It does not however cover all EVG, as illustrated by the two examples below. In this upland landscape in northern England.
Approximate distribution of semi-natural habitats in an English upland landscape (darker green is an indication of semi-improved areas, question mark indicates that some MG6 grassland is considered ‘improved’). Original diagram from Averis et al. (2004); codes refer to National Vegetation Classification communities.

10
Distribution of Annex 1, UK BAP priority, habitats in the same landscape. Original diagram from Averis et al. (2004); codes refer to National Vegetation Classification communities.
The main differences are twofold. First, some habitats, though unquestionably semi-natural, are not given significant value in the BAP process and do not appear in Annex 1 of the Habitats Directive. For the most part, they are relatively poor in higher plant species. A very large area will be made up of acid upland grasslands (U4 – Festuca-Agrostis and U5 – Nardus stricta grasslands in the diagram) or slopes dominated by bracken (Pteridium aquilinum, U20). Some higher plant-rich habitats may also be excluded, notably ‘traditional hay meadow’ grasslands (MG5), since the definition of upland hay meadows 6520 specifies that British types should have Geranium sylvaticum - a geographically-restrictive criterion. A similar pattern is seen in the enclosed landscape, but with an even higher proportion of the land falling into the semi-improved category. Already visible at lower altitudes in the diagram above, the example below, from Devon illustrates clearly how a map of the BAP priority habitats only gives a misleading impression of the mosaic of semi-natural habitats.
An area of the Blackdown Hills in Devon. Middle map is of BAP priority habitats; right hand map of semi-natural habitats (including, in this case scrub and woodland) was produced by Natural England by interpretation of aerial imagery (left hand image) Based on: Cabot,D. (1999) Ireland: a natural history. New Naturalist Library

11
Costello, C (1999) Changes away from the traditional land use of The Curragh of Kildare since 1922. Irish Wildlife Manuals 6, Dúchas, The Heritage Service http://www.npws.ie/publications/irishwildlifemanuals/IWM6.pdf

12
ANNEX 4: RECOMMENDATIONS ON HOW TO DEFINE ‘HIGHLY BIODIVERSE GRASSLANDS’ IN DIRECTIVE 2009/28/EC ON THE PROMOTION OF THE USE OF ENERGY FROM RENEWABLE SOURCES (RED)
Response from: Definition of grasslands Identifying ‘non-natural’ grasslands Suggested criteria for assessment of highly biodiverse grassland
WWF European Policy Office and Oeko-Institut e.V.
Comments on RED proposal: “The proposed definition would explicitly exclude scrublands. This is not acceptable, as scrublands are well known to host high values of biodiversity, e.g. in the Mediterranean biome”. WWF finds the formulation in the RED “grass-like plants with few woody plants grows” imprecise. In addition, the term “a continuum of” would exclude many grassland types where the vegetation pattern is rather discontinuous (e.g. because of e.g. soil, climate, wild herbivores). Proposal for definition of grasslands by WWF: “Terrestrial ecosystems dominated by herbaceous and shrub vegetation”. This is elaborated from White (2000) definition of grasslands. It should be recognised that grassland types are included that have up to 60% tree/shrub cover in order to also include agro-forestry and savannah systems.
Comments on proposed definition in RED: the definition of non-natural grassland only addresses factors of its maintenance which is not enough as account also needs to be taken of species richness and level of degradation.. Proposal for definition for non-natural grassland: grassland that has been created by significant human activities, including deforestation, ploughing or sowing, and an area whose condition as grassland is maintained as grassland [for at least [5] years], and would cease to be grassland in the absence of human interventions.
Comments on proposed assessment criteria: recommend rewriting the criteria, especially recognizing the difference between natural and non-natural grassland. Proposed assessment approach for non-natural: c-1) Highly biodiverse non-natural grassland is species-rich, i.e. harbours a large variety of different species, taking into account seasonal and migrating effects where appropriate; OR c-2) Highly biodiverse non-natural grassland shows occurrence of species that are of high importance for the species' conservation regionally or globally. AND (d) Highly biodiverse non-natural grassland is not degraded as a result of human activities. To identify highly biodiverse grasslands, WWF strongly recommends setting up national and subnational lists of characteristic species and lists of plant habitat types and biotopes that can be used as indicators by means of a rapid assessment tool.

13
IEEP based on 2 papers developed for WWF by Catherine Bowyer, Graham Tucker, Håkon By and David Baldock: Working paper 1 - Interpreting Grassland Requirements set out within the Directive on Renewable Energy (Directive 2009/28/EC), Institute for European Environmental Policy: London, 2009 Working Paper 2 ‐ Operationalising Criteria to Protect Highly Biodiverse Grasslands under the Renewable Energy Directive (2009/28/EC), Institute for European Environmental Policy: London, 2010. The 2 working papers were developed with inputs from several
Comments to proposed definition: The same comments as WWF made Proposal for definition of grasslands by IEEP: The same as proposed by WWF
Comments on proposed definition in RED: The mere presence of farming activities at some level cannot, be used as a basis to distinguish between natural and non‐natural grasslands. What counts is pecies richness and level of degradation. Types of non-natural grasslands recommended to take into account: 1) Grasslands that have been intentionally improved and are under intensive agricultural management. These have generally been agriculturally improved, typically by ploughing, re‐seeding, fertilisation, herbicide treatments, and in some cases other activities intended to increase productivity on the land such as extensive drainage or irrigation. Such grasslands normally have low biodiversity value and low species richness (even when classified in the broadest sense). It should, however, be noted that despite this they may remain important habitats, for example as an over‐wintering site for birdlife. 2. Semi‐natural grasslands are usually used for extensive livestock grazing and/or hay production. They often need such grazing or other forms of disturbance to maintain their diversity of flora and dominance of the grass sward. They tend to hold a high proportion of native species of open habitats and are often species rich, and are therefore classed as highly biodiverse. 3. Land that was formerly in agricultural use for either arable or as grazed land and has since been abandoned. The lack of agricultural activity may have led to a decline in biodiversity value or an increase depending upon
Proposed assessment approach for non-natural: 1) Variable biodiversity value ‐ That there is
a hierarchy of appropriateness in terms of conversion of non-natural grasslands for feedstock production, not all non-natural grasslands are of equal biodiversity value.
2) Assessing species richness ‐ The consideration of species richness in non‐natural grasslands should not be restricted to plants. Thus species‐rich non‐natural grasslands should include grasslands that are species‐rich with respect to any taxa group (for example plants, invertebrates, reptiles, birds and mammals). Furthermore, consideration of species richness should not be solely based on small‐scale assessments, for example species per m2. Larger scale species diversity patterns are equally important. Thus grasslands should also be protected if they hold rare or otherwise threatened species or species assemblages, the loss of which would reduce larger scale biodiversity.
3) Accounting for degradation ‐ That degradation of grassland should be shown to be beyond a certain threshold, given that this is part of a continuum. In particular care should be taken if establishing that degradation has been caused by overgrazing, as this can often be rapidly reversed once grazing pressure is reduced. When determining the quality of grassland long‐term indicators of sward condition and, in

14
experts. environmental conditions, including the matrix of surrounding habitat and the type of agricultural activity undertaken previously. This category may also include land that is intentionally being restored to biodiverse grassland. These lands may be of low biodiversity value now but over time, provided appropriate management is in place, should be expected to become more biodiverse and develop the characteristics of semi‐natural grassland. 4. Land that is now grassland but has been recently deforested where the forest system has yet to, or is unable to, regenerate. This may have been farmed, be still in use or abandoned due to poor soils etc. These lands may be of low biodiversity value now and into the future, or may offer biodiversity potential in terms of future reforestation and regeneration. Proposal for definition for non-natural grassland: grassland that has been created by significant human activities, through the loss of a natural habitat, and have been maintained as grassland [for at least [5] years] as a result of human intervention such as ploughing, sowing, mowing or grazing by livestock.
particular, species composition and richness should be used rather than indicators of immediate condition/degradation.
European Forum on Nature Conservation and Pastoralism (EFNCP)
Comments to proposed definition: There is a confusing mix of concepts and definitions currently existing within these EU policies, including “highly biodiverse grassland” and “species rich” grassland (RED), “semi-natural or uncultivated land” (EIA Directive), “High Nature Value farmland” (CMEF indicators) and “permanent pasture” (cross-compliance). There are great overlaps between these concepts on the ground (for the land manager) and also in
Comments on proposed definition in RED: 1) “degraded” in proposed definition in RED
should be understood as referring to the biodiversity value of the grassland. It should NOT be understood in the sense of degraded lands as land with “significantly low organic matter content and has been severely eroded”.
2) In current definition no consideration given to the concept of semi-natural grasslands.
Proposed assessment approach for non-natural: Eliminate ‘simple’ sites from consideration at as early a stage as possible. rationale of the UK Land Cover Survey (and UK Biodiversity Action Plan) and assumes a strong correlation between ‘improved/ nonimproved’ and ‘non-highly-biodiverse/highly-biodiverse. An appeal mechanism for on-site

15
policy design and delivery. The current situation, in which related concepts and definitions are layered upon each other in EU policy with no apparent co-ordination, leads to considerable confusion for practitioners. We feel this lack of integration continues to be apparent in the Consultation document. Like WWF and IEEP EFNCP proposes to leave space to include areas with considerable tree and scrub vegetation coverage. Proposal for definition of grasslands by IEEP: “a terrestrial ecosystem dominated by herbaceous and/or scrub vegetation and with a tree canopy cover of no more than 30%”
These are non-natural grasslands that have not been improved for forage production through activities such as fertilisation and reseeding, and thus mimic natural grasslands. These communities are a priority for many nature conservation bodies, and well represented in the EU Habitats Directive. The identification of highly biodiverse non-natural grasslands is related closely to the concept of semi-natural grassland.
Proposal for definition for non-natural
grassland: Proposal is to focus on ‘highly biodiverse’ and
that permanent grassland not subjected to agricultural improvement can be taken as likely to be highly biodiverse; whereas permanent grassland subjected to agricultural improvement can be taken as unlikely to be highly biodiverse, alongside temporary grassland. Long-established grasslands which have not received herbicides or large quantities of fertilizer (and especially of inorganic fertilizer) are likely to be highly-biodiverse. The difficulty arises because some of these grasslands have been grazed at high stocking densities and are therefore rather poor in higher plant species, being dominated by a few vigorous grasses and grazing resistant herbs (often considered ‘weeds’). However, it has been shown that in the Atlantic
biogeographical zone at least, such grasslands can still be highly-biodiverse as regards the largest species groups – invertebrates and other soil biota. These grasslands are in fact
assessment should be put in place with criteria which clearly address grassland biodiversity in its totality – above ground and in the soil. In addition, the Commission should promote the development of semi-natural (or “highly biodiverse”) grassland inventories across the EU, following models already existing in a number of Member States.

16
strongholds for some species groups, such as grassland fungi.
JRC by Maria Luisa Paracchini with input from Peter Veen and Rainer Oppermann, and based on discussions within the community of European grassland experts and draft papers from several institutes.
Proposal for definition of grasslands by JRC: proposes the same as WWF and IEEP: ‘a terrestrial ecosystem dominated by herbaceous and/or shrub vegetation’ (modified from White et al.2000).
Comments on proposed definition in RED: it is not correct that natural grasslands are more likely to be highly biodiverse than non-natural grasslands. Furthermore, the definition of “non-degraded” should take into consideration temporarily and recoverable variations in the state of habitats. Proposal for definition for non-natural grassland: Grassland experts in Europe use the term semi-natural grasslands, rather than “non-natural grasslands”. Semi-natural grasslands are defined as non-zonal grasslands which can develop under the influence of a longer or shorter term extensive managed systems. These grasslands are managed by mowing (hay production) and/or pasturing by livestock. In Europe peculiar agricultural ecosystems developed through millennia of land management and still host a considerable share of European biodiversity. The link of the concept of highly biodiverse non-natural grasslands to High Nature Value (HNV) farmland must be underlined.
Operational assessment of non-natural or semi-natural grasslands proposed: The following operational steps for identification of grasslands of high biodiversity value are proposed:
1) Allocation of grasslands complexes according to semi-natural grassland vegetation types using national data (botanical relevees, grassland surveysetc. and including NATURA2000 mappings) from Countries in Europe (relevant Natura 2000 habitat types see Annex II). When this information is not available the next step should be applied.
2) Identification of sites that can potentially host biodiverse grasslands. This can be based on satellite images to identify grassland complexes or landscape types of appropriate structure, or on detailed land cover maps. At a second stage data on agricultural management, such as fertilizers input and livestock densities can be used to indentify areas under low input agricultural management. (e.g Indicative thresholds 30 to 50 kg/ha for N-input; the critical limit for livestock density ranges from 0.1 LU/ha in Mediterranean dry climate

17
to approx. 0.7 LU/ha in more productive areas). The outcome of this type of management are typically the grassland types listed in Annex I.
3) Site specific allocation of semi natural grasslands in those cases where the biodiverse grasslands are scattered in the landscape and are not mapped in national or regional data sources. In those cases regional lists of indicator species and / or a minimum number of higher plant species can be used to identify highly biodiverse grasslands. Several examples of indicator lists used already in countries/regions are included in JRC response.

18
ANNEX 5 DEFINITION OF PERMANENT GRASSLANDS ACCORDING TO CAP, OF UNCULTIVATED AND SEMI-NATURAL LAND IN EIA DIRECTIVE AND OF HIGHLY BIODIVERSE GRASSLAND IN RED AS ELABORATED IN DIFFERENT EU COUNTRIES AND THEIR LANGUAGES.
Source English French German Spanish Swedish Estonian Bulgarian Romanian
CAP
Commiss ion
Regulation EU No
796/2004
permanent grass land
means land used to grow
grasses or other
herbaceous forage
natura l ly (sel f-seeded) or
through cultivation
(sown) and that has not
been included in the crop
rotation of the holding
for five years or longer; i t
may include other
species sui table for
grazing provided that the
grasses and other
herbaceous forage
remain predominant;
«pra iries permanentes»:
les terres consacrées à la
production d’herbe et
d’autres plantes
fourragères herbacées
(ensemencées ou
naturel les ) qui ne font
pas partie du système de
rotation des cultures de
l ’exploi tation depuis
cinq ans au moins ;
d’autres espèces
adaptées au pâturage
peuvent être présentes ,
pour autant que l ’herbe
et les autres plantes
fourragères herbacées
restent prédominantes .
„Dauergrünland“
Flächen, die durch
Einsaat oder auf
natürl iche Weise
(Selbstaussaat) zum
Anbau von Gras oder
anderen
Grünfutterpflanzen
genutzt werden und sei t
mindestens fünf Jahren
nicht Bestandtei l der
Fruchtfolge des
landwirtschaftl ichen
Betriebs s ind; es können
dort auch andere für die
Beweidung geeignete
Pflanzenarten wachsen,
sofern Gras und andere
Grünfutterpflanzen
weiterhin vorherrschen
«Pastos permanentes»:
las tierras uti l i zadas
para el cul tivo de
gramíneas u otros
forra jes herbáceos , ya
sean natura les
(espontáneos) o
cultivados (sembrados) y
que no hayan s ido
incluidas en la rotación
de cultivos de la
explotación durante
cinco años o más;
pueden incluir otras
especies adecuadas para
pastos s iempre que las
hierbas y otros forra jes
herbáceos s igan s iendo
predominantes
permanent gräsmark:
mark som utnyttjas ti l l att
odla gräs el ler annat
örtartat foder naturl igt
(s jä lvsådd) el ler genom
odl ing (insådd) och som
inte har ingått i
växtföl jden på
jordbruksföretaget under
fem år el ler mera; andra
arter som lämpar s ig för
bete får ingå, under
förutsättning att den
övervägande andelen
utgörs av gräs och andra
örtartade växter.
„püs irohumaa” – maa,
mida kasutatakse rohu
või muude rohtta imede
kasvatamiseks kas
loodus l ikul vi i s i l
(i sekülvi teel ) või
harimise teel (külvamise
teel ), ning mis ei ole
põl lumajandus l iku
majapidamise
külvikorraga hõlmatud
vi i s aastat või kauem;
see võib hõlmata muid
karjatamise seisukohalt
sobi l ikke l i ike,
tingimusel et rohi või
muud rohtta imed jäävad
va ldavaks ;
„постоянно пасище“
означава земя,
използвана за
отглеждане на трева или
други тревни фуражи,
естествено растящи
(саморазсадени) или
чрез култивиране
(изкуствено засети),
които не са били
включени в
сеитбооборота на
стопанството в
продължение на пет
години или повече, то
може да включва други
подходящи за паша
видове, при условие, че
тревата или другите
тревни фуражи остават
преобладаващи;
„pajiș ti permanente”
înseamnă terenuri
consacrate producției de
iarbă ș i de a l te plante
fura jere erbacee
(cultivate sau spontane)
care nu au făcut parte din
s is temul de rotație a
cul turi lor din exploatație
timp de cel puțin cinci
ani ; această noțiune
poate include ș i a l te
speci i adecvate pentru
pășunat, cu condiția să
rămână predominante
iarba ș i a l te plante
fura jere erbacee;
EIA
Dir 85/337/EEC Annex
II.1.b
uncultivated land or semi-
natura l areas
terres incultes ou
étendues semi-
naturel les
Ödland oder naturnaher
Flächen
terrenos incultos o
superficies
seminatura les
obrukad mark el ler delvis
orörda naturområden
harimata maa või
pool loodus l ike a lade
необработваеми или
полупустеещи земи
pământului necultivat
sau a suprafețelor
seminatura le
RED
Dir 2009/28/EC Art.
17.3.c
highly biodiverse
grass land
prairies naturel les
présentant une grande
va leur sur le plan de la
biodivers i té
Grünland mit großer
biologischer Viel fa l t
prados y pastiza les con
una rica biodivers idad
Gräsmark med stor
biologisk mångfa ld
suure bioloogi l i se
mitmekes isusega
rohumaa
пасища с висока степен
на биоразнообразие
pășuni bogate în
biodivers i tate

19
ANNEX 6 SUMMARY OF METADATA CHARACTERISTICS OF GRASSLAND DATA SOURCES
Name of data source
Type of data collection
Spatial coverage Spatial resolution
Temporal coverage Temporal resolution
FADN Stratified sample among farms
EU-27 FADN regions 1999 - 2003 (only EU-15) and 2004 - 2010 (EU-27)
Annual
FSS Sample every 2/3 years and full census every 10 years
EU-27 + Norway, Switzerland, Croatia
FSS regions (Nuts 2/3)
For EU-27 from 2003-2007, 2010 census expected to be available in 2013. For EU-15 data go back to 1990
2/3 yearly
Eurostat crop statistics
National / regional statistics based on surveys
EU-27 National and for some items regional (NUTS1/2)
Starting from 1974 for some MS up to most recent year 2011
Annual
FAOSTAT National statistics Global National 1961 - 2009 Annual
LPIS Farmers survey EU27 (only eligible area which likely excludes many semi-natural grasslands which are not considered permanent grassland in CAP definition
Parcel size 1992 - 2012 Annual
LUCAS (point) field sampling
samples in EU-27 countries
Selection of points (±25%) of 2 km grid
Some earlier pilot years, 2009, 2012
Every 3 year
UNFCCC Country specific, combination of statistics and RS
Annex 1 countries, incl. EU member states, except Malta and Cyprus
National 1990-2010 Annual
OECD National statistics OECD countries National 1990-2004 Annual
EW-MFA Statistics EU-27 (+ Norway, Switzerland, Croatia and Turkey)
National 1990-2010 (although before 2000 many gaps)
Annual
PASK study Statistics EU-27 (+ Turkey) National Trend till 2002, starting year differs per country
Single review of statistics in 2003
GlobCover Satellite derived global 300 m grid cell 2009 Once

20
Name of data source
Type of data collection
Spatial coverage Spatial resolution
Temporal coverage Temporal resolution
GLC2000 Satellite derived global 1 km grid cell 2000 Once
CLC1990 Satellite derived EU-27 (except Sweden, Finland) + Croatia, Montenegro, Serbia, Turkey
100 m grid cell 1990 Once
CLC2000 Satellite derived EU27, EFTA4, EEA32, Albania, Bosnia and Herzegovina, Croatia, Macedonia, Montenegro, Serbia
100 m grid cell 2000 Once
CLC2006 Satellite derived EU-27 (except Greece) + EFTA4, Albania, Bosnia and Herzegovina, Croatia, Macedonia, Montenegro, Serbia and Turkey
100 m grid cell 2006 Once
CLC2012 Satellite derived EEA32+ 100 m grid cell 2012 Once
GIO HR grassland
Satellite derived EEA32+ 100 m grid cell 2006-2012 Once
Geoland2 HR Grassland
Satellite derived EEA32+ 100 m grid cell 2006 Once

21
ANNEX 7 FURTHER INFORMATION ON STATISTICAL DATA SOURCES
Farm Accountancy Data Network (FADN) General description The Farm Accountancy Data Network (FADN) is consists of an annual survey carried out by all the Member States of the European Union. FADN data are collected every year from a sample of the agricultural holdings in the European Union. Holdings are selected to take part in the survey on the basis of sampling plans established at the level of each region in the Union. The methodology applied aims to provide representative data along three dimensions: region, economic size and type of farming. At this moment the FADN is the only source of microeconomic (farm level) data that is harmonised, i.e. the bookkeeping principles are the same in all countries. While the European Commission (DG-Agri) is the primary user of analyses based on FADN-data, aggregated data can be found in the Standard Results database (http://ec.europa.eu/agriculture/rica/diffusion_en.cfm). Used definitions and classification of grassland In FADN different types of grassland categories are specified for which data are collected. The definitions used in FADN are identical to those used in FSS. They include the 3 different permanent grassland categories:
1) Meadows and permanent pastures (var.150): Grassland grown for 5 years or more on cultivated land.
2) Rough grazing (var. 151) Generally uncultivated and not-fertilised land, including scrub, used as poor
quality pasture. Generally uncultivated and not-fertilised land, including scrub, used as poor quality
pasture.
3) Permanent grassland no longer used for production purposes and eligible for direct payments
(var.314): Areas of permanent grassland and meadows no longer used for production purposes which,
in line with Regulation (EC) No 73/2009 are maintained in good agricultural and environmental
condition and are eligible for financial support.
So for the three types of grassland recorded some information is available on inputs and outputs. At least it is clear that only the meadows and permanent pastures (var 150) are fertilised. The rough grazings are not fertilised, but only grazed. Additional data collected for these categories include:
1) The value of hay and/or grass sold off the farm is to be indicated under 'Sales'.
2) The value of hay and/or grass used as feeding stuffs for livestock can be indicated when marketable
under 'Farm use’. This amount is also to be entered as costs of feeding stuffs produced on the farm
3) Costs of all purchased fertilisers and soil improvers
Unfortunately all 3 categories of additional information are only collected for the whole farm and are not attributable directly to the grassland categories above. Further description Currently, the annual FADN sample covers approximately 80.000 holdings. They represent a population of about 5.000.000 farms in the 25 Member States, which cover approximately 90% of the total utilized agricultural area (UAA) and account for about 90% of the total agricultural production of the Union. For the EU-27, that is including Bulgaria and Romania, the FADN represents about 6.400.000 farms. This implies that the representation of the Utilised Agricultural area in FADN differs strongly per country because of the variation in economic size distribution of farms (see Table 1). The data available start as from 1998 onwards, but data for the EU 10 become available as from 2004 onwards. The stratification of the FADN sample is done using the information of the Farm Structure Survey (FSS) on distribution of the total EU farm population over size and (sectoral) type. The survey however does not cover all the agricultural holdings in the Union but only those which due to their size could be considered commercial. This implies that often part time farms and smaller extensive farms particularly occurring in Southern and CEEC are under-represented. However, because of the different farm structures in the European Union, it is necessary to specify separate size thresholds for each Member State (see Table 1).

22
Table 1: Size thresholds applied per MS for inclusion of farm into FADN
Economic size thresholds applied by the Commission (in 1000 EUR) from
Year 2010
Belgium 25
Bulgaria 2
Czech Republic 8
Denmark 15
Germany 25
Estonia 4
Ireland 4
Greece 4
Spain 3
France 25
Italy 4
Cyprus 4
Latvia 4
Lithuania 4
Luxembourg 25
Hungary 4
Malta 4
Netherlands (*) 25
Austria 8
Poland 4
Portugal 4
Romania 2
Slovenia 4
Slovakia 15
Finland 8
Sweden 15
United Kingdom 25
United Kingdom (Northern Ireland) 15
(*) Provisional information The FADN data are available at individual farm level per FADN region. However, the accessibility to the individual farm data are restricted to FADN Liaison Agencies and permission to use the data needs to be obtained from DG-Agri. Data are only available at the FADN region level (See Map 1). Publication of the data in reports requires a minimal representation of the figure by more than 15 farms.

23
Maps 1: FADN regions
For the detailed characteristics on this data set are given in the excel table included separately.
Data quality First the National Liaison Agencies that are responsible for the collection of the FADN data apply their own quality control measures that may be higher or lower than the standard required by the Commission. When the data are considered error-free by the national Liaison Agencies they transmit the data to the Commission and submit it for inclusion with the quality procedures implemented by the Commission. The Commission then applies several control procedures on the aggregate data:
1) Check whether all farms are classified according to European Union typology
2) The coherence test: consists of several hundred tests that try to detect and identify possible errors,
inconsistent data and improbable values.
3) The homogeneity test: helps to create sub-samples that are appropriate for special analyses. It
identifies outliers, i.e. farms for which the value of one or more variables is significantly different from
the mean value of the category to which the farm belongs.
4) Continuity test: computes the percentage of deviation between X and Y and if the result exceeds a
predefined threshold an extra check on the data is made.
5) Correction procedure: data that need correction are returned to the National Liaison Agencies to
either correct or to deliver a new farm return.

24
Eurostat statistical data sources (FSS, crop survey and SAPM) The main EU wide statistical source of information on agricultural land use is the Farm Structural Survey (FSS) and the crop survey. FSS provides EU wide harmonised data on agricultural holdings in the EU on:
Number of agricultural holdings
Land use and area (crops)
Livestock
Main crops
Farm Labour Force (including age, gender and relationship to the holder)
Economic size of the holdings
Type of activity
Other gainful activity on the farm
System of farming
Machinery
Organic farming The frequency of data collection for FSS is every 2 years. This implies that the Member States are obliged to deliver the standard data every 2 years which can be based on a sample of farms but every 10 years a full scope survey is carried out in the form of an agricultural census. The most recent census took place in 2010 in all EU Member States. The data are currently under validation process and the first validated results are published in the database (see Agricultural census 2010 - provisional results). The survey data can only be derived in aggregated format at different geographic levels (Member States, regions, and for basic surveys also district level). The data can also be arranged by size class, area status, legal status of the holding, objective zone and farm type. The data are quality checked by the national collection offices and by Eurostat. In addition to the FSS there is also Survey on agricultural production methods (SAPM) which was carried out for the first time in 2010 to collect data at farm level on agri-environmental measures. European Union (EU) Member States could choose whether to carry out the SAPM as a sample survey or as an exhaustive survey. Data were collected on tillage methods, soil conservation, landscape features, animal grazing, animal housing, manure application, manure storage and treatment facilities and irrigation. With reference to irrigation, Member States were asked to provide estimation (possibly by means of models) of the volume of water used for irrigation on the agricultural holding. The Member States collected information from individual agricultural holdings and, observing rules of confidentiality, data were transmitted to Eurostat. The results of the SAPM are linked at the level of individual
agricultural holdings to the data obtained from the Farm structure survey (FSS) in 20103. The basic unit underlying the SAPM is the agricultural holding: a technical-economic unit, under single management, engaged in agricultural production. The SAPM covers all agricultural holdings with a utilised agricultural area (UAA) of at least one hectare (ha) and also those holdings with a UAA of less than 1 ha where their market production exceeds certain natural thresholds. Up until 2009/2010, in some countries, the FSS did not cover particular types of land not belonging directly to
agricultural holdings on which common rights apply - designated as common land. Generally these areas are
used for grazing animals and the area used by each holding is not individualized but is part of the UAA.
In what concerns common land as it is defined above, countries can be classified into 3 different categories:
3 The legal basis for the SAPM is Regulation 1166/2008 of 19 November 2008 on farm structure surveys and the
Survey on agricultural production methods, which repealed Council Regulation 571/88.

25
A. Common land simply does not exist (Belgium, Czech Republic, Denmark, Estonia, Latvia, Lithuania,
Luxembourg, Malta, the Netherlands, Poland, Slovakia, Finland and Sweden),
B. Common land exists but it has always been perfectly measurable within the methodology used for
covering the UAA within each agricultural holding in the FSS (Spain, Italy, Cyprus, Austria, Portugal,
Romania and Norway).
C. Common land exists but was not totally included in the FSS until 2007, and is included in FSS 2010 and
onwards (Bulgaria, Germany, Ireland, Greece, France, Hungary, Slovenia and the United Kingdom). For
this last group the differences between 2007 and 2010 in what concerns UAA, and grassland in
particular, should take into account this change in the coverage.
Coherence
The FSS does not cover the whole territory. The coverage includes only land belonging to agricultural holdings.
The total area of a holding covers utilized agricultural area (arable land, kitchen gardens, permanent grassland
and permanent crops) and other land (unutilized agricultural area, wooded area, and other land occupied by
buildings, farmyards, tracks, ponds, rock, etc.). The Utilized Agricultural Area (UAA) is also covered in other
agricultural statistics, namely the annual crop statistics. The crop statistics use a different methodology for
collecting the data (see next). Table summarizes the main differences and the reasoning in the case of
divergence in the UAA.
Table 2. Main differences and the reasoning in the case of divergence in the UAA between FSS and Eurostat
annual crop statistics4
Member State
Data Explanation
Belgium UAA figures in annual
statistics are lower than in
the FSS
No reason given.
Bulgaria UAA in annual statistics is
much larger than in the
FSS
The Farm Structure Survey excludes the common land used by the farmers
collectively, but this land is included under 'Permanent grassland" in the
annual statistics table. BG considers that common land is not part of
agricultural holdings.
The Farm Structure Survey excludes the farms under a certain threshold.
Some areas under the heading "Land under permanent crops", where
clarification is needed as to the legal status of the area, are also excluded
from the FSS. This is the case, for example, when the ownership is not clear,
because descendants of the late owner did not divide up the land.
Germany UAA figures in annual
crops and in the FSS are
almost identical
DE uses the FSS results to estimate the land use figures provided within the
framework of annual statistics.
Greece UAA figures in annual
statistics are lower than in
the FSS
Some important data are
missing.
No reason given.
Spain UAA figures in annual
statistics are lower than in
the FSS for certain years
No reason given.
France Crops under glass are No reason given.
4 http://epp.eurostat.ec.europa.eu/cache/ITY_SDDS/EN/ef_esms.htm#meta_update

26
Member State
Data Explanation
missing
Italy UAA in annual statistics is
much larger than in the
FSS
The FSS excludes both the area of very small farms (under the fixed
threshold) and the land not belonging to farms, whereas the annual surveys
take into consideration all the areas in the country that are used for
agriculture.
Annual surveys collect information on 'area under cultivation' (or 'harvested
area' for permanent crops) for each crop requested in the first three tables
of Regulation. 543/2009. However, in practice it is difficult to distinguish
between the 'main area' and the 'secondary area' (for this reason, data on
land use sent to Eurostat are in the form of estimates based on data
collected as part of the annual surveys).
Cyprus UAA figures in annual
crops and in the FSS are
almost identical
The FSS survey covers almost 100% of the UAA because the threshold used is the
same for both annual and FSS surveys.
Latvia The series L0004 Kitchen
gardens is not available
The area of kitchen gardens has been allocated to the respective crop (mostly
vegetables, potatoes or fruit trees).
Luxembourg UAA figures in annual
crops and in the FSS are
almost identical
FSS is carried out every year in Luxembourg and the results are used to
estimate the UAA in the annual statistics.
Due to the structure of the agricultural holdings in Luxembourg, the number
of farms under the defined threshold is very low, with the result that the FSS
data cover almost 100% of the UAA. FSS covers all the land (including
permanent pastures).
Hungary The figures for UAA in the
annual statistics are much
higher than the same
figure in the Farm
Structure Survey
No reason given.
Malta UAA figures in annual
crops and in the FSS are
identical
In Malta there are no permanent pastures.
The FSS does not apply any threshold.
The
Netherlands
UAA figures in annual
statistics are lower than in
the FSS for certain years.
UAA data are estimated on the basis of an annual sample survey of crop
production. The scope of this survey is very similar to the FSS. Due to
unavoidable survey errors, and in any event under the limits imposed by the
legislation in force, the UAA reported in the framework of annual statistics is
sometimes higher and sometimes lower than the UAA reported under the
FSS framework.
Before 2007, the area of rough grazing was not included in the annual land
use data. Since 2007, the FSS and the annual land use statistics are
integrated and the differences no longer occur.
Austria Some figures for UAA in
the annual statistics are
lower than the same
figure in the Farm
Structure Survey
Common land is included in the FSS data.
The differences between the annual data and the FSS are small; this is due
to the fact that different data sources are used for the land use data (FSS
and administrative sources).
Poland For some years, the
figures for UAA in the
annual statistics are much
higher than the same
figure in the Farm
Structure Survey.
Before 2002 the UAA in annual statistics also included non-farm land (the
type is not clear).
Before 2008 the UAA in annual statistics also included unusable agricultural
area.
Romania Some figures for UAA in Romania does not use thresholds in the FSS and common pastures were not

27
Member State
Data Explanation
the annual statistics are
lower than the same
figure in the Farm
Structure Survey.
Kitchen gardens are not
included before 2004.
included in annual statistics before 2010. Therefore, the scope of the FSS
and of the annual statistics survey was similar.
Since 2010, common pastures are included in the annual statistics but not in
the FSS; it is therefore expected that UAA in the annual statistics will be
higher than in the FSS.
Before 2004, data on kitchen garden areas were not collected separately
and were attributed to the respective crop (mainly permanent crops).
Slovenia Data on crops under glass
are missing
Data on kitchen gardens
are missing
The area of crops under glass is not significant
Data on kitchen gardens is not collected in Slovenia. Due to the structure of
agricultural holdings and a large proportion of self-supply farming, it is
impossible to separate the production consumed on farm and that intended
for the market. Production for own needs is therefore included in each
category of the annual data on crop production.
Slovakia Some figures for UAA in
the annual statistics are
lower than the same
figure in the Farm
Structure Survey
UAA data are estimated on the basis of an annual sample survey of crop
production. The scope of this survey is very similar to the FSS. Due to survey
errors that are impossible to avoid and in any case under the limits fixed by the
legislation in force, the UAA reported in the framework of annual statistics is
sometimes higher and sometimes lower than the UAA reported under FSS
framework.
Finland For some years, the
figures for UAA in the
annual statistics are lower
than the same figure in
the Farm Structure Survey.
The figures in UAA and FSS data are almost identical because the FSS covers
nearly 100% of UAA.
The UAA data are estimated on the basis of census data (the areas consists
of the data of all farms). The FSS data are based on the sample survey (the
areas are estimates). This is why for some years the figures may be different.
Sweden For some years, the
figures for UAA in the
annual statistics are lower
than the same figure in
the Farm Structure Survey.
There is no agricultural common land.
The data source for the UAA under FSS and the annual statistics is the same.
UAA data are estimated on the basis of an annual sample survey on crop
production. The scope of this survey is very similar to the FSS. Due to
unavoidable survey errors, and in any case given the limits fixed by the
legislation in force, the UAA reported in the framework of annual statistics is
sometimes higher and other times lower than the UAA reported under the
FSS framework.
United
Kingdom
UAA in annual statistics is
much larger than in the
FSS
No reason given.
Eurostat compiles a range of crop and land use statistics at both national and regional level5. Previous Council
Regulations (EEC No 837/90 and EEC No 959/93) concerning statistical information on agricultural production
to be supplied by the Member States have been amended several times. In 2009 these were replaced by one
single act (EC No 543/2009). In order to ensure that the common agricultural policy is properly administered,
the Commission requires that data on area, yield and production of crops are regularly provided.
Member States shall provide the Commission annually with the data on 1) crops from arable land 2)
vegetables, melons and strawberries, 3) permanent crops and 4) agricultural land use, as defined in the Annex
of EC No 543/2009. For crops marked with ‘R’ in the Annex data must be provided for the NUTS 1 and NUTS 2
territorial units defined in Regulation (EC) No 1059/2003. For Germany and United Kingdom there is an
5 http://epp.eurostat.ec.europa.eu/portal/page/portal/agriculture/data/database

28
exception to report only at NUTS 1 territorial units. The reference period is the harvest year, and the first
reference year is 2010.
Under Crops from arable land “Temporary grasses and grazing” is included, but reporting is only required at
national level for area data, production data is not required. Under Agricultural land use “Permanent
Grassland” is included, for which the area should be reported at regional level. However, the current available
data set is not complete, as demonstrated by Table , especially at the NUTS 2 level the data coverage is lower.
Data quality
Member States have to provide every three years the crop statistics data (for the first time by 2011), the
Commission (Eurostat) with reports on the quality of the data transmitted. The quality report should describe
the organisation of the surveys and the methodology applied, the level of precision achieved for the sample
surveys and the quality of sources other than surveys which are used.
Table 3. Frequency of reported statistics for permanent grassland area for the period 2000-2010, based on the regional land use statistics (agr_r_landuse) from Eurostat website
Country NUTS 0 NUTS 1 NUTS 2
Austria 100% 100% 100%
Belgium 82% 82% 82%
Bulgaria 64%
27%
Cyprus 91% Czech Republic 64%
73%
Denmark 100%
45%
Estonia 55% Finland 100% 100% 100%
France 91% 82% 82%
Germany 73% 97% 9%
Greece 45% Hungary 100% 100% 100%
Ireland 100%
100%
Italy 91% 82% 82%
Latvia 82%
18%
Lithuania 82% Luxembourg 82% Malta 9% Netherlands 100% 100% 100%
Poland 100% 100% 100%
Portugal 100% 100% 100%
Romania 100% 100% 100%
Slovakia 82%
100%
Slovenia 91%
36%
Spain 64% 55% 55%
Sweden 91% 36% 36%
United Kingdom 64% 91%

29
Land Parcel Identification System (LPIS) General description The land parcel information system (LPIS) is the spatial register within the Integrated Administration and Control System (IACS). The IACS ensures that payments of the EU Common Agricultural Policy (CAP) are made correctly. LPIS identifies and quantifies agriculture land for the purpose of targeting CAP payments. The IACS/LPIS is operationalized by the paying agencies of each member state. The data is gathered each year through beneficiaries application forms that are filled out by each farmer receiving CAP payments. A minimum percentage of farms are cross checked in the field. Used definitions and classification of grassland The CAP payments can only be targeted to agricultural land which is ‘eligible’. Therefore the CAP Regulation defines agricultural area and categorizes land for “eligible hectares”. Agricultural area is defined as any area taken up by arable land, permanent pasture or permanent crops. There is a clear distinction between temporary grassland (grassland <5yrs without ploughing), categorized under ‘arable land’ and permanent pasture ( grassland 5 yrs or > without ploughing). Next to the general discussion of permanent pasture, LPIS can distinguish different types of permanent pasture. But this depends on the country and regional definitions the agencies choose to use. Further description For the detailed characteristics an overview is provided in the excel sheet included separately. (data available on grassland production, quality (N, P content), data available on species composition, especially leguminous plants include examples of the data (e.g. a map, table with values for last year, etc.) Data quality Each member state is obliged to maintain a reference layer for the LPIS data, in that way the parcel information can be cross-checked. Each MS is free to choose the approach for the reference layer, so there exist differences in the quality check.

30
ANNEX 8 EU AND GLOBAL DATA SETS BASED ON REMOTE SENSING AND AREAL PHOTOGRAPHY
FAO-LCCS The Land Cover Classification System (LCCS) is a comprehensive, standardized a priori classification system, designed to meet specific user requirements, and created for mapping exercises, independent of the scale or means used to map. The system can be used for any land cover classification initiative anywhere in the world, using a set of independent diagnostic criteria that allow correlation with existing classifications and legends. Land cover classes are defined by a combination of a set of independent diagnostic criteria – the so-called classifiers – that are hierarchically arranged to assure a high degree of geographical accuracy. Due to the heterogeneity of land cover, the same set of classifiers cannot be used to define all land cover types. The hierarchical structure of the classifiers may differ from one land cover type to another. Therefore, the classification has two main phases:
an initial Dichotomous Phase, where eight major land cover types are distinguished, and
a subsequent Modular-Hierarchical Phase, where the set of classifiers and their hierarchical arrangement are tailored to the major land cover type.
Further definition of the Land Cover Class can be achieved by adding attributes. Two types of attributes, which form separate levels in the classification, are distinguished:
Environmental Attributes are attributes (e.g. climate, landform, altitude, soil, lithology and erosion) that influence land cover but are not inherent features of it, and which should not be mixed with “pure” land cover classifiers, and
Specific Technical Attributes are associated with specific technical disciplines. Thus for (Semi)Natural Vegetation, the Floristic Aspect can be added; for Cultivated Areas, the Crop Type; and for Bare Soil, the Soil Type.
All Primarily Vegetated land cover classes are derived from a consistent physiognomic structural conceptual approach that combines the classifiers Life Form, Cover and Height (in (Semi-)Natural Vegetation) and Life Form (in Cultivated Areas) with Spatial Distribution. The Primarily Non-Vegetated classes have a similar approach, using classifiers that deal with surface aspects, distribution or density, and height or depth. The LCCS first divides the landscape into areas that are primarily vegetated or non-vegetated. Each is then divided further according to whether it is terrestrial or aquatic or regularly flooded. Within the vegetated areas, areas that are cultivated or managed are separated from those that are semi-natural. Within the non-vegetated category, artificial surfaces and associated areas (primarily urban) are separated from bare areas and artificial and natural water bodies are distinguished. Grasslands occur under “Cultivated and managed Terrestrial Areas” and “Natural and Semi-Natural Terrestrial vegetation”. In the second modular-hierarchical phase a set of classifiers are tailored to the major land cover types. Classifiers describing grassland are Life forms (Herbaceous – Forbs or Graminoids), Cover and Height. Relevant definitions with regards to grasslands in the classification system are:

31
Herbaceous: Plants without persistent stem or shoots above ground and lacking definite firm structure are defined as herbaceous. There are two categories, depending on the physiognomy, namely Graminoids and Forbs. Graminoids: Includes all herbaceous grasses and other narrow-leaved grass-like plants that are not grasses according to the taxonomic definition (Kuechler and Zonneveld, 1988). Guidelines: Graminoid vegetation is defined by the presence of more than 75% of Graminoids in the herbaceous coverage. There is no upper limit of height: the only condition is the physiognomy of the plant. Cover: The cover can be considered as the proportion of a particular area of the ground, substrate or water surface covered by a layer of plants, considered at the greatest horizontal perimeter level of each plant in the layer. A distinction is made between closed (more than 60–70%), open (70–60% to 20–10%), closed to open (between 100 and 15%) and sparse (20–10% to 1%). As herbaceous plants are seasonal in character, it has to be noted that the cover of herbaceous vegetation is always considered at the time of its fullest development. Height: The height of a certain layer is measured from the ground to the average top of the Life Form being assessed (Kuechler and Zonneveld, 1988). The fact that single plants of one synusia differ from the average height can be ignored, apart from the fact that they can form their own layer (e.g. the emergents of a rainforest that tower above the rest). Height sub-divisions are: >30 down to 3 m for Trees; 5 m to 0.3 m for Shrubs; and 3 m to 0.03 m for Herbaceous. Each class is further sub-divided. LUCAS (LC/LU) Following a decision of the European Parliament, the European Statistical Office (EUROSTAT) in close cooperation with the Directorate General responsible for Agriculture and the technical support of the JRC, is organising regular, harmonised surveys across all Member States to gather information on land cover and land use. LUCAS stands for Land Use and Cover Area frame Survey. On a 2km grid sample points are selected and data on land use and land cover are collected. Sample points are classified into different categories of land use and land cover according to first and second dominant class per point. The classifications used are streamlined with other statistical standards, like the Farm Structure Survey and the EUNIS classification. The aim of the LUCAS survey is to gather harmonised data on land use/cover and their changes over time. In addition the survey provides territorial information facilitating the analysis of the interactions between agriculture, environment and countryside. • LUCAS is an in-situ survey area frame survey, which means that the data is gathered through direct observations by the surveyors on the ground. Land cover data can also be obtained by photo interpreting satellite images or orthophotos as is done in the Corine Land Cover.

32
The land cover/use statistics derived from the LUCAS survey are unique as they are fully harmonised (same definitions and methodology) and comparable over time and among Member States. • The land cover and the visible land use are classified according to the harmonized LUCAS land cover and land use nomenclatures. The full survey supporting documents consist of field form, where all the measured variables are listed, surveyors' instructions, which give detailed instructions to the field surveyors and of the quality control procedures. The full description of the statistical data set is available in the land cover/use statistics metadata attached to the data. • The last surveys were in 2008/2009 and in 2011/2012. The first was based on data collected in 265 000 geo-referenced points and in the 2012 271,000 points were visited by field surveyors. The points in both surveys were selected from a standard 2 km grid including in total around 1 million points all over the EU. The selection of points is done on the basis of stratification information. Data are available at national and regional aggregates. Former Lucas surveys were done already in 2002 and enable comparisons over time, although the number of points visited and the type of information gathered was more limited. The LUCAS 2009 survey included a soil module. A top soil sample was collected on 10 % of the points, but no data were collected on biodiversity. For the 2012 no soil information was collected. • The LUCAS 2009 survey included a soil module. A top soil sample was collected on 10 % of the points. The objective of the soil module is to improve the availability of harmonised data on soil parameters in Europe. The LUCAS soil was implemented in co-operation with DG Environment and DG Joint Research Centre. The results will be available in 2011. Furthermore, there are maps produced on basis of LUCAS like Grassland in agricultural use as share of land cover, by NUTS 2 regions for 2009 In LUCAS Grassland (E00) are defined as: Land predominantly covered by communities of grassland, grass like plants and shrubs. The density of tree-crown is less than 10% and the density of tree+shrub-crown is less than 20%. The following three subclasses are discerned: E10 Grassland with sparse trees, E20 Grassland without trees, E30 Spontaneous vegetation. E10 Grassland with sparse trees: Land predominantly covered by communities of grassland, grass-like plants and forbs including sparsely occurring trees (the density of the tree crown is between 5 and 10% and the total density of the tree+shrub crown is between 5 and 20% of the area). Fruit trees in small groups or along an avenue on grassland are classified here as well. This class includes the following grasslands (although not separately distinguished) :
dry grasslands, dry edaphic meadows, steppes with gramineae and artemisia
plain and mountainous grassland
wet grasslands
alpine and subalpine grasslands
saline grasslands
arctic meadows
temporarily unstocked areas within forests Links with Land Use

33
E10 - U111 Agriculture: Permanent pastures, rough grazings, alpages, meadows
E10 - U112 Fallow and abandoned land
E10 -
E10 - U31x Associated areas of transport areas
E10 - U340 Grassland attached to commerce, finance or business areas
E10 - U350 Grassland attached to community service areas
E10 - U36x Grassland for recreation: public gardens, golf courses and nature reserves
E10 - U370 Grassland attached to residential areas
E10 - U400 Natural grassland or grassland outside agricultural areas not utilized E20 Grassland without trees: Land predominantly covered by communities of grassland, grass like plants and forbs without trees and shrubland (density of tree+shrub crown is less than 5%). This class includes:
dry grasslands, dry meadows and steppes
plain and mountainous grassland
wet grasslands
alpine and subalpine grasslands
saline grasslands
arctic meadows
temporarily unstocked areas within forests Links with Land Use
E20 - U111 Agriculture: Grazning in permanent pastures, rough grazings, alpages, meadows (see Table underneath)
E20 - U112 Fallow and abandoned land
E20 - U120 Clear cuts within previously existing forests
E20 - U31x Associated areas of transport areas (e.g. aerodromes)
E20 - U340 Grassland attached to commerce, finance or business areas
E20 - U350 Grassland attached to community service areas
E20 - U36x Grassland for recreation: public gardens, golf courses, sports fields and nature reserves
E20 - U370 Grassland attached to residential areas
E20 - U400 Natural grassland grassland outside agricultural not utilized Table 1 Overview of LUCAS (2012) points with dominant land cover forest, shrubs and
permanent grasslands managed by grazing
Forest pasture, grazed
Shrubland grazed
Grassland (with and without tree coverage) grazed
Total points
% Forest grazed
% Shrubland grazed
% Grassland (with and without tree coverage) grazed
Austria 2729 100 1625 6467 36% 43% 36%
Belgium 581 11 770 2446 42% 36% 45%
Bulgaria 1822 424 1488 6642 37% 47% 50%

34
Cyprus 378 348 217 1442 6% 15% 24%
Czech Republic 2070 40 1135 5514 42% 48% 44%
Germany 8053 263 5697 24943 45% 47% 50%
Denmark 611 46 738 3445 56% 52% 57%
Estonia 1248 59 463 2202 20% 32% 25%
Greece 2083 2006 1031 7829 26% 37% 31%
Spain 9390 5012 5575 35377 33% 35% 38%
Finland 8679 235 705 13482 10% 10% 16%
France 11294 1269 10740 38338 43% 30% 54%
Hungary 1037 110 942 4637 43% 42% 51%
Ireland 457 136 2212 3484 70% 62% 72%
Italy 6049 1311 3279 21013 33% 41% 42%
Lithuania 1405 45 1154 3889 38% 51% 45%
Luxembourg 69 2 71 215 49% 0% 45%
Latvia 2327 65 1063 4420 28% 31% 30%
Malta 3 13 9 79 33% 15% 11%
Netherlands 267 30 863 2241 52% 47% 56%
Poland 7316 243 5293 21806 40% 44% 42%
Portugal 2773 1205 1217 7336 38% 29% 41%
Romania 3092 292 4184 14279 43% 55% 56%
Sweden 16006 728 1398 22421 6% 5% 19%
Slovinia 932 38 374 1621 29% 32% 32%
Slovakia 1059 89 488 2455 32% 35% 31%
UK 2250 868 4996 12253 50% 49% 62%
Total EU 93980 14988 57727 270276 30% 35% 47%
E30 Spontaneous vegetation: Mostly agricultural land which has not been cultivated this year or the years before. It has not been prepared for sowing any crop this year. This class can also be found on unused land, storage land etc. Main case is agricultural land not providing a crop during the entire year or abandoned earlier agricultural surfaces. It is occupied by spontaneous vegetation in case of set-aside arable land, with some tall herbs or weeds. This class applies as well for former grassland or hedge margins which are currently not used anymore but covered by tall herbs fringes. There might be some bare land pockets or crop residues and spontaneous re-grown crops of the before management period. Only surfaces which have not been deliberately sown and do not have any fodder crops like mixed cereals or are temporary grasslands classify for this land cover class. This class includes:
Set aside land within agricultural areas
Unused artificial land This class excludes:
Other Legumes and mixtures for Fodder (B53)

35
Mixed cereals (B54)
Temporary grassland (B55)
Grassland without tree/shrub cover (E20)
Bare land (F00) Links with Land Use
E30 - U112 Spontaneous vegetation on fallow and abandoned land
E30 - U120 Clear cuts within previously existing forests)
E30 - U140 Mining and quarrying if in use
E30 - U21x Energy and industrial production surfaces with spontaneous vegetation cover if still in use
E30 - U31x Transport, storage, water and waste treatment etc surfaces with spontaneous vegetation cover if in use
E30 - U400 Unused, spontaneously vegetated land
E30-U111 There is also a separate land use class distinguished in LUCAS: U112. This class is titled ‘Fallow and abandoned land. It includes crop land not included in the crop rotation for one year or longer. The abandoned land includes agricultural land set-aside for a long period of time (for as far as not transformed in a shrub or woodland area according to the LUCAS characteristics. So generally it includes abandoned land areas which have not been used for up to 1 to around 5 years. After that they are likely to have transformed into shrubland classes. Corine Land Cover (CLC) The CORINE (CO-oRdination of INformation on the Environment) programme was initiated by the EU in 1985. A number of databases were created within this framework with the aim to give information on the status and changes of the environment. One of these databases is the CORINE Land Cover database (CLC). The reference year for this database is 1990 (range 1986 – 1995) and its geographical extent covers 24 countries. The land cover information is derived from high resolution satellite data (Landsat-TM) by computer assisted visual interpretation in combination with ancillary data. The final CLC database consists of a geographical database describing land cover/use in 44 classes grouped into a three level hierarchical structure. The CORINE land cover nomenclature has 5 major categories at the first level, 15 land cover categories at the second level and 44 categories at the third level. In Bossard et al. (2000) an extensive description is given for each CORINE land cover class. The most important pasture types distinguished in CLC are described in further detail underneath. In the newest CLC more attention has now been paid to distinguish semi-natural grassland classes such as class 231: Pastures on abandoned land and 321 Natural grassland. In CLC the wooded meadows are also distinguished but this already happens since 1990 version. Because of this it is also logical that the CLC is an important sources of information for idenfying the HNV farmland areas in the EU (Paracchini et al., 2007). However, because of

36
the coarseness of the information additional (national) data sources on species distribution were still required to refine the likelihood indicator of HNV farmland.
Class 2.3 Pastures
Lands, which are permanently used (at least 5 years) for fodder production. Includes natural or sown herbaceous species, unimproved or lightly improved meadows and grazed or mechanically harvested meadows. Regular agriculture impact influences the natural development of natural herbaceous species composition. Dense grass cover, of floral composition, dominated by graminacea, not under a rotation system. Mainly for grazing, but the fodder may be harvested mechanically. Includes areas with hedges (bocage).
Extension: Grazing used by cattle. Pastures can be described as extensively used grasslands with presence of farm structure such as: fences, shelters, enclosures, watering places, drinking trough, or regular agricultural works: mowing, drainage, hay making, agricultural practices, manuring. This class includes:
- temporary and artificial pastures not under a rotation system which become permanent grasslands five years after ploughing. Significant number of natural vegetation species are present (as Taraxacum officinale, Ranunculus spp., Chrisanthemum leucantemum, Knautia arvensis, Achillea millefolium, Salvia spp., etc.);
- abandoned arable land not under a rotation system used as pastures (after 3 years);

37
- humid meadows with dominating grass cover. Sedges, rushes, thistles, nettles, cover less than 25 % of the parcel surface;
- pastures with scattered trees and shrubs. This class excludes:
- military exercising grass fields (without grazing) (class 321); - salt meadow located in intertidal flat areas (class 423); - lawns inside sport and leisure facility areas (class 142); - high-productive natural alpine meadows far from houses and/or crops (class 321); - fodder crops (class 211); - derelict grassland where semi-ligneous/ligneous vegetation cover at least 25 % of the
parcel (class 322/324); - strong humid meadows where hygrophyle plant species cover at least 25 % of the
parcel (class 411); - herbaceous grass cover composed of non-palatable and undesirable species for cattle
as Molinia spp. and Brachypodium spp. (class 321).
Texture of grassland
Texture of scattered trees and shrubs (10-20% of surface)
A generalised pattern of the class 231
Representative demonstration of the quoted class on example of grassland in Central
part of Slovakia Particularity of class 231: Pastures on abandoned land Grassland developed by not using arable land for more than three years. Identification of the quoted grassland requires application of data obtained by field checking. This class includes:
- areas of grassland representing succession of natural overgrowing of arable land by prevailingly herbaceous vegetation;
- areas of sporadically occurring shrubs.
Textures of abandoned arable land (more than 3 years)

38
Texture of scattered shrubs A generalised pattern of the particularity of class 231
Representative of the quoted class particularity on example of pasture on abandoned
land in Latvia Particularity of class 231: Wooded meadows Meadows where dispersed trees and shrubs occupy up to 50% of surface of the area. These meadows are characterised by rich floristic composition. This class includes:
- areas of grassland, partially covered by tree crowns; - areas of scattered trees and shrubs.
Texture of grassland
Texture of scattered trees and shrubs (40-50% of surface)
A generalised pattern of the particularity of class 231
Representative of the quoted class particularity on example of wooded meadow in Virtsu-Laelatu (Estonia) 321 Natural grassland

39
Low productivity grassland. Often situated in areas of rough, uneven ground. Frequently includes rocky areas, briars and heathland. Extension: Natural grasslands are areas with herbaceous vegetation (maximum height is 150 cm and gramineous species are prevailing) which cover at least 50 % of the surface covered by vegetation which developed under a minimum human interference (not mowed, fertilized or stimulated by chemicals which might influence production of biomass); here belong for instance grass formations of protected areas, karstic areas, military training fields, etc. (even though the human interference cannot be altogether discarded in quoted areas, it does not suppress the natural development or species composition of the meadows), areas of shrub formations of scattered trees. This class includes:
- saline grasslands grown on temporary wet areas of saline soils; - humid meadows where sedges, rushes, thistles, nettles cover more than 25 % of the
parcel; - natural grasslands with trees and shrubs if they do not cover more than 25 % of the
surface to be considered; - high-productive Alpine grasslands far from houses, crops and farming activities; - herbaceous military training areas; - grasslands which can be grazed, never sown and not otherwise managed by way of
application of fertilizers, pesticides, drainage or reseeding except by burning; - grasslands with a yearly productivity less than 1.500 units of fodder/ha; - herbaceous grass covered composed of non-palatable gramineous species such as
Molinia spp.and Brachypodium spp.; - derelict natural grassland where ligneous vegetation cover less than 75 % of the area; - grasslands found on calcareous soils with a high proportion of calcicole species of
limestone, chalk Machair or Karst; - grasslands dotted with bare rock areas which represent less than 25 % of the surface.
This class excludes:
- grey dunes (class 331); - swampy grassland (class 411); - fallow land (class 211).
Texture of natural grassland
Texture of scattered trees and shrubs
A generalised pattern of the class 321

40
Representative demonstration of the quoted class of natural grassland in the Morava floodplain (Slovakia) Generalisation: At high altitude, class 321 might be present as altitude formation between heathlands (322) or class 31x and sparsely vegetated areas (333).
333
322
321
312
312
322
321
333
altitude
Particularity of class 321: Alpine meadows Grass formations which occur in high mountains above the upper timberline. The most extensive areas of this particularity as far as the Phare countries are concerned, are in the mountains of the Alps, the Carpathian Arch, etc. This class includes:
- natural grassland; - rocky formations; - dwarf pines.
Texture of natural grassland
Texture of rocky formations
Texture of dwarf pines
A generalised pattern of the particularity of class 321

41
Representative of the quoted class particularity on example of alpine meadow in the High Tatras (Slovakia) Particularity of class 321: Grass formations of inundated alluvial plains and coastal plains, lowlands Human influence is very low with regard to natural conditions – of grass formations - extreme soil humidity and seasonal inundated. This class includes:
- natural grassland; - water bodies; - shrub formations and scattered trees.
Texture of natural grassland
Texture of water surfaces
Texture of scattered trees and shrubs
A generalised pattern of the particularity of class 321
Representative of the quoted class particularity on examples of lower coastal grassland and upper coastal grassland (Rumpo and Vaemla, Estonia)

42
Globcover
The GlobCover Land Cover Map was created by the ESA’s GlobCover Project. The map displays land classification information for most of the Earth’s surface at a resolution of 300 meter (9 ha per pixel) and contains 22 different land cover types, which are based on the predominant type of vegetation found at that location. The thematic legend is intended to be compatible with the FAO Land Cover Classification System (LCCS) used for the GLC2000 global land cover map. The data was collected from the MERIS sensor on the ENVISAT satellite during 2009.
The map data is Copyright ESA GlobCover Project. The source data can be obtained from their website.
Figure 1. Globcover database for the year 2009 (300m resolution)
- 10 Rainfed croplands - 11 Post-flooding or irrigated croplands - 13 Post-flooding or irrigated croplands - 14 Rainfed croplands - 20 Mosaic cropland (50-70%) /vegetation (grassland/shrubland/forest) (20-50%) - 30 Mosaic vegetation (grassland/shrubland/forest) (50-70%) / cropland (20-50%) - 40 Closed to open (>15%) broadleaved evergreen and/or semi-deciduous forest
(>5m) - 50 Closed (>40%) broadleaved deciduous forest (>5m) - 60 Open (15-40%) broadleaved deciduous forest/woodland (>5m) - 70 Closed (>40%) needle-leaved evergreen forest (>5m) - 90 Open (15-40%) needle-leaved deciduous or evergreen forest (>5m) - 100 Closed to open (>15%) mixed broadleaved and needleaved forest - 110 Mosaic forest or shrubland (50-70%) and grassland (20-50%) - 120 Mosaic grassland (50-70%) and forest or shrubland (20-50%)

43
- 130 Closed to open (>15%) shrubland (<5m) - 140 Closed to open (>15%) grassland - 150 Sparse (<15%) vegetation - 160 Closed (>40%) broadleaved forest regularly flooded, fresh water - 170 Closed (>40%) broadleaved semi-deciduous and/or evergreen forest regularly
flooded, saline water - 180 Closed to open (>15%) grassland or shrubland or woody vgt on regularly flooded
or waterlogged soil, fresh, brakish or saline water - 190 Artificial surfaces and associated areas (Urban areas >50%) - 200 Bare areas - 210 Water bodies - 220 Permanent Snow and Ice - 230 no data
The global Globcover legend is compatible with the GLC2000 global land cover classification (http://www-tem.jrc.it/glc2000/legend.html) and LCCS. It is based on the LCCS system. Grassland is mapped in mosaic/composite land cover classes 20, 30, 110 and 120 (+ 140).
GLC2000:
The global land cover data for the year 2000 (GLC2000) project, coordinated by the
European Joint Research Centre (JRC), provides consistent global land cover information for
the year 2000. The GLC2000 project followed a bottom-up approach to map world’s land
cover. The global land cover map was derived by merging 18 regional products made by
regional experts. Consistency between the regional products was derived by classifying
SPOT4-Vegetation dataset (spatial resolution 1km) and applying the land cover classification
system (LCCS) produced by the United Nations (UN) (Di Gregorio, 2005). After harmonization
and merging the individual regional products one global GLC2000 product with a generalized
legend was produced (Bartholomé and Belward, 2005). The GLC2000 database has 23
classes (see Annex IV) and Figure 2.

44
Figure 2. The Global Land Cover dataset for the year 2000 (GLC2000).
Tabel 2. GLC2000 legend aggregated from regional classes using LCCS.
GLC Global Class (according to LCCS terminology)
1 Tree Cover, broadleaved, evergreen
LCCS >15% tree cover, tree height >3m
(Examples of sub-classes at regional level* :
closed > 40% tree cove; open 15-40% tree cover)
2 Tree Cover, broadleaved, deciduous, closed
3 Tree Cover, broadleaved, deciduous, open
(open 15-40% tree cover)
4 Tree Cover, needle-leaved, evergreen
5 Tree Cover, needle-leaved, deciduous
6 Tree Cover, mixed leaf type
7 Tree Cover, regularly flooded, fresh water (& brackish)
8 Tree Cover, regularly flooded, saline water,
(daily variation of water level)
9 Mosaic:
Tree cover / Other natural vegetation
10 Tree Cover, burnt
11 Shrub Cover, closed-open, evergreen
(Examples of sub-classes at reg. level *: (i) sparse tree layer)
12 Shrub Cover, closed-open, deciduous
(Examples of sub-classes at reg. level *: (i) sparse tree layer)

45
Definition of grassland as in the LCCS system for example class 13: Herbaceous cover, closed to
open (>15%) is described as “the main layer consists of closed to open herbaceous vegetation. The crown cover is between 100 and 15% (a further sub range can be defined – Closed to Open 100–40%). The height is in the range of 3 - 0.03m but may be further defined into a smaller range. (Codes A2A20B4)”. GIO HR grassland A high resolution data set of permanent grassland shall be produced. The analysis will use the three reference years (2006, 2009, 2012) to detect the permanent presence of grass-land. The discrimination of permanent grassland from other agricultural land areas such as arable land, bare soil, needs to take into account seasonal variations. A minimum of 3 (worst case), an average of 4-5 and up to maximum 8 seasonal images of AWiFS data (reference year 2012) will be used as additional information for the classification process. Statistical validation will be carried out on the 100m x 100m data. Required minimum accuracy is 80%38. Grassland includes the following landscape types:
- Pastures, grassland used for grazing or hay production (CLC classes 2.3.111, but al-so appears in classes 2.1.1 to 2.4.4).
- Cultivated or semi-natural grassland within forests, and grass covered surfaces with-in transitional woodland (appears in CLC classes 3.1.1-3.1.3, 3.2.4).
- Natural grassland in any surrounding (CLC class 3.2.1). - Grassy areas with low (10%) fraction of scattered trees and shrubs. - Alpine meadows with low fraction of bare rock or gravel.
Land covers not to be considered as grassland:
- Grassland in urban areas: parks, urban green in residential and industrial areas.
13 Herbaceous Cover, closed-open
(Examples of sub-classes at regional level *: (i) natural, (ii) pasture, (iii) sparse trees or shrubs)
14 Sparse Herbaceous or sparse Shrub Cover
15 Regularly flooded Shrub and/or Herbaceous Cover
16 Cultivated and managed areas
(Examples of sub-classes at reg. level *:
(i) terrestrial; (ii) aquatic (=flooded during cultivation), and under terrestrial: (iii) tree crop & shrubs (perennial), (iv) herbaceous crops (annual), non-irrigated, (v) herbaceous crops (annual), irrigated)
17 Mosaic:
Cropland / Tree Cover / Other natural vegetation
18 Mosaic:
Cropland / Shrub or Grass Cover
19 Bare Areas
20 Water Bodies (natural & artificial)
21 Snow and Ice (natural & artificial)
22 Artificial surfaces and associated areas

46
- Grass surfaces in sport and recreation areas, incl. golf courses. - Clearcut areas, new forests. - Areas of shrubs: areas dominated by moors and heathland (Atlantic, CLC class 3.2.2)
or sclerophyllous vegetation (Mediterranean, CLC class 3.2.3). - Surfaces covered exclusively by mosses and lichen (Subarctic). - Peatland (either in natural condition or in excavation, CLC class 4.1.2).
Geoland2 HR Grassland The concept and product specifications are based on the latest consolidated user requirements (on a high common European level) for HRLs as presented in the document “User Requirements for High Resolution Layers, Draft 1.2, EC Proposal Reference No. FP-7-218795, Actual submission date: 12.12.2010“. For the HRL grassland, a multi-criteria approach is requested for characterisation. This approach would lead to a GL mask, which is being subdivided according to the following four criteria:
- Wetness, - Intensity of use, - Mixture with high vegetation elements, and - Cover density (grass)
Based on feasibility criteria of the EO based approach, the developed overall concept will serve the following layers:
- A grass surface indicator (primary probability layer), - A grass surface mask (secondary layer), - An arable land mask (annual crops),
plus the following intensity layers (secondary layers), specified and described in detail below:
- Shrub and trees indicator (corresponding to “Mixture with high vegetation elements”),
- Grass density indicator (corresponding to “Cover density”), and - Cutting indicator (addressing “Intensity of Use”).
The derivation of a wetness indicator is not deemed feasible in a consistent way and is therefore excluded.

47
Definition of the Primary product - Grass Surface Indicator (EL-01a1) The Grass surface indicator is a thematic map that shows continuous EO-defined probability (1-100%) of grass surface occurrence, typically aggregated to discrete percent classes. The map is produced by help of multi-temporal EO derived supporting data sets and other HR Layers, i.e. Soil sealing, Forest area map and Water map. The indicator provides information about the spatial extent of grass covered surfaces. The probability degrees derived for this layer reflect the level of resemblance of each pixel to the expected spectral-phenological behaviour of grass surfaces. E.g., extreme temporal variability of the spectral vegetation response may point to an arable area rather than grass surface, which can be expected to be more steadily vegetated throughout the year (in humid temperate climate). In this respect, geographically (climate, soils, elevation, etc.) induced variability of grassy surfaces throughout the year will be taken into account by means of an eco-region based stratification. Grass surfaces captured in this layer contain grassland and grassy surfaces of any use and management, e.g. pasture, cultivated meadows, lawn used for sports, etc., together with grass surfaces with shrub and trees present. The layer itself does now allow for distinguishing different habitats. According to the conceptual approach, the specification of grass surface layer is limited with regard to built-up areas and forest. The forest and build-up land cover classes have been excluded from the processing, even though there may be grass covered surfaces under the tree canopy or in between the trees (regarding low forest cover) or the buildings. On the other hand, the Grass surface indicator includes areas across a broad probability range, meaning that pure grassy surfaces and surfaces with partially “grassy behaviour” are contained in the layer. Nomenclature: Grass Surface Indicator
- Covering areas with vegetation of full or partial grass-like phenological behaviour (site-specific) that does not belong to forests and built-up areas

48
- mapped in continuous probability percent (1-100%) that can be aggregated to discrete map and such suit different customer needs
- pixel-based product (60 m) - Linear (e.g. roads) features are included if smaller than the defined MMU
Definition of the Secondary product - Grass Surface Mask (EL-01b1) The grass Surface mask is derived as a binary layer from the Grass Surface probability map via thresholding the probability levels. The determination of the appropriate threshold is evolving during production and cannot be specified a prior. It can be defined that the layer covers areas where grass constitutes the dominant surface (>50%). The Grass Surface Mask is the spatial framework for the set of intensity layers for the further characterisation of grassy surfaces (Shrub and trees, Grass density, and Cutting indicator). That means, these indicators will be derived within the Grass Surface Mask only. Nomenclature: Grass Surface Indicator
- Grass area mask includes: grass dominant (>50%) surfaces, pastures, cultivated meadows, lawn used for sports, together with grass surfaces with shrub and trees present
- Pixel-based product (60 m), the grass area mask is mapped with 1 ha minimum area / 60 m width
Definition of the Secondary product – Arable Land Area (EL-01b2) The Arable Land Area is a binary mask of arable land, specifically of annual crops. It includes both, rain fed and irrigated crops. It is derived using the supportive data set “ploughing indicator”. The ploughing indicator describes the multi-temporal dynamics of the spectral vegetation signals. As such it provides indication of arable land cover, e.g. through temporal variations from bare soil to dense green vegetation, over dried off vegetation back to bare soil at a location. The different (e.g. climatic) crop growing conditions in different regions is being taken into account for the interpretation of such spectral signals over time by means of the stratification. Nomenclature: Arable Land Area
- Arable land mask includes areas predominantly covered by annual crops (> 50%), both rain fed and irrigated crops.
- Pixel-based product (60 m), the Arable Land area is mapped with 1 ha minimum area / 60 m width
Definition of the Secondary Grassland product - Shrub and Trees Indicator (EL-01b3) The Shrub and trees indicator shows the spatial distribution of shrubs, trees and other high non-grass vegetation within the Grass Surface mask area as relative fractions ranging from 0 to 100.

49
The shrub and trees indicator layer, derived from biophysical EO parameters that differentiate vegetation according to their structure (shaded parts) is closely linked to the forest HRL. While the forest area mask is defined by crown density from 10 to 100 % and growth height minimally 5m at maturity, the shrub and trees indicator contains pixels of high (rough) vegetation canopies that do not satisfy the requirements for forest. These are transition zones between forest and mainly grassy areas or other partially shrub/tree covered grass areas. Nomenclature: Shrub and Trees Indicator
- Mapped in continuous density fraction values from 0-100% - Can be aggregated to discrete percent ranges and thus be customised - includes any woody or other vegetation taller than approximately 1.5 – 2 m of
different density within the grass surface mask - pixel-based product (60 m) - 1 ha minimum area / 60 m width is inherited in the indicator from the Grass Surface
mask area Definition of the Secondary Grassland product - Grass Vegetation Density Indicator (EL-01b4) The Grass Vegetation Density Indicator provides information on grass vegetation density, the maximum of Leaf Area Index – LAI (m2/m2) during vegetation period, within the Grass Surface mask. The Grass Vegetation Density Indicator is derived from biophysical EO parameter LAI that differentiate vegetation according to their leaf area cover, the leaf density. On a regional scale, it allows separating areas of high(er) from low(er) grass vegetation density. In as much as intensely managed grass parcels have potentially higher vegetation productivity compared to less intensely managed or natural grass surfaces, this indicator is also related to the intensity of grass management. Local/regional environmental conditions play an important role for the indicator, hence regional contextual interpretation of the indicator is required. Nomenclature: Grass Vegetation Density Indicator
- Mapped in relative density values 0-100, which correspond to Leaf Area Index (m2/m2)
- Can be aggregated to discrete ranges and thus be customised - pixel-based product (60 m) - 1 ha minimum area / 60 m width is inherited in the indicator from the Grass Surface
mask area

50
Definition of the Secondary Grassland product - Cutting Indicator (EL-01b5) The Cutting Indicator provides information on grass cutting and/or grazing on a relative scale from 0 to 100% within the Grass Surface area mask. The values refer to the intensity and/or frequency of green vegetation biomass change during main vegetation period. The Cutting Indicator is derived from multi-temporal EO parameters that show the biomass changes during the main vegetation period. The proper calculation of this indicator is highly sensitive to availability of frequent mullti-temporal EO images, especially during the high vegetation period. This indicator aims at detecting presence of cutting, but also grazing that is not separated as different management. The separation of the two ways of agricultural uses and its combination is practically not possible. The cutting indicator is a partial indicator for the intensity of use of the grass covered areas. Nomenclature: Cutting Indicator
- Mapped in relative intensity values 0-100% - Can be aggregated to discrete percent ranges and thus be customised - pixel-based product (60 m) - 1 ha minimum area / 60 m width is inherited in the indicator from the Grass Surface
mask area

51
ANNEX 9 OTHER RELEVANT EU WIDE DATA ELABORATION ACTIVITIES ON GRASSLANDS
European Grassland Federation The European grassland federation (EGF) is a forum for research workers, advisors, teachers, farmers and policy makers with active interest in all aspects of grasslands in Europe. These aspects include management of all types of grasslands for production, utilization, amenities and conservation purposes. EGF has as its objectives to facilitate and maintain close contact between Grassland Organizations in Europe, to promote the interchange of scientific and practical experience between grassland experts and to initiate conferences and other meetings on all aspects of grassland production and utilization in Europe.As such it does not collect or manage data on grasslands. However there is a working group established on Semi-natural grasslands since June 2012 that aims to:
i. to establish a common concept on the characteristics that distinguish ‘semi-natural grasslands’ from other types of grasslands,
ii. to classify all grasslands into broad categories with similar agricultural/environmental services and challenges.
For this purpose a questionnaire has been send out to specialists in different countries to collect views on definition and information needs on semi-natural grasslands. Used definitions are not yet developed, but work is done for the definition of semi-natural grasslands and how to distinguish these from other grassland categories. We are in contact with the people from the working group and will include current progress on the definitions when available. EAGLE The EAGLE group (EIONET Action Group on Land monitoring in Europe) was set up as a working group with members of EIONET NRCs on land cover. The group evolved as a response to the growing need to discuss solutions for a better integration of national mapping activities with European land monitoring initiatives (i.e. CORINE Land Cover) at technical level and independent from any political or industry preferences following the concept of a bottom-up approach. The objective of the working group is to elaborate a future-oriented conceptual solution that will allow the “feeding” of a European land monitoring database from existing national sources, and to integrate the upcoming approach of object oriented data modelling in the field of land monitoring. The discussion embarked on how to describe the earth’s surface in a conceptual way and how to store that descriptive information on land cover and land use in a data model.

52
1. Herbaceous Plants (Grasses and Forbs) Annual, biennial or perennial plants that do not have a persistent woody stem above the ground (in botanical term: herb). In contrary to woody plants, which have stems above ground that remain alive during the dormant season and grow shoots the next year from the above-ground parts, shoots of herbaceous plant die down at the end of growing season, so they regenerate themselves from tissues left above or under the ground (e.g. bulbs, rhizomes, tubers, seeds). 1.1.1. Graminaceous (grass-like) Grasses, or more technically graminoids, are monocotyledonous, usually herbaceous plants with narrow leaves growing from the base. They include the "true grasses", of the Poaceae (or Gramineae) family, as well as the sedges (Cyperaceae) and the rushes (Juncaceae). The true grasses include cereals, bamboo and the grasses of lawns (turf) and grassland. Sedges include many wild marsh and grassland plants, and some cultivated ones. Belonging here regardless of being wild-growing - forming natural grasslands or being component of other biomes (e.g. wetlands, forest, tundra) or cultivated – forming cropland (arable, meadow, pasture) or grass surfaces / lawn for sports / recreation. 1.1.1.1. Regular Graminaceous (grasses, cereals) Annual or perennial graminaceous plants, naturally growing or cultivated, with potential height not exceeding 2 meter. This includes most grass species and cereals (e.g. wheat, barley, maize, rice), except reeds and bamboo. EBONE approach to identifying and monitoring grassland habitats The rule based system for Annex I habitats is designed to promote their consistent identification between Member States. A direct key is not possible because the list of Annex I habitats has been produced by national experts over the years and requires scientific judgement in many cases. The structure of the system is first to identify Annex I habitats that are landscape units or habitat complexes and then to use the General Habitat Categories (GHCs) (Bunce et al., 2008, 2011) as a framework to identify other habitats from EUNIS. All Annex I habitats are characterised by some summary data. The full information for the identification of the Annex I habitats is given in the Interpretation Manual of EU27, together with additional information from Evans (2010). All Annex 1 habitats are classified in the following main classes:
1. Landscape classes and habitat complexes (consisting of more than three GHC’s) 2. Sparesly vegetated (SEA, AQU, TER or ICE) 3. Wetland (SHY, EHY or HEL) 4. Other herbaceous (THE, LHE/CHE, CHE or CRY) 5. Srubs and trees below 5 m (DCH, LCH, SCH, MPH or TPH) 6. Trees over 5 m(FPH)
Relevant grassland habitats are included in class 1. and class 4. The Agro-forestry systems Dehesas with evergreen Quercus spp. (6310), Fennoscandian wooded meadows (6530)) are included under 1. The EUNIS habitat classification is strongly related to the Palaearctic habitat classification but a novel feature of the hierarchical classification is the development of clear criteria in order to make a key for the identification of habitats analogous to keys for identification of

53
species. These criteria are however not appropriate for field mapping because many terms used e.g. fry and montane do not have definitions that can be used in the field. The classification is based on general vegetation science with additions of abiotic features. The EUNIS habitat classification gives a more comprehensive overview of European habitats (more than 2600 terrestrial classes have been identified already) than the 231 Annex I habitats of the Habitats Directive and has a more scientific approach. For the purposes of EUNIS, a ‘habitat’ is defined as: ‘a place where plants or animals normally live, characterized primarily by its physical features (topography, plant or animal physiognomy, soil characteristics, climate, water quality etc.) and secondarily by the species of plants and animals that live there’ (Davies et al., 2004). On their website it is stated (http://eunis.eea.europa.eu/habitats.jsp) that: “the EUNIS Habitat classification has been developed to facilitate harmonised description and collection of data across Europe through the use of criteria for habitat identification. It is a comprehensive pan-European system, covering all types of habitats from natural to artificial, from terrestrial to freshwater and marine habitats types. It is built to link to and correspond with other major habitat systems in Europe”. It cross-references to all EU Habitats Directive habitat types used for EU Member States. The EUNIS classification has four formal levels. Units at level 5, 6 and 7 have been added only to complete the linkage to the marine classification or to Annex I of the Habitats Directive. EUNIS major habitats (first level) .
A Marine habitat B Coastal habitats C Inland surface water habitats D Mire, bog and fen habitats E Grassland and tall forb habitats F Heathland, scrub and tundra habitats G Woodland and forest habitats and other wooded land H Inland unvegetated or sparsely vegetated habitats I Regularly or recently cultivated agricultural, horticultural and
domestic habitats J Constructed, industrial and other artificial habitats
On the first level the EUNIS habitat classification has ten major habitats. On the second level there are 54 habitats, on the third level there are 162 habitats and on the lowest level there are already more than 2400 habitats for the terrestrial environment.
EUNIS code Level EUNIS name Description
E 1
Grasslands and lands dominated by forbs, mosses or lichens
Non-coastal land which is dry or only seasonally wet (with the water table at or above ground level for less than half of the year) with greater than 30% vegetation cover. The vegetation is dominated by grasses and other non-woody plants, including mosses, macrolichens, ferns, sedges and herbs.

54
Includes semiarid steppes with scattered [Artemisia] scrub. Includes successional weedy vegetation and managed grasslands such as recreation fields and lawns. Excludes regularly tilled habitats (I1) dominated by cultivated herbaceous vegetation such as arable fields.
E1 2 Dry grasslands
Well-drained or dry lands dominated by grass or herbs, mostly not fertilized and with low productivity. Included are [Artemisia] steppes. Excluded are dry mediterranean lands with shrubs of other genera where the shrub cover exceeds 10%; these are listed as garrigue (F6).
E2 2 Mesic grasslands
Lowland and montane mesotrophic and eutrophic pastures and hay meadows of the boreal, nemoral, warm-temperate humid and mediterranean zones. They are generally more fertile than dry grasslands (E1), and include sports fields and agriculturally improved and reseeded pastures.
E3 2 Seasonally wet and wet grasslands
Unimproved or lightly improved wet meadows and tall herb communities of the boreal, nemoral, warm-temperate humid, steppic and mediterranean zones.
E4 2 Alpine and subalpine grasslands
Primary and secondary grass- or sedge- dominated formations of the alpine and subalpine levels of boreal, nemoral, mediterranean, warm-temperate humid and Anatolian mountains.
E5 2
Woodland fringes and clearings and tall forb stands
Stands of tall herbs or ferns, occuring on disused urban or agricultural land, by watercourses, at the edge of woods, or invading pastures. Stands of shorter herbs forming a distinct zone (seam) at the edge of woods.
E6 2 Inland salt steppes
Saline land with dominant salt-tolerant grasses and herbs. Excludes saline scrubland, listed under F6.8 xero-halophile scrubs.
E7 2 Sparsely wooded grasslands
Grasslands with a wooded overstorey that normally has less than 10% cover.
Source: Hill, M.O., Moss, D. & Davies, C.E. (2004b)

55

56
For each class descriptions are provided in the following manner:
COPERNICUS The Copernicus land monitoring service provides geographical information on land cover/land use and on variables related to vegetation state and the water cycle. It supports applications in a variety of domains, such as spatial planning, forest management, water management and agriculture and consists of the above four main components. Within this service work is performed to elaborate a permanent grassland layer for grasslands in agricultural use (based on 2006-2009-2012 data) at 100m resolution. The first step to identify this is to first create a binary product: permanent grassland and all non-grassland areas. This product includes “all” permanent grasslands. From that a separate layer is

57
created on agricultural permanent grasslands based on parameters that provide (indirect) information on management.

58
ANNEX 10 COUNTRY EXPERTS CONSULTED
Experts consulted to define EVG Alfonso San Miguel Peter Veen Gwyn Jones Table 1: National experts consulted for EVG
Country Expert names
Austria Andreas Bartel
Belgium Desire Palinckx and Jean Marc Couvreur
Bulgaria Yanka Kazanova/Vyara Stefanova
Cyprus Martin Hellicar
Denmark Jorg Jensen
Estonia Pille Koorberg
Finland Katja Ratikainen
France Xavier Poux
Germany Rainer Oppermann
Greece Vasilios Papanastasis
Hungary Zsolt Molnar
Ireland Patrick McGurn
Italy Maria Valentina Lasorella & Prof. Scotton
Latvia Solvita Rusina
Luxembourg Paul Faber
Netherlands Han Naeff/ Berien Elbersen
Portugal Sonia Maria Carvalho-Ribeiro
Romania Gwyn Jones
Slovakia Dobromil Galvanek
Spain Alfonso San Miguel & Guy Beaufoy
Sweden Jorgen Wissmann
United Kingdom Gwyn Jones

59
Table 2: National experts consulted for Farmland at risk of abandonment
Country Expert names
Bulgaria Liesbet Franken
Estonia Merit Mikk
Finland Hilkka Vihinen
France Xavier Poux
Greece Cosmas Costas
Portugal Cibele Queiroz
Spain Eduardo Corbelle Rico
Sweden Regina Lindborg
Table 3: National experts consulted for farmland afforestation
Country Expert names
Bulgaria Vyara Stefanova
Czech Republic Jaroslav Pražan
Denmark Erling Andersen
Estonia Pille Koorberg
France Xavier Poux
Germany Rainer Opperman
Greece Vasilios Papanastasis
Hungary Gabor Figeczky
Ireland Patrick McGurn
Italy Danilo Marandola
Lithuania Petras Kurlavičius
Poland Elżbieta Budka
Portugal Nuno Ribeiro / Fernanda Rodrigues, Guilherme Santos
Romania Andrei-Stefan Balan
Spain Guy Beaufoy
United Kingdom Gwyn Jones

60
Table 4: National experts consulted for good practice examples for RBS
Country Expert names
Denmark Prof. Brian Kronvang, Arhus University
Italy Dr. Stefan Otto Information from the IBAF-CNR (Padova) and DAFNAE -University of Padova
Estonia Kuno Kasak, MSc Department of Geography, Institute of Ecology and Earth Sciences, University of Tartu
Netherlands Ir. R.J.G.M. (Rob) Schrauwen ZLTO, Projectleader “Actief randenbeheer Brabant”

61
ANNEX 11 QUESTIONNAIRE ON ECOLOGICALLY VALUABLE GRASSLANDS (EVG) IN NATIONAL DATA SOURCES
Introduction
This questionnaire is carried out in the framework of a research project ‘Aspects of data on diverse
relationships between agriculture and the environment’. This project is commissioned by DG-
Environment6 to Alterra and the EFNCP. Within the project we need to elaborate an overview of
national data availability on 4 different agri-environmental topics. This questionnaire focusses on one
of the topics which is Ecologically Valuable Grasslands (EVG). For further details please read the
attached project summary on objectives and context.
It’s very important to understand that the starting point of this questionnaire is the broad definition of
grasslands and the proposed definition for Ecologically Valuable Grasslands we have chosen:
‘grasslands’ is all land which is in agriculture and is not permanent crops or arable and thus:
1) Excludes grasslands in which there is no (recent) evidence of human intervention (e.g.
through grazing, mowing) and cannot therefore be categorized as agricultural land.
2) Includes all uncultivated land with vegetation that is (at least until recently) grazed and/or
cut for fodder, including even when not dominated by herbaceous and non-herbaceous
species
EVG are a category of grasslands (including those with non-herbaceous species) that are notable,
within the overall context of agricultural grasslands, for their ecological value. EVG have a
spectrum of values depending on management but focus on biodiversity value and there is often a
strong relation between high biodiversity value and other services. The EVG are semi-natural and
natural grasslands that are not agriculturally-improved (e.g. through cultivation, reseeding,
irrigation and fertilisation) of long standing and species–rich (taking account of all taxa not only
higher plants).
6 Contract no. 2012/S 105-174311

62
Q1. Are you aware of any systematic national data sets that coincide, at least in part, with ecologically valuable grasslands? If yes, please specify
data source name and weblink (to report or other source if available) and short description of methodology used to compile the data set, and
completeness of the data set.
Type of (grass)land
category
Yes/No Please specify data source
(name, internet link if available)
Methodology used to gather
information* and year(s)
Is this a complete data set or are
there gaps (geographical and/or
types)? Is the data set renewed
regularly or a one-off exercise?
Annex 1 habitats
(Habitat Directive)
Grasslands as part of
HNV Farmland areas
Grasslands of national
biodiversity
importance (if different
from Annex 1 habitats)

63
Type of (grass)land
category
Yes/No Please specify data source
(name, internet link if available)
Methodology used to gather
information* and year(s)
Is this a complete data set or are
there gaps (geographical and/or
types)? Is the data set renewed
regularly or a one-off exercise?
Grassland in Natura
2000 sites
Semi-natural
grasslands
Grasslands under agri-
environmental
payments
Other………………
……………………..
*On-site data collection by surveyors/botanists (full area coverage), On-site data collection by surveyors/botanists (stratified sampling), Aerial photographs and/or remote sensing (full area
coverage), Aerial photographs and/or remote sensing (stratified sampling), other

64
Q2. Are any of the national grassland categories close to the idea of EVG (as we are defining
it)? If no, please explain matches and mis-matches with EVG. You may also comment on
our interpretation of EVG.
o Yes
o No, because ………………………………………………………………………………….
…………………………………………………………………………………………………
…………………………………………………………………………………………………
…………………………………………………………………………………………………
Q3. Do existing data sets reflect the true extent and distribution of the categories closest to
EVG (or that coincide in part with EVG) as we are defining it?
o Yes
o No, because …………………………………………………………………………………
…………………………………………………………………………………………………
…………………………………………………………………………………………………
…………………………………………………………………………………………………
Q4. Can an approximate extent and distribution of EVG be estimated from existing
categories and data sets?
o No, (please elaborate why not).………………………………….……………………..
……………………………………………………………………….…………………..
…………………………………………………………………………………………….
…………………………………………………………………………………………….
o Yes, (please elaborate how, specify categories and also datasets).………………………..
………………………………………………………………………………………………
………………………………………………………………………………………………
……………………………………………………………………………………………….
Q5. How could data sets be improved/altered in order to provide robust data on the extent
and distribution (and ideally also the condition) of EVG? E.g. creating new categories
within existing data sets, new system of data collection, adapting existing categories and
establishing new/-data collection, etc.
o No need to improve/alter existing data sets or create new data sets. Current situation
covers well EVG extent and condition. …………………………………………………..
……………………………………………………………………………………………..
………………………………………………………………………………………………
………………………………………………………………………………………………
o Improvement needed in existing data sets, namely through (specify the dataset(s) and way
to improve them) …………………………………………………………………………..
………………………………………………………………………………………………
………………………………………………………………………………………………
………………………………………………………………………………………………
o Creation of new data set(s) needed through (please specify what is required for this data
set) …………………………………………………………………………………………
………………………………………………………………………………………………
………………………………………………………………………………………………
Q6. For the current categories closest to EVG (or that coincide in part with EVG) is there
information available/collected on whether they are eligible for CAP payments?
o Yes, (please specify data source and type of information) ………………………………
…………………………………………………………………………………………..….
………………………………………………………………………………………………
……………………………………………………………………………………………….
……………………………………………………………………………………………….

65
o No, …………………………………………………………………………………………..
………………………………………………………………………………………………
……………………………………………………………………………………………….
……………………………………………………………………………………………….
Q7. For the current categories closest to EVG (or that coincide in part with EVG) is there
information available/collected on status of management/abandonment?
Yes, in (please specify data source and type of information with weblink if available ) ………
….……………………………………………………………………………………………..
…………………………………………………………………………………………………
………………………………………………………………………………………………….
o No, ……………………………………………………………………………………………..
…………………………………………………………………………………………………..
…………………………………………………………………………………………………..
…………………………………………………………………………………………………..
Can you share the relevant national data bases with us, or send us extractions of these databases
in order to illustrate their usefulness in the context of this study?
THANK YOU VERY MUCH FOR YOUR TIME!!!

66
ANNEX 12 COUNTRY SUMMARIES ON DATA AVAILABILITY ON EVG
Austria
Austria’s landscape is characterised by many natural limitations to agricultural production which is managed by many small farms. There is still a lot of semi-natural habitats and a high share of the permanent grasslands are likely to be EVG. The mapping on HNV farmland (Type 1 and 2) confirms this and the mapping is also a very good basis from which to explain the availability of different national data sources for identification of EVG (see Figure 1). The interesting aspect is that in Austria HNV farmland was mapped taking strong account of farm management practices at Austrian farms. This approach could also be taken as data contained in the Austrian IACS data were available to make this analysis. Furthermore there are good habitat mapping data available for Austria so this data also was a good source for identifying the species rich and Annex 1 semi-natural habitats.
Figure 1 HNV map of Austria 2009 published by the Austrian environment agency. The red areas are Type 2 with very high landscape structural quality. In Austria several different agricultural biotopes are registered at field level within the IACS (INVEKOS) system, as these biotopes are targeted in the AEP (ÖPUL) (see Table 1). These can then directly linked to several semi-natural habitats in the Annex 1 Habitat list, especially when additional management data are used for the allocation (See Table 1 and 2). These specific management data are also registered at field level and are very specific.

67
Table 1: Overview of permanent grassland biotope types registered in Austrian IACS because of their targeting in AEP (ÖPUL)
Table 2 Overview of relationship between Annex 1 habitats and permanent grassland types targeted in AEP (see Tble 1)

68

69
The majority of farmers participate in the AEP programme which makes the coverage very complete. For all LPIS plots many additional parameters are registered in terms of management. One very important variable that is registered in the stocking density. In Table 3 an overview is given of the biotope management combinations that were used to select the permanent grassland fields to be included in the HNV farmland indicator type 1. The selections are indicative for the type of information available in the Austrian IACS on which basis the EVG can also be mapped in Austria.
Translation:
g1: mountain meadow g2: meadow (used for cutting bedding for stables) g3: Wet to half dry basophilic grasslands g4: traditional grassland within wider forested land used for grazing with stocking density >0 <1 LSU/ha g5: wet nutrient poor grassland, used for cutting and grazing with low input management g6: meadow with limited cutting regime g7: landscape elements with regular management g8: meadow/grassland with multi-uses and limited cutting regime g9: permanent grassland with limited cutting regime g10: Permanent grassland and meadow - not used for production, eligible for subsidies g11: meadow/grassland with multi-uses with stocking density >0 <1 LSU/ha g12: traditional grassland within wider forested land used for grazing g13: Alpine grassland with with stocking density >0 <1 LSU/ha
SINUS (1996-2000) followed by BINKL (1998-2001) and LANDLEBEN (2000-2002) in which a geographical data base was developed at high resolution mapping all landscape structural elements, Land cover classification and cultural landscape types. These sources together with different vegetation and species inventory data are used for reporting under article 17 of the jabitat directive.

70
Belgium
In Belgium like in the other countries the categories of permanent grasslands that need to be reported to Eurostat are registered in the official agricultural statistics. These include the permanent grassland categories similar to those specified in FSS which implies that the rough grazing category is the only one registered that can be seen as a proxy for Ecologically valuable grassland. In the last Census of 2010 it turned out that not even 1% of the permanent grassland area in Belgium was included in this category. In LPIS the type of permanent grassland types included are:
1) Permanent grasslands 2) Permanent grasslands with grass-clover mix (>5 years) 3) Grassland with trees (>50 trees/ha) 4) Grasslands with AEP
The registration of Grassland in AEP is not an exception as all countries need to register this, but the registration of trees in grasslands is different from practice in most other EU countries, except for most Mediterranean countries. The main data source from which information can be derived on EVG is the Biological valuation map (BVM) (including the Natura 2000 habitat map)[1] which covers only the Flemish territory. For the Walloon territory there is a similarmapping project running covering all Natura 2000 sites and for information outside these sites there is the mapped information from 2 sources: The SGIB (Sites de Grand Intérêt Biologique’) databases as well as the information available through the Agri-Environmental Schemes.
The Biological Valuation Map (BVM) is a uniform field-driven survey of the land cover and vegetation of the Flemish Region. It is based on on-site data collection by surveyors/botanists (full area coverage), with preceding and sometimes a posteriori interpretation of aerial photographs. The results are put together in a map at a detailed scale of 1/10.000. Land cover classes and vegetation types are defined by an extensive list of legend units. For fast and easy interpretation the survey is also translated into a biological valuation and depicted by a colour code on the map (see Figure 1). The BVM is a complete dataset, but with variable detail and accuracy. It is based on a survey that is repeated every 12 years cycles within Natura 2000 sites and Nature 2000 habitat locations outside this network. Irregularly and uncertain updates are made outside these localities.
The results of both the Flemish and the Walloon inventories are also used for reporting under article 17 of the Habitat Directive. In Wallonia also a monitoring program has been set out with a 6-years cycle (corresponding to the Art17 reporting cycles). This program is based on a complete check (botanical surveys) of a sample of grasslands chosen inside and outside Natura 2000 sites. All this information has been used to fulfil the 2013 reporting.
[1] www.inbo.be/bvm

71
Figure 1 Example of extract of the Flemish Biological Valuation Map (BVM). The legend classes are categorized according to field based floristic and vegetation driven data collection information. Areas of faunistic importance are derived from existing species distribution databases. Per plot the coder for Annex 1 habitat is indicated Table 3: Area of semi-natural grasslands reported under article 17 (Habitat Directive) for Belgium (2012)
Habitat code Name area (Ha)
6110 Rupiculous calcareous or basophilic grasslands of the Alysso-Sedion albi 54
6120 Xeric and calcareous grasslands 69
6130 Calaminarian grasslands of the Violetalia calaminariae 51
6210 Semi-natural dry grasslands and scrubland facies on calcareous sustrates (Festuco-Brometalia) 426
6230 Species-rich Nardus grasslands, on siliceous substrates in mountain areas 4608
6410* Molinia meadows on calcareous, peaty or clayey-silt-laden soils (Molinion caruleae) 572
6430 Hydrophellus tall herb fringe communities of plane and of the montane to alpine levels 11151
6510* Lowland hay meadows (Alopecurus preatensis, Sanguisorba officinallis) 30179
6520 Mountain hay meadows 1100
Total area of semi-natural habitats 48209
*Likely to receive some fertilisation, so likely to not fully comply with EVG definition in this report Source: Flemish BVM and Walloon SGIB and agro-environmental scheme inventories
Both the Flemish BVM and the Walloon SGIB and agri-environmental field based data sources seem to be a good basis for identification of species rich semi-natural grasslands (see table 1). The Belgium agricultural Census of 2010 estimated that the total permanent grassland area is 49,968,653 ha; this implies that the EVG share would not even amount to 0.1% of the grassland area. This estimate is only a first estimate as the final assessement

72
requires a link to management information on these grasslands. At this moment this information is not connected. The expert consulted already indicated that that certain types (e.g. 6410 and 6510) are likely to still receive some fertilisation and many of these grasslands should therefore not be allocated to the EVG area in Belgium. In 2014 for Flanders it is planned to release a simplified typology using the BVM data in which categories of semi-natural grasslands will be displayed separately which match closely to the definition of EVG. These categories will be elaborated from the perspective of floristic diversity selecting those locations in which species occur that are indicative for extensively managed agricultural grasslands. An overlay between the BVM and the LPIS land use data would support the further identification of EVG as it can provide information on whether the site is really in agricultural use and in what type of grassland it is reported e.g. rough grazing, permanent grassland only mowed or only grazed or a permanent grassland and meadow no longer used for production purposes and eligible for the payment of subsidies. If it is not covered by a LPIS class it can be questioned whether it is a managed grassland at all. Literature: Louette G., Adriaens D., De Knijf G. & Paelinckx D. 2013. Staat van instandhouding (status en trends) habitattypen en soorten van de Habitatrichtlijn (rapportageperiode 2007-2012). INBO.R.2013.23, 46 pp + bijlagen.
Bulgaria
Within Natura 2000 areas all Annex 1 habitats, including grasslands, were mapped by surveyors in 2012. In addition for the whole of Bulgaria (inside and outside Natura 2000) the grasslands have been mapped in 2001-20047 . As for the latter inventory the limitation is that the PINMATRA grasslands inventory did not have a full area coverage and was a one-off exercise. For Natura 2000 sites there is currently an on-side full area coverage data collection inventory in process executed by botanists. The results are not yet publicly available. As for the Annex I semi-natural habitats identification and status reporting for Article 17 that Bulgaria needs to do for the first time in 2013 it is likely that the data from the cadastre with restituted land ownership are used. At least this is the main database that the Ministry of Environment (MoEW) uses normally. What is exactly contained in this database in relation to EVG is not known as the report has not yet been published but it is likely to integrate the Annex I data inventories done inside the Natura 2000 sites and the PINMATRA grasslands inventory.
7 Meshinev T, Apostolova I, Georgiev G, Dimitrov V, Petrova A, Veen P. 2005. Grasslands of Bulgaria. Final
report on the National Grasslands Inventory Project – Bulgaria, 2001–2004 (PINMATRA/2001/020).

73
HNV farmland is recorded in LPIS in Bulgaria. This is done by adding the HNV qualifier to the physical blocks8 in LPIS using information derived through remote sensing and integrating GIS layers of different biodiversity datasets, including Corine Land Cover. From the former it becomes clear that the data set that is currently most suitable to identify the current extent and location of EVG in Bulgaria is the HNV grasslands layer in LPIS. It is managed by MAF and incorporating the different GIS biodiversity data available in Bulgaria. However although the estimates sound reasonable for the overall area and they are based on improved high resolution satellite datasets , they are not verified on the spot and the actual location of HNV grassland (i.e.EVG) seems to be inconsistent. Furthermore the agricultural area included in LPIS is limited and is likely to exclude a very large part of the EVG according to the definition presented in this report (Chapter 3). The reason behind this is extensively described in the country report for Bulgaria in Beaufoy et al. (2010). In the agricultural census data more agricultural land is covered then in LPIS as the definition of permanent grasslands used is broadly interpretable: ‘permanent grasslands are natural meadows and low productive grasslands of a holding which are cut or grazed by the animals’. Area not used for production purposes but maintained in good agricultural and environmental condition is also included here’9. Given the definition it seems like the permanent grasslands registered in the census entirely cover low productive grasslands. However, since there is only one permanent grasslands category included in the census it is likely that this both includes intensive and extensive permanent grassland types. To establish a reliable picture of the overall location and extent of EVG in Bulgaria there is a need to improve existing data sets. Improvements can be made to the current LPIS-HNVF data set by including all types of HNVF and verifying them on the spot. The same needs to be done with the Natura 2000 Annex I datasets by improving the on-side field data collection adding specific attention to the identification of EVG in terms of indicator species present and status of improvement. These improved Natura 2000 data should be integrated with the improved LPIS HNVF data set. For EVG outside Natura 2000 a whole new data base needs to be created that does not follow the limiting definition of EVG as is applied in LPIS. This however cannot be expected to happen realistically on the short run. Now most of the EVG targeted by direct payments and AEP are in Natura 2000 sites. Most of the EVG outside these Natura 2000 sites are not included in any existing database.
Cyprus
In Cyprus the data on location and extent of Annex 1 grassland habitats are limited both in geographical coverage and scope. Because of this there are large areas of EVG, and
8 A physical block in LPIS is a continuous area bounded by permanent topographic features which has an
identical dominating land use and may comprise one or more parcels of farmers.
9 The definition comes from the Ministry of Agriculture and Food (2012). Census of agricultural holdings in Bulgaria in 2010. Bourgas District. Main results. http://www.mzh.government.bg/MZH/Libraries/Agriculture_Census2010/202-Publication-Bourgas.sflb.ashx

74
especially non-herbaceous scrublands, that are not covered by data nor classifications used. This is certainly the case for the permanent grasslands registered by the statistical office in the agricultural census. The Cyprus Farm structure survey (2007) recorded 1,900 ha of ‘permanent pasture and meadows’ and no distinction was made in other permanent grassland classes. Article 17 reporting was last time based on the LIFE third countries mapping data10. This was done in 2000 and results are outdated an incomplete in terms of area coverage. There is now an effort to improve habitat mapping and this is led by the Forestry department.
Denmark
In Denmark the current on-going HNV farmland mapping exercise illustrates the available data sources. This map is being developed with an expected launch in the beginning of 2014 to be used in the rural development programme 2014-20. The map will show where the most valuable grasslands are, and make it possible to ensure the grazing or cutting of these areas in case there are not enough funds for all the valuable grasslands. Overall it is clear that the landscape in Denmark is dominated by intensive farming, leaving the primary habitats for open land flora and fauna to be spread out on not more than 240.000 small areas with heath, dry grassland, meadow, bog and streams/lakes. A majority of these are protected areas that have been cultivated, fertilized or drained, and have therefore lost their value as a habitat for threatened species. Other areas can be valuable habitats even though they might be very small. If the HNV indicator is to target biodiversity in Denmark it is an important condition that the HNV indicator has some flexibility built into it and that it encompasses the most valuable habitats for plants and animals. Sinds the available data bases identifying semi-natural habitats do not have a complete country coverage tt is a special challenge to identify HNV and even more the EVG addressed in this report. Now a complete country wide spatially detailed overview of the most vulnerable and threatened species is lacking. The current elaboration of the HNV map shows that in order to identify HNV farmland and also semi-natural grasslands in the definition of EVG requires using different data sources. Data on extensive farming from the national statistical sources is limited as there is only one permanent grassland category registered. In addition there is also a category called Set-aside with grass, but this category is very insignificant (see Table 4). A rough grazing class is not registered separately. The definition of grassland is taken very strict as it cannot be grassland if more then 10% (crown cover) is covered by woody plants (tress and shrubs). In other words grazed heathlands and other habitats are excluded as agricultural and included in the forest land use category.
10 LIFE Third Countries project : Special Arwas of Conservation (Directive 92/43/EEC) in Cyprus. Ministries of
Agriculture and Interior, Cyprus. 2003.

75
Table 4 Total agricultural area (ha) and permanent grassland area in Denmark
1994 2004 2011 2012
Grass and clover in rotation 330 370 196 375 329 135 326 797
Grass and green fodder in rotation, total 452 575 431 941 566 426 569 415
Permanent grass land out of rotation 316 668 172 536 186 652 200 413
Set aside with grass 0 196 972 4 367 5 018
Total agricultural area 2 691 174 2 645 304 2 639 944 2 644 631
Set aside, total 259 356 207 914 4 367 5 018
Source: Statistics Denmark , www.statbank.dk/AFG1 The Danish LPIS and the registry system for farms (GLR)11 also collects information on permanent grasslands. For this category additional valuable information that helps to identify extensive grassland categories is collected. The additional information that is also registered per permanent grassland use is:
1) Permanent grassland under the Single Payment Scheme (SPS) with the land-use code 250 is grassland with very low yield (and low input: Nitrogen <25 kg/N/ha). It comprises approx. 11.000 hectares.
2) Grassland under the AES12 . Approx 70.000 hectares are for the time being (2013) grazed or mowed (mostly grazed) under the AES.
3) Additional information is also registered about nature area status and also organic farming status. Such status can be taken as an proxy indicator for low intensive management and is therefore used to identify the farmlands with likely low intensity management in the HNV farmland indicator approach.
The third type of data available relates to habitat mapping information relevant for identifying the semi-natural habitats that need to be reported under article 17 of the Habitat Directive. The most relevant Danish dataset is the “Naturbeskyttelse og Natura 2000”13 in which semi-natural habitats inside Natura 2000 sites are mapped. The relevant habitat types are 1 = fresh meadow, 2 = heath land, 3 = bog, 4 = dry grassland, 5 = coastal meadows and all together cover approximately 340.000 hectares of which approximately 60.000 ha are known to be grazed or mowed (have registered management in LPIS). The database is being up-dated continuously and is based on interpretation of aerial photographs and on-site field visit data collection. A limitation of this data set is thus that is excludes semi-natural grasslands outside Natura 2000 sides. These need to be identified additionally using the data from LPIS as described above.
11 AgriFish Agency, The Ministry of Food, Agriculture and Fisheries
12 This can be acquired by contacting the Ministry of Food, Agriculture and Fisheries: http://en.fvm.dk/
13 A data set containing protected semi-natural grasslands can be downloaded from the data portal Danmarks Miljøportal: http://arealinformation.miljoeportal.dk/distribution/ The data set relevant can be found under the data category called “Naturbeskyttelse og Natura 2000” and the specific data set containing the semi-natural grasslands is called “Beskyttede naturtyper”. The habitat types relevant are (found under the field heading NATYP_KODE): 1 = fresh meadow, 2 = heath land, 3 = bog, 4 = dry grassland, 5 = coastal meadows (6 is lakes). The updated version will be available for download during 2014).

76
In conclusion it is clear that the lion-share of semi-natural grasslands overlapping with the EVG in Denmark are well registered in the can be derived from the “Naturbeskyttelse og Natura 2000”. The relevant grassland categories registered in this data base are species rich. To establish their management status the combination of these grasslands with LPIS categories permanent grasslands with low yield status (code 250= Nitrogen <25 kg/N/ha) is possible, but only for the semi-natural grasslands registered in LPIS. This implies that some EVG they may be extensively managed and species rich within Natura 2000 sites are missed. The same applies for EVG outside Natura 2000 sites. These are not included in the “Naturbeskyttelse og Natura 2000” so their species presence status is not known exactly. Part of these can be identified however using LPIS and selecting permanent grasslands with additional qualifiers. The most relevant qualifiers are low input (code 250) and/or under AEP, and or have a nature area status. The permanent grassland with qualifier ‘ organic farming’ are also likely to overlap partly with EVG, but a full overlap cannot be assumed as it cannot be established whether they are of long standing and species rich unless they are of course part of Natura 2000 and covered by one of the 5 categories of semi-natural grasslands in the “Naturbeskyttelse og Natura 2000”.
Estonia
In the Estonian Environmental Register (Estonian Nature Information System, EELIS14) information is included on Estonian Nature including information about Annex 1 habitats. Regarding EVGs, access to detailed information of the EELIS will allow to make GIS queries among other data also about following layers: a) General static information about SPS/SCI as reference point for 2004 after EU
accession b) All support eligible semi-natural habitats which are related to species protection sites,
protection areas, limited conservation areas or Natura 2000 sites (~74 000 ha, non-static online information)
c) Semi-natural habitats which are located outside of protected areas (~5800 ha, non-static online information)
d) Semi-natural habitats (within and outside of Natura 2000 network, partly overlapping with information in data layer “b”), most recent information from 2009, layer updated irregularly based on projects) related to inventory made by Estonian Semi-natural Community Conservation Association (ESCCA), ~79 000 ha
e) Natura 2000 semi-natural habitats which are receiving agri-environment semi-natural habitat support for maintenance in RDP 2007-2013 framework (~26 700 ha, updated yearly)
Most of the data included in EELIS was derived through on-site data collection by surveyors/ botanists (full area coverage). A main inventory and mapping of semi-natural habitats in Estonia (including Annex 1 habitats) was done in 1999-2001 together with preparations for
14 General GIS information about special protection sites (SPS) and sites of community importance (SCI) is
partly made available for public at: http://register.keskkonnainfo.ee/envreg/main#HTTPpaaZR4K7qV4JRCQgsN3RJ3LMYFFkZ3 and also at the geo-portal of Estonian Land Board: http://xgis.maaamet.ee/xGIS/XGis.

77
Natura 2000 designation process. Then there were several up-dates and separate inventories with different purposes:
The volume of annual re-inventories is about 3 000-5 000 ha of semi-natural grasslands. Originally information about semi-natural habitats was collected into a database of Estonian Semi-natural Community Conservation Association (ESCCA), based on that work a digitalised database was created into EELIS regarding semi-natural habitats
In the framework of RDP AE support for management of semi-natural habitats information in EELIS data base has been updated based on the on-the-spot inventories and controls of the Environmental Board. Some inventories have been carried out also from national budget (2007-2009, 2013) and technical assistance measure budget of RDP (2010-2012).
Data have been updated also based on information received from inventories carried out to compile management plans.
For adequate data sets it is planned to carry out re-inventories so that each area (data layer “b” in EELIS) will be updated in 7 years.
Information about semi-natural habitats outside of Natura 2000 areas is however incomplete. It is updated irregularly and is partly out of date (e.g. inventories made already more than 10 years ago). Also EELIS data layer “d” may include information about sites which are not semi-natural habitats (e.g. some forest types).
The interesting thing is also that for the semi-natural habitats information is also collected about management (grazing, cutting grass) and this is alse include in EELIS .
There is also a separate layer in EELIS for Natura 2000 semi-natural habitats which are receiving agri-environment (AE) semi-natural habitat support for maintenance in RDP 2007-2013 framework (~26 700 ha, updated yearly). It is important to notice that all areas, which applied for RDP AE semi-natural habitat support for maintenance were automatically excluded from receiving any other hectare based CAP support in Estonia, therefore this is why the semi-natural habitat layer is being kept separately (used by Paying Agency). Areas outside Natura 2000 sites are not included however as they cannot apply for AES (yet).
Officially HNV farmland areas are not defined in Estonia and no “data layer” exists in reality about the HNVF areas (including HNV grasslands). Despite this, in RDP 2007-2013 context semi-natural habitats (both within and outside Natura 2000 network, data layers of EELIS “b”, “c”, “d”) are considered HNV farmland areas. Currently new 1x1 km grid-cell based approach is being developed for defining HNV farming areas in Estonia where apart from information available in EELIS about semi-natural habitats (layers “b”, “c”, “d”, “e”) also other permanent grasslands are being valued as areas with less intensive farming compared to arable farming. Unfortunately no exact location at parcel level of permanent grasslands is available. This is because the general GIS information in LPIS and the statistical information about grassland management in IACS is not linked at the parcel level but only at the farm level. In spite of this the combination of IACS and LPIS information regarding permanent grasslands location and management have still been combined to separate the HNV farmland grids from the non HNV farmland grids.
Overall it means that for Estonia the most reliable and comprehensive information about EVG location and extent is available in the EELIS (Layer “b”) which is equivalent to the SPS

78
layer of Natura 2000 network (reference year 2004). However for EVG outside Natura 2000 there is less reliable information available as for these areas the habitat inventory data are not updated regularly or information is out of date. This implies that for creating an up-to-date reliable data source on location and extent of EVG exiting systems in EELIS need further up-dates. Updating data sets regularly for all valuable grasslands both within and outside of Natura 2000 network is needed. Currently the Environmental Board is carrying out a “complete” type of inventory of Natura 2000 habitats which produces information for the total area. Since this is rather time-demanding and costly they are thinking of establishing a new system where 2 types of inventories could be carried out – one (done horizontally) for estimating the area from the “eligibility” point of view. The other for assessing the values, success of restoration and management efforts and changes of habitat status (done more locally and in permanent monitoring areas). A complicated issue in Estonia is that of eligibility of semi-natural areas which is a threat for their existence as without CAP support they are likely to be abandoned more quickly. The main issue at present is that quite a significant part of valuable semi-natural habitats is or has been ineligible for direct payments and a range of other area-based support (e.g. rough estimations state that only ~40% of semi-natural habitats in Natura 2000 network overlap with CAP eligible field parcels. Furthermore, no concrete information is available how much of that overlapping area actually has applied for CAP support but some estimations refer to only 10% of the eligible area received Single Payments (SAPS). For the situation outside Natura 2000 there is even less information available about eligibility. In other words this also means that the area of farm land registered both in EELIS and by the National Paying Agency is incomplete in terms of full semi-natural grassland (and EVG) coverage. How incomplete is difficult to tell.
Finland
In the Finish agricultural statistics the permanent grasslands are reported as one class and are defined as ‘At least 5 years old meadows including natural meadows, pastures and grazing grounds’. This class amounted to only 1.4% (31600 ha) of the total utilised agricultural area while the class ‘ Grassland under 5 years’ covered to 28% (651100 ha) of the total utilised agricultural area. This implies that a broad definition of permanent grassland is applied including all grazed land and more importantly that the permanent grasslands is really permanent and likely to be of relatively undisturbed status (see Table 4). In addition there is also a separate class reported in the agricultural statistics which is all fields ‘ in nature management’ (see Table 5) . To which extent the permanent grasslands overlap with the fields in Nature management cannot be assessed from this statistical source, but it becomes clear that this area amounts to 6% (143100 ha) of the utilised agricultural area in 2013. The overlap between the permanent grasslands and this category can only be derived directly from the LPIS source (see Figure 2).

79
Table 5 Land use and permanent grassland classes registered in the Finnish agricultural statistical survey
Utilized agricultural area in 2013 - forecast 27.6.2013
2013 2012 Change
Crop 1 000 ha % 1 000 ha % 1 000 ha %
Cereals 1,179.9 51.7 1,153.6 50.5 26.3 2.3
Grasslands under 5 years 651.1 28.5 659.9 28.9 -8.8 -1.3
Other crops 143.2 6.3 167.0 7.3 -23.8 -14.2
Cultivated area, total 1,974.2 86.5 1,980.5 86.7 -6.3 -0.3
Fallow area 272.0 11.9 267.3 11.7 4.7 1.8
Fallows3) 79.2 3.5 75.9 3.3 3.3 4.3
Nature management fields4) 143.1 6.3 145.8 6.4 -2.7 -1.8
Green manure 49.7 2.2 45.5 2.0 4.2 9.3
Cultivated area and fallow, total
2246.3 98.4 2247.8 98.4 -1.5 -0.1
Grasslands at least 5 years5) 31.6 1.4 31.9 1.4 -0.4 -1.1
Other 5.5 0.2 5.5 0.2 0.1 0.2
Utilized agricultural area, total 2283.31 100 2,285.2 100.0 -1.9 -0.1
3) Includes green, stubble and bare fallow
4) Includes all nature management fields
5) At least 5 years old meadows including natural meadows, pastures and grazing grounds
The data is based on the situation of the Rural Business Administration Information Systems on 26 June 2013.
Source: OSF, Utilized agricultural area
In addition to the statistical and LPIS information there are several spatial data sources that are useful for the identification of EVG. For the identification of Annex I habitats an inventory is done within conservation areas by Metsähallitus Natural Heritage Services15. This mapping is based on field survey and remote sensing. The data collection started in 2002 and is still on-going. The limitation of this data set is that it only covers conservation areas, furthermore not all privately and state owned conservation areas are mapped yet. Although work is still on-going for some years, the earliest mappings need updating and since the mapping is done once, the changes in habitat condition could not yet be detected. Another valuable but incomplete and somewhat outdated inventory was done in 1990 of semi-natural grasslands based on field surveys. It resulted in the identification of so-called ‘traditional rural biotopes’ which were grasslands categorized in 3-levels: nationally valuable, regionally valuable and locally valuable.
15
http://www.metsa.fi/sivustot/metsa/en/NaturalHeritage/SpeciesandHabitats/CollectionofDataonHabitats/Sivut/BasicDataonNaturalHabitatTypesinProtectedAreas.aspx

80
Figure 2 Overview of farmland management indicators from LPIS a) Permanent pastures, b) areas with special measures for managing traditional rural biotopes and c) areas with special measures to enhance rual biodiversity
Source: National HNV farmland report 2006. (http://www.mmm.fi/attachments/mmm/julkaisut/muutjulkaisut/5gKZU2Rcu/julkaisu_luontoarvoiltaan_arvokka
iden_maatalousalueiden_identifiointi_suomessa.pdf)
There are also several data sources providing an overview of different types of endangered species presence and abundance. An overview of the species richness information as used to identify HNV farmland areas in Finland is given in Figure 3.

81
Figure 3: Endangered species in Finland: a) butterflies, b) birds and c) vascular plants. Dark coloured areas have the highest species abundance
Source: National HNV farmland report 2006. (http://www.mmm.fi/attachments/mmm/julkaisut/muutjulkaisut/5gKZU2Rcu/julkaisu_luontoarvoiltaan_arvokka
iden_maatalousalueiden_identifiointi_suomessa.pdf)
Based on described data sets (in the former) additional work was done to:
1) Identify HNV farmland areas. This was done by the Finnish Environment Institute who made a report of the analysis in 200616. It was a response to the HNV-JRC approach of identifying HNV farmland areas at EU wide level using Corine Land Cover and Natura 2000 area information. The EU wide approach needed improvement as it included much land that was not in agricultural use. In the Finish approach a combination of the 1990 semi-natural grassland inventory data with data on species richness (vascular plants and birds) and areas under environmental support was
16
http://www.mmm.fi/attachments/mmm/julkaisut/muutjulkaisut/5gKZU2Rcu/julkaisu_luontoarvoiltaan_arvokk
aiden_maatalousalueiden_identifiointi_suomessa.pdf

82
used. The Natura 2000 layer used at EU level did not add much to the identification as the national inventory showed that practically no agriculturally managed lands are situated within Natura 2000 sites. Although the national inventory resulted in a significant improved identification of HNV farmland areas in Finland it can still be considered as incomplete because it is very much based on the national inventory of semi-natural grasslands which was done in 1990s and is therefore outdated.
2) Make a national assessment of threatened habitat types is Finland17, so called traditional rural biotopes (see Figure 4).
The national inventory of HNV farmland did illustrate that many of the most valuable traditional habitats with high species richness overlap with the permanent grassland areas (see Figure 4). Overall we can conclude that there are several different data set available in Finland that are useful for identifying EVG in Finland. However, it is also clear that there is no single database on which basis EVG can be fully mapped. The suitable data bases contain partly out-dated information and do not cover the full territory of the country particularly those areas outside Natura 2000. In order to come to provide for an accurate mapping of EVHG improvements are needed in existing data sets through:
update in the data set of National inventory of semi-natural grasslands in Finland
further completion of the data collection in conservation areas (habitat typing of conservation areas)
data collection from Natura2000-areas outside conservation areas and in other privately owned areas
combining several currently separated data sets at parcel level using at least the following data sets: habitat typing of conservation areas, national inventory of semi-natural grasslands, HNV areas, agri-environment payment areas (special support areas and permanent grasslands)
17 http://www.ymparisto.fi/luontotyyppienuhanalaisuus, https://helda.helsinki.fi/bitstream/handle/10138/37932/SY%208%202008%20Osa%202%201%20Johdanto.pdf?
sequence=2, https://helda.helsinki.fi/bitstream/handle/10138/37930/SY%208%202008%20Osa%201%20sivut%201-
110.pdf?sequence=6

83
Figure 4 Overlap between Corine permanent grassland (code 231) and traditional rural biotopes (identified in the 1990 national inventory of semi-natural habitats). Most valuable biotopes are found along rivers. (The different dot size represents different types of rural biotopes).
Source: National HNV farmland report 2006. (http://www.mmm.fi/attachments/mmm/julkaisut/muutjulkaisut/5gKZU2Rcu/julkaisu_luontoarvoiltaan_arvokka
iden_maatalousalueiden_identifiointi_suomessa.pdf)
France
In France the EVG cover very diverse habitats and their identification requires the use of different data sources. If the simple assumption is made that EVG are equivalent to low productive ("Surface Toujours en Herbe peu productive") their extent can be estimated from the 2010 agricultural survey results. These indicate that 2 million hectares are under low

84
productive permanent grassland/pastures and 6.3 million hectares under productive permanent grassland. However, the definition of ‘low productive’ in the French agricultural survey is uncertain and cannot be assumed synonymous to unimproved as is how EVG are defined. In the agricultural survey low productive is based on a yield criterion (< 5 T DM/ha) which is a very rough figure for the whole of France. Such a rough threshold will probably include too many Mediterranean French grassland in the EVG and may at the same time exclude some Northern French grasslands which may actually be EVG. The latest survey on agricultural practices on grassland18 (2006) indicates that one third of the productive permanent grasslands are not fertilised with artificial fertilisers (Enquête pratiques prairies permanentes 2006) in the Northern regions of France, it can be estimated that at least 2.2 million ha of permanent productive grassland are semi-natural (not fertilised), and probably more if it is assumed that grasslands in Southern France grassland are less fertilized than in the North. Thus a total of 4.2 million ha or more of semi-natural grassland/pastures can be assumed to correspond to EVG. So the EVG share based on absence of artificial fertilisers even leads to doubling of the EVG area then when a threshold of 5 ton DM/ha is used. TERUTI is another interesting source of information on land use which is a stratified sample based approach using aerial photographic interpretation and field survey data collection. It is comparable to LUCAS but applied at much denser grids covering the whole of France and up-dated regularly. Relevant grassland types coming near to the definition of EVG are grassland with traditional orchards, and summer or communal grasslands and extensive permanent grasslands. The definition of low productive follows the same logic as in the agricultural census and is therefore also limiting. Another feature of the French agricultural census and TERUTI is that they use a definition of grasslands that is much broader then in the EC definition (Commission Regulation EU No 796/2004) for permanent grasslands. Because of this both databases include Moorland and land with shrub vegetation beside herbaceous forage. For the potential of combined French data sources to identify grasslands that come near to the definition of EVG in France the study by Solagro (2006)19 is very illustrative. In this study a likely hood score for HNV farmland (Nuts 5 i.e. commune level) was elaborated scoring on amongst others extensive practices. These were identified from the census and TERUTI using variables at Nuts 5 level on stocking densities and the areas of grassland with traditional orchards, summer or communal grasslands and extensive permanent grasslands. The assessment was done using 'old' statistical data from the census (2000). It is likely that new census data (2010) become available soon in order to up-date the identification. Data layers use are relevant for identification of extensive grasslands in France at Nuts 5 level. 18 This survey is based on a sample of representative grassland types. While it gives indication on the % of
grassland under different management regimes, it does not give the actual size of the sample. Such survey is undertaken at regional (NUTS 2) level. The last one dates 2011 but has not been released yet.
19 For details see report at: http://agrienv.jrc.it/activities/hnv/docs/pdf/HNV_final_report_France.pdf

85
In the French LPIS there are the following type of permanent grasslands registered:
Permanent grasslands devoted to hay sold off farm
Permanent grassland
Alpine and summer mountain pastures
Heather and rangelands
Ligneous rangeland (for Corsica only) For the first 2 categories it is clear that no distinction is further made between intensive and or improved and extensive/unimproved grasslands and species richness. For the later 3 categories it is clear that these are unimproved grasslands. Whether these are also species rich cannot be known for sure as additional field surveys are required and or overlays are needed with existing ecological survey results. However, these last 3 categories are likely to cover a large area share of the EVG in France. For the reporting of semi-natural habitats under the article 17 the ZNIEFF” (Zones Naturelles d’Intérêt Ecologique, Floristique et Faunistique) database provided the information for 2008 report. This data source rough location and distribution of main Annex 1 habitats. However the sources are old, based on data collection that has taken place more than 12 years ago. Up-dates must be in process, but no information is available at this moment. The Agricultural Census (Recencement Agricole, previously Recencement Général Agricole) implemented each 10 years (approximately - 1979-1988-2000-2010) forms the basis of the most accurate and comprehensive survey on agricultural land use. Annual Agricultural Statistics and this French FSS are updated regularly and it therefore seems most efficient to improve these data sets in order to identify EVG in France more accurately. Data on "low productive grassland" are collected in this census and covers the most extensive spectrum of the EVG as it includes non herbaceous pastures. However an improvement should be made in the data collection to distinguish the productive (improved) grasslands from the low productive (unimproved) grasslands. An improvement was introduced in 2010 in the questionnaire by adding a category "farmland with no use of synthetic fertiliser". This however is too general as there no breakdown of sub-categories in this general category; e.g. between permanent grassland, temporary grassland and other crops, while it is likely that the majority of such area shall be permanent grassland in the first place. An easy improvement to these data would therefore be to specify the area of permanent grassland in the "farmland with no use of artificial fertiliser". Another improvement, but probably more demanding would be to create a new category of "permanent grassland where there is no use of artificial fertiliser and organic fertilisation or below a certain threshold which is equivalent to a very low density grazing regime. Finally it is recommended to create a new category of "natural grassland" which is generally known in farming practice and is synonymous to "non seeded with a limited level of organic fertilisation through extensive grazing" .

86
Germany
The definition for EVG given in the questionnaire does not completely meet the current understanding respectively the scientifically significance of species-rich grassland in Germany (in Central Europe). In contrast to the given definition EVG may be (or even partly normally are) agriculturally-improved mostly by being fertilized to a small amount from time to time: normally there was / is put a small amount of solid manure (sometimes also small amount of liquid organic manure) on the meadows every 2-5 years. This applies not only to “normal” semi-improved grasslands but also to a large extent to FFH-meadows (Habitat Directive) (e.g. habitat types 6510 (Lowland hay meadows) and 6520 (Mountain hay meadows)). These meadows often (not always) are richer in species than meadows which have stayed without fertilizer for many years. However, there is no differentiation possible between slightly fertilized and completely unfertilized meadows (e.g. 6510 and 6520 types), unless one performs an exact monitoring on the grassland management every year. So even for the protected habitat types 6510 and 6520 this differentiation is not available. Knowing that the slightly fertilized lowland and mountain hay meadows are included the total extent of the semi-natural grassland vegetation is estimated at 474,000 ha (Sachteleben & Behrens 2010)20, which is about 3% of the total UAA and about 10% of all the permanent grassland in Germany. The most important habitat types in terms of area are lowland and mountain hay meadows (6510 and 6520), which account to 37% of the area of all semi-natural habitats; calcareous grasslands (6210, 6170) 14%; heathlands (4010, 3030, 4060) 11%; and tall herb communities (6430) 8%. However, there are other species-rich grasslands in Germany which are not mapped as habitat types but which are also semi-natural or form transition habitats between semi-natural grasslands and species rich other grasslands. This estimate of the EVG area in Germany is derived from the the FFH-data (habitat Directive) which is or should be renewed every 6 years. The data collected in this database is used for the article 17 reporting on semi-natural habitats. The data is collected separately in every federal state in Germany. The most recent FFH-mappings or biotope mappings are from 2007, partly rely on more or less “old” (from the 1980ies and 1990ies). Partly they derive from current on-site-mappings (mainly 2004 - 2007). The current mappings are designed different in the federal states and partly even within the federal states (e.g. partly only grasslands within the N2000 boundaries have been mapped, partly also all other grasslands have been mapped in respect of the meeting of FFH-criteria. Overall it can therefore be concluded that the dataset has limitations, both in terms of age of the data recording and in terms of consistency in coverage of grasslands in different federal states.
20 Sachteleben, J., Behrens, M. (2010): Konzept zum Monitoring des Erhaltungszustandes von
Lebensraumtypen und Arten der FFH-Richtlinie in Deutschland. BfN-Skripten 278, 544 pages.; Download under http://www.bfn.de/fileadmin/MDB/documents/service/skript_278.pdf

87
The extent of HNV grasslands (species-rich grasslands) in Germany covers 5.7 % of the farmland in Germany and thus is twice as high as the area estimates for semi-natural grassland habitat types from the FFH-data . This is not a surprise as HNV farmland type 2 and 3 also include more improved farmlands that are not necessarily semi-natural, but do harbour important farmland species. The estimate of the HNV farmland area is derived from the German HNV farmland monitoring and is an ongoing process; there is an update every 1 - 4 years in all federal states. However, this data set is a sample plot approach which reflects the extent and the quality of the EVG but it is not a complete area based mapping. The HNV farmland monitoring has been organised by the Federal Agency for Nature Conservation (BfN-Bundesamt für Naturschutz) in cooperation with the Federal State agencies and with private biologists, institutes or companies (who do the fieldwork). The data are gathered through field surveys of some 900 sample plots nationwide, which were selected at random, and consist of 100 ha in size each and a minimum of 5% of open land. Since the occurrence of HNV features depends heavily on land use and local ecological conditions, the random sample is based on a two-fold stratification (Heidrich-Riske 2004); actual land use (6 landcover categories) and 21 ecoregions. In a second step the field mapping methods were developed. The HNV quality of the land use types (3 quality categories of HNV exist) is evaluated by using specific sets of indicator taxa, which can indicate floristic diversity of the land use type accordingly. While most land use types lists are valid for all Germany, the grassland regionalised lists are also provided, due to the differences of grassland communities within Germany. As a last step the extrapolation of the indicator value is carried out. Due to harmonised surveying methods, extrapolation at the national level as well as at the level of the countries is possible. Information of farm management is not used for the identification of the HNV farmland types. This is also information which is very difficult to access as all 16 federal states of Germany (Bundesländer) are responsible for the collection of the agricultural statistics and they also manage their own IACS/LPIS system. It is therefore also very difficult to assess to which extent the current EVG in Germany are eligible for CAP payments. Since the HNV farmland monitoring has been done by a sample plot approach and the data on eligibility of CAP payments are collected in other institutions, there is no possibility currently to make an overlay of both data sets. However, in Germany most of the EVG are eligible for CAP payments except those parcels / areas which are under nature conservation management since long time (and where for this reason farmers never have applied for payments). This is a minor part of the EVG, estimated at an extent of 1 - 5 % of the EVG (personal estimation by German expert). Overall it can be concluded that on the one hand there is no need to improve the existing data sets as the current monitoring in the FFH and the HNV farmland inventory covers well the EVG extent. However, it is clear that the estimates based on the FFH-data are less reliable, given limitations discussed above. As for the grasslands identified through the HNV farmland inventory one can conclude that the quality of the survey data is good and recent. However, it covers a wider spectrum of grasslands then the EVG as it also includes grasslands that are improved, although not intensively managed (e.g. some HNV type 2 and 3). A further collection of management data to establish the level of improvement would be necessary to separate the EVG from the rest of the HNV grasslands.

88
Greece
In the Greek definition there are many ‘true’grasslands registered that fit in the broad definition of permanent grasslands as proposed in chapter 3 of this study. There are important areas of semi-open grasslands (‘true’ grasslands) which have non-herbaceous plants contributing no more than 15% to the vegetative cover and phrygana (open dwarf shrub communities). Shrublands and forested grasslands are not falling to the idea of EVG unless they are wide open (shrub or tree cover is less than 40% of the total vegetative cover). Based on research studies in Greece, the more open shrublands and forested areas are, the higher plant diversity they have. However, for keeping grasslands open and diverse grazing management is not enough unless it is combined with cutting of woody species for firewood or with careful burning, particularly in shrublands and forested grasslands. Burning is a traditional practice in the Mediterranean grasslands, although it is not always applied judiciously. As for data sources on permanent grasslands, particularly EVG, there are several databases available. Annex 1 habitats were identified by scientific teams of specialists from Greek Universities and Research Institutions based on published information and field work from 1999 to 2001. Plant collections (15,000) were done and plant species were classified according to the Braun –Blanquet method. All results have been integrated in a database. Altogether 237 terrestial habitats were identified. Of those, 59 were considered by Papanastasis and Ispikoudis (2012) as grasslands, namely 17 true grasslands, 5 phryganic areas, 12 shrublands, 17 forested grasslands (silvopastoral systems) and 8 wet grasslands. However, this was a on-off exercise and therefore the data cannot be expected to be regularly renewed or updated. Those habitat types identified as belonging to grasslands is not a complete data set because they cover an approximate area of 1.2 million ha out of a total of about 5 million ha which are registered by the National Statistics as communal grazing lands (see next). In comparison to that total it is doubtful whether the share of Annex 1 grasslands makes out such a small share of the total communal grazing land. Apart from the habitat types which were identified in a systematic way, all the other protected areas of the Natura network were designated by the Forest Service and other national and regional agencies or local communities based on outstanding natural features over a long time period that started in 1950s but culminated in 1980s and 1990s. This data set may also contain valuable information on location of habitats that could be included in the EVG group. However, the data set is old and incomplete. National Statistics (Hellenic Statistical Authority) also makes regular estimates of grazing land per village community in Greece. This grazing land has a broad meaning and refers to the uncultivated land, except forests, which is grazed by the domestic animals of each village community in a communal way and includes not only true grasslands but also shrublands and open forests. Total grazing land is reported to amount to about 5 million hectares every year, which is a very rough estimate. General Directorate of Forests ( Ministry of Agriculture, 1992) made a national inventory based on air photographs and ground sampling in 1970s and 1980s of the area covered by grazing lands in a narrow sense, i.e. lands without forest vegetation (true grasslands and

89
phrygana). The result was an estimation of 1.4 million ha. It is complete but the data are too old. There has not been any updating since then. In spite of this, the assessment still seems to be quite a good approximation of the extent of true grasslands and phryganic areas in Greece. Expert judgement based estimates, expect that at least 80% of these identified areas still fit to the idea of EVG, i.e. 1.1 million ha in Greece. Of the remaining grazing lands with forest vegetation, namely shrublands and forested grasslands, amounting to about 3.6 million ha, at least 40% of them are quite open (with less than 40% shrub or tree cover) to sustain high plant diversity thus fitting to EVG, i.e. 1.4 million ha. This means that the grasslands of Greece which can fit to the characterization of EVG amount to at least 2.5 million ha. They certainly include the grassland habitats of the 92/43/EEC Directive. All these grasslands are grazed by sheep, goats and cattle in a common way during the winter (lowlands) and summer periods (uplands). They are distributed all over Greece, mainly in the hilly and high mountain areas, although there are certainly grasslands that experience under-grazing or complete abandonment. How much and to which extent is difficult to estimate as no data are available that systematically register this. Overall it is clear that rough estimates of EVG can be made the data on which such estimates are based are old, changes in agriculture have been huge and new systematic inventories of EVG are needed. Such a new data collection needs to be based on new technologies (e.g. satellite images, GIS) and ground sampling. Pilot projects with continued inventories have already been initiated in Eastern Macedonia and Thrace since 1986 but a national coverage is not implemented until now. Finding and mapping the semi-natural grassland habitats is possible, if resources would become available. At the same time is also very difficult to establish whether a grassland is really agriculturally used. In the LPIS system the 2.5 million ha of permanent grasslands, the same as estimated in the former, are eligible for CAP payments. Specifically, their area in each village community is allocated every year to livestock owners-residents of the village- according to the number of animal they possess so that they get the corresponding CAP payments. This is done because most grassland are not private but public or communal lands with the municipalities having the right of use. This right is subsequently transferred to the individual farmers after having paid a small fee to the Municipality as a tax. Whether these area are really grazed is not known however. Several farmers, especially sheep owners, prefer to feed their animals with concentrated feed to increase the milk production thus avoiding grazing their stock in grasslands which are unimproved and therefore inferior in quality to concentrates. In order to get a good estimate of EVG it is therefore important that for the potential habitats mapped as EVG information on stocking density and grazing regime should also be recorded. Nevertheless, expert observations from field studies around the country are that the categories closest to EVG are still grazed. What has changed and is affecting their structure (e.g. shrub invasion) is the cessation of firewood collection by the locals, although this seems to be changing lately due to the economic crisis.

90
Hungary
In Hungary there are two bigger programs, that collect data on habitats related to EVG habitats. As to habitat mapping information there are two important sources of information: 1. MÉTA database (www.novenyzetiterkep.hu) which was filled during a huge program between 2002-2008. 199 mappers mapped the total territory of Hungary during ca. 7000 field days in 35 hecters grid cells, using 86 habitat types, documenting 17 vegetation, land-use and landscape attributes. A repeat-mapping is not yet planned21. This database covers all Annex 1 habitats and all semi-natural habitats. It has a coverage of ca. 95% of the total country 2. Habitat mappings of National Parks (HabMapNP). The goal is partly National Park specific, but usually to map all the areas inside Natura 2000 sites, inside National Park territories in the next 10-20 years22. No central financing is available. Since 2004 two series of maps were prepared for each area: one with the Hungarian ÁNÉR habitat categories and one with the usually less detailed Natura 2000 categories. Naturalness-based habitat quality data are provided for each mapped habitat patch. The current scale of the resulting maps is 1: 25 000 , but moving towards 1: 10 000. This HabMapNP: covers ca. 20% of the territory of the national parks and Natura 2000 sites of Hungary. By 2020 it is expected that most Natura 2000 sites within Hungary are mapped according to the same methodology. Overall it is clear that these 2 sources of habitat mapping data are a valuable source of information for making a first rough identification of EVG in Hungary as they reflect the true distribution and area of types of habitats, their naturalness-based on quality. However they do not provide information on their actual management. The latter is crucial for establishing whether the habitats are indeed agriculturally managed and un-improved for a longer period
21 For a general discription of the method see Molnár Zs., Bartha S., Seregélyes T., Illyés E., Tímár G., Horváth
F., Révész A., Kun A., Botta-Dukát Z., Bölöni J., Biró M., Bodonczi L., Deák J.Á., Fogarasi P., Horváth A., Isépy I., Karas L., Kecskés F., Molnár Cs., Ortmann-né Ajkai A., Rév S. (2007): A grid-based, satellite-image supported, multi-attributed vegetation mapping method (MÉTA). Folia Geobotanica 42: 225-247.
For the data base see: Horváth F., Molnár Zs., Bölöni J., Pataki Zs., Polgár L. Révész A., Krasser D. és Illyés E. (2008): Fact sheet of the MÉTA Database 1.2. Acta Botanica Hungarica 50: 11-34.
For the habitat classification used (called: ÁNÉR) see: Bölöni, J., Molnár Zs., Illyés, E., Kun, A. (2007): A new habitat classification and manual for standardized habitat mapping. Annali di Botanica nouva serie 7: 105-126.
For a detailed description of the types: Bölöni J., Molnár Zs., Kun A. (2011): Magyarország élőhelyei. A hazai vegetációtípusok leírása és határozója. MTA ÖBKI, Vácrátót.
22 Its method was published also in English: Takács G., Molnár Zs. (eds.) (2009): Habitat mapping. 2nd modified edition. Handbooks of National Biodiversity Monitoring System IX. MTA ÖBKI - KvVM, Vácrátót - Budapest, 54 pp. (angolra fordított változat). - 2nd modified edition. Authors: Marianna Biró, János Bölöni, Ferenc Horváth, András Kun, Zsolt Molnár and Gábor Takács; http://novenyzetiterkep.hu/?q=magyar/publikaciok/node/374

91
of time. For establishing their management an initial overlay with LPIS information would be required. This has not been done until now.
Ireland
In Ireland much work has been done and is done on identifying and monitoring Annex I habitats. There is the National Vegetation Database23. This database includes a record of all relevés gathered both recently and historically and is based on national surveys, PhD research and other academic research. It is more used as a tool for developing a plant database than an inventory of semi-natural grasslands. The other specific focused surveys in Natura 2000 sites are based on on-site collection by surveyors. This includes results from the Irish Semi-natural Grassland Survey (ISGS) (Becconsultants)24. The focus is on large areas of semi-natural vegetation but also covers features such as eskers. It is an on-going exercise which is not a complete inventory of semi-natural grasslands as not all regions have been covered by the survey. For the targeted surveys in Natura 2000 sites there is a full coverage of the area and the survey is repeated regularly as it is used for the six-yearly Article 17 reporting. It is interesting to know that the Irish Semi-natural Grassland Survey identifies threats such as under grazing and other signs of abandonment as these need to be reported as part of the threats to semi-natural habitats in the Article 17. In addition there are also several separate surveys done in Natura 2000 site on specific habitats these include: Orchid rich calcareous grasslands (6210), Species-rich Nardus Upland grasslands (6230), Molinia meadows (6410), Lowland hay meadows(6510), Limestone pavement (8240) and Machair (21A0) are the main recorded Annex 1 habitats found in Natura 2000 sites25. 23 http://nationalvegetationdatabase.biodiversityireland.ie/home/what-use-will-it-have/
24 See http://www.npws.ie/publications/archive/Martin_et_al_2007_ISGS.pdf. There are also specific survey done in Natura 2000 sites targetting specific grassland habitats. See: http://www.npws.ie/publications/archive/Martin_et_al_2008_ISGS.pdf http://www.npws.ie/publications/archive/ONeill_et_al_2009_ISGS.pdf http://www.npws.ie/publications/archive/ONeill_et_al_2010_ISGS.pdf 25 Details of each Natura 2000 site are available at the websites: http://www.npws.ie/protectedsites/ http://www.npws.ie/publications/archive/6210_Orchid-Rich_Calcareous_Grassland_Assessment.pdf http://www.npws.ie/publications/archive/6230_Species-Rich_Nardus_Upland_Grassland_Assessment.pdf http://www.npws.ie/publications/archive/6410_Molinia_Meadows_Assessment.pdf http://www.npws.ie/publications/article17consultation/habitatsassessments/individualhabitatreports/6510_Lowland_Hay_Meadows_Assessment.pdf http://www.npws.ie/publications/article17consultation/habitatsassessments/individualhabitatreports/8240_Limestone_Pavement_Assessment.pdf

92
Finally, there is also a registration in IACS/LPIS of species rich grasslands under agri-environment payments and traditional hay meadows under agri-environment schemes. These registration are based on a farm plan drawn up through an agricultural/environmental consultant. The field must contain at least 5 positive indicator species from a list of grassland species to be classed as species rich. However, these forms part of agri-environment scheme and involve an one off exercise, although could be continued into the next scheme. There is therefore no actual database to show sites and what is registered is not covering all species rich grasslands. There is no national inventory of the extent and distribution of EVG presently available within Ireland. Land cover data under CORINE is not sufficient for grasslands and other landcover data such as Teagasc Landcover maps only distinguish between wet and dry grassland types. There is an ongoing project three year project (started in 2013) to identifying HNV farmland using satellite imagery and ground truthing which in the future enable an approximate estimate for the extent and distribution of EVG. In the Irish census different categories of permanent grasslands are distinguished. These include permanent pastures, permanent meadows, rough grazing (mountain or rocky land used for grazing) which is not commonage and commonage land. The inclusion of non-herbaceous dominated grasslands is allowed, but permanent grasslands can still be rezoned every year. For the permanent pastures and meadows class no distinction can be made between improved and unimproved grasslands. The rough grazing and commonage lands are likely to be EVG. Overall, one can therefore conclude that currently one cannot reflect the true extent of EVG with existing data, but on the short run this situation may improve. Existing data sets (Semi-natural grassland Survey, Natura 2000 sites) give sufficient data on type, condition and threats, only lack information on the overall extent of the EVG in Ireland. On the other hand when all survey data both from the different habitat inventories and the IACS/LPIS were combined one could establish a first although not complete overview of EVG extent in Ireland. One category of land that would certainly be missed in current data is the lowland wet grassland category. This category of grassland has been reseeded in the past and has little floral diversity but can still be considered species rich because of the wide birds diversity present. Several of these grasslands are unimproved and harbour important breeding wader populations particularly Lapwing (Vanellus vanellus) , Snipe (Gallinago gallinago), Curlew (Numenius arquata) and Redshank (Tringa totanus). These grassland are now not part of the several habitat monitoring activities which are mostly concentrate on the semi-natural Annex I habitats.

93
Italy
Italy reported Annex I habitats under article 17 in 2008 using a mix of data sources. The quality of the distribution data used depended on the type of habitat, but was often based on data for which collection methodology was unknown. In some cases extrapolation was applied to estimate the distribution of the habitats26. The monitoring and reporting of the status of habitats and species was done by the Italian Botanical Society, based on all relevées available. For the 2013 the same organisation is responsible. Relevé data feeding the system is continuously up-dated, but not for the whole territory. The status of habitats is therefore inconsistently based on old and newer relevé data at the same time. The 2013 article 17 report is not public yet27. Given the large diversity in EVG is Italy and the lack of up-to-date inventories at a national scale much work is still required to create a consistent database. In the past there have however been several projects which have resulted in good inventories of semi-natural habitats including grasslands, but these were usually focussed on one region or Natura 2000 site in Italy28. In spite of the decentral nature of the work done and in process, there is a lot of information available. Meadows were surveyed in the Province of Trento in 700 sites with a total area estimated at 88,764 ha (Scotton et al., 2012). An interesting study which was performed for the provinces of Trento and Veneto by Prof. Michele Scotton from University of Padua in cooperation with local authorities was the SALVERE project29 .The aim of the study was to investigate the current situation and possible future developments of semi-natural grasslands and it considered the identification of HNV farmlands with existing data sources. Similar activities were conducted in others Italian regions where researchers worked on classification and interpretation handbook manuals of pasture types: Veneto (Ziliotto et al. 2004) and Piemonte (Cavallero et al. 2007). Also the statistical data collection on agricultural land use categories is organised decentrally, which means that an Italian wide overview of different permanent grassland categories is difficult to obtain without consulting all regional statistics and could not be compiled in this study. The Agriculture census, (2010) for the whole of Italy only reports permanent grasslands and meadows (prati permanenti e pascoli) for one class30. More detailed statistical information from Trentino statistical office reveals that permanent 26 See; http://cdr.eionet.europa.eu/it/eu/art17/envrelzrg/index_html?&page=3
27 However a summary report in English on the distribution: http://sweb01.dbv.uniroma1.it/cirbfep/pubblicazioni/pdf/habitat_eng.pdf
28 Lombardi L. and Viciani D., 2003. Conservazione delle praterie montanedell’Appennino toscano. Progetto N. LIFE00 NAT/IT/7239. Analisi del paesaggio vegetale nel pSIC “Monte Castellino – Le Forbici”/ LIFE Nature project LIFE99NAT/IT/006229. Monte Labbro e Alta Valle dell'Albegna, tutela e gestione. Comunita Montana del Monte Amiata Grossetano, 1999-2003./ LIFE Nature project LIFE04NAT/IT/000173. Tutela degli Habitat e dei Rapaci del Monte Labbro e dell'Alta Valle dell'Albegna. Comunita Montana del Monte Amiata Grossetano, 2004-2008./ Provincia di Prato 2007. Progetto LIFE Natura HABIO. Tutela della biodiversita nell’area Calvana –Monferrato. Formazioni erbose secche semi-naturali e facies coperte di cespugli su substrato calcareo, (Festuco-Brometalia) con stupende fioriture di orchidee cod. 6210* (*prioritario)
29 http://www.salvereproject.eu/en/node/48
30 http://dati-censimentoagricoltura.istat.it/#

94
pastures in this province cover 119,107 ha, which are divided in 20,345 meadows and 88,762 pastures. These are mostly located at high altitudes, normally between 1000 and 2500 m and they are spread over the entire surface of Trentino in different areas and valleys and are mostly common land. IACS/LPIS data in Italy is managed by the national payment agency (AGEA Agenzia per le Erogazioni in Agricoltura) and several regional agencies exist. In this database several classes of permanent grasslands are registered including those in AEP (see Table 1). The types of permanent grasslands registered also include types with non-herbaceous vegetation including agroforestry area, alpine pastures. Grasslands not receiving payments are also registered. It can be concluded that the most detailed information on type of management and use of permanent grasslands is available in the IACS/LPIS database. Some of the categories distinguished are clearly unimproved, but for the rest of the permanent grasslands it cannot be established how intensively/extensively they are managed and to which extent they have been improved. So additional information on the level of (nitrogen) inputs and grazing density over several years would be required to separate the EVG. Data on species richness of the grassland habitats is available from different sources of which some could be very valuable to establish the EVG share and location. However, these type of data are only available for some limited regions and areas in Italy, more often for the Northern regions then for the south and the Italian islands. Work on semi-natural habitat identification is however in process and coordinated by the Italian Botanical Society. The latest development and quality of the data need to be further investigated as soon as the article 17 report for 2013 becomes available. Overall it is however clear that large improvements are required in existing databases to establish a reliable picture of the location and extent of EVG in Italy.

95
Table 6 Types of permanent and non-permanent grasslands classes registered in the Italian IACS/LPIS
DESTINAZIONE PRODUTTIVA VARIETA' PRODUCTION DESTINATION VARIETY
Pascolo arborato (bosco alto fusto e
cespugliato) Tara 20%
Pascolo magro non avvicendato per
almeno 5 anni – permanente
Pasture planted with trees (forest with high
trees and bushy). Tare 20%
Rough Grazing for at least 5 years –
Permanent
Pascolo arborato (bosco ceduo ) Tara 50% Pascolo magro non avvicendato per
almeno 5 anni – permanente Pasture planted with trees (coppice) Tare 50%
Rough Grazing for at least 5 years –
Permanent
Pascolo polifita (Tipo alpeggi)
Pascolo magro non avvicendato per
almeno 5 anni – permanente Pasture polyphyte (Alpine pasture)
Rough Grazing for at least 5 years –
Permanent
Pascolo polifita (Tipo alpeggi) con roccia
affiorante Tara 20%
Pascolo magro non avvicendato per
almeno 5 anni – permanente
Pasture polyphyte (Alpine pasture) tare rock
outcropping cover maximum 20%
Rough Grazing for at least 5 years –
Permanent
Pascolo Polifita (Tipo alpeggi) con roccia
affiorante Tara 50%
Pascolo magro non avvicendato per
almeno 5 anni – permanente
Pasture polyphyte (Alpine pasture) tare rock
outcropping 50%
Rough Grazing for at least 5 years –
Permanent
** Superfici arborate/cespugliate con o
senza tare non utilizzate ai fini del pascolo
** Tree/Bushy Land Area with or without tare,
not used for productive purposes, but declared
for payments
Permanent grassland and meadow - not
used for production, eligible for
subsidies
Prato polifita da foraggio
Prato avvicendato (sfalciato) – Non
permanente Polyphyte meadows – used for Fodder
Rotation meadows (mowed) – Not
Permanent
Prato pascolo polifita- da foraggio
Prato pascolo avvicendato (sfalciato e/o
pascolato) non permanente Polyphyte Meadow /Pasture – used for Fodder
Meadow/ Pasture alternated (mowed and
/ or grazed) - Not Permanent
Prato pascolo polifita- da foraggio
Prato pascolo non avvicendato per
almeno 5 anni (sfalciato e/o pascolato) –
permanente Polyphyte Meadow / Pasture – used for Fodder
Permanent grassland alternated not
rotational for at least 5 years (mowed
and / or grazed) - Permanent
Prato polifita da foraggio
Prato non avvicendato per almeno 5
anni (sfalciato) permanente Polyphyte Meadows – used for Fodder
Meadow alternated not for at least 5
years (mowed) - Permanent
Superfici inerbite sottobosco senza tare Superfici inerbite sottobosco senza tare
Agro-forestry with grass unstory ( no
maximum cover ) Grass underbrush without tare
Superfici inerbite sottobosco - Tara 20% Superfici inerbite sottobosco - Tara 20% Agro-forestry with grass unstory - Tare 20% Grass underbrush - Tare 20%- Tare 20%
Superfici inerbite sottobosco - Tara 50% Superfici inerbite sottobosco - Tara 50% Agro-forestry with grass unstory – Tare 50% Grass underbrush - Tare 20%- Tare 50%
Note:
** These areas are part of the farm land, but not subject to payment.
Tare: This means that x % of the total area is excluded by the payment acreage

96
Latvia
In Latvia there is an official concept of ‘Biologically Valuable Grasslands’ (BVG). These include both semi-natural grasslands floristically diverse and cultivated grasslands (permanent grasslands) valuable for birds as feeding or nesting habitats. No other ecological values of these grasslands have been evaluated and described until now. There is therefore a database of Biologically valuable grassland database of the Latvian Fund for Nature developed and maintained by Latvian Fund for Nature31. This database contains several data sets:
1) 2000-2003: database started in 2000 in the frame of the project Grasslands of Latvia financed by PIN-MATRA programme of the Ministries of Agriculture, Nature and Food Quality and Foreign Affairs32. Only botanically valuable grasslands were mapped. Grasslands were classified according to national grassland habitat classifier, based on phytosociological approach. Grasslands were mapped by on-site data collection by surveyors/botanists and resulted in a full area coverage.
2) The database was further developed after Latvia entered EU and Rural Development Programme was launched. In the frame of RDP the agro-environmental measure Management of Biodiversity in Grasslands was established. To find new grassland areas eligible for this measure the Ministry of Agriculture invited farmers (owners) of grasslands to apply for inventory (it was done in 2005, 2006, 2007, and 2009). All grasslands applied for this inventory were surveyed by botanists. Both botanically valuable grasslands and grasslands important for Habitats Directive Annex I bird species (incl. cultivated grasslands without botanical values) were mapped. The method for botanically valuable grasslands was the same as in previous period. Only expert judgement was used to determine grasslands importance for birds (no precise methodology was used). The resulting database now contains two data sets: 1) geospatial data in vector format 2) patch level data on plant species composition, habitat type, management
in ACCESS database format There are however several shortcomings for this database for Biologically valuable grasslands:
i. 2000-2003: only 2/3 of country’s area was covered by mapping. No repeated inventory has been done for grasslands mapped in this period, so the data are outdated.
1) In 2005-2007, and in 2009 only those grasslands applied for inventory by farmers (owners) were inventoried
2) The amount of grasslands not inventoried is not known 3) No intercalibration seminars or study courses for experts were carried out ,
nor quality control was done for obtained results, so data quality is highly
31 www.ldf.lv
32 Kabucis, I., Rusina, S., Veen, P. 2003. Grasslands of Latvia. Status and conservation of semi-natural grasslands. European grasslands. Report Nr.6. Royal Dutch Society for Nature Conservation, Latvian Fund for Nature. http://www.ldf.lv/pub/?doc_id=28229.

97
varying, quite many misinterpretations of habitat type have been observed when using the database.
4) No consistent methodology was applied for mapping of grasslands important for birds.
5) About 1/3 of all grassland patches were mapped as complexes (if several habitats occurred in one patch their extent in a patch was evaluated in percentage and not mapped in detail. For those patches no spatial information is available where particular habitat type is situated in the field.
6) In 2009, grasslands were not inventoried by Latvian Fund for Nature so those data were not added to the database.
Box 1: Mapped semi-natural grassland habitats in Latvia (source, Latvian Fund for Nature (2003). Grasslands of Latvia” is the sixth report in
the series of Publications National Grassland Inventory Projects in Central and Eastern Europe.
During the 2003 project period 5482 polygons of semi-natural grasslands were mapped. Those strictly selected botanically valuable grassland areas totally cover 17 323 ha and form only 0,3% of the total surface of the country. The most widespread habitat groups are mesophile pastures Cynosurion and humid eutrophic grasslands Caltion (Table 6). Fig.6 – Fig.11 illustrate coverage of grassland habitat groups and habitat types. Only 40% of all grasslands are managed. More than half of hay meadows (58%) and mesophile pastures (60%) are under regular management. Less managed are coastal brackish (10%) and calcareous dwarf sedge grasslands (10%). In average not more than one third of each habitat type is found in protected sites. 31% of all Magnocaricion, 28% of Calthion and 27% of Cynosurion are included in protected sites. Only exemption is Molinion grasslands – 43% of them are under some protection. Fig.14 and Fig.15 illustrate protection of different grassland types.
1.1.1 Table.6 Coverage of semi-natural grassland types
Grassland habitat type Area (ha) % (of all grasslands)
1. Dry grasslands 1851 11
1.1. Dune grasslands Corynephorion 124 0,72
1.2. Dry siliceous grasslands Plantagini-Festucion
473 2,73
1.3. Dry grasslands on cliffs Alysso-Sedion albi 4 0,02
1.4. Dry calcareous grasslands Bromion erecti 1116 6,44
1.5. Xero-thermophile fringes Geranion sanguinei
12 0,07
1.6. Mesophile fringes Trifolion medii 121 0,7
2. Fresh grasslands 6386 36,86
2.1. Nardus grasslands Violion caninae 221 1,28
2.2. Mesophile pastures Cynosurion 4236 24,45
2.3. Hay meadows Arrhenatherion 1908 11,01

98
2.4. 2 POTENTILLION ANSERINAE
10 0,06
3. Moist grasslands 5876 33,92
3.1. Humid riverine grasslands Alopecurion 1088 6,28
3.2. Humid eutrophic grasslands Calthion 3889 22,45
3.3. Humid oligotrophic grasslands Molinion 846 4,88
3.4. Coastal brackish grasslands Armerion maritimae
47 0,27
4. Wet grasslands 2937 16,96
4.1. Acidic dwarf sedge communities Caricion fuscae
258 1,49
4.2. Calcareous dwarf sedge communities Caricion davallianae
47 0,27
4.3. Tall sedge communities Magnocaricion 2632 15,19
5. Semi-ruderal grasslands 273 1,57
For Annex 1 habitats in Natura 2000 there are two main sources of information:
1) The Database of EU importance grassland, scrub and heathland habitats in Latvia. It was developed in the frame of LIFE+ project33. It combinies all existing spatial data on EU importance grassland habitats in Latvia (inside and outside Natura 2000 sites) which are the data from all Natura 2000 sites in Latvia named « Ozols» (see next) and the biologically valuable grassland database (see 3rd row in this table). It is planned that all new data will be incorporated into this database. In addition to geospatial database, a database in ACCESS software will be developed to store data on species composition, management data, vegetation structure quality etc. data gathered during the field work and stored in the field form. Interestingly, this database also contains information on grassland status of management and abandonment. Only two categories are available: grassland managed through the agro-environmental measures (about 50 % of all grasslands in 2011 had this status) and grasslands not managed through this measure. The latter includes all other grasslands, part of them are managed but the extent of management/abandonment is not known.
2) The common data base for Natura 2000 sites in Latvia named « Ozols»34. Information on grassland habitats is gathered mainly from two sources:
33 Life 11/NAT/LV/371 NAT-PROGRAMME, National Conservation and Management Programme for
Natura 2000 Sites in Latvia (NAT-PROGRAMME), implemented by the Nature Conservation Agency http://www.daba.gov.lv/public/lat/projekti/life_nature1/nat_programme
34 developed and maintained by Nature Conservation Agency (http://ozols.daba.gov.lv/pub/ only in Latvian) . The data base developed during the project co-financed by European Regional Development Fund, project No.: 3DP/3.2.2.1.1/09/IPIA/IUMPELS/013 - "OZOLS"

99
1) Nature management plans for Natura 2000 sites (starting from 1998). The method used was on-site data collection by surveyors/botanists;
2) Mapping of habitats in 2011 and 2012 in the frame of the project “Monitoring of plants and habitats in Natura 2000 sites in Latvia” by Latvian Fund for Nature.
It is complete data set but with shortcommings as not all Natura 2000 sites have management plans, so not all sites have been mapped. Many sites has outdated habitat maps (10 and more years old). No inter-calibration seminars or study courses for experts were carried out , nor quality control was done for obtained results, so data quality is highly varying, quite many misinterpretations of habitat type have been observed when using the database. For several Natura 2000 sites grassland mapping was not done but only data of the Biologically valuable grassland database of Latvian Fund for Nature were used to create the habitat map. So this database has the same shortcomings as for the Biologically valuable grassland database.
It is planned that both Natura 2000 databases discussed above will be linked and integrated into the common database for Natura 2000 sites “Ozols” . Above discussed data all form the basis for Annex I habitat reporting under article 17. The last relevant database is the Geospatial database of biologically valuable grasslands developed and maintained by Rural Support Service35 (Latvian LPIS) and includes geospatial data on location of biologically valuable grasslands (no other information is stored in the database - no information on habitat type or quality etc.). The database is used to manage agro-environmental measures for grasslands. The data on the biologically valuable grassland database from the Latvian Fund for Nature (see above) is included. Additionally, data were included of those biologically valuable grasslands, which were inventoried in 2009 (see Figure 3). Figure 3: Interactive webtool to search parcel specific information included in
the LPIS system. In the vies plots are identified with attributes on their location in Natura 2000 or grasslands in the biologically valuable grassland class. Data can be viewed, but not downloaded.
35 http://www.karte.lad.gov.lv/

100
Overall one can conclude that with the existing data one can reveal a near extent of the EVG in Latvia. However there are shortcomings as inventories on which the data in the discussed databases are based have been done about 10 years ago, many sites are now overgrown or destroyed by urbanisation. However, precise information on this is not available. The latest data on managed Biologically Diverse Grasslands indicate that many of them have lost their floristic value because of mulching (very widespread management in the last 15 years in Latvia). To come to a better database for identification of exact extent and location of EVG in Latvia improvements needed in existing data sets. A more flexible common database maintained and improved on the regular basis should be created. Now several databases are available. Each of them contains data on distribution, management and quality of only some part of the total grassland area in Latvia. One consistent Latvian wide database therefore needs to be created which should include information on:
o EU importance Habitat type and subtype (now only type is known), and type according to National vegetation classification (now only for older part of grasslands available)
o Ecological quality of grassland (now only part of grassland patches has information on their floristic quality, information on birds for grasslands is largely missing)
o management type (such information is available only for grasslands applied for agro-environmental measure, but it is not available in geospatial form, so no information on grassland patch level is available)
o data on grassland patch level should be renewed regularly at least once per 6 years and the new information should be added, also to comply with the article 17 reporting

101
o historical data should be stored in the database (data on habitat changes, management changes, grasslands lost for some reason etc.).
Finally it should be mentioned that in 2013 a lot of new information will be available and will be incorporated into one common database which is the database of EU important grassland, scrub and heathland habitats in Latvia which is the Natura 2000 database discussed above. In addition to geospatial data, a database (in ACCESS software) of grassland quality will be developed. In 2013 two important projects are running:
2) Inventory of newly applied grasslands by farmers to identify if a grassland correspond to the criteria of Biologically Valuable Grassland (about 60 000 ha are applied).
3) Inventory of Biologically Valuable Grasslands which are managed through agro-environmental measure Management of Biodiversity in Grasslands (about 2000 ha will be inventoried)
Luxembourg
Annex 1 habitats, including relevant EVG have been mapped and evaluated in terms of their conservation status in a national assessment and mapping project. This project as “cadaster des biotopes protégés” was implemented between 2007 and 201136. It was a full area coverage mapping and evaluation of all Annex 1 habitats in and outside protected areas excluding forests. Mapping and assessment was done according to a standard methodology and implemented by experts. The data collection is based on aerial photographic interpretation and field surveys identifying the plant communities indicative for the Annex 1 habitats present. In principle there are no data gaps, review is planned at a regular basis, but depending on financial means available. It is likely that all EVG in Luxembourg are mapped and assessed in the Cadastre database. Per site there is also information included on species composition, structure, area and main threats. This detailed information allows for multivariable queries in relation to the definition provided of EVG in Chapter 3. The farmed habitats in the Cadastre are also combined with the LPIS information and therefore land use and management data are available for the EVG.
Netherlands
In the Netherlands the extent of EVG is very limited as the area of unimproved grasslands is very limited, although present. There are several data sources that provide when combined a good approximation of EVG in The Netherlands.
36 Data base can be consulted via the Ministry for sustainable development and infrastructure.
http://www.environnement.public.lu/conserv_nature/dossiers/Cadastre_des_biotopes/index.html. Further information about methodology can be downloaded via the link indicated (http://www.environnement.public.lu/conserv_nature/dossiers/Cadastre_des_biotopes/index.html).

102
The first and main database is Synbiosys system which includes a description and mapping of all Annex 1 habitats37. This is an information system for the evaluation and management of biodiversity among plant species, vegetation types and landscapes. It incorporates a GIS platform for the visualisation of layers on plant species, vegetation and landscape data. It also offers the possibility to identify vegetation types and to analyse the patterns and processes which relate them to plant species and landscape types. The section ‘Vegetation’ holds a distribution database of relevé data (plot data). Because each relevé in the database is – through an automated process using the program ASSOCIA - assigned to a plant community it is in fact a database with distribution of plant communities. Additional data are also contained in the system from the ‘Vegatlas’, which is basically also a distribution database of relevé data, but here the assignment of the relevés to plant communities is done by expert judgment (Weeda et al. 2000-2003). Finally the distribution of plant species is also projected on the soil map to create a distribution of plant communities. Most recent up-date available for 2008. The relevé data feeding the system is continuously up-dated, but not for the whole territory. The status of habitats is therefore inconsistently based on old and newer relevé data at the same time. In the Netherlands 2 main studies have also been commissioned by the Ministry of Economic Affairs to Alterra to identify HNV farmland in The Netherlands38. The main aim of the first study was to map HNV farmland areas, as defined in the different European wide HNV studies using national statistical and spatial data sources of the highest possible spatial resolution and thematic detail. In 2012 the second study was commissioned by the Ministry to Alterra to produce an up-date of the first HNV farmland map in order to produce the HNV baseline indicator to be used for reporting in the CMEF. In both studies a similar approach of identifying HNV farmland was followed, although the latest study by van Doorn et al. (2013) involved the use of more recent data sets, a wider number of species distribution information layers. The identification of HNV farmland was done at a spatial resolution of 250 m² while the first study used a 1km² resolution. Input data used are BKN database which has mapped all habitats targeted by AEP. In this spatially explicit database which is up-dated every 2 to 3 years there are 18 general ‘nature types’ (e.g. grasslands, semi-natural grasslands, forests, moorlands etc.) and 58 ‘nature management types’ (e.g. meadow bird grasslands) mapped. Identification of area that can be targeted by AEP is based on several studies that identified the potential species per habitat to be realised under ideal management. However, since agricultural management is intensive in most of the Netherlands the likeliness that a semi-natural habitat state is
37 Information at;
http://www.synbiosys.alterra.nl/natura2000/gebiedendatabase.aspx?subj=habtypen&groep=0
38 1) Elbersen, B.S.; Eupen, M. van; Foppen, R.; Hoogeboom, J.; Fliervoet, L. (2008) Landbouwgrond met hoge natuurwaarden in Nederland op de kaart Wageningen : Alterra, (Alterra-rapport 1542) - p. 125. 2) Doorn, van, A., Elbersen, B. & Eupen, van, M. (2013). High Nature Value Farmland in Nederland: Handvatten voor beleidsimplementatie. Alterra-report 2013).

103
reached again is very low. Therefore the AEP often are allocated to grassland areas that are substantially improved and do not opt for categorization in any of the Annex 1 habitats, let alone EVG. Other important spatially explicit sources used for the identification of HNV farmland were LPIS (=BRP), IACS (linked to LPIS parcels), Landscape elements data (VIRIS) and species distribution data on farmland birds (Sovon), Butterflies (Vlinderstichting), vegetation (Symbioses). Overall, one can conclude that there is no data set alone that covers the true extent of EVG. However, with a combination of data sets it should not be very difficult to identify the true and up-to-date extent of EVG in The Netherlands. An overlay of the HNV farmland areas (Doorn et al., 2013) overlayed with the Grassland Annex 1 in Synbiosys will already deliver a very good approximation. Only one aspect that cannot be optimally established is whether the habitat is truly unimproved. An overlay with LPIS-IACS data only delivers information on agricultural use while management information is only available for the whole farm and not plot specific.. An approximation using average farm level information about management would be possible but since management and input levels can range very strongly between fields on the same farm it will not be an optimal solution.
Portugal
Like in most Mediterranean countries climatic characteristics and (poor) soil types in combination with a long and recent history of traditional extensive management have created large areas on EVG. Many of these have never become intensified. The challenge will however be to separate the intensively managed grasslands from the low intensive ones should be possible with exiasting data. However, there are also many extensive grasslands that still obtain some level of fertilisation in order to simply make them produce some biomass for agricultural production (e.g. Azores islands bare soils). There are also other areas that although of ecological value do not have intentional management at all. For example in the communal lands in the north with vast areas of grasslands, where the number of animals grazing in the mountains has been steadily decreasing. Those areas are on higher mountains (>1000 metres high). Although some cattle is still present the area is so extended that they are completely under-grazed, particularly in winter, and actually in a status of abandonment with large shrub and tree invasion. It will be a challenge to filter out those extensively fertilised grassland and the abandoned communal lands from the unimproved species rich grasslands still in good agricultural use. There are several data sources in Portugal which have value for the identification of EVG. All Annex 1 habitats have been mapped and their extend and status assessed between 2006 and 200839. These assessments were made by an expert based on on-site data collection by surveyors/botanists in a stratified sampling approach. There are known to be several limitations to this database. In spite of this it was used for
39 Information and reports per habitat available at: http://www.icn.pt/reldhabitats/

104
Annex 1 article 17 reporting. To identify EVG it does have some value, but should be combined with better data from other sources such as the Portuguese forestry institute that developes the forestry plans for the entire country40. In all of them there is a function labelled as sylvopastoral areas. Those areas are mapped and this may be of use to assess EVG. In addition there could also be valuable information on EVG in the ITI- Integrated territorial interventions that also focus on valuable grasslands41. As to the statistical sources there is the agricultural census RGA (Recenseamento geral Agricola) this dataset has to be demanded to the Portuguese statistics Institute INE42 . In this census data are collected for different types of permanent grassland categories. These include categories that could entirely or almost entirely be part of the total EVG area in Portugal as they are unimproved and could also be non-herbaceous. The state of un-improvement is determined by the absence inputs of fertilisers, irrigation, drainage and are located on poor soils. These categories are:
1) Permanent grasslands unimproved (=pobres) with dominant herbaceous cover (prados e pastegens permanents pobres em terra limpa)
2) Permanent grasslands unimproved (=pobres) with with bushes/shrubs/matorral/montes (prados e pastegens permanents pobres sob-coberto de matas e florestas)
3) Permanent grasslands unimproved (=pobres) with permanent cultures/trees/montado (prados e pastegens permanents pobres sob-coberto de culturas permanentes)
For an overview of the area and share of the different types of pastures described above see Table 7, where a distinction is made between unimproved (=pobres) and improved (melhorados e semeados) and herbaceous (em terra limpia) and sub-covered by shrubs and trees (sob-coberto de matas e forestas).
40 http://www.icnf.pt/portal/@@search?SearchableText=PROF
41 http://www.proder.pt/conteudo.aspx?menuid=383 42http://www.ine.pt/xportal/xmain?xpid=INE&xpgid=ine_publicacoes&PUBLICACOESpub_boui=1195
64579&PUBLICACOESmodo=2 in the page 48 of the report RA_2009_part1 there is a map containing the areas per type.

105
Table 7 Regional overview of area of types of permanent grasslands registered in the RGA (Recenseamento geral Agricola)
Romania
In Romania the distribution of farmed semi-natural vegetation reflects the ability of the soil to support arable crops - intensively managed grasslands are not common. Semi-natural pastures are therefore common in the mountain zone and on steep or flat and wet areas in the hills and lowlands. Communal land may survive around villages even in areas of arable cultivation. The categories of permanent grassland found in the Romanian IACS-LPIS are Natural pastures and Natural meadows. The same categories, synonymous in Romanian usage with ‘permanent pastures’ (land in pasture for >5 year), are used in the Agricultural Census and FSS. No distinction is made in land on the farm and common lands. Note that in Eurostat data, the ‘total area’ figure is the total area of the whole country, whereas the UAA figure approximates to the total area of all farmed land, not FSS UAA. The permanent pasture data would therefore seem to include all such land, including common land.
As to farmland management there are quite detailed statistical figures available which enable to make first estimates of general stocking density figures fro grasslands. basic statistical data is available on the internet at judeţ (county) level.

106
Taking 3 counties which are known to have a high proportion of HNV farmland (Fig xx) - Bistriţa-Năsăud; Braşov and Hunedoara – it is possible to work out a first estimate of the density of breeding livestock on grassland. The results are shown in table 4. Table 8 First estimate of breeding livestock density on grassland in 4
Romanian counties with a high proportion of grazed semi-natural vegetation
Pastures Meadows Total grassland
Breeding bovines
Ewes She-goats
Ovine LU
Total LU
LU/ha grass
Bistriţa-Năsăud 113890 70769 184659 50460 205431 11013 32467 82927 0.45
Braşov 97086 60440 157526 37564 253560 10700 39639 77203 0.49
Hunedoara 117510 82282 199792 36061 124468 6416 19633 55694 0.28
According to the National Statistical Institute Statistical Annual for Agriculture and Silviculture 200643, 4818 agricultural holdings have the legal status of units of public administration, i.e. public land. This includes all types of land, but of these, 4161 have land but no livestock and are likely to provide a good estimate of communal grazing land, while 589 have both land and animals. These 4750 public holdings with land cover 2,124,736.7 ha. The total utilised agricultural land in the country is 13,706,901.3 ha. FSS 2005 UAA44, which excludes common land is 10,337,100 ha (with 927,500 ha of other land on the enumerated holdings themselves). This difference is, we believe, mostly common land. In Annex 1.8 of the National Strategy for Rural Development45, the 4750 public holdings are split by area. 1389 have less than 5 ha and can be considered trivial. 530 have holdings of between 5 and 50 ha and 2831 have holdings of >50ha. The total of land used as pasture in the country in 2005 was 3.364 million ha, suggesting that communal pastures are of the order of two thirds of the total.
As to habitat mapping the following information is from Veen (2007)46 and the national
grassland inventory report for Romania47 unless otherwise specified:
3660 polygons mapped and included in the database, which also includes 130680 species records. The total area mapped is 390,012 ha and 29 grassland habitat types are recognised. Of the total mapped area, the actual mapped grasslands accounted for 371,894 ha, while 16,484 ha were considered degraded grassland and not mapped and the remainder was under other land uses. The type of grasslands mapped are presented in Table 10. 43 http://www.insse.ro/cms/files/pdf/ro/cap14.pdf
44 http://epp.eurostat.ec.europa.eu/cache/ITY_OFFPUB/KS-SF-07-060/EN/KS-SF-07-060-EN.PDF
45 http://www.mapam.ro/pages/page.php?self=03&sub=0303&tz=030301
46 Veen, P (2007) On the implementation of the results of the national grassland inventory projects in Central and Eastern European Countries. KNNV report. Utrecht
http://www.veenecology.nl/data/EVALUATIONNATIONALGRASSLANDINVENTORYfinal4.pdf
47 http://www.veenecology.nl/index.php?id=15 and links thereon

107
Table 10 Mapped Habitats by Veen et al. (2007) DRY GRASSLAND 1. Continental dune grasslands FBC 2. North-western pontic dune grasslands ELG 3. Pannonic and western pontic salin meadows PBJ 4. Pannonic western pontic salt steppes FEP 5. Hill and plateau xero-mesophilous grasslands FDS 6. Xerophilous feathergrass (Stipa) steppe grasslands SCE 7. Hill and plateau xero-mesophilous grasslands CDB 8. Hill limestone steppe grasslands from Dobrogea PIT 9. Pale fescue grasslands on shinny limestone from hill-mountain belts BFP 10. Dealpinae mountain calcareous Sesleria rigida grasslands SER MESOPHILOUS GRASSLAND 11. Hill mountain mesophilous meadows CYN 12. Hill mountain mesophilous manured meadows ARR 13. Mountain mesophilous manured meadows POT 14. Mesophilous oligotrophic mountain pastures VNG 15. Mountain mesophilous tall herb meadows. CAA HIGH-MOUNTAIN GRASSLAND 16. Subalpine mesotrophic pastures POA 17. Subalpine oligotrophic pastures PON 18. Basiphilous subalpine pastures SEB 19. Subalpine acidophilous tall herb meadows CAV 20. Subalpine calciphilous tall herb meadows FCT 21. Acidophilous alpine pastures JUT 22. Basiphilous alpine pastures OXE WET GRASSLAND 23. Meso-hygrophilous flood plain meadows AAP 24. Intramountain hygrophilous river meadows CAL 25. Hygrophilous meadows in the intramountain low valley MOL 26. Marsh-fens tall Carex meadows MAC 27. Water-fringe reed canary-grass meadows SGP 28. Poor fen acid meadows CAF 29. Continental base-rich fen meadows CAD
The inventory does not cover all the country, but does include Alpine grasslands. Sample areas were chosen in 11 broad regions, covering between them a range of conditions in mountain, hilly and lowland zones. It is considered that complete coverage is necessary. To illustrate the size of the sample, the CLC estimate of grassland in the sample area was 385,551 ha (an overestimation of approximately 3.7%), out of a national estimated area of 2,313,366 ha. The inventory is kept by the Danube Delta Institute in collaboration with the Ministry of Environment and Water Management. The contact regarding the inventory in Romania is Anca Sarbu at the University of Bucharest. A comment made by the respondents to the questionnaire was that whereas the grassland inventory represents a good coverage of grassland types included in the Habitats Directive, there are in Romania ‘types very characteristic of [that] part of Europe that were not represented’.
The methodology followed involved six steps:
- identification of possible grassland polygons using satellite imagery - expert filtering on issues such as land abandonment and field research to divide
samples by topography, biogeographical zone, etc.

108
- preparation of a set of mapping units to ensure consistency of approach - mapping, with collection of species data - preparation of GIS database including additional information on e.g. land use,
management etc - provision of database with additional support in its interpretation and use
ArcInfo and ArcView were used. The estimate of HNV farmland used in the RDP and for the
targeting of RDP funds was based on the CLC work.48
Slovakia
The best source of data containing information on extent of EVG in Slovakia is National Grassland Inventory organized by DAPHNE-Institute of Applied Ecology in the years 1998-200649. It was on-site data collection by botanists with full-area coverage. Nearly the whole country (more than 96%) was covered by the inventory. It was more or less one-off exercise, dataset is renewed only by case on very small areas and the renewal is not systematic. Subsequently the DAPHNE data were also used to identify HNV farmlands. Data from national grassland inventory were roughly overlapped with LPIS data. Not all grasslands mapped during national grassland inventory were considered as HNV grasslands, because nearly 40% of them were not included in LPIS system and therefore not considered agricultural. In most cases these lands were covered by trees and shrubs or Alpine grasslands. Whether these lands were really not agriculturally used was not verified. In order to establish a GIS-layer of LPIS blocks under agri-environmental payments the Institute of Soil Science and Soil Protection (which is responsible for LPIS maintenance) asked the State Nature Conservancy to certify grassland for AEP. For this purpose DAPHNE-IAE did an additional farm mapping exercise in the years 2003-2006. The methodology of farm mapping was compatible with the methodology of national grassland inventory. The eventual certification is based on results from the additional farm mapping, the national grassland inventory and own data from the State Nature Conservation, but there is no common standard for farm mapping of AEP.
48 National Strategic Plan for Rural Development
http://www.madr.ro/pages/dezvoltare_rurala/NATIONAL_STRATEGY_PLAN_march_2007.pdf
49 The methodology of the inventory was published in 1999. After the field testing the methodology was updated and 2
nd version was published in 2000. See:
Šeffer J., Stanová V., Lasák R., Galvánek D. & Viceníková A. (eds.) 1999: Mapovanie travinnej vegetácie Slovenska (methodical manual). DAPHNE, Bratislava.
Šeffer J., Stanová V., Lasák R., Galvánek D. & Viceníková A. (eds.) 2000: Mapovanie travinnej vegetácie Slovenska (methodical manual). DAPHNE, Bratislava, 2
nd edition.

109
Overall one can conclude that with the current data available on habitat mapping and certified farmland for AEP there is a good basis for identifying EVG in Slovakia. However given the dramatic changes in agricultural land use in the last 10-15 years (including large scale abandonment) there is a need for improvement in existing data sources. This would require new up-dates in field data collection at large scale, preferable for the full area, at least in terms of aerial photographic interpretation. It would also be good to increase accuracy of mapping using new ortophoto maps or satellite imagery, because only military maps were used in the first inventory and the locations of the polygons may be less precise in some situations. So far it is estimated that 80% of the EVG have been mapped in the different grassland inventories and are included in the LPIS system. Further mapping of the 20% would also be required in an up-date inventory.
Spain
Different Spanish data sets categorise grasslands and broader grazing lands in several different ways. In some cases there are categories that correspond broadly to EVG but not precisely. The types of grassland covered and relation to EVG are as follows:
1) Prados – grasslands in more humid areas (e.g. Atlantic Spain) that are productive enough to be mown (although they may be not mown in practice). Prados naturales are unsown but may have been improved through manuring and artificial fertilisation, and may be irrigated; so may be EVG or may not. Prados can have some trees and shrubs. Praderas generally refers to more productive grasslands that have been sown and agronomically improved, so not EVG, but this interpretation varies according to the data base (also, after several years without cultivation a pradera will revert to a more natural prado).
2) Pastizal – permanent grasslands in dry areas (i.e. most of Spain) that generally are not productive enough to be mown and that dry out in the summer months. In principle they have not been sown and climate/soil conditions do not allow for significant agronomic improvement, so generally they are EVG (although may be locally over-grazed). Sub-types include pastizal with trees and with shrubs.
3) Erial a pastos – spontaneous vegetation on low-productivity land that is no longer cultivated. Generally semi-natural, but the land may be previous arable land or occasionally cultivated so not always EVG.
4) Dehesa – farmland with scattered (sometimes quite dense) tree cover, mostly permanent pasture but can be arable.
5) Matorral – shrub vegetation, may be under grazing use 6) Monte – general term for forest vegetation, of which some types are under
grazing use e.g. monte arbolado ralo is open grazed woodland

110
These categories are partly or fully identified is statistical sources.
Agricultural Statistics (Anuarios de Estadística Agroalimentaria)50 are the agricultural statistics published annually by the Ministry of Agriculture MAGRAMA. These are the statistics communicated to Eurostat. These statistics give a total extent of pastures (prados and pastizales) in 2011 of 6,494,036 ha. This is the figure reported to Eurostat for pastures in Spain. However the same tables show a column for “land principally used as pasture” that includes eriales (abandoned cropland used for grazing), giving a total for 2011 of 10,021,637 ha. This figure does not include grazing land with trees, that is counted in the Agricultural Statistics under “forests”, although the section of the statistics introducing forests explains that this includes land where scattered trees share the space with other uses, that may include grazing under Spanish law. Note that dehesas alone cover around 4 million ha but apparently are not counted in the permanent pasture area under these statistics.
In the agricultural census collected by the Spanish statistical office (INE)51 data on some of these EVG categories are indeed collected and encompass prados, pastizales, eriales a pastos, monte arbolado ralo (open Woodland). But Prados distinguished as a separate category may in some cases be under intensive use and therefore not EVG. The census gives the total extent of permanent pasture (prados, pastizales, eriales a pastos) in 2009 as 8,377,389 ha. In this case permanent pasture includes all types of pasture of >5 years, including pastures with trees and shrub (quantitative criteria on % coverage are not given) and eriales, when these are under some form of farming use.
In the Mapa de Cultivos y Aprovechamientos MCA52 the categories relevant to EVG are Prados y praderas naturales – these are described as having “natural” vegetation, but as already mentioned above some may still be under intensive management, making it problematic to assume this is all EVG. There are two separate categories for those with occasional irrigation and those with more permanent irrigation. There are four separate categories for Prados with trees, with shrubs, with both and with fruit trees (orchards with permanent pasture) – probably all EVG. Prados de alta montaña are mountain herbaceous grasslands used for grazing - EVG. Pastizales are permanent grasslands in dry areas that are not productive enough to be mown, and that generally are not ploughed (except in some cases for occasional clearance of shrubs), so these can be included in EVG. There are separate categories for pastizales with trees, with shrubs, and with
50 http://www.magrama.gob.es/es/estadistica/temas/publicaciones/anuario-de-
estadistica/2011/default.aspx?parte=3&capitulo=13
51 Estadistica Agraria de España http://www.magrama.gob.es/es/estadistica/temas/estadisticas-agrarias/
and http://www.ine.es/jaxi/menu.do?type=pcaxis&path=%2Ft01%2Fp042/E01&file=inebase&L=0
52 http://www.magrama.gob.es/es/cartografia-y-sig/publicaciones/agricultura/mac_2000_2009.aspx The information is collected at a regular basis in a stratified sampling using areal photographic information and field surveys.

111
both – which can also expected to be EVG. Pastizal in this data base includes erial a pastos.
ESYRCE is a sample survey similar to the LUCAS model53. Permanent pastures according to ESYRCE covered 8,360,026 ha in 2012. This figure includes pastures with trees up to 20% cover and pastures with shrubs that may reach 100% cover if still used for grazing. It does not include land with >20% tree cover.
SIGPAC54 is the Spanish LPIS and is the responsibility of the Paying Agency FEGA, and of the regional governments. LPIS - Categories that encompass EVG are pastizales, pastos arbustivos, pastos arbolados. The pastos arbustivos and pastos arbolados are assumed to be EVG, although management may not be perfect for conserving ecological values (e.g. possibility of localised over-grazing). In this data base the category pastizal includes prados and also praderas, some of which are under intensive management (especially praderas), so whereas the majority of this category can be assumed to be EVG, it is not 100%. According to LPIS there was a total area of permanent pasture of 18,622,983 ha in 2013. This figure is the sum of the categories PA (pasto arbolado or pasture with trees >40% cover), PR (pasto arbustivo or pasture with shrubs >40% cover) and PS (pastizal or pasture with <40% tree/shrub cover).
53 http://www.magrama.gob.es/es/estadistica/temas/estadisticas-agrarias/agricultura/esyrce/
54 http://sigpac.magrama.es/fega/visor/

112
Table 11. LPIS categories PA (pasto arbolado), PR (pasto arbustivo) and PS (pastizal) – all are CAP eligible, see Excel for criteria. FO is forest (not CAP eligible, but registered).
2013
PA PR PS Total pasture FO TOTAL
(ha) (ha) (ha) (ha) (ha)
ANDALUCIA 1,006,509.87 881,027.19 965,678.66 1,153,160.06 4,006,375.77
ARAGÓN 373,460.78 1,379,050.30 43,029.85 889,389.99 2,684,930.92
ASTURIAS 11,819.92 308,187.55 109,519.05 385,660.39 815,186.90
BALEARES 40,092.49 81,008.05 3,144.78 101,403.43 225,648.75
CANARIAS 1,670.20 376,507.06 4,421.53 102,827.51 485,426.29
CANTABRIA 24,929.75 179,899.73 119,722.12 141,813.41 466,365.01
CASTILLA-LA MANCHA 816,848.95 1,669,865.52 92,891.96 983,492.80 3,563,099.23
CASTILLA Y LEÓN 772,475.24 2,277,397.58 371,840.50 1,312,796.58 4,734,509.90
CATALUÑA 397,729.72 672,859.10 40,284.47 895,323.73 2,006,197.03
EXTREMADURA 1,059,218.30 789,970.03 223,955.64 297,642.98 2,370,786.95
GALICIA 63,234.99 825,041.40 344,193.24 1,051,577.56 2,284,047.19
MADRID 94,360.39 186,774.95 37,668.71 70,524.45 389,328.50
MURCIA 93,630.50 295,201.63 6,828.34 121,418.28 517,078.75
NAVARRA 28,302.12 145,820.62 77,046.62 362,426.44 613,595.80
PAIS VASCO 22,789.40 77,123.21 73,389.13 359,448.01 532,749.75
LA RIOJA 34,082.99 182,668.91 5,454.95 84,382.79 306,589.63
VALENCIA 153,895.86 767,102.17 13,356.79 357,500.19 1,291,855.00
TOTAL 4,995,051.47 11,095,504.98 2,532,426.33 18,622,982.78 8,670,788.59 27,293,771.38
Source; LPIS 2013
Finally there are also other relevant data sources that contain relevant data sources. These include the Spanish Forest Map (Mapa Forestal de España (MFE50)55). It was developed by the Environment and forestry departments of MAGRAMA. There is also Sistema de Información sobre la Ocupación del Suelo en España (SIOSE)56 which is an integrated landuse data base developed by the Dirección General del Instituto Geográfico Nacional.
In Spain the semi-natural habitats are reported under the article 17 reporting using the data from the Spanish Habitats Atlas and Manual57. This Atlas
55 http://www.magrama.gob.es/es/biodiversidad/temas/ecosistemas-y-conectividad/mapa-forestal-
de-espana/mfe_50.aspx
56 http://www.siose.es/siose/
57 It was produced in 2000-2003 and further improved in 2004-5 and includes a cartography at 1:50,000 of Annex 1 habitats plus other semi-natural and natural habitats of conservation interest in Spain. It was produced as a development of the inventory of Annex 1 habitats generated for the proposal of Natura 2000 sites. The method was interpretation of aerial photos plus field visits where necessary. The cartography is freely available on the Ministry website (ttp://www.magrama.gob.es/es/biodiversidad/temas/espacios-protegidos/red-natura-2000/bases_ecologicas_preliminares.aspx).

113
provides a reasonable picture of the distribution of Annex 1 habitats in Spain and could be particularly useful to provide a reasonable picture of the Annex 1 hay meadows. But also for these data it will include several other semi-natural grasslands, especially the prados and praderas, that are actually significantly improved and therefore do not qualify as EVG. Furthermore, there are also gaps and imperfections in this Habitats Atlas because field visits could not be exhaustive and it is not regularly renewed.
So overall as to the statistical data we can conclude that part of the EVG are already registered and mapped, at least at the scale of municipality (Nuts 4,5). However, for some of the types, especially the prados and praderas a distinction cannot be made between non-improved and improved grasslands. This also is the case for the types of potential EVG registered in LPIS. Another particularly relevant issue in Spain is the limited coverage of LPIS for grasslands, particularly the EVG. All 3 categories referred to from LPIS, pastizales, pastos arbustivos, pastos arbolados, are theoretically eligible, but approximately 15 million ha do not have SPS rights and therefore will be excluded from the new Pillar 1 basic payment at least following the EU definition of permanent grasslands unless the Spanish government decides to include the non-herbaceous dominated categories of grazing land. In conclusion it means that there is not one database that identifies EVG in Spain in an acceptable way, but that a combination of data sources will provide a reasonable picture of the most important EVG areas in Spain. For the vast areas of poorer pastures and high mountain pastures, the MCA (Mapa de Cultivos y Aprovechamientos of the Spanish statistical office) categories indicated above provide a reasonable picture of the current distribution and location. For pastures/meadows on better land (prados/praderas) there is no complete data set that distinguishes semi-natural from more intensively farmed land58. The Spanish Habitats Atlas may provide a reasonable picture for Annex 1 hay meadows, this would need to be verified though by combining it with detailed spatial information on species richness. But there may be considerable areas of Prados that are Annex 1 hay meadows but do not qualify as EVG because of abandonment or too intensive management. The best solution may be to create a new MCA or LPIS category for Prados to distinguish them from Praderas (improved grassland), based on information on the number of years since cultivation and management (e.g. mowing and livestock regime and input levels).
58 Note that Navarra has a separate category for traditional hay meadows that is probably an
approximation to EVG

114
Sweden
In Sweden most of the semi-natural grasslands are inventoried and included in two databases:
1) The TUVA database59 which is the national inventory of biologically valuable grasslands. In this database the grasslands are categorized and if they are valuable, in terms of biodiversity, similar to the definition above, about 25 parameters are gathered including plant species according to a list of indicator species (see Figure 4).
2) The Forest Statistics60 also include fairly much grasslands. The Forest Statistics is inventoried primarily but spatially specific information of productivity and volumes of tree-stands are also collected including information on biodiversity within forest and the included grassland areas.
Both data sets are continuously improved and up-dated but as all datasets it has some problems e.g. may lack grasslands that are not known (small areas in remote places etc.) and some grasslands that are abandoned but still may be restored if management is reintroduced. Overall one can use the TUVA to identify the majority of the EVG and complement it with data from the forest statistics to obtain a full national coverage. For the allocation of AEP the TUVA data was also crossed with the LPIS blocks. There is also a voluntary dataset of presence of species (all species, everywhere) the Species Gateway61. It contains species observations by volunteers and now includes about 35 million observations from 16 000 persons. This system will never be complete. It has limitations however as there is a bias for reporting on species occurring in the most accessible places. Furthermore very common species are not reported in the same relation to their actual abundance compared to rare species. As to statistics and permanent grasslands it is clear that in the agricultural census permanent grasslands are registered as one class, making it impossible to exclude the unimproved from the improved ones. As to registration of permanent grasslands in LPIS the study by Beaufoy et al. (2010) showed that there are large exclusions particularly of Annex 1 grasslands (e.g. Alvars, wood pastures). LPIS therefore do not seem to be a good basis for the identification of agricultural use of the grassland habitats identified in the 2 databases discussed above. Furthermore one can doubt whether the blocks identified for AEP are covering the most valuable EVG grassland habitats. In conclusion it means that for the identification of EVG in Sweden the data from TUVA and the Forest statistics are the best basis. However to filter the agriculturally used and extensively managed farmlands from these 2 databases the LPIS blocks
59 https://etjanst.sjv.se/tuvaut/site/index.htm 60 http://www.slu.se/en/webbtjanster-miljoanalys/forest-statistics/
61 http://www.artportalen.se/

115
suitable for AEP are not a sufficient basis as they exclude important EVG. This therefore requires additional data collection on farmland management information for the areas identified as biologically valuable grasslands in TUVA and the forest statistics. Figure 4: View of TUVA data showing location and extend of different Annex 1
semi-natural habitats in Northern part of Gotland
UK
In the UK, semi-natural grassland include what are called semi-improved grasslands, which are of long-standing, but are impoverished in higher plant species. In the case of such grasslands, the high biodiversity is found in other species groups, including fungi and invertebrates (see example of the Curragh of Kildare in Annex 3) . There are different data sets available that can be used to identify at least part of the EVG in the UK. For designated sites the Common Standards Monitoring CSM62 is carried out by regular site visits. The monitoring results in a detailed breakdown of habitat and land use types (including Annex 1 habitats of Community Interest), which allows for the calculation of totals for EVG. This may on a case by case basis also be available for UK-designated Sites of Special Scientific Interest. These sites however cover a mere fraction not only of all EVG, but of all Annex 1 habitats in the UK. The
62 See http://jncc.defra.gov.uk/page-2199

116
published figures for the individual habitats do not distinguish what proportion of which habitats are used for agriculture (though this may be available in the original data). Last collation of data on Annex 1 habitats was for 2007 Article 17 report, next one in 2013. However, this periodic reporting should also cover the extent and condition of Annex 1 habitats outside protected sites. In the UK, there is a broad overlap between these habitats and those listed in the UK Biodiversity Action Plan process (under a different classification; correspondence tables have been published) as priority habitats. Such data should be reliably precise at at least the UK and regional levels. It does not however cover all EVG (see Annex 3). In the UK Land Cover information system ‘improved grassland’ are separated from other, semi-natural, grasslands along the same dividing line as has been found to be significant in studies of grassland fungi, for example (in UK National Vegetation Classification terms, in the middle of the MG6 mesotrophic grassland community). Assuming that the classification is accurate for this distinction, the UK Countryside Survey and Northern Ireland Countryside Survey should therefore provide a value for EVG in the UK. To obtain a better estimate of the farmed EVG figure, a correction must be made for the difference between census and LPIS grasslands of approximately 1.5 million ha. This is partly related to the fact that in LPIS the focus is on land that applies for CAP payments and non-eligible hectares are generally excluded. It should be noted however that not all potentially eligible land is claimed. Some grasslands in the UK are BAP priority habitats and these should certainly be part of EVG. Their extent is reported as part of the Countryside Survey (CS)63. The CS is based on a combination of remote sensing and aerial photography of the whole UK complemented with with sample based ground-truth information on species and management. The last CS was held in 2007 and the results are used to inform the Annex 1 reporting outside designated areas. Agricultural census data and the Land Parcel Information System (LPIS), which is a separately-collected subset of the census population, are not suitable sources for an estimate of EVG. Two main classes suggest themselves, namely Rough Grazings and Permanent Grassland (with minor areas of Grazed Woodland). While Rough Grazings is reliably semi-natural, Permanent Grassland contains a large area of fertilised grasslands, as well as grasslands previously reseeded, which are not separately identifiable in the dataset. Grasslands appearing in the census but not in LPIS are almost wholly not in current agricultural management, and will be overwhelmingly semi-natural. They amount to around 1.5 million ha in Scotland, which illustrates that census data should always be used with care. Individual census returns do not include shares in common land, but the common land figure is usually included in gross figures at regional, national and UK level.
63 http://www.countrysidesurvey.org.uk/outputs/uk-results-2007
http://www.countrysidesurvey.org.uk/reports-2007

117
Overall it can be concluded that the closest identification of EVG in UK data sets is coinciding to the semi-natural habitats from the Countryside Survey, but with the caveat that some are not farmed; an LPIS mask is therefore always necessary. The sum of Countryside Survey non-woodland, non-rocky, semi-natural terrestrial habitats gives an estimate of semi-natural grasslands; agricultural land use data summarised in the annual Economic Report on Scottish Agriculture64 can be used to correct the data for England, Wales and Northern Ireland; for Scotland, the total land used to claim SPS must also be used to exclude non-farmed rough grazings. It would be preferable to have access to such data for the other countries as well (e.g. to exclude lowland raised bogs), but the effect on the final figure in the other countries is likely to be much less significant. For an improved identification of EVG in the UK there is no need to improve the existing data sets or create new data sets. The current data sources discussed above cover well the EVG extent. For the assessment of condition; it is not clear if a meaningful statement of condition would be possible given current knowledge, though it is done for more ‘valuable’ habitats.
64 http://www.scotland.gov.uk/Publications/2012/06/6894/downloads

118
ANNEX 13 COMMON LAND REGISTRATION IN FSS AND OTHER NATIONAL DATA SOURCES
Table 1 The situation of common land registration per EU country
Source :http://epp.eurostat.ec.europa.eu/statistics_explained/index.php/Common_land_statistics_-
_backgrounds
In what concerns common land as it is specified in the table 1, countries can be classified into different categories:
a. Common land simply does not exist (Belgium, Czech Republic, Denmark, Estonia, Latvia, Lithuania, Luxembourg, Malta, the Netherlands, Poland, Slovakia, Finland and Sweden).
b. Common land is included in the land use data of the agricultural holdings making use of the common land (Slovenia, Croatia) included all the common land in the area of the agricultural holding which makes use of the common land. In Italy, Germany, Cyprus, Spain and Hungary an unknown part of the common land was included in the area of the holdings making use of the common land, this happened in cases where common land was used by a single agricultural holding. In all of these cases the area of common land is proportionally included in the area of the agricultural holding making use of the area and the livestock grazing on the common land belonging to the agricultural holding is included in the number of livestock of the agricultural holding.
c. Common land is included as special holdings, the common land holdings. Countries that used this option and provide data representing agricultural holdings, but also records representing the common land holdings. Common land is often offered by a legal unit or the municipality or parish as a service to agricultural holdings. Such organisations are not agricultural holdings as they do not produce agricultural products, they provide a service to agricultural holdings. Farmers can use the common land for grazing of their animals. France, Portugal, Bulgaria, Romania and Austria recorded all the common land in the area of the common land holdings. In Italy, Spain, Germany and Cyprus a part of the common land was recorded in the area of the common land holdings. A disadvantage is however that the area of common land however is recorded in the area of the common land holding providing the service to agricultural holdings with livestock, while the livestock grazing on these areas are recorded in the numbers on livestock of

119
the agricultural holdings. There is therefore no direct relation between the area of common land used by a specific agricultural holding and the number of livestock using this common land area nor with characteristics of the farm manager making use of the common land area.
d. Common land is collected at regional level and included in regional records. Countries which use sent records with data representing agricultural holdings, but also records not representing some kind of holding but representing the regional sum of the common land. In the United Kingdom, Ireland and Greece all the common land was aggregated in records at regional level. In Hungary a part of the common land was delivered in records at regional level. Again the disadvantage is that the area of common land is recorded in a specific record at regional level, while the livestock grazing on these areas are recorded in the numbers on livestock of the agricultural holdings so there is no direct relation between the area of common land used by a specific agricultural holding and the number of livestock using this common land area nor with characteristics of the farm manager making use of the common land area.
Table 2: Common land registered per MS in 2010 in SAPM
ha: Utilised agricultural
area
Common land area Rough grazings: Permanent grassland
and meadow
total ha permanent grassland
ha
Forest land ha
other land ha
total agricultural
land ha
% UAA Description
Austria 2878170 252872 252872 8.8%
Bulgaria 4475530 858563 858563 858563 19.2% Much common land is not registered as not part of UAA
Cyprus 118400 805 721 4 27 752 0.6%
France 27837290 750000 747000 0 3000 750000 2.7%
Germany 16704040 0.0% no estimates available although common land exists
Greece 5177510 1698949 1698949 32.8% data are not broken down by type of grassland and they do not specify whether these are used for grazing or not
Hungary 4686340 426033 73975 201192 150866 73975 1.6% All Common land registered as permanent grassland and meadows and rough grazing land
Ireland 4991350 422415 422415 422415 8.5% All Commonage registered as rough grazing land
Italy 12856050 610165 610165 610165 4.7% The common land concerning wood and non agricultural area has been excluded from the survey before hand and therefore not registered at all
Portugal 3668150 171351 127491 43691 169 127660 3.5%
Romania 13306130 2062334 1497764 358407 206163 1497764 11.3%

120
Slovenia 482650 8221 8221 8221 1.7% All common land are registered as rough grazing
Spain 23752690 4205593 - - - 1727618 7.3%
UK 16881690 1195246 1195246 1195246 7.1% All Common lands are registered as rough grazing land
Source: Overview is based on Eurostat (2012). Common land statistics – backgrounds. http://epp.eurostat.ec.europa.eu/statistics_explained/index.php/Common_land_statisti
cs_-_backgrounds Based on Eurostat65 an overview can be given of the registration and importance of common land in different EU countries: In Spain for example in 2010 4 700 common land holdings were included in the Census covering 4,205,593 hectares of which 1,727,618 hectares (only 41%) were considered to be agricultural. Since no information on livestock presence is collected for these lands it cannot be established whether they are grazed and thus potentially EVGs. This has been assessed for the census, but for the Spanish LPIS the same problem applies. In France the situation is different however, there were 1,410 common land holdings registered in 2010 managing and providing common land covering 750,000 ha UAA, of which 99.6 % is still grassland and maintained by grazing. These holdings are legal units, paid by stockbreeders for the service and they fill declarations for Common agricultural policy (CAP) subsidies (about grassland) and give back those subsidies to the stockbreeders proportionally to the number of animals they sent to the common land. It is likely that most of these common lands are EVGs. The problem of registration of common land seems to be tackled which implies that both in FSS and LPIS it is likely to be largely included. In Ireland there were 421,041 hectares for 2007 and 422,415 hectares for 2010 of common lands (Agricultural Ministry (DAFM)). There were 13,578 agricultural holdings which indicated on the questionnaire that common land was used in 2010. The Commonage data collected by DAFM provides a total commonage area of 422,415 hectares in 2010. The information on commonage land only refers to eligible area of all commonages declared for the purposes of all area-based schemes. The results in Ireland were based on a complete inventory and therefore provide data at the level of NUTS 4. These records showed that in Ireland common land is always permanent grassland in the form of rough grazing. Thus common land is likely to be well registered in most cases both in the agricultural statistics as in LPIS. There is very little common land left in Scotland. Historically most of it was absorbed into private estates in the 1500s and late 1700s. However, crofters secured common
65 Eurostat (2012). Common land statistics – backgrounds.
http://epp.eurostat.ec.europa.eu/statistics_explained/index.php/Common_land_statistics_-
_backgrounds
http://epp.eurostat.ec.europa.eu/statistics_explained/index.php/Common_land_statistics_-_backgrounds
http://epp.eurostat.ec.europa.eu/statistics_explained/index.php/Common_land_statistics_-_backgrounds

121
access and grazing rights in the mid-1800s and this remains the most the suitable proxy for common agricultural land in Scotland. The Scottish Government and the Crofters Commission hold a register of the common grazing area for Scotland; however the data held relates simply to the recorded area, it does not include details on the farming activity taking place. This register was used to derive areas of common grazing at the NUTS 3 level for SAPM inventory. In England although not included in the Commons Registration Act this land is subject to grazing rights in much the same way as registered commons. The data supplied are based upon “rights to graze” not actual grazing. In England where a farmer has a legal right to use a common they may be able to activate Single Payment Scheme entitlements. The Common Land Register gives the farmer the right to graze a number of animals. Each farmer receives a notional common area based on: total area of the common (ha)/total capacity of the common (LU); the number of rights claimed (LU). Thus the estimates of common lands are based on all common land, as in most cases even un-grazed land will still have some payments claimed against it and must therefore be managed and kept in good agricultural condition. The registered commons dataset is largely at the Local Authority level (NUTS 4).

122
ANNEX 14 ECOLGICALLY VALUABLE GRASSLANDS AREA ESTIMATES FROM EXISTING SOURCES
Eurostat 2010 FSS (ha) National data
Country
Pasture and meadow (ha)
Permanent grassland and meadow - not used for production, eligible for subsidies (ha)
Rough grazings (ha)
Main national source
Year Website Permanent grassland area total(ha)
Categories (ha) of permanent grassland distinguished Rough estimate of % EVG in total permanent grassland area
Austria 886,470 3,480 549,520 Grüner Bericht, data included on permanent grassland come from LPIS (INVEKOS)
2012 www.gruenerbericht.at 1,440,000 Mountain meadow & Alpine grasslands (397,440 ha)/ Meadow and wet to half dry basophilic grasslands and set-aside with grassland (31,680 ha)/Permanent grassland for grazing (Feldfütter) (144,000 ha)/ Meadow/grassland with multi-uses with limited cutting regime (485,280 ha)/Permanent grassland with limited cutting regime 67,680 ha)/Wet nutrient poor grassland, used for cutting and grazing with low input management (256,320 ha)/Traditional grassland within wider forested land used for grazing with stocking density >0 <1 LSU/ha (57,600 ha)/Permanent grassland and meadow - not used for production, eligible for subsidies (3480 ha) 20%-50%
Belgium 491,230 5,510 2,940 Landbouw enquête 2010
2010 http://statbel.fgov.be/nl/modules/publications/statistiques/economie/downloads/agriculture_-_enquete_agricole_de_2010.jsp
499,686 Permanent grassland & meadow for mowing (138388 ha)/Permanent grassland for grazing (352,773 ha)/Permanent grassland and meadow - not used for production, eligible for subsidies (5,585 ha)/Rough grazing (2,940 ha)
<5% Bulgaria 628,070 56,060 556,460 Agrostatistics 2009 http://www.mzh.governm
ent.bg/MZH/en/ShortLinks/SelskaPolitika/Agrostatistics/Land_Use.aspx
1,701,990 Productive meadows (441931 ha)/Alpine meadows (127799 ha)/ Low productive grasslands (1113371 ha)/ Meadow orchards (18889 ha)
30%-50% Cyprus 1,230 130 780 n.a. n.a. n.a. n.a. n.a.
n.a. Czech Republic
909,010 9,710 10,100 n.a. n.a. n.a. n.a. n.a. n.a.

123
Denmark 101,260 62,510 36,080 Agricultural survey
2012 http://www.dst.dk/en/Statistik/emner/landbrug-gartneri-og-skovbrug/landbrug-mv-produktion-og-anvendelse.aspx
205,431 Statististical census data report: Permanent grassland out of rotation (200,413)/Set-aside with grass (5018). However in LPIS there are 11,000 ha of permanent grassland reported with very low yield and low input. These are EVG. Furthermore there ar also approx 70,000 ha of permanent grassland under AES. Not all of these will be EVG with no improvement and most of these will overlap with the low input grasslands. Roughly 50% of these are likely to be low input and high biodiverse.
10%-20% Estonia 186,640 109,430 0 Estonian
Nature Information System, EELIS
2013 http://register.keskkonnainfo.ee/envreg/main#HTTPpaaZR4K7qV4JRCQgsN3RJ3LMYFFkZ3
296,065 Semi-natural habitats (within and outside of Natura 2000 network) based on inventory made by Estonian Semi-natural Community Conservation Association (ESCCA) (79, 000 ha)
20%-40% Finland 9,950 0 23,000 Land use
statistics Finland
2013 http://www.stat.fi/org/index_en.html
174,700 Grassland at least 5 years (31,600 ha)/Nature management fields (143,100 ha). Not all Nature management fields are likely to overlap with EVG as many will still have been improved and their biodiversity relatievely low. So the EVG should maybe around 50% of this area. 20%-40%
France 6,351,730 0 2,067,150 Agricultural Census and additional survey 'Enquête pratiques prairies permanentes 2006'.
2010 and 2006
8,418,900 Surface Toujours en Herbe peu productive (2 mln ha), but Enquête pratiques prairies permanentes 2006 indicates that 1/3rd of the permanent grasslands in France are non-fertilised (approx 4.2 mln ha).
30%-50% Germany 4,443,940 22,790 187,960 German
agricultural survey and seperate semi-natural grassland inventory (Sachteleben & Behrens 2010)
2009-2012
www.destatis.de 4,630,800 In agricultural census following categories: Grasslands for cutting (wiesen met schnittnutzung) (1,832,900 ha)/Meadows and mountain pastures (Weiden) (2,599,100 ha)/Low productive permanent grasslands (Ertragsarmes Dauergrünland) (180,100 ha)/ Permanent grassland and meadow - not used for production, eligible for subsidies (18,700 ha). Many of these still many inputs and species poor. In a sepearte inventory semi-natural grassland vegetation is estimated at 474,000 ha (Sachteleben & Behrens 2010) which is more likely to overlap with EVG.
10%-20%

124
Greece 272,970 16,690 2,160,580 (Hellenic Statistical Authority
2010 5,000,000 National Statistics (Hellenic Statistical Authority) also makes regular estimates of grazing land per village community in Greece. This grazing land has a broad meaning and refers to the uncultivated land, except forests, which is grazed by the domestic animals of each village community in a communal way and includes not only true grasslands but also shrublands and open forests. Total grazing land is reported to amount to about 5 million hectares every year 30%-50%
Hungary 22,350 0 698,550 n.a. n.a. n.a. n.a. n.a. n.a.
Ireland 3,117,420 1,430 859,690 Agricultural statistics Ireland
2010 http://www.cso.ie/en/media/csoie/releasespublications/documents/agriculture/2004/tables1to15.pdf
2,000,174 Permanent meadow (75,170 ha)/permanent pasture 1,925,004 ha). Most EVG will be in the rough grazing class as registered in FSS 2010.
20%-40% Italy 2,198,160 53,410 1,182,510 Agricultural
census data. 2010 http://dati-
censimentoagricoltura.istat.it/index.aspx?queryid=209&lang=en
3,434,073 Permanent grasslands (728,229 ha), Permanent pastures and meadows (2,652,434 ha), Natural pastures (1,469,928 ha), Rough grazing (1,182,505 ha). Half of the natural and rough grazing lands are likely to be unimproved and species rich. 20%-40%
Latvia 146,090 155,020 349,950 Latvian Fund for Nature, grassland inventory
n.a. http://www.ldf.lv/upload_file/28900/IvarsK_Latvia.pdf
n.a. 42000 ha of grasslands are covered in AEP.
n.a. Lithuania 535,760 70,110 0 n.a. n.a. n.a. n.a. n.a.
n.a. Luxembourg
67,330 200 70 10%-20%
Malta 0 0 0 n.a. n.a. n.a. n.a. n.a. n.a.
Netherlands
768,750 0 44,570 769,766 Permanent grassland (724,173 ha), Rough grazing (45,426ha) and Rough grazing with limited agricultural activity (167 ha) < 1%
Poland 2,945,340 214,910 68,960 n.a. n.a. n.a. n.a. n.a. n.a.

125
Portugal 453,400 15,120 1,316,080 Agricultural Census 2009
2009 http://www.ine.pt/xportal/xmain?xpid=INE&xpgid=ine_publicacoes&PUBLICACOESpub_boui=119564579&PUBLICACOESmodo=2
1,827,899 1) Permanent grasslands improved with dominant herbaceous cover (322,849 ha) 2) Permanent grasslands unimproved with dominant herbaceous cover (570,131 ha))/ 3) Permanent grasslands improved with bushes/shrubs/matorral/montes (130,551 ha)/4) Permanent grasslands unimproved with bushes/shrubs/matorral/montes (745,950 ha)/ 5) Permanent grasslands improved with permanent cultures/trees/montado (6,717)/6) Permanent grasslands unimproved with permanent cultures/trees/montado (36,584)
40%-70% Romania 3,774,390 426,170 305,690 Agricultural
census data 2010 3,364,000
40%-60% Slovakia 437,230 14,870 79,180 National land
use statistics 2012 source:
http://www.statistics.sk/pls/elisw/MetaInfo.explorer?cmd=go&s=1006&sso=6&so=14
514,942
30%-50% Slovenia 235,820 0 49,900 n.a. n.a. n.a. n.a. n.a.
n.a. Spain 3,098,490 305,490 4,973,410 Agricultural
census registers all classes reported to Eurostat. More specific permanent grassland categories come from ENSYRSE (presented here)
2012 8,324,813 Unsown grasslands capable of mowing at least once per year. May have occasional trees. Irrigated.(35,214 ha)/Unsown grasslands capable of mowing at least once per year. May have occasional trees. Not-irrigated (905,417 ha)/High mountain seasonal grasslands (369,433)/Unsown dry grasslands with <20% shrubs and/or <20% trees. May be ploughed occasionally (4,740,075 ha)/Unsown dry grasslands with >20% shrub cover that may reach 100% if still used for grazing. Trees <5% (7,220,366 ha)
40%-60% Sweden 406,290 0 45,620
10%-20% United Kingdom
331,060 680 68,560 Agricultural census
2010 http://www.ons.gov.uk/ons/guide-method/user-guidance/well-being/publications/land-use-in-the-uk.pdf
10%-20%

126
ANNEX 15 SUMMARY OF RESULTS OF EXPERT QUESTIONNAIRE ON THE ISSUE OF FARMLAND AT RISK OF ABANDONMENT
Indicator 1 – Agricultural Land prices A weak land market can be an important (negative) driver for farm land abandonment (Terres et al, 2013). Data on agricultural land prices can thus be a valuable indicator for land at risk of abandonment. A recent EEA report on land prices (2010) concludes that at European level there currently exists only one public data base covering this aspect. Eurostat has some data at NUTS0 (national) level on land prices (EUR/ha) and rents, based on the annual questionnaires that National Statistical Offices fill out. This database does not include metadata. Moreover, the data is at too high a scale to provide sufficient detail for geographic analysis, such as
a comparison with land‑use data. Therefore it is not suitable for assessment of the risk of land abandonment at regional scale. The outcomes of the questionnaire on agricultural land prices make clear that most countries to some extent do have more detailed data available on agricultural land prices. Mostly at a regional level (e.g. Nuts 1-2) and occasionally on even a lower spatial level (Nuts 2+) (e.g. Bulgaria, Latvia, France, Sweden). Most data are collected at a yearly, or even monthly basis and data collection methods vary from questionnaires, (on-site) data collection, records of transactions or calculations based on (a combination of) indicators. In Finland1 for example the National Land Survey issues a publication referred to as the Real estate purchase statistics twice a year: annual statistics of the previous year in spring and biannual statistics of the current year in September. The statistics are produced on the basis of the purchase price register maintained by the NLS. The data in the publication is based on messages by notary publics and supplemented by municipalities and district survey offices. The register is public and contains all conveyances of real estate from the entire country since 1985. The most recent data from this NLS show, for example, that the price of arable land went up by 16% in the whole country in 2013 in comparison with the first half of the previous year. Considering the whole country and the first six months of the year 2013, the average price was 8 500 euros per hectare. The highest prices were found in the region of Varsinais-Suomi and Ostrobothnia, 12 050 euros per hectare. In the first six months of the year 2013, the average price of forest land in the country was 2 560 euros per hectare, signifying an increase of 7 percent. The number of purchases of genuine forest land was 1 400. The highest prices for forest land had to be paid in the region of Varsinais- Suomi, 5 000 euros per hectare. The lowest prices were found in Lapland where one hectare of forest land cost 800 euros.

127
Figure 1 Price index on agricultural land in Sweden (1995 – 2012 (1990=100)66
For example for Sweden, the estimations of agricultural land prices are based on information, collected by Statistics Sweden, from sales of whole or parts of agricultural estates and information from the taxation register for real estates. However, it must be mentioned that in Sweden rather few sales of exclusively agricultural land are performed each year. Most sales of whole or parts of agricultural estates also include buildings and other kinds of land. The method used takes account of this circumstance in order to eliminate the value of buildings and other kinds of land by using the assessed values to determine the proportion of the agricultural land value of the total selling prices. These prices are calculated both at NUTS II level and at the scale of ‘Production Area’ (see Figure 1). There are big differences in prices between different parts of Sweden. In the plain district of southern Sweden the prices were on average more than 10 times higher than the prices in the north of Sweden.
The responsible authorities for data collection vary between countries. In many countries it appears to be either a task of the National Statistical Institutes or of
66
http://www.jordbruksverket.se/webdav/files/SJV/Amnesomraden/Statistik,%20fakta/Priser%20och%
20prisindex/JO38/JO38SM1301/JO38SM1301_inEnglish.htm

128
(statistical boards of) the Ministry of Agriculture. In some of the countries there are (also) private organizations who have access to data on agricultural land prices. When asked about the reliability of the data on agricultural land prices only 2 country experts (Italy / Bulgaria) explicitly state that the available data are reliable. Others find it more difficult to judge, for example because access to the database is restricted. The expert from Latvia signals that data on agricultural land prices differ from prices in the real market. Thus, looking at this indicator of agricultural land prices, it is likely that the use of these national data could help to refine insights on processes of land abandonment at a national level. Even though, for some countries the spatial level at which these data are available are still relatively coarse. The biggest restriction however for an analysis at EU level seems to be the lack of consistency and comparability between data from different countries. Data are collected by different authorities, with different methods and at different time and spatial scales. It will most likely cost quite a lot of time and energy to harmonize these data. Indicator 2 - Revenue from touristic activities and other activities outside the farm A low farm income and low farm stability or viability is likely to be a strong driver of farm (land) abandonment. However, besides the income generated from the main agricultural activities, the overall farm income and viability can also be strongly influenced by other sources of income coming from activities such as tourism. There are many examples where these extra (non-agricultural) activities and sources of income compensate for an otherwise modest income from agricultural activities. Especially in regions with a relatively small scale agriculture, or regions with specific (natural) handicaps for farming it often is a very conscious strategy of farm household members to diversify activities in order to obtain a more stable farm income. Thus, information about the income and stability of the farm household should not only be based on the direct income from agricultural activities but should also include revenues from other (touristic) activities, on and of the farm. It is only the combination of these different indicators that can be telling about the viability of the farm and as such can give a better insight into the risk of land abandonment. One can only speak of an elevated risk of land abandonment if both sources of income are absent. The response of the national experts with respect to the data availability ‘revenue from touristic activities and other activities outside the farming activity’ results in a rather diffuse picture. Some country experts (Spain / Greece) state that no such data are available at national level. Still, we know that the Agricultural Census offers at least some kind of insight into this indicator and that at least for Spain these data are available for 2009 (see figure 2). This figure also illustrates that other revenues from activities outside the farm are also included in the Agricultural Census, such as for example the production and sales of renewable energy (wind, solar panels, biogas). In some countries and for some farm households this might actually be a substantial source of income.

129
Figure 2 Some variables with respect to rural development from the most recent agricultural census in Spain.
More countries (Italy, Latvia, France, Portugal) refer to the Agricultural Census when asked about the data availability on this indicator. Most country experts refer to the EU FADN data sources as well, updated yearly and based on samples of the agricultural sector. For other countries such as Italy and France, several data sources are mentioned with some data even available at farm level, some of which are collected quite frequently (one or two year intervals). Some of the Eastern European countries such as Bulgaria, Estonia, Latvia appear to have data available mostly at regional or national level, although some of these do not distinguish specifically between touristic or other revenues. The responsible authorities for (the collection of) these data are mainly the national Ministries of Agriculture and / or the National Statistical Institutes. In the case of Italy, the chambers of commerce are also mentioned as relevant organisations who collect data and information on the basis of farm’s declarations of annual revenues. With respect to the indicator on revenues from touristic activities and other activities outside the farm the added value of national data is not so clear. Some countries state to have no data at all on this indicator and for other countries the data do not seem to go beyond those already available at EU level (Agricultural Census, FSS, FADN). Even these EU-wide data sources are not mentioned by all experts which might suggest that this indicator is not always very familiar or fully used. As mentioned before, this indicator is only valuable to gain insight on the risk of land abandonment if it is analysed in combination with other indicators on the income from the primary agricultural activities.

130
Nonetheless, more frequent data on this indicator would be valuable. Thus it is promising to see that countries such as Bulgaria, Latvia and Estonia appear to have reliable data which are collected yearly on a national and / or regional level. Indicator 3 - Age of the farm holder or main responsible of the holding The age of the farm holder can be seen a key indicator as it might be related with driving forces regarding (low) farm stability and viability. Investments on the farm, and farm manager qualifications might both be negatively correlated with the age of the farm holder. According to the questionnaire, all countries, except for Greece, have access to one or more data sources that can provide information on the age of the farmer. For most countries, these are data at farm level which are mainly obtained through questionnaires. The Agricultural Census and Farm Structure Surveys are mentioned most frequently. In Italy the chambers of commerce also have information on this indicator and so does the Rural Support Service in Latvia. The responsible authorities for these data are mainly Statistical Institutes (Italy, Estonia, Latvia, Spain) and the Ministries of Agriculture (Bulgaria, France). In addition to the Agricultural Census published every 10 years, several country experts refer to additional data sources based on more frequent (every 1 or 2 years) data collection. Especially Latvia, Bulgaria and Italy appear to have access to data on this indicator that are more frequently collected and more detailed. Most experts state that the data on this indicator are reliable, or at least that they have no reason to doubt the reliability. The figure below shows an example of the available data on this indicator for Portugal. The map on the left shows the elevated weight of elderly farmers, especially in the central areas of Portugal (Beira Interior) and some southern parts of the Algarve. There are some municipalities where the share of farmers over the age of 55 is up to 80%. The central map on the variation of elderly farmers shows that in absolute numbers most municipalities have seen a decline in the number of elderly farmers in the period between 1989 and 1999. However, as the map on the right hand illustrates, this is not a sign of rejuvenation of the agricultural sector as the decline in elderly farmers has been less strong than the overall decline of farmers. As a consequence the relative share of farmers over the age of 55 has increased in almost all municipalities, most strongly in the western part of the country. This ageing agrarian population presents a serious problem for the future of Portuguese agriculture (see Figure 3).

131
Figure 3 Farmers over 55 years of age (Weight in 1999, Variation and Net Change, in relation to the total amount of farmers) (Pinto-Correia et al, 2006)
Indicator 4 - Farmers qualifications As with the age of the farmer, the indicator on the qualifications of the farm manager is also seen to be related with farm stability and viability. Following the response of the country experts, all countries appear to have data available on the educational level of the farmer, mostly based on questionnaires, carried out at farm level on a yearly (or 2-yearly) basis. Spain and Greece are the only countries that refer to a less frequent data collection for this indicator, referring to the 10 year Agricultural Census. Together with Estonia these countries are the only ones that refer to just one available data source. Questions on the education and qualification of the farmer or head of the farm are a standard part of Agricultural Census. As such the availability of the national data on this indicator seems to be promising to improve the insight on land at risk of abandonment. Even though the Agricultural Census is only carried out once every ten years, in combination with other indicators (e.g. age of the farmer) this indicator might actually be quite telling. Similar to the data on the age of the farmer, most experts state that the data on this indicator are reliable, or that they have no reason to doubt the reliability. The responsible authorities for these data are mainly Statistical Institutes (Italy, Estonia, Latvia, Spain) and the Ministries of Agriculture (Bulgaria, France). Indicator 5 - Farm and parcel size Information about low farm size, or low farm parcel size, can be crucial to understand dynamics of the agricultural enterprise and, especially in relation with other indicator, can refer to low farm stability and viability. As with the indicator on

132
‘of-farm revenues’ the outcomes of the questionnaire on this indicator result in quite a mixed picture. Data on farm size, at least in terms of area size, should be available in all countries from the farm census and agricultural farm survey data at variable spatial scales. Economic size information is available in FADN and also from several farm survey sources. National data will add to the EU wide data sources in terms of spatial resolution. Data on parcel size should be available from the LPIS systems which are available in all EU countries. The detail at which parcel size information is available depends on the system of registration that every country uses (see Figure 4). Some countries register the land uses at the parcel level which implies that all field boundaries are included in LPIS digitally. In other countries where land use is registered according to Farmer’s Block, Physical Block or Cadastral/topo parcel is registered not all field boundaries are digitised the identification of parcel size is more difficult or even impossible. In the countries where parcel level information is available the organisation operating the LPIS system can easily provide a good overview of the average parcel size at high spatial resolution without disclosing any information that cannot be disclosed because of legal regulations. Figure 4 Overview of possible registration method in LPIS
Source: Devos (2012). Presentation at the EFNCP-DVL workshop, Hungen December 14, 2012
In countries where LPIS does not register information at parcel level alternative sources of information can be used such as cadastre information, specifically

133
mentioned by the Greek expert as a source of information but also aerial photographs. There appears to be a wide range of responsible authorities, varying from the Ministries of Agriculture, Statistical Institutes, Rural Support Services and other organisations and institutions that hold relevant information on parcel size. Overall it is clear that improved information on farm size should be available from agricultural census data. As to field size information accessibility and time consuming data processing seems to be the largest problem and not absence of data. With the start of the reformed regulation of the direct payments, as from 2015 on, member states will have to register Ecological focus areas (EFA’s) for the implementation of the greening measures of the CAP. This action will improve the registration of field parcels, and thus will enable a better assessment of the field parcel size. Remaining questions on estimates for land abandonment Besides the specific questions with respect to the indicators country experts have also been asked the following questions:
- Whether they think it is possible to give an estimate of farmland abandonment from existing data sets?
- How they think existing data sets could be improved or altered? - If relevant national data bases can be shared in the context of this study? - If there is a possibility to assess the area that is eligible or not for CAP
payments? With respect to first question, most country experts, except for Greece and France, respond that it would be possible to give an estimate of farmland abandonment using existing data sets. Suggestions on how to carry out this estimation are diverse and some of them are quite detailed. An interesting exercise could be to exchange the various suggestions between the different country experts and check whether some of the suggestions from one country could be valid for others as well. In Greece the extent of land abandonment is limited due to maintenance of CAP payments. This is also confirmed by the Greek expert that was consulted on Ecologically Valuable Grassland and was asked about abandonment in these type of areas. He states that several farmers, especially sheep owners, prefer to feed their animals with concentrate feed to increase the milk production thus avoiding grazing their stock in grasslands, often communal lands, which are unimproved and therefore inferior in quality to concentrates. He therefore confirms that abandonment of extensive communal grasslands is seen a lot in Greece because of changes in feeding practices. In order to obtain a good understanding of the level of abandonment the Greek expert therefore advices for the need to register the grazing time per type of land. From this register a more reliable understanding can

134
be obtained from the level of abandonment of grasslands. Nevertheless, according to the experience of this expert from his journeys around the country is that the categories closest to EVG are still grazed. What has changed and is affecting their structure (e.g. shrub invasion) is the cessation of firewood collection by the local people, although this seems to be changing lately due to the economic crisis. For France land abandonment is difficult to assess because there is no geo-referenced database. A study by Pointereau et al. (2008) did make an estimation making a comparison of land uses between 2 census data using a number of different data sources. From these data only an idea of the risk for abandonment was derived, but hard figures on real abandonment could not be obtained. With respect to the second question, several suggestions have been made on how to improve existing data sets? Some of these are:
- To concentrate data collection in one body and develop an exhaustive list of indicators;
- To harmonize the methodology for identification an specification of land categories used by different authorities;
- The use of LPIS, geo-referenced; - To improve data collection, using remote sensing and ground data.
When asked whether relevant national data bases can be shared in the context of this study the respondents come up with several suggestions and links. Some of them state that it is quite time-consuming to find the right data and that it is necessary to specify the required information. Bulgaria comes up with the suggestion to ask a (Phd) student to complete the task of data gathering if needed. Finally, when asked whether there is a possibility to assess the area that is eligible or not for CAP payments most respondents state that these data can be found, often through LPIS / IACS data systems. However, from studies already discussed in Chapter 2 and 3 it has become clear that definitions of agricultural area and of permanent grasslands are a main reason why in many countries only part of the lands used for grazing are eligible for payments. The situation differs strongly per country however. In countries where there are many non-herbaceous and common lands used for grazing, e.g. Spain, France, Greece, Portugal, Scandinavian countries, it is up to the countries choices to include or exclude part of these lands from payments. The MARS website marswiki.jrc.ec.europa.eu guidance clarifies this further as follows: • With regards to shrubs, rocks etc., the conditions under which these elements can be considered as part of the agricultural parcel should be defined on the basis of the customary standards of the Member State or region concerned (e.g. land cover type, maximum area percentage). • To assess the eligibility of / eligible area within an agricultural parcel of (permanent) pasture, Member States can use a reduction coefficient, which can take the following forms: • a pro rata system whereby the eligible area taken into account is determined according to different thresholds applied at the level of each parcel. For instance, if

135
the crown cover determined on the ortho-imagery and recorded as such in the LPIS-GIS ranges between 25% and 75%, the parcel is considered as 50% eligible. The example of Spain further clarifies this situation. The LPIS data from 2013 show that approximately 86% of the total area of pastures on LPIS are in the categories of pastures with trees (PA) and pastures with shrubs (PR). These LPIS categories have 40-100% shrub cover and 40-80% tree cover. They amount to 16 m ha. in total. By contrast “herbaceous” pastures (PS) cover only 2.5 m ha, but note that this category of pasture can include up to 40% tree/shrub cover, so even this type is far from being purely herbaceous. Still these categories are eligible for direct payments. The categories of land that are not eligible are registered in Spanish LPIS in the category Forest. Note that LPIS registers all categories of land managed by farmers applying for payments, even if not eligible. From a case study elaborated by Beaufoy (2013)67 it became clear that the threshold for eligibility of grazing lands in Spain is set at a maximum tree crown cover of 75%. However, Beaufoy also shows that there are large areas with crown cover above this threshold that are used for grazing and thus excluded from payments. In Greece common lands are generally well registered as part of LPIS grazing lands. This is because the area of common land in each village community is allocated every year to livestock owners-residents of the village- according to the number of animal they possess so that they get the corresponding CAP payments. This is done because most grassland are not private but public or communal lands with the municipalities having the right of use. This right is subsequently transferred to the individual farmers after having paid a small fee to the Municipality as a tax. Whether these area are really grazed is not known however. Therefore it is likely that in this case payments are paid to lands that are actually not grazed. More information on eligibility particularly on extensive grasslands can be derived from Chapter 4 of the main report (Box 5.4) and related country descriptions in Annex 12.
Country Links Italy http://www.rica.inea.it/public/it/articoli.php?action=list&id_cat=3
www.pacioli.org
Bulgaria Detailed information is necessary to be obtained from the National statistical / Office, SAPI, and some other institutions and organisations, and it is not free of charge.
Estonia http://pub.stat.ee/px-
web.2001/dialog/varval.asp?ma=AGS204&ti=MANAGERS+BY+LEGAL+FORM+OF+HOLD
ER%2C+SEX+AND+AGE+GROUP&path=%2E%2E%2FI_Databas%2FEconomy%2F01Agric
ulture%2F06Structure_of_agricultural_holdings%2F06Labour_force%2F&xu=&yp=&lang=1 http://pub.stat.ee/px-web.2001/Dialog/statfile1.asp
67 Beaufoy (2013). Review of grazing in non-herbaceous areas in Spain; their use and extent. In;
Report for Grassdate Project (2012/S 87-142068). Methodological studies in the field of Agro-
Environmental Indicators. Lot 2. Grassland areas, production and use.

136
Latvia http://www.lvaei.lv/upload/VPM_atskaite_LANN.pdf http://www.lvaei.lv/upload/223_pasakuma_atskaite_072012_LVAEI.pdf
Greece The only possibility on data availability can be only from national statistics. The data you ask above are difficult to have. The only reliable way is to select pilot areas and to run specific questionnaires.
Spain Although many of the databases are available for download at the respective producers’ websites, downloading and preparing data in a suitable format (often there is not an option for downloading data for the whole country in one step) may take considerable time. http://www.ine.es/jaxi/menu.do?type=pcaxis&path=%2Ft01%2Fp042/E01&file=inebase&L=0
France http://www.agreste.agriculture.gouv.fr/recensement-agricole-2010/ As for LPIS, the layer is accessible through official website of national geographical institute http://www.geoportail.gouv.fr/accueil
Finland http://www.maanmittauslaitos.fi/kauppahintatilastot
Portugal http://ra09.ine.pt/xportal/xmain?xpid=RA2009&xpgid=ra2009_apresentacao
Sweden http://www.jordbruksverket.se/webdav/files/SJV/Amnesomraden/Statistik,%20fakta/Priser%20o
ch%20prisindex/JO38/JO38SM1301/JO38SM1301_inEnglish.htm https://www.jordbruksverket.se/swedishboardofagriculture.4.6621c2fb1231eb917e680002462.ht
ml http://www.scb.se/Pages/SubjectArea____8680.aspx

137
ANNEX 16 DETAILED NATIONAL EXPERT RESPONSES TO QUESTIONNAIRE OF FARMLAND AFFORESTATION
Bulgaria
Bulgaria has not implemented the farmland afforestation measure. However, measure 223 for the afforestation of non-agricultural land is implemented. According to the national RDP annual report for 2011, by the end of the year 44 applications for afforestation of non-agricultural land had been approved for a total of 1,467 ha. By the same date only 21 applications (761 ha) had been paid. At the moment the key beneficiaries are the state forestry units and municipalities. Objectives The objectives of the measure are: Enhance the forest cover in order to contribute to climate change mitigation and to support natural biodiversity. Diminish soil erosion and avoid land marginalization. Improve the water balance in the supported afforested and neighbouring areas. Targeting and protection mechanisms All non-agricultural land is eligible in: areas belonging to municipalities with average forest cover less than 60%; areas with high and medium risk of soil erosion according to national classification done by the Soil Resources Agency[1]. For the purpose of this measure non-agricultural lands include: Abandoned agricultural land – agricultural land which was not in agricultural use for at least three years preceding the application for support for afforestation. Not afforested forest fund lands – lands located within forest areas that have never been afforested in the previous 15 years before the application for afforestation, but excluding environmentally valuable areas. Provision and criteria for the designation of areas to be afforested: All kinds of afforestation to be supported under this measure should be for environmental purposes only. Existing forests, urbanised territories, High Nature Value abandoned agricultural land, meadows and pastures are not eligible for support for afforestation. In designated Natura 2000 sites afforestation can be supported only if such activity is explicitly written in the Management Plan/Order for designated protected zone of the specific site. Environmental effects There are estimated to be as much as 800,000 ha of low-productivity grasslands recorded on LPIS as non-agricultural land and there is a concern that EVG may be
[1] about 80,6% of the whole territory of the country

138
threatened by this measure. The exclusion from eligibility for afforestation of High Nature Value abandoned agricultural land, meadows and pastures, and the special requirements in Natura 2000 sites, seem in principle to prevent this threat. However, no data is available on the type of land afforested to-date, or on the environmental effects.
Czech Republic Farmland afforestation under EU measures has affected 4,301 ha since 2004. In addition there were 7,433 ha afforested under similar national schemes from 1994 to 2004. Objectives The objectives of the measures in the period 2004-2006 were: Permanent decrease of agricultural land Increase the forest areas and support of biodiversity in landscape, Support of sustainability of rural areas, Diversification of farms, Improvement of ecological stability in rural areas. The objectives of the measures in the period 2007-2013 were: Increase of forest area on agricultural land, Sustainable use of forest and agricultural land, Improvement of environment and landscape. In terms of previous landuses, the data shows an approximately 50/50 split between arable land and grassland. The new forest plantations are also divided approximately 50/50 between conifer and broadleaved plantations. Data is not available on whether the species used are native or exotic. Targeting and protection mechanisms In the Czech Republic the main policies regulating the afforestation process are: Forest law Agricultural law Law on protection of environment Respecting Cross-compliance (GAEC, SMR) For each project there should be approval provided by regional office for nature protection (unde Ministry of Environment) It is reported that the policy structure is helping to improve the enforcement of legislation, and that the control and sanctioning mechanisms are working quite well. However, the approval process sometimes fails to notice that the land for which afforestation aid is applied is a valuable grassland habitat (EVG). Although the MS has a wel-developed inventory of grassland habitats, this is not complete outside protected areas. It is estimated there is about the same area of valuable grasslands outside protected areas as inside (in total about 40% of all grasslands in CZ). The

139
inventory outside the protected areas is not well established (only provisional/not final) and most importantly it is not approved as a tool for policy implementation. The database is going through revision these years by visits and mapping on site. Municipalities have no access to this data, yet they are responsible for approving afforestation projects outside of protected areas. Therefore it can happen from time to time that a valuable grassland is afforested, although the extent is thought to be not large. Environmental effects According to the Czech Ministry of Agriculture, the following results were achieved. 2004-2006: Forests increased by 0,08 %; Size of wood „storage“ on forest land incresed: in 2006 was 507 m3, in 2056 expected 937 386 m3; Broadleaves 49,5 % and conifers 50,5 % of forest areas. But afforestation by broadleaves only by 36%. I.e. it is supposed the overall structure of forests inproved; Increase of C sequestration: In 2006 according model was sequestred on afforested land 176 t C and in 2016 is expected there 289 796 t CO2; Limited effect on secured jobs by 10 persons increase, Subscheme of afforestation by wood for Antal coppice by 25 persons, but mostly seasonal employment Conservation of genetic diversity and biodiversity was secured. Current programme (not finished yet): Forests increased by 2031 ha The sequestration potential of the afforested area is in total 24,5 Gg of CO2; Conservation of genetic diversity and biodiversity was secured. From this information, the only concrete environmental gains are those relating to CO2 sequestration. It is not clear whether the counterfactual situation of sequestration on previous landuses has been taken into account (i.e. to what extent sequestration is higher on afforested land compared with permanent pasture). The biodiversity gains are not specified in terms of habitat types or species. As explained above, some small losses of EVG are possible.
Denmark
Around 17,800 ha of farmland have been afforested since 1992 under the EU-funded afforestation measures. In addition during the same period there have been 7,350 ha of afforestation on public land, some of which has received support under EU measures but the data is not readily available. There have also been 9,400 ha of private afforestation without support from public funds.

140
The land afforested is almost entirely arable land (92% according to the MTE evaluation for 2000-2003), as permanent grassland generally is protected from afforestation in Denmark. For private afforestation the figures on tree species composition in the afforested areas in 1989/2000 were 94% broadleaved and 6% conifers (The Nature Agency, 2010). For the areas afforested by the state the corresponding figures were 69% broadleaved and 31% conifers. This varies quite a lot from forest on dunes (43/57%) to areas in the eastern part of the country (85/15%) (The Nature Agency, 2010). For the period 2000-2003 the private afforestation under the RDP resulted in 95% of the area covered by broadleaved species (Direktoratet for FødevareErhverv, 2003). Objectives There are three measures with slightly differing features, but in essence the objectives are: to add to the extension of the forest area to protect important ground water reserves used for drinking water for general biodiversity improvements increased carbon storage social benefits from new forests The Danish RDP in the current version consist of three measures: First afforestation of agricultural land (in designated afforestation areas) with the objective to support the establishment of 750 ha private forest annually in designated areas where afforestation is desirable (see Q9 on the designations) First afforestation of agricultural land (in designated neutral areas where afforestation is possible) with the objective to support the establishment of 600 ha private forest annually in designated areas where afforestation is possible (neutral areas). First afforestation of agricultural land to establish new public forests with the aim to support afforestation of 250 ha annually. Targeting and protection mechanisms There are significant targeting mechanisms in place in Denmark. Afforestation has been part of Danish land use planning system for more than 20 years. On the basis of Government guidelines the former counties in their regional planning designated areas where afforestation is desirable as well as non-desirable areas for afforestation which generally cannot be afforested. Areas not designated to one of these two groups are called neutral-areas, where afforestation is possible. The designation is based on an assessment of the different interests that are linked to the various areas, including, for example, interests concerning the protection of drinking water, the availability of urban forests, agricultural interests, ecological corridors in the landscape or other environmental interests. Currently the areas desirable for afforestation comprise app. 6% of the countryside and the areas non-desirable comprises app. 21%. In the current revision of the municipality plans the areas desirable for afforestation are expected to be increased to 15-20 % of the area

141
of the countryside, whereas the areas where afforestation is un-desirable are expected to remain stable. Currently lower premiums are given to the afforestation in the neutral areas than in the areas where afforestation is desirable. For the main part of the period since 1991 support has only been given with in the areas where afforestation is desirable. Almost all permanent grassland in Denmark is protected in the Danish Nature Protections Act from conversion to arable, afforestation etc., as well as against changes in management that can affect the overall state of the pasture. Approximately two thirds of all permanent pasture is protected by the Act including the pastures that are most valuable from a conservation point of view (EVG). Regarding the design of the measures themselves, several aspects enhance the environmental outcome: Requirements are imposed for the new forest with regard to size, approved tree species, forest edges and numbers of plants. Grants are not given for Christmas trees or ornamental greenery. In Denmark all afforested areas are automatically designated as “reserved forests” according to the Danish Forest Act. This means, there is an obligation to replace any logged forest, thus ensuring that the newly established forests will remain forest permanently. Optionally measures available to optimize the impacts include locality mapping, pesticide-free maintenance and environmentally friendly soil preparation (only available for private projects as they are obligatory in public projects). Finally, the applications for support are ranked in case of too many applications within the budget frame. This includes considerations of aspects related to environmental benefits: Tree species, soil preparation, size of project and pesticide free establishment. Environmental effects The assumed outcomes as specified for the RDP indicators are: The loss of N from agriculture will be reduced by approx. 50 kg N pr. ha Afforestation in Denmark will absorb approx. 10 tonnes/ha of CO2 yearly. All afforested land is considered HNV No effect on farmland bird species population There is no monitoring system in place to directly measure and assess the environmental outcome of the farmland afforestation. The latest mid-term evaluations of the afforestation measures have used farm interviews as the prime method of the evaluation. The MTE thus provides information on the effects according to the participants (supplemented by expert knowledge) and mainly on the actions they have taken rather than on the outcomes. For example, selected results from Mid-term evaluation 2010 are that the support has to some or to high degree had the effect that:

142
70% of the participants have used environmentally friendly soil preparation for the establishment of the forest 78% have raised forest with deciduous species or species adapted to the locality 85% have raised forest without use of pesticides 76% of the participants have mapped key biotopes 61% have made locality mapping 75% have made a plan for the protection of natural values Overall, the assessment of the evaluator is that the afforestation contributes to the ecological functioning of the forest and to the improvement of the forest resources by environmentally friendly afforestation with deciduous or locally adapted species. The evaluator also assesses that the support measures influences the decisions of the participants in a positive direction towards a future sustainable management of the forests (The Ministry of Food, Agriculture and Fisheries, 2010). As mentioned above there is no monitoring in place to monitor the environmental effects of the support for afforestation. It goes beyond the scope of this report to do a full review of the literature on general effects of afforestation. Some observations are: Leaching of nitrogen: There is broadly consensus that afforestation of farmland has a positive effect on nitrate leaching. However, the effect highly depends on a number of circumstances such as former use, soil type and methods for establishing and managing the afforested area. One often quoted example shows a leaching of an average of 12 kg N/ha/year over a full forest rotation corresponding to a reduction of 82% compared to arable farming. In the same example the leaching from the afforested areas vary from 50-100 kg N/ha/year in years 1 and 2 after the afforestation to < 5 kg N7Hha/year in the years from 6 to 20 after the afforestation (Gundersen, 2004). Carbon storage: As mentioned above the Danish RDP assumes that afforestation in Denmark will absorb approx. 10 tonnes/ha of CO2 yearly. This is probably an optimistic goal as this figure is more suitable for afforestation with conifers than for broadleaved species (Vesterdal, 2010). Biodiversity: There has been some criticism that the afforested areas do not deliver much in terms of biodiversity. The time needed to establish valuable nature is very long (Johannesen et al., 2013); nature is not the prime goal of the afforestation (Rahbek et al., 2012) and the afforested areas are too small and scattered (Landskabsværkstedet, 2009). Assessments of the effect of the afforestation at the landscape level are not available.
Estonia
According to the estimates used for compiling background information of this measure for RDP programme document for period 2004-2006, there are ~150 000 ha of agricultural land suitable for afforestation in Estonia. For the RDP 2004–2006 a target of 10,000 ha of agricultural land was set to be afforested in an

143
environmentally friendly manner, taking into account local conditions and planning. In practice the area of land afforested in this period was approximately 2,800 ha.
An extract from the RDP monitoring tables for the 2005-2007 period regarding support provided to farmland afforestation (per hectare by stand types and years) is provided below. Support for establishing of forest plantations was implemented during the first two years, whereas in 2007 only supplementation of existing plantations was carried out.
Table 1 Support provided to forested areas (establishment in 2005–2006 and supplementation in 2007)
*Support was provided to supplement forest plantations, no new plantations were established
The average size of afforestation area per applicant for period 2005-2007 was 3.28 ha The interviews conducted with experts and interested parties for ex-post evaluation of RDP 2004-2006 programme identified lengthy periods of waiting for the afforestation support and the vagueness preceding the opening of the measure and the subsequent difficulties of applicants with acquiring of plants as the possible reasons for the limited up-take of the measure. Insufficient information provided to the nurseries in Estonia caused their failure to provide a sufficient quantity of sets, and there was no previous experience with acquiring planting stock from neighbouring countries. Also the requirement of ensuring that 80% of the forest plantation remains standing after expiry of the five years period, established by the rules, constituted a problem in certain cases, although the compliance therewith is assisted by the maintenance and supplement support. The situation where it was first required to make a rather significant investment in connection with the planting, using one’s own funds, while the support was paid later, also created a complicated situation for those receiving the support. Problems also emerged with selecting the appropriate tree species suited for the land to be afforested; the level of awareness of the applicants in this respect was low. According to the experts certain plots of lands with the soil quality class below 35 were often too fertile for planting spruce (rich in mineral compounds). This involves root rot risk reducing growth of conifers. Also fact that large part of the Estonian agricultural land is used by the tenants who do not feel long-term security on the land probably had its impact on up-take.
Supported area (ha) 2005 2006 2007*
Conifer plantations 756,39 689,28 54,96
Broadleaf plantations 232,05 395,93 56,68
Mixed plantations (> 25% of other species) 274,75 483,00 170,78

144
Objectives The aim of the measure as stated in the RDP documents was to reduce the share of abandoned agricultural lands and the share of lands less suitable for agriculture, as well as to support the formation of valuable forests. There were no specific biodiversity objectives. Targeting and protection mechanisms Conditions for granting the afforestation aid included the following: At least 0.3 hectares of agricultural land being the applicant’s property, if the same was entered in the Estonian Agricultural Registers and Information Board (Paying Agency) agricultural support and LPIS. If the field area exceeded 5 ha, the average soil quality rating had to be 35 points or less; for comparison the average rating score of normal arable soils in Estonian conditions is 45. The application was submitted with respect to a field that was used either for growing agricultural crops or as permanent grassland, or an abandoned field. In the latter case the support was granted provided that the land unit had been used at least once in the last five years68. At least 25% of broadleaves had to be included in an established conifer plantation; establishment of pure conifer stands was not permitted. It was allowed to have a lower share of broadleaves in the stand, had the environmental authority granted a relevant confirmation, which had to have been stated on the application. The applicant could apply for afforestation support for up to 30 hectares. Natura 2000 Annex 1 habitats located in Natura 2000 areas and other protected areas were not eligible for support under this measure. Support was also not granted for regions and areas where afforestation may endanger natural environment (e.g. protected areas, restricted zones, habitats with a heritage value. No requirement for EIA was foreseen due to the small size of the individual afforestation projects. Environmental effects The achievement of the objectives of the afforestation measure did not reach the intended level, because the reduction of the share of abandoned and poor agricultural land did not take place to the expected extent, at least through afforestation. However, regarding the land for which afforestation support was applied, the objective of causing afforestation of low-quality land was achieved. The support has created preconditions of establishing forests on poor soils. The use of plants with proven quality, adjustment of natural overall forest regeneration processes and poor soil quality have also affected this process. Indirectly the quality of the soil of afforested areas will increase in time – humus content and organic matter content will increase, general soil health will improve.
68 Pursuant to the EU Accession Treaty Estonia was granted an exception, namely in 2005–2006 it was possible to carry out supported afforestation of such agricultural land that had been abandoned by agriculture up to 5 years earlier

145
A specific concern in Estonia is that the economic drivers to afforest semi-natural wood pastures are increased because of the absence of CAP support due to eligibility rules (e.g. the “50 tree rule”). This situation encourages owners of semi-natural habitat to converting potentially valuable farmland habitats into forest land. There are no legally established mechanisms to prevent an area of semi-natural habitat outside of protected areas and Natura 2000 sites from being afforested, but there is no data to show if this happened. In some cases where potentially valuable semi-natural habitats were proposed to be afforested outside protected areas it is reported that the Environmental Service was able to check such applications. The farmland afforestation measure was not continued for the RDP 2007-2013 as the Ministry decided against a blanket approach to afforestation taking account of the very high forest cover generally in the country (>50%). Only a specific measure for afforestation of buffer zones of certain water bodies was initially planned, however this was not implemented in reality for several reasons (e.g. cost of administrating such a measure). Although not in the scope of this study, it may be of interest to mention that under measure 224 there is a scheme intended to contribute to the sustainable use of private forest land located in Natura 2000 area by maintaining such land in forest management. However, some environmental conflict is reported because a considerable proportion of semi-natural farmland habitats (wooded pastures/meadows, also in some cases alvars) are in some registers as "forestry" land despite being grazed and used for agricultural purposes. Landowners with such land find it more attractive to apply for the forestry payment, that requires less activity, rather than the alternative agri-environment scheme for maintaining semi-natural habitats in farming use.
Hungary
Since joining the EU, a total of 68,566 ha of farmland have been afforested in Hungary using the RDP measure. This figure makes Hungary one of the biggest users of the measure. According to the RDP, the distribution of the target area by land types is as follows:
Landuse Expected area (ha)
Grassland 3000
Orchard 900
Arable land 61700
Wineyard 400
Total Area 66000
However, no data are available so far on land types that have been afforested. The paying agency do criteria and no research has been made on this yet.

146
Objectives The main aims of the measure is to increase the forest cover of the country, to increase the environmental protection, social, public welfare and economic role of forests and to improve the level of employment in rural areas by developing the forestry sector, to enable the agricultural restructuring, by the help of alternative use of areas. Objectives of forestry also include the establishment of high biodiversity natural forests, through a substantial increase in the ratio of indigenous tree species, particularly in protected areas. Environmental development objective is to enrich biodiversity by establishing close-to-nature forests, to preserve the natural components of the rural landscape, and to facilitate appealing landscape appearance. The whole area of afforestation contributes to protection against erosion (water or wind erosion) and combating climate change mitigation. The approval procedure of the afforestation plan ensures, that no afforestation can be implemented with negative effect to the environment. Targeting and protection mechanisms The RDP contains the following provisions: No afforestation can be established in protected natural areas or NATURA 2000 areas and no support can be granted for these purposes where the current landscape structure and cultivation sector should be kept and it is positive from the aspect of preserving biological diversity. The afforestation on Natura 2000 areas can only be supported, if the area has an approved and valid Natura 2000 management plan, and the plan permits the afforestation. The afforestation of non-protected grassland can be implemented with the agreement of the competent national park directorate. Payments are higher for broadleaved and for native species, and annual payments are available for 15 years compared with 5 years for non-native species. The applicant is obliged to obtain an afforestation permit issued by the forestry authority (the approving resolution of the afforestation plan). The afforestation plan according to the Act LIV of 1996 (The Act on forest, and protection of forest) should be made by professional forester, considering the site conditions and ecological features. The relevant authorities (authority of nature protection, defence, water protection) take part in the approval procedure. All farmland is eligible, but for non-protected and non-Natura2000 grasslands a supportive statement from the conservation authority is required in order to get approval for an afforestation grant.

147
Applications must include “habitat details” of the area concerned. ‘Habitat’ in this case mostly describes how much the natural conditions are suitable for a plantation with such species. Data on soil properties, precipitation, exposure to sunlight, gradient etc. are mostly abundantly available and reliable. However, this does not refer directly to biodiversity. The approval procedure of the applications based on a scoring system: Afforestation planned with protective function, contributing to the protection of erosion on arable land. (Estimated: 7000 hectares). There is a separate cartography layer for erosion and steepness and there is differentiated support according to erosion risk. Afforestation planned on water shed areas. (According to the Gov. Reg. 240/200 (XII.23.)) (Estimated: 3500 hectares) Afforestation planned in the regions with less forest cover than desired. (Hungarian Great Plain, and areas with low forest cover) (Estimated: 38000 hectares) Afforestation planned in regions with high population where the role of the forests in air cleaning, and health protection can prevail in a higher level. (Estimated: 6500 hectares) Indigenous, mixed forests with higher biodiversity. (Estimated: 54000 hectares) Afforestation planned with the natural stand type of the specific forestry region. (Estimated: 20000 hectares) Afforestation that is planned in the “forestry”, and “mixed land use” regions according to the Law on National Physicalplanning. (Estimated: 50000 hectares)’ The RDP lists all the geographic regions of Hungary (each between ca. 300-3000 km2s) and a mark is given to each of the forest types (conifers, oak, black locust etc.) in each of the regions how much they are suited to the local landscape and therefore how much they are recommended for subsidy. An annex of the regulation contains the scorecard for all applications, some of which have environmental relevance – see them below. Out of 100 points there are: 7 points if at least 70% of the plantation is of indigenous species 3 points if 50-69% of the plantation is of indigenous species 1 points if 30-49% of the plantation is of indigenous species 2 points if the area is in a Nitrate Vulnerable Zone 2 points if it is in a Natura 2000 area 5 points if it is in an LFA 4 points if it is in the river-basin of lake Balaton, Velencei or Fertő (3 large, navigable lakes in Hungary) 10 points if it is recommended for subsidy in the local landscape (according to Annex 1 explained above). Environmental effects No studies on the environmental outcomes of farmland afforestation were found in the course of the present study.
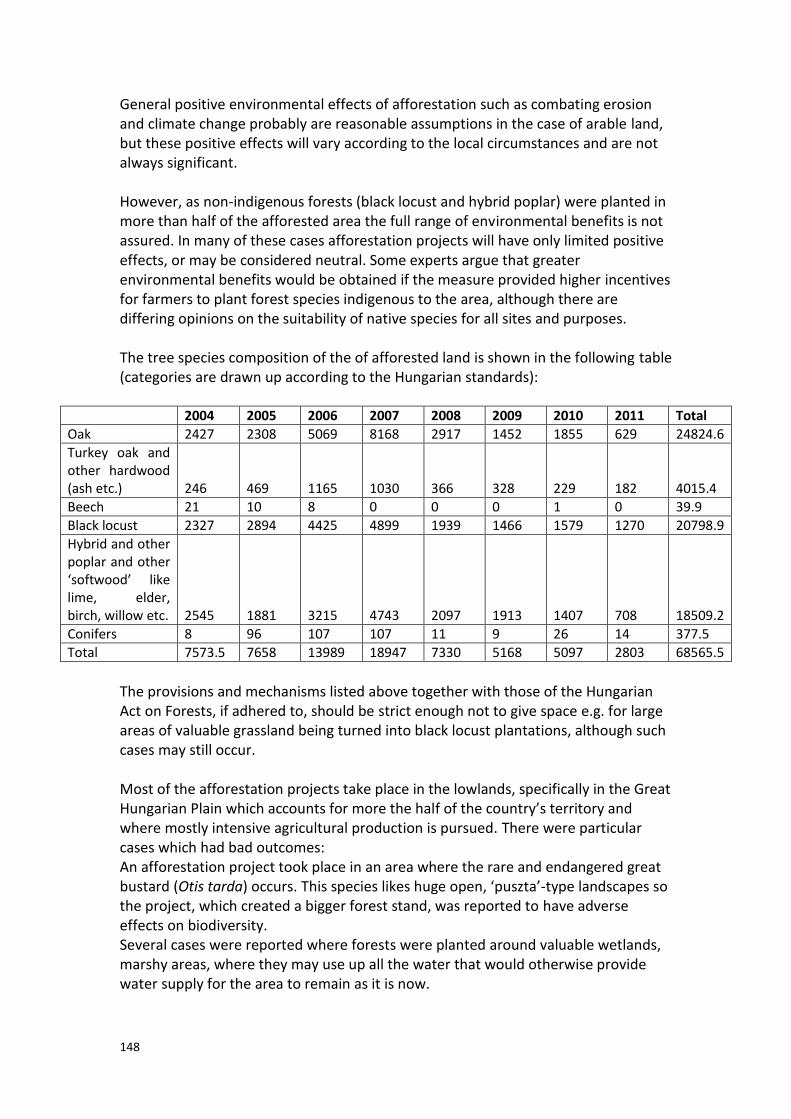
148
General positive environmental effects of afforestation such as combating erosion and climate change probably are reasonable assumptions in the case of arable land, but these positive effects will vary according to the local circumstances and are not always significant. However, as non-indigenous forests (black locust and hybrid poplar) were planted in more than half of the afforested area the full range of environmental benefits is not assured. In many of these cases afforestation projects will have only limited positive effects, or may be considered neutral. Some experts argue that greater environmental benefits would be obtained if the measure provided higher incentives for farmers to plant forest species indigenous to the area, although there are differing opinions on the suitability of native species for all sites and purposes. The tree species composition of the of afforested land is shown in the following table (categories are drawn up according to the Hungarian standards):
2004 2005 2006 2007 2008 2009 2010 2011 Total
Oak 2427 2308 5069 8168 2917 1452 1855 629 24824.6
Turkey oak and other hardwood (ash etc.) 246 469 1165 1030 366 328 229 182 4015.4
Beech 21 10 8 0 0 0 1 0 39.9
Black locust 2327 2894 4425 4899 1939 1466 1579 1270 20798.9
Hybrid and other poplar and other ‘softwood’ like lime, elder, birch, willow etc. 2545 1881 3215 4743 2097 1913 1407 708 18509.2
Conifers 8 96 107 107 11 9 26 14 377.5
Total 7573.5 7658 13989 18947 7330 5168 5097 2803 68565.5
The provisions and mechanisms listed above together with those of the Hungarian Act on Forests, if adhered to, should be strict enough not to give space e.g. for large areas of valuable grassland being turned into black locust plantations, although such cases may still occur. Most of the afforestation projects take place in the lowlands, specifically in the Great Hungarian Plain which accounts for more the half of the country’s territory and where mostly intensive agricultural production is pursued. There were particular cases which had bad outcomes: An afforestation project took place in an area where the rare and endangered great bustard (Otis tarda) occurs. This species likes huge open, ‘puszta’-type landscapes so the project, which created a bigger forest stand, was reported to have adverse effects on biodiversity. Several cases were reported where forests were planted around valuable wetlands, marshy areas, where they may use up all the water that would otherwise provide water supply for the area to remain as it is now.

149
If black locust stands are planted near biodiversity rich forests or grasslands, a buffer zone of a certain width (min. 20m) should be established. There was a case reported where a permit was issued for an afforestation project without providing for this restriction. With the new Act on Forests that came into force in 2009, there are no such cases anymore. The Act replaced an old Act on Forests from 1996 and requires consultations with the nature conservation authorities at various stages of forest planning. So far this provision seems to prevent more bad cases like the one described. Good examples that illustrate the effectiveness of the mechanisms: There were several cases where farmers applied for support to plant black locust stands near protected or Natura 2000 areas and they were turned down on the basis of the official opinion provided by the national park directorate. Bad examples, where mechanisms are not fully effective: In many cases of hybrid poplar or other plantations in the vicinity of marshes it is difficult for the national park directorate to justify that the establishment of these stands will lead to the destruction of the marshlands due to soaking up most of soil water and water that would otherwise flow into the area. This problem can be eliminated if, similarly to restrictions on afforestation with invasive species near protected areas, the Act on Forests would declare that wetlands should also get similar protection.
Ireland
A total of 209,583 ha have been afforested in Ireland in the period 1992-2011, although since 2007 (35,000 ha) this has not been funded under through the RDP but as a State aid. Ireland probably has the biggest area of farmland afforestation since 1992 of any MS in proportion to the country’s land area. The Forest Service do not specifically record the previous land use (e.g. arable, permanent pasture etc), although a general high level description of the vegetation present at the time of the application is usually recorded, and all applications are spatially recorded. It is recorded if the land is improved or unimproved (unenclosed) agricultural or non-agricultural land. However, this data is not readily available. The ex post evaluation of the 2000-2006 RDP reports that most of the land afforested was classed as ‘extensive grazing’, and about 15% of land planted in 2000-06 was classed as unenclosed. However, this proportion is declining over time. In general, there was a trend away from planting in western counties, due to the more acid sensitive nature of the soils in those regions, and towards the better soils of the midlands and south west. This was accompanied by an increase in the level of planting of broadleaf species reflecting the substantially higher premium paid for planting broadleaves over conifers.

150
The Rural Development Plan had a target of 30% broadleaf planting at the end of the programme in 2006 having been 15.1% and 12.9% in 1999 and 2000 respectively. The ratio of broadleaf planting gradually rose during the operation of the programme, reaching 22.8% in 2003 and in 2006 broadleaf planting represented 31.5% of total new planting. The species composition of afforestation in the period 2009-11 is shown below.
2009 2010 2011
Broadleaf Conifer Broadleaf Conifer Broadleaf Conifer
ha ha ha ha ha ha
Total 2,473.20 4,174.61 3,149.32 5,164.77 2,446.71 4,206.41
Percentages 37.20% 62.80% 37.88% 62.12% 36.78% 63.22%
In recent years there has been an increase in the planting of native woodlands with the introduction of a Native Woodland Scheme. Since 2001 1,100ha of native woodland have been created. Objectives The objectives of the nationally funded measure (not RDP) as outlined in the Forest Service’s Afforestation Scheme 2012 include: To increase the area under forest in Ireland to contribute towards climate change mitigation; To produce a commercial crop of timber; To provide a sustainable source of wood biomass for energy purposes; To provide a sustainable basis for development of the rural economy; To increase the area of purpose-designed recreational and amenity forests; To improve water quality through riparian planting; To increase overall biodiversity by providing woodland habitat which is under- represented in the complex of habitat types. Targeting and protection mechanisms Agricultural land is classified into two types: (i) enclosed/improved land; and (ii) unenclosed/unimproved land. enclosed/improved land The E/I land type generally includes land that is enclosed and improved for agricultural use by cultivation and manuring, and which is completely surrounded by man-made boundaries. E/I land includes land that has been under intensive agricultural use since prior to 1st January 2004 and carries vegetation predominately of pasture grasses and herbaceous plants. unenclosed/unimproved land. U/U land is normally associated with peat soils or other poor soils and includes areas that have not been cultivated or brought under intensive commercial agricultural use successfully over a sustained period. These lands are generally used for extensive grazing and have low levels of existing agricultural productivity. The U/U land type generally includes sites with natural vegetation associated with heath land or peat land.

151
For the purposes of the afforestation schemes, there is a list of criteria excluding E/I land or U/U land from eligibility on environmental grounds, as follows: High elevation areas over 300 m above sea level in the west and over 400 m above sea level in the east of Ireland Infertile blanket and midland raised bogs, e.g. vegetation predominately consisting of heather (Calluna vulgaris), bog cotton (Eriophorum vaginatum), deergrass (Trichophorum caespitosum-formerly called Scirpus cespitosus) and sphagnum, and also vegetation – often pool studded. Also containing sundews (Drosera rotundifolia) and Bog asphodel (Narthecium ossifragum) Unmodified raised bogs. Designated blanket and raised bogs. Plots with rock outcrop and associated shallow soils in excess of 25% of the plot area. Severely exposed sites and some sea facing locations. All areas outlined in the Forestry Schemes Manual as being ineligible for grant aid, e.g. shell marl, sites which cannot be adequately drained Sites not capable of producing a commercial crop of timber. The land must be capable of producing at least yield class 14 for Sitka spruce. The use of Sitka spruce as an indicator species recognises that other conifers may not achieve the same level of production on the same site. Very poor U/U sites where a standard application of phosphorus fertiliser (e.g. 350 kg/ha GRP) at the time of establishment is unlikely to provide sufficient phosphorus input to bring the forest to full rotation. (A split application not exceeding a total of 400 kg /ha GRP would be acceptable instead, within the establishment period). Sites where it is not practical to access or construct forest roads to facilitate the harvesting of timber to a suitable public road network. Cooperative roads and shared access routes may allow difficult sites to be considered for approval on application. Non-agricultural land (e.g. golf courses, turbary). These criteria have prevented planting on some ecologically sensitive sites but have not excluded planting from many habitat types such as species-rich dry and wet grasslands, dry and wet heaths. The criteria seem to be determined more by the possible financial return from the tree crop than from an environmental perspective. Applicants are asked on the application form to indicate if the land is agricultural or non-agricultural and improved or unimproved (enclosed or unenclosed) but the Forest Service District Inspector will ultimately determine whether the information provided by the applicant is correct – this is usually determined by examining colour ortho-datasets and/or by field inspection. All applications for afforestation must contain: Site Location Map Certified Species Map (in relation to tree species planted)

152
Biodiversity Map (NOT a biodiversity assessment but a map addressing biodiversity issues during and after planting) Fencing Map (if applicable) Test results for levels of Calcium carbonate CaCO (if applicable) Drainage Survey report Soil Analysis report The application is processed by the Forest Service and assigned a unique Forest Service reference number known as “Contract No.”. Applications then go through the following procedures: The application is referred to the relevant Forestry Inspector for assessment and recommendations. If there are any environmental considerations identified, the application is simultaneously referred to the relevant prescribed body. Notice of all applications for approval is published on the Department’s website and anybody may make a submission on the proposed development within 28 days. If the proposed development is greater than 25 hectares the application is automatically referred to the relevant Local Authority for their observations. Sites below this threshold may also be referred to Local Authorities depending on their location and landscape sensitivity. If the site is greater than 50 hectares, an Environmental Impact Statement must accompany the application. In relation to Natura 2000 the present mechanisms (introduced in 2010) appear sufficient, complying with Article 6 of the Habitats Directive with every application within an SAC subject to an assessment and screening of the proposal. All applications are publically available and members of the public may make a submission or observation in relation to the application.
In 2012, of the 1,018 applications submitted, 118 were refused permission to plant. However, for areas outside Natura 2000 sites, no procedure exists for ecological assessment of sites pre-afforestation which means there is a (risk) of continuing loss of semi-natural vegetation due to afforestation particularly in more upland or unenclosed areas. Environmental effects Since 1992 the great majority of afforestation has been with exotic species. In the 1990s there was severe criticism from environmental NGOs of planting on semi-natural habitats such as blanket bogs, including within protected areas. The creation of native woodlands of potential biodiversity value under the RDP schemes has been on an extremely small scale. The intention of Regulation 1698/2005 that all farmland

153
afforestation funded by EAFRD should “enhance biodiversity” clearly has not been complied with. During the current RDP An Taisce, an impartial monitor on the application of EU environmental legislation at local level, has highlighted a number of cases they felt alleging non-compliance of forestry consents with the requirements of Article 6 of the Habitats Directive in relation to appropriate assessments, an allegation refuted by the Forestry Service. However these examples pre-date the 2010 introduction of the Appropriate Assessment procedure described above. However, outside of Natura 2000 sites the planting of woodland on semi-natural habitat (EVG) is common practice. Birdwatch Ireland voiced concerns as late as 2012 on the continuing planting of woodland on semi-natural and species-rich grassland and breeding wader sites. For the former they have recommended to government that all afforestation sites should be surveyed for the presence of semi-natural and species-rich grassland before consent is granted for afforestation and any planned afforestation in breeding habitat for Curlew (Numenius arquata) should be screened for impact on breeding curlew prior to afforestation. A major university research project BIOFOREST (2006) (http://bioforest.ucc.ie/index.htm) also recommended that semi-natural habitats should not be afforested, unless there are mitigating circumstances. This was a project whose objectives were to assess biodiversity in a range of important habitat types and to develop methodologies and indicator species for the assessment of biodiversity and to assess the efficacy of the Forest Biodiversity Guidelines (Forest Service 2000c) and make recommendations for their improvement. Their actual recommendation, among others is as follows: “This recommendation is similar to one made earlier in other BIOFOREST reports (Smith et al. 2005)* and is supported by the results of this study. Semi-natural habitats are those that are unmanaged or managed at a low intensity and that support assemblages of native species that have originated and are maintained primarily by natural processes. We have found that semi-natural wet grasslands and peatlands often support species assemblages of high biodiversity value, particularly when compared with improved grasslands. At present, the Guidelines do not consider the choice of sites for afforestation or what types of sites should not be afforested. The Guidelines should be amended to recommend that semi-natural habitats should not be afforested, unless there are mitigating circumstances, such as when such habitats are common in the local area. Improved grasslands, arable land and other land highly modified or disturbed by human use should be selected over semi-natural habitats where possible. Semi-improved grasslands (grasslands that have been substantially altered by management from a semi-natural state but would not be considered improved by agricultural standards, e.g. see Section 4.3.2.5) usually can be afforested without major impacts on biodiversity. Peatland sites with well-developed flushes or other hydrological features or sites that have experienced little or no peat cutting should not be afforested. Priority habitats listed in the EU

154
Habitats Directive (European Commission 1999) should not be afforested, regardless of whether they are part of a designated site or not. We provide indicators to help identify wet grasslands and peatlands of biodiversity value (Section 8.3), but research on other frequently afforested habitat types is needed.”
Lithuania
The extent of different land types that have been afforested since 2004 under the measures for farmland afforestation (221) and afforestation of non-agricultural land (223) are as follows (data for measure 223 is included here because the land afforested is often abandoned grassland): Lowlands – 26,334 ha (data available for 2004-2012) Mountains – 0 ha (data available for 2004-2012) Arable land 1,116 ha (data available for 2004-2006 only) Permanent pasture 850 ha (data available for 2004-2006 only) Permanent crops (orchards) 49 ha (data available for 2004-2006 only) Protected areas – 856 ha (data available for 2007 (partly)-2012 only) Karsts areas – 32 ha (data available for 2007 (partly)-2012 only) Natura 2000 areas – 60 ha (data available for 2007 (partly)-2012 only) Plantations of short rotation – 31 ha (data available for 2007 (partly)-2012 only) The tree species composition of the afforestation to-date has been as follows: Conifers (pure) – 0 ha (data available for 2004-2012) Deciduous (pure; coniferous – 0 %) – 8,637 ha (including pure broadleaved – 598 ha) (data available for 2004-2012) Mixed – 17,696 ha (data available for 2004-2012) In Lithuania, an afforestation project must use deciduous and/or mixed deciduous-coniferous trees only. Deciduous have to cover minimum 20% of the area to be afforested. The size (hectares) of afforestation projects to-date (data from 2004-2012): Minimum – 0,02 ha Maximum – 55 ha Average – 3 ha Objectives In Lithuania, according to the national RDP the objectives of farmland afforestation are as follows:

155
Overall objective: To promote afforestation of land used for agricultural production as an alternative land use, to promote the development of forestry and its role within context of climate change mitigation, to ensure improvement of local environmental conditions and to help to solve the unemployment problems in rural areas. Specific objectives: To increase the forest cover of the country; To reduce dependency on agriculture of rural population; To increase economical, ecological and social value of the locality and land holdings; To provide new employment opportunities in rural areas; To provide new sources of income. Targeting and protection mechanisms At the start of the programmes in 2004, mechanisms for promoting/ensuring positive environmental outcomes are reported to have been not well known or recognised by leading expert staff and politicians of Ministries of Agriculture and Environment, and also very poorly known by farmers. As a result, in the RDP environmental objectives for measures 221 and 223 are weak. Existing legislative and administrative mechanisms do not always ensure positive environmental outcomes and preventing negative ones. Criticism of the afforestation of valuable semi-natural meadows (treated as non-agricultural land by the administration due to their abandoned or semi-abandoned state) in the western part of the country has resulted in changes to regulations implementing RDP measure 223 in order to prevent damaging of existing nature values. As a result, now regulations for implementation of measure 223 require the application of measures to prevent negative environmental outcomes. Thus regional land planners and administrations of protected areas, as extra experts, are involved in the process of preparation of afforestation projects by farmers and are responsible for checking that valuable habitats have not been selected for afforestation projects. Unfortunately these mechanisms are not always working correctly for preventing losses of known biological values (e.g. valuable semi-natural meadows) through afforestation. The following problems are identified: GIS data on valuable habitats is not functioning properly; Information on valuable habitats needs updating; Regulations of forest planting on non-forest land (non-forest areas) should meet modern requirements of biodiversity conservation in agricultural landscapes. Ministry of Agriculture is lacking capacity on agro-conservation issues; Ministry of Environment is not enough active when cooperating with the Ministry of Agriculture on mentioned issues.

156
Improved national mechanisms for preventing of negative environmental outcomes and for ensuring of positive ones could be included in up-dated Regulations of Forest Planting on Non-forest Land (non-forest areas). New Regulations of Forest Planting on Non-forest Land could be based on: National Biodiversity Conservation Strategy, National Programme of Development of the Forestry Sector for 2012 – 2020, Nature frame maps of local scale (frame GIS data base), Valuable habitat maps (semi-natural habitat GIS data base). Environmental effects In cases where afforestation projects have been performed in areas/regions where forest coverage was poor or on large agricultural fields, or on slopes and ravines where water erosion could occur, and where new forest plantations are likely to play a role of biological corridors, afforestation should be considered as very environmentally positive measure of landscape management, which is valuable for stability of agro-ecosystems and for biodiversity. Unfortunately in cases where afforestation projects have been performed in areas where forest coverage in the region was very high or on rather small agricultural fields surrounded by forests, afforestation should be considered as environmentally negative measure of landscape management, which is also damaging local biodiversity. In Lithuania, there are known cases where valuable meadows have been afforested (even in protected areas). In such situations measure 223 has been an instrument destroying biological values rather than creating them.
Poland
The extent of farmland afforestation in Poland since 2004 is shown below:
Agricultural land that has been afforested with RDP support
payments between 2004-2012
RDP 2004-2006
2004 6 782,85
2005 15 201,53
2006 18 273,18
total 40 257,56
RDP 2007-2013
2007 5 855,27
2008 3 394,83
2009 5 671,93
2010 5 915,18
2011 6 415,96

157
2012 (by 30.06.2013) 1 928,26
total 29 181,43
Total for RDP 04-06 and RDP 07-13 69 438,99
The land types that have been afforested in Poland are as follows:
RDP 2004-2006: agricultural and non-agricultural land, arable land, pastures and
meadows.
RDP 2007-2012 afforestation is not carried out pastures and meadows.
The characteristics of the afforestation projects are as follows:
RDP 2004-2006:
Composition of forest plantations:
conifers (predominance of coniferous species - more than 75% of the area) - 23%;
broadleaved (predominance of broadleaved species - more than 75% of the area) -
11%
mixed - 66%.
The average area of afforestation projects is 4.42 ha.
RDP 2007-2013:
Composition of forest plantations:
conifers (predominance of coniferous species - more than 75% of the area) - 26%
broadleaved (predominance of broadleaved species - more than 75% of the area) -
16%
mixed - 58%.
The average area of afforestation projects is 2.41 ha
Objectives The main stated objectives of the measure are conservation and consolidation of ecological stability of the forest areas through reduction of fragmentation of forest complexes and creation of ecological corridors. The measure also aims to increase the contribution of forests to the global carbon balance. The afforestation needs of Poland, as estimated by the National Programme for the Augmentation of Forest Cover (NPAFC) approved for implementation by Resolution of the Council of Ministers, specify that the forest cover in Poland is to increase to cover 30% of the country’s area by 2020. According to NPAFC, lands of low usefulness for agriculture and susceptible to threats (e.g. erosion, water contamination) are excessively used in Poland. Considering the planned increase in forest cover of the country, it is justified to support the process of afforestation of private and municipal lands, and to provide proper maintenance of the new plantings at early stages of their development.

158
Targeting and protection mechanisms Afforestation projects should be adjusted to the local habitat and landscape conditions In accordance with the requirements specified in the National guidelines on the organisation of agricultural and forest areas (Guidelines concerning delimitation of agri-forest border, document of the Ministry of Agriculture and Rural Development and the Ministry of the Environment, 2003). The introduction of new guidelines has resulted from the objective to direct the process of afforestation towards the improvement of natural environment conditions, in particular towards influencing the climate, water retention, reduction of water and air erosion, and improvement of public leisure and health conditions. There is also a regulation of Minister of Agriculture and Rural Development on detailed conditions and procedures for granting financial assistance under the measure "Afforestation of agricultural land and afforestation of non-agricultural land" under the Rural Development Programme for 2007-2013. Negative effects of afforestation are avoided through the use of the provisions of the Environmental Impact Assessment Directive and domestic mechanisms. From 2007 pastures and meadows have not been eligible for farmland afforestation aid in order to protect the environmental values of this land. Environmental effects The expected environmental effects of increasing forest cover include: retention and mitigation of conditions of water flow (surface water and groundwater), counteraction of soil degradation and soil erosion sequestration CO2 preferable modification of hydrological and topo-climatic conditions in rural areas The environmental objectives of approved projects will be reported under the RDP evaluation process. No further information on environmental effects was available, although the exclusion of pastures and meadows from afforestation since 2007 probably reduces the risks of negative effects.
Romania
Romania has implemented measures aimed at farmland afforestation since 2005, when Measure 3.5 "Forestry" (SAPARD) was launched. For the period 2005-2007, the financial allocation was 74.45 million euros. Of the 158 projects submitted, 113 projects were approved, with a total eligible value of 63.086 million euros. A total of 115 ha were afforested. The implementation of these projects was under RDP 2007-2013, by applying the transition rules.

159
Under the RDP 2007-2013, starting in 2010, Measure 211 on first afforestation of agricultural lands was launched. By the end of 2012 the number of beneficiaries receiving support was 26 of the RDP target of 14,180. The number of ha afforested was 649, out of the RDP target of 49,348 ha. The effects of the measure to-date have been completely marginal. Out of the 649.39 ha representing the total area afforested under Measure 221 (RDP), 152 ha of arable land are situated in less favoured areas and an area of 12 ha is located in Natura 2000 sites. The total area of land forested through projects supported under Measure 221, classified by type of species composition, shows that for 528.32 ha the afforestation was done with broadleaves species, for 10.12 ha with coniferous and 110.95 ha with mixed plantations. Objectives The overall objective of Measure 221 under the RDP 2007-2013 is to improve environmental conditions in rural areas through sustainable use and management of land through afforestation. This objective is to prevent damage caused by natural harmful factors, reduce soil erosion, improve water retention capacity, improve air quality and the production of biomass, including quality wood by maintaining or, where appropriate, enhancing biodiversity.
The specific objective of Measure 221 is not only to increase the area of forests with a protective role for water and soil as well as of forests with a protective role against harmful natural and anthropogenic factors, but also to ensure the recreational functions on the basis of its multifunctional role. Targeting and protection mechanisms Permanent grasslands are not eligible for afforestation unless they have a certain degree of degradation (e.g. soil erosion). Projects submitted are evaluated according to the selection criteria provided by the technical data sheet measure. One of the selection criteria is "the degree of degradation of the land" based on a list of indicators supplied by a research institute (ICPA). Environmental effects Almost no effects to-date due to the very small area planted. The majority was arable land.
Spain
By the end of 2010 a total of 704,295 ha of farmland had been afforested in Spain under the RDP measure. This is almost 40% of all the farmland afforestation in the EU since 1992, making Spain by far the biggest user of the measure.

160
Evaluating farmland afforestation on such a scale over a period of 20 years in a large, diverse and administratively devolved MS requires considerable resources and time. The resources available under the present study were extremely limited and allowed only a superficial investigation based mainly on RDP evaluation reports, ad hoc consultations with experts and the author’s own experience over 20 years as a consultant on rural landuse in Spain. Since 2007, farmland afforestation in Spain has been programmed at regional level, so that there is no evaluation available at the MS level for the current RDP period. With the resources available it was not possible to review 17 regional RDPs. The focus therefore is on the period 1992-2006 and the main sources were the 2000-2006 mid-term evaluation report of 2003 and the final evaluation of 2008 (TRAGSATEC, 2008). The fastest rate of afforestation took place under Regulation 2080/92. The Spanish national measure was implemented from 1994 to 1999. The objective was to afforest 800,000 ha of farmland, excluding Navarra and Basque Country where separate programmes were implemented. In practice 430,000 ha were afforested, with 33,000 beneficiaries and a total cost of 796.7 million euros. The average size of projects was 13 ha and the average cost was 1,770 euros per ha. The programme was a heavy burden on RDP budgets due to the 20 year commitment for compensation payments. Several regions did not implement the new measure from 2000 (e.g. Andalucía, Cataluña, Valencia) because of the large number of commitments carried forward from the 1992-99 programme. Overall the rate of afforestation declined, but continues to be significant.
Trends in farmland afforestation in Spain 1994-2007 There are some significant differences between the 17 regions in afforestation patterns over recent years, and also in the design of RDP measures. This makes it difficult to report on the situation for the MS as a whole, given the resources available to this study. The last national programme (excluding Basque Country and Navarra, which had different programmes and measures) was in the period 2000-2006. Much of the following data draws on this period and on the mid-term and ex-post evaluation reports for this period.
0
50.000
100.000
150.000
1994 1995 1996 1997 1998 1999 2000 2001 2002 2003 2004 2005 2006 2007
Trends in farmland afforestation - Spain

161
The 2003 MTE report, using a sample survey for the period 2000-2003, found that 25% of afforestation had been on cropped (arable and permanent) land, compared with 40% on permanent pastures and 27% on “other land” which in most cases is extensive grazing land. The 2008 evaluation report found that afforestation to 2006 had been divided approximately 50/50 between cropped land and pastures (the latter are almost entirely “pastizales” or uncultivated permanent pastures). In the period 2000-2003, the species composition of new plantations was as follows: 36% pure conifers, 37% pure broadleaves, 26% mixed stands and 1% fast-growing species (mainly eucalyptus). This corresponds approximately to the proportions of existing forests in Spain.
Of the total area afforested in 2000-2003, 47% is estimated to consist of species with no commercial value. Overall, 89% of the afforestation was done with native tree species. However, tree species identified as “of special interest” in the Annexes of the Royal Decree establishing the national measure have been used very rarely in afforestation projects, according to the MTE 2003. The average size of afforestation project in the period 2000-2003 was 10 ha, although with large variations from region to region. Projects in the north-western regions (typically minifundia regions) tended to be much smaller than in the extensive regions of the interior (latifundia). See table below. One of the criticisms reported in the MTE report (2003) was that the measure tended to benefit larger landowners, and was of no benefit to smaller farmers. In fact the majority of beneficiaries were not farmers; many were local councils afforesting common grazing land.

162
Average extent of farmland afforestation projects 2000-2003. Tragsatec, 2003 Objectives In the 2000-2006 period in Spain, according to Royal Decree 6/2001, the objectives of farmland afforestation were to contribute to the following (environmental objectives shown in bold): Diversifying agricultural activity, income sources and employment. Correcting problems or erosion and desertification affecting certain Spanish zones. Conservation and improvement of soils. Conservation of fauna and flora. Regulation of water catchments. Management of natural spaces compatible with the environment. Development of forest ecosystems beneficial for agriculture. Reducing the risk of wild fires and the improvement of natural resources. It is obvious that for each of the environmental objectives listed above, afforestation would need to be targeted at specific types and areas of land in order for the objectives to be pursued. The first objective hints at this when it says that erosion affects “certain zones”. However, in practice there has been no targeting of the measure in order to pursue these objectives. See below. For the specific objective “reducing the risk of wildfires” it is hard to see how this can be pursued by afforesting farmland. Forests are inherently far more at risk of wildfires than open farmland. Grazing is a crucial tool for reducing fire risk on pastures and wooded pastures, yet grazing is not permitted on land afforested under the EU measure, making the accumulation of dry matter inevitable. See below. Targeting and protection mechanisms The land eligible for afforestation aid was defined extremely broadly for the 2000-2006 period, to include all land that had been farmland within ten years of the grant application, specifically: Permanent crops Vegetable gardens Natural pastures Extensive grazing land Rough grazing on abandoned farmland Fallow land Some regions implemented the measure using only the national definitions of these landuses, while some regions added exclusions to this national list. For example, some regions excluded land where natural regeneration was already occurring, and/or with a certain density of tree cover. Castilla la Mancha and Madrid excluded land of “high ecological value” and of “high floristic value” respectively. This seems to be a positive mechanism bearing in mind that there were controversies in the 1994-99 period when environmental NGOs highlighted the loss to afforestation of large areas of semi-natural vegetation of high nature value. However, the MTE

163
report does not explain how these terms were interpreted or what mechanisms were applied to prevent the afforestation of such land. In the period 1994-99, all types of land received the same compensation payment rates under measure 2080/92. In the period 2000-2006 differentiated compensation payments were introduced, ranging from 60 euros/ha/year for the poorest land (rough grazing on abandoned farmland) to 355 euros/ha/year for land under permanent crops, arable crops or vegetables. This change appears a positive mechanism for greater targeting of aids for afforestation. The was also differentiation of payments according to the tree species used, with much higher rates for mixed broadleaved stands compared with conifers, for example. In principle the measure was available to all farmers with eligible types of land, as well as to public bodies (the latter did not receive the compensation payments). However, in the event of the measure being over-subscribed (i.e. above the available budget), a series of criteria were applied in order to prioritise the applications received. Each region applied its own criteria. Many of the criteria were not of environmental relevance, for example some regions gave priority to full-time farmers, or to farmers receiving LFA support. Exceptionally, Castilla y León gave priority to applications that included an environmental impact statement, amongst other criteria. Canarias also gave priority to applications according to their environmental value. In some cases, certain types of land were given priority. For example, in Castilla la Mancha priority was given to dehesas with a low density tree cover adjacent to other dehesas. In second order of priority were all types of arable land. Other conditions were applied according to the region, for example minimum and maximum size of afforestation projects. The thresholds varied considerably, for example a minimum of 25ha in Cataluña for afforestation of parcels surrounded by arable land, compared with a general minimum of 0.5ha in Asturias. In terms of afforestation methods and practices, the 2003 MTE report refers only to tree density, with a wide range of different thresholds according to the region. For the 2007-13 period, there were changes in the EU regulations, as set out by the Commission in its replies to the Court of Auditors (2004). The protection of the environment is established as the explicit objective of afforestation; and first afforestation should be adapted to local conditions and compatible with the environment and enhance biodiversity. Moreover, MS have to designate areas suitable for afforestation for environmental reasons. However, regional RDPs in Spain do not define areas suitable for afforestation for environmental reasons, other than stating that all farmland is eligible with certain exceptions as described above. A more precise definition of suitable areas

164
potentially could have prevented the planting of semi-natural habitats of high ecological value as has occurred in some regions, and could have lead to much more effective pursuit of the environmental objectives set out in Regulation 1698/2005 (García et al, 2013). The most recent EIA legislation at Spanish national level is Real Decreto 1/2008, that requires EIA for: First afforestations of over 50 ha in extent within Natura 2000 sites First afforestations of over 50 ha in extent if they have risks of serious ecological transformations outwith Natura 2000 sites. Changes in land use that imply elimination of shrub vegetation when such changes affect areas of over 100 ha, or 10 ha within Natura 2000 sites. In addition, environmental authorities may require an EIA in the case of first afforestations that have risks of serious and negative ecological transformations. Clearly many farmland afforestation projects will fall below the size thresholds set out above. In addition, large projects tend to be put forward with the justification that they are for environmental restoration (of soils, hydrology, climate change) and therefore are not required to undertake EIA. The criteria for deciding if projects have risks of “serious ecological transformations” are not defined. There is no standardised screening process, such as checking if a project will impact on Habitats Directive Annex 1 habitats or Annex 2 species. In a consultation of environmental authorities in 6 administrative regions, all those consulted agreed that current mechanisms are not sufficient to guarantee that biodiversity is not negatively affected by subsidised afforestation projects (Garcia et al, 2013). Environmental effects In the course of the present study, no robust evaluations of environmental outcomes for the period 1992-2013 were found, whether at national, regional or local level. The most complete official evaluation of the farmland afforestation measure are the mid-term and final evaluation of the 2000-2006 RDP. This was part of a detailed evaluation of individual RDP measures undertaken at national level (excluding Navarra and Basque Country), whereas subsequent RDP evaluations have been undertaken only at regional level. However, the 2003 and 2008 evaluation reports on farmland afforestation do not analyse the full range of possible environmental outcomes in detail. They explore a series of questions on socio-economic and environmental effects, drawing on responses from beneficiaries and experts. However, there is very little quantified data to demonstrate benefits or impacts, with the exception of estimates of carbon sequestration. There are several blanket assumptions about the positive environmental benefits of afforestation, some of which are highlighted below.

165
The evaluations purport to use as a main source of secondary information the national Banco de Datos de la Naturaleza, but in practice this seems to have been used only to count the number of projects taking place within Natura 2000 and other protected areas. There is no analysis of afforestation in relation to other parameters available in the Banco de Datos de la Naturaleza, such as presence of particular habitats or species of conservation concern. This is a missed opportunity for more robust analysis. The main environmental outcome identified is the storage of carbon, estimated in the 2003 MTE at 0.117 million tonnes per annum as a result of the 106,000 ha planted in the period 2000-2003. This figure is said to be low because new plantations store very little carbon. From 2012 it is estimated that the hectares planted will store an annual total of 2,928 million tonnes. However, the 2008 evaluation of the same measure, that was considering a total area afforested of 218,273 ha (i.e. twice the area in the 2003 calculations), estimated the carbon storage from 2012 at 0.54 million tonnes per year. This massive difference in the estimated amount of carbon stored raises questions as to the reliability of the calculations made. Furthermore, the reports make no assessment of the counterfactual situation, i.e. of the carbon balance of the pre-existing land cover, which in the majority of cases was permanent vegetation used for grazing. There is no analysis or mention of the carbon stored in the soils of permanent grasslands, that is known to be considerable and in some cases superior to that of forest soils. On the contrary, the MTE report assumes that the land afforested was previously subject to annual cultivation, and therefore was releasing carbon, in contrast to forest soils that are only disturbed at the time of plantation. This is a fundamental error in the evaluation, given that much of the afforestation has taken place on permanent pastures that are not ploughed and that have a far more favourable carbon balance that cultivated land. The MTE report also states that there have been cases of afforestation on land with pre-existing natural succession (i.e. natural establishment of tree cover), and that in some cases the natural succession was cleared prior to (re-)planting. This causes release of carbon and destruction of habitats and should be avoided in future, according to the MTE report. The report is also critical about the fact that fire prevention measures seem to be implemented in only a small percentage (<20% of those reviewed) of afforestation projects, thus putting forests at risk of destruction by fire and potentially negating all environmental benefits. Wild fires are a frequent occurrence in Spain, with 187,000 ha burnt in 2001 alone, according to the MTE report. They occur mainly on forest land and can be highly

166
destructive of biodiversity and soils, as well as causing considerable carbon release. Official documents tend to justify farmland afforestation on the grounds of preventing wild fires, but this has no foundation in fact. One of the more innovative approaches to wild-fire prevention, practised in France for many years and more recently on a pilot scale in several regions of Spain, is to incentivise extensive grazing on land at high risk, including forest land (e.g. see Beylier et al, 2006). The farmland afforestation measure does precisely the opposite as grazing is not permitted on the afforested land. Farmland afforestation has absorbed a considerable proportion of RDP funds during more than 20 years, while the use of the agri-environment to incentivise extensive grazing for fire prevention has developed very slowly in Spain due to the lack of funds, and some measures have been cancelled in recent years.
The fact that grazing is a priori excluded from all newly afforested land under the rules of the EU measure, and that this exclusion of grazing will greatly increase the fire risk, is not mentioned in the MTE report. However, in Extremadura (for example) special exemptions to the rules have been introduced to allow grazing in plantations of over 10 years old (exceptionally of over 5 years old) precisely in order to control dry-matter accumulation and thus reduce the fire risk. In 2003, some 2,200 ha of land afforested under the measure were burnt by a wild fire according to the MTE report. On other environmental issues, the report makes a number of generally positive affirmations that essentially reflect the measure’s EU objectives and the assumptions inherent in these objectives, but with an absence of robust analysis. However, some negative effects are also mentioned, as cited below. For example, it is affirmed that afforestation has had beneficial effects for agricultural land that was previously exposed to erosion of soil and other resources. This implies that afforestation has occurred on cropped land whereas in fact only 25% has been on cropped land, compared with 40% on permanent pastures and 27% on “other land” which in most cases is extensive grazing land. Studies in Spain have shown that spontaneous shrub and herbaceous vegetation can provide effective soil protection (e.g. Bienes et al, 2009). The MTE report mentions that in some cases the planting and maintenance practices have been too intensive, and similar to those on cropped land (e.g. ploughing prior to planting and to control invasive vegetation, ploughing up and down the slope), thus negating the potential soil conservation benefits of afforestation. It is not clear in what proportion of afforestation such practices have occurred; the MTE report states that according to the interviews with beneficiaries, the figure is less than 1% (however, the beneficiaries may not be the most objective source). A study of farmland afforestation in the province of Huelva from 1993 to 1998 (1,568 projects) found that in >90% of parcels there had been more or less intensive sub-soiling as preparation for tree planting (R.Mª. Navarro, R.; R. Amores, y P. Carrasco, un-dated). Such practices are known to cause considerable carbon release and potentially cause soil erosion.

167
The report emphasises the high rates of soil erosion on some land in Spain, and the potential benefits of afforesting such land, but high rates of erosion do not occur on all land and there is no evidence that afforestation has taken place on land with particular erosion problems. In fact only 13% of afforestation (14,000 ha) was found to have taken place on steeply sloping land. An even smaller area of afforestation (1,500 ha or less than 2% of the total) was found to have taken place on land with very low organic matter content (<2% organic matter by weight). Furthermore the 2008 evaluation report finds from simple surveys that only 7% of the parcels afforested had evidence of some soil erosion, while 4% had evidence of medium-severe soil erosion (TRAGSATEC, 2008). Given these figures it is very surprising that the evaluation considers the afforestation programme to have been almost universally beneficial for soil conservation. If steep slopes and soils with very low organic matter content are highlighted as examples of land with particular erosion problems, then it might be expected for the measure to be targeted on such land if it aims to achieve specific soil conservation objectives. Such targeting does not occur. A review of RDP forestry measures in the Basque Country (García et al, 2013) points out that in conditions with a pre-existing permanent vegetation that provides effective protection, stability and maintenance of soil structure, any afforestation regardless of the soil preparation method, implies a loss of soil quality and release of CO2 from the soil. Concerning biodiversity, afforestation is affirmed in the MTE report to have been beneficial (“increased biodiversity”) because it has been mostly with native species and respecting existing ecosystems. The consultation with experts and beneficiaries also concluded that the programme had been beneficial for biodiversity overall. Some examples of benefits are cited, such as creation of habitats for forest birds and the extension of forest habitat in areas with brown bear populations. One positive achievement highlighted by the report is that 18,883 ha of plantations have provided increased connectivity between existing, isolated forests. This represents 18% of the area afforestated under the measure. Again it is legitimate to question why this function, if it is considered positive, was not promoted by some form of targeting under the measure rather than left to chance. Similarly, it is reported as positive that 28,754 ha (27% of afforestation) have been afforested in districts with less than 10% tree cover, but this objective is not actively pursued under the national measure. On a less positive biodiversity note, the MTE report finds that the tree species identified as “of special interest” in the Annexes of the Royal Decree establishing the national measure have been used very rarely in afforestation projects.

168
Surprisingly and very importantly there is no analysis in the evaluations reports of what types of habitats have been afforested nor of the habitat priorities for the country. A large number of Habitats Directive habitats (including Annex 1 priority habitats) are semi-natural pastures that are eligible for afforestation under the measure, and a national inventory of these habitats is held by the Ministry of Agriculture in the Banco de Datos de la Naturaleza that is referenced in the MTE report. But no assessment is made of how much of these habitats have been lost to afforestation. Both the 2003 and 2008 evaluations report on the previous landuses based on samples. There appears to have been a shift towards cropped land in the second half of the 2000-2006 period, with the proportion of afforested land previously under permanent pasture declining to about 50%. There were large differences between regions, for example in Galicia over 90% of afforested land was previously under permanent pasture while in Castilla y León and Castilla La Mancha around 80% of the land was previously in cultivation. However, there is no analysis in the evaluations of wider land-use changes, to put farmland afforestation in the context of other large-scale changes that are taking place. For example, the LPIS data for Spain show that permanent pastures declined in extent by 335,135 ha from 2005 to 2013. Some of this decline is probably the result of the farmland afforestation measure, but clearly there is an on-going loss of permanent pastures resulting simply from abandonment of grazing and subsequent reclassification as forest. A report recent on the state of Spanish forests from the Ministry (Ministerio de Agricultura, Alimentación y Medio Ambiente, 2012) shows that the average annual regeneration of forest cover (artificial and natural regeneration) for the period 2003-2007 was 98,250 of wooded area. Almost half this regenerated area (49%), was due to natural regeneration, rather than afforestation. It seems that the afforestation measure is pushing at an open door by subsidising the creation of forest when this is already occurring through natural succession. If there is no economic benefit to the subsidised afforestation, and the main benefits are environmental (as the 2003 and 2008 evaluation reports conclude), then artificial tree planting seems difficult to justify as preferable to natural succession. However, it should be emphasised that in some cases farmland afforestation is taking place on land that is remote from seed sources and would take many years to evolve naturally to tree cover. Indeed, the report does mention that there have been “some cases” of pastures with pre-existing natural regeneration, including species of ecological value, being cleared prior to afforestation. Cases are also reported of fragile habitats with endemic vegetation of high ecological value suffering from “aggressive planting practices”, for example Annex 1 habitats 1410 Mediterranean salt meadows and 1520 Iberian gypsum vegetation. The report states that the number of cases is not known, but that the environmental effects of such afforestation are negative and should be avoided in future.

169
A less common problem has been afforestation of farmland in extensive pseudo-steppe landscapes where the fauna of ecological value (especially steppe bird communities) can be impacted negatively by the establishment of forest patches. The occurrence of such cases is reported to be “not very significant” and generally well controlled by the nature conservation authorities. The fact that forests of native species have been planted does not mean that biodiversity necessarily has been increased or enhanced in a given region. It may be that the forest habitats created are of a type already common, and that the open habitats that are lost are of a type suffering from decline. The 2008 evaluation report mentions the creation of large areas of Quercus ilex and Quercus suber forests as positive, given that these are Directive Annex 1 habitats. However, these grazed woodland habitats cover several million hectares in total and the same report highlights that lack of natural regeneration is the key environmental affecting them. WWF Spain has argued that promoting natural regeneration through sustainable grazing management should have priority over planting new areas (Beaufoy et al, 2005). As Box 1 illustrates, some native forest types are widespread and there expansion is not a conservation priority, whereas certain types are highly fragmented and creation of new forests of these types is considered a priority. The farmland afforestation measure in Spain has included an annex of tree species of special priority but these have been used in a very small number of cases. In the case of Natura 2000 sites, the MTE report found that special care was taken by all regional administrations in checking applications within such sites to ensure beneficial effects. In some cases, such afforestation was found not to be positive for biodiversity within the site.
Box 1: Forest habitat priorities in Basque Country The Basque Country has 55% forest cover, although only 25% cover of native forests, the rest being plantations of exotic species. However, some types of native forest are relatively widespread and well-connected (beech and Pyrenean oak for example), while others have been reduced to small, fragmented patches. Atlantic oak forests and riverine alder woodlands in particular cover only a small fraction of their potential area, the former having been largely replaced by exotic Monterey pine (Pinus radiata) plantations. In Bizkaia province, some 75% of the forest area consists of exotic conifer species and eucalyptus. Native Atlantic and mixed woodlands are reduced to relicts occupying only 15,000 ha compared with 100,000 ha of Monterey pine and 13,000 ha of eucalyptus. Riverine woodlands are highly fragmented and cover only 5% of their potential distribution.

170
The regional RDP document identifies the scarce coverage of certain types of mature native woodlands as a key environmental problem, but the resources dedicated to establishing new native woodlands of these types are very limited according to Garcia et al (2013).
Concerning landscape, the MTE report affirms that forests are beneficial for landscape quality and will thus increase the touristic value of areas affected by the measure. There is no apparent basis for this affirmation, other than the fact that the majority of beneficiaries of the measure expressed this opinion. A more meaningful point made by the report is that 57% of afforestation projects were on parcels adjacent to cultivated land and that this could have the effect of creating a mosaic landscape. Overall, it is striking that the evaluation concludes that the benefits of the afforestation measure have been mainly environmental, while socio-economic benefits have been limited. And yet several environmental commentators such as WWF Spain take the view that farmland afforestation is not an environmental priority and that improved management of existing forests and improved fire prevention are more important. As an indication of the limited socio-economic benefits, TRAGSATEC (2008) report that in the period 1996 to 2004 employment in forestry and related activities fell by 37%, an even faster rate than affected farming in the same period (-15%). In other words, the area of forest has increased considerably but this has not lead to a corresponding increase in employment, implying that the economic future for the created forests is quite limited. Finally, the report mentions more than once that in some cases the afforestation supported by the measure has caused conflicts with graziers who are excluded from pastures. This may refer in some cases to common grazing land that is afforested by public authorities, as a considerable proportion of afforestation under the measure has been undertaken by public authorities. However, commentators in Extremadura have also said that pasture availability has become a problem in areas with high rates of afforestation, and that rental prices have risen accordingly. To conclude, it should be borne in mind that Spain is the MS with the fastest rate of increase in forest area in recent decades, partly the result of farmland abandonment processes, especially of more remote extensive pastures. The EU measure for farmland afforestation has driven this process faster, resulting in a larger reduction in the area of EVG. It is simple to present this as “good for the environment”. Forests are seen as an environmentally positive landuse, especially when consisting mainly of native species. Evaluation reports point to “obvious” benefits in terms of soil, carbon, landscape and biodiversity, but in the case of afforested permanent pastures (mostly EVG) these claims are not clearly unjustified.

171
From 1992 to 2013, farmland afforestation has been the main RDP measure available to marginal farmland in Spain, putting agri-environment and the maintenance of low-intensity farming systems in the shade. It is legitimate to ask what is the future of this land after the maintenance payments are ended, and whether the owners will pay the cost of maintaining the new forests if they are of no or limited economic value. In some cases they may have a future as wood pasture systems, of CAP direct payment rules allow for this. Some of the forests may mature without management into valuable wildlife habitats and carbon stores but it can also be expected that wild fires will become an increasing risk.
UK
A total of approximately 277,000 ha of afforestation has occurred in the UK under the EU farmland afforestation measures since 1992, the third biggest area after Spain and Portugal. In current RDP period the UK is the MS with the largest extent of EU-supported farmland afforestation by a considerable margin. There are some significant differences between the four parts of the UK in afforestation patterns over recent years, and also in the design of measures. This makes it difficult to report on the situation for the MS as a whole. Scotland and England consistently account for around 90% of all non-State afforestation in the UK. Scotland accounts for between half and three-quarters of the England+Scotland total. The size and type of afforestation projects varies considerably between Scotland and England. For example, the great majority of plantations created in Scotland are over 40 ha in size, whereas in England they are under 5 ha. A common feature across the four administrations is that the annual compensatory payment (FWPS) is differentiated in order better to reflect the income foregone from agriculture on different land types. The classes used are improved farmland (sometimes separating out arable land) and unimproved land, with some distinction also between Less Favoured Area (LFA) and non-LFA. The distinction between improved and unimproved farmland is consistently maintained in all administrations. The following is an example of the definition given for non-arable improved land in the England Woodland Grant Scheme: “This includes improved grassland and other cropped land areas where over half the sward comprises either singly or in mixture, ryegrass, cocksfoot, timothy or white clover. Within Less Favoured Areas (LFA) improved grassland that contains areas where over one third of the sward comprises either singly or in mixture, ryegrass, cocksfoot, timothy or white clover. Grassland within the LFA not qualifying under this definition may still be eligible if it has been ‘improved’ by management practices such

172
as liming and top dressing, provided that there is not a significant presence of sensitive plant species indicative of native unimproved grassland. Further information and a list of these sensitive species can be obtained from your local FC office. Such land must have been ‘improved’ at least three years before the date of application.”69 The threshold of improvement is lower in the LFA – a field which is regarded as poor quality in the non-LFA might be the best on the farm in the LFA and its importance is recognised in the payments. Effectively, farmland defined as “unimproved” would be equivalent to EVG according to the definition proposed in this study. In Scotland, unimproved land accounted for a consistent 40-50% of afforestation from the 1990s, while in England only 5.1% of planting between 1992-3 and 2000-1 was on such land. These data should not be taken to be representative of the subsequent period however, with Scotland introducing Locational Premia, for example, in an attempt to improve uptake in certain zones and land types. Full time series would be available on request from all 4 administrations. Objectives The 4 UK RDPs are intended to make a significant contribution to the delivery of the 4 forestry strategies of the respective administrations. As the UK’s major afforesting country, Scotland’s strategy is the most important in terms of the scale of its potential effects, at least. It aims to increase Scotland’s forest cover from 17% in 2006 to at least 25% by the second half of the 21st century, which equates to an average of around 10,000 ha of new planting per annum. It includes the following objectives: Help to tackle climate change. Contribute positively to soil, water and air quality. Contribute to landscape quality. Protect and promote the historic environment and cultural heritage. Help to protect and enhance biodiversity. Climate change clearly is the top priority for the Scottish Government in terms of afforestation goals; what this implies for biodiversity is not so clear, as we explore below. In Wales, an interactive web tool is available to indicate areas which are suitable for planting70 in support of the forestry strategy, which includes the objectives: Woodland cover in Wales increases
69 http://www.forestry.gov.uk/pdf/ewgs7-guide.pdf/$file/ewgs7-guide.pdf
70 http://maps.forestry.gov.uk/imf/imf.jsp?site=fcwales_ext&

173
Welsh woodlands contribute to reducing the carbon footprint of Wales Woodlands and trees make a positive contribution to the special landscape character of Wales and to sites of heritage and cultural importance New and existing woodlands and trees contribute to water and soil management The RDP intends to deliver this by increasing the area of native woodland by woodland creation and by increasing the area of mixed woodland on mineral soils. In Northern Ireland, the policy is summarised in the overall objective: ‘A steady expansion of tree cover to increase the many diverse benefits that forests provide.’ In support of this objective, an indicative map has been produced and is reproduced below. The specific aims of the Woodland Grant Scheme (WGS) in Northern Ireland are: (i) Encouraging the creation and sustainable management of woodlands and forests to: • increase the area of tree cover in Northern Ireland; • increase the production of wood; • improve the landscape; • improve woodland biodiversity; • offer opportunities for recreation and sport. (ii) Providing jobs and improve the economy of rural areas and other areas with few sources of economic activity. (iii) Providing a use for land as an alternative to agriculture. Targeting and protection mechanisms In Scotland, the plethora of strategies is summarised well in its Rationale for Woodland Expansion (Scottish Government, 2009a). It is particularly open when it comes to land use choices: Prime agricultural land. It is accepted that while there is some scope for filling in habitat networks on the best land, and also of high-yielding biomass plantations, in general afforestation will not be carried out on prime agricultural land Peats and high carbon soils. “To harness the benefits of trees for carbon sequestration, woodland creation is best focused away from the deeper peat soils. Low carbon agricultural soils offer the best carbon gains, but these are increasingly unlikely to become available for woodland creation given their importance for food production. Hence, woodland creation is likely to be focused on lower quality agricultural land that still offers a significant net carbon sequestration potential from woodland.” Species and habitats. “Many of the EU and UK priority habitats, for example a range of coastal, calcareous and montane open habitats, are limited in extent. The upland heath priority habitat is much more extensive, with the action plan indicating up to 2.5 million ha in Scotland (some 30% of Scotland’s land area). Of that, an unknown proportion comprises habitats listed in the European Habitats Directive.”

174
“Where woodland planting proposals involve areas of biodiversity importance, the established consultation processes and environmental impact assessment are used to inform decisions on whether the scheme should be consented and/or supported with grant aid. The decision process involves provision of advice from Scottish Natural Heritage on the quality and significance of the area, and the likely impact of the proposed woodland on the habitat. The design and type of the proposed woodland is taken into account, and in some cases careful woodland design, in accordance with current good practice, can offer protection of high quality open habitats and the creation of valuable new woodland habitats. Similar processes are used in relation to species listed in the EU Habitat and Birds Directives and those listed in the UK Biodiversity Action Plan.” In Northern Ireland, the indicative map has been drawn up as follows71: Research undertaken by Forest Service, utilising the Forest Service’s Geographical Information System (GIS), identified 51 % (695,500 hectares) of the land area as being potentially “suitable for woodland creation”, taking into account the following environmental and land use constraints: Peat greater than 50cm depth Land over 300 metres Special Areas of Conservation (SAC) Special Protection Areas (SPA) Scheduled Monuments and Zones Ramsar Convention Sites Areas of Special Scientific Interest (ASSI) Breeding Wader Areas A further 12% (159,100 hectares) was found to be potentially “suitable for woodland creation with possible constraints” in relation to: Areas of Outstanding Natural Beauty (AONB) Red Squirrel Preferred Areas Designed Landscapes Areas of Significant Archaeological Interest (ASAI)
71 http://www.dardni.gov.uk/forestservice/forestry-grant-schemes-and-plant-
health/private_woodlands_indicative_maps_for_new_woodland.htm

175
Indicative map for woodland planting, Northern Ireland. Red areas are suitable; orange have possible constraints; cream areas are unsuitable. In Wales, the indicative map shows the areas which are deemed: suitable for planting suitable for planting with guidance possibly suitable for planting after consultation not suitable for planting. It has not been possible to elucidate the list of constraints on which this map is based, but it is likely to be very similar to that for Northern Ireland. The rules implementing the EIA Directive have been enacted separately but similarly in the constituent parts of the UK72. In Scotland, the thresholds apply as follows:
Criterion Threshold
Site of Special Scientific Interest (national conservation designation) or subject to Nature Conservation order World Heritage Site Scheduled Monument (national historic/ built heritage designation) Natura 2000 site
None
72 The current Regulations are the Environmental Impact Assessment (Forestry) (England and Wales)
Regulations 1999 [SI 1999/2228], the Environmental Impact Assessment (Forestry) (Scotland) Regulations 1999 [SI 1999/43] and the Environmental Impact Assessment (Forestry) Regulations (Northern Ireland) 2006, as amended by the Environmental Impact Assessment (Forestry) (England and Wales) (Amendment) Regulations 2006, the Environmental Impact Assessment (Scotland) Amendment Regulations 2006 and Environmental Impact Assessment (Forestry) (Amendment) Regulations (Northern Ireland) 2007.

176
National Park or National Scenic area (national landscape designations)
2 ha
None of the above 5 ha
The thresholds take account of any similar adjacent activity within the past 5 years. As can be seen in some of the detail above, many of the constraints set out in the EIA rules are reflected in the respective indicative maps. In Scotland, for example, planting applications on large or marginal areas are expected to produce further evidence as set out in Guidance Note 35 (Forestry Commission Scotland, undated), including maps of soils and National Vegetation Classification communities, as well as geology, climate and other constraints. Whilst the main aim of the note is to limit afforestation to sites where it can succeed, it nevertheless instructs that ‘Plant communities which are of greater conservation value left unplanted should be mapped and described through ‘target notes’. In some situations whole mapped soil or site types may be unsuitable for planting.’ Also ‘FCS currently operates a general presumption against new woodland creation on soils with peat exceeding 50cms in depth. A survey will be required to satisfy this requirement. A peat depth survey will usually record <30cms; 30-50cms; and >50cms. Areas of peat greater than 50cms and 0.25ha will need to be mapped out as not grant aided “other land”.’ As such it could impose much greater constraints than the rules implementing the EIA Directive. Afforestation grants in the UK are handled by local woodland officers who both implement statutory controls and administer grant schemes (including under the RDPs). Since most planting by private persons is likely to involve grant aid, this gives them a very important role, and one to which in general they seem to bring a proactive approach to guidance. From the perspective of the applicant, all administrative controls are implemented seamlessly through the woodland officers. This means that Forestry Strategies and targeting mechanisms in the grant schemes are in many cases as important as EIA rules. The existence of these local woodland officers is thus a positive mechanism in the UK for implementing and integrating the various policy instruments that aim to target afforestation for environmental and other purposes. Environmental effects Afforestation was responsible for considerable environmental damage in the 1960s, 70s and 80s, for example causing large-scale destruction of valued habitats, and deep ploughing of carbon-rich soils. It was the mistakes of the 1960s-80s which led in large part to the putting in place of the safeguards outlined above. Since their introduction the EIA controls and other mechanisms appear to have been effective in protected semi-natural habitats from afforestation in England (where they have been criticised as weak in the case of agricultural intensification of grassland habitats), although numerous small examples are reported of afforestation in inappropriate places from a habitat point of view, especially small plots that fall

177
below the thresholds (Grasslands Trust, personal communication). EIA for forestry only came into force in 1999, there were no controls between 1992 and 1999. Generally at the MS level, the current mechanisms are designed and implemented with care and have the effect of discouraging planting on certain land cover types (designated sites, priority habitats, deep peat) and limiting it in other areas (protected landscape designations) where the most extreme negative effects of afforestation could be expected. However, in the context of the present study it is legitimate to raise questions about the very large areas of valued semi-natural habitats (EVG) outside of protected and designated areas. The UK Biodiversity Action Plans (BAP) identify expansion of tree cover and tree planting as a significant cause of decline across a range of priority habitats. These include upland and lowland grasslands, hay meadows, acidic and calcareous grasslands, wood pastures, blanket bog, upland and lowland heaths and others. It is estimated that 120,000 ha of former BAP habitats have been lost to afforestation in England alone. Chatters (2013) reminds us that forest biodiversity in the UK is dependent primarily on the maintenance of continuity of “old growth” wood pastures and management of ancient coppices. Conservation management is about keeping open spaces within woodland (e.g. through grazing), rather than filling open spaces with trees. Tree planting in itself does not automatically deliver forest biodiversity priorities. In Northern Ireland, where targeting and protection mechanisms seem to be particularly effective, there are nevertheless concerns about some biodiversity effects of afforestation. The RSPB has concerns that the loss of open ground habitat due afforestation has reduced the area in which waders such as lapwing, curlew and snipe can breed and, by concentrating birds into smaller areas, may have increased vulnerability to predators. These areas can be in the uplands/marginal land (e.g. for breeding curlew) and the lowlands (e.g. for breeding lapwing). Plans to plant forests, including the production of biomass, could impact on the limited number of areas suitable for breeding waders and farmland birds, e.g. yellowhammer and skylark. The Northern Ireland Countryside Survey (NICMS) also has highlighted concerns based on measurable data. NICS is structured on statistical sampling principles and standardized protocols for habitat field survey. Between 1986 and 1991, baseline habitat field survey was carried out in a sample set of quarter kilometre grid squares throughout NI. Habitat change was assessed by surveys in 1998 and 2007. Increases in woodland cover, both broadleaved and coniferous, were recorded at the expense of semi-natural habitat. An important consideration in all the countries is that the returns from agriculture on the best land have the effect of limiting afforestation on improved grassland and arable land, notwithstanding the higher incentive payments on offer, and notwithstanding the statement in the Scottish Forestry Strategy that ‘carbon gains will be greatest on fertile, low carbon soils.’ In Scotland and Wales the distribution of

178
CAP support (Pillar 1 and LFA) is weighted in favour of more productive land, thus further limiting the attractiveness of afforestation on such land. The effect of these drivers tends to be to encourage the afforestation of the poorer land (generally with semi-natural vegetation) which does not fall under the existing protection mechanisms. In Scotland, the main types of land affected by afforestation in the absence of strong counter-incentives are thus predicted to be: Upland acid grasslands, especially those not on soils with substantial organic horizons (e.g. Festuca ovina – Agrostis tenuis pastures) Undesignated European dry heaths and Atlantic wet heaths with Erica tetralix Bracken (Pteridum aquilinum) areas Species-poor inbye pastures (such as less productive Lolium perenne - Cynosurus cristatus MG6 and more species-rich but unprotected MG5 Cynosurus cristatus - Centaurea nigra grassland grasslands, in the UK National Vegetation Classification) Species-poor rush pastures (e.g. MG10 Holcus lanatus - Juncus effuses or species-poor M23 Juncus effusus/acutiflorus – Galium palustre communities) All of these habitats are accorded higher value under the protection mechanisms in certain situations, for example, upland grasslands with notable breeding wader populations; bracken with pearl-bordered fritillary (Boloria euphrosyne) populations; species-poor old pastures with significant grassland fungi populations; rush pastures with significant breeding waders or marsh fritillary (Euphydryas aurinia) populations. In all these cases, successful protection depends on both correctly identifying the habitat and ascertaining correctly the presence or not of other features of potential importance. With the exception of bracken, which is easy to recognise at all times of year, identifying these areas and distinguishing them from more ‘valuable’ habitats (acid grasslands on brown podzolics from those on stagnopodzols; species-poor from species-rich hard grazed inbye grasslands, especially in winter time; more species-rich rush pastures, etc.) require some skill and training, and mistakes are of course possible. It is also the case that habitats which are locally common, even ones of European significance, sometimes receive poor protection, as witness the blanket bog planting on the Isle of Lewis in the following photo.

179
Google StreetView of conifer planting on blanket bog on the Isle of Lewis, Scotland This is true on a much wider-scale for non-bog habitats, as illustrated by the following sentence in the Scottish Rationale for Woodland Expansion, ‘Of [the 2.5 million ha of upland heath priority habitat], an unknown proportion comprises habitats listed in the European Habitats Directive’ If these areas are indeed heathland, as current landcover data indicates, then all will fall into one of a number of Annex 1 habitats (for example European dry heaths, 4030; Northern Atlantic wet heaths, 4010; Alpine and Boreal heaths, 4060), the loss of which the UK, including Scotland, has to report to the European Commission. In fact the most recent Article 17 report from the UK (http://jncc.defra.gov.uk/page-
4060) refers to the limited protection for Annex 1 habitats outwith designated sites. An example table in the Macaulay report illustrates a possible scenario by which the 25% woodland cover target could be delivered. It imagines a scenario in which 150,000 ha of Annex 1 shrub heath or 7% of the current resource and 270,000 ha or 17% of all other unimproved (semi-natural) grasslands is lost.73
73 A large report by the Macaulay Institute on the targeting of woodland expansion is available online:
http://www.forestry.gov.uk/pdf/macaulaymainreport.pdf/$FILE/macaulaymainreport.pdf http://www.forestry.gov.uk/pdf/Macaulaymainreportappendices.pdf/$FILE/Macaulaymainreportappe
ndices.pdf
http://www.forestry.gov.uk/pdf/MAINTABLES.pdf/$FILE/MAINTABLES.pdf http://www.forestry.gov.uk/pdf/Macaulaymainreportfigures.pdf/$FILE/Macaulaymainreportfigures.p
df

180
An example scenario of how planting could be directed in order to achieve the target of 25% woodland cover in Scotland. The more general issue is whether the low value accorded to such habitats as those listed above is valid, being based mainly on higher plants, ignoring taxa such as invertebrates and fungi which benefit from the age and continuity of management of some of these land covers. The question of how to set that value against the benefits accruing from a forest plantation raises further challenges, especially if, as in Scotland, afforestation is seen as having wider socio-economic benefits. The Woodland Expansion Advisory Group (WEAG) was established as a positive mechanism for working towards a consensus on woodland expansion in Scotland. The final WEAG report (http://www.forestry.gov.uk/weag) identified approximately 2.65 million hectares of farmland (generally extensive grazing land of Land Capability for Agriculture classes 3.2-6) as very suitable or suitable for native woodlands and almost 85% of this as suited to productive conifer forests. However, it also noted that up to 1 million ha of this area may be UK BAP priority habitat, mainly upland and lowland heath. The report also notes the potential sensitivity to planting of this open ground habitat for 11 species of bird, including breeding waders, corncrake and golden eagle, based on analysis submitted by RSPB Scotland (which was a member of WEAG). Some 34% of the area identified as suitable for planting in purely land capability terms, is very highly sensitive or highly sensitive for some species of birds. This means that afforestation has the potential to have adverse impact unless planting proposals can demonstrate a critical assessment of impacts, and how design, location and scale can overcome or avoid these. In the case of very highly sensitive land, planting should be avoided. The approach of 'woodland sensitivity mapping' proposed by RSPB offers a possible tool for refining the targeting of afforestation to take better account of birds and wider biodiversity. The lack of value and protection afforded to non-Annex 1 semi-natural pastures, from activities such as afforestation and agricultural intensification, is a real concern for RSPB Scotland which wants to see the Scottish Government take greater action to prevent its loss (RSPB, pers comm.).

181
More debate on this topic has been prompted recently by an article by Clive Chatters (2013), whose conclusion is that tree planting is ‘not particularly’ good for wildlife. In a response in the subsequent edition of British Wildlife, Paul Smith (2013) notes that ‘he might have gone on that the unceasing propaganda put out by community-woodland charities and others that “planting trees is good”, almost without reservation, has effectively brainwashed the general public.’ The UK has well-developed mechanisms for preventing environmental damage and promoting environmental benefits from farmland afforestation. Forest strategies have been developed through wide stakeholder participation. Implementation on the ground through woodland officers is a positive mechanism – from other MS reports it seems the absence of such human resources on the ground is a major handicap to effective targeting. On the other hand the UK is now the MS with the largest programme of farmland afforestation in the EU, and there are some inevitable tensions between environmental objectives such as biodiversity and carbon sequestration, and also with socio-economic objectives. Since productive farmland is largely excluded by economic forces (including the CAP), and prime habitats and deep peats are excluded by protection mechanisms, the only land available for large-scale afforestation is extensive grazing land, much of which is EVG as defined by this study. This land has important biodiversity value, and also other environmental values that may not be taken sufficiently into account (carbon storage). This type of landcover is also in decline partly as a result of other policy decisions, especially CAP decoupling and CAP support being skewed in favour of more productive farmland in the Scottish case, and the relatively limited availability of agri-environment support for the continued extensive farming of such land. Many positive steps have been made in the UK over the last 20 years to improve the environmental impacts of forest plantations; however, beyond the questions of how to ensure that any new woodland that is planted has the lowest possible negative impact and highest possible level of benefit for its environment, there is a more fundamental issue of how the decision to undertake large-scale afforestation of farmland is made and what environmental value judgements are used in the cost-benefit analysis.

182
ANNEX 17 EU-LEVEL INFORMATION AND STUDIES ON ENVIRONMENTAL EFFECTS OF AFFORESTATION
The Court of Auditors (2004) reported that in one Member State visited the policy was highly criticised by environmental NGO’s which claimed that it was over-focused on economic aspects without due regard to the need to maintain bio-diversity. The evaluation of Regulation 2080/92 by IDF (2001) made the following comments concerning the environment (present author’s comments in bold):
Here the lack of truly specific objectives posted by national programmes, specific monitoring tools and references is a glaring omission. We are however able to say that the impact of the afforestation under 2080 on the storing of carbon is positive but would be negligible in 2012, and that it will hardly be significant before 2030, mainly because of the slow growth of the Mediterranean species planted (it would then represent 2 to 3% of the total carbon fixed by the European forests, but will remain small when compared with Europe’s undertakings at the Kyoto Conference). However, the evaluation did not take account of the considerable carbon storage properties of previous land cover, particularly extensive pastures (see comments below from MEACAP study). As far as the contribution of Regulation 2080 to biodiversity is concerned, both medium and large scale, it is rather positive and relatively significant. The national programmes have in fact all encouraged the use of broad-leaved trees (with the exception of Ireland), the planting of indigenous species in the interests of the country’s heritage (particularly Spain) and also of the types of forests and original improvements, based on mixes of species. The assessment is extremely generalised. Fundamentally, it does not take account of the previous land cover, that is known to have consisted of semi-natural pastures in many cases. It is highly questionable that the planting of a broadleaved forest should be assessed as automatically positive for biodiversity, without knowing the habitat and species communities that it replaces, and that may (or may not) be considered of greater biodiversity value. In fact the study also states: We would however point out that the plantations planted in Spain and Ireland would in some cases and to a certain extent have had an effect deemed to be detrimental to biodiversity, habitats and the protection of natural resources. Plantations and improvements carried out owing to Regulation 2080 are ultimately part, with few exceptions, of a step which generally helps to protect the soil from erosion and desiccation (in particular in an arid Mediterranean area), and protects the water by cleansing it of nitrates.

183
However, it is impossible to quantify this impact, in the absence of tools and references available in the countries. A very generalised assertion. Again, a key question is the previous land cover. Spontaneous grasslands and shrublands have been found to be effective in protecting soil from erosion in some situations (e.g. Bienes et al, 2009). The outcome depends ultimately on the land in question and the management regime, not merely on whether there is tree cover or not.
A LIFE report on grasslands made the following comments: In several Member States, deliberate afforestation, e.g. with poplars Populus spp., is a significant threat to permanent grasslands. For the EU-15 as a whole, a breakdown of newly afforested land according to previous use revealed that 60% was formerly permanent pastures or meadows while only 40% was cropland (EEA 2001). The MEACAP study (Zanchi, Thiel, Green and Lindner, 2007) gave more detailed consideration to environmental effects of farmland afforestation. On the question of carbon balance, the study does not find conclusive evidence that afforestation is beneficial compared with pre-existing permanent pastures. It seems that in some cases it may be, and in others it may not be. Relevant factors include the former land use, site preparation methods, and subsequent events, such as possible forest fires causing carbon release especially in Mediterranean regions:
While forest stands always contain more biomass above-ground compared to grassland or agricultural crops, this is not always true for below-ground biomass and soil organic matter. The former land use and possible site preparation strongly influence the soil carbon changes in afforestation activities. A review of soil carbon dynamics in land-use changes revealed that in the case of conversion from pasture to plantation, an average decrease in soil carbon stocks was observed (Guo and Gifford 2002). Natural grasslands and pastures often store more carbon in the soil compared to forests, because of the high root litter input from perennial grasses into the soil. Woody plants deposit more litter on the surface, which leads to carbon accumulation in the forest floor, often at the cost of lower soil organic matter contents. In their recent review, Jandl et al. (2006) found that after a temporary reduction of soil carbon storage after site preparation and afforestation, most studies revealed a long term accumulation of carbon in the soils. For example the study of Zerva et al. (2005) showed that the establishment of coniferous forests on peaty gley grassland soils in the Scottish uplands can lead to a net accumulation of soil carbon during the second rotation.
Land abandonment can sometimes lead to uncertain or negative change in the amount of the carbon stored in the ecosystem (Goodale and Davidson 2002), land degradation (for example, erosion and desertification) and unstable conditions (for example, increase of fires). Jackson et al. (2002) studied woody invasion into grasslands along a precipitation gradient and found losses of soil organic carbon at the wetter sites substantial enough to offset increases in plant biomass carbon. Discontinued maintenance of

184
terraces can also lead to carbon loss from soils. In the first stage of abandonment terraced soils are favourable for the invasion of shrubs and trees. However, in the absence of maintenance works to the terraces a rapid soil and organic matter loss may occur after the fall of the terrace walls (Dunjò et al. 2003). The terraced lands are usually on very steep slopes and as a consequence of the loss of terraces, the soil might be much more subjected to erosion and the vegetation establishment might also be more difficult. Land abandonment is also reported as one of the main causes of soil degradation and desertification in the Mediterranean region (ICCDD 2000). Soil evolution after the abandonment of cultivated land is connected to the development of the natural vegetation through secondary succession processes (Martinez-Fernandez et al. 1995, Kosmas et al. 2000, Van Rompaey et al. 2001). The establishment of shrub or tree communities is strictly determined by the site conditions: shallow soils and low availability of nutrients can delay the recovery of natural vegetation. The absence of a vegetation cover leads to an increase of erosion processes that can result in degradation and desertification (Garcia-Ruiz et al. 1995, Lasanta et al. 1995, Cammeraat and Imeson1999, Pardini et al. 2003). In Southern European countries another factor that can promote soil degradation is the disturbance by recurrent forest fires. The secondary succession on former agricultural areas leads to an increase in the biomass, but this also increases fuel amounts, increasing fires risk in these regions (Romanya et al. 2001).
On the question of biodiversity, the study points out that the implications of afforestation depend on many factors such as the previous land use, previous biodiversity values, or the way afforestation is carried out. The surrounding landscape is also relevant. The report states that:
Large scale afforestation of natural grasslands or culturally rich historical small scale landscapes could lead to the loss of specific species, while afforestation of intensively used agricultural areas could enhance biodiversity. Similarly, afforestation of patches in an open landscape could increase biodiversity by creating additional habitats. On the other hand afforestation of open areas in a forested landscape could lead to a loss in biodiversity by destroying specific habitats, because open patches in the forest are known to be beneficial for many species. The high afforestation rate promoted by high subsidies has sometimes ecologically negative effects, such as afforestation of bogs with high conservation value.
Overall, the MEACAP study suggests that carbon and biodiversity effects of farmland afforestation both depend to a large extent on the previous land cover and land use. It cannot be assumed that farmland afforestation is, or has been, automatically beneficial for either carbon balance or biodiversity. The AFFOREST research results seem to be specific to the sites studied and do not intend to provide a basis for evaluating the effects of farmland afforestation at the scale of the EU or a MS. However, some points are mentioned here. For example, it

185
was shown that afforestation affects groundwater recharge in some situations, because trees of all ages have larger water demands than arable land and grassland. This depletion in the groundwater recharge may affect the local hydrological balance negatively in these specific situations. Concerning nitrogen leaching, it was negligible in the spruce forest and declined with age in the oak forest, indicating a net consumption of N. Therefore, water pollution due to N, previously introduced by fertilizers, can be expected to be reduced with time as a result of afforestation of intensively farmed land. A meta-analysis study on the effect of Soil Organic Carbon (SOC) of afforestation (Laganiere et al., 2010) indicated that this is primarily determined by previous land use, tree species planted, soil clay content, pre-planting disturbance and, to a lesser extent, climatic zone. It also became clear that the positive impact of afforestation on SOC stocks is more pronounced in cropland soils than in pastures or grasslands. In the same AFFOREST project a case of afforestation in Calabria was investigated both in relation to groundwater recharge, soil erosion and carbon sequestration in combination with economic valuation (Tassone et al., 2008). The overall conclusion of this study was that afforestation does not necessarily lead to an improvement of the environmental quality, certainly in relation to groundwater recharge and soil erosion reduction, afforestation of pasture and non-cultivated land leads to negative effects. For carbon sequestration it would still work out positively however. Afforestation of arable lands leads to environmental improvements in all three environmental issues considered. Since this study also incorporated the economic valuation of environmental benefits and losses an analysis could also be made of the costs against the benefits (equalling to ‘social costs/gains’). If costs to environment are included the rotation length needs to be increased to produce a positive result for a plantation. If environmental costs are excluded the rotation length declines and so do the environmental benefits that can be reached with an afforestation project. The conclusion is drawn that through the provisioning of subsidies to afforestation costs are sooner compensated for by gains, leading to an average decline in rotation length of a plantation. At the global scale, the FAO has reported some relevant research about the carbon-storage functions of farmland, and especially of grassland. Grasslands are included in Article 3.4 of the Kyoto Protocol and, like forest, they play an important role in carbon sequestration. Firstly, grasslands occupy billions of hectares (3.2, according to FAO) and they store from 200 to 420 Pg in the total ecosystem, a large part of this being below the surface and therefore in a relatively stable state (FAO, 2001). Soil carbon amounts under grassland are estimated at 70 t ha-1, similar to the quantities stored in forest soils (Trumbmore et al., 1995; Balesdent and Arrouays, 1999). While the total C present in the grassland ecosystem is less than in some forest ecosystems, the belowground (and therefore most stable) part of C may be higher. Even greater C storage in grassland soils can be achieved by for example increasing the proportion of nitrogen-fixing legumes and/or more productive species with deeper root systems, more resistant to pasture degradation. These technicques will

186
increase carbon sequestration to a considerable extent (Fisher et al., 1994) since pastures can store very high quantities of C in a very stable form (FAO, 2001). Grasslands represent a major terrestrial carbon carbon (C) stock which can be increased by appropriate management. The global technical mitigation potential by 2030 for grazing land management estimated by IPCC (2007) is high. Low cost mitigation options based on enhancing carbon sequestration in grasslands are available. These practices generate additional important co-benefits in the form of food security, biodiversity and water conservation, and improved resilience and thus adaptation to climate change. There are compelling reasons to consider grasslands as part of a holistic approach (all gases, all sources and sinks) to land use and land use change in the context of deliberations at COP15 in Copenhagen and beyond. (FAO, 2009) Sustaining yields on the existing land base, whether under intensive pasture and agro-silvo pastoral systems production, or extensive grassland and rangeland management, is critical to mitigating greenhouse gas emissions from agriculture (FAO, 2009). The same paper emphasises that improved fire management is critical to reduce emissions.

ANNEX 18 INVENTORY OF BUFFER STRIPS AS A MEASURE UNDER THE NITRATES DIRECTIVE
Country width (m)
fertilizer/ location
Description in MS reports
Austria 5 rivers At least 5 and 20 m from rivers and lakes, respectively
20 lakes
Belgium Flanders
5-10 water body buffer strips (investment of €1,- per m2). Specific rules are applied for soils with a slope of more than 8%. It is forbidden to apply any fertilizer or manure on slopes of more than 18%. In 2011, the slope limit has been changed from 18 to 15%. It is not allowed to apply any manure or fertilizer on frozen, wet, inundated or snow covered soil, or within 5-10 meter of a water body. In AP Limited information was provided on the cost effectiveness of buffer strips and catch crops.
? slope>8%
any slope>15%
Belgium W.
Bulgaria 5 water course Fertilization at least 5 m from water courses on flat terrains
Cyprus No data reported
Czech 25 slope >7o at least 25 m distance at slopes > 7
o
Denmark 10 streams & lakes
50.000 ha 10 m. buffer zones along streams and lakes before 2015, 300 m. protection zones around ammonia sensitive habitats, 2004 Green growth Agreement
Estonia 1 Man-made drains Terms for application of fertilisers near watercourses: fertilisation within a water protection zone of a body of water is prohibited. In large lakes and at the coast, the width of the protection zone is 20 metres from the boundary of the water; in small lakes, reservoirs, rivers and canals the width of the zone is 10 metres; and in the artificial recipients of land improvement objects the width of the zone is 1 metre until their debouchment into natural bodies of water
10 other water bodies
20 large lakes
Finland No specific data reported
France No specific data reported
Germany No specific data reported
Greece No specific data reported
Hungary
2 industrial fertilizer During fertilisation, nutrients may not enter surface waters directly or indirectly, nor through infiltration or erosion. No synthetic fertilisers may be applied in a 2-metre-wide zone from the shorelines of surface waters. The application of organic fertilisers is not allowed in a 20-metre-wide zone from lakes and a 5-metre-wide zone from other surface waters.
5 organic fertilizer
20 organic fertilizer next to lakes
Ireland 1.5 industrial fertilizer Approximately half of the surveyed farmers (4%) indicated a negative preference for provision of a 10 metre riparian buffer zone. 5 organic fertilizer
15 organic fetilizer karst area

20 organic fetilizer lakes
25-200 organic fertilizer human water supply
Italy No specific data reported
Latvia 50 >10o, unless
covered with vegetation Fertilisers shall be spread no closer than 50 metres from the edge of a watercourse or a water body, if the incline of the slope towards the watercourse or water body is greater than 10 degrees. Fertiliser shall only be spread on a slope where the incline is greater than 10 degrees, if the field is covered by vegetation cover.
Lithuania No specific data reported
Luxemburg 30, 3 >15% no fertilizer within 30 m unless there is a permanent downslope pasture or >3 m grass strip
> 8% no fertilizer unless soil covered with vegetation or fertilizer incorporated within 48 hours
Malta 5 water course, spring, borehole, karst area
Organic or inorganic fertilisers shall not be applied to any type of natural water courses, within a minimum distance of 5m from natural water courses, within 5m from springs, galleries, gallery shafts, boreholes and karst features, within 30m any borehole used for public water supply, and within 100m from the coast.
30 human water supply
100 coast
Netherlands 0.25-0.5 grass and cereals Uncultivated strips vary from 25 cm for grains and grasses and between 50 cm and 150 cm for other arable crops. For tree nurseries, the width of the manure-free zone is 500 cm
0.50-1.5 other arable
5 fruit trees
5 Some streams in higher parts
Extension of manure-free zone along watercourses in higher parts of the Netherlands.
Poland 20 water intake, recreational swimming
Provisions concerning the application of fertilizers in the vicinity of watercourses were supplemented by a prohibition on fertilization within 20 metres of water intake protection zones, water intakes, and recreational swimming sites located on surface waters. Moreover, fertilizer distributors may not be washed in the vicinity of watercourses and water intake protection zones.
Romania 1 <12% Protection strips of 1m are required for slopes < 12 % and of 3 m for slopes > 12%
3 >12%
Slovakia 10 Fertiliser must not be used in zones 10 metres from the bank line of a watercourse, the flood line of a reservoir, or the boundary of the buffer zone of a level-one water source
Slovenia 5-10 The application of fertilisers is prohibited at a distance (5-15 m) from inshore watercourses determined by the act regulating waters
Spain No specific data reported
Sweden 2 NVZ A minimum distance of 2 meters to water course is needed in NVZ areas
UK (EWS) No specific data reported
UK N.Ireland 2 industrial fertilizer Chemical fertilizers: 2 m Organic fertilizers: 20 (lakes); 10 m (water way); 50 m (bore whole or well, and 250 m in case of drinking water; 15 10 water course

15 karst area m (cavernous or karstified limestone features)
20 lakes
50 well
250 human water supply

ANNEX 19: INVENTORY OF BUFFER STRIPS AND PROTECTION AREAS AS A MEASURE UNDER THE NATIONAL ACTION PLANS (NAP) FOR SUSTAINABLE PESTICIDE USE (SUD).
Information was acquired from the website: http://ec.europa.eu/food/plant/pesticides/sustainable_use_pesticides/national_action_plans_en.htm last update April 18, 2013, last accessed September 9, 2013
Country Buffer width (m) location Description of the National Action Plan measures for protection of environment and drinking water from impacts of Plant Protection Products (PPP)
Austria
Belgium
Bulgaria
No buffer width specifications. The sizes of buffer zones will be determined with reference to soil characteristics, pesticide properties, the agricultural and specifications of the relevant areas.
Aquatic environment and drinking water. Protection of surface and groundwater bodies.
The national legislation currently in effect lays down the following main requirements in respect of measures to protect the aquatic environment and drinking water:
Reducing the risks of pollution outside the area of application from jet drift during spraying, drainage or leakage, including the establishment of untreated buffer zones of a suitable size to protect non-target aquatic organisms: Reducing or stopping the application of plant protection products on or along roads, railway lines, highly permeable surfaces or other infrastructure located in the vicinity of surface water or groundwater, or on impermeable surfaces where there is a major risk of leakage into surface water or into the drainage network.
Complying with the prohibitions and restrictions on plant protection product use in protection zones for water intended for drinking and domestic purposes and mineral water, and in public health protection zones for surface water and groundwater intended for use as a drinking and domestic water supply.
Except under exceptional conditions aerial spraying of agricultural crops and other areas using plant protection products is prohibited.
Cyprus
No buffer width specifications.
Buffer and safety zones for protection of the aquatic environment and drinking water. Prohibit use of ppp’s in specific areas like recreational waters, bathing waters, nature conservation areas, Natura 2000 sites. Green Eco-
Target of the National Action Plan is to take measures for the protection of the environment and of drinking water from the impacts of plant protection products. Way of Application of the Measures regarding buffer zones: Users of plant protection products must adhere to any restrictions on the use and storage of plant protection products in the following buffer/safety zones: a) Any buffer zones set with the authorization of each plant protection product and noted on its label, b) the safety zones as set at Regulatory Administrative Acts issued under the Protection and Management of Waters Law, for aqueous systems which are used for taking water for human consumption purposes and c) the safety zones of irrigation bores as set in the Control of Water Pollution (Groundwater Protection Measures) Decree of 1996, as amended or replaced.

Management Bodies. Determination of the procedures for the authorisation of aerial spraying only in special cases and under such conditions that minimizes the risks to human health and the environment.
Czech Republic
No buffer width specifications.
Presently the existing system of protecting water resources from contamination with foreign substances is based on the existence of buffer zones around groundwater and surface water resources (WRBZ) in accordance with the provisions of the Water Act. Currently the protection of invertebrates, similarly with the protection of non-target plants, relates to the obligation to maintain untreated buffer zones along the edges of the land, if it is specified in the instructions for use (the label) for the individual PP products.
The NAP objectives and milestones and the manner of implementing them: The NAP contains two main objectives: - limiting the risks associated with the use of PP products in the areas of protecting human health, water protection and environmental protection, and
- optimising PP products´ use without limiting the scope of agricultural production and quality of plant products; connecting milestones and deadline measures to ensure they are met. One of the methods used to ensure the milestones of the NAP are met is determining spatially and temporally defined areas in which the use of PP products represents a higher risk for non-target organisms and the environment (“hot spot management”). Among the main higher risk factors are: specific environmental conditions (e.g. territories with a high density of watercourses, with increased soil porosity, buffer zones for drinking water sources) the wide-spread and frequent use of one or more PP products in the framework of certain indications (crop + pest organism) in a particular territory in conjunction with other risk conditions, e.g. frequent rainfall or land threatened by erosion.
Denmark
No buffer width specifications.
Reduced pesticide use in: 1)Areas under public government 2)Golf courses 3) private gardens
The Danish pesticide strategy increases protection of human health, nature and drinking water by e.g. streamlining and strengthening our approval scheme, enhancing the collection of knowledge, controlling, regulating and not least through communicating to citizens. The Danish approval scheme will be strengthened. The authorities must react faster in the event of findings pesticides above the threshold value in the groundwater via Pesticide Leaching Assessment Programme. If there is a need to change the approvals, such changes must take effect as quickly as possible. Moreover, we will continue to take precautionary measures towards protection of groundwater. We must increase our knowledge about substances in groundwater and interpret data critically. The municipalities must to a greater extent establish more protection areas near wells, and similarly, municipal action plans on protecting surface water and groundwater will ensure

targeted protection of groundwater in highly sensitive areas. In addition, the municipalities will receive advice on protection of ground water, among other things focusing on the establish-ment of protection areas near wells. The aim is for Denmark to continue having stricter approval requirements than the EU. To ensure the best possible protection of groundwater based on our special geological conditions and ensure that, in the future, to continue using untreated groundwater for drinking water. The goal is to reduce pesticide loads by 40 % by the end of 2015. The program focuses on: 1)strict approval of pesticides; 2)protection of surface and groundwater; 3)Increased food safety; 4) integrated pest management
Estonia
Finland Aland Islands Finland has slightly different regulations, not accounted f-or in this summary.
Approved buffer strips for PPP in Finland and Aland Islands: 10 m (moderately toxic active substances) 15 m (toxic active substances) 25 m (highly toxic active substances).
Areas requiring special protection: Habitats and Birds Directives areas Natura 2000 sites, Areas used by the general public or by sensitive population groups such as children and the elderly, including public parks and gardens, sports and recreation grounds, school grounds and children’s playgrounds, and the grounds of healthcare facilities.
Project proposals Determination of how effective buffer zones with permanent plant cover along water bodies are at reducing the risk to aquatic organisms presented by plant protection products and how wide these zones should be. Such zones have already proven to have a positive impact with respect to nutrient leaching prevention, but the specified width of such field margins and permanent buffer strips in accordance with current requirements for agri-environmental support is often insufficient to prevent the pollution of water bodies by spray drift. Under the agri-environmental support scheme, a one to three metre wide perennial grass-covered field margin must be left on arable parcels located along main ditches. Buffer strips at least three metres wide on average but not more than 10 metres wide must be established on parcels located along watercourses larger than main ditches, around drinking water wells, and on pond, lake and sea shores. The spread of weeds can be prevented by cutting of field margins and buffer strips. Field margins and buffer strips must not be treated with plant protection products, with the exception of spot control of serious weed problems or control of wild oats, which must be carried out in accordance with the prevention plan. Prior written notice of the use of plant protection products on field margins or buffer strips must be given to the municipal rural business authority. Other restrictions are proposed for: Groundwater, repeated application, sensitive aquatic environments and bee colonies.

Aerial spraying is prohibited as it can have substantial harmful consequences for human health and the environment, particularly due to spray drift. It is possible exceptionally to permit aerial spraying if there are no alternatives and if the aerial spraying may bring clear benefits in comparison with ground-level application of plant protection products.
France
Germany
Greece
Hungary
No buffer width specifications
Measures for areas of extreme environmental vulnerability - areas with special environ-mental features (e.g. water bases, drained soils, karsts);
- surroundings of surface waters;
- areas designated for the protection of natural habitats, animal and plant varieties of community importance (e.g. NATURA 2000, Hungarian protected natural areas);
- surrounding of state controlled facilities for beekeeping queen-rearing apiaries;
- forestry;
- vicinity of inhabited areas, public parks, excursion areas;
Objective of the National Action Plan is to encourage the development and introduction of integrated pest management and safer alternative approaches in Hungary. With regard to the environment the objective is to reduce the pollution of soil, surface and subsurface waters and air. Selection of good practices of crop production based on the relief and pedological conditions of the fields (e.g. minimum tillage, soil tillage, nutrition management based on soil nutrient content, use of natural cultivated or sown buffer zones, ensuring habitats and feedingstuffs for the non target organisms by means of buffer zones, crop rotation) helps reduce the environmental risk posed by the use of plant protection products. Dissemination and propagation of Good Agricultural Practices (GAP) which include all crop production techniques that will cause to further reduce the application numbers of plant protection products. By the conditions of Article 8 paragraph (2), Directive 2009/128/EC allows the Member States to authorise the aerial spraying, at national level, if they strictly respect the risk mitigating restrictions, furthermore if the particular phytosanitary case can not be solved by other means.

- areas exposed to soil erosion, regions with precipitation higher than the average.
Ireland
Italy
Latvia
Storage: 10 m. Protection of aquatic organisms, maximum 40 m
Currently: To stop the decline of biodiversity, 327 areas have been included in the Natura 2000 network in Latvia: 4 strict nature reserves, 4 national parks, 237 nature reserves, 37 nature parks, 9 protected landscape areas, 9 natural landmarks, 3 areas of the Northern Vidzeme Biosphere Reserve and 24 micro-reserves. In total 20% of the area ofLatvia.
Protection of the aquatic environment: Treatment with plant protection products along railway lines, parts of roads and very permeable territories, as well as permeable territories that are close to surface water or groundwater shall be allowed only in conformity with the requirements referred to in the legislation regarding protective zones and ensuring that plant protection products do not run off into surface water or sewerage systems. The Protection Zone Law specifies a number of restrictions with respect to plant protection products: e.g., the use of plant protection products and placement of structures for the storage of plant protection products is prohibited in a 10 metre area to a body of surface water. In accordance with the Water Management Law, a body of surface water is a discrete and significant element of the drainage system of surface water: a watercourse (river, stream, channel or part thereof), water body (lake, pond, water reservoir or part thereof), as well as other transitional waters or a stretch of coastal waters. Where based on the assessment of a plant protection product a wider protective zone is required to bodies of water and watercourses for the protection of aquatic organisms, this is specified in the registration conditions and labelling of the plant protection products (the maximum protective zone established to date is 40 m). Cabinet Regulation No 950 of 13 December 2011 laying down rules on the use of plant protection products prescribes the procedure for the preparation of an assessment regarding the potential risks of aerial spraying of plant protection products, as well as the procedure for the issuance of a permit for the aerial spraying of a plant protection product. Aerial spraying of plant protection products shall be allowed if a permit of the Service for aerial spraying of plant protection products (hereinafter referred to as the “permit”) has been received.
Lithuania
No buffer width specifications
Implementation of measures to protect surface water and groundwater from plant protection product pollution. Application of adequate risk management
Reduction of the use of plant protection products in specific areas. In order to protect areas used by the general public or by sensitive populations, the use of plant protection products for professional use shall be prohibited in the close vicinity of educational and healthcare facilities. The use of plant protection products on recreational land in the vicinity of sports facilities is restricted to plant protection products containing low-risk active substances. The Special conditions for the use of land and forest stipulate that the use of plant protection products is prohibited in protected wetland reserves, soil reserves, animal, bird and fish reserves as well as in karst area land falling under “ group III and IV” . The use of plant protection products in botanical and zoological reserves and in buffer zones around these is restricted to arable land. Depending on the specific nature of the operations, agricultural workers may be permitted to

measures in protected sites, areas of the Community’s ecological network Natura 2000 and in areas where plant protection products were recently used.
carry out treatment-related operations in outdoor and indoor areas during the treatment and immediately afterwards unless otherwise indicated on the label of the product in use, and always provided that personal protective equipment is worn as specified on the labelling of the product in use. Measures to protect surface water and groundwater from the impact of plant protection products. In Lithuania, the use of drinking water is currently governed by legislation establishing the authorised maximum contents of substances whose levels of emission to water need to be controlled. Pursuant to the Law of the Republic of Lithuania on Water, assessment of the condition of water bodies requires surveillance, operational and investigative monitoring of water bodies. A new National Environmental Monitoring Programme for 2011-17 was approved by the Government of the Republic of Lithuania of 2 March 2011 “on the approval of the 2011-17 National Environmental Monitoring Programme”. The programme provides for the continuation of monitoring of plant protection products whose use is restricted or banned altogether in groundwater, the Baltic Sea and the Curonian Lagoon. In order to protect surface water and groundwater, the use of plant protection products is prohibited in safeguard zones for surface water, as provided for in the Special conditions for the use of land and forest approved by Resolution No 343 of the Government of the Republic of Lithuania of 12 May 1992. Aerial spraying of plant protection products. Aerial spraying of plant protection products is prohibited in Lithuania, other than in the cases laid down by the Law of the Republic of Lithuania on Plant Protection.
Luxemburg
Malta
- Should not be applied on any type of fresh water path
- > 5 m from passages of natural waters
- > 5 m from streams, boreholes, and cracks in rocks
- > 30 meters from boreholes used for the provision of water to the
Reduction of pesticide use or risks in specific areas: – areas used by the general public or by vulnerable groups such as public parks and gardens, sports and recreation grounds, school grounds and children’s play grounds and in the close vicinity ofhealthcare facilities; – protected areas as defined in the Water
Specific measures to protect the aquatic environment and drinking water. Appropriate risk measures will be taken to protect the aquatic environment and drinking water supplies from the impact of pesticides through the adoption of risk mitigation measures. These measures will support and be compatible with relevant provisions of the Water Policy Framework Regulations. Preference should be given to pesticides that are not classified as dangerous for the aquatic environment according to the Dangerous Substances and Preparations Regulations (LN 10/2007), as well as to those which do not contain priority hazardous substances as set out in the Water Policy Framework Regulations. MCCAA will make available information to stakeholders on the different classifications of different Plant Protection Products. Such information will provide the necessary information to enable users to make a more careful decision and minimize risks on aquatic environment and drinking water. The most efficient application techniques such as the use of low-drift pesticide application equipment should be used especially when these are applied on vertical crops such as hops,

public - > 30 meters
from the coast and bathing waters
Policy Frame work Regulations (LN 194/2004), or other areas identified for the purposes of establishing the necessary conservation measures in accordance with the pro-visions of the Conservation of Wild Birds Regulations and the Flora, Fauna and Natural Habitats Protection Regu-lations – recently treated areas used by or accessible to agricultural workers.
orchards and vineyards. Off-site pollution caused by spray drift, drain-flow and runoff should be minimized through use of mitigation measures which include the use of buffer zones for the protection of non-target aquatic organisms and safeguard zones for surface and groundwater used for the abstraction of drinking water. In addition applications along roads and very permeable surfaces or other infrastructure close to surface water or groundwater or on sealed surfaces with a high risk of run-off into surface water or sewage systems should be drastically minimized or eliminated. Aerial spraying will be prohibited in Malta. On the advice of the Pesticides Control Board aerial spraying may only be allowed in special cases.
Netherlands
In the interests of good spatial planning, a buffer zone (ranging from 10 to 50 metres) must separate zones designated for agri-cultural use from residential zones.
Reduction of pesticide use or risks in specific areas: - areas used by the general public or by vulnerable groups - protected areas as defined in the Water Framework Directive, the Birds Directive and the Habitats Directive
The Netherlands has a lot of surface water, but has not yet achieved the WFD objectives. In addition to measures implementing the WFD, the government therefore introduced additional specific measures: - Specific measures to protect the aquatic environment and drinking water - Introduction of an emissions reduction plan of pesticides to surface water - Reduction of spray drift to surface water - Closed water systems in glasshouse horticulture - The use of pesticides containing a priority hazardous substance as defined in the WFD is
prohibited near surface water and groundwater protection areas. Aerial spraying is prohibited. The Minister of Economic Affairs can grant exemptions in emergency situations in accordance with the Directive on sustainable use of pesticides, as long as there is a specific need for application.
Poland
Portugal
Romania
Slovakia
Buffer zones proposed for water courses (no specific measures)
Use of plant protection pro-ducts should also be minimal or absent in the protection zones
Management measures in water resource protection zones are primarily intended to protect water quality. Farming restrictions are set out in decisions declaring protection zones. In level-one water resource protection zones, use of chemicals is prohibited; in level-two water resource

of water sources designated, under water legislation and in Natura 2000 sites. Measures are taken to protect human health, drinking water sources, bees, animals, water and other non-target organisms, the environment and specific areas from the use of PPP’s. In particular when these areas comprise public parks, gardens, sports fields, recreation centres, school grounds and playgrounds or areas close to medical facilities.
protection zones, use of chemicals is prohibited, with restricted use in water resource protection zones (SPZs) under the current list of authorised plant protection products. Action proposed Draw up methodological guidelines for the use of plant protection products in relation to water in protected water management areas, drinking water protection zones, vulnerable and sensitive areas (public green areas, buffer zones for watercourses), protected areas (wetlands), etc., According to Article 9 of Directive 2009/128/EC, aerial spraying is generally banned as a method that has the potential to cause substantial adverse effects on human health and the environment, in particular from spray drift. It is permitted in exceptional cases where there are no acceptable alternatives and where aerial spraying offers clear advantages over land-based application.
Slovenia
The Waters Act provides for the total prohibition of the use of PPP on waterside land < 15 m of the for class 1 waters and < 5 m from the boundary of the bank for class 2 waters, in order to protect surface waters
Various levels of protection are determined in the water protection zone. The most rigorous protection regime applies in inner water protection zones (WPZ I). PPP’s that may be used in the WPZ I are only those products which do not contain active substances that are banned according to a decree published by the Government.
No specific regulations on water courses or streams. Measures taken have been oriented into the awareness-raising of users concerning the proper use of PPP, with emphasis on the protection of groundwaters and surface waters, protection of honey-bees, safe disposal of wastes and waste packaging of PPP. Due to the fragmentation of agricultural surfaces and settlement pattern in Slovenia, safe treatment with PPP by avoiding drifting of such products onto houses, humans and animals is not possible; therefore, aerial PPP application or aerial spraying has not been permitted so far. Alignment of Slovenian legislation to the European Union legislation was pursued through the Plant Protection Products Act (Official Gazette of the Republic of Slovenia, No 11/01) which, on account of the residues found in waters, put restrictions to the use of multi-component PPP based on atrazine within the safeguard zones of water resources or prohibited their use in areas where data on the monitoring of pesticides in drinking water and drinking water sources, springs, groundwater and in soil indicated that the permitted maximum levels of atrazine or its metabolites.

In Slovenia the water protection zones occupy less than 345,000 ha or 17% of the entire territory. Due to the fragmentation of agricultural surfaces and settlement pattern in Slovenia, safe treatment with PPP by avoiding drifting of such products onto houses, humans and animals is not possible; therefore, aerial PPP application or aerial spraying has not been permitted so far. The prohibition of aerial spraying in Slovenia remains in force.
Spain
Keep an untreated safety distance of 5 m from bodies of surface water, or 50 m if the points or bodies of water are intended for human consumption.
Specific objectives of the measures - Reduce the risks
arising from the use of plant protection products in environmentally sensitive areas, in relation to protected natural spaces and bodies of water.
- Informing agricultural and forestry farmers of the risks arising from the use of plant protection products in environmentally sensitive areas, in relation to protected natural spaces and bodies of water.
- Reduce the risks to and effects on human health related to the use of plant protection products in space
A document, which contains the “NATIONAL ACTION PLAN FOR THE SUSTAINABLE USE OF PLANT PROTECTION PRODUCTS”, referred to as the PAN, has been drawn up to ensure compliance, in the range of circumstances present in Spain. The PAN shall be in force from 1 January 2013 to 31 December 2017, and it may be extended if necessary. SUMMARY OF PAN MEASURE 7.1 – 7.4 Actions: Identification of pollution in rivers, streams etc Evaluate risk for human consumption (well, deposits, reservoirs) Observe and provide safety distances for the use of PPP’s Identify risks of PPP’s use in bird and habitad protection zones Identify and publish protection zones implementing the List of wild species subject to special protection and the Spanish catalogue of endangered species. Specific objectives of the measures - Reduce the risks arising from the use of plant protection products in environmentally
sensitive areas, in relation to protected natural spaces and bodies of water. - Informing agricultural and forestry farmers of the risks arising from the use of plant
protection products in environmentally sensitive areas, in relation to protected natural spaces and bodies of water.
- Reduce the risks to and effects on human health related to the use of plant protection products in space used by the general public or vulnerable groups, in accordance with the definition given in Article 3 of Regulation (EC) 1107/2009.
- Protect and preserve biodiversity and wildlife, establishing priority actions for species that require greater attention, and that are included in the List of wild species subject to special protection and the Spanish catalogue of endangered species.
Establish systems for approving, monitoring and registering aerial applications.

used by the general public or vulnerable groups, in accordance with the definition given in Article 3 of Regulation (EC) 1107/2009.
- Protect and preserve biodiversity and wildlife, establishing priority actions for species that require greater attention, and that are included in the List of wild species subject to special protection and the Spanish catalogue of endangered species.
Sweden
United Kingdom
Incentives: No application < 2 m from watercourses or field ditches in Single Farm Payment Schemes Under-sowing spring cereals, use of winter crops, slowing pathways
Measures to reduce risks with the use of pesticides in: Public places; conservation areas; recently treated with pesticides areas accessible to agricultural workers. Landowners and public authorities need to obtain agreement or
As the NAP is a UK Plan it covers England, Scotland, Wales and Northern Ireland Measures to protect the aquatic environment and drinking water Regulatory Measures The pesticide regulatory risk assessment devotes a significant degree of attention to identifying and mitigating risks to water by considering the risk to groundwater and surface water for each product and use and the surface water assessment specifically looks at the risk to aquatic life. Incentives Government uses financial incentives to encourage farmers to adopt practices which will help

and 6 – 12 m buffer zones to watercourses and ditches in nvironmental Steward Schemes
consult from nature conservation authorities before applying pesticides to protected areas identified for the purposes of conservation established under the Water Framework Directive, Sites of Special Scientific Interest, or Natura 2000 sites. In each case an assessment is made of the conservation objectives of the site and potential impact of pesticide use. Agreements to use a pesticide are developed in accordance with the guidelines laid down in ‘The Herbicide Handbook’ which details alternative and integrated approaches to vegetation management. Work to update the guidelines is underway.
to reduce the risk of pesticides reaching water. For example, currently one of the requirements of the Single Farm Payment Scheme is that pesticides must not be applied within 2 metres (m) of a watercourse or field ditch. Also Environmental Stewardship Schemes provide incentives for farmers to use measures which tackle the source of pollution such as under-sowing spring cereals, use of winter cover crops, slowing pathways (in-field grass areas) and 6 m or 12 m buffer zones to protect watercourses. Government-led non-regulatory initiatives Single Farm Payment and Environmental Stewardship Schemes provide subsidy payments to farmers to adopt practices which will protect water including use of particular cropping techniques, slowing pollution pathways in fields, and use of buffer zones adjacent to watercourses or ditches. Industry Initiatives The Campaign for the Farmed Environment, a multi-stakeholder initiative, has three main themes, one of which is resource protection (including water). Various measures within CFE such as grass strips across slopes to avoid erosion and run-off, winter cover crops and grass buffers alongside water courses all play a part in reducing pesticide movement to water. Aerial spraying The PPP (SU) Regulations 2012 prohibit aerial spraying, allowing it only where specifically permitted by a competent authority. The Regulations provide that the competent authority may only permit applications if it has approved the Application Plan and ensured that conditions set out in the Directive are fulfilled.

ANNEX 20: INVENTORY OF BUFFER STRIPS APPLICATION IN THE EU RIVER BASIN NETWORK (RBN)
Countr WFD River basin network
Basin or
territory
Specification
Width (m) Profile Dry/wet
Vegetation Short/tall
Harvest No/frequent
Austria
Belgium Flanders
Belgium Wallonia
Bulgaria
Cyprusrus
Czech
Denmark Jylland &Fyn
Buffer strips 10 m : all water courses, rivers and lakes > 100m
2 rural areas
Estonia
? probably both
No cultivation in buffer strips. Clearing obligation of natural perennials
Clearing obligation to keep soil in good agricultural condition
Finland South West
1 – 3 m main ditches. 15 – 20 m larger water courses based on different agreements
France Moselle &Sarre
5 m and larger Decrease erosion and movement of nutrients, erosion
Decrease CO2 emissions. Riparian zones preferably perennial grass with a nurse crop
Agricultural use and grazing allowed. No tillage, fertilizer nor plant protection product allowed.
Germany Moselle &Sarre
Riparian buffer strips (RLP) uban >5 m (SL) outside urban >10m (SL)
grass, shrubs,trees No intensive agriculture
Greece
Both, ecological and flood
Natural succession No intensive agriculture

discharges
Hungary
Ireland
Italy Arno Width 5 m. If water course in good status 3 m. Compulsary, except olive grove or permanent pasture
? Permanent (sown) grass strips or planted trees
Agricultural production prohibited
Liri etc. All buffers’ width range between 50 cm and 5 m
Flooding occurs
? no work performance except for preparation of filter capacity of buffers
Serchio Submeasures: See vegetation
? Riparian vege-tation objective and proper management or riparian vegetation
Focus on pro-tection of native species. Adresses land erosion, flood water retention, pollutants
Latvia
Lithuania
Luxemburg Moselle &Sarre
3 m along rivers; 5-20 m ponds and lakes; 3 < Other cases < 12; 3 < “headland program” < 9m
? Arable land and grass Grazing after July 15
Malta
Norway Børsesjø etc
Buffer zone vegetated > 5 m
Between water course and arable fields
Short, little cover, easy to erode
unfertilised
Jæren Buffer zones 5 to 10 m ? Grass, prevention of soil erosion
Unfertilised, harvest once a year
Leira, etc. Voluntary Agri-environmental measures as buffer zones 6 – 12 m wide
? Short Harvested buffer strips. Tillage only for reconditioning grass cover
Morsa Mandatory 2 m natural vege-tation along water ways. Voluntary 6 – 12 m
? Grass by early autumn Must be harvested. Grazing allowed. Tillage for reconditioning grass

Poland Sona Buffer strips with different sizes as separated areas around water courses, reservoirs etc
? ? No manure or mineral fertilzers
Romania Lechinta Buffer strips between 1 – 3 m. if > 12% must be 3m
? Planted with grass. Other areas with forest or growing graminous plats or pulse perennial plants
Main pressure is pollution by agriculture. Pesticides and fertilizers prohibited
Slovakia
Slovenia
Spain
Sweden Svartaå Buffers zones along water courses, lakes or sea. 6 to 20m. Only water courses on map 1:50 000, meaning 93.000 km excluded
? ?
10% of seeds must be nitrogen fixating species.
Harvest allowed after 15 july, cutting, grazing. Checklist with 19 points regulations
UK(S) Scot- land
2 types of buffers: A. Regulatory 2 m beside water courses
? dry wet
Aim: protect water margins from erosion, encourage waterside vegetation, stabilise banks
No cultivation zone
B. Funded buffers (Water Margins) Rural Development program up to 20 m
? dry wet
Needs to be managed. Management plan needs to be provided
Water margins: 1. Bordering still water: between 12 and 24 m wide 2. Bordering water course with bed width < 1.2 m: 3 m on any1 side, overall width at least 5 times bed width max 12 m on any one side 3. Bordering a water course with bed width >= 1.2 m, minimum water margin on any one side is 6m and the maximum is 12 m Sides with steep slopes, water margins may be extended to 20 m, creating enhanced buffer to intercept runoff
Provide an effective sediment trap in winter: Soil surface covered with dense plants in winter months; control rank, tussocky growth, maintain a close sward. There are various ways to control this, light grazing or mowing. Two cuts may be required. If any other alternative management method will be proposed, an alternative management plan will be agreed upon with Scottish Ministers.
UK(E,W) England & Wales
Four buffer types exist: 1. A regulatory requirement for a 1m no cultivation zone beside all water courses/ field ditches

2. A funded grass buffer in various widths. Additional option: ‘in-field’ buffer. 3. Voluntary riparian buffer (Campaign Farmed Environment, Voluntary Initiative-pesticides) 4. Unfertilised headlands Measures are undertaken under GAEC, , Rural Development agri-environmental schemes and Higher Level Environmental Stewardship Schemes:
- Protection of hedgerows and watercourses (GAEC 14) : 2 main regulations
- RD agri-environmental scheme in England, Environmental Stewardship 2m and 4m buffer strips on cultivated land: 5 main regulations
- 6 m buffer strips on cultivated land: 2 main regulations
- 2m, 4m and 6m buffer strips on intensive grassland: 7 main regulations Buffering in-field ponds in improved permanent grassland and arable land To maintain their value to wildlife, the water quality of ponds needs to be protected. In areas of improved grassland management and on arable land, the creation of unfertilised grass buffers surrounding-field ponds will help to protect them from nutrient leaching and run-off and will provide additional habitat for pond wildlife. Buffers will be less effective where field drains discharge directly into the pond. The buffer areas may be designed to link two nearby ponds or to link ponds to copses or other boundary features. For this option you must comply with nine regulations. Higher Level Scheme Buffer strips Enhanced strips for target species on intensive grassland: this option is used to provide additional habitat for invertebrates, birds and small mammals by managing buffer strips in intensive grass leys. These strips of wildflowers and grasses provide nesting habitat and shelter, as well as a food source for a variety of species including farmland birds, bats and insects such as bumblebees and butterflies. The location of the strip may be rotated within the same field. Management will include sowing and establishing a specified seed mixture of wildflowers and grasses. The strip will need to be protected from grazing and will need to be re-established when the cover of wildflowers decreases. Other management, such as cutting and fertiliser, will be tailored to each site based on the species targeted. Additional CFE – essential requirements: Establish or maintain a grassy strip with a minimum width of 6m (including the 1m protection zones under cross compliance) alongside a watercourse. 9 regulations
UK(NI) Northern Ireland

205
ANNEX 21 TABULAR INFORMATION ON EVALUATION OF 4 BEST PRACTICE EXAMPLES FOR RBS
In this Annex the Tables are presented in which the 4 best practice examples are evaluated in terms of effectiveness on the goals for multifunctional buffer strips together with supporting material and literature referecens specific to the 4 examples.
Danish Buffer Strips
Information from Prof. Brian Kronvang, Arhus University, Denmark.

206
Table 1 Evaluation of the buffer strips example in Denmark.
Documents a, b, c sent by Brian Kronvang a Buffer strips_Denmark_GJN.docx b Buffer zones and biodiversity on land and in the watercourse_GJN_BKR.docx c Factsheet buffer strips (Denmark)_BKR
Notes from documents a, b and c. 1b The streams are deeply incised and the land in the buffer zone therefore is normally dry 2c Trees are not allowed in BSs as farmers are still receiving EU funding for BS as part of their farmed area. 3c Vegetation must be cut every 2nd year, without removal 4ac 50.000 ha of arable land in DK is taken out of production for BS. On a farm, the BS area may be reduced to 5 % of total farm area. 5b If buffer zones are established where there is undisturbed nature nearby, there will also be the possibility that species can migrate to and from the established
buffer zone. Dense refers to the situation where there is a good connection with nature reserve areas. As Danish situation applies to practically the whole nation, we rate this te be
6a Nature Protection Act gives the public access to uncultivated land and therefore the buffer zones will generally be accessible. For the public when they appear as an uncultivated area in the sense of the Nature Protection Act.
7c Plantation of the river banks with trees is required to stabilize the banks and reduce bank erosion, but this is not allowed because of EU subsidies. 8c P load reduction due to BS for DK as a whole is 4-30 ton P/year minus a negative effect of 2-10 ton P/year (freezing and leaching of left vegetation) makes a
Goals Specified goals
width placement profile vegetation
harvest /
maintenance fencing soil slope hydrology
land
use
stream
density
discharge
continuity
ecological
network
L = narrow standard abrupt/dry short/prod. zero no light/heavy flat/steep deep grass sparse ephemeral sparse
H = wide tailored gradual/wet tall/various frequent yes moderate moderate shallow arable dense continuous dense
this row refers to the situation in Denmark --> medium standard abrupt/dry 1) short/prod. 2) infrequent 3) no variable variable variable both medium 4) both medium 5)
1. Biodiversity 1.1 local terrestric M L L L H H M M M M M H M
1.2 functional agrobiodiversity M L L L H H M M M H M M M
1.2.1 pest control M L L L H H M M M H M M M
1.2.2 pollination M L L L H H M M M H M M M
1.3 aquatic M L L L H H M M M M M H M
1.4 connectivity M L L L H H M M M M M H M
2. Landscape 2.1 attractivity M L L L H H M M M M M H M
quality 2.2 access 6) H H H H M H M M M M M M M
3. Load reduction 3.1 solid bound M L, 7) H H L M M M M H M H M
= water quality M L, 8) H H L L M M M H M H M
M L M M M M M M M M M H M
M L M L M M M M M H M H M
M L H M M L M M M L M H M
3.2 soluble M L, 9) L H L L M M M M M H M
4. Climate change 4.1 C sequestration (mitigation) M M L L M M M M M M M M M
4.2 biomass harvesting (mitigation) M M L H L M M M M M M M M
4.3 water storage capacity (adaptation) M L L M M M M M M M M H M
The numbers before ..) refer to notes below, taken from the documents a, b, c sent by Brian Kronvang
3.2.2 N
manage- and designable factors conditional factors conditional factors design management for field level for landscape level
3.1.1 sediment
3.1.2 P
3.1.3 toxicants
3.1.4 pesticides
3.2.1 vectors

207
total effect of 2-20ton P/year 9c N load reduction due to BS for DK as a whole is 2000 tons N/year (did I get this right from your document c? It also states that the reduction of N load below the
root zone hardly contributes to N load reduction to surface waters.) Description of the comments (L, M, H) in the spreadsheet:
Factor or column
Rating and row or goal
Note
Width Medium, M 1.1–2.1, 3 & 4
10 m wide in DK is standard. Compared to Netherlands 4 m and the Po valley Italy 1 - 5 m and even more in Estonia, we rate this as medium.
H 2.2 10 m wide is more than necessary for access.
Placement Standard, L 1.1 – 2.1
BS are standard, i.e. they are the same for all fields. So not specific for, or adjusted to the specific circumstances of each field.
H 2.2 Standard short vegetation is good for access.
L 3.1, 3.2.2 Tailored to a specific contaminant is always better
L 3.2 Tailored to a specific vector is always better
M 4.1-4.2 Not distinctive
L 4.3 Tailoring to this function would be advantageous
Profile Abrupt/dry The streams are deeply incised and the land in the buffer zone therefore is normally dry.
L 1, 2.1 A gradual wet profile is considered better for biodiversity
H 2.2 A gradual wet profile is less accessible
H 3.1.1, 3.1.2 Dry is good for sediment/P reduction
M 3.1.3 For some dry is better for others wet, in general varying wetness allows for different retention reactions and thus for retention of more types of toxicant
M 3.1.4 Not distinctive
H 3.2.1 Dry is better for predation on vectors
L3.2.2 Wet is better for nitrate retention
L 4.1, 4.2 A gradual wet profile is better for increasing organic matter content
L 4.3 A gradual wet profile is better for water storage (floodplain)
Vegetation Short/productive Only grass
L 1.1, 1.2 Because it is only grass, no specific flower mixtures or host species
L 1.3, 1.4, 2.1 Because no trees
H 2.2 Because no trees or shrubs
H 3.1.1, 3.1.2 Short productive vegetation is good for sediment/P reduction
M 3.1.3 No data on difference in effectiveness between tall or short
L 3.1.4 Tall vegetation is better for drift reduction
M 3.2.1 No data on difference in effectiveness between tall or short
H 3.2.2 Short productive vegetation is good for N retention

208
L 4.1 Variable vegetation with deeper rooting species is better for increasing organic matter content
H 4.2 Because of productivity
M 4.3 Not distinctive
Harvest & Maintenance
Infrequent Vegetation should be cut every 2nd year, without removal.
H 1 Infrequent harvesting is considered advantageous for biodiversity, zero harvesting is less effective for both ecological and environmental goals, frequent harvesting is good for the environment but not for biodiversity
H 2.1 Better for biodiversity is more attractive
M 2.2 Frequent harvesting would be better for access
L 3.1.1, 3.1.2, 3.2.2
Frequent harvesting with removal would be better. No sediment removal projected
M 3.1.3 Should be L for sediment bound toxicants. No specific information on difference in effectiveness due to maintenance frequency.
M 3.1.4 Tall vegetation is better for drift reduction
M 3.2.1, 4.1 Unknown
L 4.2 Infrequent harvesting without removal
M 4.3 Indistinctive
Fencing No -
H 1 Fencing would be good for the environment, but not necessarily for biodiversity
H 2.1 Better for biodiversity is more attractive
H 2.2 No fencing, better access
M 3.1.1, 3.1.3, 3.1.4, 4.1, 4.3
Indistinctive
L 3.1.2, 3.2.1, 3.2.2
Animals have access to BS, but not very relevant in DK
M 4.2 Allowing grazing animals is less effective than cutting with removal, but not very relevant in DK
Soil Variable, M 1 – 4
We got no specific data on soils in DK, but we figure a large variety of soils because the BS are prescribed in most of the entire country, therefore we rate this factor M in all rows
Slope Variable, M 1 – 4
We got no specific data on slopes in DK, but we figure a large variety of slopes because the BS are prescribed in most of the entire country, therefore we rate this factor M in all rows. DK is known to be an undulating country without steep slopes

209
Table 1 Evaluation of the buffer strips example in Denmark. (repeated for readability)
Hydrology Variable, M
1 – 4 We got no specific data on hydrology in DK, but we figure a large variety because the BS are prescribed in most of the entire country, therefore we rate this factor M in all rows
Land use Both, arable About 6 % grassland the remainder arable land, therefore we evaluate as if arable
All M’s Indistinctive
H 1.2 FAB is more relevant for arable land
H 1.2.1 Pest control is more relevant for arable land
H 1.2.2 ollination is more relevant for arable land
H 3.1.1, 3.1.2, 3.1.4 More important for arable land
L 3.2.1 Not relevant for arable land
Stream density
Medium, M All M’s
Compared with the NL not so dense
Discharge continuity
Both, continuous More continuous than ephemeral, because DK has a relatively wet climate, therefore judged as if continuous
All H’s Continuous
All M’s Indistinctive
Ecological network
Medium, All M’s
We got no specific data on ecological network in DK, but we figure the connectivity to the ecological network is variable because the BS are prescribed in most of the entire country, therefore we rate this factor M in all rows
Goals Specified goals
width placement profile vegetation
harvest /
maintenance fencing soil slope hydrology
land
use
stream
density
discharge
continuity
ecological
network
L = narrow standard abrupt/dry short/prod. zero no light/heavy flat/steep deep grass sparse ephemeral sparse
H = wide tailored gradual/wet tall/various frequent yes moderate moderate shallow arable dense continuous dense
this row refers to the situation in Denmark --> medium standard abrupt/dry 1) short/prod. 2) infrequent 3) no variable variable variable both medium 4) both medium 5)
1. Biodiversity 1.1 local terrestric M L L L H H M M M M M H M
1.2 functional agrobiodiversity M L L L H H M M M H M M M
1.2.1 pest control M L L L H H M M M H M M M
1.2.2 pollination M L L L H H M M M H M M M
1.3 aquatic M L L L H H M M M M M H M
1.4 connectivity M L L L H H M M M M M H M
2. Landscape 2.1 attractivity M L L L H H M M M M M H M
quality 2.2 access 6) H H H H M H M M M M M M M
3. Load reduction 3.1 solid bound M L, 7) H H L M M M M H M H M
= water quality M L, 8) H H L L M M M H M H M
M L M M M M M M M M M H M
M L M L M M M M M H M H M
M L H M M L M M M L M H M
3.2 soluble M L, 9) L H L L M M M M M H M
4. Climate change 4.1 C sequestration (mitigation) M M L L M M M M M M M M M
4.2 biomass harvesting (mitigation) M M L H L M M M M M M M M
4.3 water storage capacity (adaptation) M L L M M M M M M M M H M
3.2.2 N
manage- and designable factors conditional factors conditional factors design management for field level for landscape level
3.1.1 sediment
3.1.2 P
3.1.3 toxicants
3.1.4 pesticides
3.2.1 vectors

210
Italian Buffer Strips Information from Dr. Stefan Otto, IBAF-CNR / Universtity of Padova Figure 1. The ditch with the samplers.
Figure 2 The double row tree + shrubs BS in winter.
Figure 3 Maize 3 weeks after sowing (left), and in July (right).

211
Figure 4 Runoff flow during simulated rainfall (exceptional rainfall/runoff event) (see Otto et al., 2012).

212
Table 2 Evaluation of the buffer strips example in Italy
The numbers before ..) refer to the notes below
DESIGN
1. Biodiversity. For biodiversity protection and enhancement size of BS matters, then for all Biodiversity goals, in Po Valley the BS as bigger, tailored, wet and various, as better. Please consider that (hypothetical) negative effects of BS biodiversity on cropland, i.e. invasion of weeds or pest can be properly managed (Vasileiadis et al., 2011).
2. Landscape quality. As bigger, tailored, wet and various are the BS, as better is the landscape quality for non-farmers residents and by-passers. This is a general statement based only on my personal feeling. The point of view of farmers may be different, especially for in-farm BS.
3. Load reduction (water quality). In plain fields of Po Valley, the reduction of pollutants via sediments is of minor importance. Main effect of BS is on reduction of pollutants mass to surface water. This reduction depends on the BS size, but there are evidence that effectiveness becomes maximum when BS is of 3 m. It means that for common runoff events in plain fields narrow BS can be enough.
4. Climate change. This aspect was not studied, but it is supposed to be minor because in the Po Valley the area with BS (when exist) is only a small fraction of the cropland. MANAGEMENT
5. To increase Biodiversity and Landscape quality, the BS management must be properly designed, otherwise invasive species can spread uncontrolled in BS (Hedera spp., Robinia pseudoacacia, Ailanthus spp., etc). the intensity of the management should be related to the type of BS. For example consider attractiveness: for grass BS frequent harvest is good, but for trees it is not.
6. To maintain its filter capacity and improve load reduction/water quality over time, it is very important to maintain the continuity of the surface and to avoid cracks (see Otto et al., 2008). The management has an effect only if maintain BS integrity. For grass BS frequent mowing (3-4/year) is good, for trees and shrubs the coppicing cycle must be respected.
7. Coppicing cycle is the only factor with a theoretically effect on climate change by C sequestration. CONDITIONAL FACTORS FOR FIELD LEVEL
8. Biodiversity and Landscape quality are not significantly affected by Soil, Slope and Hydrology.
Effectivity factors for buffer strips Italy
Goals Specified goals
width placement profile vegetation
harvest /
maintenance fencing soil slope hydrology
land
use
stream
density 17)
discharge
continuity 20)
ecological
network 22)
- narrow standard abrupt/dry short/prod. zero 5) no light/heavy flat/steep deep grass sparse ephemeral sparse
+ wide tailored gradual/wet tall/various frequent yes moderate moderate shallow arable dense continuous dense
refers to traditional vegetative filter strips in North-East Po Valley --> narrow standard abrupt/dry both. frequent no Loamy Flat Mostly deep arable 13)Moderate Most ephemeral 18) Sparse
1. Biodiversity 1.1 local terrestric L L L M M H M M M M M M L
1) 8) 14) 22) 1.2 functional agrobiodiversity M L L M M H M M M H M M L
1.2.1 pest control 23) 25) M L L M M H M M M H M M L
1.2.2 pollination M L L M M H M M M H M M L
1.3 aquatic L L L M M H M M M M M L L
1.4 connectivity L L L M M H M M M M M M 11) L
2. Landscape 2.1 attractiveness M L L M 5) 9) M H M M M M M M L
quality 2) 8) 22) 2.2 access H H H H 9) H H M H M H M M L
3. Load reduction3.1 solid bound M L H H 6) M M 10) H 10) M 11) L M M M M
= water quality M L H H 6) M L H M L M M M M
3,15,17,20,22,24 M L M M M M H M L M M M M
M L M H M M H M L M M M M
M L H M M L H M L M M M M
3.2 soluble M L M H 6) M L H M L M M M M
4. Climate change 4.1 C sequestration (mitigation) L M L M M M H M M M M M M
4) 12) 16) 21) 4.2 biomass harvesting (mitigation) L M L H H M M M M M M M M
4.3 water storage capacity (adaptation) L L L M M M M L M M M M M
3.2.2 N 3)
manage- and designable factors conditional factors conditional factors design 1) management for field level 8) 12) for landscape level 14) 16)
3.1.1 sediment 3)
3.1.2 P
3.1.3 toxicants
3.1.4 pesticides 3,23,24)
3.2.1 vectors

213
9. We have no specific experience with attractiveness and access, but the better to walk through, the better the access. 10. Load reduction/water quality: In general, for Po Valley, a sandy-loam soil with a little slope (max 1%) is ideal for BS effectiveness because let the runoff flow “laminar” through the BS, with a balanced
horizontal and vertical velocity. In this scenario some of the runoff water infiltrate, even if is unlike the contamination of the watertable because of the low runoff volume. 11. replaced by note on hydrology in the table 12. Climate change. No experience. Likely Soil, Slope and Hydrology are of minor importance.
CONDITIONAL FACTORS FOR LANSCAPE LEVEL 13. Cancelled 14. Biodiversity and Landscape quality. No specific data on this point 15. Load reduction/water quality. Although the Po Valley is a “Lowland” with little slope, this does not necessarily imply that drainage is more important compared with runoff: in spring-summer the net
recharge for summer crops is negative (and irrigation is needed). Load of organic pollutants like pesticides is higher in this period, and they are more prone to move by drift and runoff. In winter time drainage of soluble pollutants can indeed be expected.
16. Climate change. No data on this point. 17. Stream density: cancelled 18. Discharge continuity: cancelled 19. Biodiversity and Landscape quality. We let this ecological aspects to ecologist. What we support is the protection also of ephemeral streams because a BS here is the first line of defense for
permanent communities in continuous streams. 20. Load reduction/water quality. We believe that BS are good also when the streams are ephemeral because at field scale most of ditch and streams are ephemeral, but this is the first line of defense,
and we strongly support the rule “keep pollution close to source”. We see no reason why BS next to discontinuous streams should be judged less effective. 21. Climate change. Not relevant. 22. Ecological network. For Biodiversity and Landscape quality, Load reduction/water quality, Climate change, a dense ecological network is good. This is true especially for Biodiversity because a
population cannot survive or be effective (i.e. predators) under a minimal sill/size.For Load reduction/water quality, a dense ecological network is good. As longer is the residential time in an hydrological network, as greater is the dissipation and/or adsorption (see Ghirardello et al., 2014). The mitigation effect due to macrophyte in the hydrological network need to be assessed but likely is important (see figure 7.3.4). Because of the intensive cropping system, in Po Valley the BS contribution to ecological connectivity is minor.
Figure 5. A ditch (ephemeral) with Arundo donax (Carpaneta, Mantova).
23. ur experimental data show that BS reduce herbicide runoff, pesticide drift and BS with tree and shrubs can also provide shelter and food for non-target arthropods.

214
24. For the Padova site an analysis of rainfall/runoff return period has been done (see Otto et al., 2012 and Cardinali et al., 2013) and the main result is this: in the Po Valley the BS will hinder two types of runoff events: (1) frequent (4–5 each year), ordinary minor events for which BS are very effective and the loss very little; (2) rare (1–2 every 25–27 years) extreme events with high loss of herbicides, for which BS are still effective even if not enough to preserve surface water from local high contaminations. This conclusion is for herbicides, but can likely be extended to other pesticides applied to soil (insecticides).
25. For a recent study on FAB see Bàrberi et al., 2010; on Landscape-Weeds see Otto et al., 2012; on Landscape-Predators see Veres et al., 2012). I believe that the effect of BS on pest control in conventional cropping systems need to better assessed because the effect of chemicals is dominant.

215
Table 2 Evaluation of the buffer strips example in Italy (repeated for readability)
Description of the comments (L, M, H) in the spreadsheet:
Factor or column
Rating and row or goal
Note
Width Narrow As compared to 10 m wide in DK and even more in Estonia
L: 1.1, 1.3, 1.4, 4 5 to 6 m wide in the Po valley, Italy is low compared to 10 m in DK, and even more in Estonia
M 1.2 Trees provide additional advantages compared to DK and NL
M2.1 en H2.2 H-->M because of comparison with NL=L and DK=M and probably Estonia H
M 3 Italian research shows the BS are highly effective in the Po Valley, particularly for pesticides. It is paradoxical that 5 m BS are judged ineffective in the NL for N and P, while the Italian 5 m VFS’s appear rather effective. A solution for this would requ ire an in-depth scientific discussion which is beyond the scope of this study. We judge the width too small for the highest rating in comparison with the DK, NL and Estonian examples.
Placement Standard, L BS are standard, i.e. they are the same for all fields. So not specific for, or adjusted to the specific circumstances of each field
L: 1.1 – 2.1, L 3 Standard is always L, even if the BS is effective. What we judge is the level of tailoring, not the effectiveness of the standard BS
H 2.2 Here we rate H because it is easier to provide access to standard BS than to BS that vary with circumstances
M 4.1-4.2 Not distinctive for this goal
Goals Specified goals
width placement profile vegetation
harvest /
maintenance fencing soil slope hydrology
land
use
stream
density 17)
discharge
continuity 20)
ecological
network 22)
- narrow standard abrupt/dry short/prod. zero 5) no light/heavy flat/steep deep grass sparse ephemeral sparse
+ wide tailored gradual/wet tall/various frequent yes moderate moderate shallow arable dense continuous dense
refers to traditional vegetative filter strips in North-East Po Valley --> narrow standard abrupt/dry both. frequent no Loamy Flat Mostly deep arable 13)Moderate Most ephemeral 18) Sparse
1. Biodiversity 1.1 local terrestric L L L M M H M M M M M M L
1) 8) 14) 22) 1.2 functional agrobiodiversity M L L M M H M M M H M M L
1.2.1 pest control 23) 25) M L L M M H M M M H M M L
1.2.2 pollination M L L M M H M M M H M M L
1.3 aquatic L L L M M H M M M M M L L
1.4 connectivity L L L M M H M M M M M M 11) L
2. Landscape 2.1 attractiveness M L L M 5) 9) M H M M M M M M L
quality 2) 8) 22) 2.2 access H H H H 9) H H M H M H M M L
3. Load reduction3.1 solid bound M L H H 6) M M 10) H 10) M 11) L M M M M
= water quality M L H H 6) M L H M L M M M M
3,15,17,20,22,24 M L M M M M H M L M M M M
M L M H M M H M L M M M M
M L H M M L H M L M M M M
3.2 soluble M L M H 6) M L H M L M M M M
4. Climate change 4.1 C sequestration (mitigation) L M L M M M H M M M M M M
4) 12) 16) 21) 4.2 biomass harvesting (mitigation) L M L H H M M M M M M M M
4.3 water storage capacity (adaptation) L L L M M M M L M M M M M
3.2.2 N 3)
manage- and designable factors conditional factors conditional factors design 1) management for field level 8) 12) for landscape level 14) 16)
3.1.1 sediment 3)
3.1.2 P
3.1.3 toxicants
3.1.4 pesticides 3,23,24)
3.2.1 vectors

216
L 4.3 Tailoring to this function would be advantageous
Profile Abrupt/dry, L Judged by the pictures
L 1, 2.1 A gradual wet profile is considered better for biodiversity
H 2.2 We consider dry good for access
H 3.1.1, 3.1.2 Dry is good for sediment/P reduction
M 3.1.3 For some dry is better for others wet, in general varying wetness allows for different retention reactions and thus for retention of more types of toxicant
M 3.1.4 Not distinctive
H 3.2.1 Dry is better for predation on vectors
M 3.2.2 Wet is generally better for nitrate retention, but Italian research shows the BS are highly effective in the Po Valley, also for N. See note width-M3
L 4.1, 4.2 A gradual wet profile is better for increasing organic matter content
L 4.3 A gradual wet profile is better for water storage (floodplain)
Vegetation Short/productive Mainly grass in the area, but we chose the Po valley because of the traditional combination with trees/shrubs
M 1 The traditional BS include trees and shrubs
M 2.1
M because traditional BS include trees, H requires a more natural vegetation gradient
H 2.2 Because only a small row of trees or shrubs, remainder is short grass
H 3.1.1, 3.1.2 Short productive vegetation is good for sediment/P reduction
M 3.1.3, 3.2.1 No data on difference in effectiveness between tall or short
H 3.1.4 Tall vegetation is better for drift reduction
H 3.2.2 Short productive vegetation is good for N retention
M 4.1 Vegetation with deeper rooting species is better for increasing organic matter content, but only one narrow row
H 4.2 Because of productivity of short vegetation
M 4.3 Not distinctive
Harvest & maintenance
Frequent, M Grass is cut 2-3 times per year, without removal, trees and shrubs every 6 years (common coppicing cycle) with removal of wood.
M 1 Infrequent harvesting is considered advantageous for biodiversity, zero harvesting is less effective for both ecological and environmental goals, frequent harvesting is good for the environment but not for biodiversity
M 2.1 Attractiveness follows biodiversity
H 2.2 Frequent harvesting is good for access
M 3 Frequent harvesting but without removal. Sediment removal is unnecessary on flat fields.

217
M 3.1.4 Short vegetation is worse for drift reduction (L), but traditionally trees are present (H), so -->M
M 3.2.1 Unknown
M 4.1 Vegetation with deeper rooting species is better for increasing organic matter content, but only one narrow row
H 4.2 Frequent harvesting, productivity of short vegetation
M 4.3 Indistinctive
Fencing No -
H 1 Fencing would be good for the environment, but not necessarily for biodiversity
H 2.1 follows biodiversity
H 2.2 Fencing is not good for access
M 3.1.1, 3.1.3, 3.1.4, 4.1, 4.3
Indistinctive
L 3.1.2, 3.2.1, 3.2.2 No grazed grassland
M 4.2 Allowing grazing animals is less effective than cutting with removal, only relevant for grazed grassland
Soil Loamy M 1, 2
Indistinctive
H 3 loamy soils are advantageous for pollutant reduction by BS
H 4.1 In theory clay content is advantageous for C sequestration
M 4.2, 4.3 Not distinctive

218
Table 2 Evaluation of the buffer strips example in Italy (repeated for readability)
Slope Flat, L
M 1 Slope is more important for judging the effectiveness for environmental goals compared to biodiversity, therefore indistinctive = M
M 2.1 Follows M1
H 2.2 No slope is good for access
M 3 According to the general information on RBS, moderate slope (up to 10%) is most advantageous, but Italian researchers stress the importance of laminar SRO flow and rate this H, partly because they focus on pesticides. Another paradox that needs more in depth discussion, like in “width, M3”.
M 4.1, 4.2 Slope is more important for judging the effectiveness for environmental goals compared to climate change, therefore indistinctive = M
L 4.3 Storage of water is limited to confined profile partly due to no slope
Hydrology Mostly deep
In case of deep hydrology BS are less effective for the protection of surface water quality. However, note that in Italy, a deep ground water table (and thus deep discharge flow) is considered advantageous for protecting groundwater aquifers, due to more travel time and retention in the vadose zone.
M 1, 2, 4 We consider flow depth indistinctive for biodiversity and climate change. Wetness may be relevant but is treated under profile
Goals Specified goals
width placement profile vegetation
harvest /
maintenance fencing soil slope hydrology
land
use
stream
density 17)
discharge
continuity 20)
ecological
network 22)
- narrow standard abrupt/dry short/prod. zero 5) no light/heavy flat/steep deep grass sparse ephemeral sparse
+ wide tailored gradual/wet tall/various frequent yes moderate moderate shallow arable dense continuous dense
refers to traditional vegetative filter strips in North-East Po Valley --> narrow standard abrupt/dry both. frequent no Loamy Flat Mostly deep arable 13)Moderate Most ephemeral 18) Sparse
1. Biodiversity 1.1 local terrestric L L L M M H M M M M M M L
1) 8) 14) 22) 1.2 functional agrobiodiversity M L L M M H M M M H M M L
1.2.1 pest control 23) 25) M L L M M H M M M H M M L
1.2.2 pollination M L L M M H M M M H M M L
1.3 aquatic L L L M M H M M M M M L L
1.4 connectivity L L L M M H M M M M M M 11) L
2. Landscape 2.1 attractiveness M L L M 5) 9) M H M M M M M M L
quality 2) 8) 22) 2.2 access H H H H 9) H H M H M H M M L
3. Load reduction3.1 solid bound M L H H 6) M M 10) H 10) M 11) L M M M M
= water quality M L H H 6) M L H M L M M M M
3,15,17,20,22,24 M L M M M M H M L M M M M
M L M H M M H M L M M M M
M L H M M L H M L M M M M
3.2 soluble M L M H 6) M L H M L M M M M
4. Climate change 4.1 C sequestration (mitigation) L M L M M M H M M M M M M
4) 12) 16) 21) 4.2 biomass harvesting (mitigation) L M L H H M M M M M M M M
4.3 water storage capacity (adaptation) L L L M M M M L M M M M M
3.2.2 N 3)
manage- and designable factors conditional factors conditional factors design 1) management for field level 8) 12) for landscape level 14) 16)
3.1.1 sediment 3)
3.1.2 P
3.1.3 toxicants
3.1.4 pesticides 3,23,24)
3.2.1 vectors

219
L 3 In general BS are more effective in reducing contaminant loads with shallow flow, but Italian researchers nonetheless find high effectiveness, independent from water table depth. See also “width, M3” and “slope M 3”
Land use Arable arable land
M 1.1, 1.3, 1.4, 2.1
Makes no difference
H 1.2 most important for arable agriculture including fruits
M 2.1 Mostly arable land without grassland can be considered less attractive, but trees and shrubs in the traditional BS are attractive, so M
H2.2 Well accessible
M 3.1
BS are more effective on arable land for reducing sediment bound contaminants
M 4 Land use makes no difference in the BS itself
Stream density
Moderate M 1-4
Compared with the NL (H), DK (M)
Discharge continuity
mostly ephemeral Due to relatively dry climate in growing season
M 1.1, 1.2, 1.4, 2, 4.1, 4.2, 4.3
Indistinctive
L 1.3 Periodically no water to protect
M 3 Intuitively one would give a lower rating for water quality purposes but Italian researchers stress the importance of vegetation on the bottom of the ephemeral streams and in the adjoining BS to prevent pollution “at the source” right after the dry growing season
Ecological network
Sparse
BS in N-E Po Valley are scattered, with a minor contribution to the natural hydrological network.
L 1,2 BS in N-E Po Valley are scattered, with a minor contribution to the natural hydrological network.
M 2.2, 3,4 Indistinctive

220
Specific references from the Padova Team Bàrberi P., Burgio G., Dinelli G., Moonen A.C., Otto S., Vazzana C., Zanin G., 2010. Functional
biodiversity in the agricultural landscape: relationships between weeds and arthropod fauna. Weed Research, 50 (5), 388-401.
Bonzini S., Verro R., Otto S., Lazzaro L., Finizio A., Zanin G., Vighi M., 2006. Experimental validation of a Geographical Information Systems-based procedure for predicting pesticide exposure in surface water. Environmental Science and Technology, 40 (24), 7561-7569.
Borin M., Bigon E., Zanin G., Fava L., 2004. Performance of a narrow buffer strip in abating agricultural pollutants in the shallow subsurface water flux. Environmental Pollution, 131, 313-321.
Borin M., Vianello M., Morari F., Zanin G., 2005. Effectiveness of buffer strips in removing pollutants in runoff from a cultivated field in North-East Italy. Agriculture, Ecosystems and Environment, 105, 101-114.
Cardinali A., Otto S., Zanin G., 2013. Herbicides runoff in vegetative filter strips: evaluation and validation of a recent rainfall return period model. International Journal of Environmental and Analytical Chemistry, 1-10.
Ghirardello D., Morselli M., Otto S., Zanin G., Di Guardo A., 2014. Investigating the need of complex vs. simple scenarios to improve predictions of aquatic ecosystem exposure with the SoilPlus model. Environmental Pollution, 184, 502-510.
Lazzaro L., Otto S., Zanin G., 2008. Role of hedgerows in intercepting spray drift: Evaluation and modelling of the effects. Agriculture, Ecosystems and Environment, 123, 317-327.
Otto S., Vianello M., Infantino A., Zanin G., Di Guardo A., 2008. Effect of a full-grown vegetative filter strip on herbicide runoff. Maintaining of filter capacity over time. Chemosphere, 71, 74-82.
Otto S., Lazzaro L., Finizio A., Zanin G., 2009. Estimating ecotoxicological effects of pesticide drift on nontarget arthropods in field hedgerows. Environmental Toxicology and Chemistry, 28 (4), 853-863.
Otto S., Cardinali A., Marotta E., Paradisi C., Zanin G., 2012. Effect of vegetative filter strips on herbicide runoff under various types of rainfall. Chemosphere, 88 (1), 113-119.
Otto S., Vasileiadis V.P., Masin R., Zanin G., 2012. Evaluating weed diversity with indices of various complexity in north-eastern Italy. Weed Research, 52 (4), 373-382.
Otto S., Mori N., Fornasiero D., Veres A., Tirello P., Pozzebon A., Duso C., Zanin G., 2013. Insecticide drift and its effect on Kampimodromus aberrans (Oudemans) in an Italian vineyard-hedgerow system. Biosystems Engineering, 116, 447-456.
Vasileiadis V.P., Sattin M., Otto S., Veres A., Pálinkás Z., Ban R., Pons X., Kudsk P., van der Weide R., Czembor E., Moonen A.C., Kiss J., 2011. Crop protection in European maize-based cropping systems: current practices and recommendations for innovative Integrated Pest Management. Agricultural Systems, 104, 533-540.
Verro R., Finizio A., Otto S., Vighi M., 2009. Predicting pesticide environmental risk in intensive agricultural areas. I: screening level risk assessment of individual chemicals in surface waters. Environmental Science and Technology, 43 (2), 522-529.
Verro R., Finizio A., Otto S., Vighi M., 2009. Predicting pesticide environmental risk in intensive agricultural areas. II: screening level risk assessment of complex mixtures in surface waters. Environmental Science and Technology, 43 (2), 530-537.
Veres A., Tóth F., Kiss J., Fetykó K., Orosz S., Lavigne C., Otto S., Bohan D., 2012. Spatio-temporal dynamics of Orius spp. (Heteroptera: Anthocoridae) abundance in the agricultural landscape. Agriculture, Ecosystems and Environment, 162 (1), 45-51.
Vianello, M., Vischetti, C., Scarponi, L., Zanin, G., 2005. Herbicide losses in runoff events from a field with a low slope: Role of a vegetative filter strip. Chemosphere 61, 717-725.

221
Buffer Strips in The Netherlands
Figure 6 Riparian Buffer Strips in the ARB project
Figure 7 Buffer strips on arable land (left) and grassland (right)
Application of evaluation framework Table 4 is the evaluation framework filled in for The Netherlands case. The evaluation should be read as follows. The design, management or condition described in the column is highly (H), moderately (M for Medium) or less (L for Low) effective for reaching the goals described in the rows.

222
Table 3 Evaluation of the buffer strips example in The Netherlands
The numbers before ..) refer to the notes below 1. In both contracts for grassland and arable land the width is standard 4 metres. 2. Vegetation on the strips is a mixture grasses and local herbs. Ploughing and (reseeding) is not allowed. Introduction of foreign herbs or plants is not allowed. A natural balance in the flora and
fauna is pursued. 3. Cutting is allowed once or twice a year and not before the 15th of June. 4. Different soil types varying from sand to clay. (see picture 7.3.5.3) 5. Groundwater table in the whole area is between approximately 60 – 150 cm below ground surface. However, precipitation excess is expected to be discharged via relatively deep groundwater
flow paths, due to the hydrogeology of the area. According to {Noij, 2012 #97}, the Province of Noord Brabant comprises three hydrogeological units: b: deep sandy aquifer; e: deep sandy aquifer, interrupted by less-permeable loam layer; and f: Holland clay, less permeable deep aquifer in tile drained clay soils.
6. Stream density is relatively high in Noord Brabant (Table 7.3.5.1 above). E.g. when you have strips of 5 metres on both sides, 3.3 % up to 6.2 % of the agricultural area in Noord-Brabant would be occupied.
7. Approximately 1400 kms of RBS have been installed in the province. The total length of permanent ditches is estimated to be about 10.000 kms. So a maximum of 14 % of the ditches can have RBS on one side. There aren’t many situations with RBS on both sides because many, particularly bigger ditches are situated between f ields and roads or paths to provide access for maintenance of the ditch. Hence, the proportion of RBS is still not enough for a good ecological connectivity with natural resource areas with a rich variety in plants and animals. However the research of Cools Akkervogels indicates that there is a positive effect of buffer strips on the density or number of farmland and meadow birds, up to 2,5 times a much ( Anonymus 2007 p. 10 Par 3.2). In the evaluation report of Natuur Balans 2012 only slightly positive effects of RBS where found for vegetation,(Aukema 2013 p. 50), but not for birds, (Aukema 2013, p.51) nor insects (Aukema 2013, p.53). However, indicator species of macro fauna in the water was found time and again along in water along RBS (Aukema 2013, p.57).
8. Within the scheme there was a pilot with 12 farmers who experimented with FAB and special mixes of herbs and flowers in the RBS to test the effect on the use of pesticides for crop protection in potatoes and wheat. Under well supervised conditions there is a positive effect of RBS on the reduction of pesticides use (Anonymus zd no date 2. 45).
Goals Specified goals
width placement profile vegetation harvest fencing soil slope hydrology
land
use
stream
density
discharge
continuity
ecological
network
- narrow standard abrupt/dry short/prod. zero no light/heavy flat/steep deep grass sparse ephemeral sparse
+ wide tailored gradual/wet tall/various frequent yes moderate moderate shallow1arable dense continuousdense
narrow 1) standard abrupt/dry short/prod. frequent no Variable Flat Mostly deep both High both sparse
1. Biodiversity 1.1 local terrestric L L L M 2) M 3) H M 4) M M 5) M M 6) H L 7)
1.2 functional agrobiodiversity L L L M M H M M M M M M L
1.2.1 pest control L L L M 8) M H M M M M M M L
1.2.2 pollination 9) L L L M M H M M M M M M L
1.3 aquatic 10) L L L L M H M M M M M H L
1.4 connectivity L L L L 8) M H M M M M M H L 11)
2. Landscape 2.1 attractivity 12) L L L M H H M M M M H M L
quality 2.2 access 13) M H H H H H M H M M H H L
3. Load reduction 3.1 solid bound 3.1.1 sediment L L 14) H H H M M L L M H H M
=water quality 3.1.2 P L L 16) 17) H H H L M L L M H H M
3.1.3 toxicants L L M M M M M L L M H H M
L L M L 18) L M M L L M H H M
3.2.1 vectors 20) L L H M M L M L L M H H M
3.2 soluble L L 21) 22) L H H L M L L M H H M
4. Climate change 4.1 C sequestration (mitigation) L M L L M M M M M M H H M
4.2 biomass harvesting (mitigation) L M L H H M M M M M H H M
4.3 water storage capacity (adaptation) 23 L L L M M M M L M M H H M
conditional factors design management for field level for landscape level
this row refers to the situation in the Netherlands -->
3.2.2 N
manage- and designable factors conditional factors
3.1.4 pesticides

223
9. A cooperation of 6 beekeepers in Noord-Brabant had special interest for RBS with herbs en flowers in the FAB pilot of the project (see 8). Their expectation is that RBS could help to stop the decline of the bee population in the countryside.
10. Due to the short vegetation, the RBS provide no shadow, nor litter to the stream, and therefore are not expected to exert a specific directly positive effect on aquatic biodiversity other than their indirect effect on water quality. One of the two principal aims of the ARB project is to improve water quality, by reducing leaching and runoff of minerals and drift of pesticides to the surface water (load reduction). So RBS indirectly improve aquatic biodiversity. In the evaluation of the effect of buffer strips on biodiversity, indicator species of macro fauna in the water was found time and again along in water along RBS (Aukema 2013, p.57). Water board employees notice less reed production next to RBS, most probably due to the reduction of nutrient loads seeping through the ditch banks.
11. See 7. 12. Improving the attractiveness of the countryside is not a primary aim of ARB, although it can be a spin-off, leading to public support for the project. See 13. 13. That is why in communication there was put much effort to accommodate hikers and cyclists. Website: http://www.randenbeheerbrabant.nl/. In several places farmers and municipalities have
created a kind of public footpath for hikers in the RBS. This is only possible when all farmers are ready to participate. However, some farmers don’t like hikers with dogs, because dogs may disturb cattle or sheep or leave droppings in high quality crops for (baby)food production.
14. Thanks to the permanent grass/herbs vegetation on the RBS and the slopes of the ditches, the ditch banks have been stabilized. According to the maintenance staff of water board Hollandse Delta. (Anonymus no date1)is the costs of dredging have thus decreased.. It is an estimation based on expert judgement of maintenance staff. Water board employees in Noord Brabant notice less reed production next to RBS, most probably due to the reduction of nutrient loads seeping through the ditch banks.
15. The cost of ditch maintenance for water boards can go down with 5 – 10 eurocents per metre per year (Van Hoeij 2011b p. 7). 16. Reduction of P loads caused by direct spill during fertilizer application is calculated to be 50- 89 %. (Van Dijk 2003b p. 5), see 17. 17. This reduction is rather low in absolute amounts of kg per ha per year. No clear conclusion can be drawn yet on the cost effectiveness (Van Slobbe 2010b p. 37). 18. Reduction of pesticides caused by drift is calculated to be 75- 95 %. (Van Dijk 2003b p. 5). 19. In areas with a high density of RBS both the number of observed pesticides in the water as well as their concentrations were lower compared to area’s with no or low density of RBS. The
number of samples was however too low for statistic calculations. There is an indication that RBS have an effect. (Slabbekoorn 2010a p. 23). 20. Surface runoff is limited because the field surface of the RBS is very flat. Runoff of manure directly to the surface water is therefore also limited. Vectors in faeces tend to stay on the soil
surface or to infiltrate into the soil and will be disarmed. Contamination of the surface water with vectors that cause diseases is therefore also unlikely to happen (and has not been reported). 21. Reduction of N loads caused by direct spill during fertilizer application is calculated to be 50- 89 %. (Van Dijk 2003b 2003 p. 5), see 22. 22. This reduction is rather low in absolute amounts of kg per ha per year. No clear conclusion can be drawn yet on the cost effectiveness (Van Slobbe 2010b p. 37). 23. Improving water storage capacity is not an explicit aim of ARB. However, water board employees in Noord Brabant notice less reed production next to RBS, most probably due to the reduction
of nutrient loads seeping through the ditch banks. Less vegetation growth (especially reed in the sea clay area) improves the water storage capacity of the water system (or prevents dredging to restore this capacity). From the international literature it is known that the permanent vegetation in the RBS stimulates infiltration, which to some extent contributes to higher water storage capacity and less peak runoff.

224
Table 4 repeated for readability
Description of the comments (L, M, H) in the spreadsheet:
Factor or column
Rating and row or goal
Note
Width Narrow, L
L: 1.1-2.1 & 3.1-4.3 Compared to 5 or 6 m wide in the Po valley, Italy, 10 m in DK, and even more in Estonia, we rate 4 m LOW
M 2.2 4 m wide is enough for access.
Placement Standard, L
L: 1.1 – 2.1 BS are standard, i.e. they are the same for all fields. So not specific for, or adjusted to the specific circumstances of each field.
H 2.2 Standard short vegetation is good for access.
L 3.1, 3.2.2 Tailored to a specific contaminant is always better
L 3.2 Tailored to a specific vector is always better
M 4.1-4.2 Not distinctive
L 4.3 Tailoring to this function would be advantageous
Profile Abrupt/dry, L
Goals Specified goals
width placement profile vegetation harvest fencing soil slope hydrology
land
use
stream
density
discharge
continuity
ecological
network
- narrow standard abrupt/dry short/prod. zero no light/heavy flat/steep deep grass sparse ephemeral sparse
+ wide tailored gradual/wet tall/various frequent yes moderate moderate shallow1arable dense continuousdense
narrow 1) standard abrupt/dry short/prod. frequent no Variable Flat Mostly deep both High both sparse
1. Biodiversity 1.1 local terrestric L L L M 2) M 3) H M 4) M M 5) M M 6) H L 7)
1.2 functional agrobiodiversity L L L M M H M M M M M M L
1.2.1 pest control L L L M 8) M H M M M M M M L
1.2.2 pollination 9) L L L M M H M M M M M M L
1.3 aquatic 10) L L L L M H M M M M M H L
1.4 connectivity L L L L 8) M H M M M M M H L 11)
2. Landscape 2.1 attractivity 12) L L L M H H M M M M H M L
quality 2.2 access 13) M H H H H H M H M M H H L
3. Load reduction 3.1 solid bound 3.1.1 sediment L L 14) H H H M M L L M H H M
=water quality 3.1.2 P L L 16) 17) H H H L M L L M H H M
3.1.3 toxicants L L M M M M M L L M H H M
L L M L 18) L M M L L M H H M
3.2.1 vectors 20) L L H M M L M L L M H H M
3.2 soluble L L 21) 22) L H H L M L L M H H M
4. Climate change 4.1 C sequestration (mitigation) L M L L M M M M M M H H M
4.2 biomass harvesting (mitigation) L M L H H M M M M M H H M
4.3 water storage capacity (adaptation) 23 L L L M M M M L M M H H M
conditional factors design management for field level for landscape level
this row refers to the situation in the Netherlands -->
3.2.2 N
manage- and designable factors conditional factors
3.1.4 pesticides

225
L 1, 2.1 A gradual wet profile is considered better for biodiversity
H 2.2 A gradual wet profile is less accessible
H 3.1.1, 3.1.2 Dry is good for sediment/P reduction
M 3.1.3 For some dry is better for others wet, in general varying wetness allows for different retention reactions and thus for retention of more types of toxicant
M 3.1.4 Not distinctive
H 3.2.1 Dry is better for predation on vectors
L 3.2.2 Wet is better for nitrate retention
L 4.1, 4.2 A gradual wet profile is better for increasing organic matter content
L 4.3 A gradual wet profile is better for water storage (floodplain)
Vegetation Short/productive, L Mainly grass
M 1.1, 1.2 Includes specific flower mixtures or host species
L 1.3, 1.4 Because no trees
M 2.1 No trees but with flower mixtures
H 2.2 Because no trees or shrubs
H 3.1.1, 3.1.2 Short productive vegetation is good for sediment/P reduction
M 3.1.3 No data on difference in effectiveness between tall or short
L 3.1.4 Tall vegetation is better for drift reduction
M 3.2.1 No data on difference in effectiveness between tall or short
H 3.2.2 Short productive vegetation is good for N retention
L 4.1 Variable vegetation with deeper rooting species is better for increasing organic matter content
H 4.2 Because of productivity
M 4.3 Not distinctive
Harvest & maintenance
Frequent, M Cutting once or twice per year with removal. Sediment removal is unnecessary on flat fields
M 1 Infrequent harvesting is considered advantageous for biodiversity, zero harvesting is less effective for both ecological and environmental goals, frequent harvesting is good for the environment but not for biodiversity
M 2.1 Attractivity follows biodiversity
H 2.2 Frequent harvesting is good for access
H 3.1.1, 3.1.2, 3.2.2 Frequent harvesting with removal is best. Sediment removal is unnecessary on flat fields.
M 3.1.3 No specific information on difference in effectiveness due to maintenance frequency.
L 3.1.4 Tall vegetation is better for drift reduction
M 3.2.1, 4.1 Unknown
H 4.2 Frequent harvesting with removal
M 4.3 Indistinctive

226
Fencing No -
H 1 Fencing would be good for the environment, but not necessarily for biodiversity
H 2.1 Better for biodiversity is more attractive
H 2.2 No fencing, better access
M 3.1.1, 3.1.3, 3.1.4, 4.1, 4.3
Indistinctive
L 3.1.2, 3.2.1, 3.2.2 Animals have access to BS, only relevant for grazed grassland
M 4.2 Allowing grazing animals is less effective than cutting with removal, only relevant for grazed grassland
Soil Variable, M 1 – 4
Various soils, so indistinctive
Slope Flat, M M1 – 4, M2.1
Slope is more important for judging the effectiveness for environmental goals compared to biodiversity and climate change. Therefore indifferent for Biodiversity.
H2.2 L3
No slope is good for access and see L3 too. Slope is more important for judging the effectiveness for environmental goals compared to biodiversity and climate change

227
Table 4 repeated for readability
M4.1, 4.2 Slope is more important for judging the effectiveness for environmental goals compared to biodiversity and climate change. Therefore
indifferent for climate change = M
L4.3 Storage of water is limited to confined profile partly due to no slope
Hydrology Mostly deep Deep hydrology is less effective for environmental goals.
M 1, 2, 4 We consider flow depth indistinctive for biodiversity and climate change. Wetness is relevant but treated under profile
L 3 BS are more effective in reducing contaminant loads with shallow flow
Land use Both, M both occur so indistinctive
M 1 FAB, Pest control and pollination are more relevant for arable land
M 2 A mix of arable with BS and grassland can be considered attractive, but no trees and shrubs
M 3 BS are more effective on arable land for reducing sediment bound contaminants
M 4 Grasslands are able to sequester more C
Stream density High, H The NL have highest stream density
M 1 Although stream density is high, BS’s have not been installed along all ditches. So no maximum effect on biodiversity
H 2,3,4 Relative BS area is high due to high stream density
Discharge continuity Both, but mostly continuous More continuous than ephemeral, because the NL has a relatively wet climate, therefore judged as if continuous
All H’s Continuous
All M’s Indistinctive
Ecological network Sparse, L
L 1,2 See note 7
M 3, 4 Indistinctive
Goals Specified goals
width placement profile vegetation harvest fencing soil slope hydrology
land
use
stream
density
discharge
continuity
ecological
network
- narrow standard abrupt/dry short/prod. zero no light/heavy flat/steep deep grass sparse ephemeral sparse
+ wide tailored gradual/wet tall/various frequent yes moderate moderate shallow1arable dense continuousdense
narrow 1) standard abrupt/dry short/prod. frequent no Variable Flat Mostly deep both High both sparse
1. Biodiversity 1.1 local terrestric L L L M 2) M 3) H M 4) M M 5) M M 6) H L 7)
1.2 functional agrobiodiversity L L L M M H M M M M M M L
1.2.1 pest control L L L M 8) M H M M M M M M L
1.2.2 pollination 9) L L L M M H M M M M M M L
1.3 aquatic 10) L L L L M H M M M M M H L
1.4 connectivity L L L L 8) M H M M M M M H L 11)
2. Landscape 2.1 attractivity 12) L L L M H H M M M M H M L
quality 2.2 access 13) M H H H H H M H M M H H L
3. Load reduction 3.1 solid bound 3.1.1 sediment L L 14) H H H M M L L M H H M
=water quality 3.1.2 P L L 16) 17) H H H L M L L M H H M
3.1.3 toxicants L L M M M M M L L M H H M
L L M L 18) L M M L L M H H M
3.2.1 vectors 20) L L H M M L M L L M H H M
3.2 soluble L L 21) 22) L H H L M L L M H H M
4. Climate change 4.1 C sequestration (mitigation) L M L L M M M M M M H H M
4.2 biomass harvesting (mitigation) L M L H H M M M M M H H M
4.3 water storage capacity (adaptation) 23 L L L M M M M L M M H H M
conditional factors design management for field level for landscape level
this row refers to the situation in the Netherlands -->
3.2.2 N
manage- and designable factors conditional factors
3.1.4 pesticides

228
Literature BS example the Netherlands: Anonymus. (No date 1): Interne Notitie Waterschap Hollandse Delta, Dordrecht. Kostenbesparing m.b.t. baggeren in landelijk gebied als gevolg van akkerrandenbeheer. (Cost reduction of dredging due to RBS). Anonymus. (no date 2): Interne notitie ARB, Den Bosch. Project Actief Randenbeheer Brabant – II Pilot ‘Functionele Agro Biodiversiteit’. (Pilot Functional Agro Biodiversity). Anonymus (2003a). Observatieproef op proefboerderij Vrede-peel met buffergewassen naast snijmaïs. Wageningen: Praktijkonderzoek Plant & Omgeving B.V. sector AGV PPO 510368 (Observation experiment with buffer strips next to forage maize) Anonymus (2007). Onderzoek naar het effect van actief randenbeheer op akker- en weidevogels in West-Brabant. Tilburg: Ecologisch Adviesbureau Cools. (Effect of BS on birds). Alberti, P. Broeren, J. Romme, W. & Verschure, H. (2002). Actief Randenbeheer Brabant & Motivatieonderzoek agrariërs. ’s-Hertogenbosch: HAS Kennistransfer. (Inquiry into the motivation of farmers to participate in ARB). Aukema, R. Cuppen, H. Faessen, T. V.d. Koppel, S. Raemakers, I. & Scherpenisse-Gutter, M.C. (2013). Biodiversiteit bij Actief Randenbeheer in Noord-Brabant 2008-2013. Nijmegen: Natuurbalans-Limes Divergens BV. (Biodiversity results). Bouwman, J. Van Nierop, J. & Klein Schiphorst, S. (2007). Motivatieonderzoek 2007. ’s-Hertogenbosch: Has Kennistransfer. (Motivation of farmers to participate in ARB) Clevering, O.A. & Visser, A.J. (2005a). Beheeradvies grasbufferstroken voor het project Actief Randenbeheer Brabant. Wageningen: Praktijkonderzoek Plant en Omgeving B.V. PPO 500149. (Grass buffer strips management advice). De Jongh, P. & Margry, K. (No date 3). Ecologische kansen bij Actief Randenbeheer Brabant. Boxtel: Helicon opleidingen MBO Boxtel. (Interne notitie ARB). (Ecological opportunities). Geerts, A.J.M. (2011a). Tien jaar Actief Randenbeheer in Brabant. Bodem (Ten years ARB, Evaluative article in the Dutch Journal Bodem (=Soil)). Geurts, P. (2005b). “Motivatieonderzoek onder agrariërs”. ’s-Hertogenbosch: Has Kennistransfer. (Motivation of farmers to participate in ARB). Slabbekoorn, H. (2010a). Analyse gewasbeschermingsmiddelen in oppervlaktewater 2009. Wageningen: Stichting Dienst Landbouwkundig Onderzoek PPO 3250189600.

229
Van Beek, C., Merkelbach, R. & Van der Salm, C. (2005c). Quick-scan effectiviteit van droge bufferstroken langs watergangen in de provincie Noord-Brabant. Wageningen: Alterra.Geen rapportnummer (Quick-scan effectiveness of dry buffer strips). Van den Borne, C. Groot Koerkamp, M. Van Riet, J. (2012a). Evaluerend motivatie onderzoek project Actief Randenbeheer Brabant. ’s-Hertogenbosch: Has Kennistransfer (Evaluation of farmers motivation) Van Dijk, W. Clevering, O. Van der Schans, D. Van de Zande, J. Porskamp, H. Heinen, A. Smidt, R. & Merkelbach, R. (2003b). Effecten bufferstroken op de kwaliteit van oppervlaktewater in Noord-Brabant. Wageningen: Praktijkonderzoek Plant & Omgeving B.V.PPO 510318. (Effects of buffer strips on surface water quality in Noord-Brabant). Van Herpen, F.C.J., Rozemeijer, J. (2012b). Bufferstroken in Noord-Brabant. Resultaten Nutriëntenonderzoek ’s-Hertogenbosch: Royal Haskoning Rapport 9X0852 (Evaluation report nutrients). Van Hoeij, S. & Vroegrijk, M. (2011b). Akkerranden in relatie tot onderhoud van waterlopen. ’s-Hertogenbosch: Has Kennistransfer. (The relation between buffer strips and maintenance of water courses). Van Slobbe, E., Aalderink, H., De Vlieger, B. Roenbeek, R. & Penninkhoff, P. (2010b). Bufferstroken in Nederland. Amersfoort: Stowa Rapport 2010/39 (Buffer strips in the Netherlands: a review of related projects).

230
Riparian Buffer strip example for Estonia The Porijõgi buffer zone area represents a grey alder stand. It is situated in the
moraine plain of southeast Estonia (Tartu County, Sirvaku; 58◦13’N, 26◦47’E;
Figures 8&9), in the riparian zone of a small river, the Porijõgi, which flows in a
primeval valley where agricultural activities ceased in 1992 (red ellipse in Figure 9).
The mean annual air temperature at the study sites varied from 5.0-5.5 °C. In winter
the lowest daily mean temperature reach -20°C. The variation in long-term annual
precipitation is 500-700 mm (Teiter and Mander, 2005). The river discharge varies
from 2000 in summer to 11000 m3.day
-1 in winter.
Figure 8 River Porijõgi and grey alder forest close to the study site (photo: Indrek
Talpsep, 2012).
Figure 9 Location of the Porijõgi riparian buffer stripe (red arrow) and the
agricultural activities (red ellipse; aerial photo taken between 1993-2000)
affecting the buffer strip (Photo: Estonian Land Board, 2014).

231
Figure 10 Current situation (aerial photo taken 2011) and location of study area.
Light yellow area indicates slope >10% (Photo: Estonian Land Board, 2014).
Figure 11 The share of major greenhouse gases from the Porijõgi riparian study sites from October 2001 to November 2003, presented as median CO2 equivalent values (kg CO2-C ha-1 yr-1) (Mander et al., 2008).
Application of the evaluation framework
Table 5 is the evaluation framework filled in for The Netherlands case. The evaluation
should be read as follows. The design, management or condition described in the
column is highly (H), moderately (M for Medium) or less (L for Low) effective for
reaching the goals described in the rows.

232
Table 5 Evaluation of the buffer strips example in Estonia
Description of the comments (L,M, H) in the Estonian spreadsheet Factor or column Rating and
row or goal Note
Width Wide, H 31 m =11 m for wet grassland + 20 m for grey alder; Compared to 5- 6 m wide in Italy, 10 m in DK, 4 m in NL we rate this High
H 1.1
H 1.2, 1.2.1, 1.2.2 No information on pest control, no agricultural activities after 1992
M 1.3 The width does not influence aquatic biodiversity so much.
H 1.4, 2, 3 and 4 The wider the better
Placement Standard, L The design is not tailored to a specific adjacent land. It is a standard.
L 1.1, 1.3, 1.4, 2.1 BS are standard, i.e. they are the same for all fields. So not specific for, or adjusted to the specific circumstances of each field.
L 1.2, 1.2.1, 1.2.2 No information
H 2.2 Standard short vegetation is good for access.
L 3.1, 3.2.2 Tailored to a specific contaminant is always better
L 3.2.1 Tailored to a specific vector is always better
effectivity factors for buffer strips Estonia
Goals Specified goals
width placement profile vegetation
harvest /
maintenance fencing soil slope hydrology
land
use
stream
density
discharge
continuity
ecological
network
L = narrow standard abrupt/dry short/prod. zero no light/heavy flat/steep deep grass sparse ephemeral sparse
H = wide tailored gradual/wet tall/various frequent yes moderate moderate shallow arable dense continuous dense
this row refers to the situation in Estonia --> 31 m standard gradual/wet tall/various zero no light-moderatemoderate both grass/arable sparse continuous sparse
1 Biodiversity 1.1 local terrestric H L H H L H M M H M L H M
1.2 functional agrobiodiversity H L H H L H M M H M L M M
1.2.1 pest control H L H H L H M M H M L M M
1.2.2 pollination H L H H L H M M H M L M M
1.3 aquatic M L H H H H M M H M L H M
1.4 connectivity H L H H L H M M H M L H L
2 Landscape 2.1 attractivity H L H H L H M M H M L H M
quality 2.2 access H H L L L H M M M M L M M
3 Load reduction 3.1 solid bound H L H H L M H H H M L H M
= water quality H L H H L L H H H M L H M
H L H H M M H H H M L H M
H L M H H M M H M M L H M
H L M M M L H H H M L H M
3.2 soluble H L H H L L H H H M L H M
4 Climate change 4.1 C sequestration (mitigation) H M H H M M M M M M L M M
4.2 biomass harvesting (mitigation) H M M M L M M M M M L M M
4.3 water storage capacity (adaptation) H L H M M M M M H M L H M
3.2.2 N
manage- and designable factors conditional factors conditional factors design management for field level for landscape level
3.1.1 sediment
3.1.2 P
3.1.3 toxicants
3.1.4 pesticides
3.2.1 vectors

233
M 4.1-4.2 Not distinctive
L 4.3 Tailoring to this function would be advantageous
Profile Gradual/wet, H
H 1.1, 1.3, 1.4, 2.1 A gradual wet profile is considered better for biodiversity
H 1.2, 1.2.1, 1.2.2 Not information
L 2.2 A gradual wet profile is less accessible
H 3.1.1, 3.1.2 Dry is best for sediment/P reduction, the Estonian system has both dry and wet sections and shows good retention results for P
H 3.1.3 For some dry is better for others wet, in general varying wetness allows for different retention reactions and thus for retention of more types of toxicant
M 3.1.4 Not distinctive
M 3.2.1 Dry is best for predation on vectors, Estonian buffers have both dry and wet
H 3.2.2 Wet is best for nitrate retention, these BS have both dry and wet and retention results are good (81%)
H 4.1 A gradual wet profile is best for increasing organic matter content. Soils have high C content, considerable litter stock and wet circumstances contribute to C sequestration
M 4.2 No harvesting assumed
H 4.3 A gradual wet profile is best for water storage
Vegetation Tall/various, H Both grass species and grey alder
H 1.1
H 1.2, 1.2.1, 1.2.2 No information
H 1.3 Trees contribute to aquatic biodiversity with litter and shade (less important in Estonia)
H 1.4
H 2.1
L 2.2 Due to trees
H 3.1.1, 3.1.2, 3.1.3 Combination of short and tall vegetation is ideal for pollutant reduction
H 3.1.4 Tall vegetation is ideal for reduction of pesticide drift
M 3.2.1 No data on difference in effectiveness between tall or short
H 3.2.2 Combination of short and tall vegetation is ideal for pollutant reduction
H 4.1 Variable vegetation with deeper rooting species is better for increasing organic matter content
M 4.2 Biomass is not harvested so it makes no difference
M 4.3 Not distinctive
Harvest & maintenance
Zero, L Infrequent harvesting is considered advantageous for biodiversity, zero harvesting is less effective for both ecological and environmental goals, frequent harvesting is good for the environment but not for biodiversity
L 1.1, 1.2, 1.2.1, 1.2.2 Zero harvesting is less effective for both ecological and environmental goals
H 1.3 No harvesting leaves litter which is good for biodiversity
L 1.4 If zero harvesting is less advantageous for local biodiversity we expect it is also less advantageous for connectivity
L 2.1 Zero harvesting is less effective for both ecological goals, attractiveness is associated with biodiversity
L 2.2 Frequent harvesting would be better for access
L 3.1.1, 3.1.2 Frequent harvesting with removal would be better for pollutant retention
M 3.1.3 Should be L for sediment bound toxicants. No specific information on difference in effectiveness due to maintenance frequency.
L 3.1.4 Tall unharvested vegetation is better for drift reduction
M 3.2.1 Unknown
L 3.2.2 Frequent harvesting with removal would be better for pollutant retention
M 4.1 Harvesting with removal is advantageous for C sequestration. However results of the experiments show the Estonian BS system contributes well to C sequestration, partly in unharvested litter
L 4.2 No harvesting
M 4.3 Indistinctive
Fencing No No fencing
H 1.1 – 1.4 Fencing would be good for the environment, but not necessarily for biodiversity

234
H 2.1 Better for biodiversity is more attractive
H 2.2 No fencing, better for access
M 3.1.1, 3.1.3, 3.1.4, 4.1, 4.3 Indistinctive
L 3.1.2, 3.2.1, 3.2.2 Animals have access to BS, but is this not relevant
M 4.2 No grazing animals
Soil Light moderate, M Loamy sand-sandy loam
M1, M2 indistinctive
H3.1.1, 3.1.2, 3.1.3 Moderately textured soils are ideal for retention of pollutants in BS
M 3.2.1, H 3.2.1 & 3.2.2 Moderately textured soils are ideal for retention of pollutants in BS via water flow but for pesticides drift is more relevant
M 4.1 Heavy textured soils are more effective in C sequestration
M 4.2 Moderately textured soils are relatively productive
M 4.3 Moderately textured soils are relatively well connected to the water system (good permeability: infiltration, saturated flow and seepage)
Slope Moderate, M 10 % is optimal
M 1.1-1.4, M 2.1 We are not acquainted with any specific influence of slope on biodiversity other than a wetness or other gradient (->hydrology)
M 2.2 No slope is best for access
H 3.1.1 – M 3.1.3 Moderate slope is best for pollutant retention. This is confirmed by favourable retention in the Estonian BS
H 3.1.4 Moderate slope is best for pollutant retention, but for pesticides drift is more important than water flow.
H 3.2.1, H 3.2.2 Moderate slope is best for pollutant retention. This is confirmed by favourable retention in the Estonian BS
M 4.1, M 4.2 Indistinctive
M 4.3 A sloping landscape provides better opportunities for water storage
Hydrology H both Confirmed in accompanying texts from Estonia
H 1.1 – H 2.1 The natural wetness gradient is good for biodiversity
M 2.2 Indifferent
H 3.1.1 Sediment retention determined by surface runoff intensity, most effective in case of shallow flow. So H because both shallow (wet) and deep flow (dry) occur
H 3.1.2 Sediment and P retention is mainly determined by shallow flow. So H because both shallow (wet) and deep flow (dry) occur
H 3.1.3 Shallow better for sediment bound pollutants, deep for dissolved pollutants and both occur
M 3.1.4 Like toxicants (shallow better for sediment bound pollutants, deep for dissolved pollutants) but drift is more important for pesticides
H 3.2.1 Drier circumstances are better for predation on vectors, both dry and wet occur
H 3.2.2 Results show high retention of N. Apparently the combination of shallow and deep flow works well
M 4.1 Wet circumstances are best for C sequestration. Both occur, so M
M 4.2 Indifferent for biomass production
H 4.3 Varying flow depth and groundwater table provides opportunities for water retention
Land use Grass/arable, M Both arable and grassland (until 1992)
M 1.1 – M 1.4 FAB, Pest control and pollination are more relevant for arable land
M 2.1, M 2.2 A mix of arable with BS and grassland can be considered attractive, but no trees and shrubs
M 3.1 – M 3.2 BS are more effective on arable land for reducing sediment bound contaminants
M 4.1 – M 4.3 Grasslands are able to sequester more C
Stream density Sparse L Sparse because this BS system is connected to "natural" water courses (compare with the ditches in the Po valley&the NL; DK is an intermediairy situation with both man-made and natural water courses)
L 1 – L 4 If stream density is low, less effect on various goals can be expected
Discharge continuity Continuous H Assumption
M 1.2. M 2.2, M 4.1, M4.2 Indistinctive
Ecological network Sparse L According to the added value of the RBS system on this aspect
M 1.1 , M 1.2, M 2.1 Indistinctive for local biodiversity
M 1.3 Indistinctive for local biodivesrity, see also stream density

235
L 1.4 Lower contribution to connectivity in case of sparse ecological network
M 2.2 If stream density is low, less effect on various goals can be expected
M 3, M4 Ecological network does not influence the effectivity of the bs on the environmental issues
Table 9 Evaluation of the buffer strips example in Estonia (Repeated for readability)
effectivity factors for buffer strips Estonia
Goals Specified goals
width placement profile vegetation
harvest /
maintenance fencing soil slope hydrology
land
use
stream
density
discharge
continuity
ecological
network
L = narrow standard abrupt/dry short/prod. zero no light/heavy flat/steep deep grass sparse ephemeral sparse
H = wide tailored gradual/wet tall/various frequent yes moderate moderate shallow arable dense continuous dense
this row refers to the situation in Estonia --> 31 m standard gradual/wet tall/various zero no light-moderatemoderate both grass/arable sparse continuous sparse
1 Biodiversity 1.1 local terrestric H L H H L H M M H M L H M
1.2 functional agrobiodiversity H L H H L H M M H M L M M
1.2.1 pest control H L H H L H M M H M L M M
1.2.2 pollination H L H H L H M M H M L M M
1.3 aquatic M L H H H H M M H M L H M
1.4 connectivity H L H H L H M M H M L H L
2 Landscape 2.1 attractivity H L H H L H M M H M L H M
quality 2.2 access H H L L L H M M M M L M M
3 Load reduction 3.1 solid bound H L H H L M H H H M L H M
= water quality H L H H L L H H H M L H M
H L H H M M H H H M L H M
H L M H H M M H M M L H M
H L M M M L H H H M L H M
3.2 soluble H L H H L L H H H M L H M
4 Climate change 4.1 C sequestration (mitigation) H M H H M M M M M M L M M
4.2 biomass harvesting (mitigation) H M M M L M M M M M L M M
4.3 water storage capacity (adaptation) H L H M M M M M H M L H M
3.2.2 N
manage- and designable factors conditional factors conditional factors design management for field level for landscape level
3.1.1 sediment
3.1.2 P
3.1.3 toxicants
3.1.4 pesticides
3.2.1 vectors

236
References:
Hutchinson, G.L., Livingston, G.P., 1993. Use of chamber systems to measure trace
gas fluxes. In: Harper, L.E., Mosier, A.R., Duxbury, J.M., Rolston, D.E. (Eds.)
Agricultural ecosystems effects on trace gases and global climate change. ASASpecial
Publication No. 55. American Society of Agronomy, Madison, MI, USA, pp. 1–55.
Mander, Ü., Lõhmus, K., Kuusemets, V., Ivask, M., Teiter, S., Augustin, J. 2005.
Budget of nitrogen and phosphorus fluxes in riparian grey alder forests. In: Vymazal,
J. Natural and constructed wetlands: nutrient, metals and management (1-19). Leiden:
Backhuys Publishers
Mander, Ü., Kuusemets, V., Lõhmus, K., Mauring, T., 1997. Efficiency and
dimensioning of riparian buffer zones in agricultural catchments. Ecol. Eng. 8, 299–
324.
Mander, Ü., Kuusemets, V., Lõhmus, K., Mauring, T., Teiter, S., Augustin, J., 2003.
Nitrous oxide, dinitrogen and methane emission in a subsurface flow constructed
wetland. Water Sci.Technol. 48, 135–142.
Mander, Ü., Lõhmus, K., Teiter, S., Uri, V., Augustin, J., 2008. Gaseous nitrogen and
carbon fluxes in riparian alder stands. Boreal Environ.Res. 13, 231–241.
Soosaar, K., Mander, Ü., Maddison, M., Kanal, A., Kull, A., Lõhmus, K., Truu, J.,
Augustin, J. 2011. Dynamics of gaseous nitrogen and karbon fluxes in riparian alder
forests. Ecol. Eng. 37, 40-54
Teiter, S., Mander, Ü., 2005. Emission of N2O, N2, CH4 and CO2 from constructed
wetlands for wastewater treatment and from riparian buffer zones. Ecol. Eng. 25,
528–541.

237
ANNEX 22: RBS LITERATURE
Arora, K., S. K. Mickelson, et al. (2010). "Review of Pesticide retention processes occurring in buffer strips receiving agricultural runoff1." Journal of the American Water Resources Association 46(3): 618-647.
Balestrini, R., C. Arese, et al. (2011). "Nitrogen removal in subsurface water by narrow buffer strips in the intensive farming landscape of the Po River watershed, Italy." Ecological Engineering 37(2): 148-157.
Bentrup, G. (2008). "Conservation buffers: design guidelines for buffers, corridors, and greenways." Gen. Tech. Rep.(SRS-109): 110.
Billeter, R., Liira, J., Bailey, D., Bugter, R., Arens, P., Augenstein, I. (2008). "Indicators for biodiversity in agricultural landscapes: a pan-European study." J Appl Ecol 45(1): 141-150.
Billeter, R., Liira, J., Bailey, D., Bugter, R., Arens, P., Augenstein, I., Aviron, S., Baudry, J., Bukacek, R., Burel, F., Cerny, M., De Blust, G., De Cock, R., Diekotter, T., Dietz, H., Dirksen, J., Dormann, C., Durka, W., Frenzel, M., Hamersky, R., Hendrickx, F., Herzog, F., Klotz, S., Koolstra, B., Lausch, A., Le Coeur, D., Maelfait, J. P., Opdam, P., Roubalova, M., Schermann, A., Schermann, N., Schmidt, T., Schweiger, O., Smulders, M. J. M., Speelmans, M., Simova, P., Verboom, J., van Wingerden, W., Zobel, M. & Edwards, P. J. (2008). "Indicators for biodiversity in agricultural landscapes: a pan-European study." Journal of Applied Ecology 45: 141-150.
Borin, M., M. Passoni, et al. (2010). "Multiple functions of buffer strips in farming areas." European Journal of Agronomy 32(1): 103-111.
Borin, M. E. B. (2002). "Abatement of NO3–N concentration in agricultural waters by narrow buffer strips." Environmental Pollution 117: 165–168.
Borin, M. M. V. F. M. G. Z. (2005). "Effectiveness of buffer strips in removing pollutants in runoff from a cultivated field in North-East Italy." Agriculture, Ecosystems and Environment 105: 101–114.
Burt, T. P., G. Pinay, et al. (2002). "Water table fluctuations in the riparian zone: comparative results from a pan-European experiment." Journal of Hydrology 265(1-4): 129-148.
Christen, B. and T. Dalgaard (2013). "Buffers for biomass production in temperate European agriculture: A review and synthesis on function, ecosystem services and implementation." Biomass and Bioenergy 55: 53-67.
CLERICI Nicola, W. C. J., PARACCHINI M.Luisa, STROBL Peter (2011). "Riparian zones: where green and blue networks meet. Pan-European zonation modelling based on remote sensing and GIS."
Dosskey, M. G. (2002). "Setting priorities for research on pollution reduction functions of agricultural buffers." Environ. Manage. 30: 641-650.
Dosskey, M. G. (2007). "Change in filter strip performance over ten years." Journal of soil and water conservation 62(1): 21-32.
Dosskey, M. G., P. Vidon, et al. (2010). "The role of riparian vegetation in protecting and improving chemical water quality in streams." Journal of the American Water Resources Association 46(2): 261-277.

238
Dworak T.; Berglund, M. G., B.; Mattheiss, V.; Holen, S. (2009). "International review on payment schemes for wet buffer strips and other types of wet zones along privately owned land. Study for RWS-Waterdienst.".
European Commission, D. G. f. A. a. R. D., Unit G-4 (2005). "Agri-environment Measures. Overview on General Principles, Types of Measures, and Application." 24.
Fischer, R. A. and J. C. Fischenich (2000). "Design recommendation for riparian corridors and Vegetated buffer strips. EMRRP Technical Notes." Collection (TN EMRRP-SR-24).
Gregory, Stanley V., Frederick J. Swanson, W. Arthur McKee and Kenneth W.Cummins, 1991. An Ecosystem Perspective of Riparian Zones. BioScience 41, 8: 540-551.
Heinen, M., I. G. A. M. Noij, Hanneke I. M. Heesmans, Jan Willem van Groenigen, J. T. N. M. Thissen and Piet Groenendijk (2012). "A Novel Method to Determine Buffer Strip Effectiveness on Deep Soils." J. Environ. Qual. 41: 334–347.
Helmers, Matthew J.; Thomas Isenhart; Michael Dosskey; Seth Dabney; Jeffrey Strock, 2008. "BUFFERS AND VEGETATIVE FILTER STRIPS." Chapter 4 in Final report: Gulf hypoxia and local water quality concerns workshop: 43-58.
Hendrickx, F., Maelfait, J. P., Van Wingerden, W., Schweiger, O., Speelmans, M., Aviron, S., Augenstein, I., Billeter, R., Bailey, D., Bukacek, R., Burel, F., Diekotter, T., Dirksen, J., Herzog, F., Liira, J., Roubalova, M., Vandomme, V. & Bugter, R. (2007). "How landscape structure, land-use intensity and habitat diversity affect components of total arthropod diversity in agricultural landscapes. ." Journal of Applied Ecology 44: 340-351.
Kruijne, R., Van der Linden, A.M.A., Tiktak, A., Groenwold, J.G., and J.W. Deneer (2011). "Environmental risk indicators for evaluating the Dutch policy on sustainable plant protection." Proceedings of the XIII Pesticide Chemistry Symposium.
Langenhoff, Alette A. M.; Sjef J. M. Staps; Charles Pijls and Huub H. M. Rijnaarts (2013). "Stimulation of Hexachlorocyclohexane (HCH) Biodegradation in a Full Scale In Situ Bioscreen." Environ. Sci. Technol., in press.
Lee, P. C. S. S. B. (2004). "Quantitative review of riparian buffer width guidelines from Canada and the United States." Journal of Environmental Management 70: 165–180.
Liu, X., Zhang, X., Zhang, M., 2009. Major factors influencing the efficacy of vegetated buffers on sediment trapping: a review and analysis. J Environ Qual, 37 (5), pp. 1667-1674.
Mayer, Paul M.; Steven K. Reynolds, Jr., Marshall D. McCutchen, and Timothy J. Canfield, 2007. "Meta-Analysis of Nitrogen Removal in Riparian Buffers." J. Environ. Qual. 36: 1172–1180.
McCracken, D. I., Cole, L.J., Harrison, W., Robertson, D. (2012). "Improving the farmland biodiversity value of riparian buffer strips: Conflicts and compromises." J. Environ. Qual. 41: 355-363.
Meier, K., Kuusemets, V., Luig, J. & Mander, U. (2005). Riparian buffer zones as elements of ecological networks: Case study on Pamassius mnemosyne distribution in Estonia. Ecological Engineering 24: 531-537.

239
Mellander, P. E., A. R. Melland, et al. (2012). "Quantifying nutrient transfer pathways in agricultural catchments using high temporal resolution data." Environmental Science and Policy.
Noij, I. G. A. M., M. Heinen and P. Groenendijk (2012). Effectiveness of non-fertilized buffer strips in the Netherlands. Final report of a combined field, model and cost-effectiveness study. , Wageningen, the NL. Alterra-report 2290.
Noij, I. G. A. M., M. Heinen, H.I.M. Heesmans, J.T.N.M. Thissen and P. Groenendijk (2012a). Effectiveness of non-fertilized buffer strips to reduce nitrogen loads from agricultural lowland to surface waters. J. Env. Qual. 41(2): 322-333.
Noij, I. G. A. M., M. Heinen, H.I.M. Heesmans, J.T.N.M. Thissen and P. Groenendijk (2013). Effectiveness of buffer strips without added fertilizer to reduce phosphorus loads from flat fields to surface waters. Soil Use and Management 29(SUPPL.1): 162-174.
Parkyn, S. (2004). "Review of Riparian Buffer Zone Effectiveness." MAF Technical Paper 2004/05.
Piechnik, D. A., S. C. Goslee, et al. (2012). "Topographic placement of management practices in riparian zones to reduce water quality impacts from pastures." Landscape Ecology 27(9): 1307-1319.
Polyakov, V. A. Fares and M.H. Ryder, 2005. Precision riparian buffers for the control of nonpoint source polutant loading into surface water: A review. Environ. Rev. 13: 129-144
Ranalli, A. J. and D. L. Macalady (2010). "The importance of the riparian zone and in-stream processes in nitrate attenuation in undisturbed and agricultural watersheds - A review of the scientific literature." Journal of Hydrology 389(3-4): 406-415.
Sabater, S., A. Butturini, et al. (2003). "Nitrogen Removal by Riparian Buffers along a European Climatic Gradient: Patterns and Factors of Variation." Ecosystems 6(1): 20-30.
Schultz, R.C., Colletti, J.P., Isenhart, T.M., Simpkins, W.W., Mize, C.W., Thompson, M.L., 1995. Design and placement of a multi-species riparian buffer strip system. Agroforest Syst, 29 (3), pp. 201-226.
Schultz, R.C.; P.H. Wray; J.P. Colletti; T.M. Isenhart; C.A. Rodrigues; A. Kuehl, (1997). Stewards of our streams. Buffer strip design, establishment and maintenance. Iowa State University Publication(Pm-1626b): 6pp.
Sebti, S. and R.P. Rudra, 2010. An approach to evaluate vegetative filter strips in watershed scale. Applied engineering in Agriculture Vol. 26(5):817-826.
Semlitsch, R. D. & J. R. Bodie, 2003. "Biological criteria for buffer zones around wetlands and riparian habitats for amphibians and reptiles." Conservation Biology 17: 1219-1228.
Shirley, S. M. (2006). "Movement of forest birds across river and clearcut edges of varying riparian buffer strip widths. ." Forest Ecology and Management 223: 190-199.
Stutter, M. I.;Simon J. Langan; David G. Lumsdon, 2009. Vegetated Buffer Strips Can Lead to Increased Release of Phosphorus to Waters: A Biogeochemical Assessment of the Mechanisms. Environ. Sci. Technol. 43, 6: 1858-1863. DOI: 10.1021/es8030193

240
Stutter, M. I., W. J. Chardon, et al. (2012). "Riparian buffer strips as a multifunctional management tool in agricultural landscapes: Introduction." Journal of Environmental Quality 41(2): 297-303.
Tanadini, M. S., B. R.; Meier, P.; Pellet, J. & Perrin, N., 2012. "Maintenance of biodiversity in vineyard-dominated landscapes: a case study on larval salamanders.." Animal Conservation 15 136-141.
Van Eerdt, M., J. van Dam, A. Tiktak, M. Vonk, R. Wortelboer en H. van Zeijts (2012). "Evaluatie van de nota Duurzame gewasbescherming (in Dutch, with summary in English)." Rapport Planbureau voor de leefomgeving 500158001
Vidon, P. (2010). "Riparian zone management and environmental quality: A multi-contaminant challenge." Hydrological Processes 24(11): 1532-1535.
Vidon, P. G. F. and A. R. Hill (2004). "Landscape controls on the hydrology of stream riparian zones." Journal of Hydrology 292(1-4): 210-228.
Welsch, D. J., 1991. Riparian Forest Buffers: Function and Design for Protection and Enhancement of Water Resources. USDA Forest Service Report NA-AP-07-91.
Zhang, X. L., Xingmei; Zhang, Minghua; Dahlgren, Randy A. and M. Eitzel (2010). "A Review of Vegetated Buffers and a Meta-analysis of Their Mitigation Efficacy in Reducing Nonpoint Source Pollution." J. Environ. Qual. 39.