OVERVIEW OF FREIGHT SYSTEMS ROD - Federal Railroad ...
134
REPORT NO. FRA/ORD- 77/58 OVERVIEW OF FREIGHT SYSTEMS ROD Office of Freight Systems Office of Research and Development Federal Railroad Administration October 1977 25 - D Prepared for 14 th ANNUAL RAILROAD ENGINEERING CONFERENCE Management " R & D and Railroading: 1 9 7 7 ”
-
Upload
khangminh22 -
Category
Documents
-
view
0 -
download
0
Transcript of OVERVIEW OF FREIGHT SYSTEMS ROD - Federal Railroad ...
REPORT NO. FRA/ORD-7 7 / 5 8
OVERVIEW OF FREIGHT SYSTEMS ROD
Office of Freight Systems Office of Research and Development
Federal Railroad Administration
October 1 9 7 7
2 5 - D
Prepared for
1 4 t h A N N U A L R A I L R O A D E N G I N E E R I N GC O N F E R E N C E
Management
" R & D a n d R a i l r o a d i n g : 1 9 7 7 ”
NOTICE
This document is disseminated under the sponsorship of the U. S. Department of Transportation in the interest of information exchange. The United States Government assumes no liability for the contents or use thereof.
NOTICE
The United States Government does not endorse products or manufacturers. Trade or manufacturers' names appear herein solely because they are considered essential to the object of this report.
TABLE OF CONTENTS
Overview of FRA*s Freight Systems R$D \A. J, Bang, P, 0Z.zk.Azyk
Research in Freight Car Dynamics 1 1W, T, TAaZ, E, H. Law, W, K , CoopzKKldzK ........
Intermodal Cars New Developments 35J, R, BZanchfiZzZd, M, A, Kznwo/ithy
Optical ACI -- A New Look 45R, L, WZAzman, H, C, IngAao, W, F, CfiazkzK
Truck Performance Friction SnubberForce Measurement System 59K, L, CappzZ, G. R, Fai/
Energy Conservation -- Multiple UnitLocomotive Throttle Control 67M, E, JazobA
FAST Mechanical Equipment Test Resultsto Date -- Future Plans 77V, E, Guay
Rail Dynamics Laboratory -- Performance Requirements § Hardware Configurations 85A, G, Gsloaa
A b s t r a c t s o f R e c e n t R e p o r t s 95
SPECIAL ACKNOWLEDGEMENT
The authors wish to express special gratitude
and appreciation to the secretarial and clerical
personnel who diligently engaged in the typing
of this special report; to the graphics and to
the photographic staff who responded in the
highly professional manner that provided those
pictures worth a thousand words. Without their
dedicated support and loyal assistance this
report and the accompanying oral presentations
would not have been possible.
Overview of FR A's Freight Systems R & D
A.J. BA N G
Chief, Freight Service Division Office of Freight Systems Federal Railroad Administration Washington, D.C.
P. OLEKSZYK
Chief, Analysis & Evaluation Division Office of Freight Systems Federal Railroad Administration Washington D.C.
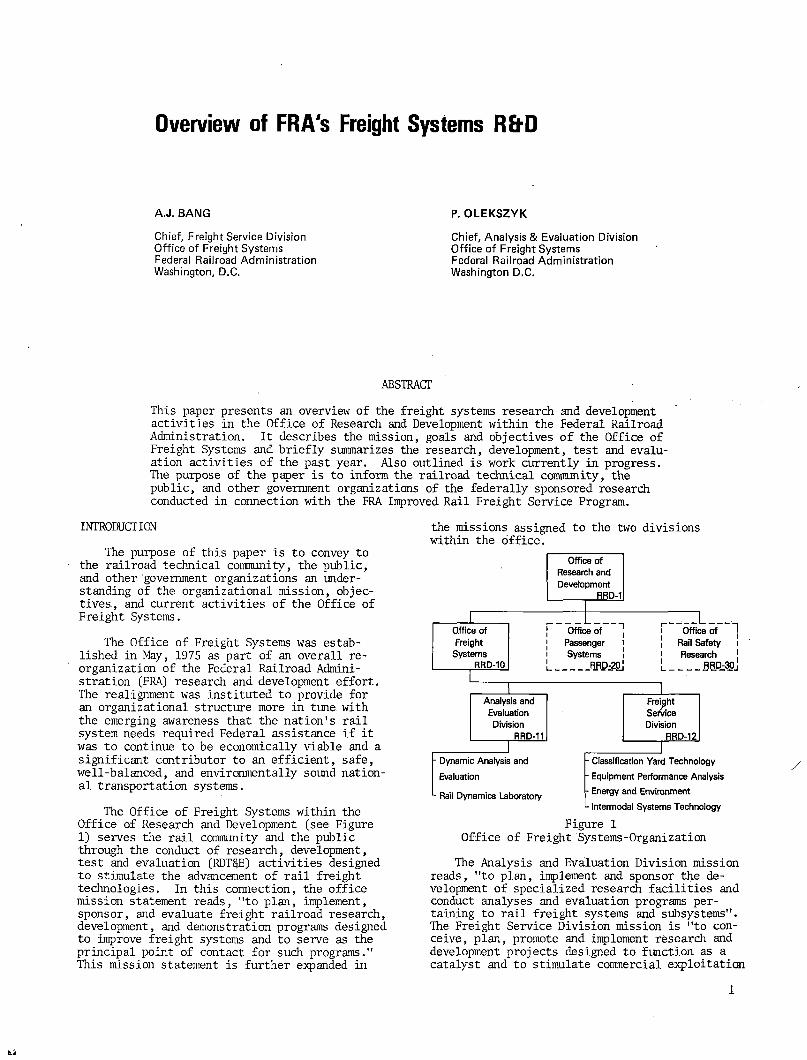
ABSTRACTThis paper presents an overview of the freight systems research and development activities in the Office of Research and Development within the Federal Railroad Administration. It describes the mission, goals and objectives of the Office of Freight Systems and briefly summarizes the research, development, test and evaluation activities of the past year. Also outlined is work currently in progress. The purpose of the paper is to inform the railroad technical community, the public, and other government organizations of the federally sponsored research conducted in connection with the FRA Improved Rail Freight Service Program.
INTRODUCTION
The purpose of this paper is to convey to the railroad technical community, the public, and other government organizations an understanding of the organizational mission, objectives , and current activities of the Office of Freight Systems.The Office of Freight Systems was established in May, 1975 as part of an overall reorganization of the Federal Railroad Administration (FRA) research and development effort. The realignment was instituted to provide for an organizational structure more in tune with
the emerging awareness that the nation's rail system needs required Federal assistance if it was to continue to be economically viable and a significant contributor to an efficient, safe, well-balanced, and environmentally sound national transportation systems.The Office of Freight Systems within the Office of Research and Development (see Figure 1) serves the rail community and the public through the conduct of research, development, test and evaluation (RDT§E) activities designed to stimulate the advancement of rail freight technologies. In this connection, the office mission statement reads, "to plan, implement, sponsor, and evaluate freight railroad research, development, and demonstration programs designed to improve freight systems and to serve as the principal point of contact for such programs." This mission statement is further expanded in
the missions assigned to the two divisions within the office.
Figure 1Office of Freight Systems-OrganizatianThe Analysis and Evaluation Division mission reads, "to plan, implement and sponsor the development of specialized research facilities and conduct analyses and evaluation programs pertaining to rail freight systems and subsystems". The Freight Service Division mission is "to conceive, plan, promote and implement research and development projects designed to function as a catalyst and to stimulate commercial exploitation
1

MOW resources.of system improvements for national rail freight service".Within these assigned organizational missions , the Office of Freight Systems, in its administration of the Improved Rail Freight Service Program, strives for the implementation of research and development that provides outputs which contribute to two of the FRA goals, namely: (1) to promote and assist development of the railroad industry as an efficient, economically sound, and privately owned national- railroad network that can attract that share of the market for intercity freight movement which is commensurate with its inherent economic advantages; (2) to otherwise facilitate rail transportation's contribution to the Nation's goals, including those relating to national security, social needs, energy conservation, and environmental protection.In carrying out its mission, the Office participates in joint Govemment/industry cost sharing projects with the Association of American Railroads, the Railway Progress Institute, and individual railroads and suppliers; it also participates in international technology information exchanges in those areas for which it is responsible. In addition, it performs project management functions in connection with contracted research. To extend its technical capabilities the Office annually establishes an agreement to have certain portions of its research either conducted or monitored by personnel of the Transportation Systems Center (TSC) in Cambridge, Mass, or the Transportation Test Center (TTC) in Pueblo, CO. Inter-agency agreements are also established witb other Federal agencies for the performance of research in support of the program.A brief description of the activities within each division follows.
ANALYSIS AND EVALUATION DIVISIONThe Analysis and Evaluation Division is comprised of two major subprogram areas; specifically-, (1) Analysis § Evaluation and (2) Rail Dynamics Laboratory.The.goals of the Analysis and Evaluation subprogram are:° Develop analytical models to describe the dynamic effects of (1) the wheel/rail interface, (2) variable truck characteristics on the performance of rail freight cars.0 Provide and operate a Facility for Accelerated Service Testing (FAST) to produce results aimed at reduction of procurement, operating, and maintenance costs of rolling stock and track.0 Evaluate available Maintenance of Way (MOW) equipment in a cooperative industry /FRA project to provide data for the more effective allocation of
Accomplishments in this area in the past year have included the following.° The initiation of a development project with Rutgers University, under contract DOT-FR-767-4323, to dynamically characterize three densities of lading in shippers comprised of three types of corrugated board. Also, to be investigated will be a single 3 ply and 5 ply bag. Lastly, a pallet that is comprised of an unconstrained single high density lading in a corrugated shipper will be characterized. Typical damage to be prevented is shown in Figure 2.0 The other significant effort in this subprogram is the "Freight Car -Vehicle Dynamics" research project being conducted by Clemson and Arizona State University. A number of interim reports describing the progress of this program have been issued and are available through NTIS. They include:
(1) Analytical' and Experiments Determination of Nonlinear Wheel/Rail Geometric Constraints, December,1975, PB 252290(2) General Models for Lateral Stability Analysis of Railway Freight Vehicles (to be publised)(3) An Investigation of Rail Car Model Validation (to be publised)(4) Linear Analysis Model for Railway Freight Cars (to be publised)(5) Nonlinear Analysis Models for Rail
way Freight Cars (to be published)(6) Field Test and Validation of Railway Freight Car Models, (to be published)(7) Users Manual for Asymmetric Wheel/ Rail Contact Characterization Program (to be published)(8) Users Manual for Kalkers Simplified Theory of Rolling Contact (to be published)
The current status of this project .will be presented in the accompanying paper entitled "Research in Freight Car Dynamics."0 Within the Analysis and Evaluation program only the rolling stock portion of the FAST program is addressed; the track portion is covered in the Improved Track Structures program which is the responsibility of another office within ORfjD. To date the track structure has accumulated over 100 MGT and the rolling stock has seen an average mileage of over 60,000 miles. The recent status of this project
2
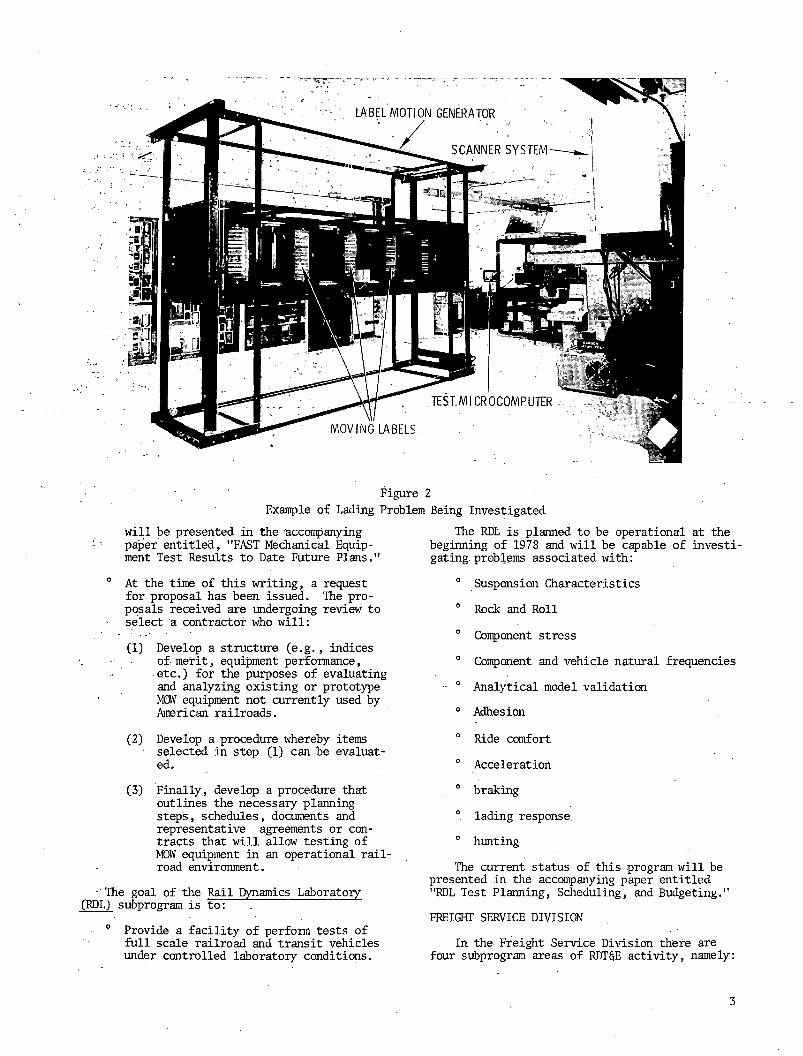
Figure 2Example of Lading Problem Being Investigated
will be presented in the 'accompanying The RDL is planned to be operational at thepaper entitled, "FAST Mechanical Equip- beginning of 1978 and will be capable of invest!ment Test Results to Date Future Plans." gating problems associated with:° At the time of this writing, a request for proposal has been issued. The proposals received are undergoing review to select a contractor who will:
(1) Develop a structure (e.g., indices of merit, equipment performance,•etc.) for the purposes of evaluating and analyzing existing or prototype MOW equipment not currently used by American railroads.(2) Develop a procedure whereby items selected in step (1) can be evaluated.(3) Finally, develop a procedure that outlines the necessary planning steps, schedules, documents and representative agreements or contracts that will allow testing of MOW equipment in an operational railroad environment.
• The goal of the Rail Dynamics Laboratory (RDL) subprogram is to:° Provide a facility of perfoim tests of full scale railroad and transit vehicles under controlled laboratory conditions.
° Suspension Characteristics ° Rock and Roll ° Component stress° Component and vehicle natural frequencies ° Analytical model validation 0 Adhesion 0 Ride comfort 0 Acceleration ° braking ° lading response.° huntingThe current status of this program will be presented in the accompanying paper entitled "RDL Test Planning, Scheduling, and Budgeting."
FREIGHT SERVICE DIVISIONIn the Freight Service Division there are four subprogram areas of RDTf)E activity, namely:
3
(1) Classification Yard Technology, (2) Equipment Performance Analysis, (3) Energy/Environ- ment, and (4) Intermodal Systems Technology. A brief description of each subprogram area, its recent activity, and current undertakings follows.
In the Classification Yard Technology area the major program objectives are to:
0 Develop technologies that will substantially reduce car delays in yards,
° Quantify areas where yard improvements are feasible and desirable,
° Evaluate components and systems that will improve efficiency in yards; in cooperation with the railroads and suppliers, and
' ° Improve the effectiveness of railroad communication and control systems.
Accomplishments in this area in the past year have included the following:
° Technical reports relating to optical automatic car identification (ACI) were provided to the industry in May, 1976 and June, 1977. These reports provided the technical data needed to assess the current industry standard ACI system.The latest reports describe options to increase performance of the optical scanner system to 971 from the current level of 801 and indicate a potential label life of 17 years.
° A report entitled, "Railroad Classification Yard Technology; A Survey and Assessment" became available to the industry and public in January, 1977.The report identified technical areas that will provide the highest payoffs for upgraded or new yards. It also provided an inventory of the yard population in the U.S. and indicated that some 200 new or major reworked classification yard projects can be projected in the next 25 years. The report is • available from the National Technical Information Service (NTIS) Springfield,VA 22161 under Accession Number PB 264 051.
° A "Research Plan for EMC [Electromagnetic Compatibility] Study of the Communication and Control Systems in a Railroad Classification Yard" was provided to interested parties in the industry in July 1977.The plan includes provisions for the participation of three railroads (Santa Fe, Southern, RF§P) in field tests and for coordination of the project through the Inductive Interference Committee, Communication and Signal Section, Association of American Railroads. This work is being performed for the FRA by the Department of Defense Electromagnetic
Compatibility Analysis Center, at Annapolis, Maryland.
Representative of RTD§E in this program area is the accompanying paper, "Optical ACI -- A New Look". The new and continuing work underway at this'time includes:
0 In addition to the yard EMC study previously mentioned, this work area has, at the request of industry, been expanded to include the EMC/EMI impact of railroad electrification. The research plan for this expanded effort is now in the formative stage. This research is expected to result in a report of the research findings in spring 1978. The report will contain a characterization of the yard's EM
, environment, aid in the understanding of existing equipment compatibility, and provide recommendations for improvements. In connection with electrification, the report will indicate a recommended testing methodology for determining the potential impact of electrification on C§S equipment and the surrounding environment.
° A feasibility study of alternatives in car speed control in classification yards has been initiated. This competitive procurement will produce a technical report identifying and recommending the most promising concepts for further development.
0 An assessment of approaches to car presence detection in connection with yard information and control systems has been initiated. This work should lead to a better understanding of the detection requirements and the development" of the optimum solution. A report of this work will be made available to industry.,
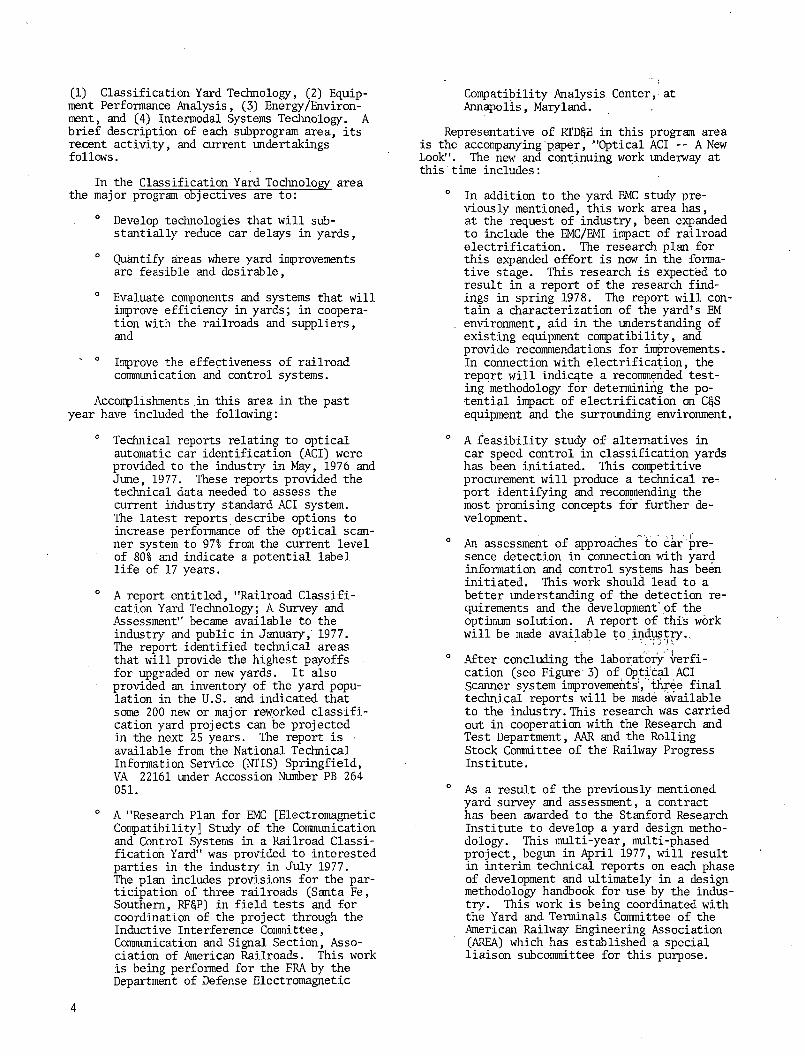
° After concluding the laboratory verfi- cation (see Figure' 3) of Optical ACI Scanner system improvements*, three final technical reports will be made available to the industry. This research was carried out in cooperation with the Research and Test Department, AAR and the Roliing Stock Committee of the Railway Progress Institute.
° As a result of the previously mentioned yard survey and assessment, a contract has been awarded to the Stanford Research Institute to develop a yard design methodology. This multi-year, multi-phased project, begun in April 1977, will result in interim technical reports on each phase of development and ultimately in a design methodology handbook for use by the industry. This work is being coordinated with the Yard and Terminals Committee of the American Railway Engineering Association (AREA) which has established a special liaison subcommittee for this purpose.
4
Figure 3TSC laboratory setup for testing OACI scanner system improvements.
In general, all. RUTEjE activities associated with the electrical engineering discipline as it relates to rail freight service are handled in this subprogram area.
In the Equipment Performance Analysis area the major program objectives are to:
0 increase railroad profitability through the reduction of lading damage which can be' attributed to dynamic phenomena asso- ciated^.with rolling stock suspension sys-
' terns. -
° Develop those technologies that will help to reduce costs occurring from the wear and maintenance of rail vehicle components .
° Quantify the information necessary to provide economic-based performance data and Specifications upon which sound investment decisions may be reached.
° Improve train handling and make-up times where system components are the limiting factor.
Accomplishments in this area in the past year have included the following:
0 Ten reports on test philosophy, measurements and economic analysis pertaining to Phase I of the Truck Design Optimization Project (TDOP)1 were made available
to industry. In addition, some 209 magnetic data tapes containing actual field test measurements were made available through NTIS.
° Two assessments of opportunities for technical innovation, one in braking and one in coupling, were completed. The reports of this work are being finalized and will be made available to the industry and public this Fall. The coupling work was coordinated with the AAR Advanced Coupler Concepts Program while the braking effort was coordinated with the AAR Brake Equipment Committee.
° Completion of the development of a friction snubber force measurement system. This is the subject of an accompanying paper, "Truck Performance -- Friction Snubber Force Measurement System" and is representative of our RDT§E efforts in this program area.
With respect to new and continuing work in the area of equipment performance the following is characteristic.
° The most significant activity will include the continuance of TDOP with the award of the Phase II contract to Wyle Laboratories. This phase of TDOP concerns itself primarily with the Type II, Special Purpose truck but will also encompass some Type I, General Purpose

truck testing as indicated below. As in Phase I, a railroad, in this case the Union Pacific, will provide, as a subcontractor to Wyle, the necessary facilities for the conduct of field testing. Also, as was done in Phase I, industry consultants representing various viewpoints and areas of expertise will be employed, and close coordination of project developments will be effected between TDOP and the Track-Train Dynamics Program.
In light of the recommendations stemming from the previously mentioned braking and coupling technology assessments, investigatory research in the areas of electropneumatic brakes, friction material versus wheel wear, automatic coupling concepts, load sensing devices, disc brakes, and wheel thermal capacity will be initiated. These studies will examine both technical and economic aspects. Reports will be made available to industry as they become available.
° Drawing .upon our previous work done in connection with TOFC/COFC aerodynamic drag studies, additional testing in the area of aerodynamic drag on different freight car configurations will take place this year along with the validation of mathematical models developed from several wind tunnel tests.The full-scale validation of TOFC/COFC wind tunnel data is now underway at the Transportation Test Center. Equipment for these tests has been made available by the Trailer Train Company
, and Trailmobile Division of Pullman,Inc. Ensco Inc., supported by Brewer Engineering Laboratories, Inc. are the contractors for this work. A report on the second series’ of wind tunnel tests should be made available approximately one year from now.
In general, those subjects dealing with mechanics, dynamics and the mechanical engineering discipline as related to rail freight service reside in this subprogram area.
Field testing of the Friction Snubber Force Measurement System (FSFMS) will be incorporated into Phase II of the TDOP. The Barber S2 and ASF Ride Control trucks will be tested loaded and unloaded, with new and worn friction shoes, on curved and tangent track using the newly instrumented side frames (see Figure 4). Findings from this work will be incorporated into the Phase II reports to be published during the coming year.
In the Energy and Environment area the major program objectives are to:
° Exploit and improve the inherent energy and environmental advantages of the rail mode.
° Assist railroad industry with practical guidelines and test procedures contributing to overall noise abatement and the reduction of noxious emissions.
SUPPORT BRACKETS
Figure 4Standard Barber S-2 truck equipped with new
Friction Snubber Force Measurement System (FSFMS).
° Develop and demonstrate energy conservation techniques having economic as well as technical payoffs.
° Quantify areas where locomotive improvements will produce further efficiencies.
Accomplishments in the past year in this program area have included the following:
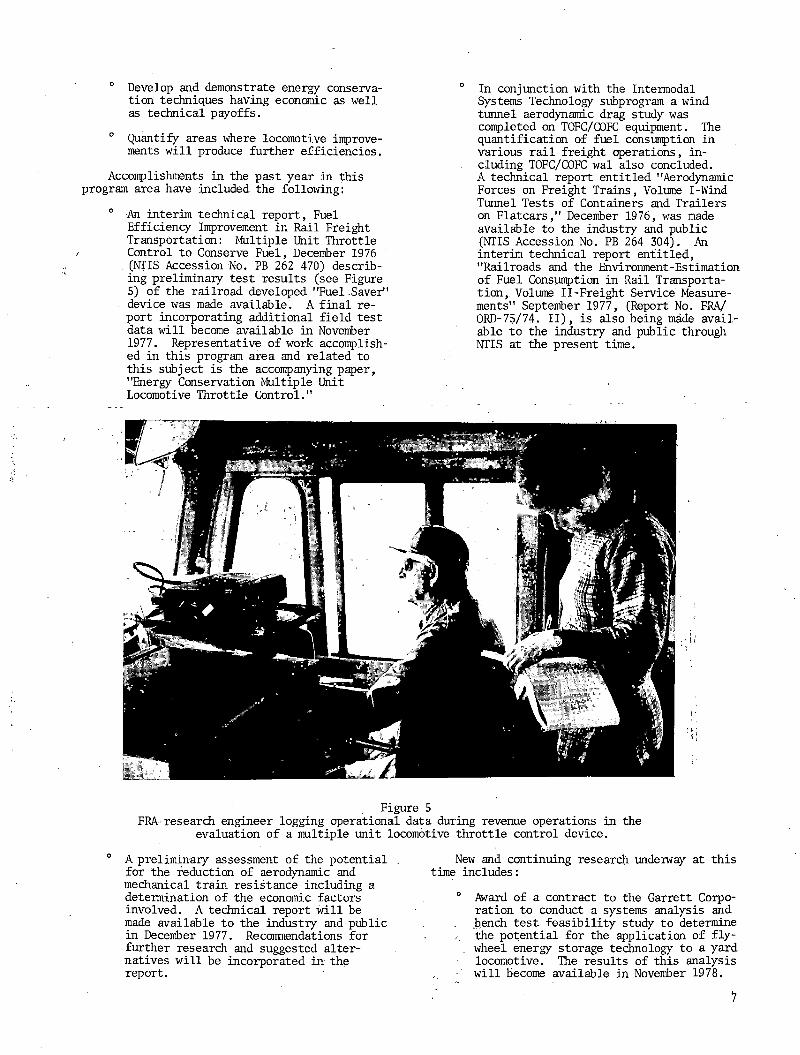
° An interim technical report, Fuel Efficiency Improvement in Rail Freight Transportation: Multiple Unit Throttle
/ Control to Conserve Fuel, December 1976. (OTIS Accession No. PB 262 470) describing preliminary test results (see Figure 5) of the railroad developed "Fuel Saver" device was made available. A final report incorporating additional field test data will become available in November 1977. Representative of work accomplished in this program area and related to this subject is the accompanying paper, "Energy Conservation Multiple Unit Locomotive Throttle Control."
0 In conjunction with the Intermodal Systems Technology subprogram a wind tunnel aerodynamic drag study was conpleted on TOFC/COFC equipment. The quantification .of fuel consumption in various rail freight operations, including TOFC/COFC wal also concluded.A technical report entitled "Aerodynamic Forces on Freight Trains, Volume I-Wind Tunnel Tests of Containers and Trailers on Flatcars," December 1976, was made available to the industry and public (NTIS Accession No. PB 264 304). An interim technical report entitled, "Railroads and the Environment-Estimation of Fuel Consumption in Rail Transportation, Volume II-Freight Service Measurements" September 1977, (Report No. FRA/ ORD-75/74. II), is also being made available to the industry and public through OTIS at the present time.
Figure 5FRA-research engineer logging operational data during revenue operations in the
evaluation of a multiple unit locomotive throttle control device.
° A preliminary assessment of the potential for the reduction of aerodynamic and mechanical train resistance including a determination of the economic factors involved. A technical report will be made available to the industry and public in December 1977. Recommendations for further research and suggested alternatives will be incorporated in the report.
New and continuing research underway at this time includes:
° Award of a contract to the Garrett Corporation to conduct a systems analysis and bench test feasibility study to determine the potential for the application of fly-
, wheel energy storage technology to a yard locomotive. The results of this analysis
■ will become available in November 1978.
V
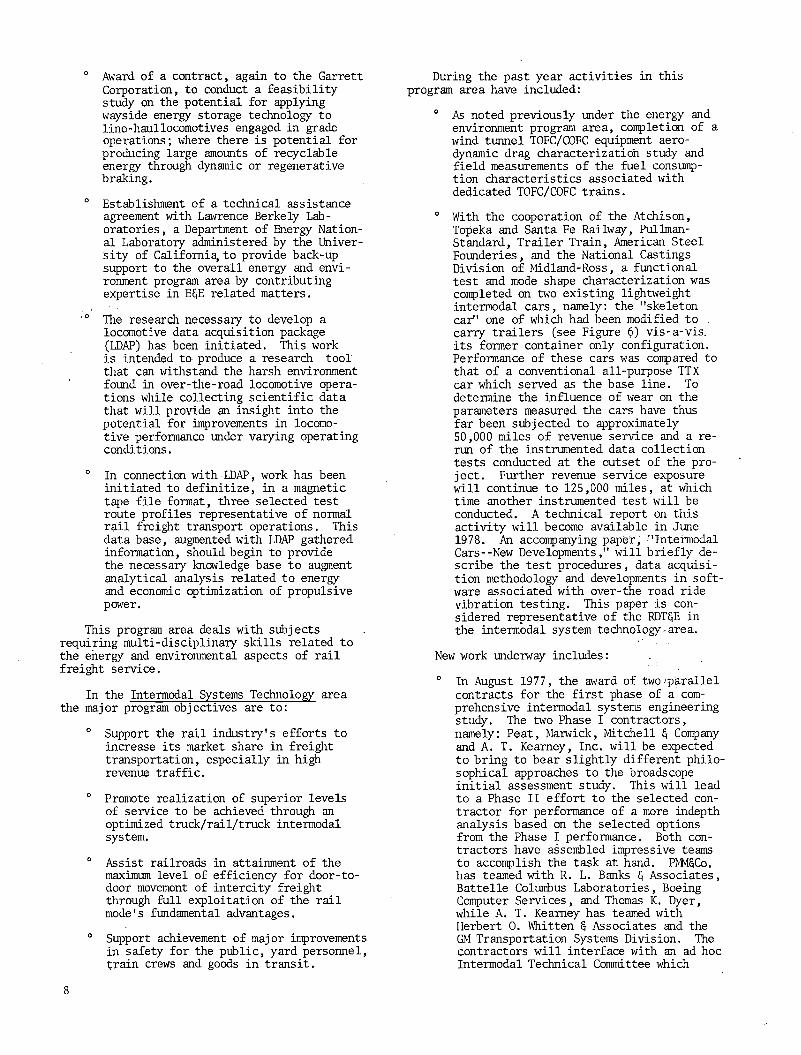
° Award of a contract, again to the Garrett Corporation, to conduct a feasibility study on the potential for applying wayside energy storage technology to line-haul locomotives engaged in grade operations; where there is potential for producing large amounts of recyclable energy through dynamic or regenerative braking.
° Establishment of a technical assistance agreement with Lawrence Berkely Laboratories , a Department of Energy National Laboratory administered by the University of California, to provide back-up support to the overall energy and environment program area by contributing expertise in E$E related matters.
° The research necessary to develop a locomotive data acquisition package (LDAP) has been initiated. This work is intended to produce a research tool that can withstand the harsh environment found in over-the-road locomotive operations while collecting scientific data that will provide an insight into the potential for improvements in locomotive performance under varying operating conditions.
° In connection with LDAP, work has been initiated to definitize, in a magnetic tape file format, three selected test route profiles representative of normal rail freight transport operations. This data base, augmented with LDAP gathered information, should begin to provide the necessary knowledge base to augment analytical analysis related to energy and economic optimization of propulsive power.
This program area deals with subjects requiring multi-disciplinary skills related to the energy and environmental aspects of rail freight service.
In the Intermodal Systems Technology area the major program objectives are to:
° Support the rail industry's efforts to increase its market share in freight transportation, especially in high revenue traffic.
° Promote realization of superior levels of service to be achieved through an optimized truck/rail/truck intermodal system.
° Assist railroads in attainment of the maximum level of efficiency for door-to- door movement of intercity freight through full exploitation of the rail mode's fundamental advantages.
° Support achievement of major improvements in safety for the public, yard personnel, train crews and goods in transit.
During the past year activities in this program area have included:
° As noted previously under the energy and environment program area, completion of a wind tunnel TOFC/COFC equipment aerodynamic drag characterization study and field measurements of the fuel consumption characteristics associated with dedicated TOFC/COFC trains.
° With the cooperation of the Atchison, Topeka and Santa Fe Railway, Pullman- Standard, Trailer Train, American Steel Founderies, and the National Castings Division of Midland-Ross, a functional test and mode shape characterization was completed on two existing lightweight intermodal cars, namely: the "skeleton car" one of which had been modified to . carry trailers (see Figure 6) vis-a-vis. its former container only configuration. Performance of these cars was compared to that of a conventional all-purpose TTX car which served as the base line. To determine the influence of wear on the parameters measured the cars have thus far been subjected to approximately 50,000 miles of revenue service and a rerun of the instrumented data collection tests conducted at the outset of the project. Further revenue service exposure will continue to 125,000 miles, at which time another instrumented test will be conducted. A technical report on this activity will become available in June 1978. An accompanying paper, "Intermodal Cars--New Developments," will briefly describe the test procedures, data acquisition methodology and developments in software associated with over-the road ride vibration testing. This paper is considered representative of the RDTfjE in the intermodal system technology-area.
New work underway includes:
° In August 1977, the award of two-parallel contracts for the first phase of a comprehensive intermodal systems engineering study. The two Phase I contractors, namely: Peat, Marwick, Mitchell § Company and A. T. Kearney, Inc. will be expected to bring to bear slightly different philosophical approaches to the broadscope initial assessment study. This will lead to a Phase II effort to the selected contractor for performance of a more indepth analysis based on the selected options from the Phase I performance. Both contractors have assembled impressive teams to accomplish the task at hand. PMMfjCo. has teamed with R. L. Banks § Associates, Battelle Columbus Laboratories, Boeing Computer Services, and Thomas K. Dyer, while A. T. Kearney has teamed with Herbert 0. Whitten 8 Associates and the GM Transportation Systems Division. The contractors will interface with an ad hoc Intermodal Technical Committee which
8
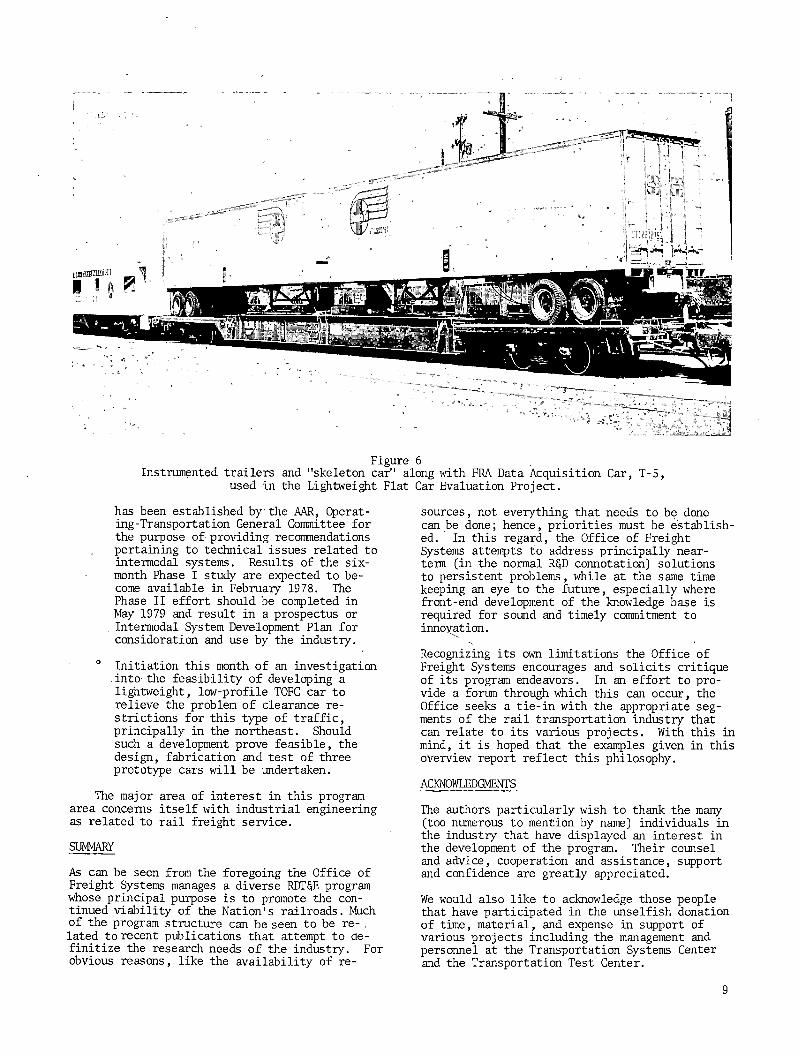
Figure 6Instrumented trailers and "skeleton car" along with FRA Data Acquisition Car, T-5,
used in the Lightweight Flat Car Evaluation Project.
has been established b y the AAR, Operating-Transportation General Committee for the purpose of- providing recommendations pertaining to technical issues related to intermodal systems. Results of the six- month Phase I study are expected to become available in February 1978. The Phase II effort should be completed in May 1979 and result in a prospectus or , Intermodal System Development Plan for consideration and use by the industry.
° Initiation this month of an investigation .into-the feasibility of developing a lightweight, low-profile TOFC car to relieve the problem of clearance restrictions for this type of traffic, principally in the northeast. Should such a development prove feasible, the design, fabrication and test of three prototype cars will be undertaken.
The major area of interest in this program area concerns itself with industrial engineering as related to rail freight service.
SUMMARY
As can be seen from the foregoing the Office of Freight Systems manages a diverse RDTfjE program whose principal purpose is to promote the continued viability of the Nation's railroads. Much, of the program structure can be seen to be related to recent publications that attempt to de- finitize the research needs of the industry. For obvious reasons, like the availability of re
sources, not everything that needs to be done can be done; hence, priorities must be established. In this regard, the Office of Freight Systems attempts to address principally near- teim (in the normal R§D connotation) solutions to persistent problems, while at the same time keeping an eye to the future, especially where front-end development of the knowledge base is required for sound and timely commitment to innovation.
Recognizing its own limitations the Office of Freight Systems encourages and solicits critique of its program endeavors. In an effort to provide a forum through which this can occur, the Office seeks a tie-in with the appropriate segments of the rail transportation industry that can relate to its various projects. With this in mind, it is hoped that the examples given in this overview report reflect this philosophy.
ACKNOWLEDGMENTS
The authors particularly wish to thank the many (too numerous to mention by name) individuals in the industry that have displayed an interest in the development of the program. Their counsel and advice, cooperation and assistance, support and confidence are greatly appreciated.
We would also like to acknowledge those people that have participated in the unselfish donation of time, material, and expense in support of various projects including the management and personnel at the Transportation Systems Center and the Transportation Test Center.
9
Research in Freight Car Dynamics
N.T. TSAI E.H. L A W
Research Manager Associate Professor of Mechanical EngineeringOffice of Freight Systems Clemson UniversityFederal Railroad Administration Clemson, S.C.Washington, D.C.
N.K. COOPERRIDER
Professor of Mechanical Engineering Arizona State University Tempe, Arizona
ABSTRACT
This paper describes the Freight Car Dynamics project conducted by Clemson and Arizona State Universities under sponsorship of the Federal Railroad Administration. A series of models and associated solution techniques for predicting freight car stability, forced response and curving behavior were developed in this effort. Validation tests were planned and carried out by the Association of American Railroads and the Union Pacific Railroad. The test data have been analyzed by several techniques including spectral analysis and the random decrement method. The validation process, involving comparison of predicted and experimental transient response, power spectral densities and steady state values, is in progress.
INTRODUCTION
This research project, under the direction of Professors E. Harry Law of Clemson University and Neil K. Cooperrider of Arizona State University, has the objective of providing tools and techniques to analyze the dynamic behavior of railroad freight cars. The effort entails development and:correlation of theoretical techniques for predicting freight car dynamic behavior, and use of the techniques to investigate the behavior of present and proposed freight car designs. The project is sponsored by the Federal Railroad Administration with support and cooperation from the Association of American Railroads and the Union Pacific Railroad.
Derailments, damaged freight, distorted track and worn or broken vehicle components are problems that result from undesirable freight car dynamic behavior. The models and analytical techniques developed in this effort can be used to determine causes of present dynamic problems, and to design components and vehicles that alleviate such problems. To study the full range of railroad operating conditions pertinent to lateral vehicle dynamics, models and analyses have been developed for rail freight vehicle stability, forced response and curving.
Until recently, experimental and analytical
evaluations of rail car dynamics have gone down separate paths. This lack of interaction can be attributed to the fact that the experimental, and analytical work has been done by different groups. Not surprisingly, those organizations, such as the British Rail and Japanese National Railway research groups, that first undertook the rail vehicle dynamics analyses, have also been the first to use integrated analytical- experimental evaluation methods for rail vehicle design. This project has built on this background to develop an approach for dealing with the dynamic problems of freight vehicles of the type in use in North America. In the course of this work several innovations have been introduced into rail vehicle dynamics analysis and testing including development of numerical techniques to deal with arbitrary wheel and rail head profiles, the use of quasi- linearization techniques to handle nonlinear characteristics, the use of an hydraulic excitation system during the vehicle tests, and the application of the random decrement technique in analyzing the test data.
Research of this type involves modeling, correlation or validation of models, and analysis of the model behavior. In this program, quite
11
a number of models have been developed for freight car behavior on tangent track, during curve entry, and in curve negotiation. Because this is an exploratory study into the*theory of freight car behavior, these models differ widely in complexity. One of the outputs of the project will be recommendations for the appropriate use of each model and analysis approach.Validation of these models is underway. Experimental data for the validation effort has been provided by tests carried out by the Association of American Railroads and the Union Pacific Railroad. After validation, the models will be utilized to examine current vehicle and track maintenance procedures and to suggest amendments to the procedures. The models will be supplied to the railroad industry for use in evaluating supplemental devices, in studying possible modifications for current freight car trucks, and in exploring new design concepts.This paper is intended as an overview of this effort. The theoretical developments achieved in this effort are discussed in the next section, followed by descriptions of the validation techniques and field tests. The current status and future work are summarized in the final section.
THEORETICAL DEVELOPMENTS Approach
Our approach in this project has been to develop and to investigate the conditions of applicability of a number of modeling and analysis approaches. For example, computer solutions for the stability behavior of rail vehicles that use linearized models and eigenvalue/eigen- vector solution techniques are several orders of magnitude less expensive than solutions obtained by direct numerical integration. Consequently, eigenvalue/eigenvector stability analyses offer considerable promise for use in the design process where a large number of candidate designs are to be evaluated.
After analysis of the test results, we will compare the results from the various models and analyses with test results to evaluate the conditions and range of applicability of each model and analysis approach. For many purposes, analyses may be used that are inexpensive computationally as compared with other analyses.It is important to identify the purposes for which such analyses can be used if these models and analyses are to be of maximum benefit to the railroad industry.In each of the three areas pertinent to lateral rail vehicle dynamics (hunting or lateral stability, forced response, and curving behavior), we have followed this approach. For investigating hunting stability we have developed six models (classified in terms of the numbers of degrees of freedom) and three analyses, or techniques to solve the model equations of motion,
for forced response one model and three analyses, and for curving behavior two models and three analysis approaches. These models and analyses are briefly described in the following sections.Before most of these models and analyses could be developed, it was necessary to develop methods for determining the nonlinear wheel/rail geometric constraint functions for arbitrary wheel and rail transverse profiles. Methods for calculating both linear and nonlinear creep force/creepage relationships were also needed.The work involved in pursuing these objectives is also described in the following sections.
Wheel/Rail Geometric ConstraintsThe transverse or lateral profiles of the wheels and rails have a strong influence on all aspects of the lateral dynamic behavior of rail vehicles. Wheel/rail geometric constraint functions such as the differences of left and right wheel rolling radii and left and right wheel/ rail contact angles and wheelset roll angle appear explicitly in the equations of motion. These functions are usually highly nonlinear and depend, to the first order, on the wheelset lateral displacement relative to the rails (and to the second order on the wheelset yaw angle). The forms of these nonlinear functions are governed by the lateral wheel and rail head profiles, the wheel and rail gauge, and the rail cant angles. Examples of these constraint functions are shown in Figures 1 and 2 for new and CN profile wheels on new rails.Linear dynamic and steady state curving analyses have generally represented the influence of the wheel/rail geometry by constant values of effective coni city (obtained by linearization of the curve of the difference in rolling radii) and lateral gravitational stiffness (obtained by linearization of the curve for the difference of contact angles). The linearization technique depends on the type of analysis to be performed. Examples of methods used for linearization are linearization about the assumed equilibrium point, least squares fit of a straight line characteristic over a specified range, and quasi-linearization [1-3].Perhaps the only wheel/rail profile combinations that are easy to linearize are those of new wheels on new and worn rails. For these combinations, the important wheel/rail geometric constraints are essentially linear up to the value of lateral displacement where flange contact occurs. For wheels having other than a straight taper, the constraint functions are nonlinear in the lateral wheelset displacement over the entire range of lateral displacement. If other than straight tapered wheels are to be considered, it is essential, for prediction of lateral dynamic behavior, to know these wheel/rail geometric constraint functions.In this program, two analyses and accompanying computer programs with Users' Manuals have been developed to calculate these wheel/rail geometric constraint functions. The first of these [4]
12
addresses the case where the left and rightawheels. and the left and right rails are, respectively., mirror images of each other. The second [5] relaxes this condition and permits the consideration of wheels and/or rails that are not mirror images of each other. The latter case is of course the more realistic one. Additionally, a technique utilizing cubic splines for calculating the curvature of the wheel and the rail is incorporated in the analysis and program reported in [5].This information is essential for calculating creep coefficients and nonlinear creep force/ creepage relationships.A technique was also developed under this program [6] for fast and efficient digitization of graphical wheel and rail profile data.These digitized data are needed as input to the wheel/rail geometric constraint programs of [4] and [5].
Creep Force/Creepage. - : The.shear stresses acting between wheeland- rail in the contact region give rise to creep forces and moments. Estimating the level of creep forces and moments that prevails for a given vehicle is perhaps the most difficult aspect of estimating the parameters necessary for a theoretical analysis of rail vehicle dynamics.0)
Kalker's nonlinear theory on creep [8, 9] is regarded by most t:o be the most complete theory available. Kalker's theoretical predictions of the nonlinear creep force characteristics have been substantiated by laboratory experiments [7]. In addition to predicting the longitudinal and lateral forces due to the relative longitudinal and lateral velocities or creepages between wheel and rail, Kalker's linear and nonlinear theories (of all those avai-1 abj-e), ;are the only ones that predict the .lateral- creep -force due to a relative angular veloci ty, component normal to the contact area between .wheel- and rail. This force, called the lateral/spin.creep force, is usually less than the lateral creep force due to lateral creepage while wheel/rail contact remains in the tread region of the wheel. However, as the contact point moves towards the flange and the wheel/ rail contact angle increases (as happens during ’ curving, hunting, and incipient wheel climb), the 1-a'teral/spin creep force becomes much larger than the lateral force due to lateral creepage. Consequently, the importance of Kalker's theories in providing a basis for understanding the creep force mechanism and the effects of creep on rail vehicle dynamics should not be underestimated.
A computer program for calculating the linear creep forces and moments utilizing Kalker's linear theory has been developed during this project, and made available to those investigators requesting it. Additionally, the conversion from ALG0L to F0RTRAN of Kalker's program embodying his simplified nonlinear creep theory [8] has been completed recently.This theory is considerably more economical
of computation time than Kalker's complete nonlinear theory [9] and, as shown in Figure 3, agrees well with experimental results published in [11]. A version of this program was developed in subroutine form so that it might be incorporated easily in F0RTRAN computer programs for rail vehicle dynamics analysis.Hunting Stability
One of the most severe problems facing the railroad industry today is that of ensuring that the various rail vehicles in service have, an adequate margin of safety with regard to hunting stability. Unfortunately, the practical solution of the hunting problem for the , complete fleet of rail vehicles is a long way . off. However, the analytical modeling and analysis techniques developed in this effort should enable designers of rail vehicles to develop new vehicle designs as well as corrective measures for existing designs that offer sufficient safety against hunting.Several different models and analysis techniques have been developed on this project. .. As the validation efforts continue, we will determine the conditions, range of validity, and appropriate application of each model and technique. As discussed previously, the intent has been also to develop the simplest credible model consistent with the ultimate use to which it will be put.Linear AnalysesA series of models for the lateral dynamics of a single railway vehicle have been developed. These are shown in Table 1 and are classified by the numbers of degrees of freedom. Eigen- value/eigenvector stability analyses have been developed and programmed for each of these models after linearization. These analyses predict the frequency and damping of oscillatory modes and the time constants for overdamped ■ modes as well as the shape of each mode of the vehicle. This information permits the estimation
of stability margins from the variation of the damping with speed of the least damped mode.An example of such theoretical results is shown in Figure 4.It has been shown by comparison of results for the various models that the truck model used in the 9 degree-of-freedom (DOF) model is adequate for use in stability analyses of vehicles with roller bearing trucks. The critical speeds predicted by the 9, 17, and 19 DOF models for a vehicle having roller bearing trucks are very similar. However, the shape of the least damped mode predicted by the 19 DOF model differs from that predicted by the 9 or 17 DOF not only in the car body mode shapes due to car body flexibility but in the phasing of the motions of the front and rear trucks.Based on these results, it may be concluded that in the initial design stages of vehicles equipped with roller bearing trucks the 9 DOF model may be used to investigate stability.
^ Hobbs [7] has reviewed both theoretical and experimental work in the area of creep.13
Later in the design process, the effects of car body flexibility should be considered.The selection of input data for use in these eigenvalue/eigenvector analyses is not a simple matter even when component test data are available. For vehicles like conventional North American freight cars, the lateral suspension characteristics are dominated by dry friction and other nonlinearities such as deadband and saturation. Thus, choosing effective or equivalent linear suspension characteristics requires considerable expertise and judgement as does interpretation of the results.These computer programs have been used to conduct parameter studies encompassing the various configurations tested by the Association of American Railroads on the Union Pacific Railroad during the recent field tests.To illustrate the application of these models in a design study, the 11 and 23 DOF models were used to examine the effects on hunting stability of various primary suspension elements and car body flexibility [12, 13],In addition, a generic model of truck with interconnected wheelsets was formulated and a range of values for the interconnection suspension elements was examined. Typical results from this study are shown in Figure 5 where the critical speed for hunting instability is plotted versus interconnection shear stiffness for a vehicle having interconnected wheelsets.These models and analyses have also been used to examine a potential maintenance problem. As a freight car accumulates service mileage, the wheels on a given truck develop different transverse profiles, A brief study was conducted to examine the effects on stability of using a different wheel profile for each of the two axles of a truck [14], Various combinations of wheel profiles were examined.A typical result is shown in Figure 6 where critical speed for hunting is shown for a nominally empty 80 ton hopper car with various wheel profile configurations. The axles labeled "N" are those with the standard AAR new profile while those labeled "P" are those with profiled wheels having an effective coni city of about 0.31 together with a substantially increased value of gravitational stiffness. It can be seen that trucks with different wheel profiles on the leading and trailing axles exhibit critical speeds that depend strongly on the direction of travel (see Configuration 8 of Figure 6). Thus it would appear that one maintenance objective should be to maintain all wheel profiles of a truck to a common profile.The operational practice of loading freight cars asymmetrically fore and aft was also examined briefly for its effects on stability [14]. It was found that stability was increased slightly when the vehicle was loaded in the rear as opposed to the front.
However, this difference usually was not as great as the difference in stability between empty and fully loaded cars.As can be seen from this brief discussion, these models and analyses have been used and may be used in the future to answer various questions concerned with maintenance and operational practices as well as those concerned with vehicle design. The primary advantages of these linearized analyses are that they are very economical with regard to computer costs and offer a great deal of insight into the effects of various parameters on the vehicle dynami cs.Nonlinear Analyses of HuntingThe suspensions of North American freight cars are dominated by nonlinearities such as dry friction, deadband, and limiting or saturation. In addition, the wheel/rail interaction process is characterized by nonlinear wheel/rail geometric constraints and nonlinear creep force/creepage relationships. These nonlinearities strongly affect the lateral dynamic response of rail vehicles.As discussed previously, there are many uses for linearized stability analyses of rail vehicles. These should be used with considerable care and judgement for vehicles with strongly nonlinear characteristics such as the freight car. For those cases where a detailed examination of the effects of these nonlinearities is desired and warranted, nonlinear analyses must be used. These should be used with discretion as the computation costs are usually at least an order of magnitude greater than those of linear analyses.We are using two types of nonlinear analysis for examining the hunting stability of freight cars. One, called quasi-1inear analysis, seeks to utilize linear analysis techniques in a special way to effect considerable computation cost savings over the standard approach to analyzing complex nonlinear systems, direct integration of the equations of motion [1, 2, 3], We have also taken two approaches to integrating directly the equations of motion. We are using both numerical integration methods on digital computers and analog integration on a state-of- the-art hybrid computer. Although fewer companies have direct access to hybrid computers than to digital computers, hybrid computation can offer significant cost savings as compared with digital integration. These questions are discussed more completely in [15].Quasi-1inear analysis of hunting may be used to compute the existence and stability characteristics of limit cycles. The work
reported(2) in [1, 2, 3] represents the first efforts in this area and results obtained for a __v 'This development of quasi-linear techniques for rail vehicle dynamic analysis was primarily supported by FRA through Transportation Systems Center Contract No. D0T-TSC-902.
14
simplified model agree very well with those obtained by integration of the equations of motion [2]. Thus, although only recently developed as an analysis technique for problems in rail vehicle dynamics, the future for the application of quasi-linear analysis techniques to rail vehicle dynamics problems appears bright.Results obtained via quasi-linear analysis for the limit cycle amplitude versus speed are shown in Figure 7 for the 9 DOF freight car model. Unstable limit cycles may be thought of as stability boundaries while stable limit cycles represent the amplitude finally attained after hunting has started. These analyses may also be used to estimate the levels of the forces between wheels and rails and between vehicle components (depending on the particular model used) during hunting. We have applied the quasi- linear analysis technique to the 9 DOF freight car model described in Table 1 as well as to simpler models. However, it may be used in conjunction with almost any model.The computation costs in developing curves such as those shown in Figure 7 via quasi-linear analysis are much less than the costs would be using hybrid computation and at least several orders of magnitude less than the costs associated with numerical integration of the equations via digital computation.We are analyzing two nonlinear models of rail vehicles via direct integration. The first model is the 5 DOF half-car model described in Table 1. Nonlinearities considered are suspension friction and wheel/rail geometric constraints. This model is implemented on the Clemson University Engineering Computer Laboratory hybrid computer ]. Because of
machine capacity limitations, we cannot implement rail vehicle models with more degrees of freedom or nonlinear creep force/creepage relationships or consider large wheel/rail contact angles in the creepages or geometric constraints. Nevertheless, we feel that we have demonstrated the feasibility of hybrid computation for rail vehicle problems and have achieved cost-effective results with the half car model. We also have developed a numerical integration program on the digital computer for the 5 DOF model.■ The second model we are analyzing -via direct integration is the 9 DOF model described in Table lW. This is being performed by numerical integration on digital computers ).As the cost of computation with numerical integration increases geometrically with the order of the system, our approach has been to develop the simplest credible model (in terms of the number of degrees of freedom) for a freight car equipped with roller bearing trucks. This implies neglecting degrees of freedom such as bolster pitch and sideframe rock that in all probability have only a minor influence (if any) on vehicle stability. However, recognizing the importance of effects such as nonlinear wheel/rail geometric constraints,
suspension friction, and nonlinear creep force/ creepage relationships, we have attempted to model these effects with a high degree of fidelity.Large wheel/rail contact angles are considered in both the creepage expressions and the geometric constraint functions. A heuristic nonlinear creep force/creepage relationship is used based on Kalker's theory that includes the effects of spin creep on the lateral force. The feasibility of actually using Kalker's simplified nonlinear creep theory [8, 10] is being investigated ). As wheel/rail normal forces and contact geometry change dynamically, these effects are included in the program as they affect the creep forces and gravitational stiffness. Suspension friction is also included!'!. The computer program embodying this analysis is in the development stage.In summary, we have developed six different models of freight vehicles (Table 1) and are . using four different analysis techniques (linear eigenvalue/eigenvector analysis, quasi-linear analysis, numerical integration via digital computer, and analog integration using a hybrid computer) for evaluating the lateral stability of railway freight cars. We anticipate establishing the utility of each of these models and analysis approaches and have used them in a preliminary fashion to address questions concerned with vehicle design, maintenance, and operation.
Forced ResponseMethods are needed that will enable the designer to estimate the acceleration levels and the forces between vehicle components.We have developed analyses that answer this need by predicting these quantities as the rail vehicle traverses irregular, rough track. To date our work has focused on developing cost effective analysis techniques for the forced response of the 9 DOF model described in Table 1.
f oT' 'This system is described in [15] and comprises an EAI-680 analog computer linked to a PDP-15 digital computer through an EAI-693 interface.^Actually, the model being used in this instance has 13 DOF. The additional four degrees of freedom are rigid body angular rotation of each wheel set about the axle centerline. This is necessary to describe accurately the dynamics of vehicles traversing curves at a constant forward speed.[51' 'We are using two models of digital computers: the UNIVAC 1110 at Arizona State University, and the IBM 370/3165-11 at Clemson University.^There is no doubt as to the technical feasibility. However, computation time and costs are expected to increase and may not be acceptable unless additional efficiencies are effected elsewhere in the program.^The choice of a suitable digital algorithm for analyzing dry friction is by no means straightforward. Our efforts in this area are described in [16].
15
The simplest and least expensive analysis approach uses standard linear frequency analysis techniques long used by vibrations and automatic control engineers. These techniques yield results in either of two forms. In the first, the amplitudes of the vehicle response variables (displacements, accelerations, forces across suspension elements and between wheel and rail) are obtained as a function of the frequency of the track alignment or cross level irregularity for given magnitudes of these irregularities. In the second, the power spectral densities (PSD's) of the same vehicle response variables are obtained in response to the PSD for either track alignment or cross level. As for the linearized analyses of hunting stability, the models must be linearized and effective or equivalent linear values chosen for suspension and wheel/rail characteristics.To more accurately consider the effects of the suspension and wheel/rail nonlinearities, quasi-1inear analysis was used [1, 2, 3],The output characteristics of the various nonlinear suspension elements may depend on either or both the magnitude and frequency of the input. The quasi-1inear approach preserves this dependency and enables the designer to calculate the various vehicle response variables of interest. As in the case of the linear forced-response analysis, the track alignment irregularities are considered to be either harmonic at a fixed amplitude or representative of a Gaussian random process.When the input is considered to be random, results are obtained in the form of PSD's for the various vehicle response variables. However, in this case, these PSD results depend nonlinearly on the root mean square and shape of the alignment input spectrum.As in the case of the stability analyses using the quasi-linear approach, the application of these techniques to the forced response of rail vehicles appears to be a very cost effective approach. Computation costs are on the order of several orders of magnitude less than those associated with the commonly used technique of digital integration of the equations of motion.The calendar and engineer time required to generate and interpret results of a quasi-linear analysis as compared with a digital integration program reflect these same ratios. However, it should be stated that there are approximations and assumptions necessary in a quasi-linear analysis that are not necessary when using a direct integration approach. Whether these pose difficulties in a given situation depend on the information desired. These topics are more fully addressed in [1].The last analysis technique we are using to examine the response of the 9 DOF freight car to lateral alignment irregularities is that of digital integration of the equations of motion. The same analysis and computer program that is being developed to examine hunting stability of the 9 DOF model will be used here with prescribed lateral alignment irregularities. These may be of almost any form ranging from "bumps" to sinusoids to random signals. While
we anticipate that it may be necessary to use this last analysis approach in a limited number of cases, we anticipate that the computation costs will be very high requiring at a minimum 15 sec of computer time to simulate 1 sec of real time. Results of the digital integration analysis for the forced response of the 9 DOF freight car will be in the form of time histories of the response variables.Summarizing, work in this project on the lateral forced response of freight cars has focused on developing linear, quasi-linear, and numerical integration analyses of the 9 DOF freight car model. The cost, facility of use, and results obtainable with these techniques vary. One of the results of the research will be to establish the most cost-effective approach for given types of problems faced by vehicle designers.
Curving BehaviorThe insurance of good curving performance should be of primary concern to the vehicle designer. Good curving performance is characterized by lack of contact between the wheel flanges and the rails. When flange contact does occur, it leads to increased rates of wheel and rail wear, higher levels of vibration in the vehicle, and an increased propensity for derailment. These factors have long been recognized. However, only with the relatively recent work of Newland [17] and Boocock [18] has the groundwork been laid for the development of curving analyses appropriate for designing for good curving performance.The analysis techniques developed by Newland and Boocock are linear approaches that predict
flange contact and slip boundaries. That is, for a given vehicle design, the combination of track curvature and cant deficiency necessary for wheel slip and flange contact may be calculated. If these values are plotted, slip and flange contact boundaries may be constructed on a graph of cant deficiency vs. inverse curve radius for the particular vehicle. Design changes that promote flange-free traversal of curves of smaller radius may be identified easily.Three general approaches to the question of estimating curving performance have been used in this project. In the first, we have developed steady state analyses of the linearized equations of a freight car. These are solved to develop the slip and flange contact boundaries. This is the type of analysis that is inexpensive to do and may be used to evaluate a host of design possibilities.The second approach entails a refinement of the first that enables the designer to evaluate the effects on the slip and flange contact boundaries of profiled or worn wheels. Actual nonlinear wheel/rail geometric constraint functions are introduced into the equations of motion which are then solved iteratively. Two models may be used in these analyses. The first
16

is a 9 DOF model of a freight car with conventional roller bearing trucks. The1 second iVa',17'DOF model: of a rail :car with two generalized truck models.' In this latter' model,. the car body has l ateral ', yaw, and roll'degrees of freedom; each truck frame has lateral, yaw, and warp degrees of freedom; and., each wheel set has lateral and yaw degrees of freedom. Interconnected wheel sets and primary suspension elements may be easily considered with this model.The third approach utilizes the complete nonlinear equations of motion for the 9 DOF ■ freight car with roller bearing trucks. This analysis and program is the same one described previously for forced response and stability investigations.' It employs digital integration of the equations of motion and consequently is much more expensive computationally than either of the first two approaches. However, as large contact angles and a nonlinear creep force/creepage relationship are considered, this analysis may be used to predict wheel/ rail forces and L/V ratios under conditions of hard flanging. Consequently, this program may be of'greatest use in studies of wheel and rail wear and derailment. The results- of this program are in the form of time histories of the vehicle response variables such as displacement, accelerations, and forces between vehicle components and between wheel and rail. Curve entry and exit as well as curve negotiation may be investigated.It should be noted that while this latter model and analysis is quite detailed and entails considerable modeling fidelity, some factors that may be quite important in addressing questions such as derailment are not included. The most important of these are track flexibility and simultaneous two point wheel/rail contact for a given wheel..In summary, we have developed (or are in the,latter stages of developing) a range 'of''model s//and analyses for investigating curving:'behavior. The'first two of these are'-'inexpensive computationally and should be.of'particular use to the vehicle designer. The0third3model and analysis ’is expensive' computationally and is probably of most use in the latter steps of vehicle design or in studies of such phenomena as derailment and
wheel/rail wear.
VALIDATION TECHNIQUE Approach
Theoretical model validation may be undertaken at many different levels. At the lowest level, a qualitative correlation is obtained between theoretically predicted trends and experimentally observed behavior. For example, almost all linear stability analyses of rail car lateral dynamics predict that vehicles whose wheel sets have high "effective" coni cities will hunt at lower speeds than those with low "effective"
conicity wheel sets. This trend agrees with observations of rail vehicle operation.A great/deal of qualitative validation ■ ' has been done to strengthen confidence in the analytical1 tools. In stability analyses, { the effects of changes in. primary yaw and warp stiffness on critical hunting speeds 'have been qualitatively correlated. In curving' analyses, the effects of yaw stiffness and ’ ’ wheel set conicity on lateral to vertical force . ratios have also been qualitatively correlated.The value of qualitatively validated analyses should not be underestimated.- Such models are invaluable in making design changes and in devising successful experiments, because they ' provide information about the sensitivity of the vehicle behavior to parameter changes and also provide a framework for interpreting and understanding the test results.A second level of validation entails correlation of a single, usually critical, vailue from' the analysis with experimental results. For J. example, the analytical predictions for the " critical speed when hunting begins or the resonant speed for-rock and roll behavior would be com-; pared with experimental measurements of the same variable.Too much validation of this sort is done)This can be quite dangerous because it may lend false confidence to an analytical model. This is particularly true when those model parameters that cannot be measured are varied to obtain agreement between analysis and experiment. This second level of validation is generally of ' questionable value. It is far better to proceed, directly to a full validation of the type described below.The highest level of validation entails a fairly complete quantitative correlation of analytical and experimental results. A fre- , quently used approach is the direct comparison of experimental and analytical time histories of variables such as acceleration, displacement' or force level. Another possibility is the . .. comparison of power spectral density curves. 'A third possibility for validating stability analyses by comparing the variation of system damping ratios with speed is discussed in detail below.Because any mathematical model is only valid for a limited range-of conditions, the validation comparison need only cover the range of model validity. The most common limitation is a bound on the frequency range of the mathematical results. For example, most lateral rail vehicle dynamic analyses are not valid beyond 20 Hz, and many are not valid above 10 Hz. Other limitations may concern the amplitudes of the motions (to avoid suspension or wheel tread nonlinearities), the type of car body, the type of wheel tread, or the nature of the track irregularities.This highest level of validation is necessary before one can rely on the quantitative results
17

of a mathematical analysis. Our objective, in this project, is to achieve a quantitative validation of theoretical analyses for hunting stability, forced response, and curving behavior. To our knowledge, a quantitative validation of this type for the lateral dynamics of a rail vehicle has not been successfully completed. Our approach to each of these areas is briefly discussed below. A more detailed discussion of these matters is found in [19, 20, 21].Stability
Sustained hunting oscillations are one of the most important problems associated with freight car dynamic behavior. A major objective of this project is the development of mathematical models that will predict the speed at which sustained hunting oscillations occur, the influence of design changes on this speed, and the stability margin available at lower speeds.The rail freight car behavior at any speed can be loosely^) described as the
sum of motions in several different modes.Each mode is characterized by a particular frequency, damping ratio and mode shape, where the mode shape is a particular amplitude and phase relationship between the motions of the various system components. Terms such as upper center roll, lower center roll, nosing, and fish tailing are often used to describe such mode shapes.The stability of the freight car dynamic response is determined by the mode that has the least amount of damping. For a linear system, the response of any variable is mathematically expressed as,
m j_xi = I a ii e"^' % cos (“ i t + <f>i) 1 j=l 1J 3
where:n - number of state variables Cj - damping ratio for mode j coj - frequency of mode j conj - undamped frequency of mode j c()j - phase angle for mode j
Thus, a stable system will have £-,*.> 0 for all modes and an unstable system will have ^ < 0. The transient response of a motion for several different damping ratios is depicted in Figure 8.Validation of the mathematical analyses can be achieved by comparison of predicted and experimentally determined damping ratios, frequencies and mode shapes at several speeds. As shown in the analytical results for freight car behavior depicted in Figure 4, the damping ratio of the least damped mode varies with speed. The intersection of the damping ratio
curve with the horizontal axis occurs at the predicted critical speed of hunting.We attempted to obtain this system damping information from the field tests in two different ways. During certain test maneuvers, a hydraulic truck forcer system applied a torque between the truck and the car body. This system caused an initial translation and angular displacement of the truck components. The objective in using the forcer was to obtain transient response data that would provide damping ratio information of the type shown in Figure 4.This same system damping versus speed information is being extracted from the random
response tests on the tangent track using the random decrement technique. The random decrement technique, originally developed for aircraft flutter test analysis, [22], also provides a transient "signature," Figure 9 illustrates a random decrement signature obtained for the test vehicle at 15 mph. As one can see, the damping ratio and frequency can be determined directly from these signatures to produce an experimental curve of damping ratio versus speed such as that shown in Figure 10 for the test vehicle with CN Profile A wheels and constant contact side bearing. A least squares curve fit was used to match a damped sinusoidal response to the random decrement signature.Note that the 20 Hz noise caused by the motor- generator set on the instrumentation car may also be seen in the random decrement signature.To our knowledge, this is the first application of the random decrement technique for rail vehicle stability analysis.The validation process entails comparing analytically determined values for the damping ratio and speed such as those shown in Figure 4, with experimental results for the comparable configuration. We are now doing this.
Forced ResponseThe mechanics of validating the forced random response of a freight vehicle are simpler than stability or curving analysis validation. Previous studies have shown that response to specific track irregularities, such as low joints, [23] and response to vertical track irregularities [20], can be predicted fairly well by analytical means. For example, power spectral densities from experimental vertical acceleration measurement made in the TD0P tests [20] were compared with analytical computed PSD's. As seen in Figure 11 , quite good agreement was obtained, despite the nonlinear friction present in the system.Previous attempts to validate analyses for lateral response to random rail irregularities have not been very successful. The British Rail Research Center effort [24] attributed
( o\v 'This description is mathematically correct for linear systems, and can be used with caution for nonlinear systems such as the rail freight car.
18
their difficulties to three factors: 1) theuse of profiled wheels whose "effective" con- ici ty depended on the amplitude of the motion,2) the unknown level of the actual creep coefficients, and 3) the fact that the actual lateral input spectrum was not known because they did not measure the rolling line offset.The British researchers assumed the rolling line offset was equal in magnitude to the centerline alignment irregularity and adjusted the input spectrum accordingly. Effort was made in our project to avoid these difficulties by testing with conical as well as profiled wheels, measuring rail head profiles to assess rolling line offset, and devising tests to determine the actual creep coefficients.The shape of the least damped mode, and in some cases those of other modes can also be obtained from the forced response data. Cross-spectral densities used in conjunction with
PSD's provide transfer functions between variables that can be used to find the relative amplitudes and phases between the component motions.This provides additional information to strengthen confidence in the validity of the mathematical analysis.
Computer programs to carry out the data processing and reduction described here have been developed and Users' manuals [25] prepared. These will be turned over to the National Technical Information Service in the near future.In this project, an attempt will be made to validate the curving analysis described earlier. During the field tests, relative wheel/rail displacements were measured during curving for all test configurations. In addition, instrumented wheel sets were employed to obtain lateral and vertical wheel/rail forces in the two configurations with standard AAR new wheel profiles. The test vehicle was operated through two curves of different curvature at three different operating speeds.The validation will involve a comparison of predicted and measured wheel set lateral and yaw displacements for the various vehicle configurations and test conditions. Comparison with the steady state wheel/rail force data will be made, where possible.
Validation DiscussionOur estimate of the enormity of the task we set for ourselves has grown steadily over the course of the project. Perhaps the greatest problem faced in any validation study involves obtaining accurate data for the system parameters needed in the mathematical analysis. In this study, uncertainty over the creep coefficients and creep force laws governing the relationships between the wheel set motions and the contact forces causes the greatest difficulty. Our analytical studies demonstrate a strong dependence of vehicle stability on the creep coefficients. For example, in the unloaded, new wheel configuration, we found a variation from 44 mph to 80 mph in critical speed as the creep coefficients vary from 50% to 100% of the
values predicted by Kalker's theory. This sensitivity to creep coefficients was borne out by test experience. The new wheel configuration tested had instrumented wheels with new AAR profiles but a few thousand miles of running fitted in one truck, while the other truck was equipped with new wheels of the same profile with the casting scale intact. The truck with "run in" wheels began hunting around 55 mph while the other truck did not hunt until nearly 80 mph.A test maneuver employing the hydraulic forcer system was designed to extract independently the needed creep coefficient information. Unfortunately, shortcomings in the experimental procedures used in these creep tests rendered the data unusable. Thus the creep coefficients
must be extracted indirectly from the test results, a procedure that undermines our confidence in the validation results.Similar uncertainties exist in some of the vehicle parameters. Martin-Marietta [26] tested one of the two trucks actually used on the test vehicle, but some characteristics, such as the friction levels in the suspension, may differ between trucks and vary over time as surfaces wear and atmospheric conditions vary. An uncertainty also exists in the value of the extremely sensitive centerplate friction torque. This was not measured for these trucks, and consequently the actual friction values
are not known. An estimate based on tests conducted by ASF [27] was used in the analytical work.Lack of precise knowledge of the track data also poses difficulties for the validation effort.As explained in the next section, the track geometry data available to us is limited because of two accidents with the track measuring vehicles. In addition, we were able only to measure rail head profiles at a limited number of stations and hence can not construct a continuous estimate of rolling line offset.Perhaps the most difficult problem is caused by the nonlinearities in wheel/rail geometry and suspension. These nonlinearities due to curved wheel profiles, dry friction and suspension stops cause the vehicle dynamic response to depend on the amplitude of the motion. Because the amplitude depends on the imprecisely known track input, direct comparison of experimental and analytical results is difficult. Our validation effort attempts to avoid this as much as possible by comparing indirect attributes such as frequency, damping, etc.As in all activities, the validation process is better understood in hindsight than foresight. In particular, many aspects of the test conduct should have been done differently to produce better experimental data for the validation effort. As a result of shortcomings in the testing procedure certain vehicle parameters are not well known, the creep coefficients were not found, fewer non-hunting data points than desired were obtained, and the
19
transient response data from the hydraulic forcer exercises is limited. Thus, more estimation than we would like is involved in the validation process. However, we have redundancy in Qjr procedures and consequently have sufficient data to complete the validation process. Our experience should be invaluable in insuring that the next generation of validation tests will avoid these problems and provide a higher level of confidence in the validated models.
FREIGHT CAR FIELD TESTS
Test Description
The field tests to provide data for the validation effort were planned in cooperation with the Association of American Railroads and conducted by the Association of American Railroads and the Union Pacific Railroad. The tests were conducted during late fall and early winter of 1976-77 on the Union Pacific mainline west of Las Vegas. The test objectives, test philosophy and test requirements for these tests are discussed in detail in the program planning document [28].
The test vehicle, shown on the test site in Figure 12, was a Louisville and Nashville Railroad Company, 80 ton, open hopper equipped with 70 ton (6 X 11 journal) A-3 Ride Control trucks. The component characteristics of one of the trucks were determined in tests conducted by Martin-Marietta [26]. The field tests were conducted with the vehicle in the eight different configurations of wheel profile, load, side bearing pressure, track warp stiffness and centerplate condition shown in Table 2. As can be seen, the tests were conducted with the car in a range of conditions similar to those encountered in revenue service. Light and loaded vehicles, lubricated and dry centerplate, new AAR profile and Canadian National "Profile A"( ) wheels were variations to obtain data to determine whether the theoretical analyses predict the effects of such changes on vehicle dynamic performance. The truck warp stiffener and the constant contact side bearings with variable load were tested to investigate concepts that may improve vehicle dynamic behavior.
The test vehicle was equipped with the hydraulic truck forcing system, mentioned earlier, that exerted a torque between truck and car body. This system caused an initial translation and angular displacement of the truck components to provide a controllable initial condition and subsequent transient response.
The L & N Hopper car was instrumented by the AAR Research Center to measure 22 acceleration values, 49 displacement values, wheel/ rail forces for one truck set of the new wheels, and train speed. This instrumentation included 14 displacement transducers to measure the relative lateral and angular position of the wheel relative to the rail. This latter instru
mentation was developed by Reaction Instruments for the AAR.
The signals from the transducers were conditioned, digitized and recorded by the instrumentation system on board the AAR 100 Instrumentation car. The data was sampled at 100 samples/second and recorded on 1600 BPI magnetic tape. Header and trailer records on the tapes provide calibration and test conduct information.
The tests were conducted on both tangent and curved track sections on the Union Pacific Railroad. The AAR provided the test car, instrumentation car, test manager and test crew, while the motive power, caboose and train crew were provided by the Union Pacific Railroad.
The tangent test site was a 12,000 foot section of continuous welded rail on the Union Pacific mainline in the Mojave Desert between Yermo, California and Las Vegas, Nevada.Tangent tests for each configuration were conducted at four different speeds. In turn, both "unforced" and "forced" runs were made over the test zone at each speed. In the "forced" runs, the hydraulic forcer system was repetitively activated to cause an initial displacement and released to allow a transient motion.
The curving tests were conducted on Union Pacific track between Sloan and Arden, Nevada.The tests were run with each configuration at three speeds through a one degree and six degree curve.
The curved and tangent track geometry was measured by the Union Pacific track geometry car in the fall of 1974. Because of the long delay before carrying out the tests, attempts were made during and immediately after the testing period to resurvey the track with the FRA Track Measurement cars and the Track Survey Device. Both these attempts ended disasterously. The FRA cars were severely damaged in a derailment on the curve test site and the Track Survey Device was involved in a collision with a revenue train. The tangent test zone was finally remeasured by the Track Survey Device this fall. However, the curve test zone was reworked in the interim and consequently the information about track geometry during the tests was lost.
During the test period, the rail head geometry was measured at about 200 locations throughout the test zones. This information was processed to determine variation in wheel/rail geometry along,the track with both new AAR and CN Profile A wheels. The processed data for the variation in conicity, contact angle, etc., also provides an estimate of the rolling line offset and hence will premit the estimate of its influence on the vehicle dynamics.Tgl-----------v 'The CN Profile A wheels used in these tests
were developed by the Canadian National Railroad with the goal of achieving long tread life and good curving performance.
20

Data Processing and Reduction
The test data collected during the field tests nearly filled eleven reels of 1600 BPI magnetic tape. Table 3 summarizes the test conditions under which data was gathered.The first processing step entails reading the raw data tapes, converting to engineering units, combining channels to compute the desired model variables, computing desired statistics such as mean values, standard deviations, and histograms, and plotting the time histories of selected model variables. At present this process has been completed for the tangent tests with configurations 2, 3, 4, 6, 7 and 8.
A typical response of one truck to the hydraulic forcers is shown in Figure 13. Note that in some cases, insufficient time was left between turning the forcer off and turning it on to observe several cycles of the damped sinusoidal response. This problem was purely operational. The technique proved capable of providing the desired transient response information.
Figure 14 shows the Configuration 6 (CN Profile A Wheels) A-truck lateral displacement during the unforced tangent tests of 35 mph. Note here that hunting starts and stops during the test run at constant speed. This behavior, which has been observed by others, is probably due to either the amplitude dependence of stability for the nonlinear system or due to changes in the rail head or surface condition along the track.We are using our nonlinear analyses and rail head profile data to investigate these two possibilities.
The next step in data processing is to use the random decrement and spectral analysis programs to analyze the random data. Examples of the random decrement results have been discussed earlier. We had planned to extract damping ratio and frequency directly from the forcer test data. Unfortunately, usually too little time was left between forcer applications during testing so only a very few runs provided useful data for estimating damping ratio.
The power spectral densities have proven very useful. For example, Figure 15 shows a PSD for the A-Truck lateral displacement.Note that the least damped mode, at 1.4 Hz is easily identifiable as well as a lesser peak at the wheel revolution frequency, 8 Hz. We have found that damping ratio estimates obtained from these PSD's agree remarkably well with values obtained by the random decrement technique.
Additional processing to compute cross- spectral densities and transfer functions between variables is the last data processing step. This processing yields mode shapes, i.e., amplitude and phase relationships between component motions.
CURRENT STATUS AND SUMMARY
Completed Models
of all the models concerned with lateral stability, lateral forced response, and curving performance. These models are described in Table 1.
Completed Analyses and Computer Programs
We have completed development of all computer programs dealing with the linear and quasi-linear analysis of freight car stability as well as the hybrid computer program and digital computer program for the stability analysis of the 5 DOF model. A digital integration routine has been programmed for the response of the linear 9 DOF model to initial conditions. The programs for the linear and quasi-linear forced response of the 9 DOF model are also operational. The programs for the linear and nonlinear steady state curving performance of the 9 and 17 DOF models are complete. These calculate performance at given values of cant deficiency and track curvature. A search algorithm and accompanying subroutine for the calculation of slip and flange contact boundaries has been developed.
Supporting programs have been developed for use in calculating creep force/creepage relationships. Two programs have been developed to find: a) the linear creep coefficientsusing Kalker's linear theory, b) the nonlinear creep force/creepage relationships using Kalker's simplified theory [10].
Programs have also been developed to provide data concerning the wheel/rail geometric constraints. A hybrid computation procedure has been created to digitize accurately and quickly graphical wheel and rail profile data [6]. Two programs have been written to find the wheel/rail contact characteristics and resulting geometrical constraint relationships. One of these treats the case where both wheels and rails are mirror images of each other [4] while the other treats the general case where left and right wheel and/or rail profiles are arbitrary [5].
Efforts Underway
Work is underway on integrating the subroutine for calculating slip and flange contact boundaries into the programs for calculating both the linear and nonlinear steady state curving performance of the 9 and 17 DOF models. The digital integration program for calculating the stability, forced response, and curve entry and negotiation of the 9 DOF model is being developed.
Documentation on these various theoretical efforts is only partially complete. We plan to issue a report on the modeling and analysis for the linear studies of the stability and forced response of the 9 DOF model. The linear studies for steady state curving performance of the 9 and 17 DOF models will be included in this report. A second report will be issued describing the nonlinear studies of the stability, forced response, and curving behavior for the various models.
Briefly, we have completed the development 21
Validation Effort
The validation field tests have been completed and the raw test data, in the form of 22 data files on 11 magnetic digital tapes, has been received from the AAR. The AAR plans to prepare a report documenting the instrumentation and conduct of these field tests.
An array of computer programs has been prepared to process the test data. These programs include the following:
READAAR100 - reads the raw data tapes furnished by the AAR, converts the recorded signals from binary to engineering units, combines signals to form the model variables of the 9 and 19 degree of freedom models, prints header and trailer records, and writes processed data in disc files and on magnetic tape.
DATAPL0T - prepares CALC0MP plots of any data channel or model variable.
PSD - computes and plots any or all of the following functions: power spectral density,cross spectral density, auto correlation, cross-correlation, probability density, cumulative distribution, mean, standard deviation, transfer function and coherence.
RANDEC2 - finds a random decrement signature by prewhitening and averaging a series of time- domain data records, finds the least squares fit of a decaying sinusoid to the random decrement signature, prints the damping ratio and speed, and plots the random decrement signature and fitted curve.
DCOR - corrects the initial damping ratio estimate from RANDEC2 to compensate for speed variations during the tests. .
All of the tangent test data, 11 of the 22 files, has been processed by the AAR100 program. Random decrement signatures and PSD's have been computed for most of these cases.Data plots have been prepared for selected variables in all rdns. Thus, the tangent test data analysis is nearly complete.
The curving and creep test data has not been processed yet because position references for the wheel/rail displacements, needed to determine the actual wheel-to-rai1 positions, are not known. Due to. an oversight, the measurements made to fix these references during the tests were insufficient to completely determine the reference values for all the displacement transducers. We will attempt to reconstruct this missing reference information by statistical means. If successful, data plots and statistics for the component displacements during the creep and curving tests will be prepared.
Two informal reports on the test plans and validation procedures have been prepared [19, 28], and one interim report on validation techniques written [21]. Validation of the stability and forced response models is now underway. A report on the results of this
effort is planned for next spring. The validation of the curving model depends on the success of the attempt to fix the displacement transducer references.
Railroad Applications
To achieve maximum utility for application by the railroad industry, we are developing a variety of models, analyses, and computer programs for the analysis of the lateral dynamics of freight cars. This is necessary because there are many different kinds of questions asked by the industry that can be answered by such analyses. For example, to examine trends in performance with various design parameters, linear analyses are particularly attractive as much information can be obtained for modest computation costs. If a detailed examination of the effects-of parameters such as suspension friction, curved wheel profiles, or adhesion level is needed, nonlinear analyses should be used. The need for these in a particular instance should be established carefully as computation costs for nonlinear analyses can be high. As we have discussed, it is especially critical to use models with a) the smallest number of degrees of freedom necessary to describe adequately the behavior being investigated, and b) high modeling and analysis fidelity for phenomena that are expected to influence strongly the behavior. (Typical of these are wheel/rail interaction effects and suspension friction.) The first condition is necessary because computation costs increase extremely rapidly with the number of degrees of freedom.
After analysis of the field test results is complete together with the validation of the various models, we will establish the range of applicability of each of the models. This is necessary because of the widely differing applications anticipated for such models and the wide range of associated computation costs.It would be a disservice to the industry to circulate only the most complex models and analyses because of the associated high computation costs and the high risk of "overkill" in using such models and analyses in many instances.
We have described briefly above initial studies that have been conducted to demonstrate the utility of the various models and analyses. These studies have treated questions associated with vehicle design as well as maintenance and operation. We anticipate that these models and analyses can be.used extensively by the railroad industry in a similar manner and that the types of questions addressed will be limited only by the imagination of the user.
As formal documentation of much of the modeling and analysis work has yet to be completed, there has been to date only limited distribution of the analyses and computer programs. Nevertheless, we have distributed informally the programs for the work on wheel/rail geometry, creep force/creepage characteristics, linear stability analyses, and quasi-linear analysis to researchers in the U.S.A., Canada,
22
and Europe. We have also made every attempt to communicate the results of our work to the rail engineering community through distribution of informal reports and presentations, formal presentations through the technical societies, and tutorials at the MIT Rail Vehicle Dynamics short courses in the summers of 1975 and 1976. In doing so, we have hoped to achieve the exchange of ideas and information (as well as obtain constructive criticism) between researchers and potential users that is so necessary to the eventual success of this work.
Recommendations
This effort has provided a great deal of knowledge that should be useful in future research-projects. We believe that the simpler of the models developed in this effort will prove adequate for most studies of stability and forced response. However, the presence of nonlinearities, particular dry friction, will probably necessitate use of quasi - linearization or direct integration solution techniques in one form or another. Additional work is needed to improve the computational efficiency of these techniques so that they can be widely used by the railroad industry. It appears that more detail is appropriate in modeling the regime of curving under hard flange contact and derailment. Rail flexibility, three dimensional geometry, and a nonlinear creep theory that accurately includes spin effects should be investigated for inclusion in such a model. Efficient solution techniques, to make solution of the nonlinear curving problems feasible for design work should also receive additional attention.
Several suggestions for future field testing are evident from our experience. First, the test operations team should include at all times someone familiar with the theory and intended use of the test data. This person should have immediate access to test data to enable him to judge the quality of the test data and make immediate suggestions for improving test procedures. If we had done this, most of our problems with insufficient data would have been eliminated. Second, the importance of vehicle and environmental characteristics should be emphasized. Too often this is overlooked in the pressure to get "test" data. Procedures to determine regularly friction and wheel condition are needed. A procedure similar to that attempted in our tests to determine creep force conditions by employing the hydraulic forcers should be developed further.
Several suggestions concerning test equipment emerged. Our experience has demonstrated that the forcer system can provide useful data, and that stability information can also be extracted from random response data by the random decrement technique. The wheel/rail displacement transducers provided very good data, and should be used whenever possible. However, the high degree of redundancy in the instrumentation on our test vehicle should
not be necessary in future tests. The wide differences in behavior between the two trucks do suggest the need to include instrumentation on both trucks.
New ground in model validation has been broken during this project. The random decrement technique has proven highly successful for assessing stability. This process could be incorporated into an onboard mini-computer to allow on-line assessment of stability margins.The forcer system proved capable of introducing controlled inputs, and would be extremely useful in testing to determine creep conditions. An assessment of the importance of rolling line offset will be made from the processed wheel and rail head data. We expect that careful track measurements, including wheel and rail head profile measurements are appropriate for future tests.
REFERENCES
1. Hedrick, J.K., Cooperrider, N.K. andE.H. Law, "The Application of Quasi- Linearization Techniques to Rail Vehicle Dynamic Analyses", Final Report for D0T-TSC-902, January, 1977.
2. Cooperrider, N.K., et. al., "The Application of Quasi-Linearization to the Predictionof Nonlinear Railway Vehicle Response", Proceedings of IUTAM Symposium on the Dynamics of Vehicles on Roads and on Railway Tracks, Delft, The Netherlands,August 1975, pp. 314-325.
3. Hull, R. and N.K. Cooperrider, "Influence of Nonlinear Wheel/Rail Contact Geometry on Stability of Rail Vehicles", ASME Journalof Engineering for Industry, Vol. 99, No-. 1, February 1977, pp. 172-185.
4. Cooperrider, N.K., et. al., "Analytical and Experimental Determination of Nonlinear Wheel/Rail Geometric Constraints", Report No. FRA-OR & D-76-244 (PB-25290),December 1975.
5. Heller, R. and N.K. Cooperrider, "Users' Manual for Asymmetric Wheel/Rail Contact Characterization Program", Interim Report for D0T-0S-40018, to be published September 1977.
6 . Tuten, J.M., "Interactive Computation Procedure for Digitizing Wheel and Rail Profile Data", Informal Report for D0T-0S- 40018, Department of Mechanical Engineering, Clemson University, June 4, 1976.
7. Hobbs, A.E.W., "A Survey of Creep", DYN/52, April 1967, British Railways Research Dept., Derby, England.
8 . Kalker, J.J., "Simplified Theory of Rolling Contact", Deft Progress Report, Series C: Mechanical and Aeronautical Engineering and Shipbuilding, 1 (1973), pp. 1-10.
23

9.
10.
11 .
12.
13.
14.
15.
16.
17.
18.
19.
20.
21 .
Kalker, J.J., "On the Rolling Contact Between Two Elastic Bodies in the Presence of Dry Friction", Ph.D. Thesis, Delft University of Technology, 1967.
Goree, J.G. and E.H. Law, "Users' Manual for Kalker's Simplified Nonlinear Creep Theory", Interim Report for D0T-0S-40018, to be published September 1977.
Gilchrist, A.O. and B.V. Brickie, "A Re- Examination of the Proneness to Derailment of a Railway Wheelset", J. Mech. Engr. Sci., Vol. 18, No. 3, 1976, pp. 131-141.
Hadden, J.A. and E.H. Law, "Effects of Truck Design on Hunting Stability of Railway Vehicles", ASME Journal of Engineering for Industry, Vol. 99, No. 1, February 1977, pp. 162-171.
Hadden, J.A., "The Effects of Truck Design and Component Flexibility on the Lateral Stability of Railway Freight Vehicles", M.S. Thesis, Dept of Mechanical Engineering, Clemson University, 1976.
Tuten, J.M., Law, E.H. and N.K. Cooperrider, "Lateral Stability of Freight Cars with Axles Having Different Wheel Profiles and Asymmetric Loading", to be published,August 1977.
Heller, R., Malstrom, C.W. and E.H. Law, "Hybrid Simulation of Rail Vehicle Lateral Dynamics", 1976, (accepted for publication in Simulation).
Heller, R. et. al., "Analog and Digital Computer Simulation of Coulomb Friction", Interim Report for D0T-0S-40018, to be Published September 1977.
22. Cole, Henry, A., Jr., "On Line Failure Measurement and Detection of Aerospace Structures by Random Decrement Signatures," NASA-TND-4503, 1968.
23. Weibe, D., "The Effects of Lateral Instability of High Center of Gravity Cars",ASME Trans., Vol. 90-B, No. 4, Nov. 1968, p. 462.
24. Anon., "A Comparison of Theoretical and Experimental Vehicle Behavior Using a2 Axled Special Vehicle," Report No. 2, Question Cl 16, Interaction Between Vehicle and Track, Utrecht, October 1972.
25. Fallon. W.J. Jr., "User's Manual, Random Data Analysis Programs," Arizona State Univ., Engineering Center Report No. ERC-R- 76010, April 1 , 1976.
26. Abbott, P., "Comparison of the Nonlinear Dynamic Characteristics of Barber S-2 and ASF Ride Control Freight Trucks," Martin- Marietta Corp., Report No. MCR-76-475, September 1976.
27. Orr, D.G., ed., "70 Ton Truck Component Data, Physical Restraints, Mechanical Properties, Damping Characteristics," Track-Train Dynamics Harmonic Roll Series, Vol. 2, 1974.
28. Cooperrider, N.K. and E.H. Law, "Program Plan for Field Test Validation of Lateral Freight Car Dynamic Analysis", Arizona State and Clemson Universities, July 5, 1974.
Newland, D.E., "Steering a Flexible Railway Truck on Curved Track," ASME Journal of Engineering for Industry, Vol. 9l , Series B, No. 3, August 1969, pp. 908-918.
Number of Degrees of Freedom
5*
T A B L E 1 - V E H I C L E M O D E L S
Description of Degrees of Freedom _
Half car model; one roller bearing truck with warp, yaw, and lateral DOF; half car body with lateral and roll DOF.
Boocock, D. "A Simplified Linear Analysis of the Steady-State Motion of Conventional and Cross-Braced Bogie Vehicles and Four- Wheelers on Curved Track", DYN 89, April 1968, British Railways Research Dept., Derby, England.
Cooperrider, N.K. and E.H. Law, "Validation Plan for Freight Car Dynamic Analysis", Arizona State and Clemson Universities,June 15, 1976.
Fallon, W.J. Jr. "An Investigation of Rail- car Model Validation," M.S. Thesis, Arizona State University, May 1977.
Fallon, W.J. Jr., N.K. Cooperrider and E.H. Law, "An Investigation of Techniques for Validation of Railcar Dynamic Analyses,"FRA Report, to be published, Nov. 1977.
9
n
17
19
23
Full car model; two roller bearing trucks with warp, yaw, and lateral DOF; car body with lateral, yaw and roll DOF.
Half car model; one generalized truck with lateral, yaw, and torsional DOF of each of two wheel sets as well as lateral, warp, and yaw DOF of the truck frame; half car body with lateral and roll DOF.
Full car model; two generalized trucks with lateral and yaw DOF of each of two wheelsets as well as lateral, warp, and yaw DOF of the truck frame; car body with lateral, yaw, and roll DOF.
Full car model; two generalized trucks with lateral and yaw DOF of each of two wheelsets as well as lateral, warp, and yaw DOF of the truck frame; car body with rigid body lateral, roll, and yaw DOF. The use of a two mass approximation to the car body permits a first approximation to flexible car body torsion and lateral bending thus giving the car body a total of 5 DOF.
Full car model; this model is identical to the 19 DOF model discussed above with the addition of an axle torsional degree of freedom for each of the four axles. The effects of independently rotating wheels or axle torsional flexibility may be examined with this model.
♦This model was developed in the early stages of the research when It was thought there was a possibility of performing tests with a similar physical configuration on the Japanese National Railways (JNR) roller rig.
24
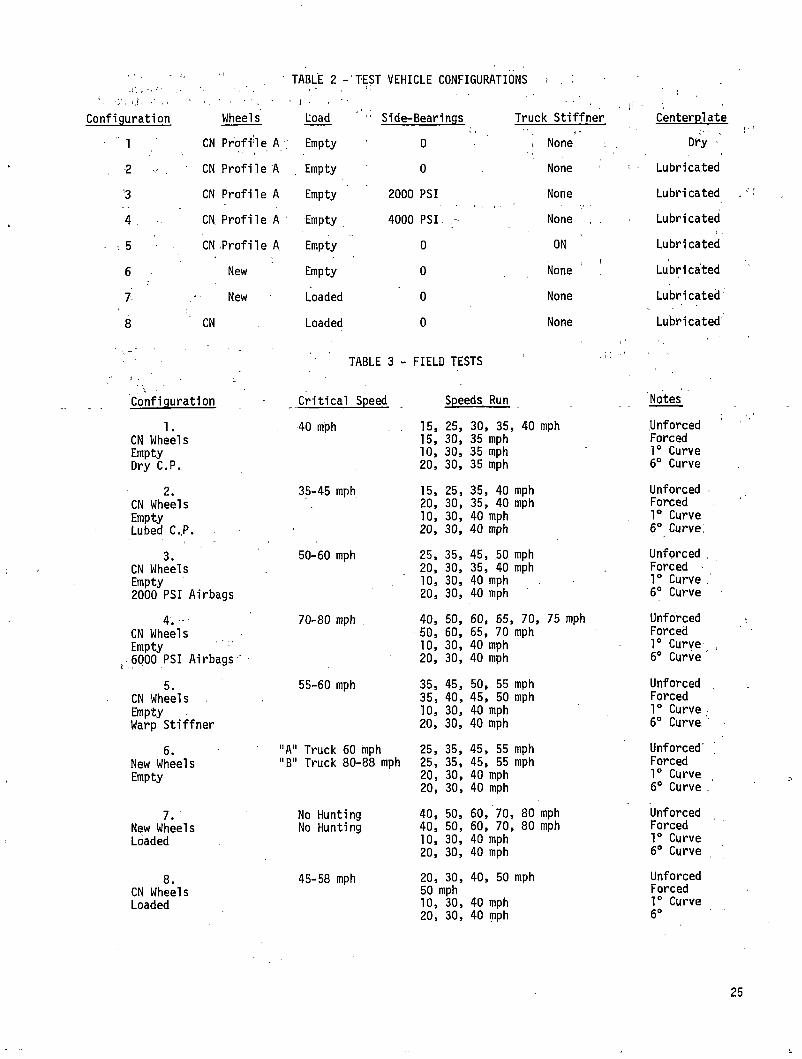
TA B L E 2 - T E S T V E H I C L E C O N F I G U R A T I O N S i
?C o n f i g u r a t i o n W h ee ls Load S i d e -B ea ri ng s T r u c k S t if fn er
1 CN P r o f i l e A Empty 0 . None
2 CN P r o f i l e A Empt y 0 None
'3 CN P r o f i l e A Empty 2000 PSI None
4 , ■ CN P r o f i l e A ' Em pt y 4 0 0 0 P S I . - N o ne , .
■ ■ . 5 CN P r o f i l e A Em pt y 0 ON
6 New Em pt y 0i
None
7 New Loaded 0 None
8 CN Loaded 0 None
T A B L E 3 - FIELD T E S T S; ;;
C o n f i g u r a t i o n Critical Speed Speeds Run
1. 40 mph 15, 25, 30, 35, 40 m p h
CN W h e e l s 15, 30, 35 m p h
Em p t y 10, 30, 35 m p h
D r y C.P. 20, 30, 35 m p h
2. 35 - 4 5 m p h 15, 25, 35, 40 m p h
CN W h e e l s 20, 30, 35, 40 m p h
E m p t y 10, 30, 40 mp h
Lu b e d C.,P. 20, 30, 4 0 m p h
3. 50-6 0 m p h 25, 35, 45, 50 m p h
CN W h e e l s 20, 30, 35, 40 m p h
Em p t y 10, 30, 40 mp h
2 0 0 0 PSI A i r b a g s 20, 30, 40 mp h
4 . - - 70 - 8 0 m p h 40, 50, 60, 65, 70, 75 m p h
CN W h e e l s 50, 60, 65, 70 m p h
E m p t y 10, 30, 40 m p h
6 0 0 0 PSI A i r b a g s 20, 30, 40 m p h
5. 55 - 6 0 mp h 35, 45, 50, 55 m p h
CN W h ee ls 35 , 40, 45, 50 m p h
Em p t y 10, 30, 40 m p h
W a r p S t i f f n e r 20, 30, 40 m p h
6. "A" T r u c k 60 m p h 25, 35, 45, 55 m p h
N e w W h ee ls "B" T r u c k 8 0 - 8 8 mph 25, 35, 45, 55 m p h
Em pt y 20, 30, 40 m p h20, 30, 40 mp h
7. No Hunting 40, 50, 60, 70, 80 mp h
N e w W h e e l s No Hunting 40, 50, 60, 70, 8 0 m p h
Lo aded 10, 30, 40 m p h20, 30, 40 m p h
8. 45 - 5 8 mph 20, 30, 40, 50 m p h
CN W h e e l s 50 mph
L o ad ed 10, 30, 40 m p h20, 30, 40 mp h
C e n t e r p l a t e
Dr y
Lu br i c a t e d
Lu br i c a t e d
L u b r i c a t e d
L u b r i c a t e d
L u b r i c a t e d
L u b r i c a t e d
L u b r i c a t e d
Notes
Un f o r c e d Forced 1° Curv e 6° Curv e
Un f o r c e d . Forced 1° Cu rv e 6° Curved
U n f o r c e d . F o rc ed - 1° Cu r v e ; 6° Cu rv e
U n fo rc ed Forced 1° C u r v e , 6° Cu r v e
U n fo rc ed Fo rc ed 1° Cu rv e 6° Cu r v e '
Unforced' Forced 1° Cu r v e , 6° Cu r v e .
Un f o r c e d Fo rc ed 1° Cu rv e 6° Cu r v e
Un f o r c e d Fo rc ed 1° Cu rv e 6°
25
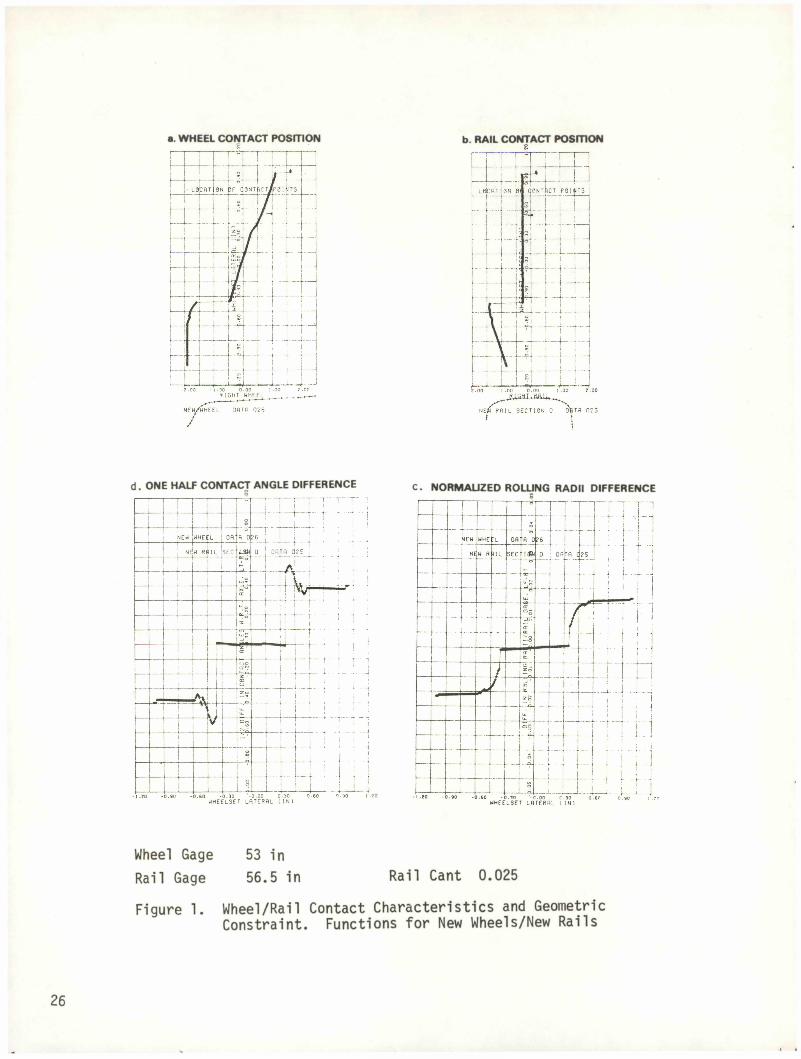
a. W H E E L CONTACT POSITION b. RAIL CONTACT POSITION
d . ONE HALF CONTACT ANGLE DIFFERENCE C. NORMALIZED ROLLING RADII DIFFERENCE
Wheel Gage 53 inRail Gage 56.5 in Rail Cant 0.025
Figure 1. Wheel/Rail Contact Characteristics and Geometric Constraint. Functions for New Wheels/New Rails
26
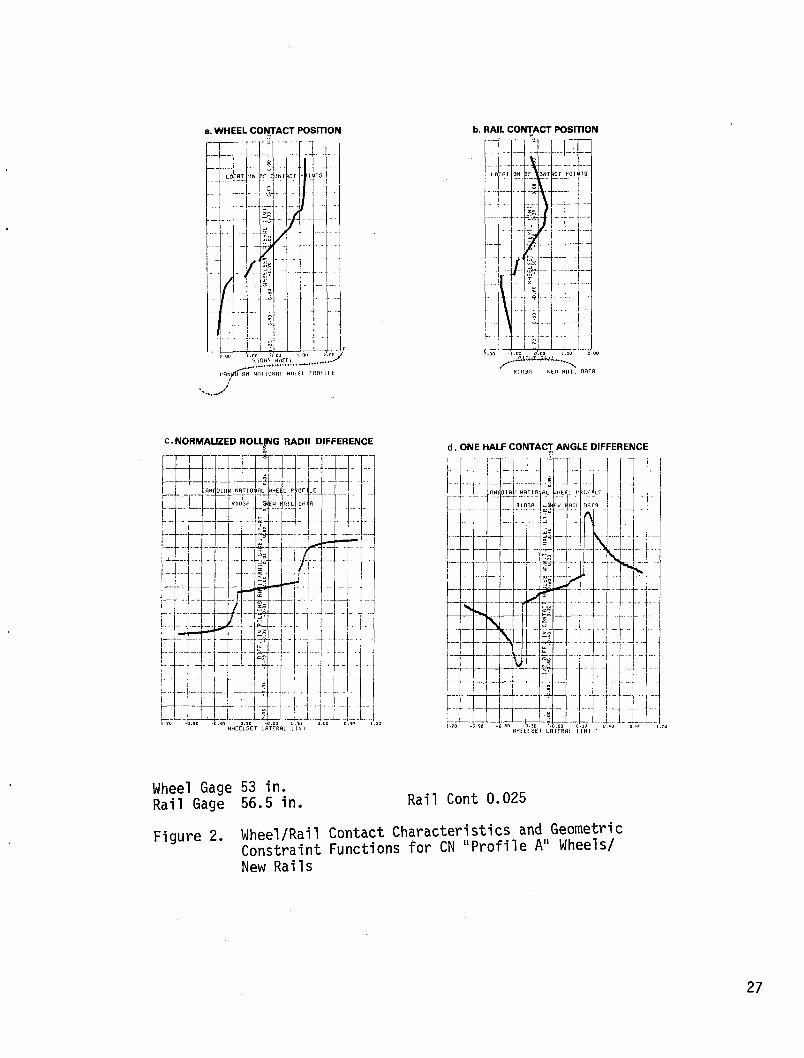
a. W H E E L C O N T A C T P O S I T I O N b . R A I L C O N T A C T P O S I T I O N
C . N O R M A L I Z E D R O L L J N G R A D I I D I F F E R E N C Ed . O N E H A L F C O N T A C T A N G L E D I F F E R E N C E
Wheel Gage 53 in. Rail Gage 56.5 in Rail Cont 0.025
Figure 2 Wheel/Rail Contact Characteristics and GeometricConstraint Functions for CN "Profile A" Wheels/New Rails
27
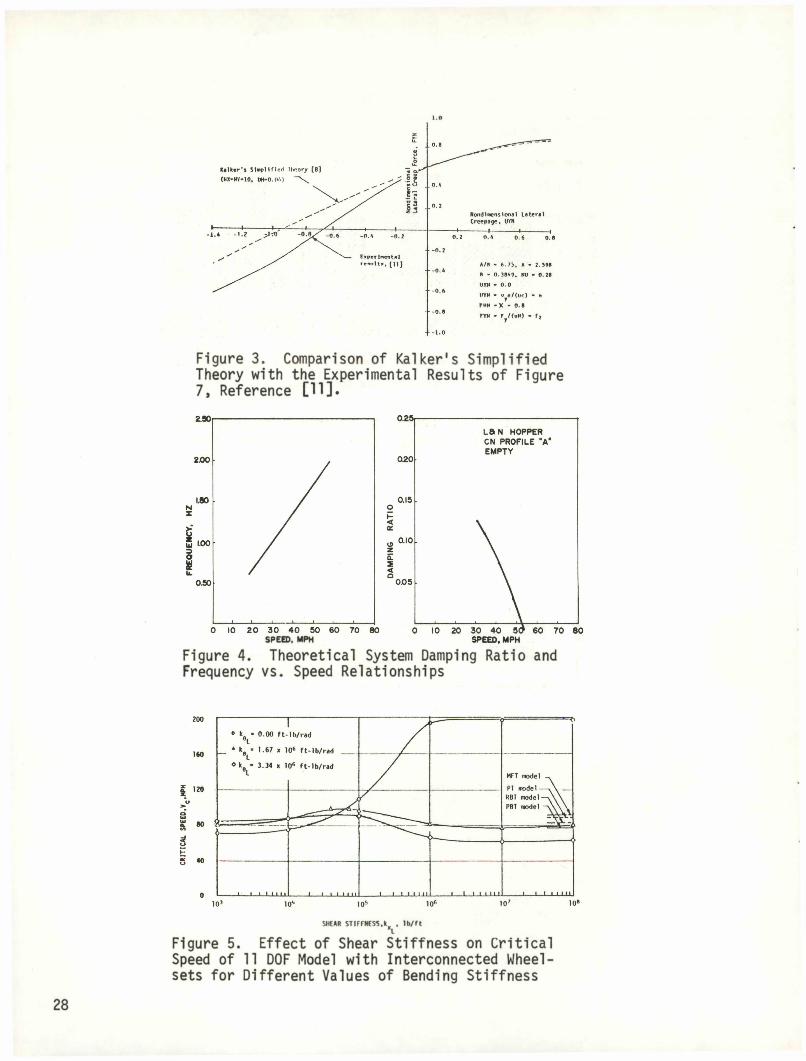
1.0
Figure 3. Comparison of Kalker's Simplified Theory with the Experimental Results of Figure 7, Reference [11].
Figure 4. Theoretical System Damping Ratio and Frequency vs. Speed Relationships
SHEAR STIFFNESS,k , lb/ft XLFigure 5. Effect of Shear Stiffness on Critical Speed of 11 DOF Model with Interconnected Wheel- sets for Different Values of Bending Stiffness
28
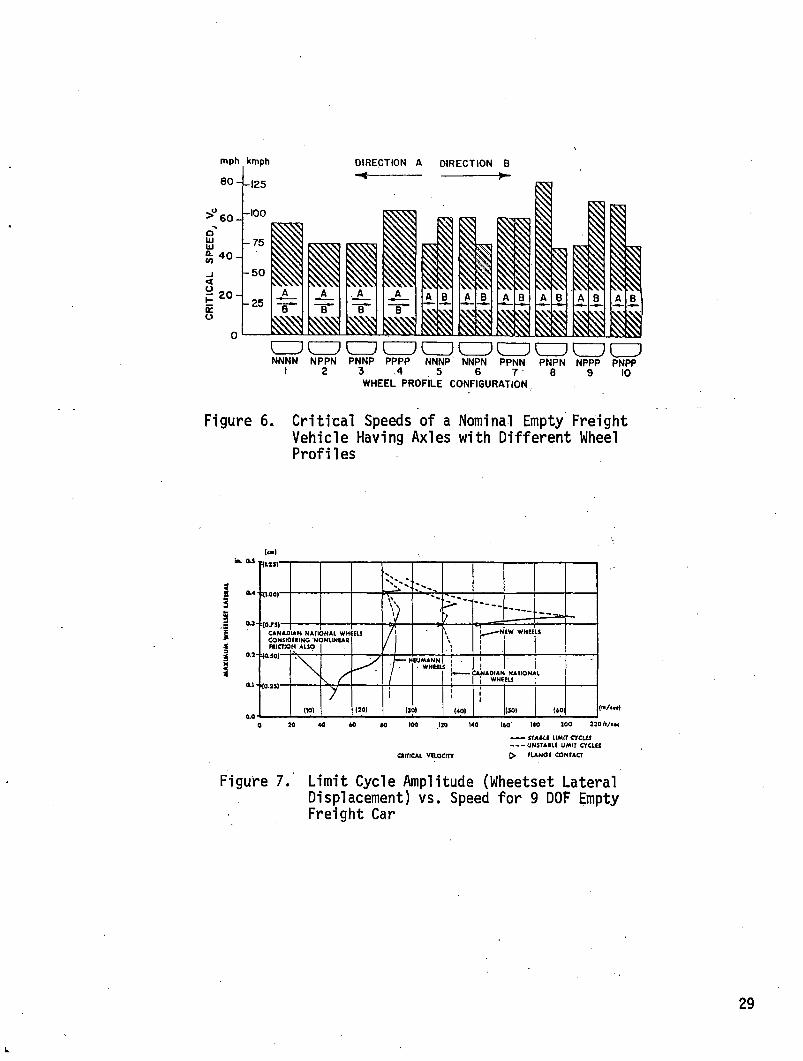
WHEEL PROFILE CONFIGURATION,
Figure 6. Critical Speeds of a Nominal Empty Freight Vehicle Having Axles with Different Wheel Profiles
(e-l
9CV — —• !{0.7S) CANAO CONSIC PIICT10
IAN NATI EXINO N< N ALSO3NAL WH 3NUNEARELS
i\\
er— — 1ii
£W WHEE.s
\r
EUMANN ■ WHEEL1 L_i
iilANAOIAN j WHENATION/ELS L
noi (20|t
(33)ii(401
. [--11
(■SOI (40)110 100
critical vaoemr
— STARLf LIMIT CYCLES - ...U N S T A B L E LIMIT CYCLES > F U N O I CONTACT
Figure 7. Limit Cycle Amplitude (Wheetset Lateral Displacement) vs. Speed for 9 DOF Empty Freight Car
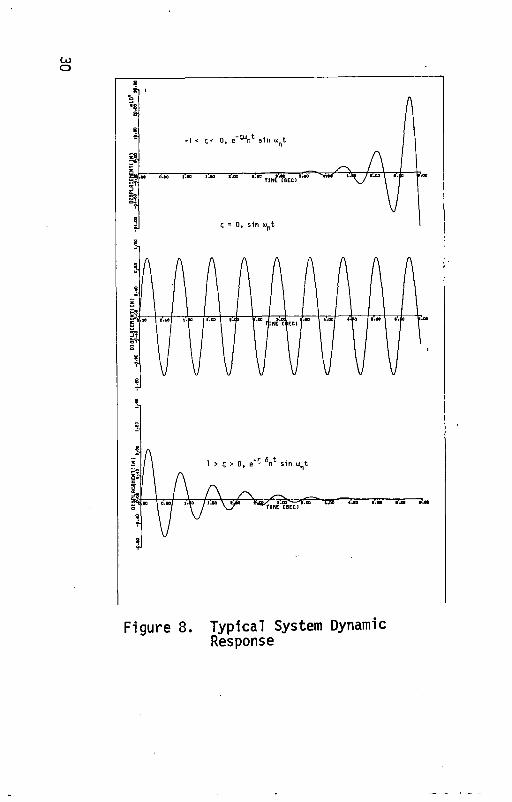
COo
F ig u re 8 . T y p ic a l System Dynamic Response
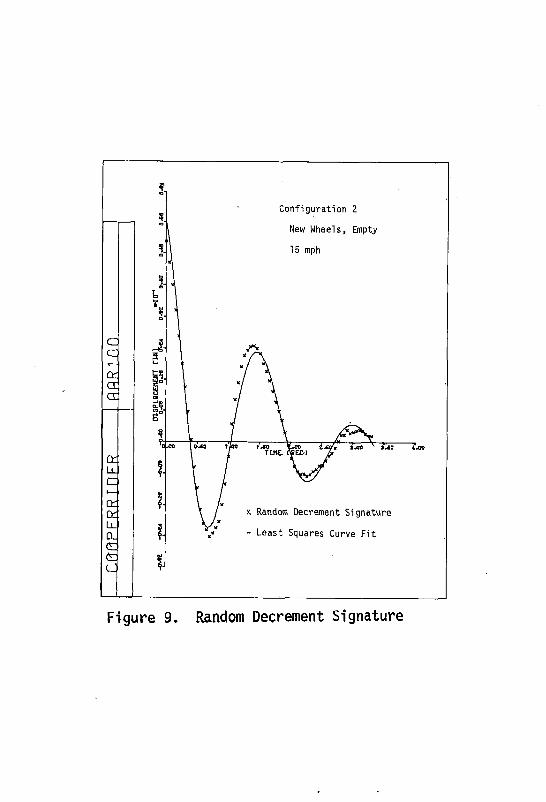
ccq:C E
a:Ll
cc Q: L l
C L
£
Figure 9. Random Decrement Signature

Speed Relationships
Figure 11. Freight Car Body Vertical Acceleration Spectra for Empty Vehicle at 100 ft/sec on CWR [20]
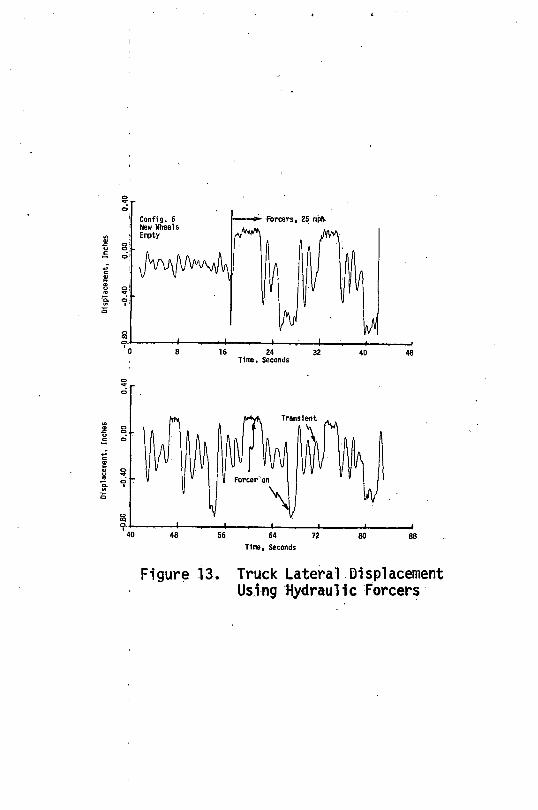
Displacement, Inches
Displacement, Inches
Figure 13. Truck Lateral Displacement Using Hydraulic Forcers
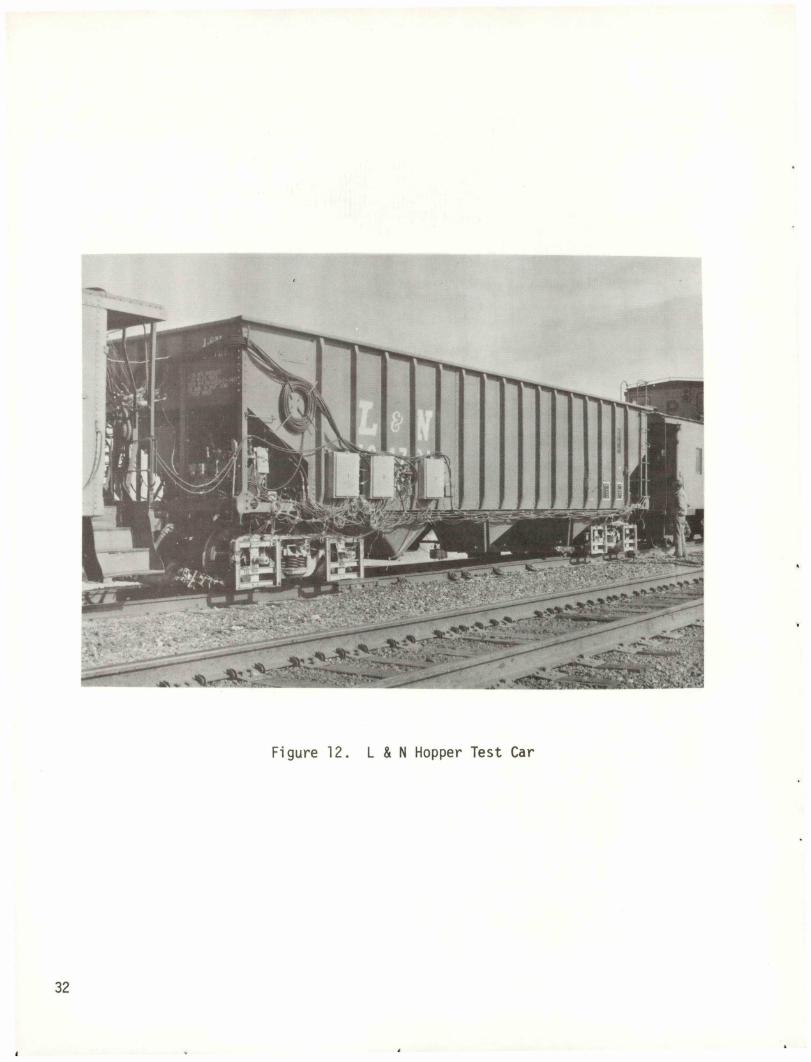
Figure 12. L & N Hopper Test Car
32
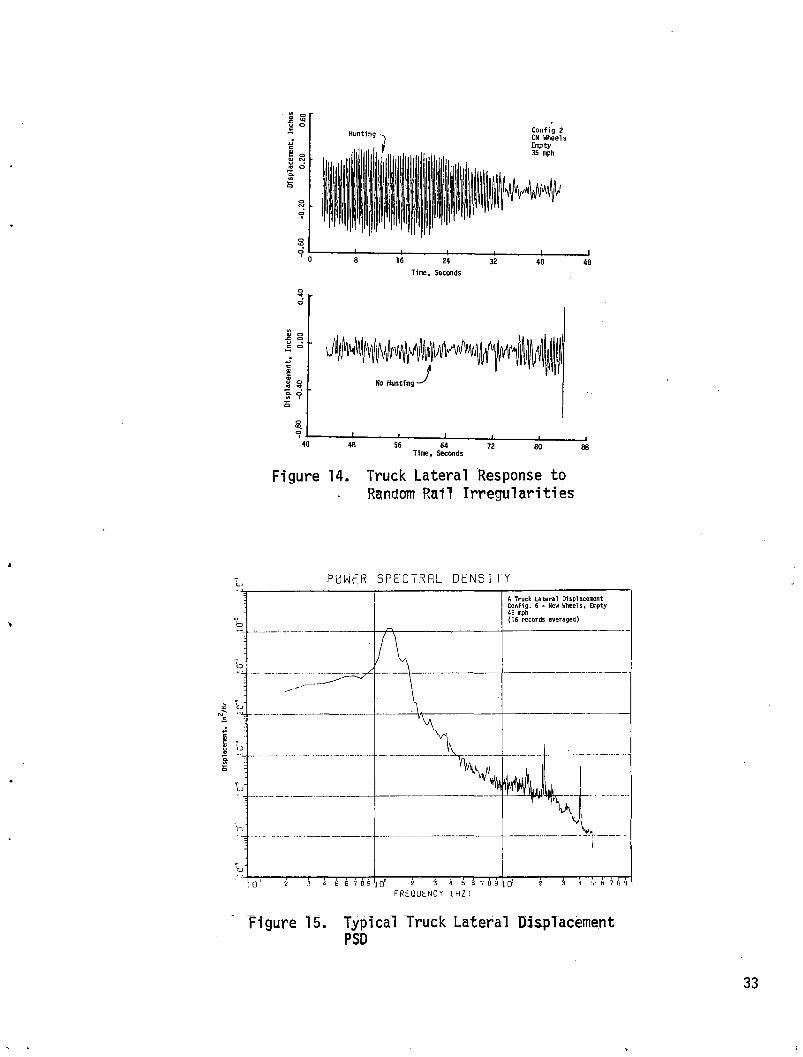
Displa
cement
, Irr/H
z
X. *
4----- 1-- --- 1-8 16 24
Time, Seconds
Config 2 CN Wheels Empty 35 mph
------- 1-- --- 132 40 48
48 56 64 72 80Time, Seconds
Figure 14. Truck Lateral Response to Random Rail Irregularities
POWER SPECTRAL DENSIFY
Figure 15. Typical Truck Lateral Displacement PSD
33
Intermodal Cars — New Developments
J. R. BLANCHFIELD
Research Manager, Intermodal Systems Office of Freight Systems Federal Railroad Administration Washington, D.C.
M. A. KENWORTHY
EngineerEngineering, Test, and Analysis Division of ENSCO, Inc. Alexandria, VA
ABSTRACT
Intennodal railcars used for ’’piggyback” trailer and container transportation are becoming the subject of increasing design interest. In response to increasing fuel costs and competitive pressures, a number of new car designs have been developed, some to the hardware stage. From the designs it is apparent that two common goals are the reduction of tare weight and aerodynamic drag. The ride quality and dynamic stability characteristics of lighter weight cars are key issues which are being investigated.This paper describes the features of several new intermodal railcar concepts. It also reports on a cooperative government industry test program designed to quantitatively define and measure the ride vibration characteristics of current and experimental intermodal flatcars. Under the program, the procedures, equipment and analytical techniques suitable for evaluating car performance under both controlled test and actual service conditions were developed and successfully employed. Preliminary results indicate that substantial weight reductions can be achieved without adversely affecting ride quality or dynamic stability.
INTRODUCTION
The objectives of this paper are to review developments in the area of intennodal railcar design which represent the beginning of a new cycle in the evolutionary process and to describe a method of testing and evaluating the dynamic performance of new car prototypes under actual service conditions.
CAR DESIGN OBJECTIVES
As the backbone of the intermodal hardware system the flatcar has become the subject of increasing design interest due to a number of trends. In combination, these trends have produced several distinct objectives for all new flatcars which are:
° Reduced train resistance
° Ability to carry 45 foot trailers
° Improved service capabilities
0 Reduced acquisition and maintenance costs
° Reduced man-machine interaction
° Reduced clearance requirements
The driving forces behind these objectives can be readily traced to:
° Increased fuel costs
° Shortages of motive power
° Increased cost of investment capital
° Tightened competition within and between modes
° Need to extend service in northeast metropolitan areas
Consideration of design changes is appropriate at this time because there is a need to produce new intermodal cars to replace those that have reached the end of their useful life and to provide the fleet expansion needed to handle an annual 10 to 12% growth rate in intermodal carloadings. A production rate of 6000 new cars a year may be necessary.
INTERMODAL IMPORTANCE
The importance of intermodal traffic to the railroads is based on its revenue potential. Shippers of high value manufactured goods pay the highest revenue rates, but they demand prompt, reliable damage free service in return. Dedicated, run-through intennodal trains appear to be the only way the railroads can meet the service requirements.
35
Such service is proving to be well worth the effort, for its revenues can assure the long term economic viability of the railroads. It is likely that within a few years many railroads will derive 20 percent or more of their total revenues from intermodal traffic. Recently it was reported that one major railroad has already attained the 25% mark. Noting that in terns of traffic volume, intermodal loads account for only 15% of the total shows that its revenue potential is remarkably high. As a result of its earning power the investment in new intermodal equipment appears attractive.The opportunity will soon exist to introduce designs that are better suited to the needs of the times. Although the design requirements have yet to be defined, and probably will not be until the Federal Railroad Administration (FRA) Intermodal Systems Engineering Program has been completed, a number of concepts have been formulated within the industry toward achieving the basic objectives cited above.
DESIGN CONSIDERATIONS
The design of an inteimodal car is a challenging task. The current car presents a deceptively simple image. It has been doing its job well for the past twenty years and when it is superseded the new equipment must be superior in meeting the needs of the industry.
Will the new design be evolutionary or revolutionary? For good reason the industry has been cautious and slow to accept revolutionary hardware. At the present time the new concepts being proposed range from alterations of the current design to radical new approaches to the idea of moving trailers and containers by rail.
In connection with FRA’s Intermodal Systems Engineering Program new ideas are being solicited for study and evaluation. Each will be subjected to a comprehensive assessment of its merits based on the interrelationships between the car and the other components in the intermodal system.
The systems aspect must be emphasized.In order for the railroads to benefit from the intermodal potential, the cost of providing the service must be minimized. A well-matched, efficient, and cost effective hardware system will be essential. Each element’s characteristics must be established in concert with those of the other equipment toward maximizing the system’s overall performance in terms of service and return on investment. This means that all the equipment, facilities and sub-systems used between the shipper’s and consignee’s loading docks must be considered. The intermodal rail car is certainly one of the major elements of the system. Typical considerations for a new intermodal car include:
° Size(s) of trailers/containers to be carried
° Number of loads per car
° Method of loading
° Tare weight per load
0 Aerodynamics (resistance and stability)
° Number of axles
° Ride quality and stability
0 Method of connection between cars
0 Vertical and lateral clearances
° Automation of load securement devices
° Cost of acquisition and maintenance
° Durability
° Compatibility
° Interchangeability
NEW CONCEPTS
A review of the proposed concepts has disclosed a variety of ideas concerning these design considerations. Variations in the ranking of priorities is apparent reflecting tradeoffs made by the respective designers. However, without commenting on each concept’s merits with respect to the design considerations, it is interesting to observe in what areas changes have been proposed in a few of the better known concepts.
The Santa Fe ’’Six Pack” concept utilizes articulated joints with 2 axle trucks at the five intermediate points of the six-unit car sets. This arrangement reduces by two thirds the number of couplers and brake reservoirs in a 60 trailer train. A box type structure serves as the longitudinal member and supports cantilevered aprons for the trailer wheels. The slenderness of the center structure allows it to be straddled by the landing legs of the trailers eliminating the need for their adjustment. Car section length will correspond to the length of trailer to be carried resulting in a minimal spacing between successive trailers and lower aerodynamic drag. Twenty eight inch diameter wheels contribute to a 16 inch reduction in vertical loaded height. Compared to conventional equipment, the Santa Fe design has achieved a weight reduction of 34%. The cars are intended only for captured service and require lift type loading capability at the terminals.
36
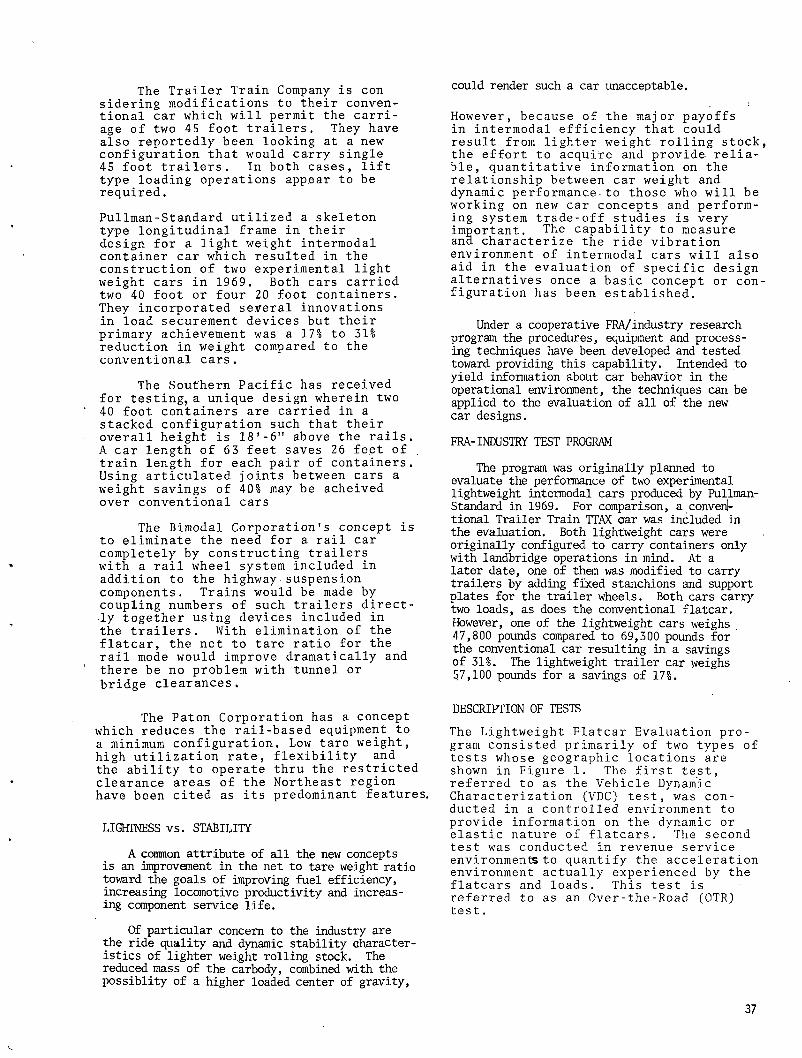
The Trailer Train Company is con sidering modifications to their conventional car which will permit the carriage of two 45 foot trailers. They have also reportedly been looking at a new configuration that would carry single 45 foot trailers. In both cases, lift type loading operations appear to be required.
Pullman-Standard utilized a skeleton type longitudinal frame in their design for a light weight intermodal container car which resulted in the construction of two experimental light weight cars in 1969. Both cars carried two 40 foot or four 20 foot containers.They incorporated several innovations in load securement devices but their primary achievement was a 171 to 31% reduction in weight compared to the conventional cars.
The Southern Pacific has received for testing, a unique design wherein two 40 foot containers are carried in a stacked configuration such that their overall height is 18’-6" above the rails.A car length of 63 feet saves 26 feet of train length for each pair of containers. Using articulated joints between cars a weight savings of 40% may be acheived over conventional cars
The Bimodal Corporation's concept is to eliminate the need for a rail car completely by constructing trailers with a rail wheel system included in addition to the highway suspension components. Trains would be made by coupling numbers of such trailers directly together using devices included in the trailers. With elimination of the flatcar, the net to tare ratio for the rail mode would improve dramatically and there be no problem with tunnel or bridge clearances.
The Paton Corporation has a concept which reduces the rail-based equipment to a minimum configuration. Low tare weight, high utilization rate, flexibility and the ability to operate thru the restricted clearance areas of the Northeast region have been cited as its predominant features.
LIGHTNESS vs. STABILITY
A common attribute of all the new concepts is an improvement in the net to tare weight ratio toward the goals of improving fuel efficiency, increasing locomotive productivity and increasing component service life.
Of particular concern to the industry are the ride quality and dynamic stability characteristics of lighter weight rolling stock. The reduced mass of the carbody, combined with the possiblity of a higher loaded center of gravity,
could render such a car unacceptable.
However, because of the major payoffs in intermodal efficiency that could result from lighter weight rolling stock the effort to acquire and provide reliable, quantitative information on the relationship between car weight and dynamic performance.to those who will be working on new car concepts and performing system trade-off studies is very important. The capability to measure ana characterize the ride vibration environment of intermodal cars will also aid in the evaluation of specific design alternatives once a basic concept or con figuration has been established.
Under a cooperative FRA/industry research program the procedures, equipment and processing techniques have been developed and tested toward providing this capability. Intended to yield information about car behavior in the operational environment, the techniques can be applied to the evaluation of all of the new car designs.
FRA-INDUSTRY TEST PROGRAM
The program was originally planned to evaluate the performance of two experimental lightweight intermodal cars produced by Pullman- Standard in 1969. For comparison, a convenl- tional Trailer Train TTAX car was included in the evaluation. Both lightweight cars were originally configured to carry containers only with landbridge operations in mind. At a later date, one of them was modified to carry trailers by adding fixed stanchions and support plates for the trailer wheels. Both cars carry two loads, as does the conventional flatcar. However, one of the lightweight cars weighs 47,800 pounds compared to 69,300 pounds for the conventional car resulting in a savings of 31%. The lightweight trailer car weighs 57,100 pounds for a savings of 17%.
DESCRIPTION OF TESTS
The Lightweight Flatcar Evaluation program consisted primarily of two types of tests whose geographic locations are shown in Figure 1. The first test, referred to as the Vehicle Dynamic Characterization (VDC) test, was conducted in a controlled environment to provide information on the dynamic or elastic nature of flatcars. The second test was conducted In revenue service environments to quantify the acceleration environment actually experienced by the flatcars and loads. This test is referred to as an Over-the-Road (OTR) test.
37

DESCRIPTION OF INSTRUMENTATION
Figure 1. Test Zone Locations
Signals recorded during the VDC and OTR tests consisted of speed, automatic location detection (ALD), and up to 120 accelerations. The latter of these required a number of ancillary components in addition to the accelerometer transducer as shown in Figure 2.
The test consist was comprised of the three instrumented test flatcars and the FRA/DOT Data Acquisition Vehicle T-5.The test vehicles included a conventional TTAX (973799) and two lightweight flatcars designed by Pullman-Standard. One lightweight flatcar (TLDX 62) was designed for container service only and the other (TLDX 61) was modified for trailer service only. The test matrix included empty, half loaded, and fully loaded configurations for both the VDC and OTR test series.
The VDC test was conducted on two test zones near La Junta, Colorado. The test zones were established on a 1 mile section of class 3 tangent track and a 3 mile section of class 5 tangent track. Accelerations were measured on the • vehicle and recorded at consist speeds of 10, 15, 20, 30, and 40 mph over the first test zone and at 40, 50, 60, 70, and 79 mph over the second zone.
The OTR test series was conducted on main line track between Argentine Yard, Kansas City, Missouri and Hobart Yard, Los Angeles, California. Data were recorded in twelve 10 mile test zones representing a cross section of track class and structures, and accelerations were measured and recorded while the consist was passing through these zones. During the OTR test, there was no control over consist speed, and as a result, speed varied from 20 to 79 mph during measurements. This method of testing includes the effects of train handling which were not included in the VDC test.
Figure 2. Schematic of Instrumentation and Recording System
For the purpose of this evaluation program 120 precision servo-accelerometers were mounted on the carbody, loads, and axle journal bearings of the three test flatcars. Accelerometers on the car and loads were Sg accelerometers while 30g accelerometers were used on the axles. An excitation voltage was supplied from T-5 and calibration signals were input at junction boxes located on each test vehicle.
Each accelerometer was mounted in a mechanical isolator for protection from high frequency accelerations of large amplitude present in the rail environment. Mismatched rail joints, for example, can produce impulses as large as a hundred g's. The isolators with a natural frequency of 150 Hz were designed to low pass accelerations. The signal from the accelerometer 'transducer was transmitted along the consist through a maximum of 250 feet of shielded cable in a current mode to avoid voltage drop due to line resistance.
In the Data Acquisition Car the signal was converted to a voltage. This signal was then filtered using a low pass single pole filter (-6dB/octave) with a corner frequency of 1.6 Hz. This filter is used to offset the effect of acceleration amplitude increasing with frequency and thereby produced an increase in the system resolution. Next the signal was anti-aliased using a 4-pole (-24dB/octave) Bessel filter with
38
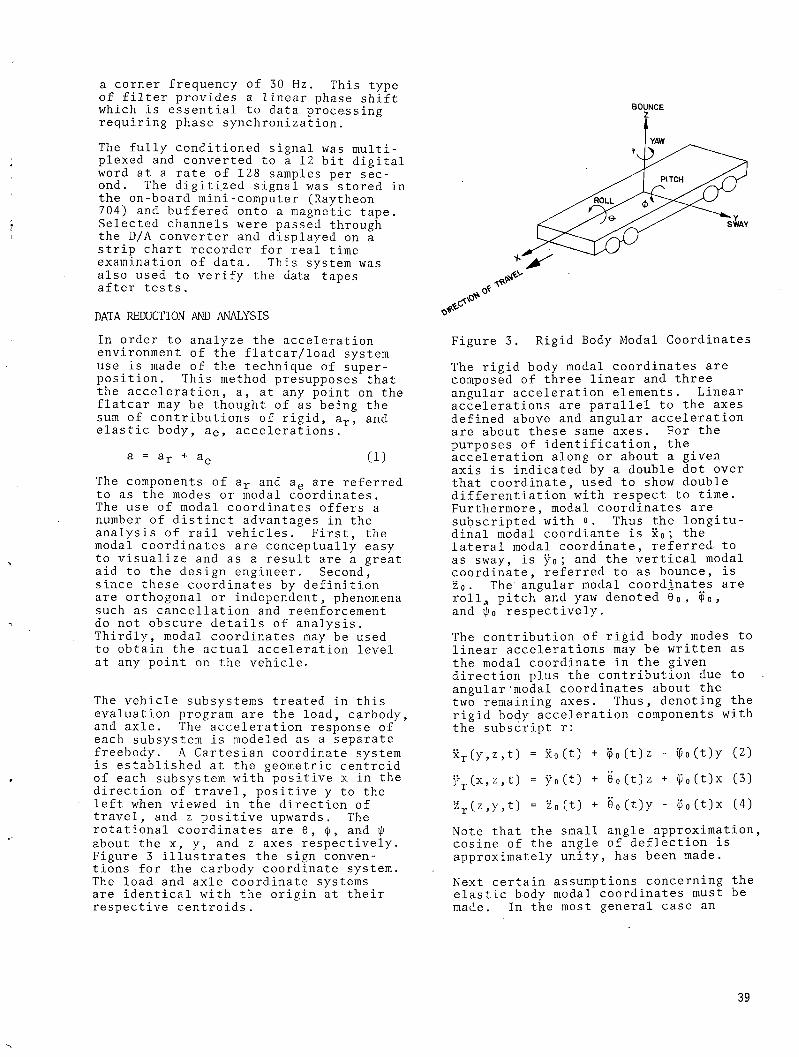
a corner frequency of 30 Hz. This type of filter provides a linear phase shift which is essential to data processing requiring phase synchronization.
The fully conditioned signal was multiplexed and converted to a 12 bit digital word at a rate of 128 samples per second. The digitized signal was stored in the on-board mini-computer (Raytheon 704) and buffered onto a magnetic tape. Selected channels were passed through the D/A converter and displayed on a strip chart recorder for real time examination of data. This system was also used to verify the data tapes after tests.
DATA REDUCTION AND ANALYSIS
In order to analyze the acceleration environment of the flatcar/load system use is made of the technique of superposition. This method presupposes that the acceleration, a, at any point on the flatcar may be thought of as being the sum of contributions of rigid, ar, and elastic body, ae, accelerations.
a = ar + ae (1)
The components of ar and ae are referred to as the modes or modal coordinates.The use of modal coordinates offers a number of distinct advantages in the analysis of rail vehicles. First, the modal coordinates are conceptually easy to visualize and as a result are a great aid to the design engineer. Second, since these coordinates by definition are orthogonal or independent, phenomena such as cancellation and reenforcement do not obscure details of analysis. Thirdly, modal coordinates may be used to obtain the actual acceleration level at any point on the vehicle.
The vehicle subsystems treated in this evaluation program are the load, carbody, and axle. The acceleration response of each subsystem is modeled as a separate freebody. A Cartesian coordinate system is established at the geometric centroid of each subsystem with positive x in the direction of travel, positive y to the left when viewed in the direction of travel, and z positive upwards. The rotational coordinates are 0, <j>, and ip about the x, y, and z axes respectively. Figure 3 illustrates the sign conventions for the carbody coordinate system. The load and axle coordinate systems are identical with the origin at their respective centroids.
BOUNCE
Figure 3. Rigid Body Modal Coordinates
The rigid body modal coordinates are composed of three linear and three angular acceleration elements. Linear accelerations are parallel to the axes defined above and angular acceleration are about these same axes. For the purposes of identification, the acceleration along or about a given axis is indicated by a double dot over that coordinate, used to show double differentiation with respect to time. Furthermore, modal coordinates are subscripted with °. Thus the longitudinal modal coordiante is x0; the lateral modal coordinate, referred to as sway, is y0; and the vertical modal coordinate, referred to as bounce, is z0. The angular modal coordinates are roll^ pitch and yaw denoted 0O, $o, and i(jo respectively.
The contribution of rigid body modes to linear accelerations may be written as the modal coordinate in the given direction plus the contribution due to angular'modal coordinates about the two remaining axes. Thus, denoting the rigid body acceleration components with the subscript r:
xr(y,z,t) = xo (t) + $0(t)z - i|jo(t)y (2)
yr(x,z,t) = yo(t) + e0(t)z + $o(t)x (3)
zr(z,y,t) = z0(t) + e0(t)y - $o(t)x (4)
Note that the small angle approximation, cosine of the angle of deflection is approximately unity, has been made.
Next certain assumptions concerning the elastic body modal coordinates must be made. In the most general case an
39
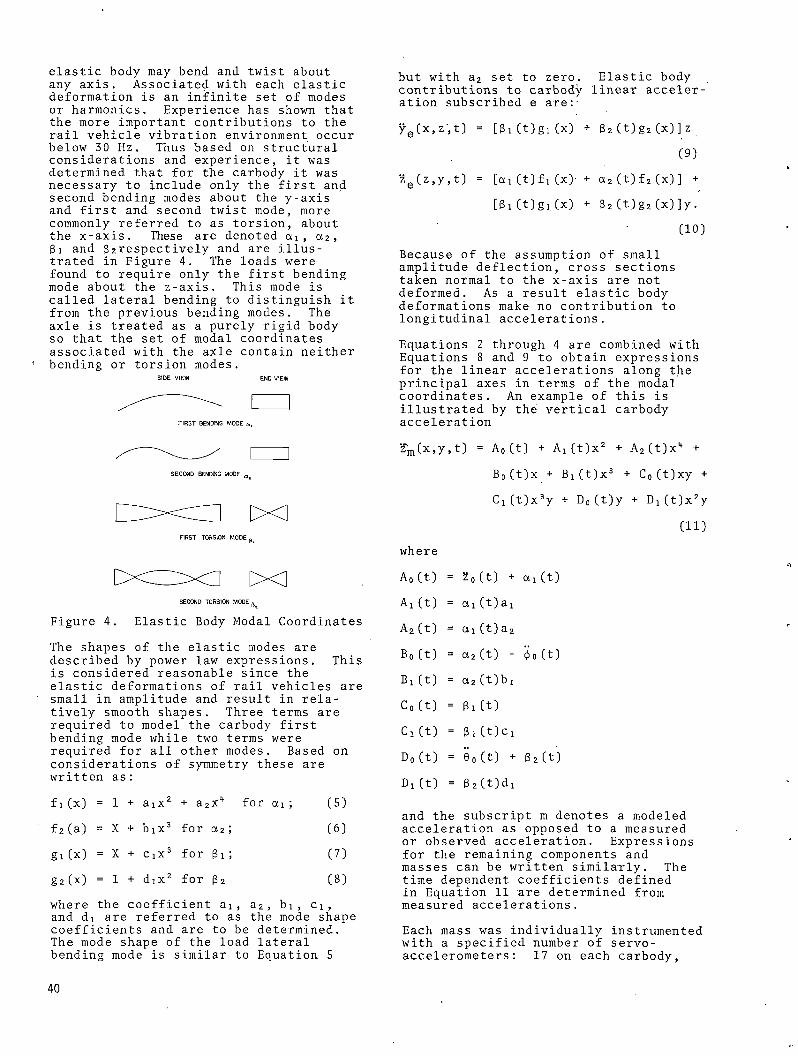
elastic body may bend and twist about any axis. Associated with each elastic deformation is an infinite set of modes or harmonics., Experience has shown that the more important contributions to the rail vehicle vibration environment occur below 30 Hz. Thus based on structural considerations and experience, it was determined that for the carbody it was necessary to include only the first and second bending modes about the y-axis and first and second twist mode, more commonly referred to as torsion, about the x-axis. These are denoted oti , a2 ,81 and (^respectively and are illustrated in Figure 4. The loads were found to require only the first bending mode about the z-axis. This mode is called lateral bending to distinguish it from the previous bending modes. The axle is treated as a purely rigid body so that the set of modal coordinates associated with the axle contain neither bending or torsion modes.
SIDE VIEW END VIEW
SECOND TORSION MODE
Figure 4. Elastic Body Modal Coordinates
The shapes of the elastic modes are described by power law expressions. This is considered reasonable since the elastic deformations of rail vehicles are small in amplitude and result in relatively smooth shapes. Three terms are required to model the carbody first bending mode while two terms were required for all other modes. Based on considerations of symmetry these are written as:
£1 (X) = 1 + aix2 + a2x't for on ; (5)
£2 (a) = X + b 1 x3 for a2; (6)
gi (x) = X + CiX3 for 31; (7)
g 2 (x) = 1 + dix2 for 3 2 (8)
where the coefficient ai, a2, bi, ci, and di are referred to as the mode shape coefficients and are to be determined. The mode shape of the load lateral bending mode is similar to Equation 5
but with a2 set to zero. Elastic body contributions to carbody linear acceleration subscribed e are:-
yeCx, z, t) = [3 1 (t)gi (x) + 82 (t) g2 (x) ] z
(9)
ze(z,y,t) = [on (t)fi(x) + a2(t)f2(x)] +
[31 (t)g! (x) + 82 (t)g2(x)]y.
(10)
Because of the assumption of small amplitude deflection, cross sections taken normal to the x-axis are not deformed. As a result elastic body deformations make no contribution to longitudinal accelerations.
Equations 2 through 4 are combined with Equations 8 and 9 to obtain expressions for the linear accelerations along the principal axes in terms of the modal coordinates. An example of this is illustrated by the vertical carbody acceleration
'fm (x,y,t) = A0 (t) + Aj (t)x2 + A2 (t)x1* +
B0(t)x + B!(t)x3 + C0(t)xy +
Ci(t)x3y + D0(t)y + Dj (t)x2y
(11)
z0(t) + ai(t)
on (t)aj
Ul (t)a2
ci2 (t) - $0 (t)
a 2(t)b 1
Bi (t)
61(t)ci
6o(t) + 32(t)
02 (l)d.i
subscript m denotes a modeled acceleration as opposed to a measured or observed acceleration. Expressions for the remaining components and masses can be written similarly. The time dependent coefficients defined in Equation 11 are determined from measured accelerations.
Each mass was individually instrumented with a specified number of servo- accelerometers: 17 on each carbody,
where
A0(t) =
Ai(t) =
A2(t) =
B0(t) =
Bi(t) =
C0(t) =
Ci(t) =
D0(t) =
Di(t) =
and the
40
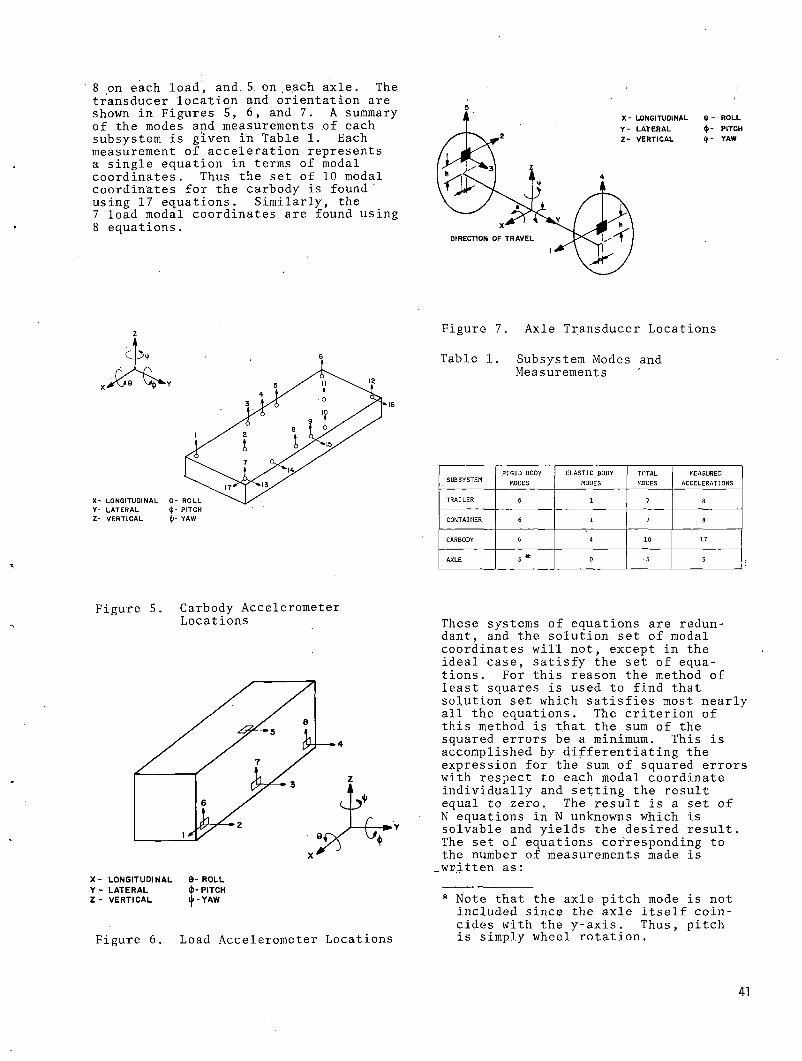
8 on each load', and. 5. on .each axle. The transducer location and orientation are shown in Figures 5, 6, and 7. A summary of the modes and measurements of each subsystem is given in Table 1. Each measurement of acceleration represents a single equation in terms of modal coordinates. Thus the set of 10 modal coordinates for the carbody is found ' using 17 equations. Similarly, the7 load modal coordinates are found using8 equations.
5
z
Z- VERTICAL l(l- YAW
Figure 7. Axle Transducer Locations
Table 1. Subsystem Modes and Measurements
SUBSYSTEM RIGID BODY MODES
ELASTIC BODY MODES
TOTALMODES
MEASURED'ACCELERATIONS
TRAILER 6 1 7 8CONTAINER 6 1 7 8CARBODY 6 4 10 17-AXLE 5 * 0 • s 5
Figure 5. Carbody Accelerometer Locations
X - LONGITUDINAL 0- ROLLY - LATERAL <t>- PITCHZ - VERTICAL iji - Y A W
Figure 6. Load Accelerometer Locations
These systems of equations are redundant, and the solution set of modal coordinates will not, except in the ideal case, satisfy the set of equations. For this reason the method of least squares is used to find that solution set which satisfies most nearly all the equations. The criterion of this method is that the sum of the squared errors be a minimum. This is accomplished by differentiating the expression for the sum of squared errors with respect to each modal coordinate individually and setting the result equal to zero. The result is a set of N equations in N unknowns which is solvable and yields the desired result. The set of equations corresponding to the number of measurements made is
.written as:
* Note that the axle pitch mode is not included since the axle itself coincides with the y-axis. Thus, pitch is simply wheel rotation.
41
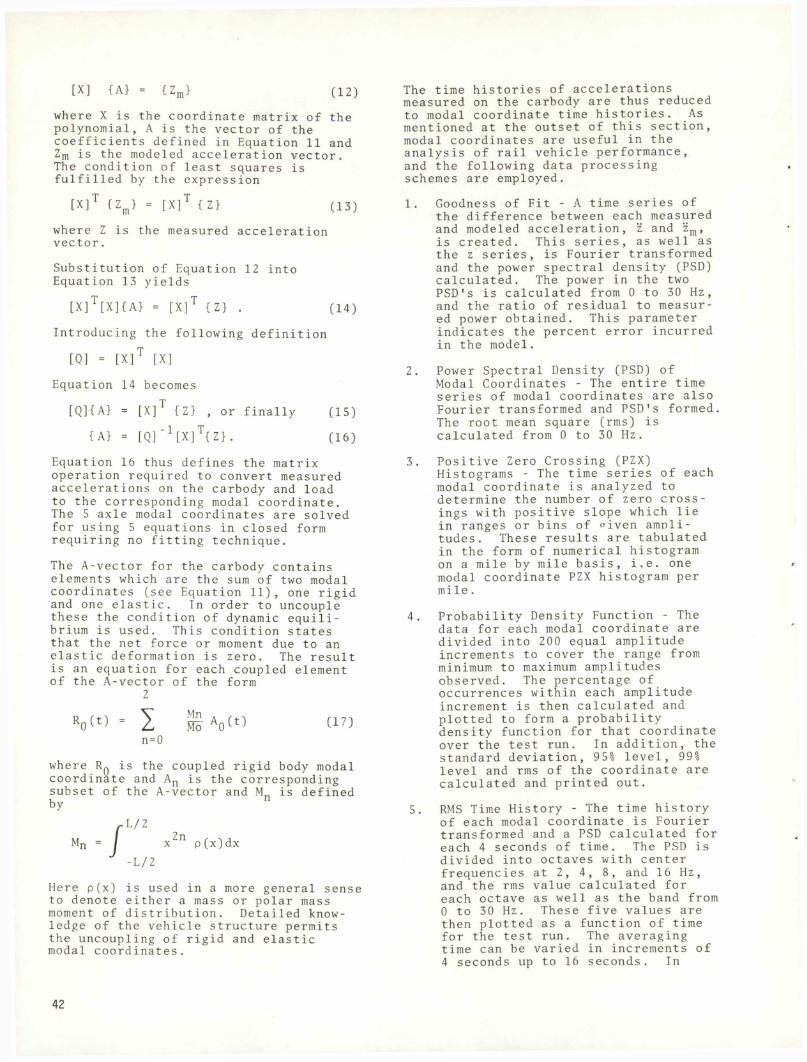
[X] {A} = {zm} (1 2 )
where X is the coordinate matrix of the polynomial, A is the vector of the coefficients defined in Equation 11 and Zm is the modeled acceleration vector. The condition of least squares is fulfilled by the expression
[X]T {Zm} = [X]T {Z} (13)
where Z is the measured acceleration vector.
Substitution of Equation 12 into Equation 13 yields
[X]T[X]{A} = [X]T {Z} . (14)
Introducing the following definition
[Q] = [X]T [X]
Equation 14 becomes
[Q]{A> = [Xp {Z} , or finally (15)
(A) = [Q] 1[x]T{Z) . (16)
Equation 16 thus defines the matrix operation required to convert measured accelerations on the carbody and load to the corresponding modal coordinate. The 5 axle modal coordinates are solved for using 5 equations in closed form requiring no fitting technique.
The A-vector for the carbody contains elements which are the sum of two modal coordinates (see Equation 11), one rigid and one elastic. In order to uncouple these the condition of dynamic equilibrium is used. This condition states that the net force or moment due to an elastic deformation is zero. The result is an equation for each coupled element of the A-vector of the form
2
i — - A ft) Mo A0UJn=0
where Rq is the coupled rigid body modal coordinate and An is the corresponding subset of the A-vector and M_ is defined by
/-L/2Mn = / *2n p(x)dx
J -L/2
Here p(x) is used in a more general sense to denote either a mass or polar mass moment of distribution. Detailed knowledge of the vehicle structure permits the uncoupling of rigid and elastic modal coordinates.
The time histories of accelerations measured on the carbody are thus reduced to modal coordinate time histories. As mentioned at the outset of this section, modal coordinates are useful in the analysis of rail vehicle performance, and the following data processing schemes are employed.
1. Goodness of Fit - A time series of the difference between each measured and modeled acceleration, z and zm , is created. This series, as well as the z series, is Fourier transformed and the power spectral density (PSD) calculated. The power in the two PSD’s is calculated from 0 to 30 Hz, and the ratio of residual to measured power obtained. This parameter indicates the percent error incurred in the model.
2. Power Spectral Density (PSD) of Modal Coordinates - The entire time series of modal coordinates are also Fourier transformed and PSD’s formed. The root mean square (rms) is calculated from 0 to 30 Hz.
3. Positive Zero Crossing (PZX) Histograms - The time series of each modal coordinate is analyzed to determine the number of zero crossings with positive slope which lie in ranges or bins of criven amplitudes. These results are tabulated in the form of numerical histogram on a mile by mile basis, i.e. one modal coordinate PZX histogram per mile.
4. Probability Density Function - The data for each modal coordinate are divided into 200 equal amplitude increments to cover the range from minimum to maximum amplitudes observed. The percentage of occurrences within each amplitude increment is then calculated and plotted to form a probability density function for that coordinate over the test run. In addition, the standard deviation, 95% level, 99% level and rms of the coordinate are calculated and printed out.
5. RMS Time History - The time history of each modal coordinate is Fourier transformed and a PSD calculated for each 4 seconds of time. The PSD is divided into octaves with center frequencies at 2, 4, 8, and 16 Hz, and the rms value calculated for each octave as well as the band from 0 to 30 Hz. These five values are then plotted as a function of time for the test run. The averaging time can be varied in increments of 4 seconds up to 16 seconds. In
42
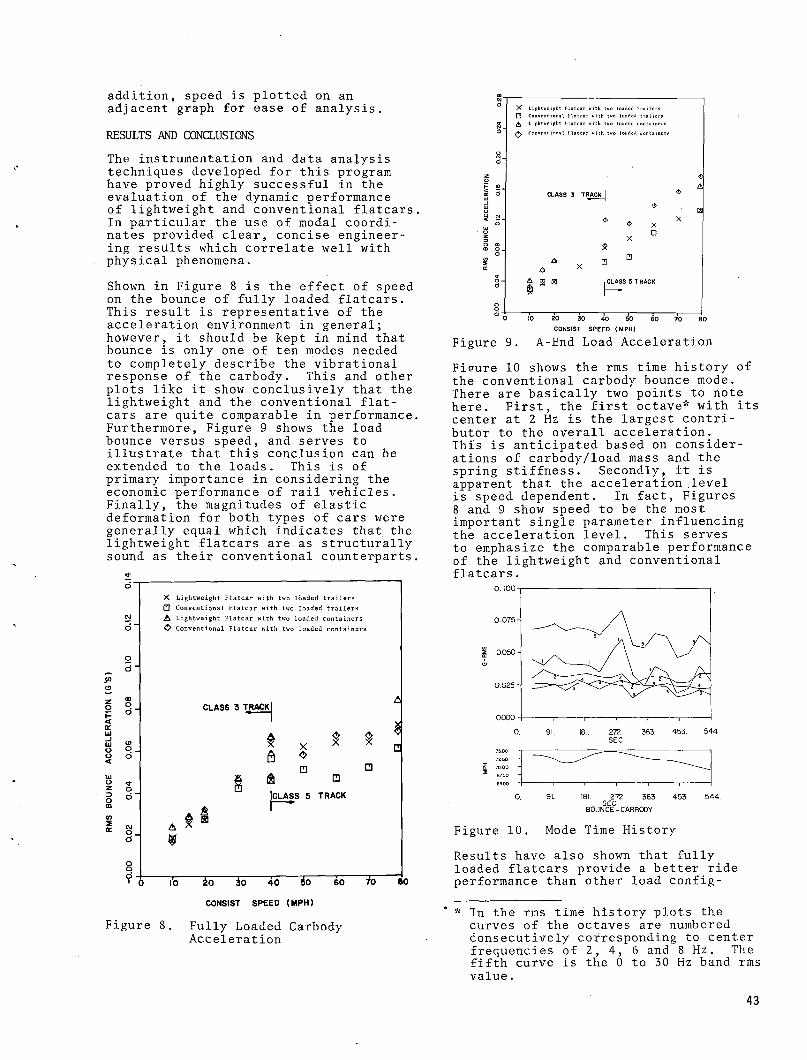
addition, speed is plotted on an adjacent graph for ease of analysis.
RESULTS AND CONCLUSIONS
The instrumentation and data analysis techniques developed for this program have proved highly successful in the evaluation of the dynamic performance of lightweight and conventional flatcars. In particular the use of modal coordinates provided clear, concise engineering results which correlate well with physical phenomena.
Shown in Figure 8 is the effect of speed on the bounce of fully loaded flatcars. This result is representative of the acceleration environment in general; however, it should be kept in mind that bounce is only one of ten modes needed to completely describe the vibrational response of the carbody. This and other plots like it show conclusively that the lightweight and the conventional flatcars are quite comparable in performance. Furthermore, Figure 9 shows the load bounce versus speed, and serves to illustrate that this conclusion can be extended to the loads. This is of primary importance in considering the economic performance of rail vehicles. Finally, the magnitudes of elastic deformation for both types of cars were generally equal which indicates that, the lightweight flatcars are as structurally sound as their conventional counterparts.
meoF<cc
oo<
o 6 '
X Lightweight Flatcar with two loaded trailers a Conventional Flatcar with two loaded trailers A Lightweight Flatcar with two loaded containers O Conventional Flatcar with two loaded containers
CLASS 3 TRACK
ft X❖X oX
Q□ □
a □CLASS 5 TRACK
E
A $
o o d •
Figure
£o 5o 40 So 60~CONSIST SPEED (MPH)
Fully Loaded Carbody Acceleration
70 80
Figure 9. A-End Load Acceleration
Figure 10 shows the rms time history of the conventional carbody bounce mode. There are basically two points to note here. First, the first octave* with its center at 2 Hz is the largest contributor to the overall acceleration.This is anticipated based on considerations of carbody/load mass and the spring stiffness. Secondly, it is apparent that the acceleration level is speed dependent. In fact, Figures 8 and 9 show speed to be the most important single parameter influencing the acceleration level. This serves to emphasize the comparable performance of the lightweight and conventional flatcars.
0. 91. 181. 27Z 363. 453. 544.SEC
BOUNCE-CARBODY
Figure 10. Mode Time History
Results have also shown that fully loaded flatcars provide a better ride performance than other load config-
* In the rms time history plots the curves of the octaves are numbered consecutively corresponding to center frequencies of 2, 4, 6 and 8 Hz. The fifth curve is the 0 to 30 Hz band rms value.
43
urations. In particular, it was found that the trucks of the conventional flatcar carrying a single load had a tendency to go into a lateral oscillation or hunting mode. This in turn had an extremely adverse effect on the acceleration levels in the loads.
Finally, data has been obtained which characterize the vibrational environment of containers and trailers during revenue operation. This data should prove beneficial to both the shippers and the railroads in evaluating the use of this mode of freight transportation.
Testing will continue during the upcoming year to provide similar data at specified points in the mileage accumulation of the test cars. This will allow a determination of the effects of component wear on the ride performance of these cars. This information is vital to engineers who will be designing and evaluating the future generation of intermodal rail cars.
ACKNOWLEDGEMENTS
The authors wish to thank Mr. L. P. Greenfield and R. Brodeur of Trailer Train Co., Mr. J. A. Angold and Mr. S. Green of the Santa Fe Railway Co., Dr. W. P. Manos of Pullman-Standard,Mr. Robert A. Love and Mr. Garth Tennecut of American Steel Foundries, Mr. N. A. Morelia of National Castings Division of Midland Ross and Mr. Lorin Staten of the Transportation Test Center for their generous assistance in the conduct of this program. Dr. H. Weinstock of the Transportation Systems Center was instrumental in the formulation, planning and conduct of the program and his efforts deserve special recognition. Mr. Barney Ross of ENSCO, Inc. was responsible for coordinating and directing the data acquisition operations. He and the T-5 test personnel are to be thanked for their long hours and many miles of travel.
44
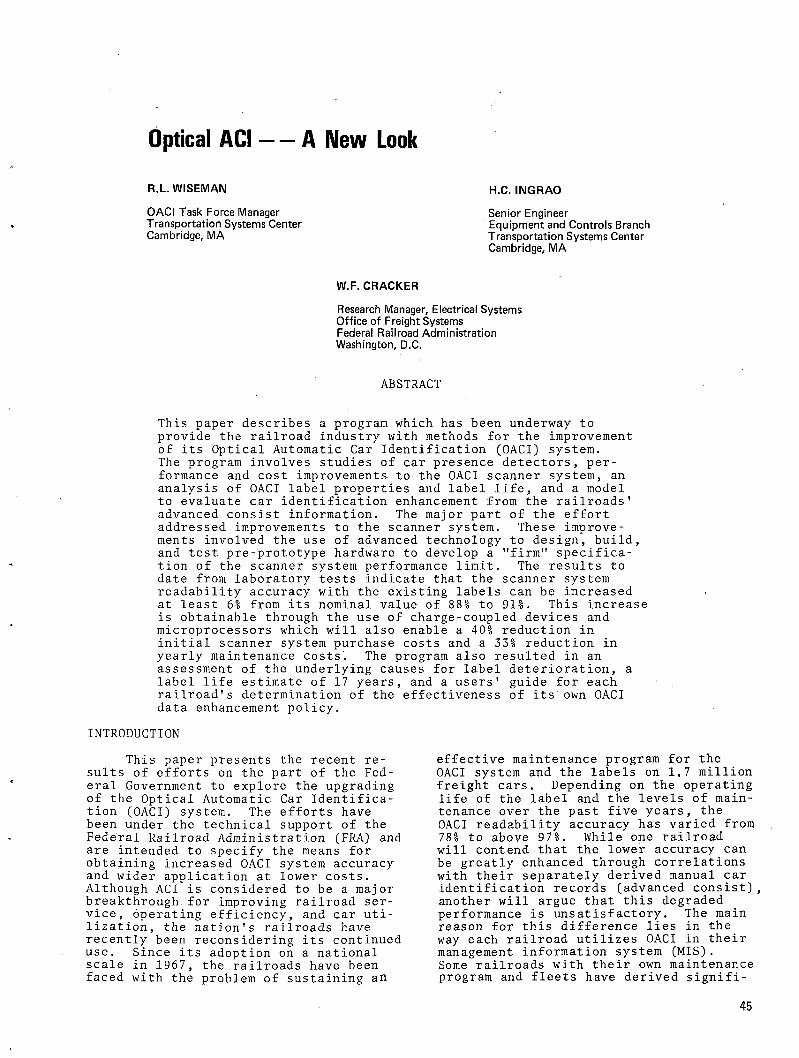
Optical ACI — A New Look
R.L. WISEMAN
OACI Task Force Manager Transportation Systems Center Cambridge, MA
H.C. INGRAOSenior EngineerEquipment and Controls Branch Transportation Systems Center Cambridge, MA
W.F. CRACKER
Research Manager, Electrical Systems Office of Freight Systems Federal Railroad Administration Washington, D.C.
ABSTRACT
This paper describes a program which has been underway to provide the railroad industry with methods for the improvement of its Optical Automatic Car Identification (OACI) system.The program involves studies of car presence detectors, performance and cost improvements to the OACI scanner system, an analysis of OACI label properties and label life, and a model to evaluate car identification enhancement from the railroads' advanced consist information. The major part of the effort addressed improvements to the scanner system. These improvements involved the use of advanced technology to design, build, and test pre-prototype hardware to develop a "firm" specification of the scanner system performance limit. The results to date from laboratory tests indicate that the scanner system readability accuracy with the existing labels can be increased at least 6% from its nominal value of 88% to 91%. This increase is obtainable through the use of charge - coupled devices and microprocessors which will also enable a 40% reduction in initial scanner system purchase costs and a 33% reduction in yearly maintenance costs. The program also resulted in an assessment of the underlying causes for label deterioration, a label life estimate of 17 years, and a users' guide for each railroad's determination of the effectiveness of its own OACI data enhancement policy.
INTRODUCTION
This paper presents the recent results of efforts on the part of the Federal Government to explore the upgrading of the Optical Automatic Car Identification (OACI) system. The efforts have been under the technical support of the Federal Railroad Administration (FRA) and are intended to specify the means for obtaining increased OACI system accuracy and wider application at lower costs. Although ACI is considered to be a major breakthrough for improving railroad service, operating efficiency, and car utilization, the nation's railroads have recently been reconsidering its continued use. Since its adoption on a national scale in 1967, the railroads have been faced with the problem of sustaining an
effective maintenance program for the OACI system and the labels on 1.7 million freight cars. Depending on the operating life of the label and the levels of maintenance over the past five years, the OACI readability accuracy has varied from 78% to above 97%. While one railroad will contend that the lower accuracy can be greatly enhanced through correlations with their separately derived manual car identification records (advanced consist) , another will argue that this degraded performance is unsatisfactory. The main reason for this difference lies in the way each railroad utilizes OACI in their management information system (MIS).Some railroads with their own maintenance program and fleets have derived signifi-
45
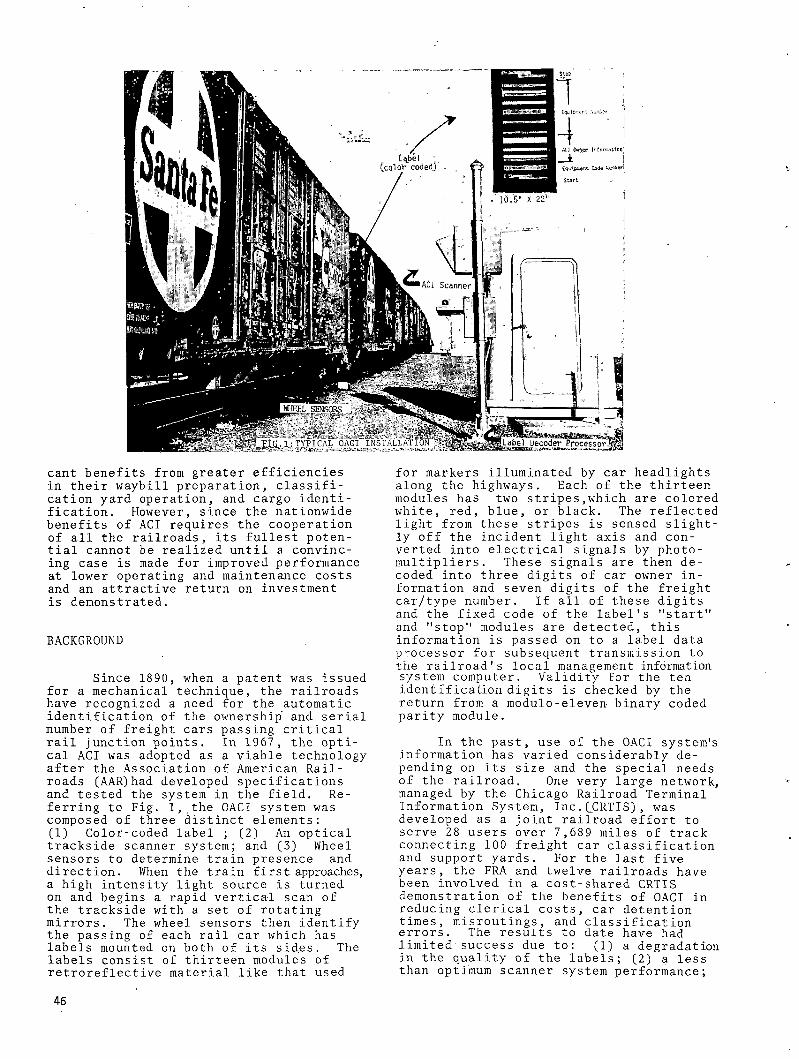
cant benefits from greater efficiencies in their waybill preparation, classification yard operation, and cargo identification. However, since the nationwide benefits of ACI requires the cooperation of all the railroads, its fullest potential cannot be realized until a convincing case is made for improved performance at lower operating and maintenance costs and an attractive return on investment is demonstrated.
BACKGROUND
Since 1890, when a patent was issued for a mechanical technique, the railroads have recognized a need for the automatic identification of the ownership' and serial number of freight cars passing critical rail junction points. In 1967, the optical ACI was adopted as a viable technology after the Association of American Railroads (AAR)had developed specifications and tested the system in the field. Referring to Fig. 1, the OACI system was composed of three distinct elements:(1) Color-coded label ; (2) An optical trackside scanner system; and (3) Wheel sensors to determine train presence and direction. When the train first approaches, a high intensity light source is turned on and begins a rapid vertical scan of the trackside with a set of rotating mirrors. The wheel sensors then identify the passing of each rail car which has labels mounted on both of its sides. The labels consist of thirteen modules of retroreflective material like that used
for markers illuminated by car headlights along the highways. Each of the thirteen modules has two stripes,which are colored white, red, blue, or black. The reflected light from these stripes is sensed slightly off the incident light axis and converted into electrical signals by photomultipliers. These signals are then decoded into three digits of car owner information and seven digits of the freight car/type number. If all of these digits and the fixed code of the label's "start" and "stop" modules are detected, this information is passed on to a label data processor for subsequent transmission to the railroad's local management information system computer. Validity for the ten identification digits is checked by the return from a modulo - eleven binary coded parity module.
In the past, use of the OACI system's information has varied considerably depending on its size and the special needs of the railroad. One very large network, managed by the Chicago Railroad Terminal Information System, Inc.CCRTIS), was developed as a joint railroad effort to serve 28 users over 7,689 miles of track connecting 100 freight car classification and support yards. For the last five years, the FRA and twelve railroads have been involved in a cost-shared CRTIS demonstration of the benefits of OACI in reducing clerical costs, car detention times, misroutings, and classification errors. The results to date have had limited success due to: (1) a degradationin the quality of the labels; (2) a less than optimum scanner system performance;
46
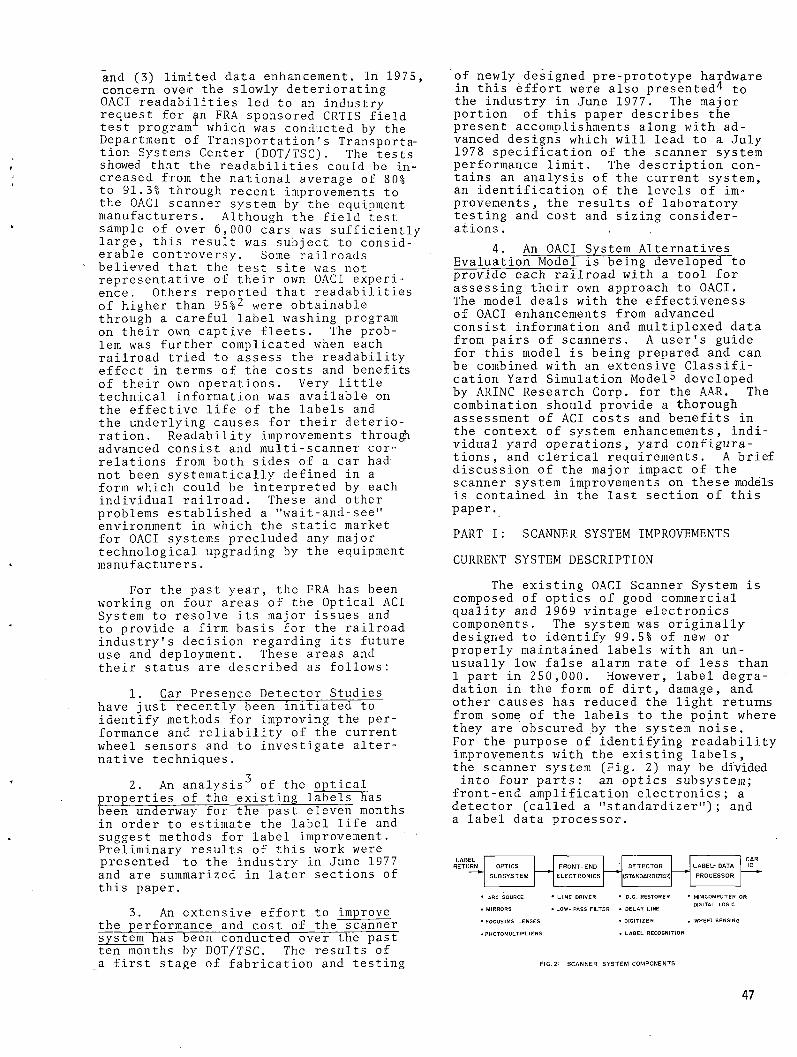
and (3) limited data enhancement. In 1975, concern over the slowly deteriorating OACI readabilities led to an industry request for an FRA sponsored CRTIS field test program1 which was conducted by the Department of Transportation's Transportation Systems Center (DOT/TSC). The tests showed that the readabilities could be increased from the national average of 80% to 91.31 through recent improvements to the OACI scanner system by the equipment manufacturers. Although the field test sample of over 6,000 cars was sufficiently large, this result was subject to considerable controversy. Some railroads believed that the test site was not representative of their own OACI experience. Others reported that readabilities of higher than 95%2 were obtainable through a careful label washing program on their own captive fleets. The problem was further complicated when each railroad tried to assess the readability effect in terms of the costs and benefits of their own operations. Very little technical information was available on the effective life of the labels and the underlying causes for their deterioration. Readability improvements through advanced consist and multi-scanner correlations from both sides of a car had not been systematically defined in a form which could be interpreted by each individual railroad. These and other problems established a "wait-and-see" environment in which the static market for OACI systems precluded any major technological upgrading by the equipment manufacturers.
For the past year, the FRA has been working on four areas of the Optical ACI System to resolve its major issues and to provide a firm basis for the railroad industry's decision regarding its future use and deployment. These areas and their status are described as follows:
1. Car Presence Detector Studies have just recently been initiated to identify methods for improving the performance and reliability of the current wheel sensors and to investigate alternative techniques.
32. An analysis of the optical
properties of the existing labels has been underway for the past eleven months in order to estimate the label life and suggest methods for label improvement. Preliminary results of this work were presented to the industry in June 1977 and are summarized in later sections of this paper.
3. An extensive effort to improve the performance and cost of the scanner system has been conducted over the past ten months by DOT/TSC. The results ofa first stage of fabrication and testing
of newly designed pre-prototype hardware in this effort were also presented^ to the industry in June 1977. The major portion of this paper describes the present accomplishments along with advanced designs which will lead to a July 1978 specification of the scanner system performance limit. The description contains an analysis of the current system, an identification of the levels of improvements, the results of laboratory testing and cost and sizing considerations.
4. An OACI System Alternatives Evaluation Model is being developed to provide each railroad with a tool for assessing their own approach to OACI.The model deals with the effectiveness of OACI enhancements from advanced consist information and multiplexed data from pairs of scanners. A user's guide for this model is being prepared and can be combined with an extensive Classification Yard Simulation Model^ developed by ARINC Research Corp. for the AAR. The combination should provide a thorough assessment of ACI costs and benefits in the context of system enhancements, individual yard operations, yard configurations, and clerical requirements. A brief discussion of the major impact of the scanner system improvements on these models is contained in the last section of this paper.
PART I: SCANNER SYSTEM IMPROVEMENTS
CURRENT SYSTEM DESCRIPTION
The existing OACI Scanner System is composed of optics of good commercial quality and 1969 vintage electronics components. The system was originally designed to identify 99.5% of new or properly maintained labels with an unusually low false alarm rate of less than 1 part in 250,000. However, label degradation in the form of dirt, damage, and other causes has reduced the light returns from some of the labels to the point where they are obscured by the system noise.For the purpose of identifying readability improvements with the existing labels, the scanner system (Fig. 2) may be divided into four parts: an optics subsystem;
front-end amplification electronics; a detector (called a "standardizer"); and a label data processor.
• ARC SOURCE • LINE DRIVER • D.C. RESTORER • MINICOMPUTER ORDIGITAL LOGIC• MIRRORS • LOW- PASS FILTER • DELAY LINE•FOCUSING LENSES •DIGITIZER . WHEELSENSING• PHOTOMULTIPLIERS • LABEL RECOGNITIONFIG. 2- SCAN N ER SY ST E M COMPONENTS
47
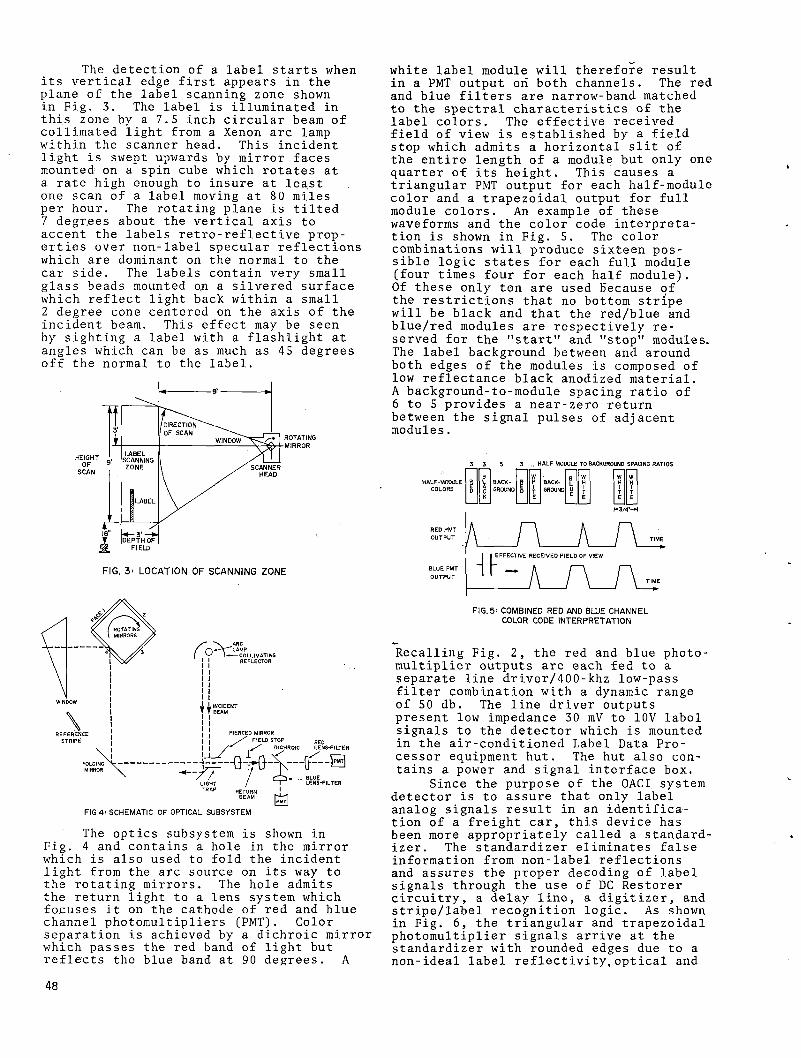
The detection of a label starts when its vertical edge first appears in the plane of the label scanning zone shown in Fig. 3. The label is illuminated in this zone by a 7.5 inch circular beam of collimated light from a Xenon arc lamp within the scanner head. This incident light is swept upwards by mirror faces mounted on a spin cube which rotates at a rate high enough to insure at least one scan of a label moving at 80 miles per hour. The rotating plane is tilted 7 degr.ees about the vertical axis to accent the labels retro-reflective properties over non-label specular reflections which are dominant on the normal to the car side. The labels contain very small glass beads mounted o.n a silvered surface which reflect light back within a small 2 degree cone centered on the axis of the incident beam. This effect may be seen by sighting a label with a flashlight at angles which can be as much as 45 degrees off the normal to the label.
FIG. 3' LOCATION OF SCANNING ZONE
r t
ARCLAMPCOLLIMATINGREFLECTOR
PIERCED MIRROR/ FIELD STOP RE0OICHROIC LENS-FILTER1/ / / CZ23-.- BLUELIGHT / LENS-FILTER
FIG 4 -SCHEMATIC OF OPTICAL SUBSYSTEM
The optics subsystem is shown in Fig. 4 and contains a hole in the mirror which is also used to fold the incident light from the arc source on its way to the rotating mirrors. The hole admits the return light to a lens system which focuses it on the cathode of red and blue channel photomultipliers (PMT). Color separation is achieved by a dichroic mirror which passes the red band of light but reflects the blue band at 90 degrees. A
white label module will therefore result in a PMT output on both channels. The red and blue filters are narrow-band matched to the spectral characteristics of the label colors. The effective received field of view is established by a field stop which admits a horizontal slit of the entire length of a module but only one quarter of its height. This causes a triangular PMT output for each half-module color and a trapezoidal output for full module colors. An example of these waveforms and the color code interpretation is shown in Fig. 5. The color combinations will produce sixteen possible logic states for each full module (four times four for each half module).Of these only ten are used because of the restrictions that no bottom stripe will be black and that the red/blue and blue/red modules are respectively reserved for the "start" and "stop" modules. The label background between and around both edges of the modules is composed of low reflectance black anodized material.A background-to-module spacing ratio of 6 to 5 provides a near-zero return between the signal pulses of adjacent modules.
3 3 5 3 ... HALF MODULE TO BACKGROUND SPACING RATIOSHALF-MODULE COLORS BACK- 8 GROUND o B W BACK- l H GROUND U {E F H3/4'-H
FIG.5' COMBINED RED AND BLUE CHANNEL COLOR CODE INTERPRETATION
Recalling Fig. 2, the red and blue photomultiplier outputs are each fed to a separate line driver/400-khz low-pass filter combination with a dynamic range of 50 db. The line driver outputs present low impedance 30 mV to 10V label signals to the detector which is mounted in the air-conditioned Label Data Processor equipment hut. The hut also contains a power and signal interface box.
Since the purpose of the OACI system detector is to assure that only label analog signals result in an identification of a freight car, this device has been more appropriately called a standard- izer. The standardizer eliminates false information from non-label reflections and assures the proper decoding of label signals through the use of DC Restorer circuitry, a delay line, a digitizer, and stripe/label recognition logic. As shown in Fig. 6, the triangular and trapezoidal photomultiplier signals arrive at the standardizer with rounded edges due to a non-ideal label reflectivity,optical and
48
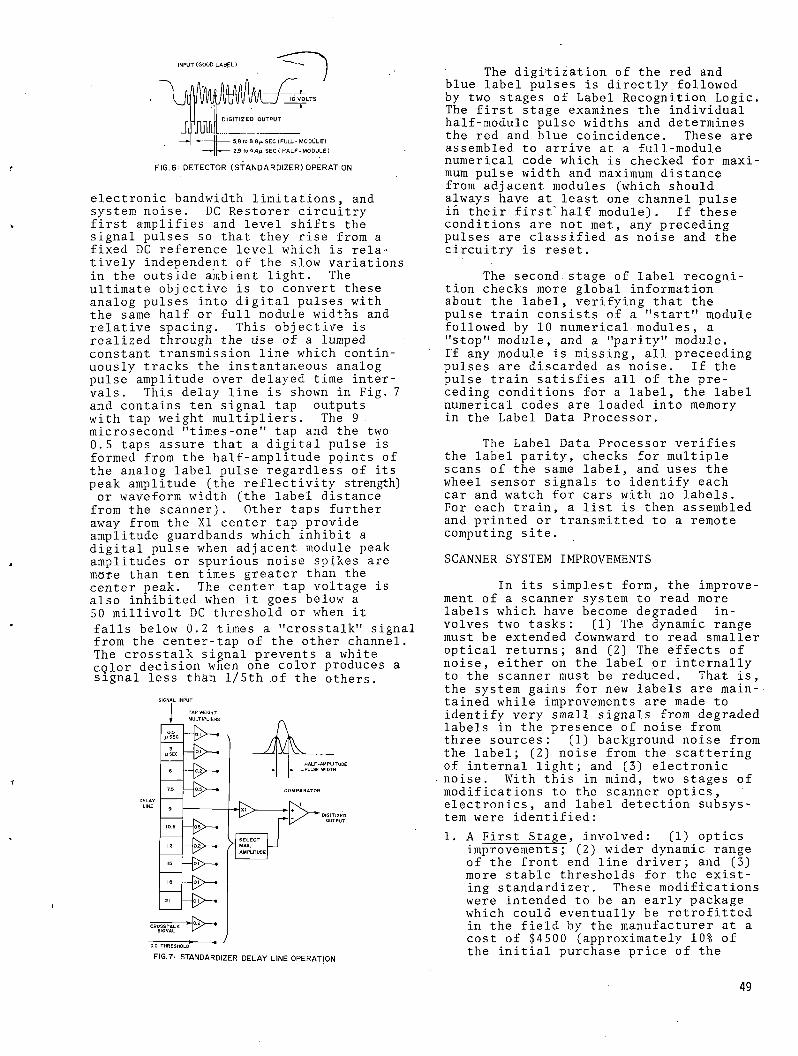
INPUT (GOOD LABEL)
FIG.6' DETECTOR (STANDARDIZER) OPERATION
electronic bandwidth limitations, and system noise. DC Restorer circuitry first amplifies and level shifts the signal pulses so that they rise from a fixed DC reference level which is relatively independent of the slow variations in the outside ambient light. The ultimate objective is to convert these analog pulses into digital pulses with the same half or full module widths and relative spacing. This objective is realized through the lise of a lumped constant transmission line which continuously tracks the instantaneous analog pulse amplitude over delayed time intervals. This delay line is shown in Fig. 7 and contains ten .signal tap outputs with tap weight multipliers. The 9 microsecond "times-one" tap and the two0.5 taps assure that a digital pulse is formed from the half-amplitude points of the analog label pulse regardless of its peak amplitude (the reflectivity strength) or waveform width (the label distance from the scanner). Other taps further away from the XI center tap provide amplitude guardbands which inhibit a digital pulse when adjacent module peak amplitudes or spurious noise spikes are more than ten times greater than the center peak. The center tap voltage is also inhibited when it goes below a 50 millivolt DC threshold or when it falls below 0.2 times a "crosstalk" signal from the center-tap of the other channel. The crosstalk signal prevents a white color decision when one color produces a signal less than l/5th of the others.
SIGNAL INPUT
The digitization of the red and blue label pulses is directly followed by two stages of Label Recognition Logic. The first stage examines the individual half-module pulse widths and determines the red and blue coincidence. These are assembled to arrive at a full-module numerical code which is checked for maximum pulse width and maximum distance from adjacent modules (which should always have at least one channel pulse in their first'half module). If these conditions are not met, any preceding pulses are classified as noise and the circuitry is reset.
The second stage of label recognition checks more global information about the label, verifying that the pulse train consists of a "start" module followed by 10 numerical modules, a "stop" module, and a "parity" module.If any module is missing, all preceeding pulses are discarded as noise. If the pulse train satisfies all of the preceding conditions for a label, the label numerical codes are loaded into memory in the Label Data Processor.
The Label Data Processor verifies the label parity, checks for multiple scans of the same label, and uses the wheel sensor signals to identify each car and watch for cars with no labels.For each train, a list is then assembled and printed or transmitted to a remote computing site.
SCANNER SYSTEM IMPROVEMENTS
In its simplest form, the improvement of a scanner system to read more labels which have become degraded involves two tasks: (1) The dynamic rangemust be extended downward to read smaller optical returns; and (2) The effects of noise, either on the label or internally to the scanner must be reduced. That is, the system gains for new labels are maintained while improvements are made to identify very small signals from degraded labels in the presence of noise from three sources: (1) background noise fromthe label; (2) noise from the scattering of internal light; and (3) electronic noise. With this in mind, two stages of modifications to the scanner optics, electronics, and label detection subsystem were identified:1. A First Stage, involved: (1) optics
improvements; (2) wider dynamic range of the front end line driver; and (3) more stable thresholds for the existing standardizer. These modifications were intended to be an early package which could eventually be retrofitted in the field by the manufacturer at a cost of $4500 (approximately 101 of the initial purchase price of the
49
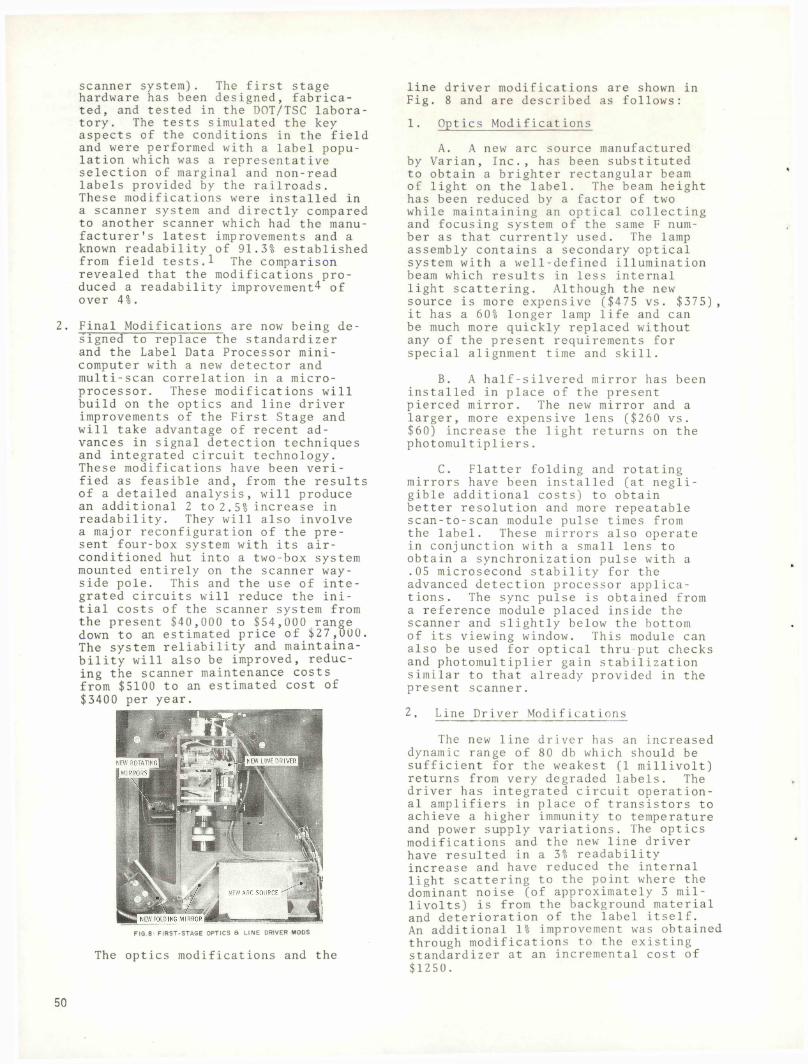
scanner system). The first stage hardware has been designed, fabricated, and tested in the DOT/TSC laboratory. The tests simulated the key aspects of the conditions in the field and were performed with a label population which was a representative selection of marginal and non-read labels provided by the railroads.These modifications were installed in a scanner system and directly compared to another scanner which had the manufacturer’s latest improvements and a known readability of 91.3% established from field tests.1 The comparison revealed that the modifications produced a readability improvement^ of over 4%.
Final Modifications are now being designed to replace the standardizer and the Label Data Processor minicomputer with a new detector and multi-scan correlation in a microprocessor. These modifications will build on the optics and line driver improvements of the First Stage and will take advantage of recent advances in signal detection techniques and integrated circuit technology. These modifications have been verified as feasible and, from the results of a detailed analysis, will produce an additional 2 to 2.5% increase in readability. They will also involve a major reconfiguration of the present four-box system with its air- conditioned hut into a two-box system mounted entirely on the scanner way- side pole. This and the use of integrated circuits will reduce the initial costs of the scanner system from the present $40,000 to $54,000 range down to an estimated price of $27,000. The system reliability and maintainability will also be improved, reducing the scanner maintenance costs from $5100 to an estimated cost of $3400 per year.
F IG .8° F IR S T -S T A G E O PT ICS & L IN E DR IVER MODS
The optics modifications and the
line driver modifications are shown in Fig. 8 and are described as follows:
1. Optics Modifications
A. A new arc source manufactured by Varian, Inc., has been substituted to obtain a brighter rectangular beam of light on the label. The beam height has been reduced by a factor of two while maintaining an optical collecting and focusing system of the same F number as that currently used. The lamp assembly contains a secondary optical system with a well-defined illumination beam which results in less internal light scattering. Although the new source is more expensive ($475 vs. $375), it has a 60% longer lamp life and canbe much more quickly replaced without any of the present requirements for special alignment time and skill.
B. A half-silvered mirror has been installed in place of the present pierced mirror. The new mirror and a larger, more expensive lens ($260 vs.$60) increase the light returns on the photomultipliers.
C. Flatter folding and rotating mirrors have been installed (at negligible additional costs) to obtain better resolution and more repeatable scan-to-scan module pulse times from the label. These mirrors also operate in conjunction with a small lens to obtain a synchronization pulse with a .05 microsecond stability for the advanced detection processor applications. The sync pulse is obtained from a reference module placed inside the scanner and slightly below the bottom of its viewing window. This module can also be used for optical thru put checks and photomultiplier gain stabilization similar to that already provided in the present scanner.
2. Line Driver Modifications
The new line driver has an increased dynamic range of 80 db which should be sufficient for the weakest (1 millivolt) returns from very degraded labels. The driver has integrated circuit operational amplifiers in place of transistors to achieve a higher immunity to temperature and power supply variations. The optics modifications and the new line driver have resulted in a 3% readability increase and have reduced the internal light scattering to the point where the dominant noise (of approximately 3 millivolts) is from the background material and deterioration of the label itself.An additional 1% improvement was obtained through modifications to the existing standardizer at an incremental cost of $1250.
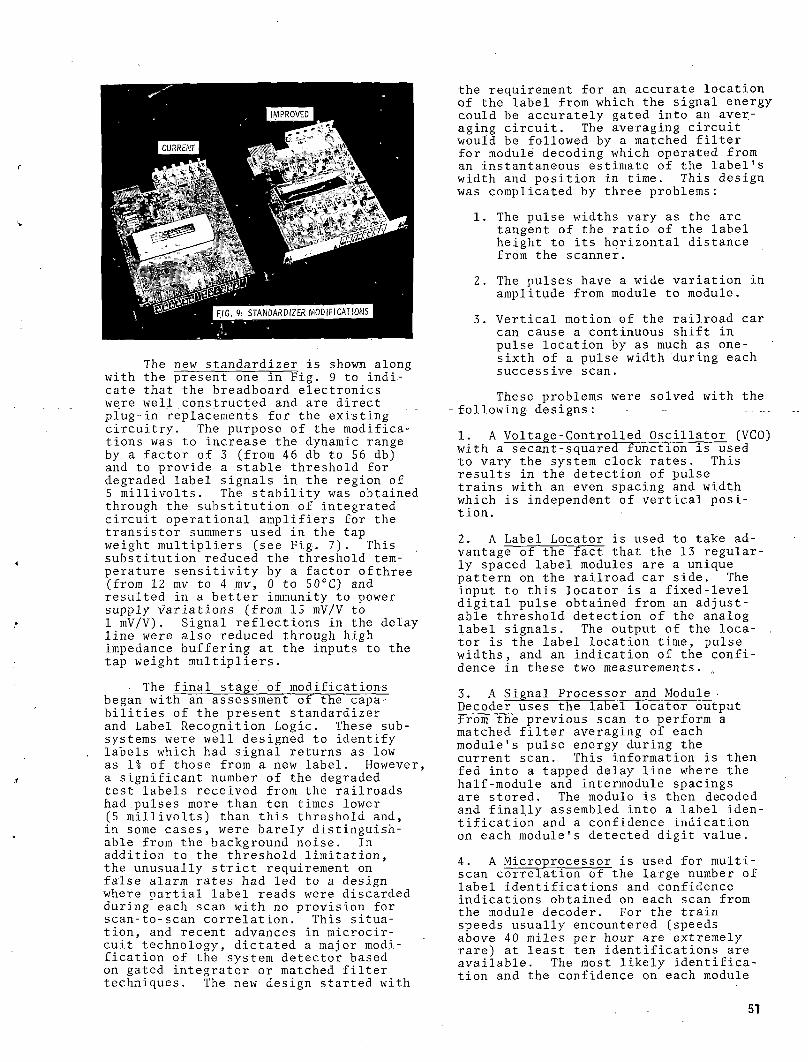
The new standardizer is shown along with the present one in Fig. 9 to indicate that the breadboard electronics were well constructed and are direct plug-in replacements for the existing circuitry. The purpose of the modifications was to increase the dynamic range by a factor of 3 (from 46 db to 56 db) and to provide a stable threshold for degraded label signals in the region of 5 millivolts. The stability was obtained through the substitution of integrated circuit operational amplifiers for the transistor summers used in the tap weight multipliers (see Fig. 7). This substitution reduced the threshold'temperature sensitivity by a factor ofthree (from 12 mv to 4 mv, 0 to 50°C) and resulted in a better immunity to power supply variations (from 15 mV/V to 1 mV/V). Signal reflections in the delay line were a:lso reduced through high impedance buffering at the inputs to the tap weight multipliers.
The final stage of modifications began with an assessment of the capa- bilities of the present standardizer and Label Recognition Logic. These subsystems were well designed to identify labels which had signal returns as low as II of those from a new label. However, a significant number of the degraded test labels received from the railroads had pulses more than ten times lower (5 millivolts) than this threshold and, in some cases, were barely distinguishable from the background noise. In addition to the threshold limitation, the unusually strict requirement on false alarm rates had led to a design where partial label reads were discarded during each scan with no provision for scan-to-scan correlation. This situation, and recent advances in microcircuit technology, dictated a major modification of the system detector based on gated integrator or matched filter techniques. The new design started with
the requirement for an accurate location of the label from which the signal energy could be accurately gated into an averaging circuit. The averaging circuit would be followed by a matched filter for module decoding which operated from an instantaneous estimate of the label's width and position in time. This design was complicated by three problems:
1. The pulse widths vary as the arc tangent of the ratio of the label height to its horizontal distance from the scanner.
2. The pulses have a wide variation in amplitude from module to module.
3. Vertical motion of the railroad car can cause a continuous shift in pulse location by as much as one- sixth of a pulse width during each successive scan.
These problems were solved with the following designs: ~ ...
1. A Voltage-Controlled Oscillator (VCO) with a secant-squared function is usedto vary the system clock rates. This results in the detection of pulse trains with an even spacing and width which is independent of vertical position.
2. A Label Locator is used to take ad- van tag e~of_The~Tact’ that the 13 regularly spaced label modules are a unique pattern on the railroad car side. The input to this locator is a fixed-level digital pulse obtained from an adjustable threshold detection of the analog label signals. The output of the locator is the label location time, pulse widths, and an indication of the confidence in these two measurements. „
3. A Signal Processor and Module •Decoder uses the label locator output from the previous scan to perform a matched filter averaging of each module's pulse energy during the current scan. This information is then fed into a tapped delay line where the half-module and intermodule spacings are stored. The module is then decoded and finally assembled into a label identification and a confidence indication on each module's detected digit value.
4. A Microprocessor is used for multiscan correlation of the large number of label identifications and confidence indications obtained on each scan from the module decoder. For the train speeds usually encountered (speeds above 40 miles per hour are extremely rare) at least ten identifications are available. The most likely identification and the confidence on each module
51
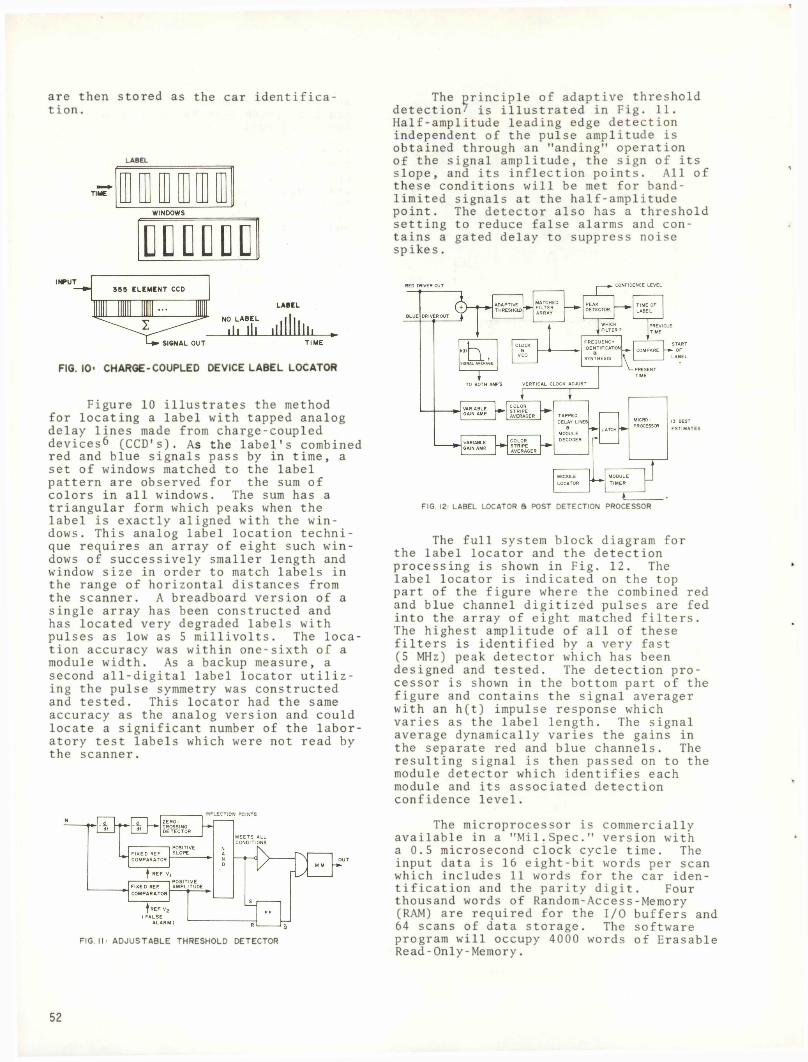
are then stored as the car identification .
LABEL
FIG. 10* CHARGE-COUPLED DEVICE LABEL LOCATOR
Figure 10 illustrates the method for locating a label with tapped analog delay lines made from charge-coupled devices^ (CCD's). As the label’s combined red and blue signals pass by in time, a set of windows matched to the label pattern are observed for the sum of colors in all windows. The sum has a triangular form which peaks when the label is exactly aligned with the windows. This analog label location technique requires an array of eight such windows of successively smaller length and window size in order to match labels in the range of horizontal distances from the scanner. A breadboard version of a single array has been constructed and has located very degraded labels with pulses as low as 5 millivolts. The location accuracy was within one-sixth of a module width. As a backup measure, a second all-digital label locator utilizing the pulse symmetry was constructed and tested. This locator had the same accuracy as the analog version and could locate a significant number of the laboratory test labels which were not read by the scanner.
INPI FTrinw dohutc
FIG. II > A D JU S TA B L E THRESHOLD DETECTOR
The principle of adaptive threshold detection/ is illustrated in Fig. 11.Half-amplitude leading edge detection independent of the pulse amplitude is obtained through an "anding" operation of the signal amplitude, the sign of its slope, and its inflection points. All of these conditions will be met for band- limited signals at the half-amplitude point. The detector also has a threshold setting to reduce false alarms and contains a gated delay to suppress noise spikes.
FIG. I2: LABEL LOCATOR 8 POST DETECTION PROCESSOR
The full system block diagram for the label locator and the detection processing is shown in Fig. 12. The label locator is indicated on the top part of the figure where the combined red and blue channel digitized pulses are fed into the array of eight matched filters. The highest amplitude of all of these filters is identified by a very fast (5 MHz) peak detector which has been designed and tested. The detection processor is shown in the bottom part of the figure and contains the signal averager with an h(t) impulse response which varies as the label length. The signal average dynamically varies the gains in the separate red and blue channels. The resulting signal is then passed on to the module detector which identifies each module and its associated detection confidence level.
The microprocessor is commercially available in a "Mil.Spec." version with a 0.5 microsecond ciock cycle time. The input data is 16 eight-bit words per scan which includes 11 words for the car identification and the parity digit. Four thousand words of Random-Access-Memory (RAM) are required for the I/O buffers and 64 scans of data storage. The software program will occupy 4000 words of Erasable Read-Only-Memory.
52
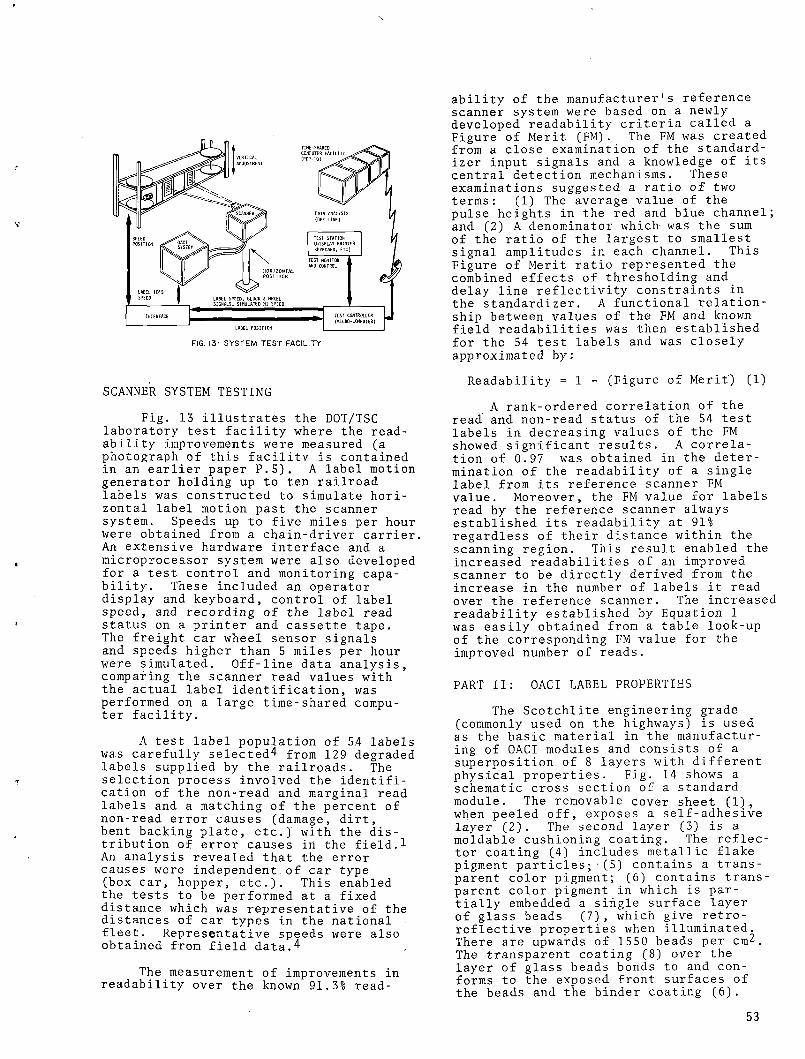
SCANNER SYSTEM TESTING
Fig. 13 illustrates the DOT/TSC laboratory test facility where the readability improvements were measured (a photograph of this facility is contained in an earlier paper P.5), A label motion generator holding up to ten railroad labels was constructed to simulate horizontal label motion past the scanner system. Speeds up to five miles per hour were obtained from a chain-driver carrier. An extensive hardware interface and a microprocessor system were also developed for a test control and monitoring capability. These included an operator display and keyboard, control of label speed, and recording of the label read status on a printer and cassette tape.The freight car wheel sensor signals and speeds higher than 5 miles per hour were simulated. Off-line data analysis, comparing the scanner read values with the actual label identification, was performed on a large time-shared computer facility.
A test label population of 5.4 labels was carefully selected4 from 129 degraded labels supplied by the railroads. The selection process involved the identification of the non-read and marginal read labels and a matching of the percent of non-read error causes (damage, dirt, bent backing plate, etc.) with the distribution of error causes in the field.1 An analysis revealed that the error causes were independent, of car type (box car, hopper, etc.). This enabled the tests to be performed at a fixed distance which was representative of the distances of car types in the national fleet. Representative speeds were also obtained from field data.4
The measurement of improvements in readability over the known 91.3% read
ability of the manufacturer's reference scanner system were based on a newly developed readability criteria called a Figure of Merit (FM). The FM was created from a close examination of the standard- izer input signals and a knowledge of its central detection mechanisms. These examinations suggested a ratio of two terms: (1) The average value of thepulse heights in the red and blue channel; and (2) A denominator which- was the sum of the ratio of the largest to smallest signal amplitudes in each channel. This Figure of Merit ratio represented the combined effects of thresholding and delay line reflectivity constraints in the standardizer. A functional relationship between values of the FM and known field readabilities was then established for the 54 test labels and was closely approximated by:
Readability = 1 - (Figure of Merit) (1)
A rank-ordered correlation of the read and non-read status of the 54 test labels in decreasing values of the FM showed significant results. A correlation of 0.97 was obtained in the determination of the readability of a single label from its reference scanner FM value. Moreover, the FM value for labels read by the reference scanner always established its readability at 91% regardless of their distance within the scanning region. This result enabled the increased readabilities of an improved scanner to be directly derived from the increase in the number of labels it read over the reference scanner. The increased readability established by Equation 1 was easily obtained from a table look-up of the corresponding FM value for the improved number of reads.
PART II: OACI LABEL PROPERTIES
The Scotchlite engineering grade (commonly used on the highways) is used as the basic material in the manufacturing of OACI modules and consists of a superposition of 8 layers with different physical properties. Fig. 14 shows a schematic cross section of a standard module. The removable cover sheet (1)„ when peeled off, exposes a self-adhesive layer (2). The second layer (3) is a moldable cushioning coating. The reflector coating (4) includes metallic flake pigment particles;■(5) contains a transparent color pigment; (6) contains transparent color pigment in which is partially embedded a single surface layer of glass beads (7), which give retro- reflective properties when illuminated. There are upwards of 1550 beads per cm^. The transparent coating (8) over the layer of glass beads bonds to and conforms to the exposed front surfaces of the beads and the binder coating (6).
53
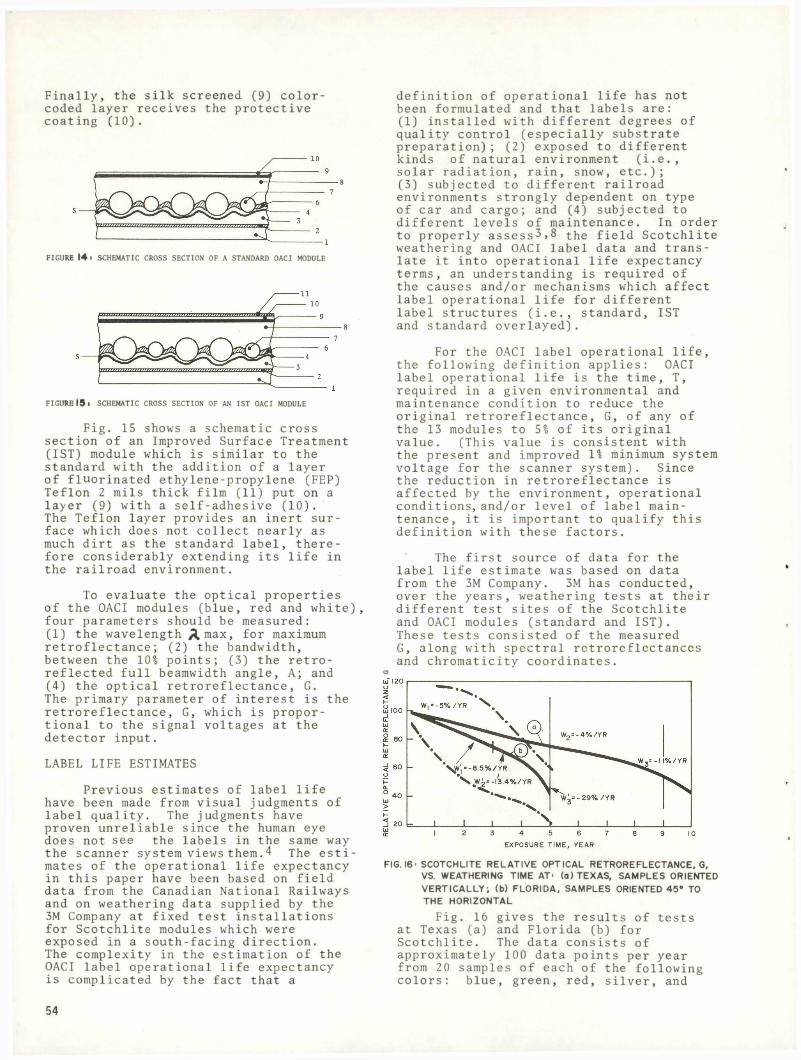
Finally, the silk screened (9) color- coded layer receives the protective coating (10).
FIGURE 14 * SCHEMATIC CROSS SECTION OF A STANDARD OACI MODULE
FIGURE 15 i SCHEMATIC CROSS SECTION OF AN 1ST OACI MODULE
Fig. 15 shows a schematic cross section of an Improved Surface Treatment (1ST) module which is similar to the standard with the addition of a layer of fluorinated ethylene-propylene (FEP) Teflon 2 mils thick film (11) put on a layer (9) with a self-adhesive (10).The Teflon layer provides an inert surface which does not collect nearly as much dirt as the standard label, therefore considerably extending its life in the railroad environment.
To evaluate the optical properties of the OACI modules (blue, red and white), four parameters should be measured:(1) the wavelength /{max, for maximum retroflectance; (2) the bandwidth, between the 10% points; (3) the retro- reflected full beamwidth angle, A; and (4) the optical retroreflectance, G.The primary parameter of interest is the retroreflectance, G, which is proportional to the signal voltages at the detector input.
LABEL LIFE ESTIMATES
Previous estimates of label life have been made from visual judgments of label quality. The judgments have proven unreliable since the human eye does not see the labels in the same way the scanner system views them.4 The estimates of the operational life expectancy in this paper have been based on field data from the Canadian National Railways and on weathering data supplied by the 3M Company at fixed test installations for Scotchlite modules which were exposed in a south-facing direction.The complexity in the estimation of the OACI label operational life expectancy is complicated by the fact that a
definition of operational life has not been formulated and that labels are:(1) installed with different degrees of quality control (especially substrate preparation); (2) exposed to different kinds of natural environment (i.e., solar radiation, rain, snow, etc.);(3) subjected to different railroad environments strongly dependent on type of car and cargo; and (4) subjected to different levels of maintenance. In order to properly assesses the field Scotchlite weathering and OACI label data and translate it into operational life expectancy terms, an understanding is required of the causes and/or mechanisms which affect label operational life for different label structures (i.e., standard, 1ST and standard overlayed).
For the OACI label operational life, the following definition applies: OACIlabel operational life is the time, T, required in a given environmental and maintenance condition to reduce the original retroreflectance, G, of any of the 13 modules to 5% of its original value. (This value is consistent with the present and improved 1% minimum system voltage for the scanner system). Since the reduction in retroreflectance is affected by the environment, operational conditions, and/or level of label maintenance, it is important to qualify this definition with these factors.
The first source of data for the label life estimate was based on data from the 3M Company. 3M has conducted, over the years, weathering tests at their different test sites of the Scotchlite and OACI modules (standard and 1ST).These tests consisted of the measured G, along with spectral retroreflcctanccs and chromaticity coordinates.
FIG. 16' SCOTCHLITE RELATIVE OPTICAL RETROREFLECTANCE, G, VS. WEATHERING TIME AT' (a) TEXAS, SAMPLES ORIENTED VERTICALLY*, (b) FLORIDA, SAMPLES ORIENTED 45° TO THE HORIZONTALFig. 16 gives the results of tests
at Texas (a) and Florida (b) for Scotchlite. The data consists of approximately 100 data points per year from 20 samples of each of the following colors: blue, green, red, silver, and
54
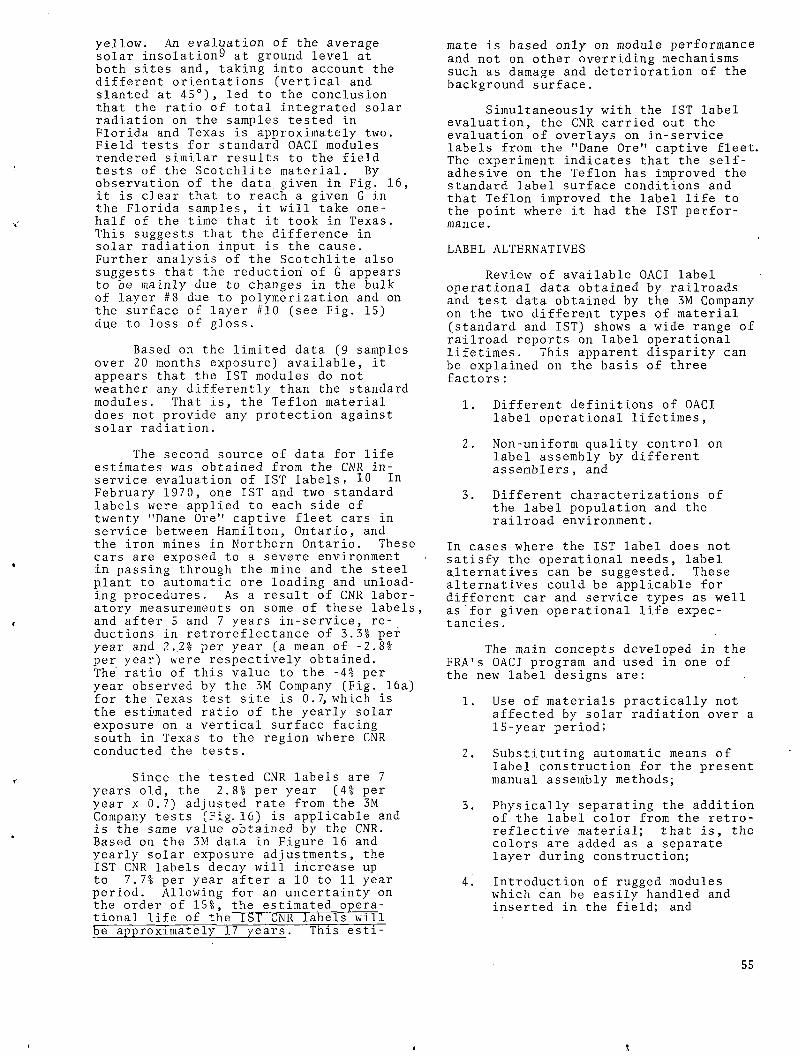
yellow. An evaluation of the average solar insolation^ at ground level at both sites and, taking into account the different orientations (vertical and slanted at 45°), led to the conclusion that the ratio of total integrated solar radiation on the samples tested in Florida and Texas is approximately two. Field tests for standard OACI modules rendered similar results to the field tests of the Scotchlite material. By observation- of the data given in Fig. 16, it is clear that to reach a given G in the Florida samples, it will take one- half of the time that it took in Texas.This suggests that the difference in solar radiation input is the cause.Further analysis of the Scotchlite also suggests that the reduction of G appears to be mainly due to changes in the bulk of layer #8 due to polymerization and on the surface of layer #10 (see Fig. 15) due to loss of gloss.
Based on the limited data (9 samples over 20 months exposure) available, it appears that the 1ST modules do not weather any differently than the standard modules. That is, the Teflon material does not provide any protection against solar radiation.
The second source of data for life estimates was obtained from the CNR in- service evaluation of 1ST labels , 10 In February 1970, one 1ST and two standard labels were applied to each side of twenty "Dane Ore" captive fleet cars in service between Hamilton, Ontario, and the iron mines in Northern Ontario. These cars are exposed to a severe environment in passing through the mine and the steel plant to automatic ore loading and unloading procedures. As a result of CNR laboratory measurements on some of these labels, and after 5 and 7 years in-service, reductions in retroreflectance of 3.3% per year and 2.2% per year (a mean of -2.8% per year) were respectively obtained.The ratio of this value to the -4% per year observed by the 3M Company (Fig. 16a) for the Texas test site is 0.7, which is the estimated ratio of the yearly solar exposure on a vertical surface facing south in Texas to the region where CNR conducted the tests.
Since the tested CNR labels are 7 years old, the 2.8% per year (4% per year x 0.7) adjusted rate from the 3M Company tests (Fig. 16) is applicable and is the same value obtained by the CNR.Based on the 3M data in Figure 16 and yearly solar exposure adjustments, the 1ST CNR labels decay will increase up to 7.7% per year after a 10 to 11 year period. Allowing for an uncertainty on the order of 15%, the estimated opera- tional life of the 1ST CNR labels will be approximately 17 years. This esti
mate is based only on module performance and not on other overriding mechanisms such as damage and deterioration of the background surface.
Simultaneously with the 1ST label evaluation, the CNR carried out the evaluation of overlays on in-service labels from the "Dane Ore" captive fleet. The experiment indicates that the self- adhesive on the Teflon has improved the standard label surface conditions and that Teflon improved the label life to the point where it had the 1ST performance.
LABEL ALTERNATIVES
Review of available OACI label operational data obtained by railroads and test data obtained by the 3M Company on the two different types of material (standard and 1ST) shows a wide range of railroad reports on label operational lifetimes. This apparent disparity can be explained on the basis of three factors:
1. Different definitions of OACI label operational lifetimes,
2. Non-uniform quality control on label assembly by different assemblers, and
3. Different characterizations of the label population and, the railroad environment.
In cases where the 1ST label does not satisfy the operational needs, label alternatives can be suggested. These alternatives could be applicable for different car and service types as well as for given operational life expectancies .
The main concepts developed in the FRA's OACI program and used in one of the new label designs are:
1. Use of materials practically not affected by solar radiation over a 15-year period;
2. Substituting automatic means of label construction for the present manual assembly methods;
3. Physically separating the addition of the label color from the retro- reflective material; that is, the colors are added as a separate layer during construction;
4. Introduction of rugged modules which can be easily handled and inserted in the field; and
55
5
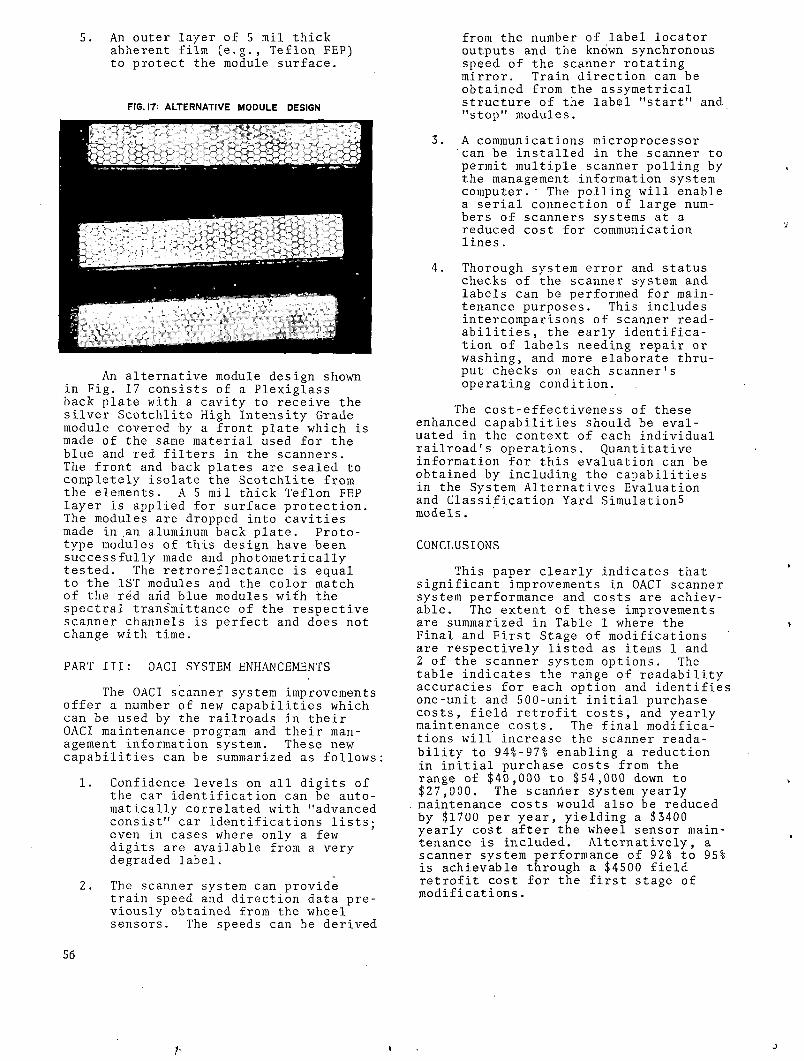
5. An outer layer of 5 mil thickabherent film (e.g., Teflon FEP) to protect the module surface.
FIG. 17: ALTERNATIVE M O D U L E DESIGN
An alternative module design shown in Fig. 17 consists of a Plexiglass back plate with a cavity to receive the silver Scotchlite High Intensity Grade module covered by a front plate which is made of the same material used for the blue and red filters in the scanners.The front and back plates are sealed to completely isolate the Scotchlite from the elements. A 5 mil thick Teflon FEP layer is applied for surface protection. The modules are dropped into cavities made in .an aluminum back plate. Prototype modules of this design have been successfully made and photometrically tested. The retroreflectance is equal to the 1ST modules and the color match of the red arid blue modules with the spectral trans'mittance of the respective scanner channels is perfect and does not change with time.
PART III: OACI SYSTEM ENHANCEMENTS
The OACI scanner system improvements offer a number of new capabilities which can be used by the railroads in their OACI maintenance program and their management information system. These new capabilities can be summarized as follows:
1. Confidence levels on all digits of the car identification can be automatically correlated with "advanced consist" car identifications lists; even in cases where only a few digits are available from a very degraded label.
2. The scanner system can provide train speed and direction data previously obtained from the wheel sensors. The speeds can be derived
from the number of label locator outputs and the known synchronous speed of the scanner rotating mirror. Train direction can be obtained from the assymetrical structure of the label "start" and "stop" modules.
3. A communications microprocessor can be installed in the scanner to permit multiple scanner polling by the management information system computer. ' The polling will enable a serial connection of large numbers of scanners systems at a reduced cost for communication lines.
4. Thorough system error and status checks of the scanner system and labels can be performed for maintenance purposes. This includes intercomparisons of scanner readabilities, the early identification of labels needing repair or washing, and more elaborate thru- put checks on each scanner's operating condition.
The cost-effectiveness of these enhanced capabilities should be evaluated in the context of each individual railroad's operations. Quantitative information for this evaluation can be obtained by including the capabilities in the System Alternatives Evaluation and Classification Yard Simulations models.
CONCLUSIONS
This paper clearly indicates that significant improvements in OACI scanner system performance and costs are achievable. The extent of these improvements are summarized in Table 1 where the Final and First Stage of modifications are respectively listed as items 1 and 2 of the scanner system options. The table indicates the range of readability accuracies for each option and identifies one-unit and 500-unit initial purchase costs, field retrofit costs, and yearly maintenance costs. The final modifications will increase the scanner readability to 941-971 enabling a reduction in initial purchase costs from the range of $40,000 to $54,000 down to $27,000. The scanner system yearly maintenance costs would also be reduced by $1700 per year, yielding a $3400 yearly cost after the wheel sensor maintenance is included. Alternatively, a scanner system performance of 921 to 951 is achievable through a $4500 field retrofit cost for the first stage of modifications.
56
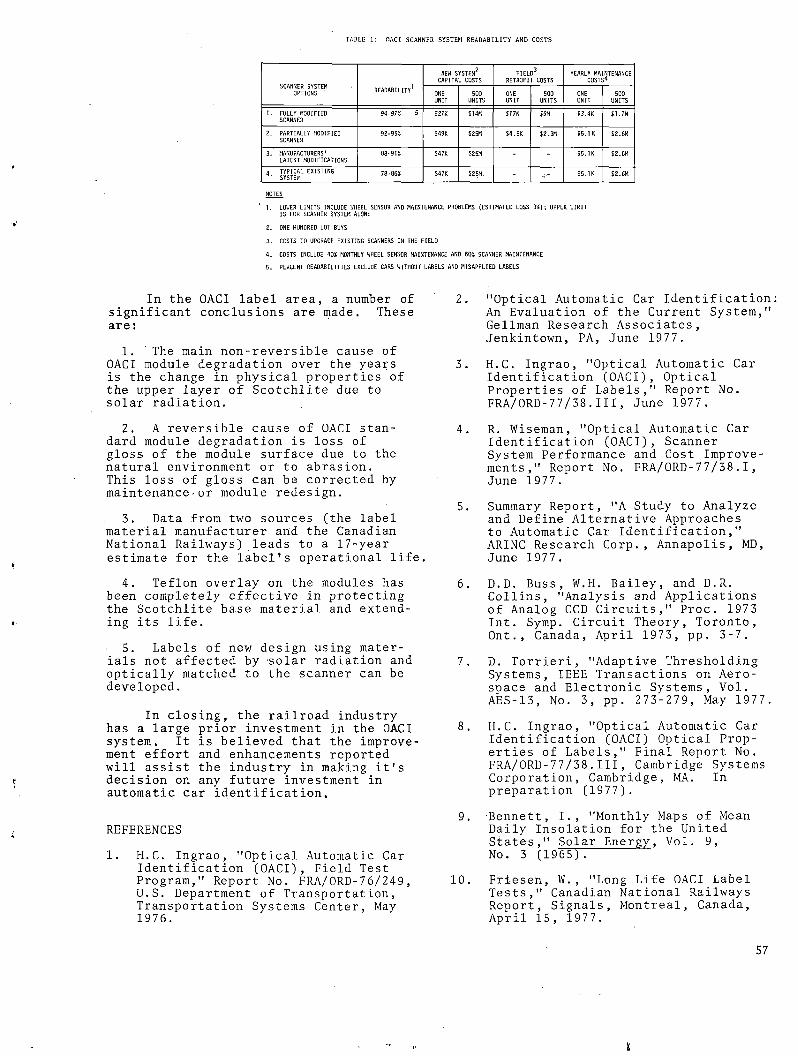
TABLE 1: OACI SCANNER SYSTEM READABILITY AND COSTS
SCANNER SYSTEM OPTIONS
NEW SYSTEM2 CAPITAL COSTS
FIELD3RETROFIT COSTS
YEARLY MAINTENANCE COSTS'*
READABILITY1 ONEUNIT
500UNITS
ONEUNIT
500UNITS
ONE , UNIT
500UNITS
I. FULLY MODIFIED SCANNER
94-97% 5 $2 7K $14K S17K 59M $3.4K $?.7M
2. PARTIALLY MODIFIED SCANNER
92-95% $49K $25M S4.5K $2.3M $5.IK S2.6M
3. MANUFACTURERS'LATEST MODIFICATIONS
88-91% $47K $25M - - $5.IK $2.6M
4. TYPICAL EXISTING SYSTEM
78-86% $47K $25M. - $5.IK $2.6M
NOTES
1. LOWER LIMITS INCLUDE WHEEL SENSOR AND MAINTENANCE PROBLEMS (ESTIMATED LOSS 3%); UPPER LIMIT IS FOR SCANNER SYSTEM ALONE
2. ONE-HUNDRED LOT BUYS
3. COSTS TO UPGRADE EXISTING SCANNERS IN THE FIELD
4. COSTS INCLUDE 40* MONTHLY WHEEL SENSOR MAINTENANCE AND 60% SCANNER MAINTENANCE
5. PERCENT READABILITIES EXCLUDE CARS WITHOUT LABELS AND MISAPPLIED LABELS
In the OACI label area, a number of significant conclusions are made. These are:
1. The main non-reversible cause of OACI module degradation over the years is the change in physical properties of the upper layer of Scotchlite due to solar radiation.
2. A reversible cause of OACI standard module degradation is loss of gloss of the module surface due to the natural environment or to abrasion.This loss of gloss can be corrected by maintenance - or module redesign.
3. Data from two sources (the label material manufacturer and the Canadian National Railways) leads to a 17-year estimate for the label's operational life.
4. Teflon overlay on the modules has been completely effective in protecting the Scotchlite base material and extending its life.
5. Labels of new design using materials not affected by solar radiation and optically matched to the scanner can be developed.
In closing, the railroad industry has a large prior investment in the OACI system. It is believed that the improvement effort and enhancements reported will assist the industry in making it's decision on any future investment in automatic car identification.
REFERENCES
1. H.C. Ingrao, "Optical Automatic Car Identification (OACI), Field Test Program," Report No. FRA/ORD-7 6/249 , U.S. Department of Transportation, Transportation Systems Center, May 1976.
2. "Optical Automatic Car Identification An Evaluation of the Current System," Gellman Research Associates, Jenkintown, PA, June 1977.
3. H.C. Ingrao, "Optical Automatic Car Identification (OACI), Optical Properties of Labels," Report No.FRA/ORD-77/38.111 , June 1977 .
4. R. Wiseman, "Optical Automatic Car Identification (OACI), Scanner System Performance and Cost Improvements," Report No. FRA/ORD-77/38.I, June 1977.
5. Summary Report, "A Study to Analyze and Define Alternative Approaches to Automatic Car Identification," ARINC Research Corp., Annapolis, MD, June 1977.
6 . D.D. Buss, W.H. Bailey, and D.R. Collins, "Analysis and Applications of Analog CCD Circuits," Proc. 1973 Int. Symp. Circuit Theory, Toronto, Ont., Canada, April 1973, pp. 3-7.
7. D. Torrieri, "Adaptive Thresholding Systems, IEEE Transactions on Aerospace and Electronic Systems, Vol. AES-13, No. 3, pp. 273-279, May 1977.
8 . H.C. Ingrao, "Optical Automatic Car Identification (OACI) Optical Properties of Labels," Final Report No. FRA/ORD-77/38.1II, Cambridge Systems Corporation, Cambridge, MA. In preparation (1977).
9. Bennett, I., "Monthly Maps of Mean Daily Insolation for the United States," Solar Energy, Vol. 9,No. 3 (19651^
10. Friesen, W., "Long Life OACI Label Tests," Canadian National Railways Report, Signals, Montreal, Canada, April 15, 1977.
57
t
ACKNOWLEDGEMENTS
The authors wish to express their sincere appreciation to the many individuals and their organizations that have contributed to the OACI Improvement Effort.
From the Transportation Systems Center, we would like to acknowledge the engineering contributions of L. Long, M. Yaffee, and A. Lavery,
Thanks are gratefully given to all of the members of the ACI Technical Committee especially the Chairman,D. Spanton, for their guidance and review throughout the improvement effort, Also, appreciation is expressed to the Research and Test Department of the Association of American Railroads, in particular C, Taylor, for their careful study of ACI alternatives and especially their economic methodology effort which led to a Classification Yard Simulation Model.
58
i

Truck Performance — Friction Snubber Force Measurement System
K.L. CAPPEL G.R. FAY
Chief Design Engineer Research Manager, Equipment PerformanceWyle Laboratories Office of Freight SystemsHuntsville, AL Federal Railroad Administration
Washington, D.C.
ABSTRACT
With all its truck and carbody instrumentation, Phase I of the Truck Design Optimization Project found that adequate transducer systems for the measurement of forces in the friction snubber were non-existent. This paper documents the design, testing and potential utilization of such a system, fabricated and tested by Wyle Laboratories.
INTRODUCTION
Within the last decade, an increasing amount of research has been directed toward improving the performance of the three-piece freight car truck. Truck manufacturers have designed and built several new truck configurations as well as added special purpose components aimed at improving such performance parameters as ride quality, lateral stability, and curve negotiation. There has been a great deal of testing by both industry and government for the evaluation of the comparative advantages afforded by modified or new trucks under a range of operating conditions. Of course, testing was conducted on the standard three-piece friction snubbed truck to establish quantitative performance characteristics as a base for the evaluation of new or modified designs.
While the conclusions drawn from many of the test results were very often contradictory, the methods of truck performance evaluation have steadily grown more rational. Much of the technological advance can be attributed to the parallel use of mathematical simulation and full-scale testing. The mathematical models used in simulations are necessarily idealized as they are linearized to reduce computing time, and because many of the non-linear parameters in truck dynamics are not quantified.
In 1974, the Federal Railroad Administration awarded a contract to the Southern Pacific Transportation Company for the performance of Phase I of the Truck Design Optimization Project (TDOP) which had the objective of quantitatively characterizing the performance of the general purpose freightcar truck. The Contractor was
primarily concerned with the evaluation of the two most commonly used three-piece trucks: theAmerican Steel Foundries (ASF) "Ride Control" truck, and the Barber S-2 truck; the first incorporates constant snubbing friction, and the second, load-dependent snubbing friction. TDOP Phase I instrumented new 70-ton (63,502 kg) and 100-ton (90,718 kg) ASF and Barber trucks to measure accelerations, normal contact forces at the roller bearing adapters and relative linear and angular displacements between side frames and bolster. Relative rotation between truck and carbody bolsters was also measured.
It was soon recognized that instrumentation was not available to measure the forces transmitted through the spring loaded friction shoes or wedges between the side frames and bolster. In theory, it might have been possible to derive the friction forces by comparing measured accelerations and displacements with the calculated dynamics of a system without energy dissipation. It was also apparent that this approach would not only be cumbersome and expensive in computer time but would not lead to an accurate determination of the friction forces. In November 1974, a preliminary design concept of a transducer system to measure the forces between side frames and bolster was submitted by Wyle Laboratories for review.
ENGINEERING CONSIDERATIONS
Although the bolster-side frame connection is structurally and mechanically simple, it performs a multiplicity of functions:
59
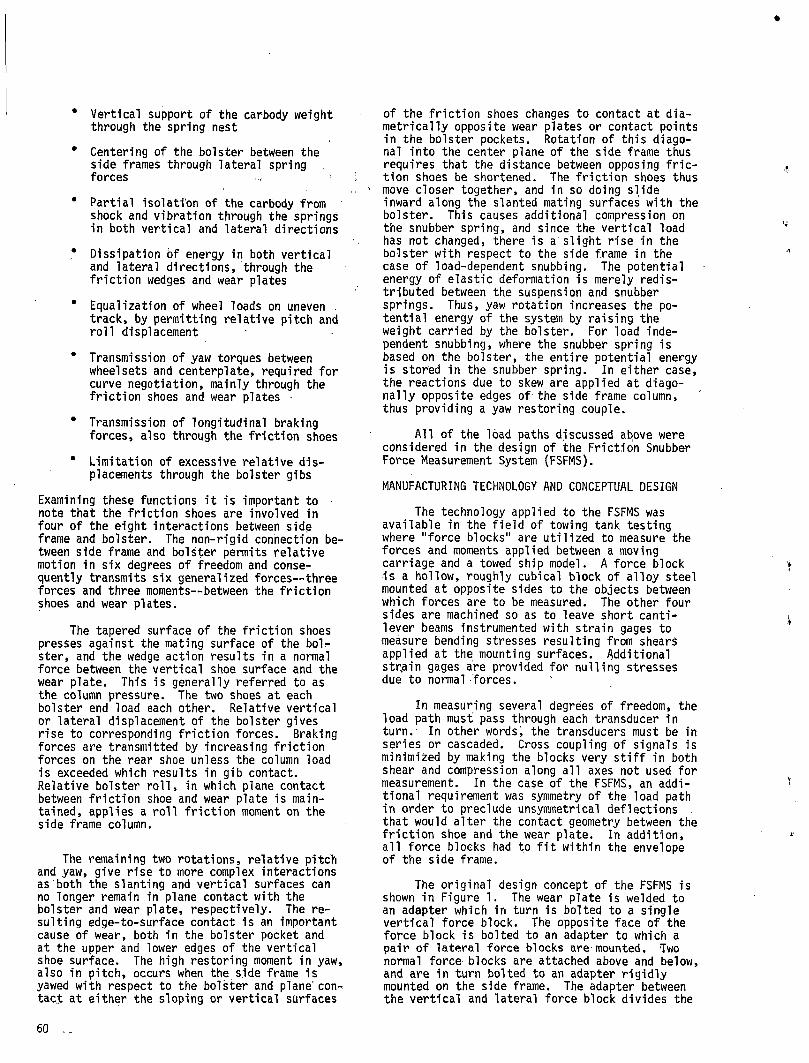
• Vertical support of the car-body weight through the spring nest
• Centering of the bolster between theside frames through lateral spring forces i
• Partial isolation of the carbody from shock and vibration through the springs in both vertical and lateral directions
• Dissipation of energy in both vertical and lateral directions, through the friction wedges and wear plates
• Equalization of wheel loads on uneven . track, by permitting relative pitch and roll displacement
• Transmission of yaw torques between wheel sets and centerplate, required for curve negotiation, mainly through the friction shoes and wear plates
• Transmission of longitudinal braking forces, also through the friction shoes
• Limitation of excessive relative displacements through the bolster gibs
Examining these functions it is important to note that the friction shoes are involved in four of the eight interactions between side frame and bolster. The non-rigid connection between side frame and bolster permits relative motion in six degrees of freedom and consequently transmits six generalized forces— three forces and three moments— between the friction shoes and wear plates.
The tapered surface of the friction shoes presses against the mating surface of the bol- ster, and the wedge action results in a normal force between the vertical shoe surface and the wear plate. This is generally referred to as the column pressure. The two shoes at each bolster end load each other. Relative vertical or lateral displacement of the bolster gives rise to corresponding friction forces. Braking forces are transmitted by increasing friction forces on the rear shoe unless the column load is exceeded which results in gib contact. Relative bolster roll, in which plane contact between friction shoe and wear plate is maintained, applies a roll friction moment on the side frame column.
The remaining two rotations, relative pitch and yaw, give rise to more complex interactions as both the slanting and vertical surfaces can no longer remain in plane contact with the bolster and wear plate, respectively. The resulting edge-to-surface contact is an important cause of wear, both in the bolster pocket and at the upper and lower edges of the vertical shoe surface. The high restoring moment in yaw, also in pitch, occurs when the side frame is yawed with respect to the bolster and plane'contact at either the sloping or vertical surfaces
of the friction shoes changes to contact at diametrically opposite wear plates or contact points in the bolster pockets. Rotation of this diagonal into the center plane of the side frame thus requires that the distance between opposing friction shoes be shortened. The friction shoes thus move closer together, and in so doing slide inward along the slanted mating surfaces with the bolster. This causes additional compression on the snubber spring, and since the vertical load has not changed, there is a slight rise in the bolster with respect to the side frame in the case of load-dependent snubbing. The potential energy of elastic deformation is merely redistributed between the suspension and snubber springs. Thus, yaw rotation increases the potential energy of the system by raising the weight carried by the bolster. For load independent snubbing, where the snubber spring is based on the bolster, the entire potential energy is stored in the snubber spring. In either case, the reactions due to skew are applied at diagonally opposite edges of the side frame column, thus providing a yaw restoring couple.
All of the load paths discussed above were considered in the design of the Friction Snubber Force Measurement System (FSFMS).
MANUFACTURING TECHNOLOGY AND CONCEPTUAL DESIGN
The technology applied to the FSFMS was available in the field of towing tank testing where "force blocks" are utilized to measure the forces and moments applied between a moving carriage and a towed ship model. A force block is a hollow, roughly cubical block of alloy steel mounted at opposite sides to the objects between which forces are to be measured. The other four sides are machined so as to leave short cantilever beams instrumented with strain gages to measure bending stresses resulting from shears applied at the mounting surfaces. Additional strain gages are provided for nulling stresses due to normal forces.
In measuring several degrees of freedom, the load path must pass through each transducer in turn. In other words, the transducers must be in series or cascaded. Cross coupling of signals is minimized by making the blocks very stiff in both shear and compression along all axes not used for measurement. In the case of the FSFMS, an additional requirement was symmetry of the load path in order to preclude unsymmetrical deflections that would alter the contact geometry between the friction shoe and the wear plate. In addition, all force blocks had to fit within the envelope of the side frame.
The original design concept of the FSFMS is shown in Figure 1. The wear plate is welded to an adapter which in turn is bolted to a single vertical force block. The opposite face of the force block is bolted to an adapter to which a pair of latere! force blocks are mounted. Two normal force blocks are attached above and below, and are in turn bolted to an adapter rigidly mounted on the side frame. The adapter between the vertical and lateral force block divides the
60
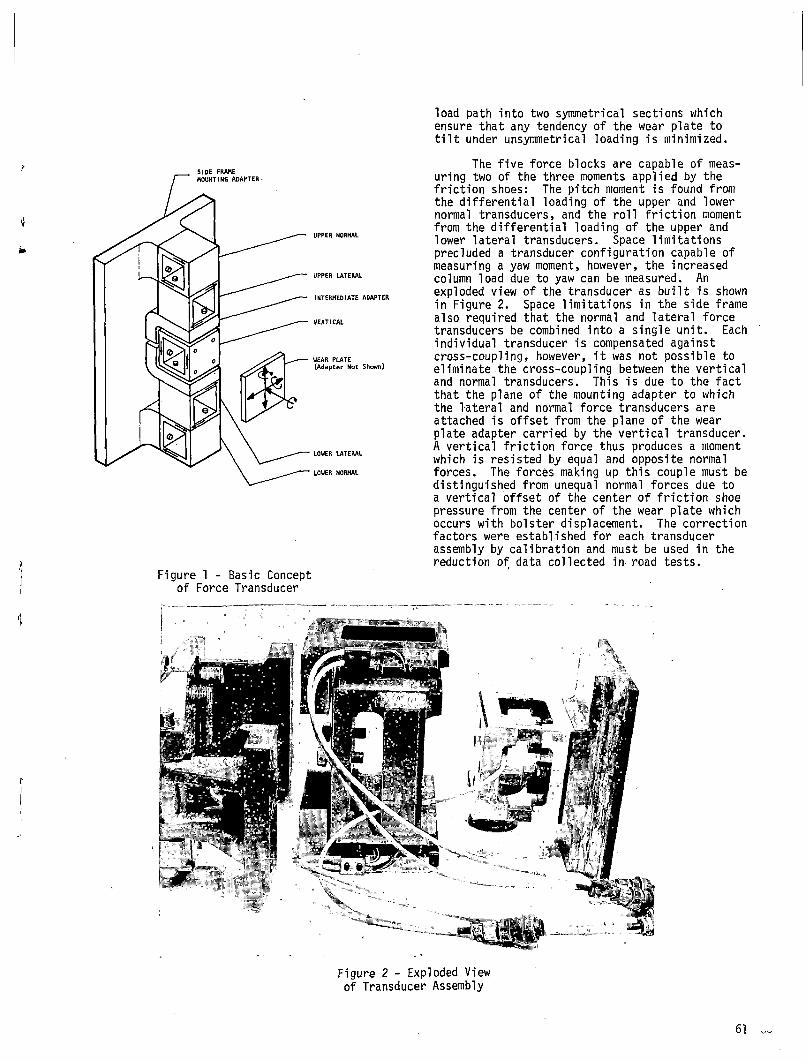
S ID E FRAME MOUNTING ADAPTER
Figure 1 - Basic Concept of Force Transducer
load path into two symmetrical sections which ensure that any tendency of the wear plate to tilt under unsymmetrical loading is minimized.
The five force blocks are capable of measuring two of the three moments applied by the friction shoes: The pitch moment is found fromthe differential loading of the upper and lower normal transducers, and the roll friction moment from the differential loading of the upper and lower lateral transducers. Space limitations precluded a transducer configuration capable of measuring a yaw moment, however, the increased column load due to yaw can be measured. An exploded view of the transducer as built is shown in Figure 2. Space limitations in the side frame also required that the normal and lateral force transducers be combined into a single unit. Each individual transducer is compensated against cross-coupling, however, it was not possible to eliminate the cross-coupling between the vertical and normal transducers. This is due to the fact that the plane of the mounting adapter to which the lateral and normal force transducers are attached is offset from the plane of the wear plate adapter carried by the vertical transducer. A vertical friction force thus produces a moment which is resisted by equal and opposite normal forces. The forces making up this couple must be distinguished from unequal normal forces due to a vertical offset of the center of friction shoe pressure from the center of the wear plate which occurs with bolster displacement. The correction factors were established for each transducer assembly by calibration and must be used in the reduction of data collected in road tests.
Figure 2 - Exploded View of Transducer Assembly
61
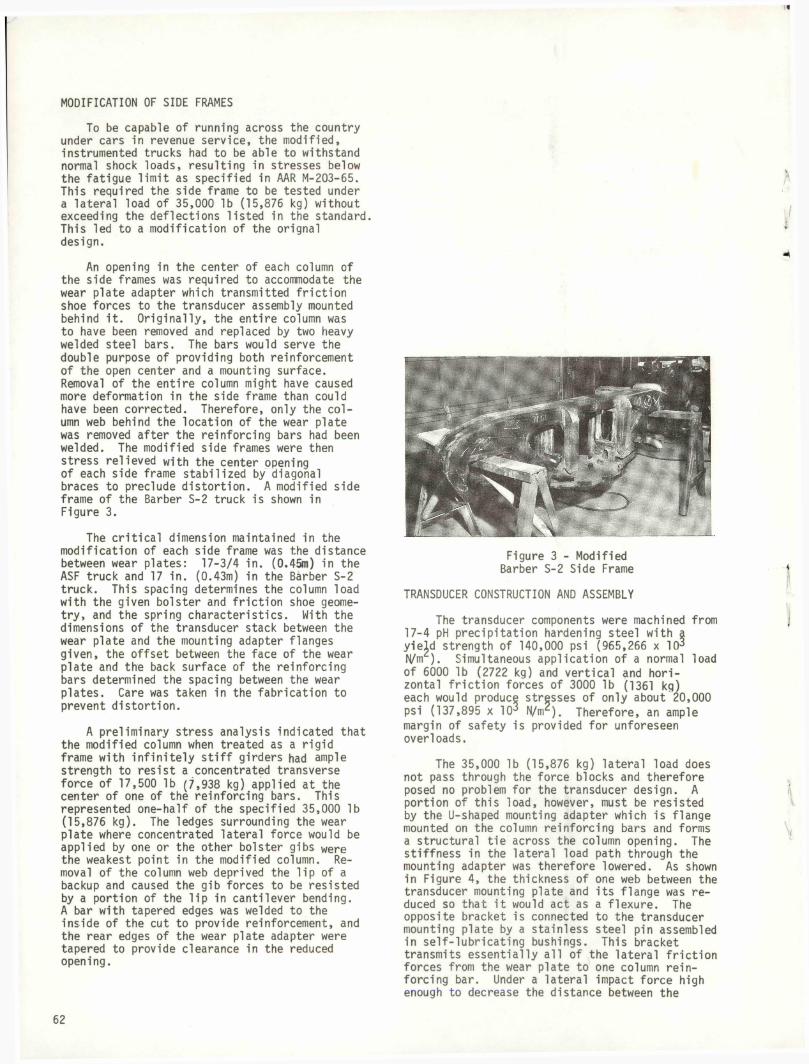
MODIFICATION OF SIDE FRAMES
To be capable of running across the country under cars in revenue service, the modified, instrumented trucks had to be able to withstand normal shock loads, resulting in stresses below the fatigue limit as specified in AAR M-203-65. This required the side frame to be tested under a lateral load of 35,000 lb (15,876 kg) without exceeding the deflections listed in the standard This led to a modification of the orignal design.
An opening in the center of each column of the side frames was required to accommodate the wear plate adapter which transmitted friction shoe forces to the transducer assembly mounted behind it. Originally, the entire column was to have been removed and replaced by two heavy welded steel bars. The bars would serve the double purpose of providing both reinforcement of the open center and a mounting surface. Removal of the entire column might have caused more deformation in the side frame than could have been corrected. Therefore, only the column web behind the location of the wear plate was removed after the reinforcing bars had been welded. The modified side frames were then stress relieved with the center opening of each side frame stabilized by diagonal braces to preclude distortion. A modified side frame of the Barber S-2 truck is shown in Figure 3.
The critical dimension maintained in the modification of each side frame was the distance between wear plates: 17-3/4 in. (0.45m) in theASF truck and 17 in. (0.43m) in the Barber S-2 truck. This spacing determines the column load with the given bolster and friction shoe geometry, and the spring characteristics. With the dimensions of the transducer stack between the wear plate and the mounting adapter flanges given, the offset between the face of the wear plate and the back surface of the reinforcing bars determined the spacing between the wear plates. Care was taken in the fabrication to prevent distortion.
A preliminary stress analysis indicated that the modified column when treated as a rigid frame with infinitely stiff girders had ample strength to resist a concentrated transverse force of 17,500 lb (7,938 kg) applied at the center of one of the reinforcing bars. This represented one-half of the specified 35,000 lb (15,876 kg). The ledges surrounding the wear plate where concentrated lateral force would be applied by one or the other bolster gibs were the weakest point in the modified column. Removal of the column web deprived the lip of a backup and caused the gib forces to be resisted by a portion of the lip in cantilever bending.A bar with tapered edges was welded to the inside of the cut to provide reinforcement, and the rear edges of the wear plate adapter were tapered to provide clearance in the reduced opening.
Figure 3 - Modified Barber S-2 Side Frame
TRANSDUCER CONSTRUCTION AND ASSEMBLY
The transducer components were machined from 17-4 pH precipitation hardening steel with a yield strength of 140,000 psi (965,266 x 103 N/nr). Simultaneous application of a normal load of 6000 lb (2722 kg) and vertical and horizontal friction forces of 3000 lb (1361 kg) each would produce stresses of only about 20,000 psi (137,895 x 1CH N/m2). Therefore, an ample margin of safety is provided for unforeseen overloads.
The 35,000 lb (15,876 kg) lateral load does not pass through the force blocks and therefore posed no problem for the transducer design. A portion of this load, however, must be resisted by the U-shaped mounting adapter which is flange mounted on the column reinforcing bars and forms a structural tie across the column opening. The stiffness in the lateral load path through the mounting adapter was therefore lowered. As shown in Figure 4, the thickness of one web between the transducer mounting plate and its flange was reduced so that it would act as a flexure. The opposite bracket is connected to the transducer mounting plate by a stainless steel pin assembled in self-lubricating bushings. This bracket transmits essentially all of the lateral friction forces from the wear plate to one column reinforcing bar. Under a lateral impact force high enough to decrease the distance between the
h
I
\
62
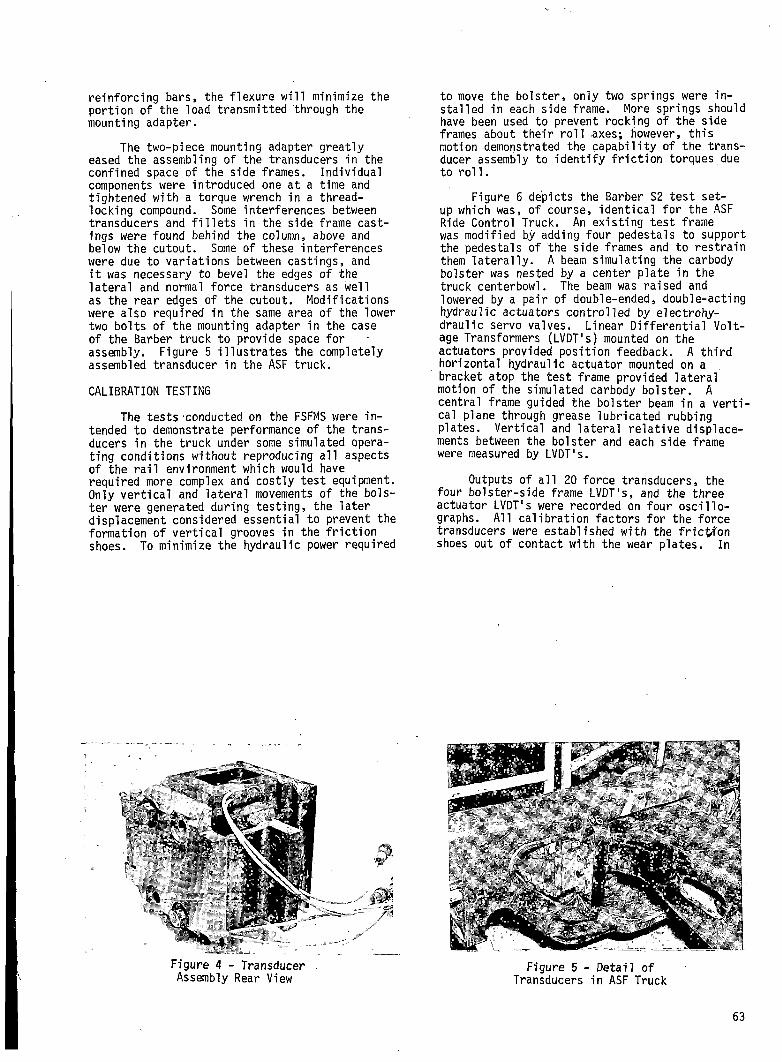
reinforcing bars, the flexure will minimize the portion of the load transmitted through the mounting adapter.
The two-piece mounting adapter greatly eased the assembling of the transducers in the confined space of the side frames. Individual components were introduced one at a time and tightened with a torque wrench in a threadlocking compound. Some interferences between transducers and fillets in the side frame castings were found behind the column, above and below the cutout. Some of these interferences were due to variations between castings, and it was necessary to bevel the edges of the lateral and normal force transducers as well as the rear edges of the cutout. Modifications were also required in the same area of the lower two bolts of the mounting adapter in the case of the Barber truck to provide space for assembly. Figure 5 illustrates the completely assembled transducer in the ASF truck.
CALIBRATION TESTING
The tests conducted on the FSFMS were intended to demonstrate performance of the transducers in the truck under some simulated operating conditions without reproducing all aspects of the rail environment which would have required more complex and costly test equipment. Only vertical and lateral movements of the bolster were generated during testing, the later displacement considered essential to prevent the formation of vertical grooves in the friction shoes. To minimize the hydraulic power required
Figure 4 - Transducer Assembly Rear View
to move the bolster, only two springs were installed in each side frame. More springs should have been used to prevent rocking of the side frames about their roll axes; however, this motion demonstrated the capability of the transducer assembly to identify friction torques due to rol1.
Figure 6 depicts the Barber S2 test setup which was, of course, identical for the ASF Ride Control Truck. An existing test frame was modified by adding four pedestals to support the pedestals of the side frames and to restrain them laterally. A beam simulating the carbody bolster was nested by a center plate in the truck centerbowl. The beam was raised and lowered by a pair of double-ended, double-acting hydraulic actuators controlled by electrohy- draulic servo valves. Linear Differential Voltage Transformers (LVDT's) mounted on the actuators provided position feedback. A third horizontal hydraulic actuator mounted on a bracket atop the test frame provided lateral motion of the simulated carbody bolster. A central frame guided the bolster beam in a vertical plane through grease lubricated rubbing plates. Vertical and lateral relative displacements between the bolster and each side frame were measured by LVDT's.
Outputs of all 20 force transducers, the four bolster-side frame LVDT's, and the three actuator LVDT's were recorded on four oscillographs. All calibration factors for the force transducers were established with the friction shoes out of contact with the wear plates. In
Figure 5 - Detail of Transducers in ASF Truck
63
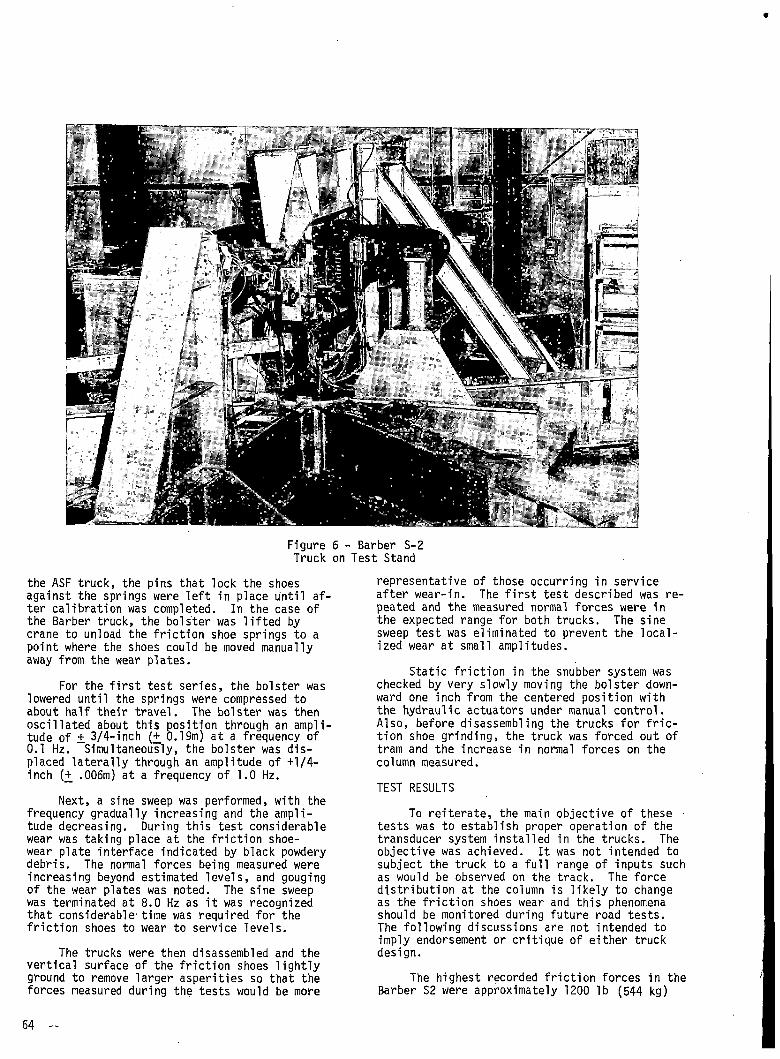
Figure 6 - Barber S-2 Truck on Test Stand
the ASF truck, the pins that lock the shoes against the springs were left in place until after calibration was completed. In the case of the Barber truck, the bolster was lifted by crane to unload the friction shoe springs to a point where the shoes could be moved manually away from the wear plates.
For the first test series, the bolster was lowered until the springs were compressed to about half their travel. The bolster was then oscillated about this position through an amplitude of + 3/4-inch (+ 0.19m) at a frequency of0.1 Hz. Simultaneously, the bolster was displaced laterally through an amplitude of +1/4- inch (+ .006m) at a frequency of 1.0 Hz.
Next, a sine sweep was performed, with the frequency gradually increasing and the amplitude decreasing. During this test considerable wear was taking place at the friction shoe- wear plate interface indicated by black powdery debris. The normal forces being measured were increasing beyond estimated levels, and gouging of the wear plates was noted. The sine sweep was terminated at 8.0 Hz as it was recognized that considerable'time was required for the friction shoes to wear to service levels.
The trucks were then disassembled and the vertical surface of the friction shoes lightly ground to remove larger asperities so that the forces measured during the tests would be more
representative of those occurring in service after wear-in. The first test described was repeated and the measured normal forces were in the expected range for both trucks. The sine sweep test was eliminated to prevent the localized wear at small amplitudes.
Static friction in the snubber system was checked by very slowly moving the bolster downward one inch from the centered position with the hydraulic actuators under manual control. Also, before disassembling the trucks for friction shoe grinding, the truck was forced out of tram and the increase in normal forces on the column measured.
TEST RESULTS
To reiterate, the main objective of these tests was to establish proper operation of the transducer system installed in the trucks. The objective was achieved. It was not intended to subject the truck to a full range of inputs such as would be observed on the track. The force distribution at the column is likely to change as the friction shoes wear and this phenomena should be monitored during future road tests.The following discussions are not intended to imply endorsement or critique of either truck design.
The highest recorded friction forces in the Barber S2 were approximately 1200 lb (544 kg)
64
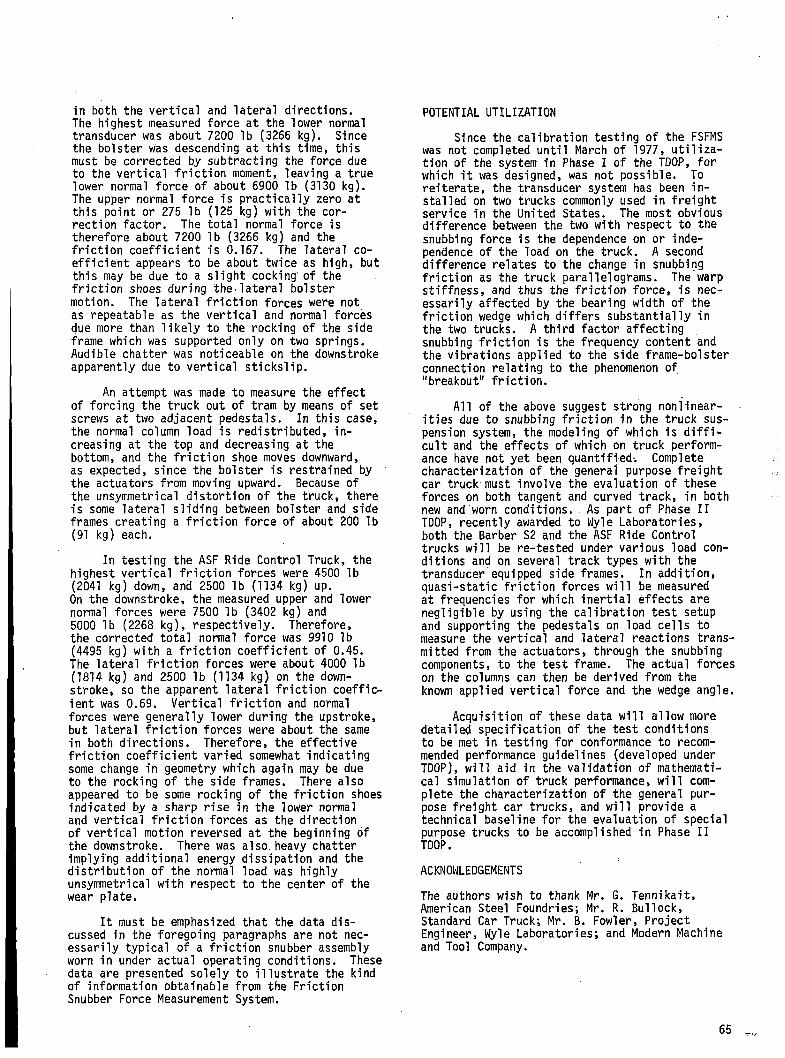
in both the vertical and lateral directions.The highest measured force at the lower normal transducer was about 7200 lb (3266 kg). Since the bolster was descending at this time, this must be corrected by subtracting the force due to the vertical friction moment, leaving a true lower normal force of about 6900 lb (3130 kg). The upper normal force is practically zero at this point or 275 lb (125 kg) with the correction factor. The total normal force is therefore about 7200 lb (3266 kg) and the friction coefficient is 0.167. The lateral coefficient appears to be about twice as high, but this may be due to a slight cocking of the friction shoes during the-lateral bolster motion. The lateral friction forces were not as repeatable as the vertical and normal forces due more than likely to the rocking of the side frame which was supported only on two springs. Audible chatter was noticeable on the downstroke apparently due to vertical stickslip.
An attempt was made to measure the effect of forcing the truck out of tram by means of set screws at two adjacent pedestals. In this case, the normal column load is redistributed, increasing at the top and decreasing at the bottom, and the friction shoe moves downward, as expected, since the bolster is restrained by the actuators from moving upward. Because of the unsymmetrical distortion of the truck, there is some lateral sliding between bolster and side frames creating a friction force of about 200 lb (91 kg) each.
In testing the ASF Ride Control Truck, the highest vertical friction forces were 4500 lb (2041 kg) down, and 2500 lb (1134 kg) up.On the downstroke, the measured upper and lower normal forces were 7500 lb (3402 kg) and 5000 lb (2268 kg), respectively. Therefore, the corrected total normal force was 9910 lb (4495 kg) with a friction coefficient of 0.45.The lateral friction forces were about 4000 lb (1814 kg) and 2500 lb (1134 kg) on the down- stroke, so the apparent lateral friction coefficient was 0.69. Vertical friction and normal forces were generally lower during the upstroke, but lateral friction forces were about the same in both directions. Therefore, the effective friction coefficient varied somewhat indicating some change in geometry which again may be due to the rocking of the side frames. There also appeared to be some rocking of the friction shoes indicated by a sharp rise in the lower normal and vertical friction forces as the direction of vertical motion reversed at the beginning of the downstroke. There was also heavy chatter implying additional energy dissipation and the distribution of the normal load was highly unsymmetrical with respect to the center of the wear plate.
It must be emphasized that the data discussed in the foregoing paragraphs are not necessarily typical of a friction snubber assembly worn in under actual operating conditions. These data are presented solely to illustrate the kind of information obtainable from the Friction Snubber Force Measurement System.
POTENTIAL UTILIZATION
Since the calibration testing of the FSFMS was not completed until March of 1977, utilization of the system in Phase I of the TD0P, for which it was designed, was not possible. To reiterate, the transducer system has been installed on two trucks commonly used in freight service in the United States. The most obvious difference between the two with respect to the snubbing force is the dependence on or independence of the load on the truck. A second difference relates to the change in snubbing friction as the truck parallelograms. The warp stiffness, and thus the friction force, is necessarily affected by the bearing width of the friction wedge which differs substantially in the two trucks. A third factor affecting snubbing friction is the frequency content and the vibrations applied to the side frame-bolster connection relating to the phenomenon of "breakout" friction.
All of the above suggest strong nonlinearities due to snubbing friction in the truck suspension system, the modeling of which is difficult and the effects of which on truck performance have not yet been quantified-. Complete characterization of the general purpose freight car truck must involve the evaluation of these forces on both tangent and curved track, in both new and worn conditions. . As part of Phase II TD0P, recently awarded to Wyle Laboratories, both the Barber S2 and the ASF Ride Control trucks will be re-tested under various load conditions and on several track types with the transducer equipped side frames. In addition, quasi-static friction forces will be measured at frequencies for which inertial effects are negligible by using the calibration test setup and supporting the pedestals on load cells to measure the vertical and lateral reactions transmitted from the actuators, through the snubbing components, to the test frame. The actual forces on the columns can then be derived from the known applied vertical force and the wedge angle.
Acquisition of these data will allow more detailed specification of the test conditions to be met in testing for conformance to recommended performance guidelines (developed under TD0P), will aid in the validation of mathematical simulation of truck performance, will complete the characterization of the general purpose freight car trucks, and will provide a technical baseline for the evaluation of special purpose trucks to be accomplished in Phase II TD0P.
ACKNOWLEDGEMENTS
The authors wish to thank Mr. G. Tennikait, American Steel Foundries; Mr. R. Bullock,Standard Car Truck; Mr. B. Fowler, Project Engineer, Wyle Laboratories; and Modern Machine and Tool Company.
65
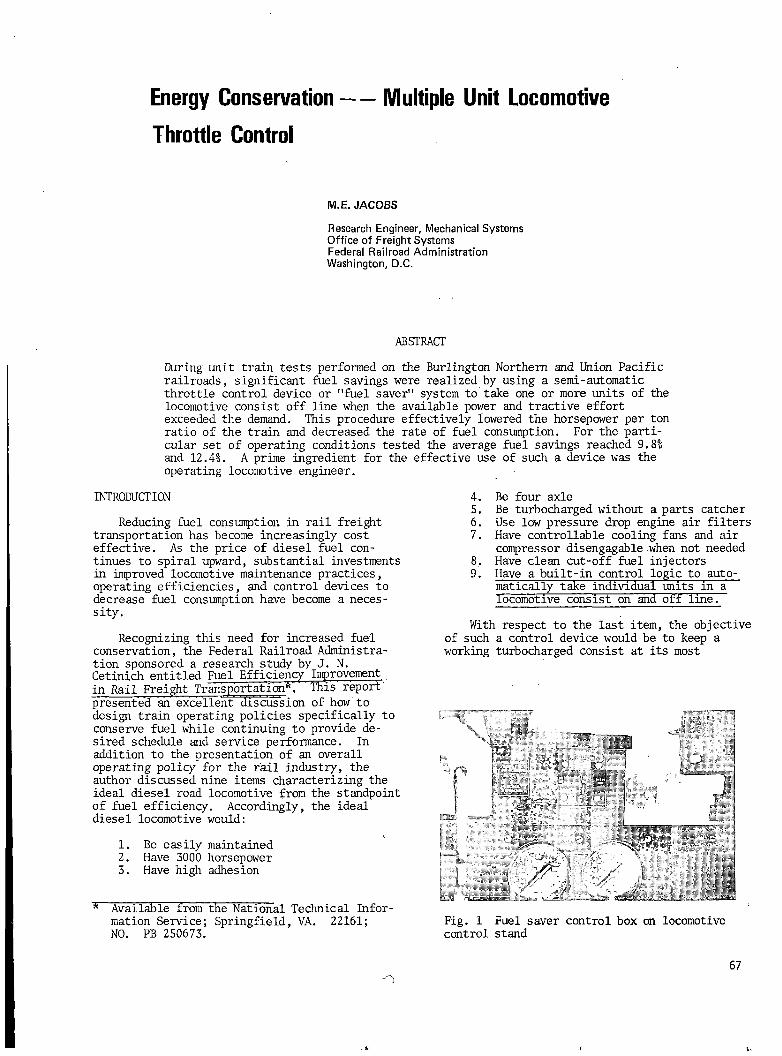
Energy Conservation — Multiple Unit Locomotive Throttle Control
M.E. JACOBS
Research Engineer, Mechanical Systems Office of Freight Systems Federal Railroad Administration Washington, D.C.
ABSTRACT
During unit train tests performed on the Burlington Northern and Union Pacific railroads, significant fuel savings were realized by using a semi-automatic throttle control device or "fuel saver" system to take one or more units of the locomotive consist off line when the available power and tractive effort exceeded the demand. This procedure effectively lowered the horsepower per ton ratio of the train and decreased the rate of fuel consumption. For the particular set of operating conditions tested the average fuel savings reached 9.81 and 12.41. A prime ingredient for the effective use of such a device was the operating locomotive engineer.
INTRODUCTION
Reducing fuel consumption in rail freight transportation has become increasingly cost effective. As the price of diesel fuel continues to spiral upward, substantial investments in improved locomotive maintenance practices, operating efficiencies, and control devices to decrease fuel consumption have become a necessity.
Recognizing this need for increased fuel conservation, the Federal Railroad Administration sponsored a research study by J. N.Cetinich entitled Fuel Efficiency Improvement in Rail Freight Transportation*, This report presented an excellent discussion of how to design train operating policies specifically to conserve fuel while continuing to provide desired schedule and service performance. In addition to the presentation of an overall operating policy for the rail industry, the author discussed nine items characterizing the ideal diesel road locomotive from the standpoint of fuel efficiency. Accordingly, the ideal diesel locomotive would:
1. Be easily maintained2. Have 3000 horsepower3. Have high adhesion
4. Be four axle5. Be turbocharged without a parts catcher6 . Use low pressure drop engine air filters7. Have controllable cooling fans and air
compressor disengagable when not needed8. Have clean cut-off fuel injectors9. Have a built-in control logic to auto
matically take individual units in a locomotive consist on and off line.
With respect to the last item, the objective of such a control device would be to keep a working turbocharged consist at its most
"* Available from the National Technical Information Service; Springfield, VA. 22161; Fig. 1 Fuel saver control box on locomotiveNO. PB 250673. control stand
67
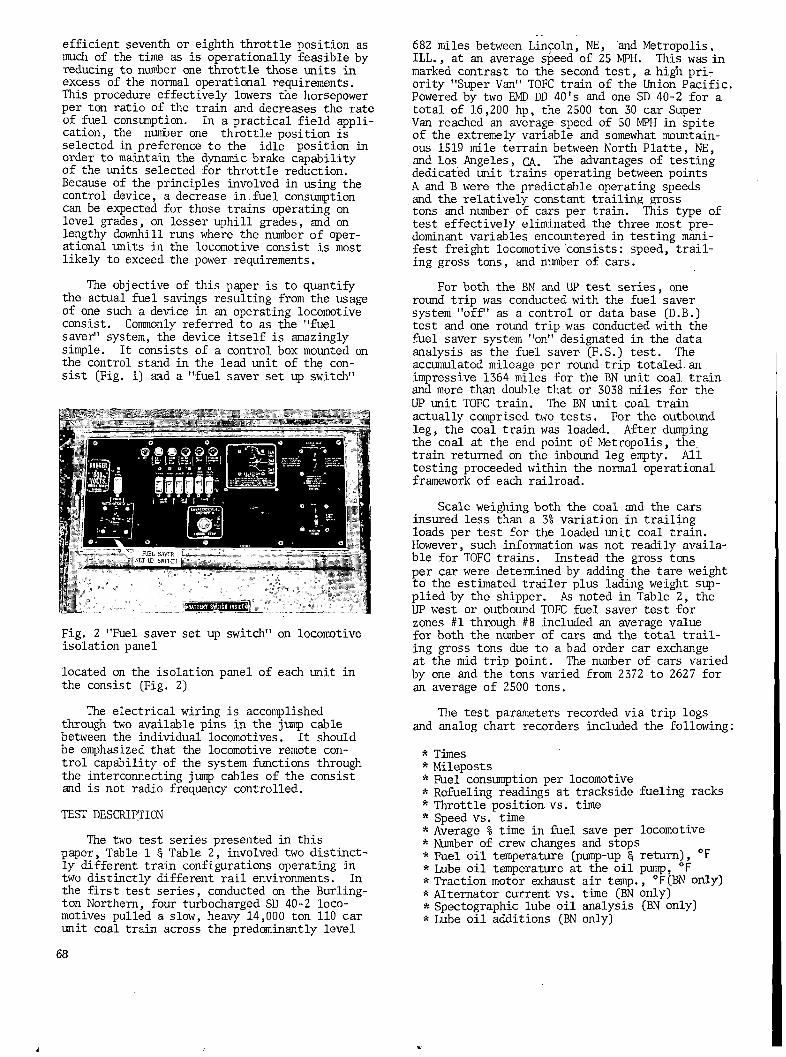
efficient seventh or eighth throttle position as much of the time as is operationally feasible by reducing to number one throttle those units in excess of the normal operational requirements. This procedure effectively lowers the horsepower per ton ratio of the train and decreases the rate of fuel consumption. In a practical field application, the number one throttle position is selected in preference to the idle position in order to maintain the dynamic brake capability of the units selected for throttle reduction. Because of the principles involved in using the control device, a decrease in,fuel consumption can be expected for those trains operating on level grades, on lesser uphill grades, and on lengthy downhill runs where the number of operational units in the locomotive consist is most likely to exceed the power requirements.
The objective of this paper is to quantify the actual fuel savings resulting from the usage of one such a device in an operating locomotive consist. Commonly referred to as the "fuel saver" system, the device itself is amazingly sinple. It consists of a control box mounted on the control stand in the lead unit of the consist (Fig. 1) and a "fuel saver set up switch"
Fig. 2 "Fuel saver set up switch" on locomotive isolation panel
located on the isolation panel of each unit in the consist (Fig. 2)
The electrical wiring is accomplished through two available pins in the jump cable between the individual locomotives. It should be emphasized that the locomotive remote control capability of the system functions through the interconnecting jump cables of the consist and is not radio frequency controlled.
TEST DESCRIPTION
The two test series presented in this paper, Table 1 § Table 2, involved two distinctly different train configurations operating in two distinctly different rail environments. In the first test series, conducted on the Burlington Northern, four turbocharged SD 40-2 locomotives pulled a slow, heavy 14,000 ton 110 car unit coal train across the predominantly level
682 miles between Lincoln, NE, and Metropolis. ILL., at an average speed of 25 MPH. This was in marked contrast to the second test, a high priority "Super Van" TOFC train of the Union Pacific. Powered by two EMD DD 40's and one SD 40-2 for a total of 16,200 hp, the 2500 ton 30 car Super Van reached an average speed of 50 MPH in spite of the extremely variable and somewhat mountainous 1519 mile terrain between North Platte, NE, and Los Angeles, CA. The advantages of testing dedicated unit trains operating between points A and B were the predictable operating speeds and the relatively constant trailing gross tons and number of cars per train. This type of test effectively eliminated the three most predominant variables encountered in testing manifest freight locomotive consists: speed, trailing gross tons, and number of cars.
For both the BN and UP test series, one round trip was conducted with the fuel saver system "off" as a control or data base (D.B.) test and one round trip was conducted with the fuel saver system "on" designated in the data analysis as the fuel saver (F.S.) test. The accumulated mileage per round trip totaled, an impressive 1364 miles for the BN unit coal train and more than double that or 3038 miles for the UP unit TOFC train. The BN unit coal train actually comprised two tests. For the outbound leg, the coal train was loaded. After dumping the coal at the end point of Metropolis,, the train returned on the inbound leg empty. All testing proceeded within the normal operational framework of each railroad.
Scale weighing both the coal and the cars insured less than a 3% variation in trailing loads per test for the loaded unit coal train. However, such information was not readily available for TOFC trains. Instead the gross tons per car were determined by adding the tare weight to the estimated trailer plus lading weight supplied by the shipper. As noted in Table 2, the UP west or outbound TOFC fuel saver test for zones #1 through #8 included an average value for both the number of cars and the total trailing gross tons due to a bad order car exchange at the mid trip point. The number of cars varied by one and the tons varied from 2372 to 2627 for an average of 2500 tons.
The test parameters recorded via trip logs and analog chart recorders included the following:
* Times* Mileposts* Fuel consumption per locomotive* Refueling readings at trackside fueling racks* Throttle position, vs. time* Speed vs. time* Average % time in fuel save per locomotive* Number of crew changes and stops* Fuel oil temperature (pump-up 8 return), °F* Lube oil temperature at the oil pump, °F* Traction motor exhaust air temp., 0FtBN only)* Alternator current vs. time (BN only)* Spectographic lube oil analysis (BN only)* Lube oil additions (BN only)
68

Table 1 BN Unit Coal TrainSummary of Fuel Saver Test Results
LOADED COAL TRAIN INIOADED COAL TRAINOPERATING CONDITIONS* TEST ZONES 1 TO 6 TEST ZCNES 6 TO 1
D.B.TESI F.S.TEST 4 DIFF. D.B. TEST F.S. TEST 4 DIFF.
1. TOTAL HP (SD 40-2, POUR)** 12000 12000 12000 12000
2. NIMBER OF GOAL CARS 110 110 110 110
3. SCALE WEIGHT OF CARS, TONS 14,368 13,958 - 2.8 3370 3375 ♦ 0.1
4. AVER. CABOOSE NT., TONS 27 27 27 27
5. TRAILING GROSS TONS, TGT 14,395 13,985 - 2.8 3397 5402 ♦ 0.1
6. HP/TGT .83 .86 ♦ 3.6 3.53 3.53
7. MILES TRAVELED 682.1 682.1 682.1 682.1
8. 1 TOT. MII£S/©AD£ RANGE
a. LEVEL 0 l. 0.494 79.4 79.5
h. ° -s0 ■ 0.701 9. S 8. 20.71 - 1.501 0.91.51 - 2.501 0. 0 0. 0
c. DF.VENT 0.50 - 0.704 8. 3 9. 20.71 1.504 1.91.51 2.504 0.0 0.0
9. TOTAL TIME IN MOTION, HR. 27.90 29.15 ♦ 4.5 27.54 23.90 - 13.2
10. AVER. SPEED, MW 24.4 23.4 - 4.1 24.6 26.5 ♦ 14.9
11. NIMBER OF CREWS 6 6 6 6 0
12. NIMBER CF STOPS 31 27 -12.9 32 31 - 3.1
13. AVER. 4 TIME IN FUEL SAVE *«•
14. AVER. 4 TIMS/IHROITLE NO.
a. IDLE (IN MOTION) 8.0 9.0 ♦ 12.5 6.1 7.2 ♦ 18.0b. THKOTTIE 11 7.7 10.7 ♦ 39.0 12.5 8.1 - 35.2c. THROTTLE #2 13.9 7.0 -49.6 20.0 6.2 • 69.0d. THROTTLE 13 12.4 6.3 -49.2 11.7 5.2 - 55.Se. THROTTLE #4 10.7 4.6 -57.0 13.1 7.4 - 43.5f. THROTTLE IS 10.1 6.9 -31.7 9.5 5.8 - 38.9g. THROTTLE #6 7.5 5.7 -24.0 5.5 5.4 - 1.8h. THROTTLE 17 4.3 4.7 ♦ 9.3 5.0 7.7 ♦ 54.0i . THROTTLE #8 25.4 45.1 ♦ 77.6 16.6 47.0 ♦ 183.0
15. FUEL CCMSLMOTICN, GALS. 7566 7700 ♦ 1.8 6278 4927 - 21.5
16. tg im/gal. 1297.8 1238.8 - 4.5 369.1 471.0 ♦ 27.6
17. GAL./1000 TGIW 0.77 0.81 ♦ 5.2 2.71 2.12 - 21.8
• TEST DATES: FEB. 14-22, 1977 •• SAME LOCCKTriVE CCNSIST FOR All. TESTS *• * INCCMPLEIE nATA
To aid in the subsequent analysis, the above data was supplemented with track profiles, track diagrams, and mileage tables. All speeds, temperatures, throttle positions, and alternator currents were recorded for the lead locomotive only. In addition, a set numeric order for manually recording all other pertinent locomotive data was established and adhered to throughout the tests.
The locomotives assigned to both test consists had all been screened for potential problems in regularly scheduled fifteen or thirty day inspections just prior to testing. Hence their performance characteristics and fuel efficiencies were considered to be typical of the average locomotive operating under similar conditions. The designated lead and trailing power units never varied from one test to the next and were set up to operate in the fuel save mode either individually or in a preset combination. Although all SD 40-2 locomotives could be operated independently in fuel save, both power units of the 6600 hp DD 40 were wired to simultaneously reduce power when in fuel save . In this case the DD 40 represents a special class of locomotive. The decision to monitor the two power plants as a single unit was based on the prevailing route profile grades and the relative
Table 2 UP Unit TOFC TrainSummary of Fuel Saver Test Results
OPERATING CCKDITICNSWESTBOUND TEST ZONES 1 TO 6 WESTBOtND TEST ZCNS 1,2,84 EASTBOtHD TEST ZONES 1,2,44
D.B. TESTF.S. TEST 1 DIFF. D.B. TESTF.S.TEST 1 DIFF. D.B. TESTF.S.TEST \ DIFF
1. TOTAL HP 16,200 16,200 16,200 16,200 16,200 16,2002.
a. LOADS) CARS 34 31* 34 32 46 31(21BOX)2 1 2 1e. TCFC CARS ALL Birr 3 All. ALL BUT 3 ALL
3. AVBt. CABOOSE ITT., TINS 27 27 27 27 27 274. TRAILING GROSS TOiS, TUT 2S01 2500* 0.0 2S01 2627 ♦ s’.o 3233 ■ 31S5 • 2.4S. KP/TCT 6.48 6.48 0.0 6.48 6.17 - 4.8 S.01 5.23 ♦ 2.46. MILES TRAVELED 1519 1S19 605 605 605 60S7. TOTAL TOC IN MOTION, HI. 31.38 29.70 - 5.4 11.70 11.21 - 4.2 11.03 11.36 ♦ 3.08. AVER. SPEED, WH 48.6 51.5 ♦ 5.6 51.9 S4.5 *4.9 SS.3 53.4 - 3.59. NLM3ER OF OEMS 8 8 3 3 3 310. HJMBER CP STOPS 6 9 3 4 3 411. AVER, t THE IN HZL SAVE
a. LEAD POWER UNIT 0 .. 0 ti 0 0.0b. 3RD POWER UNIT 0 0c. 4th, Sth POWER WITS 0 47.4
12 AVBt. \ TTMEnwOITlE NO.a. C-DYN. BRAXE, IDLE 30.3 42.9 ♦41.6 23.5 23.0 - 2.1 . 25.6 26.4 ♦ 3.1b. THtOTTLE 1 2 4.1 3.5 -14.6 5.0 3.3 •34.03.4 •46.9 5.2d. THROTTLE 1 4 8.5 3.5 •58.8 10.6 -40.62.8 -67.4 5.8 •41.4
9.6 4.1 -57.3 7.1 S.9 -16.99.6 7.5 •21.9 11.2 9.2 -17.8 9.7h. THtOTtlE 1 8 22.9 32.3 *41.0 31.6 42.4 ♦34.2 25.1 *77.7
IS RIEL (EfStMTICN, GAL.*** 12,145 10,641 •12.4 5274 4491 •14.9 4617 4240 • 8.214 TGWGAL 312.8 356.9 ♦14.1 286.9 353.9 •23.3 423.6 4S0.2 ♦ 6.3IS GAiyiOOO TT7IM 3.20 2.60 • 12.S 3.49 2.63 -18.9 2.36 2.22 - 5.9
• AVERAGE: CAR EXCHANGE AT HID TRIP POINT. ** U5H) BUT NOT REODRDS)M* MESTRXND DOMES SOC DERIVED DATA
NOTES1. TEST DATES: MARCH 29, 1977 TO APRIL S, 19772. SAM LOCOCTIVE CONSIST AND ORDER FOR ALL TESIS
LEAD, 12 <3 14, »SHM0 SD 40-2 CD 40 6600hp JOOOhp 6600hp
ly high track speeds.
To record diesel fuel consumption to the nearest gallon, two calibrated volumetric flow meters were installed in each of the four locomotives of the BN unit coal train and in each of the five power plants of the three locomotive UP unit TOFC train. The difference in meter readings between the supply line and the return line to the fuel tank indicated the fuel consumed per locomotive. The meter readings were recorded manually at. the end of each test zone as well as for any delay encountered. Because of the number of crew changes per test and the importance of the locomotive engineer in evaluating the performance of the fuel saver system, a test zone was defined as that distance traveled before a crew change occurred.
In addition to the on-board meters, track- side tank refueling readings were also recorded, where possible, to determine a comparability factor between the on-board meter readings and the quantity of fuel supplied to each fuel tank. For the purpose of these tests, the BN installed in the pump line of their refueling racks an accurate high volume flow meter calibrated by the Nebraska Bureau of Weights and Measures. The most recent calibration dates of the UP track- side refueling meters were not known, but the meters themselves were less than a year and a half old.
69
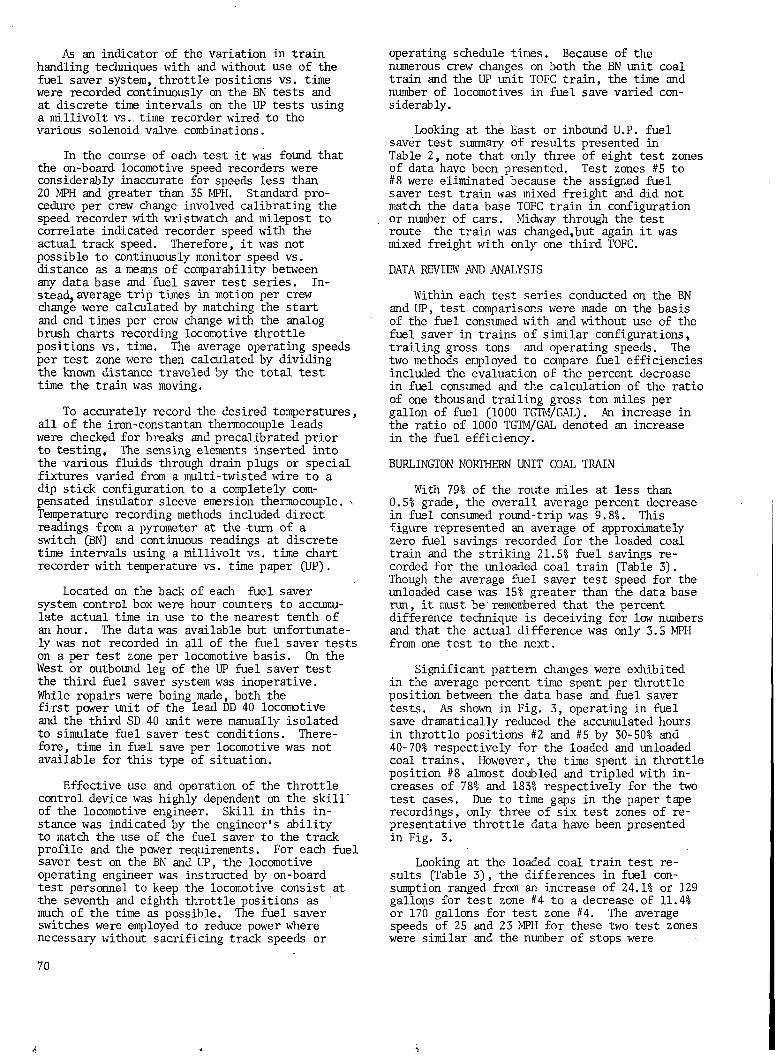
As an indicator of the variation in train handling techniques with and without use of the fuel saver system, throttle positions vs. time were recorded continuously on the BN tests and at discrete time intervals on the UP tests using a millivolt vs. time recorder wired to the various solenoid valve combinations.
In the course of each test it was found that the on-board locomotive speed recorders were considerably inaccurate for speeds less than 20 MPH and greater than 35 MPH. Standard procedure per crew change involved calibrating the speed recorder with wristwatch and milepost to correlate indicated recorder speed with the actual track speed. Therefore, it was not possible to continuously monitor speed vs. distance as a means of comparability between any data base and fuel saver test series. Instead, average trip times in motion per crew change were calculated by matching the start and end times per crew change with the analog brush charts recording locomotive throttle positions vs. time. The average operating speeds per test zone were then calculated by dividing the known distance traveled by the total test time the train was moving.
To accurately record the desired temperatures, all of the iron-constantan thermocouple leads were checked for breaks and precalibrated prior to testing, The sensing elements inserted into the various fluids through drain plugs or special fixtures varied from a multi-twisted wire to a dip stick configuration to a conpletely compensated insulator sleeve emersion thermocouple. -■ Temperature recording methods included direct readings from a pyrometer at the -turn of a switch (BN) and continuous readings at discrete time intervals using a millivolt vs. time chart recorder with temperature vs. time paper (UP).
Located on the back of each fuel saver system control box were hour counters to accumulate actual time in use to the nearest tenth of an hour. The data was available but unfortunately was not recorded in all of the fuel saver tests on a per test zone per locomotive basis. On the West or outbound leg of the UP fuel saver test the third fuel saver system was inoperative.While repairs were being made, both the first power unit of the lead DD 40 locomotive and the third SD 40 unit were manually isolated to simulate fuel saver test conditions. Therefore, time in fuel save per locomotive was not available for this type of situation.
Effective use and operation of the throttle control device was highly dependent on the skill' of the locomotive engineer. Skill in this instance was indicated by the engineer's ability to match the use of the fuel saver to the track profile and the power requirements. For each fuel saver test on the BN and UP, the locomotive operating engineer was instructed by on-board test personnel to keep the locomotive consist at the seventh and eighth throttle positions as much of the time as possible. The fuel saver switches were employed to reduce power where necessary without sacrificing track speeds or
70
operating schedule times. Because of the numerous crew changes on both the BN unit coal train and the UP unit TOFC train, the time and number of locomotives in fuel save varied considerably.
Looking at the East or inbound U.P. fuel saver test summary of results presented in Table 2, note that only three of eight test zones of data have been presented. Test zones #5 to # 8 were eliminated because the assigned fuel saver test train was mixed freight and did not match the data base TOFC train in configuration or number of cars. Midway through the test route the train was changed, but again it was mixed freight with only one third TOFC.
DATA REVIEW AND ANALYSIS
Within each test series conducted on the BN and UP, test comparisons were made on the basis of the fuel consumed with and without use of the fuel saver in trains of similar configurations, trailing gross tons and operating speeds. The two methods employed to compare fuel efficiencies included the evaluation of the percent decrease in fuel consumed and the calculation of the ratio of one thousand trailing gross ton miles per gallon of fuel (1000 TGTM/GAL). An increase in the ratio of 1000 TGTM/GAL denoted an increase in the fuel efficiency.
BURLINGTON NORTHERN UNIT COAL TRAIN
With 79% of the route miles at less than 0.51 grade, the overall average percent decrease in fuel consumed round-trip was 9.8%. This figure represented an average of approximately zero fuel savings recorded for the loaded coal train and the striking 21.5% fuel savings recorded for the unloaded coal train (Table 3). Though the average fuel saver test speed for the unloaded case was 15% greater than the data base run, it must be'remembered that the percent difference technique is deceiving for low numbers and that the actual difference was only 3.5 MPH from one test to the next.
Significant pattern changes were exhibited in the average percent time spent per throttle position between the data base and fuel saver tests. As shown in Fig. 3, operating in fuel save dramatically reduced the accumulated hours in throttle positions #2 and #5 by 30-50% and 40-70% respectively for the loaded and unloaded coal trains. However, the time spent in throttle position #8 almost doubled and tripled with increases of 78% and 183% respectively for the two test cases. Due to time gaps in the paper tape recordings, only three of six test zones of representative throttle data have been presented in Fig. 3.
Looking at the loaded coal train test results (Table 3), the differences in fuel consumption ranged from an increase of 24.1% or 129 gallons for test zone #4 to a decrease of 11.4% or 170 gallons for test zone #4. The average speeds of 25 and 23 MPH for these two test zones were similar and the number of stops were
A, < 1
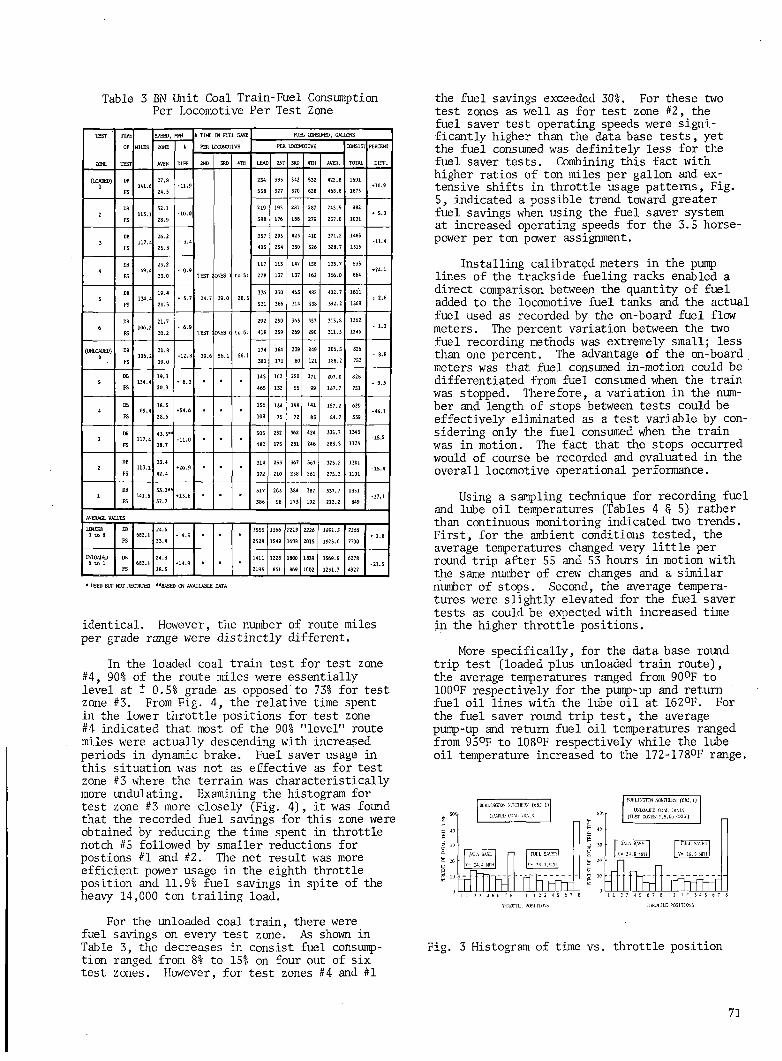
Table 3 BN Unit Coal Train-Fuel ConsumptionPer Locomotive Per Test Zone
TEST TYPE SPEED,MPH l TIME IN FUEL SAVE FUEL CONSUMED, GALLONSOF MILES ZONE 1 PER 10COMOTTVE PER LOCOMOTIVE CONSISTPERCENT
ZONE TEST AVER DIFF 2ND 3RD 4TO LEAD 2ND 3RD 4W AVER. TOTAL DIFF.
(LOADED) DB 141.627.8 •11.9
234 383 542 532 422.8 1691♦ 10.9
FS 24.5 558 327 370 620 463.6 187S
DB 32.1 -10.0219 195 261 287 245.S 982
* 5.0FS 28.9 388 176 188 279 2S7.8 1031
DB 26.2 357 295 423 410 371.2 UBS3 FS 117.4 2S.3
- 3.4405 254 330 326 328.7 1315
-11.4
DB69.4
23.2 117 113 147 156 133.7 535♦24.1
FS 23.0 TEST ONES 1to 5: 228 137 137 162 166.0 664
DB 19.4 336 330 463 482 402.7 16115
FS134,4
20. S♦ 5.7 24.7 39.0 28.5
S31 386 314 338 392.2 1569 : 2.6
DB 21.7 292 250 363 357 315.S 12626 FS
106,2 20.2- 6.9
TEST ONES fto 6: 418 269 269 290 311.5 1246
(UNLOADED) DB 21.8 56.1174 164 239 249 206.5 826
6 FS106.2
19.039.6 381 171 80 121 188.2 753
DB 19.3 145 162 250 271 207.0 828S FS 134.4 20.9
♦ 8.3465 132 55 99 187.7 751 - 9.3
DB 18.5 156 134 198 141 157.2 6294FS
69.428.6
♦54.6109 75 72 83 84.7 339
-46.1
DB 305 2S2 362 424 335.7 1343 -1S.63FS
117.4 38.7 -11.0‘ ' 482 175 231 246 283.5 1134
DB 33.4 314 253 367 267 325.2 13012FS
113.142.4
♦ 26.9372 210 258 261 275.2 1101 -15.4
1DB
141.633.2** ♦13.6 317 263 384 387 337.7 1351
-37.1FS 37.7 386 961,3 192 212.2 849
AVERAGE VALUESLOADED IB 24.5 1555 2566 2219 2226 1891.5 75661 to 6
FS682.1
23.4 - 4.52528 1549 1608 201S 192S.0 7700
♦ 1.8
UNLOADED DB 24.8 1411 1228 1800 1639 1569.5 62786 to 1 FS662.1
28.5♦14.9
2195 861 869 1002 1231.7 4927 -21.5
* USED BUT NOT RECORDED **8ASED ON AVAILABLE DATA
identical. However, the number of route miles per grade range were distinctly different.
In the loaded coal train test for test zone #4, 901 of the route miles were essentially level at t 0.51 grade as opposed’to 73% for test zone #3. From Fig. 4, the relative time spent in the lower throttle positions for test zone #4 indicated that most of the 90% "level" route miles were actually descending with increased periods in dynamic brake. Fuel saver usage in this situation was not as effective as for test zone #3 where the terrain was characteristically more undulating. Examining the histogram for test zone #3 more closely (Fig. 4), it was found that the recorded fuel savings for this zone were obtained by reducing the time spent in throttle notch #5 followed by smaller reductions for postions #1 and #2. The net result was more efficient power usage in the eighth throttle position and 11.9% fuel savings in spite of the heavy 14,000 ton trailing load.
For the unloaded coal train, there were fuel savings on every test zone. As shown in Table 3, the decreases in consist fuel consumption ranged from 8% to 15% on four out of six test zones. However, for test zones #4 and #1
the fuel savings exceeded 30%. For these two test zones as well as for test zone #2, the fuel saver test operating speeds were significantly higher than the data base tests, yet the fuel consumed was definitely less for the fuel saver tests. Combining this fact with higher ratios of ton miles per gallon and extensive shifts in throttle usage patterns, Fig.5, indicated a possible trend toward greater fuel savings when using the fuel saver system at increased operating speeds for the 3.5 horsepower per ton power assignment.
Installing calibrated meters in the pump lines of the trackside fueling racks enabled a direct comparison between the quantity of fuel added to the locomotive fuel tanks and the actual fuel used as recorded by the on-board fuel flow meters. The percent variation between the two fuel recording methods was extremely small; less than one percent. The advantage of the on-board meters was that fuel consumed in-motion could be differentiated from fuel consumed when the train was stopped. Therefore, a variation in the number and length of stops between tests could be effectively eliminated as a test variable by considering only the fuel consumed when the train was in motion. The fact that the stops occurred would of course be recorded and evaluated in the overall locomotive operational performance.
Using a sampling technique for recording fuel and lube oil temperatures (Tables 4 § 5) rather than continuous monitoring indicated two trends. First, for the ambient conditions tested, the average temperatures changed very little per round trip after 55 and 53 hours in motion with the same number of crew changes and a similar number of stops. Second, the average temperatures were slightly elevated for the fuel saver tests as could be expected with increased time in the higher throttle positions.
More specifically, for the data base round trip test (loaded plus unloaded train route), the average temperatures ranged from 90°F to 100°F respectively for the pump-up and return fuel oil lines with the lube oil at 162°F. For the fuel saver round trip test, the average pump-up and return fuel oil temperatures ranged from 95°F to 108°F respectively while the lube oil temperature increased to the 172-178°F range.
Fig. 3 Histogram of time vs. throttle position
71
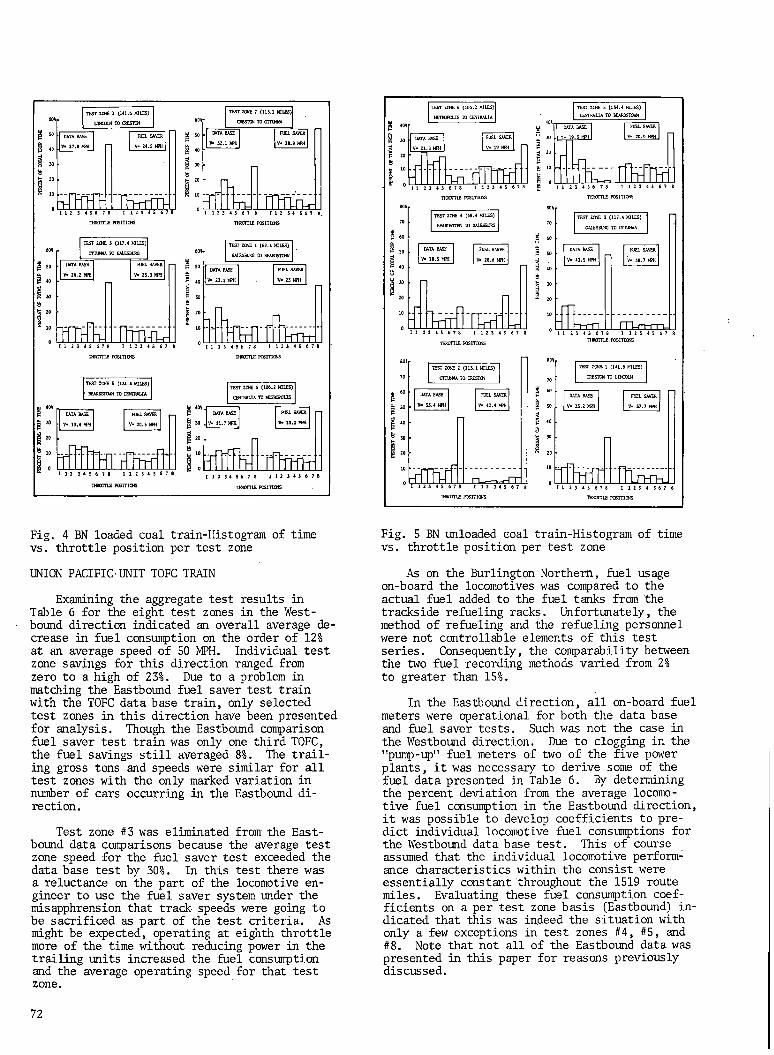
g 40
| 30&
TEST 2CUE 1 (141.6 MILES) LINCOLN TO C5EST0N
DATA BASE V» 27.8 MFH
iTITHT
RIEL SAVER V- 24.s mi
IThrtJIL
40
I 30 6
TEST ZCNE 3 (117.4 MILES) OTTU-WA TO GALESBURG
DATA BASE V* 26.2 M>H
RIEL SAVER V* 25.3 Kfl
[TfTfm TTiffrCII 23 4 S 676 I 123 45 67 THROTTLE POSmCNSTEST 2CUE 5 (134.4 MILES) BEARDSTOUN TO CENTRALIA
60»r
£ SO
TEST ZCNE 2 (113.1 MIES) OtESTCN TO OTTU*(A
DATA BASE V- 32.1 YfH
FUEL SAVER V- 26.9 KH
112345678 112345678THROTTLE POSITIONS
z l Ii l . iThln-r112345678 112 ]4 567THROTTLE POSITKNS
TEST ZCNE 4 (69.4 MILES) GALESBURG TO BEARDSTCNN
DATA BASE V- 23.2 WH
FUEL SAVER V- 23 MPH
Thrfl T1 iT-rn-r]I1234S676 I 123 4S 676
THROTTLE POSITKNS
TEST ZCNE 6 (106.2 MILES) (XNTRALIA TO SCTSCPOLIS
DATA BASE FUEL SAVER DATA BASE RIEL SAVERV» 19.4 AffH V- 20.5 mu V- 21.7 IfH V- 20.2 WH
112 3 4 S 6 7 6 I 1 2 3 4 S 6 7 6 TVROTT1E POSITIONSlOM r T l Tfffh-112345678 112345676
TT5OTTLE POSITIONS
Fig. 4 BN loaded coal train-Histogram of time vs. throttle position per test zone
UNION PACIFIC-UNIT TOFC TRAIN
Examining the aggregate test results in Table 6 for the eight test zones in the Westbound direction indicated an overall average decrease in fuel consumption on the order of 121 at an average speed of 50 MPH. Individual test zone savings for this direction ranged from zero to a high of 231. Due to a problem in matching the Eastbound fuel saver test train with the TOFC data base train, only selected test zones in this direction have been presented for analysis. Though the Eastbound comparison fuel saver test train was only one third TOFC, the fuel savings still averaged 81. The trailing gross tons and speeds were similar for all test zones with the only marked variation in number of cars occurring in the Eastbound direction.
Test zone #3 was eliminated from the East- bound data comparisons because the average test zone speed for the fuel saver test exceeded the data base test by 30%. In this test there was a reluctance on the part of the locomotive engineer to use the fuel saver system under the misapphrension that track- speeds were going to be sacrificed as part of the test criteria. As might be expected, operating at eighth throttle more of the time without reducing power in the trailing units increased the fuel consumption and the average operating speed for that test zone.
Fig. 5 BN unloaded coal train-Histogram of time vs. throttle position per test zone
As on the Burlington Northern, fuel usage on-board the locomotives was compared to the actual fuel added to the fuel tanks from the trackside refueling racks. Unfortunately, the method of refueling and the refueling personnel were not controllable elements of this test series. Consequently, the comparability between the two fuel recording methods varied from 2% to greater than 151.
In the Eastbound direction, all on-board fuel meters were operational for both the data base and fuel saver tests. Such was not the case in the Westbound direction. Due to clogging in the "pump-up” fuel meters of two of the five power plants, it was necessary to derive some of the fuel data presented in Table 6. By determining the percent deviation from the average locomotive fuel consumption in the Eastbound direction, it was possible to develop coefficients to predict individual locomotive fuel consumptions for the Westbound data base test. This of course assumed that the individual locomotive performance characteristics within the consist were essentially constant throughout the 1519 route miles. Evaluating these fuel consumption coefficients on a per test zone basis (Eastbound) indicated that this was indeed the situation with only a few exceptions in test zones #4, #5, and #8. Note that not all of the Eastbound data was presented in this paper for reasons previously discussed.
72
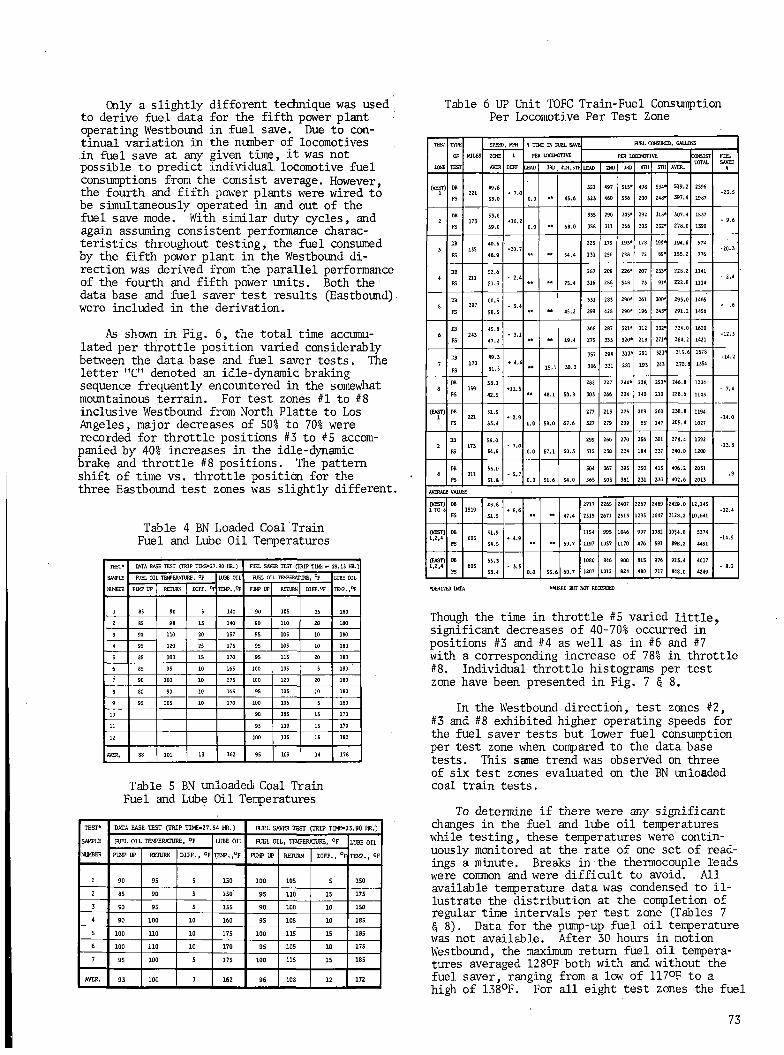
Only a slightly different technique was used to derive fuel data for the fifth power plant operating Westbound in fuel save. Due to continual variation in the number of locomotives in fuel save at any given time, it was not possible to predict individual locomotive fuel consumptions from the consist average. However, the fourth and fifth power plants were wired to be simultaneously operated in and out of the fuel save mode. With similar duty cycles, and again assuming consistent performance characteristics throughout testing, the fuel consumed by the fifth power plant in the Westbound direction was derived from the parallel performance of the fourth and fifth power units. Both the data base and fuel saver test results (Eastbound). were included in the derivation.
As shown in Fig. 6, the total time accumulated per throttle position varied considerably between the data base and fuel saver tests. The letter "C" denoted an idle-dynamic braking sequence frequently encountered in the somewhat mountainous terrain. For test zones #1 to #8 inclusive Westbound from North Platte to Los Angeles, major decreases of 501 to 701 were recorded for throttle positions #3 to #5 accompanied by 401 increases in the idle-dynamic brake and throttle #8 positions. The pattern shift of time vs. throttle position for the three Eastbound test zones was slightly different.
Table 4 BN Loaded Coal Train Fuel and Lube Oil Temperatures
TEST* I1ATA BASE TEST (TRIP TIME-27.90 HR.) FUEL SAVER TEST (TRIP TIME - 29.15 HR.)SAMPLE FUEL OIL TEMPERATURE. °F LUBE OIL FUEL OIL TEMPERATURE, °F LUBE OILNIMBER PIMP UP RETURN DIFF. °FTBP.,°F PUMP UP RETURN DIFF.°F TB4P. ,°F
1 BS 90 5 140 90 105 15 1802 85 98 13 140 90 110 20 1803 90 110 20 1S7 95 105 10 1804 95 120 25 175 95 10S 10 180S 8S 100 IS 170 95 115 20 1806 85 9S 10 165 100 105 s 1807 90 100 10 175 100 120 20 1808 80 90 10 165 95 105 10 1809 95 105 10 170 100 105 5 18010 90 105 15 17011 95 110 15 17012 100 115 15 180
AVER. 88 101 13 162 95 109 14 178
Table 5 BN unloaded Coal Train Fuel and Lube Oil Temperatures
TEST* DATA BASE TEST (TRIP TIME-27.54 HR.) FUEL SAVER TEST (TRIP TIME-23.90 HR.)
SAMPLE FUEL O IL TEMPERATURE, °F LUBE OIL FUEL OIL, TEMPERATURE, °F LUBE OIL
NIMBER PUMP UP RETURN D IFF ., °F TEMP,,°F PIMP UP RETURN DIFF., °F TEMP., °F
1 90 95 5 150 100 105 s ‘ ISO
2 85 90 5 150' 95 110 15 175
3 ' 90 95 5 155 90 100 10 150
4 90 100 10 160 95 105 10 18S
5 100 110 10 175 100 115 15 165
6 100 110 10 170 95 105 10 175
7 95 100 s 175 100 115 15 185
AVER. 93 100 7 162 96 108 12 172
Table 6 UP Unit TOFC Train-Fuel ConsumptionPer Locomotive Per Test Zone
TEST TYPE SPEED, MPH t TIME IN FUEL SAVE FUEL OONSUMED, GALLONSOF MILES 2«E PER LOCCMJTIVE PER LOCEM3TIVE CONSIST FUEL
ONE TEST AVER DIFF EAD 3RD 41H.51HLEAD 2ND 3RD 4TH STH AVER. 1
(WEST) DB 49.6 552 497 SIS* 498 S34* 519.2 2S961 FS
221S3.0
♦ 7.00.0 45.6 523 460 SS6 200 248* 397.4 1967
2DB S3.6 ♦ 10.2
335 290 30S* 292 315* 307.4 1537 - 9.6FS 59.0 0.0 “ 58.0 358 311 266 203 252* 1390
DB 40.5 22S 179 193* 178 199*1 194.8 9743
FS135 48.9
♦20.7•• •* 54.4 131 256 228 72 89* 15S.2 776
•20.3
267 208 226* 207 233* 228.2 11414 FS 211 SI.3
- 2.4•• 75.4 316 286 348 73 91* 222.8 1114
- 2.4
DB 207 60.5 331 283 290* 261 300* 293.0 1465 ♦ .6FS 58.5 ** 45.2 299 428 290* 196 243' 291.2 1456
DB 45.8 368 287 321* 312 332* 324.0 16206 FS
24347.2
♦ 3.1•• •• 19.4 279 333 320* 218 271* 284.2 1421
-12.3
DB 49.3 357 294 313* 291 323’ 315.6 1578 ■14.27
FS170 51.5 aa 15.1 30.3 306 331 281 193 243 270.{ 13S4
DB 38.1 282 227 244* 228, 2S3» 246.8 12346 1S9 ♦ 11.5 - 7.4
FS 42.5 a* 48.1 50.8 303 266 224 140 210 228.6 1143
(EAST)1
DB221 51.9 ♦ 2.9
277 213 235 209 260 238.6 1194 •14.0FS 53.4 0.0 58.0 67.6 327 279 209 65- 147 1027
DB 299 266 270 256 301 278.4 13922 FS
173 54.9- 7.0
0.0 57.1 60.3 315 230 234 184 237 240.0 1200•13.8
DB 55.0 504 367 395 350 41S 406.2 20314 FS 211
51.8- 5.7
0.0 51.6 54.0 565 503 381 231 333 402.6 2013.9
AVERAGE VALUES(NEST) DB 48.8 2717 2265 2407 2267 2489 2429.0 12,1451 TO 8
FS1519
51.5♦ 5.6
•• •• 47.4 2515 2671 2S13 1295 1647 2128.2 10,641•12.4
(WEST) DB 51.9 1154 995 1046 997 1082 10S4.8 52741,2,4 60S ♦ 4.9 •14.9
FS S4.5 aa aa 59.7 1197 10S7 1170 476 S91 898.2 4491
(EAST) IB 5S.3 1080 846 900 81S 976 923.4 46171,2,4 FS 605
S3.4 - 3.5 0.0 55.6 60.7 1207 1012 824 480 717 848.0 4240• 8.2
•DERIVED DATA “USED HIT NOT RECORDED
Though the time in throttle #5 varied little, significant decreases of 40-701 occurred in positions #3 and #4 as well as in #6 and #7 with a corresponding increase of 781 in throttle #8. Individual throttle histograms per test zone have been presented in Fig. 7 § 8,
In the Westbound direction, test zones #2,#3 and #8 exhibited higher operating speeds for the fuel saver tests but lower fuel consumption per test zone when compared to the data base tests. This same trend was observed on three of six test zones evaluated on the BN unloaded coal train tests.
To determine if there were any significant changes in the fuel and lube oil temperatures while testing, these temperatures were continuously monitored at the rate of one set of readings a minute. Breaks in the thermocouple leads were common and were difficult to avoid. All available temperature data was condensed to illustrate the distribution at the completion of regular time intervals per test zone (Tables 7 § 8). Data for the pump-up fuel oil temperature was not available. After 30 hours in motion Westbound, the maximum return fuel oil tenpera- tures averaged 128°F both with and without the fuel saver, ranging from a low of 117°F to a high of 138°F. For all eight test zones the fuel
73
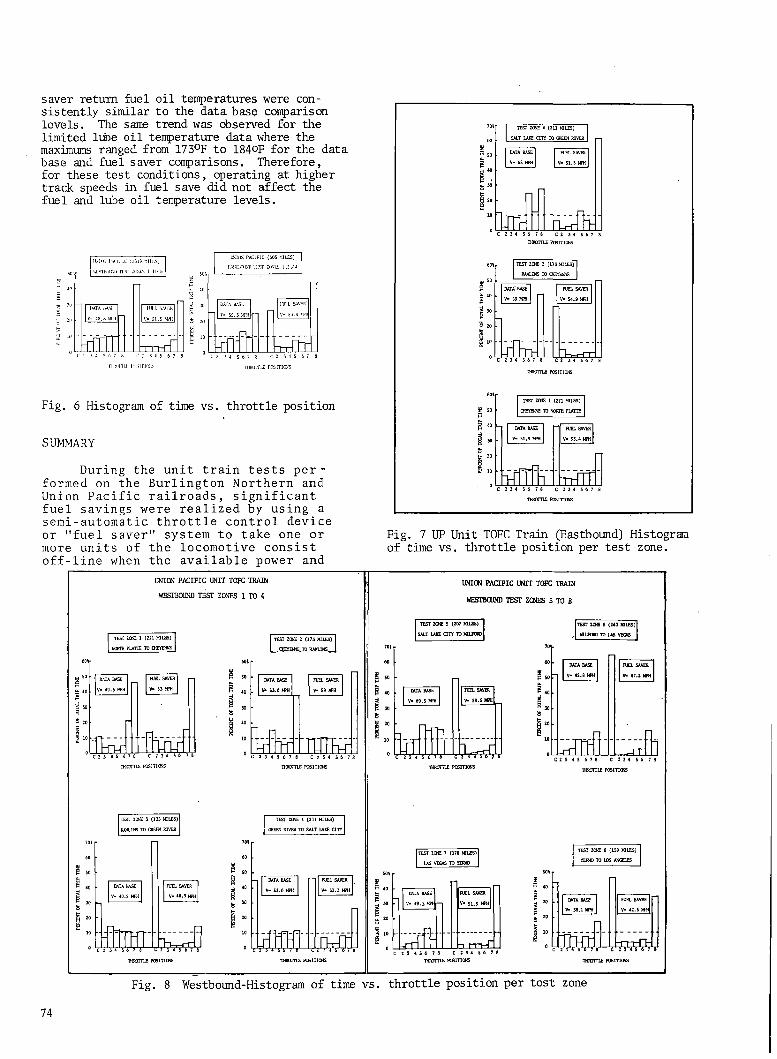
saver return fuel oil temperatures were consistently similar to the data base comparison levels. The same trend was observed for the limited lube oil temperature data where the maximums ranged from 173°F to 1840F for the data base and fuel saver comparisons. Therefore, for these test conditions, operating at higher track speeds in fuel save did not affect the fuel and lube oil temperature levels.
:i:.lic. f1 At'ii i t MSI? ‘iiu.sj hi snaiip.n ri ''i :ir.is i i<> »
V* -18.8 Mi'llllll i. SAVER
V* Sl.S MITI
~t t -h TC ’ 5 4 S (. : 8 I' : 5 4 S 6 7 8
nmnriii hisinov.
UNION PACIFIC (60S MILES) 1.AST1KHJN1) niSl" :uNI.S 1,2 ,f.4
DATA BASEH V* 55.3 Mill f
|~) _
FUEL SAVER' ~1 V- S3.4 MU'
.dift. - i t (TrC2 3 J S 6 7 8 C2 3 4 S 6 7
•nnuirriT; positions
Fig. 6 Histogram of time vs. throttle position
SUMMARY
During the unit train tests performed on the Burlington Northern and Union Pacific railroads, significant fuel savings were realized by using a semi-automatic throttle control device or "fuel saver" system to take one or more units of the locomotive consist off-line when the available power and
TEST 2CHE 4 (211 MILES) SALT LAKE CITY TO (SEEN RIVER
DATA BASE V« S5 XH
n
FUEL SAVER V- SI.8 XH
mt.. __ fl-r-rl h~C 2 3 4 S 6 7 8 C2 34 567 8
THROTTLE POSITIONS
l 20
TEST ZONE 2 (173 MILES) RAWLINS TO CHEYENNE
DATABASE V* 59 MFH
-rlTn-
FUEL SAVER V- 54.9 MPH
C 234 567 8 C234S678THROTTLE POSITIONS
i »
TEST 2CHE 1 (221 MILES) CTEYEWE TO NORTH PLATTE
DATA BASE (“l FUEL SAVER V- 51.9 WH V- 53.4 WH
T f f l f l i T F i T f TC 234 56 78 C 234 567
THROTTLE POSITIONS
Fig. 7 UP Unit TOFC Train (Eastbound) Histogram of time vs. throttle position per test zone.
UNION PACIFIC UNIT TOFC TRAIN
WESTBOUND TEST ZONES 1 TO 4UNION PACIFIC UNIT TOFC TRAIN
WESTBOUND TEST ZCNES 5 TO 8
TEST ZCNE 1 (221 MILES) TEST ZONE 2 (173 MILES)NORTH PLATTE TO CHEYENNE (MEYFMTC TO RAWETfR
60Ar 608 r
S 20
DATA BASE V 49.6 XH
FUEL SAVER V 53 XH
H i m ftuiufC234S678 C 234 56 78 THROTTLE POSITIONS
I .i? »3&l 2010
DATA BAS V* S3.6 XH
FUEL SAVER V 59 XH
-r It 'TUTKr'THROTTLE POSITIONS
TEST ZOB 5 (207 MILES) TEST ZWE 6 (243 MIIES)SALT LAIS CITY TO MILFORD MILfCH) TO LAS VEGAS
TEST 2CKE 3 (135 MILES) TEST ZOKE 4 (211 MIIES)RAWLINS TO GREEN RIVER (SEEN RIVER TO SALT LAKE CITY
V- 40.S XH
"firmr
V- 48.9 XH
Th-rrilTHROTTLE POSITIONS
DATA BASE f ' V- S2.6 MFH
■ FUEL SAVER V* SI.3 XH
rid M LTOOITLE POSITIONS
TEST 2ONE 7 (170 MILES) LAS VEGAS TO YEB-P
DATA BASE |• V» 49.3 MF™-
1 nFUEL SAVERv- S1.S X*
. - t i r f e . n m - £ _C 23 456 78 C2345676
THROTTLE POSITIONS
TEST ZONE 8 (159 MILES) YEftO TO LOS ANCZIES
-
, DATA BAS V* 38.1 XH
FUEL SAVER V- 42.S XT
-1THT -m n-THROTTLE POSITIONS
Fig. 8 Westbound-Histogram of time vs. throttle position per test zone
74
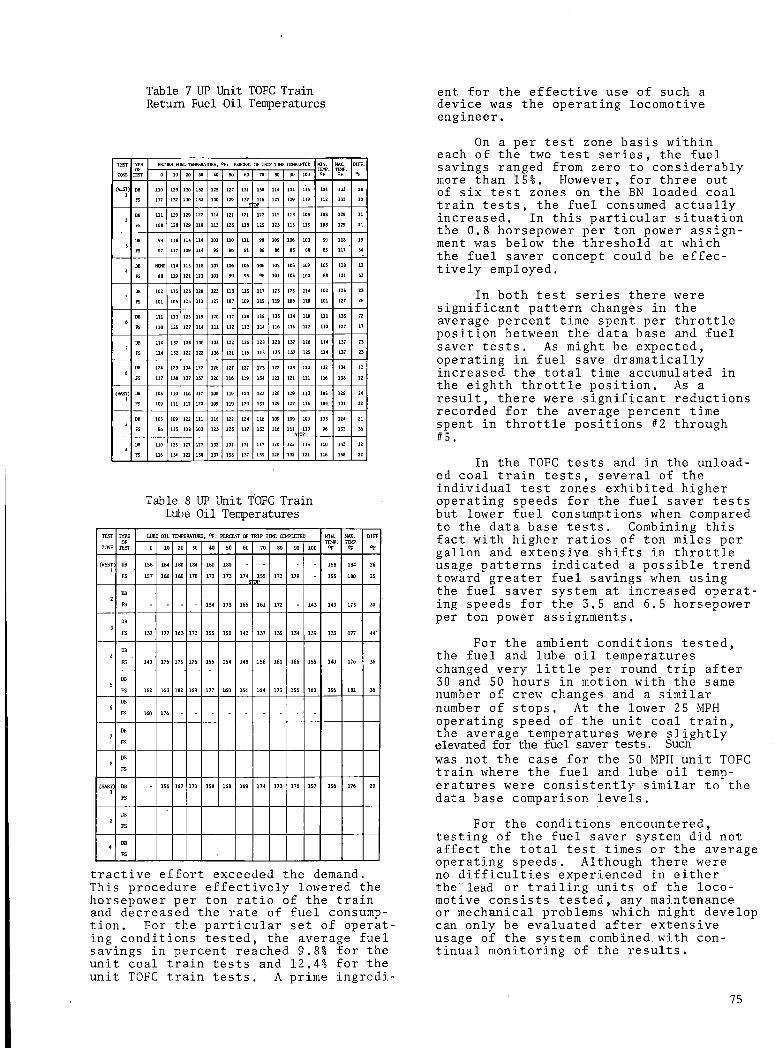
Table 7 UP Unit TOFC Train Return Fuel Oil Temperatures
Table 8 UP Unit TOFC Train Lube Oil Temperatures
TESTZCNE
TYPEOFTEST
LUBE OIL TEMPERATURE, °F: PERCENT OF TRIP TINE CCMPLETED MIN.TEMP.°F
MAX.TEMPOF
DIFF°F0 10 20 30 40 50 60 70 80 90 100
(VEST)1
DBFS
1SB1S7
184180
180180
184178
180173
180173 174
S15SOP 172 179
1S8155
184180
2625
2DBFS 154 173 165 161 172 143 143 173 30
3DBFS 133 177 163 172 15S ISO 142 137 135 134 139 133 177 44*
4DBFS 140 176 17S 17S 156 154 148 156 161 166 155 140 176 36
SDBFS 162 163 182 169 177 160 164 164 173 1S6 160 156 182 26
6DBFS 160 176
7DBFS
8DBFS
(EAST)1
DBFS
1S6 167 171 158 168 169 174 173 176 1S7 156 176 20
2DBFS
4 ISFS
tractive effort exceeded the demand.This procedure effectively lowered the horsepower per ton ratio of the train and decreased the rate of fuel consumption. For the particular set of operating conditions tested, the average fuel savings in percent reached 9.8% for the unit coal train tests and 12.4% for the unit TOFC train tests. A prime ingredi
ent for the effective use of such a device was the operating locomotive engineer.
On a per test zone basis within each of the two test series, the fuel savings ranged from zero to considerably more than 15%. However, for three out of six test zones on the BN loaded coal train tests, the fuel consumed actually increased. In this particular situation the 0.8 horsepower per ton power assignment was below the threshold at which the fuel saver concept could be effectively employed.
In both test series there were significant pattern changes in the average percent time spent per throttle position between the data base and fuel saver tests. As might be expected, operating in fuel save dramatically increased the total time accumulated in the eighth throttle position. As a result, there were significant reductions recorded for the average percent time spent in throttle positions #2 through #5.
In the TOFC tests and in the unloaded coal train tests, several of the individual test zones exhibited higher operating speeds for the fuel saver tests but lower fuel consumptions when compared to the data base tests. Combining this fact with higher ratios of ton miles per gallon and extensive shifts in throttle usage patterns indicated a possible trend toward greater fuel savings when using the fuel saver system at increased operating speeds for the 3.5 and 6.5 horsepower per ton power assignments.
For the ambient conditions tested, the fuel and lube oil temperatures changed very little per round trip after 30 and 50 hours in motion with the same number of crew changes and a similar number of stops. At the lower 25 MPH operating speed of the unit coal train, the average temperatures were slightly elevated for the fuel saver tests. Suchwas not the case for the 50 MPH unit TOFC train where the fuel and lube oil temperatures were consistently similar to the data base comparison levels.
For the conditions encountered, testing of the fuel saver system did not affect the total test times or the average operating speeds. Although there were no difficulties experienced in either the lead or trailing units of the locomotive consists tested, any maintenance or mechanical problems which might develop can only be evaluated after extensive usage of the system combined with continual monitoring of the results.
75

ACKNOWLEDGMENTS
The cooperative efforts of the Burlington Northern and Union Pacific, railroads were sincerely appreciated during the planning and execution phases , of the fuel saver test series. Test coordination and equipment installation expertise were provided through the staff of the Transportation Systems Center at Cambridge, MA. At the completion of the BN test series, the tedious reduction and evaluation of all test data were accomplished through the diligent efforts of the 0A0 Corporation.
76
FAST Mechanical Equipment Test Results to Date-Future Plans
D.E. GRAY
Research Manager Office of Freight Systems Federal Railroad Administration Washington, D.C.
ABSTRACT
This paper summarily describes the results to date, after approximately 66,000 miles of train operation, on the mechanical experiments being conducted at the Facility for Accelerated Service Testing (FAST). Specific results are presented on wheel flange wear, wheel failure modes and premium truck performance. Future plans for FAST mechanical testing are also described.
INTRODUCTIONAs reported in a number of recent AAR and FRA technical reports and presentations, the FAST program is a cooperative FRA, AAR, RPI research program concerned with both track systems and mechanical equipment components. This paper will be concerned with only the mechanical equipment aspects of the FAST program.The FAST, test consist is composed of a total of 89 test vehicles. Specifically they are made up of the following types and sizes. Sixty-five of the test vehicles are 100-ton open - hopper cars. There are three 100-ton capacity bathtub coal cars and three 70-ton Trailer-Qn-Flat-Car (TOFC) units also are
included. The remaining 18 test vehicles are 100-ton tank cars.The typical test consist in any one day is normally made up of 76 cars. The motive power has been typically 4 four-axle diesel-electric locomotives providing a test train of approximately 9,500 total gross tons.With regard to FAST operations the following information is provided. The FAST train is operated up to 16 hours per day - five days per week at an average speed of approximately 42 miles:per hour. The remaining eight hours of each test day are used to take measurements and perform track and vehicle maintenance.
Each day a block of four test cars removed from the FAST train and are routed to the shop for measurements. This shopping cycle is repeated every 22 test days.Car position in the consist is rotated by removing eight cars from the front of the train each day and placing them at the rear. In addition, to equalize wear on both track and rolling stock components under test, the direction of the train movement as well as its orientation are reversed in a four-day cycle.As mentioned above four cars are removed from the FAST consist each day. Depending on which experiments are included on these cars, literally hundreds of measurements are made.For example 71 cars require the following wheel measurements. Three types of measurements are made at two locations (180° apart) on each of
the eight car wheels. Flange thickness, rim thickness and flange height are measured using the Standard AAR Finger Gage. Wheel profiles along with tread and rim hardness are also measured at these two locations.Twenty-four cars are specifically involved in the truck experiment of which 12 car sets are equally divided among four premium trucks the remaining 12 car sets are comprised of two. Types of commonly used trucks under six 100-ton hopper cars and the trucks used on the three "Bathtub"
77
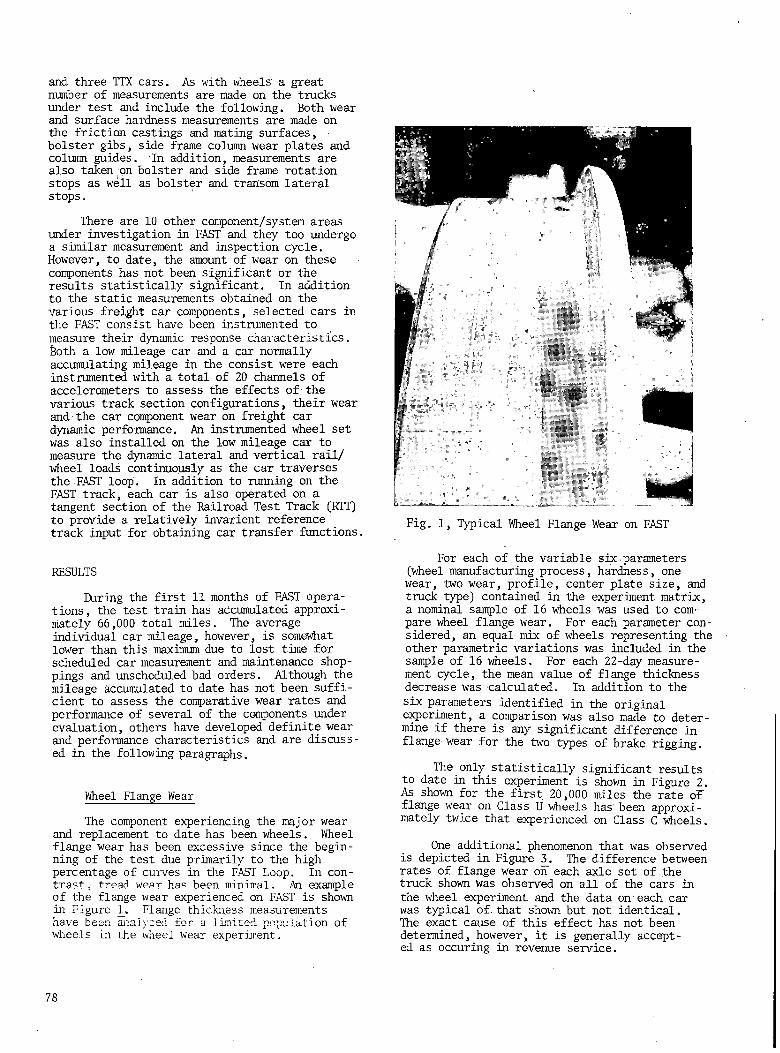
and three TTX cars. As with wheels' a great number of measurements are made on the trucks under test and include the following. Both wear and surface hardness measurements are made on the friction castings and mating surfaces, bolster gibs, side frame column wear plates and column guides. In addition, measurements are also taken 'on bolster and side frame rotation stops as well as bolster and transom lateral stops.There are 10 other component/system areas under investigation in FAST and they too undergo a similar measurement and inspection cycle. However, to date, the amount of wear on these components has not been significant or the results statistically significant. In addition to the static measurements obtained on the various freight car components, selected cars in the FAST consist have been instrumented to measure their dynamic response characteristics. Both a low mileage car and a car normally accumulating mileage in the consist were each instrumented with a total of 20 channels of accelerometers to assess the effects of the various track section configurations, their wear and the car component wear on freight car dynamic performance. An instrumented wheel set was also installed on the low mileage car to measure the dynamic lateral and vertical rail/ wheel loads continuously as the car traverses the FAST loop. In addition to running on the FAST track, each car is also operated on a tangent section of the Railroad Test Track (RTT) to provide a relatively invarient reference track input for obtaining car transfer functions.
RESULTSDuring the first 11 months of FAST operations, the test train has accumulated approximately 66,000 total miles. The average individual car mileage, however, is somewhat lower than this maximum due to lost time for scheduled car measurement and maintenance shoppings and unscheduled bad orders. Although the mileage accumulated to date has not been sufficient to assess the comparative wear rates and performance of several of the components under evaluation, others have developed definite wear and performance characteristics and are discuss
ed in the following paragraphs.
Wheel Flange WearThe component experiencing the major wear and replacement to date has been wheels. Wheel flange wear has been excessive since the beginning of the test due primarily to the high percentage of curves in the FAST Loop. In contrast . tread wear has been minimal. An example of the flange wear experienced on FAST is shown in Figure 1_. Flange thickness measurements have been analyzed for a limited population of wheels in the wheel wear experiment.
Fig. 1, Typical Wheel Flange Wear on FAST
For each of the variable six parameters (wheel manufacturing process, hardness, one wear, two wear, profile, center plate size, and truck type) contained in the experiment matrix, a nominal sample of 16 wheels was used to compare wheel flange wear. For each parameter considered, an equal mix of wheels representing the other parametric variations was included in the sample of 16 wheels. For each 22-day measurement cycle, the mean value of flange thickness decrease was calculated. In addition to the six parameters identified in the original experiment, a comparison was also made to determine if there is any significant difference in flange wear for the two types of brake rigging.
The only statistically significant results to date in this experiment is shown in Figure 2. As shown for the first 20,000 miles the rate oF flange wear on Class U wheels has been approximately twice that experienced on Class C wheels.One additional phenomenon that was observed is depicted in Figure 3_. The difference between rates of flange wear on each axle set of the truck shown was observed on all of the cars in
the wheel experiment and the data on each car was typical of, that shown but not identical.The exact cause of this effect has not been determined, however, it is generally accepted as occuring in revenue service.
78
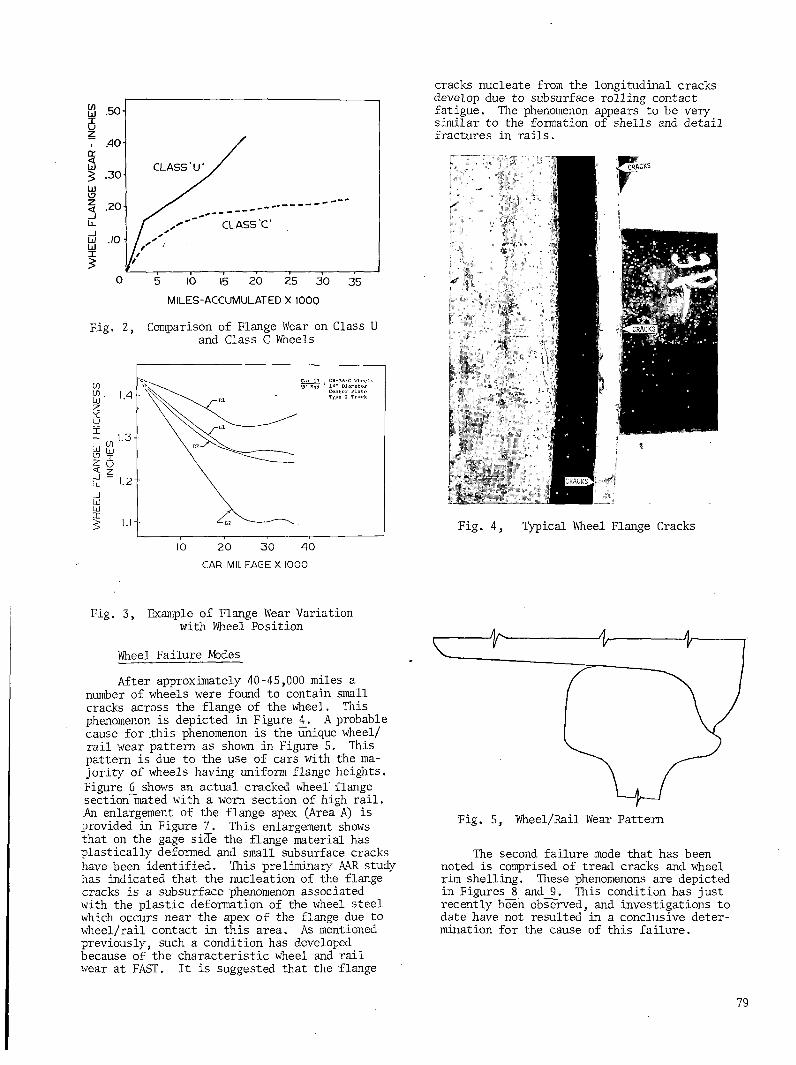
Fig. 2, Comparison of Flange Wear on Class U and Class C Wheels
Fig. 3, Example of Flange Wear Variation with Wheel PositionWheel Failure ModesAfter approximately 40-45,000 miles a number of wheels were found to contain small cracks across the flange of the wheel. This phenomenon is depicted in Figure 4_. A probable cause for .this phenomenon is the unique wheel/ rail wear pattern as shown in Figure 5. This pattern is due to the use of cars with the majority of wheels having uniform flange heights.
Figure 6 shows an actual cracked wheel' flange sectioninated with a worn section of high rail. An enlargement of the flange apex (Area A) is provided in Figure 7. This enlargement shows that on the gage side the flange material has plastically deformed and small subsurface cracks have been identified. This preliminary AAR study has indicated that the nucleation of the flange cracks is a subsurface phenomenon associated with the plastic deformation of the wheel steel which occurs near the apex of the flange due to wheel/rail contact in this area. As mentioned previously, such a condition has developed because of the characteristic wheel and rail wear at FAST. It is suggested that the ’flange
cracks nucleate from the longitudinal cracks develop due to subsurface rolling contact fatigue. The phenomenon appears to be very similar to the formation of shells and detail fractures in rails.
Fig. 4, Typical Wheel Flange Cracks
The second failure mode that has been noted is comprised of tread cracks and wheel rim shelling. These phenomenons are depicted in Figures 8 and 9. This condition has just recently been observed, and investigations to date have not resulted in a conclusive determination for the cause of this failure.
79
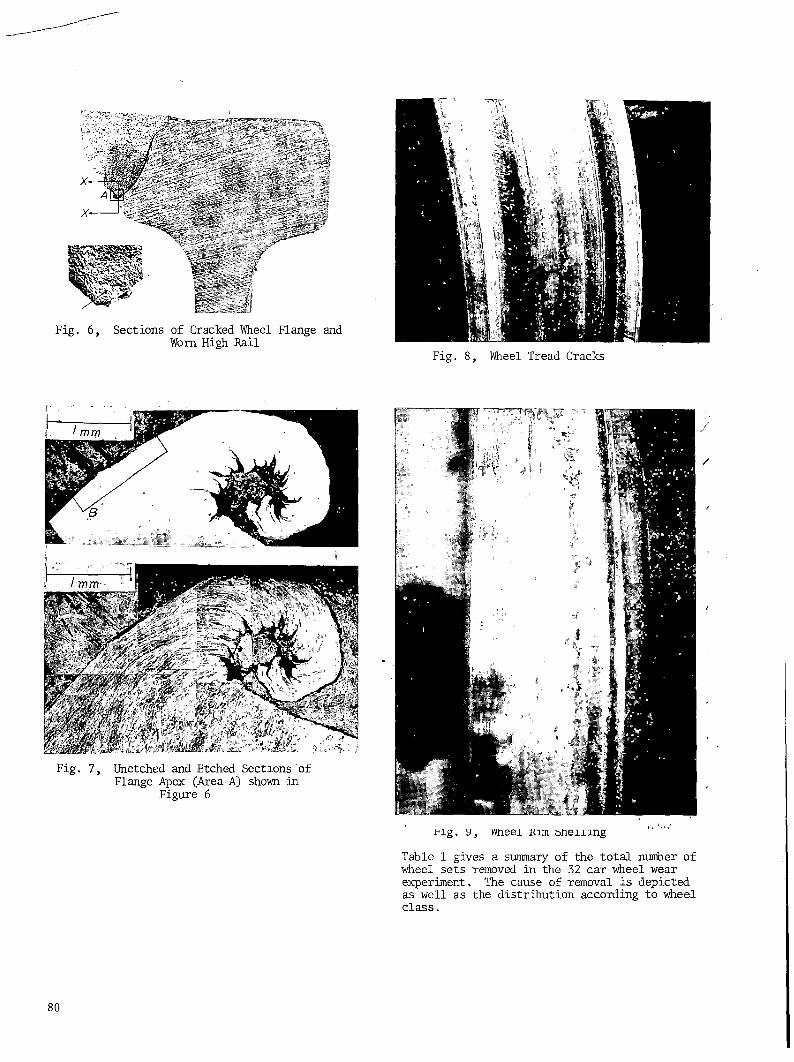
Fig. 6, Sections of Cracked Wheel Flange and Worn High Rail
rig. y, wneei Kim bnening
Table 1 gives a summary of the total number of wheel sets removed in the 32 car wheel wear experiment. The cause of removal is depicted as well as the distribution according to wheel class.
80
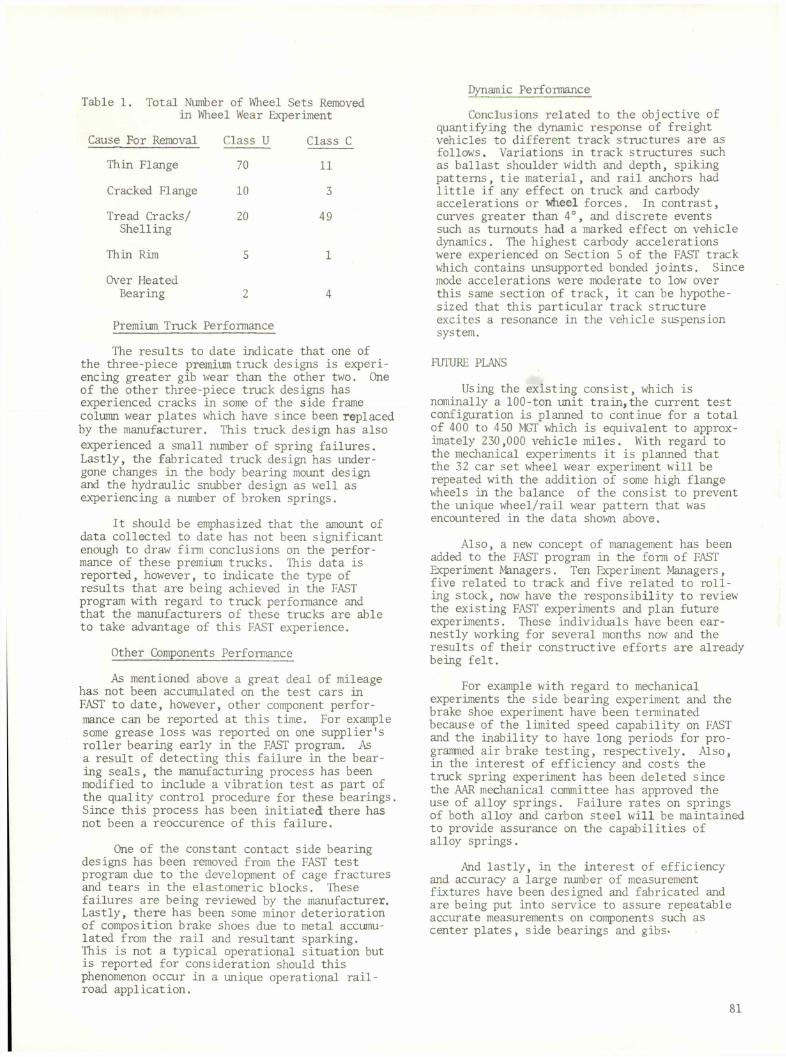
Dynamic PerformanceTable 1. Total Number of Wheel Sets Removed in Wheel Wear ExperimentCause For Removal Class U Class
Thin Flange 70 11Cracked Flange 10 3Tread Cracks/ 20 49ShellingThin Rim 5 1Over HeatedBearing 2 4Premium Truck PerfoimanceThe results to date indicate that one of the three-piece premium truck designs is experiencing greater gib wear than the other two. One of the other three-piece truck designs has experienced cracks in some of the side frame column wear plates which have since been replaced
by the manufacturer. This truck design has also experienced a small number of spring failures. Lastly, the fabricated truck design has undergone changes in the body bearing mount design and the hydraulic snubber design as well as experiencing a number of broken springs.
It should be emphasized that the amount of data collected to date has not been significant enough to draw film conclusions on the performance of these premium trucks. This data is reported, however, to indicate the type of results that are being achieved in the FAST program with regard to truck perfoimance and that the manufacturers of these trucks are able to take advantage of this FAST experience.Other Components PerformanceAs mentioned above a great deal of mileage has not been accumulated on the test cars in FAST to date, however, other component perfor
mance can be reported at this time. For example some grease loss was reported on one supplier’s roller bearing early in the FAST program. As a result of detecting this failure in the bearing seals, the manufacturing process has been modified to include a vibration test as part of the quality control procedure for these bearings. Since this process has been initiated there has not been a reoccurence of this failure.One of the constant contact side bearing designs has been removed from the FAST test program due to the development of cage fractures and tears in the elastomeric blocks. These failures are being reviewed by the manufacturer. Lastly, there has been some minor deterioration of composition brake shoes due to metal accumulated from the rail and resultant sparking.This is not a typical operational situation but is reported for consideration should this phenomenon occur in a unique operational railroad application.
Conclusions related to the objective of quantifying the dynamic response of freight vehicles to different track structures are as follows. Variations in track structures such as ballast shoulder width and depth, spiking patterns, tie material, and rail anchors had little if any effect on truck and carbody accelerations or wheel forces. In contrast, curves greater than 4°, and discrete events such as turnouts had a marked effect on vehicle dynamics. The highest carbody accelerations were experienced on Section 5 of the FAST track which contains unsupported bonded joints. Since mode accelerations were moderate to low over this same section of track, it can be hypothesized that this particular track structure excites a resonance in the vehicle suspension system.FUTURE PLANS
Using the existing consist, which is nominally a 100-ton unit train,the current test configuration is planned to continue for a total of 400 to 450 MGT which is equivalent to approximately 230,000 vehicle miles. With regard to the mechanical experiments it is planned that the 32 car set wheel wear experiment will be repeated with the addition of some high flange wheels in the balance of the consist to prevent the unique wheel/rail wear pattern that was encountered in the data shown above.Also, a new concept of management has been added to the FAST program in the forni of FAST Experiment Managers. Ten Experiment Managers, five related to track and five related to rolling stock, now have the responsibility to review the existing FAST experiments and plan future experiments. These individuals have been earnestly working for several months now and the results of their constructive efforts are already being felt.For example with regard to mechanical experiments the side bearing experiment and the brake shoe experiment have been terminated because of the limited speed capability on FAST and the inability to have long periods for programmed air brake testing, respectively. Also, in the interest of efficiency and costs the truck spring experiment has been deleted since the AAR mechanical committee has approved the use of alloy springs. Failure rates on springs of both alloy and carbon steel will be maintained to provide assurance on the capabilities of alloy springs.And lastly, in the interest of efficiency and accuracy a large number of measurement fixtures have been designed and fabricated and are being put into service to assure repeatable accurate measurements on components such as center plates, side bearings and gibs*
81
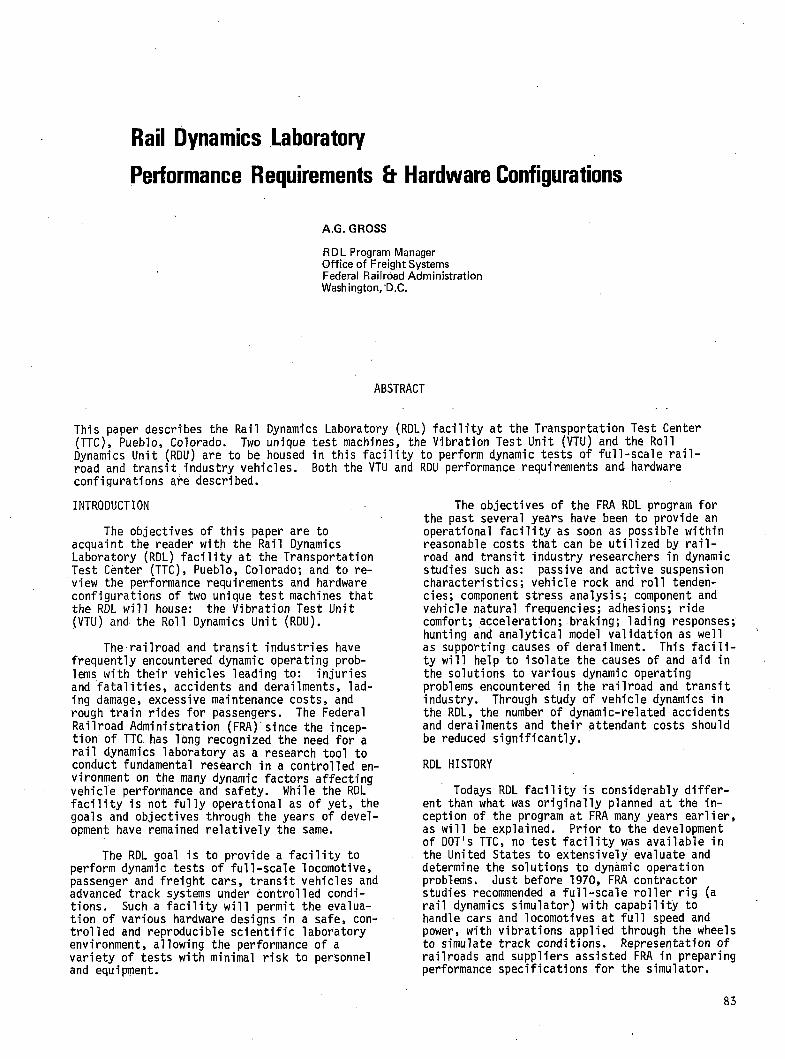
Rail Dynamics LaboratoryPerformance Requirements & Hardware Configurations
A.G. GROSS
RDL Program Manager Office of Freight Systems Federal Railroad Administration Washington, D.C.
ABSTRACT
This paper describes the Rail Dynamics Laboratory (RDL) facility at the Transportation Test Center (TTC), Pueblo, Colorado. Two unique test machines, the Vibration Test Unit (VTU) and the Roll Dynamics Unit (RDU) are to be housed in this facility to perform dynamic tests of full-scale railroad and transit industry vehicles. Both the VTU and RDU performance requirements and hardware configurations are described.
INTRODUCTION
The objectives of this paper are to acquaint the reader with the Rail Dynamics Laboratory (RDL) facility at the Transportation Test Center (TTC), Pueblo, Colorado; and to review the performance requirements and hardware configurations of two unique test machines that the RDL will house: the Vibration Test Unit(VTU) and the Roll Dynamics Unit (RDU).
The railroad and transit industries have frequently encountered dynamic operating problems with their vehicles leading to: injuriesand fatalities, accidents and derailments, lading damage, excessive maintenance costs, and rough train rides for passengers. The Federal Railroad Administration (FRA) since the inception of TTC has long recognized the need for a rail dynamics laboratory as a research tool to conduct fundamental research in a controlled environment on the many dynamic factors affecting vehicle performance and safety. While the RDL facility is not fully operational as of yet, the goals and objectives through the years of development have remained relatively the same.
The RDL goal is to provide a facility to perform dynamic tests of full-scale locomotive, passenger and freight cars, transit vehicles and advanced track systems under controlled conditions. Such a facility will permit the evaluation of various hardware designs in a safe, controlled and reproducible scientific laboratory environment, allowing the performance of a variety of tests with minimal risk to personnel and equipment.
The objectives of the FRA RDL program for the past several years have been to provide an operational facility as soon as possible within reasonable costs that can be utilized by railroad and transit industry researchers in dynamic studies such as: passive and active suspensioncharacteristics; vehicle rock and roll tendencies; component stress analysis; component and vehicle natural frequencies; adhesions; ride comfort; acceleration; braking; lading responses; hunting and analytical model validation as well as supporting causes of derailment. This facility will help to isolate the causes of and aid in the solutions to various dynamic operating problems encountered in the railroad and transit industry. Through study of vehicle dynamics in the RDL, the number of dynamic-related accidents and derailments and their attendant costs should be reduced significantly.
RDL HISTORY
Todays RDL facility is considerably different than what was originally planned at the inception of the program at FRA many years earlier, as will be explained. Prior to the development of DOT'S TTC, no test facility was available in the United States to extensively evaluate and determine the solutions to dynamic operation problems. Just before 1970, FRA contractor studies recommended a full-scale roller rig (a rail dynamics simulator) with capability to handle cars and locomotives at full speed and power, with vibrations applied through the wheels to simulate track conditions. Representation of railroads and suppliers assisted FRA in preparing performance specifications for the simulator.
83
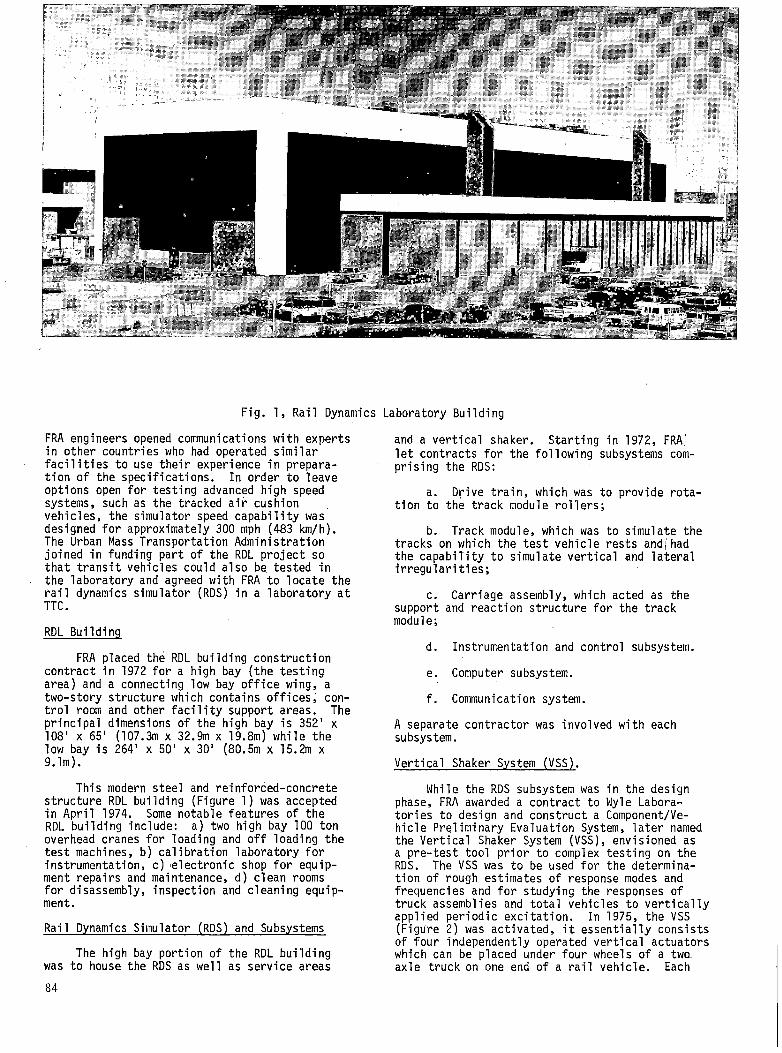
Fig. 1, Rail Dynamics Laboratory Building
FRA engineers opened communications with experts in other countries who had operated similar facilities to use their experience in preparation of the specifications. In order to leave options open for testing advanced high speed systems, such as the tracked air cushion vehicles, the simulator speed capability was designed for approximately 300 mph (483 km/h). The Urban Mass Transportation Administration joined in funding part of the RDL project so that transit vehicles could also be tested in the laboratory and agreed with FRA to locate the rail dynamics simulator (RDS) in a laboratory at TTC.
RDL Building
FRA placed the RDL building construction contract in 1972 for a high bay (the testing area) and a connecting low bay office wing, a two-story structure which contains offices, control room and other facility support areas. The principal dimensions of the high bay is 352' x 108' x 65' (107.3m x 32.9m x 19.8m) while the low bay is 264' x 50' x 30' (80.5m x 15.2m x 9.1m).
This modern steel and reinforced-concrete structure RDL building (Figure 1) was accepted in April 1974. Some notable features of the RDL building include: a) two high bay 100 tonoverhead cranes for loading and off loading the test machines, b) calibration laboratory for instrumentation, c) electronic shop for equipment repairs and maintenance, d) clean rooms for disassembly, inspection and cleaning equipment.
Rail Dynamics Simulator (RDS) and Subsystems
The high bay portion of the RDL building was to house the RDS as well as service areas
84
and a vertical shaker. Starting in 1972, FRA) let contracts for the following subsystems comprising the RDS:
a. Drive train, which was to provide rotation to the track module rollers;
b. Track module, which was to simulate the tracks on which the test vehicle rests and,1 had the capability to simulate vertical and lateral irregularities;
c. Carriage assembly, which acted as the support and reaction structure for the track module;
d. Instrumentation and control subsystem.
e. Computer subsystem.
f. Communication system.
A separate contractor was involved with each subsystem.
Vertical Shaker System (VSS).
While the RDS subsystem was in the design phase, FRA awarded a contract to Wyle Laboratories to design and construct a Component/Ve- hicle Preliminary Evaluation System, later named the Vertical Shaker System (VSS), envisioned as a pre-test tool prior to complex testing on the RDS. The VSS was to be used for the determination of rough estimates of response modes and frequencies and for studying the responses of truck assemblies and total vehicles to vertically applied periodic excitation. In 1975, the VSS (Figure 2) was activated, it essentially consists of four independently operated vertical actuators which can be placed under four wheels of a two. axle truck on one end of a rail vehicle. Each

actuator can accommodate wheel loads of up to 40,000 pounds (18, 144 kg). The acceleration, frequency, and displacement of these actuators can be varied over a wide operating range to simulate operating environments of most test specimens.
Fig. 2, Vertical Shaker System
Input capabilities for this system include: a)vertical translation of the truck and-railcar, b) roll motion of the truck and railcar and c) pitch motion between the forward and aft axle sets. Prior to changes in the RDL program that affected the VSS configuration, two test programs were conducted in the RDL on the VSS:
(a) The Trailer-on-Flatcar (TOFC) Optimization Program (see Figure 3) which was designed primarily to determine the sensitivity of lading response to suspension system component variations and load distribution; and (b) the AAR Structural Dynamics evaluation of the TOFC configuration which was structured to collect data for verification of a mathematical model of the flat car body.
Fig. 3, TOFC on VSS
RDL Program Redirection
During the development of some of the RDS subsystems, unforeseen technical problems arose which resulted in severe schedule delays and associated risks of great concern to DOT.
In mid-1975, after the RDL program had con
tinued to encounter R&D development and management problems, a DOT task force review resulted in the redirection of the RDL program so that it could be completed in a timely manner, relatively free of technical risk, and with minimum cost. The RDS was replaced by the Vibration Test Unit (VTU), on upgraded VSS, which will provide vertical and lateral excitation at both ends of a test vehicle, and the Roll Dynamics Unit (RDU), a basic roller rig. The RDS formerly combined both vibration and roll in one simulator. The redirected RDL program now has one prime contractor, Wyle Laboratories, instead of several major contractors.
The subsystems and systems which formerly supported the RDS, now as Government Furnished Property (GFP), will be modified for VTU and/or RDU operation, wherever possible. These sub- systems/systems included the VSS, drive trains, hydraulic subsystem, integrated computer subsystem network, analog acquisition and control subsystem, and communication system, and structures subsystems. The RDL building floor plan including the VTU and RDU test pits is shown in Figure 4.
VTU DEFINITION/BASIC REQUIREMENT
The VTU shall provide the capability for subjecting a 320,000 pound (145,150 kg) rail vehicle equipped with two, two-axle trucks or to one truck of a vehicle having three or four axles per truck, to the vertical and lateral vibrations environments which the vehicle and its components would "see" in traveling over track with representative profile and alignment variations.
RDU DEFINITION/BASIC REQUIREMENT
The RDU will provide the capability for driving, or absorbing power from the wheel sets of a four-axle vehicle or a three or four axle locomotive truck. One roller module shall be provided for each wheel set. Through rotation of the rollers, the RDU will simulate tangent track at various vehicle velocities, and will permit investigation of dynamic phenomena characteristics of "perfect" tangent track such as truck hunting. "Perfect" track is defined as track with no lateral or vertical irregularities.
VTU PERFORMANCE REQUIREMENTS
A brief summary of the major VTU performance requirements are noted here. Table 1 identifies the test vehicle weight and size limitations for VTU. The VSS vertical actuators (as GFP) was the primary factor for the maximum vehicle weight requirements.
85
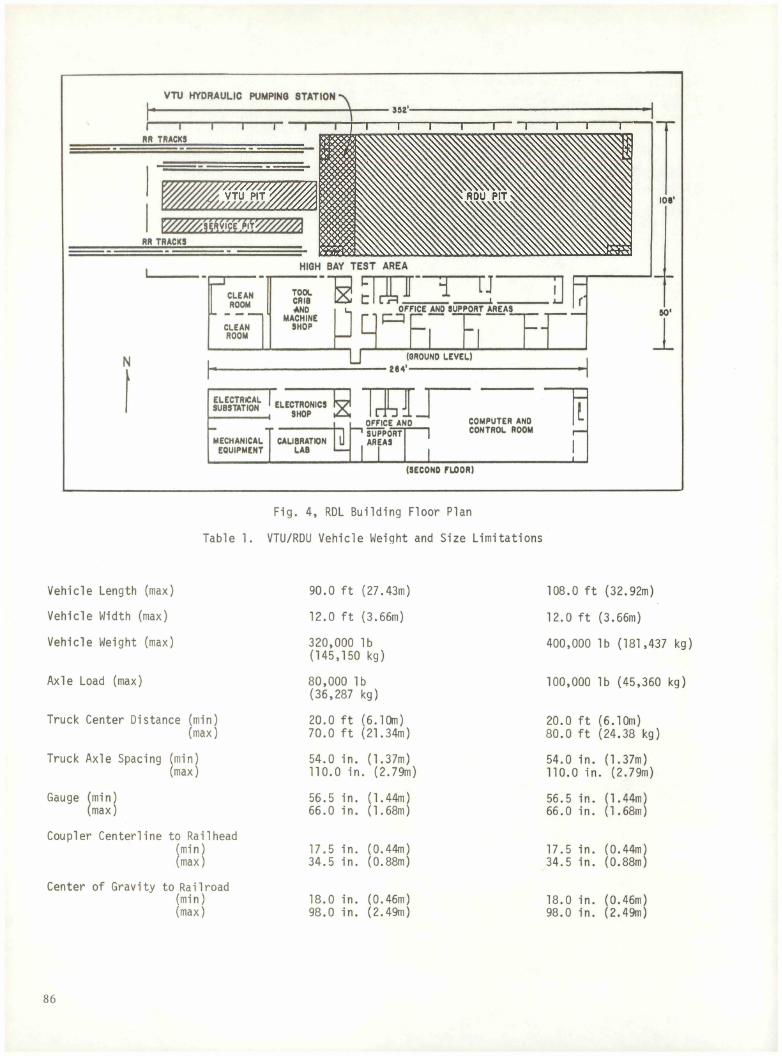
VTU HYDRAULIC PUMPING STATION*
i----r—RR TRACKS
"i---- 1---- 1---- r
7/////////A
RR TRACKS_______________
• 332'-
L HIGH BAY TEST AREA
CLEANROOMCLEANROOM
TOOLCRIBANOMACHINESHOP
TJ-
OFFICE ANO SUPPORT AREAS
L L T 9 a a1(GROUND LEVEL)1
rELECTRICALSUBSTATION 1 ELECTRONICS
1 SHOP i1 ru COMPUTER ANO CONTROL ROOM ,
i__________________ !
LOFFICE ANOMECHANICALEQUIPMENT
CALIBRATIONLAB tj[^ SUPPORT AREAS| |
lr
(SECONO FLOOR)
106'
30'
1
Fig. 4, RDL Building Floor Plan
Table 1. VTU/RDU Vehicle Weight and Size Limitations
Vehicle Length (max) 90.0 ft (27.43m) 108.0 ft (32.92m)
Vehicle Width (max) 12.0 ft (3.66m) 12.0 ft (3.66m)
Vehicle Weight (max) 320,000 lb (145,150 kg)
400,000 lb (181,437 kg)
Axle Load (max) 80,000 lb (36,287 kg)
100,000 lb (45,360 kg)
Truck Center Distance (min) (max)
2 0 . 0 ft (6.10m)70.0 ft (21.34m)
2 0 . 0 ft (6.10m)80.0 ft (24.38 kg)
Truck Axle Spacing (min) (max)
54.0 in. (1.37m)110.0 in. (2.79m)
54.0 in. (1.37m)110.0 in. (2.79m)
Gauge (min) (max)
56.5 in. (1.44m) 6 6 . 0 i n. (1.68m)
56.5 in. (1.44m) 6 6 . 0 in. (1.68m)
Coupler Centerline to Railhead (min)(max)
17.5 in. (0.44m)34.5 in. (0.88m)
17.5 in. (0.44m)34.5 in. (0.88m)
Center of Gravity to Railroad (min) (max)
18.0 in. (0.46m)98.0 in. (2.49m)
18.0 in. (0.46m)98.0 in. (2.49m)
86
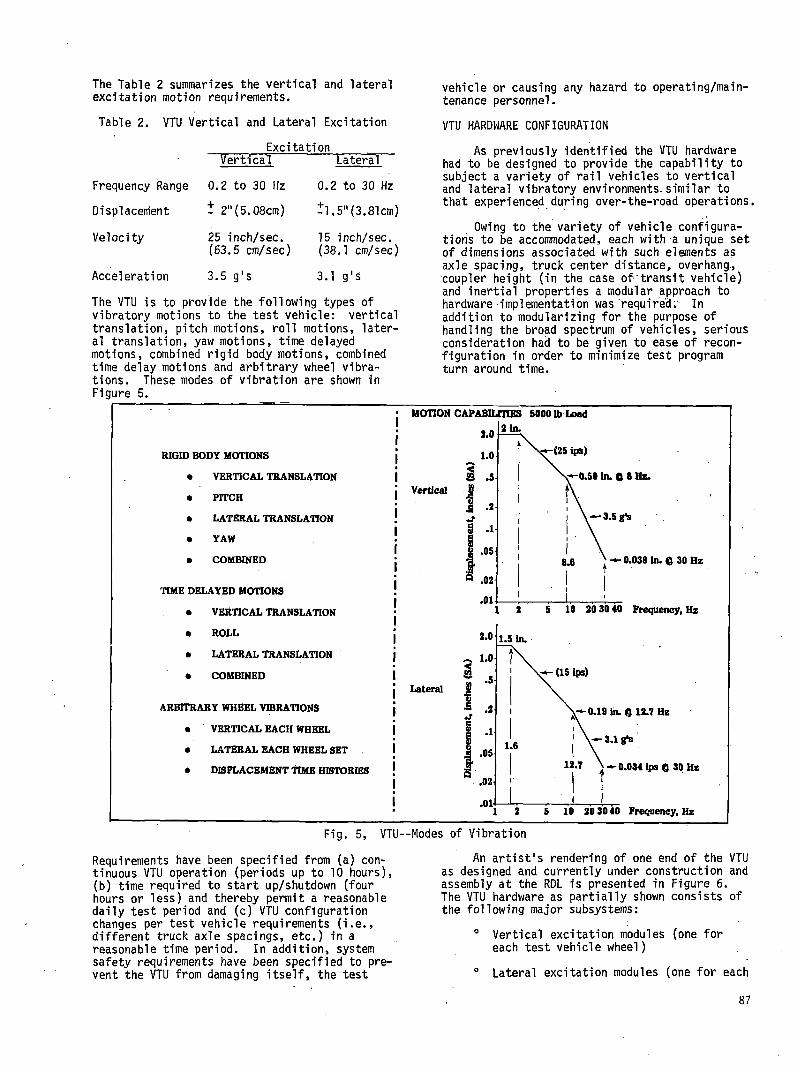
The Table 2 summarizes the vertical and lateral excitation motion requirements.
Table 2. VTU Vertical and Lateral Excitation
vehicle or causing any hazard to operating/main- tenance personnel.
VTU HARDWARE CONFIGURATION
_______ Excitation________Vertical Lateral
Frequency Range
Displacement
Velocity
Acceleration
0.2 to 30 Hz
t 2"(5.08cm)
25 inch/sec. (63.5 cm/sec)
3.5 g's
0.2 to 30 Hz
Jl.5"(3.81cm)
15 inch/sec. (38.1 cm/sec)
3.1 g's
The VTU is to provide the following types of vibratory motions to the test vehicle: vertical translation, pitch motions, roll motions, lateral translation, yaw motions, time delayed motions, combined rigid body motions, combined time delay motions and arbitrary wheel vibrations. These modes of vibration are shown in Figure 5.
As previously identified the VTU hardware had to be designed to provide the capability to subject a variety of rail vehicles to vertical and lateral vibratory environments, similar to that experienced during over-the-road operations.
Owing to the variety of vehicle configurations to be accommodated, each with a unique set of dimensions associated with such elements as axle spacing, truck center distance, overhang, coupler height (in the case of transit vehicle) and inertial properties a modular approach to hardware implementation was required.' In addition to modularizing for the purpose of handling the broad spectrum of vehicles, serious consideration had to be given to ease of reconfiguration in order to minimize test program turn around time.
RIGID BODY MOTIONS• VERTICAL TRANSLATION• PITCH• LATERAL TRANSLATION• YAW• COMBINED
TIME DELAYED MOTIONS• VERTICAL TRANSLATION• ROLL• LATERAL TRANSLATION• COMBINED
ARBITRARY WHEEL VIBRATIONS• VERTICAL EACH WHEEL• LATERAL EACH WHEEL SET• DISPLACEMENT TIME HISTORIES
MOTION CAPABILITIES 5000 lb Load
Lateral
Fig. 5, VTU--Modes of Vibration
Requirements have been specified from (a) continuous VTU operation (periods up to 10 hours),(b) time required to start up/shutdown (four hours or less) and thereby permit a reasonable daily test period and (c) VTU configuration changes per test vehicle requirements (i.e., different truck axle spacings, etc.) in a reasonable time period. In addition, system safety requirements have been specified to prevent the VTU from damaging itself, the test
An artist's rendering of one end of the VTU as designed and currently under construction and assembly at the RDL is presented in Figure 6.The VTU hardware as partially shown consists of the following major subsystems:
0 Vertical excitation modules (one for each test vehicle wheel)
0 Lateral excitation modules (one for each
87
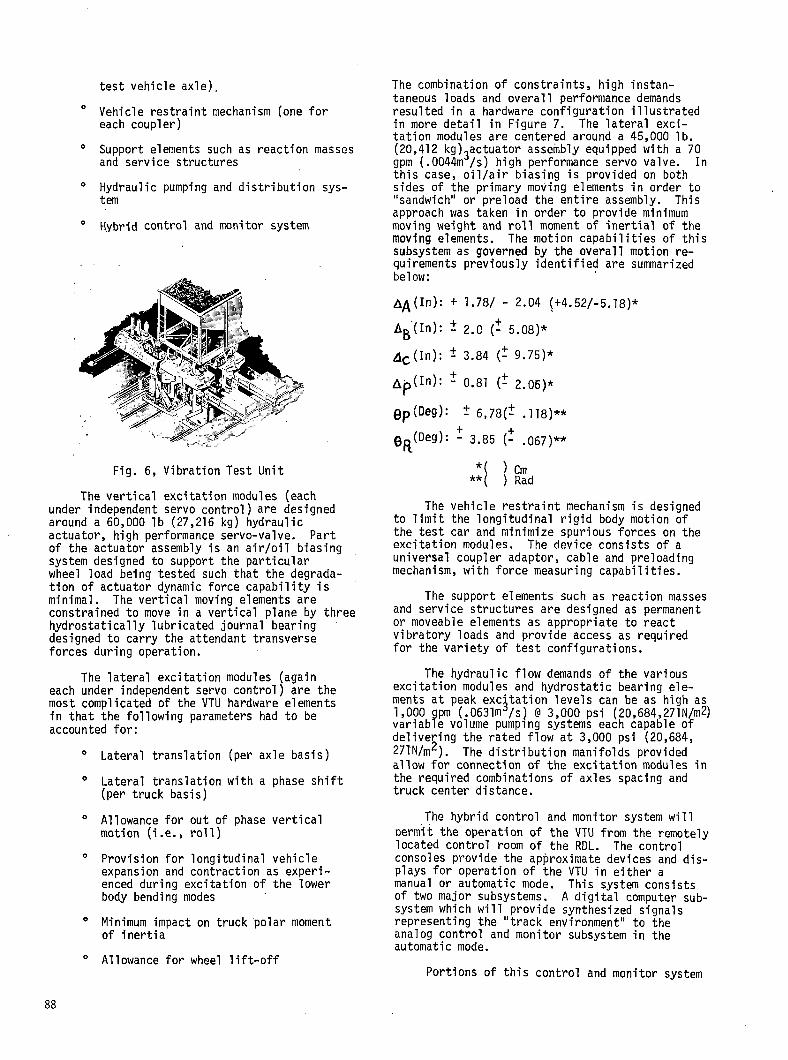
test vehicle axle).
° Vehicle restraint mechanism (one for each coupler)
° Support elements such as reaction masses and service structures
° Hydraulic pumping and distribution system
° Hybrid control and monitor system
Fig. 6, Vibration Test Unit
The vertical excitation modules (each under independent servo control) are designed around a 60,000 lb (27,216 kg) hydraulic actuator, high performance servo-valve. Part of the actuator assembly is an air/oil biasing system designed to support the particular wheel load being tested such that the degradation of actuator dynamic force capability is minimal. The vertical moving elements are constrained to move in a vertical plane by three hydrostatically lubricated journal bearing designed to carry the attendant transverse forces during operation.
The lateral excitation modules (again each under independent servo control) are the most complicated of the VTU hardware elements in that the following parameters had to be accounted for:
° Lateral translation (per axle basis)
° Lateral translation with a phase shift (per truck basis)
° Allowance for out of phase vertical motion (i.e., roll)
0 Provision for longitudinal vehicle expansion and contraction as experienced during excitation of the lower body bending modes
° Minimum impact on truck polar moment of inertia
° Allowance for wheel lift-off
The combination of constraints, high instantaneous loads and overall performance demands resulted in a hardware configuration illustrated in more detail in Figure 7. The lateral excitation modules are centered around a 45,000 lb. (20,412 kg),actuator assembly equipped with a 70 gpm (.0044nr/s) high performance servo valve. In this case, oil/air biasing is provided on both sides of the primary moving elements in order to "sandwich" or preload the entire assembly. This approach was taken in order to provide minimum moving weight and roll moment of inertial of the moving elements. The motion capabilities of this subsystem as governed by the overall motion requirements previously identified are summarized below:
(In): + 1.78/ - 2.04 (+4.52/-5.18)*
Ag(In): t 2.0 (- 5.08)*
A c (In): ± 3.84 (± 9.75)*
A p ( In); ~ 0.81 (± 2.06)*
0p(Deg): t 6,78(- .118)**
e^(Deg): - 3.85 (- .067)**
*( ) Cm**( ) Rad
The vehicle restraint mechanism is designed to limit the longitudinal rigid body motion of the test car and minimize spurious forces on the excitation modules. The device consists of a universal coupler adaptor, cable and preloading mechanism, with force measuring capabilities.
The support elements such as reaction masses and service structures are designed as permanent or moveable elements as appropriate to react vibratory loads and provide access as required for the variety of test configurations.
The hydraulic flow demands of the various excitation modules and hydrostatic bearing elements at peak excitation levels can be as high as 1 ,000 gpm (.0631nr7s) @ 3,000 psi (20,684,271N/m2) variable volume pumping systems each capable of delivering the rated flow at 3,000 psi (20,684, 27TN/m2). The distribution manifolds provided allow for connection of the excitation modules in the required combinations of axles spacing and truck center distance.
The hybrid control and monitor system will oermit the operation of the VTU from the remotely located control room of the RDL. The control consoles provide the approximate devices and displays for operation of the VTU in either a manual or automatic mode. This system consists of two major subsystems. A digital computer subsystem which will provide synthesized signals representing the "track environment" to the analog control and monitor subsystem in the automatic mode.
Portions of this control and monitor system
88
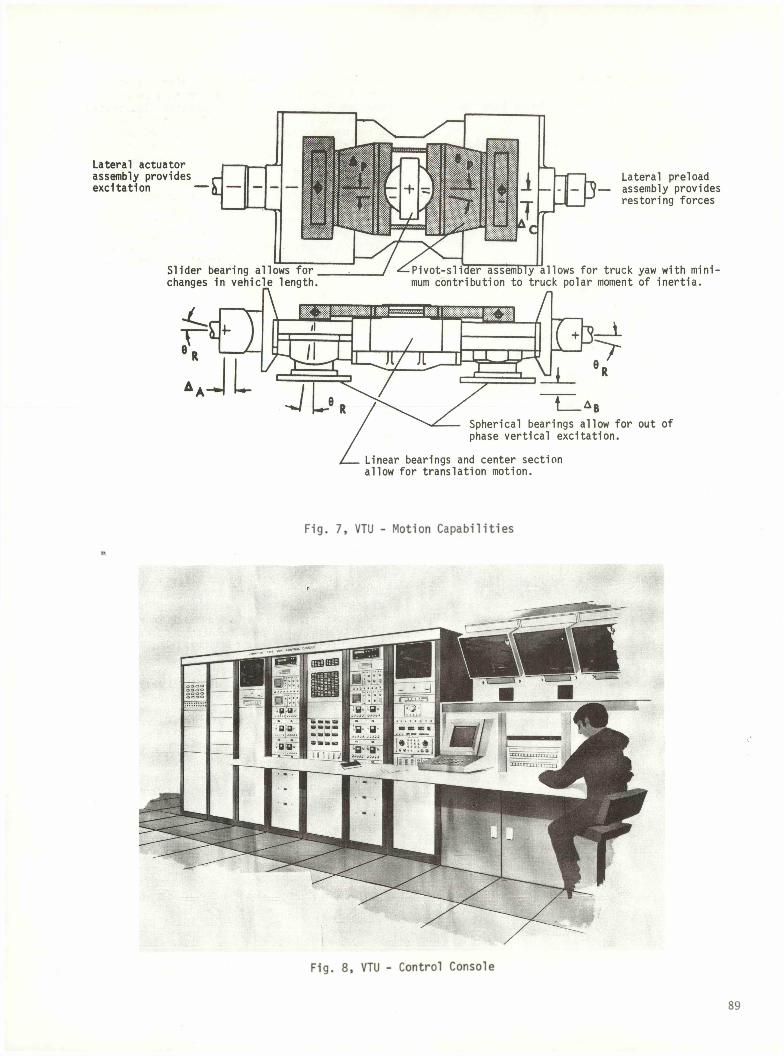
Fig. 7, VTU - Motion Capabilities
Fig. 8, VTU - Control Console
89
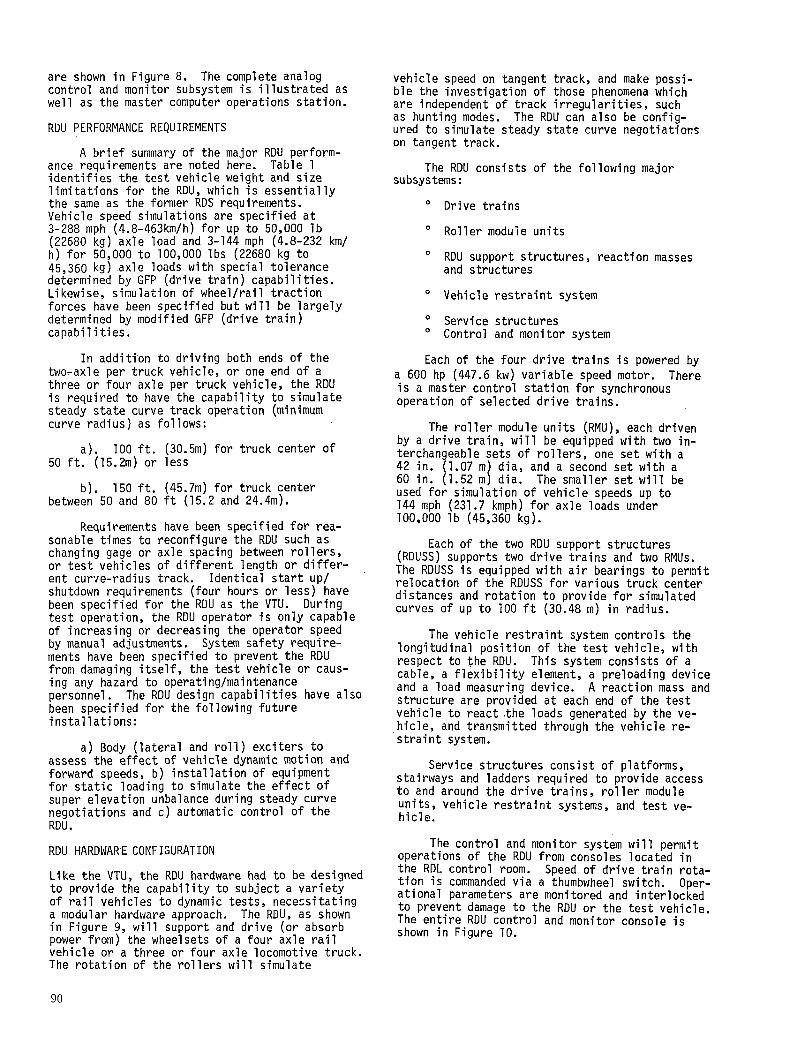
are shown in Figure 8. The complete analog control and monitor subsystem is illustrated as well as the master computer operations station.
RDU PERFORMANCE REQUIREMENTS
A brief summary of the major RDU performance requirements are noted here. Table 1 identifies the test vehicle weight and size limitations for the RDU, which is essentially the same as the former RDS requirements.Vehicle speed simulations are specified at 3-288 mph (4.8-463km/h) for up to 50,000 lb (22680 kg) axle load and 3-144 mph (4.8-232 km/ h) for 50,000 to 100,000 lbs (22680 kg to 45,360 kg) axle loads with special tolerance determined by GFP (drive train) capabilities. Likewise, simulation of wheel/rail traction forces have been specified but will be largely determined by modified GFP (drive train) capabilities.
In addition to driving both ends of the two-axle per truck vehicle, or one end of a three or four axle per truck vehicle, the RDU is required to have the capability to simulate steady state curve track operation (minimum curve radius) as follows:
a) . 100 ft. (30.5m) for truck center of 50 ft. (15.2m) or less
b) . 150 ft. (45.7m) for truck centerbetween 50 and 80 ft (15.2 and 24.4m).
Requirements have been specified for reasonable times to reconfigure the RDU such as changing gage or axle spacing between rollers, or test vehicles of different length or different curve-radius track. Identical start up/ shutdown requirements (four hours or less) have been specified for the RDU as the VTU. During test operation, the RDU operator is only capable of increasing or decreasing the operator speed by manual adjustments. System safety requirements have been specified to prevent the RDU from damaging itself, the test vehicle or causing any hazard to operating/maintenance personnel. The RDU design capabilities have also been specified for the following future installations:
a) Body (lateral and roll) exciters to assess the effect of vehicle dynamic motion and forward speeds, b) installation of equipment for static loading to simulate the effect of super elevation unbalance during steady curve negotiations and c) automatic control of the RDU.
RDU HARDWARE CONFIGURATION
Like the VTU, the RDU hardware had to be designed to provide the capability to subject a variety of rail vehicles to dynamic tests, necessitating a modular hardware approach. The RDU, as shown in Figure 9, will support and drive (or absorb power from) the wheel sets of a four axle rail vehicle or a three or four axle locomotive truck. The rotation of the rollers will simulate
vehicle speed on tangent track, and make possible the investigation of those phenomena which are independent of track irregularities, such as hunting modes. The RDU can also be configured to simulate steady state curve negotiations on tangent track.
The RDU consists of the following major subsystems:
0 Drive trains
0 Roller module units
0 RDU support structures, reaction masses and structures
° Vehicle restraint system
° Service structures0 Control and monitor system
Each of the four drive trains is powered by a 600 hp (447.6 kw) variable speed motor. There is a master control station for synchronous operation of selected drive trains.
The roller module units (RMU), each driven by a drive train, will be equipped with two interchangeable sets of rollers, one set with a 42 in. (1.07 m) dia, and a second set with a 60 in. (1.52 m) dia. The smaller set will be used for simulation of vehicle speeds up to 144 mph (231.7 kmph) for axle loads under 100,000 lb (45,360 kg).
Each of the two RDU support structures (RDUSS) supports two drive trains and two RMUs. The RDUSS is equipped with air bearings to permit relocation of the RDUSS for various truck center distances and rotation to provide for simulated curves of up to 100 ft (30.48 m) in radius.
The vehicle restraint system controls the longitudinal position of the test vehicle, with respect to the RDU. This system consists of a cable, a flexibility element, a preloading device and a load measuring device. A reaction mass and structure are provided at each end of the test vehicle to react the loads generated by the vehicle, and transmitted through the vehicle restraint system.
Service structures consist of platforms, stairways and ladders required to provide access to and around the drive trains, roller module units, vehicle restraint systems, and test vehicle.
The control and monitor system will permit operations of the RDU from consoles located in the RDL control room. Speed of drive train rotation is commanded via a thumbwheel switch. Operational parameters are monitored and interlocked to prevent damage to the RDU or the test vehicle. The entire RDU control and monitor console is shown in Figure 10.
90
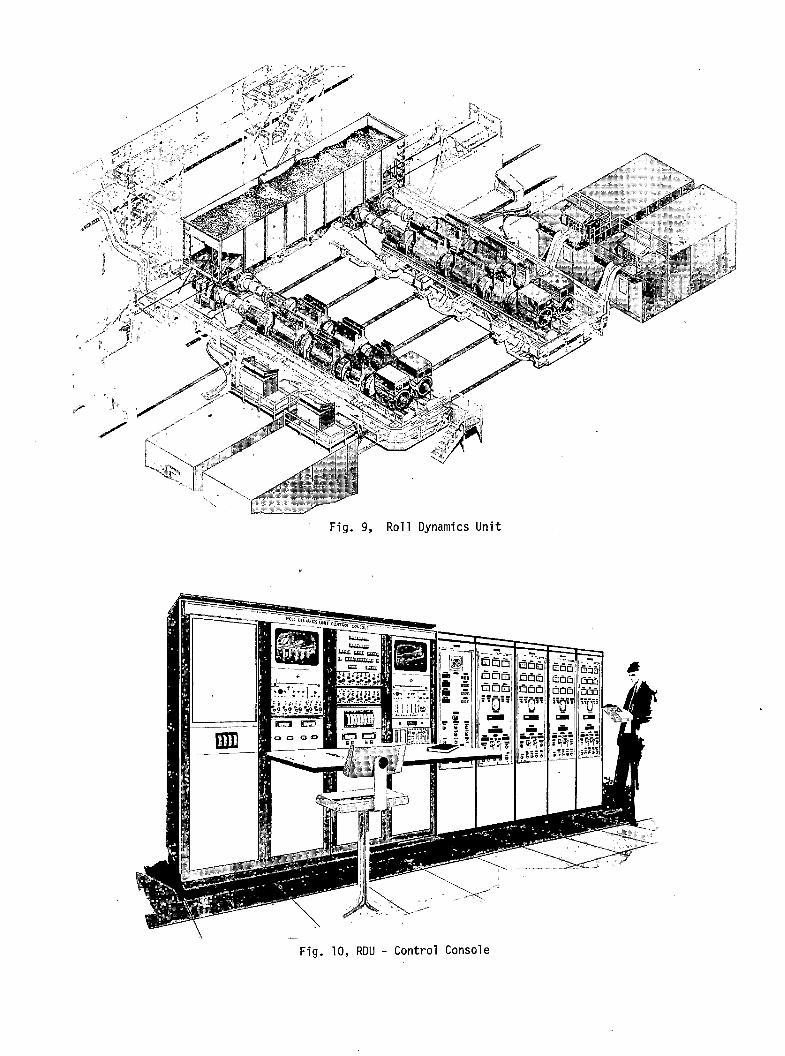
Fig. 10, RDU - Control Console
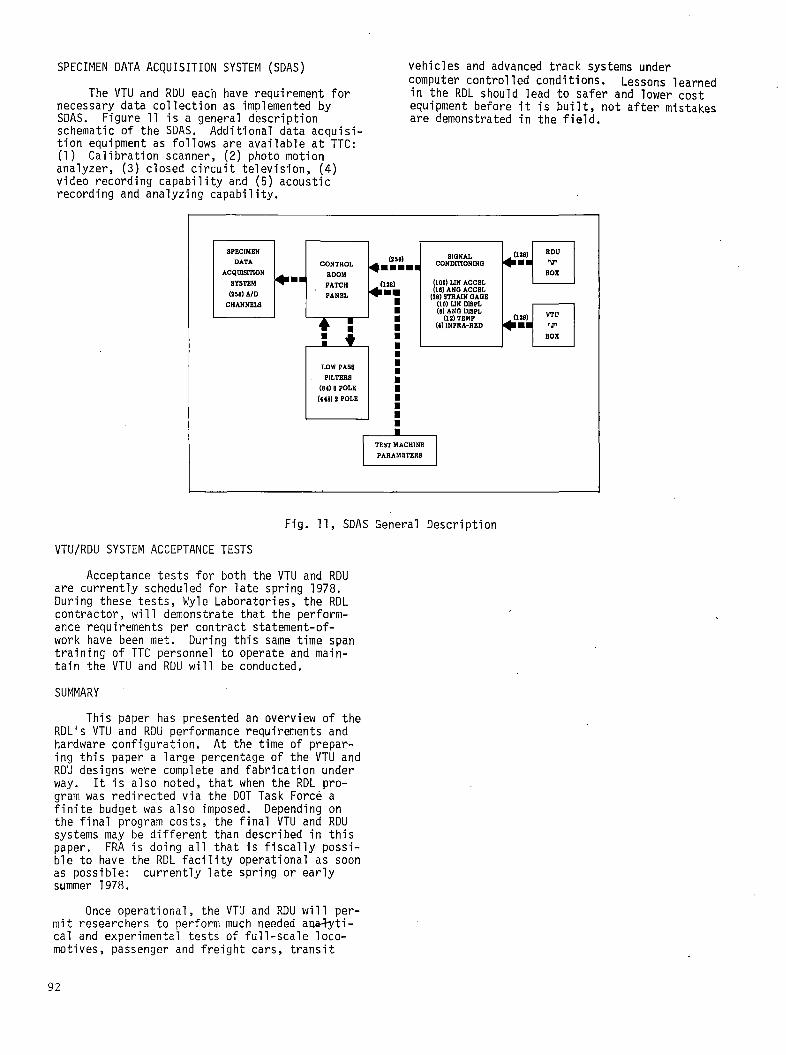
SPECIMEN DATA ACQUISITION SYSTEM (SDAS)
The VTU and RDU each have requirement for necessary data collection as implemented by SDAS. Figure 11 is a general description schematic of the SDAS. Additional data acquisition equipment as follows are available at TTC: (1) Calibration scanner, (2) photo motion analyzer, (3) closed circuit television, (4) video recording capability and (5) acoustic recording and analyzing capability.
vehicles and advanced track systems under computer controlled conditions. Lessons learned in the RDL should lead to safer and lower cost equipment before it is built, not after mistakes are demonstrated in the field.
SPECIMBN
D A T A C O N T R O LACQUISITION R O O M
SYSTEM P A T C H(256) A/D P A N E L
C H A N N E L S
(256)
(128)
L O W PASS
FILTERS
(64) 8 POLS
(448) 2 PO LE
SIGNALCONDITIONING
(100) U N A C C E L (18) A N O A C C E L (SB) STRAIN G A Q B (10) U N DISPL (8) A N O DISPL
(12) T E M P (4) INFRA-RED
TE ST M A C H I N E
P A R A M E T E R S
. (128)
.(128)
Fig. 11, SDAS General Description
VTU/RDU SYSTEM ACCEPTANCE TESTS
Acceptance tests for both the VTU and RDU are currently scheduled for late spring 1978. During these tests, Wyle Laboratories, the RDL contractor, will demonstrate that the performance requirements per contract statement-of- work have been met. During this same time span training of TTC personnel to operate and maintain the VTU and RDU will be conducted.
SUMMARY
This paper has presented an overview of the RDL1s VTU and RDU performance requirements and hardware configuration. At the time of preparing this paper a large percentage of the VTU and RDU designs were complete and fabrication under way. It is also noted, that when the RDL program was redirected via the DOT Task Force a finite budget was also imposed. Depending on the final program costs, the final VTU and RDU systems may be different than described in this paper. FRA is doing all that is fiscally possible to have the RDL facility operational as soon as possible: currently late spring or earlysummer 1978.
Once operational, the VTU and RDU will permit researchers to perform much needed analytical and experimental tests of full-scale locomotives, passenger and freight cars, transit
92
A P P E N D IX
A b s t r a c t s o f R e c e n t R e p o r t s
a n d M a g n e t i c D a t a T a p e s
R e l a t i n g t o F r e i g h t S y s t e m s R § D
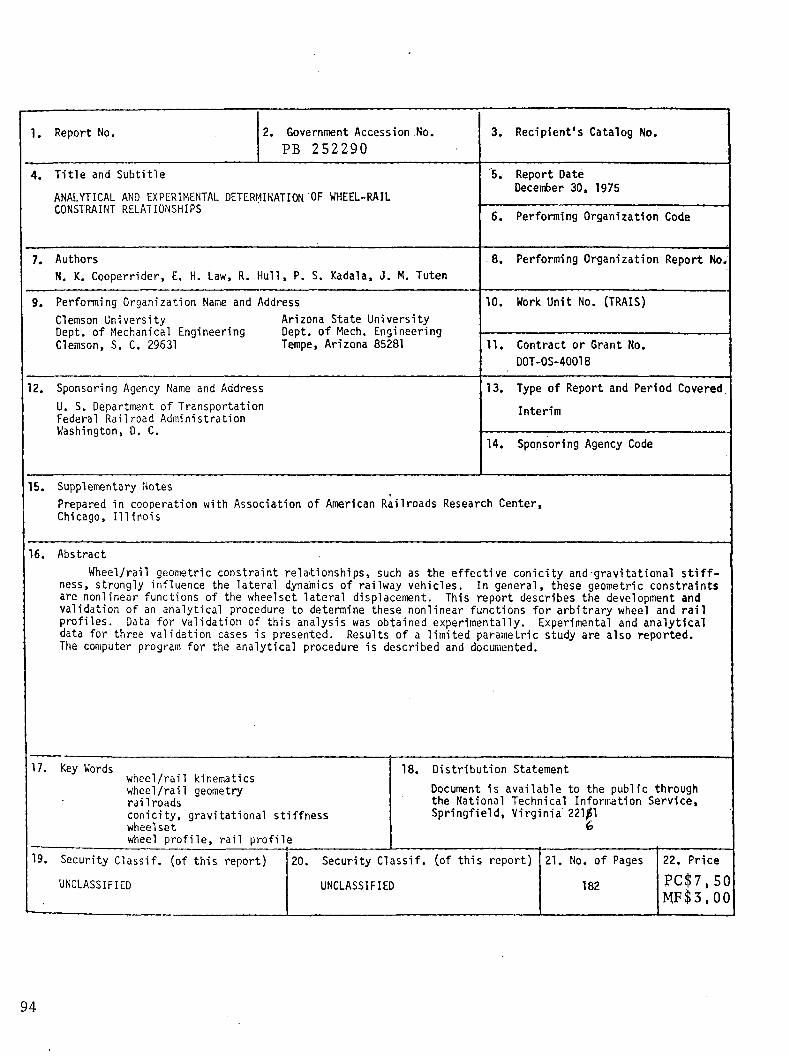
1. Report No. 2. Government Accession No.
P B 2 5 2 2 9 0
3. Recipient's Catalog No.
Title and Subtitle
ANALYTICAL AND EXPERIMENTAL DETERMINATION'OF WHEEL-RAIL CONSTRAINT RELATIONSHIPS
'5. Report DateDecember 30, 1975
6. Performing Organization Code
7. AuthorsN. K. Cooperrider, E. H. Law, R. Hull, P. S. Kadala, J. M. Tuten
8. Performing Organization Report No.
9. Performing Organization Name and AddressClemson University Arizona State UniversityDept, of Mechanical Engineering Dept, of Mech. EngineeringClemson, S. C. 29631 Tempe, Arizona 85281
10. Work Unit No. (TRAIS)
11. Contract or Grant No. D0T-0S-40018
12. Sponsoring Agency Name and AddressU. S. Department of Transportation Federal Railroad Administration Washington, D. C.
13. Type of Report and Period Covered
Interim
14. Sponsoring Agency Code
15. Supplementary NotesPrepared in cooperation with Association of American Railroads Research Center, Chicago, Illinois
16. Abstract
Wheel/rail geometric constraint relationships, such as the effective conicity and gravitational stiffness, strongly influence the lateral dynamics of railway vehicles. In general, these geometric constraints are nonlinear functions of the wheelset lateral displacement. This report describes the development and validation of an analytical procedure to determine these nonlinear functions for arbitrary wheel and rail profiles. Data for validation of this analysis was obtained experimentally. Experimental and analytical data for three validation cases is presented. Results of a limited parametric study are also reported.The computer program for the analytical procedure is described and documented.
17. Key Wordswheel/rail kinematics wheel/rail geometry railroadsconicity, gravitational stiffness wheelsetwheel profile, rail profile
18. Distribution Statement
Document is available to the public through the National Technical Information Service, Springfield, Virginia 221^1
6
19. Security Classif. (of this report) 20. Security Classif. (of this report) 21. No. of Pages 22. Price
UNCLASSIFIED UNCLASSIFIED 182 P C $ 7 , 5 0
M F $ 3 , 0 0
94

technical report standard title pace1. Report No. 2. Government Accession No.FRA/ORD-76/249 PB 2 54810
3. Recipient s Catalog No. .
4. Title and SubtitleOPTICAL AUTOMATIC CAR IDENTIFICATION (OACI) Field Test Program
5. Report DateMay 1976
6. Performing Organization Code7. Autbor(s)Hector C . Ingrao
8. Performing Organization Report No.DOT-TSC-FRA-76-9
9. Performing Organization Name and AddressU.S. Department of Transportation Transportation Systems Center Kendall Square Cambridge M A 02142
10. Work Unit No.RR 616/R6335
11. Contract or Grant No.13. Type of Report and Period CoveredFinal Report June-October 1975
12. Sponsoring Agency Name and AddressU.S. Department of Transportation Federal Railroad Administration Office of Research and Development Washington DC 20590
14. Sponsoring Agency Code15. Supplementary Notes ....
16. AbstractThe results of the Optical Automatic Car Identification (OACI) tests at Chicago conducted from August 18 to September 4, 1975 are presented. The main purpose of this test was to determine the suitability of optics as a principle of operation for an automatic car identification. Readabilities by standard and "modified" scanners were measured. Based on the optical information available in the label-scanner communication channel and the determination of the non-read causes, the label-scanner readability and limit of readability were obtained. Also the same readabilities were obtained using multiplexed data from two scanners, one at each side of the track. The benefits of redundancy in the multiplexed data are based on the analysis of the test results. Conclusions and recommendations are presented. No attempt has been made to evaluate the hardware implementation of the OACI systems used during the Chicago test.
17. Key Words 18. Distribution StatementAutomatic Car Identification Railroad Information Systems Classification Yard Technology
DOCUMENT IS AVAILABLE TO THE PUBLIC THROUGH THE NATIONAL TECHNICAL INFORMATION SERVICE. SPRINGFIELD.Virginia 22161
19. Security Classif. (of this report) 20. Security Clas if. (of this page) 21- No. of Pages 22. PriceUnclassified Unclassified 186 P C $ 7 . 5 0
M F $ 3 . 0 0Form DOT F 1700.7 is-69)
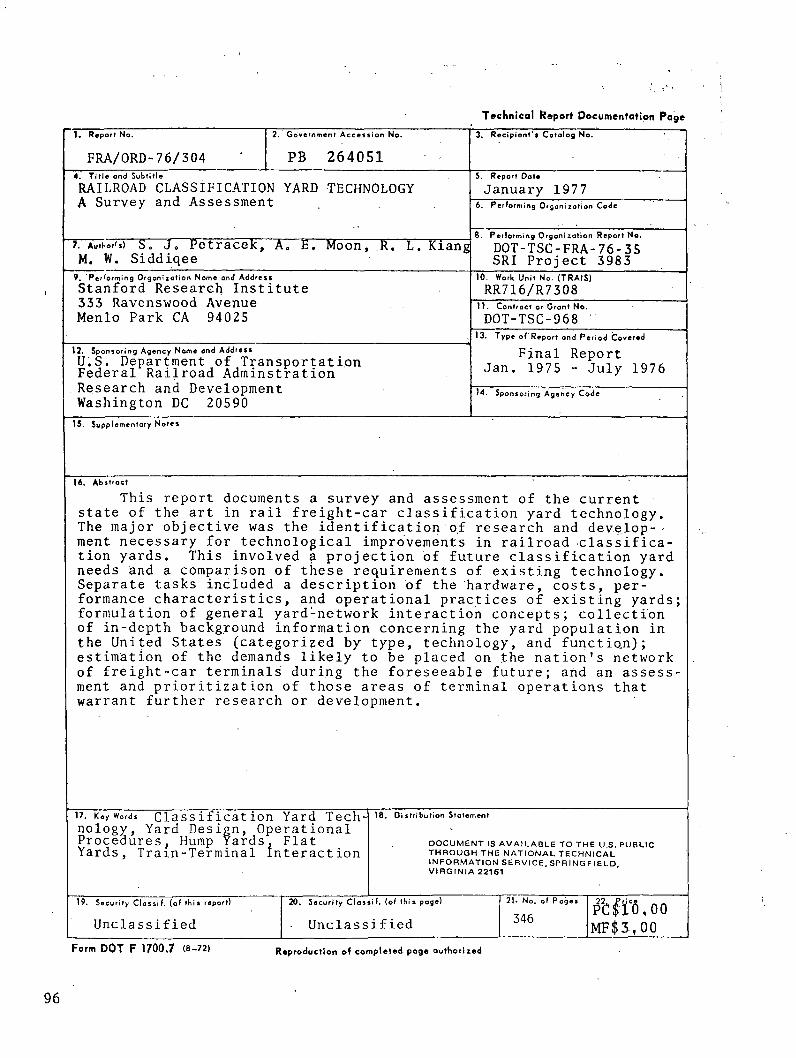
Technical Report Documentation Page
FRA/ORD-76/3041. Report No. 2. Government Accession No.
PB 2640513. Recipient's Catalog No.
4. Title and SubtitleRAILROAD CLASSIFICATION YARD TECHNOLOGY A Survey.and Assessment
5. Report DoteJanuary 19776. Performing Orgonizofion Code
7. S. Jo Petracek, A. E. Moon, R. L. KiangM. W. SiddiqeePerforming Organization Report No.DOT-TSC-FRA-76-35 SRI Project 3983
9. Performing Organization Nome and AddressStanford Research Institute 333 Ravenswood Avenue Menlo Park CA 94025
10. Work Unit No. (TRAIS)RR716/R730811. Contract or Grant No.DOT-TSC-968
12. Sponsoring Agency Name ond AddressU.S. Department of Transportation Federal Railroad Adminstration , Research and Development Washington DC 20590
13. Type of Report ond Period CoveredFinal Report
Jan. 1975 - July 197614. Sponsoring Agency Code
15. Supplementary Notes
16 AbstroctThis report documents a survey and assessment of the current
state of the art in rail freight-car classification yard technology. The major objective was the identification of research and develop-' ment necessary for technological improvements in railroad classification yards. This involved a projection of future classification yard needs and a comparison of these requirements of existing technology. Separate tasks included a description of the hardware, costs, performance characteristics, and operational practices of existing yards; formulation of general yardmetwork interaction concepts; collection of in-depth background information concerning the yard population in the United States (categorized by type, technology, and function); estimation of the demands likely to be placed on the nation's network of freight-car terminals during the foreseeable future; and an assessment and prioritization of those areas of terminal operations that warrant further research or development.
17. Key Word. Classification Yard Technology, Yard Design, Operational Procedures, Hump Yards, Flat Yards, Tram-Terminal Interaction
18. Distribution StotementDOCUMENT IS AVAILABLE TO THE U.S. PUBLIC THROUGH THE NATIONAL TECHNICAL INFORMATION SERVICE. SPRINGFIELD, VIRGINIA 22161
19. Security Classif. (of this report) 20. Security Classif. (of this page) 21* No. of Pages346 pblffi.oo
Unclassified Unclassified MF $ 3,00Form DOT F 1700.7 (8-72) Reproduction of completed poge outhorized
96
( hCHNICAL KtPQRr SI ANUAKU IHLc rAwt1. Report No.F R A / O R D - 7 7 / 4 4
2. Government Accession No. 3. Recipient’s Catalog No.
I4. Title and SubtitleR E S E A R C H P L A N F O R E M C S T U D Y O F T H E C O M M U N IC A T IO N A N D
C O N T R O L S Y S T E M S I N A R A IL R O A D C L A S S I F I C A T I O N Y A R D
5. Report DoteJ u l y 1 9 7 7
6. Performing Organization Code
7. Author's)P . S p e h a n d S . S t o r o z u m o f I I T R e s e a r c h I n s t i t u t e
8. Performing Organization Report No.E C A C - C R - 7 7 - 0 3 1
9. Performing Orgonizotion Nome and AddressE l e c t r o m a g n e t i c C o m p a t i b i l i t y A n a l y s i s C e n t e r
N o r t h S e v e r n
A n n a p o l i s , M D 2 1 4 0 2
[ _ _ --------------------------
10. Work Unit No.
11. Contract or Grant No.W o r k S t a t e m e n t A R 7 4 3 1 1
13. Type of Report and Period Covered12. Sponsoring Agency Name and Address jU . S . D e p a r t m e n t o f T r a n s p o r t a t i o n C o n s u l t a t i v e R e p o r t j
i F e d e r a l R a i l r o a d A d m i n i s t r a t i o n ______________________________________________
! O f f i c e o f R e s e a r c h a n d D e v e l o p m e n t u - spon‘orin® Ag.ney Cod.
j W a s h i n g t o n , D C 2 0 5 9 0 _________________________________________________ I_______________________________________j 15. Supplementary Notes| C o o r d i n a t e d w i t h t h e I n d u c t i v e I n t e r f e r e n c e C o m m i t t e e , C o m m u n i c a t i o n a n d S i g n a l
| S e c t i o n , A s s o c i a t i o n o f A m e r i c a n R a i l r o a d s .
16. Abstract jT h e F e d e r a l R a i l r o a d A d m i n i s t r a t i o n ( F R A ) i s p l a n n i n g a s t u d y o f t h e e l e c t r o - j
m a g n e t i c i n t e r f e r e n c e / e l e c t r o m a g n e t i c c o m p a t i b i l i t y ( E M I/ E M C ) i n t h e r a i l r o a d
c l a s s i f i c a t i o n y a r d . C l a s s i f i c a t i o n y a r d s , e s p e c i a l l y h u m p y a r d s , a r e a u t o m a t e d I
i t o t h e e x t e n t t h a t e l e c t r o m a g n e t i c e q u ip m e n t e m i t s i n t h e r a n g e f r o m D C t o s e v e r a l j I t h o u s a n d m e g a h e r t z . W i t h t h e i n t r o d u c t i o n o f c o m p u t e r s a n d c o m p u t e r c o n t r o l s , c o m - '
| p a t i b l e e l e c t r o m a g n e t i c o p e r a t i o n i n t h e y a r d s w i l l b e m o r e d i f f i c u l t n o w a n d i n
l t h e f u t u r e .
T h e F R A h a s t a s k e d t h e E l e c t r o m a g n e t i c C o m p a t i b i l i t y A n a l y s i s C e n t e r ( E C A C ) to !
i n v e s t i g a t e t h e c l a s s i f i c a t i o n y a r d c o m m u n i c a t i o n a n d c o n t r o l s y s t e m s EM C c o m p a t i - |
b i l i t y s i t u a t i o n . A n EM C a n a l y s i s w i l l b e c o n d u c t e d t o d e t e r m i n e t h e i n t e r f e r e n c e
i m p a c t o n y a r d e q u i p m e n t . R e c o m m e n d a t io n s t o im p r o v e c o m p a t i b i l i t y w i t h i n t h e
c l a s s i f i c a t i o n y a r d w i l l b e m a d e i n t h e f o r m o f c o n c e p t u a l g u i d e l i n e s .
I n p a r t i a l f u l f i l l m e n t o f t h e i n v e s t i g a t i o n a r e m e a s u r e m e n t s r e q u i r e d t o d e
t e r m i n e t h e E M I/ E M C . T h i s r e s e a r c h p l a n a d d r e s s e s t h e e q u i p m e n t s r e q u i r e d a l o n g
w i t h t h e s u g g e s t e d l o c a t i o n s o f t h e m e a s u r e m e n t s . T h e r e s e a r c h p l a n w i l l b e s u b - j
m i t t e d t o t h e A s s o c i a t i o n o f A m e r i c a n R a i l r o a d s ( A A R ) f o r c o m m e n t p r i o r t o i m p l e -
i m e n t a t i o n .
iI
! 17. Key Words| E L E C T R O M A G N E T IC C O M P A T IB I L I T Y
i E L E C T R O M A G N E T IC IN T E R F E R E N C E
R A IL R O A D C L A S S I F I C A T I O N Y A R D
R A IL R O A D H U M P Y A R D
18. Distribution Stotement
T H I S D O C U M E N T W I L L B E
I N C L U D E D A S A N A P P E N D I X
T O T H E F I N A L R E P O R T .
II
19. Security Classif. (of this report) 20. Security Classif. (of thi $ page) 21. No. of Pages 22. Price
U N C L A S S I F I E D U N C L A S S I F I E D 1 8
Form DOT F 1700.7 (s-69)
97
Technical Report Documentation Page
1. Report No.
FRA-OR&D 75-81A
2. Government Accession No.
PB 248350
3. Recipient’s Catalog No.
4. Title and Subtitle •FREIGHT CAR TRUCK DESIGN OPTIMIZATION
Literature Search - Volume I
,5. Report DateJune 1975
6. Performing Organization Code
8. Performing Organization Report No:
TD0P 75-2517. Author's) Southern Pacific Transportation Company
Technical Research and Development Group9. Performing Organization Name and Address
Southern Pacific Transportation CompanyOne Market StreetSan Francisco, California 94105
10. Work Unit No. (TRAIS)
11. Contract or Grant No.DOT FR-40023
13* Type of Report and Period CoveredInterim Report April 1975 - June 1975
12. Sponsoring Agency Name and AddressDepartment of Transportation Federal Railroad Administration Office of Research and Development
___ Washington. D.C.__20590_______________________________14. Sponsoring Agency Code
15. Supplemenfary NotesThis interim report represents the first of a three-volume set. Volumes II and III bear the same report number with B and C suffixes.
16. AbstroctThis document serves as an introduction to the literature known to be available and relevant to rail freight car trucks, their components and performance characteristics. In connection with the Federal Railroad Administration sponsored research in Truck Design Optimization a literature search was conducted to review and assemble all relevant publications, papers, and articles. The collected documentation has been organized into five sections:
° The History of the Freight Car Truck ° Truck Design ° Truck Components° Track-Train Dynamics as Related to Truck Performance ° Truck Performance
Each section contains; an introduction dealing with literature selected for reprinting, reprints of articles judged particularly representative or salient, and a bibliography alphabetized by author. The five sections have been organized into three-volumes. Volume I contains the sections entitled: "The History of theFreight Car Truck" and "Truck Design." Volumes II and III will complete the compilation. It is expected that supplements to the three initial volumes will be published at a later date as additional information becomes available.
i7. Keywords big 1 iography, history, design principles, freight car trucks, passenger car trucks, locomotive trucks, reprints, literature, truck functions, three-piece truck, bolster, side frames friction snubbers, truck dynamics
18. Distribution StatementDocument is available to the public through the National Technical Information
Service, Springfield, Virginia 22161
19. Security Classif. (of this report) 20. Security Classif. (of this page) 21* No. of Pages 22. PricePC$ 5,50
Unclassified Unclassified 124 MF $ 3,0 0Form D O T F 1700.7 (8-72) Reproduction of completed page authorized
98
Tcclinicol Dcj'otl Pocuntenlotiort Pcl. Report No.
FRA-OR&D-75-81BPB 248351
2. Covcrnmenl Accession No. 3. Recipient'* Cofolog No.
4. Title end Subtitle
FREIGHT C A R T R U C K DESIGN OPTIMIZATIONLiterature Search - Volume II
5. Report OgleJuly 1975
Performing Orgoniaohon Co dt
7. Aothor'i) Southern Pacific Transportation Company.Technical Research and Development Group
6. Performing Orgcni zolion Report No.
T D O P 75-2529* Performing Orgcnizotion Nome end Address
Southern Pacific Transportation CompanyOne Market StreetSan Francisco, C A 94105
10. Work Uni! No. (TRAIS)
11. Controc? or Grant No.D O T FR-40023
12. Sponsoring Agency Nome ond AddressDepartment of Transportation Federal Railroad Administration Office of Research and Development Washington, D. C. 20590
13. T ype of Report ond Period Covered
Interim Report June-July 1975
14. Sponsoring Agency Code
IS. upplcnjcnlory Note* *This interim report represents the second of a three-volume set.Volumes I and III bear the same report number with A and C suffixes respectively.
16. AbsCroctVolume II of the T D O P Literature Search contains the sections entitled:
"Truck Components" and "Track-Train Dynamics As Related To Truck Performance." Each of the two sections contains:
• An introduction dealing with literature selected for reprinting• Reprints of articles judged particularly representative or salient• A bibliography alphabetized by author
The "Bibliography--Truck Components" is further organized into the following subsections:
• Brakes and Brake Rigging• Centerplates• Side Frames arid Bolsters• Snubbers and Dampers• Springs.• Wheels, Axles, and Roller Bearings• Miscellaneous Component Systems
17. Key Wordi Bibliography, freight car truck, truck components, brakes, brake rigging, centerplates, side frames, bolsters, snubbers, dampers, springs, wheels, axles, roller bearings, track-train dynamics,
16. Distribution StatementDocument is available to the public through the National Technical Information Service, Springfield, Virginia 22161.
19. Security Closul. (of fltit report) 20, Security Clossif. -(of lliis poge) 21* No, of Pogcs l*W750Unclassified Unclassified 198 MF$3,00
Perm DOT P 1700.7 (8-72) Reproduction of completed page oullioriicJ
Tcclmicol. Ivcpoil Do.ciimontolion Pc
FRA-OR&D-75-81C1. Report Mo. 2. Government Accession No.
PB 248352 1 “3» Recipient's Cctoloy No.
4. Title onii Subtitle* * r> .FREIGHT CAR T R U C K DESIGN OPTIMIZATION
Literature Search - Volume III
5, Report Dote \ *August 1975
6. 'Performing O'soniaot.ion Code 41
1. Author'.) Southern Pacific Transportation CompanyTechnical Research and Development Group
8. Performing Orgoni zolion Report No'.. T D O P 75-253 !
9. Performing Orgoni lotion Nome end AddressSouthern Pacific Transportation CompanyOne Market StreetSan Francisco, C A 94105
10. Work Unit No. (TRAIS)
11. Contract or Grant. No.D O T F R -40023
12. Sponsoring Agency Nome ond AddressDepartment Of Transportation Federal Railroad Administration Office of Research and Development Washington. D. C. 20590_________
13. Type of Report ond Period CoveredInterim Report , July -^August 1975
id. Sponsoring Agency Code'
15. $ypp!cnieni°ry NotesThis interim report represents the third of a three-volume set. Bibliographical additions will be made to these volumes as hev/ articles become available throughout the course of the Truck Design Optimization Project. See also, FRA-OR&D 75-81A & B.
1 6 . A bstrocf
Volume HI of the TDOP Literature Search contains the sections entitled: "Truck Performance" and "Literature Search Title Index." The section dealing with truck performance contains: ,
• An introduction dealing with literature-.selected for reprinting , . . .• Reprints of articles judged particularly representative or salient• A bibliography .alphabetized by author
The "Bibliography--Truck Performance" is further 'Organized into the following subsections:
• Computer Analysis of Truck Performance• Field Analysis of Truck Performance : '• Laboratory Analysis of Truck Performance
The index section contains a listing alphabetized by title of all publications included in the three-volume Literature Search.
17. Key Words , ‘ . -Bibliography, freight car truck, truck performance, computer analysis, field analysis, laboratory analysis, title index
18. Distribution Slotcmcnf Document is available to the public through the National Technical Information Service, Springfield, Virginia 22161.
19. Security Clostif. (of this report) 29. Security Clossif. {of tfii* pogc) 21* No. of PoQC 5 i ?. PricePC$7., 75Unclassified Unclassified 215 MF$3,00
f o r m D O T F 1700.7 (8 - 7 2 ) Reproduction of completed poge outlrorizcd
100
Technical Report Documentation Page
1. Report No. | 2. Government Accession No.FRA-OR&D 75-59 j PB 248632
3. Recipient's Cotolog No.j
4. Till* and Subti TieFREIGHT CAR TRUCK DESIGN OPTIMIZATIONIntroduction and Detailed Tests Plans— Series 1, 2, and 3 Tests— Phase I
5. Report DoteJune 19756. Performing Orgonization Code
----TDOP -?-5 5»~----- ---— --8. Performing Orgam zation Report No.7. Author's)Southern Pacific Transportatiop Company---Ta jujn l /> a 1_V) nn n v/ Vv on rl H/riyr) 1 nnrr.An f0 .wm.hU errs:—rttr C7trvxt trti—mHl— pil♦Ci t —Ui Uuii--- --------V. Performing Orgonizotion Nome ond AddressSouthern Pacific Transportation CompanyOne Market StreetSan Francisco, California 94105
10. Work Unit No. (TRAIS)11. Contract or Gront No.
DOT FR-4002313. Type of Report and Period Covered
Interim Report November 1974-March 1975
12. Sponsoring Agoncy Nome ond AddressDepartment of Transportation Federal Railroad Administration Office of Research^ and Development 14. Sponsoring Agency Code
_ ---- --— ■ - - ------—— ...■■■-■---—15. Supplementary Notes jThe information presented herein is a prerequisite to the coming interim report covering the test plan for Test Series 4, FRA Re.port No. FRA-OR&D 75-60.
16 AbsfroctThis document serves as an introduction to the Freight Car Truck Design
Optimization Project (TDOP) and presents the detailed test plans for Series 1, 2, and 3 Tests of a contemplated group of four series for that project. Some of the background of the project is given, the development of the test method is described, a description of the instrumentation on the test track and test car and of the facilities of Southern Pacific Transportation Co. (SPT Co.) are given, a data collection and processing plan and analytical procedures for comparing test results with predicted values are presented. A description of the Series 1, 2, and 3 Tests, the contemplated test schedule, and the management structure for the project are also given. In the appendix, the tasks required to be performed by the statement of work for Phase I are outlined.
17. Key Words Testing, instrumentation, dynamic analysis> data acquisition, wheel wear, spring rate, snubbing level, load, speed, track, side bearing clearance, gib clearance
i 18. Oi s»r» bi-t*on Statement« Document is availablet o t h e p u b 1 i c t h r o u gh t he N a t j on a 1
j Technical Information Service, Spring- field, Virginia 22151
i17 Security U o s m I. (of this report) j 20. Security C»os si f. (of ij*: s page) 21 • No. of r'ogos !p f $ 5 7 5 0 |MF$ 3 . 0 0 1
Unclassified Unclassified!
113______ _ 1
Form D O T F 1700.7 <8-.7?> Reproduction of completed poue oythorized
101
1. Report
FRA-0R6.D 75-60
2 Government Accession No.
PB 246389
4. Title and SubtitleF R E I G H T C A R T R U C K D E S I G N O P T I M I Z A T I O N
P R O J E C T - D e t a i l e d T e s t P l a n s F o r S e r i e s 4
7. Author's) s o u t h e r n P a c i f i c T r a n s p o r t a t i o n C o m p a n y
T e c h n i c a l R e s e a r c h & D e v e l o p m e n t G r o u p9. Performing Orgonizotion Nome ond AddressS o u t h e r n P a c i f i c T r a n s p o r t a t i o n C o m p a n y
O n e M a r k e t S t r e e t
S a n F r a n c i s c o , C a l i f . 9 4 1 0 5
1 2. Sponsoring Agency Name and AddressD e p a r t m e n t o f T r a n s p o r t a t i o n
F e d e r a l R a i l r o a d A d m i n .
O f f i c e o f R e s e a r c h & D e v e l o p m e n t
W a s h i n g t o n , D . C . 2 0 5 9 0 __________
3. Recipient’s Catalog No.
5. Report DateA u g u s t 1 9 7 56. Performing Organization Code
8. Performing Organization Report No.T D O P 7 5 - 1 5 2
10. Work Unit No. (TRAIS)11. Controct or Grant No.
D O T - F R - 4 0 0 2 313. Type of Report ond Period CoveredI n t e r i m R e p o r t
A p r i l - M a y 1 9 7 5
14. Sponsoring Agency Code
15. Supplementary NotesT h e r e p o r t F r e i g h t C a r T r u c k D e s i g n O p t i m i z a t i o n , I n t r o d u c t i o n a n d
D e t a i l e d T e s t P l a n s - - S e r i e s 1 , , a n d 3 T e s t s - - P h a s e I i s a
p r e r e q u i s i t e t o t h i s d o c u m e n t . _______________16. Abstroct
T h i s d o c u m e n t p r e s e n t s t h e d e t a i l e d t e s t p l a n s f o r S e r i e s 4 T e s t s
o f P h a s e I o f t h e T r u c k D e s i g n O p t i m i z a t i o n P r o j e c t . I t i s a
c o n t i n u a t i o n o f a p r e v i o u s r e p o r t p r e s e n t i n g t h e i n t r o d u c t i o n a n d
t h e d e t a i l e d t e s t p l a n s f o r S e r i e s 1 , 2 , a n d 3 T e s t s , f o r P h a s e I
o f t h e s a m e p r o j e c t . I t d e s c r i b e s t h e m o d i f i c a t i o n s t o t h e t r u c k s
t;o b e m a d e p r i o r t o t e s t i n g a n d l i s t s t h e i n s t r u m e n t a t i o n t o b e
u s e d a n d t h e s e q u e n c e o f t e s t i n g . T h e r e a d e r i s r e f e r r e d t o t h e
p r e v i o u s d o c u m e n t f o r d e t a i l s o f t h e i n s t r u m e n t a t i o n a n d t h e d a t a a n a l y s i s .
17. Key Word friction-snubbed truck,laboratory testing,mathematical models, center- plate friction,pedestal shims,elastomeric adapter pads,side frame intertie,hydraulic dampers,air bag (constant contact)side19. Security Clossif. (of this report)
U n c l a s s i f i e d
18. Di stribution StatementDocument is available to the public through the National Technical Information Service, Springfield, Va.22151
i o n ^ ____________ n20. Security Clossif. (of this page) 21» No. of Pages 22. PriceP C $ 4 , 0 0
U n c l a s s i f i e d M F $ 3 . 0 0
Form DOT F 1700.7 (8-72) Reproduction of completed poge authorized
102
Technical Report Documentation Page
1. Report No.FRA-OR&D-75-82
2. Government Accession No.
P B 2 4 8 6 3 1
3. Recipient $ Catalog No.
4. Tift* and Subtitl.FREIGRT CAR TRUCK DESIGN OPTIMIZATION Detailed Test Plans For Series 5 Tests-Phase I
5. Report DateNovember 1975
6. Performing Organization Code
8. Performing Organization Repprt No.TDOP-75-1537. Author'*) southern Pacific Transportation Company
Technical Research & Development Group9. Performing Organization Name ond AddressSouthern Pacific Transportation CompanyOne-Market StreetSan Francisco, California 94105
10. Work Unit No. (TRAIS)
11. Contract or Grant No.DOT FR-40023
13. Type of Report and Period Covered
Interim Report July-August
12. Sponsoring Agency Nome ond AddressDepartment of Transportation Federal Railroad Administration Office of Research & Development Washington, D.C. 20590
14. Sponsoring Agency Code
15. -Supplementary NotesThe reports entitled Introduction and Detailed Test Plans For Series 1, 2, and 3 Tests, Phase I, and Detailed Test Plan For Series 4 Tests, Phase I, are prerequisite to this document.
16. Abttroct xhis document presents the detailed test plans for Series 5 Tests of Phase I of the Truck Design Optimization Project. It is a continuation of previous reports for the same project presenting the introduction and detailed test plans for Series 1, 2, and 3 Tests in the first volume and the detailed test plans for Series 4 Tests in the second volume. It includes a description of the trucks and cars to be used in the testing, the basis for selecting them, and a description of the tests themselves. It lists the instrumentation to be used and the sequence of testing. The reader is referred to the previous documents for details of the instrumentation and data analysis.
17. Key Words friction snubbed trucks,cylindri cal wheels, 1-in-40 tapered wheels, selected wheel profile,spring complements, harmonic roll, 3/4 in. low, half- staggered joints, spring-nest snubbers
J8, Distribution StotementDocument is available to the public through the National Technical Information Service,Springfield, Virginia 22151
19. Security Clossif. (of this report)Unclassified
20. Security Clossif. (of this page)Unclassified
21* No. of Pages32
22. PriceP C $ 4 ,00 M F $ ■*. 0 0
Form DOT F 1700,7 (8-72) Reproduction of completed poge authorized
103
Technical Report Documentation Page
1. Report No.FRA-OR&D 75-58
2. Government Accession No.PB 248832
3. Recipient's Catalog No.
4. Title and Subtitle
FREIGHT CAR TRUCK DESIGN OPTIMIZATION METHODOLOGY FOR A COMPREHENSIVE STUDY'OF TRUCK ECONOMICS
5. Report DateApril » 1975
6. Performing Organization Code
7. Authors)David April
8. Performing Orgonizotion Report No.
TDOP 75-19. Performing Organization-Name and AddressSouthern Pacific Transportation Company- One Market Street . _San Francisco, California 94105
10. Work Unit No. (TRAIS)
11.- Contract or Gront No.DOT FR-40023
13. Type of Report and Period CoveredTechnical Report , August 1974-January 19'
12. Sponsoring Agency Name and AddressU. S. Department, of.' TransportationFederal Railroad Administration _________________Office of Research, Development & Demonstrat:.&ViJponsori"9 As*ncy Code Washington, D. C. 20590________________________
15. Supplementary Notes
16. Abstroct
As a part of the Federal Railroad Administration’s Truck Design Optimization Project (TDOP) a determination of the economics associated with particular freight car truck designs is needed. Although TDOP centers around the development of performance'‘'and. testing specifications for rail freight car trucks the methodology for evaluating the economic benefits to be derived from efficient truck designs is not at hand. Accordingly,it has been-necessary to develop a systematic approach to identifying the cost elements associated with truck ownership. A methodology is proposed for developing the necessary truck economic data first through a pilot study and subsequently through the collection and verification of the data from a wide base of sources. A subsequent report is to outline the findings of this research.
17. Key WordsFreight Car Truck Operating Costs Truck Economic Model Truck Economic Operating Life Truck Economic Data Base
19. Security Classif. (of this report)Unclassified
18. Distribution StatementDocument is available to the public through the National Technical Information Service, Springfield, Virginia 22151
20. Security Classif. (of this page) 21* No. of Pages 22. PriceUnclassified 27 P C $ 4 ,00
MF $ 3,0 0Form DOT F 1700.7 (8-72) Reproduction of completed page authorized
104

T e c h n i c a l Repo rt D o c u m e n ta t i o n P a g e
1. Report No.
FRA-OR&D 75-58A4. Title ond Subti tie
2. Government Accession No.
P B 2 5 1 4 Q Q
FREIGHT C A R T R U C K D E S I G N OPTIMIZATION:
T ruck Econo m i c Dat a C o l l e c t i o n and Analysis
7. Author's)
David A p r i l9. Performing Orgonizotion Nome and Address
Southern Pacific Transportation CompanyOne Market StreetSan Francisco, CA 94105
12. Sponsoring Agency Nome ond Address
Department of Transportation Federal Railroad Administration Office of Research and Development Washington, D.C. 20590
3. Recipient’s Catalog No.
5. Report Date
March 19766. Performing Organization Code
8. Performing Organization Report No.
TDOP 75-210. Work Unit No. (TRAIS)
11. Contract or Grant No.
DOT-FR-4002313. Type of Report and Period Covered
Technical Report Feb. 1975 - Feb. 1976
14. Sponsoring Agency Code
15. Supplementary Notes
See also Freight Car Truck Design Optimization, Methodology for a Comprehensive Study of Truck Economics, April 1975 (NTIS Accession No. PB 248 832/AS) to the extent that this report expands further on the economic analysis of freight car trucks
16. AbstroctA first interim report covering the development of the TDOP economic methodology was published by the Federal Railroad Administration in April 1975.It contains the truck investment economic evaluation procedures intended for the use of the railroad industry and their suppliers.
The primary objective of the Truck Economic Data Collection and Analysis Program is to test the procedures for establishing the significant actual operating costs of existing Type I general purpose trucks. This second interim report covers the progress of the program. A generalized truck cost information system was designed for the collection and integration of truck economic data. The collection of test data for off-line truck maintenance costs was completed. Test data collection was initiated for on-line truck maintenance and other associated costs and operating conditions. Preparatory work was begun to develop the appropriate data analysis guidelines. A preliminary analysis of some of the test data clearly revealed the truck’s reported off-line wear and failure cost performance.
Railroad companies and their suppliers are encouraged to consider adopting the tested procedures of the TDOP economic methodology. A progressive implementation of this methodology will provide them with the timely opportunity to develop a truck economic evaluation capability of their own.
17. Key Words
Freight Car Truck Operating Costs; Freight Car Economic Model; Freight Car Truck Economic Data Collection; Freight Car Truck Economic Data Base, Freight
18. Distribution Stotement
Document is available to the public through the National Technical Information Service, Springfield, Virginia, 22161
Car T r u c k E c o n o m i c D a t a A n a l y s i s19. Security Classif. (of this report) 20. Security Classif. (of this page) 21. No. of Poges 22. Price
U n c l a s s i f i e d U n c l a ssified 86 PC$ 5 ,00 MF $ 3 . 0 0
F o rm D O T F 17 0 0 .7 (8-72) Reproduction of completed page authorized
105
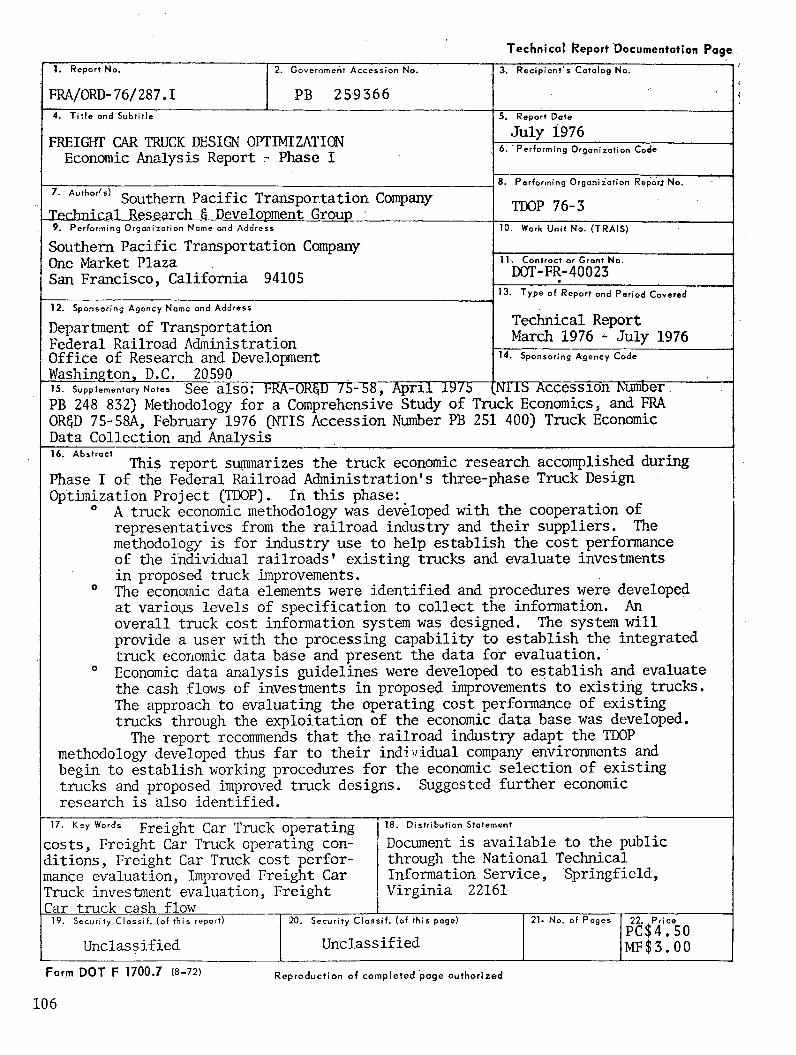
T e c h n i c a l R e p o r t D o c u m e n ta t io n P a g e .
1. Report No. 2. Government Accession No.
F R A / O R D - 7 6 / 2 8 7 . 1 P B 2 5 9 3 6 6
3. Recipient's Catalog No.
4. Title and Subtitle
F R E IG H T C A R T R U C K D E S IG N O P T IM IZ A T IO N
E c o n o m ic A n a l y s i s R e p o r t - P h a s e I
5. Report DateJ u l y 1 9 7 6
6. ‘Performing Organization Code
8. Performing Organization ReporJ No.
T D O P 7 6 - 37. Author ) P a c i f i c T r a n s p o r t a t i o n C o m p a n y
T e c h n i c a l R e s e a r c h 8 D e v e l o p m e n t G r o u p9. Performing Organization Name and Address
S o u t h e r n P a c i f i c T r a n s p o r t a t i o n C o m p a n y
O n e M a r k e t P l a z a
S a n F r a n c i s c o , C a l i f o r n i a 9 4 1 0 5
10. Work Unit No. (TRAIS)
IT. Controct or Grant No.D O T - F R - 4 0 0 2 3*
13. Type of Report and Period Covered
T e c h n i c a l R e p o r t
M a r c h 1 9 7 6 - J u l y 1 9 7 6
12. Sponsoring Agency Name and AddressD e p a r t m e n t o f T r a n s p o r t a t i o n
F e d e r a l R a i l r o a d A d m i n i s t r a t i o n O f f i c e o f R e s e a r c h a n d D e v e l o p m e n t
W a s h i n g t o n , D . C . 2 0 5 9 0
14. Sponsoring Agency Code
is. Supplementary Notes S e e a l s o : F R A -O R 6 jD 7 5 - 5 8 , A p r i l 1 9 / 5
P B 2 4 8 8 3 2 ) M e t h o d o l o g y f o r a C o m p r e h e n s i v e S t u d y o f T n
O R 8 D 7 5 - 5 8 A , F e b r u a r y 1 9 7 6 ( N T I S A c c e s s i o n N u m b e r P B 2 5 ]
D a t a C o l l e c t i o n a n d A n a l y s i s
[ M i s A c c e s s i o n N u m b e r —
l c k E c o n o m i c s , a n d F R A
L 4 0 0 ) T r u c k E c o n o m ic
T h i s r e p o r t s u m m a r i z e s t h e t r u c k e c o n o m ic r e s e a r c h a c c o m p l i s h e d d u r i n g
P h a s e I o f t h e F e d e r a l R a i l r o a d A d m i n i s t r a t i o n ' s t h r e e - p h a s e T r u c k D e s i g n
O p t i m i z a t i o n P r o j e c t ( T D O P ) . I n t h i s p h a s e :
° A t r u c k e c o n o m ic m e t h o d o l o g y w a s d e v e l o p e d w i t h t h e c o o p e r a t i o n o f
r e p r e s e n t a t i v e s f r o m t h e r a i l r o a d i n d u s t r y a n d t h e i r s u p p l i e r s . T h e
m e t h o d o l o g y i s f o r i n d u s t r y u s e t o h e l p e s t a b l i s h t h e c o s t p e r f o r m a n c e
o f t h e i n d i v i d u a l r a i l r o a d s ' e x i s t i n g t r u c k s a n d e v a l u a t e i n v e s t m e n t s
i n p r o p o s e d t r u c k im p r o v e m e n t s .
° T h e e c o n o m ic d a t a e l e m e n t s w e r e i d e n t i f i e d a n d p r o c e d u r e s w e r e d e v e l o p e d
a t v a r i o u s l e v e l s o f s p e c i f i c a t i o n t o c o l l e c t t h e i n f o r m a t i o n . A n
o v e r a l l t r u c k c o s t i n f o r m a t i o n s y s t e m w a s d e s i g n e d . T h e s y s t e m w i l l
p r o v i d e a u s e r w i t h t h e p r o c e s s i n g c a p a b i l i t y t o e s t a b l i s h t h e i n t e g r a t e d
t r u c k e c o n o m ic d a t a b a s e a n d p r e s e n t t h e d a t a f o r e v a l u a t i o n .
° E c o n o m ic d a t a a n a l y s i s g u i d e l i n e s w e r e d e v e l o p e d t o e s t a b l i s h a n d e v a l u a t e
t h e c a s h f l o w s o f i n v e s t m e n t s i n p r o p o s e d im p r o v e m e n t s t o e x i s t i n g t r u c k s .
T h e a p p r o a c h t o e v a l u a t i n g t h e o p e r a t i n g c o s t p e r f o r m a n c e o f e x i s t i n g
t r u c k s t h r o u g h t h e e x p l o i t a t i o n o f t h e e c o n o m ic d a t a b a s e w a s d e v e l o p e d .
T h e r e p o r t r e c o m m e n d s t h a t t h e r a i l r o a d i n d u s t r y a d a p t t h e T D O P
m e t h o d o l o g y d e v e l o p e d t h u s f a r t o t h e i r i n d i v i d u a l c o m p a n y e n v i r o n m e n t s a n d
b e g i n t o e s t a b l i s h w o r k i n g p r o c e d u r e s f o r t h e e c o n o m ic s e l e c t i o n o f e x i s t i n g
t r u c k s a n d p r o p o s e d im p r o v e d t r u c k d e s i g n s . S u g g e s t e d f u r t h e r e c o n o m ic
r e s e a r c h i s a l s o i d e n t i f i e d .
i7. Key words p r e i g h t C a r T r u c k o p e r a t i n g
c o s t s , F r e i g h t C a r T r u c k o p e r a t i n g c o n
d i t i o n s , F r e i g h t C a r T r u c k c o s t p e r f o r
m a n c e e v a l u a t i o n , Im p r o v e d F r e i g h t C a r
T r u c k i n v e s t m e n t e v a l u a t i o n , F r e i g h t
C a r t r u c k c a s h f l o w
18. Distribution StatementD o c u m e n t i s a v a i l a b l e t o t h e p u b l i c
t h r o u g h t h e N a t i o n a l T e c h n i c a l
I n f o r m a t i o n S e r v i c e , S p r i n g f i e l d ,
V i r g i n i a 2 2 1 6 1
19. Security Clossif. (of this report) 20. Security Classif. (of this page) 21« No. of Pages 22. .PriceP C S 4 5 0
U n c l a s s i f i e d U n c l a s s i f i e d M F $ 3 ! o O
Form D O T F 1700.7 (8—72) Reproduction of completed page authorized
106
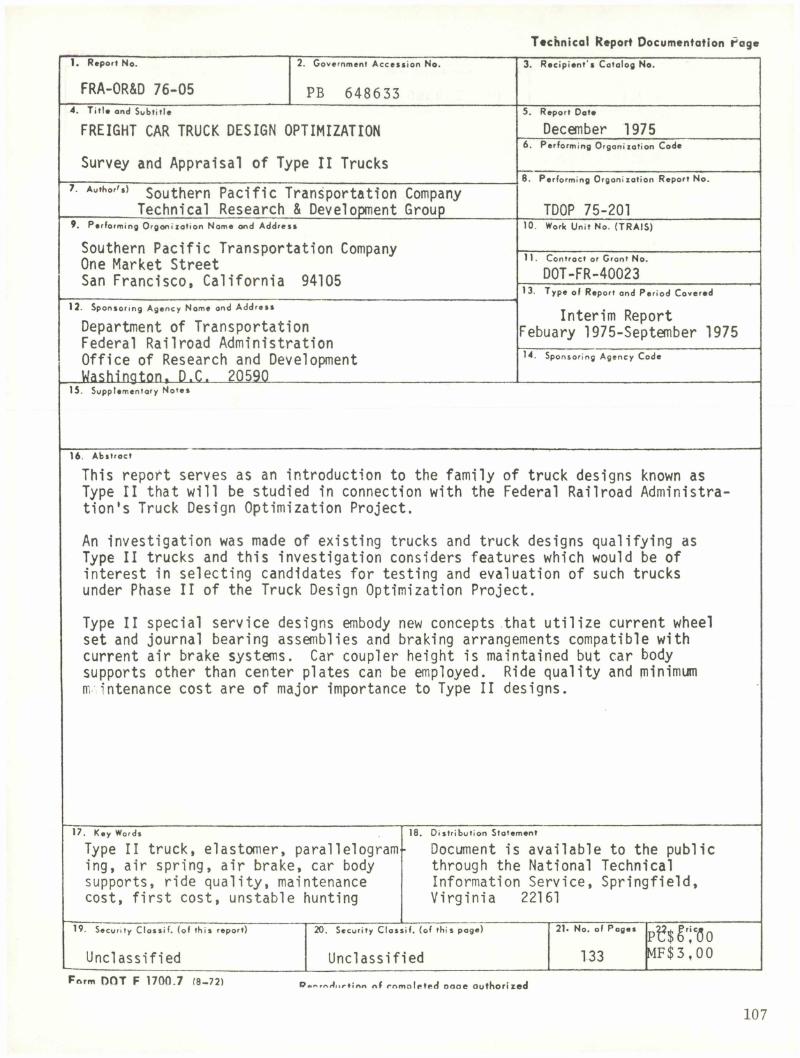
T e c h n i c a l R e p o r t D o c u m e n t a t i o n P a g e
1. Report No.
FRA-OR&D 7 6 -0 5 P B 6 4 8 6 3 3
2. Government Accession No. 3. Recipient's Catalog No.
4. Title and SubtitleFREIGHT CAR TRUCK DESIGN OPTIMIZATION
Survey and Appraisal of Type II Trucks
5. Report DoteDecember 1975
6. Performing Organization Code
7 Author**) southern Pacific Transportation Company Technical Research & Development Group
8. Performing Orgoni zotion Report No.
TDOP 75-2019. Performing Orgonizotion Nome ond Address
Southern Pacific Transportation CompanyOne Market StreetSan Francisco, California 94105
10. Work Unit No. (TRAIS)
11. Controcf or Gront No.D0T-FR-40023
12. Sponsoring Agency Name ond AddressDepartment of Transportation Federal Railroad Administration Office of Research and Development Washington. D.C.__20.5,90____________
13. Type of Report ond Period Covered
Interim Report Febuary 1975-September 197514. Sponsoring Agency Code
15. Supplementary Notes
16. AbstractThis report serves as an introduction to the family of truck designs known as Type II that will be studied in connection with the Federal Railroad Administration's Truck Design Optimization Project.
An investigation was made of existing trucks and truck designs qualifying as Type II trucks and this investigation considers features which would be of interest in selecting candidates for testing and evaluation of such trucks under Phase II of the Truck Design Optimization Project.
Type II special service designs embody new concepts that utilize current wheel set and journal bearing assemblies and braking arrangements compatible with current air brake systems. Car coupler height is maintained but car body supports other than center plates can be employed. Ride quality and minimum m intenance cost are of major importance to Type II designs.
17. Key WordsType II truck, elastomer, parallelogram ing, air spring, air brake, car body supports, ride quality, maintenance cost, first cost, unstable hunting
18. Distribution StatementDocument is available to the public through the National Technical Information Service, Springfield, Virginia 22161
19. Security Clossif. (of this report) 20. Security Clossif. (of this page) 21. No. of Pagesp£$Sr!e(3o
Unclassified Unclassified 133 MF$ 3,00
Form DOT F 1700.7 (8-72) P o o p / N r f u r » i n n r i f r o m o l e t e d o a a e a u t h o r i z e d
107
F R E I G H T C A R T R U C K D E S I G N O P T I M I Z A T I O N P R O J E C T
P H A S E I - M A G N E T I C D A T A T A P E S
A v a i l a b l e t o t h e p u b l i c t h r o u g h t h e
N a t i o n a l T e c h n i c a l I n f o r m a t i o n S e r v i c e
S p r i n g f i e l d , V A 2 2 1 6 1
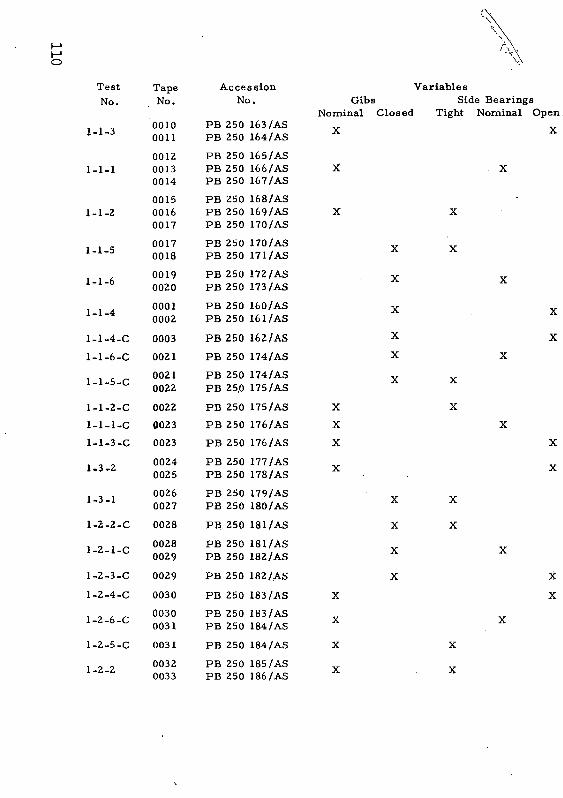
o
Test Tape Accession VariablesNo. No. No. Gibs Side Bearings
Nominal Closed Tight Nominal Open1-1-3 0 0 1 0 PB 250 163/AS X V
00 11 PB 250 164/AS A
00 12 PB 250 165 /AS1 -1-1 0013 PB 250 166/AS X X
0014 PB 250 167/AS0015 PB 250 168/ AS
1-1-2 0016 PB 250 169/AS X X0017 PB 250 170/AS0017 PB 250 170/AS X X1-1-5 0Q18 PB 250 171/AS
1 i L 0019 PB 250 172/AS X X1-1-00 0 2 0 PB 250 173/AS
1-1-4 0 0 0 1 PB 250 160/AS X X0 0 0 2 PB 250 161/AS
1-1-4-C 0003 PB 250 162/AS X X1-1-6-C 00 21 PB 250 174/AS X X
1 H— 1 (J1 1 o 00 21
0 0 2 2
PBPB
25025.0
174/AS 175/AS X X
1-1-2-C 00 22 PB 250 175/AS X X1-1-1-C 0023 PB 250 176/AS X X1-1-3-C 0023 PB 250 176/AS X X
0024 PB 250 177/AS X X0025 PB 250 178/AS
1-3-1 00260027
PBPB
250250
179/AS 180/AS X X
1-2-2-C 0028 PB 250 181/ AS X X
1-2-1-C 00280029
PBPB
250250
181/AS182/AS X X
1-2-3-C 0029 PB 250 182/AS X X1-2-4-C 0030 PB 250 183/AS X X
1-2-6-C 00300031
PBPB
250250
183/ AS 184 /AS X X
1-2-5-C 0031 PB 250 184/AS X X
1-2-2 00320033
PBPB
250250
185/AS 186/AS X X
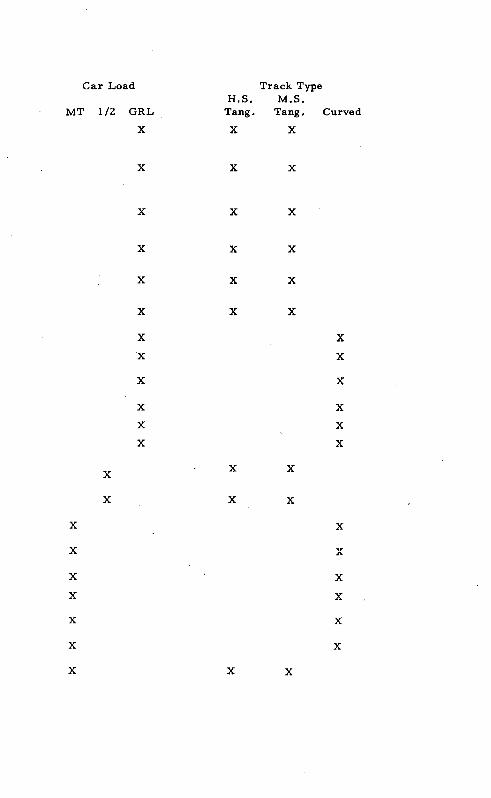
Car LoadMT 1/2
X
X
Track TypeH.S. M.S.
GRL Tang. Tang. CurvedX X X
X X X
X X X
X X X
X X X
X X X
X XX X
X X
X XX XX X
X X
X X
X X
X X
X XX X
X X
X X
X X X
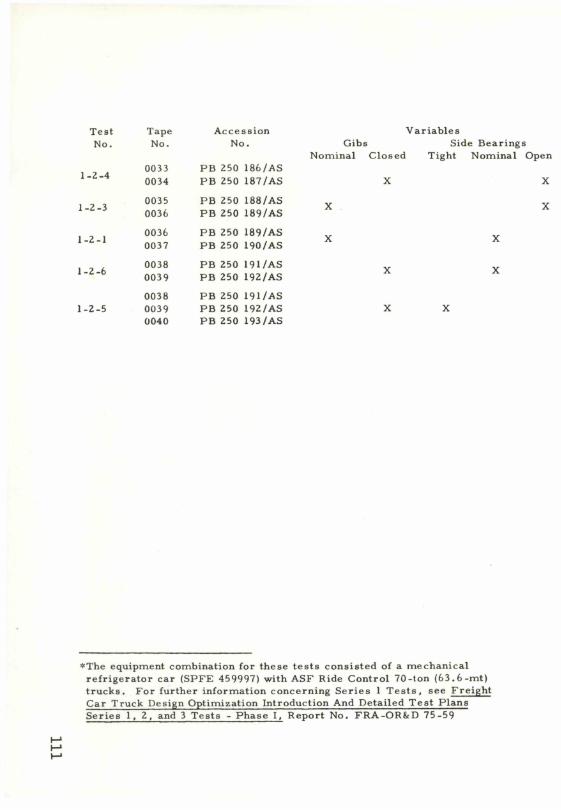
Il
l
Test Tape AccessionNo. No. No.
1-2-4 0033 PB 250 186/AS0034 PB 250 187/AS
1-2-3 0035 PB 250 188/AS0036 PB 250 189/AS
1-2-1 0036 PB 250 189/AS0037 PB 250 190/AS0038 PB 250 191 / AS
1 -2 -6 0039 PB 250 192/AS0038 PB 250 191/AS
1-2-5 0039 PB 250 192/AS0040 PB 250 193/AS
VariablesGibs Side Bearings
Nominal Closed Tight Nominal Open
X X
X X
X X
X X
X X
♦ The equipment combination for these tests consisted of a mechanical refrigerator car (SPFE 459997) with ASF Ride Control 70-ton (63.6 -mt) trucks. For further information concerning Series 1 Tests, see Freight Car Truck Design Optimization Introduction And Detailed Test Plans Series 1,2, and 3 Tests - Phase I, Report No. FRA-OR&D 75-59
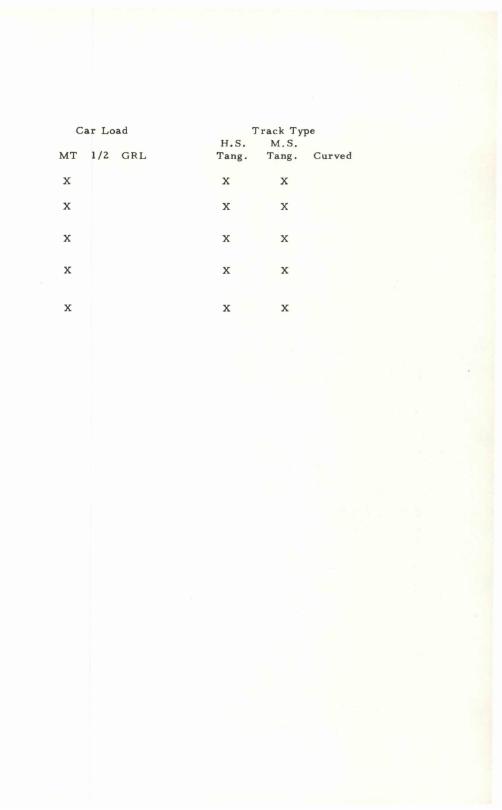
Car Load Track TypeH.S. M.S.
MT 1/2 GRL Tang. Tang. Curved
X X X
X X X
X X X
X X X
X X X
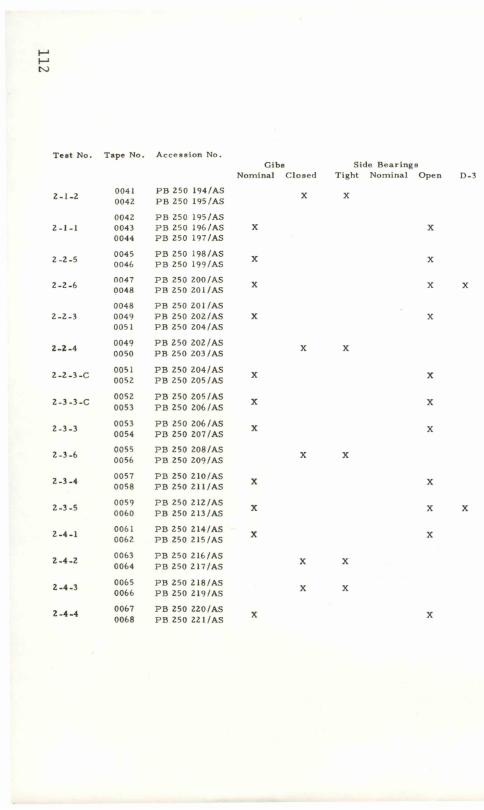
112
Test No. Tape No. Accession No.Gibs Side Bearings
Nominal Closed Tight Nominal Open D-0041 PB 250 194/AS
2 — 1 —2 0042 PB 250 195/AS0042 PB 250 195/AS
2-1-1 0043 PB 250 196/AS X X0044 PB 250 197/AS0045 PB 250 198/AS X2 -2-5 0046 PB 250 199/AS X0047 PB 250 200/AS Xc -c -o 0048 PB 250 201/AS X0048 PB 250 201/AS
2-2-3 0049 PB 250 202/AS X X0051 PB 250 204/AS
O ? A 0049 PB 250 202/AS Y YL-L -4 0050 PB 250 203/AS A A0051 PB 250 204/AS YL-L-d-L 0052 PB 250 205/AS A X
> i t r 0052 PB 250 205/AS Yb • J “ J — 0053 PB 250 206/AS A X
2-3-3 00530054
PB 250 206/AS PB 250 207/AS X X
O 1 £ 0055 PB 250 208/AS Y YL -3 -O 0056 PB 250 209/AS A A
2-3-4 00570058
PB 250 210/ AS PB 250 211 / AS X X
9 l c 0059 PB 250 212/AS Yb -J -J 0060 PB 250 213/AS A X X
2-4-1 0061 PB 250 214/AS Y0062 PB 250 215/AS A X
949 0063 PB 250 216/AS •V"b -4 -b 0084 PB 250 217/AS X A
2 -4 -3 0065 PB 250 218/AS0066 PB 250 219/AS X X
2-4-4 00670068
PB 250 220/AS PB 250 22 1 /AS X X
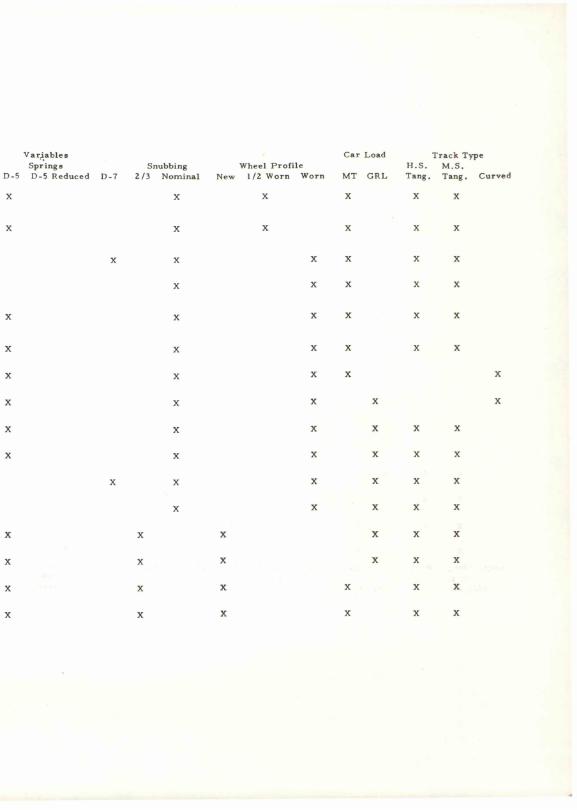
D-5V arjables Springs D-5 Reduced D-7
Snubbing 2/3 Nominal New
Wheel Profile 1 /2 Worn Worn
CarMT
LoadGRL
H.S.Tang,
Track Type M. S.
, Tang. CurvedX X X X X X
X X X X X X
X X X X X X
X X X X X
X X X X X X
X X X X X X
X X X X X
X X X X X
X X X X X X
X X X X X X
X X X X X X
X X X X X
X X X X X X
X X X X X X
X X X X X X
X X X X X X
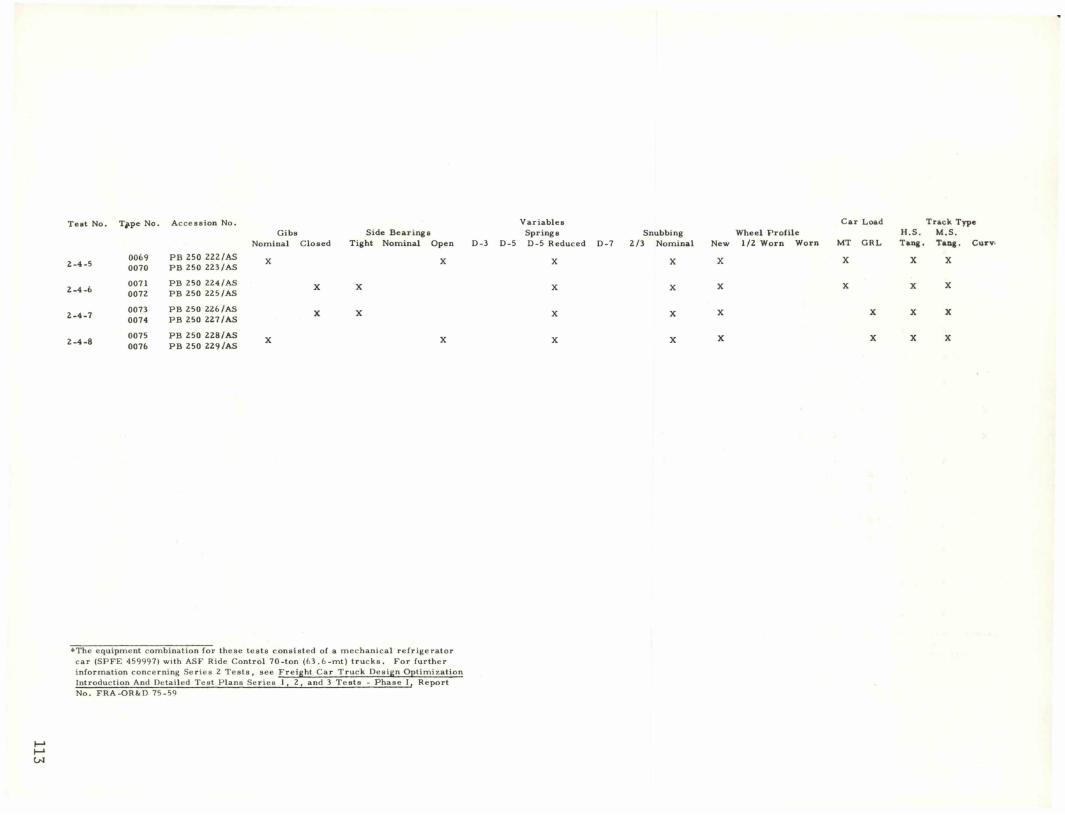
Test No. T pe No. Accession No.Gibs
Nominal ClosedSide Bearings
Tight Nominal OpenVariablesSprings Snubbing
D-3 D-5 D-5 Reduced D-7 2/3 Nominal NewWheel Profile 1/2 Worn Worn
Car Load MT GRL
H.S. Tang ,
Track Type M.S.Tang. Curv«
2-4-5 00690070
PB 250 222/AS PB 250 223/AS X X X X X X X X
2-4-6 00710072
PB 250 224/AS PB 250 225/AS X X X X X X X X
2-4-7 00730074
PB 250 226/AS PB 250 227/AS X X X X X X X X
2-4-8 00750076
PB 250 228/AS PB 250 229/AS X X X X X X X X
*The equipment combination for these tests consisted of a mechanical refrigerator car (SPFE 459997) with ASF Ride Control 70-ton (63.6-mt) trucks. For further information concerning Series 2 Tests, see Freight Car Truck Design Optimization Introduction And Detailed Test Plans Series 1, 2, and 3 Tests - Phase I, ReportNo. FRA-OR&D 75-59

Test No. Tape No. Accession No. Equipment Arr.New
Wheels
0077 PB 250 230/AS3-1-2 0078 PB 250 231 /AS A X
0079 PB 250 232/AS0080 PB 250 233/AS
3-2-2 0081 PB 250 234/AS B X0082 PB 250 235/AS
3-2-2-C 0083 PB 250 236/AS B X3-1-2-C 0084 PB 250 237/AS A X3-1-1-C 0085 PB 250 238/AS A X3-2-1-C 0086 PB 250 239/AS B X
0087 PB 250 240/AS3-2-1 0088 PB 250 241/AS B X
0089 PB 250 242/AS0090 PB 250 243/AS A Y.5 -1 -1 0091 PB 250 244/AS A A
0 1 02 PB 250 252/AS Y3-3-1 0103 PB 250 253/AS L. A
01 11 PB 250 261/AS3-4-1 0 1 1 2 PB 250 262/AS D X
0113 PB 250 263/AS3-4-1-C 0 1 1 0 PB 250 260/AS D X
0098 PB 250 251/AS i— vj-3-1-U 0104 PB 250 254/AS A
* A=SP FE Mech. Refer.--Barber S-2-C 70-ton (63.6-mt) trucksB=SP 60-foot (18.3-m) Box Car--Barber S-2-C 100-ton(90.9-mt) trucksC=SCL Box Car X5B--Barber S-2-C 70-ton low level trucksD=LN Covered Hopper Car--ASF Ride Control 100-ton trucksE=SP 89-foot, 4-inch (27.2-m) Flat Car--ASF Ride Control 70-ton trucks
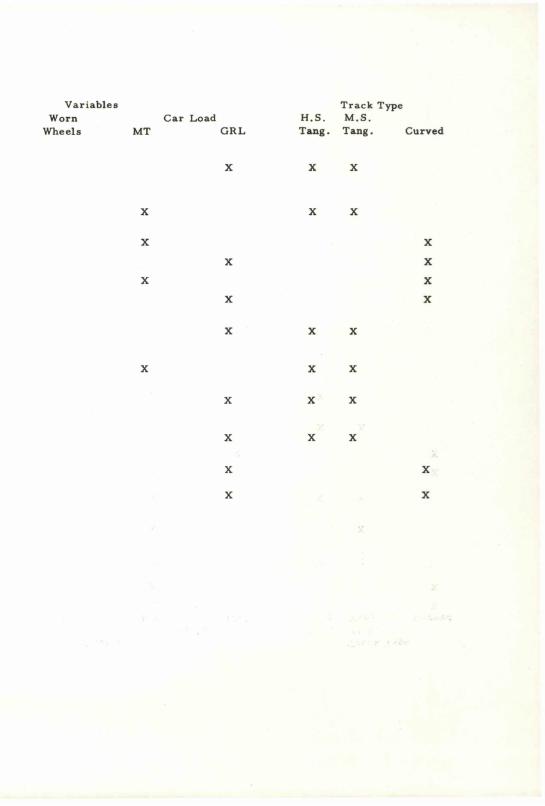
Variables Track TypeWorn Car Load H.S. M.S.Wheels MT GRL Tang. Tang. Curved
X X X
X X X
X XX X
X XX X
X
X X X
X X
X X
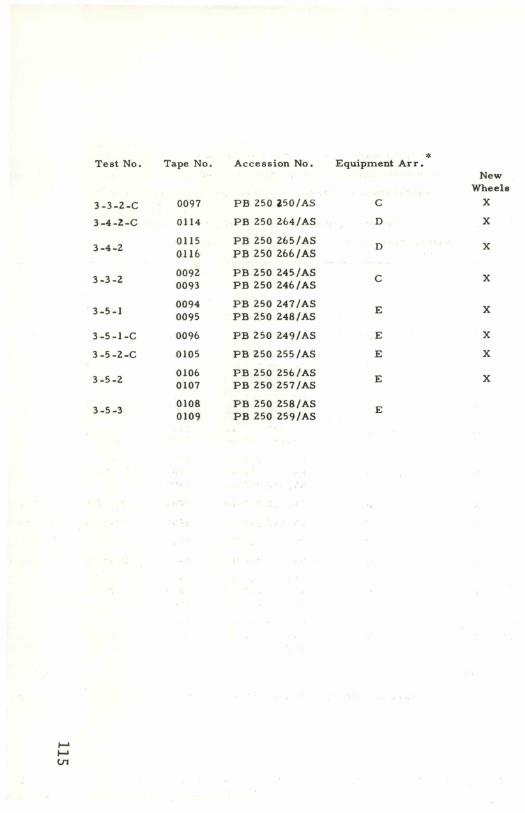
Test No. Tape No. Accession No. Equipment Arr.New
Wheels3-3-2-C 0097 PB 250 250/AS C X3-4-2-C 0114 PB 250 264/AS D X
3-4-2 01150116
PB 250 265/AS PB 250 266/AS D X
3-3-2 00920093
PB 250 245/AS PB 250 246/AS C X
3-5-1 00940095
PB 250 247/AS PB 250 248/AS E X
3-5-1-C 0096 PB 250 249/AS E X3-5-2-C 0105 PB 250 255/AS E X
3-5-2 01060107
PB 250 256/AS PB 250 257/AS E X
3-5-3 01080109
PB 250 258/AS PB 250 259/AS E
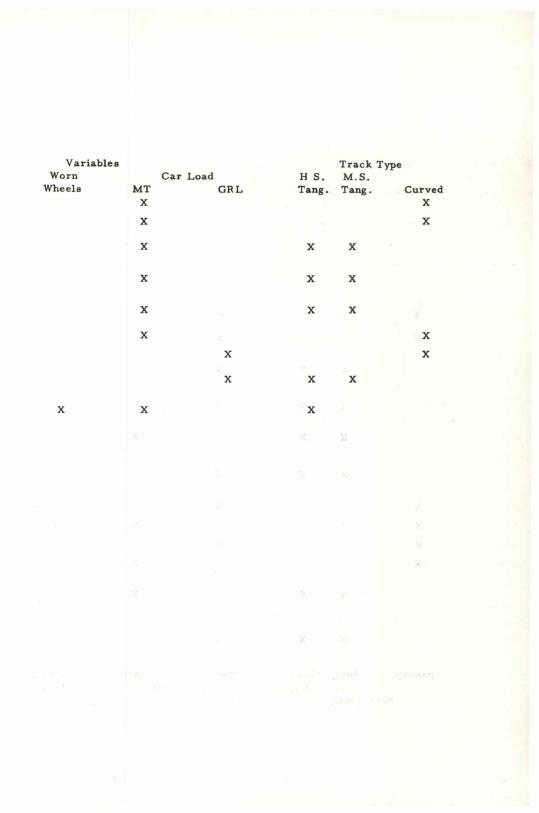
Variables Track TypeWorn Car Load H S. M.S.Wheels MT GRL Tang. Tang. Curved
X XX X
X X X
X X X
X X X
X XX X
X X X
X X X
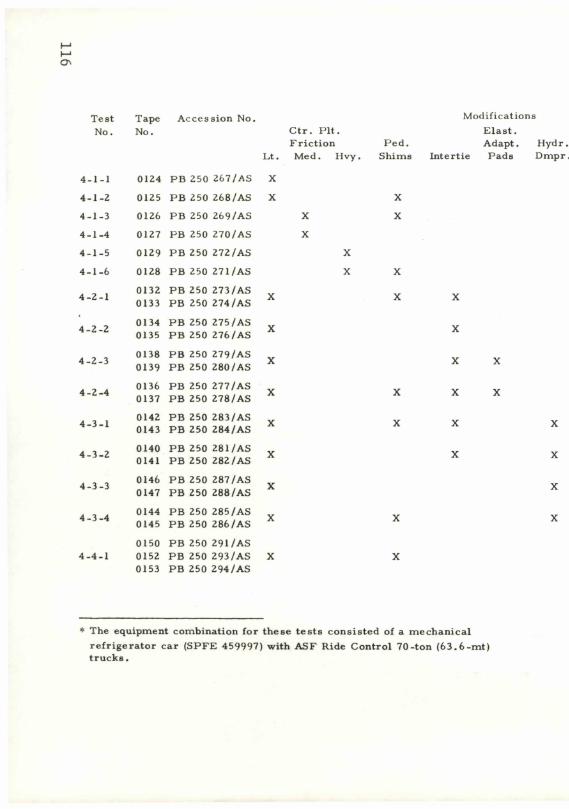
Test Tape Accession No. ModificationsNo. No. Ctr. Pit. Elast.
F riction Ped. Adapt. HydiLt. Med. Hvy. Shims Intertie Pads Dmp:
4-1-1 0124 PB 250 267/AS X4-1-2 0125 PB 250 268/AS X X4-1-3 0126 PB 250 269/AS X X4-1-4 0127 PB 250 270/AS X4-1-5 0129 PB 250 272/AS X4-1-6 0128 PB 250 271 /AS X X
4-2-1 01320133
PB 250 273/AS PB 250 274/AS X X X
0134 PB 250 275 /AS Y4 -Z -Z 0135 PB 250 276/AS A A
4-2-3 01380139
PB 250 279/AS PB 250 280/AS X X X
4-2-4 01360137
PB 250 277/AS PB 250 278/AS X X X X
i O 1 0142 PB 250 283/AS v v V Y4-0-1 0143 PB 250 284/AS A A A A
4-3-2 01400141
PB 250 281 / AS PB 250 282/AS X X X
4-3-3 01460147
PB 250 287/AS PB 250 288/AS X X
A ”1 A 0144 PB 250 285/AS v Y V"n - J 0145 PB 250 286/AS A A A
0150 PB 250 291 /AS4-4-1 0152 PB 250 293/AS X X
0153 PB 250 294/AS
* The equipment combination for these tests consisted of a mechanical refrigerator car (SPFE 459997) with ASF Ride Control 70-ton (63.6-mt) trucks.
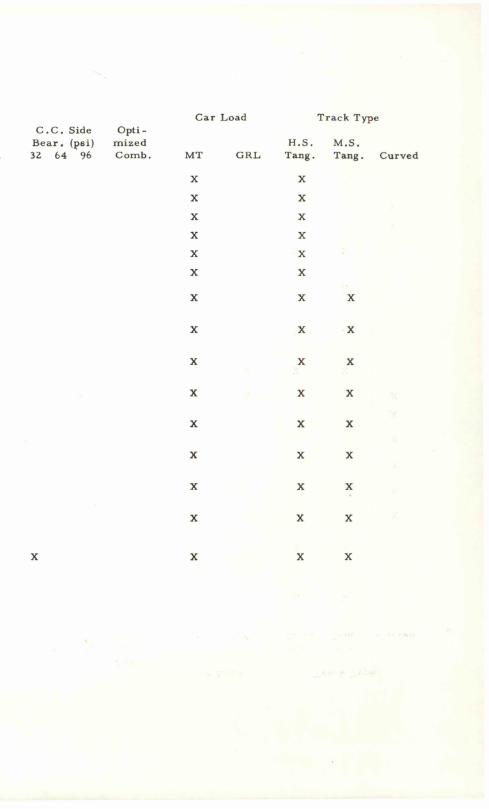
Car Load Track TypeC . C . Side Opti -Bear, (psi) mized H.S. M.S.32 64 96 Comb. MT GRL Tang. Tang
X XX XX XX XX XX X
X X X
X X X
X X X
X X X
X X X
X X X
X X X
X X X
X X X X
Curved
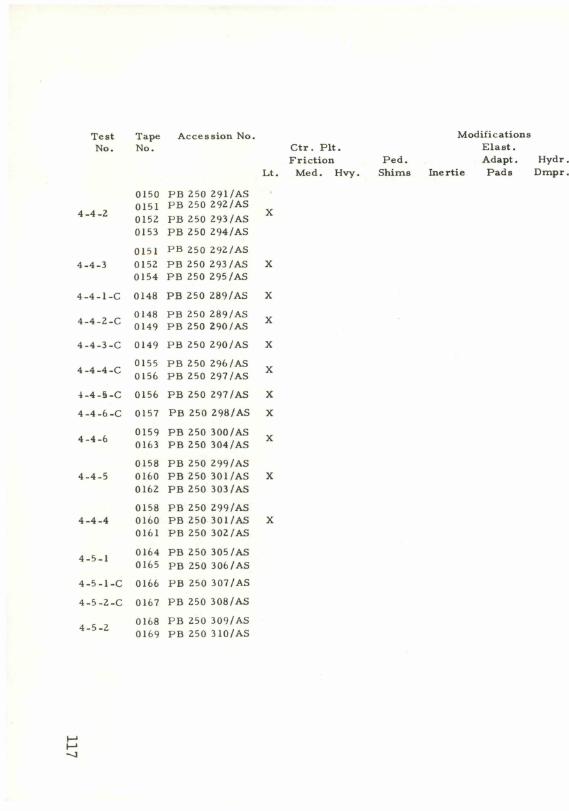
Test Tape Accession No. ModificationsNo. No. Ctr. Pit. Elast.
Friction Ped. Adapt.L.t. Med. Hvy. Shims Inertie Pads
0150 PB 250 291/AS0151 PB 250 292/AS4-4-2 0152 PB 250 293/AS X0153 PB 250 294/AS0151 PB 250 292/ AS
i i u> 0152 PB 250 293/AS X0154 PB 250 295/AS
4-4-1-C 0148 PB 250 289/AS X0148 PB 250 289/AS Y4-4-Z-C 0149 PB 250 290/ AS A
4-4-3-C 0149 PB 250 290/AS X0155 PB 250 296/ASi i i a 0156 PB 250 297/AS X
4-4-5-C 0156 PB 250 297/AS X4-4-6-C 0157 PB 250 298/AS X
0159 PB 250 300/AS X4 -4 -6 0163 PB 250 304/AS0158 PB 250 299/AS
4-4-5 0160 PB 250 301 /AS X0162 PB 250 303/ AS0158 PB 250 299/AS
4-4-4 0160 PB 250 301 /AS X0161 PB 250 302/AS
4-5-1 0164 PB 250 305/AS0165 PB 250 306/AS
4-5-1-C 0166 PB 250 307/AS4-5-2-C 0167 PB 250 308/AS
0168 PB 250 309/AS4-5 -2 0169 PB 250 3 10/AS
HydD m p
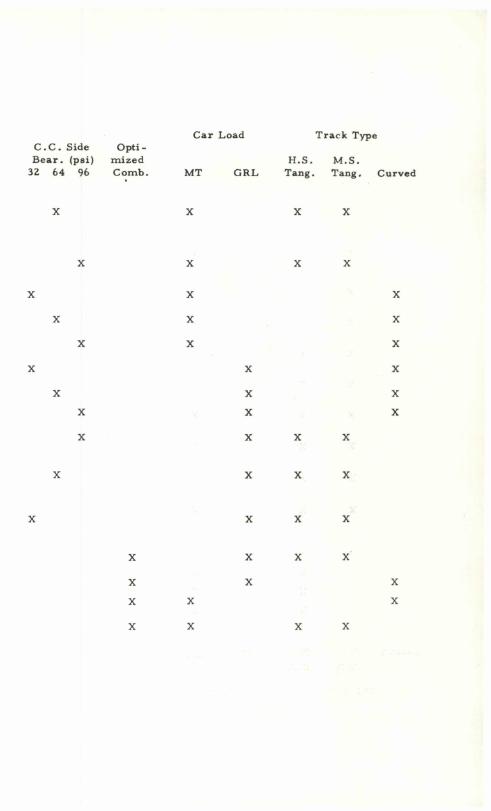
c.c. Side OptiCar Load Track Type
Bear.(psi) mized H.S. M.S.32 64
X
96 Comb. MT GRL
X
Tang. Tang. Curved
X X
X X
X X
X X
X X
X
XX
X
X
X X
X
X
X
X X
X XX X
X X X
X X X
X X X X
X X X X
X X XX X X
X X X X
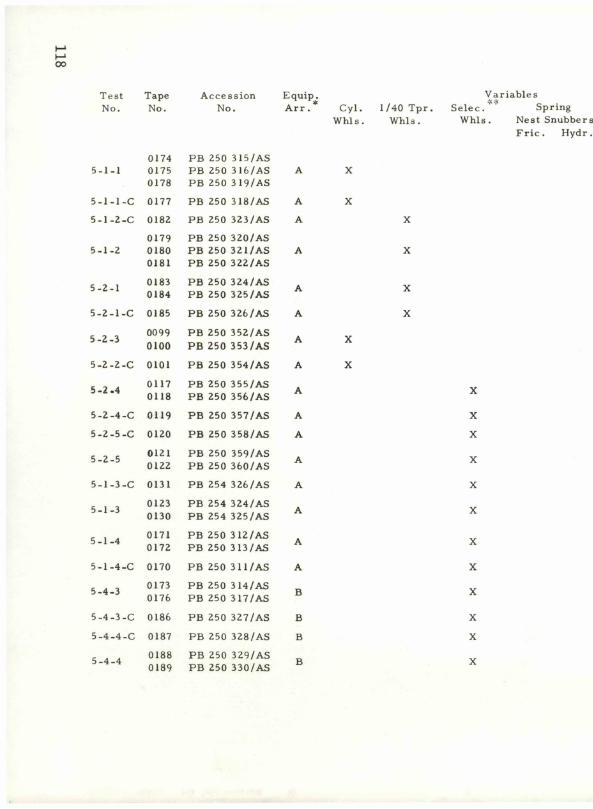
00
Test Tape Accession Equip.No. No. No. Arr.
0174 PB 250 315 / AS5-1-1 0175 PB 250 316/AS A
0178 PB 250 319/AS5-1-1-C 0177 PB 250 318/AS A5-1-2-C 0182 PB 250 323/AS A
0179 PB 250 320/AS5-1-2 0180 PB 250 321/AS A
0181 PB 250 3 22/AS
5-2-1 0183 PB 250 324/AS A0184 PB 250 3 25/AS A
5-2-1-C 0185 PB 250 326/AS Ac ? o 0099 PB 250 3 52/ASD -C -3 0100 PB 250 353/AS A
5-2-2-C 0101 PB 250 354/AS AC O A 0117 PB 250 355 / AS AJ -£ 0118 PB 250 3 56/AS A
5-2-4-C 0119 PB 250 3 57/AS A5-2-5-C 0120 PB 250 358/AS A
5 -2 -5 0121 PB 250 3 59/AS A0122 PB 250 360/AS A
Ui i i OJ 1 O 0131 PB 254 326/AS A
5-1-3 0123 PB 254 324/AS A0130 PB 254 325/AS A
5-1-4 0171 PB 250 312/AS A0172 PB 250 313 /AS A
5-1-4-C 0170 PB 250 311/ AS A
5-4-3 01730176
PBPB
250250
314/AS317/AS B
5-4-3-C 0186 PB 250 327/AS B5-4-4-C 0187 PB 250 328/AS BC A A 0188 PB 250 329/AS BD -*± 0189 PB 250 330/AS
VariablesCyl. 1/40 Tpr. Selec. SpringWhls. Whls. Whls. Nest Snubbers
Fric. Hydr.
X
XX
X
X
X
X
XX
X
X
X
X
X
X
X X
X
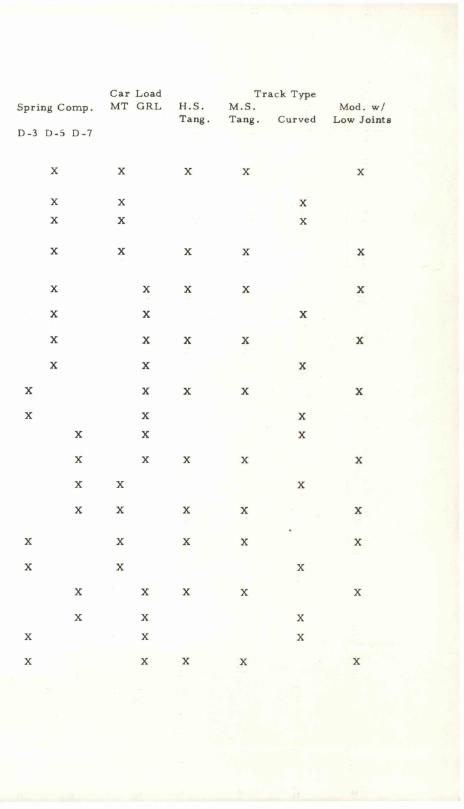
Spring Comp.
D-3 D-5 D-7
CarMT
LoadGRL H.S.
Tang.
Track Type M.S.Tang. Curved
Mod. w/ Low Joint8
X X X X X
X X XX X X
X X X X X
X X X X X
X X X
X X X X X
X X X
X X X X X
X X XX X X
X X X X X
X X X
X X X X X
X X X X X
X X X
X X X X X
X X XX X X
X X X X X
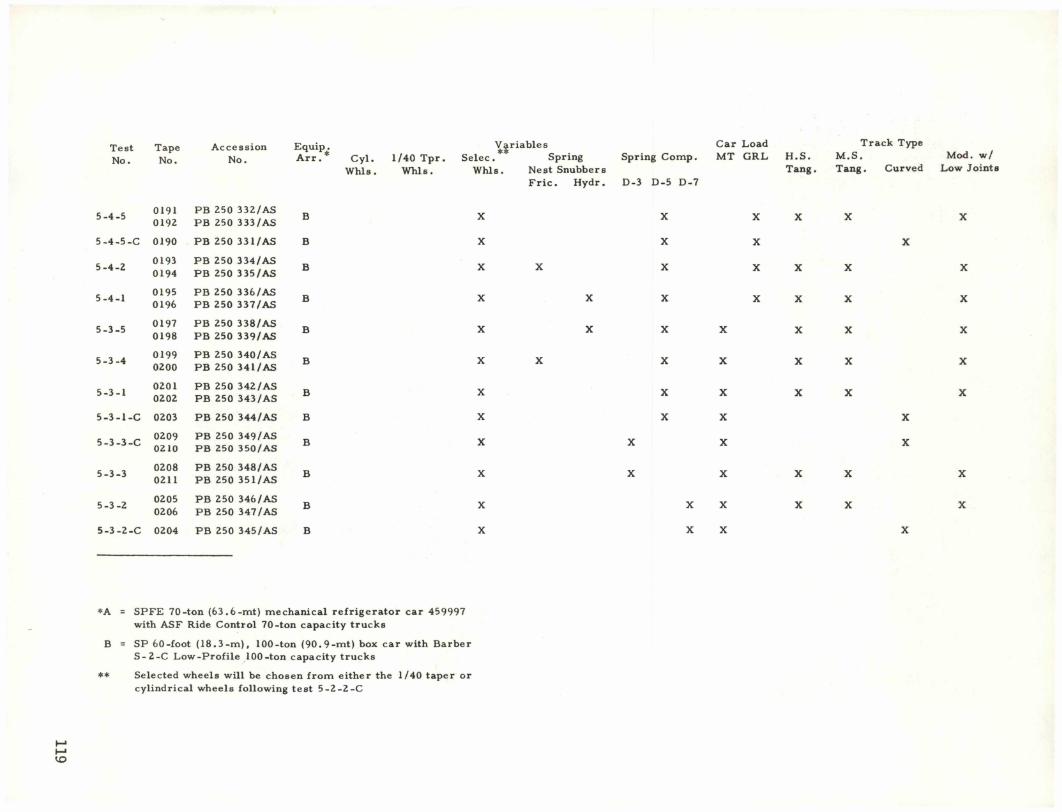
TestNo.
TapeNo.
AccessionNo.
Equip.Arr. Cyl.
Whls.1/40 Tpr. Whls.
V|Selec. Whls.
riablesSpring
Nest Snubbers Fric. Hydr.
Spring Comp.
D-3 D-5 D-7
Car Load MT GRL H.S.
Tang.
Track Type M.S.Tang. Curved
Mod. w/ Low Joints
5-4-5 01910 1 9 2
PB 250 332/AS PB 250 333/AS B X X X X X X
5-4-5-C 0190 PB 250 331/AS B X X X X
5-4-2 01930194
PB 250 334/AS PB 250 335/AS B X X X X X X X
5-4-1 01950 1 9 6
PB 250 336/AS PB 250 337/AS B X X X X X X X
5-3-5 01970 1 9 8
PB 250 338/AS PB 250 339/AS B X X X X X X X
5-3-4 01990 2 0 0
PB 250 340/AS PB 250 341/AS B X X X X X X X
5-3-1 0 2 0 10 2 0 2
PB 250 342/AS PB 250 343/AS B X X X X X X
5-3-1-C 0203 PB 250 344/AS B X X X X
5-3-3-C 02090 2 1 0
PB 250 349/AS PB 250 350/AS B X X X X
5-3-3 020802 1 1
PB 250 348/AS PB 250 351 /AS B X X X X X X
5-3-2 02050206
PB 250 346/AS PB 250 347/AS B X X X X X X
5-3-2-C 0204 PB 250 345/AS B X X X X
*A = SPFE 70-ton (63.6-mt) mechanical refrigerator car 459997 with ASF Ride Control 70-ton capacity trucks
B = SP 60-foot (18.3-m), 100-ton (90.9-mt) box car with Barber S-2-C Low-Profile 100-ton capacity trucks
** Selected wheels will be chosen from either the 1/40 taper or cylindrical wheels following test 5-2-2-C
Techn ica l Report Documentation Page
1. Report No. 2. Government Accession No.
FRA-OR5D- 7 5-74.1 PB 2441503. Recipient's Catalog No.
4. Title ond SubtitleRAILROADS AND THE ENVIRONMENT - ESTIMATION OF FUEL CONSUMPTION IN RAIL TRANSPORTATION Volume I - Analytical Model
5. Report DateReprint October 1975
6. Performing Organization Code
8. Performing Organization Report No.
DOT-TSC-FRA-75-16.I7. Author's'John B. Hopkins9. Performing Organization Name and AddressU.S. Department of Transportation Transportation Systems Center Kendall Square Cambridge MA 02142
10. Work Unil No. (TRAIS)RR516/R630211. Controct or Grant No.
13. Type of Report and Period CoveredFinal Report November - October 1973 1974
17. Sponsoring Agency Nome ond Address .U.S. Department or Transportation Federal Railroad Administration Office of Research and Development Washington DC 20590
14. Sponsoring Agency Code
15. Supplementory Notes
16. Abstroct
This report describes an analytical approach to estimation of fuel consumption in rail transportation, and provides sample computer calculations suggesting the sensitivity of fuel usage to various parameters. The model used is based upon careful deliniation of the relevant physical mechanisms of energy dissipation under steady-state conditions rolling and aerodynamic resistance (using the Davis equations), brak ing, idling, and locomotive power generation and conversion losses.Both simple and more complex formulations are applied as appropriate. Several classes of service are considered: branch line freight, intercity freight, conventional and high-speed passenger, and commuter. Numerous graphs illustrate typical results for specific fuel consumption as a function of speed, grade, power/weight, load factor, weight per seat, etc.
17. Key Werds 18. Distribution Stotement
Fuel Consumption Rail Transportation Energy Usage
DOCUMENT IS AVAILABLE TO THE PUBLIC THROUGH THE NATIONAL TECHNICAL INFORMATION SERVICE, SPRINGFIELD, VIRGINIA 22161
19. Security Clossif. (of this report)
Unci ass i fied20. Security Clossif. (of this page)
Unclassified21. No. of Poges
9022. Price
PC$ 5,00 MF $3.00
Form DOT F 1700.7 (8-72) Reproduction of completed page authorized
T e c h n i c a l R e p o r t D o c u m e n t a t i o n P a g e
1. Report No. 2. Government Accession No.
FRA-0R&D-75-74,II
3. Recipient’s Catalog No.
4. Title and SubtitleRAILROADS AND THE ENVIRONMENT: ESTIMATION OF FUEL CONSUMPTION IN RAIL TRANSPORTATION,
. Vol. II-Freight Service Measurements
5. Report DateSeptember 1977
6. Performing Organization Code
8. Performing Organization Report No.DOT-TSC-FRA-77-117. Authors)
John B. Hopkins and A. T. Newfell9. Performing Organization Name and Address
U.S. Department of Transportation Transportation Systems Center Kendall Square Cambridge, MA 02142
10. Work Unit No. (TRAIS)RR716/R7311
11. Contract or Grant No.
13. Type of Report and Period CoveredFinal Report October 1974 - May 1977
12. Sponsoring Agency Name and AddressU.S. Department of Transportation Federal Railroad Administration Office of Research and Development Washington, D.C. 20590
14. Sponsoring Agency Code
15. Supplementary Notes
16. Abstract
Fuel consumption measurements have been carried out in cooperation with several railroads for a variety of types of revenue freight service, Intermodal operations have been emphasized, but this report also includes studies relating to branchline and general freight movements, The wide range of operating parameters examined include train speed, weight, length, type, power-to-weight ratio, and terrain. In particular, this report describes the test conditions, operating parameters and fuel usage indices for 80 separate line-haul movements on six different railroads, covering 53,000 train miles, Trailer-On-Flatcar (TOFC) service predominates, but several manifest freights, two unit coal trains, and two COFC trains are included. Branchline service is also reported and analysed for six 174-mile round trips. In spite of considerable variation in relevant parameters and inherent imprecision in the data, the results are found to exhibit a basic consistency both internally and with past estimates.
17. Key Words 18. Distribution Statement
Fuel Consumption Rail Transportation Energy Usage
Document is available to the U.S. Public through the National Technical Information Service, Springfield, VA 22161
19. Security Classif. (of this report)Unclassified
20. Security Classif. (of this page)Unclassified
21. No. of Pages46
22. Price
F o rm D O T F 1 7 0 0 .7 (8-72) Reproduction of completed page authorized
TECHNICAL REPORT STANDARD TITLE PAGE
1. Report No.d o t -t s c -o s t -76-1+FRA-OR&D-7 6-1 U2
2. Government Accession No.
P B 2 6 0 4 1 0 / 6 W T
3. Recipient's Catalog No.
4. Title and Subtitle
AN ASSESSMENT OF RAILROAD LOCOMOTIVE NOISE
5. Report DateAugust 1976
6. Performing Organization CodeDOT-TSC-OST-7 o -hnOT-Tsr-VRfl-7 -9..
7. Authors)
Paul J. Remington and Michael J. Rudd
8. Performing Organization Report No.
9. Performing Organization Name and Address
Bolt Beranek and Newman Inc.* 50 Moulton Street Cambridge MA 02138
10. Work Unit No.OS607,RR616/R6513
11. Contract or Grant No.DOT-TSC-1016
12. Sponsoring Agency Name and Address U.S. Department of Transportation Office of the Secretary Federal Railroad AdministrationOffice of the Asst. Sec. for Systems Research and Development Development and Tech.
Office of Noise AbatementWashington DC 20590
13. Type of Report and Period Covered
Final Report June-August 1975
14. Sponsoring Agency Code
15. Supplementary Notes
*Under contract to:
U.S. Department of Transportation Transportation Systems Center Kendall SquareCambridge MA 02142_________________
16. Abstroct
Measurements of the noise generated by an SD40-2 diesel electric locomotive are described. The noise was measured in three types of moving tests: the firstwith the locomotive passing a 6-microphone array while under maximum power acceleration, the second with the locomotive simulating the pulling of a train, and the third with the locomotive coasting by unpowered. Stationary noise measurements were made at 16-microphone positions around the locomotive while it was attached to a load cell. The moving tests show that at the lower throttle settings, wheel/rail noise may be an important contributor to the overall locomotive noise signature even at modest speeds (20 mph and above at throttle 1 and 30 mph and above at throttle 4). At throttle 8, wheel/rail noise does not become a significant source until speeds in excess of 50 mph are reached. At throttle 8 and at speeds below 50 mph, noise spectra measured opposite the moving locomotive are comparable to noise spectra measured opposite the stationary locomotive. Diagnostic tests to determine how much the various sources contributed to the overall noise were performed at seven positions on one side of the locomotive. The engine exhaust and intake, the engine/generator, the radiator cooling fans, the dynamic brake fans, the traction motor blowers, the dust bin blower compressor, and structure- borne noise have all been identified. At high throttle settings the exhaust and radiator cooling fans dominate. At low throttle settings ‘•.he engine/generator* the exhaust and the cooling fans all contribute to the overall noise.
17. Key Words
Noise, Railroad Noise, Locomotive Noise, Exhaust Noise, Fan Noise, In-Cab Noise, Wayside Noise, Ground Transportation Noise.
18. Distribution Statement
DOCUMENT IS AVAILABLE TO THE PUBLIC THROUGH THE NATIONAL TECHNICAL INFORMATION SERVICE. SPRINGFIELD. VIRGINIA 22161
19. Security Classif. (of this report) 20. Security Classif. (of this page) 21- No. of Pages 22. PriceUNCLASSIFIED UNCLASSIFIED
16 8
Form DOT F 1700.7 (8-69)
3. Recipient’s Cotalog No.
Techn ica l Report Documentation Page
1. Report No.
FRA/ORD-76/295. I2. Government Accession No.
P B 2 6 4 3 0 4 / A S
4. Title and Subtitle
AERODYNAMIC FORCES ON FREIGHT TRAINS Volume I--Wind Tunnel Tests of Containers and Trailers on Flatcars
5. Report Dote
December 19766. Performing Orgonixotion Code
8. Performing Organization Report No.DOT-TSC-FRA-76-30,17. Autfor's)
Andrew G. Hammitt9. Performing Orgonixotion Name and Address
Andrew G. Hammitt Assoc.*30813 Marne DriveRancho Palos Verdes CA 90274
10. Work Unit No. (TRAIS)RR616/R730911. Controct or Grant No.DOT-TSC-1002-113. Type of Report and Period Covered
Final Report March 1975-June 1976
12. Sponsoring Agency Nome ond Address
U.S. Department of Transportation Federal Railroad Administration Office of Research and Development Washington DC 20590
14. Sponsoring Agency Code
is. Supplement* Not.j U.S. Department of Transportation*Under contract to: Transportation Systems CenterKendall Square_____________________ Cambridge MA 02142__________16. Abstroct The aerodynamic forces on trailers and containers on flatcars have been measured in wind tunnel tests. The forces were measured on the central car of a five-car train consisting of a locomotive, three flatcars with various loadings and a boxcar. Tests were made over a range of yaw angles and with different loadings. Standard trailers, containers and flatcars were tested as well as a variety of modifications designed to improve the aerodynamic performance. In addition to the railroad-car tests, a series of blocks simulating containers and trailer bodies were1 tested to determine the effect of gap spacing, corner radius, and surface roughness. The flatcars loaded with containers were found to have about forty percent less drag than when loaded with trailers. Various modifications that reduced the frontal area of the trailers or filled in the empty space between the trailer body and the car were all found to be effective in reducing the drag. Gap spacing size had little effect until it became of the order of the body width, and then the drag increased with increased spacing.Side and lift forces are chiefly caused by yaw angle and s.ide area. fThe forces act near the centroid of the side area, but when the gap !spacing becomes large they move farther forward. The research reported is intendeu to increase the knowledge base in understanding the aerodynamic drag component of trail resistance.17. Key Words 18. Distribution Statement
Freight Car Aerodynamics TOFC and COFC Aerodynamics Train Resistance
DOCUMENT IS AVAILABLE TO THE U.S. 1 THROUGH THE NATIONAL TECHNICAL INFORMATION SERVICE. SPRINGFIELD. VIRGINIA 22161
PUBLIC
19. Security Classif. (of this report)
UNCLASSIFIED20. Security Classif. (of this page)
UNCLASSIFIED21* No. of Pages
15022. Pric.
PC$ 6.00 MF$3.00
Form DOT F 1700.7 (8~72) Reproduction of completed page authorized
123
OVERVIEW OF FREIGHT SYSTEMS R&D REPORT NO FRA/ORD-77/58
OCTOBER 1977
ERRATA
"Rail Dynamics Laboratory Requirements and Hardware Configurations"
Page 90 first sentence under Fig. 6, Vibration Test Unit should read as follows:
"The vertical excitation modules (each under independent servo control) are designed around a 60*000 lb (27*216 kg) hydraulic actuator, equipped with a 200 gpm (.0126 m3's) high performance servo-valve."
Page 90 first sentence of second major paragraph from bottom starting "The hydraulic flow demands ..." should be changed to read as follows
"The hydraulic flow demands of the various excitation modules and hydrostatic bearing elements at peak excitation levels can be as high as 1000 gpm (.0631 m3/s) @ 3,000 psi (20,684.271 N/m2). This has been provided for via three 360 gpm (.0227 m3/s) variable volume pumping systems each capable of delivering the rated flow at 3,000 psi (20,684,271 N/m2)."
Overview of Freight Systems Research and Development, US DOT, FRA, Office of Freight Systems, Office of Research and Development, 1977 -25-Goverment Policy, Planning & Regulations