Prediction of Rail Buckling - Federal Railroad Administration
81
1 I U.S. Department of Transportation Federal Railroad Administration Prediction of Rail Buckling i Office of Research and Development Washington, DC 20590 _________ P/6S3 - j 2 ^ __ ' Recommendations for Development of Test Methods Committee on Nondestructive Testing of Longitudinal Forces in Rails &■ National Materials Advisory Board National Academy of Sciences 2101 Constitution Avenue Washington, D.C. 20418 4 DOT/FRA/ORD-82/21 March 1982 Final Report This document is available to the U.S. public through the National Technical Information Service, Springfield, Virginia 22161. °1-Track & Structures
-
Upload
khangminh22 -
Category
Documents
-
view
3 -
download
0
Transcript of Prediction of Rail Buckling - Federal Railroad Administration

1 I
U.S. Department of Transportation
Federal Railroad Administration
Pred iction of Rail B u ck lin g
i
Office of Research and Development Washington, DC 20590
_________ P / 6 S 3 - j2̂__'R e c o m m e n d a t i o n s for D e v e l o p m e n t of Test M e t h o d s
Committee on Nondestructive Testing of Longitudinal Forces in Rails
&■ National Materials Advisory BoardNational Academy of Sciences 2101 Constitution Avenue Washington, D.C. 20418
4
DOT/FRA/ORD-82/21 March 1982Final Report
This document is available to the U.S. public through the National Technical Information Service, Springfield, Virginia 22161.
°1-Track & Structures

NOTICEThis document is disseminated under the sponsorship of the Department of Transportation in the interest of information exchange. The United States Government assumes no liability for its contents or use thereof.
NOTICEThe United States Government does not endorse products or manufacturers. Trade or manufacturers' names appear herein solely because they are considered essential to the object of this report.

)
1. Report No.DOT/FRA/0RD-82/21
2 Govr’̂men* Accession No. 3. Recipient s Cotolog No.
d. Title ond SubtitlePrediction of Rail Buckling —Recommendations for Development of Test Methods
5. Report Dot®March 1982
6. Performing Orgom lotion Code8. Performing Organization Report No.
NMAB-3887. Aufhir'gi 0ommittee on Nondestructive Testing of Longitudinal Force in Rails9. Performing Orgonizotion Nome and AddressNational Materials Advisory Board National Academy of Sciences
. 2101 Constitution Ave., N.W. Washington, D.C. 20418
10. ' Work Unit No. 'TRAIS)11. Contract or Grant No.DTFR53-80-C-00043 .
13. Type of Report and Period Covered, Final Report
12. Sponsoring Agency Nome ond Address ••• .Department of Transportation/Federal Railroad Administration
14. Sponsoring Agency Code15. S u p p lem e n ta ry N o te s
16. A b s tra c t
Railroad track structure can buckle if excessive compressive force is developed due to a temperature increase. The resulting misalignment can be a significant cause of train accidents. There is no practical method for measuring the longitudinal force without disturbing the track.
Physical phenomena were reviewed in an effort to establish a basis for measuring longitudinal force. Various nondestructive testing techniques were considered, and it was concluded that no one of them applied singly is capable of providing an unambiguous practical measurement. Short-, medium-, and longterm recommendations are made, and the continued development of two methods (rail vibration and a magnetic technique) is endorsed. Fundamental studies also are recommended to provide the basis for a model that will identify the influence of texture, cold work, and other metallurgical properties on the measured results. Three specific areas are identified as showing promise but in need of sustained research.
17. K e y Words
BucklingContinuously welded rail ForceNondestructiveRail
RailroadTrack
18. D is tr ib u t io n S to fem enf
This document is available through the National Technical Information Service, Springfield, Virginia, 22161.
19. S e c u rity C lo s s if . (o f th is repo rt)
Unclassified20. S e c u rity C lo s s if . (o f th is page)
Unclassified21* N o . o f P ages
8722. P r ie .
Form DOT F 1700.7 (8-72)i

NOTICE: The project that is the subject of this report was approved by theGoverning Board of the National Research Council, whose members are drawn from the Councils of the National Academy of Sciences, the National Academy of Engineering, and the Institute of Medicine. The members of the committee responsible for the report were chosen for their special competences and with regard for appropriate balance.The report has been reviewed by a group other than the authors according to procedures approved by a Report Review Committee consisting of members of the National Academy of Sciences, the National Academy of Engineering, and the Institute of Medicine.The National Research Council was established by the National Academy of Sciences in 1916 to associate the broad community of science and technology with the Academy's purposes of furthering knowledge and of advising the Federal Government. The Council operates in accordance with general policies determined by the Academy under the authority of its congressional charter of 1863, which established the Academy as a private, nonprofit, self-governing membership corporation. The Council has become the principal operating agency of both the National Academy of Sciences and the National Academy of Engineering in the conduct of their services to the Government, the public, and the scientific and engineering communities. It is administered jointly by both Academies and the Institute of Medicine. The National Academy of Engineering and the Institute of Medicine were established in 1964 and 1970, respectively, under the charter of the National Academy of Sciences.The Commission on Sociotechnical Systems is one of the major components of the National Research Council and has general responsibility for and cognizance over those program areas concerned with physical, technological, and industrial systems that are br may be deployed in the public or private sector to serve societal needs.The National Materials Advisory Board is a unit of the Commission on Sociotechnical Systems of the National Research Council. Organized in 1951 as the Metallurgical Advisory Board, through a iseries of changes and expansion of scope, it became the National Materials Advisory Board in 1969. Its general purpose is the advancement of materials science and engineering in the national interest. It fulfills that purpose by providing advice and assistance to government agencies and private organizations on matters of materials science and technology affecting the national interest, by focusing attention on the materials aspects of national problems and opportunities, and by making appropriate recommendations for the solution of such problems and the exploitation of the opportunities.This study by the National Materials Advisory Board was conducted under Contract No. DTFR53-80-C-00043 with the Federal Railroad Administration.This report is for sale by the National Technical Information Service, Springfield, Virginia 22151.Printed in the United States of America.
ii

NATIONAL MATERIALS ADVISORY BOARDCOMMITTEE ON NONDESTRUCTIVE TESTING OF LONGITUDINAL FORCE IN RAILS.
Chairman
DONALD O. THOMPSON, Principal Scientist, Ames Laboratory and Adjunct Professor, Department of Engineering Science and Mechanics, Iowa State University of Science and Technology, Ames
Members
ARNOLD D. KERR, Professor, Department of Civil Engineering, University of Delaware, Newark
HARRIS L. MARCUS, Professor, Mechanical Engineering/Materials Science, University of Texas, Austin
PAUL R. PASLAY, Consultant, Houston, Texas
GERALD POSAKONY, Manager-Nondestructive Testing Section, Physics and Instrumentation Departments, Battelle Northwest Laboratories, Richland, Washington
BRUCE THOMPSON, Senior Scientist, Ames Laboratory and Adjunct Professor, Iowa State University of Science and Technology, Ames
ALLAN M. ZAREMBSKI, Director, Research and Development, Pandrol, Inc., Bridgeport, New Jersey and Director, Research and Development, Speno Rail Services, East Syracuse, New York (formerly Manager, Track Research Division, Association of American Railroads, Chicago, Illinois)
Liaison Representatives
CHARLES CRAIG, Assistant for Nondestructive Inspection, Materials Engineering Office, NAVSEA, U.S. Department of the Navy, Washington, D.C.
MICHAEL LAURIENTE, Program Manager, U.S. Department of Transportation, Washington, D.C.
LEONARD MORDFIN, Deputy Chief, Office of Nondestructive Evaluation, National Bureau of Standards, U.S. Department of Commerce, Washington, D.C.
WILLIAM O'SULLIVAN, Senior Technical Advisor, Improved Track Structures ’ Research Divisipn, Federal Railroad Administration, U.S. Department of Transportation, Washington, D.C.
EDWARD J. WARD, Rail Transport Specialist, Transportation Research Board, National Academy of Sciences, Washington, D.C.
NMAB
Joseph R. Lane, Staff Metallurgist
iii

v M E T R IC C O N V E R S IO N F A C T O R S
A p p r o x im a te C o n v e rs io n s t o M e tr ic M easures9
S y m b o l When Y o u K n o w M u lt ip ly b y T o F in d S y m b o l 8L E N G T H
in inches •2.6 centimeters cmft feet 30 centimeter* cmyd yards 0.9 meters mm i miles 1.6 kilometers km
A R E A
in* square' inches 6.5 square centimeters . cm*ft* square feet 0.09 square meters m*vd* square yards square meters m*mi* square mile* 2.6 square kilometers km*
acres 0.4 hectare* ha
M A S S (w e ig h t )
oz ounces 28 grams glb pounds
short tons (20001b)
teaspci>ns
0.460.9
V O L U M E
kilogramstonnes
kgt
tsp 5 milliliters mlTbsp tablespoons 16 milliliters mlfl oz fluid ounces 30 milliliters mlc cups 0.24 liters Ipt pints 0.47 liters iqt quarts 0.96 liters igal gallons 3.8 liters ift* cubic feet 0.03 cubic meters m 3yd* cubic yards 0.76 cubic meters m 3
T E M P E R A T U R E (e x a c t)
°F - Fahrenheit 6/9 (after Celsius o ctemperature subtracting
32)temperature
■a ■ ■ ■ ■ 1 ' ■ . i .. . . ■ - i, . . . i1 In. - 2.64 cm (exactly). For other exact conversion* and m ore detail table* tee
N B S M iic. Publ. 2B6 Unit* o< Weight and Meeture*. Price $2.26 S D Catalog No. C13 10 286.
6
6
4
3
2
1
inches —
23
A p p r o x im a t e C o n v e rs io n s f ro m M e tr ic M easures22S y m b o l W h e n Y o u K n o w M u lt ip ly b y T o F in d S y m b o l
— --------------21
=-------------20
L E N G T H
=------------- 19 m m millimeters 0.04 inches in
cm centimeters 0.4 inches in=
-------------18 m meters 3.3 feet ftm meters 1.1 yards yd
-------------17km kilometers 0 .6 miles m i
-------------16 A R E A
16 cm* square centimeters 0.1 6 square inches. in*SS- m* square meters 1.2 square yards yd*E? km* square kilometers 0.4 square miles m i*'
------------- 14 ha hectares (10 .000 m * ) 2.5 acres
= — ------ 13
I 'M A S S (w e ig h t )
== a grams 0.036 ounces ozS I ------------- 11 kg kilograms 2.2 pounds lb— t tonnes (1000 kg) 1.1 short tons= -------------1 0
S---------------9 V O L U M E
= 0 ml milliliters 0.03 fluid ounces fl oz= i liters 2.1 pints pt
i liters 1.06 quarts qt= ---------------7 i liters 0 .26 gallons gal— m 3 cubic meters 36 cubic feet ft*= - ---------------6 m 3 cubic m eter: 1.3 cubic yards yd*
5° C
3
T E M P E R A T U R E (e x a c t)
Celsius 9/5 (then Fahrenheittemperature. add 32) temperature
°F
21
cm
OF- 4 0
320 40I ,J . .1 _1_
t— r-20
98.68 0 120 I .1 I. I I. I I. I
T20 T T 40
37
®F212160 2CK) |I .1 1. I X.iJ
- 4 0° C
60r
80 100ocinches 0

CONTENTS
Chapter 1 - INTRODUCTION 1Chapter 2 - CONCLUSIONS AND RECOMMENDATIONS • 3
Conclusions 3Recommendations 4
Short-Term Actions 4Intermediate-Term Actions 5Long-Term Actions 5
Chapter 3 - BACKGROUND 7Statement of the Problem 7Summary of Thermal Buckling Tests 13Analysis of Thermal Track Buckling 19References 30
Chapter 4 - ANALYTIC FORMULATION OF THE NDE PROBLEM 32References 40
Chapter 5 - REVIEW OF NONDESTRUCTIVE MEASUREMENT TECHNIQUES 41Direct Measurements 41
Temperature 41infrared Radiometer 41Heat Balance Method 42Contact Devices 42
Strain <. 43Strain Gauge Techniques 43Penetrating Radiation 44
Indirect Measurements 47Vibrating Wire 47Rail Vibration 47Ultrasonic Techniques 48
Acousto-Elastic 48Magnetic Techniques 52
Coercivity 56Barkhausen Technique 58Magnetomechanical-Acoustic Emission 61Magnetostrictive Sensing 61Summary of Techniques 6,3
Other Techniques Being Explored, 63Laser Speckle Methods 63Acousto-Elastic Mapping 65Temperature Dependence of Ultrasonic Velocity 65Couplant-Free Electromagnetic-Acoustic Transducers 65
References 66Appendix
Page
v

LIST OF TABLES AND FIGURES
Table 1 Test Results for P50 Track Sections 19Table 2 Dependence of vmax and Nt on At 28Table 3 Summary of Rail Force Measurement Techniques 64Figure 1 Buckled Track 8Figure 2 Rail Temperature Increase Versus Axial Rail Forces 9Figure 3 Thermal Stress in 1-Mile Length Rail 10Figure 4 Thermal Strains in 1-Mile Length Rail 11Figure 5 Buckling Modes Observed in Tests 14Figure 6 The Track Buckling Facility at Karlsruhe 15Figure 7 Rail-Tie Fasteners 16Figure 8 Temperature Increase Versus Lateral Displacement. 18Figure 9 Distribution of Axial Compression Forces 20Figure 10 Resistance Between Rail-Tie Structure and Ballast 22Figure 11 Typical Equilibrium Branches for Heated Straight Track 23Figure 12 Typical Equilibrium Branches for Track With Lateral 25
Geometric ImperfectionsFigure 13 Buckled Track Shapes 26Figure 14 Equilibrium Branches and Corresponding Axial Force 27
CurvesFigure 15 Dependence of Safe Temperature Increase on Track 29
ParametersFigure 16 Coordinate System 35Figure 17 Axial Force Distribution 37
Page
vi

c •
Figure 18 Free Body Diagram 37Figure 19 Conditions for Bragg Diffraction from Parallel Atomic 45
PlanesFigure 20 Typical Acoustic Response from Impact Excitation 49Figure 21 Physical Origin of Ultrasonic Velocity Changes 51Figure 22 Three-Dimensional Plot of Magnetic Anisotropy Energy of 53
IronFigure 23 Domain Configuration of a Ferromagnetic Crystal 54Figure 24 Stages in the Magnetization of Iron Polycrystal 55Figure 25 Planar Cuts of Energy Surface 57Figure 26 Laboratory Tests on the Effect of Residual Stress 59Figure 27 IAhc Versus Stress Force 60Figure 28 Ratio of Amplitude Response 62
Page
vii/viii

Chapter 1INTRODUCTION
Railroad rails can buckle when a temperature increase causes an excessive compressive force to be developed. This problem has grown with the greater use of continuous welded rail. Although many buckles are repaired before accidents occur, numerous accidents have resulted from the track misalignment.
A procedure requiring rail laying at or above a defined temperature generally prevents the problem; however, the rails can shift over time because of traffic or temperature cycling, which makes their susceptibility to buckling uncertain. No instrument to measure the longitudinal force in rail has been available. In an attempt to provide guidance in the development of such an instrument, a workshop was cosponsored by the Federal Railroad Administration (FRA) and the Association of American Railroads (AAR) in February 1979. Of the stress measurement methods discussed, no one procedure appeared to be capable of being developed into a practical instrument.
The FRA contracted with the National Academy of Sciences in February 1980 to convene a committee to examine the problem. An ultimate objective would be a description of a system that could scan track from a moving platform to identify locations in which rail force was dangerously high. It was recognized, however, that this might be well beyond the state of the art. To define the really important attributes, an AAR group was asked to itemize the needed requirements. Its list, which is also incorporated into Table 3, comprises:
1. Rugged i2. Easy to use3. Nondestructive4. No disturbance to track*5. No calibration needed6. Independent of size, wear, etc.; independent of material
microstructure*7. No surface preparation required*8. Measures absolute force*9. No permanent attachment needed*
: 10. Provides continuous measurement11. Compatible with temperature measurement
Keeping in mind this list of "requirements" the committee then assessed the applicability of all theoretically possible methods for
♦Primary requirements.
1

measuring force in rails with the objective of recommending suitable and promising methods for further development.
To cope with the task, the committee expertise deemed necessary comprised the following: practical experience with rail laying and trackdynamics, theoretical and applied mechanics, and the physical basis and practical application of non-destructive test (NDT) methods.
2

CONCLUSIONS AND RECOMMENDATIONS
Chapter 2
CONCLUSIONS
1. Essentially correct analyses of the rail buckling problem are available (see Chapter 3). These analyses indicate that the total net longitudinal force in the rail, not the localized stress or strain, is the parameter which must be measured nondestructively. As shown in Chapter 4, this requires a direct measurement of stress, or an inference of stress from measurements of length (strain) and temperature changes.In either case, an average value over the rail cross-section is required.
2. No one of the various nondestructive test techniques presently available is capable of providing an unambiguous practical measure of the net longitudinal force in rails. No single technique has been shown to directly measure stress, independent of other factors such as rail geometry. A number of techniques is available which either directly measure strain or indirectly measure an unknown function of stress,strain, and temperature. Often, however, these techniques only determine the measured parameter in a local, near-surface region and, in ,the case of the indirect techniques, are influenced by microstructure and other uncontrolled variables. Furthermore, their application to the rail problem is hampered by the lack of adequate documention describing the temperature at which the rail was laid and subsequent modification of the stress-free temperature; this condition prevents the successful application of stress measurement techniques even if it were assumed that the results of a localized stress measurement could be multiplied by the cross-sectional area of the rail to calculate a force. Other measurement techniques based on phenomena that depend implicitly on the total force (e.g., rail vibration) are not sufficiently developed for use in the field.
3. Techniques that are primarily sensitive to surface and near-surface rail conditions are likely to suffer from interpretive limitations in that they are not necessarily representative of volumetric conditions in the rail. This is essentially true of all techniques that measure stress or strain at or just below the surface of the rail. A number of features (e.g., deformation resulting from wheel traction stresses) are likely to contribute to a nonhomogeneity of conditions.Thus, the committee recommends that caution be exercised in interpreting the results of such measurements. Even then, according to the first conclusion above, these measurements cannot be used singly and be expected to yield credible results, since they do not determine stress independent of strain and temperature.
3

4. Preliminary investigation has been made of several promising methods for measuring the net longitudinal force throughout the rail cross-section. These include magnetic property measurements and rail vibration techniques. Both of these approaches depend on the force in an implicit way.
5* The committee believes that an inadequate understanding of physical principles exists for those phenomena that are potentially useful indicators of the values of the force in the rail structure. Too much dependency has been placed on the short-term, trial-and-errorsolutions while creation of an adequate scientific base of understanding on which to launch a realistic effort has been neglected.
RECOMMENDATIONS
Oil the basis of its conclusions, the committee recommends a series of short-, intermediate-, and long-term actions. The time designations refer to expected time to payoff, not to the sequence in which! the actions should be taken.
Short-Term (0-2 Years) Actions
1. Because of the existing technological deficiencies in nondestructive testing hardware applicable to a complete solution of this problem and a lack of information necessary to develop knowledge of boundary conditions, such as the temperature at which the rail was laid, the committee suggests that the only meaningful measurement approach in the short term is to apply a proof test concept. This approach, as described in Chapter 4, allows one to determine changes in the totai force from measurements of changes in track length and temperature. The essential features are summarized below.
In this approach, use is made of Eq. 11 in Chapter 4. Two simultaneous measurements are required. They are:
o Measurement of rail temperature with emphasis on theacquisition of data at the maximum temperatures reached. These results should be recorded and faithfully documented. ̂
o Measurement of the strain component along the rail, £ 3 3 ofEq. 11, with a Berry or other strain gauge. These values should be recorded and documented together with the temperatures. Measurement at a subsequent time must be made at the same location.
Although it is not possible to determine the absolute force in the rail from these measurements, it should be possible to establish changes and, hence, limits. Thus, if at an initial time, values for temperature and strain component along the rail are obtained, and if the track does not buckle under these conditions, then it is known that the force required for buckling is greater than the value at that time. Measurements at later times will allow changes in the total force to be determined. If this change is positive when the rail is at the same temperature, then a force buildup has occurred. From these values it may be possible to develop-some-degree-of predictabilityin regard—to buckling conditions.— The committee presents this as the only possible solution which can be
4

implemented in the 0-2 year timeframe. However, several potential, practical difficulties are foreseen which may rule against its implementation. It would be difficult to train existing personnel, within this timeframe, to implement the test. The measurements can only be made at discrete points along the rail (where the strain changes are recorded) in a random sample sense; these data may not be obtained at the point at which a buckle may initiate. Extensive plastic deformation of the rail due to the passage of heavy rolling stock may make the assumptions in the analysis invalid. Therefore, the proof test concept is not recommended as a general solution to the force measurement problem, but is presented as "the best that can be done" in the two-year timeframe for rail sections that might be particularly suspect or critical.
2. Detailed measurements of the force-free laying temperature of continuous welded rail (CWR) should be made, faithfully documented, and stored for future reference. Lack of this documentation at the present time severely handicaps the application of currently available technology
Intermediate-Term (2-5 Years) Actions
1. As noted in the body of the report, research and development work is in progress in two areas which are directly related to the nondestructive measurement of force in CWR. These are the magnetic techniques that are being pursued in Poland and the rail vibration technique being pursued in the U.S. Although neither of these techniques has been developed far enough so that definitive conclusions may be drawn as to their overall applicability and adherence to the engineering requirements given in the Introduction, they appear to be based on physical principles that are compatible with the problem. Work on the magnetic and rail vibration techniques should be continued and results observed in particular relation to this problem. Milestones should be defined to serve as checkpoints upon applicability.
2. There are other ongoing research activities that may provide at least partial solutions to the force problem, but which either have not been pursued far enough to provide specific information about the rail force problem or are being pursued with other purposes in mind. Progress in these various topics, which are discussed in chapter 5, should be monitored for applicability to this,problem.
Long-Term (5 Years) Actions
1. Fundamental studies that will lead to credible volumetric, nondestructive evaluation techniques should be supported. These studies should be initiated now even though the payoff will be several years away. The wisdom of this approach is amply demonstrated in the analysis of this problem, in which it has been shown that no satisfactory nondestructive test solution exists even though effort has gone into the development of several techniques. The committee considers it essential that technique development be based on proper understanding of the problem in order that false starts be avoided.
There are three volumetric techniques that show longer term promise in measurements of absolute longitudinal force. These are:
o High-intensity x-rays o Magnetic o Acousto-elastic
5

The use of high-intensity x-rays to directly measure volumetric strains has already been demonstrated, as discussed in chapter 5. However; the time and equipment required are not consistent with field application.It is recommended that progress in this technique be followed closely and applied as appropriate. An important role of this technique may be as a laboratory standard to aid in the development of the indirect, but fieldable techniques and to calibrate future instruments based on those principles.
The remaining two indirect techniques, magnetic and acoustoelastic, suffer from a lack of understanding of the various competing effects. It is recommended, therefore, that our appreciation of these phenomena would benefit from a fundamental study, including detailed modeling, of the dependence of the measurement upon the relevant physical parameters.
As an example of the intent of this recommendation, the committee has considered in a survey sense the essential content of the work needed to provide a comprehensive understanding of magnetic techniques. A fundamental approach to the problem of magnetic measurement of stress appears formidable, but within grasp. What is required is a model that would predict in detail the evolution of the magnetic state of the material (i.e., the distribution of domain sizes and polarization) during the magnetization process. From such a detailed model, which would include stress, texture, and other microstructural details as materials parameters, it would be possible to simultaneously predict the results that would be obtained using each of the known magnetic measurement techniques. It would then be possible to model how each was influenced by the microstructural parameters and, one hopes, to establish combinations of measurements that would be insensitive to these parameters.
The success of such an approach depends, of course, on the ability of the model to accurately indicate the effect of these material variations, and this would be the primary technical problem. The model would include a number of well-established energy functions that, in the absence of hysteresis, would predict the equilibrium distribution of domains. Included should be the magnetic anisotropy energy, which describes the tendency of magnetization to align itself along cube axes; the magnetostatic energy, which describes the tendency to form domains of closure to avoid free magnetic poles; the magnetoelastic energy, which describes the sensitivity to deformation of the lattice (i.e., strain); and the field energy, which describes the tendency of the magnetization to align parallel to the applied field. A description of processes characteristic of the nonreversible, hysteretic behavior of the material would also be needed. A large body of knowledge is available that can be used to formulate such a model, but it needs to be assembled into a coherent approach. Once completed, the model should allow the various magnetic techniques to be evaluated, compared, and combined on a much less empirical basis.
Although not presented here, in detail, studies of a similar nature are recommended for the acousto-elastic case.
6

Chapter 3BACKGROUND
STATEMENT OF THE PROBLEMA conventional railroad track consists of two longitudinal steel
rails resting on and fastened to discretely spaced crossties, which are embedded in a layer of crushed stone ballast. The ends of the rails either are connected by joint bars to form an expandable joint or are welded together to form long lengths of continuous welded rail (CWR). The latter configuration is considered in this report.
The CWR structure, when subjected to sufficiently high longitudinal compressive forces in the rails, can exhibit sudden and rapid lateral or vertical movement over a relatively short length. This lateral movement or buckling* of the track results in severe misalignment that may not permit the safe passage of train traffic (Figure 1). If: the buckling occurs undera.train, a derailment is likely; if it occurs between trains, traffic must either be stopped or slowed until the buckled track condition is corrected.
During 1977, track buckle caused 109 train derailments” which resulted in over $5.5 million in reported damage (private communication, Federal Railroad Administration, 1977). Furthermore, for every track-buckle derailment, there were 10 cases of track buckle that were corrected by railroad maintenance forces before a derailment could occur.**
The compressive forces that contribute to the lateral buckling phenomenon are largely thermally.generated under conditions in which the ends of the rails are constrained and are permitted insufficient movement. Figure 2 illustrates the magnitude of the thermal forces that can be experienced by the rails. The distribution of thermal stresses that can be generated in a long length of welded rail is shown in Figure 3* and the corresponding strains are given in Figure 4. These data were taken from field measurements on the Bessemer and Lake Erie Railroad (Talbot 1937) .
Since it is the difference in temperature from the initial or laying temperature that determines the magnitude of the thermally induced rail forces, proper selection and control of the CWR installation temperature is of great importance (Kerr 1978d). Consequently, many railroads have well-defined installation temperatures for different geographical locations.*Railroad track maintenance personnel often call it a "sun-kink."**Based on a study of track buckles occurring on a major U.S. railroad.
7

FIGURE 1 Buckled track (courtesy of the U.S. Department of Transportafi’onT'TransportatTiorT'Te’sir'Center, Pueblo 7~Colorado) .
8

°F °C
FIGURE 2 Rail temperature increase versus axial rail forces for different rails (American Railway Engineering Association 1978) .
9

14
i
FIGURE 3 Thermal stresses in 1-mile length of welded rail measured using a reference temperature of 53°F; based on Bessemer and Lake Erie Railroad data (American Railway Engineering Association 1937).
10

ccIoX
< GC HCO
<rUJXH
oic0)-JcO)
O Jc<ytC«in(00)wO4)o
SOUTH END NORTH END
DISTANCE IN RAIL LENGTHS FROM SOUTH END
FIGURE 4 Thermal strains in 1-mile length of welded rail measured using a reference temperature of 53°F; based on Bessemer and Lake Erie Railroad data (American Railway Engineering Association 1937).
11

When the ambient temperature at the time of installation is below the recommended installation temperature, the rail is either heated to the proper temperature or mechanically stretched to the appropriate length.Iri the latter case, mechanical strains and, consequently, tensile stresses are introduced. Furthermore, rail installed in curves often undergoes expansion and contraction cycles that result in a shifting of the track, usually seen as change in the curvature. This behavior often changes the equivalent installation temperature so that it is no longer the same as the initial laying -.emperature. In fact, in many cases, the force-free temperature is no longer known.
Longitudinal tensile stresses may contribute to pull-apart. In CWR, these pull-aparts generally occur at the twelded joints or at the ends of the string and result in a gap in the rails. These gaps can result in a derailment or, at the very least, rail batter, and traffic must be slowed or halted until appropriate corrective action is taken. It is clear, however, that these stresses do not contribute to buckling because.of their tensile nature.
Large.mechanically generated compressive stresses and forces also may be present. They are generated by traction stresses between locomotive wheels and the rail structure and are the stresses (forces) responsible for train movement. Likewise, when decelerating or braking occurs, the resultant train forces are reacted against the track. When the train is on a grade, and particularly during severe braking conditions, the net longitudinal forces can be very severe. This mechanical loading by itself, however, generally is not sufficient to buckle the track. In fact, according to Kerr (1974), track subjected to mechanical compressive loading should buckle vertically, a phenomenon almost never experienced in the field. These traction forces nevertheless can produce longitudinal creep of the ballast accompanied by elastic movement of the rails. When this ballast creep is restrained, as is the case with well-anchored track or at turn-outs and grade crossings, longitudinal compressive forces can be built up in the rails. Hiltz (1955) presents a complete description of the development of rail creepage forces.
Residual stresses are introduced in various ways (e.g., by the rail manufacturing process, by heat--treating processes, by the work hardening and softening of the rail heads under wheel-rail interactions, and by the welding process which creates residual stresses in the vicinity of the welds). However, these residual stresses generally are so distributed that the net force across the rail section is zero. This stress distribution is similar to that encountered by a rail in bending when a stress can be present at any given point in the rail section even though the net force in the rail section (i.e., the total of all the stresses in the cross section) is zero. In this case, the effect of the residual stresses on track buckling is negligible since it is the net longitudinal force in the rails that contributes to this mode of track failure. It should be noted that several of the nondestructive test techniques examined later in this report are aimed essentially at providing measures of local residual stress and not the required net force quantity.
Finally, one of the questions that must be asked and evaluated in determining the scope of the track buckling problem is the extent to which localized, discrete flaws and their associated local stress intensification factors (i.e., cracks, stress risers, inclusions, etc.) contribute to buckling failure. Analyses summarized later in this report make it clear
12

that the buckling phenomenon is global, in that global force distributions and deflections are involved, and local failure modes are not relevant. There is no doubt that a secondary local failure mode amenable to fracture mechanics analysis could follow a buckling failure, but no evidence was available to indicate that this combined failure mode was of any significance. As noted earlier, only compressive longitudinal stresses are of major interest in the buckling problem. This means that any mode I fracture mechanics analysis, the one in common usage, would not be applicable even though failure in mode II or mode III could be possible;For these reasons, the committee conducted no further investigation of . failure due to the instability of a local flaw present in the track. The presence of imperfections may, however, affect track stability and influence the onset of buckling. This effect is reviewed later in the report.
SUMMARY OF THERMAL BUCKLING TESTS
In the early track buckling tests by Ammann and Gruenewaldt (1932) and by Nemcsek (1933), hydraulic jacks were used to induce compression forces in the rails of a track. In Kerr (1973 and 1978a) , the use of jacks for simulating thermal compression forces was questioned. In later track buckling tests conducted (since about 1934) by various railroads, the axial forces were induced by heating the rails. These test Set-ups consisted of a track section whose movements were constrained at both ends by two heavy concrete piers . (Birmann and Rabb 1960, Bartlett 1960, and Bromberg1966) or by locomotives that were placed on both ends of the test section (Neitihsdy 1960, Numata I960, and Prud'homme and Janin 1969). A survey of these tests and a discussion of the obtained test results is presented by Kerr (1978aj. The typical buckling modes observed are shown in Figure 5. An understanding of some of these test results is essential to the understanding of thermal track buckling and these are described below.
Results of a series of 21 track buckling tests conducted for the Federal German Railways (DB) were reported by Birmann and Raab (1960). The test facility was located at the Technical University of Karlsruhe. The track section was 46.50 m (153 ft) long and was confined at both ends by 624 tonne (686 ton) reinforced concrete blocks (Figure 6). The axial compression force in the rails was induced by electric resistance heating.
Wooden cross-tie track K49 (Hh) was used in 12 of these tests. This track consisted of S49 rails attached to wooden cross-ties by means of K-fasteners (Figure 7a). The tie spacing was 62.5 cm (25 in.). To simplify comparisons, note that the lateral stiffness of the S49 rail (I = 320 cm^= 7.66 in.^) is less than the stiffness of the 52 kg (115 lb) rail. In all tests the track buckled laterally. The buckling modes exhibited two, three, or four noticeable half-waves. It was observed that a typical half-wave was about 5 to 6 m (16 to 20 ft) long and the largest amplitude of lateral displacement was about 25 cm (10 in.). For the 12 tests with wooden crossties track K49 (Hh), buckling took place for temperature increases65°C (117°F) <At < 140°C (252°F). The measured axial compression forces (in both rails) ranged from 177 tonne (195 tons) to 340 tonne (374 tons).
13

FIGURE 5 (b) nearly
(a)
Buckling modes observed in tests; (a) nearly antisymmetrical; symmetrical (Kerr 1978d).
14

FIGURE 6 Track buckling facility at Karlsruhe (Kerr 1978d)
15

a. K -t y p e F a ste n e rb . C u t -s p ik e F astener
FIGURE 7 Rail-tie fasteners used in test tracks: (a) K type and (b) cutspike (Kerr 1978d).
16

Birmann and Raab (1960) observed that the straight tracks, which did not exhibit noticeable out-of-straightness, buckled at much higher temperature increases than those tracks with noticeable lateral imperfections. They also observed that buckling of "straight" tracks occurred suddenly and with a loud bang, whereas the imperfect tracks buckled gradually and quietly. Birmann and Raab (1960) further observed that the use of different fasteners in some tests resulted in buckling loads that differed by as much as 25 percent.
A very extensive series of track buckling tests was conducted at the Central Railroad Research Institute (CNII) in the USSR. A description of these tests and a discussion of the results is presented by Bromberg (1966). The test stand for straight tracks was 100 m (328 ft) long. The track section was mounted between two concrete -piers. . The compression force in the track was induced by electric resistance heating. The tested tracks consisted of jointless P50 or P65 rails on wooden or reinforced concrete ties using a variety of fasteners. Many of the tests were conducted with weakly compacted ballast in order to simulate the conditions of newly constructed or renovated tracks. In all tests the tracks buckled in the horizontal plane and exhibited three, four, or five half-waves of the type shown in Figure 5. To simplify comparisons with U.S. tracks, note that the P50 rail is about 16 percent less stiff laterally than the 52 kg (115 lb) rail (I = 377 cm̂ [9.05 in.̂ ] versus 450 cm̂ [10.8 in.̂ ]) and that the P65 rail is slightly less stiff than the 59 kg (132 lb) rail (I =570 cm^ [13.7 in.̂ ] versus 608; cm^ [14.6 in.̂ ]).
During tests in which the temperature was continuously increased, it was observed that an increase of, for example, At ̂produced no noticeable displacements. For AT > AT-̂ , the track started to deform laterally. The rate of deformation increased with increasing AT. ; At a temperature increase of AT = AT2, the track buckled. These results are shown in Figure 8a.
During a number of these tests it was observed that when a track was heated by a temperature increase of At ̂< At < AT2, at which lateral displacements occurred and its temperature subsequently was lowered, the lateral displacements did not vanish (Figure 8b). Pointing out that an actual track is usually exposed during the summer to hot days followed by cool nights, Bromberg (1966) suggested that the resulting temperature variations (AT < T̂ ) may cause an accumulation of undesirable permanent lateral track deformations for temperature increases that do not cause actual track, buckling.
Citing the need for improved ride quality and for reduced track maintenance, Bromberg (1966) suggested that a desirable criterion for the design of welded tracks would be an admissible temperature increase smaller than Ati . In order not to restrict unduly the admissible temperature increase AT (beyond neutral), Bromberg (1966) modified this criterion to the inequality AT < AT̂ , where AT̂ is the temperature increase that causes a lateral displacement of 0.2 mm (0.008 in.) for a straight track and0.4 mm (0.016 in.) for a curved track. (For additional consents on this approach to track stability, see Albrekht et al. 1967.)
Of special interest for U.S. tracks are the test results obtained on track sections with P50 rails, wooden ties (1,840/km [2,961/mi], center-to-center tie spacing of 54.3 cm [21.4 in.]), and cut-spike
17

TEMP
ERAT
URE INCREASE, A
T
LATERAL DISPLACEMENT LATERAL DISPLACEMENT(a) (b)
FIGURE 8 Temperature increase versus lateral displacement observed in track buckling tests (Kerr 1978d).
18

fasteners of the type shown in Figure 7b. Results for two of these tests are given in Table 1. According to Bromberg (1966), these results fall within the range recorded in the tests with the same track section but with K4 fasteners (Nj » 150 to 196 tonne [165 to 216 ton], and N2 = 200 to 240 tonne [220 to 265 ton]).
TABLE 1 Test Results for P50 Track Sections with Wooden Ties and Cut-Spike Fasteners __
TestTemperature in °C (°F)
IncreaseCorresponding Axial Force in Tonnes (Tons)
Deflected Shape in Lateral Plane (dimensions in
No. At x At 2 N j n 2 meters)
15 52 (94) 73 (131) 170 (187) 238 (262)ooi ms'
17 59 (106) 69 (124)' 193 (212) 225 (248).
Source: Bromberg 1966.Note: The * refers to the temperature and the axial force correspondingto a lateral displacement of 0.008 in.
The K4 fastener (of the type shown in Figure 7a) generally is considered to be a more rigid fastener than the cut-spike fastener. Therefore, one would expect the buckling temperatures to be higher for the tr&ck with K4 fasteners. One reason why this was not the case in the test described above could be that the cut-spike track sections were specially prepared for these tests and were not' exposed to the rolling stock prior to buckling. Since it is well known that moving trains have a tendency to loosen the connection between the cut-spike and the ties, which results in a reduction of the fastener rigidity also with respect to the vertical axis, it may be that the buckling temperatures will be lower for an actual track with cut-spike fasteners than those shown in Table 1 (assuming that the lateral resistance of the ballast and the other track properties remain essentially unchanged). (For additional test results, see Birmann and Raab 1960, Bartlett 1961, Bromberg 1966, Nemesdy 1960, Numata 1960, and Prud'homme and Janin 1969; £or a discussion of some of these results, see Numata 1960, The effect of test track length on the obtained results is analyzed and discussed in Kerr 1979.)
ANALYSIS OF THERMAL TRACK BUCKLINGThe currently accepted analysis of thermal track buckling was
developed by Kerr (1978a, 1978c). This analysis is based on the observations that the buckling mode of a long, straight track usually
19

buckled state
(a) Axial compression force before buckling
4i< • •» 1 1 L L - J --- 1-1- • - r 1 1 1 M l T F T X T
^ — —a 21 i a
*-----!------ 2l '--------------------------------------------»
(b) Axial compression force after buckling(Note that in an actual track a is several times larger than Z)
FIGURE 9 Distribution of axial compression forces before and after buckling. Nt = net longitudinal compliance force. (Kerr 1978d).
20

takes place in the lateral plane and that it consists of a buckled region exhibiting relatively large lateral deformations and two adjoining regions appearing to deform only axially (Figure 9). In the buckled region, a part of the constrained thermal expansions is released, which results in a reduction of the axial force. In the adjoining regions, because of the ballast resistance to axial displacements of the rail-tie structure, the constrained thermal expansions vary and so does the axial force.
In this analysis, the rail-tie structure was replaced by an equivalent beam of uniform cross section consisting of the two separate rails each deforming axially and in bending. This assumption, which neglects the torsional rigidity of the fasteners, appears.justified for the tracks currently used in the United States. When the fastener rigidity is not negligible, the resulting "safe temperature increase" is higher. Thus, the corresponding results obtained (Kerr 1978a and 1978b) provide for a margin of safety.
The lateral resistance provided by the ballast on the rail-tie structure (due to lateral displacements) consists of the friction forces between the ballast and the bottom surface and the two long sides of the ties as well as of the pressure the ballast exerts against the front surface of the ties (Figure 10a). For the analysis, it was assumed that the resulting lateral resistance is pQ = const (per unit length of track axis) . The justification for this assumption is suggested by Kerr (1976a) . The energy balance considerations for the frictional lateral constraint in the rail buckling problem are the same as for a class of problems in mechanics known as "one-sided constraint problems" (Zajac 1962).
The axial resistance exerted by the ballast on the rail-tie structure (due to axial displacements) consists of the resistance between the ballast and the bottom surface of the ties and the pressure on the vertical tie surfaces exerted by the ballast in the cribs (Figure 10b) .. For the analysis (Kerr 1978a), it was assumed that the resulting axial resistance is rQ = const (per unit length of track axis) or bi-linear (Kerr 1978c). Samovedam (1979), however, assumed that the axial resistance was nonlinear. It also was assumed in the analysis that both track rails are subjected to a uniform temperature increase, AT, above the installation (neutral) temperature and that, prior to and during buckling, the response of the rail-tie structure is elastic.
The buckling analysis of a railroad track subjected to thermal compression forces consists of two parts: (1) the determination of allequilibrium states and (2) an inspection to determine which of the equilibrium states are stable and which are not. From the nature of the post-buckling equilibrium branches and their stability, it follows that the range of "safe" temperature increases to prevent track buckling may be determined solely from the post-buckling equilibrium branches. This concept is adopted in the following analysis.
Typical equilibrium branches for a perfectly straight track, based on the above assumptions, are shown in Figure 11. Note that each point on the equilibrium branch corresponds to an equilibrium configuration of the track: branch I corresponds to the straight unbuckled equilibrium statesand branch II to the laterally deformed configurations. When the track is subjected to a temperature increase of AT < ATl, there exists only the straight equilibrium configuration. For such a AT, when the track is pushed sideways at a point it will return to its original straight position once the lateral load is removed (assuming that the track response is elastic).
21

Axia
l re
sist
ance
>r(k
g/m^
La
tera
l re
sist
ance
,p(k
g/mj
(a)
FIGURE 10 Resistance between rail-tie structure and ballast: (a) lateraldisplacement and (b) axial displacement (Kerr 1978d).
22

A B1-<JLU</><UJ Aj<razLU CCt-<GCLUa .5LU
A T ,
B r a n c h I Iv m a x
B r a n c h I
LATERAL DISPLACEMENT, Vm a x
FIGURE 11 Typical equilibrium branches for a heated straight track (Kerr 1978d) .
23

Note, however, that for a temperature increase of At > Atl, there are three states of equilibrium: the (stable) straight state (l), the(unstable) configuration (2) on branch AL, and the (stable) configuration <D on branch LB (Kerr 1973) . Thus, when the straight track buckles at a temperature increase At > At. , it will move to the laterally deformed equilibrium configuration (5; on branch LB. Thus, it may be concluded that a temperature increase for a straight track will not cause buckling when the Bromberg criterion is fulfilled.
Because railroad tracks usually are not "perfectly" straight, it is necessary to know the effect of geometric imperfections on the track response. The corresponding equilibrium branches (Kerr 1973 and 1979) for relatively small lateral track imperfections are shown schematically, as dashed lines, in Figure 12. Note that the At l value for each of these branches is very close to the At l value of the perfectly straight track. Hence, the criterion stated by Bromberg with a At l value for a "straight" track, also is valid for a track with small lateral imperfections.
It should be noted that when the geometrically imperfect rails are heated and At reaches the value ATcr, the track will buckle sideways and will adopt an equilibrium configuration on branch LB. The buckling phenomenon itself is dynamic in nature and, hence, is not included in graphs (which show equilibrium curves). Note that with increasing imperfections, ATcr and, hence, vmaX decrease. These findings agree with observations made by Birmanri and Raab (1960).
A buckling analysis of a railroad track subjected to thermal compression forces consists of two parts: determination of all equilibriumstates and the inspection of the determined equilibrium states to establish which are stable and which are not. The above discussion suggests that the safe temperature increase for preventing track buckling may be determined solely from the post-buckling equilibrium branches. This concept was adopted by Kerr (1978b, 1978c) and is reviewed below.
To insure an analytical formulation that is mechanically reasonable and mathematically consistent, the equilibrium equations for the rail-tie structure were derived by utilizing the nonlinear theory of elasticity and the principle of virtual displacements. When matching track regions that are governed by different differential equations and whose matching points are not fixed a priori along the track axis, use was made of variational calculus for variable matching points (Kerr 1976b).
The typical buckling modes shown in Figure 5 suggested the analysis of antisymmetrical and symmetrical buckling shapes. The analyses for these shapes are shown in Figure 13 (Kerr 1978b). In the following, only the results of this numerical evaluation are presented and discussed.
For example, the results of the numerical evaluation for a 59 kg (132 lb) track with rQ = 1000 kg/m (672 lb/ft) and pQ = 900 kg/m (605 lb/ft) are shown in Figure 14. The solid line corresponds to the antisymmetrical S-shape or mode II (Kerr 1978a). The dashed line corresponds to &he symmetrical deformation shape or mode III (Kerr 1978a). The safe temperature increase is Atl =* 4 3.5°C (78°F) . Note that if the track should buckle for a temperature increase AT = 50°C (90°F), it will come to rest at the equilibrium configuration © (Figure 11) on branch LB with the largest lateral deflection vmax = 32 cm (12.5 in.). Thecor respond ingaxialcompression forces are:— N^-=—EAaAT— =—20-2— tonne— (-2-2-3----ton) in the straight equilibrium configuration (l) and Nt = 80 tonne (88 ton) in the stable equilibrium configuration (5) . Thus, for a rail
24

Temp
erat
ure
incr
ease
,AT
FIGURE 12 Typical equilibrium branches for a track with lateral geometric imperfections (Kerr 1978d) .
25

(a)
(b)
FIGURE 13 Buckled track shapes obtained from analysis for AT = 50°C (90°F) for rQ = 1000 kg/m and pQ = 900 kg/m: (a) antisymmetrical mode and (b) symmetricalmode (Kerr 1978b).
26

•c
FIGURE 14 Equilibrium branches and corresponding axial force curves obtained from analysis (Kerr 1978d).
27

temperature increase of AT = 50°C (90°F), the axial track force drops, due to buckling, to less than half of its original value. For T = 60°C (10 8°F) , the thermal force Nj. = 242 tonne (267 tons) drops to 65 tonne (72 tons), about a quarter of its original value.
Figure 14 also indicates that, for a given track, the magnitude of vmax depends on the temperature increase AT at which buckling will take place. To show this point, the corresponding values are presented in Table 2. Note that vmax arid Nt (axial force in rails in laterally buckled region) also depend on the track parameters, especially the resistarices rQ and pQ.TABLE 2 Dependence of vmax and Nt on At for 59 kg (132 lb) Track
AT in °C(°F) vmax cm (in.)
Nt intonne (ton)
Nt intonne (ton)
Nt as % of Nt
43.5 (78.3) 15 (5.9) 17 5 (193) 115 (127) 6645 (81) 22 (8.7) 181 (200) 96 (106) 5350 (90) 32 (12.6) 202 (223) 80 (88) 4060 (108) 48 (18.9) 242 (267) 65 (72) 2770 (126) 63 (24.8). 28 2 (311) 57 (63) 2080 (144) 78 (30.7) : 323 (356) 52 (57) 16Note: vmax = largest lateral deflection, Nt = corresponding compressionforce, Nt = compression force in laterally buckled region.
A comparison of the equilibrium branches in Figure 14 shows that the ATl values for the symmetrical and antisymmetrical deformation modes are almost the same, whereas the v„„„ value for the symetrical mode is larger (about 50 percent). For the range of temperature increases shown, the drop of the axial force due to buckling is about the same for both modes of deformation. For example, for AT = 50°C (90°F), the axial force in the straight state (according to Table 2) is N = 202 tonne (223 tons), whereas the corresporiding Nt value for the stable deformed state (3) is about 80 tonne (88 tons). The antisymmetrical and symmetrical track shapes that correspond to the temperature increase AT = 50°C (90°F) are shown in Figure 13.
In order to establish the effect of rail section and ballast conditiori on the post-buckling track response, especially on the safe temperature increase, ATL ,̂ the solutions presented in Kerr (1978c) were numerically evaluated for the standard rail steel constants
E = 2.1 x 10⁶ kg/cm2 =.3 x 107 lb/in.2 = 3 x 10⁴ ksi0t = 1.15 x lO-5 1/°C = 6.39 x 10“® 1/°F
28

for different rail weights and a range of tie-ballast resistances rQ and pQ. The numerical results are summarized in Figure 15. This graph was obtained for the antisymmetrical S-shape of deformation; but the corresponding graph for the symmetrical deformation shape was found to be very close to that of the S-shape; therefore, for engineering purposes, the graphs in Figure 15 may be considered valid for both modes of deformation.
A method for establishing the installation (neutral) temperature is detailed by Kerr (1978d) . The example demonstrates the importance of choosing the optimum neutral temperature when making the installation.
i-w<UJccozDC3H<DCLUa.SUJUJLL<C/5
°F °C
200 400 600 800 1,0001 b/ftLATERAL RESISTANCE
FIGURE 15 Dependence of safe temperature increase T on track parameters (Kerr 1978c). L
29

REFERENCES
Albrekht, V.G., Bromberg, E.M. , Ivanov, K.E., Laishchenko, V.N. ,Pershin, S.P., and Shulga, V. Ya. , Besstykov’oi Puti Dlinnye -Relsy (The Jointless Track and Long Rails), Izd. Transport, Moscow, 1967.
American Railway Engineering Association, Bulletin of the American Railway Engineering Association, 38(1937): 674-75.
American Railway Engineering Association, Bulletin of the American Railway Engineering Association, 79(1978):19.
Ammann, 0., and Gruenewaldt, C.v., "Versuche uber die wirkung vonlangskraften im gleis (Tests of the effect of axial forces in the track)," Organ fur die Fortschnitte des Eisenbahnwesens, Heft 6, 1932.
Bartlett, D.L., "The Stability of Long Welded Rails."CivilEngineering,and Public Works Review, Parts I-IV. Also "Die Stabilitat Durchgehend Verschweisster Gleise (The stability of Continuously Welded Rails), Eisenbahntechnische Rundschau, Heft 1/2, 1960.
Birmann, F., and Raab, F., "Zur entwicklung durchgehend VerschweissterGleise— ergebnisse bei versuchen auf dem Karlsruher prufstand: ihreauswertung und deutung" (To the development, of the continuous welded track— track results of the Karlsruhe test facility: theiranalysis and interpretation), Eisenbahntechnische Rundschau (1960) .
Bromberg, E.M., Ustoichivost besstykogo puti (The stability of the jointless track), Izd. Transport, Moscow, 1966.
Hiltz, J.P., Jr., et al. "Measurement under traffic of the dynamicrail creepage forces," Bulletin of the American Railway Engineering Association. 56 (1955):283.
Kerr, A.D.,,"Model study of vertical track buckling," High Speed Ground Transportation Journal. 7(1973).
Kerr, A.D., "The stresses and stability analysis of railroad tracks," Journal of Applied Mechanics, 41, 4(1974).
Kerr, A.D., "The effect of lateral resistance on track buckling analyses." Rail International, 1(1976a).
Kerr, A.D., "On the declaration of well posed boundary value problems in structural mechanics," International Journal of Solids and Structures. 12, l(1976b).
30

Kerr, A.D., "Lateral buckling of railroad tracks due to constrainedthermal expansions - a critical survey," in Railroad Track Mechanics and Technology, edited by A.D. Kerr, Pergamon Press, Elmsford,New York, 1978a.
Kerr, A.D., An Analysis of Thermal Track Buckling in the LateralPlane, Report No. FRA-QR&D-76-285, Federal Railroad Administration, U.S. Department of Transportation, Washington, D.C., 1978b.
Kerr, A.D., An Improved Analysis for Thermal Track Buckling,Report CE-78-16, University of Delaware, Newark, 1978c.
Kerr, A.D., "Thermal buckling of straight tracks: fundamentals,analyses and preventative measures," Bulletin of the American Railway Engineering Association, 80(1978d):16-47.
Kerr, A.D., "On thermal buckling of straight railroad tracks and theeffect of track length on the track response," Rail International (1979) .
Nemcsek, J., "Versuche der Koniglich Ungarischen Staatsbahnen^uberdie Standsicherheit des Gleises" (Tests of the Royal Hungarian National Railroads on track stability), Organ fur die Fortschritte des Eisenbahnwesens, Heft 6, 1933.
Nemesdy, E. "Berechnung Waagerechter Gleisverwerfungen nach denNeuen Ungarischen Versuchen" (Analysis of horizontal track buckling in accordance with the new Hungarian tests), Eisenbahntechnische Runsdshau, Heft 12, 1960.
Numata, H., "Buckling strength of continuously welded rail," Bulletinof the International Railway Congress Association, English ed., 1960.
Prud'homme, A. and Janin, G., "The stability of tracks laid with ong welded rails," Bulletin of the International Railway Congress Association, part 1 and 2, English ed. (1969) .
Samovedam, G., Buckling and Post-Buckling Analyses of CWR in theLateral Plane, Technical Note TNTS 34, British Railways Board, R&D Division, U.K., 1979.
Talbot, A.N. , et al. "Discussion of stresses in railroad track,"Bulletin of the American Railway Engineering Association.38(1937) :674.
Zajac, E.E. "The deflection and buckling of a beam-column with aone-sided constraint." Zeitschrift fur Angewante Mathematik und Phvsik. XII(1962):536.
31
Chapter 4ANALYTIC FORMULATION OF THE NON-DESTRUCTIVE EVALUATION (NDE) PROBLEM
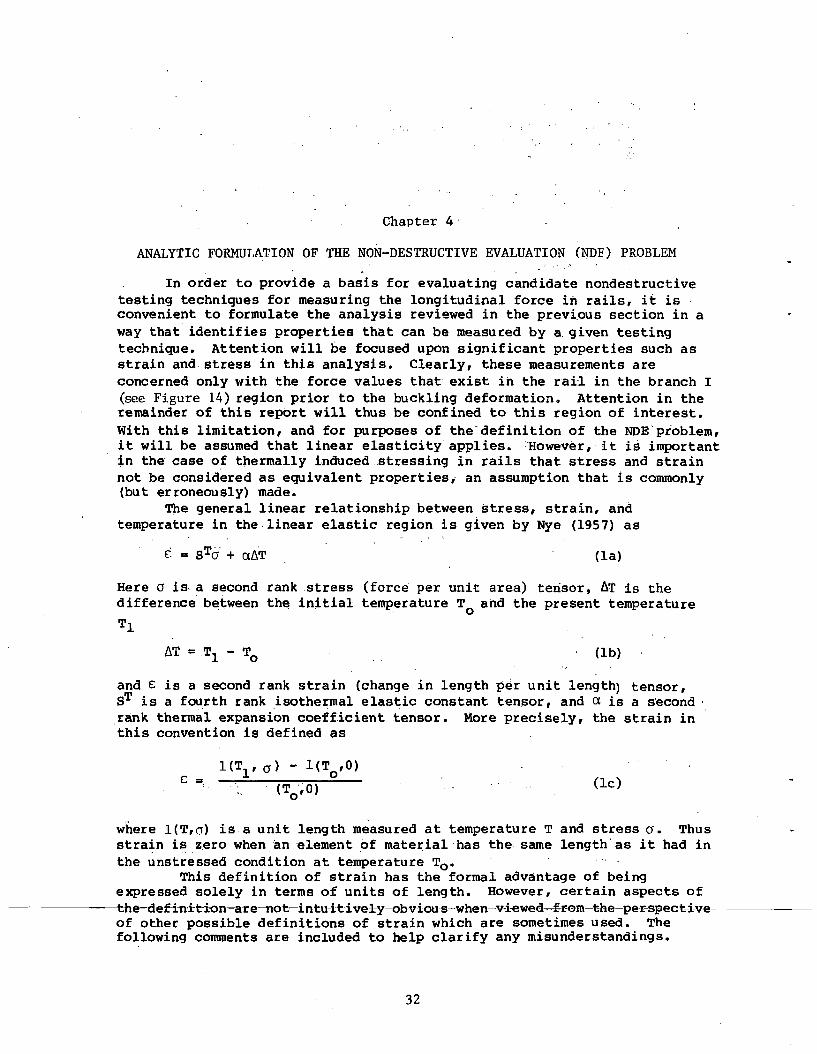
In order to provide a basis for evaluating candidate nondestructive testing techniques for measuring the longitudinal force in rails, it is convenient to formulate the analysis reviewed in the previous section in a way that identifies properties that can be measured by a given testing technique. Attention will be focused upon significant properties such as strain and stress in this analysis. Clearly, these measurements are concerned only with the force values that exist in the rail in the branch I (see Figure 14) region prior to the buckling deformation. Attention in the remainder of this report will thus be confined to this region of interest. With this limitation, and for purposes of the definition of the NDE problem, it will be assumed that linear elasticity applies. However, it is important in the case of thermally induced stressing in rails that stress and strain not be considered as equivalent properties, an assumption that is commonly (but erroneously) made.
The general linear relationship between stress, strain, and temperature in the linear elastic region is given by Nye (1957) as
c = STa + aAT (la)Here c is a second rank stress (force per unit area) tensor, At is the difference between the initial temperature T and the present temperature*1
AT = T1 - TQ (lb)and e is a second rank strain (change in length per unit length) tensor, ST is a fourth rank isothermal elastic constant tensor, and a is a second rank thermal expansion coefficient tensor. More precisely, the strain in this convention is defined as
c 1 (Tj, a) - l(To,0)< V ° ) (lc)
where l(T,a) is a unit length measured at temperature T and stress a. Thus strain is zero when an element of material has the same length as it had in the unstressed condition at temperature T0.
This definition of strain has the formal advantage of being expressed solely in terms of units of length. However, certain aspects of thedefinitionare not—intuitiveiy-obvious when viewedfrom theperspective of other possible definitions of strain which are sometimes used. The following comments are included to help clarify any misunderstandings.
32

Suppose that the material is heated with no stress applied. Then Eq. la predicts that
1(^,0) - 1(Tq ,0) l(To,0 ) a(T - T ) 1 o (Id)
where the tensor notation has been neglected for conceptual clarity. Although no stress is applied, the material is considered to be "strained," and the amount of this strain depends upon the selection of the initial temperature T0. An alternate definition of strain would be
l(Tlfa) - 1(^,0) 1(^,0) (le)
In this case, the strain is defined as a change in length with respect to the stress-free length of the material at the same temperature. This may be thought of as a deviation from the equilibrium length of the sample, and does not depend upon any arbitrary selection of initial temperature T0.This may be considered to be a more physically appealing definition than the former.
The two views are, of course, equivalent to the first order. If o = o and the material is heated from T0 to T]_, then combining Eqs. lb and lc yields Eg. Id. Substitution of Eq. Id into Eg. la to eliminate the explicit dependence on temperature yields the results
Kyo). - k t ^ o) . sTa (lf)1(TQ,0)
ore - ST (lg)
where we have approximated 1(TQ,0) ~ 1(T̂ ,0) in the denominator for linear elasticity. Therefore, use of Eq. la, in which AT and e are defined by Eqs. lb and lc, is equivalent to use of Eq. lg with strain defined by Eg. le. Although the former approach has certain aspects that are possibly counterintuitive, it has the advantage that the effects of change in length and change in temperature are explicitly separated, and that the definition of strain corresponds to the quantity that would be measured by a strain gauge mounted on a rail. Consequently, this definition of Eqs. la*lc will be adopted for this work.
To be rigorously correct, Eq. la should also contain nonlinear terms that describe deviations from Hooke's law. However, these terms are omitted in the present analysis because they constitute only small effects and their omission is consistent with the assumptions made earlier. Figures 3 and 4 of the previous chapter show that measured stresses and strains in the straight rail (branch I) condition are of the order of 12 ksi and 1 0“4.These values are small compared to the expected yield stress of rail
33

material and to a strain value of 1 0 - 3 which is often taken as an approximate boundary between the regions of linear and nonlinear mechanical response. Thus, nonlinear effects are omitted in this work.
A further assumption is made to reduce Eg. la to a more manageable form. Rail material is generally anisotropic, and a proper discussion of its deformation in response to thermally induced stresses should include these effects. However, many of the important physical phenomena can be extracted from an isotropic analysis. Anisotropy will thus be neglected in the present discussion, but will play a role in analyzing specific nondestructive measurement situations. With this simplification, Eq. la becomes
°11 " v a 22 " W 3 3 ) + aAr , (2a)
~ v a l l + a22 ~ VCJ3 3 ) + aAT, (2b)
and
e = — i-vo - vo + a ) + aAr .33 E ' 11 22 33* ’ (2 c )
where E is Young's modulus, V is Poisson's ratio, and arecomponents of strain and stress, and At is the difference between the ambient rail temperature and the reference, strain-free temperature T0 (S f T) at which the rail was laid. It should be noted, in this context, that the vanishing of stress components does not imply that the strain is also zero. This occurs because the definition of strain relates the material length at ambient rail temperature T0 + At to a reference length at temperature T0.
The simplest case to consider is that of a uniform rail whose temperature has been increased by ah amount, At , while the strain component along the rail, £3 3, has been constrained to be zero. Figure 16 Summarizes the coordinate system. In this case Eg. 2a-2c become:
and°33 = - eoiAt
£11 = £22 = aAT(1+v)
(3a)(3b)
where the vanishing of stress on the lateral rail surfaces, <7^ = (J22 =0 has been used in the derivation. In this highly idealized example, it can be seen that the net longitudinal compressive force, defined as N̂ , is given by
Nt = -ACJ33 = EAaAT, (4)\th A representing the cross-s ect ional—a rea-of
causes the force to be a positive quantity sincethe—raiHL-i--(The-minus-sign, in the above convention.
34

?Pjocd sr

the compressive stress, <133, is negative.) It is evident that if this simple case prevailed (which it does not), the force in the rail could be determined from a single measurement of AT.
In the above simple case, it is assumed that the ends of the CWR are fixed; as a result, the axial force distribution is constant along the rail and the strain component £33 is zero. More realistically, the ends of the CWR are free to move. However, they experience a constraint generated by the axial resistance provided by the roadbed (ballast) and the soil-tie structure. This effect was introduced in the previous chapter in regard to rail stability questions, but it must also be considered in the NDE formulation. However, only the case of axial constraint is considered.
A schematic representation of this case is shown in Figure 17 in which rQ is the axial resistance force per unit length of rail. For sufficiently long rails the central region is subjected to a force Nt =EACxAt given in Eq. 4. The distribution of the axial forces in the end regions (i.e., the "breathing" regions) is determined from the free body diagram shown in Figure 18. Equilibrium of forces in the axial direction yields
N(z) = rQz (5)Thus, N varies linearly with distance z. The length of the breathing region is determined from the condition that at z = b, the axial force is N =Nf.. Thus
b = Nt/rc (6)Note that b depends on rQ and also on the magnitude of Nt and, hence, on the temperature increase. At , as indicated (by a dashed line) in Figure 17.
As an example, consider an 800 m (2624 ft) length (L) of track with continuous welded 60 kg (132 lb) rails. The track is free at both ends to expand axially. Assume that the rails are subjected to a temperature increase (At) g’£ 50°C (90°F) . As shown in Figure 2, the corresponding axial compression force is N̂- = 202 tonne (223 tons). With rQ= 800 kg/m (538 lb/ft), it follows from Eq. 6 that the corresponding b is 252 m (825 ft). Thus, for the problem under consideration, the distribution of the axial forces will be as shown in Figure 17 with b = 252 m (825 ft) and L* = 296 m (987 ft) .
It follows that for any rail length (L) larger than 2b, the largest axial force takes place in the L* region and is equal to N̂.. Therefore, in the above example, the largest axial compression force due to At = 50°C (90°F) will be Nt = 202 tonne (223 tons) whether the rail length is 800 m (2,624 ft) or 8,000 m (26,240 ft). It is essential to realize this when considering the possibility of track buckling and when assessing the need to include expansion joints in CWR. It also follows that the rail length, L, has to be smaller than the corresponding 2b to limit the largest compression force in a track rail for an anticipated temperature increase At .
It also should be noted that the axial movements caused by temperature variations are confined to the "breathing" regions. Thus, theIhher part of the^rail o^ length L* neither expands nor contracts.— In_the__above example with At = 50°C (90°F) , the rail ends will move by the same amount whether the rail length is 800 m (2,624 ft) or 8,000 m (26,240 ft).
36

A B
FIGURE 17 Axial force distribution in a track of length L (based on the simplifying assumption rQ = const). rQ = axial resistance force per unit length of railf Nt = net longitudinal compliance force (Kerr 1978).
free end rails\ a y n (z)
z
FIGURE 18 Free body diagram for the determination of the axial force in the "breathing" region (Kerr 1978).
37

The corresponding displacement of each rail end is derived, referring to Figure 17, as the product of the mean strain (r0b/2EA) in the end section and Length (b):
' r b2 2u = 2°_ = aATb = (EAaAT) (7)° 2EA 2 2r EA 'o
where A is the area of both rails. Thus, for a temperature increase AT =25°C (45°F), the end displacement is 1.8 cm (0.7 in.). The "effective" strain may be obtained from this result.
The above example is one of several cases that can be cited which suggest that Eq. 4 is insufficient to describe realistic track conditions ( £33 = 0) and must be made more general. Other factors enter in also.Another of these is a change in the neutral temperature (i.e., that temperature at which O33 = 0) . In yet another, the constant passage of trains may cause rail to "bunch" at the bottom of a hill or on a curve because of shifting of the ballast. Again, it is no longer correct to assume O33 = 0. Instead, the axial strain has a fixed value £33 and Eq. 3a and 3bgeneralize to the form:
a , = -E(aAT - e° ) (8a)
(8b)
(9)
An additional complicating factor is the possible spatial variation in the above parameters throughout the cross section of the rail due to local plastic deformation of the rail material during fabrication or usage. Under such conditions, the definitions of 0 and £ must be applied to local, microscopic elements of material. For example, it is often convenient to think of 1, the element of length in Eq. lc, as the interatomic distance.Eq. 4 should then be replaced by the integral:
Nt = -fdx Jdy a3 3 (x,y) , (10)in which x and y now represent dimensions across the rail, and where the integration is performed over the cross-section of the rail. When the rail is laid, Nt = 0. However, will, in general, not vanish, exceptin the average sense implied by Eq. 10, due to the presence of internal stresses induced during fabrication. Locally, ^33 may have values equal to_the yield stress or higher. The analysis could proceed by applying a proper generalization of Eq. la, including nonlinear and pfasticity effects, on a point by point basis throughout the cross-section of the rail.However, this generalization is quite complex and goes beyond the scope of the present report.
and
hi ■ e22 - Ct4r<1+'’> X 3 •Eq. 4 becomes:
N = EAaAT - EA£° . t 33
38

It is evident from the foregoing analysis that a variety of strategies could be devised for measuring the absolute value of the longitudinal force in rails. The analyses show that the absolute force Nt is a function of three parameters (i.e., Nt = Nt[u,£,T]), twq of which are independent parameters. The strategy of choice should then reflect how well certain boundary conditions are met. For example, if the assumption of perfect clamping ( £ 3 3 = 0) were to apply, the rail force could be determined from a temperature measurement alone using Eqs. 3a and 4. Equivalently, a measure of transverse strain (or stress) could be used in conjunction with Eqs. 3b and 4. This, of course, is a highly unrealistic condition. If the boundary condition £ 3 3 j4 0, then consideration should be focused on Eqs. 8 and 9. Determination of the force then requires the addition of a second independent measure of C3 3 . If the perfect clamp boundary conditions are assumed when interpreting data obtained in this more realistic situation, an error of magnitude, AEE32 would occur. In the more general case in which stress and strain variations occur throughout the rail cross-section, recourse must be made to Eq. 10. In this case, additional information should be obtained from measurement of stress variations in the rail cross-section. Methods that have been used to measure various of the rail properties (conditions of stress, strain, and temperature) are summarized in the following chapter. It is evident that these techniques may measure the desired properties directly, or that a quantity is measured from which various ones can be deduced.
There is a major difficulty in selecting any strategy for use at this time, however. As noted above, the temperature is a key parameter in determining the absolute force. Since the temperature of interest is the difference between the ambient temperature (which can be readily measured) and the stress-free laying temperature T q , a documentary history of Tg is essential. Since that documentary history is said not to exist in any systematic way for present rail structures, it is evidently not possible at this time to select a strategy based on current technology that will provide an unambiguous measure of the absolute force in rails. It may, of course, be possible for railroad officials to compile an average T q from whatever records and experience are available, and then use this number for subsequent considerations. The seriousness of errors introduced by this method cannot, of course, be estimated by the committee at this time.
Lacking sufficient data to provide a basis for accurate T q
determination, it is to be noted that changes in the axial force can be measured with existing technology. Ignoring any changes due to plastic deformation of the rail for the moment, the difference in the axial force at two temperatures, T^ and T2 , is
SNt = Nt^-N^T!) = EAtafTz-T!)-
(e303[T2'a2]-e33[Tl'al]>] (H>formed from Eq. 9 at two different conditions assuming that it is possible to approximate thermally induced changes as a uniform deformation, described by a and e in Eqs. 8 and 9, superimposed on the complex stress-strain state of the rail. If this is correct then changes in the axial strain £ 3 3 can be determined by a variety of techniques discussed in the next chapter.
39

These may include measures of changes in rail length, interatomic spacings, or othfcr indirect phenomena from which the properties can be deduced. It should be noted that in using this equation it is assumed that the measured changes are uniform throughout the rail cross-section. Eq. 11 suggests that, in lieu of an absolute force measurement, a proof-test concept may be employed. Measurement of temperature and strain over a range of ambient temperatures at various times would establish a range within which i,t is known that buckling does not occur. From this basis, it may be possible that useful predictions of temperatures at which buckling is likely could be made. Suppose that measurements of L and T are made several times at a point on a rail section. Eq. 11 can then be used to determine the change in axial stress. If little or no change is observed when the rail returns to the same temperature after a period of use, it can be assumed, that no major compressive stresses have built up. Since the rail has withstood usage in this condition, there should be no cause for concern. However, if a positive axial force change is observed, then compressive stresses have built up, perhaps due to shifting of the ballast, and further action should be considered. Although the absolute force level has not been determined, areas of potential trouble can be identified.
It should finally be noted that, although changes in axial forces can be determined from measurements of T and L, changes in the neutral temperature due to shifts in ballast cannot be so determined. This is because it is impossible to distinguish changes in rail length which would disappear if the driving temperature changes were removed from changes that would remain because of ballast resistance. These two cases are physically distinguished by the type of restoring force exerted by the ballast. In the former case, the ballast deforms elastically, whereas, in the latter case, it does not because of hysteresis effects. It is not possible to differentiate these two modes from measurements made on the rail which is always deforming elastically, but subject to the constraint of the ballast. In order to estimate changes in neutral temperature, it would be necessary to distinguish these two modes so that the temperature corresponding to zero axial force could be determined.
REFERENCES
Kerr, A.D., "Thermal buckling of straight tracks: fundamentals,analyses and preventative measures," Proc. American Railway Engineering Association, 80(1978):16-47.
Nye, J. , Physical Properties of Crystals, Oxford University Press, England, 1957.
40

Chapter 5
REVIEW OF NONDESTRUCTIVE MEASUREMENT TECHNIQUES
The purpose of this chapter is to provide a review of nondestructive measurement techniques that have been used in an effort to determine the longitudinal force in rails. The chapter is subdivided into three sections. In the first subdivision, techniques are reviewed that provide direct measurement of temperature and strain (i.e., those properties that haves been used in. the previous chapter to characterize force in rails) . The second subdivision describes techniques that have been used which provide
' indirect measures of the desired properties (i.e., the properties must be deduced from the measurements through a formal, interpretive theoretical base) . As will be noted, theoretical bases needed for the required interpretations are not complete at this time. Finally, the third subsection lists a number of research efforts that are currently in progress whose results may bear on the rail problem. This section is included for completeness. It is to be noted that the techniques reviewed in the first and second subsections have all had some degree of test and evaluation in a rail environment and, thus, have had some degree of engineering evaluation. The extent to which this evaluation has been carried out can best be judged from the descriptions provided. The information in this regard has been provided by developers of the techniques and is presented without committee comment.
DIRECT MEASUREMENTS
Temperature
As noted in the previous chapter, the measurement of the rail temperature is an important contribution to any strategy for the measurement of force in rails. Temperature measuring techniques are well known; a few are summarized below which appear to be appropriate for rail applications.
Infrared RadiometerA number of infrared radiometers are available. For the temperature
range of interest, 0 to 100°C, (32 to 212°F), the most effective are the cryogenically cooled (liquid nitrogen) pointing, line, or area scanning systems. The cryogenically cooled detectors have the shortest response time and are used for high-speed scanning. NCncryogenically cooled detectors (i.e., bolometers) are available to cover the desired temperature range, but
41

since their response time is relatively slow, they are more effective as pointing or single-spot temperature recorders. Both types of radiometers contain infrared optics and filters that can be focused to detect radiation from a single spot (e.g., 1 mm or 0.04 in.). Most infrared radiometers have recording sensitivities of better than 1°C ( 1.8°F) .
The surface emissivity of the object being measured introduces a variable that is difficult to quantify; consequently, obtaining accurate measurements from surfaces that have high reflectivity or variable reflectivity is quite difficult. Emissivity values range from 0 to 1 with 0 indicating a totally reflective surface and 1, a "black body." Emissivity compensation or normalization techniques may be employed, but without adequate compensation for the emissivity variations caused by such factors as rust, grease, dirt, and color variations, an accurate measurement cannot be made.
Evaluation of infrared radiometers currently is under way (Office of Research and Experiments 1980a) . Test results show close correlation between radiometric and thermocouple readings over the desired temperature range. The experiments also have shown that the sides of the rail have little emissivity variations and approximate those of a "black body."
Heat Balance Method
The heat balance measuring probe relies on transfer of heat by conduction and convection across an air gap separating the probe from the test surface. The probes are made up of a network of "hot" and "cold" thermocouples.. The "hot" thermocouples are embedded in a mica window and are located in close proximity to the surface being measured. Corresponding "cold" thermocouples are located more or less remote from the active thermopile and are designed to measure parameters such as housing temperature and ambient temperature. The "hot" thermocouple network is placed at a fixed distance (e.g., 1 to 7 mm or 0.04 to 0.28 in.) from the surface being measured. Surface temperature variations change the output of the sensing thermocouple and provide an output that can be calibrated in temperature. Typical response time for a temperature measurement by the heat balance method is 10 seconds.
One main advantage of this heat balance method is that it is immune to variations in emissivity. Wind and drafts also have a minimal effect. However, the sensor is in close proximity to the rail head, and only the bright or running surface of the rail is being measured despite the fact that there can be a considerable variation (e.g., 11°C or 20°F) throughout the cross section of the rail (Office of Research and Experiments 1980a) .
Contact Devices
The effective temperature of the rail can be measured using a variety of bimetallic thermocouple thermistor or semiconductor devices that are commercially available. These systems are in common use and are effective for monitoring and recording temperature at a fixed location. These devices are described in depth in available literature; therefore, no further details are provided here. !
42

StrainA number of techniques have been developed which are suitable for
the direct measure of strain as described in Chapter 4. These are reviewed below.
Strain Gauge Techniques*
The use of strain gauges to measure strain in structural members is common in industry. Both mechanical and electrical resistance strain gauges are employed to measure strain or change in dimension per-unit dimension (e.g., length) of the member under load. For loadings that induce strains in rail (e.g., creep and mechanical forces), strain gauges may be used directly. For loadings that do not induce strains (e.g.,temperature-induced stresses in constrained CWR), the strain gauge must be installed when the rail is in a strain-free (or force-free) condition and the subsequent measurements must be compared to a nonconstrained "standard." Types of strain gauges that currently are being used are discussed below.
Mechanical Strain Gauge. The Berry strain gauge is a mechanical caliper designed to measure a change in displacement between two fixed indentations. The gauge consists of a bar of a fixed length with feeler posts located on either end. Changes in length are measured by placing the feeler post9 in two indentations and reading the change on a dial micrometer. In rail applications, two indentations, 25 to 50 cm (10 to 20 in.) apart, depending on the gauge size, are punched in the neutral axis (web) of the rail. At a stress-free temperature, indentations are machined into an in-track rail and into a stress-free "standard." By comparing the displacement in the "standard" with displacement in the rail constrained in the track, a net strain can be established and the force in the rail can be calculated. The gauge has ah accuracy of approximately 5 ym (0.002 in.)(U.S. Department of Transportation 1980).
Electrical Resistance Strain Gauge. The advent of the electrical resistance strain gauge increased the versatility and simplified the technique for measuring strain. This type of gauge is small and is Usually bonded or welded to the surface of the member under study. The displacement caused by strain changes the electrical resistivity of the gauge and the resistance values can be calibrated in strain. A wide variety of gauges is available and units are designed for single or multiple axis response. For rail applications,)j thd‘ electrical resistance gauge is attached in a neutral axis of the rail to provide either continuous or periodic measurements.
These gauges are quite practical for measuring mechanically induced strain but are essentially limited to the measurement of a surface strain.To measure thermally induced strains in constrained CWR, the gauges must be initially installed with the rail when it is in a neutral temperature condition and the measurement must be compared with a secondary strain-free "standard." The "standard" can be a short segment of rail or another steel member that has the same thermal expansion properties.
♦Strain gauges that are mounted on a surface measure essentially surface, and not volumetric, responses.
43

Optical-Mechanical Gauge. Longitudinal strains in the rail produce a complementary (Poisson's ratio) lateral or transverse strain (see Eqs. 2a, b, c and others) . The extent of,lateral,strain may be obtained by measuring the lateral displacement using precise optical comparators. An optical-mechanical comparator has been developed that can be used to measure the transverse deformation in the rail (Ebering 1971). The equipment consists of two micrometer adjustable microscopes mounted in Invar holders. Fiducial (reference) markers are permanently fixed at opposite points on the upper part of the base of the rail. The optical-mechanical comparator is attached to the rail head, and the microscopes are adjusted to read the spacing between the fiducial markers.
Penetrating RadiationBragg Diffraction of Penetrating Radiation. Penetrating radiation
has been pursued as a tool in attempts to measure force in rails. When a beam passes through an atomic lattice, scattering takes place at each of the atomic sites. At certain angles of illumination and detection, constructive interference of the scattered waves occurs, and a peak in the reflected signal can be observed experimentally. Figure 19 shows that this condition occurs when Bragg'S law, given by
2dsin0 = nX, (12)
is fulfilled, d is the spacing between atomic planes, X is the wave length of the illuminating radiation, and n is an integer defining the order of the interference. This condition applies to both x-ray and neutron diffraction.
It is important to note that penetrating radiation measures a length that can be related to a strain rather than a stress. This is somewhat discouraging given the desire to measure the force in clamped rails.However, since x-ray measurements can be interpreted directly in terms of material strain, a shift in the neutral temperature that has occurred because of the development of a strain £33 can, in principle, be directly measured.
Perhaps the best established nondestructive test for "stress detection" is based on the utilization of x-rays. Here, Eq. 12 provides the relationship between the angle for Bragg diffraction and the distance between lattice planes. If the lattice spacing d = 1Q is known for the unstressed material, then the strain is equal to the ratio (1-10 )/10 where 1 is the measured lattice spacing under load.
The major problem in the utilization of conventional x-ray sources arises when it is recognized that the x-rays measure only the deformation in a very-near-surface layer of thickness (on the order of 0.025 mm [10“ 3 in.]). There is no guarantee that the strain in this layer is equal to the average strain over the entire cross section. Surface deformation produced during formation of the rail or during use can lead to major errors. Other sources of errors (e.g., textural and microstructural variations) have been well documented (Ruud and Farmer 1979). It should be noted, however, that x-rays can provide an accurate measure of the change in strain at the rail surface. Thus, if the laying temperature were known, as well as the surface strain at that time, satisfactory predictions of the force-free temperature might be realized by replacing £3 3 , as discussed in
44

FIGURE 19 Conditions for Bragg diffraction from parallel atomic planes separated by a distance d. Maximum intensity occurs when 2dsin6 *= nX, with \ the wavelength of the illuminating energy.
45

0 sthe previous chapter, with £3 3 ^) - e 3 3 (T0), where the superscript S refers to a surface measurement and T and are the ambient and initial temperatures, respectively. It would be necessary, however, that £3 3 (1 ) and e J3 (Tq) be measured at identical locations, implying an indexing procedure.
The fact that only a near-surface layer is interrogated might be considered somewhat surprising in light of the well-known fact that x-rays propagate through metallic objects such as railroad rails. From a strictly rigorous point of view, one should state that the technique measures a weighted average of the material strain with the weighting heavily favoring the near-surface values due to the attenuation of the beam as it propagates into the material and the relative geometrical positions of the source and detector. This suggests that it might be possible to measure internal strain if a different configuration were chosen for the source or detector. In fact, it recently has been shown that this constraint can be overcome by the use of a transmission configuration (Kuriyama et al. 1979). In this technique,'the lattice constants at a local region, internal to the part, are estimated from the energies at which maximum transmission occurs between sources and detectors placed at fixed angles with respect to one another.The beams are tightly collimated so that they overlap and, hence, measure strain in a local region of the material. In work using a 50 KeV source and a solid state detector, strains of 5 x 10“ 3 were detected reproducibly in the laboratory (Kuriyama et al. 1979).
This technique is quite intriguing since it offers the possibility of measuring absolute strains in the interior of the material. In principle, with sufficient power, one might average over the entire rail cross-section, thus avoiding one of the objections to x-ray strain measurement techniques. Combined with a temperature measurement, an absolute measure of force could be obtained. However, questions concerning the practicality and portability of the requireci instrumentation remain.
Neutron Diffraction. A related technique makes use of the diffraction of neutrons. The principles of Bragg diffraction again are involved and a measure of the distortion of the lattice spacing is obtained. However, the operational characteristics of a practical device are quite different because of the weaker attenuation of neutrons as they pass through rail steel. Whereas1.5 A x-rays are attenuated by 50 percent in 3 ym, 1.08 A neutrons will pass through 0.7 cm or 7000 ym with the same amplitude decrease. Thus, an important advantage of the neutron technique is the ability to sample a much greater volume of material. Average strains over volumes on the order of 1 cm3 have been obtained in the laboratory and larger volumes, probably can be inspected. A practical disadvantage, however, is the lack of portability of high-intensity sources. With typical technology, it is usual that a high-flux reactor and an overnight measurement are required to obtain a measurement at a single point. Completely modern gear probably would reduce this time to about one hour, again using a high-flux reactor as a source. To achieve field operation, a portable source would have to be used which wouldhave a flux 103 times weaker, and measurement times would be prohibitive.Thus, it appears that neutron measurements may play an important role in laboratory NDE problems, but they are probably not appropriate for field use for railway problems. "
46

INDIRECT MEASUREMENTSin addition to the methods and devices described in the first
subsection of this chapter, which provide a direct measure of properties (temperature, strain) needed to determine the force in rails, a number of Other methods that provide results indirectly related to these properties have also been used. As in the first subsection, these techniques may fotm part of a strategy selected for the.measurement of force, but should be viewed in connection with the analyses given in Chapter 4.
As will become apparent, it is hot clear in all cases that follow that it is known which properties are measured. Sufficient work bn a fundamental level does not yet exist which will enable this question to be completely and uniquely sorted out. Because of this difficulty, the categorization in this section is by technique rather than by property.
Vibrating Wire
The British Rail (BR) rail force transducer (RAFT) is a vibrating wire strain gauge in which the natural frequency of vibration of the taut wires in the gauge is related to tension. ; The BR transducer consists of a steel annulus, approximately 25 mm (1 in.) in diameter^ containing two fixed wires (Office of Research and Experiments 1980a) . The annulus is inserted intb a hole drilled in the neutral axis of the rail. When changes occur in longitudinal displacement of the mil, the shape of the hoie changes slightly. This results in a change in the tension of the fixed wires and, consequently, the resonant frequency of the wire. The resonant frequency is monitored by an electromagnetic Sensor. By calibrating the vibrating frequency as a function of changes in shape of the annulus* a change in resonant frequency can be related to force in the rail.
This technique does not require the use of ah external standard; It does, however, require that a zero datum reading Be taken.when the rail is in a stress-free state. It also requires that a hole be drilled in the WSb of the tail and an on-site calibration be performed using a special web loading device.
Rail Vibration
Since the speed of a transverse wave in a string is related to the tension in the string, it might be expected that a measurement of the vibration spectrum of a rail could be made to yield the force in the rail.
In pursuing this idea, the effect on the Vibrational response of the rail when struck with a lateral impulse has been studied. The modes of vibration of the rail are found to be dependent on the flexural characteristics of the rail together with the applied axial force in the rail. As the axial forces vary, the response characteristics of the rail, both frequency and amplitude, change. This phenomenon, although related to the sensitivity of the rail natural frequency to axial force, is related more directly to the distribution of the vibrational response, both amplitude and frequency, under an impulse or white noise (random vibration) excitation. Preliminary work (McErvan and Born 1980) appears to confirm this phenomenon.
47

further, the lower frequencies (e.g., 100 Hz) are strongly dependent on the properties of the fasteners, ties, ballast, and subgrade. The higher frequencies (500 to 20,000 Hz) are dependent on the flexure of the track and, consequentlyi may be useful for evaluating longitudinal force (Department of Transportation 1980, Office of Research and Experiments 1980b, Lusignen et al. 1980, Samavedam et al. 1980). Since frequency and vibration modes change when axial loads are applied, it should be possible to relate the frequency spectra and/or vibration mode to the longitudinal force in the rail.
Recent tests performed by the Association of American Railroads (McErvan and Born 1980) demonstrate the potential for application of the rail test vibration method. Figure 20 is a recording of a typical acoustic re^onse for rail vibrations under two different applied loads. A shift in the frequency domain spectrum and the amplitude of that spectrum is clearly evident. Although rail vibration measurement techniques currently are only in the "proof in principle" phase, they offer the potential for contributing to the measurement of force in the rail and for serving as a noncontact test that could be adapted to a moving recording car. The neutral temperature differential would still have to be monitored, however.
Ultrasonic Techniques
Acousto-Elastic
Ultrasonic techniques, particularly acousto-elastic effects, also have received considerable attention. Here the basic phenomenon iis the stress dependence of the ultrasonic velocity, which is a consequence of the anharihonicity in the interatomic forces as described by the third order elastic constants. Thus, when most solids are compressed, the speed of ultrasound increases due to an increase in the interatomic forces with the amount of change being proportional to the applied stress. The magnitude of the proportionality constant depends critically on the relative orientations of the stress, propagation direction, and wave polarizations. Egle and Bray (1976) present the following values for relative changes in ultrasonic wave speed with strain for uniaxial stress along the rail axis at constant temperatures
dV /V33 33 = - 2.4 + 7.5 percent, (13)d£33
dV31/VU dV /V32' 32 = -0.3 + 29 percent, (14)ae33 de 33
dV /V32 32 = 1.5 + 2.3 percent, (15)d£33 de33
dV12/V?2de33
^V2 1 ^ V 21 = ~ 0 (magnituae < 0 .1 ), de.
(16)'33
48

FIGURE 20 Typical acoustic response from impact excitation of 136 RE test rail section (McErvan and Born 1980}.
49

I
anddV /V IT 11
dc33dv22/V°2dc33
0.3 + 24 percent, (17)
where v^j is the velocity of a wave propagating along the i-axis and polarized along the j-axis.
The above discussion applies to the case in which temperature is held constant. Since, in this case, stress and strain are proportional, the words "strain" and "stress" can be interchanged with the proper tensbt interpretation. However, for vairying temperature, this proportionality no longer holds (see Eq. la of Chapter 4), and the relative roles of stress and strain are an area of active research.
As indicated in Figure 21^ the relationship between the measurement and stress or strain is not as simple with the ultrasonic technique as it is with the x-ray technique. Figure 21a shows a typical interatomic potential and Figure 21b, the derivative interatomic force. The load-free equilibrium position is the point at which F = 0. If a load is applied, the material will deform to a new equilibrium point at which the interatomic force;just cancels that of the applied load. The material stiffness, given by the slope of the force curve, is greatest when the interatomic distance is decreased by compression and, hence, velocity tends to increase. Density changes also occur and affect the velocity, but they do not alter the qualitative conclusions given above.
This model shows that the! acousto-elastic technique directly measures neither stress nor strain but rather the curvature in the energy function at the bias point determined by the! load. It is not clear whether this can be related more simply to applied stress or strain. In constant temperature/stress measuring situations, this distinction is not too important; however, when temperature is introduced as an additional independent variable, more care must be taken (MacDonald 1979) .
A number of problems with the acousto-elastic technique have prevented its practical use. The fractional velocity shifts are very small, on the order of 10“ ̂or less, and very precise measurements are required. Furthermore, the effect can be masked easily by changes in composition, texture, or microstructure that produce competing velocity shifts. Measurement of the ultrasonic birefringence (i.e., the difference in velocities of two orthogonally polarized shear waves propagating in the same direction) can greatly reduce the dependence on composition and microstructure, and this approach does not distinguish texture from stress. Other measurements based on comparing various velocities have been proposed to suppress textural effects (MacDonald 1979). Other tests which bear on these observations as well as test methodologies are summarized below.
Experimental measurement of the velocity of longitudinal waves propagating down the axis of a test track has shown that daily changes in stress can be monitored ultrasonically. As with the x-ray technique, however, the ability to measure absolute stress on a rail of unknown history has not yet been demonstrated (Egle and Bray 1979). If the velocity at the time-of— rail laying,— the present—velocity-.— and the temperature change were known, an absolute force estimate might be possible.
50

t
FIGURE 21 Physical origin of ultrasonic velocity changes: (a) typicalinteratomic potential and (b) derivative interatomic force.
51

Experiments performed on thermally induced stress in CWR (Bray and Egle 1980) indicate that the acousto-elastic effect is greatest for longitudinal waves propagating in the direction of the applied stress. As indicated earlier, the speed changes are very small and parameters such as rolling direction, grain size, temperature, residual stress, and metallurgy affect the wave speed through the materials and can change the absolute measurement values. Related results are given in Egle (1980) and Ratcliffe (1969).
One approach used to normalize the nonstress-related parameters is the use of the shear wave birefringent technique (Benson 1968). This technique compares the velocities of horizontally and vertically polarized shear waves propagating through the same volume. Although effective in overcoming some intrinsic problems associated with the material, the concept probably is limited to point or fixed location measurements.
The equipment used to make the measurements consists of an ultrasonic pulse generator; one or two transducers for transmitting and receiving the ultrasonic energy; and appropriate amplifiers, time interval connectors, and displays. The transducers are coupled to the test part at a fixed position and the Ultrasonic wave propagates into the material (rail), travels a known distance, and is received, displayed and analyzed. The greatest sources for measurement error are associated with the transducer alignment, modes of wave propagation, mechanical configuration (i.e., dimensional changes), temperature, and liquid coupling media. The use of electromagnetic-acoustic transducers (EMAT's) (Moran et al. 1975) may overcome some sources for error.
Magnetic Techniques
A major class of techniques is based on the stress dependence of the magnetic response of ferromagnetic materials such as steel (Bozorth 1951, Chikazumi 1964). Figure 22 is a graphic representation of the magnetic energy of a uniformly magnetized single crystal of iron as a function of the orientation of the magnetic moment and illustrates the basic physics underlying this effect. The energy is minimum when the magnetic moment is aligned along one of the cube axes. In a polycrystal, each grain has a magnetic anisotropy energy similar to the one shown. The magnietic moment generally is not uniform within the grain; instead, the individual atomic magnetic dipoles interact to form uniformly magnetized domains in which all magnetic dipoles are aligned, separated by domain walls, at which the magnetic dipoles abruptly change directions over distances of a few hundred lattice spacings. Figure 23a illustrates a typical domain structure within a grain in the demagnetized condition, and Figure 23b gives greater detail of the behavior of the domain wall. Within each domain, the magnetic dipoles tend to lie along one of the easy directions of magnetization;(energy minima in Figure 22) which corresponds to one of the cube axes of the grain. The magnetic moment changes by either 90 or 180 degrees at the domain walls so that it can be aligned along a cube axis in each domain andachieve the minimum energy condition.
During magnetization, the domains change from this configuration to one in-which-all magnetization is aligned parallel to the applied field at saturation. This is accomplished by a series of changes that are illustrated for a polycrystal in Figure 24. When the crystal is demagnetized, there will be an equal number of domains in which the magnetic moment is aligned parallel to each of the three easy axes. This occurs
52

[1001
[001]
FIGURE 22 Three dimensional plot of magnetic- anisotropy energy of iron (Thompson 1980a).
53

(a)
(b)
FIGURE 23 Domain configuration of a ferromagnetic crystal: (a) domainsin demagnetized state and (b) details of magnetization change in transit ion region- indicated by dashed rectangle in (a) .
54

M
FIGURE 24 Stages in the magnetization of iron polycrystal; Jumps in magnetization during irreversible regime are shown in the inset.
55

because the axes are energetically equal and because an excess alignment of magnetic moments along any one direction would leave free magnetic dipoles that are energetically unfavored. As a magnetic field is applied, however, those easy axes more closely aligned with the field will be energetically preferred, and the magnetization will increase via a reversible motion of the domain walls separating preferred from unpreferred domains. This regime corresponds to the reversible domain wall motion shown in Figure 24; however, impurities and other defects can impede the free motion of the walls. Smooth wall motion then is replaced by a series of jumps in wall position as the applied field increases to the level at which enough energy is available to overcome the barrier imposed by the defect. The magnetization increases in a step-like fashion (inset in Figure 24) during this irreversible domain wall motion regime. At the erid of this process, the only domains that remain are those in which the magnetic moment is aligned along an easy axis as close as possible to the applied field. Magnetization concludes by the rotation of the magnetic moments away from the easy axes towards the applied field direction. This is the reversible rotation regime. At the conclusion! of this process, all magnetic moments are aligned parallel to the field and the magnetization has its full saturated value, Ms.Figure 25 shows the effect of an applied stress. Through the magnetoelastic effect, this modifies the orientational dependence of the magnetic anisotropy energy. In iron, this has the specific effect of, favoring magnetization alignment along those cube axes parallel to a tensile stress or perpendicular to a compressive stress. These energetic changes in turn modify the details of the domain configurations and thereby influence a number of measurable parameters.
A variety of measurement techniques have been developed based on , macroscopic parameters that have been observed to be stress sensitive.These include various features of magnetic hysteresis, (permeability, coercive force, remanent magnetization, etc.) , the magnetostrictive response of the material, and the Barkhausen and magneto-mechanical acoustic emission effects. Although the details of these techniques are different, they all exhibit a number of common attributes. In each case, there is a relatively large variation of the measured quantity with stress; in general, much greater changes occur than are found in the ultrasonic case. Unfortunately, there also is strong dependence of the measured quantities on texture, composition, microstructure, etc., since these also influence magnetic energies. In each case, it can be shown clearly that relative changes in stress in a particular part such as a rail can be measured with high precision. However, the absolute accuracy often is unsatisfactory for longitudinal force measurement in rails of unknown compositional history.It is also important to note that, as in the ultrasonics case, no unique functional relations exist which permit the desired properties to be extracted uniquely from the results of various test techniques.
CoercivityThere have been several research efforts aimed at utilizing magnetic
properties for the determination of rail- stresses-; These include both-------relative coercivity (Office of Research and Experiments 1980b), l'Hc, and differential relative coercivity (Jakubowicz 1980), EAhc. Relative coercivity is defined as the difference between the coercivity measured
56

FIGURE 25 Planar cuts of Energy surface with zero stress (solid line) arid a tensile stress of 200MN/m2 (29 ksi) alorig the (100) axis (broken line) (Thompson 1980a).
57

parallel and perpendicular to the applied longitudinal rail force, £hc =Hc| | - H^. Differential relative coercivity is defined as the difference between the coercivity measured parallel and perpendicular to the longitudinal rail force measured at load and at no load. Thus,
EAH = [Hc | [ (F) - Hc | | (0) ] - [HC]_(F) - 11^(0)] (18)where F is the force under load, 0 equals no load, Hc | | = parallel and HCJ_ = perpendicular.Although the differential relative coercivity, EAhc, tends to normalize the effects associated with residual stress and thus provide a stress-free measurement, this procedure would be difficult to apply under field conditions.
Relative Coercivity. A series of laboratory and field measurements have been made (Office of Research and Experiments 1980b) to evaluate this technique. Because of the practical difficulty of establishing the zero force condition and because the end use of the test method was to evaluate the in-situ track, a decision was reached to utilize the data from the relative coercivity measurements, EHC. Figure 26 shows the experimental results for three specimens of Bessemer rail steel (Office of Research and Experiments 1980b). The plots show the relationship between coercive field (Hc) and load but also illustrate that stress relieving of the rail is essential. Apparently, the residual stresses in the rail result in a shift in the Hc data that must be normalized before actual force can be determined. The Office of Research and Experiments (1980b) has reviewed the potential value of the magnetic property method and identified areas in need of further work before the method can be made fieldworthy.
Differential Relative Coercivity. A second research effort devoted to magnetic property measurements in rail has been conducted. These experiments focused on measurements using the differential relative coercivity of various railroad steels (Jakubowicz 1980). In this research, a section of rail was magnetically cycled to saturation and thehysteresis loops were plotted under load and no-load conditions. The coercive field increased linearly under compressive loading and decreased linearly under tensile loading. The differential relative coercivity,£AHc was plotted as a function of load, F. Figure 27 shows a plot of several different railroad steels. Subsequent tests showed some scatter at different positions along individual sections of rail, but these differences were attributed to local residual stress variations.
Barkhausen Technique
As discussed earlier, all ferromagnetic materials contain magnetic domains that are oriented according to the local state of magnetization surrounding each domain. If a magnetizing force is increased or decreased continuously, individual domains will shift abruptly or "jump." These "jumps" can be detected by measuring the current in a secondary field coil located within the magnetizing field. The "“jumps" produce a succession—of small, sharp peaks that, when appropriately amplified, can be observed as
r>8

B1 • As Received
B2 - Stress Relieved
FIGURE 26 Laboratory tests on the effect of residual stress (Office of Research and Experiments 1980b) .

XAH
1.060
FIGURE 27 , ZA'ilc versus stress force (F) in tonnes (Jakubowicz 1980) .
60

clicks or noised on a loudspeaker or can be recorded on an oscilloscope or other transient recorder. The amplitude of the Barkhausen signal is related to the state of compressive or tensile stress that exists in the magnetized area.
Laboratory experiments carried out on constrained and unconstrained rail (Perry and Barton 1980) indicate that the technique has the potential for providing rapid stress measurements. However, even with a constant force applied to the rail, the Barkhausen response can provide different measurement outputs at different rail locations. Careful preparation of the surface and orientation of the probe is required; consequently, the technique may be somewhat difficult to apply under field conditions.Another factor to consider is that the technique provides only a surface measurement with the depth of measurement estimated to be about 0.4 mm (0.015 in.) (Office of Research and Experiments 1980a).
Magnetomechanical-Acoustic EmissionThe magnetomechanical-acoustic emission (AE) phenomenon (Ono and
Shibata 1980) originates from displacement steps owing to the shift in magnetic domain structure which elastically distorts by way of magnetostriction. The shift in magnetic domain generates an elastic wave that penetrates to the surface of the structure where it is detected by a piezoelectric sensor and amplified. The frequency range of these AE signals is high (e.g., 100 to 2000 kHz) as compared to the "Barkhausen noise," which essentially is low (below 10 kHz). It is well known that microplastic deformation and substructure dislocations resulting from residual or applied stresses can produce acoustic emission; however, applying! a magnetic field (Rusanagi et al. 1979, Ono et al. 1981) to produce domain shifts offers a convenient means for generating the emissions. Research to date indicates that the amplitude and spectra of the AE energy released is a function of stresses and the strength of the applied magnetic field. Although analogous to Barkhausen, the approach is considered to provide a volumetric rather than a surface measurement since the depth of penetration is about (10 mm)0.25 in.
More recent work (unpublished paper on measurements by the AE method by K. Ono, Materials Department, University of California, Los Angeles, supported by the Association of American Railroads, Chicago, Illinois) documents the AE response for newly laid rail as a function of temperature at a field site in San Bernardino, California, Figure 28 shows a plot of the ratio of the amplitude at 175 and 375 kHz versus temperature. Although somewhat inconclusive because of the low signal-to-background noise ratio, these field results indicate potential success for the approach.
Magnetostrictive SensingThe magnetostrictive response of a material (i.e., its change in
length during magnetization) is known to be highly sensitive to the presence of stress within the material. For example, in Armco iron, a change from0.7 kg/cm^ (10 ksi) compressive stress to 0.7 kg/cm^ (10 ksSi) tensile stress will alter not only the magnitude but also the sign of the magnetostriction (Kuruzar and Cullity 1971). In the former case, the sample lengthens along the direction of magnetization whereas it shortens in the latter case. When an ultrasonic wave is excited in a ferromagnetic material
61

TEMPERATURE (t) F°
FIGURE 28 Ratio of amplitude response at 175 kHz/375 kHz versus temperature (unpublished data provided by Kanji Ono, Materials Department, University of California, Los Angeles supported by the Association of American Railroads, Chicago, Illinois).
62

by an electromagnetic-acoustic transducer (EMAT) , it has been shown that, at modest bias fields, the efficiency of transduction is directly determined by the material magnetostrictive constants (Thompson 1978). Thus, the amplitude of the wave generated by an EMAT is directly related to the material stress via the magnetostrictive constants responsible for the generation.
Laboratory experiments have demonstrated these results and the possibility of their application to the measurement of longitudinal force in rails has been suggested (Thompson 1980a). The experiments reported to date have been based on varying the magnetic field at a fixed measurement location and deducing the material stress from various features of the plot of wave amplitude versus stress. Large variations in wave amplitude have been observed, and positive correlations with x-ray measurements have been reported. No surface preparation is required. The technique could be applied from a moving vehicle, but motion would have to be sufficiently slow to allow the bias to be cycled while the probe movement was small. The measurement is sensitive to material microstructure as well as to stress in a fashion similar to that of other magnetic techniques. The region of material interrogated corresponds to the material directly underneath the transducer and extending into the part to a distance equal to the electromagnetic skin depth (typically a few thousanths of an inch).Summary of Techniques
The various techniques that have been discussed in this chapter are summarized in Table 3. In this table, the techniques are listed in the first column. The second column contains summaries of the direct or indirect nature of the measurement (i.e., the techniques either yield a strain quantity directly or the desired information must be deduced from a measurement through a formal interpretive structure) . New information is contained in the remaining entries in the table. These columns list various engineering requirements for the techniques that were given in the introduction together with the committee's estimates of how well the various techniques can be expected to fulfill the requirements. The numbers above the column heads across the table refer to this requirement listing. Those requirements considered by the industrial advisory group as primary are indicated by an asterisk in the key at the bottom of the table.
OTHER TECHNIQUES BEING EXPLOREDA number of research programs that bear on the measurement of
residual stress are under way but have not yet been evaluated in the context of the rail force measurement problem. The techniques being investigated are described briefly below.Laser Speckle Methods
The coherent properties of light can be used to measure surfacestrains of material using a variety of techniques generically described aslaser speckle techniques (Hung 1978, Hung and Durelli 1979). In all of
63

TABLE 3 Summary of Rail Force Measurement Techniques
ON•p-
Reference to . System Requirements ffrtvn AAR) (see Lev) 1.2 3,4 5 5 6(a ) 6 (b ) 7 8 9 10
TechniqueD ire c t o r In d ir e c t F ie ld a b le
Nonde- s t r u c t iv e
Requires Lab C a lib ra t io n
Requires F ie ld C a lib ra t io n
S e n s it iv e to R a il S tru c tu re
S e n s it iv e to R a ilMi c ro s tru c tu re
S urfaceP re p a ra tio nReauired
I n i t i a lMeasurementReouired
Fixed o r P orta b le
ContinuousMeasurement
SeparateReferenceStandardReauired
Measures Volume o r Surface S tra in
Mechanical Gau ge (B e rry ) D ire c t Yes Yes Yes No No No Yes No P o rt. No Yes S
E le c tr ic a l S tr l in Gauge D ire c t Yes Yes Yes No No No ■Yes No F ixed No Yes S
O p tica l Mechanical Di re c t Yes Yes No No No No Yes No P o rt. No No S
X-Ray D i f f r a c t on D ire c t Yes Yes No No No - No Yes No P o rt. No No S
Keutron D i f f r a c tio n D ire c t No Yes No No No No No No F ixed No No V
V ib ra tin g H ire D ire c t Yes No Yes Yes No No Yes No F ixed No No V
R a il V ib ra tio n D ire c t Yes Yes Yes No Yes Yes No U P o rt. Yes No V
A co u s to -E la s ti In d ir e c t Yes Yes Yes No No Yes I No P o rt. I No V
Magnetic Coerc on In d ir e c t Yes Yes Yes No No Yes No No P o rt. No No V
Barthausen In d ir e c t Yes Yes Yes No No Yes Yes No P o rt. I No s
Magnetomechani A co u s tic Eaiss
a lon
In d ir e c t Yes Yes Yes No No Yes No U P o rt. No(?) No V
EMM S tress Me isurement In d ir e c t Yes Yes Yes No No Yes No U P o rt. Yes(?) No S,v
KEY TO REQUIREMENTS (see page one o f r e p o r t ) :T I rugged; Z. | easy to use; 3. n o n d e s tru c tiv e ; 4 . no d is tu rb a n ce to t r a c k * ; 5 . no c a l ib r a t io n needed;6. (a ) dependent on s i r e , wear, e t c . * , (b ) dependent on m a te r ia l m ic ro s tru c tu re * ; 7. no su rfa ce p re p a ra tio n needed*; 8 . measures abso lu te fo rc e * ; 9 . no permanent attachm ent re q u ire d * ; 1 0 .' pe rm its continuous measurement.
•P rim ary requirem ent determ ined by in d u s try a d v iso ry group.
U - unknown I « s u b je c t to in te r p re ta t io n
these, the optical interference patterns of laser, or other coherent source of light, are compared before and after deformation, and quantitative predictions of the deformation are deduced from this comparison^ The application to rail problems appears quite difficult, however, because of the long times over which the deformations occur and the need to accurately register the speckle patterns before and after deformation. Although quite useful for laboratory situations, the field application of this technique to the rail problem does not appear promising.Acousto-Elastic Mapping
The acousto-elastic effect was described, and its application to rail force measurements was reviewed earlier. Recent research in this area (Kino et al. 1980) has demonstrated a number of new concepts and measurement techniques that have extended understanding. Included are measurements of two dimensional stress fields, J integral, and stress intensity factors of cracks. Although this research is very fruitful, it is not obvious at this time that the results will lead to an improved solution to the rail problem.Temperature Dependence of Ultrasonic Velocity
One approach to overcoming the competing effects of microstructure and texture has been to use the temperature derivative of the ultrasonic velocity rather than the velocity itself as a stress measure (Ippolito and Salama 1977) . It has been shown experimentally that, for aluminum, the scatter in this derivative is much less influenced by material variations than the velocity itself. Data presently being obtained on steel alloys are also promising. The temperature dependence of the velocity could be measured either during the day, taking advantage of solar heating, or by directly heating the rail resistively.Couplant-Free Electromagnetic-Acoustic Tranducers
A potential advancement in ultrasonic techniques is offered by the availability of couplant-free EMATs. These devices represent an alternate means for exciting and detecting ultrasonic waves and could replace fluid-coupled piezoelectric transducers in an acousto-elastic stress measuring system.
Three primary characteristics of EMATs make them prime candidates for improving the precision of stress measurement systems. First, they require no couplant and may be operated easily from a moving vehicle. The development of such a capability for flaw detection in rails is presently in progress (Maberi et al. 1980). Second, the surface preparation required to operate with these devices is much less, or nonexistent, compared to that required with piezoelectric probes. Third, phase errors due to uncontrolled couplant thickness or properties are avoided making it easier to obtain more reproducible data. Velocity measurement precisions of one part in 105 have been demonstrated and used to map stresses in aluminum bars (Moran et al. 1975).
The use of EMATs in an acousto-elastic system implies two primary differences with respect to conventional probes. The first relates to sensitivity. Here the EMATs are at a disadvantage since a single probe may have a conversion loss of 40 or 50 dB in converting electrical to mechanical
65 ~

energy. In practice, this usually is overcome by narrow-band operation (to reduce receiver noise), high input powers (the breakdown constraints of an EMAT are less severe than for a piezoelectric probe), or signal averaging (again to reduce receiver noise). The latter is not practical if measurement is to be made from a moving vehicle but can easily overcome 30 dB or more of loss in a stationary measurement.
The second difference relates to radiation patterns. Both EMATs and piezoelectric probes excite waves by producing a stress pattern on the surface of the material. Once a wave is launched by this pattern, the principles of diffraction govern its subsequent propagation, and there is no difference between the two techniques. However, the specific stress patterns developed at the surface can differ. A piezoelectric probe, coupled through a liquid or grease couplant, generally impresses a normal stress on the surface of the part. This is spatially uniform for the case of normal wave generation or periodic for the case of angle beam or Rayleigh wave generation. On the other hand, an EMAT can produce either normal or shear stresses whose spatial variations can be readily controlled in transducer design. General details of the implications' that this has on operational characteristics may be found in the literature (Frost 1979 and Thompson 1980b and in press).
For the case of rail force measurement, an important advantage of this flexibility in selecting the radiation pattern is the ability to excite modes that would be quite difficult to excite by other techniques. For example, a true cross-sectional average of the ultrasonic velocity on the rail could be obtained by going to sufficiently low frequency (10 kHz) and exciting ah extensional wave propagating along the axis. This wave, analogous to the waves that travel along a rod when it is excited at the end, have velocities that are independent of the cross-section at sufficiently low frequency. Hence, they should provide a true measure of the average properties over the cross-section (as required by Eq. 6). Such a measurement offers the practical advantage of a true volume average that could be automated; however, it suffers from the sensitivity to composition, texture, and microstructure that plague other ultrasonic techniques.
A second way in which the excitement of new modes could enhance the capabilities of ultrasonic tests is through the excitation of horizontally polarized shear waves. Such waves, in which motion is parallel to the material surface, cannot be excited by normal fluid coupled probes .but they can be excited by EMATs. Rirthermore, these waves can be used to implement some newly conceived techniques to separate texture, compositional, and microstructural changes from stress effects (Thompson, in press).
REFERENCESBenson, R.W., Development of Nondestructive Methods for Determining
Residual Stress and Fatigue Damage in Metals. Report NASA-CR-61584, National Technical Information Service, Springfield, Virginia, 1968.
Bozorth, R.M., Ferromagnetism, D. Van Nostrand Co., Inc., Princeton, ------- New Jersey, 1951.____
66

Bray, D.E., and Egle, D.M., "Field tests on the use of ultrasonicwave velocity to detect longitudinal stress variations in railroad steel," in Nondestructive Techniques for Measuring the Longitudinal Force in Rails, Proceedings of Joint Government-Industry Conference, pp. 13-18, National Technical Information Service, Springfield, Virginia, 1980.
Chikazumi, S., Physics of Magnetism, John Wiley and Sons, New York1964.
Ebering, R., "Mechaisch-optische Setzdehungsmesser sum Bestimmenvon Lang Skraften im Inckenlosen Gleis." Deutsche Eisenbahntechnick, September 1971. (System description in Office of Research and Experiments, Utrecht Report No. D-150/RP-1, Utrecht, The Netherlands.!
Egle, D.M., and Bray, D.E., "Measurements of acoustoelastic and third- order elastic constants for rail steel," J. Acoust. Soc. Amer.60(1976):741.
Egle, D.M., and Bray, D.E., "Application of the acoustoelastic erfect to rail stress measurement," Mat. Eval. 37(1979):41.
Egle, D.M., Using the Acoustoelastic Effect to Measure Stress inRails, Report CA-UCRL-52914, Lawrence Livermore Laboratory,University of California, Livermore, California, 1980. (Available from the National Technical Information Service, Springfield,Virginia.)
Frost, H.M., "Electromagnetic-ultrasond transducers: principles, practice, andapplications," Physical Acoustics, vol. 14, edited by W.P. Mason and R.N. Thurston, Academic Press, New York, 1979.
Hung, Y.Y., "Displacement and strain measurement," in Speckle Metrology, p. 51, Academic Press, 1978.
Hung, Y.Y., and Durelli, A.J., "Simultaneous measurement of three displacement derivatives using a multiple image-shearing interferometric camera," Journal of Strain Analysis 19(1979);81.
Ippolito, R.M., and Salama, K., "Evaluation of residual stress by an ultrasonic method." Proceedings of the 11th Symposium on Nondestructive Evaluation, p. 62, Southwest Research Institute,San Antonio, Texas, 1977.
Jakubowicz, J., PKP Experience with the Use of a Magnetic Methodfor the Measurement of Longitudinal Forces in Rails, Report D-150/RP-1, Office of Research and Experiments, Utrecht,The Netherlands, 1980.
67

Kino, G.S. et al., "Acoustic measurements of stress fields andmicrostructure," J. Nondestructive Evaluation, 1(1980):67.
Kuriyama, O.M., Boettinger, W.J. , and Burdette, H.E., "X-ray residuaL stress evaluation by an energy dispersive system," Proceedings of a Symposium on Accuracy in Powder Diffraction, NBS Special Publication 567, p. 479, National Bureau of Standards, Gaithersburg, Maryland, 1979.
Kuruzar, M.E. and Cullity, B.D., "The magnetostriction of iron under tensile and compressive stresses," International Journal of Magnetism,1(1971):323.
Kusanagi, H., Kimura, H., and Sasaki, H. , "Stress effects on the magnitude of acoustic emission during magnetization of ferromagneticmaterials,'1 J. Appl. Phys., 50(1979) :2985.
Lusignea, R., Prahl, F., and Maser, K. , "The effects of axial load onthe flexural dynamic response of a rail," Nondestructive Techniques for Measuring the Longitudinal Force in Rail, Proceedings of Joint Government-Industry Conference, pp. 88-110, National Technical Information Service, Springfield, Virginia, 1980.
Maberi, H., MacLauchlan, D., and Alers, G.A., Application of EMATs in in-place inspection of railroad rails, in DARPA/AF Review of Progress in Quantitative NDE, in press (to be published as an Air Force Wright Aeronautical Laboratory technical report).
MacDonald, D.E., "On determining stress and strain and textureusing ultrasonic velocity measurements," paper presented at IEEE Ultrasonics Symposium, September 26-28, 1979, New Orleans, Louisiana.
McErvan, W.S., and Born, G., Preliminary Evaluation of Rail VibrationTechniques for Rail Force Measurements, Report R-437, Association of American Railroads Technical Center, Chicago, Illinois, 1980.
Moran, T.J., Thomas, R.L., Hawkins, G.F., and Lin, M.J., "ElectromagneticGeneration of Bulk and Surface Sound Waves at Megahertz Frequencies for NDE," Proceedings of the 10th Symposium on Nondestructive Evaluation, p. 105, Southwest Research Institute, San Antonio,Texas, 1975.
Office of Research and Experiments, Preliminary Selectionof Techniques for Determining Longitudinal Rail Forces,Report D-150/RP-1, Utrecht, The Netherlands, 1980a.
Office of Research and Experiments, Detail Appraisal of Techniques -The Magnetic Parameter Method. Report D-150/RP-2, Utrecht, The Netherlands, 1980b.
"OnoV̂ KV,- SfiTbaEa7~MT"T"~ahd—Kwan“, M7M77- "Determination—of— residual- stress-by--magnetomechanical acoustic emission," Proceedings of Conference on Residual Stress for Designers and Metallurgists, American Society for Metals, Cleveland, Ohio, 1981.
68

Ono, K. , and Shibata, M. , "Magnetomechanical acoustic emission for residual stress measurements in railroad rails and wheels," Nondestructive Techniques for Measuring the Longitudinal Force in Rails, Proceedings of Joint Government-Industry Conference, pp. 117-127, National Technical Information Service, Springfield, Virginia, 1980.
Perry, W.D., and Barton, J.R., "Stress measurements in railroad railindicated by Barkhausen force analysis," Nondestructive Techniques for Measuring the Longitudinal Force in Rails, Proceedings of Joint Government-Industry Conference, pp. 61-72, National Technical Information Service, Springfield, Virginia, 1980.
Ratcliffe, B.J., "A review of the techniques using ultrasonic waves. for measurement of stress within materials," Nondestructive Evaluation 3(1969):48-58.
Ruud, C.O., and Farmer, G.D., "Residual stress measurements by x-rays:errors, limitations and applications," Nondestructive Evaluation of Materials, edited by J.J. Burke and V. Weiss, Plenum Press,New York, 1979.
Samavedam, G., Lusignea, R., and Prahl, F., Determination of Longitudinal Force in CWR Using a Vibration Technique, Foster Miller Associates, Waltham, Massachusetts, 1980.
Thompson, R.B.,."A model for the electromagnetic generation of ultrasonicguided waves in ferromagnetic metal polycrystals," IEEE Transactions on Sonics and Ultrasonics SU-25(1978):7-15.
Thompson R.B., "Measurement of residual stress by noncontact sensing ofmagnetostricture properties with EMATs," Nondestructive Techniques for Measuring the Longitudinal Force in Rails, Proceedings of the Joint Government Industry Conference, pp. 34-46, National Technical Information Service, Springfield, Virginia, 1980a.
Thompson, R.B., "Special EMAT configuration for optimum detection ofultrasonic birefringence," Nondestructive Techniques for Measuring the Longitudinal Force in Rails, Proceedings of the Joint Government Industry Conference, pp. 22-34, National Technical Information Service, Springfield, Virginia, 1980b.
Thompson, R.B., "EMAT transducers-ultrasonics." Nondestructive Evaluation Encyclopedia of Materials Science and Engineering, edited by M.B. Bever, Pergamon Press, New York, in press.
69

APPENDIXCurricula Vitae of Committee Members
DONALD 0. THOMPSON received his degrees in physics at the University of Iowa. After a period at Oak Ridge National Laboratory he joined the North American Aviation Science Center (later Rockwell International Science Center) where he served as Director of Structural Materials. In this position he also guided the major DARPA/AF program which has broadened the scientific base of nondestructive inspection. From there he moved to Iowa State University in 1980 where he serves as Principal Scientist, Ames Laboratory, and Adjunct Professor, Departmevit of Engineering Science and Mechanics.ARNOLD D. KERR graduated from the Technical University of Minich and Northwestern University. He taught at NYU (where he rose from instructor to Professor and Director of the Mechanics of Solids Laboratory) and Princeton before his present position at the University of Delaware. His research during the past decade on track dynamics has provided a scientific basis for the phenomena.
HARRIS L. MARCUS was educated at Purdue and Northwestern University. He had several years of industrial experience before becoming a Group Leader in Fracture and Metal Physics at the North American Rockwell Science Center. For the last seven years he has been Professor of Metallurgical Engineering and Materials Science and Engineering at the University of Texas.
PAUL R. PASLAY received degrees from Louisiana State University, Rice Institute, and Massachusetts Institute of Technology. He has held numerous academic positions at Massachusetts Institute of Technology; Rice University; Brown University; Oakland University (Dean of Engineering); and the University of Illinois, Chicago Circle (Dean of Engineering). His industrial experience was at the General Electric Company (1955-59) and as a consulting engineer for the past three years.GERALD POSAKONY received his B.S. in Electrical Engineering at Iowa State University. His industrial experience, largely in nondestructive testing, waS at the University of Colorado Medical Center, and Automation̂ Industries, Inc. Since 1973 he has been at Battelle Northwest. He is a Fellow and Member of the Board of Directors of the American Society for Nondestructive Testing.BRUCE THOMPSON is a graduate in physics of Rice University and applied physics at Stanford University, Dr. Bruce Thompson has worked for Humble Oil,Stanford, and the Rockwell International Science Center where he served for four years as group leader of ultrasonic applications. He has recently moved to Iowa State University where he is a senior scientist of the Ames Laboratory and an adjunct Professor of the Department of Engineering Science and Mechanics.
ALLAN M. ZAREMBSKI is the one other railroad specialist on the committee. He was educated at New York and Princeton Universities, receiving degrees in Aeronautics and Astronautics, Civil Engineering, and Engineering Mechanics.He has worked at Grumman Aerospace Corporation and Princeton University before coming to the Association of American Railroads where he was Manager of Track Research. Since 1981 he has become associated with two railroad-related firms: Pandrol, Inc. and Speno Rail Services.

Prediction of Rail Buckling: Recommendations for Development of Test Methods, 1982US DOT, FRA, Committee on Nondestructive Testing of Longitudinal Force in Rails

PROPERTY ©F m k E E i l A E C l S ff D E V E L O P M E N T
L I B R A R Y
*•>