PB81125510.pdf - Federal Railroad Administration
104
----- ----------------------------- FRA/ORD-80/63 TRACK RENEWAL SYSTEM AND WOOD TIE REUSE ANALYSIS Unified Industries Incorporated 6600 Loisdale Court, Suite 400 Springfield, Virginia 22150 OCTOBER 1980 FINAL REPORT Document is available to the public through the National Technical Information Service, Springfield, Virginia 22161 Prepared for U.S. DEPARTMENT OF TRANSPORTATION FEDERAL RAILROAD ADMINISTRATION Office of Research and Development Washington, D.C. 20590 R£PRODUCED BY NATIONAL TECHNICAL INFORMATION SERVICE U.S. DEPARTMENJ Of COMMERCE SI'RINGFIELQ,. 2216J
-
Upload
khangminh22 -
Category
Documents
-
view
1 -
download
0
Transcript of PB81125510.pdf - Federal Railroad Administration
----- -----------------------------
FRA/ORD-80/63
TRACK RENEWAL SYSTEM AND WOOD TIE REUSE ANALYSIS
Unified Industries Incorporated 6600 Loisdale Court, Suite 400
Springfield, Virginia 22150
OCTOBER 1980
FINAL REPORT
Document is available to the public
through the National Technical Information Service, Springfield, Virginia 22161
Prepared for
U.S. DEPARTMENT OF TRANSPORTATION FEDERAL RAILROAD ADMINISTRATION
Office of Research and Development
Washington, D.C. 20590
R£PRODUCED BY NATIONAL TECHNICAL INFORMATION SERVICE
U.S. DEPARTMENJ Of COMMERCE SI'RINGFIELQ,. V~ 2216J
NOTICE
This document is disseminated under the sponsorship of the Depart·
ment of Transportation in the interest of information exchange. The
United States Gove~rnment assumes no liability for the contents or use
thereof.
The United States Government does not endorse products or manu·
facturers. Trade or manufacturers' names appear herein solely because
they are considered essential to the object of this report.
----------------
Technical ~eport Documentation Page
1. Report No. 2. Government Accession No. 3. Recipient's Catalog No.
FRA/ORD-80/63
4. Title and Subtitle 5. Report Date
OCTOBER 1980 Track Renewal System and Wood Tie Reuse Analysis 6. Performing Organization Code
r-::---~~-:-:----------------------------1 8. Performing Organization Report No. 7. Author/ s)
G. Richard Cataldi, David N. Elkaim
9. Performing Organization Name and Address
Unified Industries Incorporated 6600 Loisdale Court, Suite 400 Springfield, Virginia 22150
10. Work Unit No. (TRAIS)
11. Contract or Grant No.
DOT-FR-9044 13. Type of Report and Period Covered
~~--------------------~--------------------------------~ 12. Sponsoring Agency Name and Address Final Federal Railroad Administration August 1979-July 1980 Office of Research and Development 400 Seventh Street, SW. Washington, D.C. 20590
15. Supplementary Nates
16. Abstract
14. Sponsoring Agency Code
This report presents the results of an analytical study of the technical and economic feasibility of applying the track renewal method of railroad track maintenance in the United States. Track renewal, or out-of-face renewal, has long been the prevailing form of track maintenance used in Europe and has recently spread to Asia, Australia, and North America. Current North American activity is very limited, but the carriers and other elements of the railroad community are becoming increasingly interested in the potential advantages of track renewal as an alternative to selective maintenance.
The core of the report consists of a detailed framework for conducting a comparative economic analysis of the track renewal method versus the traditional selective maintenance method .. The framework includes detailed descriptions of both methods, unit costs for each major operation under each method, and the comparative present worth long-term costs associated with each method. The framework methodology is presented in detail so that the reader can examine and if necessary modify the built-in assumptions and thereby tailor the framework for application to a specific situation.
A sample economic analysis is presented wherein the framework is used to compare the estimated long-term and first-year costs when they are applied to fourteen specific track maintenance scenarios,. each of which represents a particular set of assumptions and conditions. The results of the sample analysis include the followin!r ( 1) track renewal offers the prospect of large longterm cost savings over selective maintenance, although only under certain circumstances; (2) wood tie reuse is a critical factor in optimizing the long-term savings; (3) with wood tie reuse, track renewal is likely to be $15,000 to $27,000 cheaper per track mile than selective maintenance over time; (4) the internal rate of return for track renewal is likely to be 25-35 percent; (5) the breakeven point for first-year costs is about 32 percent tie replacement for installing wood ties and 75 percent for replacing wood with concrete ties; (6) ballast Cleaning costs are reduced by about 28 percent with track renewal; and (7) track occupancy time for maintenance is reduced 60-79 percent with track renewcil.
The report also presents a worldwide survey of present and future track renewal machine technology to enable the reader to consider alternatives to the type of machine assumed in the framework and analysis. Also included is a discussion of the use of track renewal machines for abandoning existing track, building new track, and for other nonmaintenance applications. In addition, there is a brief section on two alternatives to track renewal machine ownership and operation by the railroads: ( 1) railroad leasing and operation, and (2) railroad purchase of services from contractor owner-operator.
The report concludes with the identification of several areas for additional study, principally with respect to the further development and refinement of the framework as a research tool. It also states that the framework should be tested by one or more railroads; the results should be used to strengthen the framework and should also be shared with the railroad community.
17. KeyWords 18. Oi stributioh Statement
Track renewal systems, track renewal machines, track maintenance, economics of track maintenance, wood tie reuse
Document is available to the public through the National Technical Information Service, Springfield, Virginia 22161
19. Security Classif. (of this report)
Unclassified
Form DOT F 1700.7 (8-72)
20. Security Classif. (of this page)
Unclassified
Reproduction of completed page authorized
i
21. No. of Pages 22. Price
_Symbol
in It yd
mi
tn2
112 yd2
mi2
oz lb
tsp
Tbsp fl oz
pi qt yal ftJ ydJ
"f
Approximate Conversions to Metric Measures
When You Know
mchos teet yards miles
square inches square feet square yard:s square miles acres
ounces
pounds
short tons
(2000 lbl
teaspoons
tablespoons
fluid ounces cups pints quarts gallons cubiC feet
cubic yards
Multiply by
LENGTH
"2.6 30 0.9 1.6
AREA
6.5 0.09 0.8 2.6 0.4
MASS (weight)
28 0.45 0.9
VOLUME
5 15 30 0.24 0.47 0.95 3.8 0.03 0.76
TEMPERATURE (exact)
Fahrenheit temperdture
5,9 (after subtracting
32)
h Find
centimeters cenlimeters meters kilometers
square centimeters square meters square meters square kilometers hectares
gramtt kllt>QHIITI$
tonnes
milliliter$ milliliter~
millililers lilcrs liters liters liters cubic meters cubic meters
Celsius
htmperature
Symbol
em em m
km
cm2
ml
~ km2
ha
g kg
ml ml ml
I
1113
m3
"c
• I ul ; :! .S4 (t! ><.<ll t! y]. I '" "the1 t~.><d< 1 ,;unvt:l ~""I'> <1nd 1illll e tlt:ldilt;d I<~Uit:~. llnll~ uf Vvc·~.llll~ dlld r.'le<..!!"HII•~::.. f'riLC ::.:! . .1.5. so Cnial<;~ Nu. CIJ.10:28ti.
NtiS M•~•·· h,t;L ;~til>.
METRIC CONVERSION FACTORS
... -
...
...
"'
•
5 g. :X
M .. .. ..
------~ .. ~
------~
~
!:;
-----~ =
:!l
~
:l
=-- ~ E.__ __
~-:::
• u
::::
"'
Symbol
mm em m m km
cm2 m2
km2
he
9 kg
ml I
I
I mJ
ml
"c
Approximate Conversions from Metric Meuurn
When You Know
nultimut6rs
centimuhtrs muters meters kilometers
squwe centimeters aquare meters square ki lometera hectares 110.000 m2)
Multiply lty
LENGTH
0.04 0.4 3.3 1.1 0.6
AREA
0.16 1.2 0.4 2.5
MASS !wveightl
gr11111S kilograms tonnes 11000 kg)
milliliters liters liters liters cubic meters cubic meters
0.035 2.2 1.1
VOLUME
0.03 2.1 1.06 0.26
35 1.3
TEMPERATURE (exact)
Celsius temperature
9/6 (then
add 321
To Fin4
1nches
inches
feet varda miles
square inches square yarda square mi los acres
ounces pounds short tooa
tlu1d ouncea pml&
quo-.rts
ga!loos cubic feet cubic yards
Fahrenheit \omperature
Of ~ H K6 m
-4~ I I I~ I I ~14~011 lelo It .~~o. I .~~o~ I 12C:O~/ -40
1 -2
1o
1 o z
1o
1 ~o 1 60 ·' a
1o
1 100
°C 37 °C
Sy•bol
in in II yd mi
in2
y~ mi2
oz lb
ft oz pi ql
gal
"3 ydJ
"f
'
---- .. -------------------
PREFACE
This report presents the results of an analytical study of the technical and economic feasibility of the track renewal method of track maintenance for U.S. railroads. It was prepared by Unified Industries Incorporated (UII), under contract to the Federal Railroad Administration (FRA).
The authors wish to thank Ms. Claire L. Orth, the FRA technical monitor, for her continued guidance and cooperation throughout this project. The comments and suggestions offered by Messrs. Philip Olekszyk, Arnold Gross, and Robert E. Kleist of the FRA, Mr. Louis T. Cerny of the American Railway Engineering Association, and Mr. Richard D. Johnson of the National Railroad Passenger Corporation (Amtrak), especially during the preparation of this final report, are also gratefully acknowledged. In addition, the assistance provided by Messrs. Robert Corsetti and Michael E. Dunn of Amtrak, Messrs. R. D. Miles and J. H. Gasper of Canadian National Railways, and the members of the Association of American Railroads' Committee on Track Maintenance Research was particularly helpful for obtaining background data and developing objectives for this project.
This study continued and expanded upon the pioneering research in track renewal done by railroad consult-ant David R. Burns, and he provided valuable assistance throughout the project.
In addition, the authors wish to thank their UII colleagues. Messrs. Paul Elliott and Kenneth W. Larsen furnished assistance in project direction and in the preparation of the intermediate reports and this final report. Mrs. Virginia 0. Clem painstakingly typed the more than 80 tables, as well as all of the text, in this report, contended with seemingly constant revisions, and then transmuted this vast assemblage of paper into a final report.
iii
TABLE OF CONTENTS
EXECUTIVE SUMMARY.
I. INTRODUCTION ...
II. FRAMEWORK FOR EVALUATING THE ECONOMICS OF TRACK RENEWAL.
1. Description of Maintenance Systems .....
A. Conventional Selective Track Maintenance
B. Track Renewal System Based Maintenance .
2. Cost Factors Associated with Track Maintenance and Wood Tie Reuse.
A. Operational Costs for Track Maintenance. .
3.
B. Development of Material Credit for Used Track Components
Long-Term Costing Methodology.
III. SAMPLE ECONOMIC ANALYSIS ..
1. Sample Track Maintenance Scenarios
A. Development of Track Maintenance Requirements.
B. Scenario Descriptions.
2. Sample Cash Flows.
3. Analysis of Sample Cash Flows.
IV. TRACK RENEWAL MACHINE TECHNOLOGY AND APPLICATIONS.
1. Track Renewal Machine Designs.
A. Single Machine - Rail-Mounted.
B. Single Machine - Combined Rail Crawler
C. Double Train Machine
D. Gantry Crane System (Auxiliary Rails).
E. Gantry Crane System (Track-Mounted).
F. Panel Track System
G. Twin Boom Crane System
2. Track Renewal Machine Applications
3. Future Trends in TRM Technology.
V. TRACK RENEWAL MACHINE OWNERSHIP ALTERNATIVES
1. Railroad Ownership and Operation
2. Railroad Lease and Operation ..
3. Contractor Ownership and Operation
VI. CONCLUSIONS ...... .
1. Summary of Findings.
2. Areas for Further Study.
v Preceding page blank
1
4
5
6
6
11
15
15
45
56
60
60
60
60
61
70
81
81
81
82
82
83
85
85
86
86
87
91
91
91
92
93
93
93

EXECUTIVE SUMMARY
This report presents an analysis of the track renewal method of railroad track maintenance as it could be applied in the United States. The core of the report consists of a detailed framework for conducting a comparative economic analysis of the track renewal method versus the traditional selective maintenance method (chapter II), together with the results of applying the framework to a set of sample scenarios (chapter III).
Selective maintenance, the method by ~hich almost all railroad trackage is presently maintained in the United States and Canada, involves the intermittent and/or periodic replacement or repair of only those track structure components that are defective or failing.
By contrast, track renewal, also known as out-of-face renewal, consists of completely rebuilding the track structure as a single, continuous process that involves renewing and/or adjusting all of the track structure components (rails, ties, ballast, etc.) in a given section of track in a scheduled period of time during which the track is closed to traffic. Following track renewal, such a section is customarily given only light section gang or basic maintenance for perhaps 15, 25, or more years (the length of the period depending upon track structure, traffic, and environmental conditions) until it is again rebuilt under the track renewal method.
The track renewal method is a highly mechanized process involving the use of large, integrated track renewal systems. A typical track renewal system (TRS) is designed around a specialized track renewal machine (TRM) or pair of such machines that moves along the track removing old rail and ties and installing new rails and ties. The rest of the system is made up of other types of conventional track maintenance equipment that perform such tasks as removing/inserting rail fasteners, cleaning the ballast, and aligning and tamping the track.
Track renewal has long been the prevailing form of track maintenance used in Europe. In recent years, spurred largely by the successful European experience, the North American railroad community has become increasingly interested in the potential advantages of track renewal as an alternative to selective maintenance; This interest is based on the prospect of track renewal being able to provide such advantages as significant long-term track maintenance cost savings and a major reduction in the amount of track occupancy time needed for maintenance activities.
To date (mid-1980), North American railroads have had little direct experience with track renewal. Only five T~~·s are presently in service (one on Amtrak lines in the Northeast Corridor, one on Canadian National Railways, and three on the National Railways of Mexico), and all of them are being used for what is essentially a specialized purpose -- converting main-line track from wood to concrete ties.
Consequently, only limited information is available for assessing the relative costs and benefits of using track renewal instead of selective maintenance to rebuild North American trackage, as well as for determining the various circumstances under which it may or may not be advantageous to apply the track renewal method.
The principal purpose of this report is to provide U.S. railroads and other elements of the North American railroad community with a basic research tool for comparing the track renewal and selective maintenance methods. This tool is in the form of a detailed economic framework for comparing the two methods.
The economic framework (chapter II) begins with detailed descriptions of both selective maintenance and track renewal. Each description includes information and assumptions on the equipment and labor requirements and makeup of each maintenance gang and related support activities, as well as average production rates. Given that railroads differ considerably in their maintenance practices and policies, the selective maintenance description is based on what may be considered a representative but nevertheless hypothetical set of maintenance procedures, which are presented in sufficient detail such that the reader can determine their relevance to specific real world situations and modify them accordingly. The track renewal description is covered in comparable detail, with the assumed production rates and other information being derived from a combina-tion of both North American and European experience; here too, the information is presented so that the reader can examine and if necessary modify the built-in assumptions.
The next step in the economic framework is to develop unit costs for each major operation under both selective maintenance and track renewal and to ascertain the economic impact of reusing and/or disposing of the track structure components removed from track during track renewal. The unit costs per mile include those for materials installed, labor,. equipment maintenance, transportation, equipment leases, and capital recovery. The calculated unit costs can then be combined to provide an estimate of first-year costs for each of the two maintenance alternatives. Track structure component reuse/disposal determination is limited to consideration of used wood ties only, on the assumption that the replacement rate for rails, other track material, and ballast would be comparable for both maintenance alternatives. Under track renewal, large-scale wood tie reuse/disposal -- calculated as a net material credit --can provide a significant economic benefit, especially when used to offset first-year costs. This second step in the framework is presented in sufficient detail such that the reader can modify it to fit a specific situation by making appropriate additions, deletions, or other changes and then carry them forward into the third and final step.
The final step is to determine the comparative long-term costs of track renewal versus selective maintenance. These include net material credit for used ties, first-year costs, and all subsequent annual maintenance costs (discounted to present value) occurring over a defined period or life cycle. Compared on the basis of present worth (the present worth methodology is given in outline form), these long-term costs provide a useful means for helping to ascertain the relative advantages and disadvantages of the track renewal and selective maintenance methods.
A sample economic analysis is presented (chapter III) wherein the framework is used to compare the estimated long-term and first-year costs of both methods when they are applied to fourteen specific track maintenance scenarios. Each scenario represents a particular set of assumptions concerning average tie life, average rail life, and other significant variables.
The principal findings of the sample analysis are as follows:
a. Compared with selective maintenance, track renewal offers the prospect of large long-term cost savings in track maintenance, although only under certain conditions.
b. The long-term cost savings attributable to track renewal are likely to be highest if (1) 25 or more percent of the ties in existing track need to be replaced (track needs upgrading), (2) rail change coincides with tie renewal, (3) ballast cleaning is included, (4) average tie life under track renewal is 15-25 percent longer than under selective maintenance, and (5) net material credit for wood tie reuse/disposal is included.
c. Wood tie reuse (the reuse of ties, with or without repair, in other tracks) and wood tie disposal (the sale of ties for nonrailroad use or scrap) together generate a net material credit of $14,100 to $22,600 per track mile in all fourteen scenarios. (If all ties are simply sold as scrap ties, there is a net material credit of about $6,000 per track mile.)
d. Material credit is a critical factor in optimizing long-term track renewal cost savings. With material credit, the long-term cost differential between both methods favors track renewal in all fourteen scenarios. Twelve ·of the fourteen scenarios each produce track renewal savings of between $15,100 and $27,000 (present-worth dollars) per track mile. The other two scenarios produce a low of $2,600 per track mile and a high of $29,500 per track mile.
e. Without material credit, the longterm cost differential between the two methods is minimal (no more than $2,100 per track mile in favor of either method) in seven scenarios. It favors track renewal by $8,100 to $13,500 per track mile in four scenarios and selective maintenance by $3,900 to $17,900 per track mile in three scenarios.
2
f. Without material credit, the internal rate of return on track renewal investment ranges from less than 4 percent to about 35 percent for eleven of the fourteen scenarios (no rate of return can be calculated for the remaining three scenarios because there is no extra first year cost for any of them). With material credit, the rate of return on track renewal is about 25-35 percent for eight scenarios.
g. The long-term cost savings and internal rates of return calculated in the sample analysis must be considered within the context of the duration of the life cycle used in each scenario. In the fourteen sample scenarios, the life cycles range from 15 years (wood tie track under heavy traffic) to 40 years (concrete tie tracks).
h. The long-term costs and cost savings associated with track renewal will differ significantly from those cited in the sample analysis if there are major changes in the assumed daily production rate of the track renewal machine (TRM). In all fourteen sample scenarios, it was assumed that the TRM could install 2,880 wood ties in an average work day (a conservative assumption based chiefly on the actual rates achieved by the Amtrak and Canadian National TRM's). If the assumed rate is increased by 25 percent, there will be an increase of about $2,900 per track mile in longterm track renewal cost savings for all fourteen scenarios. A decrease of about 33 percent in the assumed rate will result in an across-the-board long-term loss of about $5,800 per track mile.
i. First-year costs in all fourteen scenarios are generally much higher for track renewal without material credit than for selective maintenance, principally because most of the track renewal costs occur in the first year. With material credit, however, track renewal is only $2,100 to $6,600 per track mile more expensive in eight of the eleven wood tie scenarios that assume a 25-percent tie replacement rate. In two of the other wood tie scenarios, the costs (with material credit) are the same for both methods. In the scenario that assumes a 50-percent tie replacement rate, track renewal (with material credit) is actually $9,900 per track mile less expensive than selective maintenance.
j. First-year track renewal costs are much higher for converting from wood to concrete ties than for installing new wood ties, owing to the high cost of concrete ties. The cost differential amounts to $28,900-$30,800 per track mile, including material credit.
k. Breakeven analysis of first-year costs reveals that, for wood ties, the breakeven point (zero cost differential) is about 56 percent tie replacement without material credit and about 32 percent with material credit. For wood-to-concrete conversion, the comparable figures are 90 percent and 75 percent, respectively.
1. Ballast cleaning costs are reduced by about 28 percent when this activity is included in the track renewal operation.
m. Track occupancy time required for maintenance is reduced significantly under track renewal; there is a reduction of about 79 percent in the first year and about 60 percent over the track life cycle.
The track renewal system factors used in the economic framework and sample analysis are all based on the assumed use of a specific type of TRM, the Canron P-811. This machine is widely used in Europe and is the only TRM currently in use in the United States and Canada. To understand the full potential of the track renewal concept in North America, however, it is useful to consider the full range of existing and future TRM designs and their potential applications. Accordingly, descriptions of all the major TRM designs are presented in chapter IV, along with their applications, crew sizes, and production capabilities.
In addition to serving as a key element in long-term track maintenance, TRM's can be used for several specialized functions. These include abandonment of existing track and construction of new track. In addition, TRM's can be used to perform major track realignment, convert track from wood to concrete ties, or undertake changes in track class or design (change rail weight, alter tie spacing, etc.).
A principal assumption throughout the study is that each U.S. railroad adopting the track renewal method would own and operate its own TRM. However, there are two other alternatives-railroad leasing and operation and contractor ownership and operation -- that should be considered by the U.S. railroad community. The principal advantages and disadvantages of these alternatives are discussed briefly in chapter V.
The principal findings of this study are as follows:
a. Under certain conditions, the track renewal method offers significant long-term cost savings in track maintenance over the selective maintenance method.
b. Track renewal reduces the amount of track occupancy time needed to perform maintenance work.
3
c. The track renewal method produces a completely rebuilt track that is likely to remain in better overall condition over the life cycle of the track than is a selectively maintained track.
d. Track renewal technology has been advancing at a rapid rate in recent years, and this trend appears likely to continue such that future TRM's will achieve higher production rates with less labor and fewer support machines.
e. Although track renewal can produce large savings in labor and equipment costs, it does require a major planning effort and a commitment from management to operate successfully. A shortage of any material or a breakdown by any one of several key machines could have a serious impact upon the efficiency and cost-effectiveness of track renewal applications.
f. Based on the detailed economic framework and the sample analysis, it is evident that the framework itself should be a useful research tool for the U.S. railroad community to use for comparing the track renewal and selective maintenance methods. Given all the variables and options that exist in track maintenance procedures and real world applications, each railroad needs to consider the potential of track renewal from its own perspective.
The preparation of this analytical study has led to the conclusion that there are still several significant areas for additional study in the field of track renewal, especially with respect to the further development and refinement of the economic framework. These study areas include some of the assumptions used in the present study -- as, for example, a possible increase in wood tie service life attributable to track renewal. They also include several follow-on topics, such as the use of track renewal to abandon track and rebuild deteriorated track, the economics of TRM leasing and contracting arrangements, and the cost value of track occupancy time to railroad operating and engineer-ing departments.
In addition, given the hypothetical nature of the framework developed in the present study, the framework should be tested by one or more railroads. The results should be used to strengthen the framework's usefulness and should be shared with the railroad community.
I. INTRODUCTION
This report presents an analysis of the track renewal method of railroad track maintenance and its potential for application in the United States. The analysis was conducted as phase 2 of a Federal Railroad Administration research study of track renewal and an associated topic, the reuse of wood ties. Phase 1 of the study resulted in the preparation and publication of two reports: Track Renewal Systems: A Survey Report,* which provides an overview of track renewal system experience in Europe and North America and reviews previous economic feasibility studies of track renewal, and Wood Tie Reuse: A Survey Report,** which describes European and North American practices in reusing wood crossties removed from track, with emphasis on reuse associated with track renewal.
The present report focuses on the track renewal method in comparison with the selective maintenance method of track maintenance, which is the method by which almost all railroad trackage has been customarily maintained throughout the United States and Canada.
Selective maintenance involves the intermittent and/or periodic replacement or repair of only those track structure components (rails, ties, fasteners, ballast, etc.) that are defective or failing. As a result, there may be considerable variation in the age, condition, and performance of the various component types and individual components in a given section of track.
By contrast, track renewal, which is also referred to as out-of-face renewal, consists of completely rebuilding the track structure as a single, continuous process that involves renewing and/or adjusting all of the track structure components in a given section of track in a scheduled period of time during which the track is closed to traffic. Following the initial rebuilding process, such a track section is customarily given only light section gang or basic maintenance for perhaps 15, 25, or more years (the length of the period depending upon track structure, traffic, and environmental conditions) until it is again rebuilt under the track renewal method.
The track renewal method is a highly mechanized procedure involving the application of large, integrated track renewal systems. A typical track renewal system (TRS) is designed around a specialized track renewal machine (TRM) or pair of such machines that moves along the
*Report number FRA/ORD-79/43 prepared by Unified Industries Incorporated for'the Federal Railroad Administration (1979), NTIS accession number PB 300866.
**Report number FRA/ORD-79/44 prepared by Unified Industries IncorpJrated for the Federal Railroad Administration (1979), NTIS accession number PB 114044.
4
track picking up old rails and ties and installing new rails and ties as a single continuous process. The TRM is supported by other types of conventional track maintenance equipment that perform such tasks as removing/inserting fasteners, cleaning the ballast, and aligning and tamping the track.
The track renewal method has long been the predominant form of track renewal practiced in Europe. In recent years, spurred largely by the successful European experience, the North American railroad community has become increasingly interested in the potential advantages of this method as an alternative to selective maintenance. This interest is based on the prospect of track renewal being able to provide such benefits as significant long-term track maintenance cost savings and a major reduction in the amount of track occupancy time required for maintenance activities.
As of mid-1980, North American railroads have had little direct experience with track renewal. Only five TRM' s are presently in service (one on Amtrak's lines in the Northeast Corridor between Boston and Washington, D.C., one on Canadian National Railways, and three on the National Railways of Mexico). All of these North American TRM' s are being used for what is essentially a special~ ized purpose -- the conversion of main-line track from wood. to concrete ties. Consequently, it is difficult to assess the relative costs and benefits of using track renewal instead of selective maintenance to maintain and/or rebuild North America's wood tie trackage. It is also difficult to determine the various conditions and other circumstances under which adoption of the track renewal method may be most advantageous and cost-effective.
The principal purpose of this report is to provide U.S. railroads and other elements of the North American railroad community with a basic research tool for making such assessments and determinations. As presented in this report, the tool consists of a detailed economic framework for comparing the track renewal and selective maintenance methods.
The framework (chapter II) presents a detailed procedure for developing and comparing estimated first-year and long-term costs of maintaining railroad track under both track renewal and selective maintenance. It is intended to be used to examine real world situations, and so it is organized to permit the reader to understand the numerous underlying assumptions, follow the methodology used, modify any of the component elements, and insert procedure-specific or site-specific information as needed.
Given the complexity of the framework, which alone accounts for more than half of this report, the general reader may find it easier initially to read only the introductory portion (pages 5-6) of the framework chapter and then proceed to chapter III in which are given the results of applying the framework to various specific scenarios.
II. FRAMEWORK FOR EVALUATING THE ECONOMICS OF TRACK RENEWAL
This chapter presents a detailed procedure for developing estimated first-year and long-term costs of maintaining railroad track by the track renewal method and selective maintenance method. The costs developed do not include basic, or section gang, type maintenance; the cost of distributing and collecting rails; and some other operations that are presumed to be equal for track renewal and selective maintenance.
The procedure, or framework, for economic evaluation developed here is generalized to provide a representative example of relative costs and to allow some specific first-year and longterm cost comparisons in chapter III. The reader can modify the framework to fit a specific real world situation by changing unit costs, gang and facility descriptions, and production rates assumed in this report as necessary, and carry the changes forward through the cost-benefit procedure of the framework.
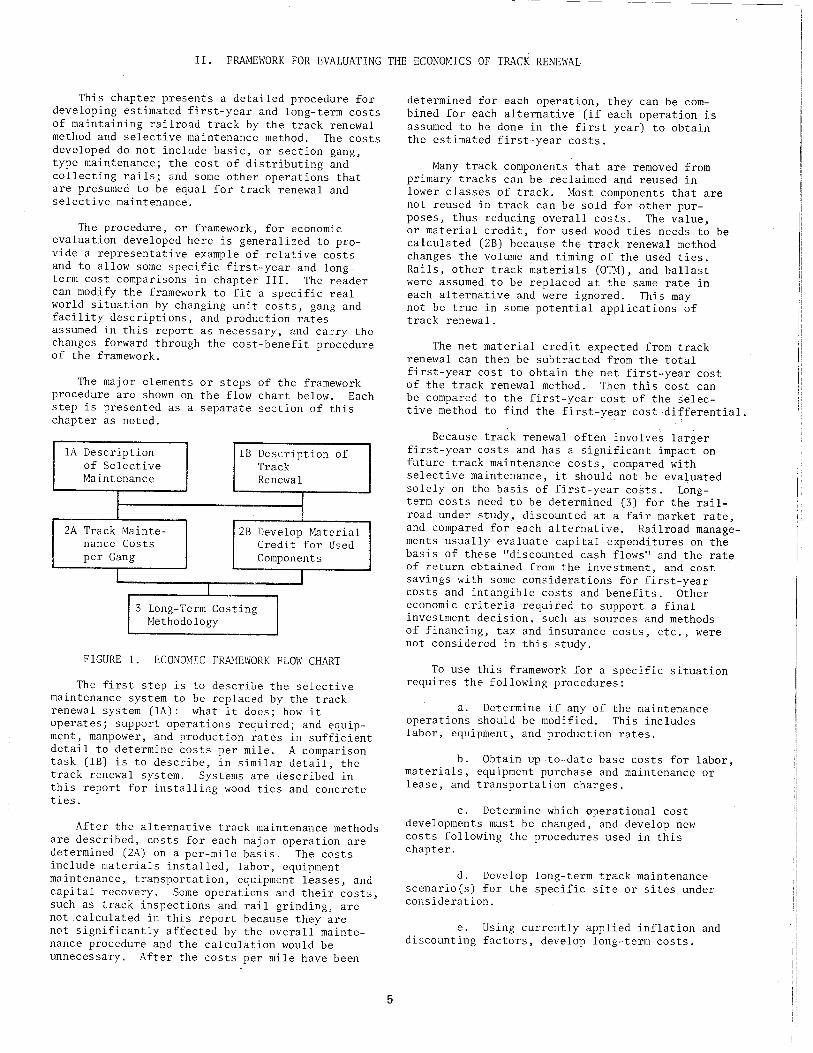
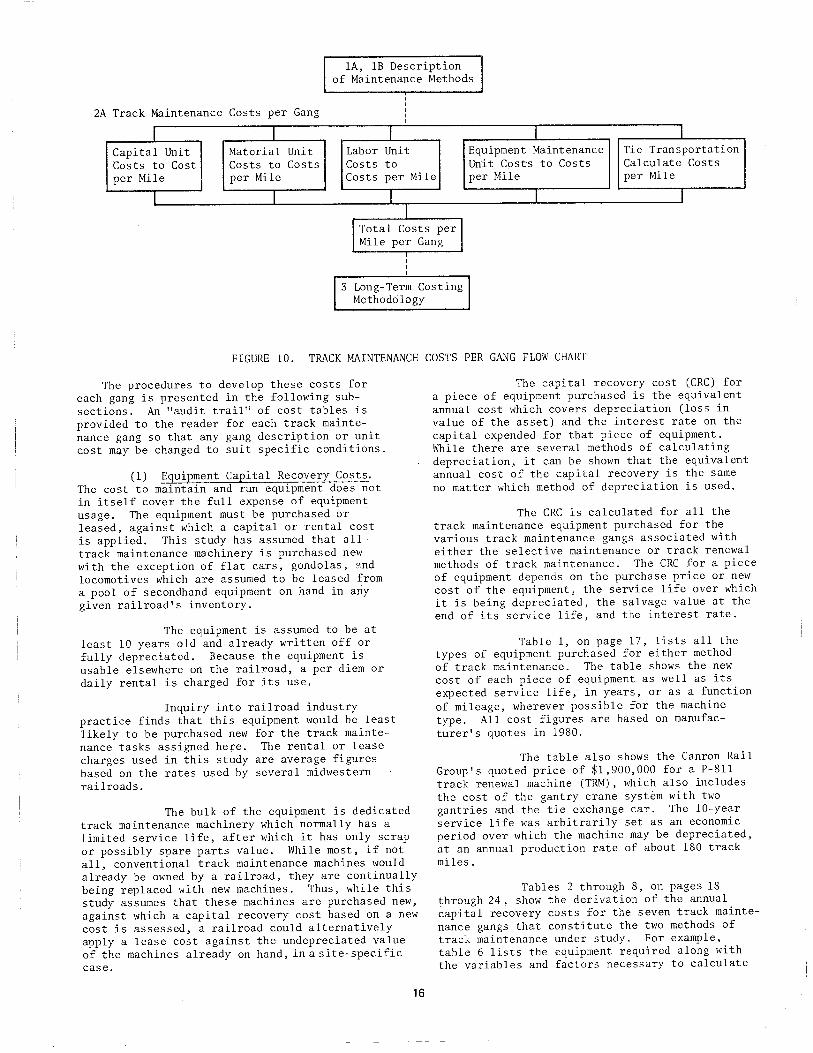
The major elements or steps of the framework procedure are shown on the flow chart below. Each step is presented as a separate section of this chapter as noted.
lA Description lB Description of of Selective Track Maintenance Renewal
I I I I
2A Track Mainte- 28 Develop Material nance Costs Credit for Used per Gang Components
l I J
3 Long-Term Costing Methodology
FIGURE 1. ECONOMIC FRAf1EWORK FLOW CHART
The first step is to describe the selective maintenance system to be replaced by the track renewal system (lA): what it does; how it operates; support operations required; and equipment, manpower, and production rates in sufficient detail to determine costs per mile. A comparison task (lB) is to describe, in similar detail, the track renewal system. Systems are described in this report for installing wood ties and concrete ties.
After the alternative track maintenance methods are described, costs for each major operation are determined (2A) on a per-mile basis. The costs include materials installed, labor, equipment maintenance, transportation, equipment leases, and capital recovery. Some operations and their costs, such as track inspections and rail grinding, are not calculated in this report because they are not significantly affected by the overall maintenance procedure and the calculation would be unnecessary. After the costs per mile have been
5
determined for each operation, they can be combined for each alternative (if each operation is assumed to be done in the first year) to obtain the estimated first-year costs.
Many track components that are removed from primary tracks can be reclaimed and reused in lower classes of track. Most components that are not reused in track can be sold for other purposes, thus reducing overall costs. The value, or material credit, for used wood ties needs to be calculated (2B) because the track renewal method changes the volume and timing of the used ties. Rails, other track materials (OTM), and ballast were assumed to be replaced at the same rate in each alternative and were ignored. This may not be true in some potential applications of track renewal.
The net material credit expected from track renewal can then be subtracted from the total first-year cost to obtain the net first-year cost of the track renewal method. Then this cost can be compared to the first-year cost of the selec-tive method to find the first-year cost differential.
Because track renewal often involves larger first-year costs and has a significant impact on future track maintenance costs, compared with selective maintenance, it should not be evaluated solely on the basis of first-year costs. Long-term costs need to be determined (3) for the railroad under study, discounted at a fair market rate, and compared for each alternative. Railroad managements usually evaluate capital expenditures on the basis of these "discounted cash flows" and the rate of return obtained from the investment, and cost savings with some considerations for first-year costs and intangible costs and benefits. Other economic criteria required to support a final investment decision, such as sources and methods of financing, tax and insurance costs, etc., were not considered in this study.
To use this framework for a specific situation requires the following procedures:
a. Determine if any of the maintenance operations should be modified. This includes labor, equipment, and production rates.
b. Obtain up-to-date base costs for labor, materials, equipment purchase and maintenance or lease, and transportation charges.
c. Determine which operational cost developments must be changed, and develop new costs following the procedures used in this chapter.
d. Develop long-term track maintenance scenario(s) for the specific site or sites under consideration.
e. Using currently applied inflation and discounting factors, develop long-term costs.
i
f. Evaluate the results, modify the scenarios and long-term economics as necessary to study alternatives, and develop recommendations for management.
1. Description of Maintenance Systems
The alternative track maintenance methods compared in this study are described in the following subsections. The selective maintenance method is presented first, with only those operations that would be eliminated or altered by track renewal receiving full descriptions. Assumed average production rates are presented for each operation. This is followed by descriptions of track renewal systems for installing wood and concrete ties and assumed production rates.
As shown in figure 1, these descriptions begin the overall procedure.
A. Conventional Selective Track Maintenance
The conventional selective track maintenance operations described below are representative of typical mechanized track maintenance gangs in the United States. Every effort has been made to include every machine and position necessary to conduct the overall operation. The gangs are described in detail so that the reader can compare them to specific real world situations and determine whether or not to use the costs developed in this report or to develop independent costs.
(1) Selective Maintenance Principles and Procedures. The selective method of track maintenance is the traditional way of maintaining railroad track in the United States. It has been used since the very first railway experienced a track component failure, it now enjoys the benefits of an incumbent procedure, and it works.
In simple terms, in selective maintenance, track components are replaced on an individual basis after they fail or wear out. Railroad policy, affected by government regulations, varies as to when the component is actually replaced. Some railroads try to replace components just before failure or wearing out; some components are replaced as soon as the failure is discovered; and some "failed" or wornout components are allowed to remain in place for some time so long as the track is passable.
Originally, selective maintenance was done by section gangs that were responsible for all track inspection and maintenance on a short length or section of the railroad. Virtually all of the work was done by hand. Since about 1950, most track maintenance work has been taken over by traveling mechanized gangs with specific missions: rail gangs change or transpose rails; tie gangs change ties; surfacing gangs realign and resurface the track; and so on. The section gang has been reduced to inspection, emergency repairs, and other maintenance work that does not lend itself to high production mechanization. This level of maintenance is sometimes referred to as basic maintenance.
6
The mechanized gangs operate over the railway as needed when their particular operations can be utilized effectively. For example, depending on the railroad and the specific track involved, tie gangs are generally not assigned until 12 to 30 percent of the ties in a track length need to be replaced. Mechanized gangs usually operate independently of each other, due to different production rates and somewhat different conditions of the various track components. Because of this, each gang is usually a complete operation, including tampers and other equipment necessary to leave the track passable behind the gang.
(2) Selective Maintenance Gang Descriptions. Mechanized selective maintenance operations that would be eliminated or altered by the track renewal method are described in the following paragraphs. Included for each gang are the operations performed, equipment, and labor operations. Other support operations are not broken down in this detail.
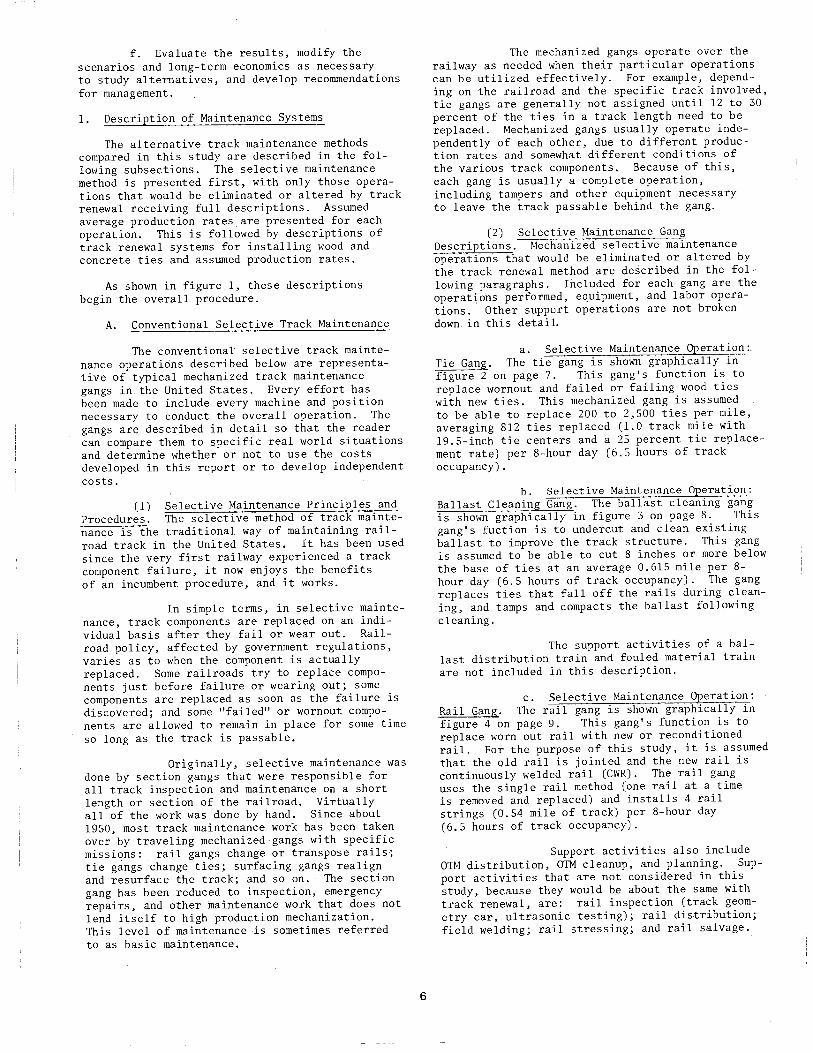
a. Selective Maintenance Operation:. Tie Gang. The tie gang is shown graphically in figure 2 on page 7. This gang's function is to replace wornout and failed or failing wood ties with new ties. This mechanized gang is assumed to be able to replace 200 to 2,500 ties per mile, averaging 812 ties replaced (1.0 track mile with 19.5-inch tie centers and a 25 percent tie replacement rate) per 8-hour day (6.5 hours of track occupancy).
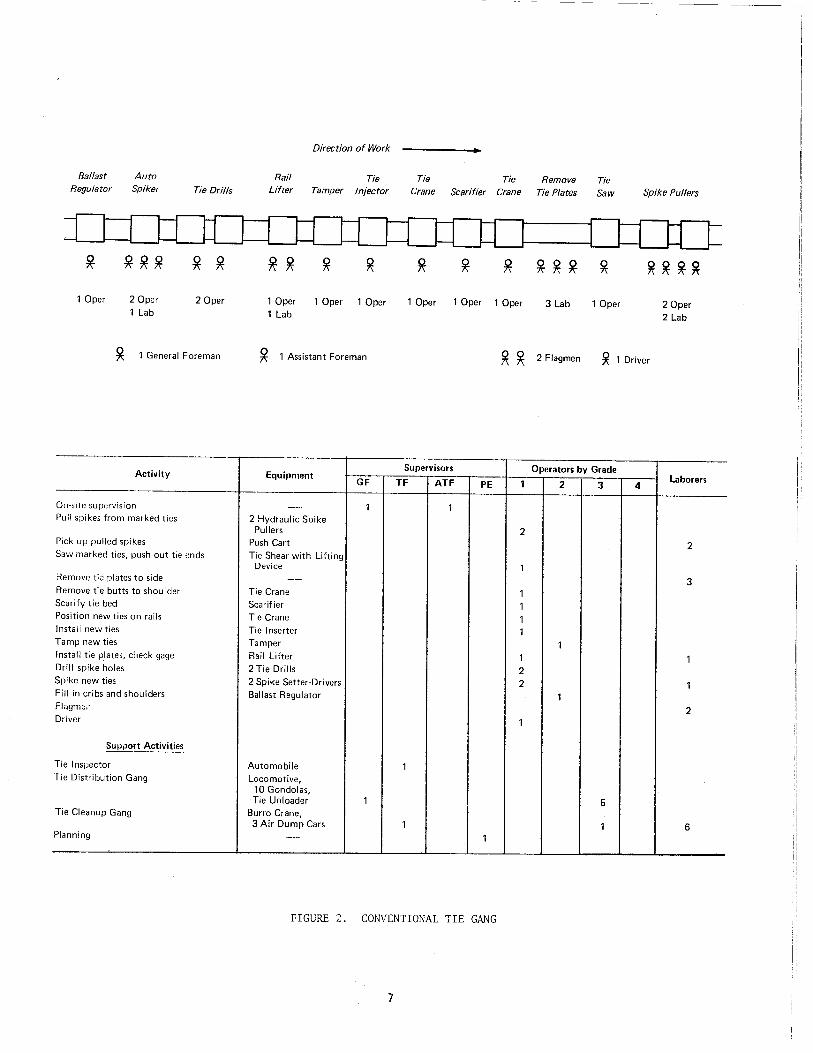
b. Selective Maintenance Operation: Ballast Cleaning Gang. The ballast cleaning gang is shown graphically in figure 3 on page 8. This gang's fuction is to undercut and clean existing ballast to improve the track structure. This gang is assumed to be able to cut 8 inches or more below the base of ties at an average 0.615 mile per 8-hour day (6.5 hours of track occupancy). The gang replaces ties that fall off the rails during cleaning, and tamps and compacts the ballast following cleaning.
The support activities of a ballast distribution train and fouled material train are not included in this description.
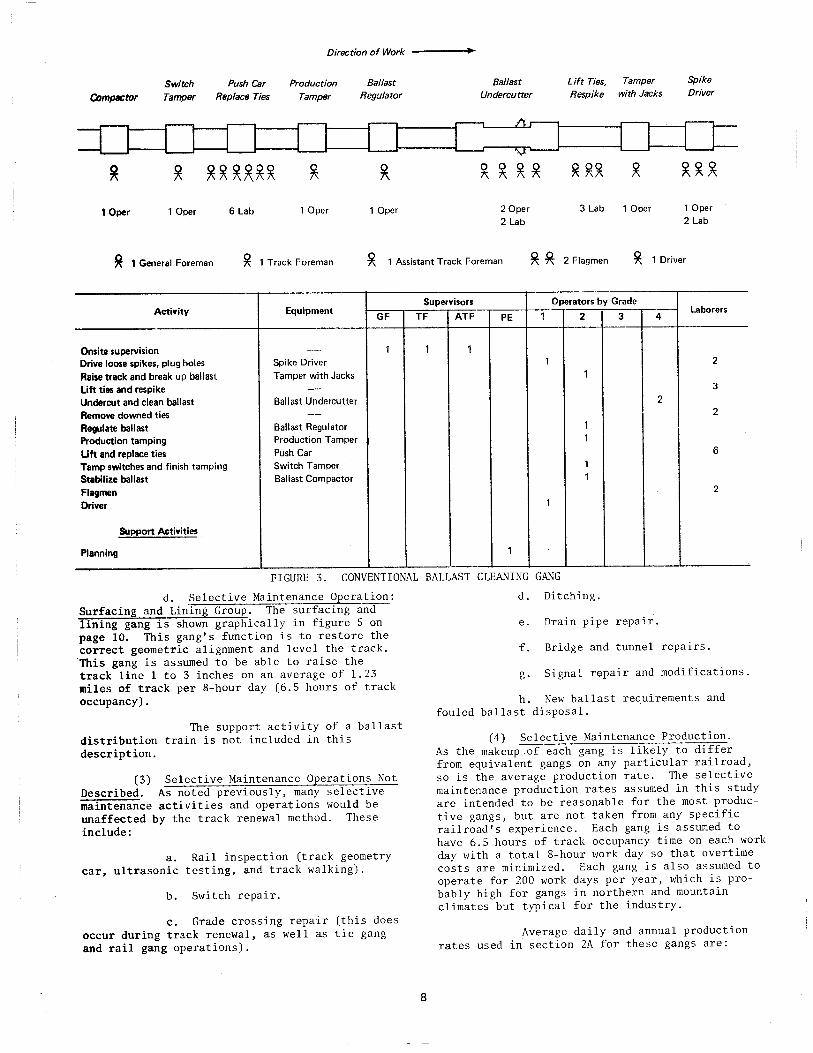
c. Selective Maintenance Operation: Rail Gang. The rail gang is shown graphically in figure 4 on page 9. This gang's function is to replace worn out rail with new or reconditioned rail. For the purpose of this study, it is assumed that the old rail is jointed and the new rail is continuously welded rail (CWR). The rail gang uses the single rail method (one rail at a time is removed and replaced) and installs 4 rail strings (0.54 mile of track) per 8-hour day (6.5 hours of track occupancy).
Support activities also include OTM distribution, OTM cleanup, and planning. Support activities that are not considered in this study, because they would be about the same with track renewal, are: rail inspection (track geometry car, ultrasonic testing); rail distribution; field welding; rail stressing; and rail salvage.
Ballast Regulator
1 Oper
Auto Spiker
2 Oper 1 Lab
Tie Drills
2 Oper
~ 1 General Foreman
Activity
On-site supervision Pull spikes from marked ties
Pick up pulled spikes Saw marked ties, push out tie ;mds
Hemove tie plates to side Remove tie butts to shoulder Scarify tie bed Position new ties on rails Install new ties Tamp new ties Install tie plates, check gage Drill spike holes Spike new ties Fill in cribs and shoulders Flagme.1 Driver
Support Activities
Tie Inspector Tie Distribution Gang
Tie Cleanup Gang
Planning
Direction of Work
Rail Lifter
Tie Tamper Injector
1 Oper 1 Lab
1 Oper 1 Oper
~ 1 Assistant Foreman
Equipment GF
---- 1 2 Hydraulic Spike
Pullers Push Cart Tie Shear with Lifting
Device ---
Tie Crane Scarifier Tie Crane Tie Inserter Tamper Rail Lifter 2 Tie Drills 2 Spike Setter-Drivers Ballast Regulator
Automobile Locomotive,
10 Gondolas, Tie Unloader 1
Burro Crane, 3 Air Dump Cars
---·
Tie Tie Remove Crane Scarifier Crane Tie Plates
1 Oper 1 Oper 1 Oper 3 Lab
~ ~ 2 Flagmen
Tie Saw
1 Oper
Spike Pullers
2 Oper 2 Lab
~ 1 Driver
Supervisors Operators by Grade TF ATF PE 1 2 3 4
Laborers
1
2
2
1
3 1 1 1 1
1 1 1 2 2 1
1
2 1
1
5
1 1 6 1
FIGURE 2. CONVENTIONAL TIE GANG
7
Direction of Work ----.-..
Switch Push Car
Compactor Tamper Replace Ties
1 Oper 1 Oper 6 Lab
Production Tamper
1 Oper
Ballast Regulator
1 Oper
Ballast Undercutter
2 Oper 2 Lab
Lift Ties, Respike
3 Lab
Tamper with Jacks
1 Oper
Spike Driver
1 Oper 2 Lab
~ 1 General Foreman ~ 1 Track Foreman ~ 1 Assistant Track Foreman ~ ~ 2 Flagmen ~ 1 Driver
Activity Equipment Supervisors Operators by Grade
GF TF ATF PE 1 2 3 4 Laborers
Onsite supervision --- 1 1 1 Drive loose spikes, plug holes Spike Driver 1 2
Raise track and break up ballast Tamper with Jacks 1
Lift ties and respike -- 3
Undercut and clean ballast Ballast Undercutter 2
Remove downed ties -- 2
Regulate ballast Ballast Regu I a tor 1
Production tamping Production Tamper 1
Lift and replace ties Push Car 6
Tamp switches and finish tamping Switch Tamper 1
Stabilize ballast Ballast Compactor 1
Flagmen 2
Driver 1
Support Activities
Planning 1
FIGURE 3. CONVENTIONAL BALLAST CLEANING GANG
d. Selective Maintenance Operation: Surfacing and Lining Group. The surfacing and lining gang is shown graphically in figure 5 on page 10. This gang's function is to restore the correct geometric alignment and level the track. This gang is assumed to be able to raise the track line 1 to 3 inches on an average of 1.23 miles of track per 8-hour day (6.5 hours of track occupancy).
The support activity of a ballast distribution train is not included in this description.
(3) Selective Maintenance Operations Not Described. As noted previously, many selective maintenance activities and operations would be unaffected by the track renewal method. These include:
a. Rail inspection (track geometry car, ultrasonic testing, and track walking).
b. Switch repair.
c. Grade crossing repair (this does occur during track renewal, as well as tie gang and rail gang operations).
8
d. Ditching.
e. Drain pipe repair.
f. Bridge and tunnel repairs.
g. Signal repair and modifications.
h. New ballast requirements and fouled ballast disposal.
(4) Selective Maintenance Production. As the makeup of each gang is likely to differ from equivalent gangs on any particular railroad, so is the average production rate. The selective maintenance production rates assumed in this study are intended to be reasonable for the most productive gangs, but are not taken from any specific railroad's experience. Each gang is assumed to have 6.5 hours of track occupancy time on each work day with a total 8-hour work day so that overtime costs are minimized. Each gang is also assumed to operate for 200 work days per year, which is probably high for gangs in northern and mountain climates but typical for the industry.
Average daily and annual production rates used in section 2A for these gangs are:
Tie Adzers
~ ~
2 Oper
Anchor Applicators
Ballast Cribber
~
1 Oper
Position Anchors
Tie Plug Drivers
---~ ~
2 Oper
Spike Drivers
Direction of Work
Remove Tie Plates
Move Old Collect OTM Bolt Machines Rail to Side Push Cart Remove Joints
~~~~ ~~~~ ~~~~ ~ ~~
4 Lab 4 Lab 4 Lab 2 Oper 1 Lab
Tie Distribute Check Adjust Drills OTM Gage Plates Tamper
Spike Pullers
~ ~ ~ ~ 4 Oper 1 Lab
Speed Gage Swing Rail
2 Oper 3 Lab 2 Oper 2 Oper 2 Lab 2 Lab 1 Lab 1 Oper 1 Oper 1 Oper 1 Lab
~ 1 General Foreman ~ 1 Track Foreman ~ 1 Assistant Track Foreman ~ ~ 2 Flagmen
Activity Equipment Supervisors Operators by Grade
GF TF ATF PE 1 2 3 Onsite supervision - 1 1 2 Thread new rail into track center Burro Crane 1 Crib ballast between ties to facilitate
adzing Cribber 1 Pull all spikes, remove any anchors, pile 4 Hydraulic Spike clear of track Pullers 4
Remove joint bars and pile clear of track Bolt Machines, Torch 2
Collect and load used OTM Push Cart Remove old rail to shoulder --Remove tie plates to shoulder -Plug all spike holes with treated wood
plugs 2 Tie Plug Drivers 2 Adze tie plate areas on all ties 2 Tie Adzers 2 APPlY creosote to adzed surfaces Creosote Machine 1 Place tie plates on all ties --· Set tie plates to correct gage; insert gage
plugs Gager 1 Sweep plate area and set new rail onto
tie plates Speed Swing 1 Tamp ties Tamper 1 Straighten tie plates --Check track gage Gager Distribute spikes and anchors to
installation points Push Cart Drill spike holes in ties 2 Tie Drills 2 Drive spikes into ties 2 Spike Setter/Drivers 2 Set rail anchors on base of rail --·
Secure anchors to rail 2 Anchor Applicators 2 Flagmen Driver
1
Support Activities
OTM Distribution Gang Burro Crane, 2 Gondolas 1 1
OTM Cleanup Gang Burro Crane, 2 Gondolas 1 1
Planning -·-· 1
FIGURE 4. RAIL GANG
9
Burro Crane Thread Rail
~ ~~ 1 Oper 1 Lab
Set Tie Creosote Plates Machine
4 Lab 1 Oper
~ 1 Driver
4 Laborers
1
1
1 4 4 4
4
1
1 2
2
3
2
2
2
Daily Production Annual Gang (Track Miles per Production
6.5-Hour Day) (Track Miles)
Rail Gang 0.54 108
OTM Distribution 0.54
OTM Cleanup 2.50
Tie Gang (812 ties per mile) 1.00 200
Inspector 6.00
Tie Distribution 4.70
Tie Cleanup 1.00
Surface and Line 1. 23 246
Ballast Cleaning 0.615 123
Direction of Work
Switch Raise Ties, Production Ballast Tamper Fill Cribs Tamper Regulator
D D D ~~ ~ ~ ~ ~
2 Oper 2 Lab 1 Oper 1 Oper
~ 1 General Foreman ~~ 2 Flagmen ~ 1 Driver
Activity Equipment Supervisors Operators by Grade
GF TF ATF 1 2 3 4 Laborers
PE
Onsite supervision -· 1 Prepare ballast for tamping Ballast Regulator* 1 Tamp every other tie and line track Production Tamper
with Liner 1 Raise ties; fill in cribs --- 2 Tamp remaining ties; tamp switches Switch Tamper 2 Dress ballast- shape shoulder, fill in cribs, sweep track Ballast Regulator*
Flagmen 2 Driver 1
Support Activities
Planning 1
*Same machine
FIGURE 5. TRACK SURFACING AND ALIGm1ENT GANG
10
The rail gang production rate is tied to installation of 4 "strings" of continuously welded rail (CWR) per day, which is averaged by rail gangs on a number of railroads. The rates for the tie gang and surface and line gang have been made by several railroads as shown in the publication, Economics of Concrete and Wood Tie Track Structures.* The ballast undercuttingcleaning production rate is taken from a midwestern U.S. railroad's experience.
B. Track Renewal System Based Maintenance
The track renewal systems described below are representative of the kinds of operations required to rebuild or maintain railroad track using the renewal method. The system for installing concrete ties is very similar to those used by the National Railroad Passenger Corporation (Amtrak) and Canadian National Railways, Ltd. (CN Rail). The system for installing wood ties has no prototype, but is reasonable for the task using a basic engineering solution. As is done with the selective maintenance operations, the TRS's described here have sufficient detail that the reader may make adjustments and recalculate the costs.
(1) Track Renewal Maintenance Principles and Procedures. Track renewal is the primary method of track maintenance in Europe, the Soviet Union, China, India, and some other countries. It was developed in Europe in the early twentieth century and has been progressively more mechanized in the last 30 years. It is an uncommon concept in the United States (some industrial railroads use this method) and is not yet proven to be economically attractive.
A track renewal system (TRS) is a mechanized system designed for maintaining the track and can be used for the major rehabilitation ·of railroad track structures. The system is designed around a specialized machine or set of
*Report number FRA/ORD-78/2 prepared by Battelle-Columbus Laboratories and Bechtel Incorporated for the Federal Railroad Administration (1978), NTIS accession number 188688.
machines called a track renewal machine (TRM) or track laying machine (TLM), which takes up existing track and relays new track in a single pass. This specialized machine is supported by a wide range of other track maintenance equipment for such activities as removal of rail fasteners, application of rail fasteners and anchors, ballast cleaning, lining and tamping, etc. This framework describes a TRS built around the Canron P-811 TRM, shown in figure 6. Other TRM designs are discussed in chapter IV.
After the track has been completely rebuilt by the TRS, it should not need any further mechanized attention, other than lining and surfacing, until either the rails need replacing or enough ties need replacing (when either a selective tie gang or a TRS is used). The time will vary depending upon traffic, the environment, and the level of basic maintenance performed.
(2) Descriptions of Systems Based on Canron P-811 Track Renewal Machine. Two similar track renewal systems are described using the Canron P-811 TRM as the key machine in each system. The P-811 operation is described in chapter IV.
Long-term track maintenance operations that would be done under selective maintenance or track renewal at the same cost are not described, as noted in subsection A.
a. Track Renewal System: Wood Tie to Wood Tie. The function of this system is to change 100 percent of the wood ties, replacing them with new or reclaimed wood ties, and to line and surface the track. The system also may simultaneously change both rails and undercut and clean the ballast, but may omit these steps.
The system is shown as two subsystems. The TRM group is shown graphically in figure 7 on page 12. This group changes the ties and rails and applies rail fasteners and anchors. Support activities include preplating of new ties, OTM distribution, Or"M cleanup, tie car support for transportation, and planning. Support activties not included are rail inspection (track
FIGURE 6. CANRON P-811 TRACK RENEWAL MACHINE
11
i i
Tie Gantry
~ 1 Oper
7 Tie Cars
Pick Up Pick Up Remove Joints
2 Oper
1 Lab
Rollers
1 Lab
Plates
2 Lab
Direction of Work
Manually Pull Back Collect
Prepare Ties Remaining Spikes Hoe Spikes
~~
2 Lab
Anchor Applicators
2 Oper
1 Lab
~ 1 Lab
Spike Drivers
2 Oper
2 Lab
~~~ ~~~ 1 Oper 3 Lab 2 Lab
Tool Power Car Car
~ 1 General Foreman ~ 1 Engineer ~ 1 Track Foreman ~ 1 Assistant Track Foreman
Supervisors Activity Equipment
GF TF ATF PE
Onsite supervision - 1 1 1 1
Place rollers under rail, join rail lengths Push Car, Rail Puller
Pull 90% of spikes-- remaining spikes 4 Hydraulic Spike
hold gage Pullers
Collect and load S>Jikes Push Car
Prepare cut-in and cut-out locations -remove ties by hand, crib ballast Back Hoe
Manually pull remaining spikes ---Move new ties to P-811, old ties to tie 7 Tie Cars, 2 Gantry
cars, secure ties Cranes
P-811 TRM -- pick up old ties; transfer old ties to tie exchange car; irnrtall new ties; install new rails; manually remove old tie plates; manually straighten new tie plates P-811 TRM
Drive spikes (outside spikes previously set.by preplate operation; inside spikes to be set and driven) 2 Spike-Setter/Drivers
Place and secure rail anchors on rail base 2 Anchor Applicators
Pick up rollers Push Car
Pick up tie plates from shoulder Push Car
Disassemble old rails Bolt Machines, Torch
Flagmen
Driver
Support Activities.
Preplate Operation -- plate all new ties Hoist, Milling Machin~; Preplate Equipment
OTM Distribution Burro Crane, 2 Gondolas I
OTM Cleanup Burro Crane, 2 Gondolas 1
Tie Car Support for Transportation Locomotive, 54 Tie Cars
Planning ---- 4
Remove 90% of Spikes
Spike Pullers
~ ~ ~ ~ 4 Oper
Place Rollers
Under Rail
~~
2 Lab
P-811 TRM Tie Exchange Tie
Working Beam
40per
7 Lab
Car Gantry
1 Oper
~ ~ 2 Flagmen ~ ~ 2 Drivers
Operators by Grade taborers --
1 2 3 4
2
4 3
1 2 1
2 3
4 6
2 2
2 1 1 2
2 1
-· 2
2
8
1 2
1 2
4
FIGURE 7. TRACK RENEWAL SYSTEM - TRM GROUP - INSTALLING WOOD TIES
12

geometry car and ultrasonic); CWR distribution; field welding; rail stressing; and CWR pickup.
The second subsystem is the ballast cleaning group. This group is separate so that it can be replaced by the selective maintenance surfacing and aligning gang if the reader wishes to forego ballast cleaning, which is optional with both selective and the track renewal method. The ballast cleaning group is shown graphically in figure 8. The support activities of a ballast distribution train and fouled material train are not included.
This gang is smaller than the equivalent selective maintenance gangs, primarily because it follows directly behind a TRM group that is putting spikes into new ties. There is little need for labor to pick up ties that fall when the track is picked up by the undercuttercleaner.
b. Track Renewal System: Wood Tie to Concrete Tie. This system differs from the preceding system in that it installs concrete ties instead of wood ties.
Fastening operations behind the · TRM are different and the support operations are different. The TRJ\1 group is shown graphically in figure 9 on the following page. Support activities include OTM cleanup, tie car support for transportation, and planning. Support activities not included are rail inspection, CWR distribution, field welding, rail stressing, and CWR pickup.
Compactor
~
1 Oper
Switch Tamper
~
1 Oper
Ballast Regulator
~
1 Oper
Direction of Work
Production Tampers
~ ~
2 Oper
The ballast cleaning group is unchanged (see figure 8).
(3) Production Capabilities of the Canron P-811 TRM. The average daily production volume that can be obtained from a P-811, or any other TRM, depends on a number of factors and would vary from railroad to railroad and even from track to track. The primary variable affecting daily production is the length of time available for production, which is a function of the track occupancy time.
Other factors include the condition of the ties and ballast, the size and makeup of the total TRS crew, management and supervisory skills, the kind of ties being installed, production capacity of the tie cars and associated gangs.
In Italy, the P-811 machines install 800 to 1,600 ties in 80 to 90 minutes of production in a total of 3 to 3.5 hours of track occupancy time. The production time includes breakdowns and downtime to cross turnouts, grade crossings, and other obstructions. The hourly production rate falls into a range of 533 to 1,200 ties installed per hour of production time. The midpoint of this range is 867 ties installed per hour.
Canadian National's P-811 installs an average of 3,000 concrete ties per day (3,692 wood ties removed) in a 5-hour production time of an 8-hour day. The hourly production rate is 600
Ballast Regulator
~
1 Oper
.. Ballast
Undercutter
~~~
2 Oper 1 Lab
Tamper with Jacks
~
1 Oper
~ 1 General Foreman ~ 1 Track Foreman ~ 1 Assistant Track Foreman
Supervisors Operators by Grade laborers
Activity Equipment GF TF ATF PE 1 2 3 4
Onsite supervision -·- 1 1 1 Raise track-- break up ballast Tamper with Jacks 1 Undercut and clean ballast 2 1 Regulate ballast Ballast Regulator 1 Production tamping and lining 2 Production
Tampers with Lining 2 Regulate ballast Ballast Regulator 1 Finish tamp and tamp switches Switch Tamper 1 Stabilize ballast Ballast Compactor 1
FIGURE 8. TRS BALLAST CLEANING AND SURFACING GROUP
13
Tie Gantry
~
1 Oper
Remove Joints
2 Oper 1 Lab
Tie Gantry 15 Tie Cars
~
1 Oper
Pick up Pick up
Rollers Plates
1 Lab 2 Lab
Direction of Work
Prepare Ties
~~~~
4 Lab
Rail Clip Applicators
3 Oper 4 Lab
Manually Pull Remaining Spikes
Back Hoe
Collect Spikes
~ ~~~ ~~~
1 Lab 1 Oper
3 Lab 2 Lab
Material Tool Car Car Power Car
2 Lab
Remove 90% of Spikes Spike Pullers
~ ~ ~ ~
40per
P-811 TRM
Working Beam
4 Oper 9 Lab
Tie Exchange Car
Place Rollers Under Rail
~~
2 Lab
Tie Gantry
1 Oper
~ 1 General Foreman ~ 1 Engineer ~ 1 Track Foreman ~ 1 Assistant Track Foreman ~ s;? 2 Flagmen ~ ~ 2 Drivers
Activity Equipment Supervisors Operators by Grade
GF TF ATF 1 2 3 Laborers
PE 4
Onsite supervision --- 1 1 1 1
Place rollers under rails, join rail lengths Push Car, Rail Puller 2
Pull 90% of spikes --·remaining spikes 4 Hydraulic Spike hold gage Pullers 4
Collect and load spikes Push Car 3
Prepare cut-in and cut-out locations; remove ties by hand; crib ballast Back Hoe 1 2
Manually pull remaining spikes -- 1
·Move new ties to P-811 and old ties to 15 Tie Cars, 3 Gantry cars; secure ties Cranes 3 5
TRM - pick up old rail and ties; transfer old ties to exchange car; manually move old tie plates to shoulder; install new ties; set tie pads; install new rails P-811 TRM 4 8
Distribute insulators and rail clips Gondola 2
Pick up tie plates from shoulder .Push Car 2
Set insulators and rail clips to ties and fasten 3 Clip Applicators 3 4
Pick up rollers Push Car 1
Disassemble old rails Bolt Machines, Torch 2 1
Flagmen ··---- 2
Driver --- 2
Support Activities
OTM Cleanup Burro Crane, 2 Gondolas 1 1 2
Tie Car Support for Transportation Locomotive, 126 Tie Cars 4
Planning -- 4
FIGURE 9. TRACK RENEWAL SYSTEM - TRM GROUP - INSTALLING CONCRETE TIES
14
concrete ties installed (738 wood ties removed) per hour. In a special test, this machine has installed ties at the rate of 22 per minute, or 1,320 per hour, but that rate was for a short time period without any downtime and cannot be maintained for an extended time.
Amtrak's P-811 has equaled Canadian National's hourly production rate on some days, but averaged only 1,653 concrete ties installed (2,034 wood ties removed) per day in 1979, with over 6 hours available for production each day. This production rate is less than 275 concrete ties installed (339 wood ties removed) per hour.
Amtrak's low production rate resulted from a considerable number of machine breakdowns and operational delays, which Amtrak seemed to be effectively reducing late in the 1979 track laying season. The sustained production during the last two months of the season seems to indicate that the machine will install at least 330 ties per hour of production time (369 wood ties removed) or about 2,000 ties per day in the future.
Based on these production rates, a rate of 576 wood ties installed per hour of production time is used for this study. This rate is less than that maintained for 2 years by Canadian National and by track maintenance contractors in Italy. It is probably a conservative estimate for installing wood ties since the tie pickup process is more complicated than tie installation by the P-811 and CN is picking up 738 wood ties per hour.
The daily production rate is obtained by estimating the TRS and TRM daily operational breakdown. Costing for all gangs is based on an 8-hour work day with 6.5 hours track occupancy time. Within the 6.5 hours, it is estimated that 0.5 hour would be required for travel time between the staging base to the work site and 1.0 hour would be required for startup and cleanup work. This leaves an average of 5 hours per day for production, including downtime. At the rate of 576 ties installed per hour, the daily average ties installed would be 2,880.
A slightly higher daily production rate of 2,940 ties is used for installing concrete ties. This was chosen to conform with the capacity of 14 tie cars. It is still slightly less than the average production rate claimed by Canadian National.
Based on the experience of Amtrak and Italian contractors, the average rates used in this study could be either high or low depending on circumstances. The TRM, and therefore the TRS, daily average capacity during a full 8-hour work shift with approximately 6.5 hours of track occupancy time could range from approximately 1,800 to 5,000 ties installed. Because this is such a high variation, the sample economic analysis in chapter III includes long-term costs calculated for production rates of 1,920 wood ties (1,890 concrete ties) per day installed and 3,840 wood ties (3,990 concrete ties) per day installed.
15
These are arbitrary rates that correspond to capacities of full tie cars.
Average daily and annual production rates, based on 200 days of production, used in section 2A for track renewal system gangs are:
Daily Produc- Annual
Gang tion (Track Production Miles per 6.5- (Track Miles) Hour Daz:)
TRS - Wood to Wood 0.886* 177
OTM Distribution 6.0
OTM Cleanup 1.5
TRS- Wood to Concrete 1.114** 222
OTM Cleanup 1.5
*2,880 ties installed at 19.5-inch centers. **2,940 ties installed at 24.0-inch centers.
2. Cost Factors Associated·with Track Maintenance and Wood Tie Reuse
The methodology for obtaining total operational costs and benefits for each operation described in section 1 is described in the following subsections. Operation or gang costs development is presented first, with the discussion organized by type of cost rather than by gang. This is followed by a presentation of how material credit for used wood ties, and.other materials, if desired, can be obtained.
The costs and material credits developed in this section are developed with some precision, but they reflect the assumptions made to describe a generalized situation and use costs that were current in January 1980. If the total gang costs and material credits developed here are used without modification, the reader should bear in mind that his first-year and long-term economic evaluation is only general, providing trends but not precise answers.
A. Operational Costs for Track Maintenance
The development of total costs to operate each of the gangs described in section l of this chapter is explained here. When all of these costs~ plus the material credits (described in section B), are determined, the long-term cost evaluation (described in section 3) can begin.
The procedures described in this section are shown on the flow chart (figure 10), which brPaks step 2A in figure l down into finer tasks.
Each operation has 5 separate cost areas, each requiring a different procedure. These cost areas are:
a. Capital recovery cost. b. New material cost. c. Labor cost. d. Equipment maintenance and fuel costs. e. Tie transportation cost.
lA, lB Description of Maintenance Methods
2A Track Maintenance Costs per Gang
I I I I I Capital Unit Material Unit Labor Unit Equipment Maintenance Tie Transportation Costs to Cost Costs to Costs Costs to Unit Costs to Costs Calculate Costs per Mile per Mile Costs per Mile per Mile per Mile
L I I J I I I Total Costs per I
Mile per Gang
3 Long-Term Costing Methodology
FIGURE 10. TRACK MAINTENANCE COSTS PER GANG FLOW CHART
The procedures to develop these costs for each gang is presented in the following subsections. An "audit trail" of cost tables is provided to the reader for each track maintenance gang so that any gang description or unit cost may be changed to suit specific conditions.
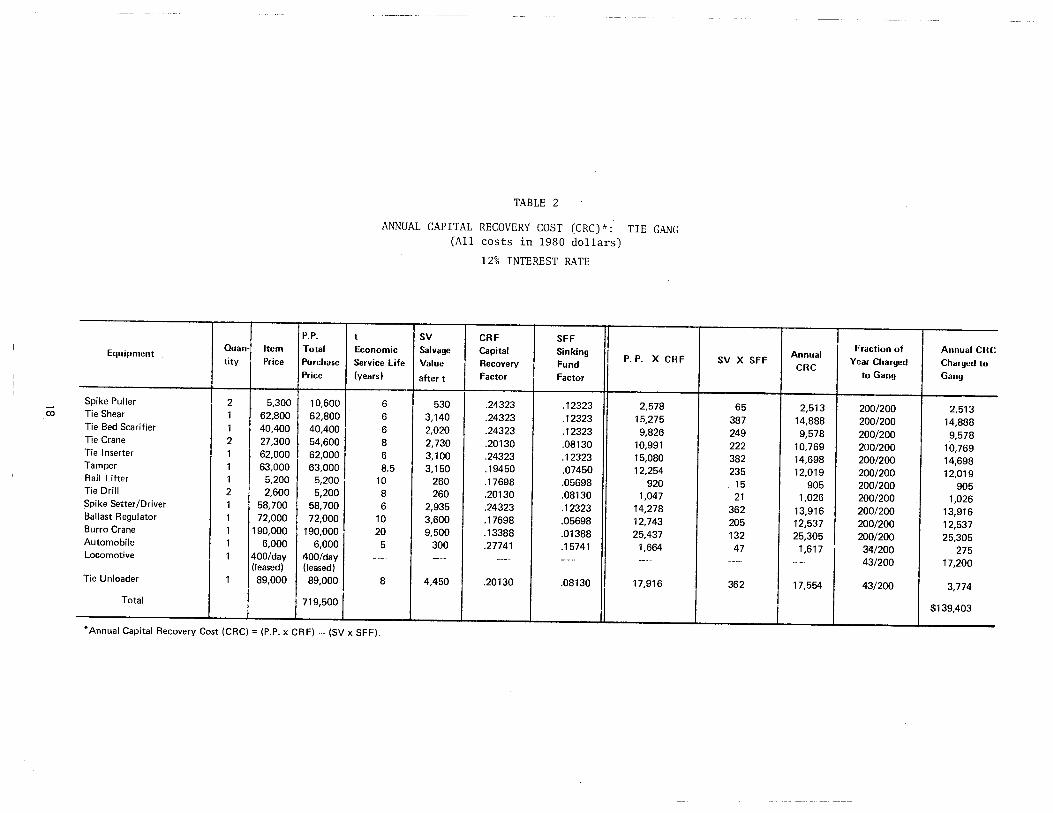
(1) Equipment Capital Recovery Costs. The cost to maintain and run equipment does not in itself cover the full expense of equipment usage. The equipment must be purchased or leased, against which a capital or rental cost is applied. This study has assumed that all track maintenance machinery is purchased new with the exception of flat cars, gondolas, ~nd
locomotives which are assumed to be leased from a pool of secondhand equipment on hand in any given railroad's inventory.
The equipment is assumed to be at least 10 years old and already written off or fully depreciated. Because the equipment is usable elsewhere on the railroad, a per diem or daily rental is charged for its use.
Inquiry into railroad industry practice finds that this equipment would be least likely to be purchased new for the track maintenance tasks assigned here. The rental or lease charges used in this study are average figures based on the rates used by several midwestern railroads.
The bulk of the equipment is dedicated track maintenance machinery which normally has a limited service life, after which it has only scrap or possibly spare parts value. While most, if not all, conventional track maintenance machines would already be owned by a railroad, they are continually being replaced with new machines. Thus, while this study assumes that these machines are purchased new, against which a capital recovery cost based on a new cost is assessed, a railroad could alternatively apply a lease cost against the undepreciated value of the machines already on hand, in a site-specific case.
16
The capital recovery cost (CRC) for a piece of equipment purchased is the equivalent annual cost which covers depreciation (loss in value of the asset) and the interest rate on the capital expended for that piece of equipment. While there are several methods of calculating depreciation, it can be shown that the equivalent annual cost of the capital recovery is the same no matter which method of depreciation is used.
The CRC is calculated for all the track maintenance equipment purchased for the various track maintenance gangs associated with either the selective maintenance or track renewal methods of track maintenance. The CRC for a piece of equipment depends on the purchase price or new cost of the equipment, the service life over which it is being depreciated, the salvage value at the end of its service life, and the interest rate.
Table 1, on page 17, lists all the types of equipment purchased for either method of track maintenance. The table shows the new cost of each piece of equipment as well as its expected service life, in years, or as a function of mileage, wherever possible for the machine type. All cost figures are based on manufacturer's quotes in 1980.
The table also shows the Canron Rail Group's quoted price of $1,900,000 for a P-811 track renewal machine (TRM), which also includes the cost of the gantry crane syst~m with two gantries and the tie exchange car. The 10-year service life was arbitrarily set as an economic period over which the machine may be depreciated, at an annual produc,tion rate of about 180 track miles.
Tables 2 through 8, on pages 18 through 24, show the derivation of the annual capital recovery costs for the seven track maintenance gangs that constitute the two methods of track maintenance under study. For example, table 6 lists the equipment required along with the variables and factors necessary to calculate
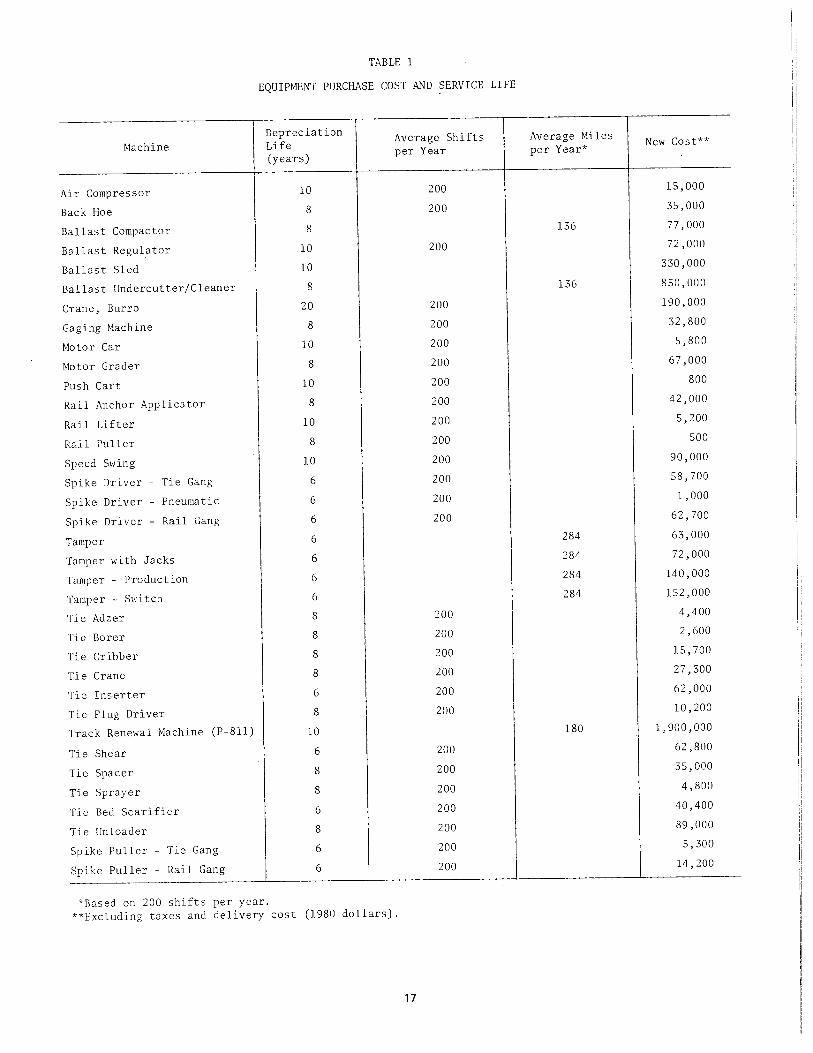
TABLE 1
EQUIPMENT PURCHASE COST AND SERVICE LIFE
Depreciation Average Shifts Average Miles
Machine Life New Cost**
(years) per Year per Year*
Air Compressor 10 200 15,000
Back Hoe 8 200 35,000
Ballast Compactor 8 136 77,000
Ballast Regulator 10 200 72,000
Ballast Sled 10 330,000
Ballast Undercutter/Cleaner 8 136 850,000
Crane, Burro 20 200 190,000
Gaging Machine 8 200 32,800
Motor Car 10 200 5,800
Motor Grader 8 200 67,000
Push Cart 10 200 800
Rail Anchor Applicator 8 200 42,000
Rail Lifter 10 200 5,200
Rail Puller 8 200 500
Speed Swing 10 200 90,000
Spike Driver - Tie Gang 6 200 58,700
Spike Driver - Pneumatic 6 200 1,000
Spike Driver - Rail Gang 6 200 62,700
Tamper 6 284 63,000
Tamper with Jacks 6 284 72,000
Tamper - Production 6 284 140,000
Tamper - Switch 6 284 152,000
Tie Adzer 8 200 4,400
Tie Borer 8 200 2,600
Tie Cribber 8 200 15,700
Tie Crane 8 200 27,300
Tie Inserter 6 200 62,000
Tie Plug Driver 8 200 10,200
Track Renewal Machine (P-8ll) 10 180 1,900,000
Tie Shear 6 200 62,800
Tie Spacer 8 200 35,000
Tie Sprayer 8 200 4,800
Tie Bed Scarifier 6 200 40,400
Tie Unloader 8 200 89,000
Spike Puller - Tie Gang 6 200 5,300
Spike Puller - Rail Gang 6 200 14,200
*Based on 200 shifts per year.
**Excluding taxes and delivery cost (1980 dollars).
17
OJ
P.P. Ouan- Item Total Equipment tity Price Purchase
Price
Spike Puller 2 5,300 10,600 Tie Shear 1 62,800 62,800 Tie Bed Scarifier 1 40.400 40,400 Tie Crane 2 27,300 54,600 Tie Inserter 1 62,000 62,000 Tamper 1 63,000 63,000 Rail Lifter 1 5,200 5,200 Tie Drill 2 2,600 5,200 Spike Setter/Driver 1 58,700 58,700 Ballast Regulator 1 72,000 72,000 Burro Crane 1 190,000 190,000 Automobile 1 6,000 6,000 Locomotive 1 400/day 400/day
(leased} (leased} Tie Unloader 1 89,000 89,000
Total 719,500
TABLE 2
ANNUAL CAPITAL RECOVERY COST (CRC)*: TIE GANG (All costs in 1980 dollars)
12% INTEREST RATE
t sv CRF SFF Economic Salvage Capital Sinking
P. P. X CRF Service life Value Recovery Fund (years} after t Factor Factor
6 530 .24323 .12323 2,578 6 3,140 .24323 .12323 15,275 6 2,020 .24323 .12323 9,826 8 2.730 .20130 .08130 10,991 6 3,100 .24323 .12323 15,080 8.5 3,150 .19450 .07450 12,254
10 260 .17698 .05698 920 8 260 .20130 .08130 1,047 6 2,935 .24323 .12323 14,278
10 3,600 .17698 .05698 12,743 20 9,500 .13388 .01388 25.437
5 300 .27741 .15741 1,664 ---" -- ---' -•r•• ---
8 4,450 .20130 .08130 17,916
*Annual Capital Recovery Cost (CRC) = (P.P. x CRF)- (SV x SFF).
Annual Fraction of Annual CRC
SV X SFF Year Charged Charged to CRC to Gang Gang
65 2,513 200/200 2,513 387 14,888 200/200 14,888 249 9,578 200/200 9,578 222 10,769 200/200 10.769 382 14,698 200/200 14,698 235 12,019 200/200 12,019
15 905 200/200 905 21 1,026 200/200 1,026
362 13,916 200/200 13,916 205 12,537 200/200 12,537 132 25,305 200/200 25,305 47 1,617 34/200 275
---- -· ·- 43/200 17,200
362 17,554 43/200 3,774
$139,403
__,. CD
P.P.
Ouan· Item Total Equipment
tity Price Purchase Price
Spike Driver 1 1,000 1,000
Air Compressor 1 15,000 15,000
Tamper 1 72,000 72,000
Ballast Undercutter 1 850,000 850,000
Ballast Regulator 1 72,000 72,000
Production Tamper/Liner 1 140,000 140,000
Push Cart 1 800 800
Switch Tamper 1 152,000 152,000
Ballast Compactor 1 77,000 77,000
Total 1,379,800
TABLE 3
ANNUAL CAPITAL RECOVERY COST (CRC)*: BALLAST CLEANING
(All costs in 1980 dollars)
12% INTEREST RATE
t sv CRF SFF
Economic Salvage Capital Sinking
Service Life Value Recovery Fund P. P. X CRF
(years) after t Factor Factor
6 50 .24323 .12323 243
10 750 .17698 .05698 2,655
10 3,600 .17698 .05698 12,743
9 42,500 .18768 .06768 159,528
10 3,600 .17698 .05698 12,743
10 7,000 .17698 .05698 24,777
10 40 .17698 .05698 142
10 7,600 .17698 .05698 26,901
9 3,850 .18768 .06768 14,451
• Annual Capital Recovery Cost (CRC) = (P.P. x CRF)- (SV x SFF).
Annual Fraction of Annual CRC
SV X SFF Year Clwrged Charged to CRC
to Gang Gang
6 237 200/200 237
43 2,612 200/200 2,612
205 12,537 200/200 12,537
2,876 156,652 200/200 156,652
205 12,537 200/200 12,537
399 24,378 200/200 24,378
2 139 200/200 139
433 26,468 200/200 26,468
261 14,191 200/200 14,191
$249,751
__j __ ··----- --- ----------
N 0
P.P. Ouan- Item Total Equipment tity Price Purchase
Price
Burro Crane 1 190,000 190,000 Spike Puller 2 14,200 28,400 .Bolt Machine 2 1,600 3,200 Speed Swing 1 90,000 90,000 Push Cart 2 800 1,600 Ballast Cribber 1 15,700 15,700 Tie Plug Driver 2 10,200 20,400 Tie Adzer 2 4,400 8,800 Tie Sprayer 1 4,800 4,800 Gager 1 32,800 32,800 Tamper 1 63,000 63,000 Tie Drill 2 2,600 5,200 Spike Setter/Driver 1 62,700 62,700 Anchor Applicator 2 42,000 84,000 Burro Crane 1 190,000 190,000 Gondola 2 2.50/day 5.00/day
(leased) (leased) Burro Crane 1 190,000 190,000 Gondola 2 2.50/day 5.00/day
(leased) (leased)
Total . 990,600
TABLE 4
ANNUAL CAPITAL RECOVERY COST (CRC)*: RAIL GANG (All costs in 1980 dollars)
12% INTEREST RATE
t sv CRF SFF Economic Salvage Capital Sinking Service life Value Recovery Fund P. P. X CRF
(years) after t Factor Factor
20 9,500 . 13388 .01388 . 25,437 6 1,420 .24323 .12323 6,908 6 160 .24323 .12323 788
10 4,500 .17698 .05698 15,928 10 80 .17698 .05698 283 8 785 .20130 .08130 3,160 8 1,020 .20130 .08130 4,107 8 440 .20130 .08130 1,771 8 240 .20130 .08130 966 8 1,640 .20130 .08130 6,603
10 3,150 .17698 .05698 11,150 8 260 .20130 .08130 1,047 6 ~.135 .24323 .12323 15,251 8 4,200 .20130 .08130 16,909
20 9,500 .13388 .01388 25,437 -- --- -- --·- ---
20 9,500 .13388 .01388 25,437 -·-- .. ---- -- --- --
*Annual Capital Recovery Cost (CRC) = (P.P. x CRF)- (SV x SFF).
Annual Fraction of Annual CRC
SV X SFF CRC
Year Charged Charged to to Gang Gang
132 25,305 200/200 25,305 175 6,733 200/200 6,733 . 20 759 200/200 759 256 15,672 200/200 15,672
5 279 200/200 279 64 3,097 200/200 3,097 83 4,024 200/200 4,024 36 1,736 200/200 1,736 20 947 200/200 947
133 6,469 200/200 6,469 179 10,970 200/200 10,970 21 1,026 200/200 1,026
386 14,864 200/200 14,864 341 16,568 200/200 16,568 132 25,305 200/200 25,305 -·- -- 200/200 1,000
132 25,305 43/200 5,441 ---- --- 43/200 I 215
140,408
1\.)
P.P.
Equipment Ouan· Item Total tity Price Purchase
Price
Ballast Regulator 1 72,000 72,000 Production Tamper/Liner 1 140,000 140,000 Switch Tamper
j __ 1_
152,000 152,000
Total 364,000 L__ ---- ----
TABLE 5
ANNUAL CAPITAL RECOVERY COST (CRC)*: SURFACE AND LINE (All costs in 1980 dollars)
12% INTEREST RATE
t sv CRF SFF Economic Salvage Capital Sinking
P. P. X CRF Service Life Value Recovery Fund (years) after t Factor Factor
10 3,600 .17698 .05698 12,743 7 7,000 .21912 .09912 30,677 7 7,000 .21912 .09912 33,306
----- - -- --· ---- ------------- --· -- --
*Annual Capital Recovery Cost (CRC) ~ (P.P. x CR F) - (SV x SFF).
Fraction of Annual CRC Annual SV X SFF Year Charged Charged to CRC
to Gang Gang
205 12,537 200/200 12,537 694 29,983 200/200 29,983 753 32,553 200/200 32,553
75,073 ------- --
N N
Ouan· Item Equipment
tity Price
Push Cart 4 800
Rail Puller 1 500
Spike Puller 2 14,200
Back Hoe 1 35,000
TRM (P-811) 1 1,900,000
Mechanics' Flat Car 1 2.50/day (leased)
Spike Setter/Driver 2 62,700
Anchor Applicator 2 42,000
Bolt Machine 2 1,600
Burro Crane 1 190,000
Gondola 2 2.50/day (leased)
Burro Crane 1 190,000
Gondola 2 2.50/day (leased)
Locomotive 1 400/day (leased)
Tie Milling Machine 1 50,000
Preplating Equipment 1 4:3,000
Magnetic Hoist 1 35,000
Total -----------
TABLE 6
ANNUAL CAPITAL RECOVERY COST (CRC)*: TRM GROUP INSTALLING WOOD TIES (All costs in 1980 dollars)
12% INTEREST RATE
P.P. t sv CRF SFF
Total Economic Salvage Capital Sinking P. P. X CRF SV X SFF
Purchase Service life Value Recovery Fund
Price (years) after t Factor Factor
3,200 10 160 .17698 .05698 566 9
500 8 25 .20130 .08130 101 2
28,400 6 1,420 .24323 .12323 6,908 175
35,000 8 1,750 .20130 .08130 7,046 142
1,900,000 10 95,000 .17698 .05698 336,262 5,413
2.50/day -----· --- -·- - . - ~ ---- --·
125,400 6 6,720 .24323 .12323 30,501 828
84,000 8 4,200 .20130 .08130 16,909 341
3,200 6 160 .24323 .12323 778 20
190,000 20 9,500 .13388 .01388 25,437 132
5.00/day ----- ---- -- ----· ···- ·-----
190,000 20 9,500 .13388 .01388 25,437 132
5.00/day ---- . ---. ----- -- ---- -·-
400/day ---- ---· ---- --- --- ---
50,000 10 2,500 .17698 .05698 I 8,849 142
48,000 10 2,400 .17698 .05698 8,495 137
35,000 10 1,750 .17698 .05695 I 6,194 100
2,692,700 I *Annual Capital Recovery Cost (CRC) = (P.P. x CRF)- (SV x SFF).
Annual Fraction of Annual CRC
Year Charged Charged to CRC to Gang Gang
557 200/200 557
99 200/200 99
6,733 200/200 6,733
6,903 200/200 6,903
330,849 200/200 330,849
-·- 200/200 500
29,673 200/200 29,673
16,568 200/200 16,568
759 200/200 759
25,305 30/200 3,796 --·-- 30/200 150
25,305 118/200 14,930 ---- 118/200 590
-·- 200/200 80,000
8,707 200/200 8,707
8,358 200/200 I 8,358
6,095 200/200 6,095
515,265
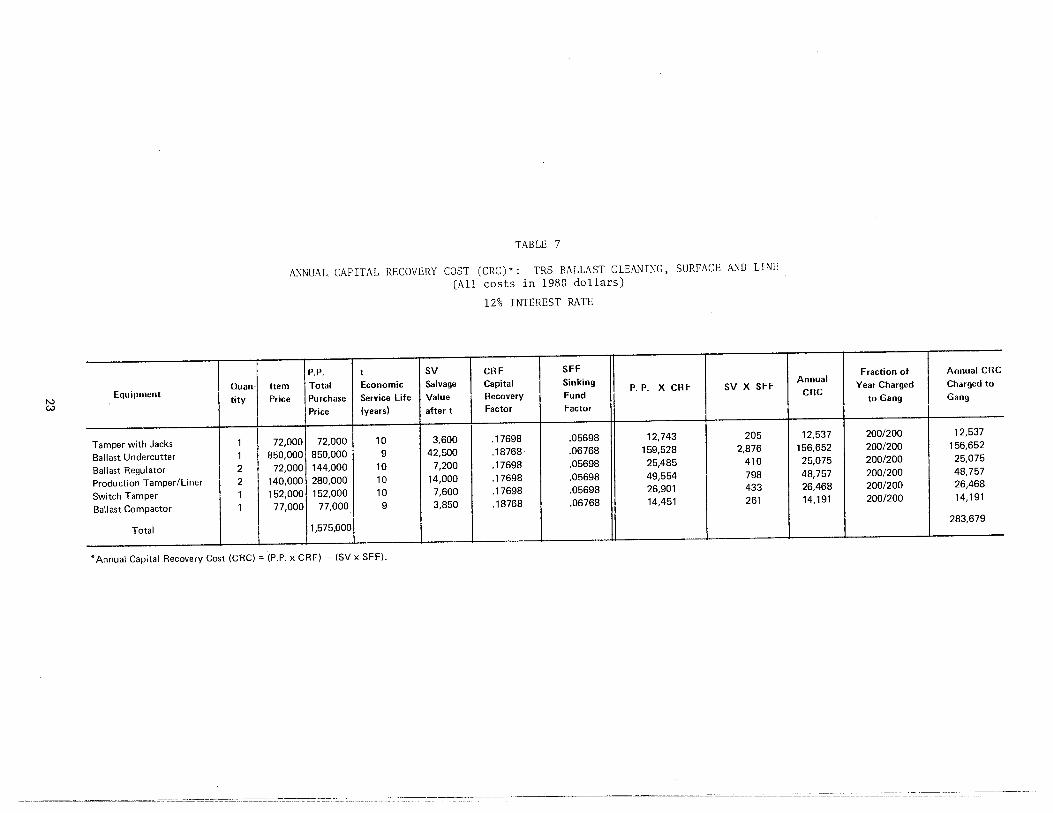
"" w
Ouan· Equipment
tity
Tamper with Jacks 1
Ballast Undercutter 1
Ballast Regulator 2
Production Tamper/Liner 2
Switch Tamper 1
Ballast Compactor 1
Total
TABLE 7
ANNUAL CAPITAL RECOVERY COST (CRC)*: TRS BALLAST CLEANING, SURFACE AND LINE
(All costs in 1980 dollars)
12% INTEREST RATE
P.P. t sv CRF SFF
Item Total Economic Salvage Capital Sinking P. P. X CRF SV X SFF
Price Purchase Service Life Value Recovery Fund
Price (years) after t Factor Factor
72,000 72,000 10 3,600 .17698 .05698 12,743 205
850,000 850,000 9 42,500 .18768 .06768 159,528 2,876
72,000 144,000 10 7,200 .17698 .05698 25,485 410
140,000 280,000 10 14,000 .17698 .05698 49,554 798
152,000 152,000 10 7,600 .17698 .05698 26,901 433
77,000 77,000 9 3,850 .18768 .06768 14,451 261
1,575,000 --~ -~
---~ --·- ..... --
*Annual Capital Recovery Cost (CRC); (P.P. x CRF)- (SV x SFF).
Fraction of Annual
Annual CRC
Year Charged Charged to CRC
to Gang Gang
12,537 200/200 12,537
156,652 200/200 156,652
25,075 200/200 25,075
48,757 200/200 48,757
26,468 200/200 26,468
14,191 200/200 14,191
283,679
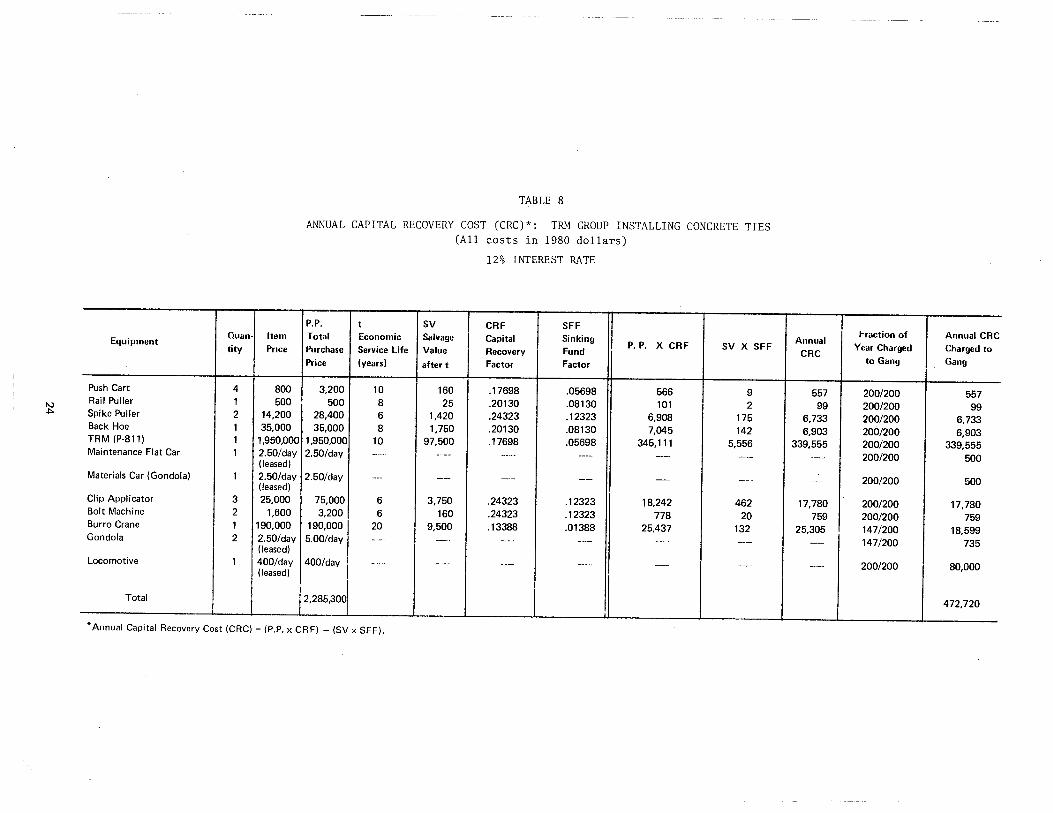
N .j>.
Quan· Item Equipment tity Price
Push Cart 4 800 Rail Puller 1 500 Spike Puller 2 14,200 Back Hoe 1 35,000 TRM (P-811) 1 1,950,000 Maintenance Flat Car 1 2.50/day
(leased) Materials Car (Gondola) 1 2.50/day
(leased) Clip Applicator 3 25,000 Bolt Machine 2 1,600 Burro Crane 1 190,000 Gondola 2 2.50/day
(leased) Locomotive 1 400/day
(leased)
Total
TABLE 8
ANNUAL CAPITAL RECOVERY COST (CRC)*: TRM GROUP INSTALLING CONCRETE TIES (All costs in 1980 dollars)
12% INTEREST RATE
P.P. t sv CRF SFF Total Economic Salvage Capital Sinking
P. P. X CRF SV X SFF Purchase Service life Value Recovery Fund Price (years) after t Factor Factor
3,200 10 160 .17698 .05698 566 9 500 8 25 .20130 .08130 101 2
28,400 6 1,420 .24323 .12323 6,908 175 35,000 8 1,750 .20130 .08130 7,045 142
1,950,000 10 97,500 .17698 .05698 345,111 5,556 2.50/day -- .... ----- --·-·- --- --- ---
2.50/day -- --- -- -- -- ---
75,000 6 3,750 .24323 .12323 18,242 462 3,200 6 160 .24323 .12323 778 20
190,000 20 9,500 .13388 .01388 25,437 132 5.00/day ---- --· ----- -- -- ---
400/day - ·- ---- -- ---- -- ---
2,285,30~ -----~----- ---------- ----~-- --· ------------- L__ l
*Annual Capital Recovery Cost (CRC) = (P.P. x CRF) - (SV x SFF).
Fraction of Annual Annual CRC Year Charged Charged to CRC
to Gang Gang
557 200/200 557 99 200/200 99
6,733 200/200 6,733 6,903 200/200 6,903
339,555 200/200 339,555 --- 200/200 500
--- 200/200 500
17,780 200/200 17,780 759 200/200 759
25,305 147/200 18,599 -- 147/200 735
-- 200/200 80,000
472,720
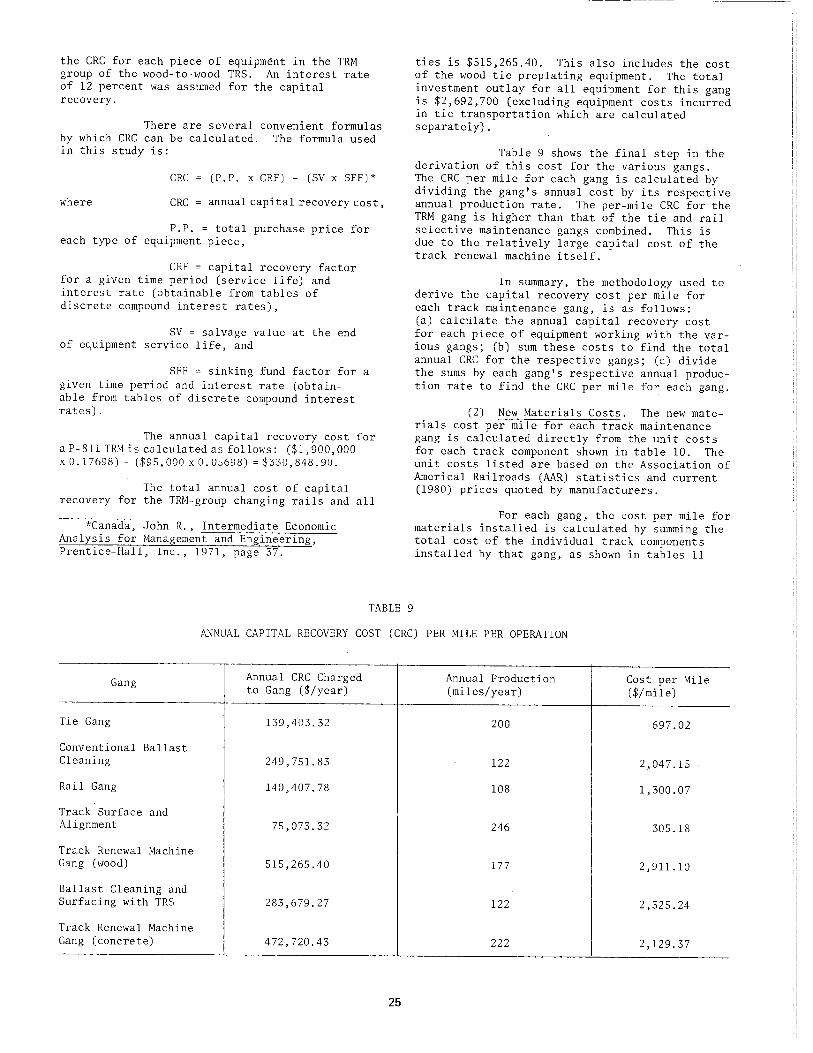
the CRC for each piece of equipment in the TRM group of the wood-to-wood TRS. An interest rate of 12 percent was assumed for the capital recovery.
There are several convenient formulas by which CRC can be calculated. The formula used in this study is:
CRC (P.P. x CRF) - (SV x SFF)*
where CRC annual capital recovery cost,
P.P. = total purchase price for each type of equipment piece,
CRF = capital recovery factor for a given time period (service life) and interest rate (obtainable from tables of discrete compound interest rates),
SV = salvage value at the end of equipment service life, and
SFF = sinking fund factor for a given time period and interest rate (obtainable from tables of discrete compound interest rates).
The annual capital recovery cost for a P-811 TRM is calculated as follows: ($1,900,000 x0.17698)- ($95,000x0.05698) =$330,848.90.
The total annual cost of capital recovery for the TRM-group changing rails and all
*Canada, John R., Intermediate Economic Analysis for Management and Engineering, Prentice-Hall, Inc., 1971, page 37.
- ~-- -------- ------
ties is $515,265.40. This also includes the cost of the wood tie preplating equipment. The total investment outlay for all equipment for this gang is $2,692,700 (excluding equipment costs incurred in tie transportation which are calculated separately}.
Table 9 shows the final step in the derivation of this cost for the various gangs. The CRC per mile for each gang is calculated by dividing the gang's annual cost by its respective annual production rate. The per-mile CRC for the TRM gang is higher than that of the tie and rail selective maintenance gangs combined. This is due to the relatively large capital cost of the track renewal machine itself.
In summary, the methodology used to derive the capital recovery cost per mile for each track maintenance gang, is as follows; (a} calculate the annual capital recovery cost for each piece of equipment working with the various gangs; (b) sum these costs to find the total annual CRC for the respective gangs; (c) divide the sums by each gang's respective annual production rate to find the CRC per mile for each gang.
(2) New Materials Costs. The new materials cost per mile for each track maintenance gang is calculated directly from the unit costs for each track component shown in table 10. The unit costs listed are based on the Association of America! Railroads (AAR) statistics and current (1980) prices quoted by manufacturers.
For each gang, the cost per mile for materials installed is calculated by summing the total cost of the individual track components installed by that gang, as shown in tables 11
TABLE 9
fu~NUAL CAPITAL RECOVERY COST (CRC) PER MILE PER OPERATION
Gang Annual CRC Charged Annual Production Cost per Mile to Gang ($/year) (miles/year) ($/mile)
Tie Gang 139,403.32 200 697.02
Conventional Ballast Cleaning 249,751.83 122 2,047.15
Rail Gang 140,407.78 108 1,300.07
Track Surface and Alignment 75,073.32 246 305.18
Track Renewal Machine Gang (wood) 515,265.40 177 2,911.10
Ballast Cleaning and Surfacing with TRS 283,679.27 122 2,325.24
Track Renewal Machine Gang (concrete) 472,720.43 222 2,129.37
25
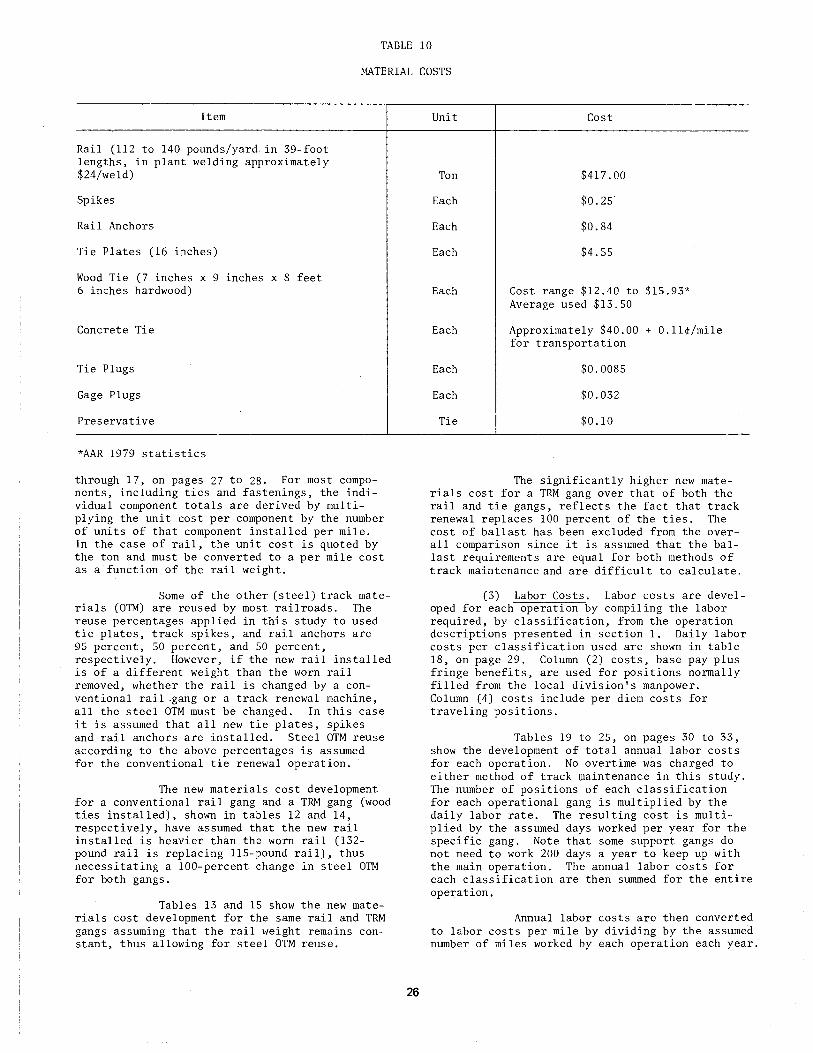
TABLE 10
MATERIAL COSTS
Item
Rail (112 to 140 pounds/yard. in 39-foot lengths, in plant welding approximately $24/weld)
Spikes
Rail Anchors
Tie Plates (16 inches)
Wood Tie (7 inches x 9 inches x 8 feet 6 inches hardwood)
Concrete Tie
Tie Plugs
Gage Plugs
Preservative
*AAR 1979 statistics
through 17, on pages 27 to 28. For most components, including ties and fastenings, the individual component totals are derived by multiplying the unit cost per component by the number of units of that component installed per mile. In the case of rail, the unit cost is quoted by the ton and must be converted to a per mile cost as a function of the rail weight.
Some of the other (steel) track materials (OTM) are reused by most railroads. The reuse percentages applied in this study to used tie plates, track spikes, and rail anchors are 95 percent, 50 percent, and 50 percent, respectively. However, if the new rail installed is of a different weight than the worn rail removed, whether the rail is changed by a conventional rail .gang or a track renewal machine, all the steel OTM must be changed. In this case it is assumed that all new tie plates, spikes and rail anchors are installed. Steel OTM reuse according to the above percentages is assumed for the conventional tie renewal operation.
The new materials cost development for a conventional rail gang and a TRM gang (wood ties installed), shown in tables 12 and 14, respectively, have assumed that the new rail installed is heavier than the worn rail (132-pound rail is replacing 115-pound rail), thus necessitating a 100-percent change in steel OTM for both gangs.
Tables 13 and 15 show the new materials cost development for the same rail and TRM gangs assuming that the rail weight remains constant, thus allowing for steel OTM reuse.
26
Unit Cost
Ton $417.00
Each $0.25
Each $0.84
Each $4.55
Each Cost range $12.40 to $15.93* Average used $13.50
Each Approximately $40.00 + 0.11¢/mile for transportation
Each $0.0085
Each $0.032
Tie $0.10
The significantly higher new materials cost for a TRM gang over that of both the rail and tie gangs, reflects the fact that track renewal replaces 100 percent of the ties. The cost of ballast has been excluded from the overall comparison since it is assumed that the ballast requirements are equal for both methods of track maintenance and are difficult to calculate.
(3) Labor Costs. Labor costs are developed for each operation by compiling the labor required, by classification, from the operation descriptions presented in section 1. Daily labor costs per classification used are shown in table 18, on page 29. Column (2) costs, base pay plus fringe benefits, are used for positions normally filled from the local division's manpower. Column (4) costs include per diem costs for traveling positions.
Tables 19 to 25, on pages 30 to 33, show the development of total annual labor costs for each operation. No overtime was charged to either method of track maintenance in this study. The number of positions of each classification for each operational gang is multiplied by the daily labor rate. The resulting cost is multiplied by the assumed days worked per year for the specific gang. Note that some support gangs do not need to work 200 days a year to keep up with the main operation. The annual labor costs for each classification are then summed for the entire operation.
Annual labor costs are then converted to labor costs per mile by dividing by the assumed number of miles worked by each operation each year.
TABLE 11
NEW MATERIALS COST PER MILE: TIE GANG REPLACING 25 PERCENT OF THE TIES
Material
Wood Tie
Spikes
Tie
Rai 1
Plates
Anc o h rs
Total Without Anchors
Total With Anchors
Unit
Each
Each
Each
Eac h
Cost/Unit Number/Mile
$ 13.50 812
$ 0.25 1,624
$ 4.55 81
$ 0. 84 8 12
TABLE 12
Cost/Mile
$10,962.00
$ 406.00
$ 368.55
8 8 $ 6 2.0
$11,736.55
$12,418.63
NEW MATERIALS COST PER MILE: RAIL GANG REPLACING JOINTED LIGHT RAIL WITH 132-POUND CWR
Material Unit Cost/Unit Number/Mile Cost/Mile
Rail Ton $417.00 232.32 $ 96,877.44 Factory Welding of Rail Welds $ 24.00 270.77 $ 6,498.46 Tie Plates Each $ 4.55 6,500 $ 29,575.00 Spikes Each $ 0.25 13,000 $ 3,250;00 Anchors Each $ 0.84 6,500 $ 5,460.00 Tie Plugs Each $ 0.0085 13,000 $ 110,50 Gage Plugs Each $ 0.032 1,625 $ 52.00 Preservative Tie $ 0.10 3,250 $ 325.00
Total $142,148.40
TABLE 13
NEW MATERIALS COST PER MILE: RAIL GANG REPLACING 132-POUND CWR WITH 132-POUND CWR
Material Unit Cost/Unit Number /Mile Cost/Mile
Rail Ton $417.00 232.32 $ 96,877.44 Factory Welding of Rail Weld $ 24.00 270.77 $ 6,498.46 Tie Plates Each $ 4.55 325 $ 1,478.75 Spikes Each $ 0.25 6,500 $ 1,625.00 Anchors Each $ 0.84 3,250 $ 2,730.00 Tie Plugs Each $ 0.0085 13,000 $ 110.50 Gage Plugs Each $ 0.032 1,625 $ 52.00 Preservative Tie $ 0.10 3,250 $ 325.00
Total $109,697.15
27
I I
TABLE 14
NEW MATERIALS COST PER MILE: TRSREPLACINGJOINTED LIGHT RAIL WITH 132-POUND CWR AND INSTALLING WOOD TIES
Material Unit
Rail Ton
Factory Welding of Rail Welds
Tie Plates Each
Spikes Each
Anchors Each
Wood Ties. Each
Total
Cost/Unit
$417.00
$ 24.00
$ 4.55
$ 0.25
$ 0.84
$ 13.50
TABLE 15
Number/Mile
232.32
270.77
6,500
13,000
6,500
3 250
Cost/Mile
$ 96,877.44
$ 6,498.46
$ 29,575.00
$ 3,250.00
$ 5,460.00
43 875.00 $
$185,535.90
NEW MATERIALS COST PER MILE: TRS REPLACING 132-POUND CWR WITH 132-POUND CWR AND INSTALLING WOOD TIES
Material Unit
Rail Ton
Factory Welding of Rail Welds
Tie Plates Each
Spikes Each
Anchors Each
Woo T. d les Ea ch
Total
Cost/Unit
$417.00
$ 24.00
$ 4.55
$ 0.25
$ 0.84
$ 13 .50
TABLE 16
Number/Mile
232.32
270.77
325
6,500
3,250
3 250
Cost/Mile
$ 96,877.44
$ 6,498.46
$ 1,478.75
$ 1,625.00
$ 2,730.00
875 0 $ 43, . 0
$153,084.65
NEW MATERIALS COST PER MILE: TRS NOT REPLACING RAILS AND INSTALLING WOOD TIES
Material Unit Cost/Unit Number/Mile Cost/Mile
Tie Plates Each $ 4.55 325 $ 1,478.75
Spikes Each $ 0.25 6,500 $ 1,625.00
Anchors Each $ 0.84 3,250 $ 2,730.00
Wood Ties Each $ 13.50 3 250 $ 43 875.00
Total $ 49,708.75
TABLE 17
NEW MATERIALS COST PER MILE: TRS REPLACING LIGHT JOINTED RAIL WITH 132-POUND CWR AND INSTALLING CONCRETE TIES
Material Unit Cost/Unit Number/Mile Cost/Mile
Rail Ton $417.00 232.32 $ 96,877.44
Factory Welding of Rail Welds $ 24.00 270.77 $ 6,498.46
Concrete Ties (including hardware Each $ 40.00 2 640 $105,600.00
Total $208,975.90
28
TABLE 18
DAILY LABOR COSTS BY CLASSIFICATION
Title
Project Engineer
General Foreman
Tie Inspector
Track Foreman
Track Foreman, Assistant
Operator Grade 4
Operator Grade 3
Operator Grade 2
Operator Grade 1
Laborer
*Monthly salary of $2,600. **Monthly salary of $2,300.
Base Pay per Day ($)
119. 54*
105.74**
84.64
73.60
69.52
90.64***
73. 76
72.00
65.68
62.84
Base Pay Plus 41% Expenses per Total Labor Fringe Benefits ($) Day ($) Cost ($)
168.55 40.00 208.55
149.09 40.00 189.09
119 0 34 40.00 159.34
103.78 12.00 ll5. 78
98.02 12.00 llO. 02
127.80 40.00 167.80
104.00 12.00 116.00
101.52 12.00 113.52
92.61 12.00 104.61
88.60 12.00 100.60
***To encourage experienced operators/mechanics to stay with the large machines, they should be paid a premium and full expenses.
This step is shown for all operations in table 26, on page 33.
(4) Equipment Maintenance and Fuel Costs. The cost of maintaining a piece of track machinery includes the costs of spare parts; grease; hydraulic and engine oils; and labor to maintain and repair the machine. It is usual for a major track maintenance gang to have one or more mechanics assigned to it on a full-time basis. These mechanics are not normally paid from the track maintenance crew's budget, but are instead accounted for in the cost to maintain the track maintenance machinery. The cost of fuel to run a machine is usually lumped together with maintenance costs, though calculated as a separate item. The overall maintenance cost for a machine or set of machines depends on many variables such as operator and mechanic skills, track design, track condition, machine design, and environmental conditions.
Upon investigation of these maintenance costs for individual pieces of conventional track maintenance equipment, it was discovered that while some railroads have attempted to compile these costs, the figures lacked consistency to give a statistically valid cost per time period of work. As an alternative to providing inconsistent (though site-specific or actual) track machinery maintenance costs, a method incorporating ICC accounting rules and AREA techniques relating maintenance costs to machine cost and usage is used to calculate track machine maintenance cost. The costs calculated by this method are shown in table 27, on page 34.
29
The method used to determine equipment maintenance cost stems from ICC accounting practices that require railroads to total the undepreciated value of work equipment (ICC Account 37) and to total the amount spent on maintaining work equipment (ICC Account 269). For most railroads, the ratio between the total undepreciated value and the total maintenance budget is in the region of five to one. This suggests that on the average, it takes 20 percent of the undepreciated value of work equipment to maintain that equipment each year.
A more detailed review of this relationship between capital and maintenance cost, done by the AREA, showed that the five-to-one ratio was not universal to all pieces of track maintenance equipment, but that heavy-use machines require more maintenance at a higher cost proportionately than do light-use machines. AREA Committee 27 designated three categories of track maintenance machinery -- light-use, average-use, and heavy-use -- and arbitrarily set the ratio between annual maintenance and capital cost at 1:10, 2:10, and 3:10 (or 0.1, 0.2, and 0.3), respectively, for the three categories.
This latter method was used to derive the maintenance costs of all conventional track maintenance machinery with the exception of the ballast undercutter. The cost to maintain this particular machine bears no such relationship to its purchase price and is therefore based on railroad and contractor experience with ballast undercutting/cleaning. The excessive wear rate of several maintenance points, particularly the
TABLE 19
ANNUAL LABOR COSTS: TIE GANG
Labor Classification Number Daily Labor Daily Labor Days Worked per Annual Labor Cost
per Gang Rate ($) Cost ($) Gang per Year Charged per Gang ($)
General Foreman s 1 189.09 189.09 200 37,818.00
Operator - Grade 1 s 12 104.61 1,255.32 200 251,064.00
Operator - Grade 2 s 2 113.52 227.04 200 45,408.00
Laborer s 7 100.60 704.20 200 140,840.00
Tie Inspector s 1 159.34 159.54 34 5,417.56
Tie Cleanup: Track Foreman s 1 115.78 115.78 200 23,156.00
Operator - Grade 3 s 1 116.00 116.00 200 23,200.00
Laborer s 6 100.60 603.60 200 120,720.00
Tie Train: Track Foreman D l 103.78 103.78 43 4,462.54
Operator - Grade 3 D 1 104.00 104.00 43 4,472.00
Trainman D 4 125.00 500.00 43 21,500.00
Supplementary: Driver D 1 92.61 92.61 200 18,522.00
Flagman D 2 88.60 177.20 200 35,440.00
Planning: Engineer s 1 31,200 per 1/2 man-year 15,600.00
year
Total $747,620.10
S - System personnel, includes per diem. D- Division personnel, no per diem cost.
TABLE 20
ANNUAL LABOR COSTS: BALLAST CLEANING
Labor Classification Number Daily Labor per Gang Rate ($)
General Foreman s 1 189.09 Track Foreman s 1 115.78 Assistant Track Foreman s 1 110.02 Operator - Grade 4 s 2 167.80 Operator - Grade 2 s 5 113.52 Operator - Grade 1 s 1 104.61 Laborer s 13 100.60
Supplementary: Driver D 1 92.61 Flagman D 2 88.60
Planning: Engineer s 1
Total
S - System personnel, includes per diem. D.- Division personnel, no per diem cost.
Daily Labor Days Worked per Cost ($) Gang per Year
189.09 200 115.78 200 llO. 02 200 335.60 200 567.60 200 104.61 200
1,307.80 200
92.61 200 177.20 200
31,200 per 1/2 man-year year
30
Annual Labor Cost Charged per Gang ($)
37,818.00 23,156.00 22,004.00 67,120.00
113,520.00 20,922.00
261,560.00
18,522.00 35,440.00
15;600.00
$615,662.00
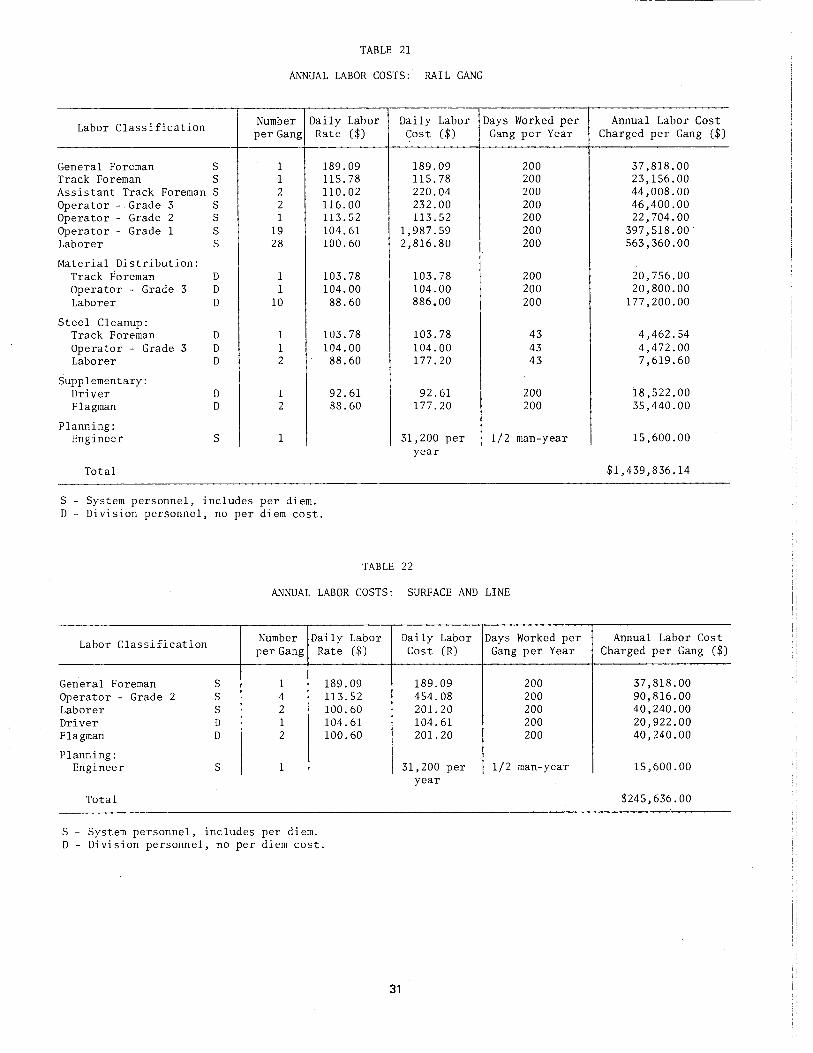
TABLE 21
ANNUAL LABOR COSTS: RAIL GANG
Labor Classification Number Daily Labor Daily Labor per Gang Rate ($) Cost ($)
General Foreman s 1 189.09 189.09 Track Foreman s 1 115.78 115.78 Assistant Track Foreman s 2 110.02 220.04 Operator - Grade 3 s 2 116.00 232.00 Operator - Grade 2 s l 113.52 113.52 Operator - Grade 1 s 19 104.61 1,987.59 Laborer s 28 100.60 2,816.80
Material Distribution: Track Foreman D 1 103.78 103.78 Operator - Grade 3 D 1 104.00 104.00 Laborer D 10 88.60 886.00
Steel Cleanup: Track Foreman D 1 103.78 103.78 Operator - Grade 3 D 1 104.00 104.00 Laborer D 2 88.60 177.20
Supplementary: Driver D 1 92.61 92.61 Flagman D 2 88.60 177.20
Planning: Engineer s 1 31,200 per
year
Total
S - System personnel, includes per diem. D - Division personnel, no per diem cost.
TABLE 22
Days Worked per Gang per Year
200 200 200 200 200 200 200
200 200 200
43 43 43
200 200
1/2 man-year
ANNUAL LABOR COSTS: SURFACE AND LINE
Labor Classification Number Daily Labor per Gang Rate ($)
General Foreman s 1 189.09 Operator - Grade 2 s 4 113.52 Laborer s 2 100.60 Driver D 1 104.61 Flagman D 2 100.60
Planning: Engineer s 1
Total
S - System personnel, includes per diem. D - Division personnel, no per diem cost.
Daily Labor Days Worked per Cost (R) Gang per Year
189.09 200 454.08 200 201.20 200 104.61 200 201.20 200
31,200 per 1/2 man-year year
31
Annual Labor Cost Charged per Gang ($)
37,818.00 23,156.00 44,008.00 46,400.00 22,704.00
397,518.00 563,360.00
20,756.00 20,800.00
177,200.00
4,462.54 4,472.00 7,619.60
18,522.00 35,440.00
15,600.00
$1,439,836.14
Annual Labor Cost Charged per Gang ($)
37,818.00 90,816.00 40,240.00 20,922.00 40,240.00
15,600.00
$245,636.00
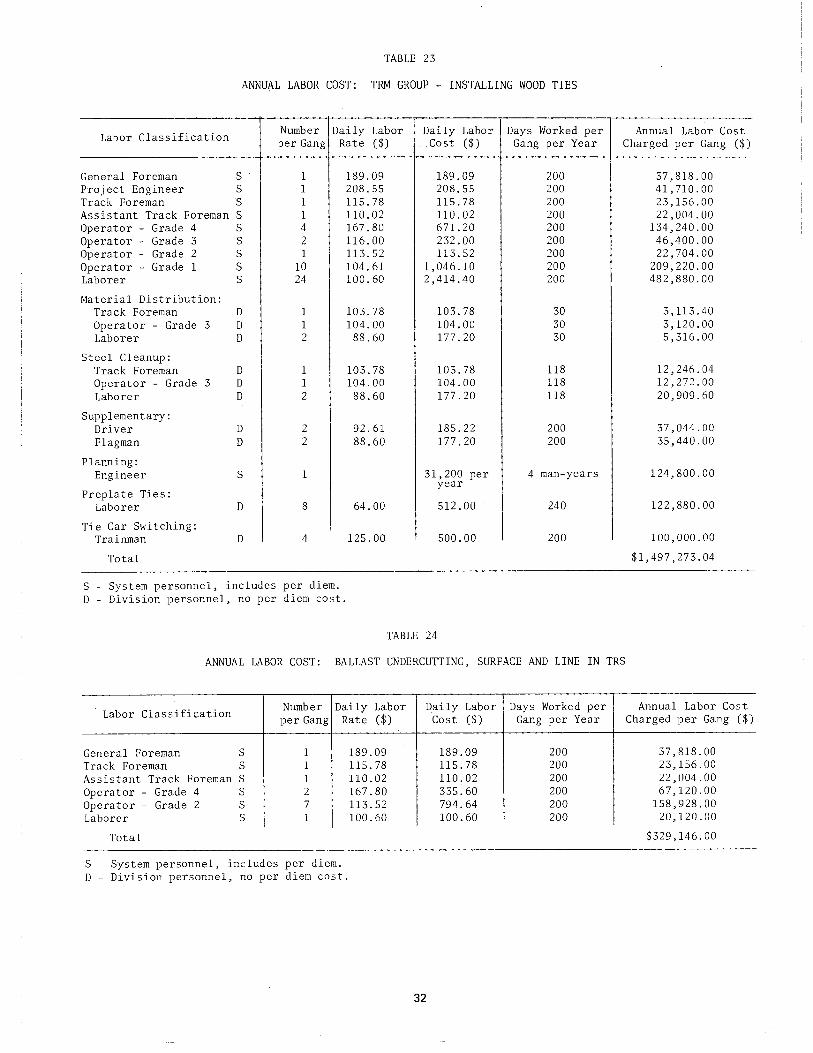
TABLE 23
ANNUAL LABOR COST: TRM GROUP - INSTALLING WOOD TIES
Labor Classification Number Daily Labor Daily Labor Days Worked per Annual Labor Cost per Gang Rate ($) Cost ($) Gang per Year Charged per Gang
General Foreman s 1 189.09 189.09 200 37,818.00 Project Engineer s 1 208.55 208.55 200 41,710.00 Track Foreman s 1 115.78 115.78 200 23,156.00 Assistant Track Foreman s 1 110.02 llO. 02 200 22,004.00 Operator - Grade 4 s 4 167.80 671.20 200 134,240.00 Operator - Grade 3 s 2 ll6.00 232.00 200 46,400.00 Operator - Grade 2 s 1 113.52 113.52 200 22,704.00 Operator - Grade 1 s 10 104.61 1,046.10 200 209,220.00 Laborer s 24 100.60 2,414.40 200 482,880.00
Material Distribution: Track Foreman D 1 103.78 103.78 30 3,113.40 Operator - Grade 3 D 1 104.00 104.00 30 3,120.00 Laborer D 2 88.60 177.20 30 5,316.00
Steel Cleanup: Track Foreman D 1 103.78 103.78 118 12,246.04 Operator - Grade 3 D 1 104.00 104.00 118 12,272.00 Laborer D 2 88.60 177.20 118 20,909.60
Supplementary: Driver D 2 92.61 185.22 200 37,044.00 Flagman D 2 88.60 177.20 200 35,440.00
Planning: Engineer s 1 31,200 per 4 man-years 124,800.00
Preplate Ties: year
Laborer D 8 64.00 512.00 240 122,880.00
Tie Car Switching: Trainman D 4 125.00 500.00 200 100 000.00
Total $1,497,273.04
S - System personnel, includes per diem. D - Division personnel, no per diem cost.
TABLE 24
ANNUAL LABOR COST: BALLAST UNDERCUTTING, SURFACE AND LINE IN TRS
($)
Labor Classification Number Daily Labor Daily Labor Days Worked per Annual Labor Cost per Gang Rate ($) Cost ($) Gang per Year Charged per Gang
General Foreman s 1 189.09 189.09 200 37,818.00 Track Foreman s 1 115.78 115.78 200 23,156.00 Assistant Track Foreman s 1 110.02 110' 02 200 22,004.00 Operator - Grade 4 s 2 167.80 335.60 200 67,120.00 Operator - Grade 2 s 7 113.52 794.64 200 158,928.00 Laborer s 1 100.60 100.60 200 20,120.00
Total $329,146.00
S - System personnel, includes per diem. D - Division personnel, no per diem cost.
32
($)
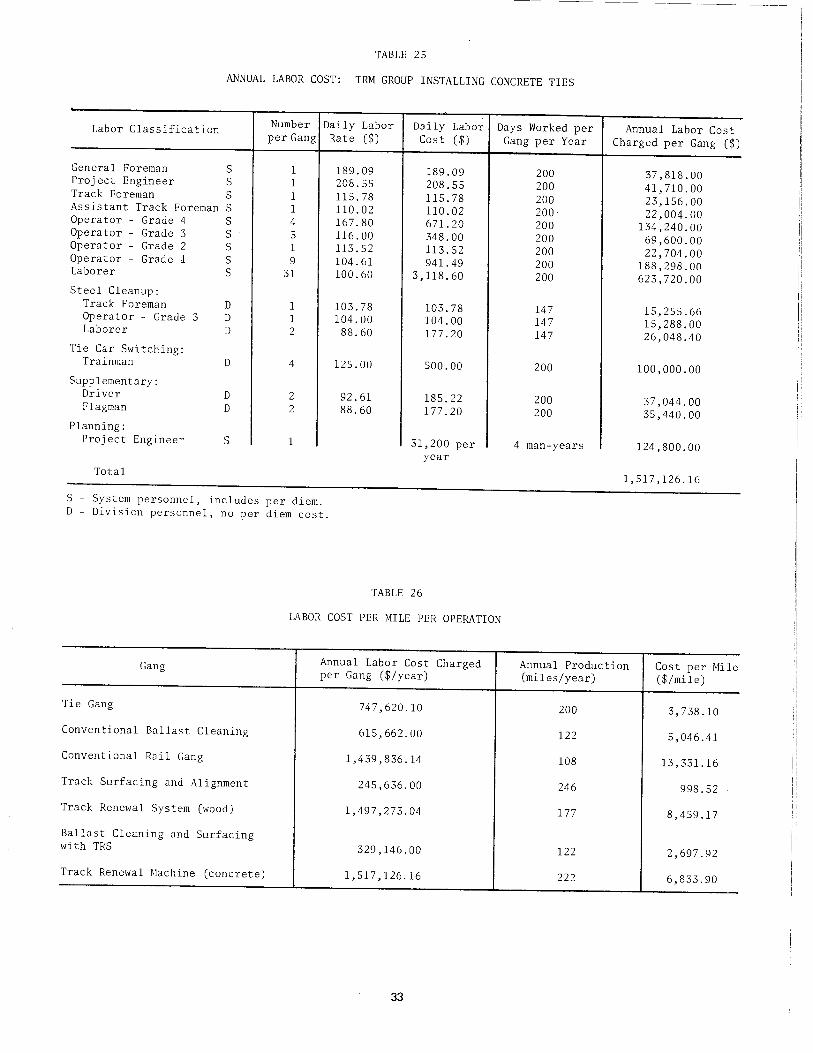
-----------------------
TABLE 25
ANNUAL LABOR COST: TRM GROUP INSTALLING CONCRETE TIES
Labor Classification Number Daily Labor per Gang Rate ($)
General Foreman s 1 189.09 Project Engineer s 1 208.55 Track Foreman s 1 115.78 Assistant Track Foreman s 1 110.02 Operator - Grade 4 s 4 167.80 Operator - Grade 3 s 3 116.00 Operator - Grade 2 s 1 113.52 Operator - Grade 1 s 9 104.61 Laborer s 31 100.60 Steel Cleanup:
Track Foreman D 1 103.78 Operator - Grade 3 D 1 104.00 Laborer D 2 88.60
Tie Car Switching: Trainman D 4 125.00
Supplementary: Driver D 2 92.61 Flagman D 2 88.60
Planning: Project Engineer s 1
Total
S - System personnel, includes per diem. D- Division personnel, no per diem cost.
Daily Labor Cost ($)
189.09 208.55 115.78 l10.02 671.20 348.00 113.52 941.49
3,118.60
103.78 104.00 177.20
500.00
185.22 177.20
31,200 per year
TABLE 26
Days Worked per Annual Labor Cost Gang per Year Charged per Gang ($)
200 37,818.00 200 41,710.00 200 23,156.00 200· 22,004.00 200 134,240.00 200 69,600.00 200 22,704.00 200 188,298.00 200 623,720.00
147 15,255.66 14 7 15,288.00 147 26,048.40
200 100,000.00
200 37,044.00 200 35,440.00
4 man-years 124,800.00
1,517,126.16
LABOR COST PER MILE PER OPERATION
Gang Annual Labor Cost Charged Annual Production Cost per Mile per Gang ($/year) (miles/year) ($/mile)
Tie Gang 747,620.10 200 3,738.10
Conventional Ballast Cleaning 615,662.00 122 5,046.41
Conventional Rail Gang 1,439,836.14 108 13,331.16
Track Surfacing and Alignment 245,636.00 246 998.52
Track Renewal System (wood) 1,497,273.04 177 8,459.17
Ballast Cleaning and Surfacing with TRS 329,146.00 122 2,697.92
Track Renewal Machine (concrete) 1,517,126.16 222 6,833.90
33
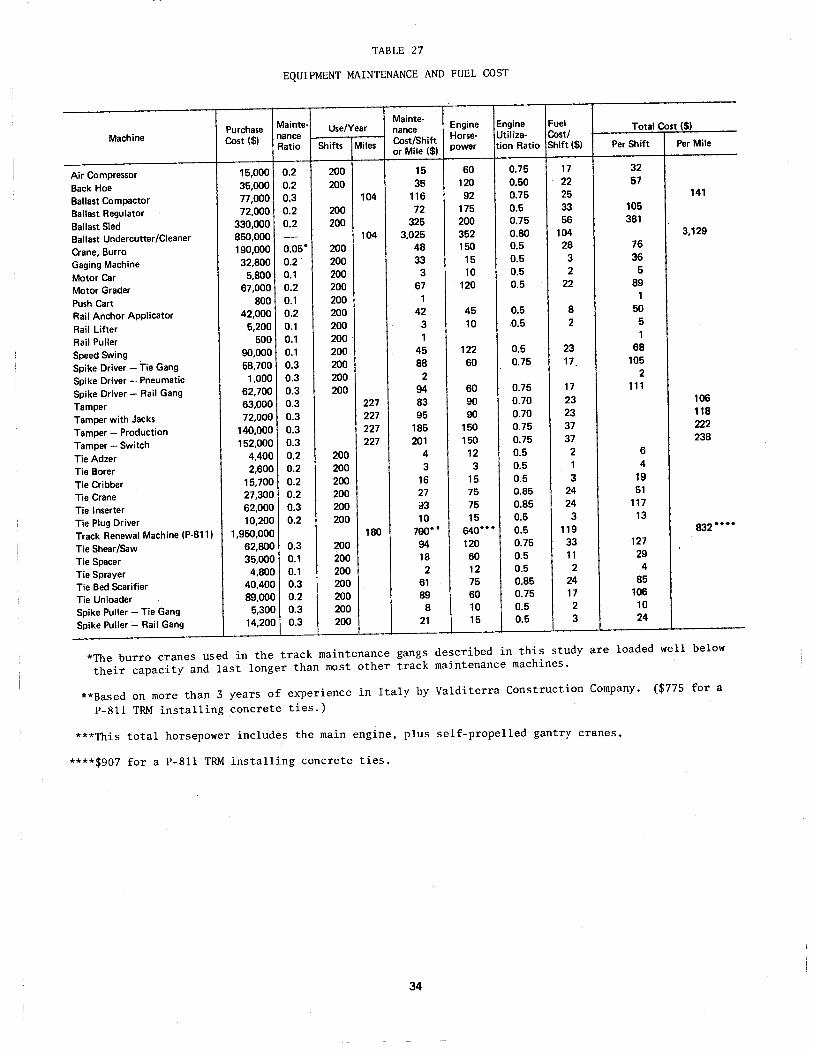
TABLE 27
EQUIPMENT MAINTENANCE AND FUEL COST
Mainte- Mainte-Engine Engine Fuel
Purchase Use/Year nance Total Cost ($) Machine Cost($) nance Horse- Utiliza- Cost/
Cost/Shift Ratio Shifts Miles
or Mile($) power tion Ratio Shift($) Per Shift Per Mile
Air Compressor 15,000 0.2 200 15 60 0.75 17 32
Back Hoe 35,000 0.2 200 38 120 0.50 22 57
Ballast Compactor 77,000 0.3 104 116 92 0.75 25 141
Ballast Regulator 72.000 0.2 200 72 175 0.5 33 105
Ballast Sled 330,000 0.2 200 325 200 0.75 56 381
Ballast Undercutter/Cieaner 850,000 -- 104 3,025 352 0.80 104 3,129
Crane, Burro 190,000 0.05* 200 48 150 0.5 28 76
Gaging Machine 32,800 0.2 200 33 15 0.5 3 36
Motor Car 5,800 0.1 200 3 10 0.5 2 5
Motor Grader 67,000 0.2 200 67 120 0.5 22 89
Push Cart 800 0.1 200 1 1
Rail Anchor Applicator 42,000 0.2 200 42 45 0.5 8 50
Rail Lifter 5,200 0.1 200 3 10 .0.5 2 5
Rail Puller 500 0.1 200 1 1
Speed Swing 90,000 0.1 200 ·. 45 122 0.5 23 68
Spike Driver - Tie Gang 58,700 0.3 200 88 60 0.75 17 105
Spike Driver- Pneumatic 1,000 0.3 200 2 2
Spike Driver - Rail Gang 62,700 0.3 200 94 60 0.75 17 111
Tamper 63,000 0.3 227 83 90 0.70 23 106
Tamper with Jacks 72,000 0.3 227 95 90 0.70 23 118
Tamper- Production 140,000 0.3 227 185 150 0.75 37 222
Tamper - Switch 152,000 0.3 227 201 150 0.75 37 238
Tie Adzer 4.400 0.2 200 4 12 0.5 2 6
Tie Borer 2,600 0.2 200 3 3 0.5 1 4
Tie Cribber 15,700 0.2 200 16 15 0.5 3 19
Tie Crane 27,300 0.2 200 27 75 0.85 24 51
Tie Inserter 62,000 0.3 200 J3 75 0.85 24 117
Tie Plug Driver 10,200 0.2 200 10 15 0.5 3 13
Track Renewal Machine (P-811) 1,950,000 180 790** 640*** 0.5 119 832****
Tie Shear/Saw 62,800 0.3 200 94 120 0.75 33 127
Tie Spacer 35,000 0.1 2oo 18 60 0.5 11 29
Tie Sprayer 4,800 0.1 200 2 12 0.5 2 4
Tie Bed Scarifier 40.400 0.3 200 61 75 0.85 24 85
Tie Unloader 89,000 0.2 200 89 60 0.75 17 106
Spike Puller- Tie Gang 5,300 0.3 200 8 10 0.5 2 10
Spike Puller- Rail Gang 14,200 0.3 200 21 15 0.5 3 24
*The burro cranes used in the track maintenance gangs described in this study are loaded well below
their capacity and last longer than most other track maintenance machines.
**Based on more than 3 years of experience in Italy by Valditerra Construction Company. ($775 for a
P-811 TRM installing concrete ties.)
***This total horsepower includes the main engine, plus self-propelled gantry cranes.
****$907 for a P-811 TRM installing concrete ties.
34
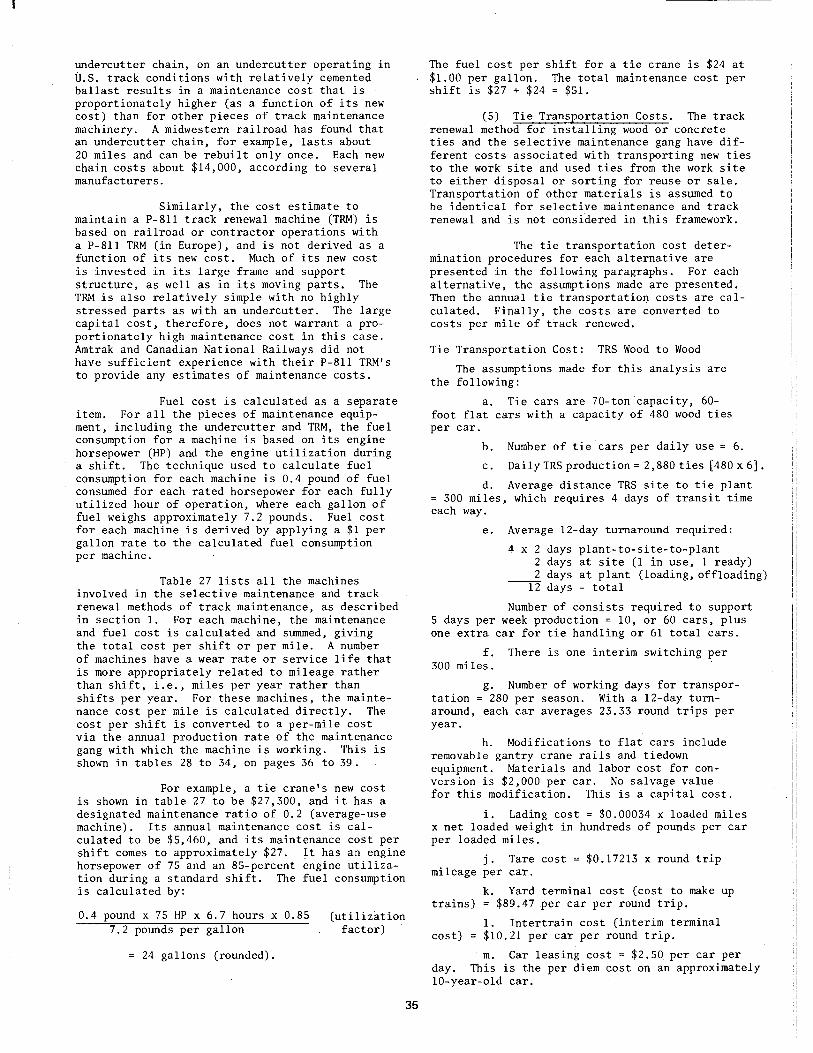
undercutter chain, on an undercutter operating in U.S. track conditions with relatively cemented ballast results in a maintenance cost that is proportionately higher (as a function of its new cost) than for other pieces of track maintenance machinery. A midwestern railroad has found that an undercutter chain, for example, lasts about 20 miles and can be rebuilt only once. Each new chain costs about $14,000, according to several manufacturers.
Similarly, the cost estimate to maintain a P-811 track renewal machine (TRM) is based on railroad or contractor operations with a P-811 TRM (in Europe), and is not derived as a function of its new cost. Much of its new cost is invested in its large frame and support structure, as well as in its moving parts. The TRM is also relatively simple with no highly stressed parts as with an undercutter. The large capital cost, therefore, does not warrant a proportionately high maintenance cost in this case. Amtrak and Canadian National Railways did not have sufficient experience with their P-811 TRM's to provide any estimates of maintenance costs.
Fuel cost is calculated as a separate item. For all the pieces of maintenance equipment, including the undercutter and TRM, the fuel consumption for a machine is based on its engine horsepower (HP) and the engine utilization during a shift. The technique used to calculate fuel consumption for each machine is 0.4 pound of fuel consumed for each rated horsepower for each fully utilized hour of operation, where each gallon of fuel weighs approximately 7.2 pounds. Fuel cost for each machine is derived by applying a $1 per gallon rate to the calculated fuel consumption per machine.
Table 27 lists all the machines involved in the selective maintenance and track renewal methods of track maintenance, as described in section 1. For each machine, the maintenance and fuel cost is calculated and summed, giving the total cost per shift or per mile. A number of machines have a wear rate or service life that is more appropriately related to mileage rather than shift, i.e., miles per year rather than shifts per year. For these machines, the maintenance cost per mile is calculated directly. The cost per shift is converted to a per-mile cost via the annual production rate of the maintenance gang with which the machine is working. This is shown in tables 28 to 34, on pages 36 to 39.
For example, a tie crane's new cost is shown in table 27 to be $27,300, and it has a designated maintenance ratio of 0.2 (average-use machine). Its annual maintenance cost is calculated to be $5,460, and its maintenance cost per shift comes to approximately $27. It has an engine horsepower of 75 and an 85-percent engine utilization during a standard shift. The fuel consumption is calculated by:
0.4 pound x 75 HP x 6.7 hours x 0.85 7.2 pounds per gallon
= 24 gallons (rounded).
(utilization factor)
35
----- -----
The fuel cost per shift for a tie crane is $24 at $1.00 per gallon. The total maintenance cost per shift is $27 + $24 = $51.
(5) Tie Transportation Costs. The track renewal method for installing wood or concrete ties and the selective maintenance gang have different costs associated with transporting new ties to the work site and used ties from the work site to either disposal or sorting for reuse or sale. Transportation of other materials is assumed to be identical for selective maintenance and track renewal and is not considered in this framework.
The tie transportation cost determination procedures for each alternative are presented in the following paragraphs. For each alternative, the assumptions made are presented. Then the annual tie transportation costs are calculated. Finally, the costs are converted to costs per mile of track renewed.
Tie Transportation Cost: TRS Wood to Wood
The assumptions made for this analysis are the following:
a. Tie cars are 70-ton capacity, 60-foot flat cars with a capacity of 480 wood ties per car.
b. Number of tie cars per daily use = 6.
c. Daily TRS production = 2, 880 ties [ 480 x 6] •
d. Average distance TRS site to tie plant = 300 miles, which requires 4 days of transit time each way.
e. Average 12-day turnaround required:
4 x 2 days plant-to-site-to-plant 2 days at site (1 in use, 1 ready) 2 days at plant (loading, offloading)
----1-2 days - total
Number of consists required to support 5 days per week production = 10, or 60 cars, plus one extra car for tie handling or 61 total cars.
f. There is one interim switching per 300 miles.
g. Number of working days for transportation = 280 per season. With a 12-day turnaround, each car averages 23.33 round trips per year.
h. Modifications to flat cars include removable gantry crane rails and tiedown equipment. Materials and labor cost for conversion is $2,000 per car. No salvage value for this modification. This is a capital cost.
i. Lading cost = $0.00034 x loaded miles x net loaded weight in hundreds of pounds per car per loaded miles.
j. Tare cost= $0.17213 x round trip mileage per car.
k. Yard terminal cost (cost to make up trains) = $89.47 per car per round trip.
cost) 1. Intertrain cost (interim terminal $10.21 per car per round trip.
m. Car leasing cost = $2.50 per car per day. This is the per diem cost on an approximately 10-year-old car.
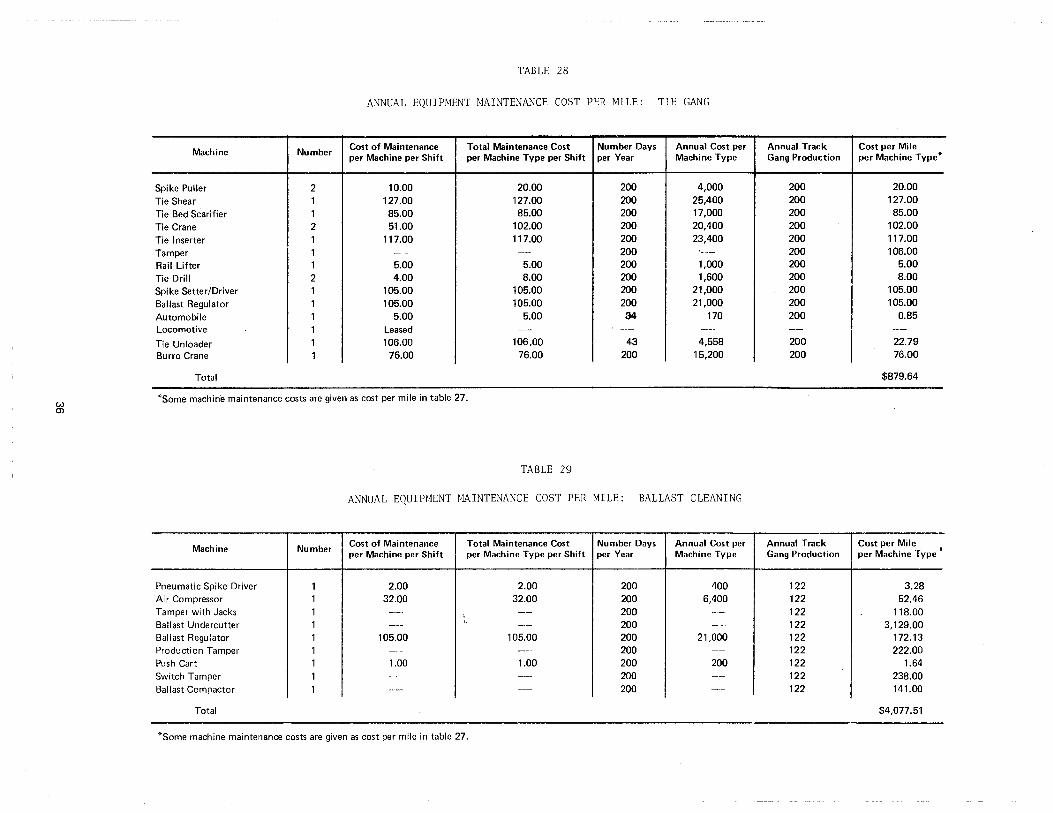
w 0)
TABLE 28
ANNUAL EQUIPMENT MAINTENANCE COST PER MILE: TIE GANG
Machine Number Cost of Maintenance Total Maintenance Cost Number Days Annual Cost per Annual Track Cost per Mile per Machine per Shift per Machine Type per Shift per Year Machine Type Gang Production per Machine Type
Spike Puller 2 10.00 20.00 200 4,000 200 20.00
Tie Shear 1 127.00 127.00 200 25,400 200 127.00 Tie Bed Scarifier 1 85.00 85.00 200 17,000 200 85.00
Tie Crane 2 51.00 102.00 200 20,400 200 102.00
Tie Inserter 1 117.00 117.00 200 23,400 200 117.00
Tamper 1 --·- -- 200 --·-- 200 106.00 Rail Lifter 1 5.00 5.00 200 1,000 200 5.00
Tie Drill 2 4.00 8.00 200 1,600 200 8.00 Spike Setter/Driver 1 105.00 105.00 200 21,000 200 105.00
Ballast Regulator 1 105.00 105.00 200 21,000 200 105.00
Automobile 1 5.00 5.00 34 170 200 0.85 Locomotive 1 Leased ---- -·- --· -- --Tie Unloader 1 106.00 106.00 43 4,558 200 22.79 Burro Crane 1 76.00 76.00 200 15,200 200 76.00
Total $879.64
*Some machine maintenance costs are given as cost per mile in table 27.
TABLE 29
ANNUAL EQUIPMENT MAINTENANCE COST PER MILE: BALLAST CLEANING
Machine Number Cost of Maintenance Total Maintenance Cost Number Days Annual Cost per Annual Track Cost per Mile per Machine per Shift per Machine Type per Shift per Year Machine Type Gang Production per Machine Type
Pneumatic Spike Driver 1 2.00 2.00 200 400 122 3.28 Air Compressor 1 32.00 32.00 200 6,400 122 52.46 Tamper with Jacks 1 --- -- 200 -·-- 122 118.00 Ballast Undercutter 1 --- \· -·- 200 -· 122 3,129.00 Ballast Regulator 1 105.00 105.00 200 21,000 122 172.13 Production Tamper 1 --- --- 200 --· 122 222.00 Push Cart 1 1.00 1.00 200 200 122 1.64 Switch Tamper 1 ---- -·- 200 -- 122 238.00 Ballast Compactor 1 ----- --- 200 -- 122 I 141.00
Total $4,077.51
*Some machine maintenance costs are given as cost per mile in table 27.
*
*
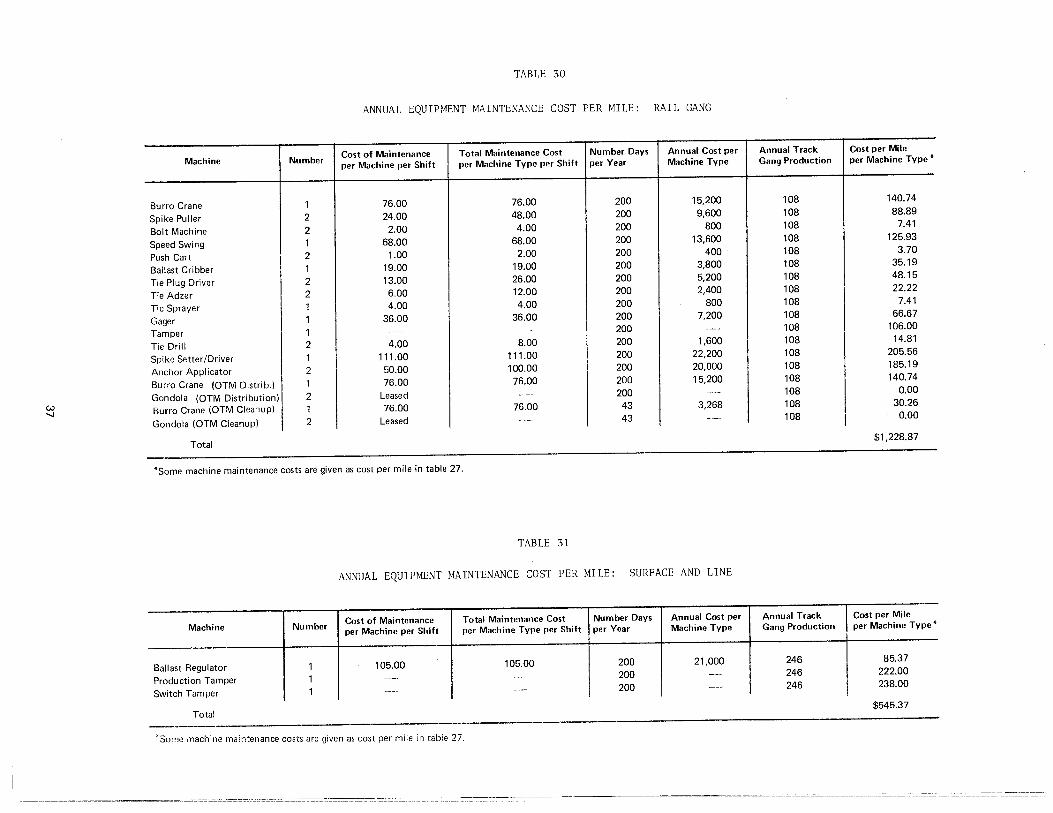
w -..J
TABLE 30
ANNUAL EQUIP~1ENT MAINTENANCE COST PER MILE: RAIL GANG
Machine Number Cost of Maintenance Total Maintenance Cost Number Days Annual Cost per Annual Track Cost per Mile
per Machine per Shift per Machine Type per Shift per Year Machine Type Gang Production per Machine Type •
Burro Crane 1 76.00 76.00 200 15,200 108 140.74
Spike Puller 2 24.00 48.00 200 9,600 108 88.89
Bolt Machine 2 2.00 4.00 200 800 108 7.41
Speed Swing 1 68.00 68.00 200 13,600 108 125.93
Push Cart 2 1.00 2.00 200 400 108 3.70
Ballast Cribber 1 19.00 19.00 200 3,800 108 35.19
Tie Plug Driver 2 13.00 26.00 200 5,200 108 48.15
Tie Adzer 2 6.00 12.00 200 2,400 108 22.22
Tie Sprayer 1 4.00 4.00 200 800 108 7.41
Gager 1 36.00 36.00 200 7,200 108 66.67
Tamper 1 -··- -- 200 --- 108 106.00
Tie Drill 2 4.00 8.00 200 1,600 108 14.81
Spike Setter /Driver 1 111.00 111.00 200 22,200 108 205.56
Anchor Applicator 2 50.00 100.00 200 20,000 108 185.19
Burro Crane (OTM Distrib.) 1 76.00 76.00 200 15,200 108 140.74
Gondola (OTM Distribution) 2 Leased -·- 200 -- 108 0.00
Burro Crane (OTM Cleanup) 1 76.00 76.00 43 3,268 108 30.26
Gondola (OTM Cleanup) 2 Leased . --- 43 --- 108 I 0.00
Total $1,228.87
*Some machine maintenance costs are given as cost per mile in table 27.
TABLE 31
ANNUAL EQUIPMENT MAINTENANCE COST PER MILE: SURFACE AND LINE
Machine Number Cost of Maintenance Total Maintenance Cost Number Days Annual Cost per Annual Track Cost per Mile
per Machine per Shift per Machine Type per Shift per Year Machine Type Gang Production per Machine Type*
Ballast Regulator 1 105.00 105.00 200 21,000 246 85.37
Production Tamper 1 --- ·-·- 200 -- 246 222.00
Switch Tamper 1 ---· --- 200 --- 246 238.00
Total $545.37
*Some machine maintenance costs are given as cost per mile in table 27.
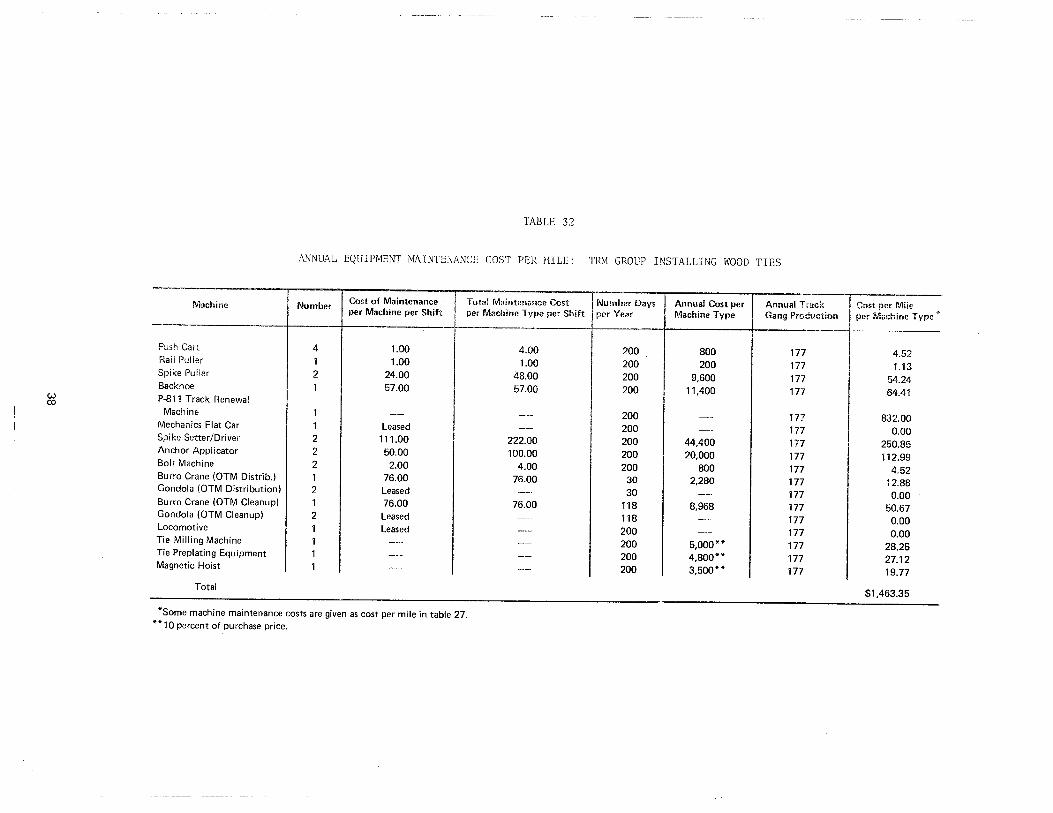
w (X)
TABLE 32
ANNUAL EQUIPMENT MAINTENANCE COST PER HILE: TRM GROUP INSTALLING WOOD TIES
--------------------r-------r----------------r-------------------.----------.-----------~------------~r-------------Cost of Maintenance I Total Maintenance Cost Number Days Annual Cost per Annual Track Cost per Mile Machine Number per Machine per Shift I per Machine 1ype per Shift por Year Machine Type Gang Production per Machine Type*
Push Cart Rail Puller Spike Puller Backhoe P-811 Track Renewal
Machine Mechanics Flat Car Spike Setter/Driver Anchor Applicator Bolt Machine Burro Crane (OTM Distrib.) Gondola (OTM Distribution) Burro Crane (OTM Cleanup) Gondola (OTM Cleanup) Locomotive Tie Milling Machine Tie Preplating Equipment Magnetic Hoist
Total
4 1
2
2 2 2 1 2
2
1.00 1.00
24.00 57.00
Leased 111.00
50.00 2.00
76.00 Leased 76.00 Leased Leased
*Some machine maintenance costs are given as cost per mile in table 27. **10 percent of purchase price.
4.00 1.00
48.00 57.00
222.00 100.00
4.00 76.00
76.00
200 200 200 200
200 200 200 200 200
30 30
118 118 200 200 200 200
800 200
9,600 11,400
44,400 20,000
800 2,280
8,968
5,000** 4,800** 3,500**
177 I
177 177 177
177 177 177 177 177 177 177 177 177 177 177 177 177
4.52 "1.13
54.24 64.41
832.00 0.00
250.85 112.99
4.52 12.88
0.00 50.67 0.00 0.00
28.25 27.12 19.77
$1,463.35
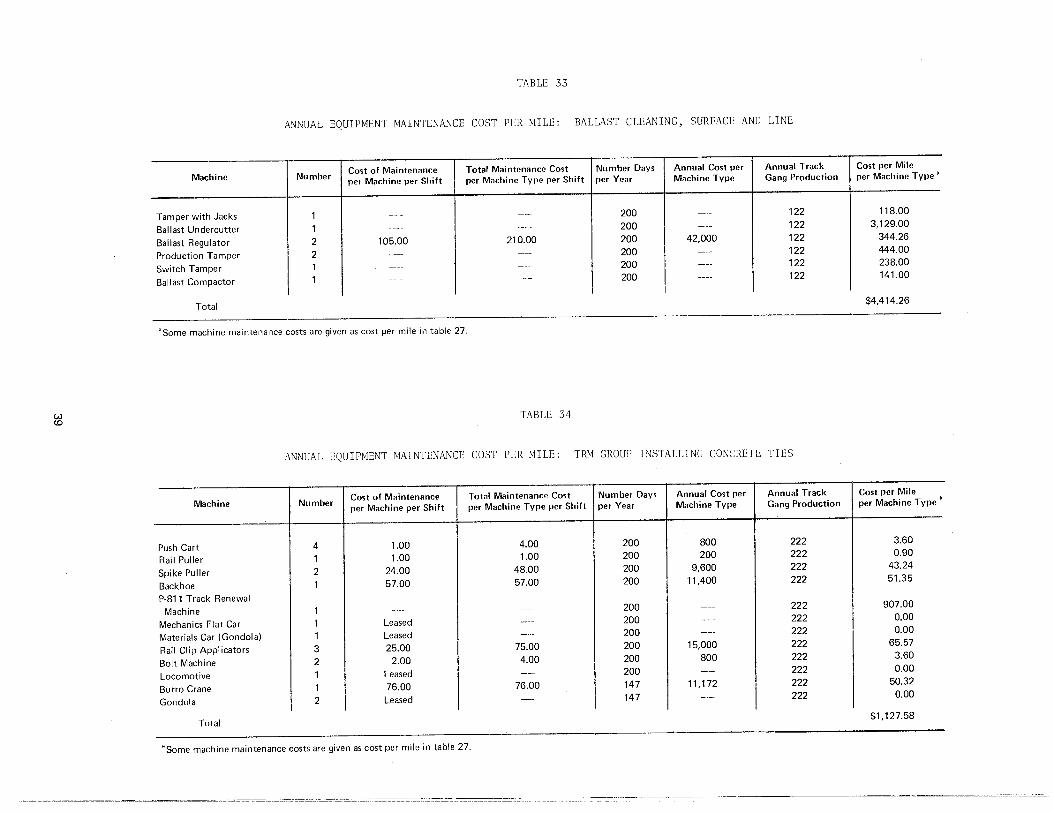
w tO
TABLE 33
A.'JNUAL EQUIPMENT MAINTENANCE COST PER !,U LE: BALLAST CLEANING, SURFACE AND LINE
------
Machine Number Cost of Maintenance Total Maintenance Cost Number Days Annual Cost per Annual Track Cost per Mile
per Machine per Shift per Machine Type per Shift per Year Machine Type Gang Production per Machine Type •
Tamper with Jacks 1 -·-- -- 200 --- 122 118.00
Ballast Undercutter 1 ---- ---- 200 --- 122 3,129.00
Ballast Regulator 2 105.00 210.00 200 42,000 122 344.26
Production Tamper 2 --- --- 200 --·- 122 444.00
Switch Tamper 1 ---- -- 200 --- 122 238.00
Ballast Compactor 1 --··- --- 200 ---- 122 141.00
I
Total $4,414.26
*Some machine maintenance costs are given as cost per mile in table 27.
TABLE 34
ANNUAL EQUIPMENT MAINTENANCE COST PER MILE: TRM GROUP INSTALLING CONCRETE TIES
Machine Number Cost of Maintenance Total Maintenance Cost Number Days Annual Cost per Annual Track Cost per Mile
per Machine per Shift per Machine Type per Shift per Year Machine Type Gang Production per Machine Type .
Push Cart 4 1.00 4.00 200 800 222 3.60
Rail Puller 1 1.00 1.00 200 200 222 0.90
Spike Puller 2 24.00 48.00 200 9,600 222 43.24
Backhoe 1 57.00 57.00 200 11,400 222 51.35
P-811 Track Renewal Machine 1 -----· --- 200 --- 222 907.00
Mechanics Flat Car 1 Leased --- 200 --- 222 0.00
Materials Car (Gondola) 1 Leased ---- 200 --- 222 0.00
Rail Clip Applicators 3 25.00 75.00 200 15,000 222 65.57
Bolt Machine 2 2.00 4.00 200 800 222 3.60
Locomotive 1 Leased -- 200 -- 222 0.00
Burro Crane 1 76.00 76.00 147 11,172 222 50.32
Gondola 2 Leased -- 147 --- 222 0.00
Total $1,127.58
*Some machine maintenance costs are given as cost per mile in table 27.

Note: The transportation costs in assumptions a through m, inclusive, were obtained from a midwestern railroad with more than 8,000 miles of track.
Annual tie transportation costs are calculated as follows:
a. Lading cost:
$0.00034 x 600 miles x 1,320* (hundreds of pounds) = $269.28 per car per round trip *Note: 480 ties per car at 275 pounds per tie = 132,000 pounds
Net weight in hundreds of pounds = 1,320.00 $269.28 x 23.33 round trips x 60 cars $376,938.14
b. Tare cost:
$0.17213 x 600 miles = $103.28 per car per round trip
$103.28 x 23.33 round trips x 60 cars
c. Yard terminal cost:
$89.47 per car per round trip $89.47 x 23.33 round trips x 60 cars
d. Intertrain costs:
$10.21 per car per round trip $10.21 x 23.33 round trips x 60 cars
e. Leasing cost:
Total number of cars = 6 (number per consist) x 10 (number of consists) + 1 (extra empty car) = 61 Total lease cost = (61 cars x $2.50 per day per car)
$144,571.34
$125,240.11
$ 14,291.96_
x 280 days per season $ 42,700.00
f. Capitalization cost:
61 cars x $2,000 per car $122,000.00 Capital recovery cost per year = capital cost x capital recovery factor at 12 percent over 10 years = $122,000 X 0.17698 $ 21,591.56
Total annual tie transportation cost $725,333.16
Total tie transportation cost per mile
$725,333.16 per year 177 miles per year $4,097.93
Tie Transportation Cost: TRS Wood to Concrete
. The assumptions made for this analysis are as follows:
a. Tie cars are 70-ton capacity, 60-foot flat cars with a capacity of 210 concrete ties per car. (Concrete ties assumed to weigh 625 pounds each).
b. Number of cars per daily consist = 14. c. Daily TRS production = 2,940 ties (210 x 14). d. Average distance TRS site to plant = 300 miles, which requires
4 days of transit time each way.
40
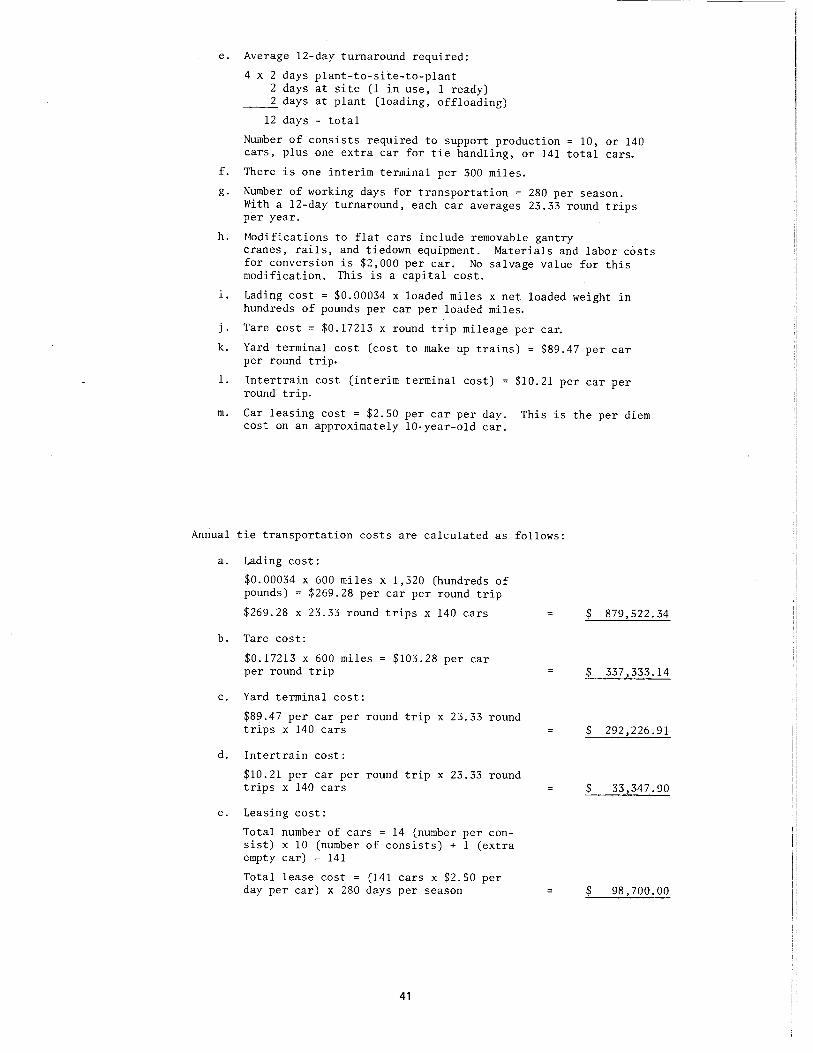
e. Average 12-day turnaround required:
4 x 2 days plant-to-site-to-plant 2 days at site (1 in use, 1 ready)
_____ 2 days at plant (loading, offloading)
12 days - total
------------------
Number of consists required to support production = 10, or 140 cars, plus one extra car for tie handling, or 141 total cars.
f. There is one interim terminal per 300 miles.
g. Number of working days for transportation = 280 per season. With a 12-day turnaround, each car averages 23.33 round trips per year.
h. t1odifications to flat cars include removable gantry cranes, rails, and tiedown equipment. Materials and labor costs for conversion is $2,000 per car. No salvage value for this modification. This is a capital cost.
i. Lading cost = $0.00034 x loaded miles x net loaded weight in hundreds of pounds per car per loaded miles.
j. Tare cost= $0.17213 x round trip mileage per ca~
k. Yard terminal cost (cost to make up trains) = $89.47 per car per round trip·
1. Intertrain cost (interim terminal cost) = $10.21 per car per round trip.
m. Car leasing cost = $2.50 per car per day. This is the per diem cost on an approximately 10-year-old car.
Annual tie transportation costs are calculated as follows:
a. Lading cost:
$0.00034 x 600 miles x 1,320 (hundreds of pounds) $269.28 per car per round trip
$269.28 x 23.33 round trips x 140 cars
b. Tare cost:
$0.17213 x 600 miles per round trip
c. Yard terminal cost:
$103.28 per car
$89.47 per car per round trip x 23.33 round trips x 140 cars
d. Intertrain cost:
$10.21 per car per round trip x 23.33 round trips x 140 cars
e. Leasing cost:
Total number of cars = 14 (number per consist) x 10 (number of consists) + 1 (extra empty car) = 141
Total lease cost = (141 cars x $2.50 per day per car) x 280 days per season
41
$ 879,522.34
$ 337,333.14
$ 292,226.91
$ 33,347.90
$ 98,700.00
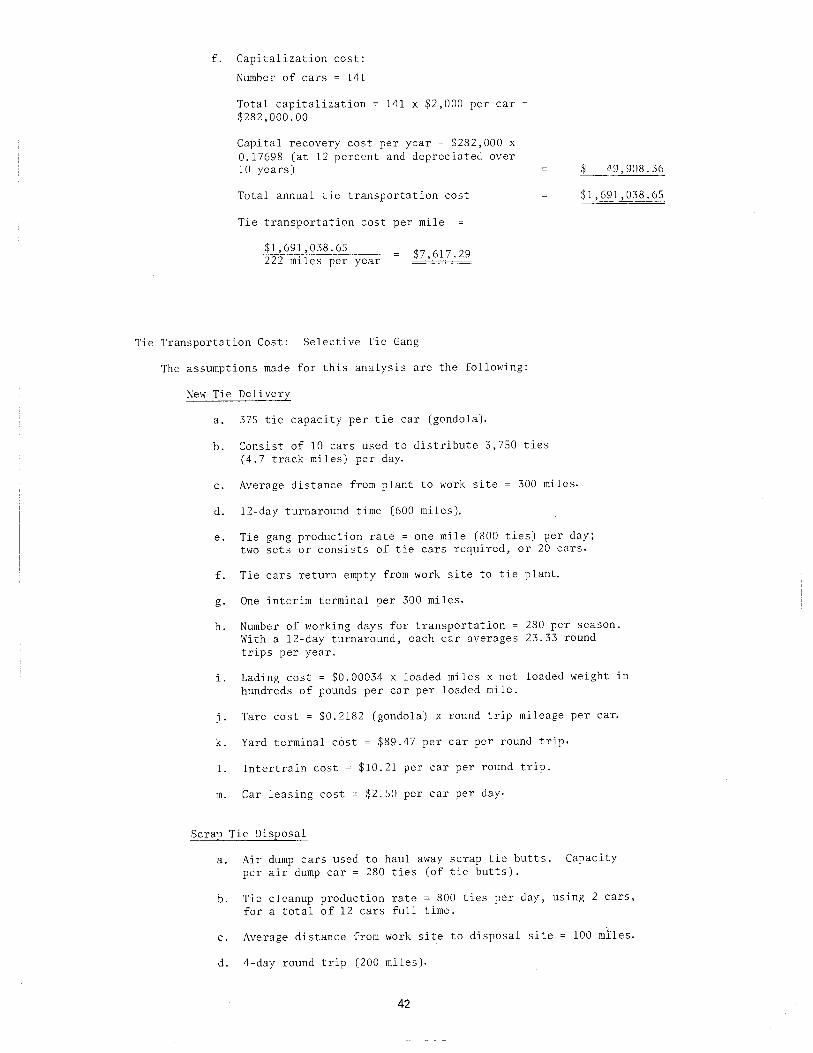
f. Capitalization cost:
Number of cars = 141
Total capitalization $282,000.00
141 x $2,000 per car
Capital recovery cost per year = $282,000 x 0.17698 (at 12 percent and depreciated over 10 years) $ 49,908.36
Total annual tie transportation cost $1,691,038.65
Tie transportation cost per mile
$1,691,038.65 $7,617.29 222 miles per year
Tie Transportation Cost: Selective Tie Gang
The assumptions made for this analysis are the following:
New Tie Delivery
a. 375 tie capacity per tie car (gondola).
b. Consist of 10 cars used to distribute 3,750 ties (4.7 track miles) per da~
c. Average distance from plant to work site 300 miles.
d. 12-day turnaround time (600 miles).
e. Tie gang production rate = one mile (800 ties) per day; two sets or consists of tie cars required, or 20 cars.
f. Tie cars return empty from work site to tie plant.
g. One interim terminal per 300 miles.
h. Number of working days for transportation 280 per season. With a 12-day turnaround, each car averages 23.33 round trips per year.
i. Lading cost = $0.00034 x loaded miles x net loaded weight in hundreds of pounds per car per loaded mile.
j. Tare cost= $0.2182 (gondola) x round trip mileage per car.
k. Yard terminal cost = $89.47 per car per round trip.
l. Intertrain cost = $10.21 per car per round trip.
m. Car leasing cost= $2.50 per car per day·
Scrap Tie Disposal
a. Air dump cars used to haul away scrap tie butts. Capacity per air dump car = 280 ties (of tie butts).
b. Tie cleanup production rate = 800 ties per day, using 2 cars, for a total of 12 cars full time.
c. Average distance from work site to disposal site 100 mhes.
d. 4-day round trip (200 miles).
42
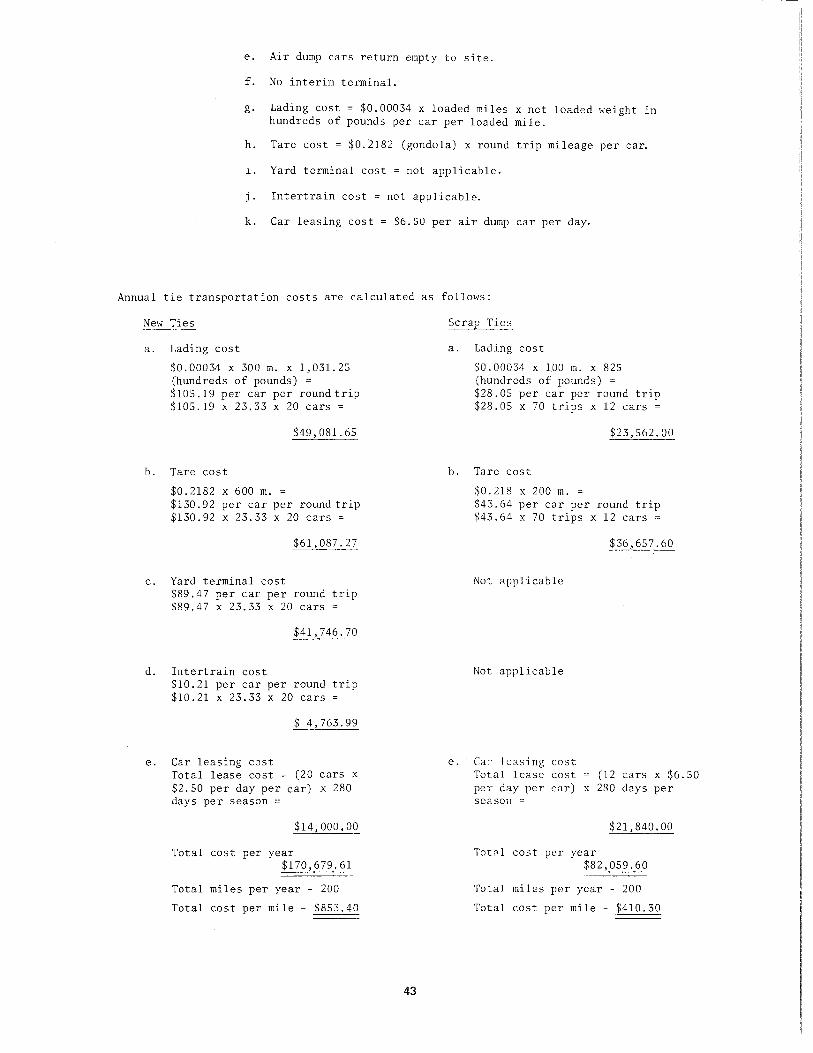
e. Air dump cars return empty to site.
f. No interim terminal.
g. Lading cost = $0.00034 x loaded miles x net loaded weight in hundreds of pounds per car per loaded mile.
h. Tare cost = $0.2182 (gondola) x round trip mileage per ca~
1. Yard terminal cost = not applicable.
j. Intertrain cost= not applicable.
k. Car leasing cost = $6.50 per air dump car per day.
Annual tie transportation costs are calculated as follows:
New Ties
a. Lading cost
$0.00034 X 300m. X 1,031.25 (hundreds of pounds) = $105.19 per car per roundtrip $105.19 x 23.33 x 20 cars=
$49,081.65
b. Tare cost
$0.2182 x 600 m. = $130.92 per car per round trip $130.92 x 23.33 x 20 cars =
$61,087.27
c. Yard terminal cost $89.47 per car per round trip $89.47 x 23.33 x 20 cars
$41,746.70
d. Intertrain cost $10.21 per car per round trip $10.21 x 23.33 x 20 cars
$ 4,763.99
e. Car leasing cost
a. Lading cost
$0.00034 X 100 m. X 825 (hundreds of pounds) = $28.05 per car per round trip $28.05 x 70 trips x 12 cars =
b. Tare cost
e.
$0.218 x 200m. = $43.64 per car per round trip $43.64 x 70 trips x 12 cars =
Not applicable
Not applicable
Car le:1o;ing cost
----------
Total lease cost = (20 cars x $2.50 per day per car) x 280 days per season =
Total lease cost (12 cars X $6.50
$14,000,00
Total cost per year $170,679.61
Total miles per year - 200
Total cost per mile - $853.40
43
per day per car) X 280 days per season =
$21,840.00
Total cost per year $82,059.60
Total miles per year - 200
Total cost per mile - $410.30
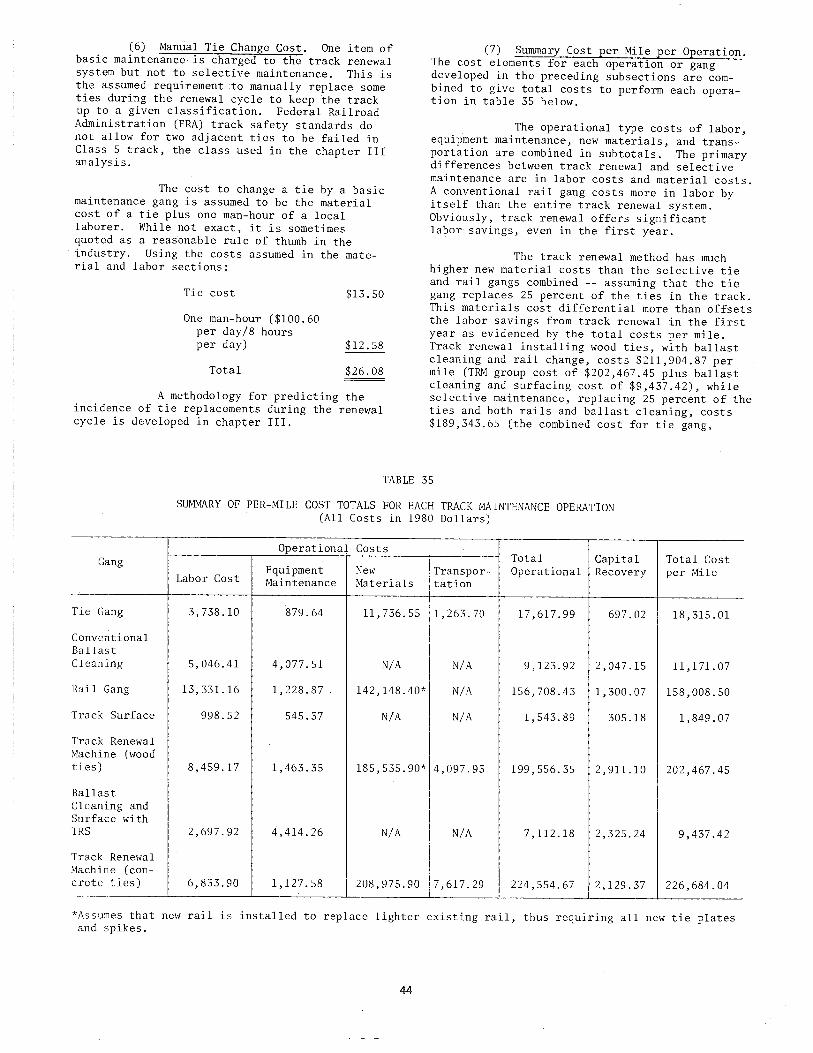
(6) Manual Tie Change Cost. One item of basic maintenance is charged to the track renewal system but not to selective maintenance. This is the assumed requirement to manually replace some ties during the renewal cycle to keep the track up to a given classification. Federal Railroad Administration (FRA) track safety standards do not allow for two adjacent ties to be failed in Class 5 track, the class used in the chapter III analysis.
The cost to change a tie by a basic maintenance gang is assumed to be the material cost of a tie plus one man-hour of a local laborer. While not exact, it is sometimes quoted as a reasonable rule of thumb in the industry. Using the costs assumed in the material and labor sections:
Tie cost
One man-hour ($100.60 per day/8 hours per day)
Total
$13.50
$12.58
$26.08
A methodology for predicting the incidence of tie replacements during the renewal cycle is developed in chapter III.
(7) Summary Cost per Mile per Operation. The cost elements for each operation or gang developed in the preceding subsections are combined to give total costs to perform each operation in table 35 below.
The operational type costs of labor, equipment maintenance, new materials, and transportation are combined in subtotals. The primary differences between track renewal and selective maintenance are in labor costs and material costs. A conventional rail gang costs more in labor by itself than the entire track renewal system. Obviously, track renewal offers significant labor savings, even in the first year.
The track renewal method has much higher new material costs than the selective tie and rail gangs combined -- assuming that the tie gang replaces 25 percent of the ties in the track. This materials cost differential more than offsets the labor savings from track renewal in the first year as evidenced by the total costs per mile. Track renewal installing wood ties, with ballast cleaning and rail change, costs $211,904.87 per mile (TRM group cost of $202,467.45 plus ballast cleaning and surfacing cost of $9,437.42), while selective maintenance, replacing 25 percent of the ties and both rails and ballast cleaning, costs $189,343.65 (the combined cost for tie gang,
TABLE 35
Gang
Tie Gang
Conventional Ballast Cleaning
f{ail Gang
Track Surface
Track Renewal :Vlachine (wood ties)
Ballast Cleaning and Surface with TRS
Track Renewal Machine (con-crete ties)
SUMMARY OF PER-MILE COST TOTALS FOR EACH TRACK MAINTENANCE OPERATION (All Costs in 1980 Dollars)
Operational Costs Total Capital
Equipment New Transpor- Operational Recovery Labor Cost Maintenance Materials tat ion
3, 738.10 879.64 11,736.55 1,263.70 17,617.99 697.02
5,046.41 4,077.51 N/A N/A 9,123.92 2,047.15
13,331.16 1,228.87 142,148.40* N/A 156,708.43 1,300.07
998.52 545.37 N/A N/A 1,543.89 305.18
8,459.17 1,463.35 185,535.90* 4,097.93 199,556.35 2,911.10
2,697.92 4,414.26 N/A N/A 7,112.18 2,325.24
6,833.90 1,127.58 208,975.90 7,617.29 224,554.67 2,129.37
Total Cost per Mile
18,315.01
11' 171.07
158,008.50
1,849.07
202,467.45
9,437.42
226,684.04
*Assumes that new rail is installed to replace lighter existing rail, thus requiring all new tie plates and spikes.
44
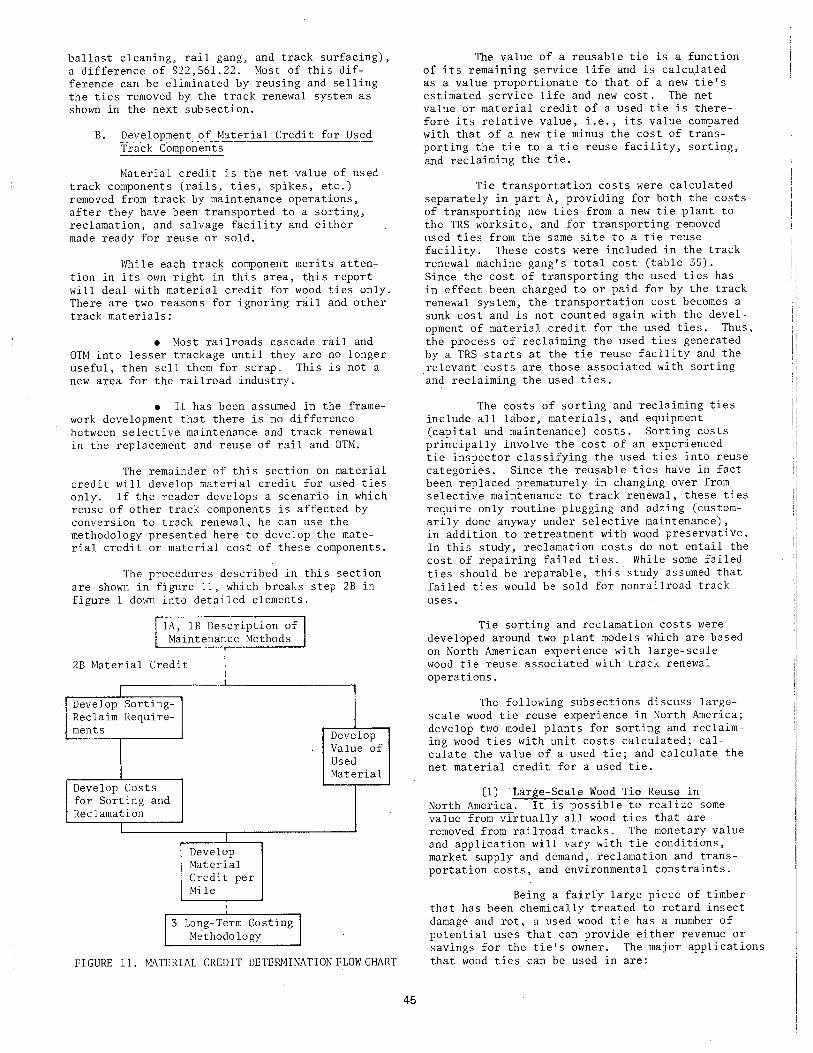
ballast cleaning, rail gang, and track surfacing), a difference of $22,561.22. Most of this difference can be eliminated by reusing and selling the ties removed by the track renewal system as shown in the next subsection.
B. Development of Material Credit for Used Track Components
Material credit is the net value of used track components (rails, ties, spikes, etc.) removed from track by maintenance operations, after they have been transported to a sorting, reclamation, and salvage facility and either made ready for reuse or sold.
lfuile each track component merits attention in its own right in this area, this report will deal with material credit for wood ties only. There are two reasons for ignoring rail and other track materials:
• Most railroads cascade rail and OTM into lesser trackage until they are no longer useful, then sell them for scrap. This is not a new area for the railroad industry.
• It has been assumed in the framework development that there is no difference between selective maintenance and track renewal in the replacement and reuse of rail and OTM.
The remainder of this section on material credit will develop material credit for used ties only. If the reader develops a scenario in which reuse of other track components is affected by conversion to track renewal, he can use the methodology presented here to develop the material credit or material cost of these components.
The procedures described in this section are shown in figure 11, which breaks step 2B in figure 1 down into detailed elements.
lA, lB Description of Maintenance Methods
1B Material Credit
I Develop Sorting-Reclaim Require-ments
Develop Costs for Sorting and Reclamation
I Develop Material Credit per Mile
3 Long-Term Costing Methodology
Develop Value of Used Material
FIGURE 11. MATERIAL CREDIT DETERMINATION FLOW CHART
45
The value of a reusable tie is a function of its remaining service life and is calculated as a value proportionate to that of a new tie's estimated service life and new cost. The net value or material credit of a used tie is therefore its relative value, i.e., its value compared with that of a new tie minus the cost of transporting the tie to a tie reuse facility, sorting, and reclaiming the tie.
Tie transportation costs were calculated separately in part A, providing for both the costs of transporting new ties from a new tie plant to the TRS worksite, and for transporting removed used ties from the same site to a tie reuse facility. These costs were included in the track renewal machine gang's total cost (table 35). Since the cost of transporting the used ties has in effect been charged to or paid for by the track renewal system, the transportation cost becomes a sunk cost and is not counted again with the development of material credit for the used ties. Thus, the process of reclaiming the used ties generated by a TRS starts at the tie reuse facility and the .relevant costs are those associated with sorting and reclaiming the used ties.
The costs of sorting and reclaiming ties include all labor, materials, and equipment (capital and maintenance) costs. Sorting costs principally involve the cost of an experienced tie inspector classifying the used ties into reuse categories. Since the reusable ties have in fact been replaced prematurely in changing over from selective maintenance to track renewal, these ties require only routine plugging and adzing (customarily done anyway under selective maintenance), in addition to retreatment with wood preservative. In this study, reclamation costs do not entail the cost of repairing failed ties. While some failed ties should be reparable, this study assumed that failed ties would be sold for nonrailroad track uses.
Tie sorting and reclamation costs were developed around two plant models which are based on North American experience with large-scale wood tie reuse associated with track renewal operations.
The following subsections discuss largescale wood tie reuse experience in North America; develop two model plants for sorting and reclaiming wood ties with unit costs calculated; calculate the value of a used tie; and calculate the net material credit for a used tie.
(1) Large-Scale Wood Tie Reuse in North America. It is possible to realize some value from virtually all wood ties that are removed from railroad tracks. The monetary value and application will vary with tie conditions, market supply and demand, reclamation and transportation costs, and environmental constraints.
Being a fairly large piece of timber that has been chemically treated to retard insect damage and rot, a used wood tie has a number of potential uses that can provide either revenue or savings for the tie's owner. The major applications that wood ties can be used in are:
I I
a. Reuse in railroad track. If the tie's mechanical properties have not deteriorated beyond repair, it can be reclaimed and reused in a class of track that it is capable of supporting. This can vary over the entire range of track from industrial sidings to high-speed or high tonnage main lines. The market includes both the original tie owner and other railroads, particularly short l:!nes and industries.
b. Engineering. Wood ties have been used for cribwork and other civil engineering applications for a long time. The railroad's own engineering department will usually have some need for such ties. Highway departments and construction firms also provide a potential market.
c. Landscaping and agriculture. Railroad ties are popular in landscaping applications for light cribwork, raising gardens, and providing borders. Farmers use ties for fencing, erosion control, and light cribbing.
d. Energy. Most wood ties consist of 2 to 3 cubic feet of wood. When dry, this much wood can develop a c·onsiderable amount of energy. Wood ties in quantity can be used to develop steam heat for a manufacturing plant or to drive steam generators to develop electricity. The rapid rise in energy costs today is making this alternative more attractive. The high chemical content of the ties requires that they be cut into small chips and burned in special furnaces so as to meet air pollution regulations.
The methods of reuse that are used depend on market demand, transportation costs, environmental constraints, the supply of suitable ties, and the general economics of tie reuse. For reuse in track, the technical aspects of reclaiming ties also affect reuse. Experience to date shows the technical feasibility of reclaiming at least the better quality used ties.
Tie reuse economics are affected by many variables, some of which. are necessarily affected by local conditions. So, it is not possible to develop one reuse combination that is mos.t efficient for the railroad industry.
Large-scale wood tie reuse has been common in Europe for many years because European track renewal methods produce large volumes of reusable ties and because hardwood ties are both scarce and relatively expensive. In most cases the ties are shipped to central, mechanized plants which sort the ties into use categories and then reclaim the ties for those categories. Such fixed plants in France, Germany, and the Soviet Union are described in other publications.*
*"Wood Tie Reuse - A Survey Report," report number FRA/ORD-79-44 prepared by Unified Industries Incorporated for the Federal Railroad Administration (1979), NTIS accession number 300866.
"Refurbishment of Railroad Crossties - A Technical and Economic Analysis," report number FRA/ORD-77/76 prepared by Stanford Research Institute for the Federal Railroad Administration . (1977), NTIS accession number 28344 7.
46
For remote locations, the Soviets have developed a mobile tie reconditioning unit which rides on a single flat car approximately 70 feet long. It is equipped to:
a. Pull broken spikes from ties.
b. Plug spike ·holes.
c. Blow dirt from the tie's surface and cracks.
d. Adze the tie plate area.
e. Drill spike holes.
f. Drill horizontal holes through the end of split ties, thread the holes, and drive hardwood antisplitting dowels into the holes.
g. Apply creosote or other preservative to exposed wood surfaces.
A second rail car, highway vehicle, or stationary plant is required to support this plant and includes an air compressor, tool shop, and a lathe for antisplitting dowels.
The mobile plant can recondition up to 400 ties in a 7-hour .shift. It is manufactured for both domestic and export markets.
Until the track renewal methodology came into use in North America, wood tie reuse was only marginal in the railroad industry. Reuse was primarily limited to:
a. Ties removed from abandoned track.
b. Ties removed from main line trackage before failure.
These ties are sorted on site into usable and nonusable categories and given standard rail gang type maintenance as needed, including plugging, adzing, and treatment of the adzed wood. The ties have nearly always been cascaded into the lowest classes of track, sidings, and light branch lines.
The performance of these ties has been somewhat mixed, leading to a general distrust of reusing wood ties within the industry. Mishandling of the ties may be partially responsible for short lifespans. Many of the ties are allowed to dry out and split before they are processed and reinstalled in track.
Until recent years, wood ties were plentiful and inexpensive, providing little incentive for reuse in track. Many ties are removed by sawing into 3 pieces, which, of course, eliminates any further use for the ties other than energy.
Several factors have combined in recent years to create an interest on the part of railroads for tie reuse in track. Included among these factors are:
a. Wood tie prices have risen at a higher rate than the general economic inflation in recent years with no indication of stabilizing.
b. Localized shortages of wood ties have slowed tie replacement programs on some railroads and led to some concern about tie supplies in the future.
c. Deferred maintenance on secondary lines, sidings, and yard tracks has created a larger market for ties in the 1980's.
While several railroads routinely cascade ties into lower class tracks and several new tie producers have occasionally sorted and processed these ties, no large-scale tie reuse programs existed in North America until 1978. This came into being because of track renewal systems installing concrete ties on Amtrak and Canadian National (CNR). Each system removes over 300,000 wood ties per season, most of which still have some effective service life left in them.
When CNR began its concrete tie program in 1976, it shipped all of the wood ties removed by the TRS back to the concrete tie manufacturing plant in Edmonton, Alberta, using the cars that delivered the concrete ties. Since the program began in track that had received normal maintenance up to the previous year, a large number of these used ties were suitable for reuse in main and secondary tracks.
Although the concrete tie program did not need wood tie reuse to justify it (softwood ties were failing at a rapid rate on high tonnage curved track), CNR recognized reuse as an opportunity to increase its benefits fromthe program. In 1978, it awarded a contract to an Edmonton contractor to sort the wood ties and repair those ties that are reusable. The contractor disposes of the remaining ties himself.
A small plant with fixed equipment is processing about 2,000 ties per day on one shift. Equipment consists of cranes and conveyors to move the ties, an adzing machine, and creosote handling equipment. There is no equipment for repairing split ties. They are sold or scrapped. The total manpower for the facility is 15 men, including supervision.
The spikes and tie plates are removed from all ties. Then the ties are sorted into 3 groups: scrap, main line use, and secondary line use. Then, the reusable ties are manually plugged. This is followed by adzing in an automatic adzing machine that cuts both rail seats simultaneously. The rail seats are then coated with creosote. Finally, the reusable ties are bundled and turned over to CNR.
The original sorting breakdown of ties was approximately 20 percent main line use, 40 percent secondary line use, and 40 percent scrap. This varies considerably over time, depending upon the track the ties were removed from, the amount of maintenance given the track
47
in recent years, and the length of time the ties wait to be processed. Tie classification specifications used in Edmonton are as follows:
Grade A Category -- Ties for reuse in track carrying more than 25 million gross tons (MGT):
a - Tie shall be sawed on all 4 sides.
b - Tie shall be 8 feet to 8.5 feet long and 7 inches to 7.5 inches deep.
c - Adzing prior to repair shall not exceed 0.5 inch in depth.
d - Tie shall have no transverse cracks.
e - Tie shall be sound with no signs of rot.
f - Tie shall not be spike killed.
g - Tie may contain a single split up to 1 inch deep extending the full length of the tie.
h - Tie may contain a single split up to onehalf the depth of the tie extending from the end of the tie, but not through the tie plate area.
i - There shall be no damage due to dragging equipment, derailment, or fire.
Grade B Category -- Ties for reuse in track carrying less than 25 MGT:
Any tie not included in either category A or the scrap tie category.
Scrap Tie Category:
a - Tie less than 5 inches deep.
b - Tie having one or more transverse cracks.
.c - Adzing more than 1.5 inches in depth.
d - Tie previously turned; that is, used both top and bottom.
e - Tie contains a split for the entire depth of the tie, extending more than one-third the length of the tie.
f- Tie contains multiple splits extending from one end through the entire depth of tie and through the tie plate area.
g - Tie crushed more than 1 inch in depth in tie plate area.
h - Tie is spike killed.
i - Tie damaged by derailment, dragging equipment, or fire.
In 1979, CNR began local processing of the used wood ties removed from two of the three operating regions in which the TRS operates each season. This was done for three reasons:
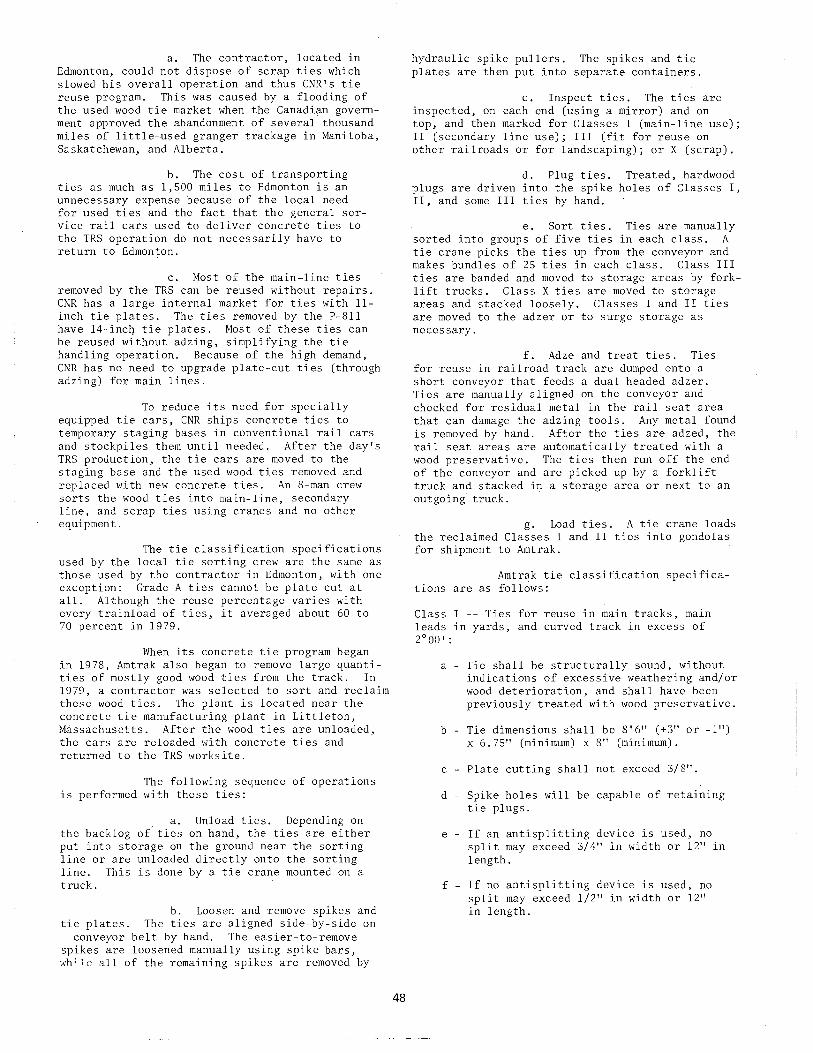
a. The contractor, located in Edmonton, could not dispose of scrap ties which slowed his overall operation and thus CNR's tie reuse program. This was caused by a flooding of the used wood tie market when the Canadian government approved the abandonment of several thousand miles of little--used granger trackage in Manitoba, Saskatchewan, and Alberta.
b. The cost of transporting ties as much as 1,500 miles to Edmonton is an unnecessary expense because of the local need for used ties and the fact that the general service rail cars used to deliver concrete ties to the TRS operation do not necessarily have to return to Edmonton.
c. Most of the main-line ties removed by the TRS can be reused without repairs. CNR has a large internal market for ties with 11-inch tie plates. The ties removed by the P-811 have 14-incq tie plates. Most of these ties can be reused without adzing, simplifying the tie handling operation. Because of the high demand, CNR has no need to upgrade plate-cut ties (through adzing) for main lines.
To reduce its need for specially equipped tie cars, CNR ships concrete ties to temporary staging bases in conventional rail cars and stockpiles them until needed. After the day's TRS production, the tie cars are moved to the staging base and the used wood ties removed and replaced with new concrete ties. An 8-man crew sorts the wood ties into main-line, secondary line, and scrap ties using cranes and no other equipment.
The tie classification specifications used by the local tie sorting crew are the same as those used by the contractor in Edmonton, with one exception: Grade A ties cannot be plate cut at all. Although the reuse percentage varies with every trainload of ties, it averaged about 60 to 70 percent in 1979.
When its concrete tie program began in 1978, Amtrak also began to remove large quantities of mostly good wood ties from the track. In 1979, a contractor was selected to sort and reclaim these wood ties. The plant is located near the concrete tie manufacturing plant in Littleton, Massachusetts. After the wood ties are unloaded, the cars are reloaded with concrete ties and returned to the TRS worksite.
The following sequence of operations is performed with these ties:
a. Unload ties. Depending on the backlog of' ties on hand, the ties are either put into storage on the ground near the sorting llne or are unloaded directly onto the sorting line. This is done by a tie crane mounted on a truck.
b. Loosen and remove spikes and tie plates. The ties are aligned side-by-side on
conveyor belt by hand. The easier-to-remove spikes are loosened manually using spike bars, while all of the remaining spikes are removed by
48
hydraulic spike pullers. The spikes and tie plates are then put into separate containers.
c. Inspect ties. The ties are inspected, on each end (using a mirror) and on top, and then marked for Classes I (main-line use); II (secondary line use); III (fit for reuse on other railroads or for landscaping); or X (scrap).
d. Plug ties. Treated, hardwood plugs are driven into the spike holes of Classes I, II, and some III ties by hand.
e. Sort ties. Ties are manually sorted into groups of five ties in each class. A tie crane picks the ties up from the conveyor and makes bundles of 25 ties in each class. Class III ties are banded and moved to storage areas by forklift trucks. Class X ties are moved to storage areas and stacked loosely. Classes I and II ties are moved to the adzer or to surge storage as necessary.
f. Adze and treat ties. Ties for reuse in railroad track are dumped onto a short conveyor that feeds a dual headed adzer. Ties are manually aligned on the conveyor and checked for residual metal in the rail seat area that can damage the adzing tools. Any metal found is removed by hand. After the ties are adzed, the rail seat areas are automatically treated with a wood preservative. The ties then run off the end of the conveyor and are picked up by a forklift truck and stacked in a storage area or next to an outgoing truck.
g. Load ties. A tie crane loads the reclaimed Classes I and II ties into gondolas for shipment to Amtrak.
Amtrak tie classification specifications are as follows:
Class I -- Ties for reuse in main tracks, main leads in yards, and curved track in excess of 2° 00':
a - Tie shall be structurally sound, without indications of excessive weathering and/or wood deterioration, and shall have been previously treated with wood preservative.
b - Tie· dimensions shall be 8' 6" ( +3" or -1 ") x 6.75" (minimum) x 8" (minimum).
c - Plate cutting shall not exceed 3/8".
d - Spike holes will be capable of retaining tie plugs.
e - If an antisplitting device is used, no split may exceed 3/4" in width or 12" in length.
f - If no antisplitting device is used, no split may exceed 1/2" in width or 12" in length.
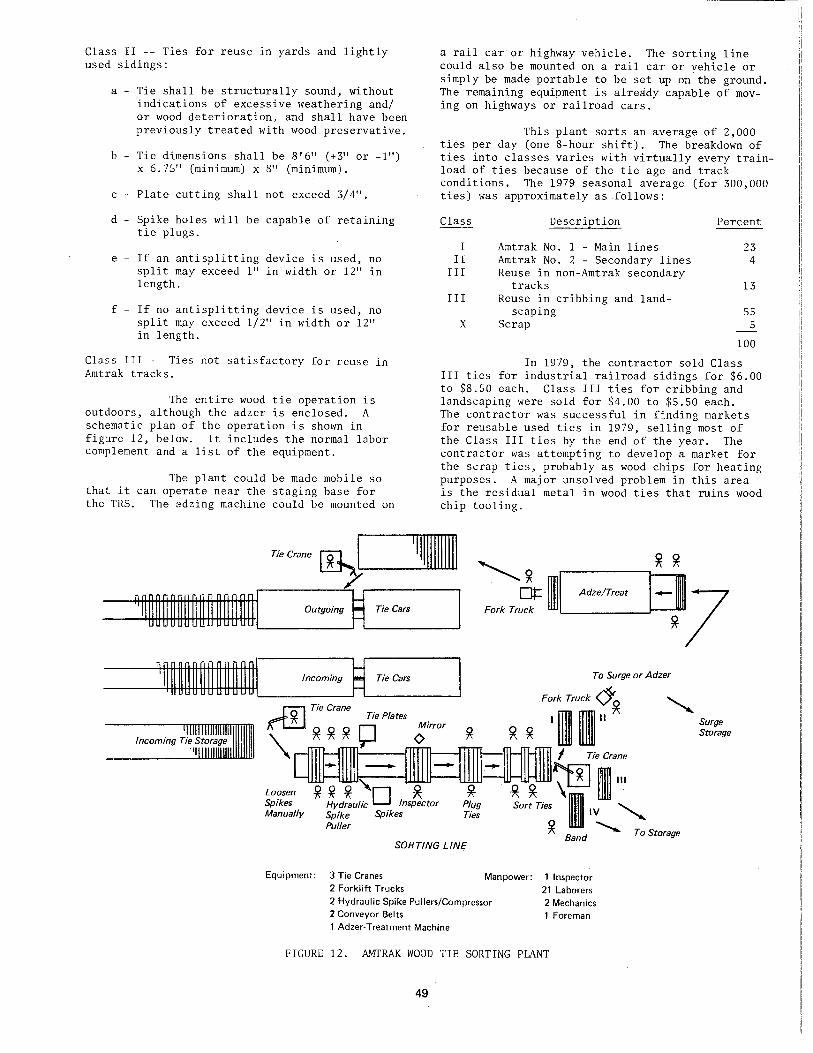
Class II -- Ties for reuse in yards and lightly used sidings:
a - Tie shall be structurally sound, without indications of excessive weathering and/ or wood deterioration, and shall have been previously treated with wood preservative.
b - Tie dimensions shall be 8'6" (+311 or -1") x 6.75" (minimum) x 8" (minimum).
c- Plate cutting shall not exceed 3/4".
d - Spike holes will be capable of retaining tie plugs.
e - If an antisplitting device is used, no split may exceed 1" in width or 12" in length.
f - If no antisplitting device is used, no split m;3.y exceed 1/2" in width or 12" in length.
Class III -- Ties not satisfactory for reuse in Amtrak tracks.
The entire wood tie operation is outdoors, although the adzer is enclosed. A schematic plan of the operation is shown in figure 12, below. It includes the normal labor complement and a list of the equipment.
The plant could be made mobile so that it can operate near the staging base for the TRS. The adzing machine could be mounted on
a rail car or highway vehicle. The sorting line could also be mounted on a rail car or vehicle or simply be made portable to be set up on the ground. The remaining equipment is already capable of moving on highways or railroad cars.
This plant sorts an average of 2,000 ties per day (one 8-hour shift). The breakdown of ties into classes varies with virtually every trainload of ties because of the tie age and track conditions. The 1979 seasonal average (for 300,000 ties) was approximately as.follows:
Class Description Percent
I Amtrak No. 1 - Main lines 23 II Amtrak No. 2 - Secondary lines 4
III Reuse in non-Amtrak secondary tracks 13
III Reuse in cribbing and land-scaping 55
X Scrap 5
100
In 1979, the contractor sold Class III ties for industrial railroad sidings for $6.00 to $8.50 each. Class III ties for cribbing and landscaping were sold for $4.00 to $5.50 each. The contractor was successful in finding markets for reusable used ties in 1979, selling most of the Class III ties by the end of the year. The contractor was attempting to develop a market for the scrap ties, probably as wood chips for heating purposes. A major unsolved problem in this area is the residual metal in wood ties that ruins wood chip tooling.
T;.C'""' ~ '1
11111111111 "' ~~ & ~~ M"n~, 1-17
R ~ ~ ~ ~ ~ ~ ~ ~ ~ ~ ~ ~ ~ ~~I Outgoing ~'--Tie c_ars ----'
Incoming ~'--r._,_·e_c_a_rs ___ __.
Loosen Spikes Manually
Tie Plates Mirror
~ ~ ~ "o .R Hydraulic Inspector Spike Spikes Puller
~ Plug Ties
SORTING LINE
Equipment: 3 Tie Cranes 2 Forklift Trucks
Fork Truck
~
To Surge or Adzer
Fork Truck 0'~ " 0 0
1 ITIJI 11l1Jln Surge r;. " UJll llllll Storage
I Tie Crane
~\ ~ mJiln1 ~~ IJIU· Sort Ties MID IV ~
~ 111111" Band To Storage
Manpower: 1 Inspector 21 Laborers
2 Hydraulic Spike Pullers/Compressor 2 Conveyor Belts
2 Mechanics 1 Foreman
1 Adzer-Treatment Machine
FIGURE 12. A~RAK WOOD TIE SORTING PLANT
49
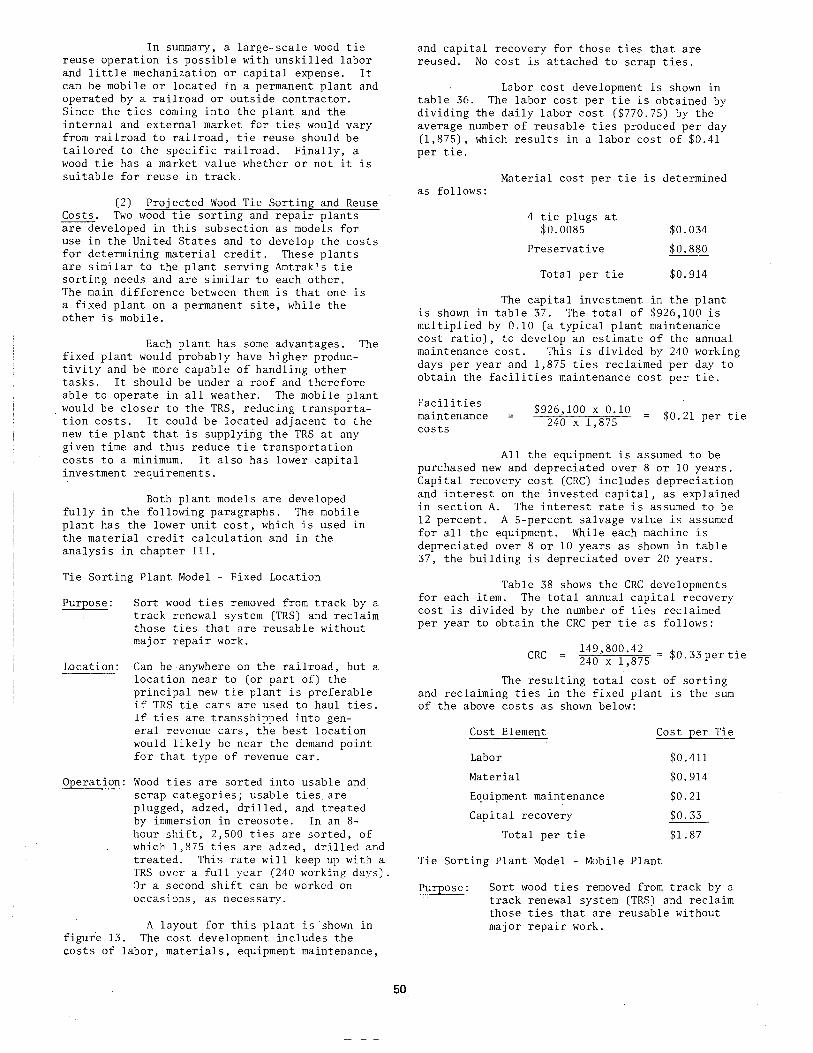
In summary, a large-scale wood tie reuse operation is possible with unskilled labor and little mechanization or capital expense. It can be mobile or located in a permanent plant and operated by a railroad or outside contractor. Since the ties coming into the plant and the internal and external market for ties would vary from railroad to railroad, tie reuse should be tailored to the specific railroad. Finally, a wood tie has a market value whether or not it is suitable for reuse in track.
(2) Projected Wood Tie Sorting and Reuse Costs. Two wood tie sorting and repair plants are developed in this subsection as models for use in the United States and to develop the costs for determining material credit. These plants are similar to the plant serving Amtrak's tie sorting needs and are similar to each other. The main difference between them is that one is a fixed plant on a permanent site, while the other is mobile.
Each plant has some advantages. The fixed plant would probably have higher productivity and be more capable of handling other tasks. It should be under a roof and therefore able to operate in all weather. The mobile plant would be closer to the TRS, reducing transportation costs. It could be located adjacent to the new tie plant that is supplying the TRS at any given time and thus reduce tie transportation costs to a minimum. It also has lower capital investment requirements.
Both plant models are developed fully in the following paragraphs. The mobile plant has the lower unit cost, which is used in the material credit calculation and in the analysis in chapter III.
Tie Sorting Plant Model - Fixed Location
Purpose: Sort wood ties removed from track by a track renewal system (TRS) and reclaim those ties that are reusable without major repair work.
Locat~~~: Can be anywhere on the railroad, but a location near to (or part of) the principal new tie plant is preferable if TRS tie cars are used to haul ties. If ties are transshipped into general revenue cars, the best location would likely be near the demand point for that type of revenue car.
Operation: Wood ties are sorted into usable and scrap categories; usable ties are plugged, adzed, drilled, and treated by immersion in creosote. In an 8-hour shift, 2,500 ties are sorted, of which 1,875 ties are adzed, drilled and treated. This rate will keep up with a TRS over a full year (240 workinr. days) . Or a second shift can be worked on occasions, as necessary.
A layout for this plant is shown in figur·e 13. The cost development includes the costs of labor, materials, equipment maintenance,
50
and capital recovery for those ties that are reused. No cost is attached to scrap ties.
Labor cost development is shown in table 36. The labor cost per tie is obtained by dividing the daily labor cost ($770.75) by the average number of reusable ties produced per day (1,875), which results in a labor cost of $0.41 per tie.
as follows: Material cost per tie is determined
4 tie plugs at $0.0085
Preservative
Total per tie
$0.034
$0.880
$0.914
The capital investment in the plant is shown in table 37. The total of $926,100 is multiplied by 0.10 (a typical plant maintenance cost ratio), to develop an estimate of the annual maintenance cost. This is divided by 240 working days per year and 1,875 ties reclaimed per day to obtain the facilities maintenance cost per tie.
Facilities maintenance costs
$926,100 X 0.10 240 X 1,875 $0.21 per tie
All the equipment is assumed to be purchased new and depreciated over 8 or 10 years. Capital recovery cost (CRC) includes depreciation and interest on the invested capital, as explained in section A. The interest rate is assumed to be 12 percent. A 5-percent salvage value is assumed for all the equipment. While each machine is depreciated over 8 or 10 years as shown in table 37, the building is depreciated over 20 years.
Table 38 shows the CRC developments for each item. The total annual capital recovery cost is divided by the number of ties reclaimed per year to obtain the CRC per tie as follows:
CRC 149,800.42 - $0 33 t" 240 x 1,875- · per le
The resulting total cost of sorting and reclaiming ties in the fixed plant is the sum of the above costs as shown below:
Cost Element Cost 12er Tie
Labor $0.411
Material $0.914
Equipment maintenance $0.21
Capital recovery $0.33
Total per tie $1.87
Tie Sorting Plant Model - Mobile Plant
Sort wood ties removed from track by a track renewal system (TRS) and reclaim those ties that are reusable without major repair work.
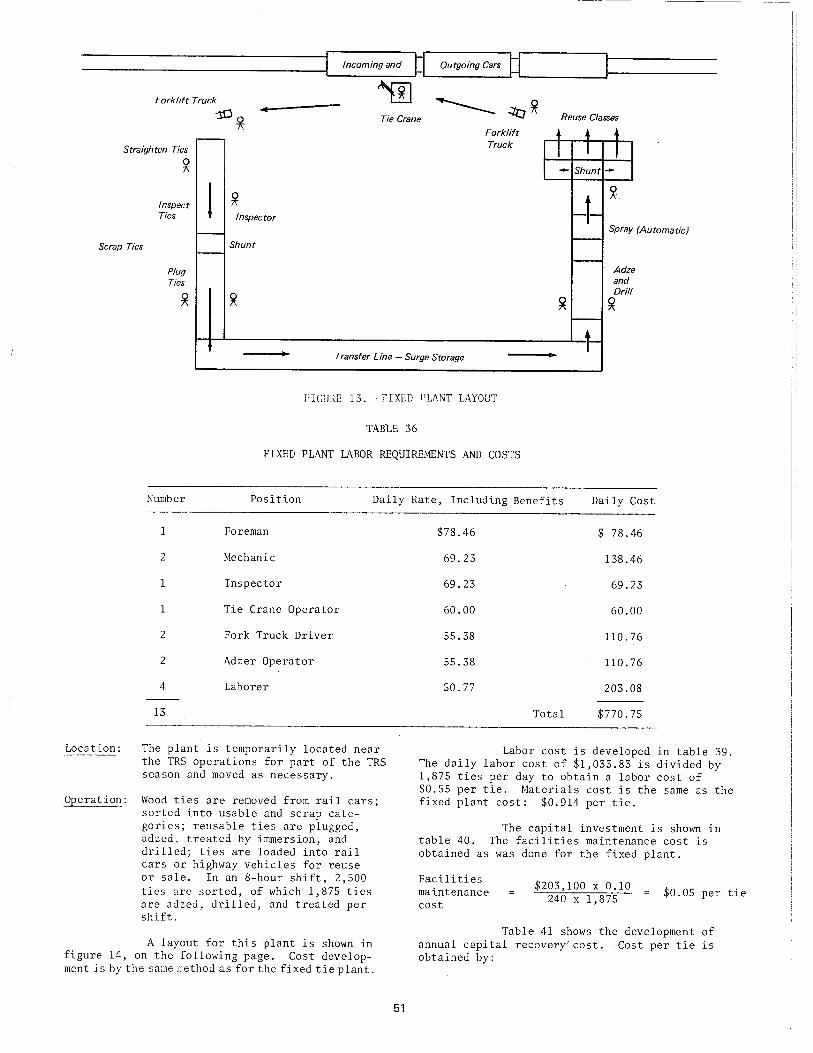
Forklift Truck
Straighten Ties
Scrap Ties
~
Inspect Ties
Plug Ties
:lO~ ,--
! ~ Inspector
-Shunt -
~
Incoming and n ~ Tie Crane
Outgoing Cars ~l ______ j---------
Reuse Classes
Forklift • • + Truck I I I - Shunt -~t-
~.
Spray (Automatic) --
Adze and Drill
~ ~ -t-
Transfer Line - Surge Storage
FIGURE 13. FIXED PLANT LAYOUT
TABLE 36
FIXED PLANT LABOR REQUIREMENTS AND COSTS
Number Position Daily
1 Foreman
2 Mechanic
l Inspector
l Tie Crane Operator
2 Fork Truck Driver
2 Adzer Operator
4 Laborer
13
Location: The plant is temporarily located near the TRS operations for part of the TRS season and moved as necessary.
Operation: Wood ties are removed from rail cars; sorted into usable and scrap categories; reusable ties are plugged, adzed, treated by immersion, and drilled; ties are loaded into rail cars or highway vehicles for reuse or sale. In an 8-hour shift, 2,500 ties are sorted, of which 1,875 ties are adzed, drilled, and treated per shift.
A layout for this plant is shown in figure 14, on the following page. Cost development is by the same method as for the fixed tie plant.
51
Rate, Including Benefits Daily Cost
$78.46 $ 7il.46
69.23 138.46
69.23 69.23
60.00 60.00
55.38 110.76
55.38 110.76
50.77 203.08
Total $770.75
Labor cost is developed in table 39. The daily labor cost of $1,033.83 is divided by 1,875 ties per day to obtain a labor cost of $0.55 per tie. Materials cost is the same as the fixed plant cost: $0.914 per tie.
The capital investment is shown in table 40. The facilities maintenance cost is obtained as was done for the fixed plant.
Facilities maintenance cost
$203,100 X 0.10 240 X 1,875 $0.05 per tie
Table 41 shows the development of annual capital recovery cost. Cost per tie is obtained by:
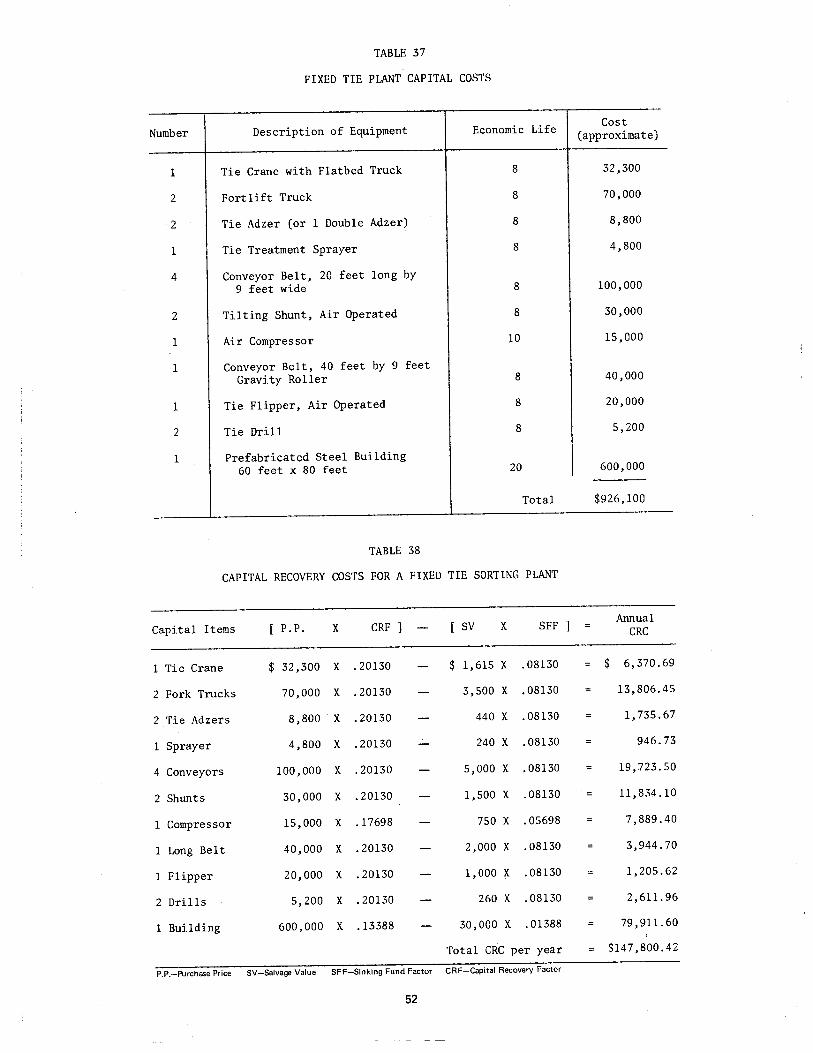
TABLE 37
FIXED TIE PLANT CAPITAL COSTS
Number
1
2
2
1
4
2
1
1
1
2
1
Description of Equipment
Tie Crane with Flatbed Truck
Fortlift Truck
Tie Adzer (or 1 Double Adzer)
Tie Treatment Sprayer
Conveyor Belt, 20 feet long by 9 feet wide
Tilting Shunt, Air Operated
Air Compressor
Conveyor Belt, 40 feet by 9 feet Gravity Roller
Tie Flipper, Air Operated
Tie Drill
Prefabricated Steel Building 60 feet x 80 feet
TABLE 38
Economic Life
8
8
8
8
8
8
10
8
8
8
20
Total
CAPITAL RECOVERY COSTS FOR A FIXED TIE SORTING PLANT
Capital Items P.P. X CRF ] sv X SFF ]
1 Tie Crane $ 32,300 X .20130 $ 1,615 X .08130
2 Fork Trucks 70,000 X .20130 3,500 X .08130
2 Tie Adzers 8,800 X .20130 440 X .08130
1 Sprayer 4,800 X .20130 240 X .08130
4 Conveyors 100,000 X .20130 5,000 X .08130
2 Shunts 30,000 X .20130 1,500 X .08130
1 Compressor 15,000 X .17698 750 X .05698
1 Long Belt 40,000 X .20130 2,000 X .08130
1 Flipper 20,000 X .20130 1,000 X .08130
2 Drills 5,200 X .20130 260 X .08130
1 Building 600,000 X .13388 30,000 X .01388
Total CRC per year
P.P.-Purchase Price SV-Salvage Value SFF-Sinking Fund Factor CRF-Capital Recovery Factor
52
Cost (approximate)
32,300
70,000
8,800
4,800
100,000
30,000
15,000
40,000
20,000
5,200
600,000
$926,100
Annual CRC
$ 6,370.69
13,806.45
1,735.67
946.73
19,723.50
11,834.10
7,889.40
3,944.70
1,205.62
2,611. 96
79,911.60
$147,800.42
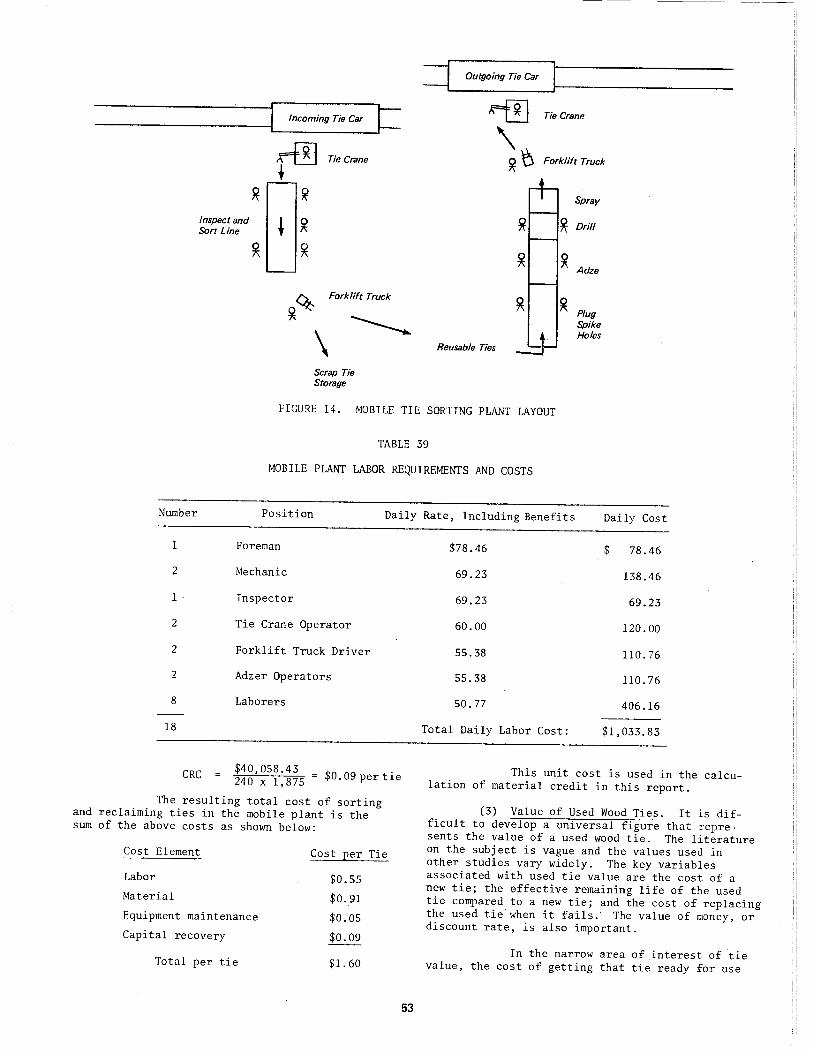
~
Inspect and Sort Line
~
Incoming Tie Car t= x=f!] Tie Crane
~ ~
! ~
~
Forklift Truck
Scrap Tie Storage
- ------ ---- --------
=l Outgoing Tie Car
~
~~
~
Reusable Ties
Tie Crane
Forklift Truck
Spray
Drill
Adze
Plug Spike Holes
FIGU~E 14. MOBILE TIE SORTING PLANT LAYOUT
TABLE 39
MOBILE PLANT LABOR REQUIREMENTS AND COSTS
Number Position Daily Rate, Including Benefits Daily Cost
1
2
1
2
2
2
8
18
CRC
Foreman
Mechanic
Inspector
Tie Crane Operator
Forklift Truck Driver
Adzer Operators
Laborers
$40• 058 · 43 = $0.09pertie 240 X 1,875
The resulting total cost of sorting and reclaiming ties in the mobile plant is the sum of the above costs as shown below:
Cost Element
Labor
Material
Equipment maintenance
Capital recovery
Total per tie
Cost per Tie
$0.55
$0.91
$0.05
$0.09
$1.60
53
$78.46 $ 78.46
69.23 138.46
69.23 69.23
60.00 120.00
55.38 110.76
55.38 110.76
so. 77 406.16
Total Daily Labor Cost: $1,033.83
This unit cost is used in the calculation of material credit in this report.
(3) Value of Used Wood Ties. It is difficult to develop a universal figure that represents the value of a used wood tie. The literature on the subject is vague and the values used in other studies vary widely. The key variables associated with used tie value are the cost of a new tie; the effective remaining life of the used tie compared to a new tie; and the cost of replacing the used tie when it fails. The value of money, or discount rate, is also important.
In the narrow area of interest of tie value, the cost of getting that tie ready for use
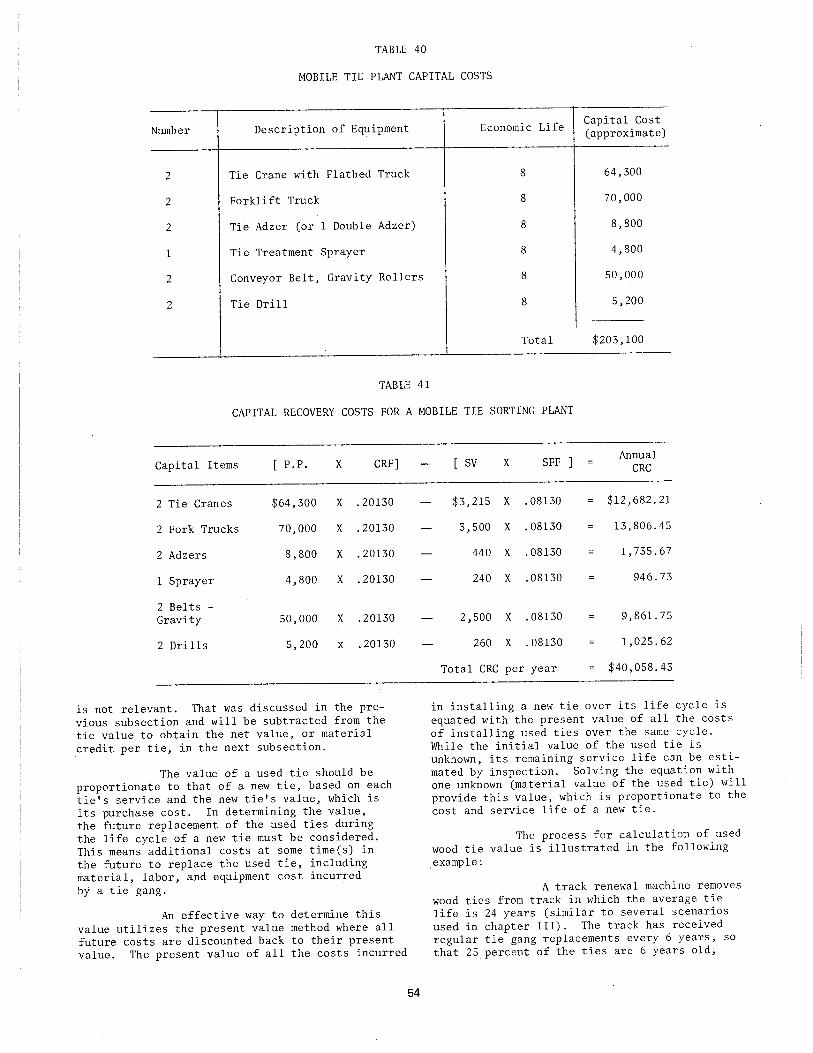
TABLE 40
MOBILE TIE PLANT CAPITAL COSTS
Number Description of Equipment Economic Life Capital Cost (approximate)
2 Tie Crane with Flatbed Truck 8 64,300
2 Forklift Truck 8 70,000
2 Tie Adzer (or l Double Adzer) 8 8,800
l Tie Treatment Sprayer 8 4,800
2 Conveyor Belt, Gravity Rollers 8 50,000
2 Tie Drill 8 5,200
Total $203,100
TABLE 41
CAPITAL RECOVERY COSTS FOR A MOBILE TIE SORTING PLANT
Capital Items [ P.P. X CRF]
2 Tie Cranes $64,300 X .20130
2 Fork Trucks 70,000 X .20130
2 Adzers 8,800 X .20130
l Sprayer 4,800 X .20130
2 Belts -Gravity 50,000 X .20130
2 Drills 5,200 X .20130
is not relevant. That was discussed in the previous subsection and will be subtracted from the tie value to obtain the net value, or material credit per tie, in the next subsection.
The value of a used tie should be proportionate to that of a new tie, based on each tie's service and the new tie's value, which is its purchase cost. In determining the value, the future replacement of the used ties during the life cycle of a new tie must be considered. This means additional costs at some time(s) in the future to replace the used tie, including material, labor, and equipment cost incurred by a tie gang.
An effective way to determine this value utilizes the present value method where all future costs are discounted back to their present value. The present value of all the costs incurred
54
[ sv X SFF ] Annual
CRC
$3,215 X . 08130 $12,682.21
3,500 X . 08130 13,806.45
440 X .08130 1,735.67
240 X .08130 946.73
2,500 X .08130 9,861. 75
260 X . 08130 1,025.62
Total CRC per year $40,058.43
in installing a new tie over its life cycle is equated with the present value of all the costs of installing used ties over the same cycle. While the initial value of the used tie is unknown, its remaining service life can be estimated by inspection. Solving the equation with one unknown (material value of the used tie) will provide this value, which is proportionate to the cost and service life of a new tie.
The process for calculation of used wood tie value is illustrated in the following example:
A track renewal machine removes wood ties from track in which the average tie life is 24 years (similar to several scenarios used in chapter III). The track has received regular tie gang replacements every 6 years, so that 25 percent of the ties are 6 years old;
25 percent are 12 years old; 25 percent are 18 years old; and 25 percent are 24 years old. It can be assumed that these groups of ties have 18, 12, 6, and 0 years of remaining life. Those ties with no remaining life have no value for track reuse and are dealt with later.
The 18-, 12-, and 6-year remaining life ties have an average remaining life of 12 years. Using this average simplifies the mathematics without having much effect on the result. It is therefore to be expected that if these ties are reinstalled in track with an average of 24-year tie life, they will last an average 12 years, at which point they will be replaced by selective tie gangs.
The labor, capital recovery, equipment maintenance, and tie transportation costs associated with replacing 812 ties by a tie gang total $6,578.46 (taken from table 35). The cost per tie is $8.10. The cost of a new tie is assumed to be $13.50 (from table 10). The discount rate is assumed to be 10 percent.
shown below:
Re:elacement
$8.10
0
$8.10
Re:elacement
$8. 10
$8.10
$8. 10
The replacement cycles and costs are
New Tie
Cost Material Value
$13.50
0
$13.50
Used Tie
Cost Material Value
X
X
X
Year
12
24
Year
1
12
24
There is equivalence for the alternatives at year 24, at which point the costs are not considered. Using the present value method and equating the new tie to used tie alternatives:
$8.10 + $13.50 = $8.10 +X+ 0.3186 ($8.10 +X)
0.3186 is the discount factor in year 12 at 10 percent.
Solving for X, the value of a used tie in this situation is $8.28.
At other average tie lives, the value of a used tie would be higher or lower as calculated.
If the used tie is installed in a track which is programed for complete renewal in the year in which the tie should fail and need replacement, the value of the used tie would be increased by the discounted replacement cost, $8.10 x 0.3186 = $2.58. Some railroads may want to attempt this long-term programing of track renewals and tie placement to maximize savings,
55
but it would be very complex and require a longterm commitment to the track renewal method. The added value is not used in the determination of material credit in this report.
If a used tie is reinstalled in a very lightly used track where it will rot before it ever fails mechanically, it will have very nearly the same reuse life as a new tie would have. Under these circumstances the used tie value could be assumed to be equal to that of a new tie.
The ties which are not reused in track also have some value as they can be used in landscaping, fencing, landfills, or as energy. The size of the market for each use varies from region to region and affects the market value of the ties. The current and projected value and shortage of fuels may lead to a long-term growth market for wood ties for steam plants. Wood ties are being sold by at least one railroad for as little as $1.00 per tie, but the buyer usually has to pick them up behind a tie gang. Amtrak's tie sorting contractor has been receiving $4.00 to $7.00 per tie,· sold in volume and already palletized. For this study, the scrap ties have been assigned a net value of $2.00. This value is probably conservative and the reader may wish to adjust it for local conditions in modifying the framework details.
(4) Material Credit Calculation: Net Economic Impact of Reuse or Disposal_. The material credit for ties, or any track component, is the difference between the full net value of the material and the cost of preparing the material for reuse or sale. In the example above, the ties for reuse would be worth $8. 28 - $1. 60 = $6.68 per tie, assuming the mobile tie sorting plant is used. The ties sold for scrap would be worth $2.00 per tie as no particular cost is assumed in the economic framework for preparing these ties.
With the assumption that 75 percent of the ties in·a mile are reusable, the material credit per mile is calculated as follows:
Reuse ties- 0.75 x 3,250 ties per mile x $6.68 per tie $16,282.50
Scrap ties - 0.25 x 3,250 ties per mile x $2.00 per tie $ 1,625.00
Total material credit per mile $17,907.50
If 50 percent of the ties are defective, the material credit per mile is:
Reuse ties - 0.50 x 3,250 ties per mile x $6.68 per tie $10,855.00
Scrap ties - 0.50 x 3,250 ties per mile x $2.00 per tie $ 3,250.00
Total material credit per mile $14,105.00
If the discounted tie gang costs could be eliminated by scheduled tie placement in future renewal trackage, the $2.58 savings per

tie could be added for the ties to be reused. In
the first example this wbuld be:
0.75 x 3,250 ties per mile x $2.58 = $6,288.75,
which when added to the original material credit
($17,907.50), results in a total credit of
$24,196.25.
Several other combinations of situa
tions were calculated and are shown in table 42.
The graph in figure 15 can be used to determine
the material credit where the average tie life
is 20, 24, 30, or 36 years, all scrap ties are
sold, and the average remaining life in the
reused ties is one-half the expected life of a
new tie.
3. Long-Term Costing Methodology
The final element of the economic analysis
framework is the development of long-term costs
for each alternative. This follows the logical
progression of describing the alternative sys
tems and developing costs and material credits
for each operation and is broken down into tasks
in figure 16, on page 57.
Long-term costs encompass all costs and cre
dits that occur over a track maintenance cycle
being evaluated. The cycle or period of analysis
evaluated usually coincides with the rail life
and average life of the ties. Thus, long-term
costs include first-year costs, credit for used
materials, and all annual maintenance costs
occurring over a defined period of analysis.
With track renewal, the track is essentially
rebui 1t in the first or renewal year. .Between
track renewals, only light basic maintenance is
usually performed. With selective maintenance,
mechanized tie gangs periodically change at least
25 percent of the ties, as explained earlier, to
maintain the track during the renewal cycle.
It is expected that track renewal would
normally represent a higher initial expense in the
first year. However, the extent to which the
first-year loss would be recovered and perhaps
surpassed to show a net cost savings must be
investigated. A comprehensive cost comparison
between these two methods of track maintenance
must therefore show the cost of maintaining a
proposed track structure by either method, over
the long term.
All costs that occur after the first year are
discounted back to their present value, so as to
provide a standardized basis of comparison. If
the first-year cost is added to the discounted
annual maintenance costs, in the case of either
method, to give the present work of the alterna
tive cash flows, a decision based on least cost
or cost effectiveness can be made.
One frequently used measure of long-term pro
ject feasibility is the development of present
worths of costs for each alternative over the project life. When comparing alternatives for a
new project, the lowest present worth (PW) cost
is usually chosen unless other factors make a
higher cost alternative more attractive. The
return on investment may be higher with a higher
cost alternative, and many corporations consider
return on investment to be an important criterion
for evaluation of alternatives. In addition, non
economic criteria, or factors not easily quantified
in dollars, may be used in the evaluation. For
example, the savings in track occupancy time
TABLE 42
.MATERIAL CREDIT POSSIBILITIES
Average Percent
Percent Percent Remaining Ties Tie Ties Life of Reins tall ed/ Reuse Material Credit New Tie Life
Failed Ties Ties Replaced in Plant Sold per Mile ($) (years) Ties Reused for
Reused Future By Type Salvage (years)
25 75 10 Tie Gang Mobile 25 15,981.87 20
25 75 12 Tie Gang Mobile 25 17,907.50 24
25 75 12 Tie Gang Fixed 25 17,249.37 24
25 75 12 TRS Mobile 25 24,196.25 24
50 50 12 Tie Gang Mobile 50 14,105.00 24
50 25 12 Tie Gang Mobile 75 10,302.50 24
25 75 15 Tie Gang Mobile 25 20,466.88 30
25 75 18 Tie Gang Mobile 25 22,587.50 36
100 0 -- -------- ------ 100 6,500.00 N/A
56

25,000
20,000
..!,'
:;;: 15,000 ~ Q.
+-'
1J
"' u ~ ~ 10,000 "' :;;:
5,000
0 10 20 30 40 50 60 70 80 90 100
Percent of Ties Reused
FIGURE 15. MATERIAL CREDIT BY REUSE PERCENTAGE
offered by track renewal may be important to management even though such savings are difficult to cost.
Develop Long-Term Maintenance Requirements Scenario
I I Develop Long-Term I
Cash Flows
I Develop First-Year Costs
I Determine of Return
Rate I
I Analyze Results j
FIGURE 16. LONG-TERM COSTING FLOW CHART
57
The present worth method of comparison is outlined below and is used in chapter III to develop estimated costs/benefits from track renewal.
Step 1: Determine first-year and long-term track maintenance requirements by the selective and track renewal methods. For the first year, this entails determining the number of ties per mile to be replaced, whether or not the rails will be replaced, whether or not the ballast is to be cleaned, and if the track should be surfaced and lined. For future years, these operations should be projected as necessary to the year in which track renewal would be repeated. That projection will have to be based on an assumption about tie life and may be subject to error. Tie life for the selectively maintained track, as well as rail life and surfacing cycles, should be predictable from the railroad's past experience.
The scheduling of future tie gangs and track renewal must be based on railroad policy as well as assumed average tie life. In chapter III, longterm costs are projected for situations in which tie life is the same under selective maintenance and track renewal and also for situations in which tie life is longer under track renewal.
One method for estimating the future year in which either a tie gang or a TRS must renew the track is by using the chart developed by theForest
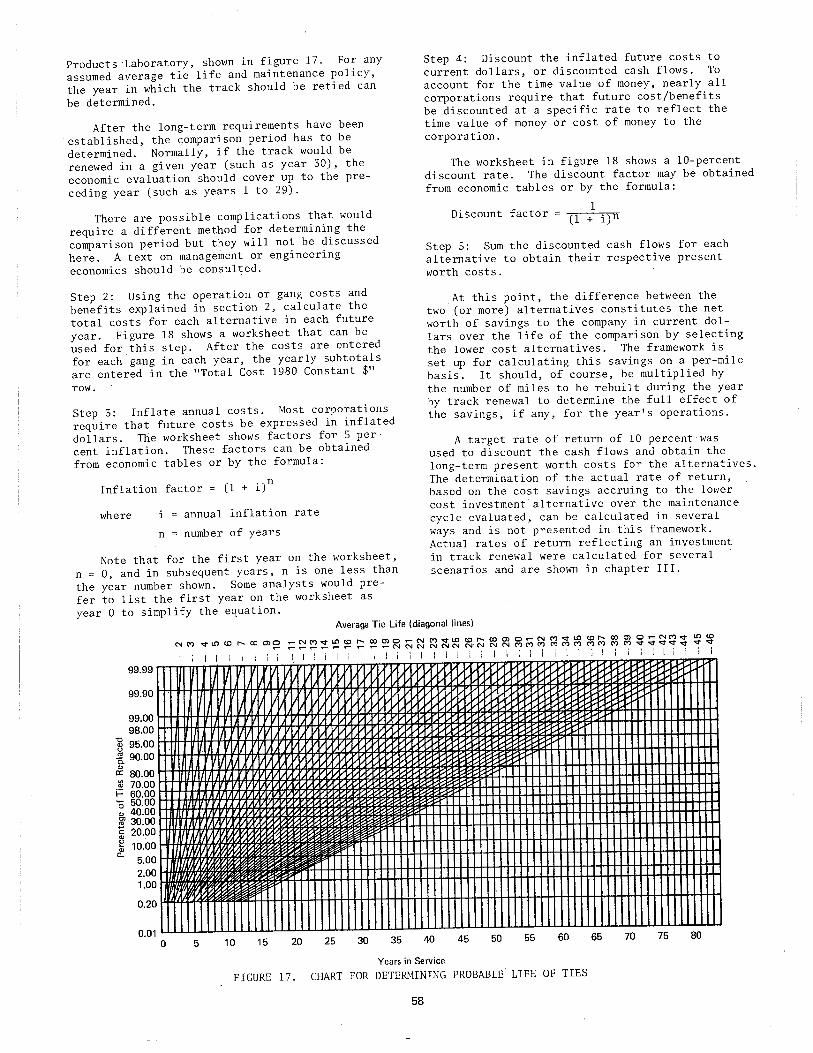
Products·Laboratory, shown in figure 17. For any
assumed average tie life and maintenance policy,
the year in which the track should be retied can
be determined.
After the long-term requirements have been
established, the comparison period has to be
determined. Normally, if the track would be
renewed in a given year (such as year 30), the
economic evaluation should cover up to the pre
ceding year (such as years 1 to 29).
There are possible complications that would
require a different method for determining the
comparison period but they will not be discussed
here. A text on management or engineering
economics should be consulted.
Step 2: Using the operation or gang costs and
benefits explained in section 2, calculate the
total costs for each alternative in each future
year. Figure 18 shows a worksheet that can be
used for this step. After the costs are entered
for each gang in each year, the yearly subtotals
are entered in the "Total Cost 1980 Constant $" row.
Step 3: Inflate annual costs. Most corporations
require that future costs be expressed in inflated
dollars. The worksheet shows factors for 5 per
cent inflation. These factors can be obtained
from economic tables or by the formula:
Inflation factor = (1 + i)n
where i annual inflation rate
n = number of years
Note that for the first year on the worksheet,
n = 0, and in subsequent years, n is one less than
the year number shown. Some analysts would pre
fer to list the first year on the worksheet as
year 0 to simplify the equation.
Step 4: Discount the inflated future costs to
current dollars, or discounted cash flows. To
account for the time value of money, nearly all
corporations require that future cost/benefits
be discounted at a specific rate to reflect the
time value of money or cost of money to the corporation.
The worksheet in figure 18 shows a 10-percent
discount rate. The discount factor may be obtained
from economic tables or by the formula:
1 Discount factor = (l + i)n
Step 5: Sum the discounted cash flows for each
alternative to obtain their respective present
worth costs.
At this point, the difference between the
two (or more) alternatives constitutes the net
worth of savings to the company in current dol
lars over the life of the comparison by selecting
the lower cost alternatives. The framework is
set up for calculating this savings on a per-mile
basis. It should, of course, be multiplied by
the number of miles to be rebuilt during the year
by track renewal to determine the full effect of
the savings, if any, for the year's operations.
A target rate of return of 10 percent was
used to discount the cash flows and obtain the
long-term present worth costs for the alternatives.
The determination of the actual rate of return,
based on the cost savings accruing to the lower
cost investment alternative over the maintenance
cycle evaluated, can be calculated in several
ways and is not presented in this framework.
Actual rates of return reflecting an investment
in track renewal were calculated for several
scenarios and are shown in chapter III.
Average Tie Life (diagonal lines)
Years in Service
FIGURE 17. CHART FOR DETERMINING PROBABLE LIFE OF TIES
58
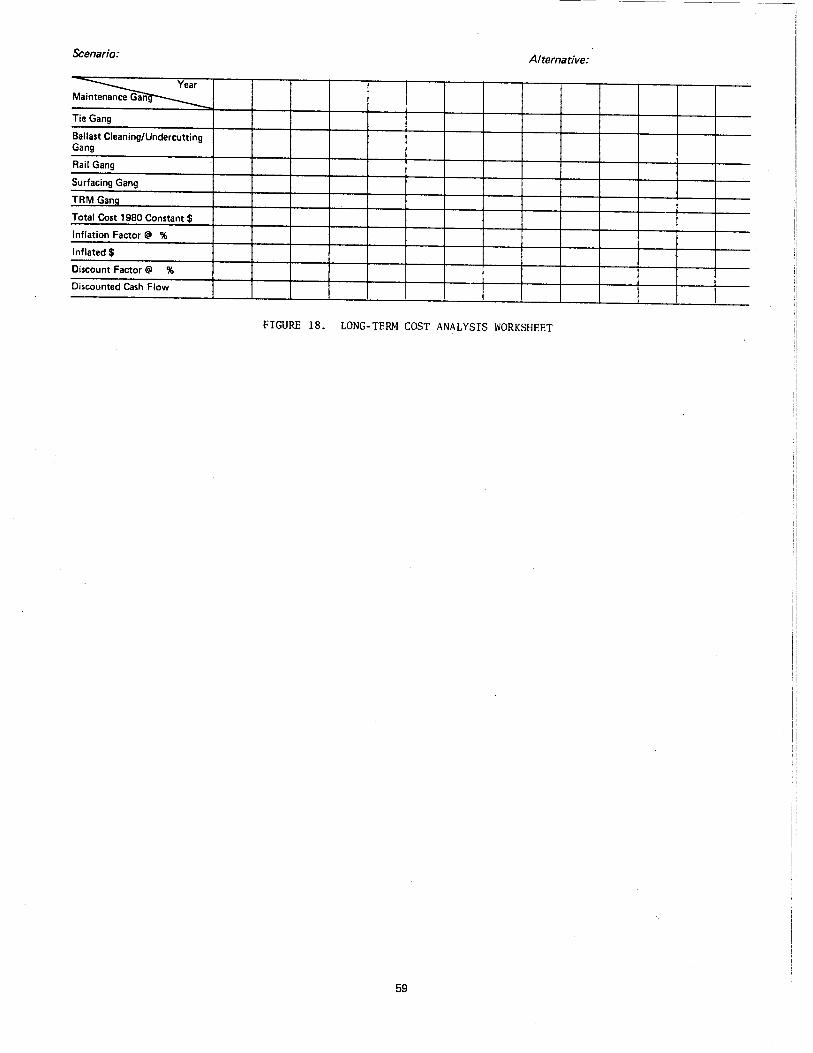
Scenario: Alternative:
Mai ~ Tie Gang
Ballast Cleaning/Undercutting Gang
Rail Gang
Surfacing Gang
TRM Ganq
Total Cost 1980 Constant$
Inflation Factor@ %
Inflated$
Discount Factor @ %
Discounted Cash Flow
FIGURE 18. LONG-TERM COST ANALYSIS WORKSHEET
59
III. SAMPLE ECONOMIC ANALYSIS
In this chapter, the economic analysis framework developed in chapter II is used to estimate first-year and long-term costs for various track maintenance scenarios. A variety of scenarios are developed to show how the track renewal method compares to selective maintenance on track of short, medium, and long average tie lives; with similar and dissimilar tie and rail lives; and comparing track renewal installed concrete ties to selectively maintained wood ties. Some other variables also are introduced. These variables include such factors as changes in average tie life induced by the track renewal method, the number of ties requiring replacement in the first year, and the inclusion or exclusion of ballast cleaning.
These scenan.os do not provide an exhaustive analysis of all possible variables for a track renewal method evaluation. But they do provide an idea of what the potential magnitude of costs and benefits would be under a variety of real world conditions. The significant savings projected from the simulated conditions and assump
'tions of most of the scenarios indicates that the railroad industry in the United States should consider the track renewal method of maintenance.
1. Sample Track Maintenance Scenarios
Several different track maintenance scenarios were developed to provide a basis for comparison between conventional track maintenance and track renewal maintenance built around a Canron P-811. Each scenario describes a set of track maintenance requirements and corresponding long-term schedules of track maintenance operations for both types of maintenance.
Because a single scenario would be similar to just a few actual railroad situations, a range of scenarios was developed to provide more railroads with an idea of how track renewal economics would apply to their situations. The multiple scenarios also provide sufficient alternative situations so that track renewal economics can be evaluated to determine if some kinds of situations are more feasible for track renewal.
A. Development of Track Maintenance Requirements
The scenarios are presented as track maintenance requirements rather than as track physical and operating characteristics. These maintenance requirements, in tie and rail life expectancies, should be easy to relate to actual track maintenance requirements on many railroads.
The maintenance requirements for each scenario are defined by the following variable factors:
(1) Average tie life expectancy. Selective tie replacement cycles are built around .,'.'erage life expectancy and all of the scenarios follow this policy for the selective maintenance ·;Hr·:··native. Some of the track renewal scenarios
60
also follow the average tie life expectancy to determine the track renewal cycle length. In several scenarios, the track renewal method alternative is assumed to have extended average tie lives.
(2) Tie failure rate. The cumulative tie failures indicate when track should be renewed.
(3) Average rail life expectancy. The ra{l life dictates rail gang scheduling in every scenario and the track renewal cycle in most scenarios.
(4) Ballast surfacing and ralslng schedules. The cycle length between major surfacing operations is given. This is an approximate requirement which is used in every scenario. Two light surfacing operations are normally required between the major surface and raise operations. These light surfacing operations are not included in the scenario descriptions as they are assumed to be equal for selective maintenance and track renewal.
(5) Original track condition. The percentage of failed ties in the track in year 1 and the remaining service life of the rail are given. These two factors affect the scheduling of maintenance and the value of the used ties removed by the track renewal system.
(6) Maintenance policy. The minimum allowable FRA track classification is given. This limits the amount of deferred maintenance allowed, and also provides the basis for tie replacement requirements.
(7) Ballast maintenance method. The type of maintenance to be given to ballast is also shown. This includes complete undercutting and cleaning, or simple raising of the track line.
Other variables, such as gang makeup and production rates, inflation and discount rates, unit costs, etc., are not varied in the analysis presented here, although each one can have an impact on the results.
B. Scenario Descriptions
The scenarios developed for this study are presented in table 43. The track maintenance requirements for each alternative are shown. In each scenario, all ties in the renewal alternative are replaced and 25 percent of the ties are replaced in the selective maintenance alternatives in year 1, except scenario 2C in which 50 percent of the ties are replaced in the selective maintenance alternative.
Three sets of scenarios (1-, 2-, and 3-series) compare situations in which tie and rail life expectancies are approximately equal, as can be expected in tangent track. The 1-series of scenarios have an average tie life of 36 years, which is about the average for U.S. track. The 2-series assumes an average tie life of 25 years, which can be expected on heavily used main-line
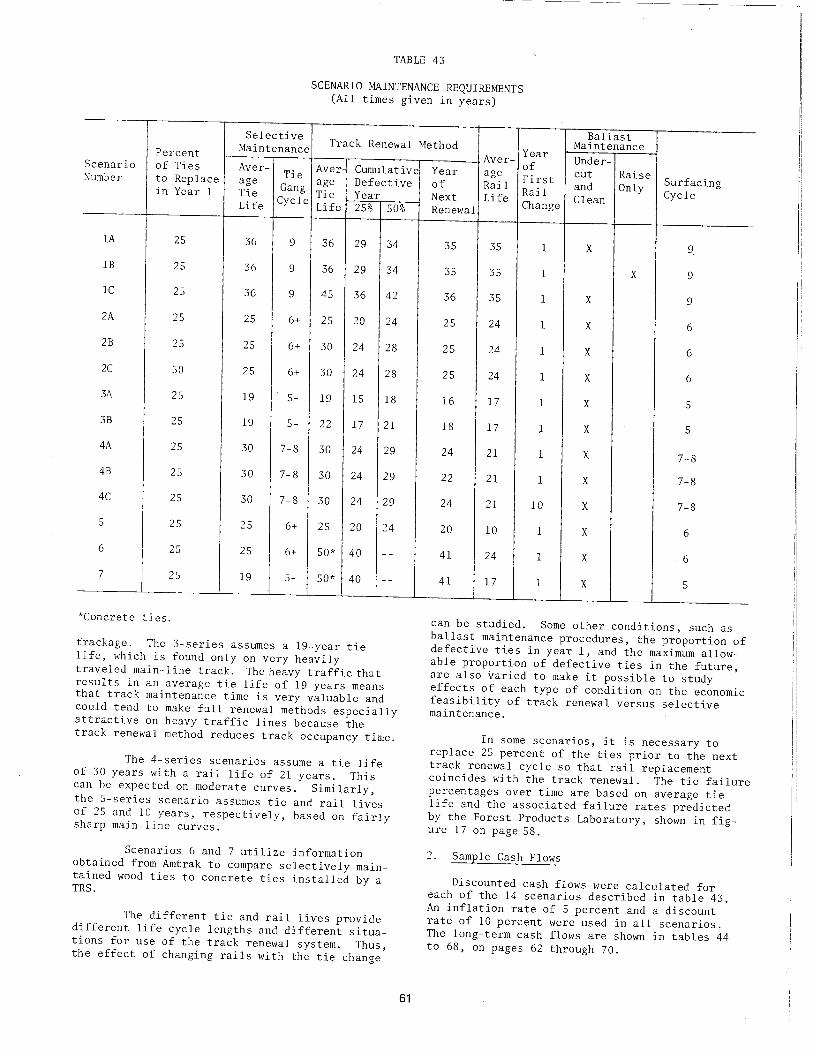
TABLE 43
SCENARIO MAINTENANCE REQUIREMENTS (All times given in years)
Ballast Selective Track Renewal Method Maintenance Maintenance Year Percent
Scenario of Ties Aver-Tie Aver Cumulative Number to Replace age
Gang age Defective in Year 1 Tie Tie Year
Life Cycle Life 25%
IA 25 36 9 36 29
IB 25 36 9 36 29
lC 25 36 9 45 36
2A 25 25 6+ 25 20
2B 25 25 6+ 30 24
2C 50 25 6+ 30 24
3A 25 19 5- 19 15
3B 25 19 5- 22 17
4A 25 30 7-8 30 24
4B 25 30 7-8 30 24
4C 25 30 7-8 30 24
5 25 25 6+ 25 20
6 25 25 6+ 50* 40
7 25 19 5- 50* 40
*Concrete ties.
trackage. The 3-series assumes a 19-year tie life, which is found only on very heavily
SO%
34
34
42
24
28
28
18
21
29
29
29
24
--
--
traveled main-line track. The heavy traffic that results in an average tie life of 19 years means that track maintenance time is very valuable and could tend to make full renewal methods especially attractive on heavy traffic lines because the track renewal method reduces track occupancy time.
The 4-series scenarios assume a tie life of 30 years with a rail life of 21 years. This can be expected on moderate curves. Similarly, the 5-series scenario assumes tie and rail lives of 25 and 10 years, respectively, based on fairly sharp main-line curves.
Scenarios 6 and 7 utilize information obtained from Amtrak to compare selectively maintained wood ties to concrete ties installed by a TRS.
The different tie and rail lives provide different life cycle lengths and different situations for use of the track renewal system. Thus, the effect of changing rails with the tie change
61
Aver- Under-Year of
cut Raise age of Rail First
and Only Surfacing Next Life Rail
Clean Cycle Renewal Change
35 35 1 X 9.
35 35 I X 9
36 35 1 X 9
25 24 1 X 6
25 24 1 X 6
25 24 1 X 6
16 17 1 X 5
18 17 1 X 5
24 21 1 X 7-8
22 21 1 X 7-8
24 21 10 X 7-8
20 10 1 X 6
41 24 1 X 6
41 17 1 X 5
can be studied. Some other conditions, such as ballast maintenance procedures, the proportion of defective ties in year 1, and the maximum allowable proportion of defective ties in the future, are also varied to make it possible to study effects of each type of condition on the economic feasibility of track renewal versus selective maintenance.
In some scenarios, it is necessary to replace 25 percent of the ties prior to the next track renewal cycle so that rail replacement coincides with the track renewal. The tie failure percentages over time are based on average tie life and the associated failure rates predicted by the Forest Products Laboratory, shown in figure 17 on page 58.
2. Sample Cash Flows
Discounted cash flows were calculated for each of the 14 scenarios described in table 43. An inflation rate of 5 percent and a discount rate of 10 percent were used in all scenarios. The long-term cash flows are shown in tables 44 to 68, on pages 62 through 70.
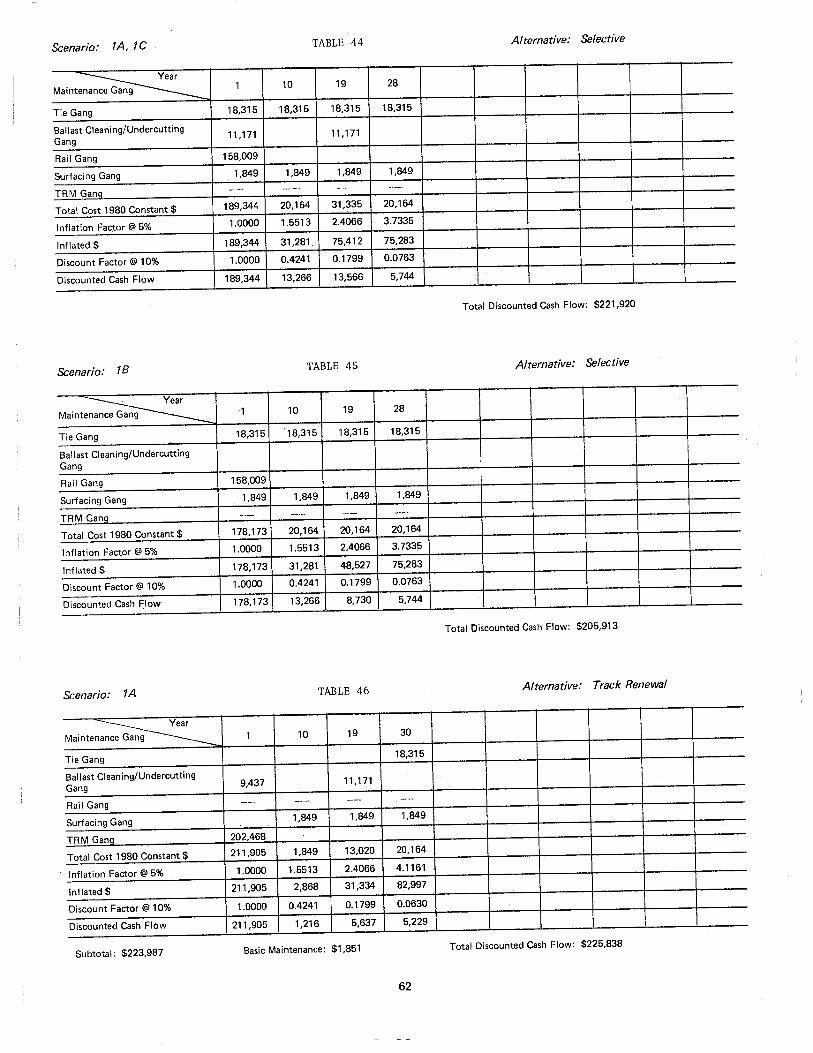
Scenario: 1A, 1C TABLE 44 Alternative: Selective
Mainte ~ 1 10 19 28
Tie Gang 18,315 18,315 18,315 18,315
Ballast Cleaning/Undercutting 11,171 11,171
Gang
Rail Gang 158,009
Surfacing Gang 1,849 1,849 1,849 1,849
TRM Gang --- ---
Total Cost 1980 Constant $ 189,344 20,164 31,335 20,164
Inflation Factor @ 5% 1.0000 1.5513 2.4066 3.7335
Inflated$ 189,344 31,281 75,412 75,283
Discount Factor@ 10% 1.0000 0.4241 0.1799 0.0763
Discounted Cash Flow 189,344 13,266 13,566 5,744
Total Discounted Cash Flow: $221,920
Scenario: 1 B TABLE 45 Alternative: Selective
Mainte ~ 1 10 19 28
Tie Gang 18,315 18,315 18,315 18,315
Ballast Cleaning/Undercutting Gang
Rail Gang 158,009
Surfacing Gang 1,849 1,849 1,849 1,849
TRM Gang -··- -··· -- --Total Cost 1980 Constant$ 178,173 20,164 20,164 20,164
Inflation Factor @ 5% 1.0000 1.5513 2.4066 3.7335
Inflated$ 178,173 31,281 48,527 75,283
Discount Factor@ 10% 1.0000 0.4241 0.1799 0.0763
Discounted Cash Flow 178,173 13,266 8,730 5,744
Total Discounted Cash Flow: $205,913
Scenario: 1 A TABLE 46 Alternative: Track Renewal
Mainten ~ 1 10 19 30
Tie Gang 18,315
Ballast Cleaning/Undercutting Gang 9,437 11,171
Rail Gang -- --- -- --
Surfacing Gang 1,849 1,849 1,849
TRM Gang 202.468
Tota I Cost 1980 Constant $ 211,905 1,849 13,020 20,164
Inflation Factor@ 5% 1.0000 1.5513 2.4066 4.1161
Inflated$ 211,905 2,868 31,334 82,997
Discount Factor@ 10% 1.0000 0.4241 0.1799 0.0630
Discounted Cash Flow 211,905 1,216 5,637 5,229
Subtotal: $223,987 Basic Maintenance: $1,851 Total Discounted Cash Flow: $225,838
62

&enario: 18 TABLE 4 7 Alternative: Track Renewai
Mainte ~ 1 10 19 30
Tie Gang 18,315 Ballast Cleaning/Undercutting Gang --- --· --- --Rail Gang --- -- -- ---Surfacing Gang 1,849 1,849 1,849 1,849 TRM Gang 202,468
Total Cost 1980 Constant$ 204,317 1,849 1,849 20,164
Inflation Factor@ 5% 1.0000 1.5513 2.4066 4.1161 Inflated$ 204,317 2,868 4,450 82,997 Discount Factor @ 10% 1.0000 0.4241 0.1799 0.0630 Discounted Cash Flow 204,317 1,216 800 5,229
Subtotal: $211 ,562 Basic Maintenance: $1,851 Total Discounted Cash Flow: $213.413
&enario: 1C TABLE 48 Alternative: Track Renewal
~ Maintenan 1 10 19 28
Tie Gang -- --·· ---- --Ballast Cleaning/Undercutting
9,437 11,171 Gang
Rail Gang ---- ---- --- --Surfacing Gang 1,849 1,849 1,849 TRM GanCI 202,468
Total Cost 1980 Constant$ 211,905 1,849 13,020 1,849 Inflation Factor@ 5% 1.0000 1.5513 2.4066 3.7335 Inflated$ 211,905 2,868 31,334 6,904
-· Discount Factor@ 10% 1.0000 0.4241 0.1799 0.0763 Discounted Cash Flow 211,905 1,216 5,637 527
Subtotal: $219,285 Basic Maintenance: $896 Total Discounted Cash Flow: $220,181
&enario: 2A, 28 TABLE 49 Alternative: Selective
~ Maintenan 1 7 13 19
Tie Gang 18,315 18,315 18,315 18,315 Ballast Cleaning/Undercutting Gang 11,171
Rail Gang 158,009 Surfacing Gang 1,849 1,849 1,849 1,849 TRM Gang --- --·- ---- -·-Total Cost 1980 Constant $ 189,344 20,164 20,164 20,164 Inflation Factor@ 5% 1.0000 1.3401 1.7959 2.4066 Inflated$ 189,344 27,022 36,213 48,527 Discount Factor @ 10% 1.0000 0.5645 0.3186 0.1799 Discounted Cash Flow 189,344 15,254 11,537 8,730
Total Discounted Cash Flow: $224,865
63
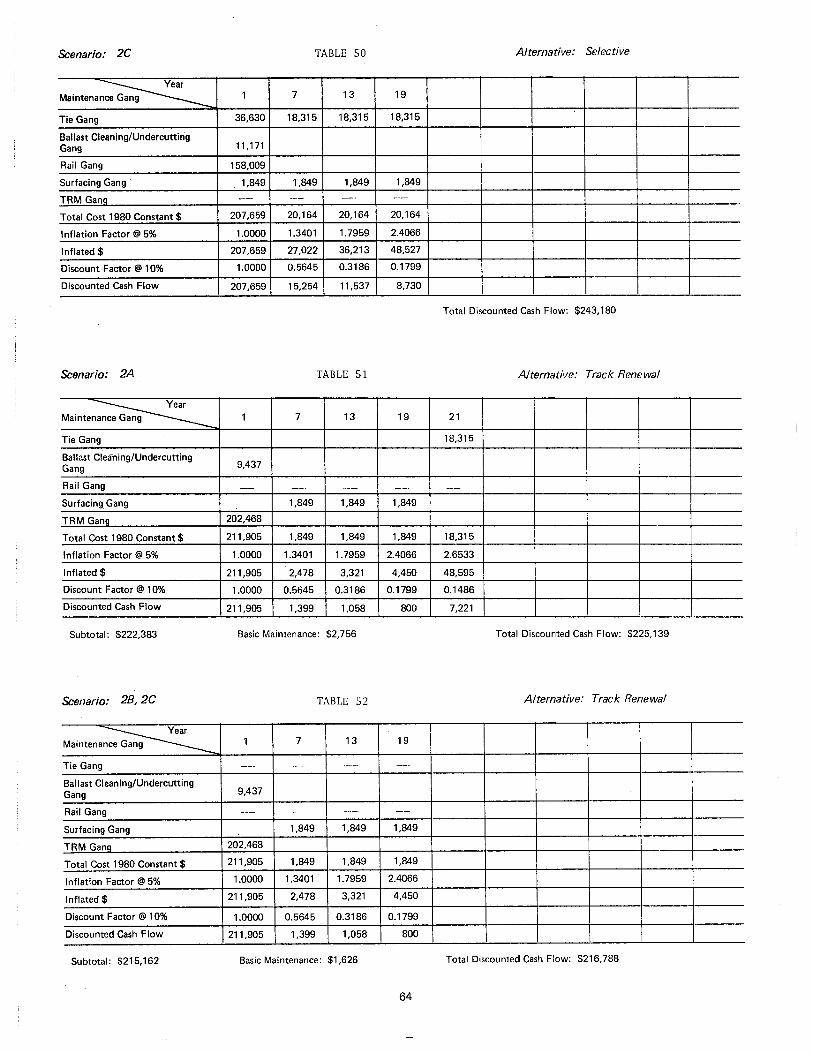
Scenario: 2C TABLE SO Alternative: Selective
~ Maintenan 1 7 13 19
Tie Gang 36,630 18,315 18,315 18,315
Ballast Cleaning/Undercutting 11,171 Gang
Rail Gang 158,009
Surfacing Gang 1,849 1,849 1,849 1,849
TRM GanQ -- --- --· ----
Total Cost 1980 Constant$ 207,659 20,164 20,164 20,164
Inflation Factor @ 5% 1.0000 1.3401 1.7959 2.4066
Inflated$ 207,659 27,022 36,213 48,527
Discount Factor @ 10% 1.0000 0.5645 0.3186 0.1799
Discounted Cash Flow 207,659 15,254 11,537 8,730
Total Discounted Cash Flow: $243,180
Scenario: 2A TABLE 51 Alternative: Track Renewal
~ Mainten 1 7 13 19 21
Tie Gang 18,315
Ballast Cleaning/Undercutting 9,437 Gang
Rail Gang -- --· ·--- ---· ---
Surfacing Gang 1,849 1,849 1,849
TRM Gang 202,468
Total Cost 1980 Constant$ 211,905 1,849 1,849 1,849 18,315
Inflation Factor@ 5% 1.0000 1.3401 1.7959 2.4066 2.6533
Inflated$ 211,905 2,478 3,321 4,450 48,595
Discount Factor @ 10% 1.0000 0.5645 0.3186 0.1799 0.1486
Discounted Cash Flow 211,905 1,399 1,058 800 7,221
Subtotal: $222,383 Basic Maintenance: $2,756 Total Discounted Cash Flow: $225,139
Scenario: 28, 2C TABLE 52 Alternative: Track Renewal
~ Maintenan 1 7 13 19
Tie Gang --- ---- --·- ----
Ballast Cleaning/Undercutting 9,437 Gang
Rail Gang --- --· -- --
Surfacing Gang 1,849 1,849 1,849
TRM GanQ 202.468
Total Cost 1980 Constant$ 211,905 1,849 1,849 1,849
Inflation Factor @ 5% 1.0000 1.3401 1.7959 2.4066
Inflated$ 211,905 2,478 3,321 4,450
Discount Factor@ 10% 1.0000 0.5645 0.3186 0.1799
Discounted Cash Flow 211,905 1,399 1,058 800
Subtotal: $215,162 Basic Maintenance: $1 ,626 Total Discounted Cash Flow: $216,788
64
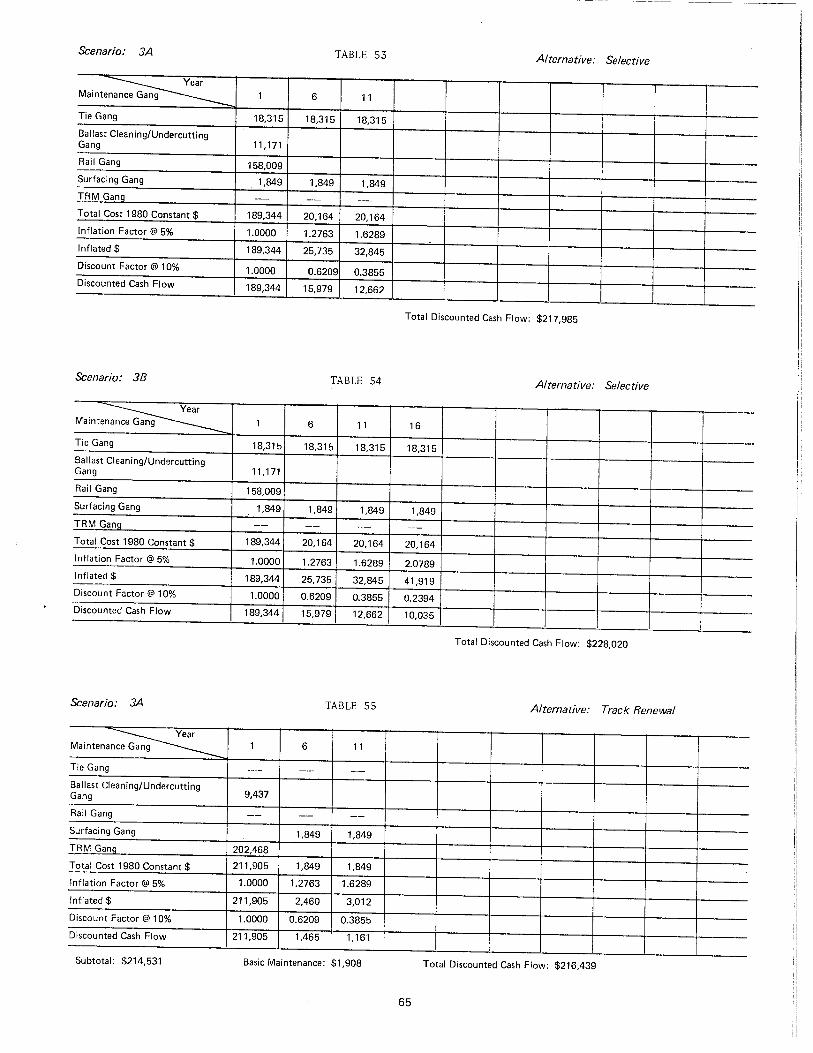
Scenario: 3A TABLE 53 Alternative: Selective
~ Mainten 1 6 11
Tie Gang 18,315 18,315 18,315 I I
Ballast Cleaning/Undercutting Gang 11,171
Rail Gang 158,009 Surfacing Gang 1,849 1,849 1,849 TRM Ganq -- --- --Tota I Cost 1 980 Constant $ 189,344 20,164 20,164 Inflation Factor @ 5% 1.0000 1.2763 1.6289 Inflated$ 189,344 25,735 32,845 Discount Factor @ 10% 1.0000 0.6209 0.3855 Discounted Cash Flow 189,344 15,979 12,662
Total Discounted Cash Flow: $217,985
Scenario: 38 TABLE 54 Alternative: Selective
~ Mainten 1 6 11 16
Tie Gang 18,315 18,315 18,315 18,315 Ballast Cleaning/Undercutting Gang 11,171
Rail Gang 158,009
Surfacing Gang 1,849 1,849 1,849 1,849 TRM Gano -- -- --- ---Total Cost 1980 Constant$ 189,344 20,164 20,164 20,164 Inflation Factor @ 5% 1.0000 1.2763 1.6289 2.0789 Inflated$ 189,344 25,735 32,845 41,919 Discount Factor @ 10% 1.0000 0.6209 0.3855 0.2394 Discounted Cash Flow 189,344 15,979 12,662 10,035
Total Discounted Cash Flow: $228,020
Scenario: 3A TABLE 55 Alternative: Track Renewal
~ Maintenan 1 6 11
Tie Gang -·-· -- ---
Ballast Cleaning/Undercutting 9,437 Gang
Rail Gang -- -- --
Surfacing Gang 1,849 1,849 TRM Ganq 202,468
Total Cost 1980 Constant$ 211,905 1,849 1,849
Inflation Factor @ 5% 1.0000 1.2763 1.6289
Inflated$ 211,905 2,460 3,012
Discount Factor @ 10% 1.0000 0.6209 0.3855
Discounted Cash Flow 211,905 1,465 1,161
Subtotal: $214,531 Basic Maintenance: $1,908 Total Discounted Cash Flow: $216,439
65
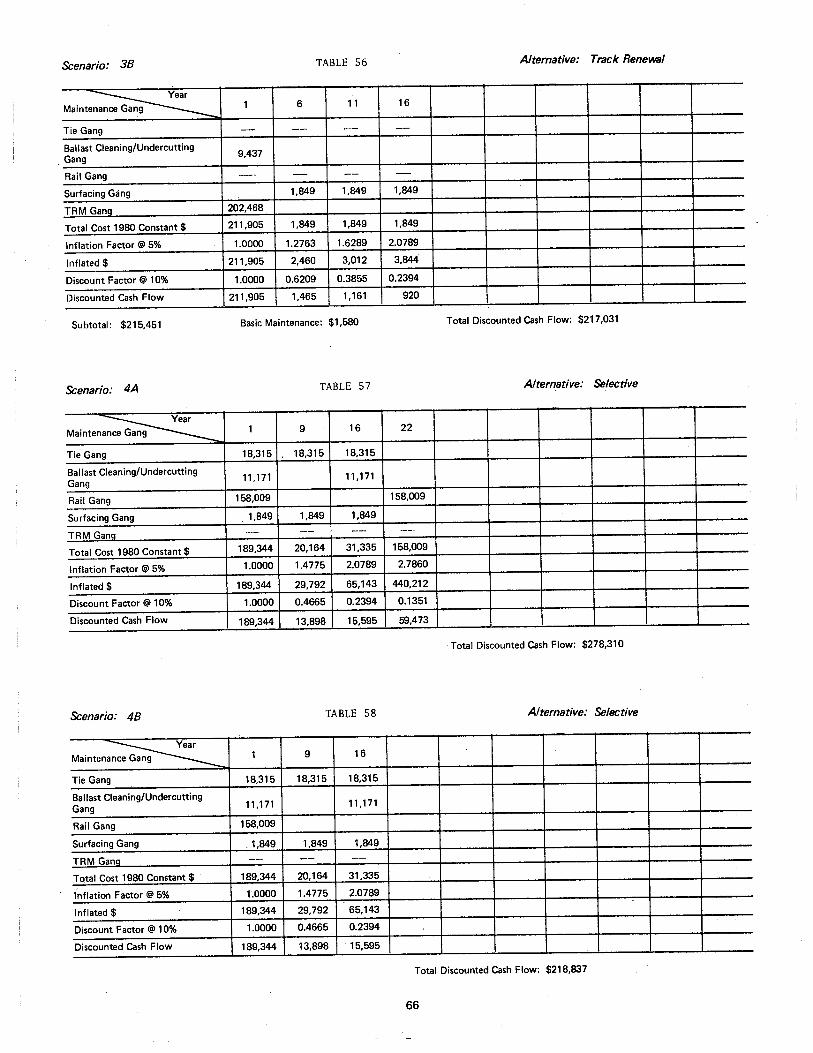
Scenario: 38 TABLE 56 Alternative: Track Renewal
~ Mainten 1 6 11 16
Tie Gang -- -- -- --Ballast Cleaning/Undercutting
9,437 Gang
Rail Gang -- -- -- --Surfacing Gang 1,849 1,849 1,849
TRM Gang 202,468
Tota I Cost 1980 Constant $ 211,905 1,849 1,849 1,849
Inflation Factor @ 5% 1.0000 1.2763 1.6289 2.0789
Inflated$ 211,905 2,460 3,012 3,844
Discount Factor @ 10% 1.0000 0.6209 0.3855 0.2394
Discounted Cash Flow 211,905 1,465 1 '161 920
Subtotal: $215,451 Basic Maintenance: $1,580 Total Discounted Cash Flow: $217,031
Scenario: 4A TABLE 57 Alternative: Selective
~ Maintena 1 9 16 22
Tie Gang 18,315 18,315 18,315
Ballast Cleaning/Undercutting 11 '171 11 '171
Gang
Rail Gang 158,009 158,009
Surfacing Gang . 1,849 1,849 1,849
TRM Gang ---- -- ·--- ~--·
Total Cost 1980 Constant$ 189,344 20,164 31,335 158,009
Inflation Factor @ 5% 1.0000 1.4775 2.0789 2.7860
Inflated$ 189,344 29,792 65,143 440,212
Discount Factor@ 10% 1.0000 0.4665 0.2394 0.1351
Discounted Cash Flow 189,344 13,898 15,595 59,473
Total Discounted Cash Flow: $278,310
Scenario: 48 TABLE 58 Alternative: Selective
~ Maintena 1 9 16
Tie Gang 18,315 18,315 18,315
Ballast Cleaning/Undercutting 11,171 11 '171 Gang
Rail Gang 158,009
Surfacing Gang . 1,849 1,849 1,849
TRM Gang -- -- --Total Cost 1980 Constant $ 189,344 20,164 31,335
Inflation Factor @ 5% 1.0000 1.4775 2.0789
Inflated$ 189,344 29,792 65,143
Discount Factor @ 10% 1.0000 0.4665 0.2394
Discounted Cash Flow 189,344 13,898 15,595
Total Discounted Cash Flow: $218,837
66
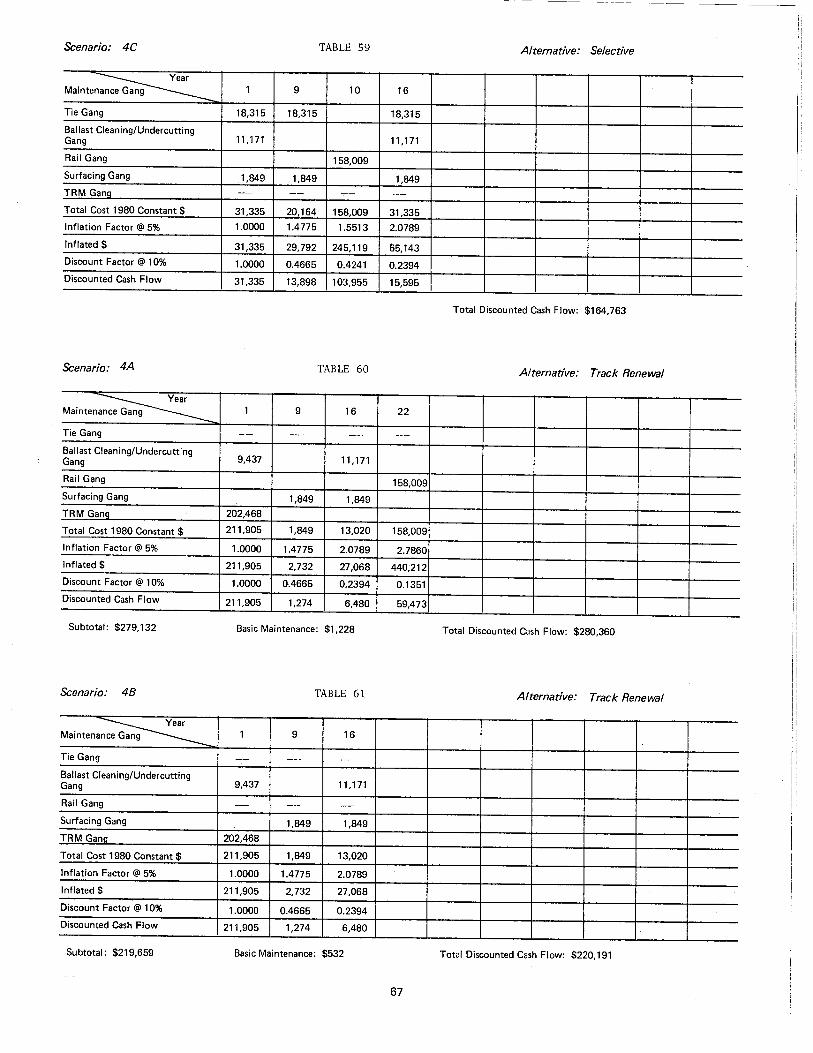
Scenario: 4C TABLE 59 Alternative: Selective
~ Maintena 1 9 10 16
Tie Gang 18,315 18,315 18,315
Ballast Cleaning/Undercutting 11 '171 11,171 Gang
Rail Gang 158,009
Surfacing Gang 1,849 1,849 1,849 TRM GanQ --- -- -- --
Total Cost 1980 Constant$ 31,335 20,164 158,009 31,335 Inflation Factor @ 5% 1.0000 1.4775 1.5513 2.0789
Inflated$ 31,335 29,792 245,119 65,143 Discount Factor@ 10% 1.0000 0.4665 0.4241 0.2394 Discounted Cash Flow 31,335 13,898 103,955 15,595
Total Discounted Cash Flow: $164,763
Scenario: 4A TABLE 60 Alternative: Track Renewal
~ Maintena 1 9 16 22
Tie Gang -- --· -·- --Ballast Cleaning/Undercutting
9,437 11 '171 Gang
Rail Gang 158,009 Surfacing Gang 1,849 1,849 TRM Gang 202,468
Total Cost 1980 Constant$ 211,905 1,849 13,020 158,009
Inflation Factor @ 5% 1.0000 1.4775 2.0789 2.7860 Inflated $ 211,905 2,732 27,068 440;212 Discount Factor @ 10% 1.0000 0.4665 0.2394 0.1351 Discounted Cash Flow 211,905 1,274 6,480 59,473
Subtotal: $279,132 Basic Maintenance: $1 ,228 Total Discounted Cash Flow: $280,360
Scenario: 48 TABLE 61 Alternative: Track Renewal
~ Maintenan 1 9 16
Tie Gang -- --- ---Ballast Cleaning/Undercutting
9,437 11,171 Gang
Rail Gang -- -- --Surfacing Gang 1,849 1,849
TRM Gang 202,468
Total Cost 19BO Constant$ 211,905 1,849 13,020
Inflation Factor@ 5% 1.0000 1.4775 2.0789
Inflated$ 211,905 2,732 27,068
Discount Factor @ 10% 1.0000 0.4665 0.2394 Discounted Cash Flow 211,905 1,274 6,480
Subtotal: $219,659 Basic Maintenance: $532 Total Discounted Cash Flow: $220,191
67

Scenario: 4C TABLE 62 Alternative: Track Renewal
~ Maintena 1 9 10 16
Tie Gang ---- -- -- --
Ballast Cleaning/Undercutting 9.437 11,171
Gang
Rail Gang 158,009
Surfacing Gang 1,849 1,849
TRM Gang 60,319
Total Cost 1980 Constant$ 69,756 1,849 158,009 13,020
Inflation Factor@ 5% 1.0000 1.4775 1.5513 2.0789
Inflated$ 69,756 2,732 245,119 27,068
Discount Factor @ 10% 1.0000 0.4665 0.4241 0.2394
Discounted Cash Flow 69,756 1,274 103,955 6.480
Subtotal: $181,465 Basic Maintenance: $1,228 Total Discounted Cash Flow: $182,693
Scenario: 5 TABLE 63 Alternative: Selective
~ Main 1 7 11 14
Tie Gang 18,315 18,315 18,315
Ballast Cleaning/Undercutting 11,171 Gang
Rail Gang 158,009 158,009
Surfacing Gang 1,849 1,849 1,84.9
TRM Gang -- ----· -·-- ---·
Total Cost 1980 Constant $ 189,344 20,164 158,009 20,164
Inflation Factor @ 5% 1.0000 1.3401 1.6289 1.8856
Inflated$ 189,344 27,022 257,380 38,021
Discount Factor @ 10% 1.0000 0.5645 0.3855 i 0.2897
Discounted Cash Flow 189,344 15,254 99,220 11,015
Total Discounted Cash Flow: $314,833
Scenario: 5 TABLE 64 Alternative: Track Renewal
Maintenan ~ 1 7 11 14
Tie Gang -- --· -- ---
Ballast Cleaning/Undercutting 9,437 Gang
Rail Gang 158,009
Surfacing Gang 1,849 1,849
TRM Ganq 202,468
Total Cost 1980 Constant$ 211,905 1,849 158,009 1,849
Inflation Factor @ 5% 1.0000 1.3401 1.6289 1.8856
Inflated$ 211,905 2,478 257,380 3,487
Discount Factor@ 10% 1.0000 0.5645 0.3855 0.2897
Discounted Cash Flow 211,905 1,399 99,220 1,010
Subtotal: $313,534 Basic Maintenance: $1,153 Total Discounted Cash Flow: $314,687
68
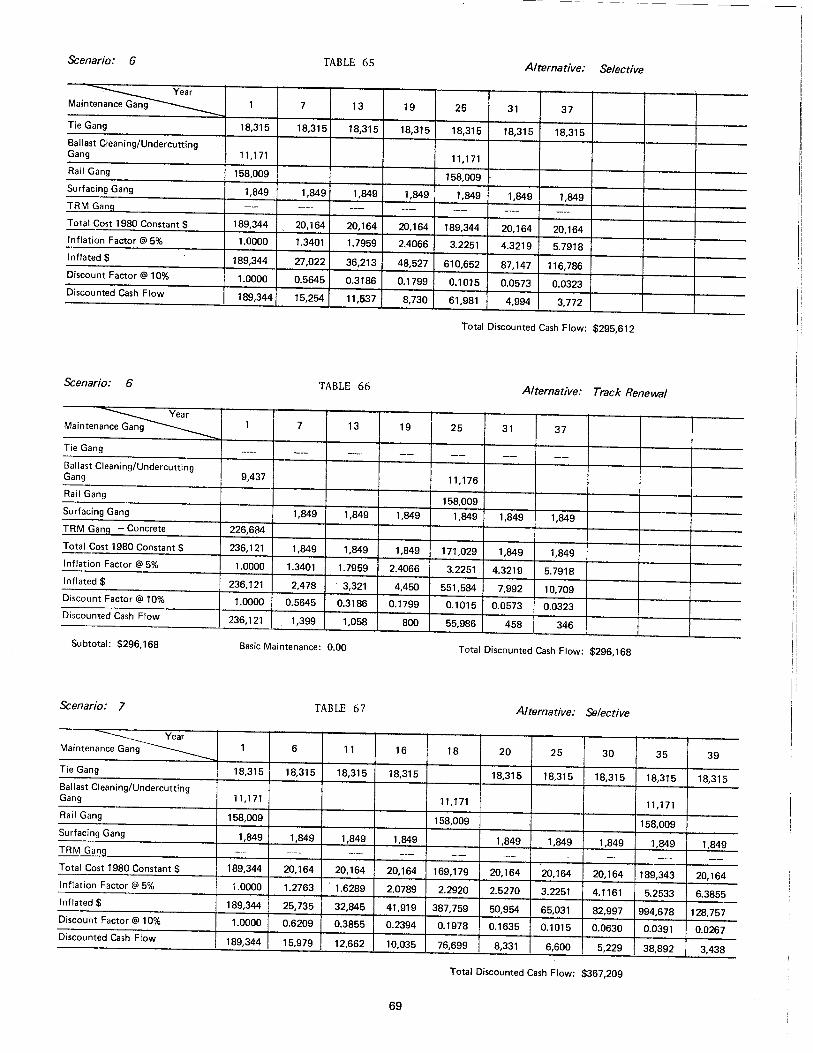
------------------------
Scenario: 6 TABLE 65 Alternative: Selective
~ Mainten 1 7 13 19 25 31 37
Tie Gang 18,315 18,315 18,315 18,315 18,315 18,315 18,315 Ballast Cleaning/Undercutting Gang 11,171 11,171 Rail Gang 158,009 158,009 Surfacing Gang 1,849 1,849 1,849 1,849 1,849 1,849 1,849 TRM Ganq -- -- --·- -- -- -- --Total Cost 1980 Constant $ 189,344 20,164 20,164 20,164 189,344 20,164 20,164 Inflation Factor @ 5% 1.0000 1.3401 1.7959 2.4066 3.2251 4.3219 5.7918 Inflated$ 189,344 27,022 36,213 48,527 610,652 87,147 116,786 Discount Factor @ 10% 1.0000 0.5645 0.3186 0.1799 0.1015 0.0573 0.0323 Discounted Cash Flow 189,344 15,254 11,537 8,730 61,981 4,994 3,772
Total Discounted Cash Flow: $295,612
Scenario: 6 TABLE 66 Alternative: Track Renewal
~ Maintenan 1 7 13 19 25 31 37
Tie Gang -- -- --· -- -- -- --Ballast Cleaning/Undercutting
9,437 11,176 Gang
Rail Gang 158,009
Surfacing Gang 1,849 1,849 1,849 1,849 1,849 1,849 TRM Ganq -Concrete 226,684
Total Cost 1980 Constant$ 236,121 1,849 1,849 1,849 171,029 1,849 1,849 Inflation Factor@ 5% 1.0000 1.3401 1.7959 2.4066 3.2251 4.3219 5.7918 Inflated$ 236,121 2,478 . 3,321 4,450 551,584 7,992 10,709 Discount Factor@ 10% 1.0000 0.5645 0.3186 0.1799 0.1015 0.0573 0.0323 Discounted Cash Flow 236,121 1,399 1,058 800 55,986 458 346
Subtotal: $296,168 Basic Maintenance: 0.00 Total Discounted Cash Flow: $296,168
Scenario: 7 TABLE 67 Alternative: Selective
~ Maintena 1 6 11 16 18 20 25 30 35 39 Tie Gang 18,315 18,315 18,315 18,315 18,315 18,315 18,315 18,315 18,315 Ballast Cleaning/Undercutting
11,171 11 '171 Gang 11,171
Rail Gang 158,009 158,009 158,009 Surfacing Gang 1,849 1,849 1,849 1,849 1,849 1,849 1,849 1,849 1,849 TRM Ganq -·- ----· -·- --- -·- --· --- --- --- --Total Cost 1980 Constant$ 189,344 20,164 20,164 20,164 169,179 20,164 20,164 20,164 189,343 20,164 Inflation Factor @ 5% 1.0000 1.2763 1.6289 2.0789 2.2920 2.5270 3.2251 4.1161 5.2533 6.3855 Inflated$ 189,344 25,735 32,845 41,919 387,759 50,954 65,031 82,997 994,678 128,757 Discount Factor @ 10% 1.0000 0.6209 0.3855 0.2394 0.1978 0.1635 0.1015 0.0630 0.0391 0.0267 Discounted Cash Flow 189,344 15,979 12,662 10,035 76,699 8,331 6,600 5,229 38,892 3,438
Total Discounted Cash Flow: $367,209
69
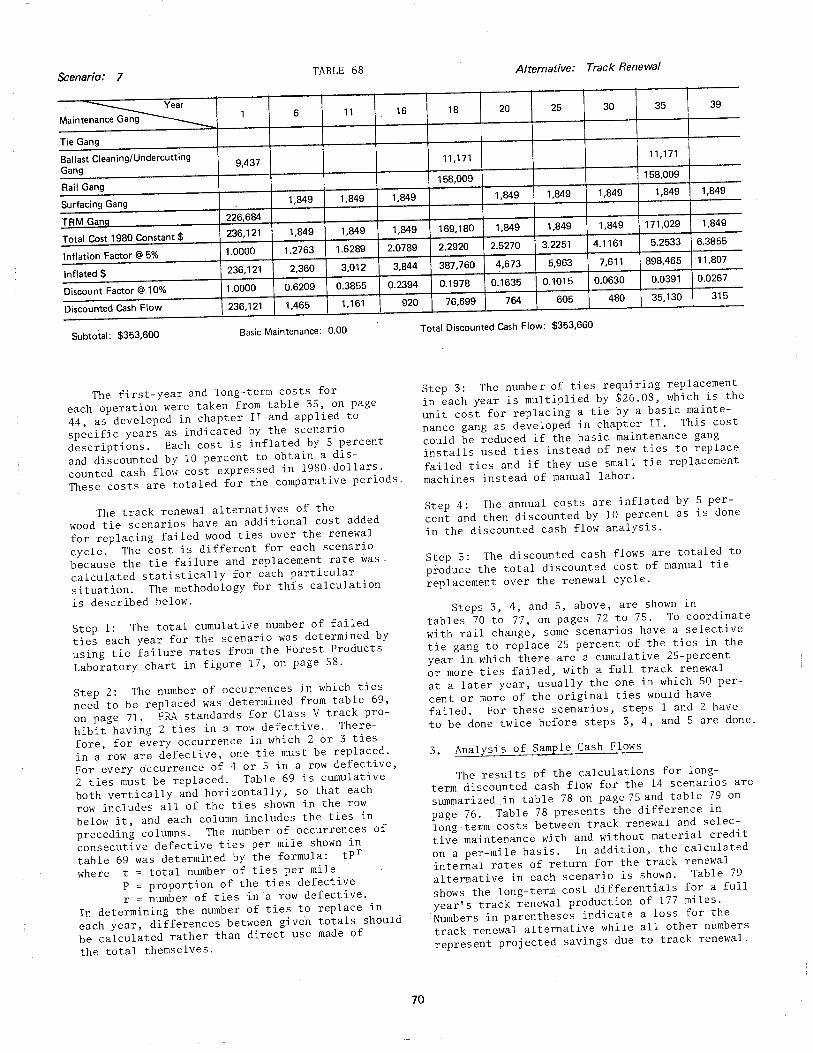
Scenario: 7 TABLE 68
~ Maintena 1 6 11 16
Tie Gang
Ballast Cleaning/Undercutting 9,437
Gang
Rail Gang
Surfacing Gang 1,849 1,849 1,849
TRM Ganq 226,684
Total Cost 1980 Constant$ 236,121 1,849 1,849 1,849
Inflation Factor @ 5% 1.0000 1.2763 1.6289 2.0789
Inflated$ 236,121 2,360 3,012 3,844
Discount Factor@ 10% 1.0000 0.6209 0.3855 0.2394
Discounted Cash Flow 236,121 1,465 1,161
Subtotal: $353,600 Basic Maintenance: 0.00
The first-year and long-term costs for
each operation were taken from table 35, on page
44, as developed in chapter II and applied to
specific years as indicated by the scenario
descriptions. Each cost is inflated by 5 percent
and discounted by 10 percent to obtain a dis
counted cash flow cost expressed in 1980 dollars.
These costs are totaled for the comparative periods.
The track renewal alternatives of the
wood tie scenarios have an additional cost added
for replacing failed wood ties over the renewal
cycle. The cost is different for each scenario
because the tie failure and replacement rate was _
calculated statistically for each particular
situation. The methodology for this calculation
is described below.
Step 1: The total cumulative number of failed
ties each year for the scenario was determined by
using tie failure rates from the Forest Products
Laboratory chart in figure 17, on page 58.
Step 2: The number of occurrences in which ties
need to be replaced was determined from table 69,
on page 71. FRA standards for Class V track pro
hibit having 2 ties in a row defective. There
fore, for every occurrence in which 2 or 3 ties
in a row are defective, one tie must be replaced.
For every occurrence of 4 or 5 in a row defective,
2 ties must be replaced. Table 69 is cumulative
both vertically and horizontally, so that each
row includes all of the ties shown in the row
below it, and each column includes the ties in
preceding columns. The number of occurrences of
consecutive defective ties per mile shown in
table 69 was determined by the formula: tPr
where t total number of ties per mile
P = proportion of the ties defective
r = number of ties in ·a row defective.
In determining the number of ties to replace in
each year, differences between given totals should
be calculated rather than direct use made of
the total themselves.
920
70
Alternative: Track Renewal
18 20 25 30 35 39
11 '171 11,171
158,009 158,009
1,849 1,849 1,849 1,849 1,849
169,180 1,849 1,849 1,849 171,029 1,849
2.2920 2.5270 3.2251 4.1161 5.2533 6.3855
387,760 4,673 5,963 7,611 898,465 11,807
0.1978 0.1635 0.1015 0.0630 0.0391 0.0267
76,699 764 605 480 35,130 315
Total Discounted Cash Flow: $353,660
Step 3: The number of ties requiring replacement
in each year is multiplied by $26.08, which is the
unit cost for replacing a tie by a basic mainte
nance gang as developed in chapter II. This cost
could be reduced if the basic maintenance gang
installs used ties instead of new ties to replace
failed ties and if they use small tie replacement
machines instead of manual labor.
Step 4: The annual costs are inflated by 5 per
cent and then discounted by 10 percent as is done
in the discounted cash flow analysis.
Step 5: The discounted cash flows are totaled to
produce the total discounted cost of manual tie
replacement over the renewal cycle.
Steps 3, 4, and 5, above, are shown in
tables 70 to 77, on pages 72 to 75. To coordinate
with rail change, some scenarios have a selective
tie gang to replace 25 percent of the ties in the
year in which there are a cumulative 25-percent
or more ties failed, with a full track renewal
at a later year, usually the one in which 50 per
cent or more of the original ties would have
failed. For these scenarios, steps 1 and 2 have
to be done twice before steps 3, 4, and 5 are done.
3. Analysis of Sample Cash Flows
The results of the calculations for long-
term discounted cash flow for the 14 scenarios are
summarized in table 78 on page 75 and table 79 on
page 76. Table 78 presents the difference in
long-term costs between track renewal and selec
tive maintenance with and without material credit
on a per-mile basis. In addition, the calculated
internal rates of return for the track renewal
alternative in each scenario is shown. Table 79
shows the long-term cost differentials for a full
year's track renewal production of 177 miles.
Numbers in parentheses indicate a loss for the
track renewal alternative while all other numbers
represent projected savings due to track renewal.
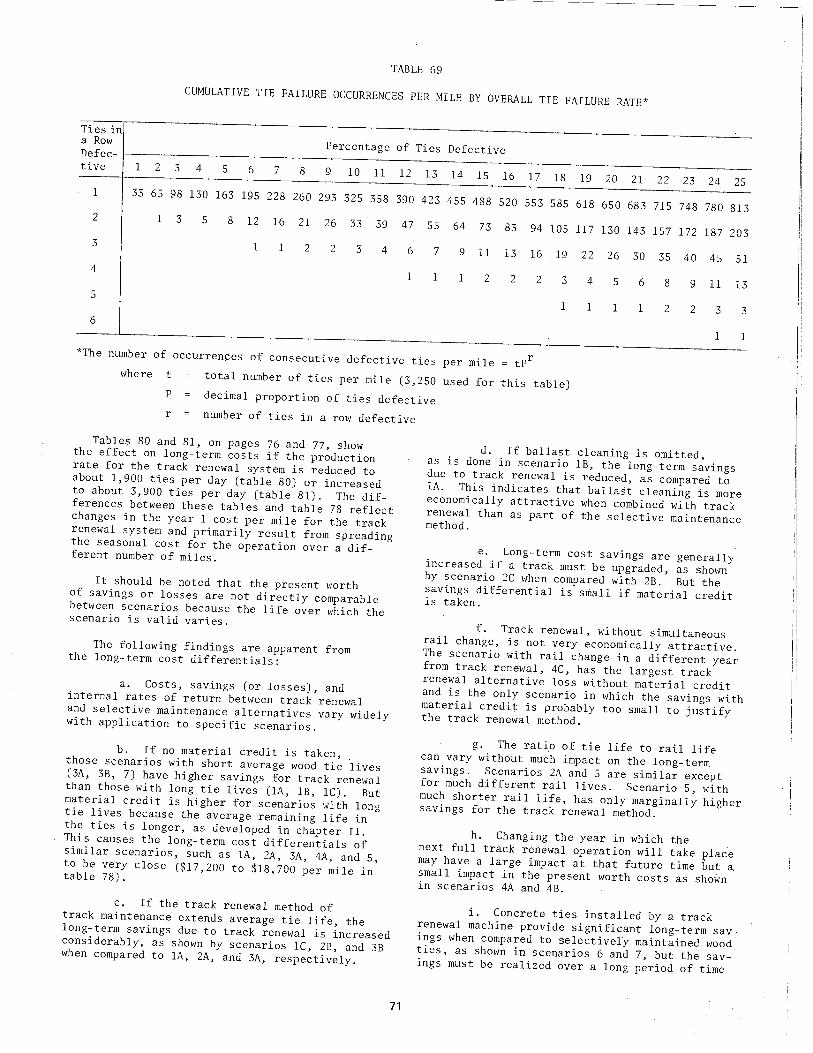
- - -- ---~------
TABLE 69
CUMULATIVE TIE FAILURE OCCURRENCES PER MILE BY OVERALL TIE FAILURE RATE*
Ties in a Row Percentage of Ties Defective Defee-tive 1 2 3 4 5 6 7 8 9 10 11 12 13 14 15 16 17 18 19 20 21 22 23 24 25
1 33 65 98 130 163 195 228 260 293 325 358 390 423 455 488 520 553 585 618 650 683 715 748 780 813 2 1 3 5 8 12 16 21 26 33 39 47 55 64 73 83 94 lOS 117 130 143 157 172 187 203 3 1 2 2 3 4 6 7 9 11 13 16 19 22 26 30 35 40 45 51 4
1 1 2 2 2 3 4 5 6 8 9 11 13 5
1 1 1 1 2 2 3 3 6
1 1 *The number of occurrences of consecutive defective ties per mile = tPr
where t total number of ties per mile (3,250 used for this table) p decimal proportion of ties defective r number of ties in a row defective
Tables 80 and 81, on pages 76 and 77, show the effect on long-term costs if the production rate for the track renewal system is reduced to about 1,900 ties per day (table 80) or increased to about 3,900 ties per day (table 81). The differences between these tables and table 78 reflect changes in the year 1 cost per mile for the track renewal system and primarily result from spreading the seasonal cost for the operation over a different number of miles.
It should be noted that the present worth of savings or losses are not directly comparable between scenarios because the life over which the scenario is valid varies.
The following findings are apparent from the long-term cost differentials:
a. Costs, savings (or losses), and internal rates of return between track renewal and selective maintenance alternatives vary widely with application to specific scenarios.
b. If no material credit is taken, those scenarios with short average wood tie lives (3A, 3B, 7) have higher savings for track renewal than those with long tie lives (lA, lB, lC). But material credit is higher for scenarios with long tie lives because the average remaining life in the ties is longer, as developed in chapter II. This causes the long-term cost differentials of similar scenarios, such as lA, 2A, 3A, 4A, and 5, to be very close ($17,200 to $18,700 per mile in table 78).
c. If the track renewal method of track maintenance extends average tie life, the long-term savings due to track renewal is increased considerably, as shown by scenarios lC, 2B, and 3B when compared to lA, 2A, and 3A, respectively.
71
d. If ballast cleaning is omitted, as is done in scenario lB, the long-term savings due to track renewal is reduced, as compared to lA. This indicates that ballast cleaning is more economically attractive when combined with track renewal than as part of the selective maintenance method.
e. Long-term cost savings are generally increased if a track must be upgraded, as shown by scenario 2C when compared with 2B. But the savings differential is small if material credit is taken.
f. Track renewal, without simultaneous rail change, is not very economically attractive. The scenario with rail change in a different year from track renewal, 4C, has the largest track renewal alternative loss without material credit and is the only scenario in which the savings with material credit is probably too small to justify the track renewal method.
g. The ratio of tie life to rail life can vary without much impact on the long-term savings. Scenarios 2A and 5 are similar except for much different rail lives. Scenario 5, with much shorter rail life, has only marginally higher savings for the track renewal method.
h. Changing the year in which the next full track renewal operation will take place may have a large impact at that future time but a small impact in the present worth costs as shown in scenarios 4A and 4B.
i. Concrete ties installed by a track renewal machine provide significant long-term savings when compared to selectively maintained wood ties, as shown in scenarios 6 and 7, but the savings must be realized over a long period of time
TABLE 70
BASIC MAINTENANCE COST PER YEAR - SCENARIOS lA, lB
Average Tie Life: 36 years Tie Condition: 25% Bad in Year 29
Year Ties Changed 1980 Cost +5% Inflation "Cash Flow" -10% Discount
17 l 26.08 56.93 12.39
18 0 19 2 52.16 125.52 22.58
20 2 52.16 131.81 21.55
21 3 78.24 207.59 30.85
22 4 104.32 290.64 39.26
23 4 104.32 305.17 37.47
24 10 260.80 801. OS 89.48
25 13 339.04 1,093.44 110.98
26 26 678.08 2,296.25 211.94
27 31 808.48 2,874.71 241.19
28 36 938.88 3,505.31 274.46
29 46 1,199.68 4,702.87 325.91
30 0 31 0 32 8 208.64 946.81 49.33
33 25 652.00 3,106.71 147.26
34 42 1,095.36 5,480.09 236.19 -
Totals 253 $1,850.84
TABLE 71
BASIC MAINTE:~;\NCE COST PER YEAR - SCENARIO lC
Average Tie Life: 45 years Tie Condition: 25% Bad in Year 35/36
Year Ties Changed 1980 Cost +5% Inflation "Cash Flow" -10% Discount
22 1 26.08 72.66 9.82
23 0 24 2 52.16 160.21 17.90
25 2 52.16 168.22 17.07
26 3 78.24 264.95 24.46
27 4 104.32 370.93 31. 12
28 4 104.32 389.48 29.72
29 5 130.40 511.18 35.42
30 12 312.96 1,288.17 81.16
31 12 312.96 1,352.58 77.50
32 17 443.36 2,011.97 104.82
33 20 521. 60 2,485.37 117.81
34 23 599.84 3,001. 00 129.34
35 41 1,069.28 5,617.25 219.63 -
Totals 146 $895.77
72
-------- -------------
TABLE 72
BASIC .MAINTENANCE COST PER YEAR - SCENARIO 2A Average Tie Life: 25 years Tie Condition: 25% Bad in Year 21
Year Ties Changed 1980 Cost +5% Inflation "Cash Flow" -10% Discount
12 1 26.08 44.60 15.63 13 2 52.16 93.67 29.84 14 2 52.16 98.35 28.49 IS 3 78.24 154.92 40.79 16 8 208.64 433.74 103.84 17 17 443.36 967.81 210.60 18 23 599.86 11,374.88 271.95 19 40 1,043.20 2,510.57 451.65 20 67 1,747.36 4,415.58 721.95 21 0 22 12 312.96 871.91 117.79 23 27 704.16 2,059.88 252.95 24 57 1,486.56 4,565.97 510.02 -
Totals 259 $2,755.50
TABLE 73
BASIC MAINTENANCE COST PER YEAR - SCENARIOS 2B, 2C Average Tie Life: 30 years Tie Condition: 25% Bad in Year 25
Year Ties Changed 1980 Cost +5% Inflation "Cash Flow" -10% Discount
15 1 26.08 51.64 13.60 16 2 52.16 108.44 25.96 17 2 52.16 113,86 24.78 18 3 78.24 179.33 35.47 19 8 208.64 502.11 90.33 20 17 443.36 1,120.37 183.18 21 23 599.84 1,591.56 236.51 22 29 756.32 2,107.11 284.67 23 36 938.88 2,746.51 337.27 24 44 1,147.52 3,524.61 393.70 -
Totals 167 $1,625.47
73
TABLE 74
BASIC MAINTENANCE COST PER YEAR - SCENARIO 3A
Average Tie Life: 19 years Tie Condition: 25% Bad in Year 15
Year Ties Changed 1980 Cost +5% Inflation "Cash Flow" -10% Discount
9 0 10 1 26.08 40.46 17.16
11 4 104.32 169.93 65.51
12 7 182.56 312.23 109.44
13 14 365.12 655.72 208.91
14 39 1,017.12 1,917.88 555.61
15 70 1,825.60 3,614.69 951. 75 -
Totals 135 $1,908.38
TABLE 75
BASIC MAINTENANCE COST PER YEAR - SCENARIO 3B
Average Tie Life: 22 years Tie Condition: 25% Bad in Year 17
Year Ties Changed 1980 Cost +5% Inflation "Cash Flow" -10% Discount
10 l 26.08 40.46 17.16
11 2 52.16 84.96 32.75
12 2 52.16 89.21 31.27
13 3 78.24 140.51 44.77
14 8 208.64 393.41 113.97
15 17 443.36 877.85 231.14
16 32 834.56 1,734.97 415.35
17 56 1,460.48 3,188.08 693.73 -
Totals 121 $1,580.14
TABLE 76
BASIC MAINTENANCE COST PER YEA~ - SCENARIOS 4A, 4B, 4C
Average Tie Life: 30 years Tie Condition: 25% Bad in Year 24
Year Ties Changed 1980 Cost +5% Inflation "Cash Flow" -10% Discount
15 1 26.08 51.64 13.60
16 2 52.16 108.44 25.96
17 2 52.16 113.86 24.78
18 7 182.56 418.43 82.76
19 9 234.72 564.88 101.62
20 12 312.96 790.85 129.30
21 15 391.20 1,037.97 154.24
22 27 704.16 1' 961. 79 265.04
23 46 1,199.68 3,509.42 430.96 -
4A, 4C Totals 121 $1,228.26
4B Total (Years 15 to 21) 48 $ 532.26
74
TABLE 77
BASIC MAINTENANCE COST PER YEAR - SCENARIO 5 Average Tie Life: 25 years Tie Condition: 25% Bad in Year 20
Year Ties Changed
12 1 13 2 14 2 15 3 16 8 17 17 18 23 19 40 -
Totals 96
1980 Cost +5% Inflation
26.08 44.60 52.16 93.67 52.16 98.35 78.24 154.92
208.64 443.74 443.36 967.81 599.86 1,374.88
1,043.20 2,510.57
TABLE 78
LONG-TERM COST ANALYSIS SUMMARY (All costs are complete per mile)
"Cash Flow" -10% Discount
15.63 29.84 28.49 40.79
103.84 210.60 271.95 451.65
$1,152.79
Internal Rate of Return Economic Selective Track Track Renewal Track Renewal on Track Investment (%) Scenario Life for Maintenance Renewal Savings Without Savings With Without Number Comparison Costs Costs Material Credit Material Credit Material (years) ($) ($) ($) ($) Credit
lA 34 221,900 225,800 ( 3,900) 18,700 7.3 lB 34 205,900 213,400 ( 7,500) 15,100 5.9 lC 36 221,900 220,200 1,700 24,300 9.9 2A 24 224,900 225,100 ( 200) 17,700 8.5 2B 24 224,900 216,800 8,100 26,000 12.1 2C 24 229,500 216,800 12,700 26,800 33.2 3A 15 218,000 216,400 1,600 17,200 9.6 3B 17 228,000 217,000 11,000 27,000 13.5 4A 23 278,300 280,400 ( 2,100) 18,400 8.2 4B 21 218,800 220,200 ( 1,400) 19,100 8.5 4C 23 164,800 182,700 (17,900) 2,600 3.3 5 19 314,800 314,700 100 18,000 9.4 6 40 295,600 296,200 ( 600) 17,300 9.3 7 40 367,200 . 353.700 13,500 29,500 11.0
*Rate of return cannot be calculated because of no extra cost in the first year (the rate of return is based on the differential cost incurred in the first year).
75
With Material Credit
*
25.4
*
31.2
31.8
*
29.3
31.0
35.2
35.2
10.4
30.4
12.6
14.1
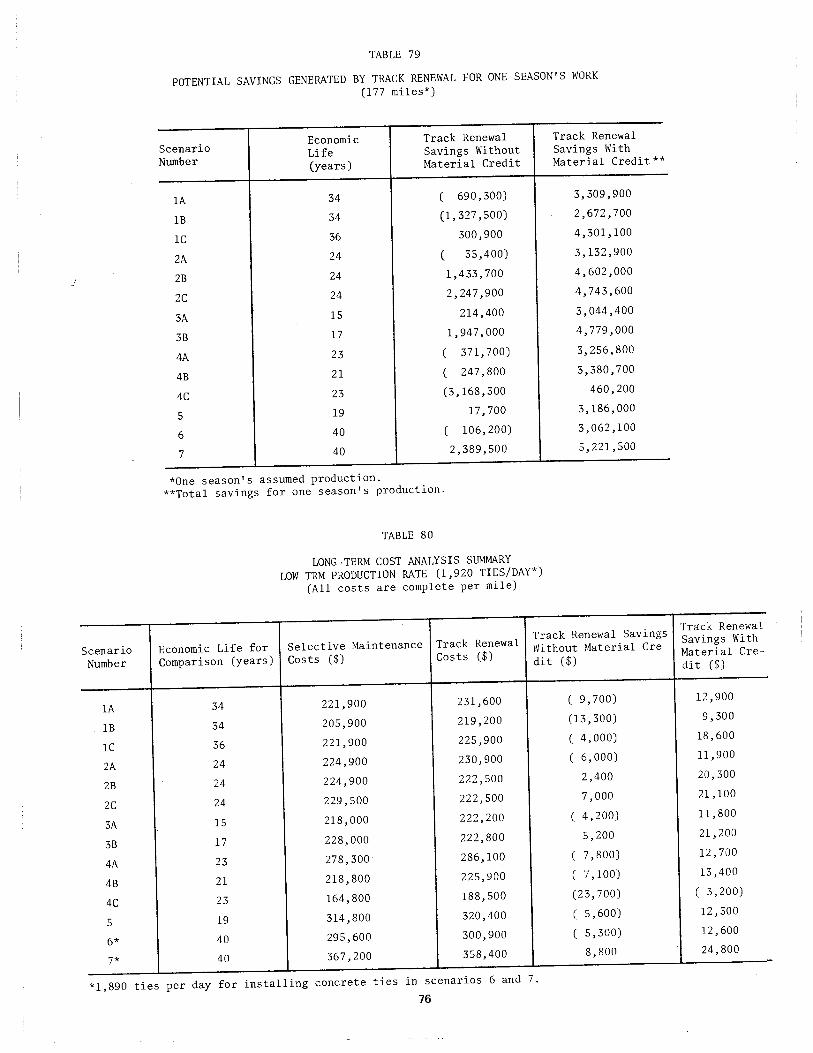
Scenario Number
lA
lB
lC
2A
2B
2C
3A
3B
4A
4B
4C
5
6*
7*
TABLE 79
POTENTIAL SAVINGS GENERATED BY TRACK RENEWAL FOR ONE SEASON'S WORK
(177 miles*)
Scenario Economic Track Renewal Track Renewal
Number Life Savings Without Savings With
(years) Material Credit Material Credit**
lA 34 ( 690, 300) 3,309,900
lB 34 (1,327,500) 2,672,700
lC 36 300,900 4,301,100
2A 24 ( 35,400) 3,132,900
2B 24 1,433, 700 4,602,000
2C 24 2,247,900 4,743,600
3A 15 214,400 3,044,400
3B 17 1,947,000 4,779,000
4A 23 ( 371, 700) 3,256,800
4B 21 ( 247,800 3,380,700
4C 23 (3,168,300 460,200
5 19 17,700 3,186,000
6 40 ( 106' 200) 3,062,100
7 40 2,389,500 5,221,500
*One season's assumed production.
**Total savings for one season's production.
TABLE 80
LONG-TERM COST ANALYSIS SUMMARY
LOW TRM PRODUCTION RATE (1,920 TIES/DAY*)
(All costs are complete per mile)
Track Renewal Savings Economic Life for Selective Maintenance Track Renewal Without Material Cre-Comparison (years) Costs ($) Costs ($) dit ($)
34 221,900 231,600 ( 9,700)
34 205,900 219,200 (13,300)
36 221,900 225,900 ( 4,000)
24 224,900 230,900 ( 6,000)
24 224,900 222,500 2,400
24 229,500 222,500 7,000
15 218,000 222,200 ( 4,200)
17 228,000 222,800 5,200
23 278,300 286,100 ( 7,800)
21 218,800 225,900 ( 7,100)
23 164,800 188,500 (23, 700)
19 314,800 320,400 ( 5,600)
40 295,600 300,900 ( 5,300)
40 367,200 358,400 8,800
*1,890 ties per day for installing concrete ties in scenarios 6 and 7.
76
Track Renewal Savings With Material Cre-di t ($)
12,900
9,300
18,600
ll '900
20,300
21,100
11,800
21,200
12,700
13,400
( 3,200)
12,300
12,600
24,800
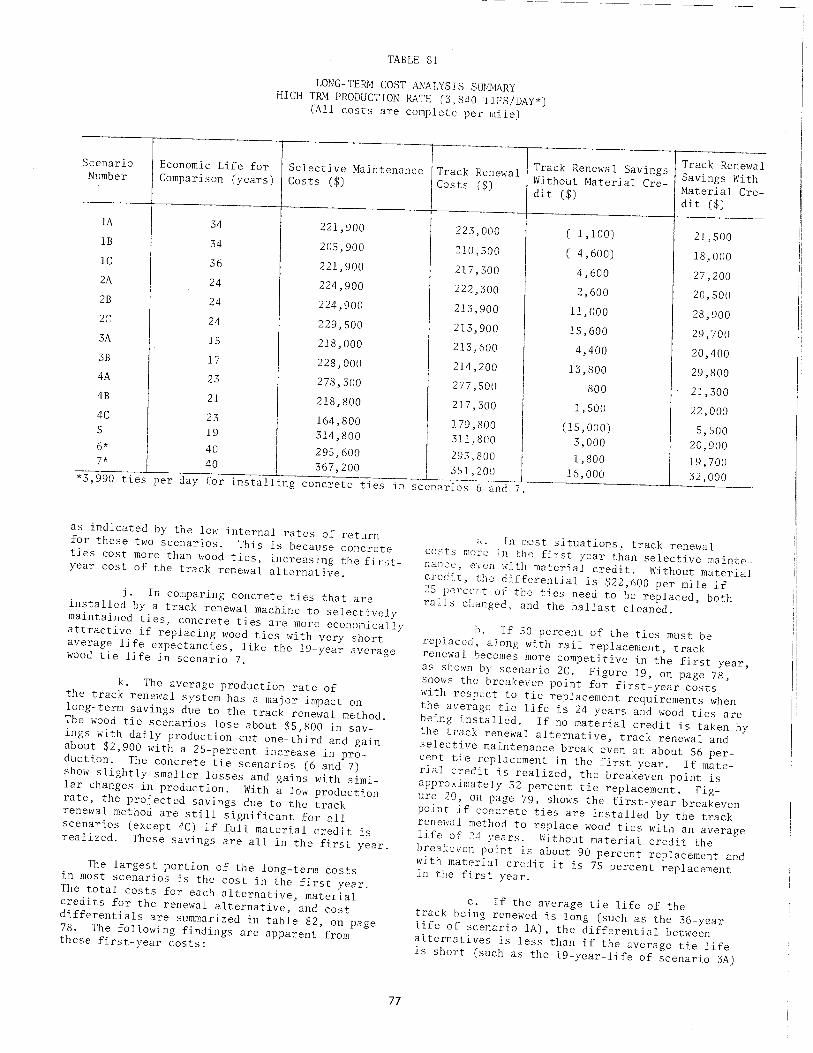
TABLE 81
LONG-TERM COST ANALYSIS SUMMARY HIGH TRM PRODUCTION RATE (3,840 TIES/DAY*)
(All costs are complete per mile)
Track Renewal Savings Track Renewal Scenario Economic Life for Selective Maintenance Track Renewal Without Material Cre- Savings With Number Comparison (years) Costs ($) Costs ($) dit ($) Material Cre-
dit ($)
lA 34 221,900 223,000 c l 'l 00) 21,500 lB 34 205,900 210,500 c 4' 600) 18,000 lC 36 221,900 217, :>oo 4,600 27,200 2A 24 224,900 222,300 2,600 20,500 28 24 224,900 213,900 11,000 28,900 2C 24 229,500 213,900 15,600 29,700 3A 15 218,000 213,600 4,400 20,400 38 17 228,000 214,200 13,800 29,800 4A 23 278,300 277,500 800 21,300 48 21 218,800 217,300 1,500 22,000 4C 23 164,800 179,800 (15,000) 5,500 5 19 314,800 311,800 3,000 20,900 6*
l 40 295,600 293,800 1,800 19,700 7* 40 367,200 I 351,200 _j 16,000 32,000 '
~ -*3,990 t1es per day for rnstallrng concrete tres rn scenar1os 6 dnd I.
as indicated by the low internal rates of return for these two scenarios. This is because concrete ties cost more than wood ties, increasing the firstyear cost of the track renewal alternative.
j. In comparing concrete ties that are installed by a track renewal machine to selectively maintained ties, concrete ties are more economically attractive if replacing wood ties with very short average life expectancies, like the 19-year average wood tie life in scenario 7.
k. The average production rate of the track renewal system has a major impact on long-term savings due to the track renewal method. The wood tie scenarios lose about $5,800 in savings with daily production cut one-third and gain about $2,900 with a 25-percent increase in production. The concrete tie scenarios (6 and 7) show slightly smaller losses and gains with similar changes in production. With a low production rate, the projected savings due to the track renewal method are still significant for all scenarios (except 4C) if full material credit is realized. These savings are all in the first year.
The largest portion of the long-term costs in most scenarios is the cost in the first year. The total costs for each alternative, material credits for the renewal alternative, and cost differentials are summarized in table 82, on page 78. The following findings are apparent from these first-year costs:
77
a. In most situations, track renewal costs mo~·e in the first year than selective maintenance, even with material credit. Without material credit, the differential is $22,600 per mile if 25 pcrce;:t of tlJC ties need to be replaced, both rails ckmged, and the ballast cleaned.
b. If 50 percent of the ties must be replaced, along with rail replacement, track renewal becomes more competitive in the first year, as shown by scenario 2C. Figure 19, on page 78, shows the break even point for first- year costs with respect to tie replacement requirements when the average tie life is 24 years and wood ties are being installed. If no material credit is taken by the track renewal alternative, track renewal and selective maintenance break even at about 56 percent tie replacement in the first year. If material credit is realized, the breakeven point is approximately 32 percent tie replacement. Fig-ure 20, Oll page 79, shows the first-year breakeven point if concrete ties are installed by the track renewal method to replace wood ties with an average life of 24 years. Without material credit the breakeven point is about 90 percent replacement and with material credit it is 75 percent replacement in the first year.
c. If the average tie life of the track being renewed is long (such as the 36-ycar life of scenario lA), the differential between alternatives is less than if the average tie life is short (such as the 19-year-life of scenario 3A)
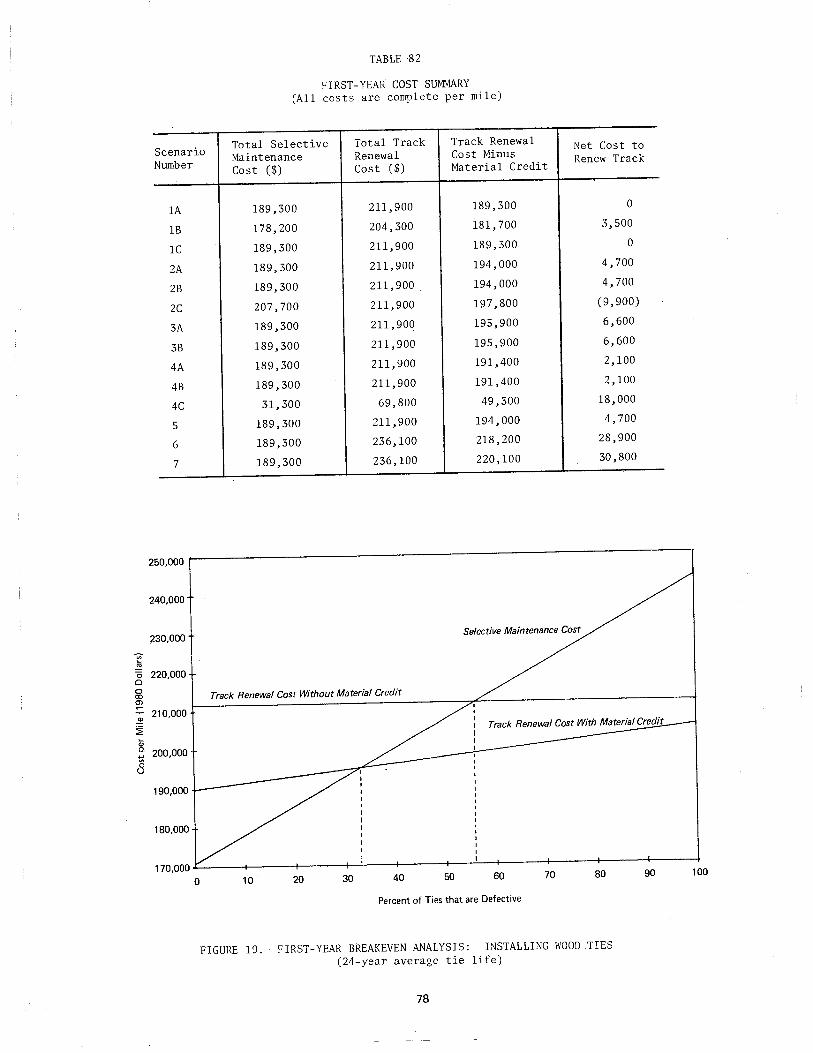
~ ~
~
Scenario Number
lA
lB
lC
2A
2B
2C
3A
3B
4A
4B
4C
5
6
7
250,000
240,000
230,000
TABLE 82
FIRST-YEAR COST SUMMARY (All costs are complete per mile)
Total Selective Total Track Track Renewal Net Cost to Maintenance Renewal Cost Minus
Cost ($) Cost ($) Material Credit Renew Track
189,300 211,900 189,300 0
178,200 204,300 181,700 3,500
189,300 211,900 189,300 0
189,300 211,900 194,000 4, 700
189,300 211,900 194,000 4, 700
207,700 211,900 197,800 (9,900)
189,300 211,900 195,900 6,600
189,300 211,900 195,900 6,600
189,300 211,900 191,400 2,100
189,300 211,900 191,400 2,100
31,300 69,800 49,300 18,000
189,300 211,900 194,000 4,700
189,300 236,100 218,200 28,900
189,300 236,100 220,100 30,800
Selective Maintenance Cost
8 220,000
0 00 Ol
~
2 Q; c. .... 0 u
210,000
200,000
190,000
180,000
170,000
Track Renewal Cost Without Material Credit
0 10 20 30 40 50 60 70 80
Percent of Ties that are Defective
FIGURE 19. FIRST-YEAR BREAKEVEN ANALYSIS: INSTALLING WOOD .TIES
(24-year average tie life)
78
90 100
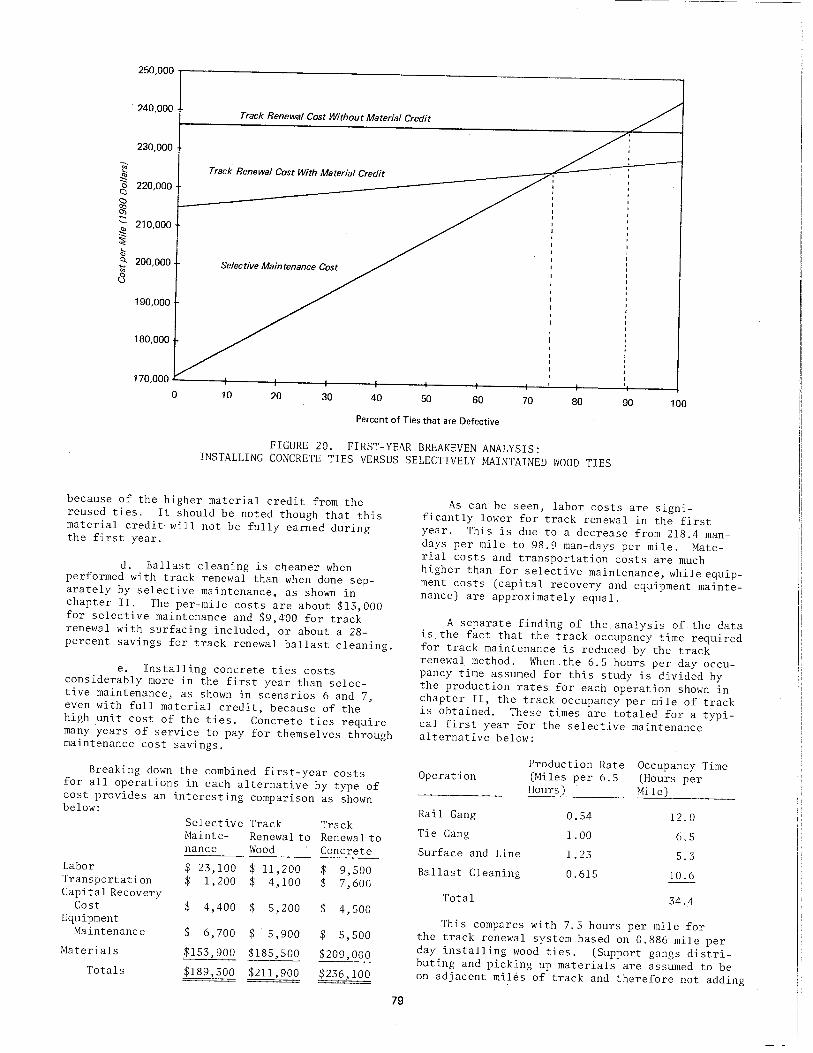
250,000
. 240,000 Track Renewal Cost Without Material Credit
230,000
"" ._ Track Renewal Cost With Material Credit :!g 220,000 0 c:,
<:;)
~ 210,000 "' ~ a; Q. 200,000 ... Selective Maintenance Cost 8
190,000
180,000
170,000
0 10 20 30 40 50 60 70 80 90 100
Percent of Ties that are Defective
FIGURE 20. FIRST-YEAR BREAKEVEN ANALYSIS: INSTALLING CONCRETE TIES VERSUS SELECTIVELY MAINTAINED WOOD TIES
because of the higher material credit from the reused ties. It should be noted though that this material credit will not be fully earned during the first year.
d. Ballast cleaning is cheaper when performed with track renewal than when done separately by selective maintenance, as shown in chapter II. The per-mile costs are about $13,000 for selective maintenance and $9,400 for track renewal with surfacing included, or about a 28-percent savings for track renewal ballast cleaning.
e. Installing concrete ties costs considerably more in the first year than selective maintenance, as shown in scenarios 6 and 7, even with full material credit, because of the high unit cost of the ties. Concrete ties require many years of service to pay for themselves through maintenance cost savings.
Breaking down the combined first-year costs for all operations in each alternative by type of cost provides an interesting comparison as shown below:
Selective Track Track Mainte- Renewal to Renewal to nance Wood Concrete
Labor $ 23,100 $ 11,200 $ 9,500 Transportation $ 1,200 $ 4,100 $ 7,600 Capital Recovery
Cost $ 4,400 $ 5,200 $ 4,500 Equipment
Maintenance $ 6,700 $ 5,900 $ 5,500 Materials $153,900 $185,500 $209,000
Totals $189,300 $211,900 $236,100
79
As can be seen, labor costs are significantly lower for track renewal in the first year. This is due to a decrease from 218.4 mandays per mile to 98.9 man-days per mile. Material costs and transportation costs are much higher than for selective maintenance, while equipment costs (capital recovery and equipment maintenance) are approximately equal.
A separate finding of the analysis of the data is the fact that the track occupancy time required for track maintenance is reduced by the track renewal method. When.the 6.5 hours per day occupancy time assumed for this study is divided by the production rates for each operation shown in chapter II, the track occupancy per mile of track is obtained. These times are totaled for a typical first year for the selective maintenance alternative below:
Production Rate Occupancy Time Operation (Miles per 6.5 (Hours per
Hours) Mile)
Rail Gang 0.54 12.0 Tie Gang 1.00 6.5 Surface and Line l. 23 5.3 Ballast Cleaning 0.615 10.6
Total 34.4
This compares with 7.3 hours per mile for the track renewal system based on 0.886 mile per day installing wood ties. (Support gangs distributing and picking up materials are assumed to be on adjacent miles of track and therefore not adding
to the track occupancy requirements.) In a direct comparison, track renewal results in a savings of 27.1 hours of track occupancy in the first year, which is a 79 percent reduction from the 34.4 hours required for the selective maintenance operations.
In scenario 2A, the selective maintenance method requires tie gangs and surface and lining gangs in years 7, 13, and 19. This would require a total of 35.4 hours of future track occupancy time per mile. The track renewal method would require surface and lining gangs in years 7, 13, and 19 (15.9 hours) and a tie gang in year 21 (6.5 hours), for a total of 22.4 hours. Therefore, the track renewal method results in an additional savings of 13.0 hours in future years and a total of 40.1 hours over the renewal cycle. Scenarios in which the track renewal method does not need a mechanized tie gang during the renewal cycle would experience larger long-term savings in occupancy time.
80
Several factors that would affect overall costs to the railroad were not considered in this analysis, primarily because they are difficult to quantify. These factors include the following:
a. No absenteeism costs were included in the study. With a smaller labor requirement than the selective maintenance operations it would replace, a track renewal system may provide overall savings in this area.
b. A track renewal system can operate effectively at night. The Canadian National TRS frequently works at night to utilize the most advantageous window in train operations.
c. With enclosed operator stations, some TRM's can work during inclement weather, thereby being able to improve their overall seasonal production.
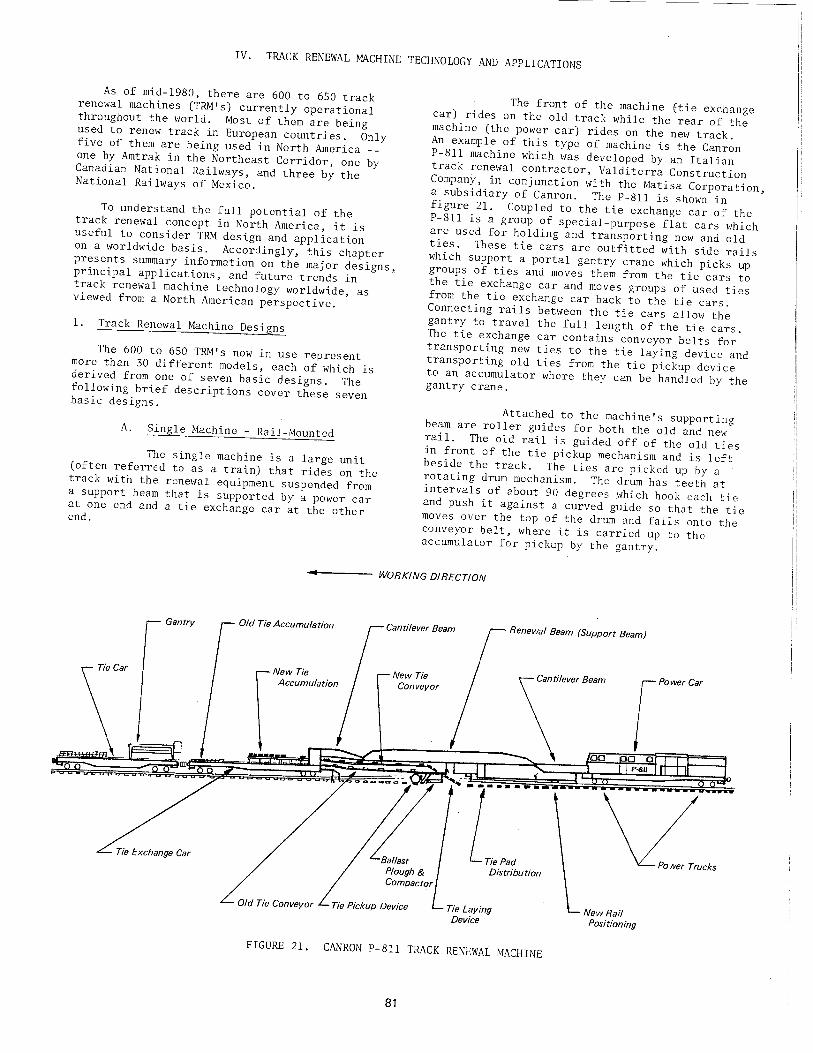
IV. TRACK RENEWAL MACHINE TECHNOLOGY AND APPLICATIONS
As of mid-1980, there are 600 to 650 track renewal machines (TRM's) currently operational throughout the world. Most of them are being used to renew track in European countries. Only five of them are being used in North America one by Amtrak in the Northeast Corridor, one by Canadian National Railways, and three by the National Railways of Mexico.
To understand the full potential of the track renewal concept in North America, it is useful to consider TRM design and application on a worldwide basis. Accordingly, this chapter presents summary information on the major designs, principal applications, and future trends in track renewal machine technology worldwide, as viewed from a North American perspective.
1. Track Renewal Machine Designs
The 600 to 650 TRM's now in use represent more than 30 different models, each of which is derived from one of seven basic designs. The following brief descriptions cover these seven basic designs.
A. Single Machine - Rail-Mounted
The single machine is a large unit (often referred to as a train) that rides on the track with the renewal equipment suspended from a support beam that is supported by a power car at one end and a tie exchange car at the other end.
The front of the machine (tie exchange car) rides on the old track while the rear of the machine (the power car) rides on the new track. An example of this type of machine is the Canron P-811 machine which was developed by an Italian track renewal contractor, Valditerra Construction Company, in conjunction with the Matisa Corporation, a subsidiary of Canron. The P-811 is shown in figure 21. Coupled to the tie exchange car of the P-811 is a group of special-purpose flat cars which are used for holding and transporting new and old ties. These tie cars are outfitted with side rails which support a portal gantry crane which picks up groups of ties and moves them from the tie cars to the tie exchange car and moves groups of used ties from the tie exchange car back to the tie cars. Connecting rails between the tie cars allow the gantry to travel the full length of the tie cars. The tie exchange car contains conveyor belts for transporting new ties to the tie laying device and transporting old ties from the tie pickup device to an accumulator where they can be handled by the gantry crane.
Attached to the machine's supporting beam are roller guides for both the old and new rail. The old rail is guided off of the old ties in front of the tie pickup mechanism and is left beside the track. The ties are pi eked up by a rotating drum mechanism. The drum has teeth at intervals of about 90 degrees which hook each tie and push it against a curved guide so that the tie moves over the top of the drum and falls onto the conveyor belt, where it is carried up to the accumulator for pickup by the gantry.
WORKING DIRECTION
Old Tie Accumulation Renewal Beam (Support Beam)
\'""r;' \ A"umwo<;u,
Tie Exchange Car
Old Tie Conveyor Tie Pickup Device Tie Laying Device
New Rail Positioning
FIGURE 21. CANRON P-811 TRACK RENEWAL MACHINE
81
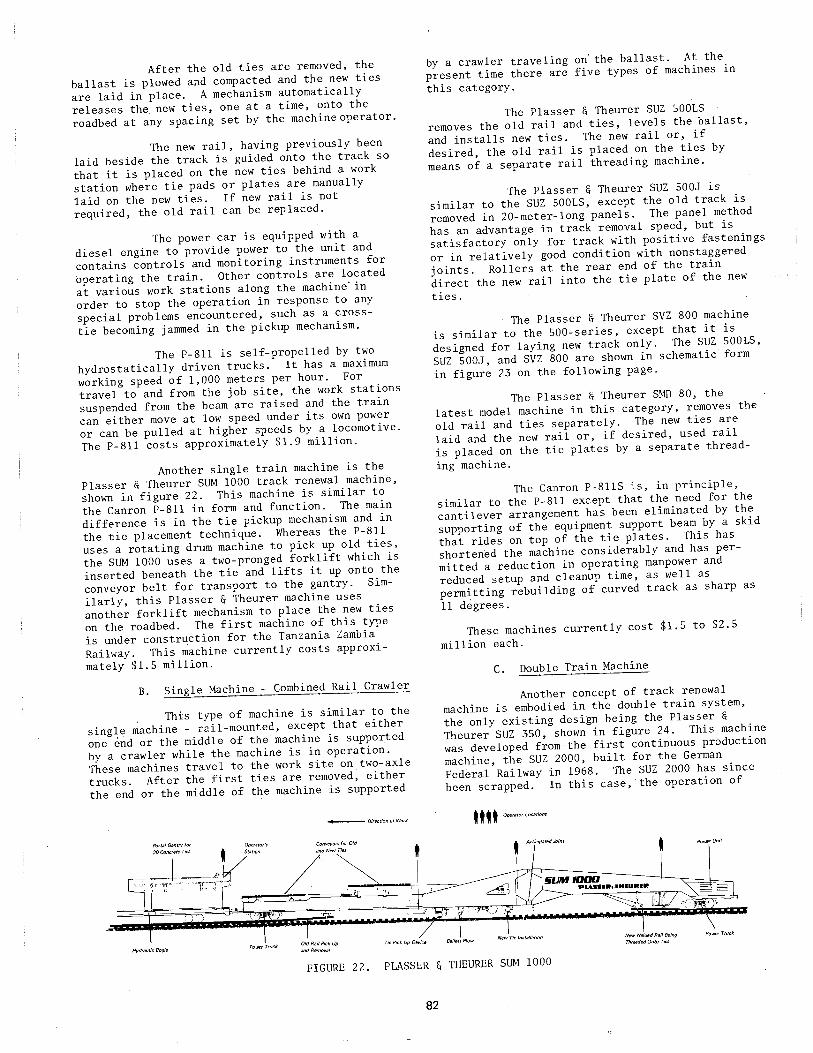
After the old ties are removed, the
ballast is plowed and compacted and the new ties
are laid in place. A mechanism automatically
releases the. new ties, one at a time, onto the
roadbed at any spacing set by the machineoperator.
The new rail, having previously been
laid beside the track is guided onto the track so
that it is placed on the new ties behind a work
station where tie pads or plates are manually
1aid on the new ties. If new rail is not
required, the old rail can be replaced.
The power car is equipped with a
diesel engine to provide power to the unit and
contains controls and monitoring instruments for
operating the train. Other controls are located
at various work stations along the machine· in
order to stop the operation in response. to any
special problems encountered, such as a cross
tie becoming jammed in the pickup mechanism.
The P-811 is self-propelled by two
hydrostatically driven trucks. It has a maximum
working speed of 1,000 meters per hour. For
travel to and from the job site, the work stations
suspended from the beam are raised and the train
can either move at low speed under its own power
or can be pulled at higher speeds by a locomotive.
The P-811 costs approximately $1.9 million.
Another single train machine is the
Plasser & Theurer SUM 1000 track renewal machine,
shown in figure 22. This machine is similar to
the Canron P-811 in form and function. The main
difference is in the tie pickup mechanism and in
the tie placement technique. Whereas the P-811
uses a rotating drum machine to pick up old ties,
the SUM 1000 uses a two-pronged forklift which is
inserted beneath the tie and lifts it up onto the
conveyor belt for transport to the gantry. Sim
ilarly, this Plasser & Theurer machine uses
another forklift mechanism to place the new ties
on the roadbed. The first machine of this type
is under construction for the T"anzania Zambia
Railway. This machine currently costs approxi
mately $1.5 million.
B. Single Machine - Combined Rail Crawler
, This type of machine is similar to the
single machine - rail-mounted, except that either
one end or the middle of the machine is supported
by a crawler while the machine is in operation.
These machines travel to the work site on two-axle
trucks. After the first ties are removed, either
the end or the middle of the machine is supported
Porta/Gantry for
20Conc1eteTies
Hyd1au/ic Bogie
Operator's
Station
Power TruCk
~DirectionofWork
Conveyors for Old
Tie Pick Up Device
by a crawler traveling on· the ballast. At the
present time there are five types of machines in
this category.
The Plasser & Theurer SUZ 500LS
removes the old rail and ties, levels the ballast,
and installs new ties. The new rail or, if
desired, the old rail is placed on the ties by
means of a separate rail threading machine.
The Plasser & Theurer SUZ 500J is
similar to the SUZ 500LS, except the old track is
removed in 20-meter-long panels. The panel method
has an advantage in track removal speed, but is
satisfactory only for track with positive fastenings
or in relatively good condition with nonstaggered
joints. Rollers at the rear end of the train
direct the new rail into the tie plate of the new
ties.
The Plasser & Theurer SVZ 800 machine
is similar to the 500-series, except that it is
designed for laying new track only. The SUZ 500LS,
SUZ 500J, and SVZ 800 are shown in schematic form
in figure 23 on the following page.
The Plasser & Theurer SMD 80, the
latest model machine in this category, removes the
old rail and ties separately. The new ties are
laid and the new rail or, if desired, used rail
is placed on the tie plates by a separate thread
ing machine.
The Canron P-8115 is, in principle,
similar to the P-811 except that the need for the
cantilever arrangement has been eliminated by the
supporting of the equipment support beam by a skid
that rides on top of the tie plates. This has
shortened the machine considerably and has per
mitted a reduction in operating manpower and
reduced setup and cleanup time, as well as
permitting rebuilding of curved track as sharp as
11 degrees.
These machines currently cost $1.5 to $2.5
million each.
C. Double Train Machine
Another concept of track renewal
machine is embodied in the double train system,
the only existing design being the Plasser & Theurer SUZ 350, shown in figure 24. This machine
was developed from the first continuous production
machine, the SUZ 2000, built for the German
Federal Railway in 1968. The SUZ 2000 has since
been scrapped. In this case, the operation of
Ballast Plow New Tie Installation New Welded Rail Being
Threaded Onto Ties
Power Truck
FIGURE 22. PLASSER & THEURER SUM 1000
82
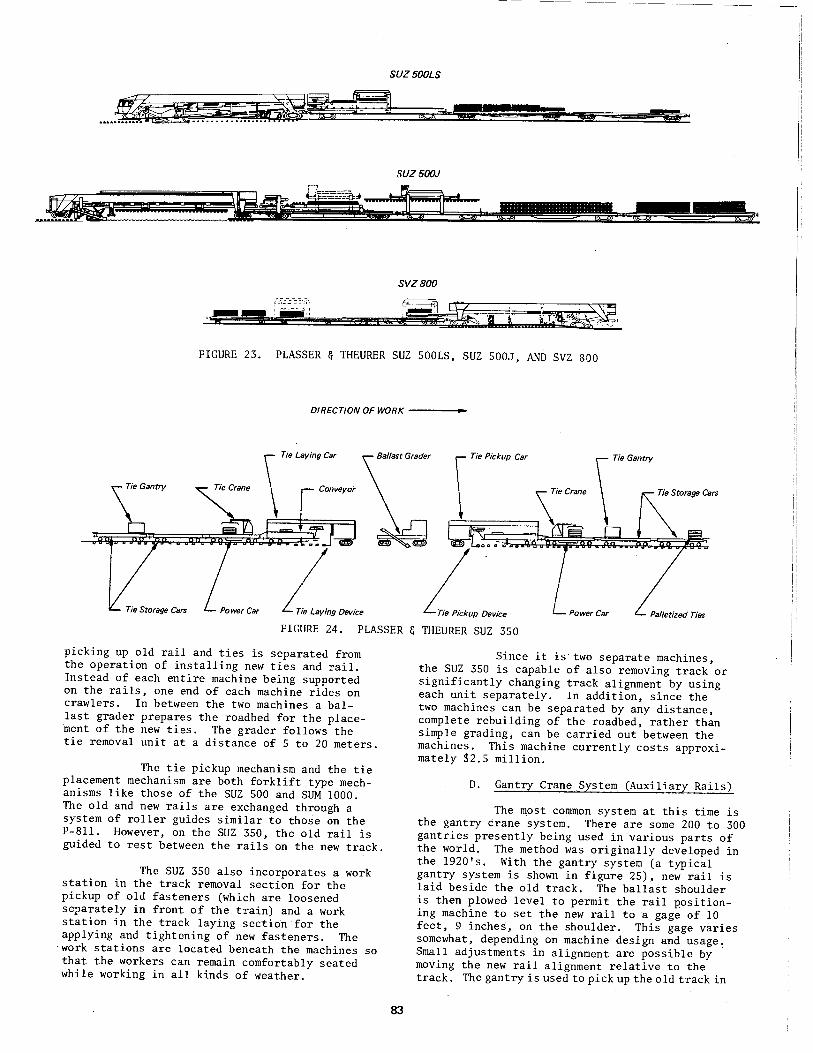
SUZ500LS
-~ b a;
SUZ500J
SVZBOO
FIGURE 23. PLASSER & THEURER SUZ 500LS, SUZ 500J, AND SVZ 800
DIRECTION OF WORK -----t~
Tie Storage Cars
Tie Storage Cars Palletized Ties
FIGURE 24. PLASSER & THEURER SUZ 350
picking up old rail and ties is separated from the operation of installing new ties and rail. Instead of each entire machine being supported on the rails, one end of each machine rides on crawlers. In between the two machines a ballast grader prepares the roadbed for the placement of the new ties. The grader follows the tie removal unit at a distance of 5 to 20 meters.
The tie pickup mechanism and the tie placement mechanism are both forklift type mechanisms like those of the SUZ 500 and SUM 1000. The old and new rails are exchanged through a system of roller guides similar to those on the P-811. However, on the SUZ 350, the old rail is guided to rest between the rails on the new track.
The SUZ 350 also incorporates a work station in the track removal section for the pickup of old fasteners (which are loosened separately in front of the train) and a work station in the track laying section for the applying and tightening of new fasteners. The
·work stations are located beneath the machines so that the workers can remain comfortably seated while working in all kinds of weather.
83
Since it is· two separate machines, the SUZ 350 is capable of also removing track or significantly changing track alignment by using each unit separately. In addition, since the two machines can be separated by any distance, complete rebuilding of the roadbed, rather than simple grading, can be carried out between the machines. This machine currently costs approximately $2.5 million.
D. Gantry Crane System (Auxiliary Rails)
The most common system at this time is the gantry crane system. There are some 200 to 300 gantries presently being used in various parts of the world. The method was originally developed in the 1920's. With the gantry system (a typical gantry system is shown in figure 25), new rail is laid beside the old track. The ballast shoulder is then plowed level to permit the rail P.OSitioning machine to set the new rail to a gage of 10 feet, 9 inches, on the shoulder. This gage varies somewhat, depending on machine design and usage~ Small adjustments in alignment are possible by moving the new rail alignment relative to the track. The gantry is used to pick up the old track in

Materials Car (New ties spaced for relaying, using beam and temporary rails. Old panels replace these ties when the car is clear.)
Gantry Set of 1 Beam and 2 Gantries (Removes old track panels and installs new ties)
Track Panel Ballast Regulator
(Provides correct elevation and compacts ballast)
Welded Rail on Prepared Shoulder
FIGURE 25. RMC/SECMAFER GANTRY SET
panels up to 20 meters long and place them on a flat car for transportation to a track panel facility. In Europe, most jointed rail is built so that joints are located opposite each other and the track is already in convenient panels. For welded rail, or rail with staggered joints, the track must be cut to create panels. The panel is picked up by clamping either the rails or the ties, depending on the design of the machine.
After the old track has been removed, a ballast regulator, which rides on the same rails as the gantries, smooths and dresses the roadbed. After the regulator vacates the work area, the gantry crane picks up a new panel of track or ties from the storage cars and places it in position on the roadbed. Depending on the design of the machine, the gantry may pick up the ties as a unit by grasping the ends of each tie, by clasping the tie plates or, in a few cases, the ties may be held together by rails which are clamped by the gantry. If the gantry lays ties, the new rails (the gantry rails) are positioned on the tie plates by a rail threader. If the new track is laid in panels, it is usual to later replace the rail with new welded rail. Production rates range from 300 to 400 feet per hour, although production can be increased 40 to 50 percent by using two gantries in tandem.
At least 10 different manufacturers produce this type ofmachine. Among the machines, there are minor variations in the method of
84
operating the system. For example, the Polish State Railways (PKR) use a system of gantry cranes moving along the track on the new rails positioned aside the existing track with a gage of 3,020 millimeters. Flat cars with rails of the same gage are connected to the new rails by a 1:42 ramp. Gantries pick up one panel and carry it onto the flat car. These gantries lay single ties.
Due to their restricted clearance diagram, the Swiss Railways have developed a hybrid gantry system called the Puma system. It avoids outside rails by having the gantry cranes run on rails atop the flat cars. One special car permits the picking up of panels through a 19-meter-long open gap in its deck. Individual ties are laid through the gap, while the rear end of the special car rests on the preplaced rails on the ballast shoulder, which afterwards becomes the running rails.
The gantry system is simpler and costs less to purchase than the single and double train systems, but it also requires more operations; such as rail cutting. Also, it is normally used only on track that either has positive fastenings or is in relatively good condition. The gantry cranes currently cost between $250,000 and $750,000 each.
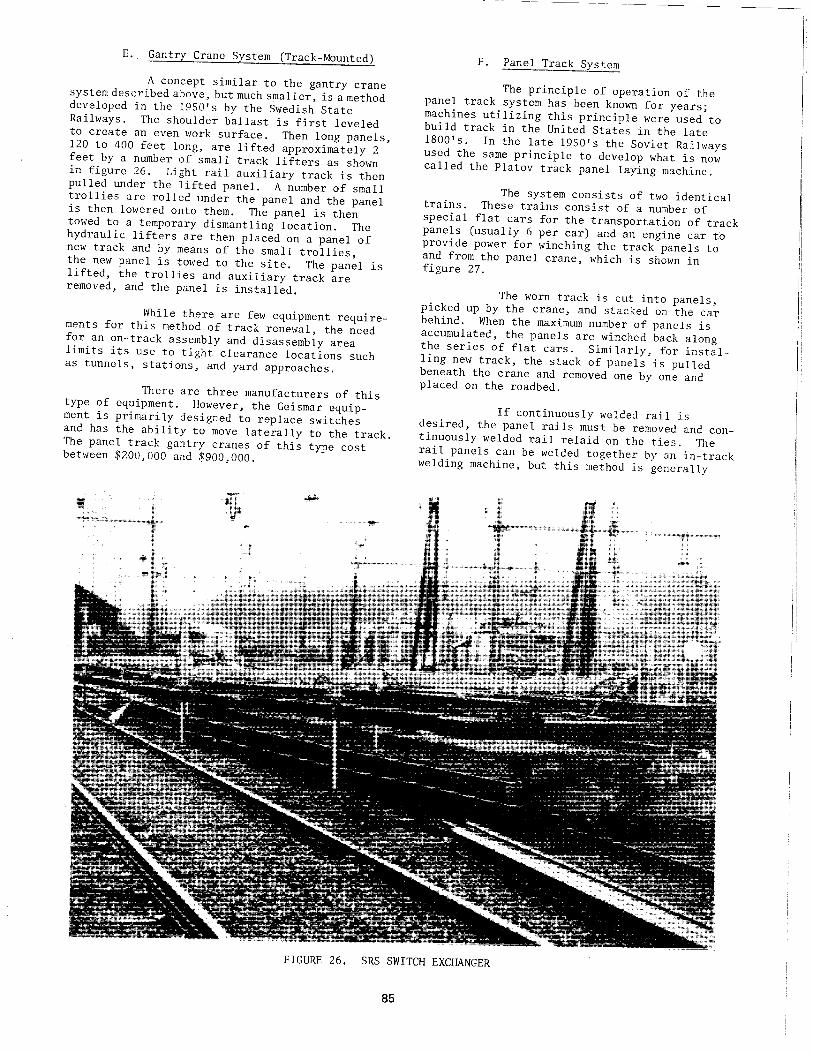
E. Gantry Crane System (Track-Mounted)
A concept similar to the gantry crane system described above, but much smaller, is a method developed in the 1950's by the Swedish State Railways. The shoulder ballast is first leveled to create an even work surface. Then long panels, 120 to 400 feet long, are lifted approximately 2 feet by a number of small track lifters as shown in figure 26. Light rail auxiliary track is then pulled under the lifted panel. A number of small trollies are rolled under the panel and the panel is then lowered onto them. The panel is then towed to a temporary dismantling location. The hydraulic lifters are then placed on a panel of new track and by means of the small trollies, the new panel is towed to the site. The panel is lifted, the trollies and auxiliary track are removed, and the panel is installed.
While there are few equipment requirements for this method of track renewal, the need for an on-track assembly and disassembly area limits its use to tight clearance locations such as tunnels, stations, and yard approaches.
There are three manufacturers of this type of equipment. However, the Geismar equipment is primarily designed to replace switches and has the ability to move laterally to the track. The panel track gantry cranes of this type cost between $200,000 and $900,000.
F. Panel Track System
The principle of operation of the panel track system has been known for years; machines utilizing this principle were used to build track in the United States in the late 1800's. In the late 1950's the Soviet Railways used the same principle to develop what is now called the Platov track panel laying machine.
The system consists of two identical trains. These trains consist of a number of special flat cars for the transportation of track panels (usually 6 per car) and an engine car to provide power for winching the track panels to and from the panel crane, which is shown in figure 27.
The worn track is cut into panels, picked up by the crane, and stacked on the car behind. When the maximum number of panels is accumulated, the panels are winched back along the series of flat cars. Similarly, for installing new track, the stack of panels is pulled beneath the crane and removed one by one and placed on the roadbed.
If continuously welded rail is desired, the panel rails must be removed and continuously welded rail relaid on the ties. The rail panels can be welded together by an in-track welding machine, but this method is generally
FIGURE 26. SRS SWITCH EXCHANGER
85
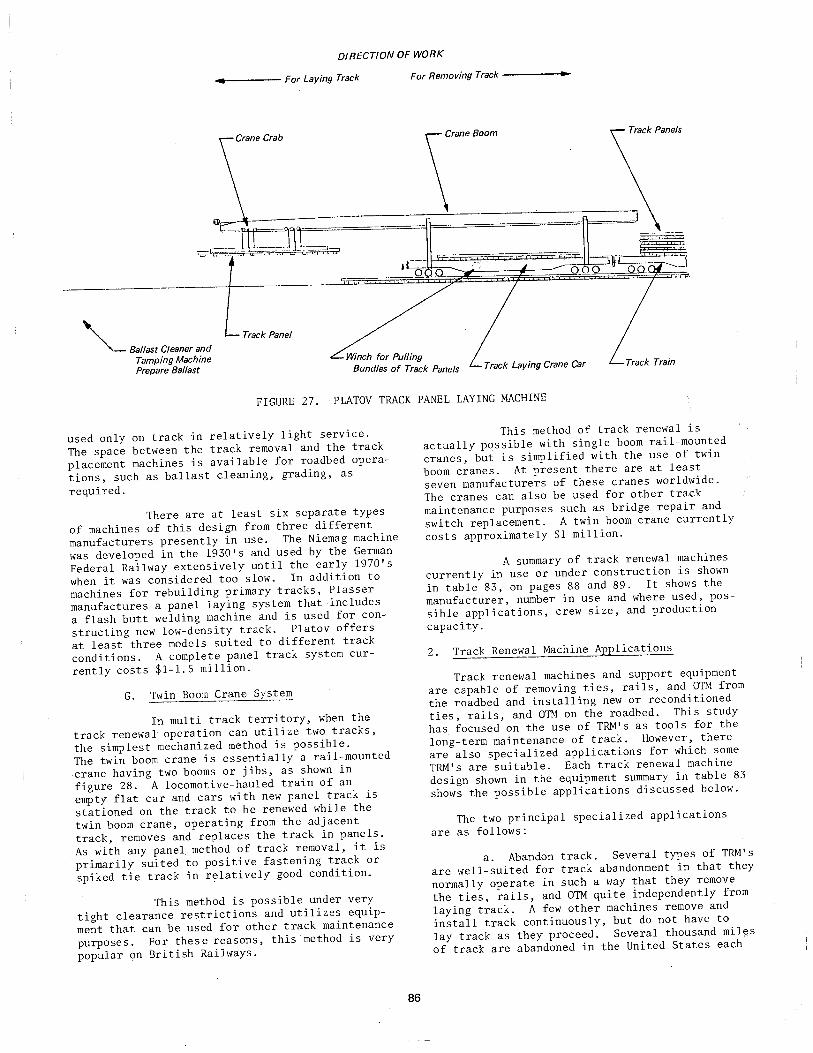
DIRECTION OF WORK
------ For Laying Track For Removing Track -----~
Track Laying Crane Car Track Train
FIGURE 27. PLATOV TRACK PANEL LAYING MACHINE
used only on track in relatively light service.
The space between the track removal and the track
placement machines is available for roadbed opera
tions, such as ballast cleaning, grading, as
required.
There are at least six separate types
of machines of this design from three different
manufacturers presently in use. The Niemag machine
was developed in the 1930's and used by the German
Federal Railway extensively until the early 1970's
when it was considered too slow. In addition to
machines for rebuilding primary tracks, Plasser
manufactures a panel laying system that includes
a flash butt welding machine and is used for con
structing new low-density track. Platov offers
at least three models suited to different track
conditions. A complete panel track system cur
rently costs $1-1.5 million.
G. Twin Boom Crane System
In multi-track territory, when the
track renewal operation can utilize two tracks,
the simplest mechanized method is possible.
The twin boom crane is essentially a rail-mounted
crane having two booms or jibs, as shown in
figure 28. A locomotive-hauled train of an
empty flat car and cars with new panel track is
stationed on the track to be renewed while the
twin boom crane, operating from the adjacent
track, removes and replaces the track in panels.
As with any panel method of track removal, it is
primarily suited to positive fastening track or
spiked tie track in relatively good condition.
This method is possible under very
tight clearance restrictions and utilizes equip
ment that can be used for other track maintenance
purposes. For these reasons, this method is very
popular on British Railways.
86
This method of track renewal is
actually possible with single boom rail-mounted
cranes, but is simplified with the use of twin
boom cranes. At present there are at least
seven manufacturers of these cranes worldwide.
The cranes can also be used for other track
maintenance purposes such as bridge repair and
switch replacement. A twin boom crane currently
costs approximately $1 million.
A summary of track renewal machines
currently in use or under construction is shown
in table 83, on pages 88 and 89. It shows the
manufacturer, number in use and where used, pos
sible applications, crew size, and production
capacity.
2. Track Renewal Machine Applications
Track renewal machines and support equipment
are capable of removing ties, rails, and OTM from
the roadbed and installing new or reconditioned
ties, rails, and OTM on the roadbed. This study
has focused on the use of TRM's as tools for the
long-term maintenance of track. However, there
are also specialized applications for which some
TRM's are suitable. Each track renewal machine
design shown in the equipment summary in table 83
shows the possible applications discussed below.
The two principal specialized applications
are as follows:
a. Abandon track. Several types of TRM's
are well-suited for track abandonment in that they
normally operate in such a way that they remove
the ties, rails, and OTM quite independently from
laying track. A few other machines remove and
install track continuously, but do not have to
lay track as they proceed. Several thousand miles
of track are abandoned in the United States each
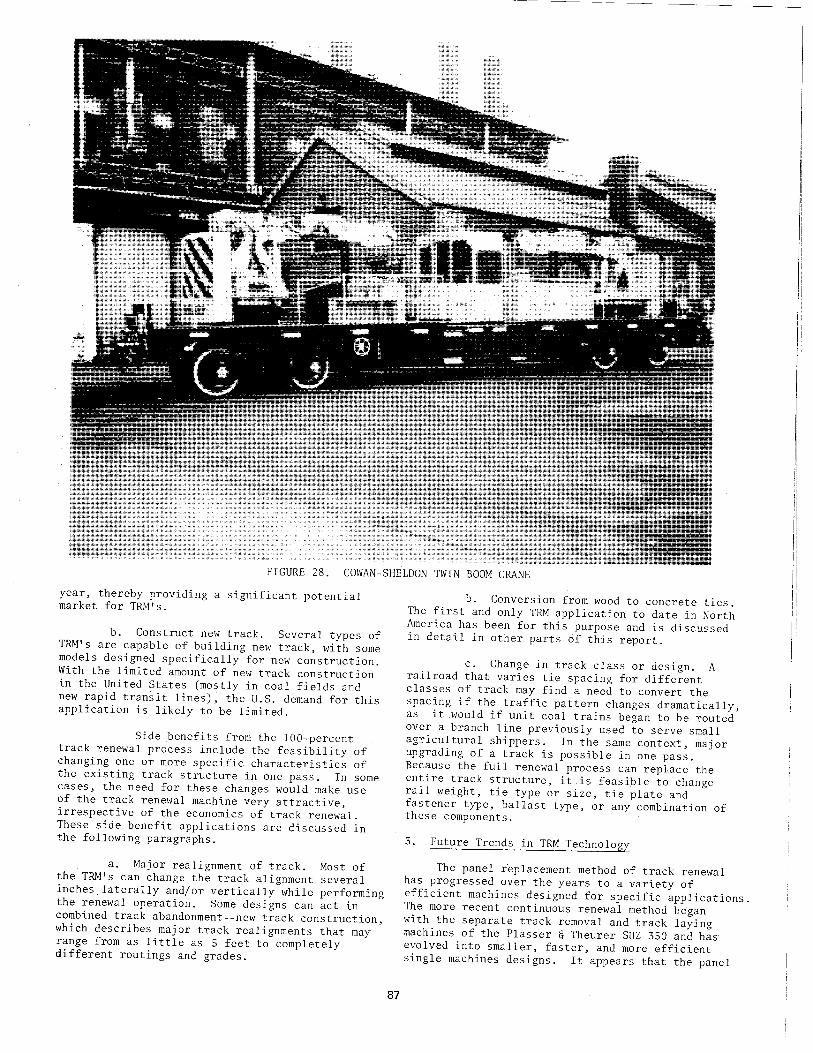
FIGURE 28. COWAN-SHELDON TWIN BOOM CRANE
year, thereby providing a significant potential market for TRM's.
b. Construct new track. Several types of TRM's are capable of building new track, with some models designed specifically for new construction. With the limited amount of new track construction in the United States (mostly in coal fields and new rapid transit lines), the U.S. demand for this application is likely to be limited.
Side benefits from the 100-percent track renewal process include the feasibility of changing one or more specific characteristics of the existing track structure in one pass. In some cases, the need for these changes would make use of the track renewal machine very attractive, irrespective of the economics of track renewal. These side benefit applications are discussed in the following paragraphs.
a. Major realignment of track. Most of the TRM's can change the track alignment several inches laterally and/or vertically while performing the renewal operation. Some designs can act in combined track abandonment--new track construction, which describes major track realignments that may range from as little as 5 feet to completely different routings and grades.
87
b. Conversion from wood to concrete ties. The first and only TRM application to date in North America has been for this purpose and is discussed in detail in other parts of this report.
c. Change in track class or design. A railroad that varies tie spacing for different classes of track may find a need to convert the spacing if the traffic pattern changes dramatically, as it ~ould if unit coal trains began to be routed over a branch line previously used to serve small agricultural shippers. In the same context, major upgrading of a track is possible in one pass. Because the full renewal process can replace the entire track structure, it is feasible to change rail weight, tie type or size, tie plate and fastener type, ballast type, or any combination of these components.
3. Future Trends in TRM Technology
The panel r-eplacement method of track renewal has progressed over the years to a variety of efficient machines designed for specific applications. The more recent continuous renewal method began with the separate track removal and track laying machines of the Plasser & Theurer SUZ 350 and has evolved into smaller, faster, and more efficient single machines designs. It appears that the panel
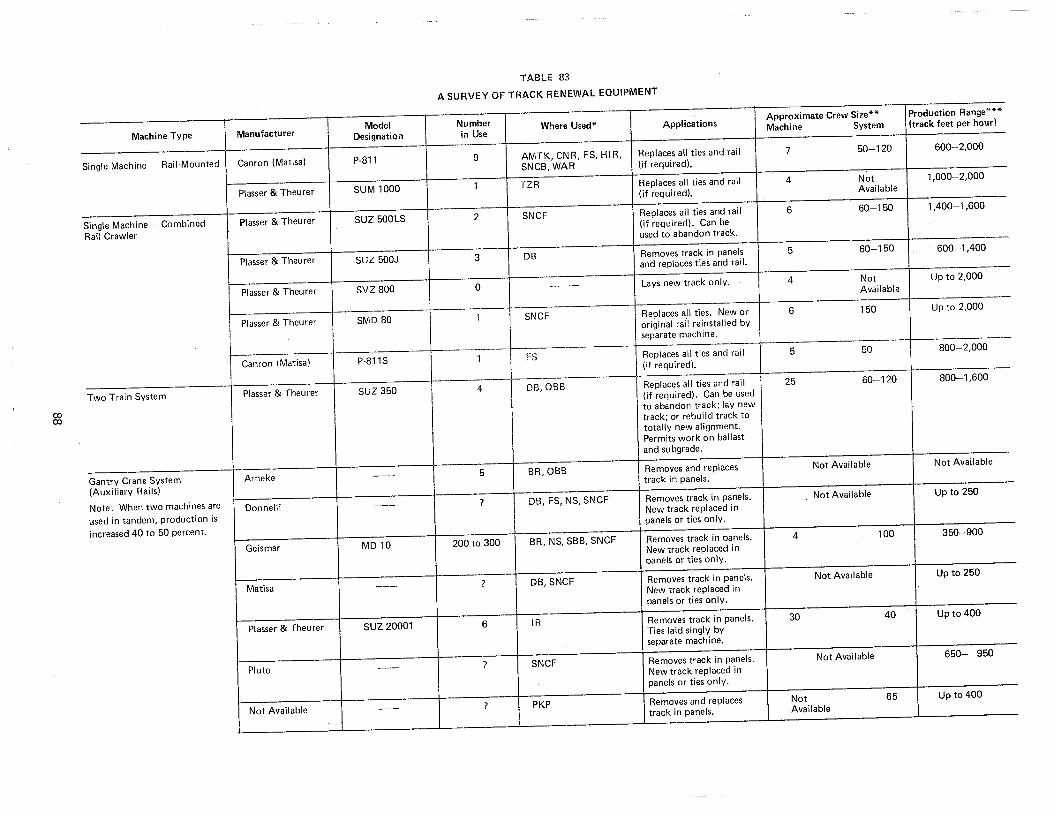
co co
Machine Type
-Single Machine - Rail-Mounted
Single Machine -Combined
Rail Crawler
Two Train System
Gantry Crane System (Auxiliary Rails)
Note: When two machines are
used in tandem, production is
increased 40 to 50 percent.
Manufacturer
Canron (Matisa)
Plasser & Theurer
Plasser & Theurer
Plasser & Theurer
Plasser & Theurer
Plasser & Theurer
Canron (Matisa)
Plasser & Theurer
Arneke
Donnelli
Geismar
Matisa
Plasser & Theurer
Pluto
Not Available
Model Designation
P-811
SUM 1000
SUZ 500LS
SUZ 500J
svz 800
SMD 80
P-811 S
suz 350
---
---
MD10
---
suz 20001
---
I
--- I
TABLE 83
A SURVEY OF TRACK RENEWAL EQUIPMENT
Number Where Used* Applications in Use
9 AMTK, CNR, FS, HIR, Replaces all ties and rail
SNCB, WAR (if required).
1 TZR Replaces all ties and rail (if required).
2 SNCF Replaces all ties and rai I (if required). Can be used to abandon track.
3 DB Removes track in panels and replaces ties and rail.
0 ---- Lays new track only.
1 SNCF Replaces all ties. New or
original rail reinstalled by
separate machine. , _______
}------
1 FS Replaces all ties and rail
(if required).
4 DB, OBB Replaces all ties and rail
(if required). Can be used
to abandon track; lay new
track; or rebuild track to
totally new alignment.
Permits work on ballast and su bgrade.
5 BR,OBB Removes and replaces track in panels.
? DB, FS, NS, SNCF Removes track in panels.
New track replaced in panels or ties only.
200 to 300 BR, NS, SBB, SNCF Removes track in panels.
New track replaced in panels or ties only.
? DB, SNCF Removes track in panels.
New track replaced in
panels or ties only.
6 IR Removes track in panels.
Ties laid singly by .separate machine.
? SNCF Removes track in panels.
New track replaced in
panels or ties only.
? PKP Removes and replaces track in panels.
Approximate Crew Size** Production Range***
Machine System (track feet per hour)
7 50-120 600-2,000
4 Not 1,000-2,000
Available
6 60-150 1,400-1,600
5 60-150 600-1,400
4 Not Up to 2,000
Available
6 150 Up to 2,000
5 50 800-2,000
25 60-120 800-1,600
Not Available Not Available
Not Available Up to 250
4 100 350-900
Not Available Up to 250
30 40 Up to 400
Not Available 650- 950
Not 65 Up to 400
Available - -- - -·· ------------
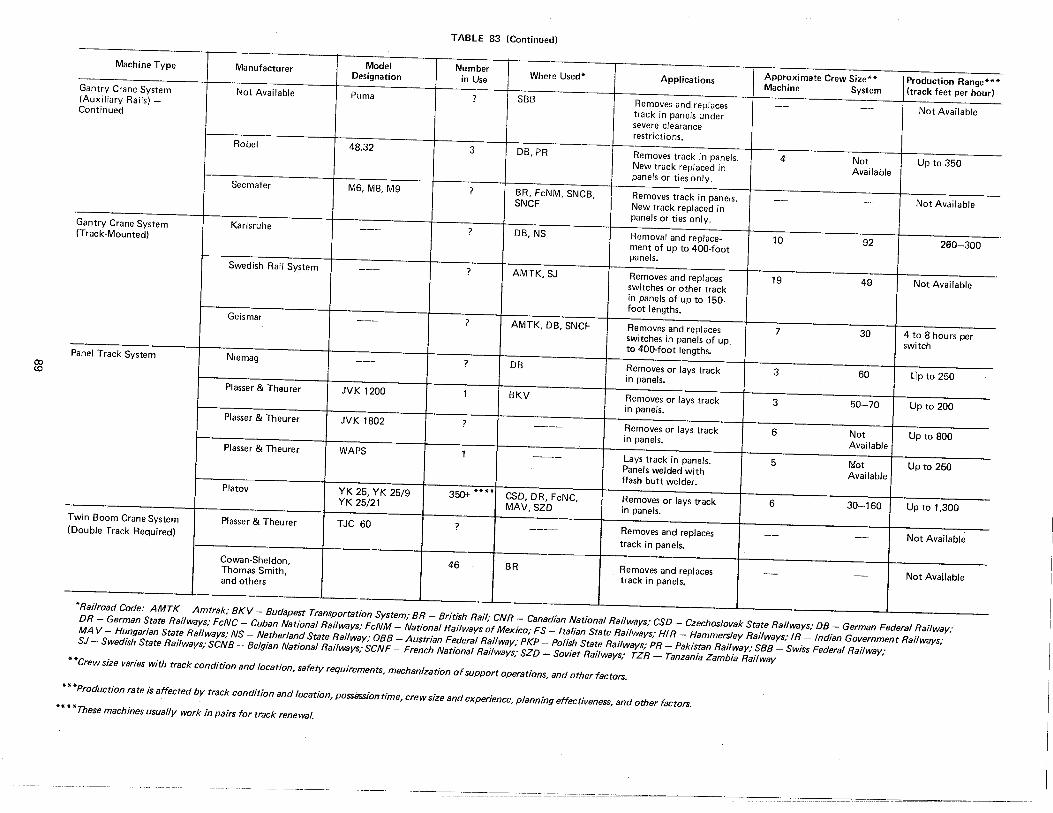
00 c.o
TABLE 83 (Continued)
Machine Type Manufacturer Model Number Where Used* Applications Approximate Crew Size** Production Range***
Designation in Use Machine System (track feet per hour)
Gantry Crane System Not Available Puma ? SBB Removes and replaces -- -- Not Available
(Auxiliary Rails) -track in panels under
Continued
severe clearance restrictions.
Robel 48.32 3 DB, PR Removes track in panels. 4 Not Up to 350 New track replaced in Available panels or ties only. Secmafer M6, M8, M9 ? BR, FcNM, SNCB, Removes track in panels. -- --- Not Available SNCF New track replaced in
panels or ties only. Gantry Crane System Karlsruhe --- ? DB,NS Removal and replace- 10 92 260-300 (Track-Mounted)
ment of up to 400-foot panels.
Swedish Rail System --- ? AMTK, SJ Removes and replaces 19 49 Not Available switches or other track in panels of up to 150-foot lengths.
Geismar --- ? AMTK, DB, SNCF Removes and replaces 7 30 4 to 8 hours per switches in panels of up switch to 400-foot lengths. Panel Track System Niemag --- ? DB Removes or lays track 3 60 L[p to 250 in panels. Plasser & Theurer JVK 1200 1 BKV Removes or lays track 3 50-·70 Up to 200 in panels. Plasser & Theurer JVK 1802 ? ---- Removes or lays track 6 Not Up to 800 in panels. Available P/asser & Theurer WAPS 1 ----- Lays track in panels. 5 ll!ot Up to 250 Panels welded with Available flash butt welder. Platov YK 25, YK 25/9 350+ **** CSD, DR, FcNC, Removes or lays track 6 30-160 Up to 1,300
YK 25/21 MAV, SZD in panels. Twin Boom Crane System Plasser & Theurer TJC 60 ? ----- Removes and replaces -- -- Not Available (Double Track Required)
track in panels. Cowan-Sheldon, 46 BR Removes and replaces -- -- Not Available Thomas Smith,
track in panels. and others
- - -------*Railroad Code: AMTK- Amtrak; BKV- Budapest Transportation System; BR- British Rail; CNR- Canadian National Railways; CSD- Czechoslovak State Railways; DB- German Federal Railway; DR- German State Railways; FcNC- Cuban National Railways,· FcNM- National Railways of Mexico; FS- Italian State Railways; HIR- Hammersley Railways; IR- Indian Government Railways; MA V- Hungarian State Railways; NS- Netherland State Railway; OBB -Austrian Federal Railway; PKP -- Polish State Railways; PR - Pakistan Railway; SBB - Swiss Federal Railway; SJ- Swedish State Railways; SCNB -- Belgian National Railways; SCNF- French National Railways; SZD- Soviet Railways; TZR- Tanzania Zambia Railway **Crew size varies with track condition and location, safety requirements, mechanization of support operations, and other factors.
***Production rate is affected by track condition and location, possession time, crew size and experience, planning effectiveness, and.other factors. ****These machines usually work in pairs for track renewal.
_·:::=..:==---- --- -----~------------··
and continuous methods will both continue to
improve with faster and more efficient machines.
But the currently faster continuous machines will
probably have the most improvements.
None of the track renewal machines presently
in use are designed specifically for the North
American market. North American applications
allow a larger clearance diagram and higher
permissible axle loads, which can lead to
simplification of the required operations, as well
as allow more operations to be performed by the
track renewal machine itself. Simplification
would improve machine availability and reduce the
crew size.
The major manufacturers have begun designing
machine components for installing wood ties with
cut spike fastenings. Most of the technology
required already exists on other machines, such
as the Canron rail changeout machine and the
Plasser automatic power wrench. An efficient
North American continuous track renewal machine,
capable of removing and installing all track
components with minimal support, is possible
within 5 years or less according to the major
manufacturers. The systems will have a maximum
production capacity of approximately 3,000 feet
per hour (1,846 wood ties installed at 19.5-inch
Direction of Work
Gantry Crane
R 1 Oper
Distribute
Anchors
Tie Cars (As Required)
Drive Spikes Set
(Automatic) Spikes
-----1[ ____ --
~ 1 Lab 2 Oper
Gantry Crane
~ 1 Qper
Install New Ral'l
~ 1 Lab
Install New Ties
1 Oper 1 Oper
centers) and should be able to average about
2,000 feet per hour (1,230 wood ties installed)
during operating times. The Canron P-811 owned
by Canadian National Railways operated at 2,640
feet per hour during a short test i.n 1979. While
that machine could not sustain such a pace for
more than an hour, it showed that a high production
rate should be attainable.
The on-track equipment and labor, as well as
support operations, for an Americanized track
renewal system built around a continuous renewal
single machine installing wood ties with cut spike
fastenings, is shown in figure 29. It should be
noted that the total crew required is approximately
50 percent of the crew shown for the Canron P-811
based system as shown in chapter II.
The system shown in figure 29 has only one
ballast undercutter-cleaner to keep up with a
TRM rebuilding track at 2,000 feet per hour. At
the present time, the largest ballast undercutter
cleaners are capable of 1,200 feet per hour
production rates, undercutting to a depth of 10
inches. Research is currently going into the
development of higher capacity machines. It is
possible to use two ballast cleaners to achieve
a higher production level to keep up with a
high-speed TRM.
Level Ballast
Pull Gage
or Bent
Spikes
~ 1 Oper
Lift
Remove
Anchors
~ 1 Oper
Automatic
Old Magnetic Pick Up and
Ties Storage of OTM
~~ 1 Oper 2 Lab
Pick Up Rollers
Prepare Cut-in/ Cut-out Place Rollers
Back Hoe Under Rails
~~~ ~}( 1 Oper
2 Lab 2 Lab
Automatic
Rail Spike
Lifting Removal
~ 1 Oper
Spike Driver
Anchor (for missed Ballast Compactor
Switch Tamper
Ballast Regulator
Production
Tamper Ballast Undercutter Push Cart App/ icators spikes)
~ ~ 1 Oper 1 Oper
~ 1 General Foreman
-~ ~ ~~~ ~ ~~~
1 Oper 1 Lab 2 Oper 1 Lab
2 Oper
1 Lab 1 Lab
~ 1 Project Engineer ~)? 2 Foremen ~ 1 Planning Engineer
FIGURE 29. FUTURE TRACK RENEWAL GANG INSTALLING WOOD TIES
· (Average production rate 2,000 feet per hour)
90
~ 1 Oper
V. TRACK RENEWAL MACHINE OWNERSHIP ALTERNATIVES
In preceding chapters, this report has explored the operation and economic implications of the track renewal method with respect to railroad ownership and operation. There are two other alternatives which will be discussed in this chapter: railroad leasing and operation and contractor ownership and operation of the equipment.
In the event that the track renewal method of track maintenance catches on in the United States, or track renewal machines are used to rebuild much of the track in need of major rehabilitation, there would be a large potential market for these machines. Railroad track maintenance consultant David R. Burns has estimated that a total potential North American market of approximately 50 track renewal machines would exist with full conversion to the track renewal method. About 40 of these machines could be operated by those individual railroads that are large enough (about 4,000 to 6,000 miles of track) to keep such machines busy over the machines' useful lifetimes. The remaining market would be for renewing trackage owned by smaller railroads and would require joint ownership, leasing, or contractor operation. Since some of the large railroads may prefer to use contractor services instead of their own machines, the possible market for contractors is more than 10 machines.
The difference between potential and actual demand will be affected by both the level of acceptance of the track renewal method for track maintenance and the economics for each railroad.
Ownership alternatives are discussed, with advantages and disadvantages, in the following sections.
1. Railroad Ownership and Operation
The major railroads have traditionally owned, or leased from banks and other investors, nearly all track maintenance equipment and operated this equipment with their own personnel. This approach is natural for equipment that will be fully utilized by a single railroad over the machine's life. Long-term equipment costs are less with outright ownership than by leasing for short periods. The railroad that owns track renewal equipment has full control over the scheduling of track renewal and can modify the equipment to fit specific needs.
As shown in chapter III, a railroad can save several million dollars a year by owning and operating track renewal machines to replace selective maintenance operations under a variety of conditions. But to realize such savings requires a long-term commitment to the track renewal method. Such a commitment entails some risk in that the method is new to North American conditions and the equipment is not yet tailored for cut spike track and American ballast conditions. Further, the life of the track structure under renewal conditions has not been studied.
91
The high turnover rate of track maintenance personnel and the difficulty in moving a trained force of supervisors, mechanics, and operators over a rail system would tend to keep a railroad track renewal system crew in a constant learning state that would keep down productivity. However, the track renewal method of track maintenance requires a smaller crew than the selective maintenance methods it would replace and the railroad could afford to pay premium wages to the 10 to 15 key operating personnel needed to keep the system operating properly.
Railroads with short work seasons and small railroads cannot utilize track renewal machines fully. Even if they can afford to purchase a machine and can justify it economically, some other alternative may be preferable.
2. Railroad Lease and Operation
A railroad that cannot fully utilize a track renewal machine but which can justify the track renewal method may prefer to lease a machine for a short term. Such an arrangement would allow northern railroads and short line railroads to use the method without having to justify the full equipment cost. The arrangement could be made by a northern railroad owning a machine and leasing it to a southern railroad during the winter season. Or the machine could be owned by a third party in a manner similar to private rail freight car ownership and leasing.
The risk to the railroad leasing the equipment would be minimized in that it does not have any money tied up in the expensive track renewal machine. The support equipment in the track renewal system, with the exception of a ballast undercutter-cleaner, is all standard track maintenance machinery that can be returned to selective maintenance at any time. The ballast cleaner can also be leased, as Amtrak and Canadian National have done in their concrete tie installation programs in past years.
A railroad that could justify buying a track renewal machine could avoid the long-term commitment that ownership implies by leasing a machine for part or all of just one season for a specific task. It could then evaluate the ramifications of track renewal without having a major investment in equipment influencing the decision.
Leasing a track renewal machine means that the railroad may finish using the machine before its personnel have learned how to use it efficiently. Also, the equipment probably could not be modified to fit local requirements and may not be available at the specific time desired by the railroad. Leasing charges would certainly be higher than capital recovery and maintenance costs if the equipment is owned, but these costs are a small portion of the total cost of track renewal.
3. Contractor Ownership and Operation
An ownership area in which interest has been
growing is contractor ownership and operation of track renewal .machines and perhaps entire track renewal systems. There is precedent for this in
Europe, where contractors perform the entire renewal process for several major railroads. At least one of these European contractors is currently studying the possibility of offering his
track renewal services in the United States. The
subject was also discussed in a paper presented to the General Contractors Association.*
A contractor owned and operated track renewal
machine or system could move around the country
to fully utilize the equipment, and the contractor
would train a crew that would stay with the machine or system. Such a crew should be able to
sustain a consistantly high production rate that would get the job done on a predictable schedule. It is difficult to say whether or not the cost to
the railroad would be comparable to railroad ownership or lease and operation.
*Presented by Mr. DavidS. Gedney, Associate Director, Office of Engineering, Northeast Cor
ridor Project, Federal Railroad Administration,
in February 1980, in Washington, D.C.
92
Small railroads already use contractors for
some or all track maintenance. Most large rail
roads use contractors for rail grinding, rail inspection, bridge construction, and other specialized work. The small railroads could certainly use contractors for track renewal. Larger railroads that do not want to commit themselves to long-term track renewal, or simply
find contractor economics advantageous, may have some difficulty with their labor agreements, especially if they wish to contract for an entire
track renewal system.
Contractor operation of track renewal reduces the railroad's control over its operations in that the contractor will want minimum track occu
pancy times guaranteed and must be supplied with
sufficient materials to perform each day's work. Considerable coordination must be maintained,
especially if the railroad supplies the support equipment and manpower in the system. These requirements are somewhat offset by the railroad's
ability to require minimum production levels and
track quality standards.

VI. CONCLUSIONS
This chapter summarizes the major findings of the analysis of track renewal systems and wood tie reuse and also identifies some areas for further study.
1. Summary of Findings
The principal findings of this study are 'Summarized below:
a. Under certain conditions, the track renewal method offers significant long-term cost savings in track maintenance over the selective maintenance method.
b. The first-year costs of track renewal are likely to be higher than those for selective maintenance. With track renewal, however, the result of first-year activities is a completely rebuilt track. Furthermore, if at least onethird of the ties have to be replaced, firstyear track renewal costs will be either equal to or less than those for selective maintenance.
c. Wood tie reuse is technically practical and economically feasible when combined with track renewal operations. This reuse, combined with the sale of scrap ties, provides a net material credit that has a significant impact on the cost savings associated with track renewal.
d. Track renewal reduces the amount of track occupancy time needed to perform maintenance work.
e. Completely renewed track has a better overall track structure over the life cycle of the track than selectively maintained track.
f. Track renewal technology has been advancing at a rapid rate in recent years, and this trend appears likely to continue such that future TRM' s wi1 1 achieve higher production rates with less labor and fewer support machines.
g. Although track renewal can produce large savings in labor and equipment costs, it does require a major planning effort and a commitment from management to operate successfully. A shortage of any material or a breakdown by any one of several key machines could have a serious impact upon the efficiency and cost-effectiveness of track renewal applications.
h. Based on the detailed economic framework and the sample analysis, it is evident that the framework itself should be a useful research tool for the U.S. railroad community to use for comparing the track renewal and selective maintenance methods. Given all the variables and options that exist in track maintenance procedures and real world applications, each railroad needs to consider the potential of track renewal from its own perspective.
93
2. Areas for Further Study
Track renewal and large-scale wood tie reuse have only recently begun in the United States and Canada. There is still very little direct experience to draw upon for determining the appropriate procedures, equipment designs, crew sizes, production rates, or planning requirements. Although some of these elements can be ascertained only through implementation, there are other areas of study that can be undertaken in the meantime that would help make the economic framework more precise and useful. The major areas are discussed below;
a. In this study, tie life was varied in several scenarios to see the economic effect that tie life has on the overall economics. Depending on the current average tie life, the long-term costs can be reduced by as much as $6,000 to $10,000 per mile if track renewal increases average tie life by about 20 percent. This increase, however, is an assumption, in that there is only a limited amount of data currently available on the service life of wood ties installed by the out-of-face method in North America. Accordingly, it is important to be able to answer the following ques ti.ons: \Vi 11 track renewal (as compared to selective maintenance) increase the service life of wood tics and, if so, under what conditions and for how long? In addition, what is the likely pattern of individual tie failures in renewed track over the life cycle?
b. Jt i.s essential to determine the optimal method of handling and processing wood ties removcci under track renewal and scheduled to be reused in track such that their remaining service 1 i fe can be maximized. Improper handling and processing can reduce the remaining life of used ties. lhe cost of studying alternative methods and developing reuse guidelines would probably pay for itself very quickly in added tie life.
c. What are the alternatives for profitably disposing of wood ties removed under track renewal but not destined to be reused in track? In the present study, a flat rate value of $2 per tie was assumed to be obtainable for each used wood tie not reused in track. A market study of used ties would be useful in itself if it could help railroads to develop more profitable markets for disposing of used wood ties.
d. What are the intermittent selective maintenance requirements likely to be under track rene\\'<ll? It was assumed in the framework that some wood ties would be replaced, the track resurfaced, and little else done during the long-term renewal cycle. The optimal maintenance schedule over the cycle should be determined so that longterm costs can be predicted more accurately.
e. What are the likely costs and benefits
to be derived from certain factors that have been
identified but not quantified in this study?
These factors include (1) the value of track
occupancy time to railroad operating departments
as well ·as engineering departments, (2) the value
of reduced energy consumption (if any) owing to
more even track quality under track renewal, and
(3) the value of reduced: equipment and lading
damage (if any) owing to more even track quality.
It should be noted that each of these factors
also can be applied to other study areas and, in
addition, should be of interest to the railroad
industry irrespective of the track renewal
application.
f. What are the U.S. railroad community's
preferences for performance, design, and safety
specifications for future track renewal machines?
All of the existing TRM designs have been created
for track renewal operations outside of North
America. The few North American machines are all
modified European machines. An industry-wide sur
vey of desired performance, design, and safety
specifications should be conducted, followed by
the development of a set of U.S. or North American
specifications that could be presented to manu
facturers interested in or willing to develop new
markets.
~U.S. GOVERNMENT PRINTING OFFICE: 1980-330"548/6659
94
g. Given the hypothetical nature of the
economic framework developed in this study, the
framework should be tested by one or severai rail
roads. The results should be used to strengthen
the framework's value as a research tool and
should be shared with the railroad community.
h. The economic framework is designed
for comparing the track renewal and selective
maintenance methods for maintaining existing
track. Comparable research tools should be
developed for determining the costs and bene
fits of using track renewal systems for abandon
ing track and for rebuilding badly deteriorated
track.
i. Similarly, additional study is
needed on the economic impact of TRM leasing
(rather than ownership) by the railroads, as
well as of the railroads contracting for track
renewal services from nonrailroad TRM owner
operators.
j. The present framework is based on the
assumed use of a particular TRM, the Canron P-811.
Depending upon the development of such interest
in the railroad community, it may be appropriate
to further modify the framework to reflect the
potential use of other designs.