U.S. rE PARTMENT - Federal Railroad Administration - Department ...
45
I l . U.S. rE PARTMENT llF TRANSPORTATION L fWLRllAD ADMINISTRATION H•f!U nr fTv ,,,.., -n .. ·::. ,,.d i- l J JULY 1978
-
Upload
khangminh22 -
Category
Documents
-
view
0 -
download
0
Transcript of U.S. rE PARTMENT - Federal Railroad Administration - Department ...
I
l .
U.S. rE PARTMENT llF TRANSPORTATION L fWLRllAD ADMINISTRATION
H•f!U nr fTv ,,,.., - n .. ·::. ,,.d i- l J
JULY 1978
TABLE OF CONTENTS Page
I troduction ................................................ ii
List of Rail-Highway Accident/Incident and Grade Crossing Inventory Tables .......................... iv
A cident/Incident and Grade Crossing Inventory Tables...... l
A pendix A Definitions and Forms .......................... 28
A pendix B Rail-Highway Accidents/Incidents Involving Motor Vehicles by State 1976, Revised ................... 38
...
i
In file mon Federal requirem of perso and pass passenge transit, railways
The of emplo injury t carry ou Railroad Act, as hazards rail .
Thi highway Class I report i grade er support promote Data in highway provides surround
Due January previous followin Highway Illness, definiti in then reported from the
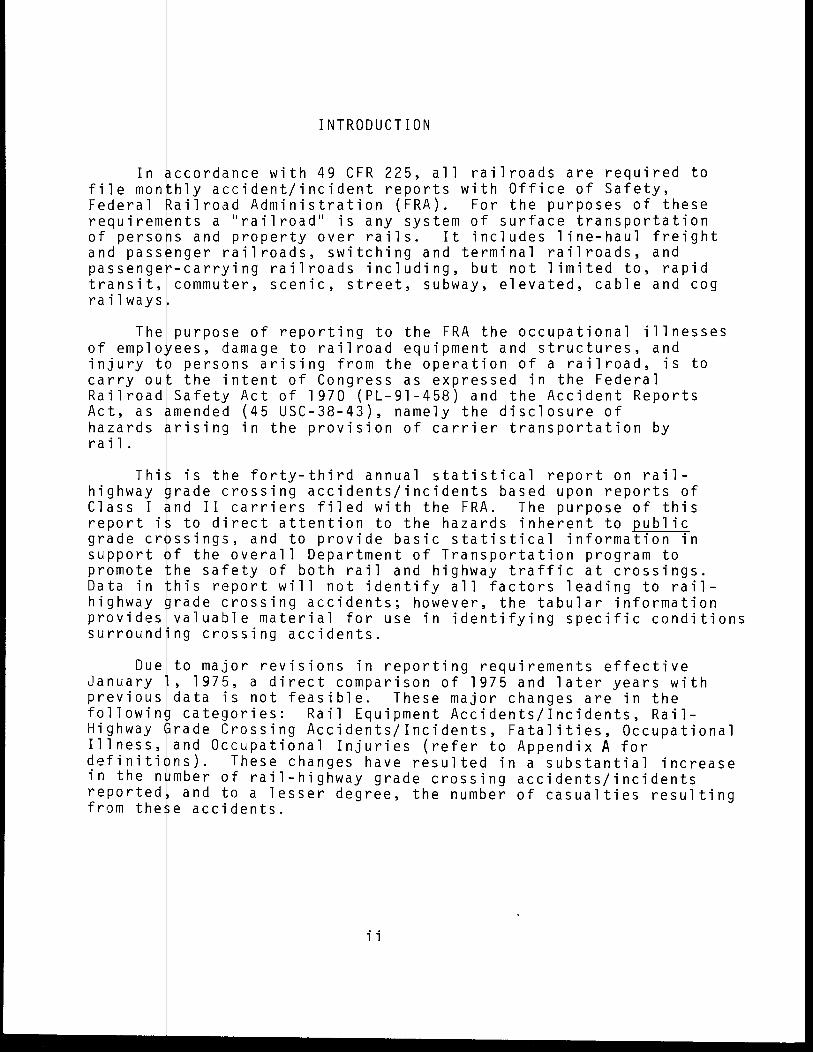
INTRODUCTION
ccordance with 49 CFR 225, all railroads are required to hly accident/incident reports with Office of Safety, ailroad Administration (FRA). For the purposes of these nts a "railroad" is any system of surface transportation sand property over rails. It includes line-haul freight nger railroads, switching and terminal railroads, and -carrying railroads including, but not limited to, rapid commuter, scenic, street, subway, elevated, cable and cog
purpose of reporting to the FRA the occupational illnesses ees, damage to railroad equipment and structures, and
persons arising from the operation of a railroad, is to the intent of Congress as expressed in the Federal
Safety Act of 1970 (PL-91-458) and the Accident Reports mended (45 USC-38-43), namely the disclosure of rising in the provision of carrier transportation by
is the forty-third annual statistical report on rail-rade crossing accidents/incidents based upon reports of nd II carriers filed with the FRA. The purpose of this
to direct attention to the hazards inherent to public ssings, and to provide basic statistical information in f the overall Department of Transportation program to he safety of both rail and highway traffic at crossings. his report will not identify all factors leading to rail-rade crossing accidents; however, the tabular information valuable material for use in identifying specific conditions ng crossing accidents.
to major revisions in reporting requirements effective , 1975, a direct comparison of 1975 and later years with data is not feasible. These major changes are in the categories: Rail Equipment Accidents/Incidents, Rail-
rade Crossing Accidents/Incidents, Fatalities, Occupational and Occupational Injuries (refer to Appendix A for ns). These changes have resulted in a substantial increase mber of rail-highway grade crossing accidents/incidents
and to a lesser degree, the number of casualties resulting e accidents.
i i
note grad tab l situ dupl 11 Ra i Stat The Rail
able Rail Cros Spri The fa l l
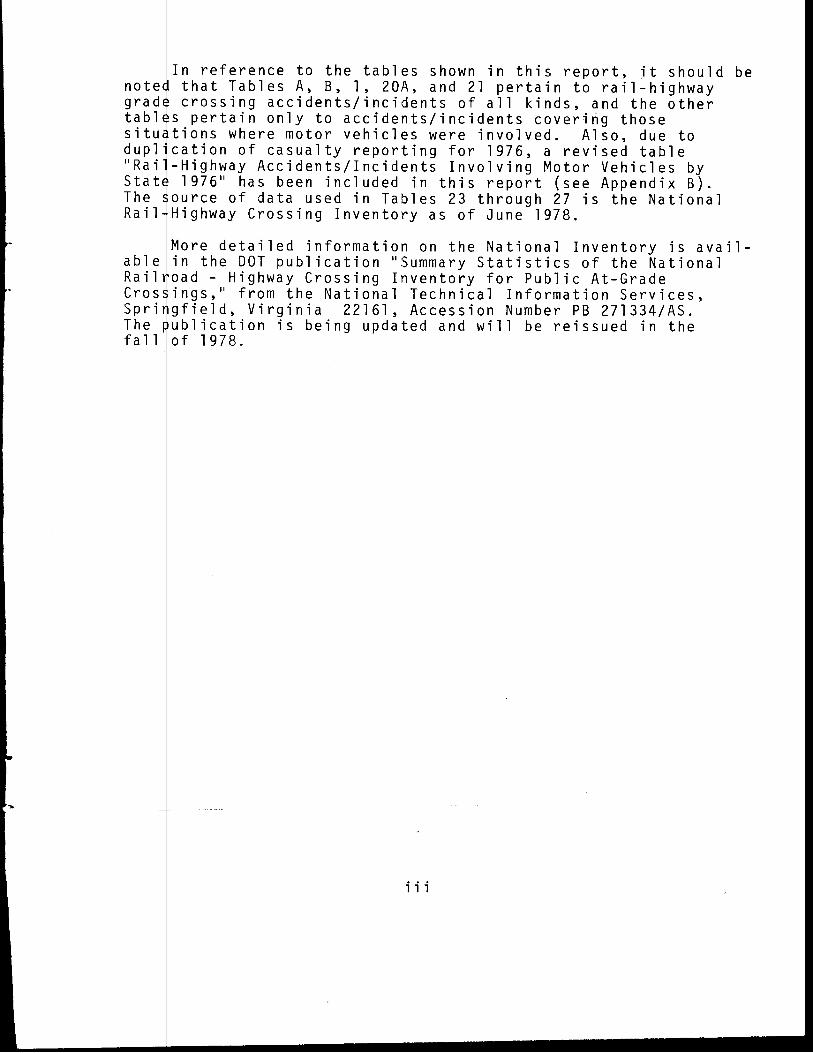
In reference to the tables shown in this report, it should be that Tables A, B, l, 20A, and 21 pertain to rail-highway crossing accidents/incidents of all kinds, and the other
s pertain only to accidents/incidents covering those tions where motor vehicles were involved. Also, due to cation of casualty reporting for 1976, a revised table -Highway Accidents/Incidents Involving Motor Vehicles by
1976 11 has been included in this report (see Appendix B). ource of data used in Tables 23 through 27 is the National Highway Crossing Inventory as of June 1978.
More detailed information on the National Inventory is avail-in the DOT publication "Summary Statistics of the National oad - Highway Crossing Inventory for Public At-Grade ings, 11 from the National Technical Information Services, gfield, Virginia 22161, Accession Number PB 271334/AS. ublication is being updated and will be reissued in the of 1978.
i i i
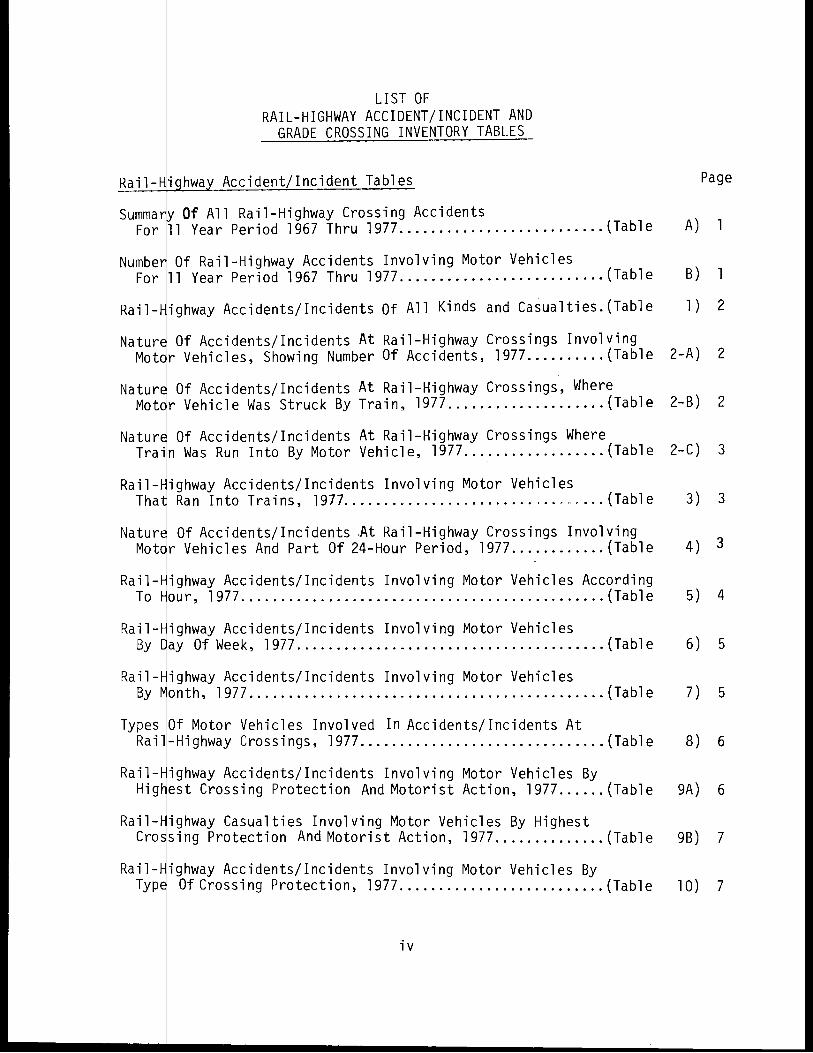
LIST OF RAIL-HIGHWAY ACCIDENT/INCIDENT AND
GRADE CROSSING INVENTORY TABLES
Accident/Incident Tables
Summar Of All Rail-Highway Crossing Accidents For 11 Year Period 1967 Thru 1977 .......................... (Table
Of Rail-Highway Accidents Involving Motor Vehicles 11 Year Period 1967 Thru 1977 .......................... (Table
Rail- ighway Accidents/Incidents Of All Kinds and Casualties.(Table
Of Accidents/Incidents At Rail-Highway Crossings Involving r Vehicles, Showing Number Of Accidents, 1977 .......... (Table
Of Accidents/Incidents At Rail-Highway Crossings, Where r Vehicle Was Struck By Train, 1977 .................... (Table
Natur Of Accidents/Incidents At Rail-Highway Crossings Where Train Was Run Into By Motor Vehicle, 1977 .................. (Table
Rail- ighway Accidents/Incidents Involving Motor Vehicles Tha Ran Into Trains, 1977 ................................. (Table
Of Accidents/Incidents .At Rail-Highway Crossings Involving r Vehicles And Part Of 24-Hour Period, 1977 ............ (Table
Rail- ighway Accidents/Incidents Involving Motor Vehicles According To our, 1977 .............................................. (Table
Rail- ighway Accidents/Incidents Involving Motor Vehicles By ay Of Week, 1977 ....................................... (Table
Rail- ighway Accidents/Incidents Involving Motor Vehicles By onth, 1977 ............................................. (Table
Types Of Motor Vehicles Involved In Accidents/Incidents At Rail-Highway Crossings, 1977 ............................... (Table
Rail- ighway Accidents/Incidents Involving Motor Vehicles By Hig est Crossing Protection And Motorist Action, 1977 ...... (Table
Rail- ighway Casualties Involving Motor Vehicles By Highest Crossing Protection And Motorist Action, 1977 .............. (Table
Rail- ighway Accidents/Incidents Involving Motor Vehicles By Typ Of Crossing Protection, 1977 .......................... (Table
iv
Page
A) l
B) l
l ) 2
2-A) 2
2-B) 2
2-C) 3
3) 3
4) 3
5) 4
6) 5
7) 5
8) 6
9A) 6
9B) 7
l O) 7
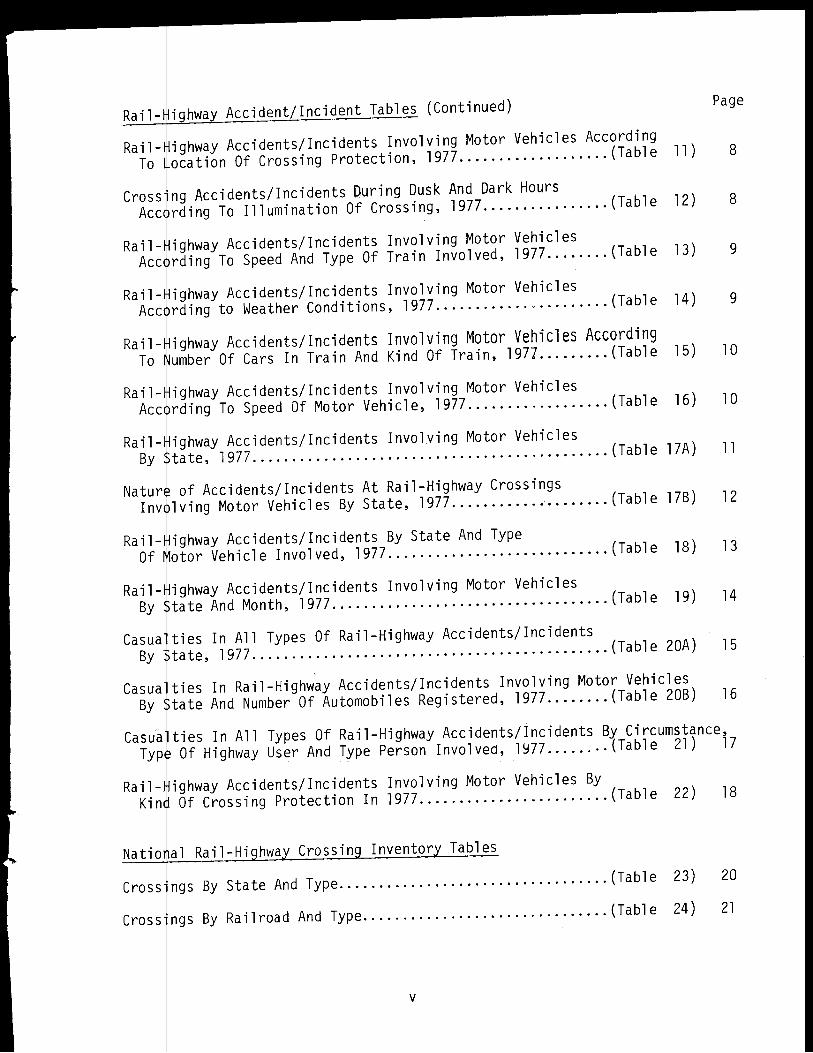
Rail- ighway Accident/Incident Tables (Continued) Page
Rail- ighway Accidents/Incidents Involving Motor Vehicles According To ocation Of Crossing Protection, 1977 ................... (Table 11) 8
Cross ng Accidents/Incidents During Dusk And Dark Hours Ace rding To Illumination Of Crossing, 1977 ................ (Table 12) 8
Rail- ighway Accidents/Incidents Involving Motor Vehicles Ace rding To Speed And Type Of Train Involved, 1977 ........ (Table 13) 9
Rail- ighway Accidents/Incidents Involving Motor Vehicles Ace rding to Weather Conditions, 1977 ...................... (Table 14) 9
Rail- ighway Accidents/Incidents Involving Motor Vehicles According To umber Of Cars In Train And Kind Of Train, 1977 ......... (Table 15) 10
Rail- ighway Accidents/Incidents Involving Motor Vehicles Ace rding To Speed Of Motor Vehicle, 1977 .................. (Table 16) 10
Rail- ighway Accidents/Incidents Involving Motor Vehicles By tate, 1977 ............................................. (Table 17A) 11
Natur of Accidents/Incidents At Rail-Highway Crossings Inv lving Motor Vehicles By State, 1977 .................... (Table 178) 12
Rail- ighway Accidents/Incidents By State And Type Of otor Vehicle Involved, 1977 ............................ (Table 18) 13
Rail- ighway Accidents/Incidents Involving Motor Vehicles By tate And Month, 1977 ................................... (Table 19) 14
Casua ties In All Types Of Rail-Highway Accidents/Incidents By tate, 1977 ............................................. (Table 20A) 15
Casua ties In Rail-Highway Accidents/Incidents Involving Motor Vehicles By tate And Number Of Automobiles Registered, 1977 ........ (Table 208) 16
ties In All Types Of Rail-Highway Accidents/Incidents By Circumstance, Of Highway User And Type Person Involved, 1977 ........ (Table 21) 17
Rail- ighway Accidents/Incidents Involving Motor Vehicles By Kin Of Crossing Protection In 1977 ........................ (Table 22) 18
Natio Cross ngs By State And Type .................................. (Table 23) 20
Cross ngs By Railroad And Type ............................... (Table 24) 21
V
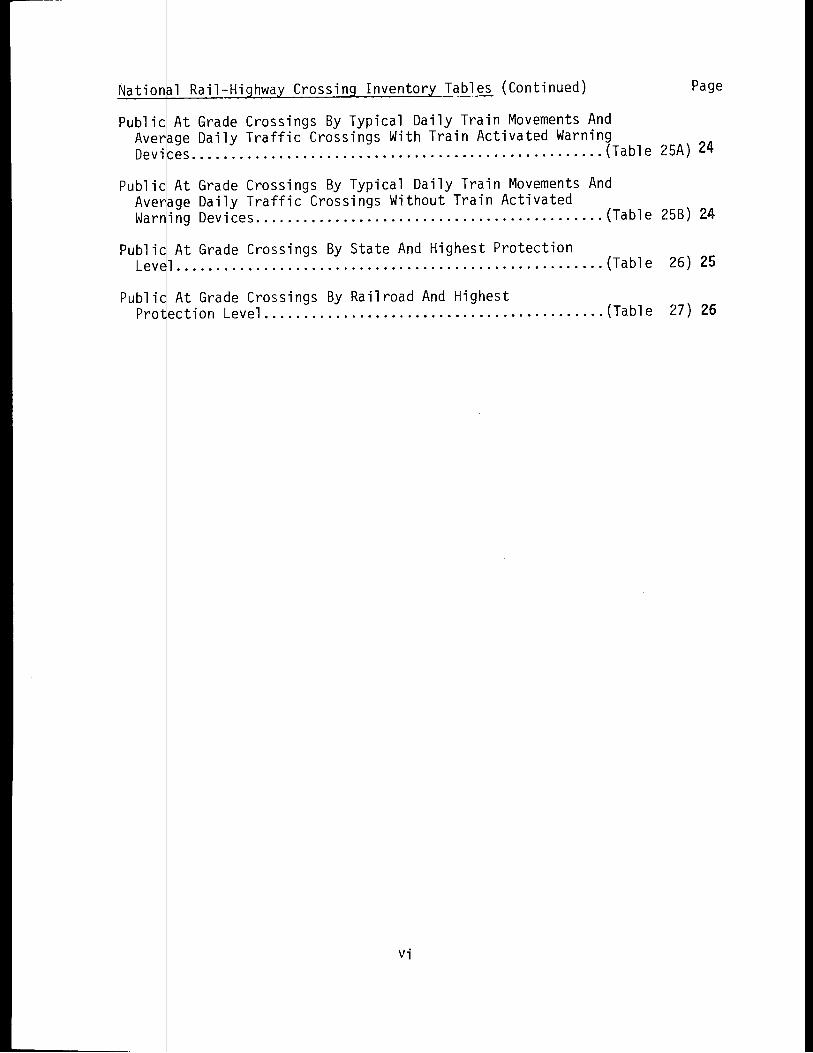
Nation~l Rail-Hiqhwav Crossinq Inventorv Ta_l?les (Continued) Page
Public At Grade Crossings By Typical Daily Train Movements And Average Daily Traffic Crossings With Train Activated Warning Devices .................................................... (Table 25A) 24
Public At Grade Crossings By Typical Daily Train Movements And Aver6ge Daily Traffic Crossings Without Train Activated Warning Devices ............................................ (Table 258) 24
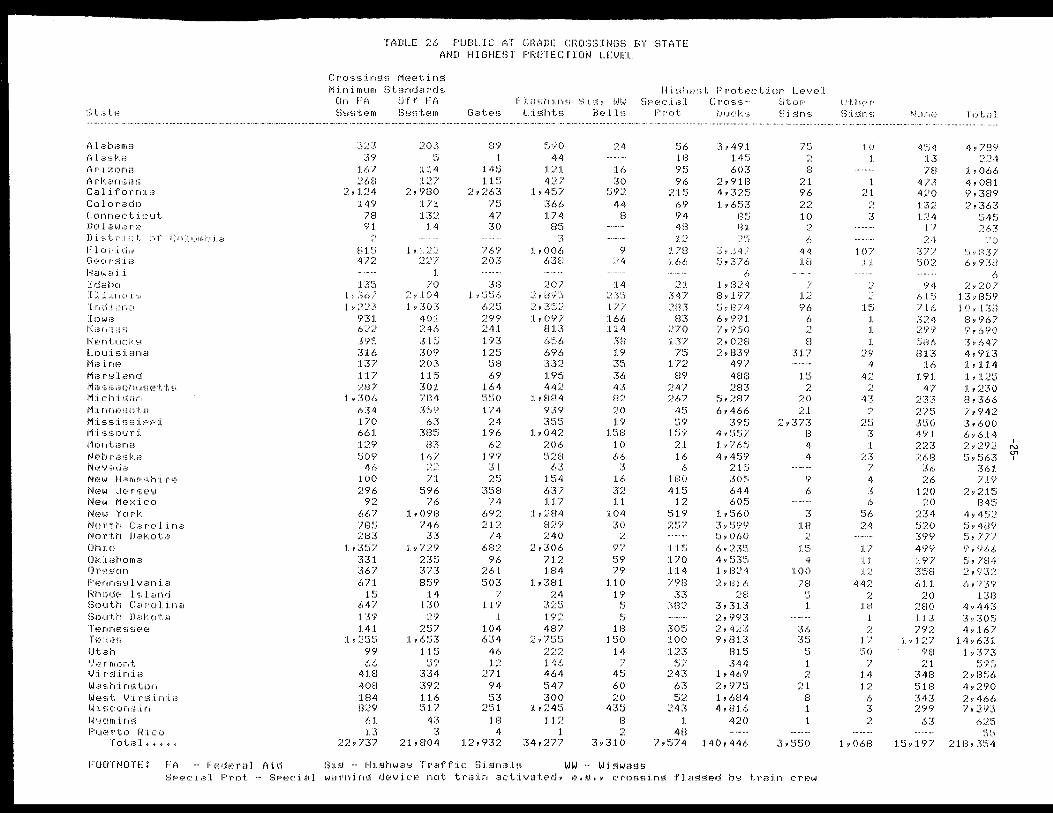
Public At Grade Crossings By State And Highest Protection Level ...................................................... (Table 26) 25
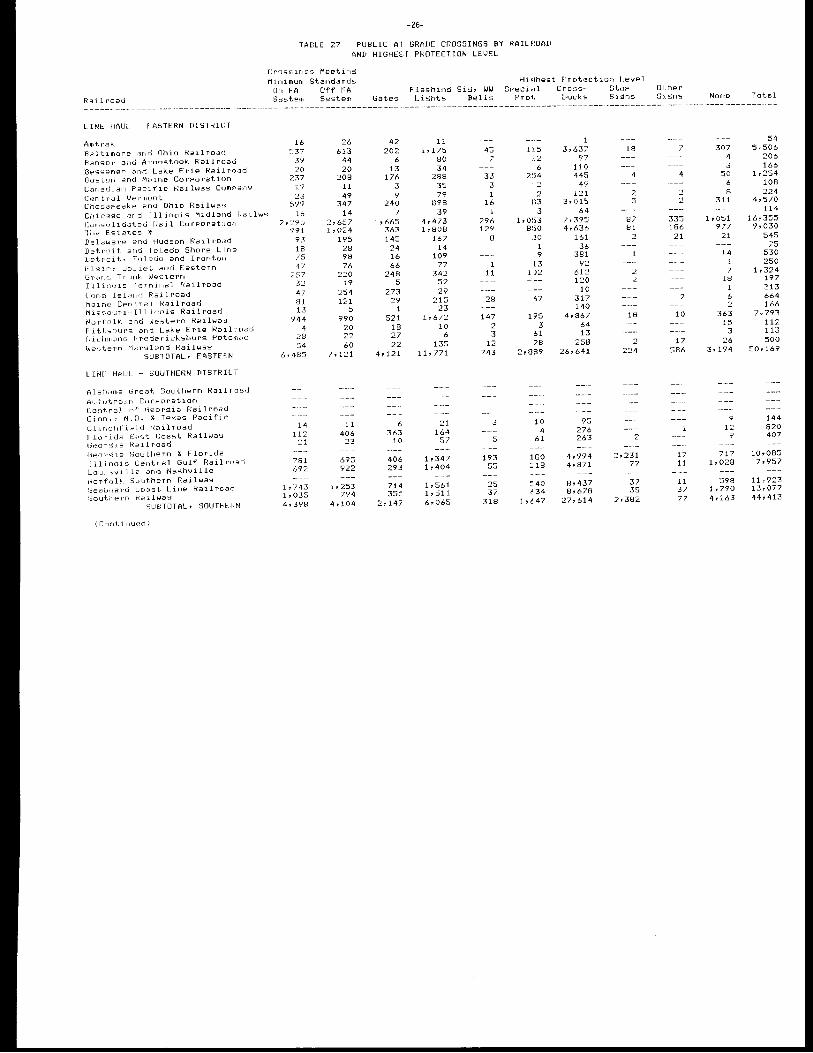
Public At Grade Crossings By Railroad And Highest Protection Level ........................................... {Table 27) 26
Vi
Year
1967 1968 1969 1970 1971 1972 1973 1974 1975 1976 1977
Year
1967 1968 1969 1970 1971 1972 1973 1974 1975 1976 1977
(1)
-1-
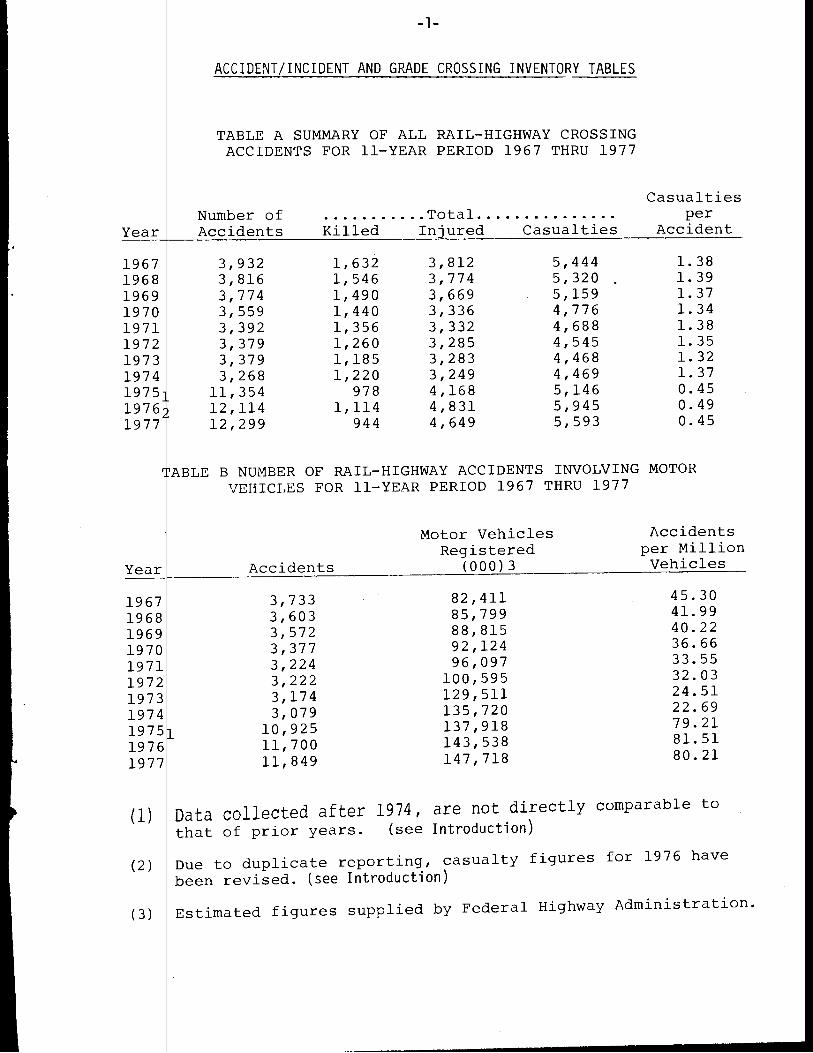
ACCIDENT/INCIDENT AND GRADE CROSSING INVENTORY TABLES
TABLE A SUMMARY OF ALL RAIL-HIGHWAY CROSSING ACCIDENTS FOR 11-YEAR PERIOD 1967 THRU 1977
Number of ........... Total ............... Accidents Killed Injured Casualties
3,932 1,632 3,812 5,444 3,816 1,546 3,774 5,320 3,774 1,490 3,669 5,159 3,559 1,440 3,336 4,776 3,392 1,356 3,332 4,688 3,379 1,260 3,285 4,545 3,379 1,185 3,283 4,468 3,268 1,220 3,249 4,469
11,354 978 4,168 5,146 12,114 1,114 4,831 5,945 12,299 944 4,649 5,593
ABLE B NUMBER OF RAIL-HIGHWAY ACCIDENTS INVOLVING VEHICLES FOR 11-YEAR PERIOD 1967 THRU 1977
Motor Vehicles Registered
Accidents (000)3
3,733 82,411 3,603 85,799 3,572 88,815 3,377 92,124 3,224 96,097 3,222 100,595 3,174 129,511 3,079 135,720
10,925 137,918 11,700 143,538 11,849 147,718
Casualties per
Accident
1. 38 1. 39 1. 37 1. 34 1. 38 1. 35 1. 32 1. 37 0.45 0.49 0.45
MOTOR
Accidents per Million Vehicles
45.30 41. 99 40.22 36.66 33.55 32.03 24.51 22.69 79.21 81.51 80.21
Data collected after 1974, are not directly comparable to
that of prior years. (see Introduction)
(2) Due to duplicate reporting, casualty figures for 1976 have been revised. ( see Introduction)
(3) Estimated figures supplied by Federal Highway Administration.
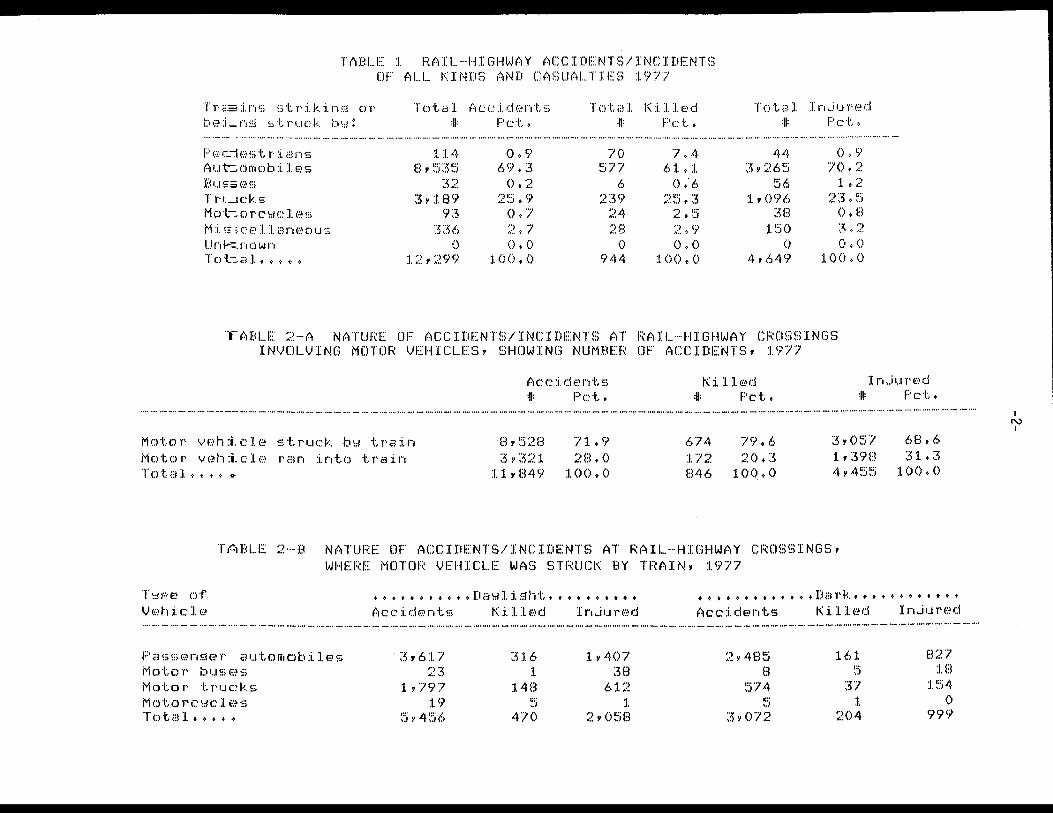
TABLE 1 RAIL-HIGHWAY ACCIDENTS/INCIDENTS OF ALL KINDS AND CASUALTIES 1977
Tra3ins striking or bei_ng struck bs:
i::· ,,? c7 <·,: ,,; t r- :i. an 1,;
B1..11:~f,!S T r-1._1ck ~; M Cl 'l-: o r-c '::I cl<~ i,; M :i. '=; C:(•:! 11 an<-:!Cll.J·::; Unl-=.nnwn TDt--:.al ••• , .•
TDtal Accidents t Pct.
114 0.9 535 69.3
32 0.2 3,189 25.9
93 0.7 336 2.7
0 o.o 12,299 100.0
TDtal Killed t Pct.
70 7.4 5// 61.1
6 o;6 239 25.3
24 ,.J 28 2.9
0 o.o 944 100.0
Tntal InJur-ed t Pct.
44 0.9 3,265 70.2
56 1.2 1,096 23.5
38 o.a 150 3,2
0 o.o 4,649 100.0
'TABLE 2-A NATURE OF ACCIDENTS/INCIDENTS AT RAIL-HIGHWAY CROSSINGS INVOLVING MOTOR VEHICLES, SHOWING NUMBER OF ACCIDENTS, 1977
Accidents t Pct.
K:i. lle-!d J:njuri,:~d :fl: Pct. :II: Pct•
------------------------------------------------------------------------------------------Motor v c-:-i h :i. c l f? 1,; t, r 1.J c k b !,1 t. r- a :i. n 8, !:.'i2B 71.9 674 79.6 3 ,O:".i7 Motci T' V(-:!h :i.c:-lc-:,, ran :i.nt.o tr-a:i.n 3,321 2!:l.O 172 20 + 3 1, 3<1B Total,••• ... 11, B49 :1.00 .o B46 l 00 • 0 4, 4~5'.:i
TABLE 2·-B NATURE OF ACCIDENTS/INCIDENTS AT RAIL-HIGHWAY CROSSINGS, WHERE MOTOR VEHICLE WAS STRUCK BY TRAIN, :1.977
t>B. 6 ~H .3
:I.()().()
T!:IF--f:! Df V ~'! h :i. c- l f:~
•••••••••• • Da-::tl:i.:~.tht+. + +. +. + +. + ••• + •••••••• Dark • ••••• + ••••
Ace :i. r.:lc-:~nts Ki 1 le-!d In..iurf,!d Ace :i. de-!nts Killf?d In,.iuri:,id -------------------------------------------------------------------------------------------Passenser automobiles 3,617 3:1.6 1,407 2,485 161 B27 Motor buses 23 :I. 3B B J 1B Mot.or trucks :1.,797 :1.48 6:1.2 574 37 154 Motorc~cles 19 J 1 J :I. () Tot.al ••••• 5,456 470 2,058 3,072 204 999
I N I
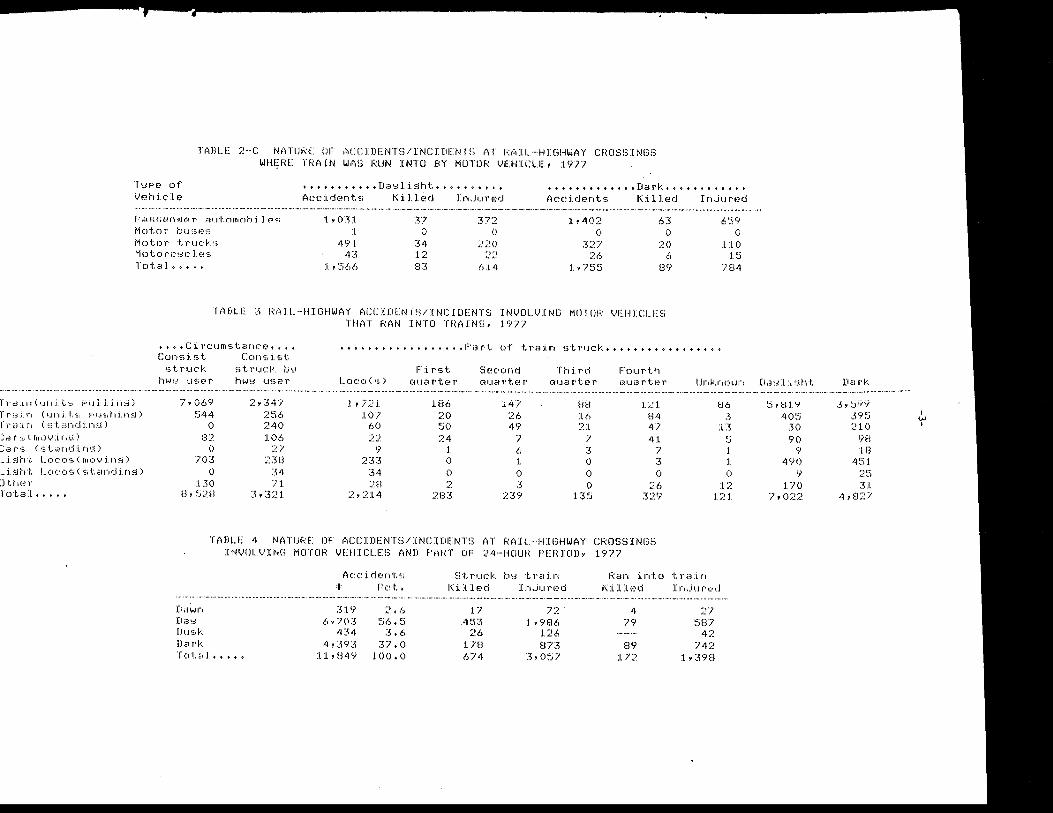
TABLE 2-C NATURE OF ACCIDENTS/INCIDENTS AT RAIL-HIGHWAY CROSSINGS
Ti,IPE! of VE!h i cl E!
+ ••• +. t • +Da~:tl:i.~.~tht+. '°' •• t + + + •••••••••••• • Dark ••••••••••••
P ,:~~;~:;.f'.-~n-:t,:.~ r ~, 1t,·~mnh ·i J f-"'<:;
Motor bu·;:;f:,s. Motor trucks Mot.CJ rc~:Jc 1 <:·~·::; Tot..aJ •••• t
Ace i. dE!ntf.;
t-031 1
491 43
1,566
KillE!d
T? 0
34 12 83
I r,,.iured
372 ()
220 22
614
Accidents
1,402 0
327 26
1,755
Kil l<~d
63 ()
20 (:,
89
TABLE 3 RAIL-HIGHWAY ACCIDENTS/INCIDENTS INVOLVING MOTOR VEHICLES THAT RAN INTO TRAINS, 1977
In...it..1rf~d
6~:-.;9 ()
l 10 l ~:_=;
/B4
•••• Circumstance •••• ++tvt+t+•t•••••t•+Part of tr<:3::in ~>tr1.Jck.++++++++•+••+++•• Consist Co11sist
~5-truck hwt, u~:;t~r'
struck b~ hw~, user l...oco(s)
First Cll..lart"''l'
Sf:-~cond Cll..laT'tf,!r
Thi.I'd <l'.Ja rte r
Fourth uua r~t<-:~ T' Unknown Dawlisht
r 1 · <:~ .i. I I ( U f I .i. i_. ~:> i-°' U } 1 i f"I !.:i )
1·raj_n (units Pustlj.ns) Train (standinS) :::ar~:~ ( n,ovinJ,;.t) l:a rs; (st.and :i. n~_:_i) _ist,t lacos<IT,c)vir)S) !_isht L_oc:as(standir)S) Dthr:;r fotal •••••
7, 0(.)9 544
0 82
0 703
0 130
8,528
2,349 256 240 106
27 238
34 71
3,321
J., 72J 107
60 22
9 233
34 2B
2,214
186 20 50 24
1 0 0 2
283
147 ~!f., 49
7 6 1 ()
3 23?
BH 16 21
7 3 () ()
0 1 :5:5
l~l 84 47 41
7 3 0
26 329
U6 3
13 1::· ,.!
1 l ()
12 121
TABLE 4 NATURE OF ACCIDENTS/INCIDENTS AT RAIL-HIGHWAY CROSSINGS INVOLVING MOTOR VEHICLES AND PART OF 24-HOUR PERIOD, 1?77
Da~n Da~ Dusk Dark Total •• +•~
Accidents t Pct,
319 6,703
434 4,393
11,849
2+6 56.5 3,6
37,0 100,0
Struck bw train Killed InJured
l/ 453
26 17B f.,74
72 1,98(:,
126 873
3,057
Ran into train Killed InJured
4 7'l
B9 172
:n '.507
4':> 742
l, :39B
~,Hl.Y 405
30 90
9 490
9 170
7,022
Dari<.
J,~99 395 210
98 1B
451 ,.,.::· ,.,~·. ,.} 31
4,!327
I w I
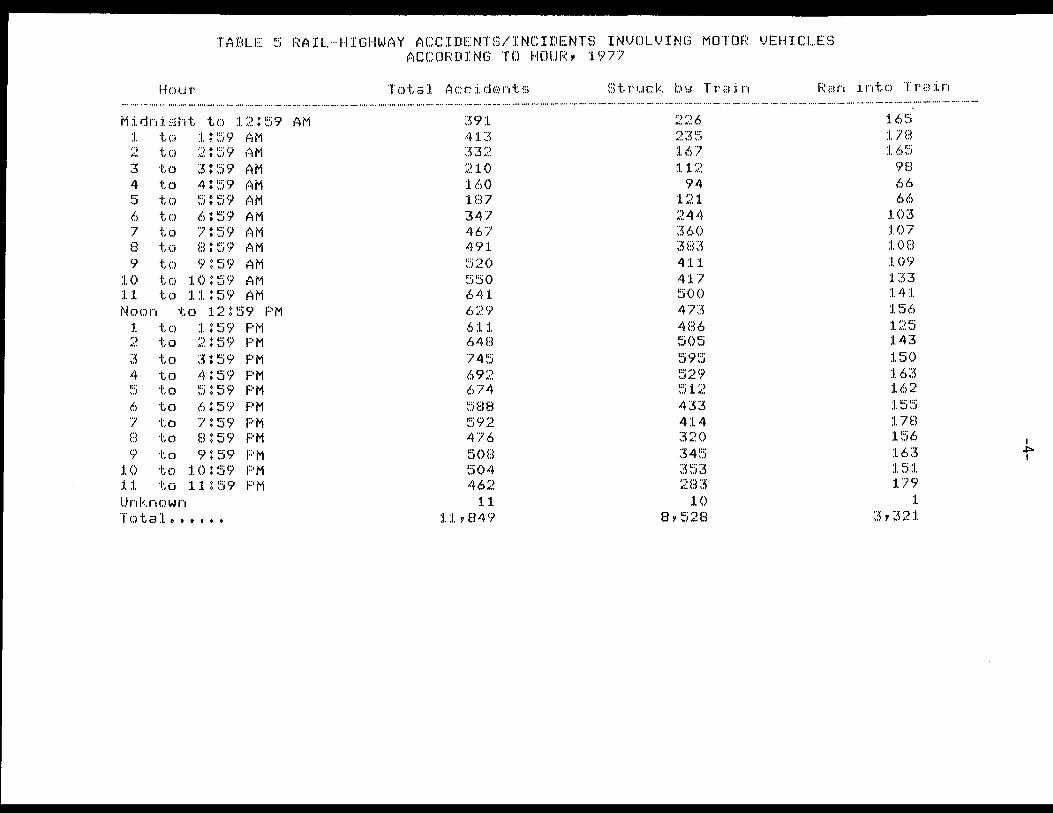
TABLE 5 RAIL-HIGHWAY ACCIDENTS/INCIDENTS INVOLVING MOTOR VEHICLES ACCORDING TO HOUR, 1977
Hour T Dta l ,~cc i d(-:-int~; \:;t T'UCk b\~ T T'a in F: an i r, t n T r a :i. n ------------------------------------------------------------------------------------- .
Midnisht to 12:59 AM 391 226 165 1 to 1:59 AM 413 235 178 ' to 2:59 AM 332 167 165 3 to 3:59 RM 210 112 4 to 4:59 AM 160 94 66
to 5:59 AM 187 121 66 6 to 6:59 AM 347 244 103 7 to 7:59 AM 467 360 107 8 to 8!59 AM 491 383 108 9 to 9:59 AM 520 411 109
10 to 10:59 AM 550 417 133 11 to 11:59 AM 641 500 141 Noon to 12:59 PM 629 473 156
1 to 1:59 PM 611 486 125 ' to 2:59 PM 648 505 143 3 to 3:59 PM 745 595 150 4 to 4:59 PM 692 529 163 5 to 5:59 PM 674 512 162 6 to 6:59 PM 588 433 155 7 ta 7:59 PM 592 414 178 8 to 8:59 PM 476 320 156 9 to 9:59 PM 508 345 163
10 to 10!59 PM 504 353 151 11 to 11:59 PM 462 283 179 Unknown 11 10 1 Total •••••• 11,849 8,528 3,321
I
I
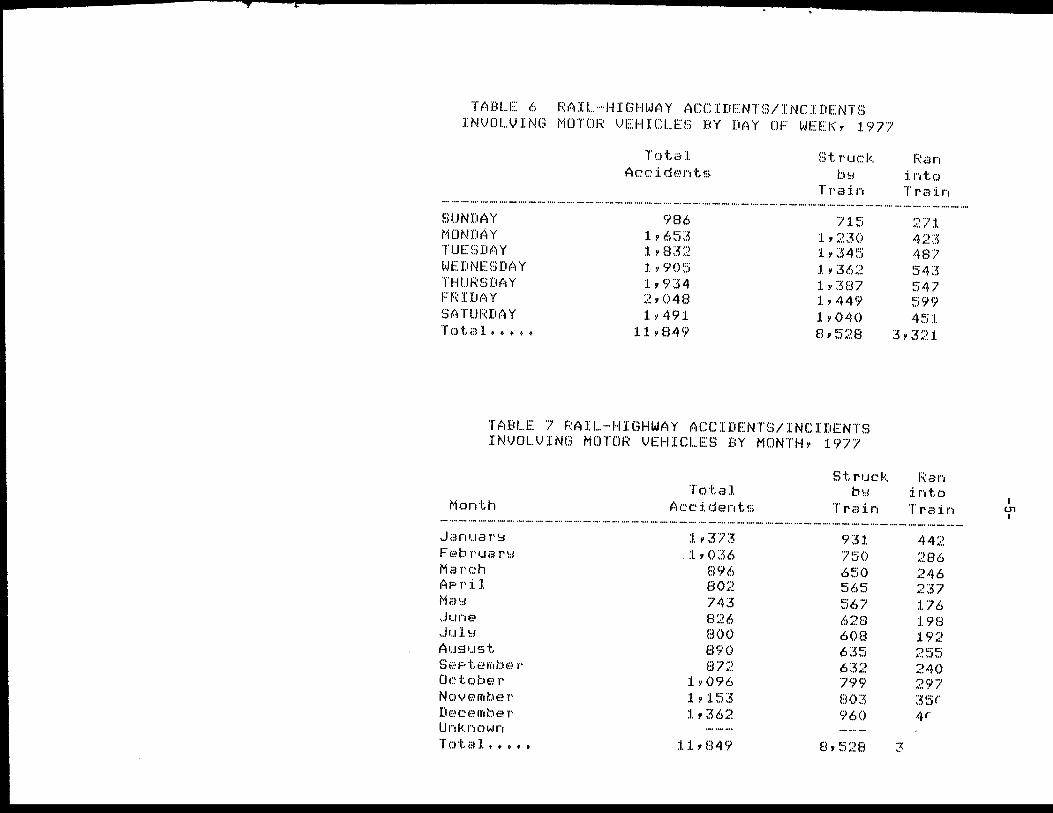
TABLE 6 RAIL-HIGHWAY ACCIDENTS/INCIDENTS INVOLVING MOTOR VEHICLES BY DAY OF WEEK, 1977
SUNDAY MOND~Y TUESDAY WEDNESDAY THURSDAY FRIDAY SATURDAY Tota:t. •••••
Total Acc:i.d<-,)nti;;
Struck b!:I
Tr,3in
li:an j_nto Tra:i.n ·--------------------------------------
986 715 271 1,653 1,230 423 1,832 1,345 487 1,905 1,362 543 1,934 1,387 547 2,048 1,449 599 1,491 1,040 451
11,849 8,528 3,321
TABLE 7 RAIL-HIGHWAY ACCIDENTS/INCIDENTS INVOLVING MOTOR VEHICLES BY MONTH, 1977
Struck Ran TcJtaJ. bhl into
Month Ace i dr,:~nti;; Train Train ---------------------------------------Januarhl 1,373 931 442
Februarhl 1,036 750 286 March 896 650 246 APri:t. 802 565 237 Mahl 743 567 176 June 826 628 198 Julhl 800 608 192 Ausust 890 635 SePtember 872 632 240 October 1,096 799 297 November 1,153 803 35( December 1,362 960 4r Unknown Total ••••• 11,849 8,528 3
I u, I
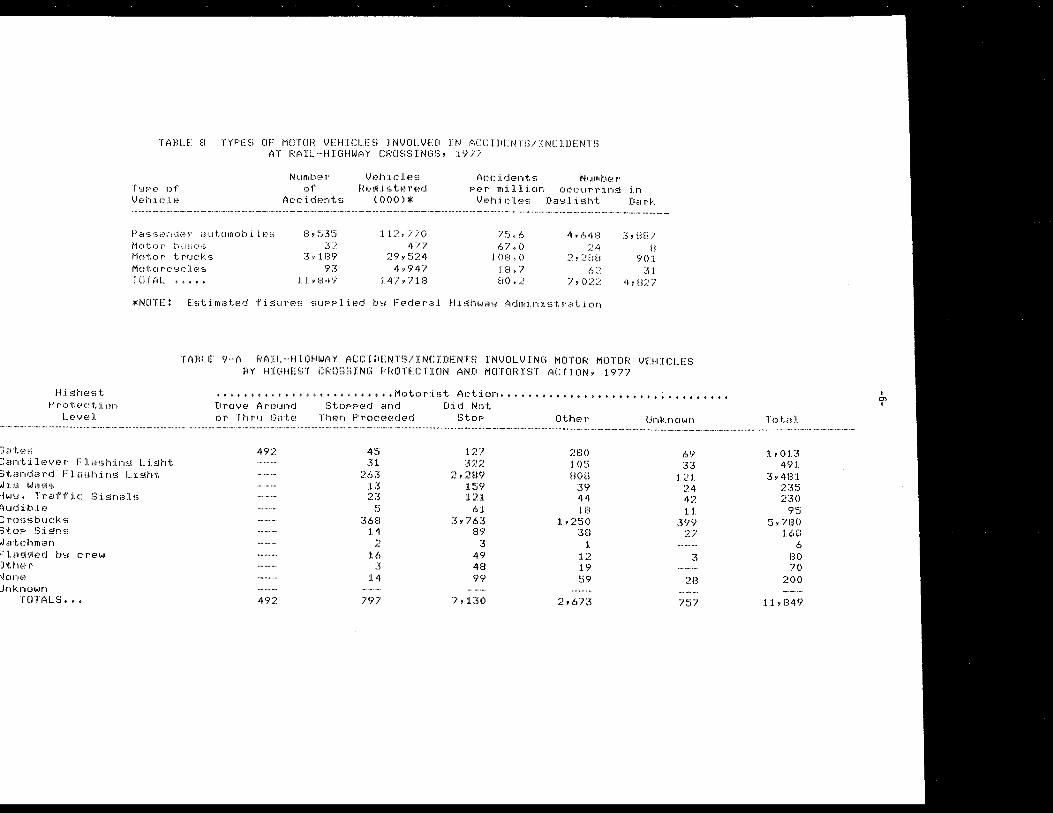
TABLE 8 fYPES OF MOTOR VEHICLES INVOLVED IN ACCIDENTS/INCIDENlS AT RAIL~HIGHWAY CROSSINGS, 19/7
T!sPf: Clf Vtc:h i. cl f.;
F·'a!;se1··1~er a1~tc)1~obiles Mc>t,Jr buses Motor trucks McJtcirc~c~:Les ·ro·rAL .••••
Number cf
Accidents
E~,~35 32
3,189 93
11,849
Vehicles Reaistered
(000)*
112,770 477
29,524 4,947
147,718
Accidents Per million
Vehicles
75.6 67,0
108,0 18,7 80,2
Number occurrina
Dawliaht
4,648 24
2,2l:~8 62
7,022
*NOTE Estimated fiaures SUPPiied bw Federal Hiahwaw Administration
:i.n Dark
3,887 8
901 31
4,827
TABLE 9-A RAIL-HIGHWAY ACCIDENTS/INCIDENTS INVOLVING MOTOR MOTOR VEHICLES BY HIGHEST CROSSING PROTECTION AND MOTORIST ACTION, 1977
::JiBt<:.?S
Hiahest ~rotectio1·)
Level
Cantilever Flashina Liaht 3tandard Flashina Liaht W :i. !=.i Wa9~:; ~w~. Traffic Sisnals 'i• . .1di.blf.; :: ro~:>sbucl.-:.s ~:)top ~3:i.8n~:; ,Jatchman ::· 1 aaae(.l b~i craw :Jth<:,r '!or-.." .Jnknown
TOTALS,,,
+,., • •. t."'. +. + •• + •••• t. + +Mc>tor:i.~;t Act:i.c:>n+ •• + ••••••••••••• • ••• •. • •••••••• •
Drove Around or Thru Gate
492
4'n
Stopped and Then Proceeded
4~j 31
263 L3 23
c:· ,J
36B l 4
2 16
3 14
797
Did Not St.DP
127 322
2,2B9 159 121
61 3,763
89 3
49 48 99
7,130
OthE,r
2BO 105 BOB
39 44 1B
1,250 38
1 1? 19 59
2,67:5
Unknown
69 33
121 24 4? 11
399 27
3
2B
757
Total
1,013 491
3,481 235 230
95 5,780
168 6
80 70
200
11,849
I CTI I
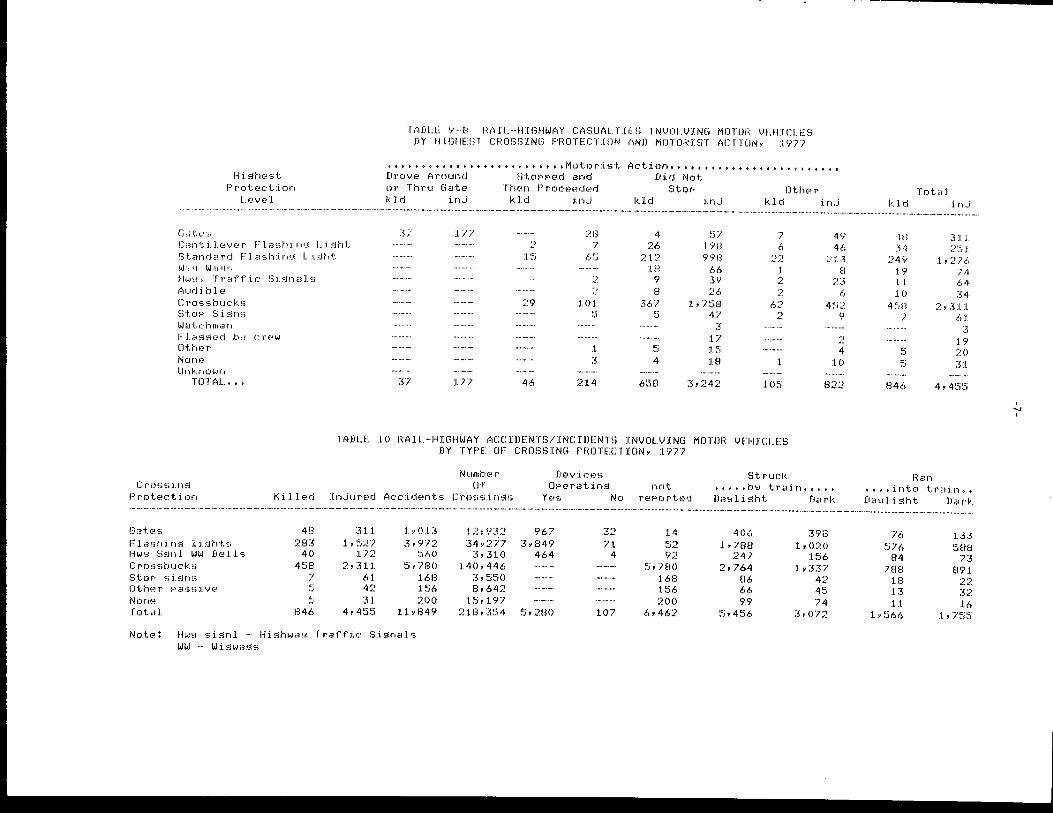
TABLE 9-B RAIL-HIGHWAY CASUALTIES INVOLVING MOTOR VEHICLES BY HIGHEST CROSSING PROTECTION AND MOTORIST ACTION, 1977
Gates
Hiahest Protection
Level
Cantilever Flashina Liaht Standard Flashi1·)g L.i~t,t W:Lg Wa~s Hw~. ·rraffic Si~11i~ls Audible Crossbucks StoP Si~r)S Watchman Flaaaed bw crew Other None Unknown
TOTAL,,,
Drove Around or Thru Gate kld inJ
3/ 177
Tl 177
Stopped and Then Proceeded kld inJ
2 l ~7j
29
46
'..!O 7
6~5
,., .{.,
:~ 101
i;:· ,.J
1 ;5
214
••• •••• •• •• t. Dir..! Not
Stop kld inJ
4 26
;:>-i.? :I. B
9 e
367 5
i::· ,J
4
6'.5B
57 190 99B
66 39 26
1,758 47
3 :1.7 15 18
;3, 242
Other kld inJ
7 6
22
2 2
62 2
10!:i
4<? 46
;:,1:3 B
23 6
4~.i) 'i>
2 4
1 0
822
TABLE 10 RAIL-HIGHWAY ACCIDENTS/INCIDENTS INVOLVING MOTOR VEHICLES BY TYPE OF CROSSING PROTECTION, 1977
Devices Crossins
Protection
Number Of
Killed InJured Accidents Crossinas 0Peratina not
Gates Flashina liahts Hww Sanl WW Bells Crossbucks StoP sisns (Jther Passive None Total
4B 2B3
40 4~iB
7 ~:5 1::· ,.!
846
311 1,527
172 2,311
61 4? 31
4,455
1,013 3,972
560 5,780
168 156 200
11,849
Note: Hww si•nl - Hiahwaw Traffic Sianals WW - Wiawaas
Yes No rePorted
12,932 967 34,2)7 3,849
3,310 464 140,446
3,550 8,642
15,197 21B,354 5,280
32 '71
4
107
14 52 92
5,/BO 168 156 200
6,462
Struck , •••• by train ••••• Dawliaht Dark
406 1,788
247 2,764
B6 66 99
5,456
398 1,020
:1.56 1,337
4? 45 74
3,072
Total kld inJ
48 34
249 19 :1.1 10
45B 7
1:.:· ,.! 1::· ,J
B46
Ra11
311 251
1Y2/6 74 64 34
2,311 6:1.
3 19 20 31
4,4~5~7.i
•••• into trai11 •• Dawliaht Dark
76 576
84 788
18 13 11
1,566
U.1 '.588 n
!391 ?2 32 J.6
:I. , 7~)~::;
I ....., I
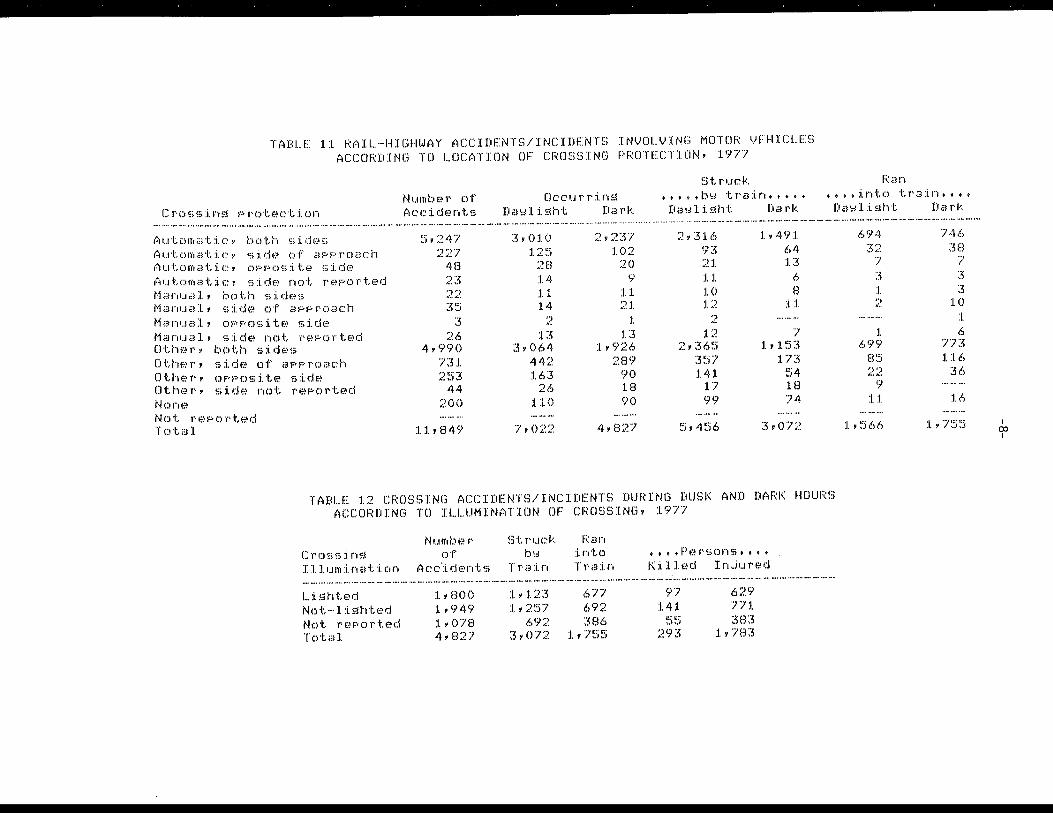
TABLE 11 RAIL-HIGHWAY ACCIDENTS/INCIDENTS INVOLVING MOTOR VEHICLES ACCORDING TO LOCATION OF CROSSING PROTECTION, 1977
CrossinS Protection
Automatic, both sides Automatic, side of aPProach Automatic, OPPosite side Automatic, side not reported Manual, both sides Manual, side of approach Manual, OPPosite side Manual, side not rePorted Other, both sides Other, side of approach Other, opposite side Other, side not reported None Not rePorted Total
Number of Accidents
5,247 227
48 23 LL
35 3
26 4,990
731 253
44 200
:1.1, B49
Occ,.J r r ins Dai~l i.i,.lht
3,010 125
28 14 11 14
,"")
"-13
3,064 442 163
26 110
7,022
Dari~.
?,237 102
20 0 '
11 21
1 13
1,926 289
90 18 90
4,827
Struck ••• ,,bY train,,,.,
Da!,ll :i.~1ht
2,316 93 21 11 10 12
L
12 2,365
357 141
17 99
~), 4~i6
Dark
1, 4<;> 1 64 :1.3
6 8
:I. 1
7 1, l~B
1n 54 l.8 74
3,072
1:.:an . l l . + •• :1.n·~o ··,r,c3:1,n ••• +
Da!~l :i~;lht
694 32
'? 3 :I. '') ,. ...
:I. 699
8'.~i ")'") ,.· .. .,: ..
9 :1.:1.
1, '.566
Dark
746 3B ... ,
I
3 i~
10 :I. 6
7T3 :L:1.6
36
:1.6
:I. , 7~:S ~:5
TABLE :1.2 CROSSING ACCIDENTS/INCIDENTS DURING DUSK AND DARK HOURS ACCORDING TO ILLUMINATION OF CROSSING, :1.977
Number Cross ins of Illumination Acdidents
Lishted Not-lishted Not reported Total
1,800 :1.,949 1,078 4,827
i:;t ruck b!,l
Tra:i.n
:1.,:1.23 :1.,257
692 3,072
1:(an :into Tra:i.n
67'7 692 :rn6
:I., 7~i~i
.,,.Persons,,,, Killed InJured
97 :1.4l
c:· t:· \,},,}
293
629 77:1. 3B3
1,7B3
I (X) I
Tra:i.n ~,r:-t:-ied (MPH)
Unknown Standins 1-9 10-19 20-29 30-39 40-49 50-59 60-69 70-79 80-89 90 and over TOTAL
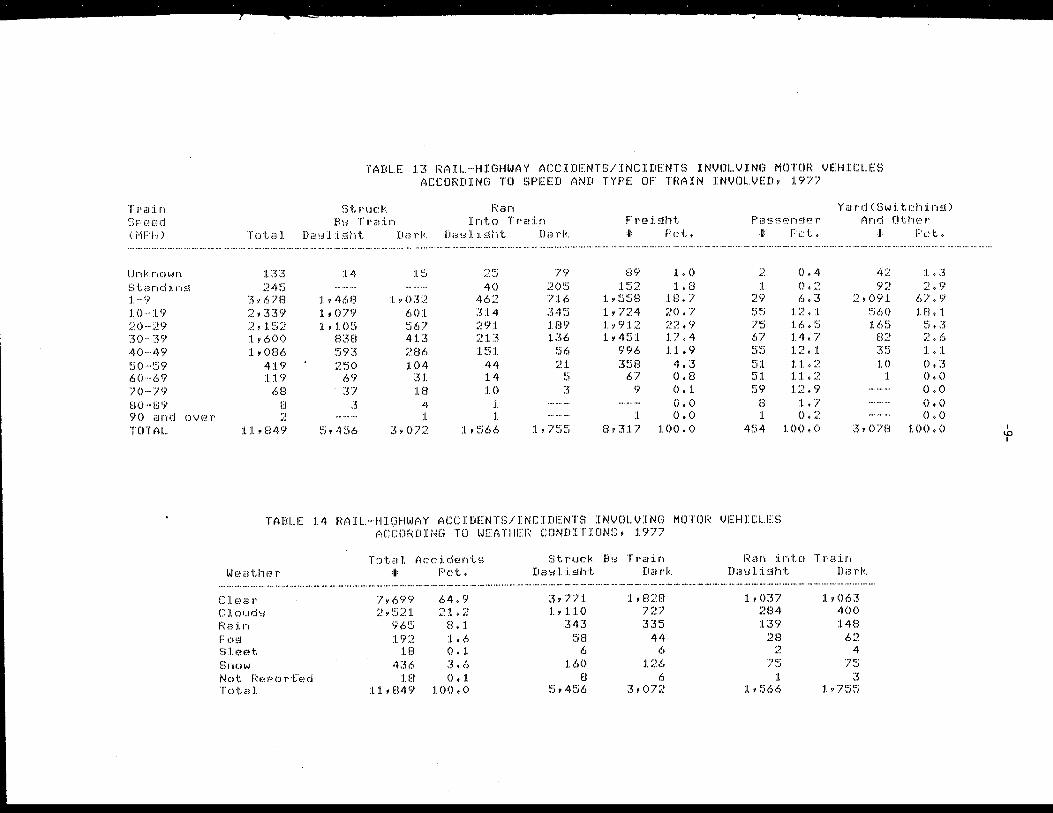
IABLE 13 RAlL-HIGHWRr RCCIDEN1S7INCIDENTS INVOLVING MOTOR VEHICLES ACCORDING TO SPEED AND TYPE OF TRAIN INVOLVED, 1977
'.:1tr1.Jck B ·r· . .·;;; r(:~1n
f<an IntD Tra:i.n Freisht
Yard(Switchins) And Other
Total Da!,l l :i. ;Jht Dark Da'.,il :i.,.iht Dark I Pct, Passenser
I Pct, I Pct.
133 245
3,678 2,339 2~•1.~:;2 1,600 1,086
419 119
68 8 2
11,849
14
1,468 1,079 1,105
838 593 250
69 37
3
'.'.',;, 4~'i6
1'.:i
1,032 601 567 413 286 104
31 18
4 1
3,072
2!::; 40
462 314 291 213 151
44 14 10
1 1
1,566
79 205 716 345 189 136
56 21
J
3
1 v 7!:=;~=.:;
89 1,0 152 1,8
1,558 18,7 1,724 20,7 1,912 22,9 1,451 17,4
996 11,9 358 4,3
67 0,8 9 0,1
0,0 1 o.o
8,317 100,0
1 29 r.:·c:· ..,Jd
75 67 JJ
51 51 59
n C)
1 454
0,4 0,2 6,3
12.1 16,5 14,7 12,1 11,2 11,2 12,9 1,7 0,2
100,0
42 1,3 92 2,9
2,091 67,9 560 18,1 165 5,3
82 2,6 35 1,1 10 0,3
1 o.o o.o 0,0 0,0
3,078 100,0
TABLE 14 RAIL-HIGHWAY ACCIDENTS/INCIDENTS INVOLVING MOTOR VEHICLES ACCORDING TO WEATHER CONDITIONS, 1977
W€,,ath,, r
Cl,:~ar Cloud·,J 1:<;;; :i.n FDEl Sl0!c-~t f' .. ,:>ltt)W
Not i:~ePort:-ed Total
Total Accidents I Pct,
7,699 64,9 2,521 21,2
965 8,1 192 1,6
18 0,1 436 3,6
18 0,1 11,849 100,0
Struck Bw Train Dawlisht Dark
3,771 1,828 1,110 727
343 335 58 44
6 6 160 126
8 6 5,456 3,072
Ran into Train DawliSht Dark
1,037 284 13'il
28 2
... ),::· ,J
1 1, '.'.'i66
:I. ,063 400 148
62 4
··,r.:· ,J
3 1, 7'.'.'i'.:i
I I.O I
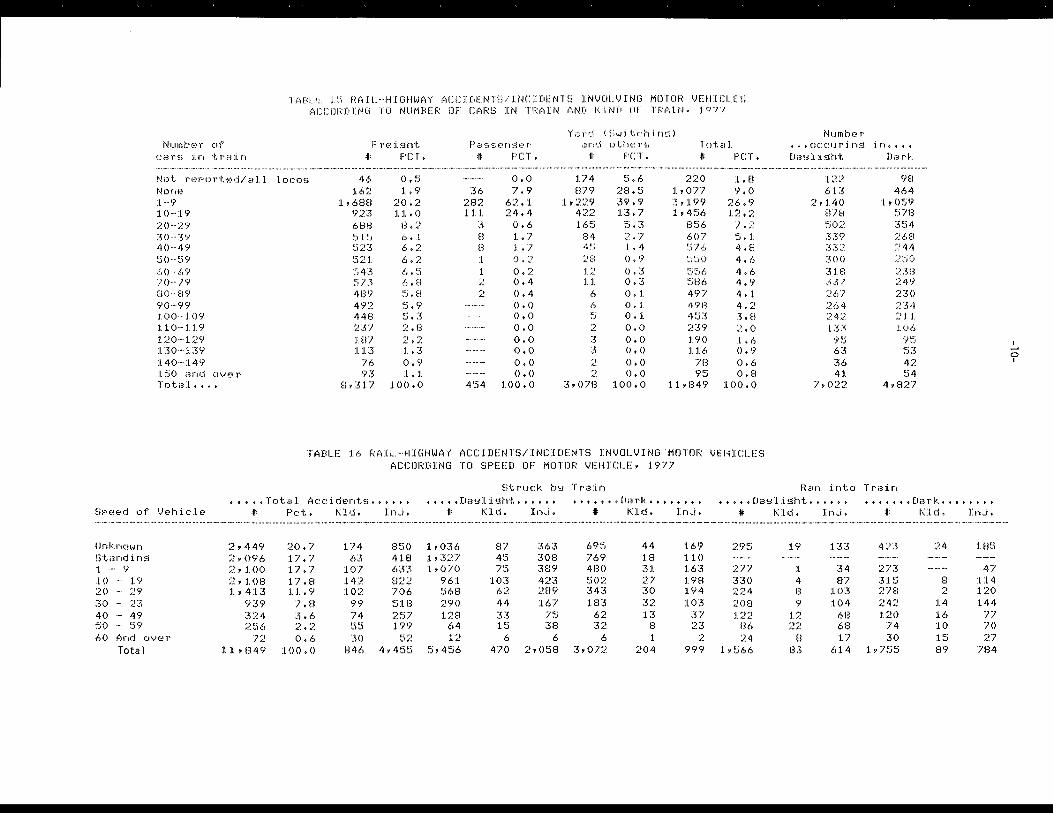
Number of <~ars J.r1 tr8if)
TABLE 15 RAIL-HIGHWAY ACCIDENTS/INCIDENTS INVOLVING MOTOR VEHICLES ACCORDING TO NUMBER OF CARS IN TRAIN AND KIND OF TRAIN, 1977
Freieht I PCT,
Passenser I PCT,
Yard <Switchinel and ott,ers
I PCT, Total f PCT,
Not reported/all locos None
46 0,5 162 1,9
o.o 36 7,9
174 5,6 879 28,5
1,229 39,9 422 13,7
220 1,8 1,077 9,0
1-9 10-19 20-29 30-39 40-49 5()--59 60-69 70··79 80-89 90-99 100-109 110-119 120-129 130-139 140-149 150 ar)d (JVer Total ••••
1,688 20,2 923 11,0 688 8,2 515 6+1 523 6.2 521 6.2 543 6.5 573 6,8 489 5.8 492 5.9 448 5,3 237 2,8 187 2,2 113 1,3
76 0,9 93 1,1
8,317 100,0
282 62,1 111 24,4
3 0,6 8 1,7 8 1,7 1 0,2 1 0,2
0,4 2 0,4
0,0 0,0 o.o o.o o.o o.o o.o
454 100,0
165 5.3 84 2,7 45 :L,4 28 0.9 12 0.3 11 0,3
6 0,1 6 0,1 5 0,1 2 0,0 3 o.o 3 0,0 2 o.o 2 o.o
3,078 100,0
3,199 26,9 1,456 12,2
856 7.2 6()7 5.1 576 4.8 55() 4.6 556 4,6 586 4,9 497 4,1 498 4,2 453 3,8 239 2.0 190 1,6 116 0,9
78 0,6 95 0,8
11,849 100,0
TABLE 16 RAIL-HIGHWAY ACCIDENTS/INCIDENTS INVOLVING MOTOR VEHICLES ACCORDING TO SPEED OF MOTOR VEHICLE, 1977
l',truck l:.>\~ Train
Number tC)c,~1.Jri.nS in ••••
Dawlieht Dark
122 613
2,140 878 502 339 13? 300 318 337 267 264 242 133
95 63 36 41
7,022
98 464
1,059 578 354 268 244 250 238 249 230 234 211 106
95 53 42 54
4,827
l~an i.nto Train • ••• ,Tc>tal Acc~idents •••••••• , •• DaYlist,t •••••• ••• ++ •• Dark •••••••• •••• • DaYl:i.!=1ht •••••• • +.++++Dari;: .•••••• +.
Speed of Vehicle
Unknown Star1dins 1 - 9 10 - 19 20 - 29 30 - 23 40 - 49 50 59 60 And over
Total
I Pct, Kld, InJ, I Kld, InJ, *
2,449 20,7 2,096 17,7 2,100 17,7 2,108 17,8 1,413 11,9
939 7,8 324 3,6 :;!.!=st.> ~~.2
72 0,6 11,849 100.0
174 850 1,036 63 418 1,327
107 633 1,070 142 822 961 102 706 568
99 518 290 74 257 128 55 199 64 30 52 12
846 4,455 5,456
87 363 695 45 308 769 75 389 480
103 423 502 62 289 343 44 167 183 33 75 62 15 38 32
6 6 6 470 2,058 3,072
Kld,
44 18 31 27 30 32 13
8 1
204
In,.i, * l~ld, InJ, ,t,
169 295 110 163 277 198 330 194 224 103 208
37 122 23 86
2 24 999 1,566
l.9
l. 4 8 9
1 '.'.>
22 8
83
133 423
34 273 87 315
103 278 104 242
68 120 68 74 17 30
614 1,755
l"<ld,
24
8 2
:1.4 16 1 () 1:::.i B9
Ird,
lB5
47 114 120 144
77 70 27
784
I ..... 0 I
,•
Stat€-)
~il at, ,1ma i:'!tlas :.a ,~ r :i. :-: ·)na ;~ rka ,sa1:.~ Cali fornia Colo 'Bdo Conn -?ct..icut.. D(·?la are
-11-
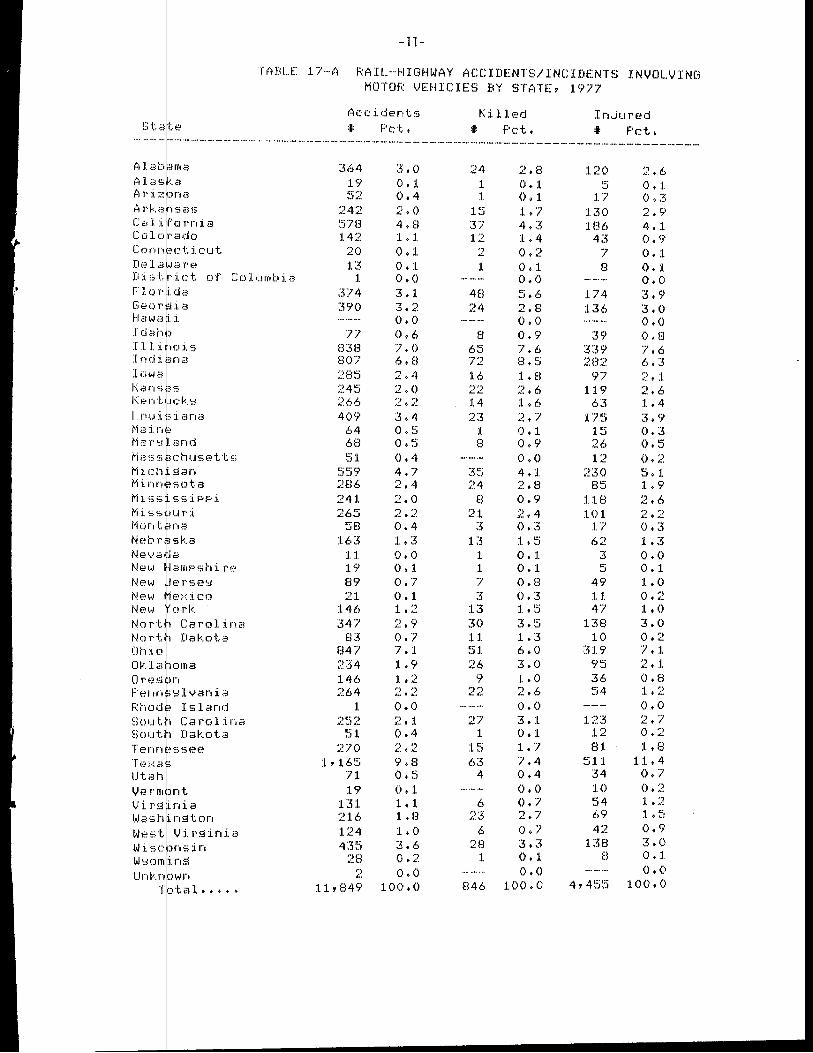
TABLE 17-A RAIL-HIGHWAY ACCIDENTS/INCIDENTS INVOLVING MOTOR VEHICIES BY STATE, 1977
Accidents =IJ: Pct.
Ki llE)d :fl: Pct.
Injured t Pct.
--------------------------------------------364 0 24 2,8 120 2.6
19 0,1 1 0.1 5 0+1 ~)2 0,4 1 0. 1 17 0 ·;
'\-·
242 ~). 0 j c:· . ,} 1 .7 1.30 .., ,.., A-+ 7
~-'i78 4,B 37 4. HJ6 4. 1 :1.42 1 • l. 1 .-,
.:.. 1 +4 43 (). <;' 20 (). 1 ,.,
··- 0 '1 + .,_ 7 0+1 13 (). :L :L (). 1 8 o. 1.
Di!,t ·-:ict of Columbia 1 0,0 0,0 0,0 Flor i.da 374 3+1 48 ~j. 6 174 3,9 Geor 0 ia 390 3,2 24 2,8 13c, 3,0 Hawa i.:i. 0,0 o.o 0,0 I dah :i n 0,6 8 0,9 39 0,B Illi ·,ois 83B 7 + () 6'::-,J 7,6 339 7,6 Indi ··na 807 6,B ·-,, .. )
/,:.. B,5 2B2 6,3 loi..ia 285 2,4 16 1 ,B 97 2. 1 t<ans. =ts ::_!45 2.0 l")t·:,
,,.;..,,.;.. 2,6 :1.19 2,6 l,ent• JC!---.~ 266 2+2 14 :L 6 6~"-) :1.,4 L.oui ,iana 409 ~L4 23 2,7 l. 7~=; 3 + <j) Mc1:i.n ., 64 0 c.-• ,J 1 0,1 1"'" ,J 0+3 Mar~1 .and 68 0 • '.S 8 0.9 26 0 c:· + ,.}
Ma;,;;; ,chusett,,,. 51 0 + 4 o.o 1 '1 ... 0 ,., A~.
Mich ·san ~:,i ~.5 c_;- 4+7 3'.:i 4, 1 230 i:;--.J. 1
Minn sot.a 286 2+4 24 2,8 8~) 1 .9 Miss ssiPPi 24:1. 2,0 B 0,9 LLB 2,6 Miss >UT'i 265 r; '")
•- + ... 21 2,4 HH ,., ,., 11,·_ + .,;..
Mont .na 58 0+4 3 0. 3 j -7 ., 0,3 Nt=:~br ska 163 1 ,3 13 :L 1.-:·
• ,J 62 :L ,3 Neva .ia l:L o.o 1 0. 1 :3 0,0 Ne,,, l·lamp;;hi rr) 19 0. 1 1 o. 1 1:::-
-.I o. 1 New er s,e~:1 s<? 0.7 7 O,B 49 1+0 Net-s• ii"):-,:i.co 21 0. 1 3 0,3 u. 0 ,.,
+ ,:._
Nt>W ork 146 :L '") ...:.. :1.3 :l.+'.S 47 1+0 Nort I Carolina 347 2,9 30 3,5 13B 3,0 Nort, Dakota 8:'I 0,7 l:L 1 . 10 0 ,.,
A':,.
Ohio B47 7. j_ '.7i l. 6,0 ~3:1.9 7, 1 OU.a ,oma 234 :L.9 26 3. () 9'.:) 2,:1. Or,J~j n 146 1 ') . ,:._ 9 j_ .o 36 O,B Penn slvania 264 '1 '1 ,,.,._ + '"- 22 2,6 '.54 1 ,.,
.,._
Rhod Island j_ o.o o.o o.o !:>out,, Cai~o1 ina 2~=;2 '1 ,/\·- t 1 27 3. :I. 123 2,7 Sout 1 Dakota 51 0,4 1 0 • 1 :L':> () ,., . .,_ TEinn !SS(~f? 270 '") '1
A.. 15 1. 7 8:L :L.8 T i~:=,~a :I., 165 9.B 63 7,4 5l:L 1l .4 Utah 71 0,5 4 0,4 34 0,7 V,'?T'ITI :mt 19 0 • 1 o.o 1.0 (). 2 Vi r-~:! nia 131 :L.l. 6 0.7 54 :I. '")
,,, ...
l.Jash · ngton 216 :L.B n 2,7 69 1+5 West Virginia l.24 :L ,0 6 0.7 42 0,9 Wi~,C nsin 435 3.6 2B 3, :3 138 3,0 w~wm ins 28 0,2 1 0. l. B 0. l. Unkn '") o.o 0,0 0,0 ·wn ·-T··,tal, 11,849 100,0 846 100.0 4, 45'.:i 100,0 . • + .
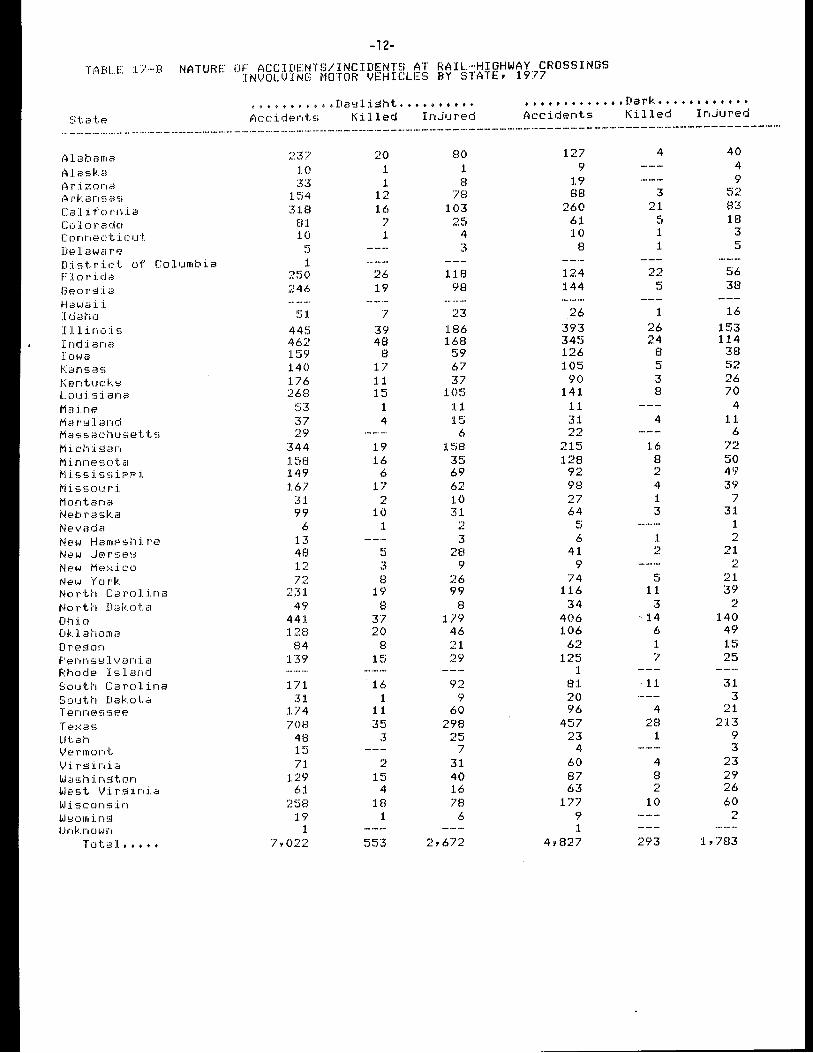
-12-TABLE 17-B NATURE OF ACCIDENTS/INCIDENTS AT RAIL-HIGHWAY CROSSINGS
INVOLVING MOTOR VEHICLES BY STATE, 1977
+ + t t t • + t + t + Da:11 i sht + ••••••••• ••••••••••••• Dark •••••••••••• StatE, Accidents Killed InJured Accidents Killed InJured
--------------------------------------------------------------------------------------------Alabama Alaska ;~rizona ,-::irkani,;as Cali. forn:i.a Colorado Connecticut. Delaware District of Columbia Florida Geors:i.a Hawai:i. I r:Jaho I 11 i no :is Indiana Iowa Kansas t,entuck!:! L..oui·;;;iana Maine Mar"::1land Massachusetts Michi;Jan Minnes,ota Mi.ssiss;iPPi. Missour'i. Montana Nebra·;;;ka Nevada New HamPshi r,? New Jerses New Mc,:dco Ne1..J York North Carolina North Dakota Ohio Oklahoma Or·,;;1sor, F'enni,!:! l van :i .• i F.:hode Island South Car'ol ina South Dakota Tennesi;ee Te:-:as Utah Vermont 1.-'i. rginia !,.,l;;ishinston I-Jest Vi rgini.a Wisconsin I-Jsomin£! Unknown
Total,,,,,
;~37 1.0 33
1:'.'i4 318
81 10
1 250 246
~'il 445 462 159 140 176 268
'.53 37 29
344 :1.~'iB 149 :1.67
31 99
6 13 4B 12 72
231 49
441 128
84 139
171 31
174 708
4B 15 71
129 61
25B 19
1 7,022
20 1. 1
12 16
7 1
26 19
7 39 4B
8 1? 11 15
1 4
19 16
6 17
2 10
1
3 8
19 8
37 20
8 15
16 1
11 35
3
2 15
4 18
1
553
80 1 8
78 103
25 4 3
118 98
23 186 168
59 67 37
10'.5 l1 15
6 158
35 69 62 10 31 ,.,
,:_
3 28
9 26 99
8 179
46 21 29
92 9
60 298
25 7
31 40 16 78
6
2,672
127 9
19 88
260 61 10
8
124 144
26 393 34'.5 126 105
90 141
11 31 22
215 128
92 9B 27 64
c· ,J
6 41
9 74
116 34
406 106
62 125
1 81 20 96
457 23
4 60 87 63
177 9 1
4,827
4
3 21
5 1 1
22 5
1 26 24
8 c· ,J
3 8
4
16 8 2 4 1 3
1 2
5 11
3 ,14
6 1 7
11
4 28
1
4 8 2
10
293
40 4 9
52 B3 18
3 5
56 38
16 153 l14
38 52 26 70
4 11
6 72 50 49 39
7 31
1 2
21 2
21 39
2 140
49 15 25
31 3
21 213
9 3
23 29 26 60
2
1,783
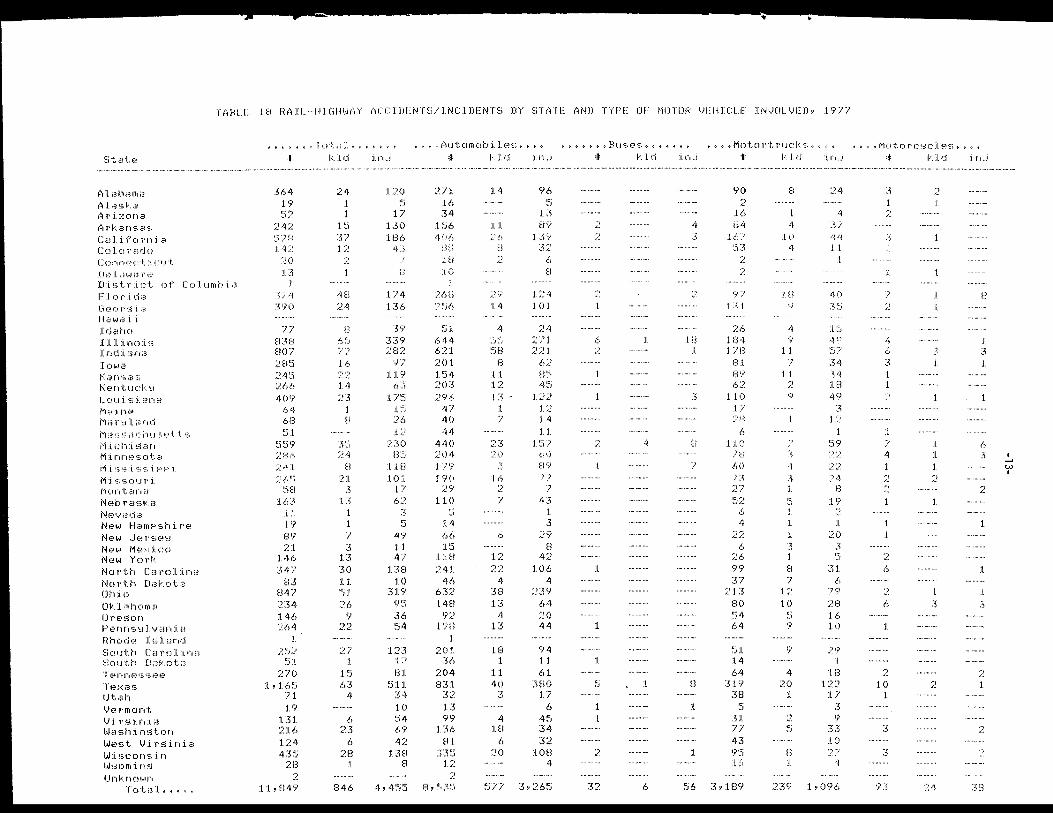
fABLE 18 RAIL-HIGHWAY ACCIDENTS/INCIDENTS BY STATE AND TYPE OF MOTOR VEHICLE 1977
~)tatt:~
Alc:Jbama ,1i l af.;ka ,~ r :i. :•~ona ,~1rkansa~::. c~:~ l i f'o rn :i. a ColorarJo Conn1:-)ct:i.cut :Oc:la1,-.1arc· D·istr·ic~t of c:olumbi2~ Flor·icia Gf-~o r:-:=l :i. a H2wa:i. :i I di~ho Ill:i.no:i.·"; Ind :i. -~~na Iowa Kan<:;a~:~ Kt.~ntuck~J t...01..1:i·,:::i.::>n::i Ma1nf? i'"iar'::$lanci i""i~:~ssachu·::;pt ti:; i"1:i.ch:i.~.!ar, M :i. nni::-~:::.nta i""i :i ·::> -~; :i. ~:; ~:;. i F F' l
M :i. ~::. b n1 . .1 r i i'"iontana Nt-:~braska N(·?Va'.'.ia New HamPsh :i. rt:~ N (':.' l,,.J J f::• I's(-:~ ~:J N (-:~ t,.J M €-: >{ :i. C ('.) i\l(·?W York NCJrth Car-ol:i.na North Dak.ot.a Oh:ic:> Oklahoma OrEi,'lon F'E•nns•:J l van i a Rhodf-i Ii,;land South Carol:i.na 1',:outh D::1-:.ot;:: T E! n n €-~ ~=; (•::' (•:.J-
· r (~::-~a!:> Utah Vermont V1 r!~:i.n:i.a Wash j_ nic!tor, W€•,~;t Vi r~J:ir1ia IAfiscons:in i..Jsmm:in~J Unkno1, .. 1n
~" ~·,,.,,. <- 1Total.," .. " ~" t
,1r
364 :1.9 ~=.:;2
242 •·:· ... ,, .. , · . ..I ID
14? 20 13
1 .":)/4 390
... , ... , I I
B3B 807 285 245 266 409
64 68 51
559 286 241 :~:: 6 ~::;
~.:SB 163
11 :I.? B? 21
146 347
B3 847 234 146 264
l 25?
5:L 270
l,165 71 19
131 216 124 435
28
11,B49
1-:.J.d
24 1 1
:I. ~j ?s·7 l?
4B ?4
B r.~ ~.=_:; .... , ... ) I,; ..
:I./) 22 14 23
l 8
3~:) 24
B 21
5 l3
:I. 1 / :5
13 :rn 11 ~=.=; 1 :·.~1:,
9 22
;:_>/ j
:I.~.=; 63
4
6 23
f., 28
1
B4f.i
1n.._j
Li() ,:.:· ,.,
17 uo 106
4:.:;; / n
l/4 13t,
39 339 2B2
97 119
63 175
15 )C)
12 230
~:15 118 101
17 62
3 J
4Y ll 47
138 10
319 95 36 54
123 ·1·::> 81
\') 11 34 10 ~:;,. 6'"i 42
na B
t
271 16 34
l\:i6 4()6
SB 18 10
1 :2.f.>B 2~:.)6
51 644 621 2()1 154 203 296
47 40 44
440 204 179 190
29 :l .LO
J
14 66 15
11B 241
46 632 14B
92 198
1 201
36 204 B31
32 13 99
136 Bl
335 12
2 4, 4~55 B., ~::.i3~=.=;
J,_ 1,.:1
14
:1.1 ?6
B
2? 14
4 1::·1::· ,.),.J
'..'iB fl
11. :1.2 13 ,
1 7
:~·:3 20
3 16
2 7
6
12 22
4 38 13
4 13
18 1
11 40
3
4 1n
6 20
:i.n..J
96 ~::;
13 G'ii
13'1 3::'.
/, p 0
124 101
24 271 221
62 85 45
1.22 12 14 11
157 60 89 77
7 43
1 3
29 B
4':> 106
4 23'1
64 20 44
'?4 :I. 1 61
3BO 17
6 4~:; 34 32
:I.OB 4
'.'i/7 3,26~i
• t t • I (· Bt.J~:~p~;; • ·) t
,t-
(~.., :.~
1
1::· ,.!
l 1
2
Vlr:.l
4
:i.n.j
4 3
1n .I.
3
7
8
.,-o.McJtor·trlJck.s •• ~'° I 1-:..1.d :i.nJ
90 2
16 !:l4
l/)'/ 153
97 131
26 HM 171'!
Dl B9 62
.I. l 0 17 :::OH
11. 0 /B l>O 73 i'./ ~~i2
l> 4
2~:~ 6
26 99 37
213 80 54 64
~:5 :I. 14 64
319 3B
t::· ,J
31 77 43 (.;) ~:; 16
B
:I. 4
10 4
I.U 9
4 9
l:I. /
11 2 ?
:·1 I 3 l ~=.:1
1 :l .l 3 :I. B /
12 1.0
,::· ,.J
9
'i>
4 20
1
2
n (:~ l
24
4 37 44 .1.1
1
4c, J~:-,;
1'.:i 4'? ~::; '?' 34 34 1 i:l 49
:.3 1?
~:.)9 ?\! )2 24
B 1'?
:?
i..) 3 15
-.:\1 6
?9 2B l.6 l.O
2<?
lH 12:"
J. '? 3 '"' ' 3J
:1.0
32 6 ~=.=;tJ 3 ~· :I. B<J 2:5') :l, ()'t6
.'°''°Motc>rcsclps ••• , ,1r
3 1
:\ .I.
7
4 ,:·~ 3 1 :I.
1
4 :I.
2
1 .I.
6
6
2 10
l
3
3
93
l'.lr:i
2 1
J
1 l 1 2
l 3
2
::;>4
in.J
[:
1 3 .I.
6 3
2
3
l
::.~
JS
I
w I
St,at.:-:-:
Ali3barna Alaska Arizona Arkansas California Colorado Connecticut Del.aware Distric·t t)f c~)]_1 __ ,n1bi;~ 1~1c,ri.d~:i (3ec,rgia Hawaii Idaho Illinoi Indiana :[owi~ l(i~nsas Kentuckw J_o1Jisiena Maine
Ma!ssachusetts Mic:t,isar·, Minr,esc)ta i~ississiPPi MiSSC)Ul'i Montana Nebras~.a Nevada New HamPstlir·e New ~Jerse~ New Mexico New York No1·tt, CarcJlir)a North Dakota Ohio Oklahoma ()reson l~er,ns~lvania Rhode Island ~301Jttl Caroli1·,a South Dakota ·1·en11essee ·rexas Utah Vermont Vi.rsinj.a Wash1ngtcJn West Virainia Wiscorlsin Wwomina Unknown
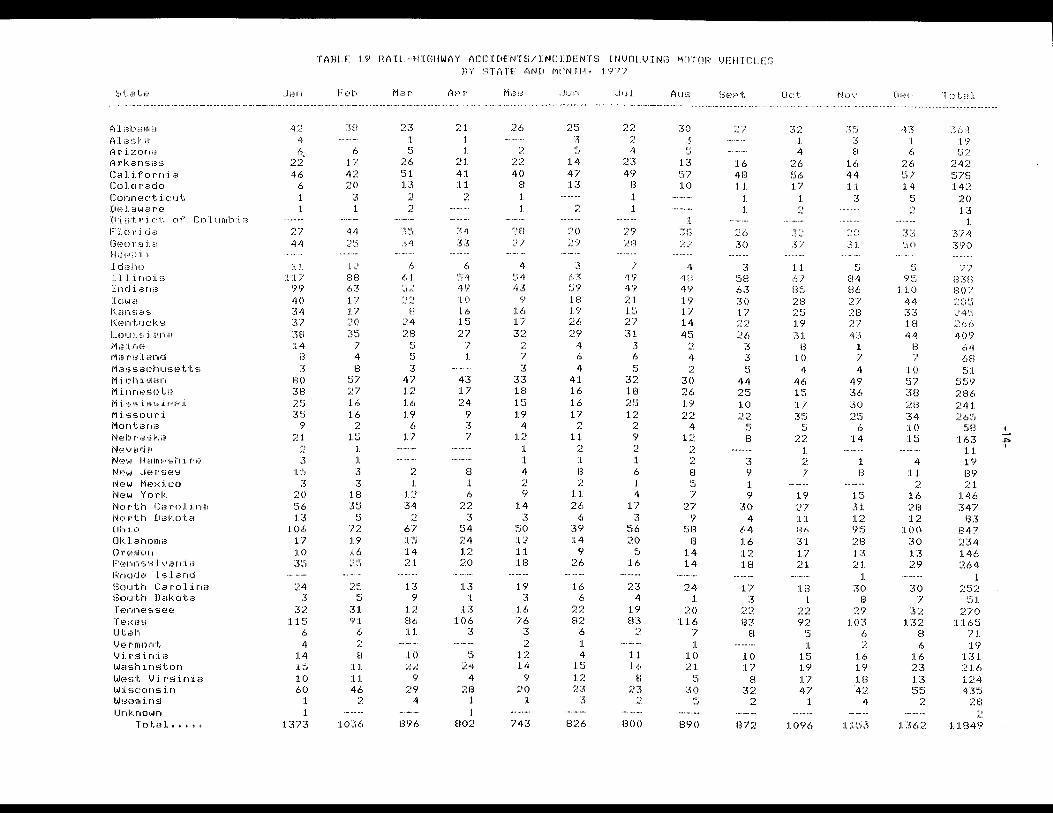
Total++•••
-..Jan
42 4 ,s ..
22 46
6 1 l
2/ 44
:1.1 117
99 40 34 37 38 14
8 3
BO 3B ::.~ ~:=; ~3:5
<_;:,
21 ,., ,:.: 3
15 3
20 56 13
106 17 10 35
24 3
32 115
6 4
:1.4 15 10 60
:I. l
1373
TABLE 19 RAIL-HIGHWAY ACCIDENTS/INCIDENTS INVOLVING MOTOR VEHICLES BY STATE AND MONfH, 1977
Fecib
:rn
6 17 4~' 20
3 1
44 '"\I::• ,::.,..t
l.2 BB 63 17 :1.7 20 35
7 4 8
57 27 16 16
15 1 l 3 3
18 35
J
72 19 :1.6 2~=.=;
,·,1::· ,:.:,.J !5
31 91
6 2 8
11 :1.1 46 ,.,
,:.:
l.036
Mar
23
1::-'·' 26 !:.) 1 13
2 2
--i--c:· ,:>d 34
6 6:1. r.:·•··, -..}.,·:. 22
B 24 2B
1::· ,., 1::· ,.!
3 47 j ~)
16 19
6 :1.7
2 1
1:.:>. 34
2 t,7 :i. ::s 14 21
:l3 9
12 Bf., :1.1
:1.0
9 29
4
896
APr
21 1 1
2l. 41 :l.l.
2
34 33
6 ~=54 4<? :I.() :1.6 15 27
'? 1
43 17 :;,~4
9 3 7
H :I. 6
::.~2 3
~54 24 12 20
:l3 :I.
:1.3 106
3
1::· ,!
::.~4 4
2B 1 :I.
B02
Ma~J
26
2 ::.~2 40
B l. 1
2B 2/
4 54 43
9 :1.6 17 32
2 7 3
33 1B 15 19
4 12
1 1 4 2 9
14 3
'.50 12 1.1 :I.B
19 3
l.6 76
3 2
:1.2 14
9 20
1
743
. .Jun
2~=; 3 1::-'·' 14
47 l3
:.~
20 29
3 63 59 lB 19 26 29
4 6 4
41 16 16 17
2 11
2 1 B 2
1:1. 26
6 39 14
9 26
U, 6
22 B2
6 1 4
.I. ~5 :1.2 n
3
B26
. .Jul
22 2 4
23 49
B l. l.
29 2B
7 49 47 21 :I. ~.i 2) 31
3 6 r.:· ,.,
32 :I.B 2!~j 12
2 9 2 l. 6 1 4
1/ 3
~:i6 20
~=.=; 16
23 4
19 B3
2
11 .1.6
B :.'3
2
BOO
J~l..l~J
30 3
J.3 ~::;7 :I. 0
3'D 22
4 4a 49 :I.'? 17 14 4~.=;
2 4
30 26 19 22
4 12
2 2 B ~:i 7
27 'ii
'.'.\B B
14 14
24 1
20 :I. 16
7 1
10 ;!.1
1::· ,.!
30 1::· ,.,
!390
bc-:-~}·.:-t,
2?
16 48 1:1.
:I. 1
2<':~ 30
3 ~:.iB 6:·:) 30 17 22 26
3 :'I ~:_:;
44 2~5 1() 22
!,:=;
8
3 9 l 9
30 4
64 16 12 :1.8
17 3
22 B3
8
:I.() 17
8 :32
2
B72
Uct
3::~ 1 4
26 ~.)6 17
:I. 2
32 T7
J.l /)/ B~::; 28 2~5 l 'ii 31
B 1 ()
4 46 1!:) J.l ~3 ~::;
5 22
l. 2 7
19 27 11 B6 31 17 21
:I.B :I.
22 ?2
5 :I.
l ~=5 1.'l 17 47
l.
1096
f'-.!O\'
.. r,::· ,:J ... J
B 16 44 l.1
3
2B 31
1:;· ,J
U-4 H6 ··,···1 ,,;;. i
2B 27 43
1 7 4
47' 36 j() 2~'.:j
6 14
1 ,., C)
15 3:1. 12 95 28 13 2:1.
1 30
B 29
103 6 2
16 19 lB 4?
4
l. 1'..'i3
:0 F:~ C:
43 l (:)
26 ~'.:j/ :1.4
i::· ,!
2
:n ~.:;o
· •• J ,·,,::· 7 ,.J
110 44 33 18 44
B ... , I
10 ~:_:; / :rn i'8 34 :I.() :I.~.=;
4 :1.:1.
2 16 28 1 ~
100 30 13 29
30 7
32 132
8 6
16 23 :1.3 1::·1::· ,.J ~.,
2
1362
Totel
3/;-:'.} 19 ~:j2
242 57B :1.42
20 :1.3
1 374 39()
···.•··., / , B3U BO/ 2E~5 245 266 407
64 6B 51
559 286 241 265
58 163
11 19 89 21
:1.46 347
B3 847 234 146 264
1 2~:s:?
(_=:;1 270
:I. :1.6'..\ /:1. j 9
l.31 216 :1.24 43'.5
2B ?
1 l.84'?
I
.i::,. I
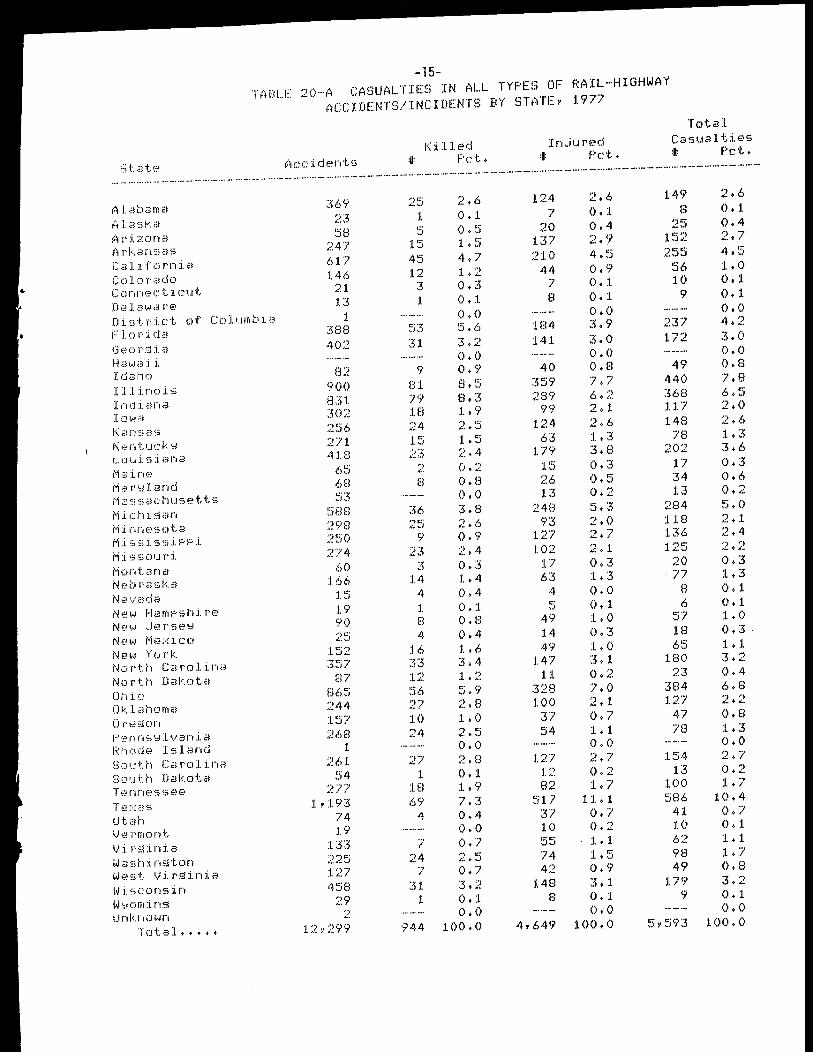
-15-TABLE 20-A CASUALTIES IN ALL TYPES OF RAIL-HIGHWAY
ACCIDENTS/INCIDENTS BY STATEv 1977
(.,cc:i.d•?.nts 1·,il Jed
t Pct, In-.iurf?d
:U: Pct,
---------------------------------------------------------· -Alabama 369 Alaska 23 Arizona 58 Arkansas 247 California 617 Colorado 146 Connecticut 21 Delaware 13 District of Columbia 1 Florida 388 Georsia 402 Ha,,1ai :i. I 1'.:iaho 111:i.noi~.; Ind:i.ana Io ... ,a t< an·::; a\,; K.-;,,ntuck;,1 L.ou:i.·::;iana Ma:i.n0; Mar·:1J.and Ma!,,,. achuse:)t t,;;; Michi;Jan Mi. nnE1!,;ota Mi.·;;;;;:. :i. s·,;; i PP :i. Mis,,ouri Montana N£;br·aska Nc"!vada New Ham:.::-shi r·e Ne;'"' J.;; r;;;e!:l New M~:;>;ico Nel--1 York Nor'th Carolina North Dal,:.ota Ohio Oklahoma D rf:.•;Jon F',::;.•nns·,~ 1 vani a Fi:hode Island !3outh Caroli.na ~)OI.Jth Dakota T ,: .. ~nnes·:;ee
Utah Vr,,rmont Vi. r~.i:in:i.a l,Ja):;h :i. n;Jton W"!,st .. V:i. rsinia 1-~ i. !,cons in W\:wm:i.ni.ci Unknown
Total,,,,.
82 900 83:1. 302 ::!~56 :n1 4:1.8
{ 1::· (.)-..J
68 ~53
'.5BB '.i9B 2~m 274
60 l.61.i
:l.!5 :l 9 90 25
:1.52 .j'.:,7
tl7 B6!':i 244 :1.57 26B
1 261
54 2·_77
:lv193 74 19
133
:1.27 45B
29 •'} ... :.
12v299
~·, 1::-.;.,.J
:I. 1::-,J
:I.~:, 4:'.'i 12
··x ., :I.
c:··•7 \.J .. :>
31
9 81 7'i :I.B 24 :l"'" ,J
23 ,., "'-:. '"' C)
~:~6 ~-) c:· ,:_,..}
9 23
3 14
4 :I. El 4
16 33 12 ~56 27 10 24 ~-)-J
:l :1.8 69
4
7 24
l 31
1
944
2 + l.i 124 2+6 0, :I. 7 0, 1 (). !':i 20 0,4 1, 5 1.37 2,9 4,7 210 4. ~.'i j '") • + ,._ 44 0,9 0,3 7 0, 1 0.1 8 0. 1 o.o o.o ~:) + f.) 1B4 :L9 3,2 141 3. 0 o.o o.o 0. 9 40 O,B 8,5 3~59 7,7 8, ~3 2B9 6,2 :t..9 99 2, 1 2 + ~:; 124 2,6 1.~i 63 :I., 3 2,4 179 3,B 0,2 1 ,::· .d 0,3 O,B 26 0,5 o.o n 0 '1 +.:. :3, 8 248 5+3 2+6 93 2. () 0,9 127 2+7 2,4 J.02 2 • 1 o.3 :L / 0,3 1.. 4 6~1 :L.3 0,4 4 o.o 0. 1 c:·
d 0+1 O,B 49 LO 0,4 l. 4 0,3 :I., 6 49 :I.• 0 :.:L4 :1.47 3. 1. :l +2 :l :I. (). 2 5,9 328 7+0 2,8 1.00 2, 1 1.0 3··,
' I 0,7 '") i;:-A-, + ~., 54 1+1 0,0 o.o 2,B :1.27 2,7 0. 1 12 0 '") .... :l ,9 8'l ,._ 1. / 7,3 ::517 11, 1 0.4 37 o.7 o.o 1 () 0,2 0,7 55 1 • :I. ... , c:· ... -:. J / 4 1 • ~:'i O,? 42 0 (~ • 1
3,2 1.48 3,1 0 + :l 8 0. :l o.o o.o
100,0 4,649 100.0
Total Casualties =II: Pct.
149 2.6 B (). 1
25 0+4 1~:i2 ') 7 ~-., 2~;5 4,5
56 1+0 :LO 0. 1
9 0. :l o.o
237 4 '") .:..
1 -,rl / ,:.. 3. 0 o.o
49 o.s 440 7,8 36B 6,5 U.l 2.0 14B 2,6
78 1+ ;3 20 3,6
17 0,3 34 0,6 u 0.2
2B4 5,0 1:LB 2, 1 136 2,4 125 2+2
20 0,3 77 :1..3
8 0. :l 6 0 + 1
!':i7 1+0 1.8 0,3 6"'" ,I 1, 1
180 3,2 23 0,4
31:14 6,8 127 •"") ... )
::.. + ••
47 0 8 78 :l.+3
o.o :l.~54 2+7 n 0,2
:1.00 1. 7 5B6 10. 4
41 0 7 . , 10 0,1 62 1 , :l 98 1. 7 49 O,B
1.79 3 ,., .... 9 () + 1
o.o 5, !':i93 :I. 00, 0
bt i~ t,::•~
Alabstrn~i Alask.~3 Arizc)na Ark.Bl'lSBS C3lifornia (:cJ:Lorado Connecticut I1e:Ls~ware DJ.str·i(~t c)t· (:(:>lurnbj_a F:·1a1·id~3 (3eo1·di l~awa11 :Ldat·1c> Illinois lndiar)f~ Iowa Ka11~;as l(e11tuck~ Louisiana Maine Mar~l~~11d Massac~t1~J!setts Michisan Mi1·)1·)esota M1sJsissiPPi Mi~~scJuri
Neb1·aska Nevada New Hampshire New Jerse~ New Mexico New York North CaY't)lirla Nc>rti·1 Dakota Ohio ()klahorna Creson 1~er1ns~lvarl:i~3 Rhode Island South Carolina South Dakota ·1·ennessee ·1·exas Utah Vermont VirSinia Wa~~hirl~to11 West Virsinia Wisconsin Wwomins Unknown
·rotal•+•••
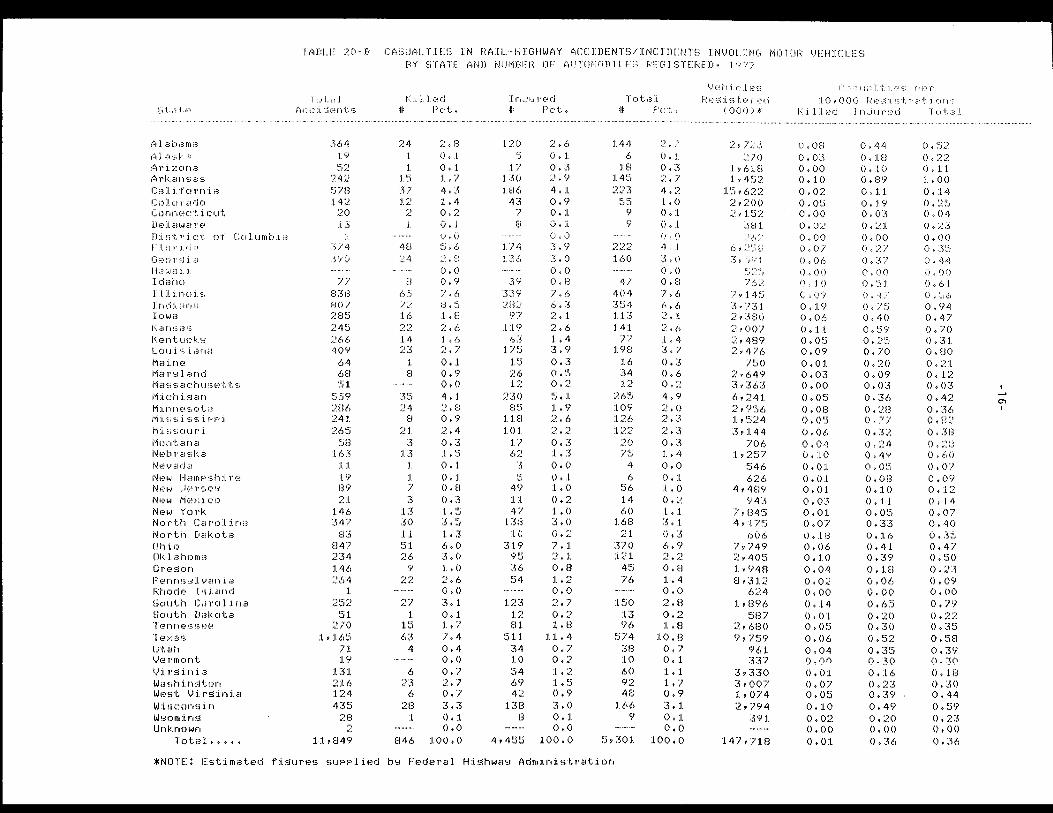
TABLE 20-B CASUALTIES IN RAIL-HIGHWAY ACCIDENTS/INCIDENTS INVDLING MOTOR VEHICLES BY STATE AND NIIMBER OF AUTOMOBILES REGISTERED, 1977
fotaJ Pie c :i. 1ji:-:~nt.~:;
:.:\64 19 :j2
242 578 142
20 13
1 374 390
7/ B3B 807 285 245 266 409
64 68 51
559 286 241 265
SB 163
11 19 89 21
146 347
83 847 234 146 264
1 2~:;2
51 270
1,165 71 19
131 216 124 435
28 ::_::
l.l,849
I< :i.11 f~,.J •If l"'ct,
24 1 :I.
1 ~.) 37 12
2 .I.
4 n ()
24
u 615
'• H (), :I. o. 1 1, 7 4,3 1 ,4 (), 2 (),.I. o. () 1:;• I ,JiD
21C !),() O,? 7,6
72 u I~:.) :1.6 :I., B 22 :? I{~ 14 1..6 23 2. 7
:I. (), 1 8 0,9
o.o 3'.'"i 4, :I. 24 2,8
B O,'il 21 ::?.,4
3 0,3 13 1, '".\
1 0.:1. :I. (). 1 7 O,B 3 0,3
:1.3 :L. :s 30 3,S 1 :I. 1, ;-5 '.'"i:l 6,0 26 3,0
9 LO 2::.~ 2 I 6
0,0 27 3,1
:I. O,l. 15 1,7 63 7,4
4 0,4 o.o
6 0,7 23 2,7
6 0,7 2B 3,3
1 0,l. o.o
846 100,0
I11~iu1·ed I Pct,
12() .. ,
j ... , .. I
no :1.86
43
8
:1.74 :I. 3,S
39 T:Vi'
2,6 0.1 0,3 2.9 4,1 0,9 0,:1. 0.1 0.0 3,9 3.0 0,0 ().8 7,6
282 6.3 97 2.1
1:1.9 2,6 63 :1.,4
175 3,9 15 0,3 26 o.s 12 0,2
230 S,1 E~5 1,9
118 2,6 101 2,2
17 0,3 62 1,3
3 0,0 S 0,1
49 :l,O 11 0,2 47 1,0
138 3,0 10 0.2
319 7,1 95 2.1 36 0,8 54 :1.,2
o.o 123 2.7
12 0,2 81 1,B
5:ll 1:l,4 34 0,7 10 0,2 54 1.2 69 1.s 42 0,9
138 3,0 B 0,1
o.o 4,455 100,0
·1 otal I Pct,
:1.44 6
:1.8 :l 4'".'i 2:~3
~:.) ~.=; 9 Cy
222 U,O
47 404 354 113 141
77 198
16 34 12
265 :1.09 126 122
20 75
4 6
56 14 60
168 21
370 121
45 76
:I.SO 13 96
574 38 10 60 92 48
:l66 9
5,301
'"} ··.• ,:: .. ,'
0,1 0,3 2.7 4.2 :1.,0 0,1 0,1 ().() 4,1 3,0 0,0 O.E! 7.6 6.6 2,1 2,6 L4 3,7 o. 3 0,6 (). 2 4,'l 2.0 2.J 2. ~-3 0,3 1, 4 (),() o. :I. 1,0 (). :i 1, 1 3,1 0,3 6,9 2.2 0,8 1,4 o.o 2,8 0.2 :l,8
:L0,8 0,7 0,1 1,1 1,7 0,9 3,1 0,:1. o.o
100,0
Vet·1:i.c::J.es ~~e~:i.~;te1'ed
(()0~))*
2v723 2/0
1,618 1,452
15,622 2,200 2v152
j81 :.?6:::
(1 y :?~=-=_; (]
3 Y 15?:I. 1::·,··,1::· ••'A•:.,.J
/{,? "_? y l 4~::; 3,731 2YJBO 2 ,,()()/ 2,489 ;:, '4/1.,
/'".\() 2,649 3,363 f.,,241 2, 9~=.)6 1, '.'"i24 3,:1.44
706 :I., 2~5/
~546 626
4,489 943
/y 04!5 4, 1/'"'j
606 7,749 :.! , 40'.'i 1,948 Bdl.2
624 :l,B96
~:iB7 2,C>BO 9,7t:i9
96:l 337
:~, :no 3,007 1,074 ~!,794
::3<, l.
147,718
C -::i -::; u d l t ·i. c-: ·::; r·•· (? r J.(),()()() !J(~~l-~::·L1'~'tJ.C:)1··1·
I\ :i.11 t•.1d J r·1 .. J1.1 l"'E,(l ·1 u L ::i J
(),()f3 0,03 0,00 0,10 0,02 o.os 0,00 0,U/ ().0() 0.07 0.06 o.oo 0,10 0,09 ()il.9 0.()6 0,11 o.os 0,09 0,01 0,03 o.oo o.os 0,08 0,05 0,06 0,04 0,:1.0 0,01 0,01 0,01 0.03 0,0:l 0,07 0,1B 0,06 0,10 0.04 0,02 0,00 0,14 0,01 o.os 0,06 0,04 o.on 0,01 0,07 O,OS 0,10 0,02 0,00 0,01
()144 0,18 0,10 0.89 0,11 0,19 0,03 O,Jl ().0()
0,37 Cr~()() (). ~_;_;:1_ o. 4)' 0 ,. ·71_=_:; (), 40 0.59 0.25 0,70 0,20 0,09 0,03 0,36 0,28 0.77 0,32 0,24 0,49 0,05 0,08 0.10 0,11 0,05 0,33 0,16 0,41 0,39 0,18 0,06 0,00 0,65 0,20 0,30 0.52 0,35 0,30 0,16 0,23 0,39 0,49 0.20 0,00 0,36
o.s2 0.22 0,11 1,00 0,14 0.25 0,04 U,/~ 0.()() () 315 0,44 0.0() 0,6:1. 0.56 0,94 0,47 0,70 0,31 0,80 0,21 0,12 0,03 0,42 0,36 0,82 0,38 0.28 0,60 0,07 0,09 0,12 0,14 0,07 0,40 0.35 0,47 0,50 0,23 0,09 o.oo 0,79 0.22 0,35 0,58 0,39 0,30 0,18 0,30 0,44 0,59 0,23 0,00 0,36
*NOTE: Estimated fisures sUPPlied bw Federal Hishwaw Administration
C'l I
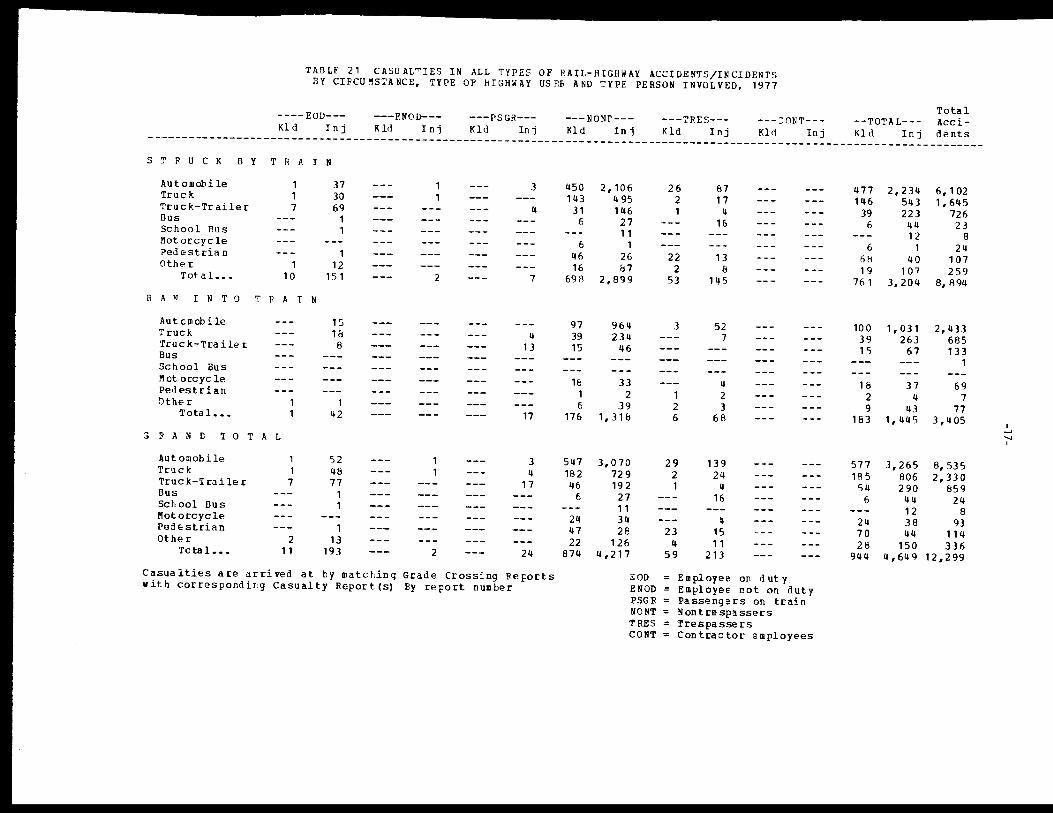
TABLE 21 CASUALTIES IN ALL TYPES OF RAIL-HIGHWAY ACCIDENTS/INCIDENTS BY CIFCU IISTA NCE, TYPE OF' HIGHWAY US F.R AND TYPE PERSON INVOLVED, 1977
----EOD---Kld Inj
--ENOD---K ld In j
---PSGR---K ld In j
---NoNr---Kld In j
---TRES---Kld Inj
---:ON'l'---Kld Inj
Total --TOTAL--- Acci-Kld Inj dents -----------------------------------------------------------------------------------
S T P U C K B Y T R A I N
Automobile Truck Truck-Tr ail er Bus School Bus Motorcycle Pedestrian Other
Tot a 1 •••
1 1 7
1 10
RAN INTO TRAIN
Autcmobile Truck Truck-Trailer Bus School Bus Mot or:cyc le Pedestrian Other:
Tota 1 •••
; E A N D T O T A L
Automobile True.le Truck-Tcailer Bus School Bus l'lotorcycle Pedecstrian Other
Total. ••
1 1 7
2 11
37 30 69
1 1
1 12
151
15 1& 8
1 42
52 4& 77
1 1
1 13
193
2
2
3
4
7
4 13
17
3 4
17
24
Casualties ace arrived at by matching Grade Crossing Reports vith correspondiDg Casualty Report(s) By report number
450 143
31 6
6 46 16
698
97 39 15
16 1 6
176
547 182 46
6
24 47 22
874
2,106 495 146 27 11
1 26 &7
2,899
964 234
46
33 2
39 1, 31 &
3,070 729 19 2
27 11 34 28
126 4,217
EOD ENOD PSGR NONT TRES CONT
26 2 1
22 2
53
3
1 2 6
29 2 1
23 4
59
&7 17
4 16
13 8
145
52 7
4 2 3
68
139 24
4 16
4 15 11
213
Employee on duty Employee not on duty
= Passengers on train = Nontrespassers = Trespassers = Contractor employees
477 2,234 146 543
39 223 6 44
12 6 1
68 40 19 107
761 3,204
100 39 1 5
18 2 9
183
577 185
54 6
24 70 28
944
1,031 263
67
37 4
43 1,445
3,265 806 290
44 12 38 44
150 4,649
6,102 1,645
726 23
8 24
107 259
0. 894
2,433 685 133
1
69 7
77 3,405
8, 535 2,330
859 24
8 93
114 336
12,299
I ....., I
1:;:ail road
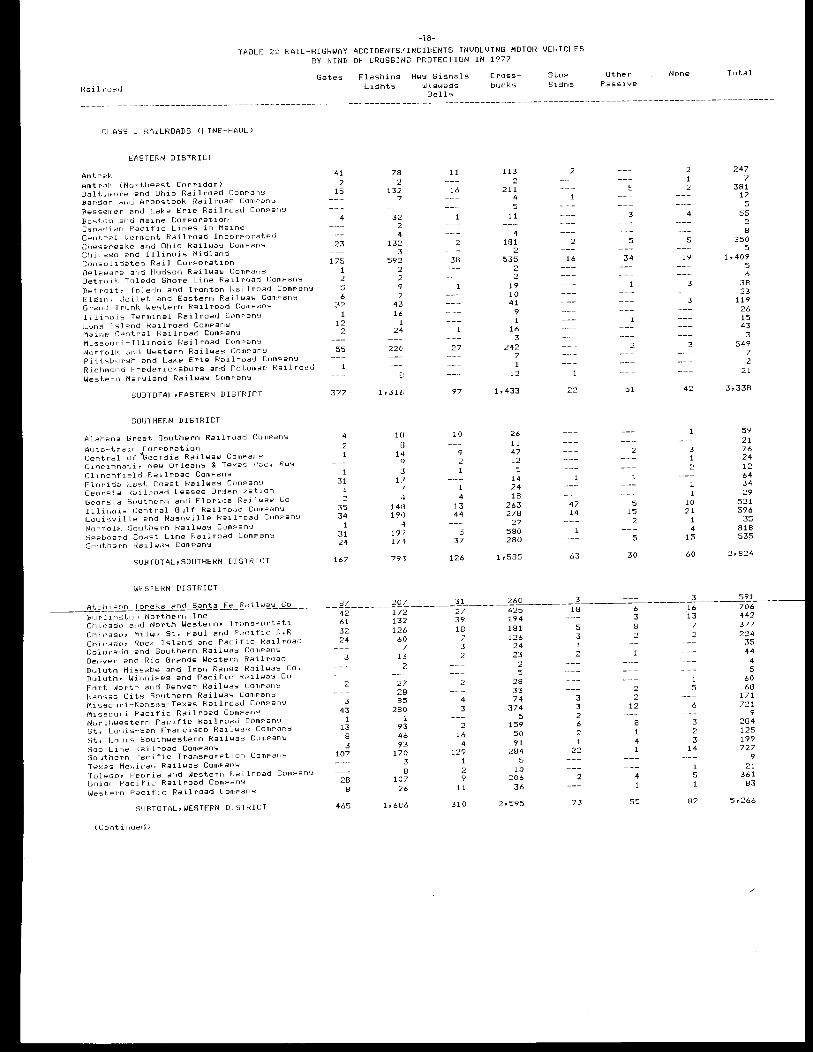
-18-TABLE 22 RAIL-HIGHWAY ACCIDENTS/INCIDENTS INVOLVING MOTOR VEHICLES
BY KIND OF CROSSING PROTECTION IN 1977
Gates Flashins Hww Sisnals Lishts Wiswass
Bells
Cross-bucks
Stop Sisns
Other Passive
None Total
---------------------------------· . - -- --- ------------------------------------------------------------------------------------
CLASS 1 RAILROADS CLINE-HAUL)
lASTERN DISTRICT
Amtrak Amtra~. (Northeast Corridor) Baltimore and Uhio Railroad ComPan~ Ban9or and Aroostook Railroad ComPanY Bessemer and Lake Erie Railro3d ComPanY Bostan 2nd Maine Corporation Canodiar1 f-·acific Lines in Maine C8ntral Ver·mont Railroad Incorporated Chesapeake and Ohio Railwa~ ComPanY
and Illinois Midland (:onsolidated Rail Corporation Delawdre arid Hudson Rai lwa>::: Corr,Pan~ Detroit Toledo Shore Line ~ailroad Compan~ Detroit, foledo and Irontor, l~aitroad ComPanY l~ls1r1~ ~lo1let and Eastern Railwa~ Company Grand Trunk Western Railroi=d Company Illinois ·rerminal Railroad ComPanH J_uns Island Railroad ComPar1w Maine Central Railroad Compan~ Missouri-Illir1ois Railroad Compan~ Norfolk and Western Railwa~1 ComPanY l~lttsbursh and Lake Erie R~iilroad ComPanY l~ichmond Fredericksburs and Potomac Railroad Western Maryland Railway Cc)mPanY
SUBTOTAL,EASTERN DISTRICT
SOUTHERN DISTRICT
Alabama Great Southern Railroad Compar)Y Auto-train Central uf teor~ia RailwaY ComPan~ C1nc1nnat1, New Orleans & ·rexas Pac. RwY Clinchfield Railroad ComPa11Y Flo1·1da East Coast RailwaY ComPan~ Geor5ia ~~ailroad Lessee Orsan1zation Geor5ia Southern and Flori,ja Railwaw Co lll1no1s Central Gulf Railroad Co1hPan~ l_ou1sv1lle and Nashville R3ilroad ComPan~ Norfolk. Southern Railwa'3 CarnPanY Seaboard Coast Line Railroad Compan~ Southern ka1lwa'3 CornPanY
SUBTOTAL,SOUTHERN D!SfRlCT
WESfERN DISTRICT
41
15
4
23
175 1 2 5 6
32
12 2
55
377
4 2
1 31
1 2
35 34
1 31 24
167
78 2
132 7
32 2 4
132 3
592 2
9 7
43 le
1 24
22(•
El
1,316
HI B
14 " J
1".7 1 ,I
14>3 19<)
4 197 174
793
11
16
2
38
27
97
10
9 2
4 l.3 44
5 37
126
113 2
211 4 5
11
4 181
2 535
2 2
19 10 41
9 1
16 3
242 7 1
12
1,433
26 11 47 12
5 14 24 18
263 278
27 580 280
1,585
2
2
16
22
47 14
63
5
3
5
34
2
51
2
5 15
2
5
30
27 39 18
__ Atchison fopeka and Santa Fe F~a1lwaY Co _____ El7 ______ 207 _____ 31. _____ 260 ___ 3, ______ _ 6 3 8
42 61 32 24
172 132 126
425 194 181 126
18 B1Jrl1n~ton Northern Inc Ch1ca~o and North Western, Ch1cas0, Milw~ St+ Paul and Pacific R.R Ch1.caso~ Rack Island and Pacific Railroad Colo1·ado and Southern Railway CornPan~ Denver and Rio Grande Western Railroad Duluth Missabe and Iron Range Railwa~ Co. Duluth~ Winnipeg and Pacific· kailwa~ Co 1~ort Worth and Denver Railway ComPa11w Kansas CitY Southern Railway Company Missouri-Kansas-Texas Railrllad ComPanY Missouri Pacific Railroad ComPanY Norttiwestern Pacific Railroad ComPanY St. Louis-San Francisco Railway ComPanw St. Louis Southwestern Railwa~ ComPanY Sao Line Railroad Company Southern F'acific TransPoret1on ComPanY ·rexas Mexican RailwaY ComFanY foledo, Peoria and Westerr, Railroad Company Union Pac1f1c Railroad Con,par1Y Western Pacific Railroad ComPanY
SUBTOTAL,WESTERN DISTRICT
(Continued)
3
2
3 43
1 13
8 3
107
28 8
465
60 7
13 2
27 28 85
280 1
93 46 93
170 3 8
107 ,6
1,6E'6
7 3 2
2
4 3
2 16
4 129
1 2 9
11
310
24 23
2 5
28 33 74
374 5
159 50 91
284
10 206
36
2,59:".J
5 3 1 2
3 3 2 6 2
2
73
2 2
12
13 1 4 1
4
55
2
2
4
5
19
3
3
3
42
3 1 2
1 1
10 21
1 4
15
60
3 16 13
7 2
5
6
3 2 3
14
5
82
247 7
381 12
5 55
2 8
350 5
1,409 5 6
38 23
119 26 15 43
3 549
7 2
21
3,338
59 21 76 24 1 '") 64 34 29
521 596
35 818 535
2,824
591 706 442 377 224
35 44
4 5
60 68
171 721
9 284 125 199 727
9 21
361 83
5,266
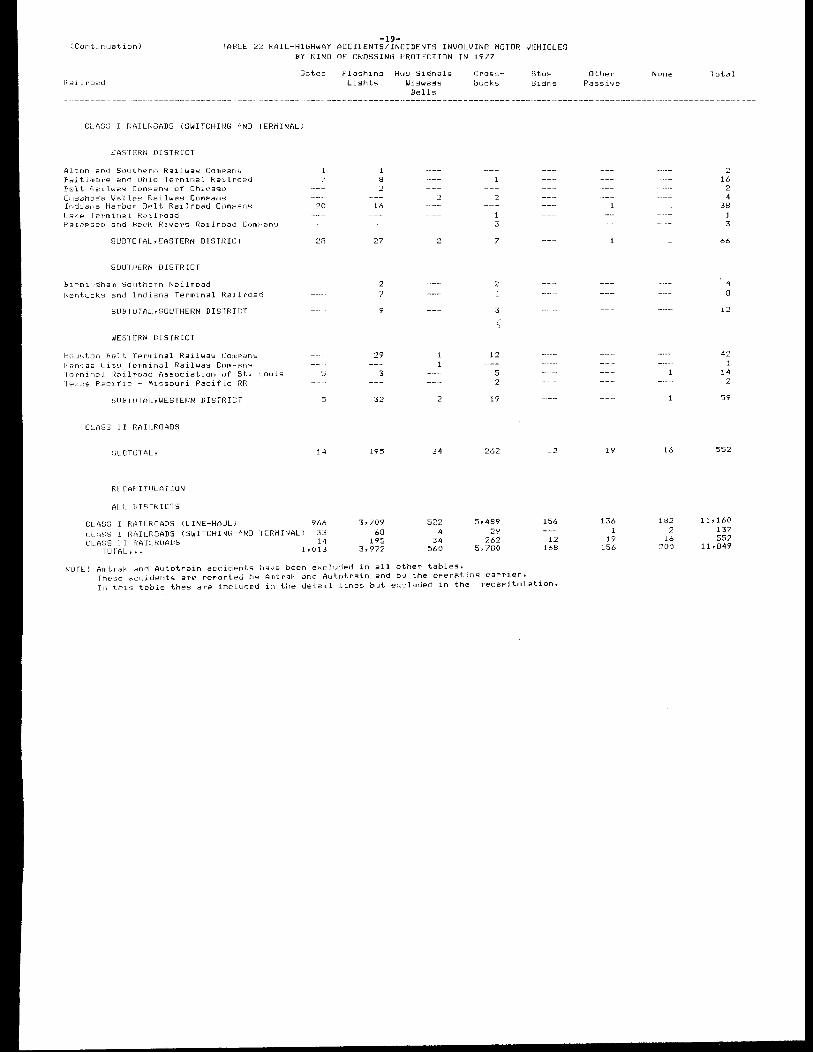
-19-~Cont1nuatiun) TABLE 22 RAIL-HIGHWAY ACCIDENTS/INCIDENTS INVOLVING MOTOR V~iICLES
BY KIND OF CROSSING PROTECfION IN 1977
CLASS I RAILROADS (SWITCHING AND TERMINAL)
EAS"fERN DISTRICT
Alton and Sout~ern Railway Company B~ltimore anrl Ohio Terminal Railroad Belt Railwa~ ComPanw of Chica~(J C1_1\::1dho:=.:1a Valley Railway ComP-ani::1 lndian3 Harbo,· Belt Railroad C11mPans Lake f"erm:i.na.l. Ra1 .l r-oad P,~taPsco and Back Rivers Railr!Jad Com~arrv
SUBTOfAL,EASTERN DISTNICI
SOUTHERN DISTRICT
B:i. rmi1·1sham Sout.ht-)r'n Rail road l\c~'r1tucY. y and Ir·1d.i.ana Terminal l~a1 J. road
SUBTOTAL,SOUTHERN DIS"fRICf
WESTERN DISTRICT
Houston Belt Terminal Railway ComPanY l\ansas City ·rerm1nal Railway C11mPar1~ ferminal Railroad Association of St. Louis le:~as F'2c1fic - Missouri Pacific RR
SUBlDfAL,WESTERN DISTRIC!
CL.ASS lr RA.I.L_ROADS
'.3U.BTOTf\L,
f<ECe,F'ITULATION
ALL i:usnncrs CL.ASS I RAIL_ROADS (LINE-HAJL;
20
2B
5
l4
966 CLASS 1 RAILROADS (SWITCHI~G AND ·rERMlNAL) ,l:l
14 l,OLl
CLASS 11 RAILROADS TCJTt,l.. •• ,
Flashins Hi,Y Sisnals Lishts Wiswass
1 8 2
16
27
7
9
3
32
195
3,709 68
195 3,972
Bells
2
2
34
522 4
34 560
NOTE: Amtrak and Autotrain accider1ts have been excluded in all other tables+
Cross~~ bucks
1 3
7
3
(
12
5 2
19
262
5,489 29
262 5,780
12
156
12 168
These accidents are rePorteci b~ Amtrak and Autotrain and b~ the oPeratin~ carrier+ Ir1 this table theY are included in the detail lines but ex~luded in the recaPitulation+
Other None
J.9 l6
136 1,32 1 2
19 16 156 200
Total
16 2 4
38 1 3
66
4 8
12
42 :l
14 2
59
552
11,160 137 552
11,849
Stat,r.-~
Alabama Alaska Arizona Arkansas California Colorado Cor·1r)ectic1Jt Delaware Distric:~·t of (:c)lumbia Florida (3ear~ia Hawaii Idaho Illinois lr)diana Iowa Kar)sas Kentuckw louisiar)a Maino Marwland Massact1usetts Michiaan Minnesoti~ MississiPPi Missouri Montana Nebraska Nevada New HamPshire New Jer~ie~ New Mexico New York North Carolina North Dakota Ohio Oklahoma Oreaon Penns~lvar)ia Rhode Island South Carolina South Dakota ·l·ennessee Texas Utah Vermont Virainia Washinaton West Virainia Wisconsin w~omin~ Puerto Rico
Tc,tal ~+•••
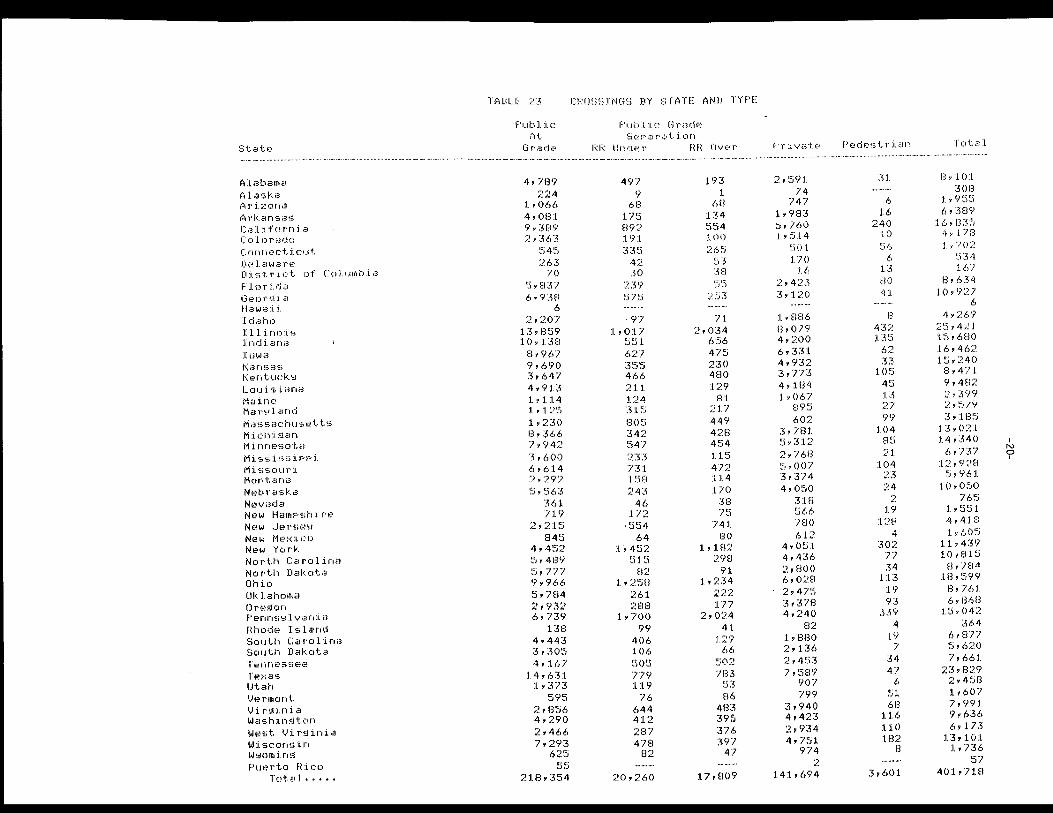
TABLE 23
Publ. :i.c ,'\t
G r-c~r:.it:~
4,789 224
1,066 4,081 9,389 2,363
545 263
70 5,837 6,938
6 2,207
13,859 10,138 8,967 9,690 3,647 4,913 1,114 1,125 1,230 8,366 7,942 3,600 6,614 2,292 5,563
361 719
2,2:1.~) 845
4,452 5,489 5,777 9,966 5,784 2,932 6,739
138 4,443 3,305 4,167
14,631 1,373
595 2,856 4,290 2,466 7,293
a,J JJ
218,354
CROSSINGS BY STATE AND TYPE
F'•.Jb:Li.c (3ri3de SePar~~tior)
RR Under RR Over
497 9
68 175 892 191 335
4? 30
239 ~.)7~7j
97 1,017
551 627 355 466 211 124 315 805 342 547 233 731 158 243
46 172
.554 64
1,452 515
8? 1,258
261 288
1,700 99
406 106 505 779 119
76 644 412 287 478
87
20,260
193 1
68 134 ~):j4 100 2.:":-,~.=;
'.53 3B 1::·1::· ., .. ,,,.,
:~~=.:; :5
71 2,034
656 475 230 480 129
81 217 449 42B 454 115 472 114 170
38 /J
741 80
1,182 298
91 1,234
222 177
2,024 41
129 66
502 783
53 86
483 395 376 397
47
l.7,809
l'·'r:i.vat.r!
2,591 74
747 1,983 ~,/60 1,514
501 170
16 2,423 3,120
1,B86 8,0/9 4,200 6,331 4,932 3,773 4,184 1,067
895 602
3,781 5,312 2,768 5,007 3,374 4,050
318 566 780 612
4,051 4,436 2,800 6,028 2,475 3,378 4,240
82 1,880 2,136 2,453 7,589
907 799
3,940 4,423 2,934 4,751
974 2
l.41,694
F°(-:~ dc::-~~3 t T' :i. an
31
6 16
240 10 56
6 13 80 41
8 432 135
62 33
105 4~ J
13 27 99
104 85 21
104 23 24
2 19
128 4
302 77 34
113 19 93
339 4
19 7
34 47
6 51 68
116 110 182
8
3,601
Total
8,101 308
1,955 6,389
l.6,035 4Y178 1,702
534 167
8,634 10,927
6 4,269
25,421 15,680 16,462 15,240 8,471 9,482 2,399 i,~/9 3,185
13,021 14,340 6,737
12,928 5,961
10,050 765
1,551 4,418 1,605
11,439 10,815 8,784
18,599 8,761 6,868
15,042 364
6,877 5,620 7,661
23,829 2,458 1,607 7,991 9,636 6,173
13,101 1,736
57 401,718
I
"' 0 I
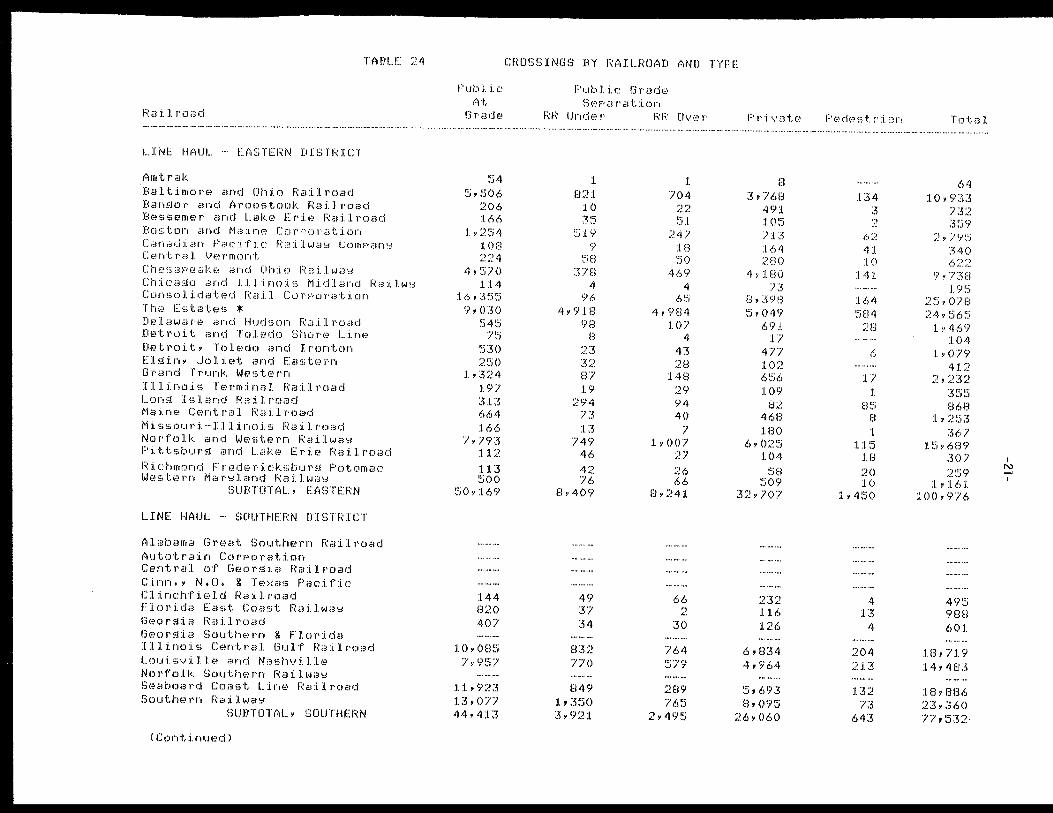
TABLE 24
Ra :l l road
LINE HAUi... - EASTERN DISTRICT
Amtrak Baltimore and Ohio Railroad Bansor and Aroostook Railroad Bessemer and Lake Erie Railroad Boston and Maine Corporation Canadian Pacific Railway Company Central Vermont Chesapeake and Ohio Railway Chicago and Illinois Midland RailwY Consolidated Rail Corporation The Estates* Delaware and Hudson Railroad Detroit and Toledo Shore Line Detroit, Toledo and Ironton Elsin, Joliet and Eastern Grand Trunk Western Illinois Terminal Railroad Lons Island Railroad Maine Central Railroad Missouri-Illinois Railroad Norfolk and Western Railway Pittsburg and Lake Erie Railroad Richmond Fredericksbure Potomac Western Marwland Railway
SUBTOTAi..., EASTERN
LINE HAUL - SOUTHERN DISTRICT
Alabama Great Southern Railroad Autotrain Corporation Central of Georsia Railroad Cinn,, N,O, & Texas Pacific Clinchfield Railroad Florida East Coast Railway Georeia Railroad Georeia Southern & Florida Illinois Central Gulf Railroad Louisville and Nashville Norfolk Southern Railwaw Seaboard Coast Line Railroad Southern Railwaw
SUBTOTAL, SOUTHERN
( C1:lnt:i.nurid)
1-''ubl ic ,<1t
GradEi
54 5,506
206 166
1,254 108 224
4,570 114
16,355 9,030
545 /J
530 250
1,324 197 313 664 166
7,793 112 113 500
50,169
144 820 407 ---
10,085 7,957
---11,923 13,077 44,413
CROSSINGS BY RAIL.ROAD AND TYPE
Public Grade Separation
RR Under RR Over
1 821
10 35
519 9
58 378
4 96
4,918 98
8 23 32 87 19
294 73 13
749 46 4? 76
8,409
49 37 34
---832 770 ---849
1,350 3,921
1 704
~-) 1') A",, .A',,
51 247
18 50
469 4
65 4,984
107 4
43 28
148 29 94 40
7 1,007
27 26 66
8,241
66 '
30 ---764 ~/7
---289 765
2,495
Pr:i.vatr:,
8 3,768
491 105 713 164 280
4,180 73
8,398 5,049
691 17
477 102 656 109
82 468 180
6,025 104
58 509
32,707
232 116 126 ---
6,834 4,964
---5,693 8,095
26,060
F·,.,·dest r :i. ;:in
B4 3 ,., ,:.:
62 41 :I. 0
141
164 ~'i[l4
2B
6
17 1
[l5 8 1
115 18 20 10
1,450
4 :I.~~
4
204 2.1.3
132 73
643
Total
/,4 10,933
732 :-:;:·:;<y
2, '/C/!.=_:j 340 622
9,73B 195
25,078 24,565
1,469 104
1,079 412
2,232 355 868
1,253 367
15,689 307 2~=:_;9
:I., 16 :I. 100,976
495 988 601
18,719 14,483
:1.8,886 23,360 77,532
I N
I
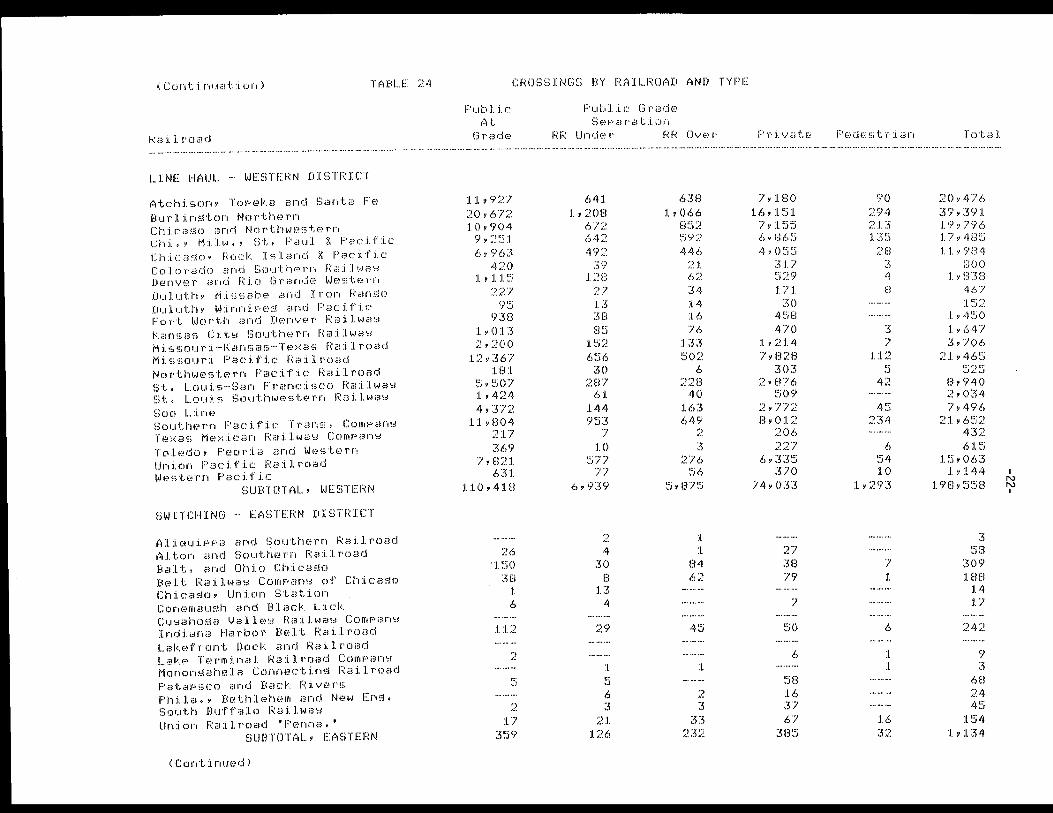
( Cc;nt :l nuat :l on) TtrBI ... E 24
Fla :i. l road
LINE HAUL - WESTERN DISTRICT
Atchison, Topeka and Santa Fe Burlin9ton Northern Chicaso and Northwestern Chi,, Milw,, St, Paul & Pacific Chicaso, Rock Island & Pacific Colorado and Southern Railwas Denver and Rio Grande Western Duluth, Missabe and Iron Ranse Duluth, Winnipeg and Pacific Fort Worth and Denver Railwas Kansas Cits Southern Railwas Missouri-Kansas-Texas Railroad Missouri Pacific Railroad Northwestern Pacific Railroad St, Louis-San Francisco RailwaY i:,t, Lou:i.i;; 130•1-t.hwi~;;;tE•irn F(ailwa\,i f:,oo Li nf.·) Southern Pacific Trans, Company Texas Mexican Railwas ComPanY Toledo, Peor:la and Western Union Pacific Railroad l.JE,stf:,rn Paci fie
SUBTOTAL, WESTERN
SWITCHING EASTERN DISTRICT
AliauiPPa and Southern Railroad Alton and Southern Railroad Balt, and Ohio Chica9o Belt Railway ComPanY of Chicaso Chicaso, Union Station Conemau9h and Black Lick CuYahoSa Valles Railway ComPans Indiana Harbor Belt Railroad Lakefront Dock and Railroad Lake Terminal Railroad Company Mononsahela Connectins Railroad PataPsco and Back Rivers Phila,, Bethlehem and New Ens, South Buffalo Railway Union Railroad "Penna,'
SUBTOTAL, EASTERN
( Cont inuc"d)
CROSSINGS BY RtrlLROAD AND TYPE
Publ:i.c ,,~t
Gr·aciE•
11,927 20,672 10,904
9,251 6,963
420 1,115
227 95
938 1,013 2,200
12,367 181
5,507 1,424 4,372
11,804 217 369
7,821 631
110,418
'") i ,.._.\.)
· 1 '.'.'.i() 30
:I. 6
:1.12
2
1::· -.. }
,., A:,
:1.7 3~.)''l
Publ:lc Grade Separation
F!Fi Und,")r
641 1,208
672 642 492
39 128
27 13 38 85
152 656
30 287
61 144 953
7 10
5/7 77
6,939
,., ,. ... 4
30 B
l3 4
2't
1 1::· ,.J
6 3
2J. 126
F(R Ov...:,·,,
6:rn 1,066
8'.'°i2 !:_:_;92 446
21 {:,~?
34 14 16 76
133 502
6 228
40 163 649
3 276
!:_:_;e.;
!;5, B?~~
1 1
B4 62
. ,,,. "t,.I
1
r) "~· :~
33 232
i::· r :i. vatE•
7,180 16,151
7,155 6,865 4,0'."j~j
317 ~-:_i29 171
30 458 470
1,214 7,828
303 2,876
509 2,772 8,012
206 227
6,335 370
74,033
27 :·3!3 79
7
~j()
f.,
~5B 16 37 f.,7
:~B'.')
Pc:-~t~<-:-:•s tr i an
90 294 213 135
28 3 4 n D
3 7
112 c:· ,J
42
45 234
6 ~'i4 :I. 0
:L,293
7 1
6
1 :I.
:I. t·) 32
Total
20,476 39,391 19,796 17,485 11,984
800 1,838
467 152
1,450 1,647 3,706
21,465 525
8,940 2,034 7,496
21,652 432 615
15,063 1,144
198,558
3 ~:;B
3()9 1BD
14 :I.?
242
9 3
6B 24 45
154 1,134
I N N I
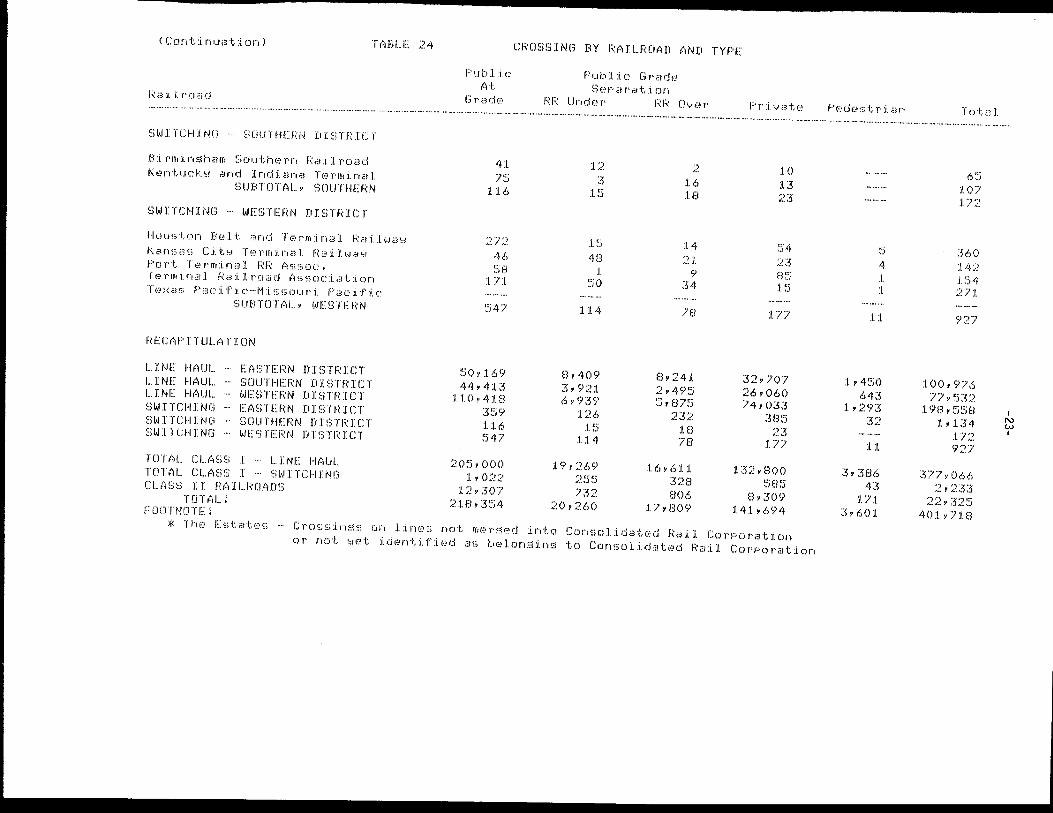
( Cc)nt :i. nuat :i. on) HiBI...E 24
1:~:a:i. l roaci
Sl,JITCHING SOUTHERN DISTRICT
B1rminsham Southern Railroad Kentucky and Indiana Terminal
SUBTOTAi..., SOUTHERN
SWITCHING - WESTERN DISTRICT
Houston Belt and Terminal Railway Kansas City Terminal Railway Port Terminal RR Assoc, ferminal Railroad Association Texas Pacific-Missouri Pacific
SUBTOTAi..., WESTERN
RECAPITULATION
1...INE HAUi... EASTERN DISTRICT LINE HAUi... - SOUTHERN DISTRICT LINE HAUi... - WESTERN DISTRICT SWITCHING - EASTERN DISTRICT SWITCHING - SOUTHERN DISTRICT SWilCHING - WESTERN DISTRICT
TOTAi... CL.ASS I - LINE HAUi... TOTAL CLASS I - SWITCHING CL.ASS II RAILROADS
TOTAL: FOOTNOTE:
P1.1b 1 :i. C
At Gradf'
4l 7'.'.\
l :1.6
27:.?. 46 ~:iB
:I. 7:1.
!_:_:;.4}
50,:1.69 44,4:1.3
110,4:1.8 359 :l.:1.6 547
205,000 1,022
:1.2,307 218,354
CROSSING BY RAIL.ROAD AND TYPE
Public Grade SeParation
RR Under RR Over
:1.2 3
:I. ~:i
l!_:=_;
48 1
!:=;o
1.14
B,409 3,921 6,939
126 15
1:1.4
1.9,·269 2!:)~=; 1:32
20,260
2 :1.6 :1.B
14 2:1.
9 34
7B
8,241 2,495 5,B75
232 :1.8 78
16,611 328 B06
17,B09
Pr :i. vat,;1
1.0 :1.3 23
~:)4 ;_,3 B~:i 1'."i
:1.77
32,707 26,060 74,033
385 23
:1.77
132,800 585
8,309 1.41,694
* The Estates - Crossinss on lines not mersed into Consolidated Rall CorPorat1on or not set identified as belonsins to Consolidated Rail Corporation
P<-:-!de,,; tr :i. an
~::; 4 1 1
11
1., 4~i0 643
1,293 32
:1.1
3,3B6 43
:I. 71 3,601.
Total
f.)15 107 :I. 72
360 142 1'54 271
92?
1.00,976 77,532
19B,55B 1.,134
:1.72 927
377,066 2,233
22,325 401,718
I N w I
Tl:(AFFIC
0 TO 251 TO 501 TO
1001 TO
250 500
1,000 5,000
5001 TO 10,000 MORE THAN 10,000
TOTAL!
TF!AFFIC
0 TO 250 251 TO 500 501 TO 1,000
1001 TO 5,000 5001 TO 10,000 MORE THAN 10,000
TOTAL:
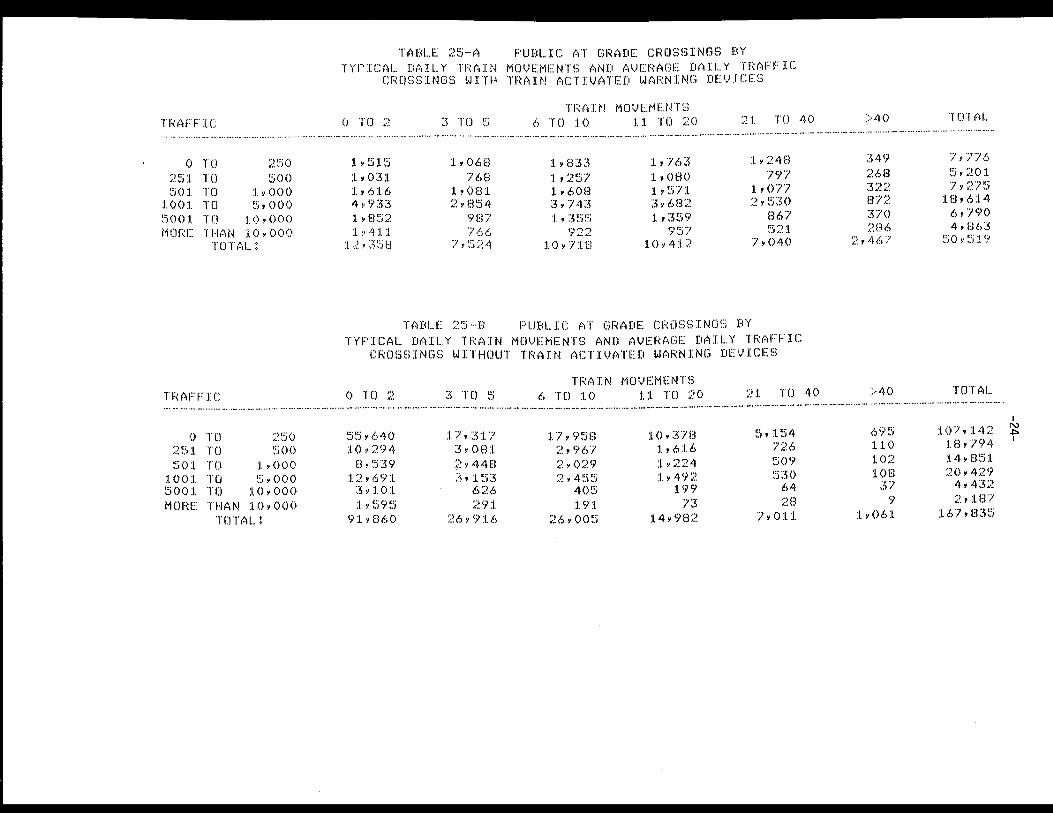
TABLE 25-A PUBLIC AT GRADE CROSSINGS BY TYPICAL DAILY TRAIN MOVEMENTS AND AVERAGE DAILY TRAFFIC
CROSSINGS WITH TRAIN ACTIVATED WARNING DEVICES
0 TO 2
1,515 1,031 1,616 4,933 1,852 1,411
12,358
3 TO ~5
1,068 768
1,081 2,854
987 766
7,524
TRAIN MOVEMENTS 6 TO 10 11 TO 20
1,833 1,257 1,608 3,743 1,355
lLL
10,718
1,763 1,080 1,571 3,682 1,359
0~7 7JI
10,412
21 TD 40
1,248 797
1,077 2,530
867 521
7,040
TABLE 25-B PUBLIC AT GRADE CROSSINGS BY TYPICAL DAILY TRAIN MOVEMENTS AND AVERAGE DAILY TRAFFIC
CROSSINGS WITHOUT TRAIN ACTIVATED WARNING DEVICES
TRAIN MOVEMENTS 0 TO ;! 3 TO ~:i 6 TO 10 11 TO 20 21 TO 40
>40
349 268 322 B72 370 2B6
2,, 4/)'.?
)40
TOTAi ...
·7!,1 77f:., 5,201 7,275
lB,614 6,790 4,863
50,519
TOTAL -------------------------------·
55,640 10,294 8,539
12,691 3,101 1,595
91,B60
17,317 3,0B1 ?•44B 3,153
626 291
26,916
17,958 2,967 2,029 2 !' 4~:.:;~:_:;
40!':i 191
2f.>, 00~:i
10,378 1,616 1,224 1,492
199 73
14,9B2
5,154 726 509 530
64 28
7,011
{0~ UlJ 107,142 110 18,794 102 14,851 108 20,429
37 4,432 9 2,1B7
1,061 167,B35
I N
I
:3t.at,f~
Al2ba1~3 Alask.a Arizorla Ark.at·)sas California Colorado c:cJnr,ec~ticut Delaware l):istr-:lc~·t of (::c>l~.1mbi.~1 1:~1ar:i.d~1J (3eorg1ft 1~~3Wi3i.J. lda~1(:) Illinoi l11dia11~3 Iowa l{a1·lsas l(e1·)t1.Jc:l~.~ !_()1Jisiarla Mi~ine Marwland MiiSSBChlJSetts Michi.~ar, Minr)esota M:ississ;iPPi Mi~;souri McJnt~irla Nebrftska Nevada New ~iamPshire New ~Jerse~ New Mexico New York North Carolina North Uakota Ohio Oklahoma Oresorl 1~en11s~lvania Rhode Island South Carolina S01Jt~, Dakota ·rennes!;ee ·rexas Utah Ver1nc)1·1t VirSinia Washinaton West Virsinia W:isconsi1·) Wwomins Puerto Rico
·rotal+••••
FOOTNOTE: FA - Federal Aid
TABLE 26 PUBLIC AT GRADE CROSSINGS BY STATE AND HIGHEST PROTECTION LEVEL
C1·o~;sj.r·1g!; Meeti11S M:irliml1m fit~indards Hishest Protection Laval
On FA Off FA S ~=i ·::; t (•:-~ m
°?~2:3 39
167 268
2,124 149
78 91
2 B1!5 472
135 1,367 1,223
931 622 395 316 137 117 287
1,306 634 170 661 129 509
46 100 296
92 667 785 283
1,357 331 367 671
15 647 139 141
1 v 2~)~j 99 66
418 408 184 829
61 13
22,737
b 1:; t (•:•~ n1
203 J
114 127
2,980 171 132
14
1 , 12~? 2:~·:7
70 2,104 1,303
401 246 315 309 203 115 301 784 359
63 385
83 167
71 596
76 1,098
746 JJ
1,729 2~·5 ~:) 373 859
14 130
29 257
1,653 115
59 334 392 116 517
43 3
21,804
Flashina Sis, WW Gate~; L.ist·1ts Be:Lls
139 1
145 115
2,263 75 47 30
/f.,? 20:::~
38 1,556
6?~~ 299 241 193 125
58 69
164 550 174
24 196
62 199
31 ,·:.1:;· ,: .. ,.J
358 74
692 212
/4 682
96 261 503
7 119
1 104 634
46 12
271 94 53
251 18
4 12,932
590 44
121 427
1,457 366 174
85 3
1,006 63E~
207 2v895 2,352 1,097
813 656 696 332 195 442
1,884 939 355
1,042 206 528
63 154 637 117
1,284 829 240
2,306 712 184
1,381 24
325 192 487
2v755 , ... 116 464 547 300
1,245 112
1 34,277
24
16 30
~:59::.~ 44
8
9 ?4
14 235 177 166 114
38 19 35 36 43 82 20 19
1513 10 66
3 16 32 11
104 30
97 59 79
110 19
J
J
18 150
14 7
45 60 20
435 8 2
3,310
~'.)Pc•:•~c:i.al F'rot
~=.=j 6 1n I.?~:=; 9(~)
2:1. !'.:}
69 94 4B 1?
J./B 1b6
21 347 283
B3 270 137
75 172
89 247 ?A7
45 59
159 21 16
6 lBO 415
12 519 2~)7
115 170 114 798
33 382
;30::; 100 123
~.=i? 24;3
63 ~S?
243 1
48 7,:'i74
Sia - Hiahwaw Traffic Sianals WW .... W i. ~Jwa~1s
bucks
3,491 145 603
2,91B 4,325 1,653
85 81 ,·11::· ,.-:.,.,
3 )' 34)' ~:.), :37 (.)
(;
1,B24 8v197 5r874 6,?91 7v950 2Y028 2,839
497 488 283
::_:;v?B7 6,466
395 4,557 1,765 4,459
215 305 644 605
1,560 3v599 5,060 6v235 4,535 1,824 2,816
28 3,313 2,993 2v'423 9,813
815 344
1,469 2,975 1,684 4,816
420
140,446
~:>tor:, Si:Jns
··"Jr:· / , •• 1
,., C)
21 96 22 lO
44 18
7 1::'. 96
6
() ,., 317
l ~=s 2
;?o 21
2,373 <:) ,., 4 4
<;>
6
:,\ 1B
2 l !=s
4 100
7B 1::· ,.!
1
~·36 3!=.=j
1::· ,.!
:I. 2
21 B :I. :I.
3, :"i:50
SPecial F'rot - Special warnir)S device not train activated, e¾s., crossins flagged b~ t1·ai.11 crew
Uth(,•r b :i. ~=.~ n ~;;
1 () 1
1 21
2 3
'1.07 11
:I. ~:=; 1 :I. 1
29 4
4 ... , ,.~: 2
43 2
2~::; 3 l
23 7 4 3 b
~=st> 24
17 11 1;>
44::.' 2
:I.B
1/ '.50
7 :1.4 :1.2
6 3 2
:l, 06B
None:
454 13 78
473 420 132 124
17 24
377 ~:_=;02
94 615 7:L6 324 299 5~36 813
16 191
47 233 275 350 491 223 268
36 26
120 20
234 ~=s20 399 499 197 35B 611
20 280 113 792
1,127 98 21
348 51B 343 299
63
l'..\,:l97
Total
4,789 224
1,066 4,081 9,389 2,363
545 263
/0 ~:_:; ~· B:3/ fi,93U
2,207 l.3,859 10,138
IIJ,967 9,690 3,647 4,913 1,114 1,125 1,230 8,366 7,942 3,600 6,614 2,292 5,563
361 719
2,215 845
4,452 5v489 5,777 9,966 5,784 2,932 6,739
13B 4,443 3r305 4,167
14,631 1,373
l~t"\1~ ,JI,.}
2,856 4,290 2,466 7,293
62'.7j l."'!'1;:· ,.J, .. ,
21B, 3'.54
I
"' tJ'1 I
Rai 1 r·oad
-26-
TABLE 27 PUBLIC Al GRADE CROSSINGS BY RAILROAD AND HIGHEST PROTECTION LEVEL
Crossings Meeting Minimum Standards Hi!:lhest f'rotection Level
On FA Off FA Flashins Sis~ WW s~stem Gates Listits Bell!:i
SPeCidl Prot
Cro:;;s-bucks
StDP Sisns
Ot11er S:i.sns None Total
------------------------··--------------------------------·--------·----------------------------------UNL HAUL - E/\STERN DISrnICT
Amtrak 16 Baltimore and Ohio Railroad 53/ Ban Sor ar1ci Aroostook Rai 1 T'oad 39 Bessemer and L.ake Erie Rai.Lro,id 20 Bostm1 arid Menne CorPorat1on 237 Canad1a11 Pac1f1c Railway C(JffiPanw 19 Central Vermont 23 Ct1esaPeake arid Oh10 Railwa•-1 ~'i99 Ctncaso arid .l 11 inoi.s Midland F\ai lw1::1 16 Consoliddted F~ail Corporation 2,295 "Ihe E.states * 991 Delawa,·e drld Hudson Railro.~d 93 Detroit and Toledo Shore Line 18 f1(:1t1·01t~ TolE:do and Ironton ?~i 1: .. LS1n, Jolic•t and Eastern 47 Grarici 1 r1ml--. Wi:.,>t:;tern ;_(~ii .[llino1s ·rer111inal Railroad 32 Lon:::l Jslai-1d Fiailroad 4'7 Maine:~ Cent,,a1 f\<Bilroad 81
Railroad 13 Norfol~ a11d Western Railwad 944 1:•1ti,::,bur~ arid Lake Erie Railroad 4 R1chn1or1d Fredericksburs Potomac 28 I..J<::.><:;tern Maru.Land Railwa':I 54
SUBTOTAL, EASTERN 6,485
um: HAUL SOUTHERN DISTRILr
Alabama Gre~t Southern Ra1l,aa€J Aul(Jtr~111 Corporation C,:!'ntra.! cif Geor·sia Railroad Cinn. :· N.D, & re:-~as Pacific c:11nchfield ~\ailroad r·1or~da Li,st Coast Rail.was (3enr~12 ~~ailroad (3ecl1'g1a Soutt,ern & Florida [.LJ.ii-101s Central Gulf RailT'1.1ad !_01Jisv1lle ar1d Nashville 1~orfoll--. Southern Railwaw '3eabuard Coast Line Railrcad '3ouli1<-?r'n f.:ailwaY
SUBTOTAL., SOUTHEI\N
14 112
21
781 692
:L,/43 1,03'5 4,398
26 613
44 20
208 11 49
347 14
2~657 l,024
195 28 98 76
220 19
254 121
5 990
20 22 60
J,121
11 406
23
695 922
1,253 794
4,104
4'' 202
6 13
176 3 9
240 7
1,665 363 145
24 16 66
248 5
273 29
1 521
18 27 '"),.)
4,121
6 363
10
406 293
714 35~:
2, 14/
11 1,175
80 34
288 35 79
898 39
4,473 l.,808
167 14
109 77
342
29 215
23 1,672
10 6
1:55 11,771
21 164
57
1,347 1,404
1,561 1,511 6,065
45 7
33 3 1
16 1
296 129
8
l 11
28
147 ,, -,
12 743
3
5
193 55
25 37
318
1:.5 .. 2
6
133 3
1,0:53 8:50
:~o 1 9
1.3 1•)2
.SJ
195 3
61 28
2,889
10 4
61
180 :18
~40 634
1, <-47
3,637 97
110 445
49 121
3,015 64
7,395 4,636
161 36
381 92
612 120
10 317 140
4,867 64 13
258 26,641
95 276 263
4,994 4,871
8,437 8,678
27,614
18
4
2 5
87 81
2
18
2 224
2
2,231 77
37 35
2,382
7
4
335 186
21
10
17 586
17 11
l1 37 n
307 4 3
50 6 8
311
1,051 977
21
14 1 7
18 1 6 2
363
26 13,194
9 12
9
717 1,028
~598 1,790 4,163
5-l 5~506
206 166
1,254 108 224
4,570 J.14
.l.6,355 9,030
54~j 75
530 250
1,324 197 313 664 166
7,793 112 113 500
50,169
144 820 407
10,085 7,957
11,923 13,077 44, 4Ll
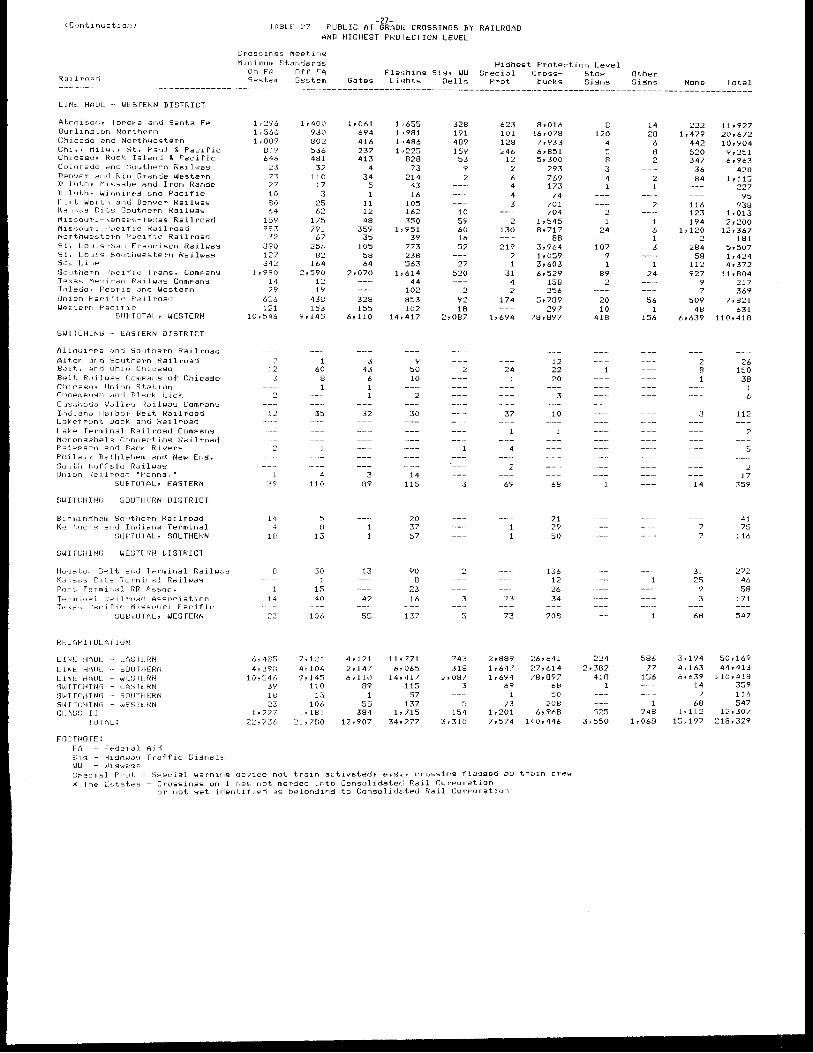
(C,-1nt1nu-;:;tion.l -27-1 ABLE 27 PUBLIC AT GRADE CROSSINGS BY RAILROAD
AND HIGHEST PROTECTION LEVEL
Cross1nss MeetinS Minimum Standards Hishest Protection Level
On FF1 '.J'::l'stem
Off FA S'::J'stem
Fla•ihing Sis, WW Special 1:ross- StoP Other Gates Lii;1hts Bells Prot bucks Signs Sisns
LINE HAUL - WESfERN DISTRICT
Atch1son, fw-•,:::ika anrj Santa Fe Burl:LnStor1 N,::ir+ .. h,:•rn (:h1caso and Northwestern Chi~, Milwv, Ht+ ~-·aul & Pacific Cn1caso~ Rae~ Island & Pacific
and ~outtiern Railwa'::l' D(:•r,ver a1"11j F~ LO Gr·ande Western D1Jl1Jth1 M1ssdbe and Iron Range D,Jluth• W1nn1PeS and Pacific F·JT't Worth anrj Denver Railwa'::l' K3ns~s Cit~ Southern Railwaw M 1 ~,sour i · ·l\ansa-::, -· f t~:;as Rai 1 road Missouri f)dc1fic RBilroad l'-k•rthwE~ster'r1 ~-·c;c1f1c Railroad St~ Lou1~,; ··ba:·1 1:··rancisco Railway St. L.ouis Southwetitern Railwa'::l' S,JCJ Line S,Juthern ~ac11'ic Trans+ ComPanw T•':'·•;a'!:, Me:<:i.can ka1 lwaw foledor and Western U11ion Pacifi,~ Railroad W•,;>~;tern f"•acif1c
SUBfOTAL, WESTERN
SlJ l TCHlNG EASfERN DISTRICT
Ali~uIPPa an,J SolJttrern Railroad Ali.on ar,d Souttiern Railroad B01t. arid Ohiu Chicago Bi?! t Ra1 ll.Ja'.~ ( 0111Par1'::l of Chica3o Chica::so, Unil)n Sta~ion C,memaush and Bldck Lick LIJ:;1al10Sa VallE:Y Fiailwaw ComP<:m'::l I11d1ana Harbor Belt Railroad L-3kefront Dock and Railroad Lake Terminal Railroad ComPanw MQn on::sahe J. a Con1·1ect i n9 Ra i 1 road l~dtaPsco 211d Back Rivers Pllilo., Bethlehem and New Ens. ~301rth H1.Jff'alo F~ailwa'::l U1·11,:ir1 ~<a1.l 1·c,d,_-j "F'.;.-~nrra, •
SUB"fUTAL, EASTERN
SWllLHlNLi - 60UfHLkN DISTRICT
B:.. ,-·m1r1.·3h<:nrr Sout.herr1 Railroad l\t?r1"!..1..1ck:.1 c'!r1d J.r·11J1ar1a Terminal
SUBfUTAL, SOUTHERN
SWlfLHlNG - WESTERN DISTRICT
Hou~.ton Belt and lerffiinal Railwc,~ K,3ns~s City ·1errn1nal Railway 1~1J1·t fermir1~l RR Assoc. r~rm1nal Ra1J.road Association fe·~as ~ac1fir·-Missouri Pacific
SUB1UTAL, WESTERN
L[Nf HAUL [ASIERN LIN£ HAUL ~OUTHERN LlNE HAUi. WlSfERN ~;WITCHING EAS"fERN '.3WifCHINLl ~OUTHE:RN swr,-cHING WES"iERN Cl_i~iS'."l I I
f OTAI..
FlllllNOlE: i:-·fi 1-·ed,::~ra.l Ajd t:is Histir,..1,3\1 rr·affic Sisnal<:: 1>.IW ~Jisw~.,gs
1_ l' 296 1. 1566 1,089
819 646
23 T3 2? 10 BO 64
159 993
32 390 127 342
1,990 14 29
656 121
10~~)46
12
39
l4 1/
HI
6 ., 48'.':i 4yJ":,)8
J.()y ~i4-'.:.> j,' !ti
1,227 '22~?36
1.,400 930 802 536 481
32 110
17 3
25 62
17'.':i 791
67 256
82 164
2,590 12 19
438 153
9,145
1 60
8 1
35
4 llO
ti 13
'.'.")() l
l :~; 40
J.06
7,121 4 ,:i.04 9, 14:i
110
106 J., 181
21,780
1,061 694 416 237 413
4 34
5
11 12 48
359 35
105 58 64
2,070
328 155
6,110
3 43
6 1 1
32
3 89
13
42
4,121 2,147 6,110
89 1
55 384
12,907
1,655 1•981 1,486 1,225
828 73
214 43 16
105 162 350
1 :• 951 39
773 238 563
1,614 44
102 853 102
14,417
9 50 10
2
30
14 115
20 37 57
90 8
23 16
1T7
11,771 6,065
14,417 115
57 137
1,715 34,277
328 191 489 159
53 9
10 59 60 16 52
27 520
2 92 18
2,087
2
3
5
74:l 318
2,087 3
5 1::,4
3,310
623 101 128 246
12 2 6 4 4 3
2 130
219 ,,
31 4 ,,
174
1,694
24 1
37
4
2
69
73
73
2,88CJ J.,647 1r694
69 .!
73 1,201 7,574
8,016 l6,078 7,933 6,851 5,300
293 769 173
74 701 704
1,545 8,717
88 3,1?64 1,059 3,603 6,529
158 256
5,789 '297
78,897
12 22 20
3
10
68
21
50
136 12 26 34
208
:?6 ,641 ~~7,614 /8,897
68 50
208 6,968
!L,O, 446
SPeci~L ~-1·ot - SP~cial warnir19 device nat trair, activated, e.s., crossing flas~ed b~ tr~in crew * The [stdte~ Crossings on lines riot merSed into Consolidateci Rail
or not yet ic1e11tif1ed 3s belor1Sins to Consolidc,ted Rail CorPoration
8 120
4 5 8 3 4 1
24
107 9 1
89 2
20 10
4Hl
224 2,382
418 1
525
14 28
6 8 2
2
,,
1 6 1 3
24
56
156
c,86 77
156
248 1,068
None
222 1,479
442 520 347
:36 84
116 123 194
1,120 2
284 58
112 927
9 7
509 48
6,639
2 8 1
3
14
7 7
31 25
9 :,
b8
Total
11,927 20,672 10,904 9,251 6,963
420 1,115
227 95
S'38 1,013 2,200
12,367 181
5,507 1,424 4,372
11,804 217 369
7,821 631
110,418
26 150 :,s
1 6
112
2
5
l.7 359
41 75
116
272 46 58
171
547
3,194 50,l69 4..163 44,413 6,639 ll0,418
14 359 7 116
68 547 1,:Ll.2 12,30'7
15,197 218,329
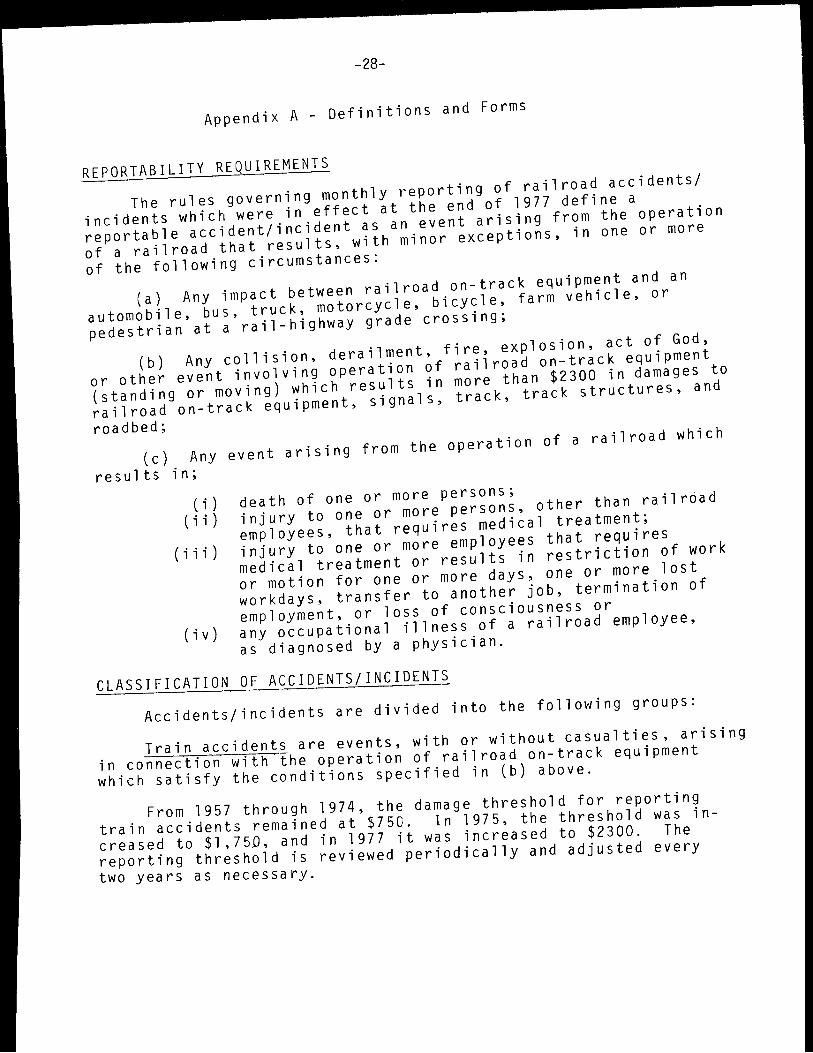
-28-
Appendix A - Definitions and Forms
REPORTABILITY REQUIREMENTS The rules governing monthly reporting of railroad accidents/
incidents which were in effect at the end of 1977 define a reportable accident/incident as an event arising from the operation of a railroad that results, with minor exceptions, in one or more of the following circumstances:
(a) Any impact between railroad on-track equipment and an automobile, bus, truck, motorcycle, bicycle, farm vehicle, or pedestrian at a rail-highway grade crossing;
(b) Any collision, derailment, fire, explosion, act of God, or other event involving operation of railroad on-track equipment (standing or moving) which results in more than $2300 in damages to railroad on-track equipment, signals, track, track structures, and
roadbed; (c) Any event arising from the operation of a railroad which
results in;
( i ) ( i i )
( i i i )
( i V )
death of one or more persons; injury to one or more persons, other than railroad employees, that requires medical treatment; injury to one or more employees that requires medical treatment or results in restriction of work or motion for one or more days, one or more lost workdays, transfer to another job, termination of employment, or loss of consciousness or any occupational illness of a railroad employee, as diagnosed by a physician.
CLASSIFICATION OF ACCIDENTS/INCIDENTS Accidents/incidents are divided into the following groups:
. Train_acci~ents are events, with or without casualties, arising in_connec!ion with the operation of railroad on-track equipment which satisfy the conditions specified in (b) above .
. From_l957 through 1974, the damage threshold for reporting train accidents remained at $750. In 1975, the threshold was in-crease~ to $1,750, and in 1977 it was increased to $2300. The reporting threshold is reviewed periodically and adjusted every two years as necessary.
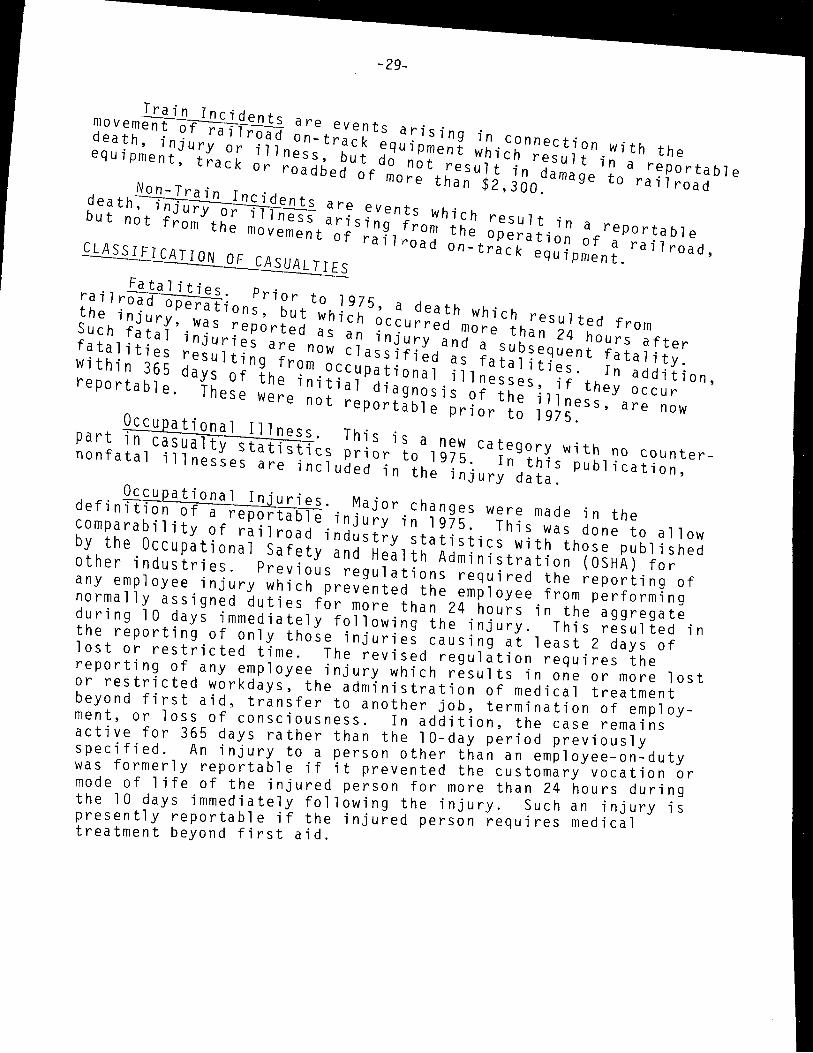
-29-
Train Incident movement f • s are events arisin · death, inJur;a~;rfad on-track equipmenf ;~i~~n~ection_with the equipment track o 11ness, but do not resu7t in isu1t in a reportab7e
, r roadbed of more than $2 30 amage to rai1road N , 0. on-Train In ·d
death, injur ~1 ents are events Which . but not fromyt~; ~11ness arising from the ~;!~~i· in a reportab7e
ovement of rai1road on-tr 10~ of a rai1road, CLASSIFICATION OF ack equipment. CASUALTIES
Fata1·t· ·1 - 1 ie2_. Prior to 1975 ;~; ~~jir~perations, but Which ~c~u~~!~hmwhich resu1ted from Such fata , .w~s ~eported as an in ·ur ore than 24 hours after fatalitie~ ~;~~ri~s are now class~fi~da~i ~a~~b~eguent fatality. within 365 days 1i;nfhfrom.o~cupationa1 illness!;~'~;·thln addition, reportable. These we~e ,~~~1al diagnosis ?f the illness~Ya~~c~~w
reportable prior to 1975. Occupational Illness Thi •
part in casualty statisti~s pri~ri~ categor~ with no counter-nonfatal illnesses are included . 0th . : In this publication,
1n e inJury data . . ~c~upational Injuries. Major changes were made in the
definition of a reportable injury in 1975 Th" d comparabilit f -1 . · is was one to allow
Y? ra1 road industry statistics with those published by the_Occupa~1onal Safety and Health Administration (OSHA) for other 1ndustr~e~. Pre~ious regulations required the reporting of any employee inJury which prevented the employee from performing normally assigned duties for more than 24 hours in the aggregate during 10 days immediately following the injury. This resulted in the reporting of only those injuries causing at least 2 days of lost or restricted time. The revised regulation requires the reporting of any employee injury which results in one or more lost or restricted workdays, the administration of medical treatment beyond first aid, transfer to another job, termination of employ-ment, or loss of consciousness. In addition, the case remains active for 365 days rather than the 10-day period previously specified. An injury to a person other than an employee-on~duty was formerly reportable if it prevented the customary vocatio~ or mode of life of the injured person for more than 24 hours during the 10 days immediately following the injury. Such an injury is presently reportable if the injured person requires medical treatment beyond first aid.
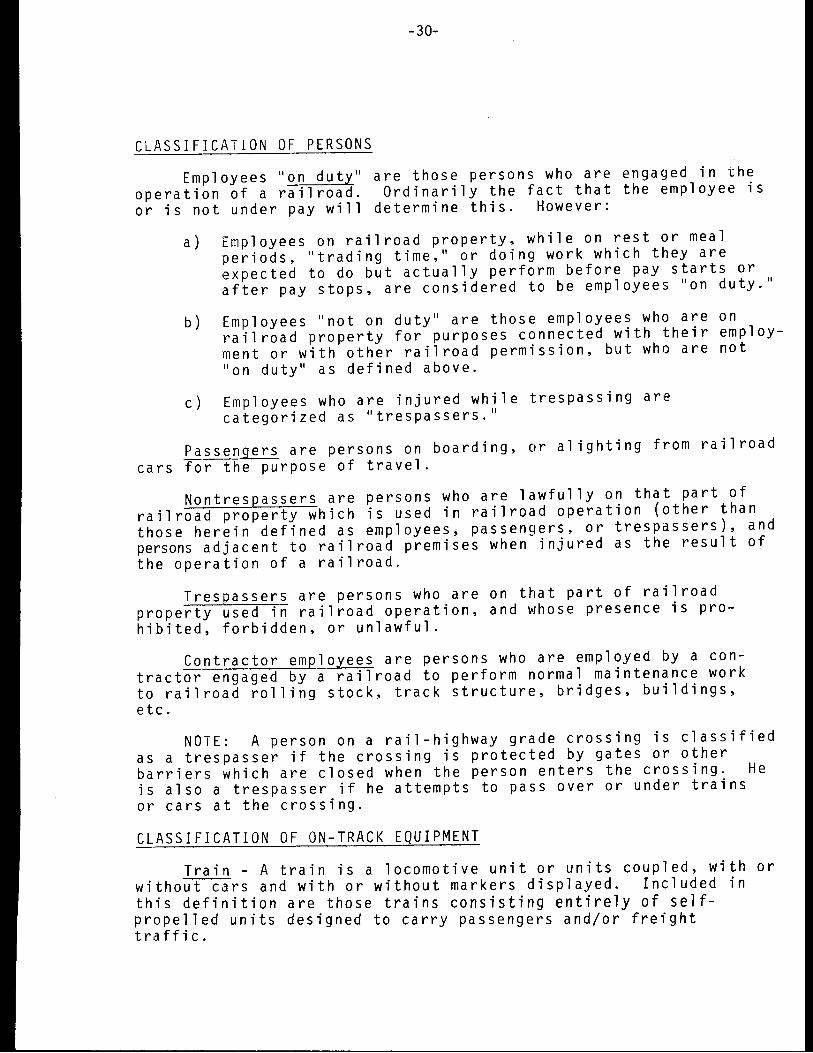
-30-
CLASSIFICATION OF PERSONS
Employees 11 0n duty 11 are those persons who are engaged in the operation of a railroad. Ordinarily the fact that the employee is or is not under pay will determine this. However:
a) Employees on railroad property, while on rest or meal periods, "trading time, 11 or doing work which they are expected to do but actually perform before pay starts or after pay stops, are considered to be employees "on duty. 11
b) Employees "not on duty" are those employees who are on railroad property for purposes connected with their employ-ment or with other railroad permission, but who are not "on duty" as defined above.
c) Employees who are injured while trespassing are categorized as 11 trespassers. 11
Passengers are persons on boarding, or alighting from railroad cars for the purpose of travel.
Nontrespassers are persons who are lawfully on that part of railroad property which is used in railroad operation (other than those herein defined as employees, passengers, or trespassers), and persons adjacent to railroad premises when injured as the result of the operation of a railroad.
Trespassers are persons who are on that part of railroad property used in railroad operation, and whose presence is pro-hibited, forbidden, or unlawful.
Contractor employees are persons who are employed by a con-tractor engaged by a railroad to perform normal maintenance work to railroad rolling stock, track structure, bridges. buildings, etc.
NOTE: A person on a rail-highway grade crossing is classified as a trespasser if the crossing is protected by gates or other barriers which are closed when the person enters the crossing. He is also a trespasser if he attempts to pass over or under trains or cars at the crossing.
CLASSIFICATION OF ON-TRACK EQUIPMENT
Train - A train is a locomotive unit or units coupled, with or without cars and with or without markers displayed. Included in this definition are those trains consisting entirely of self-propelled units designed to carry passengers and/or freight traffic.

-31-
Locomotive - A locomotive is a self-propelled unit of equip-ment designed for moving other equipment. It includes a self-propelled unit designed to carry freight and/or passenger traffic.
Car - A car is any unit of equipment designed to be hauled by locomotives, or any unit of on-track work equipment such as a track motorcar, highway-rail car, on-track crane, on-track ballast tamping machine, etc.
Equipment Consist - An equipment consist is a train, locomotive(s), cut of cars, or any single car not coupled to another car or locomotive.
Highest Protection Level - At those crossings where more than one form of crossing protection is in use, 11 Highest Protection Level 11
is determined by the following ranking:
Highest 1) 2) 3) 4) 5) 6) 7) 8) 9)
l O) l l )
Lowest 12)
Gates Cantilever Flashing Light Signal Standard Flashing Light Signal Wig Wags Highway Traffic Signals Audible Signal Crossbucks Stop Signs Watchman Flagged by Crew Other None
Daylight/Dark - Unless specifically listed, those accidents reported as occurring during dawn have been included in the daylight category. Likewise, those reported as occurring during dusk have been included in the dark category.
Minimum Standards for Crossing. The Second Annual Report on Highway Safety Improvement Programs from the Secretary of Transportation to Congress stated that a program to sign and mark all crossings is a high priority under the Highway Safety Act of 1973. Further, the report stated that the National Rail-Highway Crossing Inventory " ... will allow the states to identify those crossings which are not signed and marked in accordance with the Manual on Uniform Traffic Control Devices (MUTCD)." The Federal Highway Administration has specified the following minimum standards for signing and marking to be in accordance with the MUTCD: An automatic warning device or two reflectorized crossbuck signs, advance warning signs, and pavement markings if the highway approach is paved. In this publication, crossings having automatic warning devices are counted as meeting minimum standards except that multiple track crossings having automatic warning devices other than gates do not meet minimum standards.
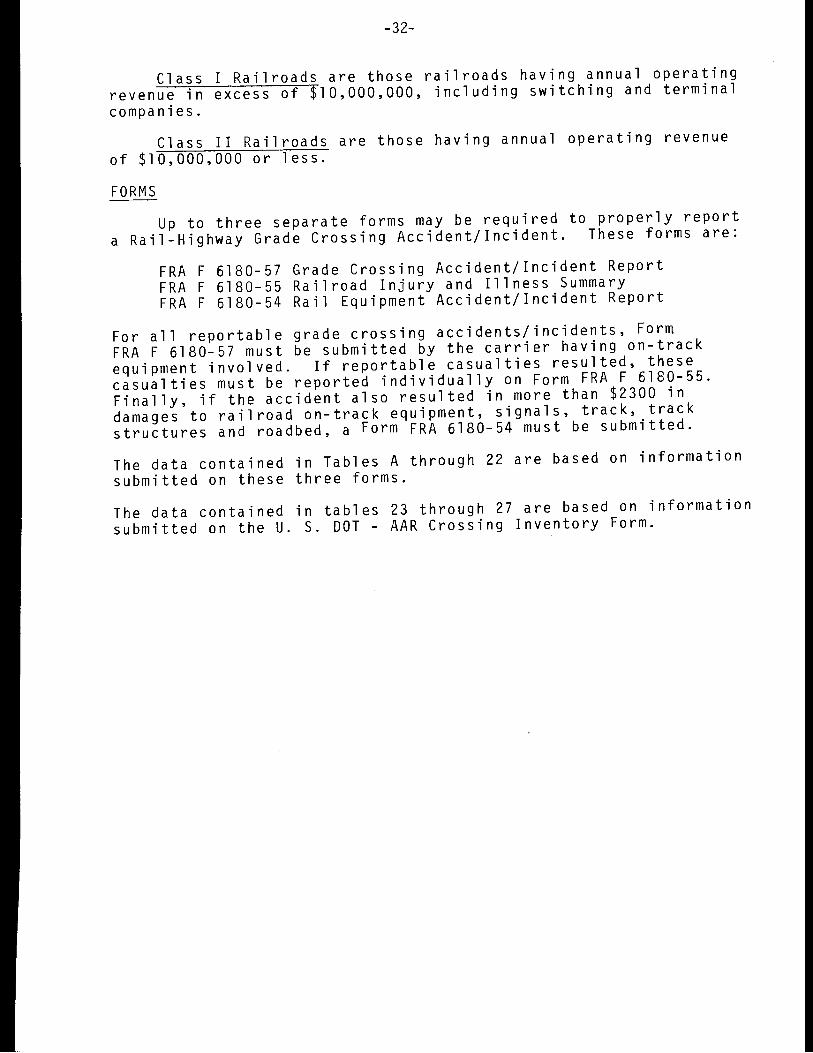
-32-
Class I Railroads are those railroads having annual operating revenue in excess of $10,000,000, including switching and terminal companies.
Class II Railroads are those having annual operating revenue of $10,000,000 or less.
FORMS Up to three separate forms may be required to properly report
a Rail-Highway Grade Crossing Accident/Incident. These forms are:
FRA F 6180-57 Grade Crossing Accident/Incident Report FRA F 6180-55 Railroad Injury and Illness Summary FRA F 6180-54 Rail Equipment Accident/Incident Report
For all reportable grade crossing accidents/incidents, Form FRA F 6180-57 must be submitted by the carrier having on-track equipment involved. If reportable casualties resulted, these casualties must be reported individually on Form FRA F 6180-55. Finally, if the accident also resulted in more than $2300 in damages to railroad on-track equipment, signals, track, track structures and roadbed, a Form FRA 6180-54 must be submitted.
The data contained in Tables A through 22 are based on information submitted on these three forms.
The data contained in tables 23 through 27 are based on information submitted on the U. S. DOT - AAR Crossing Inventory Form.
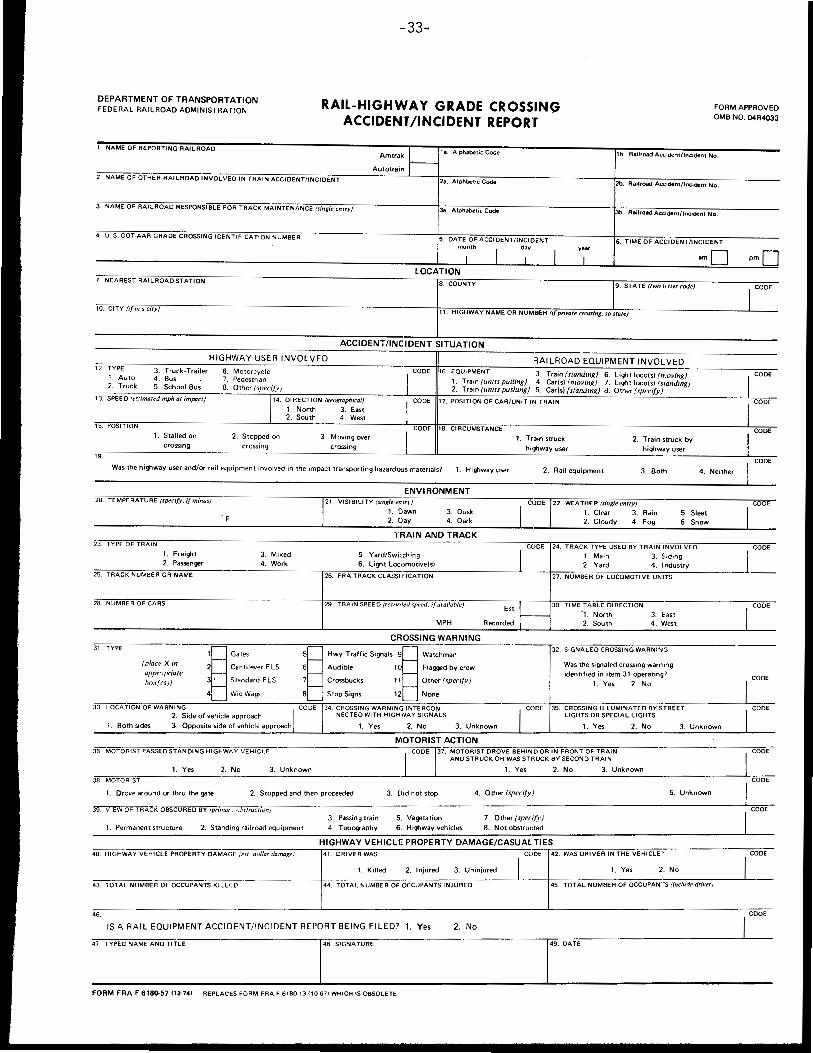
-33-
DEPARTMENT OF TRANSPORTATION FEDERAL RAILROAD ADMINISTRATION RAIL-HIGHWAY GRADE CROSSING
ACCIDENT/INCIDENT REPORT FORM APPROVED 0MB NO. 04R4033
1. NAME OF REPORTING RAILROAD Amtrak f--- la. Alphabetic Code 1b. Railroad Acc.dent/lnc1den1 No.
Autotrain 2. NAME OF OTHER RAILROAD INVOLVED IN TRAIN ACCIDENT/INCIDENT 2a. Alphbetic Code 2b. Railroad Acc•dent/lnc,dent No.
3. NAME OF RAILROAD RESPONSIBLE FOR TRACK MAINTENANCE (single entry) 3a. Alphabetic Code 3b. Railroad Accident/lnc11:tent No.
4. U.S. DOT-AAA GRADE CROSSING IDENT1 FICATtON NUMBER 5. DATE OF ACCIDENT/INCIDENT 6. TIME OF ACCIDENT/INCIDENT month
I day
I year
I I I LOCATION
7. NEAREST RAILROAD STATION 8. COUNTY 9. STATE (two letter code)
to. CITY {ifina city) 11. HIGHWAY NAME OR NUMBER (If private crossing, 10 stale)
ACCIDENT/INCIDENT SITUATION HIGHWAY USER INVOLVED RAILROAD EQUIPMENT INVOLVED
12 TYPE 3. Truck-Trailer 1. Auto 4. Bus 2. Truck 5. School Bus
13. SPEED (estimated mph al impact)
15. POSITION
19.
1. Stalled on crossing
6. Motorcycle 7. Pedestrian 8. Other ( specify J
2. Stopped on crossing
DI RE CTI ON (geographical) 1. North 3. East 2. South 4. West
3. Moving over crossing
I CODE 16 EQUIPMENT 3. Train (standing) 6. Light loco(s) (":oving)
1. Train (umts pulling) 4. Car(s) (moving) 7. light toco(s) (standing) 2. Train (units pushing) 5. Carls) (standing) 8. Other (spec,fy)
I I
CODE 17. POSITION OF CAA/UNIT IN TRAIN
CODE 18. CIRCUMSTANCE
1. Train struck highway user
2. Train struck by higlway user
Was the highway user and/or rail equipment involved in the impact transporting hazardous materials? 1. Highway user 2. Rail equipment 3. Both
ENVIRONMENT 20. TEMPERATURE (specify. if minus) 21 VISIBILITY (single enrry/ CODE 22. WEATHER (single entry)
4. Neither
'F 1. Dawn 3. Dusk 1. Clear 3. Rain 5. Sleet
23. TYPE OF TRAIN
1. Freiglt 2. Passenger
25. TRACK NUMBER OR NAME
28. NUMBER OF CARS
31. TYPE
(place X in apprnpriate box(es))
33. LOCATION OF WARNING
3. Mixed 4. Work
l~Gates 2 Ca.ntilever F LS 3' Standard FLS
4 W1gWa~
2. Side of vehicle approach 1. Both sides 3. Opposite side of vehicle approach
36. MOTORIST PASSED STANDING HIGI--WAY VEHICLE
2. Day 4. Dark 2. Cloudy 4. Fog 6. Snow
TRAIN AND TRACK CODE 24. TRACK TYPE USED BY TRAIN INVOLVED
5. Yard/Switching 6. Liglt Loc,)motive(s) I 1. Main
2. Yard 3. Siding 4. Industry
26. FAA TRACK CLASSI ;;ICATION 27. NUMBER OF LOCOMOTIVE UNITS
29. TRAIN SPEED (recorded speed, 1[ ai•ailablf'J ·1. North 3. East
MPH
Est 30. TIME TABLE DIRECTION
Recorded 2. South 4. West
CROSSING WARNING
5~ Hwy.Traffic Signals 9~ Watchman 6 Audible 10 Flagged by crew
7 Crossbucks 11 Other (specifv)
8 Stop Signs 12 None
CODE 34 CROSSING WARNING INTERCON-NECTED WITH HIGHI\IAY SIGNALS
1. Yes 2. No 3. Unknown
MOTORIST ACTION
32. SIGNALED CROSSING WAANINS
Was the signaled crossing warn 1ng identified in item 31 operating?
1. Yes 2. No
CODE 35. CROSSING ILLUMINATED BY STREET LIGHTS OR SPECIAL LIGHTS
1. Yes 2. No 3. Unknown
CODE 37. MOTORIST DROVE BEHIND OR IN FRONT OF TRAIN AND STRUCK OR WAS STRUCK BY SECOND TRAIN
1. Yes 2. No 3. Unknown 1. Yes 2. No 3. Unknown 38 MOTORIST
1. Drove around or thru the gate 2. Stopped and then proceeded 3. Did not stop 4. Other /specify/ 5. Unknown
39. VIEW OF TRACK OBSCURED BY (primon obstruction; 3. Passing train 5. Vegetation 7. Other /spec,[)')
1. Permanent structure 2. Standing railroad equipment 4. Top~aphy 6. Highway vehicles 8. Not obstructed
HIGHWAY VEHICLE PROPERTY DAMAGE/CASUAL TIES 40. HIGHWAY VEHICLE PROPERTY DAMAGE (est. dollar damage} 41. DRIVER WAS CODE 42. WAS DRIVER IN THE VEHICLE:>
1. Killed 2. Injured 3. Uninjured I 1. Yes 2. No
43. TOTAL NUMBER OF OCCUPANTS Kl _LEO 44. TOTAL NUMBER OF OCCUPANTS INJURED 45. TOTAL NUMBER OF OCCUPAN~S (include driver}
46
IS A RAIL EQUIPMENT ACCIDENT/INCIDENT REPORT BEING FILED? 1. Yes 2. No
47. TYPED NAME ANO TITLE 48. SIGNATURE 49. DATE
FORM FAA F 6180-57 112·741 REPLACES FORM FAA F 6180-13 (10-67) WHICH IS OBSOLETE
CODE
I CODE
I CODE
I CODE
CODE
CODE
I CODE
I CODE
CODE
CODE
CODE
CODE
CODE
I CODE
I CODE
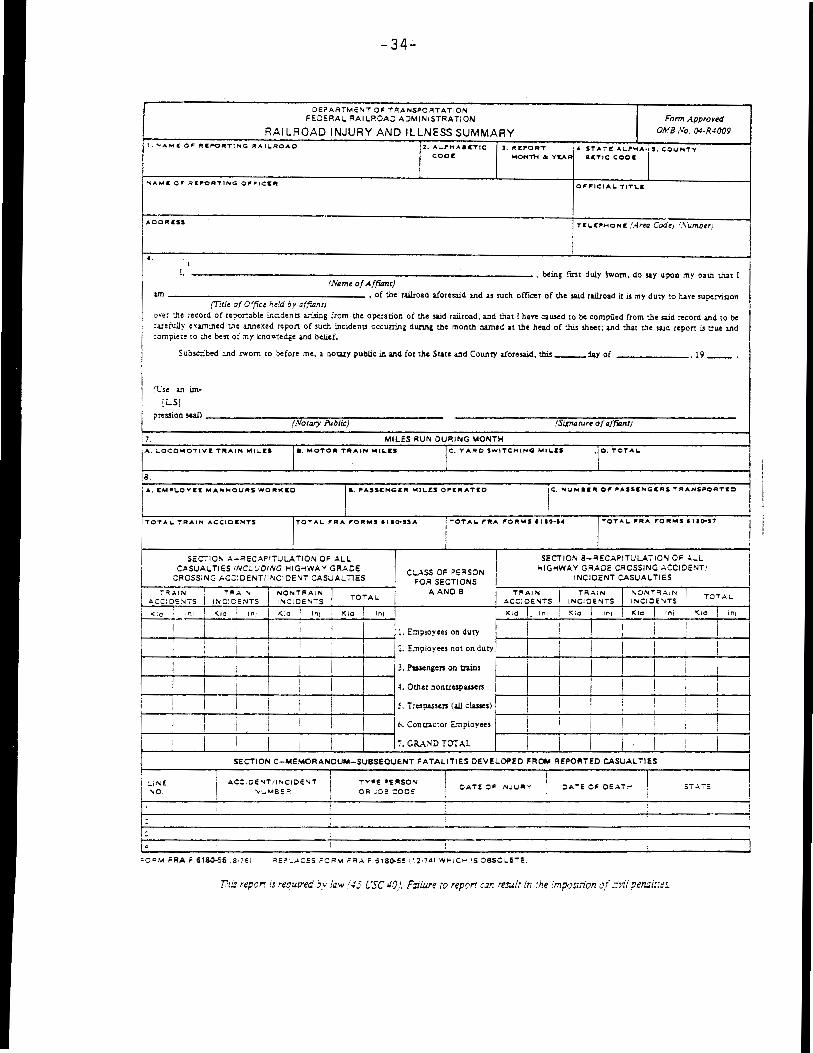
-34-
DE?ARTMENT OF TRANSPORTATION FEDERAL RAILROAD ADMINISTRATION Form Appro•ed
RAILROAD INJURY AND ILLNESS SUMMARY 0MB No. 04-R4009
l. NAM( OF ~l!:l'ORT1"'4G "'AIL..R0A0 2. Al..,HA8CTIC l. i:t£PORT 4. STATE Al..,HA· S. COUNTY CODC MONffi II Yl:AR 81:TIC C00C
NA.Ml: orr Al,.ORTING Ofll'Jl'fCS'llll 01",-ICIAL TITL.I:
ADC RESS TEl..1:,.-HONE /Area C(xieJ I.VumberJ
I ,. I
I, ' being fint duty lwom, do say upon my oath that I (Name of Affi,mr)
am , of the railroad aforesaid and as such officer of the said railroad it i., my ducy :o have ,upe:vision (Tirle of O.ffice he!d by ,ffillnrJ
over :.~e record of reponable i.ncdena aziru1g from the operation of the said railroad, and that I have caused 10 be compiled irom the said record and to be carefully e.,amined the :i.'Ulexed repon of ,uch incidenu occum.ng during the month named at the head of :his sheet; and that the said report i., true :ind compie:e to :he best oi my Jcnowte~e and belief.
Subscnbed :end sworn to before me, 1 notary public in and for the State and Councy aforesaid, this ___ day of ,19 ___
Cl's• a.n im· [LS]
pression ,ea.I) ( Notary Public) (Sip,arur, of affe,,nt/
'7. MILES RUN DURING MONTH A. L.OCOMOTIVE TRAIN MIL.ES I •. MOTOR TRAIN Mll.&S IC:. YARO SWITC:111NG Mll.&S •10, TOTAi.
8. A, E""4~1..QY'£E MA,.,MOUlt$ WOfltKE0 1 •· ... SSENGl:I• MIL£$ o•u•ATED I c:. Nu Mau, o~ ... ,u,.c.E"s TRANSPOATe:c
TOTAL. ~RAIN ACC:ICEN"T'S /'OTAI. ~RA ~ORMS "I0•UA !TOTAi. .. A ~ORMS 1110•5' I TOTAL ~RA ~ORMS" ,o-.,
SEC71011. A--'ECAP17ULATION OF All I SEC710N 8-RECAPITULATION OF ~LL
I CASUAL Tl ES INC:.. i./OING HIGHWAY GRADE C:.ASS OF PERSON HIGHWAY GRADE CROSSING ACCIDENT! CROSSING ACCIDENT/INCIDENT CASUAL TIES FOR SECTIONS I INCIDENT CASUAL TIES
i":l:~IN i
T=l~IN NONTRAIN TOTAL AAND B TFIIAlN I TRAiN I ,ONTR~1N ! :"OTAL.
ACC:OE.'l'iS INC:OENTS INCIDENTS ACC,OENTS INC:OENTS INCICE'<TS ' i <-c 1r:1 ! -CIC ' lnJ I .<!d ln1 Kid lnj Kid ln1 I '<1'0 ln1 ' ' Kie I 1n1 i(ic I in1
I I i I I I I I I i I I l. Employees on duty I I
I I i I I I :. Employees not on ducy I I I I i I I I I I I I
i i 3, Passengers on trains i i I I ' I I I 4. Other nontrespwers I I I i i I
i I i I I !. T,oopassers (all classes) I I ! ! I I
I I
I I I I i I I I 1 •· Contractor Employees I i ! i I I I I
:
I I I I i I ;. GRA.'<D TOTAL I I I I I SEC1'1ON C-MEMORANOUM-SU8SEOUENT FATALITIES DEVELOPED FROM REPORTED CASUAL TIES
'..iNE I .>.CCI DENT/INCIDENT I TYPE ::IIEASON I OAT: OF INJUFII':' I =:lA~E OF OE.AT!-' I °"O. \/1,..iMBE.-= OFI ,ca cooe- ! I
I
.. •O~M FRA F 618~5 ,8•761
rw reporr is requued by law NS l'SC d0/ F::ziure to repcn c~n res-.. /: in :he ,mposm·on J.f ::'1·ll pen.ai::::s.
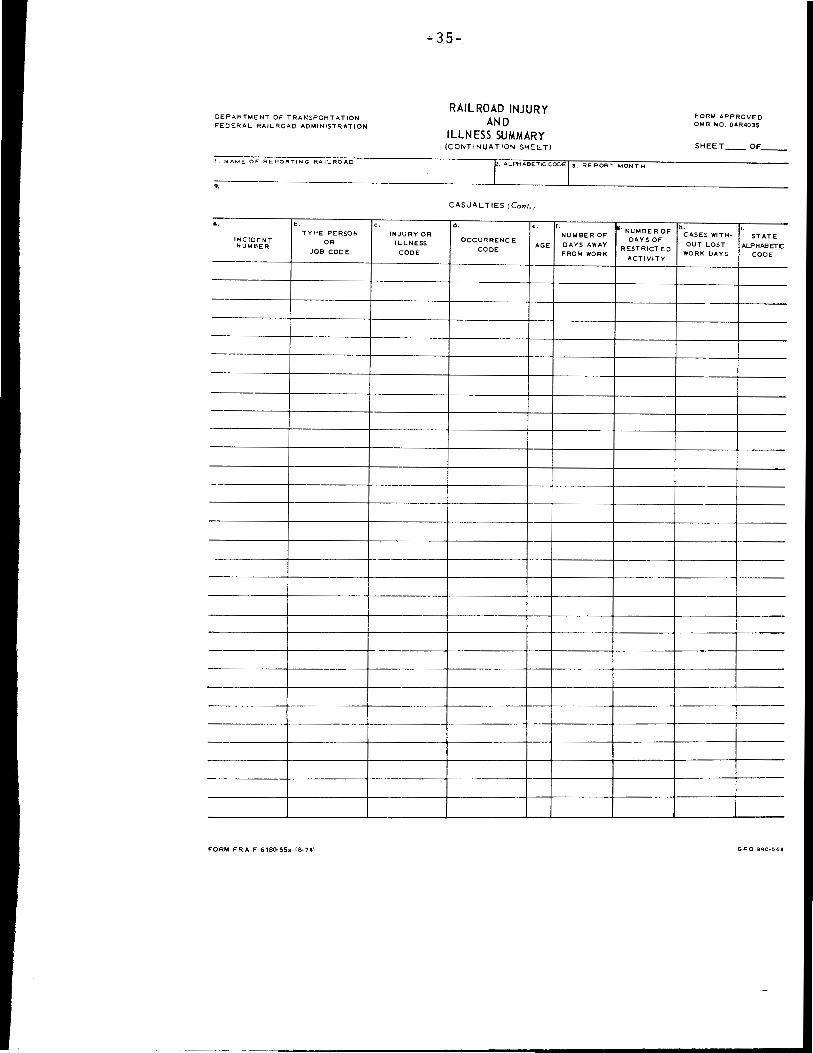
DEPARTMENT OF TRANSPORTATION FEDERAL RAILROAD ADMINISTRATION
1. "-/AME OF REPORTING RAILROAD
.. .. b.
TYPE PERSON INCIDENT OR NUMBER
JOB CODE
FORM FR AF 618~S5a (8-74\
c •
.. 35-
RAILROAD INJURY AND
ILLNESS SUMMARY (CONTINUATION SHEET)
ALA-IABE.TICCODE 3. REPOR1 MONTH
CASUAL TIES (Conl.,
d. ,. f. •· NUMBER OF INJURY OR NUMBER OF
OCCURRENCE CAYS OF ILLNESS AGE DAYS AWAY CODE RESTRICTED CODE FROM WORK ACTIVITY
h.
FORM APPROVED 0MB NO. 04R403S
SHEET __ OF __ _
'· CASES WITH· STATE OUT LOST ALPHABET(:
WORK CAYS CODE
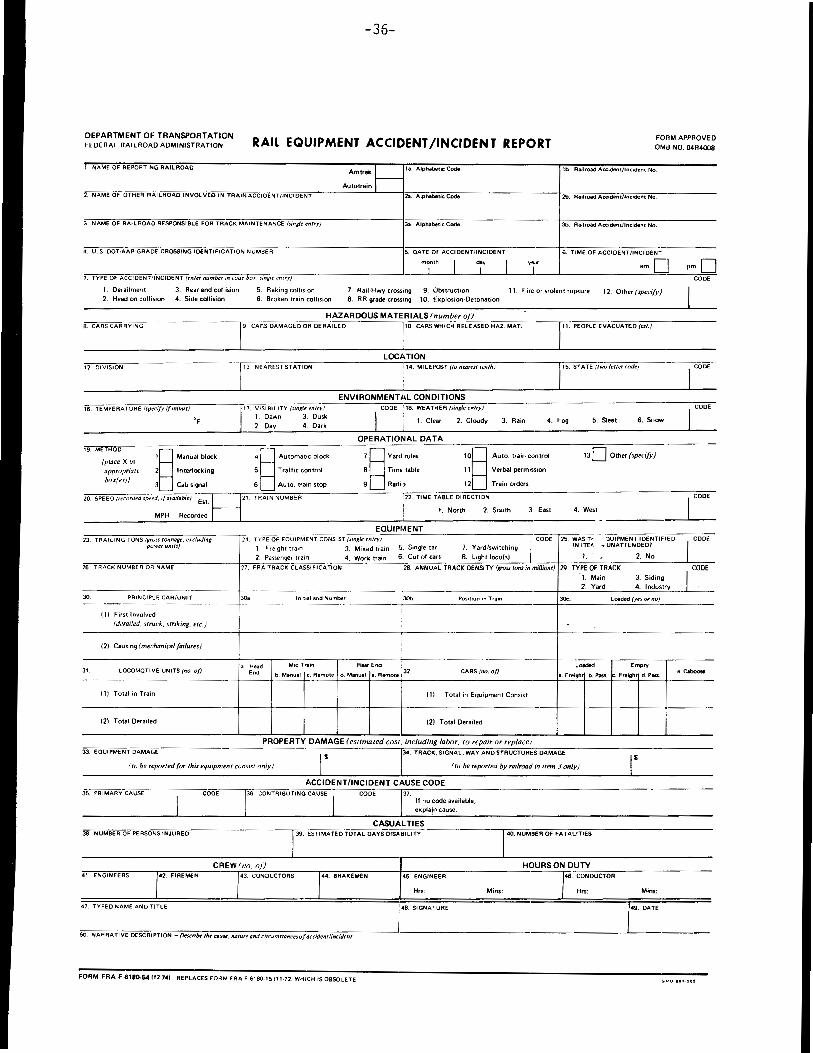
-36-
DEPARTMENT OF TRANSPORTATION FEDERAL RAILROAD ADMINISTRATION RAIL EQUIPMENT ACCIDENT/INCIDENT REPORT FORM APPROVED
0MB NO. 04R4008
1. NAME OF REPORTING RAILROAD
2. NAME OF OTHER RAILROAD INVOLVED IN TAAlNACCIDENT/INCIOENT
3. NAME OF RAILROAD RESPONSIBLE FOR TRACK MAINTENANCE (single entry)
4. U.S. DOT-AAA GRADE CROSSING IDENTIFICATION NUMBER
7. TYPE OF ACCIDENT/INCIDENT (enter number in code box, single entry)
1. Derailment 3. Rear end collision Raking cotlis1on 2. Head on collision 4. Side collision 6. Broken train collision
Amtrak L_ la. Alphabetic Code
Autotrain 2a. Alphabetic Code
Ja. Alphabetic Code
5. DATE OF ACCIDENT/INCIDENT
month I I day
I
lb. Railroad Acc1dent/lnc1dent No.
2b. Railroad Acc1dent/lnc1dent No.
3b. Railroad Accident/Incident No.
6. TIME OF ACCIDENT/INCIDENT
I year
I
7. Rail-Hwy crossmg 9. Obstruction 11. Fire or violent rupture 12. Other (specify) 8. RR grade crossing 10. Explosion·Detonation
CODE
8. CARS CARRYING HAZARDOUS MATERIALS /number o"!._{:_I -~~=~--~~===-==.,.-.,--------
9. CARS DAMAGED OR DERAILED 10. CARS WHICH RELEASED HAZ. MAT. 11. PEOPLE EVACUATED (est.)
12. DIVISION
16 TEMPERATURE (specify 1/minus)
'F
19 METHOD
(place X in
appropriate box(es))
1§ Manual block 2 Interlocking
3 Cab siwial
20. SPEED (recorded speed, 1/available) Est.
MPH Recorded
23. TRAILING TONS igross tonnage, excluding powerumts)
26 TRACK NUMBER OR NAME
JO PRINCIPLE CAR/UNIT
111 First Involved (derailed, struck, striking, etc.)
121 Causing (mechanical failures)
31. LOCOMOTIVE UNITS (no. of)
(11 Total in Tram
(2) Total Derailed
33. EQUIPMENT DAMAGE
LOCATION 13 NEAREST STATION 14. Ml LE POST (lo nearest tenth) 15. STATE (two letter code}
ENVIRONMENTAL CONDITIONS 17 VISI Bl LtTV (single entry) CODE 1 18. WEATHER (single entry)
1. Dawn 3. Dusk 2. Dav 4. Dark
1. Clear 2. Cloudy 3. Rain 4. Fog 5. Sleet 6. Snow
OPERATIONAL DATA •§ Automatic block
5 T raff,c control
6 Auto. train stop
7 § Yard rules 8 Time table
9 Radi:>
10§ Auto. train control
11 Verbal permission
12 Train orders
Other/specify)
21. TRAIN NUMBER 22 TIME TABLE DIRECTION
1. North 2. South 3 East 4. West
EQUIPMENT -·
25. WASH JUIPMENT IDENTIFIED 24 TYPE OF EQUIPMENT CONSIST (smgie entry/ I CODE 1 Freight tram 3. Mixed tram 5. Single car 7. Yard/switching INITB .. UNATTENDED?
2 Passenger tram 4. Work train 6. Cut of cars 8. Light toco(s) 1. 2. No
27 FAA TRACK CLASSIFICATION 28. ANNUAL TRACK DENSITY (gross tons in millionr) 29. TYPE OF TRACK 1. Main 3. Siding 2. Yard 4. Industry
JO, Initial and Number JOb. Position m Tram J<k. Loaded (yes or no)
. Head Mid Train Rear End Loaded Empty End b Manual c. Remote d. Manual e. Remote 32. CARS (no. of)
a. Freight b. Pass. . Freight d. Pass.
111 Total in Equipment Consist
{2) Total Derailed
PROPERTY DAMAGE (estimated cost. including labor. to repair or replace1 34. TRACK, SIGNAL, WAY AND STRUCTURES DAMAGE
( to be reported for this equipment consist only J ( to be reported by railroad in item 3 only)
35. PRIMARY CAUSE
38. NUMBER OF PERSONS INJURED
41 ENGINEERS 42. FIREMEN
47 TYPED NAME AND TITLE
ACCIDENT/INCIDENT CAUSE CODE CODE 36 CONTRIBUTING CAUSE CODE 37.
CREW/no. of) 43. CONDUCTORS
If no code available, expl_a\n cause.
CASUALTIES 39. ESTIMATED TOTAL DAYS DISABILITY
44. BRAKEMEN 45. ENGINEER
Hrs:
:48 SIGNATURE
50. NARRATIVE DESCRIPTION !Hscribe the cai1se. nature and circumsrancesof acc1dent/ir1cidenf
FORM FRA F 618().54112.74) REPLACES FORM FAA F 6180-15111.72) WHICH rs OBSOLETE
40. NUMBER OF FATALITIES
HOURS ON DUTY 46. CONDUCTOR
Mins: Hrs: Mins:
49. DATE
CODE
CODE
CODE
I CODE
I COOE
e. Caboose
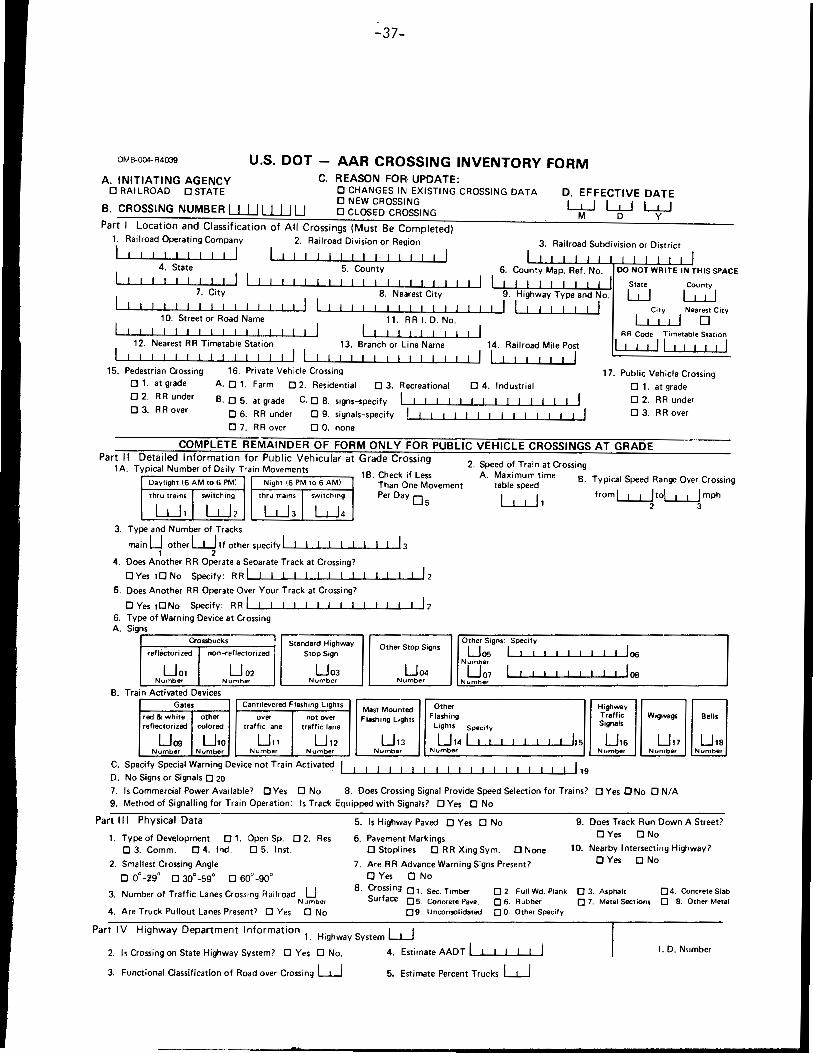
-37-
OMB-004- R4039 U.S. DOT AAR CROSSING INVENTORY FORM A. INITIATING AGENCY C. REASON FOR UPDATE:
O STATE CHANGES IN EXISTING CROSSING DATA
B. CROSSING NUMBER UlJ UlJ LJ NEW CROSSING CLOSED CROSSING
Part I Location and Classification of All Crossings (Must Be Completed) 1. Railroad Operating Company 2. Railroad Division or Region
I I I I I I I I I I I
D. EFFECTIVE DATE L.i...J Li...J L.i...J
M D Y
3. Railroad Subdivision or District
4. 5. County 6. County Map. Ref. No. State
I I DO NOT WRITE IN THIS SPACE
11111 111111111 I 7. City
State w County
I I 8. Nearest City 9. Highway Type and No. LuJ
I I I I 10. Street or Road Name
I I I I I I I j 11. RRI.D.No.
City
I I I I Nearest City
I I I I I I I II I I II I I I 12. Nearest RR Timetable Station 13. Branch or Line Name 14. Railroad Mile Post
~1~1~1~1~1~1~1~1~1~1~1~r~r-1..JI I 111,,, I 15. Pedestrian Crossing
1. at grade 02. RR under
3. RR over
16. Private Vehicle Crossing A. 01. Farm 02. Residential 03. B. O 5. at grade C. O 8. signs-specify
6. RR under 9. signals-specify 0 7. RR over D 0. none
Recreational D 4. Industrial
I II I II I I I I I I I I I I !111111111111111
RR Code Timetable Station
11111111111!
17. Public Vehicle Crossing D 1. at grade
2. RR under D 3. RR over
COMPLETE REMAINDER OF FORM ONLY FOR PUBLIC VEHICLE CROSSINGS AT GRADE Part II Detailed Information for Public Vehicular at Grade Crossing
1A. Typical Number of Daily Train Movements 2. Speed of Train at Crossing
Daylight (6 AM to 6 PM) Night (6 PM to 6 AMI 1B. Check if Less
Than One Movement Per Day Os
A. Maximum time B Typical Speed Range Over Crossing table speed ·
thwn: I MWg2 I . . 1
1 from lL..i.J tol.L..i..J mph
L....L.L.J 2 3
3. Type and Number of Tracks
main LJ other W If other specify I I I I I I I 1 2
4. Does Another RR Operate a Separate Track at Crossing? 1DN0 Specify: ARI I I I I I I I I I
5. Does Another RR Operate Over Your Track at Crossing? D Yes Specify: RR I I I I I I I I I I
6. Type of Warning Device at Crossing A. Signs
Crossbucks reflEtctorized non-reflectorized
U01 Uo2 Number Number
B. Train Activated Devices
Standard Highway Stop S,gn
Uo3 Number
Gates Cantilevered Flashing Lights red & white other over not over reflectorized colored traffic lane traffic lane
Uoo U10 U1, U12 Number Number Number Number
Other Stop Signs Other Signs: Specify
Uos I I I loo Number
Uo4 Uo1 I los Number Number
Mast Mounted Other Flashing Lights Flashing
Lights Specify
Highway Traffic Wigwags Signals
Bells
LJ13 LJ14I I I I I I I I I l,s U16 U11 U1s Number Number Number Number Number
C. Specify Special Warning Device not Train Activated D. No Signs or Signals D 20
I I I I I I I I I I I I I I I I I I I I 19
7. Is Commercial Power Available? Yes D No 8. Does Crossing Signal Provide Speed Selection for Trains? D Yes D No D N/A 9. Method of Signalling for Train Operation: Is Track Equipped with Signals? D Yes D No
Part i 11 Physical Data 1. Type of Development O 1. Open Sp. O 2. Res
0 3. Comm. 0 4. Ind. 0 5. Inst. 2. Smallest Crossing Angle
D 0° -29° D 30° -59° 60° -90°
3. Number of Traffic Lanes Crossing Railroad LJ Number
4. Are Truck Pullout Lanes Present7 D Yes O No
5. Is Highway Paved D Yes D No
6. Pavement Markings O Stoplines D RR Xing Sym. 0 None
7. Are RR Advance Warning Signs Present? 0 Yes O No
8. Crossing O 1. Sec. Timber Surface O 5. Concrete Pave.
0 9. Unconsolidated
0 2 Full Wd. Plank 0 6. Rubber O 0. Other Specify
Part IV Highway Department Information H' S W 1 . ,ghway ystem
2. Is Crossing on State Highway System? Yes D No. 4. Estimate AADT I I I I I I
3. Functional Classification of Road over Crossing W 5. Estimate Percent Trucks W
9. Does Track Run Down A Street? D Yes O No
10. Nearby Intersecting Highway? D No
D 3. Asphalt O 7. Metal Sections
0 4. Concrete Slab 0 8. Other Metal
I. D. Number
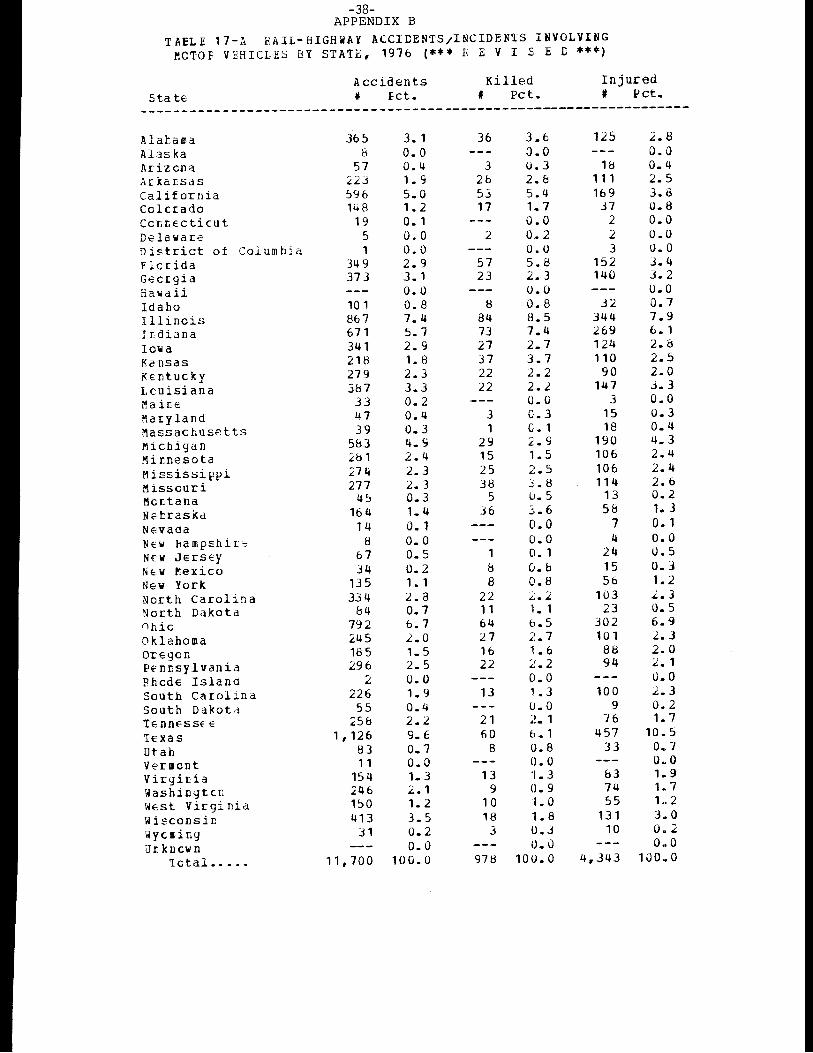
-38-APPENDIX B
TAELE 17-A RAIL-HIGHWAY ACClDENTS1INCIDEN!S INVOLVING ~CTOF VEHICLE::i BY STA'IB, 1976 (*** R E V I S E D ***)
Accidents Stat€ # fct.
Killed # Pct.
Injured # Pct.
------------------------------------------------------------------Alatama Alaska Arizcn-3. Ar ka r.sas California Colcrado Ccnr.Ecticut D€lawar0 District of Columbia Flcrida Gecrgia aawaii Idaho Illinois I r.diana Iowa Kcnsas KEntucky Lcuisiana Ma ir.E l'iar:yland Massachusetts Michigan Mir.nesota Mississippi Misscuri Mcr.tana NEl:raskd Nevada NEW liampshir ;=
NEW JersEy N~w f'Jexico New York North Carolina Nor:th Dakota Ohio Oklahoma OrEgcn PE'nr:sylvania Rhed€ Island South Carolina South Dakota TE:DDESSEE Texas Utah Vermont Virgir.ia washingtc1: WEcst Virginia Wisconsin wyclling ur:kncwn
'Ictal •••••
365 b
57 ~2.:l ':>96 148
19 5 1
3!4 9 313
101 867 671 341 218 279 3b7 33 47 39
5b3 2b 1 274 277
45 16 4 14
8 67 34
135 334
b4 792 245 185 296
2 226 55
25b 1,126
83 11
154 246 150 413
31
11,700
3. 1 o. 0 0.4 1.9 5.0 1.2 o. 1 0.0 o.o 2.9 3.1 o. 0 o. 8 7. 4 5. 1 2.9 1. 8 2.3 3.3 o. 2 0. 4 o. 3 4. 9 2.4 2. 3 2. 3 o. 3 1. 4 o. 1 o. 0 o. 5 o. 2 1. 1 2.8 0.7 6.7 2.0 1. 5 2. 5 o. 0 1. 9 0.4 2.2 9. 6 o. 7 o. 0 1. 3 2.1 1. 2 3. 5 0.2 o. 0
100. 0
36
3 2b 53 17
2
57 23
8 84 73 27 37 22 22
3 1
29 15 25 38
5 36
1 b 8
22 11 64 27 16 22
13
21 60
8
13 9
10 18
3
978
3.6 0.0 0.3 2.b 5.4 1. 7 u.O o. 2 o.o 5.8 2. 3 o.o 0.8 8. 5 7.4 2. 7 3.7 2.2 2.2 o. 0 0.3 0. 1 2.9 1. 5 2.5 3.8 o. 5 ::.. 6 o. 0 o.o o. 1 O.b 0.8 2.2 1. 1 6.5 2.7 1.6 .i. 2 o. 0 1. 3 0.0 2. 1 6.1 0.8 0.0 1. 3 o. 9 I. 0 1. 8 0.3 o. 0
100. 0
125 2.8 0.0
1b 0. 4 111 2. 5 169 3.d
37 0.8 2 0.0 2 o.o 3 o.o
152 J.4 140 3.2
o.o 32 0.7
344 7.9 269 6.1 124 2. 8 110 2.5
90 2. 0 147 3. 3
3 0.0 15 o. 3 18 o. l4
190 4. 3 106 2. 4 106 2.4 114 2.6
13 0.2 Sb 1. 3
7 o. 1 4 o. 0
24 o. 5 15 o. 3 56 1. 2
103 2.3 23 o. 5
302 6. 9 101 2. 3 88 2.0 94 2. 1
o.o 100 2. 3
9 o. 2 76 1. 7
457 10.5 33 o. 7
Ov 0 b3 1.9 74 1.7 55 1~ 2
131 3. 0 10 o. 2
o.o 4,343 100.0