report no. fra/ord-80/91 - Federal Railroad Administration
184
REPORT NO. FRA/ORD-80/91 - * «• - ASSESSMENT OF UXQMDTIVE CREW IN-CAB OCCUPATIONAL NOISE EXPOSURE PB ^ 1 ,<c/ 3 ^ R oger D. K ilmer N ational B ureau of S tandards N ational E ngineering L aboratory W ashington ^ DC 20234 DECEMBER 1980 FINAL REPORT Document is available to the public through the National Technical Information Service, Springfield, Virginia 22161. Prepared for U.S. DEPARTMENT OF TRANSPORTATION FEDERAL RAILROAD ADMINISTRATION Office of Research end Development Washington, D.C. 20590 04-Locomotives/Propulsion *\1
-
Upload
khangminh22 -
Category
Documents
-
view
1 -
download
0
Transcript of report no. fra/ord-80/91 - Federal Railroad Administration

REPORT NO. FRA/ORD-80/91- * «• -
ASSESSMENT OF UXQMDTIVE CREW IN-CAB OCCUPATIONAL NOISE EXPOSURE
PB ^ 1 ,<c/ 3
Roger D. Kilmer
National Bureau of Standards National Engineering Laboratory
Washington DC 20234
DECEMBER 1980 FINAL REPORT
Document is available to the public through the National Technical Information Service,
Springfield, Virginia 22161.
Prepared forU.S. DEPARTMENT OF TRANSPORTATION
FEDERAL RAILROAD ADMINISTRATION Office of Research end Development
Washington, D.C. 2059004-Locomotives/Propulsion
* \ 1

NOTICE
This document is disseminated under the sponsorship of the Department of Transportation in the interest of information exchange. The United States Government assumes no liability for its contents or use thereof.
NOTICE
The United States Government does not endorse products or manufacturers. Trade or manufacturers' names appear herein solely because they are considered essential to the object of this report.

Vv Technical Report Documentation Page1. Report No.
FRA/ORD-80/912. Government Accession No. 3. Recipient’s Cotalug No.
4. Title and SubtitleASSESSMENT OF LOCOMOTIVE CREW IN-CAB OCCUPATIONAL NOISE EXPOSURE
5. Report DateDecember 1980
6. Performing Organization Code
8. Performing Organization Report No.7. Au thor s)Roger D. Kilmer
9. Performing Organization Name ond AddressNational Bureau of Standards National Engineering Laboratory Washington, DC 20234
10. Work Unit No. (TRAIS)
11. Contract or Grant No.
13. Type of Report and Period Covered
Final Report12. Sponsoring Agency Name ond AddressU.S. Department of Transportation Federal Railroad Administration Office of Rail Safety Research Washington, DC 20590
14. Sponsoring Agency Code
15. Supplementary Notes
16. Abstract
The railroad industry, unlike most other'U.S. industries, is not subject to the safety regulations of the Occupational Safety and Health Administration. Instead, railroad workers are covered by the safety regulations of the Federal Railroad Administration (FRA). This report documents an extensive study designed to assess the noise environment in locomotive cabs. Operational duty cycle and in-cab sound level data are presented for 18 test runs made on 16 different locomotives used in wide range of operational modes (e.g., through freight and local transfer freights), varied terrains (mountainous, undulating and flat) and varied trip lengths (6 to 12 hours). The general conclusion of this study is that there does not appear to be a widespread problem of overexposure to noise based on the same type of evaluation as currently used by OSFA (only 1 out of 18 test runs exceeded the criteria). The noise exposure is within acceptable limits because the operational duty cycle is such that the sources which generate high sound levels (horn and brake) are operating only for short periods of time and because the locomotive spends a great deal of time in idle (diesel engine sound levels below 90 dB). However, there was one test run for which an overexposure to noise was measured. To pinpoint such cases where overexposure to noise may occur, a simplified testing procedure is developed. This test consists of making in-cab sound level measurements of engine notch 8 (no load), horn sounding and brake application with the locomotive stationary. With these three sound level measurements and an estimate of the time that the locomotive is operating on-line, the in-service noise dose can be estimated and a pass/fail assessment made of whether the noise exposure might exceed acceptable limits.
17. Key Words
locomotive crew simplified testing in-cab sound level
18. Distribution Statement
Document is available to the U. S. public through the National Technical Information Service, Springfield, Virginia 22161
19. Security C l a t t i f . (of this report) 20. Security Clossif. (of this poge) 21* No. of Pages 22. Price
F o r m D O T F 1 7 0 0 . 7 (8—72) Reproduction o f completed page authorized
1

METRIC CONVERSION FACTORS
c _? *
i *
A p p r o x im a t e C o n v e r s io n s t o M e t r ic M e a s u re s9
S y m b o l W h e n Y o u K n o w M u l t i p l y b y T o F i n d S y m b o l
8
23
22-2120
A p p r o x i m a t e C o n v e r s io n s f r o m M e t r ic M e a su re s
S y m b o l W h e n Y o u K n o w M u l t i p l y b y T o F in d
L E N G T H
S y m b o l
L E N G T H
in inches ‘ 2 .5 centim eters cmn feet 30 centim eters cmy d yards 0 .9 m eters mm i miles 1.6 kilom eters km
A R E A
in2 square inches 6 .5 square centim eters cm 2ft2 square feet 0 .0 9 square m eters m 2y d 2 square yards 0 .8 square meters m 2m i2 square miles 2 .6 square kilom eters k m 2
acres 0 .4 hectares ha
M A S S (w e ig h t )
oz ounces 28 grams 9lb pounds 0 .4 5 kilogram s kg
short tons 0 .9 tonnes t(2 0 0 0 lb )
V O L U M E
tsp teaspoons 5 m illilite rs m lT b s p tablespoons 15 m illiliters m lfl oz flu id ounces 30 m illilite rs m lc cups 0 .2 4 liters ipt pints 0 .4 7 liters iq t quarts 0 .9 5 liters igal gallons 3.8 liters ift* cu b ic feet 0 .0 3 cubic m eters m 3yd* cu b ic yards 0 .7 6 cu b ic meters m*
T E M P E R A T U R E (e x a c t )
° F Fahrenheit 5/9 (after Celsius ° Ctem perature subtracting tem perature
3 2 )
*1 In. - 2 .6 4 cm (e x a c tly ). F o r other exact conversions and m o re detail tables Me N B S M ite. Publ. 286. U n its of W eigh t and Measures. Price $ 2 .2 6 S O Catalog N o . C 1 3 10 286.
6
5
4
3
2
= ---------- --------- 19 m m m illim eters 0 .0 4 inches in= cm centim eters 0 .4 inches in=
---------18 m m eters 3.3 feet ft
= m meters 1.1 yards yd= k m kilom eters 0.6 miles m i
17
=---------16 A R E A
15 cm 2 square centim eters 0 .1 6 square inches in2= m 2 square meters 1.2 square yards y d 2= k m 2 square kilom eters 0 .4 square miles m i2
----------14 ha hectares (1 0 ,0 0 0 m 2 ) 2 .5 acres
= 13
M A S S (w e ig h t )
=
= g gram s 0 .0 3 5 ounces OZ— — <------1 1
kg kilogram s 2 .2 pounds lb= --------- t tonnes (1 0 0 0 kg) 1.1 short tons
— 10
=g V O L U M E
== 9 m l m illiliters 0 .0 3 flu id ounces fl oz~ i liters 2.1 pints Pt= i liters 1.06 quarts q t— ------------7 I liters 0 .2 6 gallons gal= m* cu b ic m eters 3 6 cu b ic feet ft*
------- — 6 m 3 cu b ic m eters 1.3 cubic yards yd*
------------5 T E M P E R A T U R E (e x a c t )
1
Inches —
4° C
3
Celsiustem perature
9/5 (th en Fahrenheit add 3 2 ) tem perature
° F
° F
°C
32 9 8 .6
° F2124 0 01 l 1 l 1 i 1 l
4 0 8 01 | 1 1 1 1
120 160 2 0 0 1l l l l 1 i l I I 1 1
i 1 r i i 4 0 - 2 0
— 1 r 20
1 T “ 1 1 4 0 6 0 8 0 100
37 ° C

>
List of Figures............. v
List of T a b l e s.................... vil
Conversion Table to SI U n i t s .................................. xi
Executive Summary ............................................. xiii
1.0 Introduction...................... 1
2.0 Occupational Noise Exposure .............................. 3
3.0 Existing Locomotive Data ...................... . . . . . . 13
3.1 In-Cab N o i s e ....................................... 133.2 Operational Duty C y c l e .............................. 1*3
3.2.1 Diesel Engine Operations . ..................... 203.2.2 Brake Applications ............................ 253.2.3 Horn Soundings................................ 30
3.3 Fleet Population .................................... 33
4.0 Field Test. Program....................................... 39
4.1 Instrumentation System .............................. 404.2 Test Procedures...................................... 48
5.0 Test Results and Conclusions.............................. 51
5.1 Operational Duty C y c l e .............................. 315.2 In-Cab Noise Levels .................................. 60
5.2.1 Spatial Variation in the C a b ................... 675.2.2 Effect of Locomotive Operations ............... 725.2.3 Effect of Terrain Features ..................... 85
5.3 Crew Noise Exposure.................................. 395.3.1 Spatial Variation in the Cab . . . . ........... 915.3.2 Crew Noise Exposure for the Overall Trip........ 9L5.3.3 Crew Noise Exposure for Alternative Criteria . . . 985.3.4 Comparison of the Crew Noise Exposures for
the Fixed and Lapel Microphones ............... 1035.3.5 Effect of the Locomotive Operations ........... 1065.3.6 Effect of Terrain Features ..................... 109
TABLE OF CONTENTSPage
i ii

Page
5.4 Summary and Conclusions.................................112
6.0 Stationary Screening T e s t ................................ 116
6.1 Ideal Relationship .................................. 1166.2 Existing Procedures .................................. 1196.3 Development of the Stationary Screening T e s t ............1226.4 Stationary Screening Test Procedure .................... 1406.5 Determining the Principal Noise Source ................ 1476.6 Conclusions and Recommendations ...................... 149
7.0 Appendix A. Descriptions of Locomotive Characteristics andTrain Parameters...............................151
8.0 References..................................................164
9.0 Acknowledgements .......................................... 168
IV

LIST OF FIGURES
Figure
Figure
F igure
Figure
Figure
F igure
F igure
Figure
F igure
F igure
Figure
Figure
Figure
Figure
1. Time/intensity relationship for the current OSHAstandard [2] ......................................
2. Comparison of the time/intensity relationships forthe current OSHA standard [2], the proposed NIOSH criteria [9], and the equal-energy criteria [10] . . .
3. Approximate relationship between sound level and exposure time for various types of locomotive operations
4. Sound level versus frequency for conditions of engineonly (notch 8) and engine (notch 8) with horn in use for an EMD SD45 locomotive [12] .......................
5. Schematic diagram of instrumentation system developedby NBS for evaluation of the noise exposure of locomotive crews ......................................
6. View inside the cab of one of the test locomotivesshowing the locations of the three microphones near the engineer.......................................
7. Operational keyboard used to record locomotiveoperations and terrain changes .....................
8. Examples of the relationships of various noise ratingsto different sound level time histories .............
9. Example of noise level distribution that may be approximated by a normal statistical distribution . . .
10. Sound level time history for horn operation at acrossing . . . . ..................................
11. Sound level time histories for different types ofbrake applications . . . . . . . . . . .............
12. Mean of the average A-weighted sound levels for all.locomotives versus notch setting for stationary and in-service test conditions corresponding to the engineer left-side microphone ......................
13. Hypothetical relationship between the actual noisedose and that predicted using a simplified testing procedure .........................................
14. Shift of hypothetical relationship to avoid any casesfalling into Quadrant II ..........................
4
9
11
19
41
43
45
65
66
75
77
82
117
Page
■120
V
Page
Figure 15. Relationship between the actual noise dose and the noise dose predicted from Equation (16) using the set of fixed percent on-times and stationary to in-service sound level corrections given in Equations (17) and (18). . . 132
Figure 16. Relationship between the actual noise dose and thenoise dose predicted from Equation (16)' using the actualpercent on-times and stationary to in-service soundlevel corrections listed in Table 41 for each test run 135
Figure 17. Predicted noise dose as a function of the characteristic sound level for constant percent on-time . . . . 138 •
Figure 18. Predicted noise dose as a function of percent on-timefor constant characteristic sound level ............. 139
Figure 19. Procedure for assessing in-cab locomotive noiseexposure based on the stationary screening test . . . . 141
Figure A-l. Illustration of various locations where the bells weremounted........................................... 154
Figure A-2. Illustration of various locations where the hornclusters were mounted.............................. 155
vi

Conversion
Table 1.
Table 2.
Table 3.
Table 4.
Table 5.
Table 6.
Table 7.
Table 8.
Table 9.
Table 10.
Table 11.
Table 12.
Table 13.
LIST OF TABLES
Table to SI Units ..................................
In-cab noise levels for various locomotives operating under stationary or over-the-road test conditions . . .
In-cab noise levels for an EMD SD40-2 locomotive operating by itself ................................
Typical EMD and GE locomotive engine speeds and percent of rated brake horsepower for idle, the eight throttle positions and dynamic brake [18] . . . . . ...........
Locomotive diesel engine duty cycle data [18] .......
Locomotive diesel engine duty cycle based on the time that the locomotive is under way [19] ...............
Operating conditions for trains used in FRA fuel consumption test program [20] ......................
In-service locomotive diesel engine duty cycle information for a unit coal train (loaded and unloaded) [20]
In-se*fvice locomotive diesel engine duty cycle information for a unit- "T0.FC” train [20] .................
Example of braking duty cycle for an actual run in the southcentral portion of the United States [21] ........
Average braking duty cycle on various types of terrains[ 2 1 ] .......................................................
Breakdown of the United States locomotive fleet (as of April 1978) for class I railroads [24] ...........
Breakdown of the United States locomotive fleet (as ofJanuary 1, 1977) by model and date of manufacturefor the 18 largest Class I railroads [25,26] .........
Breakdown of locomotive road unit population based on engine design and horsepower [27] ...................
vi l
ix
15
L6
21
22
24
26
27
28
31
32
34
36
37
Page

46
49
53
54
55
56
62
68
69
70
71
73
79
80
81
84
0
LIST or TABLES CONT.
List of operational parameters recorded for in-service tests .............................................
Locomotive operational conditions for stationary tests .
Trip log (in hours) for the 18 test runs .............
Breakdown of terrain features for the 18 test runs . . .
Operational duty cycle data for various locomotive operations . . . . . . . . . . . . ...................
Operational duty cycle data for the eight engine notch settings.................................... . . . .
Data used to establish hierarchy for binning of operational events .............................. . .
Stationary data for notch 8 for the 16 test locomotives
Stationary data for horn soundings for the 16 test locomotives . ......................................
Stationary data for brake applications for the 16 test locomotives ................... ...................
In-service data for the overall trip .................
Stationary and in-service sound level data, for the engineer left-side microphone, for various locomotive operations ..........................................
Stationary sound level data for the eight engine notch settings (cab windows open) ........................
Stationary sound level data for the eight engine notch settings (cab windows closed) ........ . . . . . . . .
In-service sound level data, corresponding to the engineer left-side microphone, for the eight engine notch settings and the overall t r i p ........... ... . .
Stationary sound level and in-service operational duty cycle data for the bell and warning alarms .........
VI11

Si
LIST OF TABLES CONT.
Page
Table 30. In-service sound level and duty cycle data for various terrain features .................................... K7
Table 31. In-service noise exposure data calculated using the 0SHA criteria........................................... 92
Table 32. Comparison of crew noise exposures for the engineer left-side microphone based on the actual exposure time,Tdose> anc* a scaled exposure time of eight hours . . . . 94
Table 33. Maximum A-weighted sound levels (slow response)-indecibels, for horn soundings, brake applications andthe overall trip.................................... 95
Table 34. Comparison of the maximum A-weighted sound levels forstationary and in-service measurements of horn andbrake applications.................................. 97
Table 35. Maximum allowable times per day and equivalent noise exposure levels based on the current OSHA standard . . . 99
Table 36. Actual crew noise exposures for the 18 test runscalculated using alternative hearing conservationcriteria.......................... '............... 100
Table 37. Maximum allowable times per day and equivalent noise exposure levels for various calculation methods . . . . 102
Table 38. Comparison of the in-service noise exposures based onthe current OSHA criteria for the fixed and lapelmicrophones....................................... 104
Table 39. Relative contributions of various locomotive operations to the overall crew noise dose....................... 108
Table 40. Relative effect of various terrain features on theoverall crew noise exposure ........................ Ill
Table 41. Sound level and duty cycle data used to derive theempirical parameters for the stationary screeningtest equation...................................... 12.7
Table 42. Prediction of the crew noise dose for the 18 test runs using the set of fixed percent on-times and stationary to in-service sound level corrections given in Equations (17) and (18).......................... 131
IX

Table 43. Prediction of the crew noise dose for the 18 testruns using the actual percent on-times and stationaryto in-service sound level corrections listed inTable 41 for each test r u n .......................... 134
Table 44. Stationary screening test values for engine notch 8 . . 144
Table 45. Stationary screening test values for the horn ........ 145
Table 46. Stationary screening test values for the brake ........ 146
Table 47. Comparison of the predicted noise doses for the 18test runs based on the actual trip run times and on an assumed value of 12 h o u r s .......................... 148
Table A-l. Descriptions of the sixteen test locomotives......... 152
Table A-2. List of bell and horn locations for the sixteen testlocomotives........................................ 153
Table A-3. General descriptions of the road and helper locomotivesused to power each train . . . ....................... 156
Table A-4. Descriptions of the train make-up in terms of thenumber of cars and the total l o a d .................. 157
Table A-5. General descriptions of the eighteen test runs . . . . 158
Table A-6. Summaries of trip logs for test runs 1, 2, and 3a . . . 159
Table A-7. Summaries of trip logs for test runs 3b, 4, 5, and 6 . . 160
Table A-8. Summaries of trip logs for test runs 7, 8, 9, and 10 . . 161
Table A-9. Summaries of trip logs for test runs 11, 12, and 13 . . 162
Table A-10. Summaries of trip logs for test runs 14a, 14b, 15, and1 6 ................................................. 163
' - K ,
LIST OF TABLES CONT.
Page
x
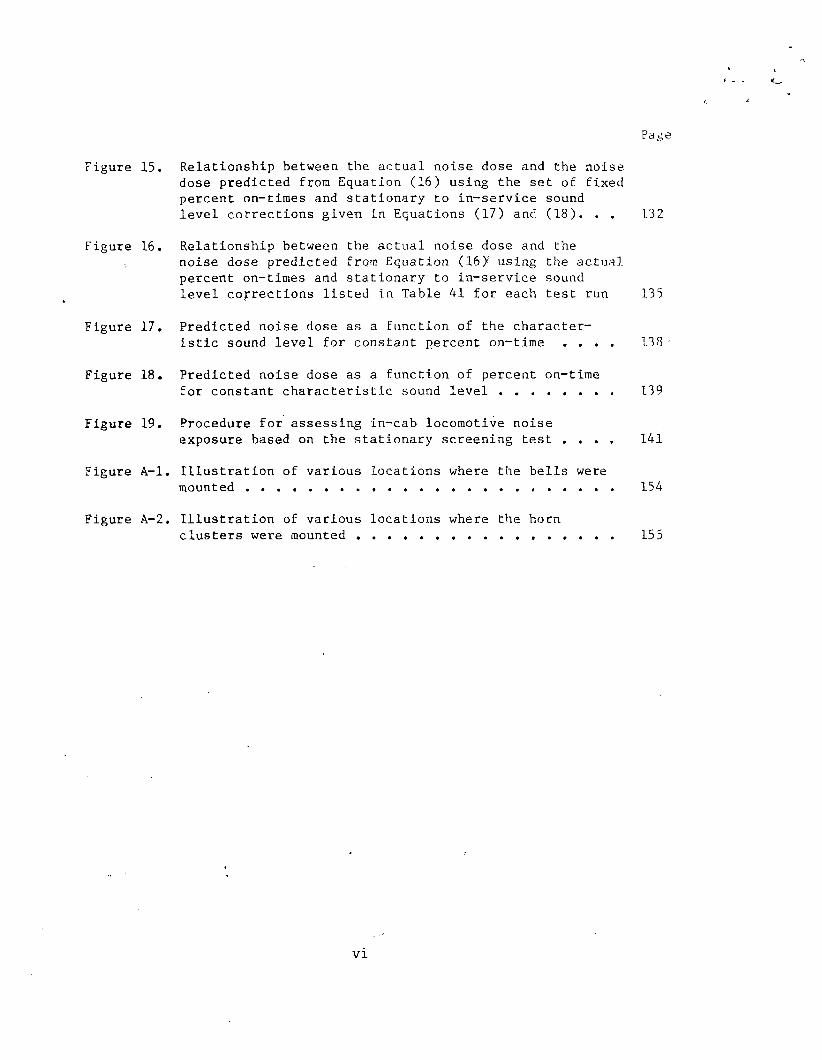
Conversion Table to SI Units
This publication uses customary English units for the convenience of enginee and others who use them habitually. The table helow is for the reader inter ested in conversion to SI units. For additional information see:
(1) MBS LC1056, November, 1977, "NBS Guidelines for Use of the Metric System."
(2) NBS SP330, August, 1977, "The International System of Units (SI)."
Quantity To convert from
Length inchfootmile
Area in2ft2
Volume in3ft3gallon
Temperature 3 FT. difference A toyMass pound
ouncePressure psi
in H 2Oin Hgm m H g
Energy Btu MBtu kWh ft • Ibf kilocalorie
Power Btu/hhp
Flow gal/minft3/min
Density lb/ft3 Ib/gal
Heat Capacity Btu/(lb • : F) Btu/(ft3 • '■> F)
To Multiply by
m (meter) 2.540 X 10⁻²m 3.048 X 10⁻¹m 1.609 X 10³m 2 6.452 X 10⁻⁴m 2 9.290 X 10⁻²m 3 1.639 X IQ"5m 3 2.832 X 10⁻²m 3 3.785 X 10⁻³⁰ C t°c - ( W — 32) /1K > H I! > H* 0 bo
kg 4.536 X 10⁻¹kg 2.835 X 10⁻²Pa 6.895 X 10³Pa 2.488 X 10²Pa 3.386 X 10³Pa 1.333 X 10²J 1.055 X 10³J 1.055 X 10⁹J 3.600 X 10⁶J 1.356 X 10°J 4.187 X 10³W 2.931 X 10⁻¹W 7.457 X 10²m 3/s 6.309 X 10⁻⁵m 3/s 4.719 x 10⁻⁴kg/m3 1.602 X 101kg/m3 1.198 x 10²J/(kg • K) 4.187 x 10³J/(m3 • K) 6.707 x 10⁴
Xl

EXECUTIVE SUMMARY
This report documents an extensive study designed to investigate and assess typical in-cab diesel locomotive noise environments in terms of crew noise exposure. In addition, the effects of different locomotive operations and terrain features on the in-cab noise environment were determined. A field test program was conducted to provide tlie necessary information. Eighteen test runs (16 locomotives, two of which had two crews) were made. These 16 locomotives covered a range of locomotive models representing over 80 percent of the types found in the current U. S. locomotive fleet population. The 18 test runs covered a wide range of operational conditions (high speed through-freights, slow speed drag-freights, local transfer movements, etc.), varied terrains (mountainous, flat, undulating,), and varied trip lengths (6 to 12 hours) . The data obtained from the program consisted of operational duty cycle information and in-cab sound level data. These were used to evaluate- the crew noise exposure in terms of the OSHA noise dose (and other alternative criteria) and to determine which locomotive operations and/or terrain features significantly affected the noise exposure. To pinpoint cases where overexposure to noise may occur, a simplified testing procedure was developed. This procedure, based on in-cab sound level measurements with the locomotive stationary, provides an estimate of the in-service crew noise dose which can be used to make a -pass/fail assessment of whether the noise exposure might exceed acceptable limits.
The major results of the investigation and evaluation are:
■ The operational duty cycle varies widely from run to run, and even from day to day over the same route depending upon the type of train, the train weight, the amount of traffic on the route and whether there are any cars to be picked up or set off or unscheduled stops because of mechanical problems.
■ While the train is underway, approximately 40 percent of the time is spent in notch 8, 25 percent at idle/notch 1, and the remaining35 percent distributed about equally among notches 2 through 7.
■ Inclusion of the time that the train is standing and not operating online increases the average time spent at idle/notch 1 to almost62 percent and reduces the average notch 8 time to 20 percent with the remaining 18 percent in notches 2 to 7. Thus, during a good portion of the time the crew is in the cab, the locomotive is being operated such that the engine noise levels are likely to be below 90 dB.
■ In general, the sound levels are not a significant function of spatial location inside the locomotive cab. The sound generated by venting the brake pipe is the one exception to this. The highest sound levels for the brake occur at the engineer left-side microphone location which is nearest to the brake pipe vent.
■ The three principal sources of in-cab locomotive noise are the diesel engine, horn and brake. The, radio is also important, but the sound levels it generates vary as a function of both the in-cab sound levels
xiii

due to the diesel engine and the personal listening preference of each engineer. Other sources, such as the bell, warning alarms, and dynamic brake, either have little influence on the in-cab sound levels or occur very infrequently.
■ Both the stationary and in-service data show that the in-cab sound levels increase with notch setting. Based on linear regression analysis of the mean values for the 16 test locomotives, the sound level increases approximately 1.5 dB per notch setting for stationary conditions (windows open or closed), and 0.6 dB per notch setting for in-service conditions.
■ The in-cab sound levels are more greatly influenced by window position for sources which are located outside the cab. This is particularly true for the horn (a range of 0.5 to 13.1 dB reduction with the windows closed) and to a lesser extent the diesel engine (0.9 to2.2 dB decrease with the windows closed). Window position and quality of sealing are especially important for locomotive operations in tunnels.
■ In general, terrain features, such as grades and cuts, do not have much effect on the in-cab sound levels. Tunnels, on the other hand, can lead to significant increases. For Test Runs 10, 11 and 12, which had a relatively large number of tunnels, the in-service equivalent sound levels for tunnels are approximately 4 to 7 dB higher than the equivalent sound levels for the overall trip.
■ Based on the group of locomotives tested, it does not appear that overexposure to noise is a widespread problem for locomotive crews under the current OSHA standard. Of the 18 test runs, only the locomotive on Test Run 2 (which was being used in an atypical situation) failed the OSHA criteria.
■ For a criterion value of 90 dB at 8 hours there is only one case of overexposure (Test Run 2) regardless of the threshold level (90, 87 or 85 dB). If the criterion value is reduced to 85 dB at 8 hours, the locomotives on Test Runs 2 and 7 would exceed the allowable limits for an 85 dB threshold level. For a threshold level of 80 or 82 dB, the locomotives on Test Runs 14 and 15 would also exceed the allowable limits.
■ The crew noise doses calculated from the lapel microphone recordings are generally higher than the noise doses for the fixed microphones. This difference is due primarily to the fact that the lapel microphones are located closer to the crew members' mouths so that the sound levels due to conversation are higher than at the fixed microphones. This results in the noise dose also being higher.
■ The two principal locomotive operations contributing to the crew noise dose are engine notch 8 and horn soundings, with some smaller contribution from the brake and engine notch 1.
xi v

■ Of the various terrain features examined, only tunnels are found to have a significant affect on the crew noise dose. For features such as upgrades, downgrades and cuts, the noise dose is a function of duration and not the terrain.
■ A simplified testing procedure based on in-cab sound level measurements of engine notch 8 (no load), horn sounding and brake application with the locomotive stationary appears to be a reasonable approach to making a pass/fail assessment of locomotive crew noise exposure. However, additional data are necessary to improve the statistical confidence of the stationary screening test prediction.
Based on these results, there does not appear to be a widespread problem of overexposure to noise for locomotive crews under current FRA regulations. However, as was seen for the locomotive on Test Run 2, there can be cases where overexposure to noise can occur when certain locomotives are used on certain runs. These cases, where overexposure to noise might occur, can be pinpointed using a stationary screening test procedure. If alternative hearing conservation criteria, such as that proposed by NIOSH, are adopted, the number of cases of overexposure to noise would increase and the stationary screening test procedures would have to be reexamined to determine their applicability.
XV

1.0 INTRODUCTION
Noise has long been recognized as a contributing factor in hearing damage [l]1. As such, the prospect of workers incurring hearing damage as the result of occupational exposure to noise is recognized in American industry as a potential safety and health hazard. In order to minimize this risk potential, the Occupational Safety and Health Administration (OSHA), acting under the authority of the Occupational Safety and
Health Act of 1970, has established regulations for maximum allowable occupational noise exposure [2]. These regulations are applicable to all workers not otherwise subject to safety and health related regulations issued by other Federal agencies. In the railroad industry, operat
ing employees fall under this latter class of potentially exempted workers since they are subject to the safety regulations of the Federal Railroad Administration (FRA) as outlined in the Federal Railroad Safety Act of
1970 [3].On March 7, 1975, the FRA published an Advance Notice of Proposed
Rule Making titled "Railroad Occupational Safety Standards" [4] in which
it proposed to adopt many of the OSHA Occupational Safety and Health
Standards including 29 CFR 1910.95 "Occupational noise exposure." Be
cause of an interest in locomotive crew noise exposure, the FRA decided
that a study of railroad noise environments should be conducted to
determine the extent of railroad worker noise exposure and to obtain the
^Numbers in brackets refer to references listed in Section 8.0 of this report.
1
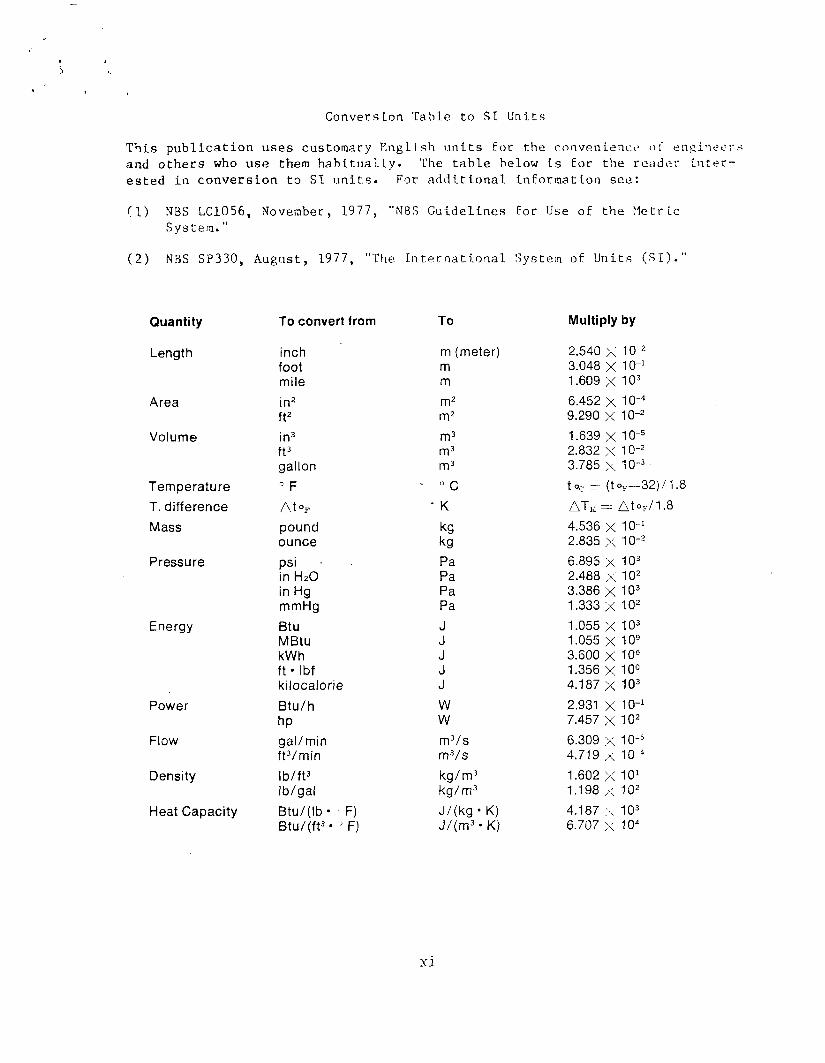
As a first step, the FRA decided to investigate railroad locomotive crew noise exposure. Through an Interagency Agreement, the FRA arranged for the National Bureau of Standards (NBS) to conduct a cooperative study with the Association of American Railroads (AAR) and four operating railroads— Consolidated Rail Corporation, Seaboard Coast Line Rail
road Company, Southern Pacific Transportation Company and Southern Rail
way System— to assess the noise environment in locomotive cabs. The
objectives of this study were to determine the characteristic noise
levels in locomotive cabs for various operational duty cycles and to
investigate simplified testing procedures which might be used to assess crew noise exposure for actual over-the-road runs. This report presents a description of the measurement methodology and instrumentation system
used to collect the necessary data base, an evaluation of the noise
environment in locomotive cabs for actual over-the-road operations, and the development of test procedures for routinely assessing the occupa
tional noise exposure of railroad locomotive crews.On March 31, ]980, the FRA published the final rule titled, "Rail
road Locomotive Safety Standards and Locomotive Inspections." This rule now defines the present noise regulations for the locomotive cab.
information necessary to provide railroad workers with hearing
conservation protection.
2

2.0 OCCUPATIONAL NOISE EXPOSURE
In developing this program, initial consideration was given to the question of which hearing conservation criteria should be used as a "benchmark" to assess the locomotive cab noise environment. This was necessary in order to design a measurement program and instrumentation system that would provide all of the required data to compare with the
chosen hearing conservation criteria. A review of the literature on the
subject indicates that, while many hearing conservation criteria exist,
the OSHA Occupational Noise Exposure Standard [2] is most commonly used
in the United States and therefore is probably most appropriate for this
study.The current OSHA noise regulation utilizes a time-weighted averaging
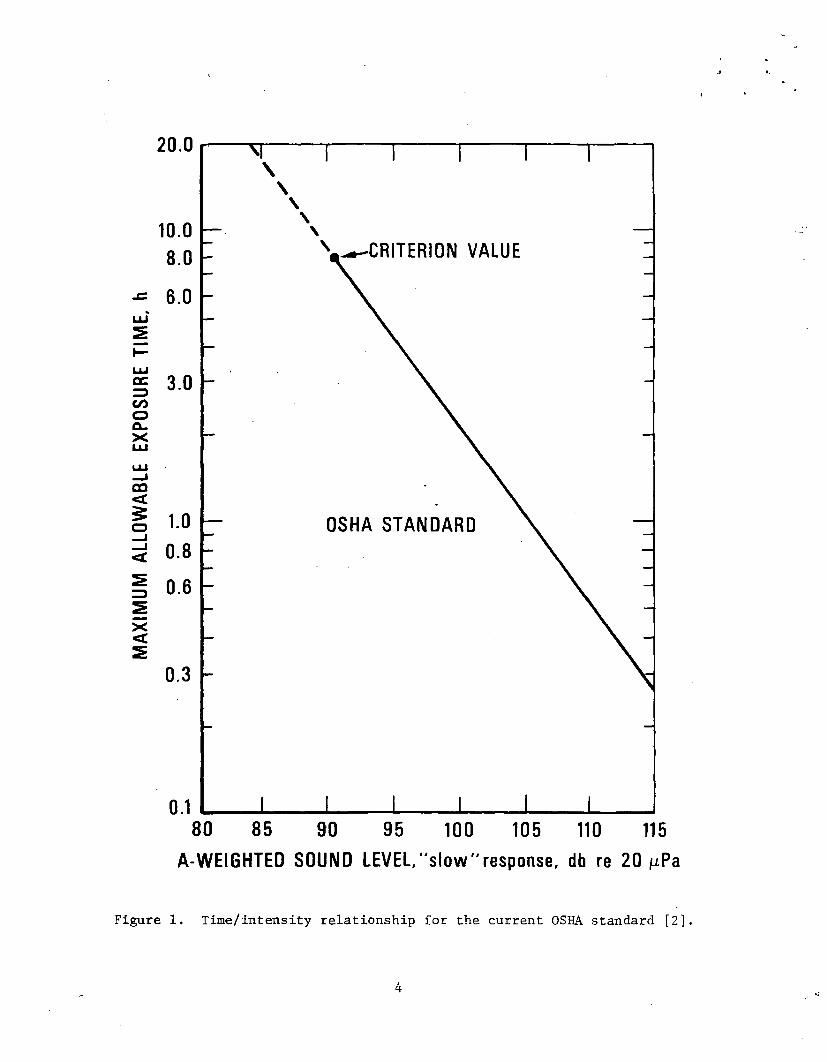
scheme that takes into account the intensity and duration of the noise to which the worker is exposed. The time/intensity relationship utilized by OSHA is illustrated in Figure 1. There are three important characteristics which describe this relationship:
Criterion Value - reference value for determining allowable noiseexposure, usually defined as the maximum steady-state sound level permitted for 8 hours of exposure,
Tradeoff Rate - defines the relationship between the equivalentsteady-state sound level and the allowable exposure time at that level, i.e., the slope of the line in Figure 1, and
2It should be noted that the OSHA Occupational Noise Exposure Standard specifies that the sound levels be measured using A-weighted, "slow" response as specified in ANSI SI.4-1971 [5]. All data presented in this report are A—weighted, "slow” response sound levels unless stated otherwise.
3
MAXIM
UM A
LLOW
ABLE
EXP
OSUR
E TIM
E,
A-WEIGHTED SOUND LEVEL,"slow"response, db re 20 /uPa
Figure 1. Time/intensity relationship for the current OSHA standard [2].
Threshold Level - steady-state sound level below which it is assumed that there is no contribution to potential hearing loss.
As shown in Figure 1, as the sound level increases the maximum aliowable exposure time at that level decreases. The "trade-off" rate between level and duration is 5 dB for each doubling of duration, e.g., 8 hours of exposure is permitted for a sound level of 90 dB, but only 4 hours is
permitted at 95 dB. In equation form, the maximum allowable time based on
the OSHA standard is given by90-l". 5 .T = 8x2 , (1)
where T = maximum allowable time, hours, andL = A-weighted, "slow" response sound level, dB.
The noise exposure or noise "dose" of the worker is determined by dividing the actual time exposed to a given sound level by the maximum
allowable time at that sound level obtained from Figure 1. If the worker is exposed to several different sound levels, the dose is the sum of the ratios of the actual times divided by the maximum allowable
times. Mathematically this can be expressed as:
C1 C2 C3 Cn- — + — + — + • • • + -Tl t2 t3 TLn
(2)
where, Cn = actual time exposed to a given sound level, hoursTn = maximum allowable time at that given sound level, hours.
The criterion for allowable noise exposure requires that the noise dosebe less than 1.0. A noise dose of 1.0 or greater indicates that the
5

Two other items to note in Figure 1 are the upper sound level limit of 115 dB and the baseline or threshold level of 90 dB. Under the current OSHA standard, no exposure time is permitted for sound levels in excess of 115 dB. Thus, if a worker is exposed to levels above 115 dB, this
automatically indicates that the OSHA criteria are exceeded.
The threshold level of 90 dB represents the baseline for determining a workers noise exposure. This means that any time spent in an environment where the sound level is less than 90 dB is not included in
the noise exposure or "dose" calculation for the worker. This is
demonstrated in the following example. Assume a machine shop worker does the following tasks in an 8 hour day:
lathe operation - 2 hours at 91 dB stamping - 2 hours at 95 dB,
punch press - 0.25 hour at 97 dB, andparts inspection - 3.75 hours at 83 dB.
The OSHA noise dose is then calculated by dividing the actual time by the maximum allowable times at each sound level above 90 dB and summing the
results. The noise dose for this example is
Noise Dose = 2 + 2 + 0.25 _ q .87.7.0 4.0 3.0
Since the noise dose is less than 1.0, the OSHA hearing conservation criterion is not exceeded. Note that in the above calculation the time spent
hearing conservation criterion has been exceeded and that there is a risk
of potential hearing damage.
6

The OSHA standard is based on an 8-hour work day. This is appropriate for most industrial situations, but the FRA hours of service rules permit railroad locomotive crews to work as long as 12 hours [6]. Hearing damage data for exposures greater than 8 hours are limited and no legally established procedures for dealing with such cases exist. One possibility might be to
extend the threshold level to the sound level corresponding to 12 hours.From Figure 1 or Equation (1), this sound level is 87.1 dB for the OSHA
standard.Another approach proposed by OSHA, but not yet legally adopted, was to
lower the threshold level to 85 dB [7]. The criterion value remains 90 dB for 8 hours but exposures to levels as low as 85 dB are included in the noise dose calculation. Referring to Figure 1, this corresponds to extending the solid line to the threshold level of 85 dB, which has a maximum permitted ex
posure of 16 hours. This same procedure has been proposed by FRA for regula
ting in-cab locomotive noise [8]. In this report, the noise dose is calculated using both the 85 and 87.1 dB threshold levels, in addition to the
90 dB value specified in the current OSHA standard. This is done to give some idea of the effect of possible future revisions of hearing conservation
criteria on in-cab locomotive noise exposure.Two other hearing conservation criteria which are being considered ate
the National Institute for Occupational Safety and Health (NIOSH) proposed 85 dB criterion value [9] and the equal-energy criteria [10]. The proposed NIOSH criteria are similar to the current OSHA standard with a time/intensity trade-off of 5 dB per doubling of duration. The difference is that the NIOSH
inspecting parts is not included since the sound level is below the thres
hold of 90 dB.
7

proposal would reduce the criterion value to 85 dB at 8 hours with an 80 dB threshold level. The equal-energy criteria, on the other hand, assume that the hearing-damage risk is determined by the total amount of sound energy to which the worker is exposed, so that the trade-off is 3 dB per doubling of duration and there is no threshold level. These criteria are plotted along
with the OSHA standard in Figure 2. (For sake of comparison, a criterion value of 90 dB at 8 hours is assumed for the equal-energy criteria.) As a
further comparison of the differences between these criteria, if the example
of the machine shop worker were repeated, the noise doses would be 2.09 for the NIOSH criteria and 1.36 for the equal-energy criteria. Both of these
proposed criteria would be exceeded in this case.
The noise dose calculations in this report are based on the 90 dB at 8 hour criterion value with a 90 dB threshold level as specified in the OSHA
standard (except where overall comparisons are made). The NIOSH and equal- energy hearing conservation criteria are mentioned only to demonstrate the effect on the noise dose calculation. If new regulations were adopted which
used either of these criteria, the material presented in this report would
have to be reexamined to determine its applicability.
The primary concept that should be remembered is that the noise dose is
a function of both sound level and duration. Even though a worker is exposed
to high sound levels (i.e., greater than 90 dB), the OSHA criteria may not be exceeded if the exposure times are sufficiently short (unless 115 dB is
exceeded). Thus in examining railroad locomotive noise, not only must the characteristic sound levels of the different sources and operations be determined, but also the typical duration or operational cycle. This concept of sound level versus duration is also important in determining which
8

MAX
IMUM
ALL
OWAB
LE E
XPOS
URE
TIM
E,
Figure 2. Comparison of the time/intensity relationships for the current OSHA standard [2], the proposed NIOSH criteria [9], and the equal-energy criteria [10].
9
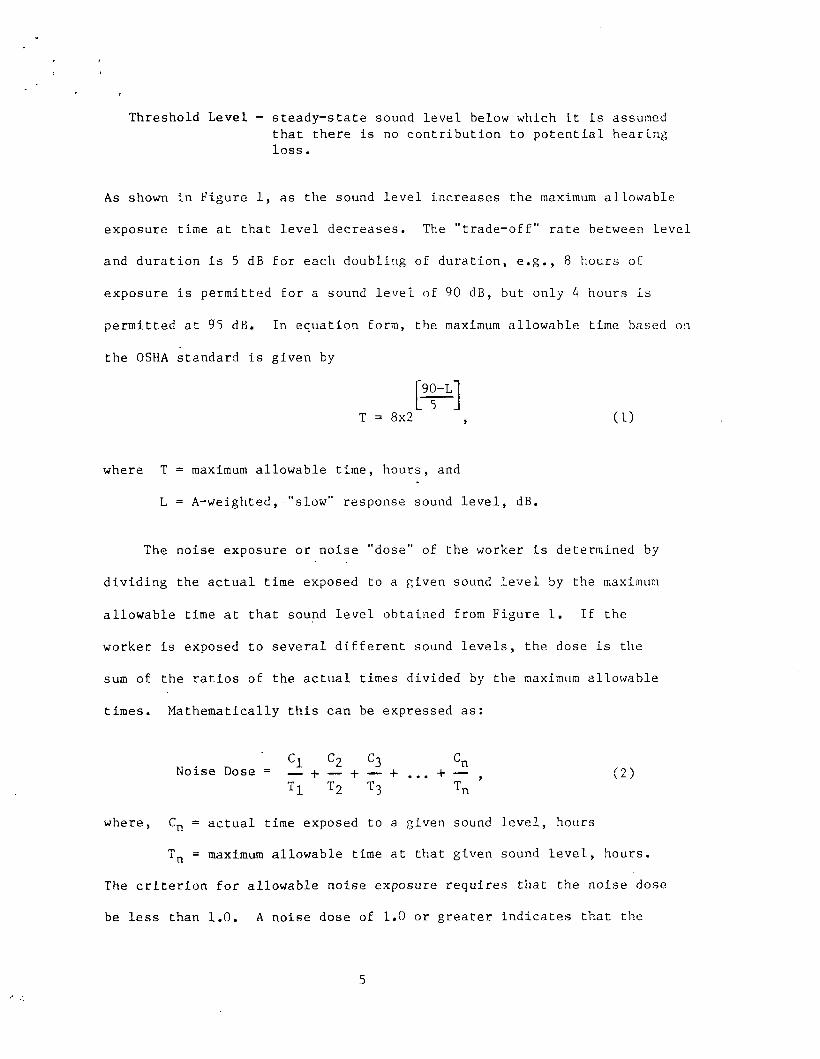
types of railroad locomotive operations are most likely to have cases of overexposure to sound e.g., switching versus over— the-road freight. Because in-cab sound level and operational duty cycle data are extremely limited, only engineering estimates can be made regarding the various types of locomotive operations. Based on the available data and conversations with FRA and AAR staff, railroad locomotive operations are broken down into four general
categories: switching, long division or drag freight, short division or
passenger and electric commuter. The relative qualitative estimates of
sound level and exposure time for these four categories are:Operation Sound Level Exposure
switching low highlong division or drag freight high highshort division or passenger high low
electric commuter low low
This is illustrated in Figure 3. As shown here, locomotives operated in
divisions which have long runs,, or where slow drag freight movement is
involved, are most likely to have problems with excessive noise exposure
because of the high sound levels and long exposure times. On the other hand, switching operation's, which have long exposure times but little notch 8 oper
ations and thus low sound levels, and short division or passenger trains,
which have high sound levels but short exposure times, are less likely to have situations where excessive noise exposure occurs.
10

INCR
EASI
NG E
XPOS
URE
TIME
INCREASING SOUND LEVEL
Figure 3. Approximate relationship between sound level and exposure time for various types of locomotive operations.
11

These, of course, are only qualitative estimates and are not intended to imply that there are not cases of overexposure to noise for these other opera tions. It merely means that the potential for overexposure to noise is greate for long division and drag freight operations. Thus, this initial study was limited to examination of long division and drag freight operations.
12

3.0 EXISTING LOCOMOTIVE DATA
In developing this program, initial efforts were directed at examining the available information on in-cab locomotive noise, typical locomotive operations, and the make-up of the current locomotive fleet. This information is useful in assessing the potential problem of in-cab locomotive noise and in determining what types of locomotives and locomotive operations are most prevalent. These data formed the basis for the development of the field measurement program.
A review of the literature showed that a breakdown of the U. S. locomotive fleet existed, but that data on in-cab locomotive noise and locomotive operations were limited. In no case had noise and duty cycle data been recorded simultaneously to permit evaluation of the noise dose. Thus, a survey of the current locomotive fleet was necessary to develop the required data base.
The remaining portion of this section is divided into three subsections dealing with in-cab locomotive noise, locomotive operations and the make-up of the locomotive fleet. Although limited, the data do indicate that cases of overexposure to noise could occur given the right combination of locomotive and trip length.
3.1' In-Cab Noise
The majority of data that are available on locomotive noise are for
exterior measurements, primarily in regard to the EPA Interstate Rail Carrier
Noise Emission Standards [11]. Although rank ordering of different types of
locomotives according to these data is possible, the information necessary to
infer in-cab noise levels from exterior noise measurements does not exist.
13

The data on in-cab noise that previously were available consisted primarily of maximum A-weighted sound levels for horn and brake applications and for the eight engine notch settings under load and no load conditions. Although this is useful information, without some knowledge of the operational duty cycle, e.g. the duration and number of horn applications and the amount of time spent in notch 1, notch 2, etc., assessment of crew noise
exposure is not possible.The data found in the literature are listed in Tables 1 and 2. These
data are for either stationary or over-the-road operating conditions for five types of locomotives. The operating condition during the measurement, engine
notch setting and measurement location in the cab, if specified in the
original reference, are also listed in.these tables. The following general
conclusions can be made based on these data:1) In-cab noise levels increase with engine notch setting.
2) Horn and brake applications generate noise levels greater than that generated by the engine, even at notch 8.
3) In most cases there is little difference in noise level between the engineer's position and the fireman's or brake- man's position in the cab.
4) At low notch settings there is practically no change in noise level due to opening or closing the cab windows.At notch 8, opening the windows increases the noise level in the cab by 2.5 to 4 dB.
These results are not surprising considering the physical construction
and layout of most diesel electric locomotives. The general design consists
of a diesel engine hard-mounted to the main frame rails and exhausted out of a stack through the top of the locomotive hood. The diesel engine drives an
14

Table 1 In-cab noise levels for various locomotives operating under stationary or over-the-road test conditions.
LOCOMOTIVE KNOTNE MEASUREMENT A-WEIGHTEDLOCOMOTIVE OPERATING CONDITION NOLSE NOTCH LOCATION IN SOUND LEVEL,
*OD€7.!
DURING MEASUREMENT SOURCE SETTING CAB dB re 20 pPa REFERENCE
r-----------------------------
EMD le a d u n i t In c o n s is t e n g in e (a ) unspec i f ie d u n s p e c i f ie d 92 i / 1SD45 v L th a n o th e r SD45 o p e r
a t in g o n - l i n e p u l l in g 72 c a r , 4 06 5 to n f r e ig h t
" (b ) 88
t r a i n h o rn (a ) unspec i f ie d u n s p e c if ie d 98a ) l i g h t lo a d , medium
speedb ) h ea vy lo a d , low speed
ALCO o p e r a t in g o n - l i n e p u l l in g eng Lno u n s p e c if ie d u n s p e c if ie d 90 l i ' 1AGP-20-MSC 4 c a r p a s s e n g e r t r a in horn " " 93
medium lo a d , medium speed b rake M 11 105
EMD s t a t i o n a r y , co n n ec ted e n g in e (a ) i u n s p e c i f ie d 75 1 3 ’F7A to lo a d c e l l 2 " 78
a ) w indow s c lo s e d 3 " 81b ) w indow s open 4 " 85c ) e n g in e room d o o r open 5 " 88
6 " 897 " 9 0 .58 " 9 0 . 5 - 9 2 .5
e n g in e (b )8
f ir e m a n ' s p o s it io n 91
e n g in e (c ) 8 M 105horn (b ) 8 M 103b ra k e (b ) cro ss in g
8 u n s p e c if ie d 98
b e l l (b ) a 91
EMD s t a t i o n a r y , co n n ec ted en g in e (a ) l e n g in e e r 1s 71 L3‘GP9 to lo a d c e l l 2 pos i t io n 74
a ) w indows c lo s e d n 3 " 80b ) w indows open 4 11 81c ) e n g in e room do o r open 5 " 84
ii 6 M 85it 7 " 88ii 8 " 87
en g in e (b )8
f ire m a n 1s p o s it io n 94
en g in e (c ) 8 " 100h o rn (b ) 8 102
EMD o p e r a t in g as s w itc h in g e n g in e 1 e n g in e e r 1s 70 L4“GP7 e n g in e p u l l i n g 25 " 8 p o s it io n 9 2 -9 5
lo a d e d c a rs horn 1 " 93b ra k e 1 " 9 2 -9 7
i em ergency b rake 1 - 1 1 6 -1 2 0
s t a t i o n a r y , co n n ec ted e n g in e 8 e n g in e e r 1s 95 15 ‘to lo a d c e l l , window p o s i t io n u n s p e c if ie d
horn 1 p o s it io n 104
M easurem en ts made
2 M easurem en ts made
u s in g
u s in g
a
a
sound
sound
l e v e l m e te r
l e v e l m ete r
m e te r re s p o n s e u n s p e c i f ie d ,
m e te r s e t f o r " f a s t " re s p o n s e .
15

Table 2. In-cab noise levels for an EMD SD40-2 locomotive operating by itself. Measurements were made at positions corresponding to 6 inches from the engineer's and brakeman's ears using a sound level meter set for A-weighting and "slow" meter response [16].
SPEED,mph
THROTTLENOTCHSETTING
WINDOWPOSITION
A-WEIGHTED SOUND LEVEL, dB re 2 0 pPaSHORT HOOD FORWARD* LONG HOOD FORWARD*ENGINEER BRAKEMAN ENGINEER BRAKEMAN
1 0 Idle Closed 6 8 6 8 — —
1 0 1 Closed 69.5 69.5 69 691 0 1 Open 71 71.5 69.5 702 0 Idle Closed 68.5 69 — —
2 0 1 Open 69.5 70.5 69.5 69.52 0 1 Closed 70.5 71 70.5 70.52 0 8 Closed 82.5 81.5 84 83.540 Idle Closed 71 71 71 71.540 4 Closed 76 75.5 76.5 76.540 8 Closed — — 83 8355 Idle Closed 73.5 74 74 7455 8 Closed 84 83.5 82 81.555 8 Open — — 84.5 85.5
*See Figure A-l on page 154 for illustration of short hood and long hood ends of a locomotive.
16

electrical alternator which in turn drives electric traction motors on the axles. Since the cab is also hard-mounted to the same frame rails as the engine, a considerable portion of the in-cab noise is probably due to structure-borne noise propagated along the frame rails and radiated into the cab from the interior panels. Thus as the engine notch setting is increased, the engine speed and generated horsepower increase and as a result so do the
in-cab noise levels.The fact that the in-cab noise levels are affected by window position at
notch 8 and not at low notch settings indicates that the principal sources of noise are most probably structure-borne engine noise at low notch settings
and exhaust stack radiated noise at high notch settings. Although no data
were reported, one would expect that window position would have an influence
on in-cab levels due to horn operations, since the horn is located on the exterior of the cab, but not the levels due to brake applicatons since the brake pipe vent is inside the cab. Also, since the cab is a relatively hard, reverberant space, the noise levels would not be expected to vary
significantly throughout the cab. This is verified by these data.
There are several specific items which should also be mentioned regarding these and other related data:
1) Opening the engine room door obviously has a significant effect on in-cab noise levels and must be considered when evaluating the crew noise exposure in locomotives [13].
2) The data from references. [13] and [14] must be treated cautiously since measurements were made using "fast" rather than "slow" meter response as specified by OSHA. If relatively "steady-state" noise sources are being measured, such as engine noise, the difference between "slow" and "fast” response results may be small, but for transient events such as horn blasts or brake pipe ventings, this is not the case. For such events, a meter set for "slow"
17
response cannot respond fast enough. This results in a lower maximum sound level reading than if "fast" meter response were used. This is mentioned here because in Reference 14 the emergency brake application, which is a short duration, high intensity noise, generated levels greater than the 115 dB permitted by OSHA. If "slow" meter response had been used, these levels would probably have been lower than those reported and perhaps even less than 115 dB.
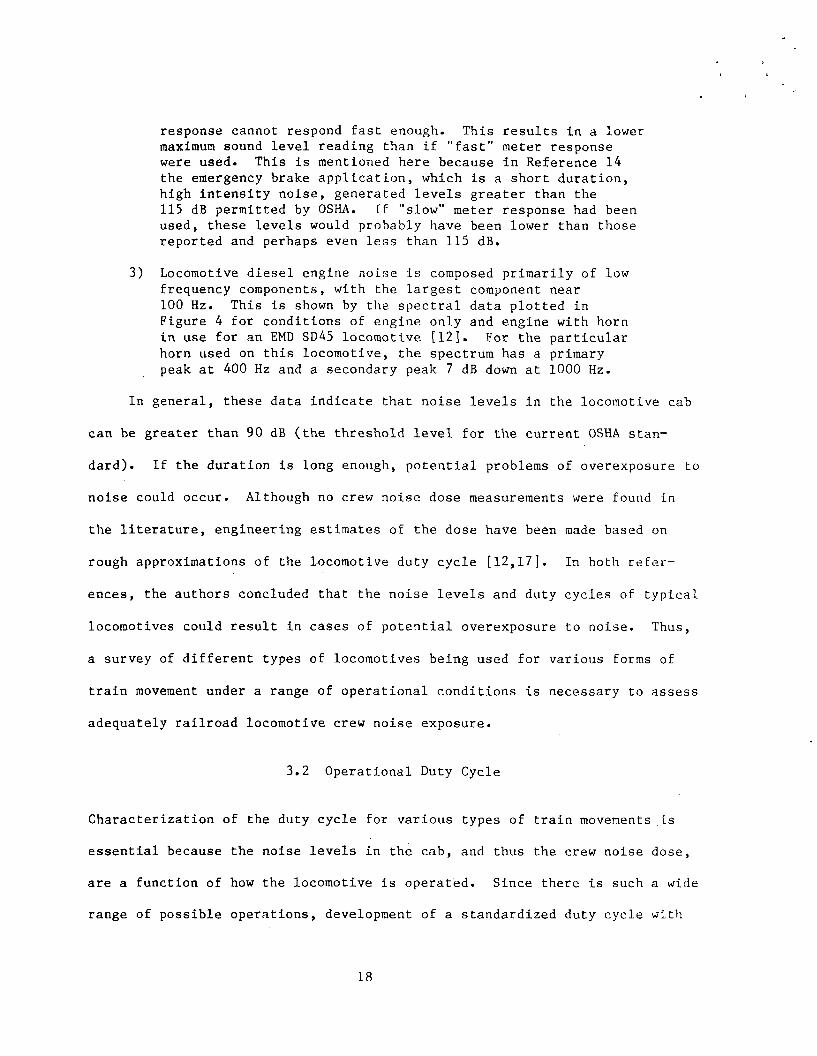
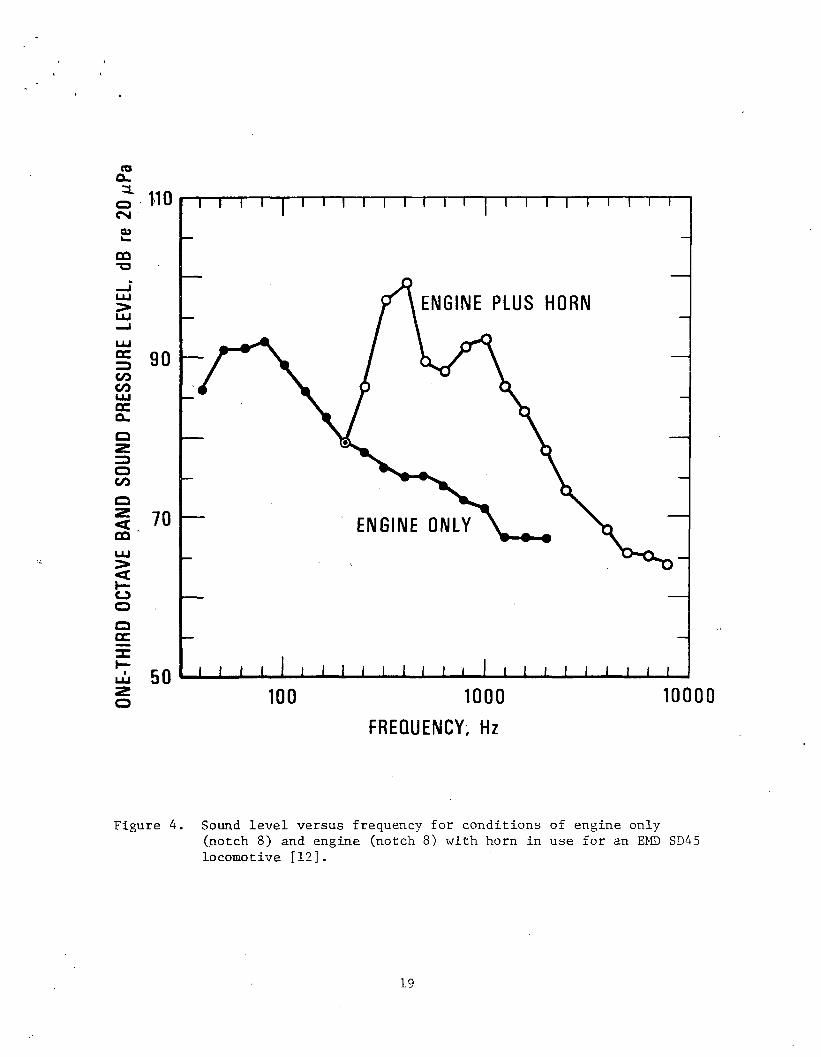
3) Locomotive diesel engine noise is composed primarily of low frequency components, with the largest component near 100 Hz. This is shown by the spectral data plotted in Figure 4 for conditions of engine only and engine with horn in use for an EMD SD45 locomotive [12]. For the particular horn used on this locomotive, the spectrum has a primary peak at 400 Hz and a secondary peak 7 dB down at 1000 Hz.
In general, these data indicate that noise levels in the locomotive cab can be greater than 90 dB (the threshold level for the current OSHA stan
dard). If the duration is long enough, potential problems of overexposure to noise could occur. Although no crew noise dose measurements were found in
the literature, engineering estimates of the dose have been made based on
rough approximations of the l-ocomotive duty cycle [12,17]. In both refer
ences, the authors concluded that the noise levels and duty cycles of typical
locomotives could result In cases of potential overexposure to noise. Thus,
a survey of different types of locomotives being used for various forms of
train movement under a range of operational conditions is necessary to assess adequately railroad locomotive crew noise exposure.
3.2 Operational Duty Cycle
Characterization of the duty cycle for various types of train movements is essential because the noise levels in the cab, and thus the crew noise dose, are a function of how the locomotive is operated. Since there is such a wide range of possible operations, development of a standardized duty cycle with
18
ONE-
THIR
D OC
TAVE
BAN
D SO
UND
PRES
SURE
LEV
EL d
B re
20 /i
Pa
1 0 0 1000 10000 FREQUENCY, Hz
Figure 4. Sound level versus frequency for conditions of engine only(notch 8) and engine (notch 8) with horn in use for an EMD SD45 locomotive [12].
19

wide applicability may not be feasible. Examination of the available Information in the literature shows that duty cycle data are available for locomotive diesel engine operations, but that only very sketchy information is available concerning horn and brake applications for different types of runs. The duty cycle data on locomotive diesel engine operations were obtained pri
marily for fuel economy and exhaust emissions studies and may not represent a
broad enough range of locomotive operations to characterize adequately all
types of locomotive operations in the United States.
3.2.1 Diesel Engine OperationsLocomotive diesel engines operate in a number of discrete throttle positions
or "notches”, each of which corresponds to a unique engine speed and power
output. Many line-haul locomotives are also equipped with a dynamic brake mode which utilizes the traction motors to slow down the train. This is accomplished by using the traction motors as generators and passing the current that is produced through a' bank of resistor grids where the power is dissi
pated as heat. In the dynamic brake mode the engine operates at a predeter
mined speed specified by the engine manufacturer.
The two primary manufacturers of diesel-electric locomotives in the
United States are the Electro-Motive Division (EMD) of General Motors Corpor
ation and the General Electric Company (GE). All EMD and most GE locomotives
utilize eight engine speeds to obtain the eight power outputs or notch set
tings (plus an Idle notch). However, late model GE units use just two engine
speeds (plus a low idle speed) to produce the same eight power outputs. The nominal engine speeds and percent of rated brake horsepower for both types of GE locomotives and for EMD locomotives are given in Table 3 [18],
20
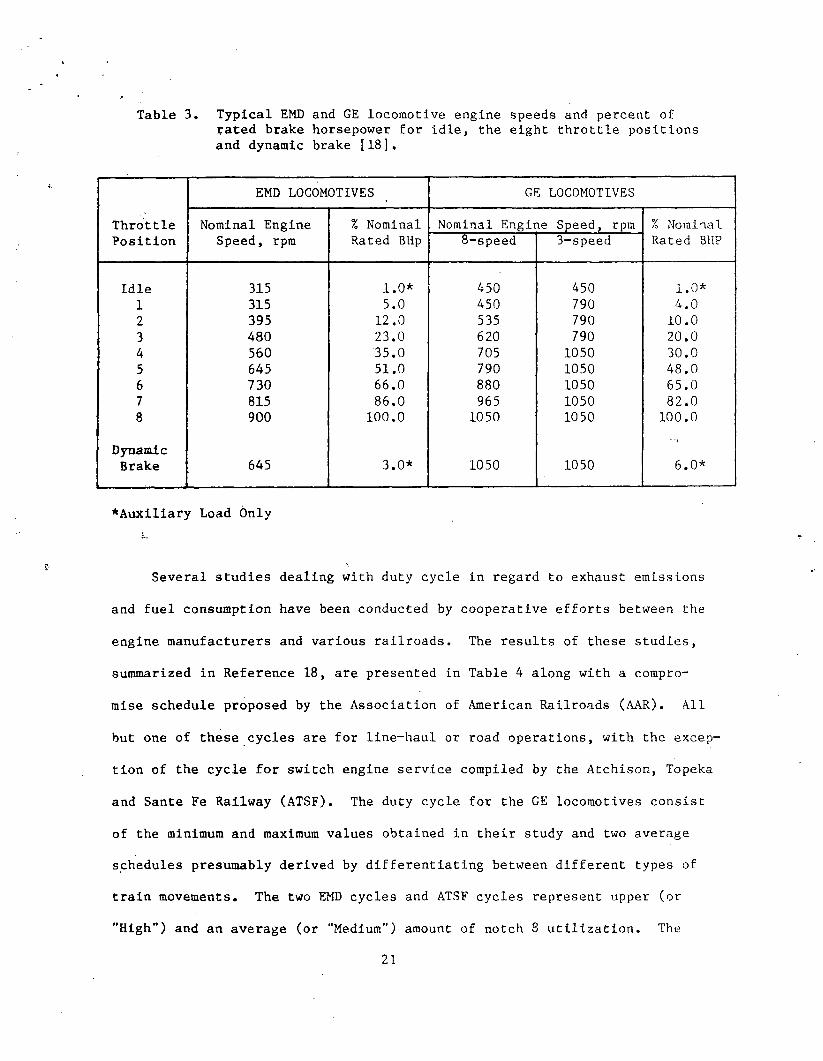
Table 3 Typical EMD and GE locomotive engine speeds and percent of rated brake horsepower for idle, the eight throttle positions and dynamic brake [18],
ThrottlePosition
EMD LOCOMOTIVES GE LOCOMOTIVESNominal Engine
Speed, rpm% Nominal Rated BHp
Nominal Engine Speed, rpm % Nominal Rated BHP8-speed 3-speed
Idle 315 1.0* 450 450 1.0*1 315 5.0 450 790 4.02 395 12.0 535 790 10.03 480 23.0 620 790 20.04 560 35.0 705 1050 30.05 645 51.0 790 1050 48.06 730 66.0 880 1050 65.07 815 86.0 965 1050 82.08 900 100.0 1050 1050 100.0
DynamicBrake 645 3.0* 1050 1050 6.0*
*Auxiliary Load Only
Several studies dealing with duty cycle in regard to exhaust emissions
and fuel consumption have been conducted by cooperative efforts between the
engine manufacturers and various railroads. The results of these studies, summarized in Reference 18, are presented in Table 4 along with a compromise schedule proposed by the Association of American Railroads (AAR). All
but one of these cycles are for line-haul or road operations, with the exception of the cycle for switch engine service compiled by the Atchison, Topeka
and Sante Fe Railway (ATSF). The duty cycle for the GE locomotives consist of the minimum and maximum values obtained in their study and two average schedules presumably derived by differentiating between different types of train movements. The two EMD cycles and ATSF cycles represent upper (or "High”) and an average (or "Medium") amount of notch 8 utilization. The
21
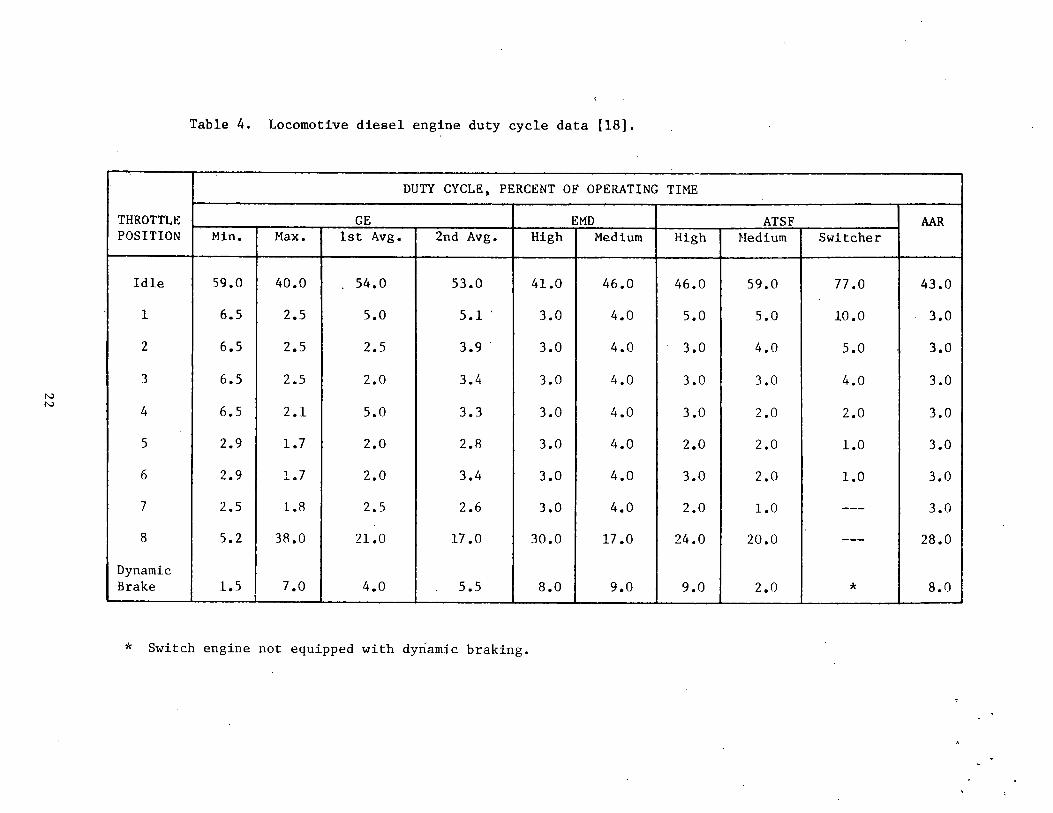
Table 4. Locomotive diesel engine duty cycle data [18]
DUTY CYCLE, PERCENT OF OPERATING TIMETHROTTLE GE EMD ATSF AARPOSITION Min. Max. 1st Avg. 2nd Avg. High Medium High Medium Switcher
Idle 59.0 40.0 . 54.0 53.0 41.0 46.0 46.0 59.0 77.0 43.01 6.5 2.5 5.0 5.1 ' 3.0 4.0 5.0 5.0 10.0 3.02 6.5 2.5 2.5 3.9 3.0 4.0 3.0 4.0 5.0 3.03 6.5 2.5 2.0 3.4 3.0 4.0 3.0 3.0 4.0 3.04 6.5 2.1 5.0 3.3 3.0 4.0 3.0 2.0 2.0 3.05 2.9 1.7 2.0 2.8 3.0 4.0 2.0 2.0 1 . 0 3.06 2.9 1.7 2.0 3.4 3.0 4.0 3.0 2.0 1 . 0 3.07 2.5 1.8 2.5 2.6 3.0 4.0 2.0 1 . 0 — 3.08 5.2 38.0 21.0 17.0 30.0 17.0 24.0 20.0 — 28.0
DynamicBrake 1.5 7.0 4.0 5.5 8.0 9.0 9.0 2.0 * 8.0
* Switch engine not equipped with dynamic braking

These data show that for line-haul locomotive operations the major percentage of time is spent either in notch 8 or at idle with a much lower, and fairly even, distribution among the other notch settings. The switcher duty cycle is, as expected, primarily idle and low power notch settings.
There are differences among the nine duty cycles for line-haul locomo
tives, especially the percentages of time spent at idle and at notch 8. As
reported in Reference 18, these differences may be due to the interpretation of "total” engine operating time, since locomotive engines are normally allowed to idle when not in use and are not shut off except for major maintenance and repair. If the total engine operating time is defined to include
the time spent with the locomotive in idle awaiting routine maintenance or service such as fueling, loading with sand, etc., the percent time for the idle throttle position will be substantially higher. Based on these data, it
is not possible to determine the locomotive engine duty cycle for in-service operations, since a portion of the total engine operating time may include times when the crew is not aboard. This difference can be noted by comparing
the data from Table 4 with the data in Table 5 which gives the average percent time spent in each notch setting while the locomotive is operating online [19]. In this case, the majority of time is spent at notch 8, with no
time at idle. While this may be a valid representation of the duty cycle for
the total time that the locomotive is under way, it does not represent the duty cycle for the total time that the crew is aboard the locomotive. There are times spent with the locomotive at idle waiting to get into or out of yards or on a siding for another train to pass which should be included in the duty cycle.
AA R duty cycle is a compromise between the "High" EMD and the GE duty cycles
and is not the result of an actual study.
23

Table 5. Locomotive diesel engine duty cycle based on the time that the locomotive is under way [19],
THROTTLEPOSITION
DUTY CYCLE, average percent
timeIdle —
1 5
2 5
3 5
4 5
5 5
6 57 58 51
DynamicBrake 14
The data presented in Tables 4 and 5 represent averages based on various types of operational runs. While this information is useful for examining
the relative amounts of time spent in each notch setting, it does not provide any indication of the variability of this time for different types of opera
tional runs.Duty cycle data for individual runs were obtained in a fuel consumption
test program conducted by FRA [20], These data are for a unit coal train (both loaded and unloaded) and a unit "TOFC" (trailer-on-flat car) train.The data are presented for discrete test zones which were established to
24
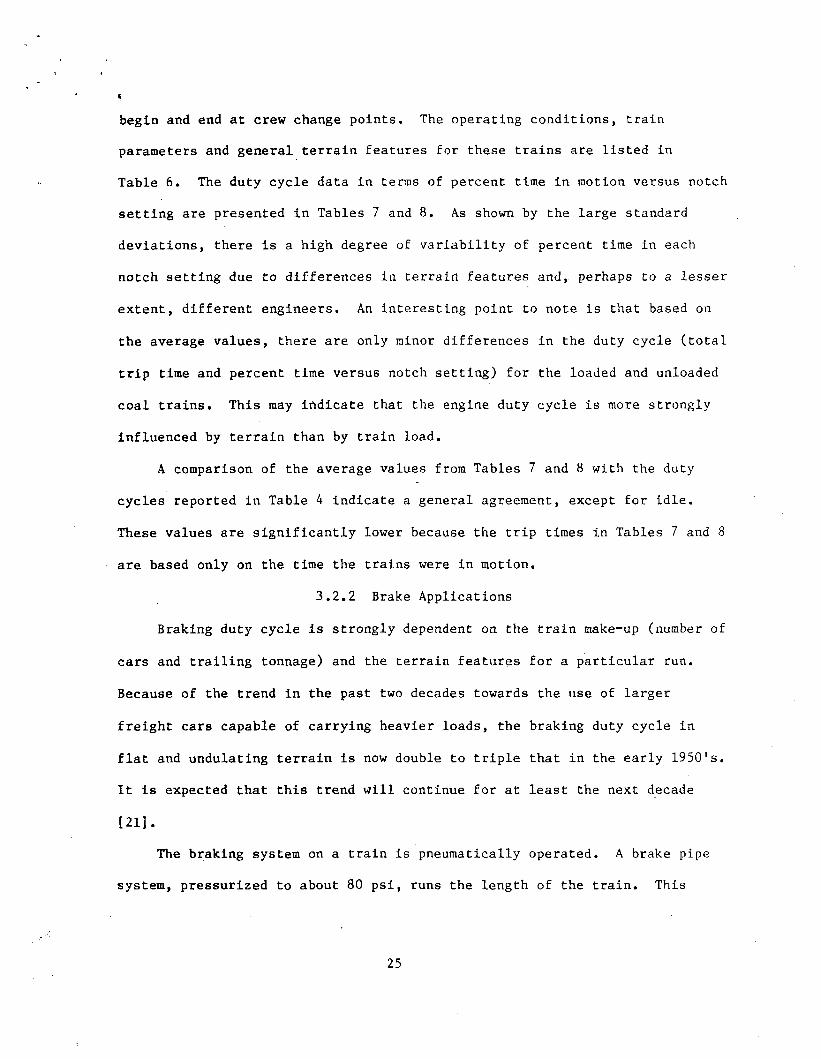
(begin and end at crew change points. The operating conditions, train parameters and general terrain features for these trains are listed in Table 6. The duty cycle data in terms of percent time in motion versus notch setting are presented in Tables 7 and 8. As shown by the large standard deviations, there is a high degree of variability of percent time in each notch setting due to differences in terrain features and, perhaps to a lesser extent, different engineers. An interesting point to note is that based on
the average values, there are only minor differences in the duty cycle (total
trip time and percent time versus notch setting) for the loaded and unloaded coal trains. This may indicate that the engine duty cycle is more strongly influenced by terrain than by train load.
A comparison of the average values from Tables 7 and 8 with the duty cycles reported in Table 4 indicate a general agreement, except for idle.
These values are significantly lower because the trip times in Tables 7 and 8 are based only on the time the trains were in motion.
3.2.2 Brake Applications
Braking duty cycle is strongly dependent on the train make-up (number of
cars and trailing tonnage) and the terrain features for a particular run.
Because of the trend in the past two decades towards the use of larger
freight cars capable of carrying heavier loads, the braking duty cycle in
flat and undulating terrain is now double to triple that in the early 1950's. It is expected that this trend will continue for at least the next decade
[21].The braking system on a train is pneumatically operated. A brake pipe
system, pressurized to about 80 psi, runs the length of the train. This
25

1
Table 6. Operating conditions for trains used in FRA fuel consumption test program [20].
OPERATING UNIT COAL TRAIN UNIT "TOFC" TRAIN
CONDITIONS LOADED UNLOADED WESTBOUND EASTBOUND
Type of Terrain Predominantly level: 80% of run between 0 + 0.49% grade
Mixed: level to mountainous
Locomotives EMD SD40 (4 units) EMD DD40 EMD SD40
( 2 units) ( 1 unit)
Total Horsepower 1 2 , 0 0 0 16, 2 0 0
Total Number of Cars 1 1 0 1 1 0 35 47
i. loaded 1 1 0 34 46
ii. unloaded 1 1 0 1 1
Trailing Gross Tons 14,395 3,397 2,501 3,233
Miles Traveled 682.1 682.1 1,519 605
Total Time in Motion, hours
27.90 27.5 31.38 11.03
Average Speed, mph 24.4 24.8 48.8 55.3
Number of Crews 6 6 8 3
Number of Stops 31 32 8 3
26

Table 7 In-service locomotive diesel engine duty cycle information for a unit coal train (loaded and unloaded) [20]. The operating conditions are listed in Table 6.
TEST TRIP PERCENT OF TOTAL TRIP TIME IN EACH NOTCH SETTINGTIME, STOPS
ZONE hr IDLE 1 2 3 4 5 6 7 8
L 1 5.10 2 4.8 3.4 10.5 6.6 8.6 5.8 10.5 6.2 43.60A 2 3.52 2 4.7 9.0 11.1 19.9 15.1 4.7 5.1 1.7 28.7DE 3 4.47 4 9.7 6.8 10.1 8.9 5.5 12.7 5.2 2.3 38.8D 4 2.99 4 15.6 8.7 23.2 14.8 6.5 10.7 5.1 4.8 10.5
5 6.93 12 7.7 8.5 16.0 13.3 14.9 11.9 11.5 6.3 9.96 4.89 7 5.8 9.6 12.7 10.9 13.8 14.6 7.7 4.3 20.6
MEAN 4.65 5 8.1 7.7 13.9 12.4 10.7 10.1 7.5 4.3 25.4STANDARDDEVIATION 1.38 4 4.2 2.3 5.0 4.7 4.4 4.0 2.9 1.9 14.2
TEST TRIPTIME, STOPS
PERCENT OF TOTAL TRIP TIME IN EACH NOTCH SETTINGZONE hr IDLE 1 2 3 4 5 6 7 8
U 1 (3.23)* 4* 9.3 10.5 12.7 7.0 5.0 6.9 9.7 8.9 30.0NL 2 3.39 5 2.7 5.5 8.7 9.3 7.4 2.6 8.3 12.1 43.40A 3 (0.63)* 2 5.3 15.7 16.2 3.7 2.9 2.9 4.2 0.0 49.1DE 4 (2.48)* 2 6.0 14.3 31.4 11.6 4.5 5.0 6.7 6.6 13.9D
5 6.98 10 10.9 19.2 29.0 12.7 16.1 7.7 2.4 0.6 1.46 4.88 9 4.8 12.9 22.0 13.2 15.6 18.3 5.9 2.3 5.0
MEAN 5.08 8 6.1 12.5 19.9 11.7 13.0 9.5 5.5 5.0 16.3STANDARDDEVIATION 1.80 3 4.3 6.9 10.3 2.1 4.9 8.0 3.0 b. 2 23.6
* Less than trip time; percent times based on available throttle data.Data for these zones are not included in the mean and standard deviationcalculations.
27

Table 8. In-service locomotive diesel engine duty cycle information for a unit "TOFC" train [20]. The operating conditions are listed in Table 6.
1---- TRIPTIME,hr
PERCENT OF TOTAL TRIP TIME IN EACH NOTCH SETTINGC * 2 3 4 5 6 7 3
1 4.46 8.1 11.1 4.0 4.7 1.7 4.4 20.5 45.52 3.23 17.2 2.8 5.6 15.4 7.9 6.0 7.4 37.53 3.33 29.3 6.3 14.0 11.7 10.4 10.4 7.6 10.3
wE 4 4.01 45.3 1.0 6.0 11.6 7.9 10.9 5.6 11.6ST 5 3.42 13.6 1.7 7.5 9.6 18.9 15.4 17.1 16.2
6 5.31 51.7 1.1 2.8 3.7 9.6 9.0 7.1 15.07 3.45 33.5 1.3 3.4 3.9 8.7 13.5 5.7 30.08 4.17 43.5 7.9 8.3 7.2 3.6 6.8 5.8 16.9
E 1 4.26 39.4 6.3 4.2 8.5 11.3 10.9 13.4 6.0AS 2 2.93 25.6 1.5 6.2 10.8 5.6 5.1 3.6 41.6T 4 3.84 11.7 2.0 8.6 8.2 5.1 24.6 12.1 27.7
MEAN 3.86 29.0 3.9 6.4 8.7 8.2 10.6 9.6 23.5STANDARDDEVIATION 0.68 15.0 3.4 3.2 3.7 4.6 5.8 5.4 13.6
* Combined idle-dynamic brake sequence.
28
brake pipe system is connected, through appropriate control valves on each
car, to brake cylinders which are used to apply the brakes. In over-the-road operations, the brakes are applied by venting controlled amounts of air from the brake pipe system through the automatic brake valve in the lead unit of the locomotive consist. This pressure reduction ranges from 5 to 10 psi for
a minimum reduction, to 23 to 26 psi for a full service system reduction [22], The air released from the brake pipe system during this pressure re
duction is vented directly from the automatic brake valve into the locomotive cab. This venting of air is the mechanism which generates the noise associated with a brake application. The duration and intensity of this venting process are functions of the brake pipe pressure reduction and the length (i.e., total air volume in the brake system) of the train. Should a situation occur which requires the train to be stopped immediately, the
automatic brake valve can be placed in the "emergency" position. In this position the air from the brake pipe is vented at a much higher rate causing the train brakes to be quickly applied. In this case the duration of the air
venting is shorter, but the sound level is much higher.The locomotives in the consist also have a separate braking system from
the train brakes. This system, referred to as the "independent" brake, is
similar to the train brake system. The air venting for the independent brake
is identical to the train brake pipe venting except that because the total volume is smaller, the duration is shorter.
Data on braking duty cycle are limited primarily to studies investigating brake equipment and brake shoe wear. Although a considerable amount of work has been done on braking to improve train handling, these studies have
29
looked at the proper braking sequence for particular train make-ups and terrain features and not the total braking duty cycle for a complete run. Reference 21, cited above, gives an overview of past trends and future projec— tions of braking duty cycle for freight train services in North America, as well as an example of braking duty cycle for a complete run. This example, given in Table 9, is for an in-service run in the southcentral portion of the United States. For this particular run, which is 136 miles long, there were 32 brake applications with an average brake pipe pressure reduction of
8 . 6 psi and an average duration of 67 seconds.
Based on information similar to this for runs over other types of terrain, the ranges of average braking duty cycle listed in Table 10 were
determined [21], Although the percentage of time spent braking is higher for
long, heavy grade terrain, the majority of the braking that occurs takes
place over general undulating terrain because of the large proportion of route miles which are this type of terrain. The braking technique commonly
used is called power or "stretch" braking. Stretch braking involves working
the power of the locomotive consist against the action of the brakes to hold
the train speed steady or to make minor speed reductions on a downgrade while
running over undulating terrain. Utilization of this braking technique
results in frequent use of the air brake system, but provides for better train handling through closer control of train speed and slack.
3.2.3 Horn Soundings
There are very few data regarding horn duty cycle because the horn is used only intermittently and is not an integral part of the train handling or
30
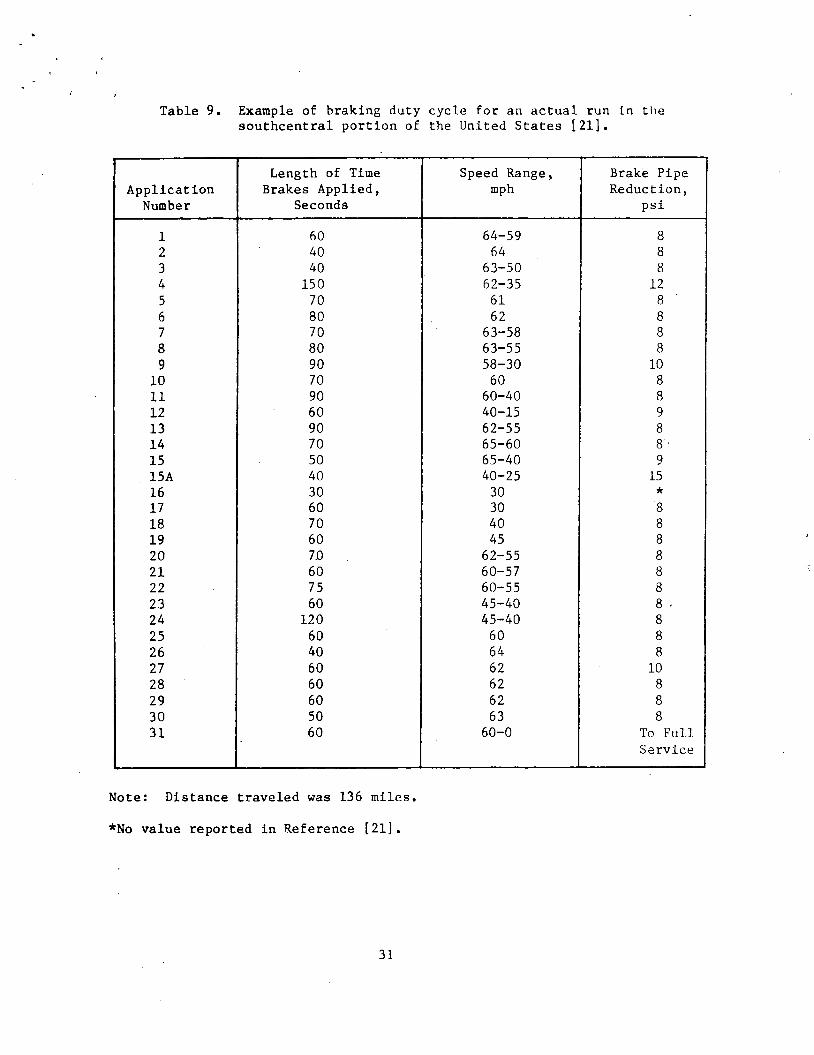
Table 9. Example of braking duty cycle for an actual run in tiie southcentral portion of the United States [21].
ApplicationNumber
Length of Time Brakes Applied,
SecondsSpeed Range,
mphBrake Pipe Reduction,
psi
1 60 64-59 8
2 40 64 8
3 40 63-50 8
4 150 62-35 1 2
5 70 61 8 '6 80 62 8
7 70 63-58 8
8 80 63-55 8
9 90 58-30 1 0
1 0 70 60 8
1 1 90 60-40 8
1 2 60 40-15 913 90 62-55 8
14 70 65-60 8 •15 50 65-40 915A 40 40-25 1516 30 30 *17 60 30 8
18 70 40 8
19 60 45 8
2 0 70 62-55 8
2 1 60 60-57 8
2 2 75 60-55 8
23 60 45-40 8 ■24 1 2 0 45-40 8
25 60 60 8
26 40 64 8
27 60 62 1 0
28 60 62 8
29 60 62 8
30 50 63 8
31 60 60-0 To Full Service
Note: Distance traveled was 136 miles.*No value reported in Reference [21],
31
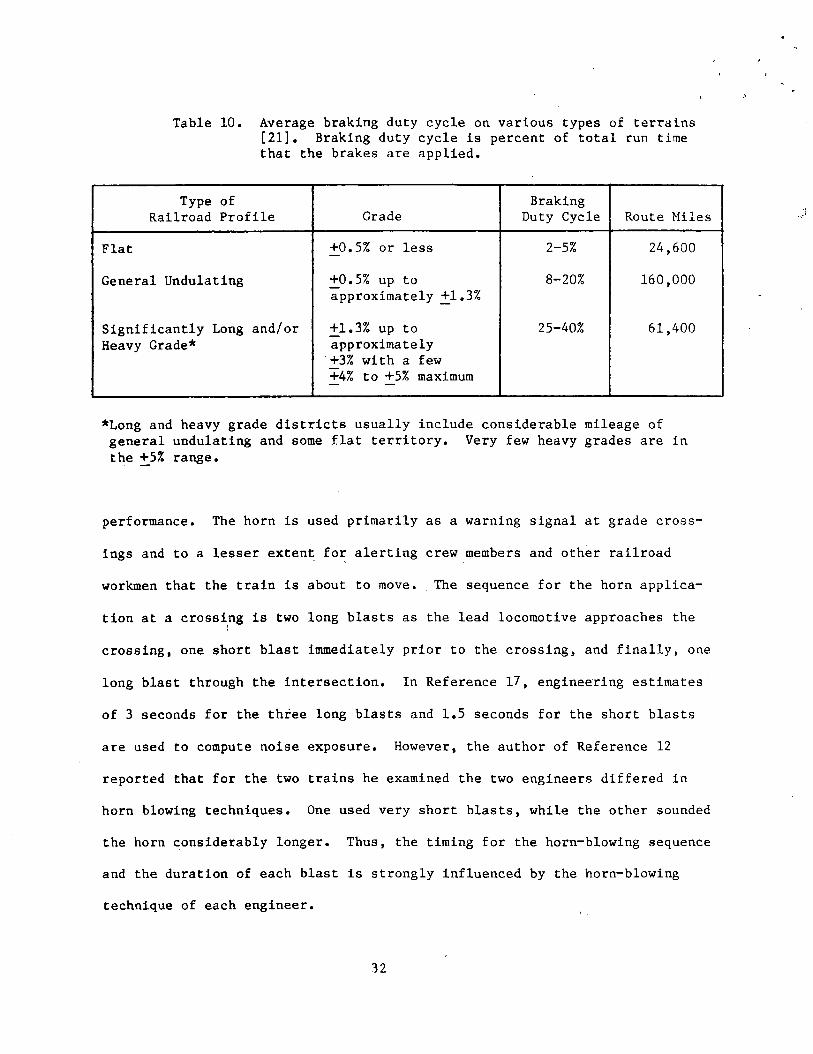
Table 10. Average braking duty cycle on various types of terrains[21]. Braking duty cycle is percent of total run timethat the brakes are applied.
Type ofRailroad Profile Grade
Braking Duty Cycle Route Miles
Flat +0.5% or less 2-5% 24,600
General Undulating +0.5% up to approximately +1.3%
8 -20% 160,000
Significantly Long and/or Heavy Grade*
+1.3% up to approximately +3% with a few +4% to +5% maximum
25-40% 61,400
*Long and heavy grade districts usually include considerable mileage of general undulating and some flat territory. Very few heavy grades are in the +5% range.
performance. The horn is used primarily as a warning signal at grade cross
ings and to a lesser extent for alerting crew members and other railroad
workmen that the train is about to move. . The sequence for the horn applica
tion at a crossing is two long blasts as the lead locomotive approaches the
crossing, one short blast immediately prior to the crossing, and finally, one
long blast through the intersection. In Reference 17, engineering estimates
of 3 seconds for the three long blasts and 1.5 seconds for the short blasts
are used to compute noise exposure. However, the author of Reference 12
reported that for the two trains he examined the two engineers differed in
horn blowing techniques. One used very short blasts, while the other sounded
the horn considerably longer. Thus, the timing for the horn-blowing sequence
and the duration of each blast is strongly influenced by the horn-blowing
technique of each engineer.
3 2
Regardless of the horn-blowing technique of the engineer, the control
ling factor for horn duty cycle is the number of grade crossings. This num
ber is dependent on the particular operating territory, whether it be through
populated areas with many crossings or through the mountains or desert with
virtually no crossings. Because few data are available, further informa
tion on the number of crossings for various types of runs is needed to char
acterize typical horn duty cycles.
3.3 Fleet Population
The third element required to assess the extent of railroad crew noise
exposure is the make-up of the current diesel locomotive fleet in the United
States. This is necessary to determine which types of locomotives are most
prevalent and thus more likely to have a larger percentage of on-board crew
time than other less common types of locomotives.
The current U. S. locomotive fleet for Class I railroads3 totaled
27,598 units as of April 1978 [24]. A breakdown of this fleet is given in
Table 11. Based on these numbers, it is seen that 84 percent of the locomo
tive fleet is composed of road units with the remaining 16 percent being
switchers. As noted in the caption to Table 11, the values for "switchers"
includes only those units designed as switchers (mostly endcabs) and not road
units assigned to switching. Thus, the number of locomotives utilized as
road units will be somewhat less than the 84 percent shown here. Examination
of the road units shows that 96 percent of such locomotives have been manu
factured by EMD and GE, with EMD accounting for 83 percent. A similar
3Class I railroads are those having annual revenues of $5 million or more.They account for 99 percent of the national freight traffic [23].
33
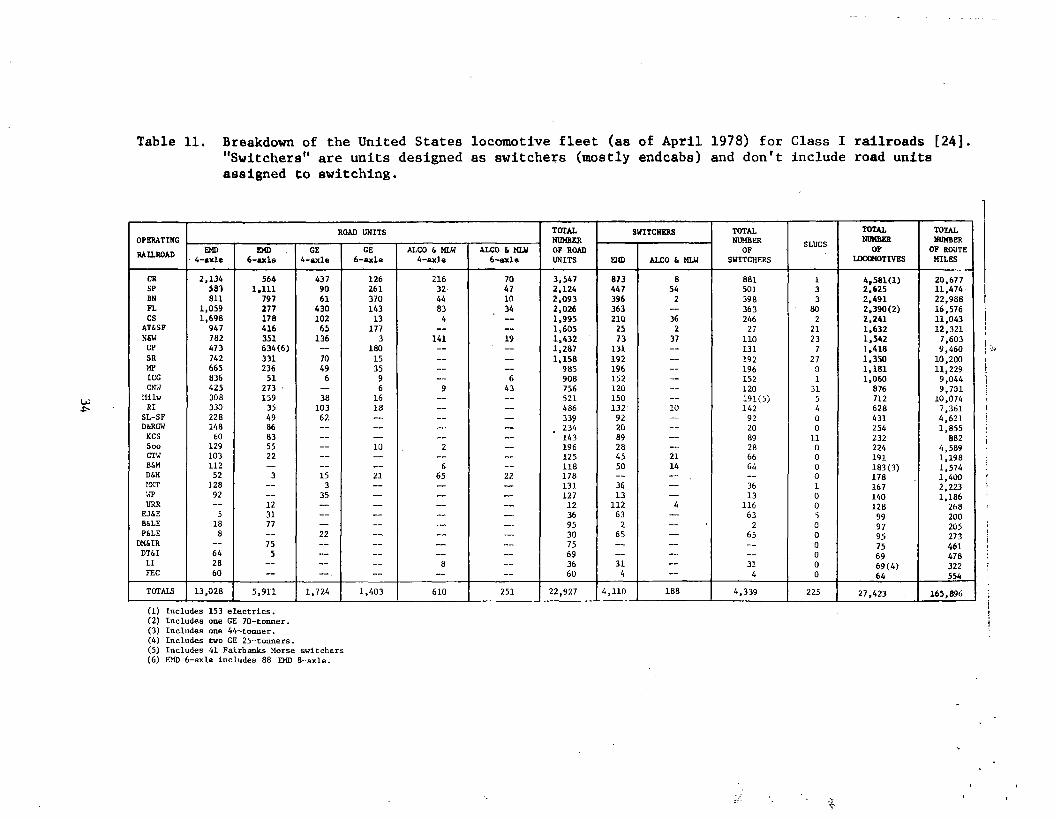
Table 11. Breakdown of the United States locomotive fleet (as of April 1978) for Class I railroads [24]. "Switchers" are units designed as switchers (mostly endcabs) and don't include road units assigned to switching.
OPERATINGRAILROAD
ROAD UNITS TOTAL NUMBER OF ROAD UNITS
SWITCHERS TOTALNUMBER
OFSWITCHERS
SLUGSTOTALNUMBER
OFLOCOMOTIVES
TOTAL NUMBER OF ROUTE MILES
EMD4-axle
EMD6-axle
GE4-axle
GE6-axle
ALCO 6 KLW 4-axle
ALCO 6 MLU 6-axle EMD ALCO £. MLU
CR 2,134 564 437 126 216 70 3,547 873 8 881 1 4,581(1) 20,677SP 333 1,111 90 261 32 47 2,124 447 54 501 3 2,625 11,474BN 811 797 61 370 44 10 2,093 396 2 398 3 2,491 22,988FL 1,059 277 430 143 83 34 2,026 363 — 363 80 2,390(2) 16,576CS 1,698 178 102 13 4 — 1,995 210 36 246 2 2,241 11,043
AT&SF 947 416 65 177 — — 1,605 25 2 27 21 1,632 12,321. N&W 782 351 136 3 141 19 1,432 73 37 110 23 1,542 7,603UP 473 634(6) — 180 — — 1*287 131 — 131 7 1,418 9,460SR 742 331 70 15 — — 1,158 192 — 192 27 1,350 10,200MP 665 236 49 35 — — 985 196 — 196 0 1,181 11,229ICG 836 51 6 9 — 6 908 152 — 152 1 1,060 9,044CNW 425 273 — 6 9 43 756 120 — 120 31 876 9,701
Milw 308 159 38 16 — — 521 150 — 19 1 (5 ) 5 712 10,074RI 330 35 103 18 — — 486 132- 10 142 4 628 7,361
SL-SF 228 49 62 — — — 33? 92 — 92 0 431 4,621D&RGW 148 86 — — — — 234 20 — 20 0 254 1,855
KCS 60 83 — — — — 143 89 — 89 11 232 882Soo 129 55 — 10 2 — 196 28 — 28 0 224 4,589GTW 103 22 — — — — 125 45 21 66 0 191 1,198B&M 112 — — — 6 — 118 50 14 64 0 183(3) 1,574D&H 52 3 15 21 65 22 178 — — — 0 178 1,400MKT 128 — 3 — — — 131 36 — 36 1 167 2,223WP 92 — 35 — — — 127 13 — 13 0 140 1,186URR — 12 — — — — 12 112 4 116 0 128 268EJ&E 5 31 — — — — 36 63 — 63 5 99 200B&LE 18 77 — — — — 95 2 — 2 0 97 205
P&LE 8 — 22 — — — 30 65 — 65 0 95 273DM&IR — 75 — — — — 75 — — — 0 75 461DT&I 64 5 — — — — 69 — — — 0 69 478L I 28 — — — 8 — 36 31 — 31 0 69(4) 322FEC 60 — — — — — 60 4 — 4 0 64 554
TOTALS 13,028 5,911 1,724 1,403 610 251 22,927 4,110 188 4,339 225 27,423 165,896
(1) Includes 153 electrics. j(2) Includes one GE 70-tonner. j(3) Includes one 44-tonner.(4) Includes two GE 25-tonners.(5) Includes 41 Fairbanks Morse switchers(6) EMD 6-axle includes 88 EMD 8-axle.

comparison for switchers shows that nearly 95 percent of the locomotives of
this type have been manufactured by EMD.
A more useful breakdown for the purposes of this study is by locomotive
model and date of manufacture. Such a breakdown based on the fleet popula
tion as of January 1, 1977 for the 18 largest Class I railroads is given in
Table 12. The values given in this table differ slightly from those in Table
11 because the totals are based on fewer railroads. The relative percentages
of road units to switchers and the breakdown by manufacturer, however, are
comparable for the two tables.
Looking at the .breakdown by year shows that approximately 40 percent of
the road units and 80 percent of the switchers were manufactured prior to
1963. For the years 1964 to 1976 the road unit population is evenly distri
buted with two to four percent of the total population manufactured per year.
The switcher population, on the other hand, ranges between one to two percent
for the years 1964 to 1973', with no units listed for 1974 to 1976. The
reasons for this are that switchers have a longer useful life than road units
because of the less severe use cycle and that older road units are often as
signed to switching [23],
The breakdown by locomotive model shows that 12 or 13 different models
comprise over 80 percent of the total road unit fleet. These 12 or 13 dif
ferent models can be grouped into ten categories based on locomotive design
and engine horsepower, as shown in Table 13. The locomotives in each of
these categories have the same engine characteristics and in general, are the
same age. Thus, locomotives within the same category can be expected to have
similar noise generating characteristics and presumably similar in-cab noise
environments.
35

Table 12. Breakdown of the United States locomotive fleet (as of January 1, 1977) by model and date of manufacture for the 18 largest Class I railroads [25,26]
u>o>
incuMOTivK Miini-i.
HORSEPOWER PR[OK ro 19b 1 lv.-4 1963 1966 14b 7 196H 1 -65 19 70 19 71 l'77i 1974 1975 1976 TOTAL
EXD (1)
1800-2400 1H7 187k//H/«I//9 LgUU/l7o0 t.Si 692CP//9 1500/1750 5,517 5.517SD7/1 l4o6/i750 548 548UP15 1500 60 60HP 15 1500 32 139 32 203GP1H 1800 302 302SD1M i m 1$ 19CP20 2000 2)6SD24 2400 215 1 2 locr28 1800 15 15SD28 1800 2 »CP 30 2250 885 88 5
R CP35 2500 54 552 541 1,147SDJ5 2500 77 282 lb
0 s )P35 2500 14 14CP 38 2000 12 116 l 23b 22b 264 340 3)8 2 ‘.2 53 111 1.909
A SI) 38 2000 35 6 15 5bGP 39 2300 20 ] 7 52 89
D SD39 2300 18 25 S 3 5bGP40 3000 47 258 214 : n 126 81 11> 3 30 S 16 62 1. 3; 3SD40 3000 362 68 54 59 39 173 194 219 339 203 I 35 1,87 5SD45 3600 236 317 233 269 108 96 .164 In 52 61 l ,6-2
U SDP40/45 3000/3600 10 14 12 20 -0 110 20tF40PH 3000 30 3o
H F/FP45 3600 14 40 X-DD35 5000 27 18 24 10 12
GE (2)T UI8B 1800 56 -9
U23B/C 2250 59 61 la 53 94 63 Si \ 5 4 L jS U25B/C 2500 14 7 177 206 12 i-3
.U28B/C 2800 3 161 42 206U30B 3000 12 124 10 5 50 35 13 JO 261U30C 3000 4 25 56 26 47 34 89 92 102 45 i.j 560U33B 3300 4 109 70 133U33C 3300 41 89 46 80 59 18 11 13 )j>U36B 3600 4 8 30 57 21 10 3 3 138U36C 3600 7 32 21 47 17 124U50 5000 1 6 1 2 18 20 46P30CH 3000 16 9 7=LC30-7 3000 10 10
ALCO 1000-3600 552 53 174 103 50 in 958BLW 1000-1800 2U 3-
ROAD UNIT TOTAL 9.406 896 1,268 1,176 984 80l; 982 821 976 1,10a 995 1 .073 734 442 21 ,66 3
S U I T C H E R S
EMI) 600-1500 2,660 40 88 37 56 80 72 71 5 3 139 39 1.4..AJ.CO 600-1500 293 29 1BLW 660-1200 106 106f-M 1000-1200 50 5u
SWITCHER TOTAL 1,109 40 38 87 56 80 72 71 83 159 59 3.904
T 0 T A L S 12,513 936 1,356 1.263 1,040 886 1,054 892 1,059 1,263 1,054 1,073 754 44 2 25.367
(1* designations for hood-type loconotives:C,p — General Purpose locomoLivc with four traction r.otors SD -- Special Duty locomotive vitlx six traction motors
(2) GE designations for Universal model hood-type locomotives: B - four traction motors C - six traction motors

Table 13 ■Breakdown of locomotive road unit population based on engine design and horsepower [27].
ENGINEMANUFACTURER
ENGINEDESIGN
ENGINETYPE
NUMBER OF CYLINDERS
HORSEPOWER LOCOMOTIVEMODEL
NUMBER OF UNITS
PERCENT OF ROAD FLEET
EMD two-stroke naturally aspirated
567 16 1500-1800 GP & SD7 GP & SD9 GP & SD18
6,386 29.5
EMD two-stroketurbocharged
567 16 2000-2500 GP20SD24GP30GP & SD35
2,859 13.2
EMD two-stroke naturally aspirated
645 16 2000 GP & SD38 1,965 9 . 1
EMD two-stroketurbocharged
645 16 3000 GP & SD40 3,311* 15.3
EMD two-stroketurbocharged
645 20 3600 SD45 1,745* 8.1
GE four-stroketurbocharged
FDL-8 8 1800 U18B 105 0.5
GE four-stroketurbocharged
FDL -12 12 2300 U23B 6 C 413 1.9
GE four-stroketurbocharged
FDL-16 16 2500-2800 U25B & C U28B & C
748 3-5j
GE four-stroketurbocharged
FDL-16 16 3000 U30B & C 821 3.8 II
GE four-stroketurbocharged
FDL-16 16 3300-3600 U33B & C U36B & C
754 3.5
TOTAL 19,107 88.2★Includes half of the SDP population of 206 from Table 11.
37
A comparison of Tables 12 and 13 shows two noticeable omissions in this latter table — ALCO road units and all types of switchers. The ALCO road units were not included because the entire, group of ALCO road units comprises only 4.4 percent (3.8 percent based on Table 11) of the total road unit population. Since the newest of the ALCO road units is ten years old, and over half are 15 years old or more, these units are being rapidly phased out of
use.
Switchers are omitted from this table because of operational considera
tions. Since the duty cycle for switchers consists primarily of idle and notch 1 operations (approximately 87 percent from Table 4) and because the
noise levels for such operations are typically less than 80 dB (based on the data in Section 3.1), the noise environment in the cab is not likely to re
sult in cases where the noise dose is exceeded. For this reason, even though
switchers comprise 15.3 percent of the total locomotive fleet, they are not included in this initial study.
For this current study, Table 13 served as the basic test matrix for the
field test program. This program and the results that were obtained are described in the remaining sections of this report.
38

4.0 FIELD TEST PROGRAM
Based on the information presented in the previous sections, a field measurement program was developed to provide the data necessary to evaluate the noise exposure of locomotive crews. The program was also designed to provide a means of identifying individual component sources and specific locomotive operations, which might influence the noise levels in the cab, and
to develop a procedure for estimating their relative contributions to the
overall crew noise expsoure. The feasibility of developing a simplified measurement procedure, which would provide information that could be used to estimate the noise exposure for in-service operations, was also examined.
Determination of noise exposure or "dose” requires a knowledge of the time history of the noise levels to which the worker is exposed. In certain industrial settings the noise environment is essentially constant over a worker's shift, thereby minimizing the difficulty of determining the noise exposure and ascertaining whether the allowable hearing conservation criteria
have been exceeded. In other settings, the noise environment may not be con
stant, thereby necessitating continuous noise exposure monitoring throughout
the worker's shift.In locomotive cabs the noise environment is characteristically highly
variable in nature due to the wide variety of sources contributing to in-cab
noise and to differences in operating conditions necessitated by the type of
run and terrain features. The fact the the workplace is mobile makes the
task of determining the individual crew member's noise exposure even more difficult.
39
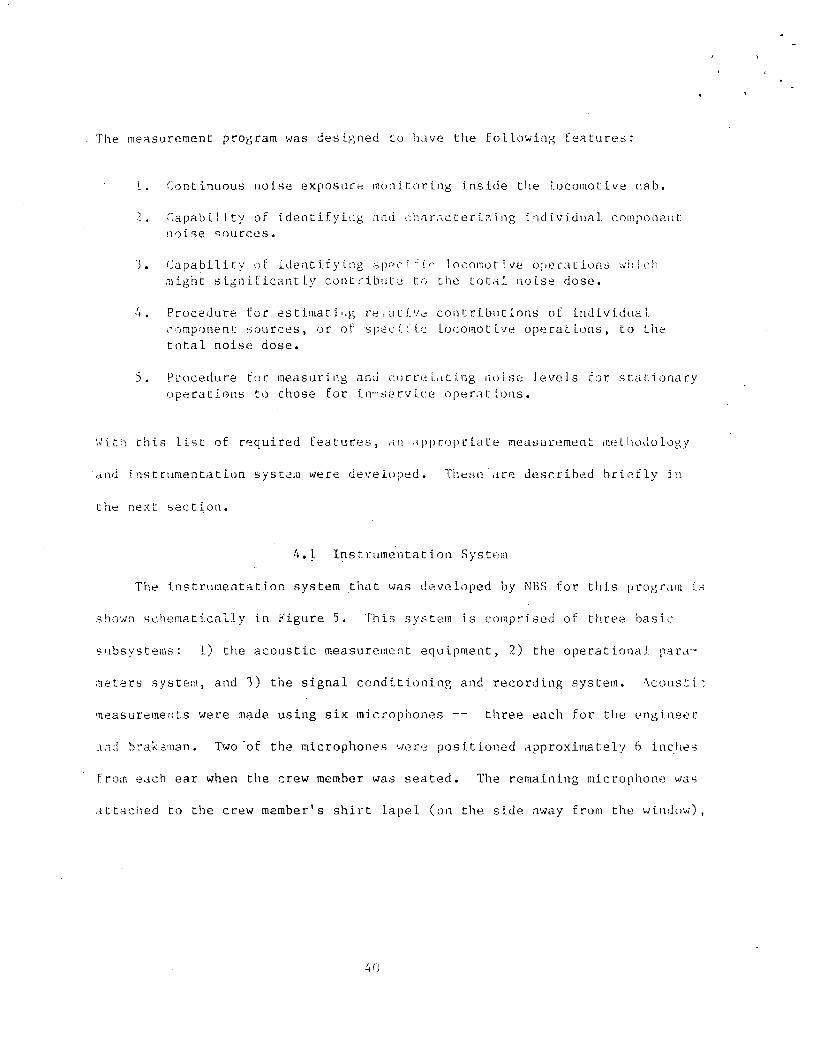
1. Continuous noise exposure monitoring inside the locomotive cab.
2. Capability of identifying and uharactertz Lng individual component noise sources.
'3. Capability of identifying specific locomotive operations which, aiight significantly contribute to the total noise dose.
4. Procedure for estimating relative contributions of individual component sources, or of specific Locomotive operations, to the total noise dose.
5. Procedure for measuring and correlating noise Levels for stationary operations to those for in-service operations.
With this list of required features, an appropriate measurement methodology
and instrumentation system were developed. These are described briefly in
the next section.
The measurement program was designed to have the following features:
4.1 Instrumentation System
The instrumentation system that was developed by MBS for this program is
shown schematically in Figure 5. This system Is comprised of three basic
subsystems: 1) ttie acoustic measurement equipment, 2) the operational para
meters system, and 3) the signal conditioning and recording system. Acoustic,
measurements were made using six microphones -- three each for the engineer
and hraxeman. T w o ’of the microphones were positioned approximately 6 inches
from each ear when the crew member was seated. The remaining microphone was
attached to the crew member's shirt Lapel (on the side away from the window),
40

ACOUSTIC MEARSUREMENTS SIGNAL CONDITIONING & RECORDINGI-------------------------------- 1I------------------------------------- 1
!______________________I I----------------------------- 1
Figure 5. Schematic diagram of instrumentation system developed by NBS for evaluation of the noise exposure of locomotive crews.
41
Figure r.:Ing one O f
suspend*,’<1
of the
coming
the4 micr'0-
similar to the location of the microphone for a noise dosimeter
shows the locations of the three microphones near the engineer during one of
the test runs. As seen in this figure, the two fixed microphones suspended
from the ceiLing are equipped with foam windscreens. The purpose of the
windscreen was to minimize the extraneous noise generated by wind coming
through the open window and blowing across the protective grid on the micro
phone. The lapel microphone was not equipped with a windscreen because it
would have been bothersome to the engineer and braketnan. A windscreen was
not essential in this location since the lapel microphone was shielded from
the open window by the body of the crew member.
The operational parameters system was used to provide information on the
loconotive operation and terrain features. This information came from two
sources: the multiple-unit (MU) cable and an operational keyboard. The MU
cable is used in multiple-unit locomotive consists to provide notch setting
and dynamic brake signals to the trailing units so that they can operate
synchronously with the lead locomotive. For this program,- these signals,
obtained by tapping into the MU cable socket on the front of the lead
locomotive, were used to provide continuous monitoring of notch and dynamic
brake settings of the locomotive.
uOne of the common techniques of checking compliance with hearing conservation criteria is through the use of noise dosimeters. Noise dosimeters give a direct indication of the worker's noise exposure; however, no diagnostic data, which could be used to pinpoint problem areas, are provided. Simple measurement techniques for determining noise exposure, such as the use of noise dosimeters, are not adequate for identifying and characterizing individual component sources as required for this study. Instead, a svsten is required which provides a permanent record of the noise signatures that can be used for further analysis.
42

Figure 6. View inside the cab of one of the test locomotives showing the locations of the three microphones near the engineer.
43
The operational keyboard, shown in Figure 7, consisted of 15 switches (a
16th was reserved to indicate system calibration), each corresponding to a
specific locomotive operation, such as a horn or brake application, or to a
terrain feature, such as a cut, tunnel, upgrade or downgrade (see Table 14).
During the run the keyboard was manualLy operated by NBS test personnel. As
different operations occurred or the terrain changed, the appropriate switch
was thrown. To record events that did not correspond to one of the 15
switches, a handwritten log was attached to the keyboard. When such events
occurred, a note was made along with the time of day, which was displayed
directly below the switches on the keyboard. This information was then used
to help interpret the data when they were analyzed.
The output signals from the microphones, operational keyboard and MU
cable were routed into the control box where signal conditioning and logic
control were performed. The output of the control box was then recorded on
magnetic tape using a 14-channel FM tape recorder.
The control box contained a variety of elements including: signal am
plifiers, peak-hold detectors to sense amplifier overload, time-of-day clock
(accurate to the nearest second), tape recorder start/stop controls and the
digital logic system controls for recording the instrumentation and opera
tional parameters. The information regarding the instrumentation and opera
tional parameters was recorded on a separate digital channel of the FM tape
recorder. Besides the operational parameters previously described, the in
formation recorded on the digital channel also included run number, time of
day, and amplifier gains and overload indicators. Each of the operational
and instrumentation parameters, listed in Table 14, was sampled and recorded
44
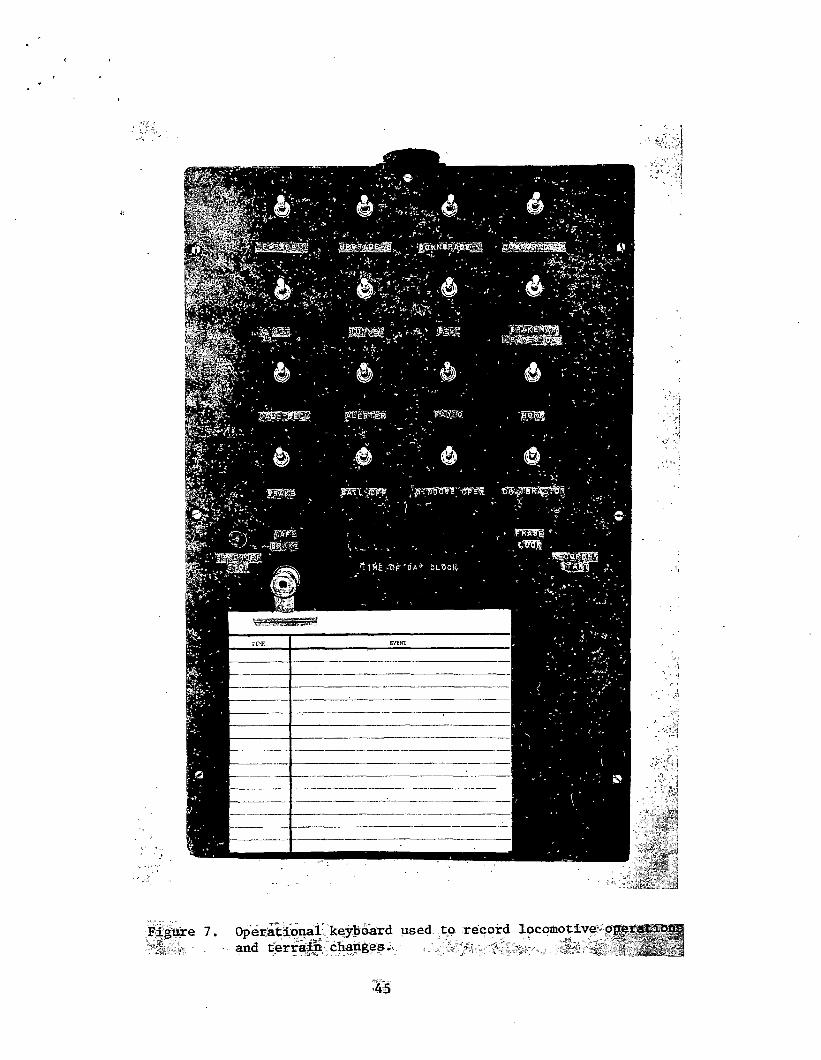
Figure 7. Operationalkeyboard used to record locomotive operations- •• and terrain changes. - .
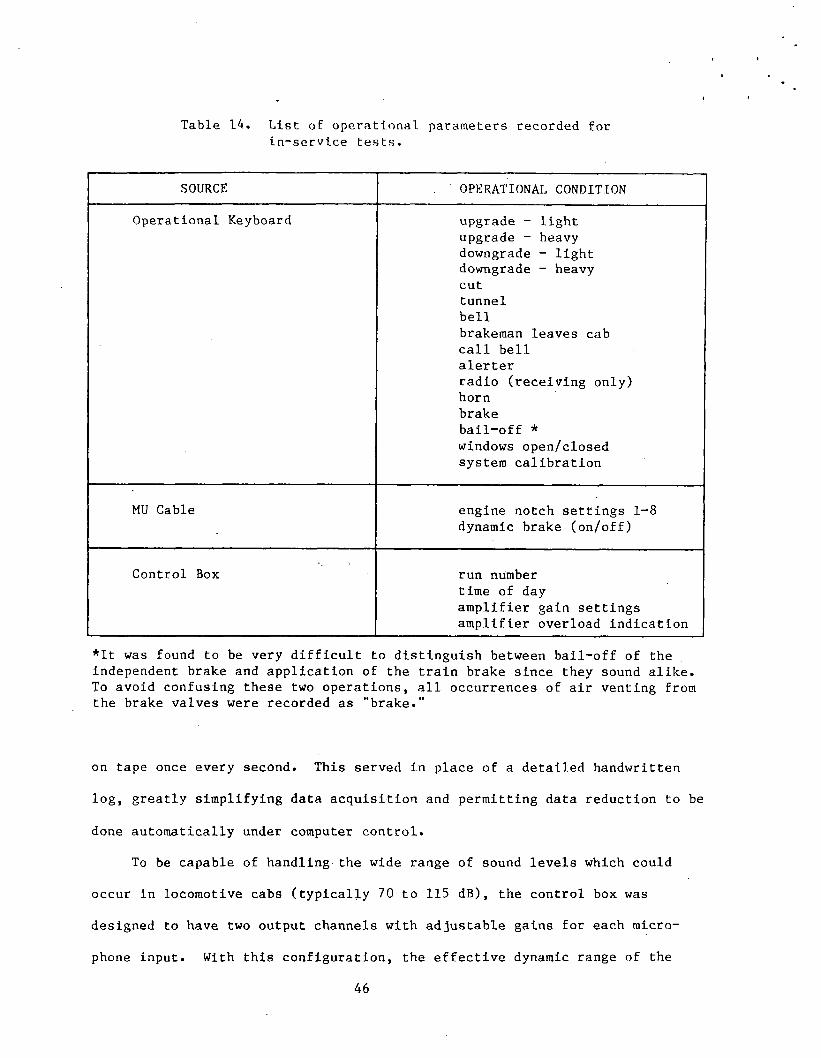
Table 14. List of operational parameters recorded for in-service tests.
SOURCE OPERATIONAL CONDITIONOperational Keyboard upgrade - light
upgrade - heavy downgrade - light downgrade - heavy cuttunnelbellbrakeman leaves cabcall bell alerterradio (receiving only)hornbrakebail-off * windows open/closed system calibration
MU Cable engine notch settings 1-8dynamic brake (on/off)
Control Box run number time of dayamplifier gain settings amplifier overload indication
*It was found to be very difficult to distinguish between bail-off of the independent brake and application of the train brake since they sound alike. To avoid confusing these two operations, all occurrences of air venting from the brake valves were recorded as "brake."
on tape once every second. This served in place of a detailed handwritten log, greatly simplifying data acquisition and permitting data reduction to be
done automatically under computer control.To be capable of handling the wide range of sound levels which could
occur in locomotive cabs (typically 70 to 115 dB), the control box was designed to have two output channels with adjustable gains for each microphone input. With this configuration, the effective dynamic range of the
46

system could be expanded by setting the gain on one of the output channels 20 dB (or whatever was appropriate to have the amplifer operating at its midrange) higher than the other. The output from the channel with the higher gain was used for data analysis except when the sound level was too high and caused the input signal from the microphone to overload the amplifier. In
this case an overload indicator was triggered and automatically recorded on
the digital channel of the tape recorder. During the data analysis the computer read the overload indicator which told it to analyze the channel with the lower gain.
As mentioned above, all data were recorded on a 14-channel FM tape recorder -- 12 channels of acoustic data (two for each microphone) and one channel of digital information on the instrumentation and operational parameters. An FM recorder was used to obtain the low frequency response necessary to record locomotive noise which, as discussed in Section 3.1, has strong low frequency components. All recordings were made with flat fre
quency response, i.e., there was no frequency pre-weighting of the recorded signals. Utilizing this system continuous recordings were made for approximately one hour (4600 foot reel of tape at 15 ips) followed by a 5 minute
break while a new tape was mounted on the recorder and calibration signals recorded. The previous data tape was not rewound until returning to the lab since this could take an additional 10 to 15 minutes.
The power for the control box and tape recorder was obtained from the
locomotive DC power supply. A power converter was required to transform the locomotive power supply of nominal 74 volts DC to 24 volts DC and to eliminate sharp power supply peaks of over 2000 volts and one millisecond duration which occurred during throttle position changes. Using the available
47

locomotive power supply eliminated the need for bulky battery supplies which
would otherwise be required to operate the equipment.
4.2 Test Procedures
Field testing was carried out on locomotives used in actual over-
the-road revenue runs. A typical test sequence began with the initial set-up
and calibration of instrumentation on the locomotive5. Following this, but
prior to the over-the-road run, a series of stationary tests was conducted on
the locomotive. If feasible, for these tests the locomotive (or the entire
consist) was moved to a site which did not have any large objects nearby such
as buildings, freight cars or other locomotives. This was done to avoid un
wanted sound reflections which could affect the measured sound levels. De
pending upon the configuration of the track within the yard, schedule
restrictions, and operational constraints, stationary data were recorded for
as many of the operational conditions listed in Table 15 as was possible.
These tests were conducted both with windows open and windows closed.
After the stationary tests were completed, the train was dispatched.
Continuous sound level and operational event data were collected throughout
the trip, with the exception of gaps which occurred when tapes were being
changed and calibration signals recorded. Also, when the train was waiting
to get into or out of a yard or waiting on a siding for another train to
pass, only a short sample of the noise levels was recorded. Since there were
no operational changes in the locomotive and the noise levels were
5After the initial instrumentation set-up and after each tape change, a calibration signal was recorded for each microphone. Field calibration was performed using a pistonphone which produced a 124-dB sound pressure level (re 20 uPa) at a frequency of 250 Hz.
48
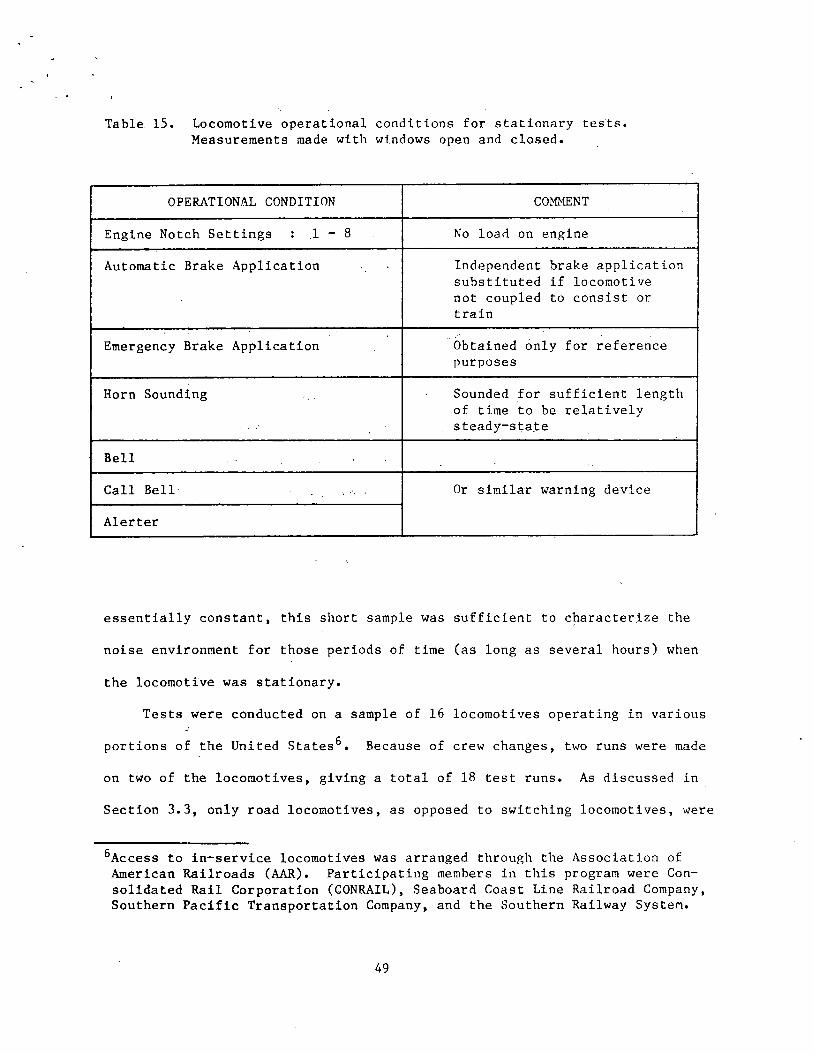
Table 15. Locomotive operational conditions for stationary tests. Measurements made with windows open and closed.
OPERATIONAL CONDITION COMMENT
Engine Notch Settings : .1— 8 No load on engine
Automatic Brake Application Independent brake application substituted if locomotive not coupled to consist or train
Emergency Brake Application Obtained only for reference purposes
Horn Sounding Sounded for sufficient length of time to be relatively steady-state
Bell
Call Bell l: . Or similar warning device
Alerter
essentially constant, this short sample was sufficient to characterize the
noise environment for those periods of time (as long as several hours) when
the locomotive was stationary.
Tests were conducted on a sample of 16 locomotives operating in variousJportions of the United States^. Because of crew changes, two runs were made
on two of the locomotives, giving a total of 18 test runs. As discussed in
Section 3.3, only road locomotives, as opposed to switching locomotives, were
^Access to in-service locomotives was arranged through the Association of American Railroads (AAR). Participating members in this program were Consolidated Rail Corporation (CONRAIL), Seaboard Coast Line Railroad Company, Southern Pacific Transportation Company, and the Southern Railway System.
49

tested. The choice of an i ndividual locomotive for testing was based on its
availability, but at least one locom o t i v e from each of the c ategories in
T a b l e 13 was tested. Care was taken to select runs w h i c h had a wi d e mix of
o p e r ational conditions (i.e., h i g h speed through-freights, slo w speed drag-
freights, local transfer movem e n t s , etc.), varied terrains (mountainous,
flat, ro l l i n g hills), and var i e d trip lengths (6 to 12 hours). In each case,
the lead locomotive in the consist was instrumented since this was w h e r e the
c r e w norm a l l y rode. Detailed d e s c r i p t i o n s of the locomotives and test runs
are given in Appen d i x A.
F o l l o w i n g each field trip, w h i c h typically involved m a k i n g measurements
on three different locomotives, the magn e t i c tape recor d i n g s were returned to
NBS and analyzed. The results of these analyses are pr e s e n t e d in Section 5
and form the basis for the s t a t i o n a r y screening test d i s c u s s e d in Section 6.
50

5.0 TEST RESULTS AND CONCLUSIONS
T h e I n f o r m a t i o n obtained f t o m the field test program consisted of a c o u s
tic data for six micro p h o n e locations and operational duty cycle data, in
terras'of the p arameters listed in Table 14, for each of the 18 test runs.
T h i s s e c t i o n is divided into three parts dealing with the l ocomotive o pera
tional d u t y cycle, in-cab noise levels, and cr e w noise exposure or dose.
B a s e d on these r e sults alternative approaches to dealing w i t h in-cab locomo
tive n o i s e a r e suggested and discussed.
5.1 O p e r ational Duty Cycle
O p e r a t i o n s for road locomotives can be broken down into two general
g r oups. T hese groups refer to o perations either when the l ocomotive and train
a r e u n d e r w a y and operating on-line, or when the locomotive (i.e. locomotive
cons i s t ) is u n c o u p l e d from the train or the train is stationary. This latter
c a t e g o r y incl u d e s operations such as the initial locomotive inspection by the
c r e w at the terminal, train m a ke-up and waiting to leave the yard, w a i t i n g on
a s i d i n g for another train to pass, pick-up and set-off of cars (which may or
m a y n o t be do n e by the lead consist), w a iting to get into the yard, and final
t e r m i n a l d r o p - o f f of the locomotive consist. In general, for these opera
tions the l o c o m o t i v e is operated in idle (when stationary) or ver y low notch
s e t t i n g (when m o v i n g between the terminal and the yard). Thus, the noise
lev e l s in the cab will n o r m a l l y be less than a 90 dB threshold level and will
n o t i n f l u e n c e the noise dose.
T h i s w a s t aken into cons i d e r a t i o n when conducting the field test program
and, as d i s c u s s e d in Section 4, only a short sample of the noise levels was
r e c o r d e d for such operations. .However, in order to document the time
r e q u i r e d to p e r f o r m this portion of the duty cycle, a log was kept for each
51

trip . A summary of the trip logs for the 18 test runs is shown in Table 167.
The three principal columns in this table are Tq_b, Tdose and Tnotc^
These three times are defined as follows:
Tg_g - on-board time, which is the time from the moment the crewgets on the locomotive un til the time they get off at the fina l destination.
Tdose - effective crew "dose" time, which includes only the time that the train is underway. This is comprised of the tape recorded data plus a small increment of time required to change tapes and calibrate the microphones while underway.
Tnotch 1 ~ total time the locomotive-is not operating on line.'"This includes the times when the train is stationary ( i.e . locomotive at id le) and when the consist is moving between the yard and terminal.
As might be expected because of the intentional choice of d iffering
types of terrain and train make-up, the va r iab ility of times spent performing
various operations is quite evident, as indicated by the large standard
deviations relative to the mean values. The important thing to note is that
even though the crew may be on-board for eight or more hours, the actual time
that the locomotive is underway (and generating levels greater than 90 dB for
extended periods of time) is s ign ifican tly less. This w ill have an
influence on the crew noise dose since the length of exposure time is an
important factor. Additional operational duty cycle information in terms of
terrain features, locomotive operations, and engine notch settings is given
in Tables 17, 18 and 19, respectively.
Table 17 gives a breakdown on the terrain features in terms of the per
cent of the effective crew "dose" time and the number of occurrences. For
7It was mutually agreed in setting up this voluntary cooperative program that in the fina l report the locomotives would not be identified by operat ing railroad.
52

Table 16. Trip log (in hours) for the 18 test runs
Ln
TESTRUN
Tinu af buyClew
in It Ini Tr rml nal
Locomot ive
Tape Recorder Operating
TapeChanging
and
Walt ing on S iding for Another Train
Pick-up and/or Set-of f
Etna l TermLnal
Effect ive Crew Total Time Locomotive Not Operating On-Line
Crew drewNUMBER On Off Time
V b
Inspect ion and Train Make-up
Calibration to Pass of Cars Drop-of f^dose Percent of Tnotch 1 Percent of
0n-Rourd TimeA B C D E F H + C A+D+E+F
1 18:47 03:00 8.22 0.15 4.46 0.37 1.87 0 1.37 4.83 58.8 3.39 41.2
2 08:00 15: 52 7.87 1.91 4.68 0.53 0.18 0.08 0 .49 5.21 66.2 2.66 33.8
3a 20: L8 01:03 4.75 0.96 2.87 0.34 0 0.41 0.15 3.21 67.6 1.54 32.4
3b 01:03 09:30 8.45 0.32 3.49 0.41 0 0 4.23 3.90 46.2 4.55 53.3
4 16:12 19:00 2.80 0.93 1.10 0.34 0 0.43 0 1.44 51.4 1.36 48. b
5 09:30 17:30 8.50 0.88 3.70 0.38 ‘ 1.31 0 2.23 4.03 48.0 4.42 52.0
6 09:20 18:00 8.67 2.13 4.38 0.59 - 1.01 0 0.56 4.97 57.3 3.70 42.7
7 05:12 12:10 6.97 0.56 2.98 0.30 1.08 1.43 0.60 3.28 47.1 3.69 52.9
8 14:37 20: 30 5.88 1.16 2.61 0.17 0 1.35 0.59 2.78 47.3 3.10 52.7
9 05:90 11:30 6.50 2.07 2.00 0.23 0.32 0 1.88 2.23 34.3 4.27 65.7
10 19:53 03:00 7.12 0.85 4.34 0.58 0 0.72 0.63 4.92 69.1 .2.20 30.9
11 12:18 22:30 10.20 1.55 5.17 0.52 0.46 0.20 2.30 5.69 55.8 4.51 44.2
12 11:15 22:15 11.00 2.15 6.06 0.70 0.45 ' 0.40 1.24 6.76 61.5 4.24 38.5
13 10:50 20:30 9.67 1.79 4.76 0.59 0.84 0.17 1.52 5. 35 55.3 4.32 44.7
14a 14:13 20:01 5.80 0-62 3.91 0.53 0. 74 0 0 4.44 76.6 1.36 23.4
14b 20:28 22:30 2.03 0.10 0.53 0 0 0 1.40 0.53 26.1 1.50 73.9
15 13:22 20:00 6.63 0.88 3.73 0.36 0 0.12 1.54 4.09 61.7 2.54 38.3
16 12:26 19:1.5 6.82 1.90 2.87 0.25 0 0 1.80 3.12 45.7 3.70 54.3
ME AM 7.10 1.16 3.54 0.40 U 46 0.32 1.25 3.94 54.2 3.17 45.8
STANDARDd ev iat io n 2.34 0.70 1.41 0.18 0. 56 0.46 1.04 1.56 12.5 1.17

Table 17. Breakdown of terrain features for the 18 test runs
TESTRUN
NUKBER
LEVEL Percent of
^doee
UPCRADE-LICHT UPGRADE-HEAVY DOWNGRADE-LIGHT DOWNGRADE-HEAVY CUT TUpiELPercent of
Td...Number of
OccurrencesPercent of
Tdoae
Number of Occurrences
Percent of
Tdoaa
Number of Occurrences
Percent of
TdoaeNumber of
OccurrencesPercent of
^dose
Number of Occurrences
Percent ofT.dose
Number of Occurrences
1 57.3 36.0 14 0 0 6.7 6 0 0 2.3 10 0 0
2 40.9 40.4 7 0 1 18.3 5 0.4 1 3.4 22 0.1 4
3a 7.8 62.0 5 29.4 2 0.8 1 0 0 5.3 26 0.3 6
3b 22.6 34.4 10 31.4 5 11.6 4 0 0 20.6 65 2.2 9
4 82.4 5.2 1 12.4 2 .0 1 0 1 3.4 2 0 0
5 18.6 27.3 13 18.7 4 34.7 11 0.7 1 7.2 47 0.2 3
6 25.6 9.1 12 22.6 3 34.3 8 8.4 1 8.2 51 0.4 9
7 66.9 26.8 5 0 0 6.3 5 0 0 0 0 0.1 1
8 88.9 9.3 9 0 0 1.8 3 ’ 0 0 0.1 ' 1 0 0
9 100.0 0 0 0 0 0 0 0 0 0 1 0 0
10 8.1 55.4 5 20.9 3 15.6 2 0 0 22.0 130 4.7 301! 11 18.8 12 39.9 2 L9.9 6 0 0 17.9 114 ;.7 20
13 21.1 V,. 1 12 1.6 1 26.5 16 15.7 4 9.6 99 1.2 14
13 57.7 42.3 3 0 0 0 0 0 0 0 0 0.1 4
14a 48.9 48.9 5 0 0 2.2 1 0 0 2.6 14 0.1 4
14b 71.0 3 9 .0 2 0 0 0 0 0 0 1.4. 1 0 0
15 42.3 57.7 7 0 0 0 0 0 0 4.2 26 0 0
16 70.9 10 0 0 3.2 2 0 0 2.4 15 0 r,

Table 18. Operational duty cycle data for various locomotive operations.I
TEST 1101-------------------rdi j BRAKE ** RADIO BELL WARNING ALARMS WINDOWS OPEN
KUN Percent of 1 Number of | Percent of Number of Percent of Number of Percent of Number of Percent of Number of Percent of Number ofNUMBER Tdose Occurrences •
i TdoseOccurrences ^dose Occurrences Tdose Oceurtcnees Tdose Occurrences Tduse
Occurrences
1 4.7 50 4.7 56 18.4 329 9.2 34 0 0 60.2 6
2 3.2 56 3.4 128 16.6 39 7 10.2 41 0 1 98.9 2
3a 2. 9 35 4.6 20 6.9 139 9.8 19 0.1 14 94.2 2
3b 3.2 41 5.4 66 4.7 122 4.9 15 0.2 12 7.4 2
4 2.3 18
COCO 27 11.2 67 3.7 4 0 0 99.6 4
5 2.3 77 4.2 45 11.4 199 6.2 14 0 0 100.0 2
6 2.2 83 1.2 26 10<. 5 241 3.0 15 1.0 4 99.6 2
7 5.9 178 1.6 11 35.6 320 12.5 54 0 0 100.0 x
8 10.3 148 2.6 34 21.4 209 16.7 40 0.3 1 100-0 1
9 8.8 143 0.9 25 11.2 163 15.2 33 0 0 100. :■ i
10 5.5 144 0.4 10 11.5 285 O' Wi 34 0 0 13.0 3
11 1.7 49 1.9 36 8.9 274 , 0.1 6 0 1 0.4 5
12 3.7 199 1.4 29 8.4 302 3.1 29 0.6 29 39.3 g
13 2.2 49 0.9 18 5.1 196 * + -k o * t 0 . 0 99.9
14a 8.8 237 3.4 8 CO 181 12.1 49 0 0 99.6 2
14b 5.8 15 0 * “ 0 * 3.9 14 20.2 3 0 0 95.2 i
15 15.9 165 1.5 22 10.5 285 28.8 63 0 0 * .'•|-> * <• i
16 11.5 247 0 * T 0 * :■ 8.6 190 , , 9 0 n' 99.8
t i
MEAN 5.7 108 3.2 35 11.7 217 9.6 28 0.1 -! !
3 j 78.2 1 3 _____________ _____________|__
STANDARDDEVIATION 3.9 75 2.6 29 7.6 97 7.5 18 0.3
I !8 | 36.6 I 2
* Mot included in mean and standard deviation calculations.
•* As discussed in the footnote to Table 14, "brake" includes both independent and train brake operations.
- Only major brake application occurred when stopping the train in the yard at the final destination, after the test equipment had been disassembled.
$ Bell couLd hardly be heard in the cab during on-line operations. No attempt made to record duty cycle data for bell.
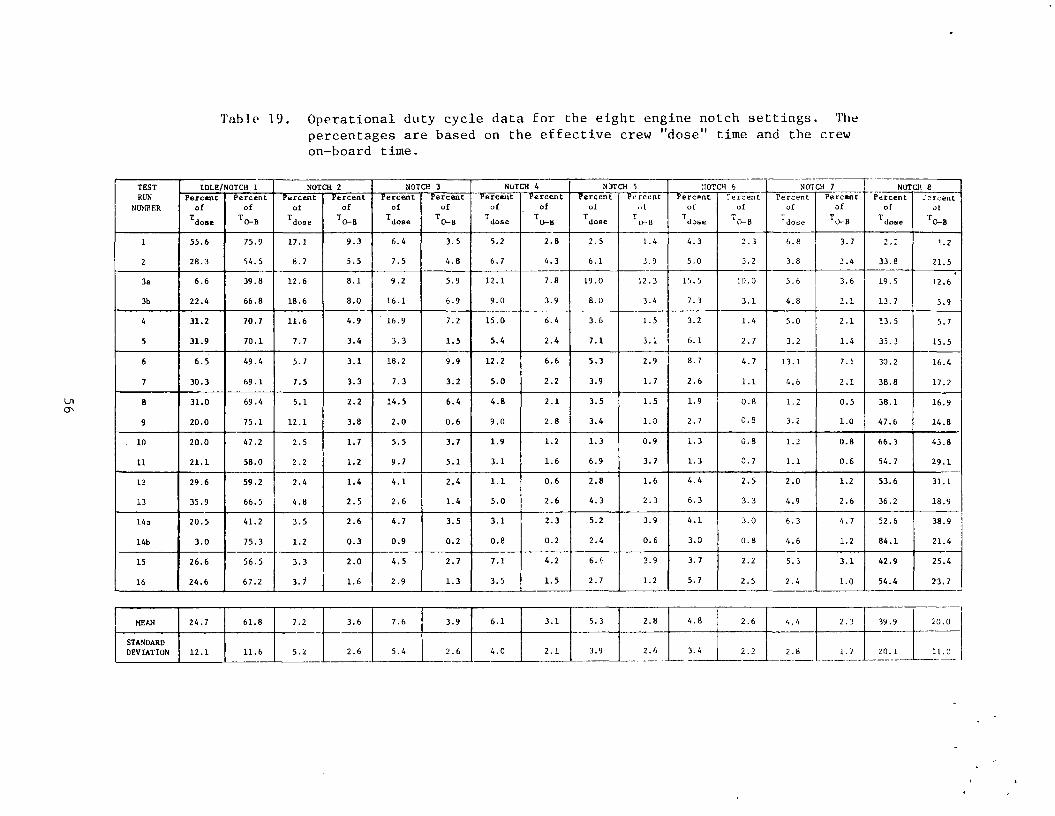
Table 19. Operational duty cycle data for the eight engine notch settings. The percentages are based on the effective crew "dose" time and the crew on-board time.
TEST IDLE/NOTCH 1 NOTCH 2 NOTCH 3 NOTCH 4 NOTCH 5 NOTCH 6 NOTCH 7 NOTCH 8RUN
NUMBERPercentof
^dose
Percentof
TO-B
Percentof
Tdose
Percentof
TO-B
Percentof
^doae
Percentof
TO-B
Percentof
Tdose
Percentof
TO-B
Percentofdose
Percentut
TO-B
Percentof^dose
Tercentof
lo-b
Percentof
Tdose
PercentofrO-B
Percentofdose
-'crcentof
t o-b
1 55.6 75.9 17.1 9.3 6.4 3.5 5.2 2.8 2.5 1.4 4.3 2.3 6.8 3.7 i - 1.2
2 28.3 64.5 6.7 5.5 7.5 4.8 6.7 4.3 6.1 3.9 5.0 3.2 3.8 2.4 33.8 21.5
3a 6.6 39.8 12.6 8.1 9.2 5.9 12.1 7.8 19.0 12.3 15.5 10.0 5.6 3.6 19.5i
12.6
3b 22.4 66.8 18.6 8.0 16.1 6.9 9.0 3.9 8.0 3.4 7.3 3.1 4.8 2.1 13.7 5.9
4 31.2 70.7 11.6 4.9 16.9 7.2 15.0 6.4 3.6 1.5 3.2 1.4 5.0 2.1 13.5 5.7
5 31.9 70.1 7.7 3.4 3.3 1.5 5.4 2.4 7.1 3.1 6.1 2.7 3.2 1.4 35.3 15.5
6 6.5 49.4 5.7 3.1 18.2 9.9 12.2 6.6 5.3 2.9 8.7 4.7 13.1 7.1 30.2 16.4
7 30.3 69.1 7.5 3.3 7.3 3.2 5.0 2.2 3.9 1.7 2.6 1.1 4.6 2.1 38.8 17.2
8 31.0 69.4 5.1 2.2 14.5 6.4 4.8 2.1 3.5 1.5 1.9 0.8 1.2 0.5 38.1 16.9
9 20.0 75.1 12.1 3.8 2.0 0.6 9.0 2.8 3.4 1.0 2.7 0.8 3.2 1.0 47.6 14.8
. 10 20.0 47.2 2.5 1.7 5.5 3.7 1.9 1.2 1.3 0.9 1.3 0.8 1.2 0.8 66.3 43.8
11 21.1 58.0 2.2 1.2 9.7 5.1 3.1 1.6 6.9 3.7 1.3 0.7 1.1 0.6 54.7 29.1
12 29.6 59.2 2.4 1.4 4.1 2.4 1.1 0.6 2.8 1.6 4.4 2.5 2.0 1.2 53.6 31.1
13 35.9 66.5 4.8 2.5 2.6 1.4 5.0 2.6 4.3 2.3 6.3 3.3 4.9 2.6 36.2 18.9
14a 20.5 41.2 3.5 2.6 4.7 3.5 3.1 2.3 5.2 3.9 4.1 3.0 6.3 4.7 52.6 38.9
14b 3.0 75.3 1.2 0.3 0.9 0.2 0.8 0.2 2.4 0.6 3.0 0.8 4.6 1.2 84.1 21.4
15 26.6 56.5 3.3 2.0 4.5 2.7 7.1 4.2 6.6 3.9 3. 7 2.2 5.3 3.1 42.9 25.4
16 24.6 67.2 3.7 1.6 2.9 1.3 3.5 1.5 2.7 1.2 5.7 2.5 2.4 1.0 54.4 23.7
MEAN 24.7 61.8 7.2 3.6 7.6 3.9 6.1 3.1 5. 3 2.8 4.8 2.6 4.4 2.3 39.9 20.0
STANDARDDEVIATION 12.1 11.6 5.2 2.6 5.4 2.6 4.0 2.1 3.9 2.6 3.4 2.2 2.8 1.7 20.1 11.0

oeach test run, the percent time is given for the five grade conditions0. The
other two columns are for cuts and tunnels. Cuts refer to locations where
the terrain has been excavated for the track bed, leaving an earthen/rock
wall on either or both sides of the track. Included in the tunnel breakdown
are long underpasses which have a similar influence on the in-cab sound
levels as do tunnels.
As shown by this table, tests were conducted over a wide variety of ter
rains. These range from mountainous for Test Runs 3, 10 and 11, to level and
f la t for Test Runs 8 and 9. The percent time and number of cuts and tunnels
also vary widely, hue to the general features of the terrain, cuts and tun
nels are most prevalent in mountainous areas. This is especially evident for
Test Runs 10 and 11. The effects of these various terrain features on in-cab
noise levels are discussed in Section 5.2.
The operational duty cycle data presented in Table 18 include chose
operations which are most like ly to contribute to, or influence, the i.n-cab
noise levels. The duty cycle for these operations is given in terms of per
cent of T Qgg and the number of occurrences. As seen from this table, there
is a high degree of operational va riab ility among the different runs. This
is indicated by both the wide range of values and the large standard devia
tions relative to the mean values. In general, even though the number of
8Unless advised by the locomotive crew, the breakdown of grade into light and heavy was dependent upon the subjective judgement of the NBS test personnel operating the operational keyboard. This judgement was influenced by the terrain features adjacent to the track and by the rate of change of the grade from ligh t to heavy or from upgrade to downgrade, and vice versa.This judgement was d if f ic u lt to make since railroad grade changes are usually very gradual. Also, several of the test runs were conducted at night making i t even more d if f ic u lt to judge grade.
57
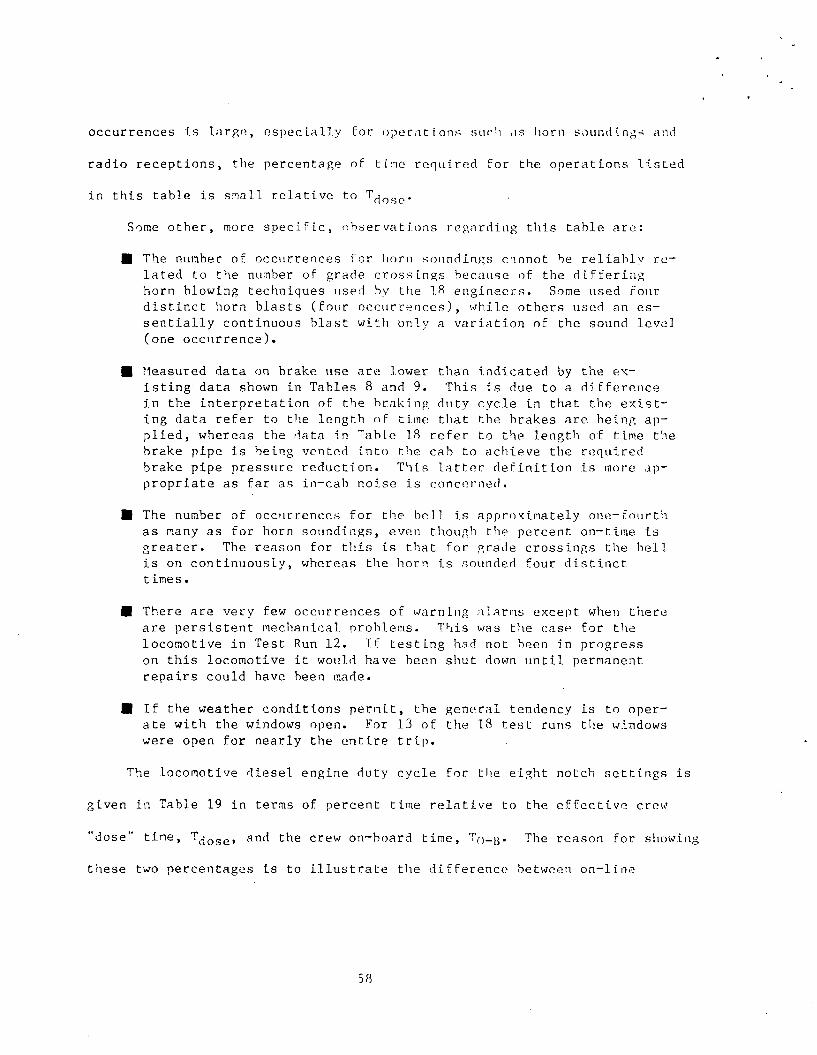
o c c u r r e n c e s i s l a r g e , e s p e c i a l l y f o r o p e r a t i o n s su c h a s l iorn s o u n d i n g s and
r a d i o r e c e p t i o n s , t h e p e r c e n t a g e o f t i n e r e q u i r e d f o r t h e o p e r a t i o n s l i s t e d
i n t h i s t a b l e i s s n a i l r e l a t i v e t o T^ .
Some o t h e r , more s p e c i f i c , o b s e r v a t i o n s r e g a r d i n g t h i s t a b l e a r e :
■ The number o f o c c u r r e n c e s f o r ho rn s o u n d i n g s c a n n o t be r e l i a b l y r e l a t e d t o t h e number o f g r a d e c r o s s i n g s b e c a u s e o f t h e d i f f e r i n g h o r n b l o w i n g t e c h n i q u e s u s e d by t h e 18 e n g i n e e r s . Some u s e d f o u r d i s t i n c t h o rn b l a s t s ( f o u r o c c u r r e n c e s ) , w h i l e o t h e r s u s e d an e s s e n t i a l l y c o n t i n u o u s b l a s t w i t h o n l y a v a r i a t i o n o f t h e sou nd l e v e l ( o n e o c c u r r e n c e ) .
■ M e a s u r e d d a t a on b r a k e u s e a r e l o w e r t h a n i n d i c a t e d by t h e e x i s t i n g d a t a shown i n T a b l e s 8 and 9 . T h i s i s due t o a d i f f e r e n c e i n t h e i n t e r p r e t a t i o n o f t h e b r a k i n g d u t y c y c l e i n t h a t t h e e x i s t i n g d a t a r e f e r t o t h e l e n g t h o f t i m e t h a t t h e b r a k e s a r e b e i n g ap p l i e d , w h e r e a s t h e d a t a i n TabLe 18 r e f e r t o t h e l e n g t h o f t i m e t h e b r a k e p i p e i s b e i n g v e n t e d i n t o t h e c a b t o a c h i e v e t h e r e q u i r e d b r a k e p i p e p r e s s u r e r e d u c t i o n . T h i s l a t t e r d e f i n i t i o n i s more a p p r o p r i a t e a s f a r a s i n - c a b n o i s e i s c o n c e r n e d .
■ The number o f o c c u r r e n c e s f o r t h e h e l l i s a p p r o x i m a t e l y o n e - f o u r t h a s na n y a s f o r horn s o u n d i n g s , e v e n t h o u g h th e p e r c e n t o n - t i m e i s g r e a t e r . The r e a s o n f o r t h i s i s t h a t f o r g r a d e c r o s s i n g s t h e h e l l i s on c o n t i n u o u s l y , w h e r e a s t h e h o r n i s s o u n d e d f o u r d i s t i n c tt i m e s .
■ T h e r e a r e v e r y fe w o c c u r r e n c e s o f w a r n i n g a l a r m s e x c e p t when t h e r e a r e p e r s i s t e n t m e c h a n i c a l p r o b l e m s . T h i s was t h e c a s e f o r t h e l o c o m o t i v e i n T e s t Run 1 2 . I f t e s t i n g had n o t been i n p r o g r e s son t h i s l o c o m o t i v e i t woul d h a v e b e e n s h u t down u n t i l p erm ane nt r e p a i r s c o u l d ha v e b e e n made.
■ I f t h e w e a t h e r c o n d i t i o n s p e r m i t , t h e g e n e r a l t e n d e n c y i s t o o p e r a t e w i t h t h e wind ows o p e n . For 13 o f t h e 18 t e s t run s t h e windows w ere o p e n f o r n e a r l y t h e e n t i r e t r i p .
The l o c o m o t i v e d i e s e l e n g i n e d u t y c y c l e f o r t h e e i g h t n o t c h s e t t i n g s i s
g i v e n i n T a b l e 19 i n t e r m s o f p e r c e n t t i m e r e l a t i v e t o t h e e f f e c t i v e c.rew
"do se " t i n e , Tdo s e , and t h e c r e w o n - b o a r d t i m e , T o - u - The r e a s o n f o r s h o w i n g
t h e s e two p e r c e n t a g e s i s t o i l l u s t r a t e t h e d i f f e r e n c e b e t w e e n o n - l i n e
58
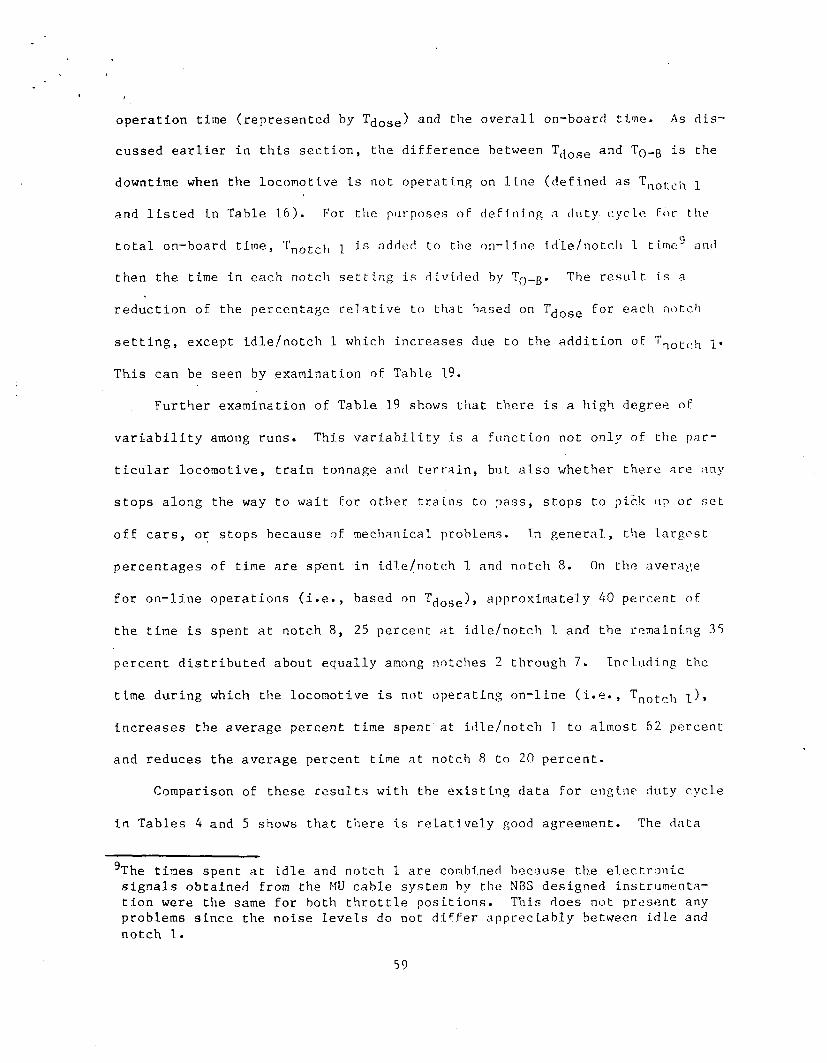
o p e r a t i o n t i m e ( r e p r e s e n t e d by T(jo s e ) and t h e o v e r a l l o n - b o a r d t i m e . As d i s
c u s s e d e a r l i e r i n t h i s s e c t i o n , t h e d i f f e r e n c e b e t w e e n T^o g e and T0 _g i s th e
do w n t im e when t h e l o c o m o t i v e i s n o t o p e r a t i n g on l i n e ( d e f i n e d a s ^ n o t c h 1
and l i s t e d i n T a b l e 1 6 ) . For t h e p u r p o s e s o f d e f i n i n g a d u t y c y c l e , f o r th e
t o t a l o n - b o a r d t i m e , Tnot-c j, i s added t o t h e o n - l i n e i d l e / n o t c h 1 t i m e 9 ami
t h e n t h e t i m e i n e a c h n o t c h s e t t i n g i s d i v i d e d by T,-j_g. The r e s u l t i s a
r e d u c t i o n o f t h e p e r c e n t a g e r e l a t i v e t o t h a t b a s e d on T^o g e f o r e a c h n o t c h
s e t t i n g , e x c e p t i d l e / n o t c h 1 w h i c h i n c r e a s e s due t o t h e a d d i t i o n o f Tnot ( ;h q.
T h i s c a n be s e e n by e x a m i n a t i o n o f T a b l e 19.
F u r t h e r e x a m i n a t i o n o f T a b l e 19 shows t h a t t h e r e i s a h i g h d e g r e e o f
v a r i a b i l i t y among r u n s . T h i s v a r i a b i l i t y i s a f u n c t i o n n o t o n l y o f t h e p a r
t i c u l a r l o c o m o t i v e , t r a i n t o n n a g e and t e r r a i n , but a l s o w h e t h e r t h e r e a r e any
s t o p s a l o n g t h e way t o w a i t f o r o t h e r t r a i n s t o p a s s , s t o p s t o p i c k up or s e t
o f f c a r s , or s t o p s b e c a u s e o f m e c h a n i c a l p r o b l e m s . In g e n e r a l , t h e l a r g e s t
p e r c e n t a g e s o f t i m e a r e s p e n t i n i d l e / n o t c h 1 and n o t c h 8 . On t h e a v e r a g e
f o r o n - l i n e o p e r a t i o n s ( i . e . , b a s e d on T^o s e ) , a p p r o x i m a t e l y 40 p e r c e n t o f
t h e t i m e i s s p e n t a t n o t c h 8 , 25 p e r c e n t a t i d l e / n o t c h 1 and t h e r e m a i n i n g 35
p e r c e n t d i s t r i b u t e d a b o u t e q u a l l y among n o t c h e s 2 t h r o u g h 7 . I n c l u d i n g t h e
t i m e d u r i n g w h i c h t h e l o c o m o t i v e i s n o t o p e r a t i n g o n - l i n e ( i . e . , Tn 0 t o h l ) >
i n c r e a s e s t h e a v e r a g e p e r c e n t t i m e s p e n t a t i d l e / n o t c h 1 t o a l m o s t 62 p e r c e n t
and r e d u c e s t h e a v e r a g e p e r c e n t t i m e a t n o t c h 8 t o 20 p e r c e n t .
C o m p a r is o n o f t h e s e r e s u l t s w i t h t h e e x i s t i n g d a t a f o r e n g i n e d u t y c y c l e
i n T a b l e s 4 and 5 sh ow s t h a t t h e r e i s r e l a t i v e l y good a g r e e m e n t . The d a t a
9The t i m e s s p e n t a t i d l e and n o t c h 1 a r e combin ed b e c a u s e t h e e l e c t r o n i c s i g n a l s o b t a i n e d from t h e MU c a b l e s y s t e m by t h e NBS d e s i g n e d i n s t r u m e n t a t i o n w e r e t h e same f o r b o t h t h r o t t l e p o s i t i o n s . T h i s d o e s n o t p r e s e n t any p r o b l e m s s i n c e t h e n o i s e l e v e l s do n o t d i f f e r a p p r e c i a b l y b e t w e e n i d l e and n o t c h 1 .
59

from Table 4, given in terms of various average duty cycles, are similar to
the duty cycle based on Tq_£. The mean values based on Tq _q from this
current study correspond very closely to both the GE first average .and the
ATSF medium duty cycles. A similar comparison of the duty cycle based on
Tdose the existing data given in Table 5 shows that the percent time in
notch 8 was less in this current study. This reduction may be due to the in
clusion in Tdose of some short periods of time when the locomotive is at
idle. Nonetheless, the general trend of notch 8 time being high while the
locomotive is under way is shown by both sets of data.
The important point to note about the operational duty cycle data is
that for a good portion of the time the crew is in the cab, the locomotive is-
being operated such that the noise levels are most likely to be below the
90 dB threshold level. This is shown to be the case by the in-cab sound
level and noise exposure data presented in the next two sections.
5.2 In-Cab Noise Levels
The acoustic data from the recorded tapes were analyzed using a measur
ing amplifier set for A-weighting and "slow” response as specified in the
OSHA standard [2]. The logarithmic output signal of the measuring amplifier,
which was proportional to the sound level in decibels, was digitally sampled
10 times per second and recorded on magnetic tape using a mini-computer. The
operational parameter data were also digitized and arranged in such a format
that they could be correlated with the acoustic data. Analysis of the digi
tized data was done on the NBS central computer facility. This analysis con
sisted of binning the acoustic data (rounded to the nearest whole decibel)
according to the operational event. The binning procedure counted the number
of times each sound level occurred, between the limits of 70 and 126 dB, for
each event. The result of the binning process is a listing of the number of
60
counts for each sound level, that occurred during the entire test run. Since
the counts correspond to 0.1 second samples, the counts can be converted into
time in seconds by multiplying by 0.1. Thus, the binned data essentially
represent a sound level histogram for each event during the test run.
The data were binned for 26 operational events. These were:
■ 15 events from the operational keyboard [Table 14] plus windows closed (16)
■ dynamic brake (1)
■ engine notch settings (8)
| overall [regardless of event] (1)
During actual in-service runs, it is possible for more than one of
these operational events to occur at the same time. In this case it is
essential to know which operation is the predominant noise source so that the
relative contribution of each operation to the crew noise dose can be
determined. The approach .used, to make this determination in this study was
to establish a hierarchy for binning the data based on maximum sound level.
This hierarchy was determined from data obtained in a preliminary study
conducted on a DOT test locomotive at the U. S. Department of Transportation
Transportation Test Center (TTC) located in Pueblo, Colorado, and from
stationary data for the locomotives in Test Runs 1 through 7. With these
data, which are listed in Table 20, the following hierarchy was established:
1 ) brake
2 ) alerter
3) horn
4) call bell
5) radio
61

Table 20. Data used to 'establish hierarchy for binning of operational events!These data are the average A-weighted sound levels, Lavo, (except where noted) for the engineer's position obtained using "slow" response.
OPERATIONAL EVENT A-WEIGHTKD dB re
SOUND LEVEL, 20 pPa
LOCOMOTIVE
Windows Open Windows Closed NUMBER
Emergency Braket 108. 3 Y DOT Test LocomotiveBrake Application! 97.5 X DOT Test LocomotiveAlerter X 92.7-105.4 2,6Horn! 94.5 91.6 DOT Test LocomotiveCall Bell X 84.8-93.8 4,7Radio X 84.0-91.1 DOT Test Locomotive
Bell 83. 3 81.1 2
Notch 8(no engine load)
82.4 78.3 DOT Test Locomotive
Notch 8(engine self-load)
83.2 78.9 DOT Test Locomotive
X - Not testedt - Maximum A-weighted sound level reported
For the case of simultaneous occurrence of events, the data were assigned to
the event which was highest in the hierarchy. For example, if the brake andradio were operating at the same time, the data were assigned to the brake, in the binning process, and not to the radio.
This hierarchical approach is valid provided that either the sound level of one of the operations involved is 10 dB higher than the other, or the events very rarely, if ever, occur simultaneously. No case of simultaneousoccurrence of any two events among the brake, alerter, horn or call bell was
62
found in this study. There were cases where the brake and radio or horn and
radio were operating simultaneously, but the horn and brake produced sound levels that were generally 8-10 dB higher than that of the radio and thus these were the predominant noise sources. The only events which frequently occurred simultaneously were the bell and horn. Since the sound levels of the bells were much less than those of the horns, the bell was not included in the event hierarchy. Instead, all the data were binned for the bell when
its operational keyboard switch was on so that an accurate measure of the duty cycle of the bell could be obtained.
After the data were binned, the appropriate noise ratings and noise exposures were calculated. With the data binned according to operational event, the net contribution of sources such as horns or brakes to the overall noise environment in the cab were determined. The results are given in terms
of one of the three following noise ratings:
Lmax - maximum A-weighted sound level obtained using "slow” response;used for short duration, transient events such as horn soundings or brake applications.
LaVg ~ average A-weighted sound level (based on the arithmetic average of the digitized samples taken every one-tenth of a second); used for single events with relatively steady sound levels.
Leq - equivalent A-weighted sound level (which has the same acousticenergy as does a time-varying sound for a given tine period); used
for long durations which include many different events.
63
Mathematically, LaVg and Leq are given by
N
Lavs l Z Lti=l
Leq = 10 log1(1
N zi= l
10Li/10
(3)
(4)
where = digitized samples taken every one-tenth second,
N = total number of samples, and
log^Q = common logarithm to the base 10.
Examples of the relationships of these noise ratings to various sound level
time histories are shown in Figure 8.
For events having sound level distributions that may be approximated by
a normal (Gaussian) statistical distribution such as shown in Figure 9, L^ v o
is equivalent to L^q, where L^g is the sound level exceeded 50 percent of the
time that the event is occurring. When the levels are normally dis
tributed, Leq can be related to LaVg by the following relationship [28]:
Leq = Lavg + 0.115 s2 , (5)
where s = standard deviation of the noise level distribution.
In the remaining portion of this section, these noise ratings are used
to examine the relative influences of different operational variables on the
in-cab noise environment. The assessment of this environment in terms of
crew noise exposure is then discussed in Section 5.3.
64
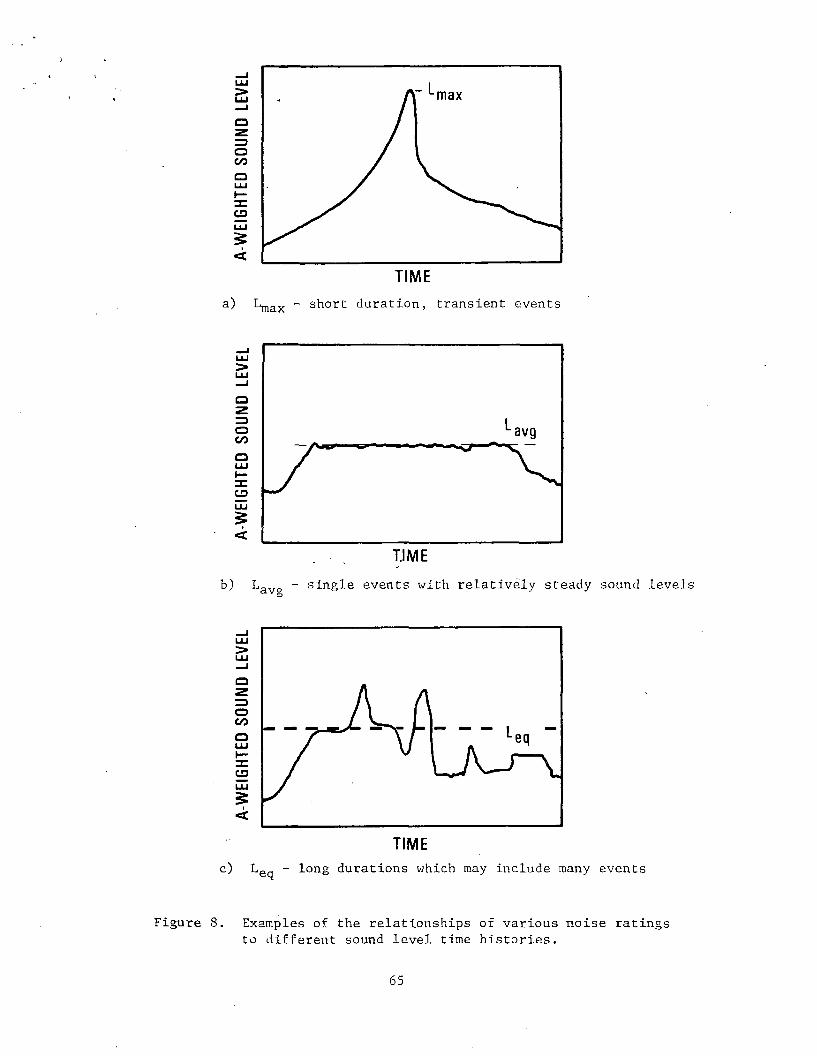
Figure 8
a) Lmax - short duration, transient events
TIME
b) Lavg single events with relatively steady sound levels
TIMEc) L„n - long durations which may include many events c4
. Examples of the relationships of various noise ratings to different sound level time histories.
65

PERCENT TIME AT A SPECIFIED SO
UND LEVEL
Figure 9. Example of noise level distribution that may be approximated by a normal statistical distribution.
66
5.2.1 Spatial Variation in the Cab
Because of the non-symmetrical location of certain sources in the cab,
such as the brake pipe outlet near the engineer, four fixed microphones
were used to obtain data to examine the spatial variation of the sound level
in the cab. As discussed in Section 4.1, these microphones were located
approximately 6 inches from the ear positions of the engineer and brakeman
when they were seated.
The data for the 18 test runs (16 locomotives) show that there is vari
ability of the sound level with position in the cab for some individual
sources but for the overall trip the spatial variation of the sound level in
the cab is statistically insignificant. This conclusion was based on analy
sis of the stationary test data for engine notch 8, horn, and brake with the
windows open and closed and of the in-service data for the overall trip.
These data are listed in Tables 21 through 24. In these tables, ELS corres
ponds to the engineer left-side microphone, ERS to the engineer right-side
microphone, BRS to the brakeman right-side microphone and BLS to the brakeman
left-side microphone.
Examination of the data for each locomotive shows that there is some
spatial variability of the sound level in the cab. However, two-way analysis
of variance shows that at the 95 percent confidence level there are no stat
istically significant differences in sound level among the levels at the four
microphone locations (ERS, ELS, BRS and BLS) for the following sets of data
for the 18 test runs:
notch 8 - LaVg, stationary, windows open
horn - Lmax, stationary, windows closed
horn - stationary, windows open
overall trip - Leq, in-service
67

Table 21. Stationary data for notch 8 for the 16 test locomotives. Values are forthe four fixed microphone locations with windows open and closed.
AVERAGE A-WEIGHTED SOUND LEVEL, Lavp, dB re 20 pPa
LOCOMOTIVENUMBER
Windows Open Windows ClosedERS ELS BRS BLS ERS ELS BRS BLS
1 90.3 89.3 89.3 N/A 88.1 89.3 87.7 N/A2 94.9 N/A 93.0 92.8 92.6 90.9 92.4 92.23 88.1 88.0 87.6 87.3 87.5 87.4 87.7 87.64 81.7 80.6 80.7 N/A 79.1 78.9 80.7 N/A5 78.3 78.1 76.5 N/A 78.3 73.1 78.8 N/A6 83.4 81.5 80.3 N/A 81.4 79.6 79.0 N/A7 85.6 85.0 8 5.3 86.6 85.0 84.3 84.0 84.88 86.0 N/A 83.0 83.2 83.2 81.9 80.8 80.69 82.3 81.8 83.2 83.8 81.5 80.8 82.7 83.310 85.0 83.5 82.9’ 84.4 81.9 81.9 80.5 81.011 88.0 86.3 85.6 87.1 86.0 ' 84.5 84.0 85.612 83.3 82.7 82.9 84.2 80.2 79.9 81.2 82.513 81.9 80.0 78.9 79.3 80.3 78.8 78.1 78.814 83.9 84.2 83.3 83.9 83.6 83.0 82.1 83.215 84.8 83.5 86.4 87.7 83.0 82.3 85.8 87.016 84.7 84.0 85.7 86.4 82.7 82.5 83.4 84.8
MEAN 85.1 ' 83.5 84.0 85.6 83.4 82.8 83.1 84.3
STANDARDDEVIATION 3.9 3.1 4.1 3.3 3.7 3.8 3.8 3.6
N/A - Data are not available for this test condition.
6 8

Table 22. Stationary data for horn soundings for the 16 test locomotives.Values are for the four fixed microphone locations with windowsopen and closed.
MAXIMUM A-WEIOHTED SOUND LEVEL, Lmax, dB re 20 pPaWindows Open Windows Closed ■
LOCOMOTIVENUMBER ERS ELS BRS BLS ERS ELS BRS BLS
1 1 106.4 104.2 102.3 N/A 102.4 OO • o 100.3 N/A
2 X 106.5 103.0 100.5 103.9 103.1 95.7 98.0 98.2
3 \ 95.1 96.3 98.9 96.0 96.4 ■ 97.5 94.2 93.0
4 3 103.4 100.8 104.7 105.4 98.5 96.5 96.1| 99.6
5 ? 97.5 96.9 100.9 101.9 92.7 90.6 101.5 99.7
6 3 99.3 102.5 107.3 105.6 98.7 102.0 104.9 104.7
7 i 105.2 10 5.2 102.8 104.8 99.0 101.5 102.1 102.2
8 96.4 95.3 93.7 96.8 95.7 90.6 91.5 92.0
9 / 95.5 96.5 92.8 94.7 95.8 91.3 90.4 94.2
10 104.8 102.9 99.1 100.7 90.4 89.8 91.6 92.0
11 i 102.2 101.8 102.9 103.2 94.9 93.8 96.0 99.0
12 3 99.8 99.4 100.6 100.2 95.0 93.5 96.4 96.4
13 7 103.1 98.2 100.6 101.0 95.0 94.2 95.0 94.9
14 r 101.5 99.0 98.1 98.6 96.3 94.3 95.6 93.1
15 r 104.9 103.0 99.7 102.9 96.1 95.0 95.8 96.1
16 101.9 101.4 97.5 94.7 90.1 89.2 88.0 88.2
MEAN 101.5 100.4 100.2 100.7 96.3 94.6 96.1 96.2STANDARDDEVIATION 3.8 3.1 3.7 3.8 3.6 3.9 4.5 4.4
N/A - Data are not available for this test condition.69

Table 23. Stationary data for brake applications for the 16 test locomotives.Values are for the four fixed microphone locations with windowsopen and closed.
MAXIMUM A-WEIGHTED SOUND LEVEL, L^*, dB re 20 pPaWindows Open Windows Closed
LOCOMOTIVENUMBER ERS ELS BRS BLS ERS ELS BRS BLS
1 97.0 100.8 95.7 N/A 97.2 101.7 95.6 N/A2 101.9 105.2 105.1 103.7 X X X X3 V X X X 10 2.3 103.6 102.4 101.64 97.0 102.2 95.1 96.4 97.1 102.4 97.9 97.85 X X X X 101.3 101.0 99.3 99.16 X X X X 102.2 103.0 101.7 101.77 104.1 102.4 104.5 100.4 101.9 103.4 103.1 L01.58 X X X X 102.3 102.1 102.5 101.99 98.3 100.2 97.5 96.4 X X X X10 87.9 87.3 86.8 86.0 85.2 87.1 85.7 85.011 X X X X 83.2 83.9 80.9 81.012 X X X X 89.3 90.0 87.3 87.313 96.1 97.9 91.2 90.6 X X X X14 X X X X 100.4 102.5 101.9 100.315 104.6 105.2 102.7 101.9 X X X X16 94.5 96.2 90.1 90.6 X X X XMEAN 97.9 99.7 96.5 95.8 96.6 98.2 96.2
1
95.7STANDARDDEVIATION 5.2 5.5 6.5 6.2 7.2 7.4 7.9
i
8.0 j ________1
X - Data were not recorded for this test condition. N/A - Data are not available for this test condition.
70
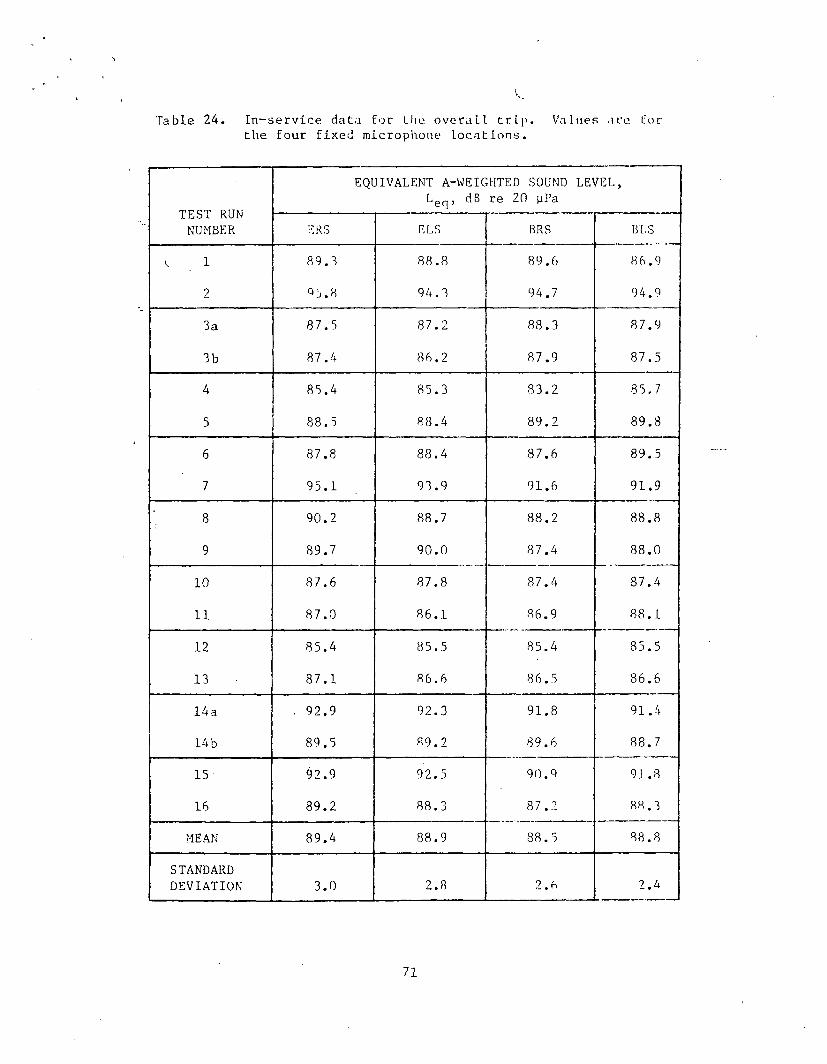
Table 24. In-service data for Lhe overaLl trip. Values are. for the four fixed microphone Locations.
TEST RUN NUMBER
EQUIVALENT A-WEIGHTED SOUND LEVEL, Leq, dB re 20 yPa
ERS ELS BRS BLS
t 1 89.3 88.8 89.6 86.9
2 95.8 94.3 94.7 94.9
3a 87.5 87.2 88.3 87.9
3b 87.4 86.2 87.9 87.5
4 85.4 85.3 83.2 85.7
5 88.5 88.4 89.2 89.8
6 87.8 88.4 87.6 89.57 95.1 93.9 91.6 91.9
8 90.2 88.7 88.2 88.8
9 89.7 90.0 87.4 88.0
10 87.6 87.8 87.4 87.4
11 87.0 86.1 86.9 88.1
12 85.4 85.5 85.4 85.5
13 87.1 86.6 86.5 86.6
14a . 92.9 92.3 91.8 91.4
14b 89.5 89.2 89.6 88.7
15 92.9 92.5 90.9 91.8
16 89.2 88.3 87.2 88.3
MEAN 89.4 88.9 88.5 88.8
STANDARDDEVIATION 3.0 2.8 2.6 2.4
71

The same was also proven to be true for the noise dose. This is discussed
in the next section.
Further examination showed that the conclusion of no statistically sig
nificant difference in sound level can also be made when comparing the notch
8, LaVg, stationary, windows-closed data for the engineer right-side and
brakeman right-side and left-side microphones (i.e., excluding the engineer
left-side microphone).
As expected because of its location in the cab, the sound level due to
venting of the brake pipe varies within the cab, with the. highest levels
recorded at the engineer left-side microphone position. Because of this and
the fact that the radio is also located nearest to the engineer left-side
microphone, examination of the effects of the various operational parameters
on the in-cab levels is performed using the data for only this microphone.
Since the values (L0q or noise dose) for the overall trip are not a function
of location in the cab, the discussion of crew.noise exposure in Section 5.3
is also based only on data for the engineer left-side microphone.
5.2.2 Effect of Locomotive Operations
Of the locomotive sources or operations which were recorded for the
operational duty cycle, the principal contributors to the in-cab noise
environment are the horn, brake, radio and, of course, the diesel engine.
Other sources such as the bell, dynamic brake, and the various types of
warning alarms result in either no observable change in noise level in the
cab or occur so infrequently that they may be disregarded. More is said
about these sources at the end of this section.
In-service data for horn soundings, brake applications, radio
receptions, and windows-open versus windows-closed conditions, plus
stationary data for horns and brakes are given in Table 25. These data are
72
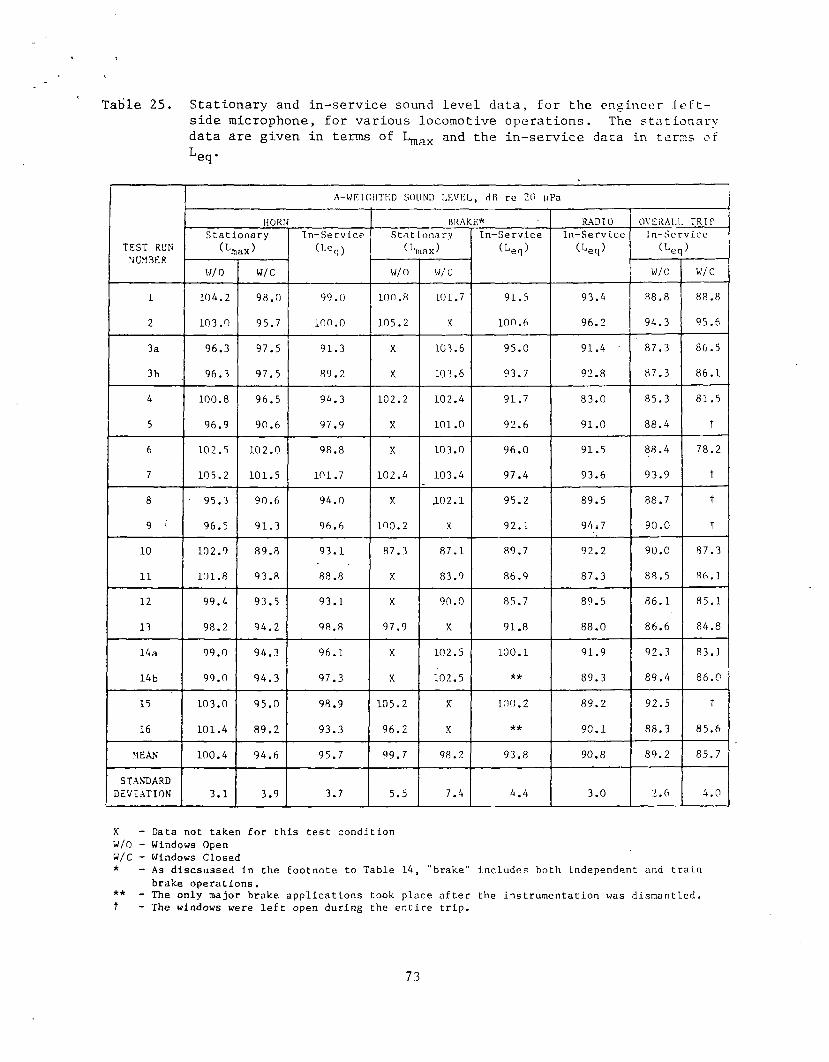
Tatile 25. Stationary and in-service sound level data, for the engineer leftside microphone, for various locomotive operations. The stationary data are given in terms of Lmax and the in-service data in terms of
A —W E I C U T K D S O U N D L E V E L , d B r e 2 0 u P a
H O R N B R A K E * R A D I O O V E R A L I T R I P
T E S T R U N
N U M B E R
S t a t i o n a r y I n - S e r v i c e
0 - e q )
S t n t i o n a r y I n - S e r v i c e
( L e q )
I n - S e r v i c e
( L e q )
I n - S c r v i c e
( l e q )
w / o W / C w / o W / C W / O W / C
1 1 0 4 . 2 9 8 . 0 9 9 . 0 1 0 0 .8 1 0 1 . 7 9 1 . 5 9 3 . 4 8 8 .8 8 8 .8
2 1 0 3 . 0 9 5 . 7 i n n . o 1 0 5 . 2 X 1 0 0 .6 9 6 . 2 9 4 . 3 9 5 . 6
3 a 9 6 . 3 9 7 . 5 9 1 . 3 X 1 0 3 . 6 9 5 . 0 9 1 . 4 ' 8 7 . 3 8 6 . 5
3 b 9 6 . 3 9 7 . 5 8 9 . 2 X L 0 3 . 6 9 3 . 7 9 2 . 8 8 7 . 3 8 6 .1
4 1 0 0 .8 9 6 . 5 9 4 . 3 1 0 2 .2 1 0 2 . 4 9 1 . 7 8 3 . 0 8 5 . 3 8 1 . 5
5 9 6 . 9 9 0 . 6 9 7 . 9 X 1 0 1 .0 9 2 . 6 9 1 . 0 8 8 . 4 t
6 1 0 2 . 5 1 0 2 .0 9 8 . 8 X 1 0 3 . 0 9 6 . 0 9 1 . 5 8 8 . 4 7 8 . 2
7 1 0 5 . 2 1 0 1 . 5 1 0 1 . 7 1 0 2 . 4 1 0 3 . 4 9 7 . 4 9 3 . 6 9 3 . 9 r
8 9 5 . 3 9 0 . 6 9 4 . 0 X 1 0 2 .1 9 5 . 2 8 9 . 5 8 8 . 7 1
9 ; 9 6 . 5 9 1 . 3 9 6 . 6 1 0 0 .2 X 9 2 . 1 9 4 i 7 9 0 . 0 t
10 1 0 2 . 9 8 9 . 8 9 3 . 1 8 7 . 3 8 7 . 1 8 9 . 7 9 2 . 2 9 0 . 0 8 7 . 3
11 1 0 1 .8 9 3 . 8 8 8 .8 X 8 3 . 9 8 6 . 9 8 7 . 3 8 8 . 5 8 6 .1
12 9 9 . 4 9 3 . 5 9 3 . 1 X 9 0 . 0 8 5 . 7 8 9 . 5 8 6 .1 8 5 . 1
n 9 8 . 2 9 4 . 2 9 8 . 8 9 7 . 9 X 9 1 . 8 8 8 .0 8 6 .6 8 4 . 8
1 4 a 9 9 . 0 9 4 . 3 9 6 . 1 X 1 0 2 . 5 1 0 0 .1 9 1 . 9 9 2 . 3 8 3 . 1
1 4 b 9 9 . 0 9 4 . 3 9 7 . 3 X 1 0 2 . 5 * * 8 9 . 3 8 9 . 4 8 6 .0
1 5 1 0 3 . 0 9 5 . 0 9 8 . 9 1 0 5 . 2 X 1 0 0 .2 8 9 . 2 9 2 . 5 1
1 6 1 0 1 . 4 8 9 . 2 9 3 . 3 9 6 . 2 X * * 9 0 . 1 8 8 . 3 8 5 . 6
M E A N 1 0 0 . 4 9 4 . 6 9 5 . 7 9 9 . 7 9 8 . 2 9 3 . 8 9 0 . 8 8 9 . 2 8 5 . 7
S T A N D A R D
D E V I A T I O N 3 . 1 3 . 9 3 . 7 5 . 5 7 . 4 4 . 4 3 . 0 2 .6 4 . 0
X - D a t a n o t t a k e n f o r t h i s t e s t c o n d i t i o n
W / 0 - W i n d o w s O p e n
W / C - W i n d o w s C l o s e d
* - A s d i s c s u s s e d i n t h e f o o t n o t e t o T a b l e 1 4 , " b r a k e " i n c l u d e s b o t h i n d e p e n d e n t a n d t r a i n
b r a k e o p e r a t i o n s .
* * - T h e o n l y m a j o r b r a k e a p p l i c a t i o n s t o o k p l a c e a f t e r t h e i n s t r u m e n t a t i o n w a s d i s m a n t l e d ,
t - T h e w i n d o w s w e r e l e f t o p e n d u r i n g t h e e n t i r e t r i p .
73

for the engineer left-side microphone. The stationary data for horns, given in terras of I- ax, show that the in-cab sound levels are strongly dependent upon whether the windows are opened or closed. The average reduction of incab level with the windows closed is 5.8 dB, with a range of reductions from 0.5 dB to 13.1 dB. This reduction is primarily a function of how well the windows and doors are sealed and to a lesser extent, the noise reduction
characteristics of the cab roof. [For locomotive 3 there is actually an in
crease of 1.2 dB with the windows closed. This is highly unlikely and is
probably due to a difference in how the horn was sounded between the sta
tionary and in-service tests.] In almost all cases, the sound levels for horn soundings are above the 90 dB OSHA threshold level. A sound level time history for the typical operation of the horn at a crossing is shown in
Figure 10. As seen in this figure, the sound level is relatively constant during the time the horn is being sounded, i.e. is approximately equal
to haVCT. Thus, because of the magnitude of the sound levels, even when the windows are closed, and the operational nature of the horn, horn soundings
will definitely be a contributing factor to the crew noise exposure. Al
though the OSHA noise exposure is not based on L , the fact that the in-'-Mservice energy equivalent levels are, in all but two cases, above 90 dB, and in most instances 3 to 10 dB higher, supports this conclusion.
Based on the four cases for which there are both windows-open and
windows-closed data, in-cab sound levels due to brake applications (includes
both independent and train brake operations) are not a function of window position. This is as expected, since the brake pipe vent is located inside the cab. The maximum in-cab sound levels for brake applications, L^,^, are greater than 90 dB for all locomotives except those on Test Runs 10 and 11.
74
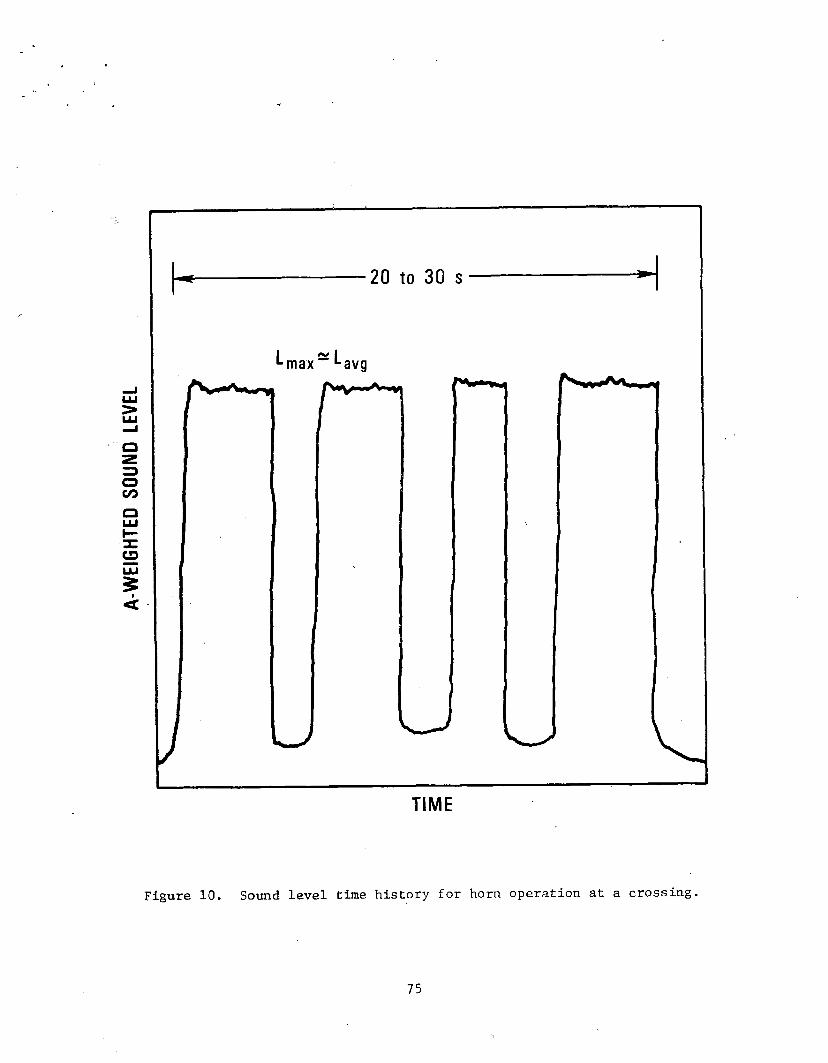
A WE
IGHTE
D SO
UND
LEVE
L
Figure 10. Sound level time history for horn operation at a crossing.
75
Unlike horn soundings, the sound level time history for various types of brake applications shows that the sound level varies widely while the brake pipe is being vented (see Figure 11). The duration is also variable, particularly for applications of the train brake. In this case the duration is dependent on the length of the train. Thus, although the maximum sound
levels for brake applications are as high as those for horn soundings, the
sound levels do not remain at these maximum values during the entire brake
application. This indicates that the crew noise exposure will be influenced
by brake applications but probably to a lesser degree than by horn sound
ings. This will be controlled by the number of occurrences and duration of each occurrence for brake applications relative to horn soundings.
The purpose of the radio is to be in communication with the dispatcher, other crew members, wayside personnel, and other trains so that all train movements can be coordinated. For obvious safety reasons, the volume
of the radio is adjusted so that it can be heard above the noise generated
by the engine. Because the volume is adjustable and is a function not only
of the in-cab noise levels but also the personal preference of each en
gineer, no stationary data were recorded for radio operations. The in-
service data listed in Table 25 correspond only to radio receptions since radio transmissions are normally inaudible above the noise in the cab. The
range of equivalent sound levels is lower than that for horn and brakes, but
the duration, given in terms of percent of T^gg in Table 18, is significantly higher. The effect on the crew noise exposure is a function of the sound level distribution relative to 90 dB, which cannot be judged from the equivalent sound level.
76

A-WEIGHTED S
OUND
LEVEL
Figure 11. Sound level time histories for different types of brakeapplications.
77

The sound level data for the eight engine notch settings are given in
Tables 26 through 28. Tables 26 and 27 list the stationary data in terms of
Lava for windows open and closed, respectively. Table 28 lists the in-
service data in terms of L£rj for each notch setting, as well as the overall
trip L0q. In general, both the stationary and in-service data show that the
sound level increases with notch setting. Figure 12 is a plot of the mean
of the average A-weighted sound levels versus notch setting for the station
ary and in-service data for all 18 test runs. The straight lines represent
the linear regression lines based on the mean values for each set of data.
Based on these regression lines, it is seen that the sound level increases
approximately 1.5 dB per notch setting for stationary (no load) conditions
(windows open or closed) and 0.6 dB per notch setting for in-service condi
tions. This difference is partially due to the fact that sources other than
engine noise are included in the data binned for each notch setting. The
only two sources which are not included in the in-service notch setting data
are horns and brakes.
The stationary data for engine noise do not indicate that there would
be any contribution to the crew noise exposure based on the OSHA standard
[2], except for the locomotive in Test Run 2. This observation is slightly
misleading since the stationary data are for engine operation without any
load. Additional data were taken for the locomotive in Test Run 10 using
the engine self-load capability (designated 10a in Tables 26 and 27). The
data for this one locomotive show little effect of load for notch settings
1, 2 and 3, but for notch settings 4 through 8, the average increase of
sound level due to engine load is 2.7 dB (range 1.8 to 4.6 dB). it is not
known how well the engine self-load simulates in-service engine operation,
78
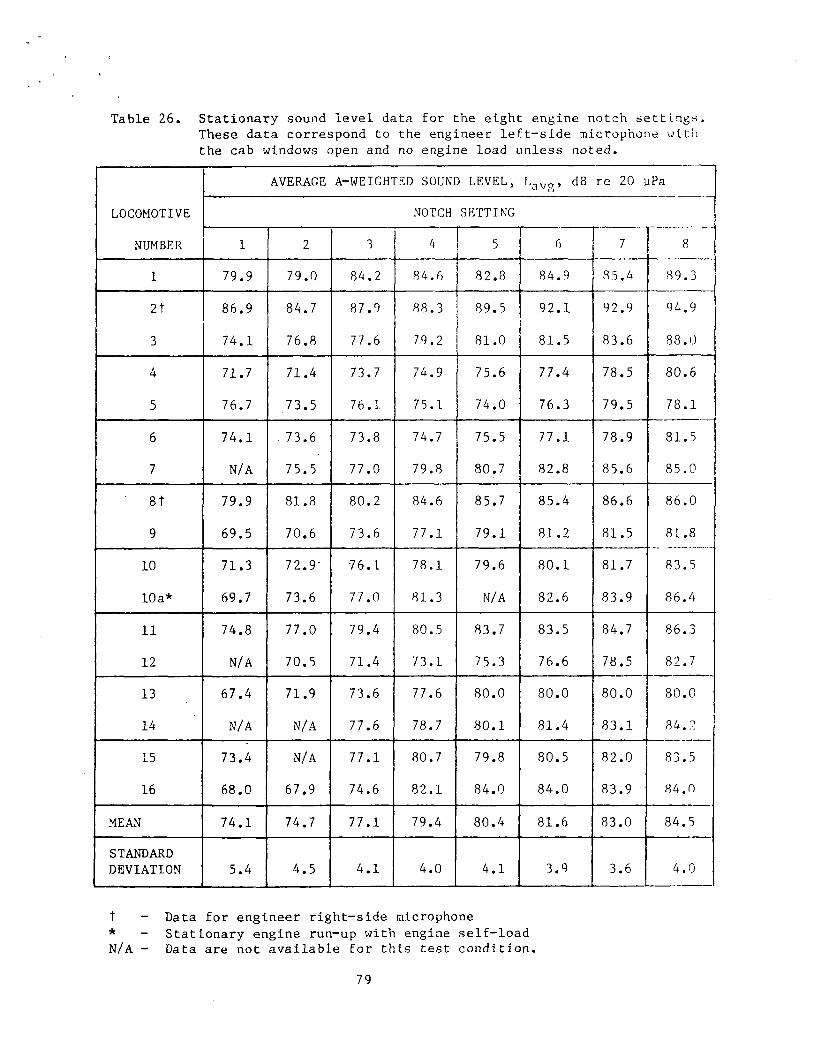
Table 26. Stationary sound level data for the eight engine notch settings.These data correspond to the engineer left-side microphone with the cab windows open and no engine load unless noted.
AVERAGE A-WEIGHTED SOUND LEVEL, fjavg> re 20 pPa
LOCOMOTIVE NOTCH SETTING
NUMBER 1 2 3 4 5 6 7 8
1 79.9 79.0 84.2 84.6 82.8 84.9 85.4 89.3
2t 86.9 84.7 87.9 88.3 89.5 92.1 92.9 94.9
3 74.1 76.8 77.6 79.2 81.0 81.5 83.6 88.0
4 71.7 71.4 73.7 74.9 75.6 77.4 78.5 80.6
5 76.7 73.5 76.1 75.1 74.0 76.3 79.5 78.1
6 74.1 73.6 73.8 74.7 75.5 77.1 78.9 81.5
7 N/A 75.5 77.0 79.8 80.7 82.8 85.6 85.0
8t 79.9 81.8 80.2 84.6 85.7 85.4 86.6 86.0
9 69.5 70.6 73.6 77.1 79.1 81.2 81.5 81.8
10 71.3 72.9' 76.1 78.1 79.6 80.1 81.7 83.5
10a* 69.7 73.6 77.0 81.3 N/A 82.6 83.9 86.4
11 74.8 77.0 79.4 80.5 83.7 83.5 84.7 86.3
12 N/A 70.5 71.4 73.1 75.3 76.6 78.5 82.7
13 67.4 71.9 73.6 77.6 80.0 80.0 80.0 80.0
14 N/A N/A 77.6 78.7 80.1 81.4 83.1 84.2
15 73.4 N/A 77.1 80.7 79.8 80.5 82.0 83.5
16 68.0 67.9 74.6 82.1 84.0 84.0 83.9 84.0
MEAN 74.1 74.7 77.1 79.4 80.4 81.6 83.0 84.5
STANDARDDEVIATION 5.4 4.5 4.1 4.0 4.1 3.9 3.6 4.0
i
t - Data for engineer right-side microphone* - Stationary engine run-up with engine self-loadN/A - Data are not available for this test condition.
79
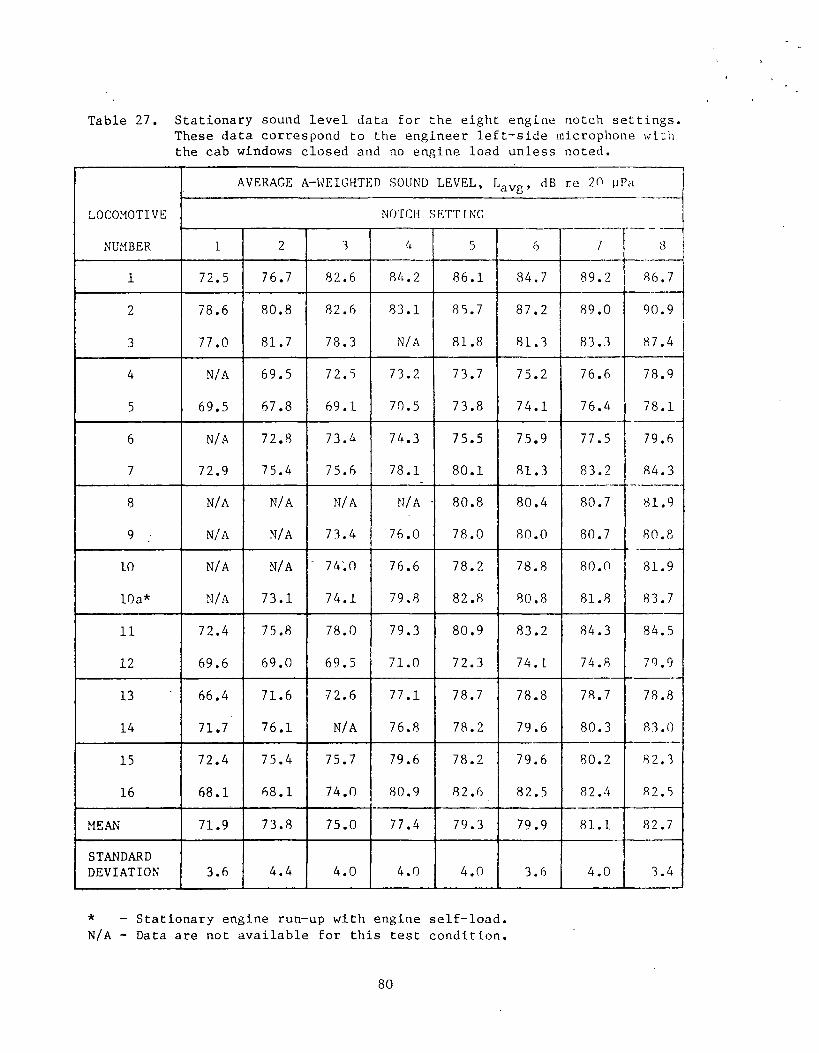
Table 27. Stationary sound level data for the eight engine notch settings.These data correspond to the engineer left-side microphone with the cab windows closed and no engine load unless noted.
AVERAGE Al-WEIGHTED SOUND LEVEL, IJavg> re 20 pPa
LOCOMOTIVE NOTCH SETTING
NUMBER 1 2 3 4 5 6 7 8
1 72.5 76.7 82.6 84.2 86.1 84.7 89.2 86.7
2 78.6 80.8 82.6 83.1 85.7 87.2 89.0 90.9
3 77.0 81.7 78.3 N/A 81.8 81.3 83.3 87.4
4 N/A 69.5 72.5 73.2 73.7 75.2 76.6 78.9
5 69.5 67.8 69.1 70.5 73.8 74.1 76.4 78.1
6 N/A 72.8 73.4 74.3 75.5 75.9 77.5 79.6
7 72.9 75.4 75.6 78.1 80.1 81.3 83.2 84.3
8 N/A N/A N/A N/A ■ 80.8 80.4 80.7 81.9
9 N/A N/A 73.4 76.0 78.0 80.0 80.7 80.8
10 N/A N/A ' 74.0 76.6 78.2 78.8 80.0 81.9
10a* N/A 73.1 74.1 79.8 82.8 80.8 81.8 83.7
11 72.4 75.8 78.0 79.3 80.9 83.2 84.3 84.5
12 69.6 69.0 69.5 71.0 72.3 74. L 74.8 79.9
13 66.4 71.6 72.6 77.1 78.7 78.8 78.7 78.8
14 71.7 76.1 N/A 76.8 78.2 79.6 80.3 83.0
15 72.4 75.4 75.7 79.6 78.2 79.6 80.2 82.3
16 68.1 68.1 74.0 80.9 82.6 82.5 82.4 82.5
MEAN 71.9 73.8 75.0 77.4 79.3 79.9 81.1 82.7STANDARDDEVIATION 3.6 4.4 4.0 4.0 4.0 3.6 4.0 3.4
* - Stationary engine run-up with engine self-load.N/A - Data are not available for this test condition.
80
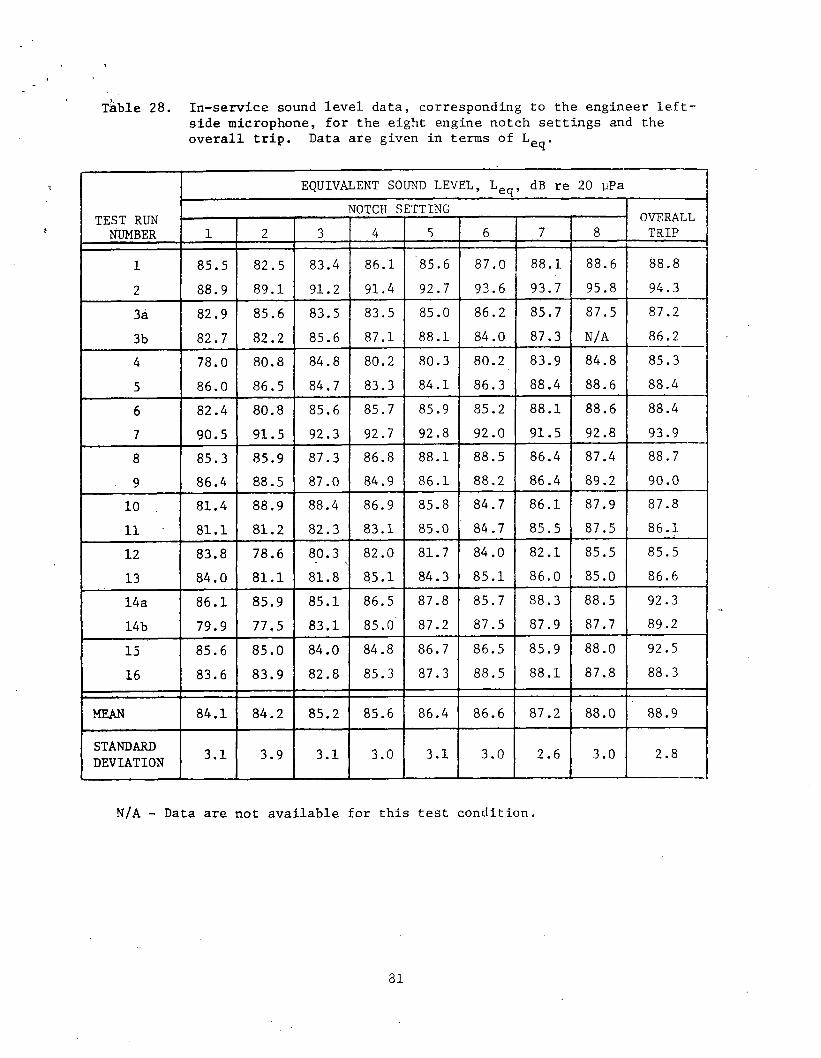
Table 28. In-service sound level data, corresponding to the engineer leftside microphone, for the eight engine notch settings and the overall trip. Data are given in terms of Le(j.
EQUIVALENT SOUND LEVEL, L._ _________________________ rH, dB re 20 pPa
TEST RUN NUMBER
NOTCH SETTING rWTTT'D A T T
1 2 3 4 5 6 7 8\J V IL I Y f il- i I_i
TRIP
1 85.5 82.5 83.4 86.1 85.6 87.0 88.1 88.6 88.82 88.9 89.1 91.2 91.4 92.7 93.6 93.7 95.8 94.33a 82.9 85.6 83.5 83.5 85.0 86.2 85.7 87.5 87.23b 82.7 82.2 85.6 87.1 88.1 84.0 87.3 N/A 86.24 78.0 80.8 84.8 80.2 80.3 80.2 83.9 84.8 85.35 86.0 86.5 84.7 83.3 84.1 86.3 88.4 88.6 88.46 82.4 80.8 85.6 85.7 85.9 85.2 88.1 88.6 88.47 90.5 91.5 92.3 92.7 92.8 92.0 91.5 92.8 93.98 85.3 85.9 87.3 86.8 88.1 88.5 86.4 87.4 88.79 86.4 88.5 87.0 84.9 86.1 88.2 86.4 89.2 90.010 81.4 88.9 88.4 86.9 85.8 84.7 86.1 87.9 87.811 81.1 81.2 82.3 83.1 85.0 84.7 85.5 87.5 86.112 83.8 78.6 80.3 82.0 81.7 84.0 82.1 85.5 85.513 84.0 81.1 81.8 85.1 84.3 85.1 86.0 85.0 86.614a 86.1 85.9 85.1 86.5 87.8 85.7 88.3 88.5 92.314b 79.9 77.5 83.1 85.0 87.2 87.5 87.9 87.7 89.215 85.6 85.0 84.0 84.8 86.7 86.5 85.9 88.0 92.516 83.6 83.9 82.8 85.3 87.3 88.5 88.1 87.8 88.3
MEAN 84.1 84.2 85.2 85.6 86.4 86.6 87.2 88.0 88.9
STANDARDDEVIATION 3.1 3.9 3.1 3.0 3.1 3.0 2.6 3.0 2.8
N/A - Data are not available for this test condition.
31
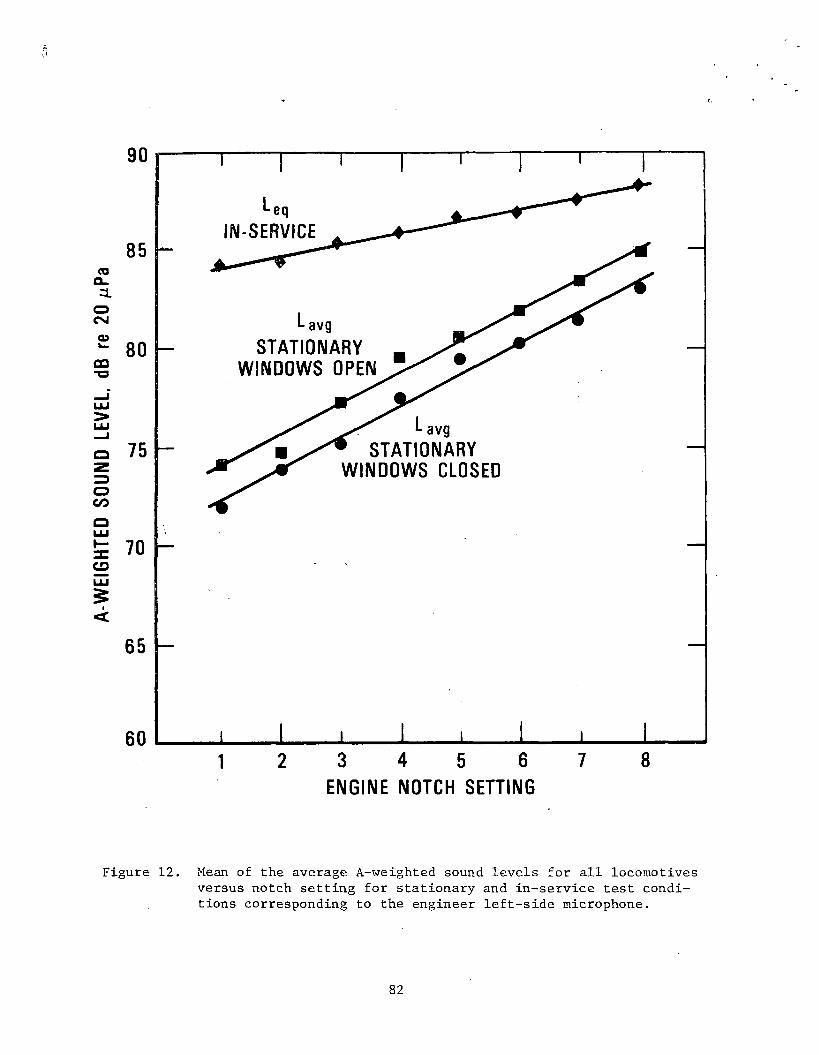
A-W
EIGH
TED
SOUN
D LE
VEL.
dB r
e 20
/iPa
90
85
80
75
70
65
60 I 1 I 1 I I I_____ L1 2 3 4 5 6 7 8
ENGINE NOTCH SETTING
F i g u r e 12. Me a n of the average A - w e i g h t e d sound levels for all locomotives versus n o t c h setting for s tationary a n d i n - s e r v i c e test c o n d i tions cor r e s p o n d i n g to the engi n e e r left-side microphone.
82
but if the sound levels do increase by a p p r o x i m a t e l y this amount when the
engine is loaded, there is likely to be a significant c o n tribution to
the crew noise exposure. This is particularly true since on the a v erage the
engine is o p e r a t i n g in notch 8 for 40 percent of the effective crew dose
time (Table 19).
The effect of w i n d o w position for each source can be summarized as:
■ ho r n - 0.5 to 13.1 dB r e d uction with wi n d o w s closed, dependentup o n h o w well windows and doors are sealed.
■ brake - not a function of win d o w position.
■ engine - 0.9 to 2.2 dB decrease with windows closed.
In general, if the source is located outside of the cab, wind o w position
will have a greater effect on the in-cab sound levels. Also, wh e n running
through a cut or tunnel the in-cab levels will be mo r e dependent on w i n d o w
position b e cause of reflections of the sound waves off the cut and tunnel
walls. E x a m i n a t i o n of the in-service data for windows open and windows
closed in Table 25 is not really meaningful because the windows were n o r m a l
ly in one p o s i t i o n (either open or closed) for the entire trip. Onl y Test
Runs 1 and 12 had a r e l a t i v e l y equal amount of time w i t h the windows both
open and closed (see Table 18). For these two cases, the equivalent sound
levels for wi n d o w s open versus windows closed are equal for Test Run 1 and
1 dB higher for wi n d o w s open for Test Run 12. A l t h o u g h there is some effect,
it is d i f ficult to make any generalized statements based on only two test
runs.
As m e n t i o n e d at the beginning of this section, other sources such as
the bell, w a r n i n g alar m s and dynamic brake either have little influence on
the in-cab sound leve l s or occur very infrequently. Table 29 lists
s t a t i o n a r y noise level and operational duty cycle data for these operations.
83
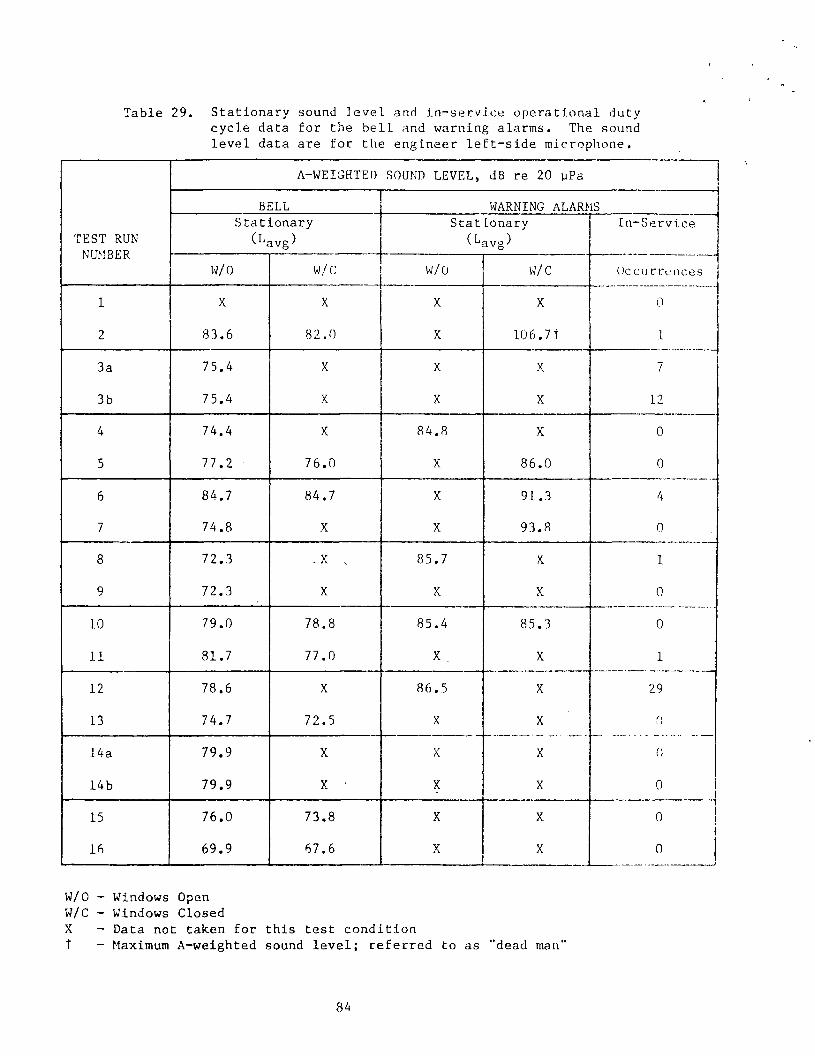
Table 29. Stationary sound level and in-service operational duty cycle data for the bell and warning alarms. The sound level data are for the engineer left-side microphone.
TEST RUN NUMBER
A-WEIGHTED SOUND LEVEL, dB re 20 pPa I
BELL WARNING ALARMSS tationary
^ Javg)Stat ionary
(^avg)In-Service
W/0 W/C W/0 w/c Occurrences
1 X X X X 0
2 83.6 82.0 X 106.7t 1
3a 75.4 X X X 7
3b 75.4 X X X 12
4 74.4 X 84.8 X 0
5 77.2 76.0 X 86.0 0
6 84.7 84.7 X 91.3 4
7 74.8 X X 93.8 0
8 72.3 . X , 85.7 X 1
9 72.3 X X X 0
10 79.0 78.8 85.4 85.3 0
11 81.7 77.0 X . X 1
1 2 78.6 X 86.5 X 29
13 74.7 72.5 X X 0
14a 79.9 X X X 0
14b 79.9 x ■ X X 0
15 76.0 73.8 X X 0
16 69.9 67.6 X X 0
W/0 — Windows Open W/C - Windows ClosedX - Data not taken for this test conditiont - Maximum A-weighted sound level; referred to as "dead m a n ”
84
As shown by these data, the sound levels for the bell are such that they are
normally less than the background levels due to the engine noise. Also,
since the bell is used primarily at crossings, the horn sounding will
predominate over the bell.
Data for warning alarms were taken for only a few locomotives because
there often was no special alarm or it could not be manually controlled.
Although the sound levels for certain alarms were above 90 d B , the number of
occurrences is extremely small. Only for the locomotive on Test Run 12,
which was experiencing mechanical problems, was the number of occurrences
significant. As mentioned in Section 5.1, if it were not for these tests
being conducted, the locomotive would have been shut down.
Data for operation of the dynamic brake are not reliable because the
dynamic brake system was frequently inoperable even though the electronic
signal from the MU cable indicated it was operating. Although this
information might be useful for discussing the operational duty cycle, the
dynamic brake had very little effect on the in-cab sound levels. This was
verified by the NBS test personnel who noted that they could only determine
that the dynamic brake was operating by observing the engineer place the
locomotive in dynamic brake or by asking the engineer in what mode the
locomotive was operating, and not by audible changes of the in-cab sound
levels.
5.2.3 Effect of Terrain Features
The effects of terrain features on in-cab sound levels are both
indirect and direct. Such features as upgrades and downgrades will
indirectly influence the in-cab sound levels by changing the load on the
engine and by necessitating changes of the engine notch settings and braking
85
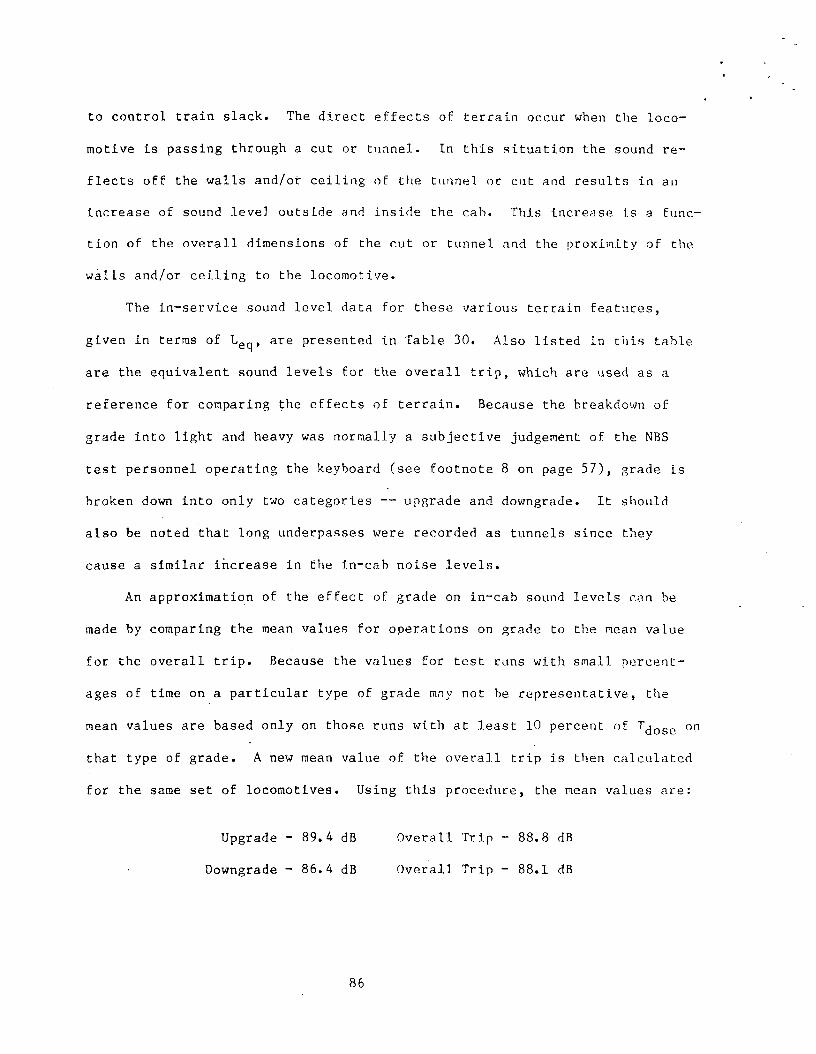
to control train slack. The direct effects of terrain occur when the loco
motive is passing through a cut or tunnel. In this situation the sound re
flects off the walls and/or ceiling of the tunnel or cut and results in an
increase of sound level outside and Inside the cab. This increase is a func
tion of the overall dimensions of the cut or tunnel and the proximity of the
walls and/or ceiling to the locomotive.
The in-service sound level data for these various terrain features,
given in terms of Leq, are presented in Table 30. Also listed in this table
are the equivalent sound levels for the overall trip, which are used as a
reference for comparing the effects of terrain. Because the breakdown of
grade into light and heavy was normally a subjective judgement of the NBS
test personnel operating the keyboard (see footnote 8 on page 57), grade is
broken down into only two categories — upgrade and downgrade. It should
also be noted that long underpasses were recorded as tunnels since they
cause a similar increase in the in-cab noise levels.
An approximation of the effect of grade on in-cab sound levels can be
made by comparing the mean values for operations on grade to the mean value
for the overall trip. Because the values for test runs with small percent
ages of time on a particular type of grade may not be representative, the
mean values are based only on those runs with at least 10 percent of Tjogc on
that type of grade. A new mean value of the overall trip is then calculated
for the same set of locomotives. Using this procedure, the mean values are:
Upgrade - 89.4 dB Overall Trip - 88.8 dB
Downgrade - 86.4 dB Overall Trip - 88.1 dB
86
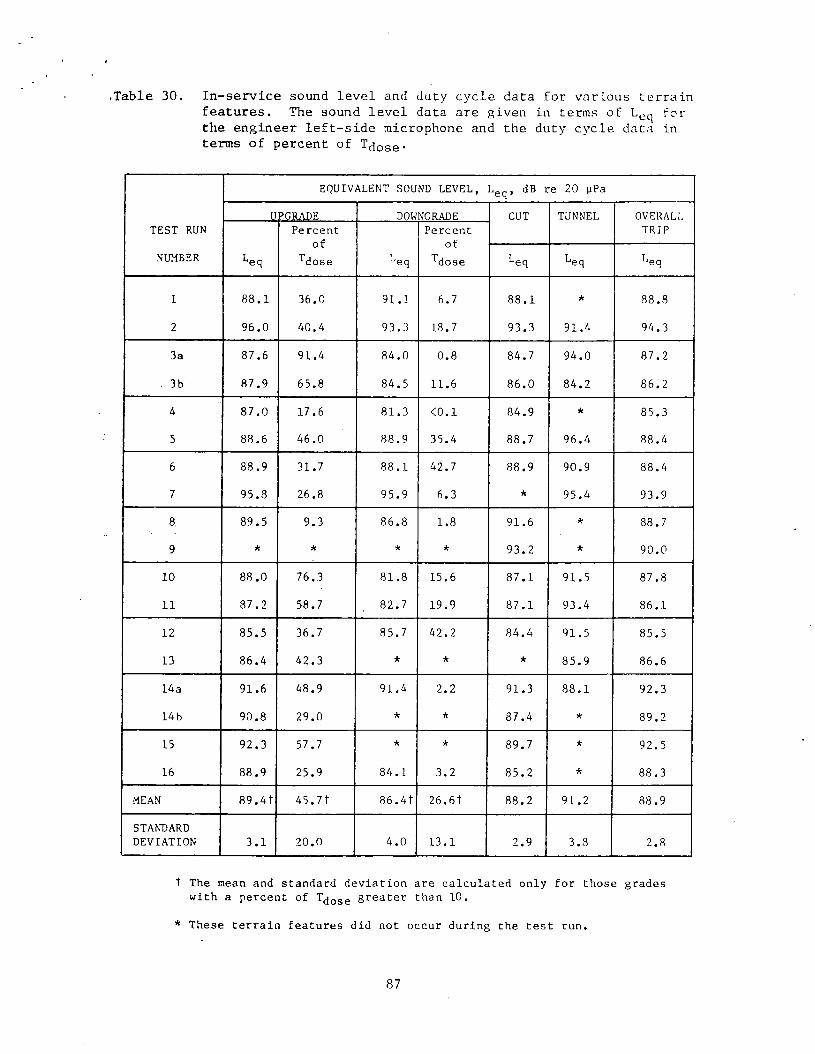
.Table 30. In-service sound level and duty cycle data for various terrain features. The sound level data are given in terms of L0q for the engineer left-side microphone and the duty cycle data in terms of percent of T^ose*
EQUIVALENT SOUND LEVEL, Leq, dB re 20 yPa
UPGRADE DOWNGRADE CUT TUNNEL OVERALLTEST RUN Pe rcent
of"^dose
Percentof
^dose
TRIP
NUMBER ^eq ^eq ^eq IJeq Jeq
1 88.1 36.0 91.1 6.7 88.1 * 88.8
2 96.0 40.4 93.3 18.7 93.3 91.4 94.3
3a 87.6 91.4 84.0 0.8 84.7 94.0 87.2
. 3b 87.9 65.8 84.5 11.6 86.0 84.2 86.2
4 87.0 17.6 81.3 <0.1 84.9 * 85.3
5 88.6 46.0 88.9 35.4 88.7 96.4 88.4
6 88.9 31.7 88.1 42.7 88.9 90.9 88.4
7 95.8 26.8 95.9 6.3 * 95.4 93.9
8, 89.5 9.3 86.8 1.8 91.6 * 88.7
9 * * * k 93.2 * 90.0
10 88.0 76.3 81.8 15.6 87.1 91.5 87.8
11 87.2 58.7 82.7 19.9 87.1 93.4 86.1
12 85.5 36.7 85.7 42.2 84.4 91.5 85.5
13 86.4 42.3 * * * 85.9 86.6
14a 91.6 48.9 91.4 2.2 91.3 88.1 92.3
14b 90.8 29.0 * k 87.4 * 89.2
15 92.3 57.7 k k 89.7 * 92.5
16 88.9 25.9 84.1 3.2 85.2 k 88.3
MEAN 89.4t 45.71 86.41 26.61 88.2 91.2 88.9
STANDARDDEVIATION 3.1 20.0 4.0 13.1 2.9 3.8 2.8
t The mean and standard deviation are calculated only for those grades with a percent of T^Qgg greater than 10.
* These terrain features did not occur during the test run.
87

The effect of grade is, as might ho expected, higher sound levels for upgrade operations when the engine is pulling, and lower sound levels for downgrade operations when the engine Is not pulling. The difference between these mean values Is not a true Indication of the effect of grade in an absolute sense because the equivalent sound levels for grade operations include other
locomotive operations such as horn soundings and radio receptions and terrain features such as cuts or tunnels. An even more important factor in
assessing the effect of grade relates to the length of the train relative to
the length of the grade. Since the train can be over a mile long, it is comnon for the lead locomotive to have crested a hill and be going downgrade
while most of the train is still on an upgrade. In this case, even though the locomotive is on a downgrade, it is still pulling the train upgrade.This would be especially true in general undulating terrain where the grade is changing frequently. In such a case, the in-cab sound levels are unlikely to be related to the grade upon which the lead locomotive is operating.
A more appropriate parameter might be drawbar force, which would give a'bet
ter indication of how hard the locomotive is pulling. Unfortunately, it was
not possible to monitor drawbar force for these test runs.
The general effect of cuts and tunnels is to increase the in-cab sound
levels because of sound reflections from the walls and/or ceilings. The
data in Table 30 indicate that cuts have only a small effect on in-cab sound levels. This is due to the general engineering practices used in excavating
cuts. To prevent earth and rock from sliding onto the tracks the cuts are normally sloped away from the track or cut hack far enough so that if there is an earth or rock slide, it will not fall on the tracks. As a result, the reflected sound is directed away from the locomotive or is insignificant
88
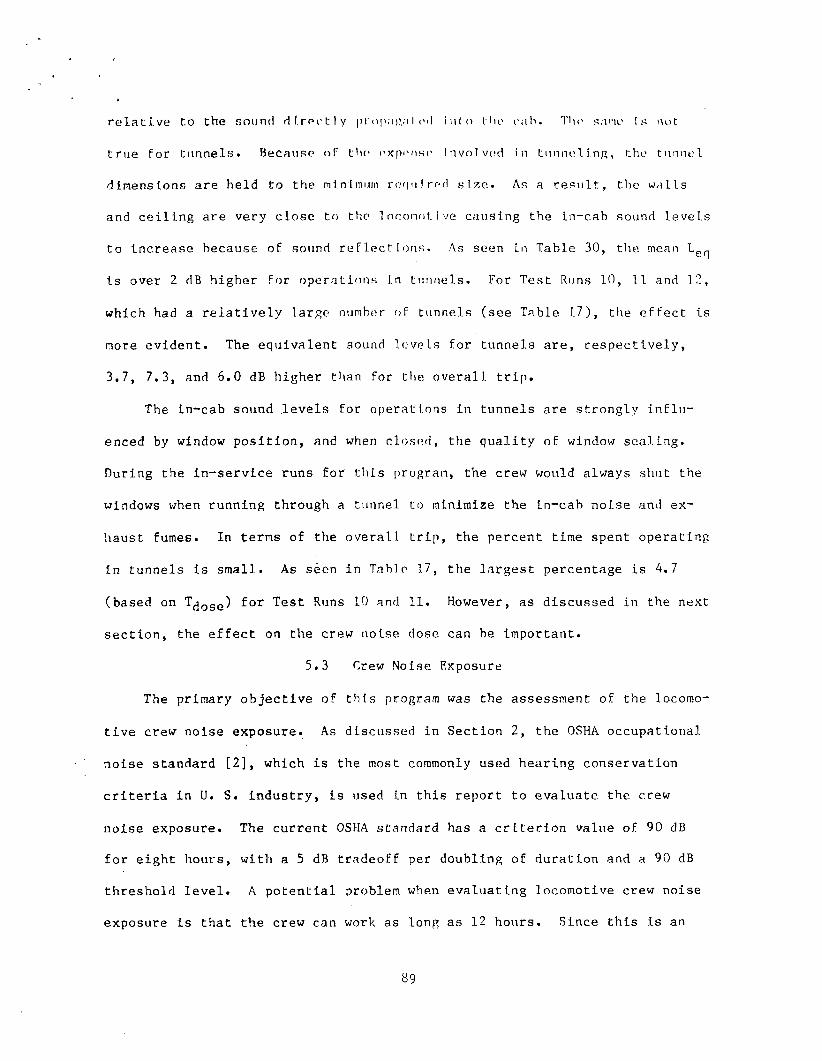
relative to the sound directly propng.'i 1 cil i n1o the call. The sane Is no t
true for tunnels. Because of t■ho expense i nvolvud in tunneling, the t.unne 1dimensions are held to the minimum roqn I red size. As a result, the walls and ceiling are very close to the locomotive causing the in-cab sound levels to increase because of sound reflections. As seen in Table 30, the mean Lerj is over 2 dB higher for operations in tunnels. For Test Runs 10, 11 and 12,
which had a relatively large number of tunnels (see Table 17), the effect is
more evident. The equivalent sound levels for tunnels are, respectively,
3.7, 7.3, and 6.0 dB higher than for the overall trip.The in-cab sound levels for operations in tunnels are strongly influ
enced by window position, and when closed, the quality of window sealing. During the in-service runs for this program, the crew would always shut the windows when running through a tunnel to minimize the in-cab noise and ex
haust fumes. In terms of the overall trip, the percent time spent operating in tunnels is small. As seen in Table 1.7, the largest percentage Is 4.7
(based on Tjjose) for Test Runs 10 and 11. However, as discussed in the next section, the effect on the crew noise dose can he important.
5.3 Crew Noise Exposure
The primary objective of this program was the assessment of the locomo
tive crew noise exposure. As discussed in Section 2, the OSHA occupational
noise standard [2], which is the most commonly used hearing conservation criteria in U. S. industry, is used in this report to evaluate the c.rew
noise exposure. The current OSHA standard has a criterion value of 90 dB for eight hours, with a 5 dB tradeoff per doubling of duration and a 90 dB threshold level. A potential problem when evaluating locomotive crew noise exposure is that the crew can work as long as 12 hours. Since this is an
89

atypical work schedule relative to most II. S. industries, there are no legally established procedures for dealing with this case.
A more recently regulation on in-cab locomotive noise [8] recommend
[7] and an FRA proposed regulation on In-cab locomotive noise [8] recommend the use of the existing OSHA relationship between sound level and exposure
time with the threshold level reduced to 85 dB (at 16 hours), i.e. all sound levels above 85.dB are included in the noise exposure calculation.
The noise exposure assessments made in this study are based on the current OSHA standard utilizing a threshold level of 90 dB (although calcula
tions of the noise dose are also made for this and other criteria).The crew noise exposures are calculated from the binned data as dis
cussed in Section 5.2. Since these data cover only the periods when the
tape recorder is operating (column B of Table 16), the binned data are scaled by the tape changing and calibration time (column C of Table 16) so that
the calculated noise exposure corresponds to T^gg — the time the locomo
tive is actually operating and likely to be generating sound levels greater
than 90 dB. This scaling merely involves multiplying the time at a parti
cular sound level (the binned values in seconds) by the ratio of the effec
tive crew dose time, T^ggg, to the time the tape recorder is operating (column B of Table 16). Scaling by this technique assumes that the in-cab sound levels during the time the tapes are being changed and calibrated are
statistically distributed the same as the sound levels for the overall trip. Since the types of locomotive operations that occurred during these times were not controlled and to an effect were random, this assumption appears to be reasonable.
90

5.3.1. Spatial Variation in the Cab As discussed in Section 5.2.1, the sound levels do vary somewhat with
position in the cab because of the nonsymmetrical location of sources. However, two-way analysis of variance showed that at the 95 percent confidence level there were no statistically significant differences in sound level among the four fixed microphone locations, except for brake applications.
The same is also true for the crew noise exposure. The in-service noise exposures for the overall trip are listed in Table 31 for the 18 test runs.
These noise exposures are based on T^ggg and calculated using the current OSHA standard. Again using two-way analysis of variance, there is no statistically significant difference at the 95 percent confidence level among
the noise exposures measured at the four fixed microphone locations. Thus,
as in Section 5.2., only data for the engineer left-side microphone are presented for discussion of the crew noise exposure.
5.3.2. Crew Noise Exposure for the Overall Trip The overall crew noise exposures presented in Table 31 show that there
is only one case where the dose is greater than the maximum allowable value
of 1.0 (see Equation (2) and subsequent discussion in Section 2). This
occurs for Test Run 2 and only for the engineer right-side microphone.10
1®As detailed in Appendix A, the locomotive on Test Run 2 was an END GP9, manufactured in 1957, with a 1750 horsepower engine. because of its low horsepower and age, this unit wasn’t normally used for over-the-road runs. It was used in this case because the NBS test personnel specifically requested this particular model of locomotive and this was the only unit available. The train on this run consisted of 110 cars weighing 6403 tons. During the trip the second unit in the consist developed electrical problems and was shut down. Thus, this test run represented the case of a relatively heavy train which, after losing the second unit, was undei— powered. As a result, the test locomotive was forced to operate under - adverse conditions for which it would not normally be used. However, since similar shut-downs can occur in regular service, this does illustrate that there can be cases where overexposure to noise occurs.
91

Table 31. In-service noise exposure data calculated using theOSHA criteria. These values are for the overall trip based on T^ggg for the four fixed microphone locations.
TEST RUN CREW NOISE EXPOSURE
NUMBER ERS ELS BRS BLS1 0.20 0.17 0.18 N/A2 .1.02 0.81 0.86 0.91
3a 0.07 0.07 0.10 0.08
3b 0.09 0.06 0.12 0.09
4 0.02 0.02 0.01 0.02
5 0.11 0.13 0.12 0.16
6 0.14 0.16 0.09 0.12
7 0.55 0.45 0.27 0.33
8 0.16 0.12 0.09 0.10
9 0.12 0.13 0.06 0.07
10 0.15. 0.16 0.15 0.14
11 0.09 0.08 0.08 0.14
12 0.08 0.09 0.08 0.06
13 0.08 0.07 0.06 0.06
14a 0.43 0.35 0.39 0.40
14b 0.02 0.02 0.02 0.02
15 0.35 0.34 0.32 0.46
16 0.13 0.10 0.07 0.10
MEAN 0.21 0.19 0.17 0.19
STANDARDDEVIATION 0.25 0.20 0.20 0.22
RANGE 0.02 - 1.02. 0.02 - 0.81 0.01 - 0.86 ' 0.02 - 0.91
N/A - Data are not available.ERS - Engineer right-side microphone BRS - Brakeman right-side microphoneELS - Engineer left-side microphone BLS - Brakeman left-side microphone
<
92

Examination of the results for the other test runs shows that there are no
other cases where the maximum allowable dose (based on the OSHA standard) is even close to being exceeded. This might appear to be due primarily Co the fact that for the 18 test runs Tciose was normally much less than eight hours. However, if the crew noise exposures for each of the 18 test runs are scaled to an exposure time of eight hours, in a manner similar to that described earlier in this section, it is found (see Table 32) that even for these increased exposure times there would only be one additional locomo
tive which exceeds the allowable noise dose. Examination of the eight-hour scaled noise exposures for the overall trip (based on the data from the en
gineer left-side microphone) shows that only the locomotives on Test Runs 2 and 7 would exceed a noise dose of 1.0 for an eight-hour exposure time.Thus, based on the current OSHA standard', it. does not appear that overex
posure to noise is a widespread problem for locomotive crews.
The other criterion specified in the OSHA standard is that the sound level shall at no time exceed 115 dB (A-weighted, slow response). Table 33
lists the maximum sound levels (minimum duration at at least 1.0 s) which
were measured for in-service horn soundings, brake applications and the
overall trip. Examination of this table shows that only the locomotive on Test Run 2 had a measured sound level greater than 115 dB. This sound level was measured at the brakeman right-side location during a brake application. This value is substantially higher than the sound level measured during the
stationary tests (105.2 dB from Table 25). This increase in sound level may be due to a difference of brake pipe pressure between the stationary and in-service tests, or to some additional source unaccounted for during the in-service run.
93
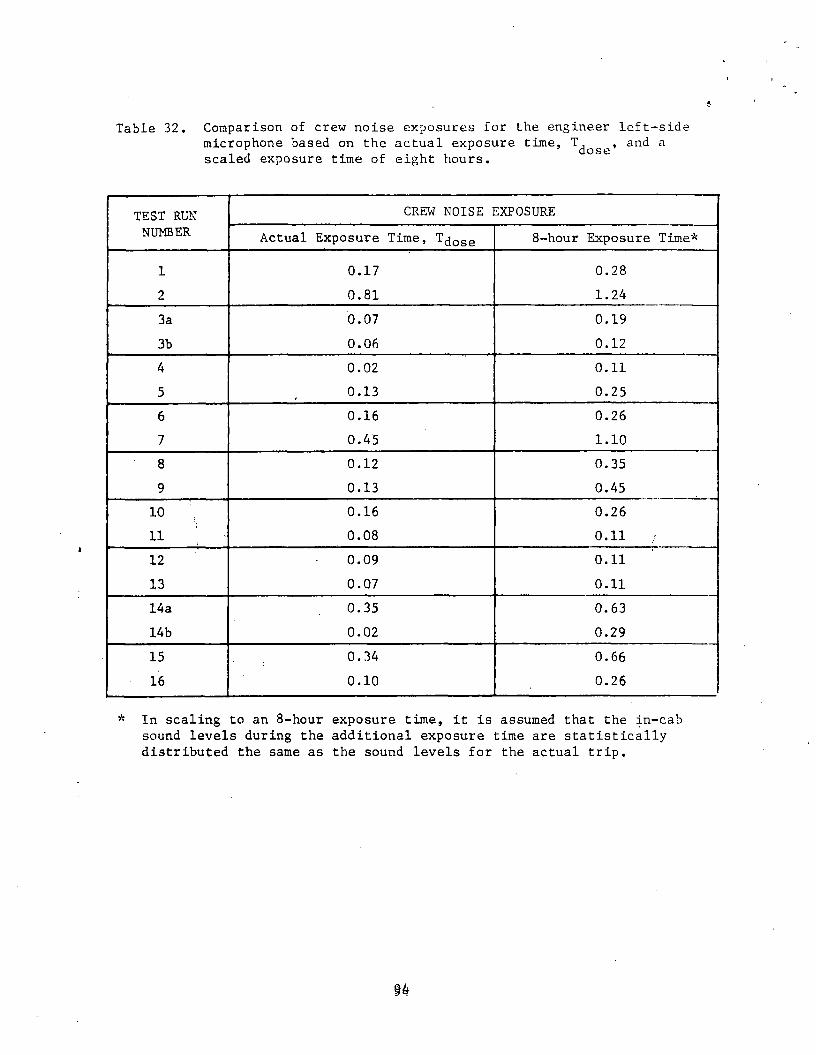
Table 32. Comparison of crew noise exposures for the engineer left-side microphone based on the actual exposure time, , and ascaled exposure time of eight hours.
TEST RUN CREW NOISE EXPOSURENUMBER Actual Exposure Time, T^ggg 8-hour Exposure Time*
1 0.17 0.282 0.81 1.243a 0.07 0.193b 0.06 0.124 0.02 0.115 0.13 0.256 0.16 0.267 0.45 1.108 0.12 0.359 0.13 0.4510 0.16 0.2611 0.08 0.1112 0.09 0.1113 0.07 0.1114a 0.35 0.6314b 0.02 0.2915 0.34 0.6616 0.10 0.26
* In scaling to an 8-hour exposure time, it is assumed that the in-cab sound levels during the additional exposure time are statistically distributed the same as the sound levels for the actual trip.

Table 33. Maximum A-weighted sound levels (slow response), in decibels, for horn soundings, brakeapplications and the overall trip. These values are based on a minimum duration of 1.0 s.
TT7CT DTT\T. ENGINEER RIGHT-SIDE ENGINEER LEFT-SIDE BRAKEMAN RIGHT-SIDE BRAKEMAN LEFT-SIDENUMBER Horn Brake Overall Horn Brake .Overall Horn Brake Overall Horn Brake Overall
1 106 101 106 103 101 103 107 99 107 100 98 1002 108 114 114 105 114 114 107 115 115 n o 113 1133a 96 103 103 97 104 104' 97 102 102 99 101 101 43b 103 105 105 103 106 106 97 103 103 97 102 1024 99 105 105 97 105 105 97 99 100 99 * 995 108 104 108 105 105 106 113 102 113 113 101 1136 107 104 107 108 105 108 105 97 105 108 96 1087 109 105 109 108 104 108 111 102 111 111 101 1118 102 103 107 104 104 105 103 103 103 103 101 1049 104 98 104 104 100 104 100 85 100 100 85 100'10 103 95 103 103 96 103 99 94 102 99 92 10011 95 101 101 92 101 102 93 96 97 95 96 9812 105 94 105 107 98 107 98 98 101 97 95 9913 103 99 103 102 100 102 102 97 102 101 96 10214a 104 109 109 102 108 108 100 104 104 101 103 10514b 99 + 99 99 + 99 100 + 100 95 + 9515 106 110 110 105 109 109 101 104 104 102 104 10416i 109 + 109 110 + n o 99 + 100 98 + 100
* This microphone channel was not operational during the brake applications.
+ The only major brake application was made when stopping the train in the yard at the final destination. This occurred after the test equipment had been disassembled.
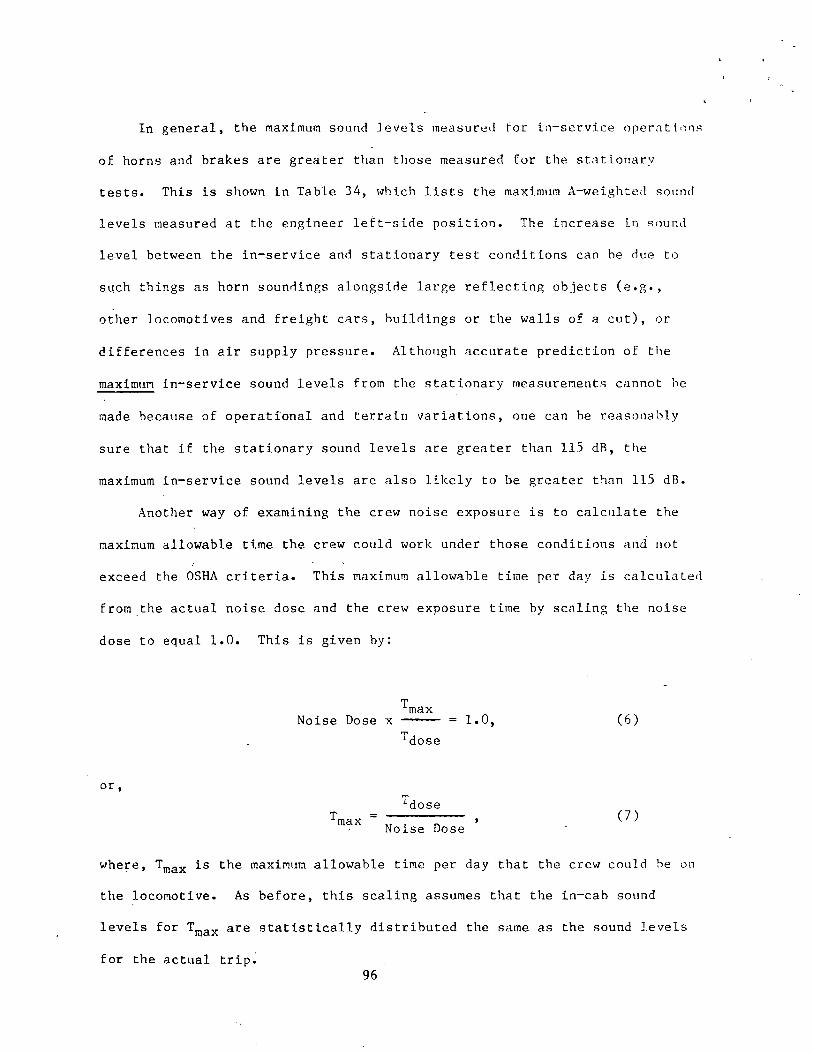
In general, the maximum sound levels measured tor in-service operations
of horns and brakes are greater than those measured for the stationary tests. This is shown in Table 34, which lists the maximum A-weighted sound levels measured at the engineer left-side position. The increase in sound level between the in-service and stationary test conditions can be due to such things as horn soundings alongside large reflecting objects (e.g.,
other locomotives and freight cars, buildings or the walls of a cut), or
differences in air supply pressure. Although accurate prediction of the maximum in-service sound levels from the stationary measurements cannot be
made because of operational and terrain variations, one can be reasonably
sure that if the stationary sound levels are greater than 115 dB, the
maximum in-service sound levels are also likely to be greater than 115 dB.Another way of examining the crew noise exposure is to calculate the
maximum allowable time the crew could work under those conditions and not exceed the OSHA criteria. This maximum allowable time per day is calculated from the actual noise dose and the crew exposure time by scaling the noise
dose to equal 1.0. This is given by:
Noise Dose x max = 1.0, (6)^dose
or,Ldose
max • r, ’Noise Dose (7)
where, Tmax is the maximum allowable time per day that the crew could he on the locomotive. As before, this scaling assumes that the in-cab sound levels for Tmax are statistically distributed the same as the sound levels
for the actual trip.96

' Table 34. Comparison of the maximum A-weighted sound levels forstationary and in-service measurements of horn and brake applications. These data are for the engineer left-side microphone.
MAXIMUM A-WEIGHTED SOUND LEVEL, dB re 20 yiPa
TEST RUN NUMBER
HORN BRAKEStationary* In-Service+ Stationary In-Servicet
1 104.2 103 101.7 1012 103.0 105 105.2* 1143a 96.3 97 103.6 1043b 96.3 103 103.6 1064 100.8 97 102.4 1055 96.9 105 101.0 1056 102.5 108 103.0 1057 105.2 108 103.4 1048 95.3 104 102.1 1049 96.5 104 100.2* 10010 102.9 103 87.1 9611 101.8 • 92 83.9 10112 99.4 107 90.0 9813 98.2 102 97.9* 100 .14 a 99.0 102 102.5 10814b 99.0 99 102.5 *.*15 103.0 105 105.2* 10916 101.4 110 96.2* **
MEAN 100.4 103.0 99.6 103.8
STANDARDDEVIATION 3.1 4.5 6.6 4.4
RANGE 95.3 - 105.2 92 - 110 83.9 - 105.2 96 - 114
+ Maximum values from binned data (1 dB bins)* Locomotive cab windows open** The only major brake application was made when stopping the train in
the yard at the final destination. This occurred after the test equipment had been disassembled.
97

Using this Tjnax, an equivalent noise exposure level can be calculated. This level corresponds to the equivalent continuous sound level which would result in the same noise exposure as the actual time-varying sound level for
an exposure time equal to For this to be strictly true, it isnecessary to assume that there is no threshold level and that exposure to all sound levels contributes to the noise dose. For the current OSHA stan
dard, the equivalent noise exposure level is found by solving Equation (1) for L and substituting Tmay for T, which gives:
lOSHA = “ 16*61 lo8i0 Tmax + 105‘ <8)Table 35 lists the maximum times per day and the equivalent exposure levels
based on the engineer left-side microphone data for the 18 test runs. These values indicate that overexposure to noise based on the OSHA criteria is likely to'occur only on the locomotives on Test Runs 2 and 7. This is true if the crew is on-board for a period of time greater than Tmax and the loco
motive operational duty cycle does not change drastically from what it was during the test run. This is the same conclusion drawn earlier from Table
32, except that it shows more dramatically that overexposure to noise based
on the current OSHA standard is unlikely to occur on most locomotives. However, as discussed in the following section, this conclusion can change if
different hearing conservation criteria are used.
5.3.3. Crew Noise Exposure for Alternative Criteria In terras of the overall crew noise exposure, there is one more factor
to consider. If, in the future, new or modified hearing conservation criteria are adopted, will locomotive crew noise exposures exceed these crtieria? Table 36 lists the noise exposures for the 18 test runs calculated using various schemes. These values are based either on the OSHA criteria or the proposed NIOSH criteria with various threshold levels
98
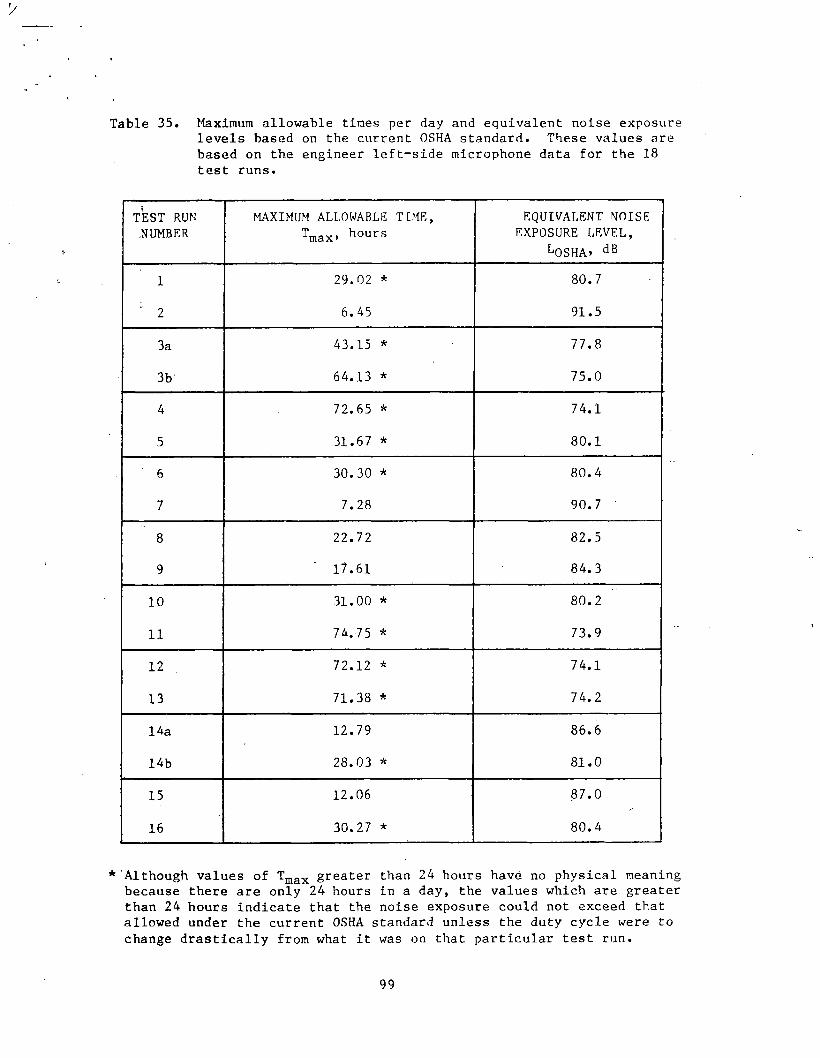
Table 35. Maximum allowable times per day and equivalent noise exposure levels based on the current OSHA standard. These values are based on the engineer left-side microphone data for the 18 test runs.
TEST RUN .NUMBER
MAXIMUM ALLOWABLE TIME, Tmax» hours
EQUIVALENT NOISE EXPOSURE LEVEL,
l0SHA> dB1 29.02 * 80.7
' 2 6.45 91.5
3a 43.15 * 77.8
3b' 64.13 * 75.0
4 72.65 * 74.1
5 31.67 * 80.1
6 30.30 * 80.4
7 7.28 90.7
8 22.72 82.5
9 17.61 84.3
10 31.00 * 80.2
11 74.75 * 73.9
12 72.12 * 74.1
13 71.38 * 74.2
14a 12.79 86.6
14b 28.03 * 81.0
15 12.06 87.0
16 30.27 * 80.4
* Although values of Tmax greater than 24 hours have no physical meaning because there are only 24 hours in a day, the values which are greater than 24 hours indicate that the noise exposure could not exceed that allowed under the current OSHA standard unless the duty cycle were to change drastically from what it was on that particular test run.
99

Table 36. Actual crew noise exposures for the 18 test runs calculated usingalternative hearing conservation criteria. These values arebased on the data from the engineer left-side microphone.
Criterion Value: 90 dB at 8 hours Trade-off Rate: 5 dB
per doubling of duration
Criterion Value: 85 dB at 8 hours Trade-off Rate: 5 dB
per doubling of duration
TEST RUN NUMBER
Threshold Level Threshold Level90 dBa 87 dBb 85 dBC 85 dB 82 dBb 80 dBd
1 0.17 0.26 0.28 0.57 0.65 0.682 0.81 0.86 0.89 1.78 1.81 1.833a 0.07 0.13 0.15 0.31 0.39 0.413b 0.06 0.08 0.10 0.21 0.29 0.364 0.02 0.02 0.03 0.06 0.09 0.105 0.13 0.21 0.27 0.53 0.61 0.646 0.16 0.21 ? 0.28 0.55 0.63 0.677 0.45 0.50 0.51 1.02 1.04 1.068 0.12 0.15 0.19 0.38 0.43 0.449 0.13 0,14 0.17 0.34 0.39 0.3910 0.16 0.19 - 0.24 0.48 0.68 0.7011 0.08 0.13 0.28 0.57 0.65 0.7112 0.09 0.13 0.18 0.36 0.63 0.7213 0.07 0.11 0.18 0.36 0.60 0.6514 a 0.35 0.45 0.49 0.99 1.07 1.0914 b 0.02 0.03 0.05 0.09 0.10 0.1015 0.34 0.42 0.48 0.96 1.03 1.0616 0.10 0.16 0.22 0.45 0.50 0.52
Current OSHA standard (8-hour work period) [2].^Threshold point for 12-hour work period.Proposed modification to OSHA standard [7] and current FRA standard.
Proposed NIOSH criteria [9].
100

corresponding to 8 or 12 hour work periods. Values for the latest proposed
revision to the OSHA standard [7] and the current FRA in-cab locomotive
noise regulation [8] are also listed.
Examination of this table shows that for the 18 test runs there are no
cases of overexposure to noise when the criterion value is 90 dB at 8 hours,
regardless of the threshold level. When the criterion value is reduced to
85 dB at 8 hours with a threshold level of 85 dB, the noise doses for the
locomotives on Test Runs 2 and 7 exceed the allowable limit of 1.0. If the
threshold level is lowered to 80 dB (corresponding to the proposed NIOSH
criteria [9]), the noise doses for the locomotives on Test Runs 14 and 1.5
also are greater than 1.0.
The differences among these various methods of calculating the crew
noise exposure are best illustrated by Tmax, the maximum allowable time per
day that the crew could operate the locomotive without exceeding a noise
dose of 1.0. These values of Tmax are given in Table 37 along with the
equivalent noise exposure levels. For shorthand purposes, the equivalent
noise exposure levels are expressed as:
^x-y-z >where,
x = threshold level for including values in the dose calculation,
y = the tradeoff rate (5 dB per doubling of duration for OSHA and proposed NIOSH criteria), and
z = criterion value (90 dB at 8 hours for OSHA and 85 dB at 8 hours for proposed NIOSH criteria).
For example, L^7_5_gg would be for the current OSHA criterion value, but
with the threshold level set at 87 dB, corresponding to a 12-hour work
period. For a criterion value of 90 dB at 8 hours with a 5,dB per doubling
101
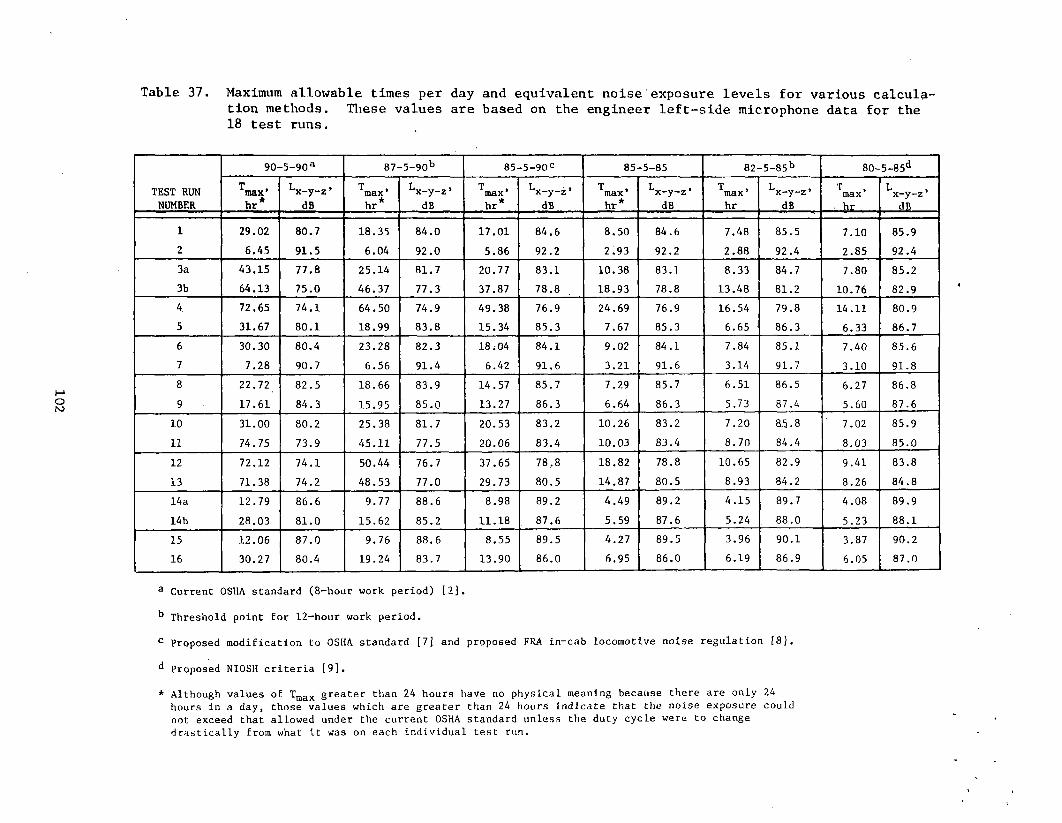
102
Table 37. Maximum allowable times per day and equivalent noise exposure levels for various calculation methods. These values are based on the engineer left-side microphone data for the 18 test runs.
90--5-90a 87--5-90b 85--5-90c 85--5-85 82--5-85b 80- T3 |mCD ! 1m 1
TEST RUN Tmax’ bx-y-z’ Tmax' Lx-y-z * Tmax Lx-y-z * Tmax* Lx-y-z’ T , max' ^x-y-z’ Tmax Lx-y-zNUMBER , *
h r dB *hr dB i_ *hr dB hr* dB hr dB _ hr dB1 29.02 80.7 18.35 84.0 17.01 84.6 8.50 84.6 7.48 85.5 7.10 85.92 6.45 91.5 6.04 92.0 5.86 92.2 2 . 9 3 92.2 2.88 92.4 2.85 92.43a 43.15 77.8 25.14 81.7 20.77 83.1 10.38 83.1 8.33 84.7 7.80 85.23b 64.13 75.0 46.37 77.3 37.87 78.8 18.93 78.8 13.48 81.2 10.76 82.94 72.65 74.1 64.50 74.9 49.38 76.9 24.69 76.9 16.54 79.8 14.11 80.95 31.67 80.1 18.99 83.8 15.34 85.3 7.67 85.3 6.65 86.3 6.33 86.76 30.30 80.4 23.28 82.3 18 ; 04 84.1 9.02 84.1 7.84 85.1 7.40 85.67 7.28 90.7 6.56 91.4 6.42 91.6 3.21 91.6 3.14 91.7 3.10 91.88 22.72 82.5 18.66 83.9 14.57 85.7 7.29 85.7 6.51 86.5 6.27 86.89 17.61 84.3 15.95 85.0 13.27 86.3 6.64 86.3 5.73 87.4 5.60 87.610 31.00 80.2 25.38 81.7 20.53 83.2 10.26 83.2 7.20 85.8 7.02 85.911 74.75 73.9 45.11 77.5 20.06 83.4 10.03 83.4 8.70 84.4 8.03 85.012 72.12 74.1 50.44 76.7 37.65 78,8 18.82 78.8 10.65 82.9 9.41 83.813 71.38 74.2 48.53 77.0 29.73 80.5 14.87 80.5 8.93 84.2 8.26 84.814a 12.79 86.6 9.77 88.6 8.98 89.2 4.49 89.2 4.15 89.7 4.08 89.914b 28.03 81.0 15.62 85.2 11.18 87.6 5.59 87.6 5.24 88.0 5.23 88.115 12.06 87.0 9.76 88.6 8.55 89.5 4.27 89.5 3.96 90.1 3.87 90.216 30.27 80.4 19.24 83.7 13.90 86.0 6.95 86.0 6.19 86.9 6.05 87.0
a Current OSHA standard (8-hour work period) [2].b Threshold point for 12-hour work period.c Proposed modification to OSHA standard [7] and proposed FRA in-cab locomotive noise regulation [8]. d proposed NIOSH criteria [9].* Although values of Tmax greater than 24 hours have no physical meaning because there are only 24 hours in a day, those values which are greater than 24 hours indicate that the noise exposure could not exceed that allowed under the current OSHA standard unless the duty cycle were to change drastically from what it was on each individual test run.

l x-5-90 = -16-61 log1Q Tmax + 105. (9)For a criterion value of 85 dB at 8 hours with a 5 dB per doubling of duration tradeoff, the corresponding relationship is
^x-5-85 = -16-61 log1(J Tmax + 100. (10)As seen in Table 37, Tmax is significantly reduced for the three groups based on a criterion value of 85 dB at 8 hours (last three pairs of columns). For the 80 dB threshold point corresponding to the proposed NIOSH criteria,
Tmax Is less than 8 hours for 11 out of the 16 locomotives. For this latter case (i.e., 80-5-85), the average Tmax for all 16 locomotives is 6.85 hours
(standard deviation of 2.78 hours and range of 2.85 to 14.11 hours).For these particular locomotives and test runs, overexposure to noise
is not a significant problem if the 90 dB criterion value is used. However,
for the proposed NIOSH criteria (80-5-85), 4 out of the 16 locomotives which
were tested, or 25 percent, would have problems with excessive noise.
5.3.4 Comparison of the Crew Noise Exposures for the Fixed
and Lapel Microphones
One of the questions that was considered in developing this program was how the measured noise exposures would compare to results using a noise dosimeter. Although noise dosimeters were not used in this study (see footnote 4, page 42), data were obtained for microphones mounted on the engineer's
and brakeman's shirt lapels in locations similar to that for the microphone of a noise dosimeter. The results obtained from analysis of the data recorded from these microphones are given in Table 38 in terms of the noise dose based on the current OSHA standard. For comparison, the noise expos
ures based on the data from the fixed microphones are also listed.
of duration tradeoff, the equivalent noise exposure level (for any given
threshold level, x) is given by:
103

Table 38. Comparison of the in-service noise exposures based on the current OSHA criteria for the fixed and lapel microphones.
ENGINEER BRAKEMANTEST RUN NUMBER
Right-Side
Left-Side Lapel
Right-Side
Left-Side Lapel
1 0.20 0.17 N/A 0.18 N/A N/A2 1.02 0.81 N/A 0.86 0.91 N/A3a 0.07 0.07 N/A 0.10 0.08 N/A3b 0.09 0.06 N/A 0.12 0.09 N/A4 0.02 0.02 0.01 0.01 0.02 N/A5 0.11 0.13 N/A 0.12 0.16 N/A6 0.14 0.16 N/A 0.09 0.12 N/A7 0.55 0.45 0.51 0.27 0.33 0.358 0.16 0.12 0.23 0.09 0.10 0.149 0.12 0.13 0.24 0.06 0.07 0.17
10 0.15 0.16 0.37 0.15 0.14 0.2111 0.09 0.08 0.23 0.08 0.14 0.2512 0.08 0.09 0.37 0.08 0.06 0.1213 0.08 0.07 0.18 0.06 0.06 0.1214a 0.43 0.35 0.54 0.39 0.40 0.4514b 0.02 0.02 0.06 0.02 0.02 0.0215 0.35 0.34 0.54 0.32 0.46 0.3716 0.13 0.10 0.24 0.07 0.10 0.15
MEAN* 0.18 0.16 0.29 0.14 0.17 0.21STANDARDDEVIATION* 0.17 0.14 0.18 0.12 0.15 0.13
N/A - Data are not available.* The mean and standard deviation values are based on the results for
locomotives 4 and 7 to 16 for the engineer and 7 to 16 for thebrakeman.
104
Examination of Table 38 shows that the results for the lapel microphones are generally higher than those obtained with the fixed microphones. For the engineer the average noise dose is about 70 percent higher for the lapel microphone than for the fixed microphones, and for the brake- man -it is about 35 percent higher (based on the averages for the locomotives which have lapel microphone results available). This increase can be explained by considering the different microphone locations relative to the engineer and brakeman, and the nature of operations in the locomotive cab.
The lapel microphones were mounted on the shirt lapel closest to the center of the cab — the left side for the engineer and right side for the brake-
man. These locations were chosen to minimize the noise which is generated
by wind from the open windows blowing on the microphone. With these locations for the lapel microphones, one would not expect there to be significant, differences between the lapel and fixed microphones for typical locomo
tive noise sources. The one exception where microphone location is impor
tant is when the engineer and brakeman are talking to each other or when
the engineer is using the radio. In either case, when the engineer and brakeman turn their heads toward the. center of the cab to speak, their
mouths are only 2 to 3 inches from the lapel microphones. Since the fixed
microphones may be a foot or more away, particularly when the engineer leans
forward to use the radio, the sound level due to conversation is lower at the fixed microphones because of distance attenuation. This was verified by
listening to several of the tapes and comparing the fixed and lapel microphone channels. For Test Run 12, for example, the engineer was frequently discussing the locomotive's mechanical problems with the brakeman and with the dispatcher via radio. The effect of these conversations can be seen by comparing the noise doses, 0.08 and 0.09 for the engineer's fixed
105
microphones versus 0.37 for the engineer's lapel microphone. The noise exposure based on the brakeman's microphone was only 0.12. This value was lower because the brakeman was not discussing the locomotive's mechanical problem as much as the engineer.
These results may be slightly atypical since some of the conversation was with the NBS test personnel regarding the instrumentation in the cab.On a normal run, there would probably be less talking. Nevertheless, verbal
communication is an important part of the locomotive crew's job. As neces
sary safety precautions the engineer is in frequent contact with the caboose, the dispatcher, wayside personnel and other trains regarding the
movement of the train, and the brakeman is calling out signals. Thus, the
sound levels and calculated noise doses for the lapel microphones would be expected to be slightly higher than the fixed microphones, with the differ
ence dependent upon the amount of conversation that takes place.5.3.5. Effect of Locomotive Operations
s0ne of the secondary objectives of this study was to determine which locomotive sources and/or operations were the primary contributors to the
overall noise dose. Examination of these contributions, which were calcu
lated from the binned data, showed that there were three principal sources contributing to the crew noise exposure. These were horn soundings, brake
applications and the diesel engine. All other sources either generated sound levels less than 90 dB or were of such short duration that they had a
negligible influence on the overall noise dose.
To determine the actual contribution of the diesel engine to the crew noise exposure, the data for the engineer left-side microphone were rebinned so that the engine notch setting bins did not include any values that occurred whenever the horn or brake were operating. This was necessary because
106

the horn and brakes generate sound levels greater than those generated by the engine. The crew noise exposures for these rebinned engine-notch-setting data and the horn and the brake data are given in Table 39. these values show that engine notch 8 and the horn are the two principal operations contributing to the crew noise dose, with some smaller contribution from the
brake11 and from engine notch 1. The average noise dose contributions for engine notch 8 and the horn are about the same, but for different reasons.
Although the sound levels characteristic of engine notch 8 operations are less than those for the horn, the duty cycle data show that the average dura
tion for engine notch 8 operations is seven times greater than it is for horn
soundings. The relative contributions of these two operations to the overall crew noise dose are about equal because of the dependence of the noise dose on duration.
The breakdown of the overall noise dose into three components —
engine, horn and brake — is an important part of the development of the
stationary measurement procedure. This is presented as part of a locomotive screening test discussed in Section 6.
One factor that has not yet been discussed is the effect on the calculated noise dose of neglecting horn or brake applications which may have oc
curred when the recorder was not operating. This occasionally occurred nea.r
the end of a test run after the instrumentation had been disassembled. Disassembly of the instrumentation was necessary due to operational constraints such as the train continuing on to another destination or test personnel and 1
1^he one exception to this was Test Run 14a. During this run there was a problem with the brake system which was causing the brakes to stick on. Several times during the run the engineer vented the brake pipe system, almost to full service, and then re-pressurized it in an effort to release the brakes. These additional, relatively long, brake applications resulted in a corresponding increase of the brake contribution to the overall noise dose.
107

Table 39. Relative contributions from various locomotive operations to theoverall crew noise dose. These data are for the engineer left-side1 microphone.
CONTRIBUTIONS TO THE NOISE DOSE BY SOURCE
TEST RUN NUMBER
ENGINE NOTCH'SETTING OVERALLNOISEDOSE1 2 3 4 5 6 7 8 HORN BRAKE
1 0.03 0 0 0.01 0 0 0.01 0.01 0.07 0.03 0.17
2 0.06 0.02 0.03 0.02 0.03 0.04 0.03 0.44 0.08 0.05 0.81
3a 0 0.01 0 0 0 0.01 0 0 0.01 0.02 0.07
3b 0 0 0.01 0.01. 0.01 0 0 0 0 0.02 0.06
4 0 0 0 0 0 0 0 0 0 0.01 0.02
5 0.02 0.01 0 0 0 0 0 0.04 0.03 0.02 0.13
6 0 0 0.02 0.01 0 0.01 0.02 0.05 0.04 0.01 0.16
7 0.06 0.02 0.02 0.02 0.01 0.01 0.01 0.18 0.11 0.01 0. 45
8 0.02 0 0.01 0 0 0 0 0.02 0.06 0.01 0.12
9 0.01 0.01 0 O’ 0 0 0 0.04 0.06 0 0.13
.10 0 0.01 0.01 0 0 0 0 0.10 0.03 0 0.16
11 0 0 0 0 0 0 0 0.06 0 0 0.08
12 0.01 0 0 0 0 0 0 0.04 0.03 0 0.09
13 • 0.01 0 0 0 0 0 0 0.01 0.05 0 0.07
14a 0.01 0 0 0 0.01 0 0.01 0.07 0.10 0.14 0. 35
14b 0 0 0 0 0 0 0 0.01 0.01 0 0.02
15 0.01 0 0 0 0 0 0 0.02 0.27 0.02 0.34
16 0 0 0 0 0 0 0 0.03 0.05 0 0.10
MEAN 0.01 0.00 0.00 0.00 0.00 0.00 0.00 0.06 0.06 0.02 0.18
STANDARDDEVIATION 0.02 0.01 0.01 0.01 0.01 , 0.01 0.01 0.10 0.06 0.03 0.20
108

equipment being dropped off at an intermediate location instead of at the
yard. In such cases this disassembling was normally done as soon as the
locomotive entered the yard or within 3 to 5 miles of an intermediate drop
off point if the locomotive consist was to continue on with another crow.
The small segment of time, for which the sound levels were not recorded,
consisted primarily of operations at low notch settings, perhaps one or two
very short horn soundings, and the final brake application to stop the
train. Since the engine operations were at low notch settings and the horn
soundings were of very short duration, the brake application was the only
operation not recorded which might be of any significance. Assuming a
steady sound level of 95 dB for one minute (typical values based on this
study and existing data), the contribution to the noise dose would be less
than 0.01. Since this contribution is small and is partially accounted for
by scaling the exposure time to T^ose, the error introduced is considered to
be negligible. Thus, no special calculations for these operations are
necessary to maintain sufficient accuracy in determining the overall crew
noise exposure or the relative contribution of the horn and brake to the
noise dose.
5.3.6. Effect of Terrain Features
Unlike locomotive operations, the effects of terrain features on crew
noise exposure are not as easy to discern. This difficulty results for two
reasons: (1) the data binned for terrain features include other locomotive
operations, such as horn soundings and brake applications, and (2) equival
ent periods of time were not spent on each type of terrain so that the in
fluence of duration outweighs any differences due to sound level. However,
some general conclusions can be made.
109

Examination of the data given in Table 40 for various types of terrain
shows that for upgrade and downgrade operations and cuts, the noise dose is
primarily a function of duration and not the terrain; i.e., the more
time spent on a particular type of grade or in a cut, the larger the per
centage of the contribution to the overall noise dose. The locomotive on
Test Run 6, for example, spent approximately 32 percent of the time on up
grade terrain and 43 percent on downgrade terrain. The breakdown of the
overall noise dose corresponds almost exactly to this: 0.05 divided by the
total noise dose of 0.16, or 31 percent for upgrade terrain and 0.07 divided
by 0.16, or 44 percent for downgrade terrain. The results for the other
test runs do not agree as well as this, but the general trend is the same.
Tunnels, on the other hand, can have A significant influence on the
overall noise dose. This is shown by the results given in Table 40 for Test
Runs 10, 11 and 12, which had a relatively large number of tunnels. The
primary factor controlling the noise dose for tunnel operations in these
three test runs is, however, not duration (although it is obviously impor
tant) but rather the increase of in-cab sound levels which results when the
locomotive runs through a tunnel (see Section 5.2.3). This can be seen by
examining the duty cycle data given in Tables 17. Although the percent times
spent operating in tunnels are less than 5 percent for these three test
runs, the relative contributions to the overall noise dose are approximately
18, 63 and 11 percent, respectively. As shown by this, it is important that
the cab windows be well sealed and closed when operating in tunnels to mini
mize this contribution to the noise dose.
110

Table 40. Relative effect of various terrain features on the overall crew noise exposure. These data are for the engineer left-side microphone.
CONTRIBUTIONS TO THE NOISE DOSE BY TERRAIN FEATURE
UPGRADE DOWNGRADE CUT TUNNEL OVERALL
TEST RUN Noise % of Noise % of Noise % of Noise % of NoiseNUMBER Dose dose Dose dose Dose dose Dose dose Dose
1 0.02 29.3 0.03 11.1 0 2.3 0 0 0.17
2 0.54 40.4 0.09 18.7 0.03 3.4 0 0.1 0.81
3a 0.06 91.4 0 0.8 0 5.3 0 0.3 0.07
3b 0.03 65.6 0.01 11.7 0.01 20.6 0 2.2 0.06
4 0.01 17.8 0 0 0 3.4 0 0 0.02
5 0.06 45.9 0.06 35.5 0.01 7.2 0 0.2 0.13
6 0.05 31.7 0.07 42.6 0.01 8.2 0 0.4 0.16
7 0.14 26.8 0.04 6.3 0 0 0 0.1 0.45
8 0.01 9.1 0 1.7 0 0.1 0 0 0.12
9 0 0 0 0 0 0 0 0 0.12
10 0.13 76.4 0 15.6 0.03 22.0 0.03 4.7 0.16
11 0.07 58.8 0 19.9 0.02 17.9 0.05 4.7 0.08
12 0.03 ' 36.7 0.04 42.2 0 9.6 0.01 1.2 0.09
13 0.03 42.4 0 0 0 0 0 0.1 0.07
14a 0.14 48.9 0.01 2.2 0.01 2.6 0 0.1 0.35
14b 0.01 29.0 0 0 0 1.4 0 0 0.02
15 0.19 57.7 0 0 0.01 4.2 0 0 0.34
16 0.03 25.9 0 3.2 0 2.4 0 0 0.10
111
5.4. Summary and Conclusions
This study was designed to investigate and assess typical in-cab diesel
locomotive noise environments in terms of crew noise exposure. In addition,
the effects of different locomotive operations and terrain features on the
in-rcab noise environment were to be determined. A field test program was
conducted to provide the necessary information. Eighteen test runs (16
locomotives, two of which had two crews) were made. These 16 locomotives
covered a range of locomotive models representing over 80 percent of the
types found in the current U. S. locomotive fleet population. The 18 test
runs covered a wide range of operational conditions (high speed through-
freights, slow speed drag-freights, local transfer movements, etc.), varied
terrains (mountainous, flat, undulating,), and varied trip lengths (6 to 12
hours). The data obtained from the program consisted of operational duty
cycle information and in-cab sound level data. These were used to evaluate
the crew noise exposure in terms of the OSHA noise dose (and other alterna
tive criteria) and to determine which locomotive operations and/or terrain
features significantly affected the noise exposure. The major results of
the investigation and evaluation are:
■ The operational duty cycle varies widely from run to run, and even from day to day over the same route depending upon the type of train, the train weight, the amount of traffic on the route and whether there are any cars to be picked up or set off or unscheduled stops because of mechanical problems.
■ While the train is underway, approximately 40 percent of the time is spent in notch 8, 25 percent at idle/notch 1, and the remaining35 percent distributed about equally among notches 2 through 7.
■ Inclusion of the time that the train is standing and not operating on-line increases the average time spent at idle/notch 1 to almost 62 percent and reduces the average notch 8 time to 20 percent with the remaining 18 percent in notches 2 to 7. Thus, during a good portion of the time the crew is in the cab, the locomotive is hein?' operated such that the engine noise levels ace likely to be below 90 dB.
112
■ In general, the sound.levels are not a significant function of spa- . tial location inside the locomotive cab. The sound generated byventing the brake pipe is the one exception to this. The highest sound levels for the brake occur at the engineer left-side microphone location which is nearest to the brake pipe vent.
■ The three principal sources of in-c.ab locomotive noise are the diesel engine, horn and brake. The radio is also important, but the sound levels it generates vary as a function of both the in-cab sound levels due to the diesel engine and the personal listening preference of each engineer. Other sources, such as the bell, warning alarms, and dynamic brake, either have little influence on the in-cab sound levels or occur very infrequently.
■ Both the stationary and in-service data show that the in-cab sound levels increase with notch setting. Based on linear regression analysis of the mean values for the 16 test locomotives, the sound level increases approximately 1.5 dB per notch setting for stationary conditions (windows open or closed), and 0.6 dB per notch setting for in-service conditions.
■ The in-cab sound levels are more greatly influenced by window position for sources which are located outside the cab. This is particularly true for the horn (a range of 0.5 to 13.1 dB reduction with the windows closed) and to a lesser extent the diesel engine (0.9 to2.2 dB decrease with the windows closed). Window position and quality of sealing are especially important for locomotive operations in tunnels.
■ In general, terrain features, such as grades and cuts, do not have much effect on the in-cab sound levels. Tunnels, on the other hand, can lead to significant increases. For Test Runs 10, 11 and 12, which had a relatively large number of tunnels, the in-service equivalent sound levels for tunnels are approximately 4 to 7 dB higher than the equivalent sound levels for the overall trip.
■ Based on the group of locomotives tested, it does not appear that overexposure to noise is a widespread problem for locomotive crews under the current OSHA standard. Of the 18 test runs, only the locomotive on Test Run 2 (which was being used in an atypical situation) failed the OSHA criteria.
■ For a criterion value of 90 dB at 8 hours there is only one case of overexposure (Test Run 2) regardless of the threshold level (90, 87 or 85 dB). If the criterion value is reduced to 85 dB at 8 hours, the locomotives on Test Runs 2 and 7 would exceed the allowable limits for an 85 dB threshold level. For a threshold level of 80 or 82 dB, the locomotives on Test Runs 14 and 15 would also exceed the allowable limits.
1 1 3

■ The crew noise doses calculated from the lapel microphone recordings are generally higher than the noise doses for the fixed microphones. This difference is due primarily to the fact that the lapel microphones are located closer to the crew members' mouths so that the sound levels due to conversation are higher than at the fixed microphones. This results in the noise dose also being higher.
■ The two principal locomotive operations contributing to the crew rioise dose are engine notch 8 and horn soundings, with some smaller contribution from the brake and engine notch 1.
■ Of the various terrain features examined, only tunnels are found to have a significant affect on the crew noise dose. For features such as upgrades, downgrades and cuts, the noise dose is a function of duration and not the terrain.
Based on these results, there does not appear to be a widespread pro
blem of overexposure to noise for locomotive crews under current FRA regulations. However, as was seen for the locomotive on Test Run 2, there can
be cases where overexposure to noise can occur when certain locomotives are used on certain runs. With this in mind, the next question to be addressed is the type of monitoring which would be most advantageous for pinpointing
those locomotives which might result in overexposure to noise. Since, based on the results of this study, the number of locomotives which fall into this category is estimated to be small relative to the total U. S. fleet, in-
service measurements on every locomotive would he a very costly and time
consuming method of testing, particularly since the noise dose can vary from
run to run. Thus, some type of simplified test, which could be .used to screen out these locomotives, would be desirable.
In the case of over-the-road trucks, the Bureau of Motor Carrier Safety
(BMCS) of the U. S. Department of Transportation developed a simplified testing procedure for assessing in-cab driver noise exposure for in-service operations based on noise measurements with the vehicle stationary [29,30].
1 1 4
5
This stationary test procedure yields a value that is correlatable to the results obtained from continuous in-service measurements as required by OSHA
[31].
A similar approach was examined in this study. Although the duty cycle for locomotives is highly variable, whereas for trucks it is generally repeatable, it was found that a stationary test, which can be used to assess
in-cab locomotive noise exposure, could he developed. Such a stationary
screening test is discussed in Section 6.
115
6.0. STATIONARY SCREENING TESTBased on the results of the field test program, it a p pears that the
mos t desirable approach for e v a l u a t i n g the ln-cab noise exposure of locomo
tive crews is to develop a s implified test procedure for s c r eening those
locomotives w h i c h might result in o v e r e x p o s u r e to noise. For this screening
test to be practical, it should involve a m i n i m u m number of m e a s u r e m e n t s and
little or no data analysis. The m e a s u r e m e n t procedure should be simple and
the measu r e d quantity easily related to the c r e w noise dose, w i t h o u t having
to perform any complex calculations. The results must be repeatable and re
liable in order to maintain any c o n f i d e n c e in the screening procedure. An
important quest i o n which must be a d d r e s s e d is the level of c o r r e l a t i o n re
quired be t w e e n the predicted and the actu a l noise doses for the screening
test to be valid and yet still be practical.
6.1. Ideal R e l a t i o n s h i p
A way of illustrating the r e l a t i o n s h i p be t w e e n the noise dose predicted
by a s i mplified test procedure and the actual noise dose is shown in Figure
13. The actual noise dose, b ased on c o n t i n u o u s m easurements, is plotted on
the ordinate. The pass/fail limit of the h e aring conser v a t i o n crit e r i a is
s h o w n as the h o rizontal dashed line. The noise dose predicted from the
results of a simplified test pr o c e d u r e is plotted on the abscissa, wi t h the
test procedure pass/fail limit shown by the v e r t i c a l dashed line. The solid
diag o n a l line represents the ideal relationship, w here the simplified test
p r o c e d u r e e x a c t l y predicts the act u a l n oise dose. The shaded region repre
sents the range of values w h i c h m a y occur due to v a r i a b i l i t y that can be ex
p e c t e d in any "real-engineering" situation. The size of this band is d epen
dent upon the complexity of the m o d e l and the ass u m p t i o n s used to derive the
e m p i r i c a l relationship.
116

INCREASING N
OISE
DOSE
BASED O
N A
CTUAL M
EASUREMENTS
PASS
FAIL
INCREASING NOISE DOSE PREDICTED F R O M SIMPLIFIED TEST PROC E D U R E
Figure 13. H y p o t h e t i c a l r e l ationship b e tween the actual n o i s e dose and that p r e d i c t e d u sing a simplified testing procedure.
117
This plot is broken down into four quadrants. In terras of the
predicted and actual noise doses, these quadrants representi
Quadrant Actual Noise Dose Predicted Noise Dose
I Fail Fail
II Fail Pass
III Pass Pass
IV Pass Fail
For the screening test to be reasonable, the results should fall into
Quadrants I or III. The scatter or range of values is not critical in
these quadrants since the only real concern is whether the noise dose is
below the criteria (pass) or above (fail).
Quadrant IV corresponds to cases which would be predicted to fail but
would actually pass if continuous noise measurements were made. For the
hypothetical relationship shown.in Figure 13, this is represented by the
hatched area in Quadrant IV. Although it is desirable to have as few cases
as possible fall in this region, some type of verification test could be
developed to ascertain whether the locomotive did indeed fail. The practi
cality of such a procedure would depend upon the number of locomotives which
fall into this region and thus, the number of verification tests that would
have to be conducted.
On the other hand, in the interest of hearing conservation, there
should be no cases which fall into Quadrant II (shown by the hatched area in
Quadrant II), i.e., when the noise dose would -be predicted to pass but would
actually be exceeded. Since the relationship between the predicted and
actual noise dose is enpirical in nature, the results can be shifted down-
118

ward by simply adjusting the relationship so that the predicted values
always exceed the noise dose actually measured by some safe margin, as
illustrated in Figure 14. The only limitation to this is that it can result
in an increase of cases falling into Quadrant IV. Thus, in the final deve
lopment of the screening test procedures, consideration of which quadrant
the majority of locomotives fall into will be an important factor in deter
mining the final form of the screening test.
6.2. Existing Procedures
The first step in developing a screening test is to establish what the
primary constraints are and what, if any, procedures currently exist. The
constraints have already been discussed. These are:
■ simple measurement techniques (repeatable and reliable, yet practical),
| minimum number of measurements,
■ little or no data analysis, and
■ no complex calculations to get final results.
At present, there are no standardized procedures commonly used for con
ducting noise measurements inside a locomotive cab. There is an Interna
tional Standard (ISO 3381-1976(E), Acoustics - Measurement of Noise Inside
Railbound Vehicles [32]) which recommends procedures for making noise
measurements inside railbound vehicles. However, this standard gives only
very generalized test procedures which are considered to be inadequate for
characterizing the noise environment inside a locomotive cab because of the
wide variety of noise sources present. In addition, since the measured re
sult is in terras of a sound pressure level, the problem of determining the
noise exposure still remains.
119
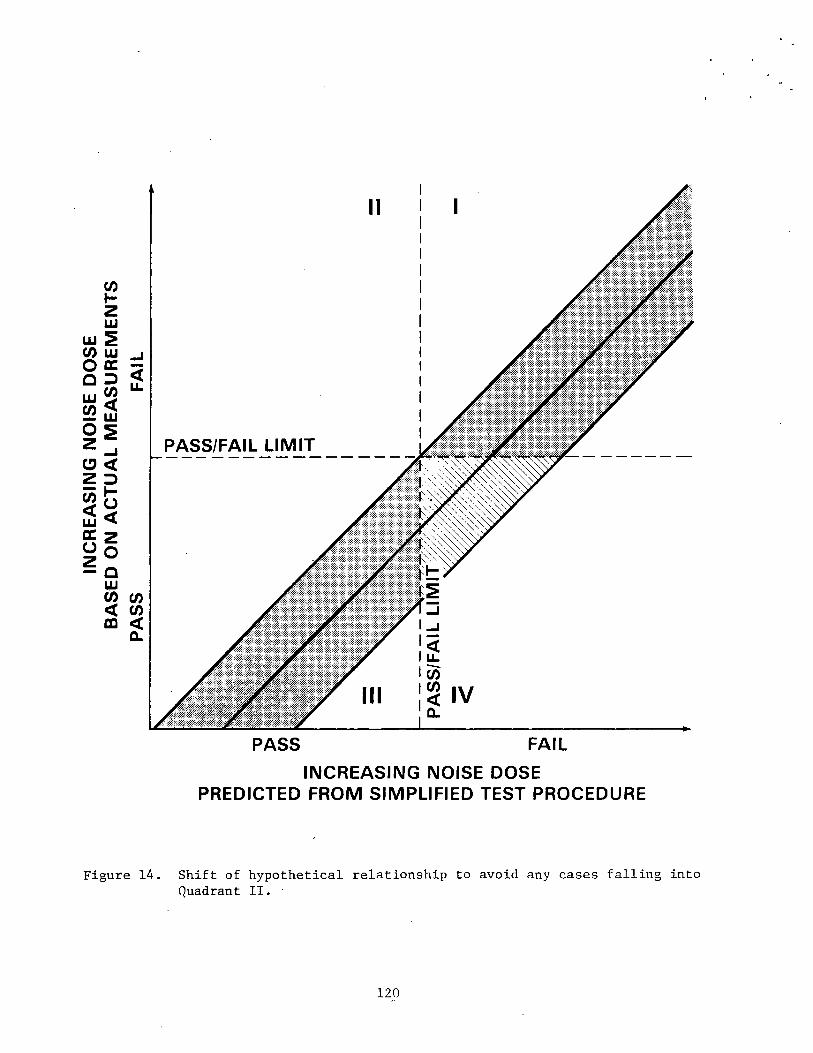
INCREASING N
OISE
DOSE
BASED O
N A
CTUAL M
EASUREMENTS
PASS
FAIL
INCREASING NOISE DOSE PREDICTED F R O M SIMPLIFIED TEST P R O C E D U R E
Figure 14. Shift of hypothetical relationship to avoid any cases falling into Quadrant II.
120

' Although there are a variety of standards for measuring operator sound
levels for other types of equipment and vehicles, e.g., see References 33-
36, the measured results are expressed in terms of the maximum A-weighted
sound levels at the operator's station, and not operator noise exposure.
One exception to this is SAE Recommended Practice J1166— Operator Station
Sound Level Measurement Procedure for Powered Mobile Earthmoving Machinery -
Work Cycle Test [37], This standard gives detailed recommendations for
microphone location and operation of the equipment being tested. For each
piece of equipment considered (nine altogether), a time-weighted average
sound level (A-weighted, slow response, 5 dB per doubling of duration trade
off) is determined for a specified work cycle. This cycle is designed to
simulate a typical work application for each general type of machinery.
Procedures are given for determining the operator noise exposure for an en
tire day based on the measurements for this work cycle, any other operation
commonly performed, and noise sources (other than the machine being tested)
that may be present. A similar technique could be used for estimating loco
motive crew noise exposure, provided that a suitable duty cycle can be
established.
Another, but slightly different, approach is used by the Bureau of
Motor Carrier Safety of. the Federal Highway Administration, U. S. Department
of Transportation, in enforcing their vehicle interior sound level standard
for trucks [38], Enforcement of this safety regulation calls for the
stationary measurement of the in-cab noise level when, with the transmission
in neutral, the engine is rapidly accelerated to the governed engine speed,
allowed to stabilize at that speed and then returned to idle. The maximum
sound level is measured for this operation and then compared to a
121

predetermined value (90 dB plus a 2-dB tolerance) to determine whether the truck passes or fails. This procedure and the reference level of 90 dB were obtained by comparing the results for various types of simplified tests with the results for over-the-road trips [29]. The test procedure was based on the degree of correlation with over-the-road trips, with some consideration
of the problems involved in conducting the tests during roadside enforce
ment. A slightly different test procedure is recommended in a similar, but
independent study [31]; however, the results that are presented further substantiate the conclusions made in Reference 29. It was with this informa
tion as background that the stationary test procedure, described in the remainder of this section, was developed.
6.3. Development of the Stationary Screening Test
Unlike the case of over-the-road trucks where engine/drive-train noise is likely to dominate the in-cab noise levels (with some contribution from tire-road interaction noise), it was shown in earlier sections of this
report that in-cab locomotive noise is generated by a variety of sources. Thus, a simple measurement of engine noise is not likely to be adequate for
estimating in-service noise exposure. Instead, measurements of the sources
that are the chief contributors to the crew noise exposure must be made.
These, along with some assumptions about the operational duty cycle, can then be used to estimate the crew noise exposure.
Examination of the data have shown that the engine, the horn and the
brake are the three chief contributors to the crew noise exposure. A breakdown of the noise dose contributions for these sources, given previously in Table 39, shows that engine notch 8 and horn are the two principal contributors to the noise dose, with some smaller contribution
122

from the brake. The stationary test is therefore based on measurements of engine notch 8, the horn and the brake. Mathematically, this can be expressed as
ND = f|A[engine (8)], B[Horn], C[Brake]| , (11)
where,ND = estimated noise dose for comparison with the pass/fail criteria,
A,B,C = empirical functions to relate the stationary test results to the in-service noise exposure.
The empirical functions A, B and C should take into account the differ
ence between the stationary and in-service sound levels and the duty cycle
for each operation. These factors plus the measured stationary test results and a knowledge of the trip "run time" can then be used to estimate the crew
noise exposure. In general form, the noise dose is a function of the following variables:
ND - f < T t, Pg, LSTAT(g), Kg, PH, hsTAT(H). KH> PB» LSTAT(B)> KB f * (12)
where, Tt = trip "run-time,”
Pg = percent "on-time" for notch 8,
LSTAT(8) average sound level for notch 8 — stationary test,
Kg = correction for the difference between the averagestationary and average in-service sound levels for notch 8,
Pg = percent "on-time" for the horn,
LgTAT(H) = maximum sound level for the horn — stationary test,Kg = correction for the difference between the maximum
stationary and average in-service sound levels for the horn,
PBL STAT(B)
percent "on-time" for the brake,
maximum sound level for the brake stationary test, and
123

Kg = correction for the difference between the maximumstationary and average in-service sound levels for the brake.
Before proceeding to the final form of the noise dose equation, some discussion of the variables just listed is appropriate.
■ Trip "Run Time" — TtThe trip "run time" represents the time that the locomotive is actually operating on-line. It does not include any periods of time when the locomotive is waiting on a siding for another train to pass or waitng to get into or out of a yard since these periods are generally spent in idle/notch 1 where the sound levels are less than 90 dB. For development of the stationary screening test formula, Tt is set equal to the effective crew dose time, Tgoge. For subsequent use of the stationary screening test, Tt can be set equal to any run time appropriate for the particular run under investigation.
■ Percent "On-Time" — Pg, Pg, PgThe percent on-time corresponds to the time that the particular operation (engine notch 8, horn or brake) is actually occurring or, in other words, the duty cycle for each event. For the development of the stationary screening test formula, the average values of the percent on-time for the 18 test runs are used. Because these percentages can vary widely among runs, as was shown in Section 5.1, the estimated dose may either be over- or under-estimated. The effect of different percent on-times upon the estimated dose, in terms of acceptable ranges of values, is discussed later in this section.
■ Stationary Sound Levels LSTAT(8)> LSTAT (H)> LSTAT(B)The stationary sound levels are the measured variables used to characterize the noise inside a particular locomotive cab. These measurements are to be made with the locomotive stationary at a test site that is as free of obstructions (i.e.,"buildings, freight cars or other locomotives) as possible. For these tests the measurements are to be made at a position corresponding to the engineer left side with the cab windows open. The quantities to be measured (all A-weighted, "slow" response) are the average sound level for engine notch 8 (no load) and the maximum sound levels for a horn sounding and a brake application. More specific information regarding these measurements and why these particular procedures were chosen are discussed ]ater in this section.
1 2 4

Stationary to .In-Service Sound Level Corrections — Kg, K^, KgThe purpose of these corrections is to adjust the sound levels from the stationary measurements to approximate the in-service sound levels. These corrections are simply the difference between the stationary sound level (average or maximum) and the average in-service sound level for each operation. These corrections are explained later in this section.
As shown in Equation (2) in Section 2, the noise dose is given by the
sura of the C-over-T ratios, i.e., the ratios of the actual time exposed to a given noise level divided by the maximum allowable time at that level.
Assuming that each of the operations can be characterized by a single sound; given by
c8 CH gbND = — + — + —
•-3 00 th Tfi(13)
where, Cg, Cjj, Cg = estimated on-time for notch 8, horn and brake,respectively, where, Cg = Pg Tt, CH = PH Tt, andCB = PB Tt> and
Tg, Tpj, Tg = maximum-allowable time at assumed soundlevel fdr notch 8, horn and brake, respectively (dependent upon hearing conservation criteria utilized).
Using the current OSRA criteria of 90 dB for 8 hours with a 5-dB per doubl
ing of duration tradeoff, the maximum allowable time, T, at a particular
sound level, L, is given by (Equation (1) in Section 2):
90-LL 5
T = 8x2 (14)
Assuming that the characteristic sound levels of each source are given by
l8 = lSTAT(8) - k8, (15a)
lH = lSTAT(H) - kh, (15b)
lB = lSTAT(B) - Kg, (15c)
125
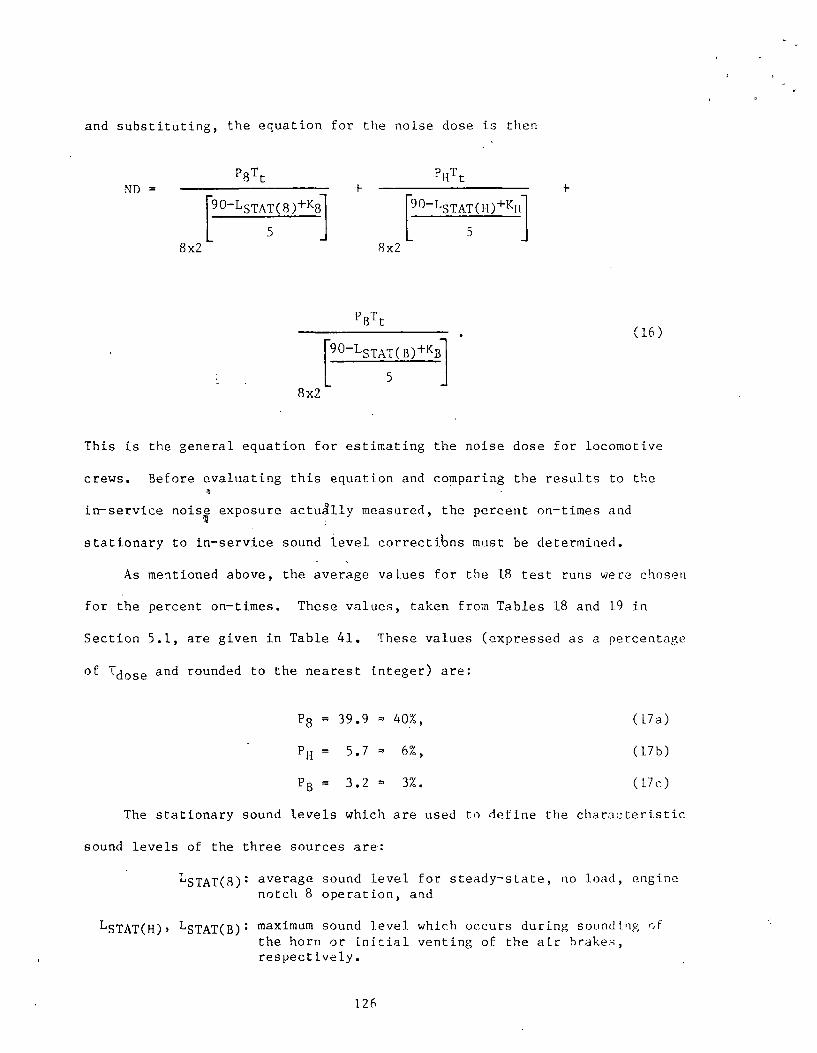
and substituting, the equation for the noise dose is then
p8Tt PHTtND = ----------------- h ----------------- h
9 0 - l St a T ( 8)+ k 8 90_LSTAT(H)+kH5 5
8x2 8x2
PBTt
8x2
90~l s t a t(b)+k b5
(16)
This is the general equation for estimating the noise dose for locomotive
crews. Before evaluating this equation and comparing the results to thea
in-service noise exposure actually measured, the percent on-times and
stationary to in-service sound level corrections must be determined.
As mentioned above, the average values for the 18 test runs were chosen
for the percent on-times. These values, taken from Tables 18 and 19 in
Section 5.1, are given in Table 41. These values (expressed as a percentage
of T^Qgg and rounded to the nearest integer) are:
p8 = 39.9 « 40%, (17a)
PH = 5.7 » 6%, (17b)
PB = 3.2 - 3%. (17c)
The stationary sound levels which are used to define the characteristic
sound levels of the three sources are:
Lstat(8): average sound level for steady-state, no load, engine notch 8 operation, and
LsTAT(H) > l'STAT(B) : maximum sound level which occurs during sounding o fthe horn or initial venting of the air brakes, respectively.
126

■LZI
Table 41 Sound level and duty cycle data used to derive the empirical parameters for the stationary screening test equation.
T E S T
K L I N
N U M B E R
K N C f N E N O T C H 8 M O R N B R A K F
l ’e r e e n t
C . e l
1 d o s e )
A v e r a g e
S t a t i o n a r y
S o u n d
L e v e l ,
* ' a v g *
A v e r a g e
l n - S e r v i c e
S o u n d
L e v e l ,
L a v , ■
S i a t i o n a r y —
I n - S e r v i ce.
S o u n d
L e v e L
K s , d B
P e r c e n t
O n - T i m e
( Z o f
T i l o s e l
M a x i m u m
S t i l t i o n a r y
S o u n d
L e v e l ,
h u x - J B
A v e r a g e
I n - S e r v i c e
S o u n d
L e v e l ,
l a v , - d B
S l a t l o n a r v —
I n - S e r v i . e e
S o u n d
L e v e L ,
K i j , .111
P e r c e n t
O n - T i m e
o f
T d o s e )
M a x i m u m
S t a t i o n a r v
S o u n d
L e v e l ' ,
(. , d Bm a x
A v e r a g e
I n - S e r v i c e
S o u n d
L e v e l ,
L a v g . d B
S t a t i o n a r y —
I n - S e r v i c e
S o u n d
L e v e l ,
K b , d B
1 2 8 9 3 8 8 4 0 9 4 7 1 0 4 •> 9 8 0 6 •) 4 . 7 1 . 0 0 8 8 2 3 1 8 5
n s 9 4 9 9 7 1 _ 0 2 3 2 1 0 6 5 1 0 2 1 4 4 3 . 4 1 0 1 9 8 9 4 1 2 5
3 a i d 6 8 8 0 8 6 3 1 7 3 9 ' 9 6 3 8 9 5 6 8 4 . 6 1 0 3 9 0 3 1 2 8
3 b * i i 7 S 3 l 8 9 7 - 1 6 3 T 9 5 1 8 7 4 7 7 5 . 4 1 12 V 8 6 9 1 5 4
4 i i 5 3 0 6 8 4 5 - 3 9 T 3 " 1 0 0 S 9 2 8 8 0 8 . 8 1 0 2 0 8 1 6 2 0 6
5 c , > 7 3 1 8 7 7 - 9 6 0 3 9 6 9 9 5 4 1 5 4 . 2 1 0 1 0 ' 4 1 4 4
6 3 0 : 8 1 5 8 6 9 - 5 4 2 2 1 0 2 5 9 6 6 5 9 1 . 2 1 0 3 rw 4 1 1 6
7 3 3 8 8 5 0 9 1 7 - 6 7 5 9 1 0 5 O 1 0 0 0 5 0 1 . 6 1 0 2 - 3 9 9
8 * 3 8 1 3 6 0 8 7 8 - 1 8 1 0 3 9 6 4 9 5 3 1 1 2 . h i o : V 3 7 ; 1 4 6
9 -* / 6 3 1 3 8 6 5 - A 7 8 8 9 6 5 9 4 9 L 6 0 . 9 1 0 0 2 2 1 5 3
1 0 6 6 3 8 3 5 8 5 8 _ 2 3 5 5 1 0 2 9 9 0 8 1 2 1 0 . 4 8 7 3 3 - 1 0
I I 5 4 7 8 6 3 8 6 4 - 0 1 1 7 1 0 1 8 8 8 4 1 3 4 l . 9 S 3 a t 5 2 5 1 4
1 2 5 3 6 8 2 7 8 3 7 - 1 0 3 7 9 9 4 9 1 0 8 4 1 . 4 9 0 0 * 5 7 4
1 3 3 6 0 s o 0 8 4 2 - 4 2 2 2 9 8 2 9 7 7 0 5 0 . 9 9 7 a,
1 2 0
1 4 a 5 2 (' 8 4 T 8 7 4 - 3 2 8 8 9 9 0 9 4 9 4 1 8 . 4 1 0 2 5 * “ 7 8
1 4 b 8 4 1 8 4 2 8 6 6 - 2 . 4 5 8 9 9 0 9 6 9 2 . 1 o " 1 0 2— 4.
5 ’ - -
1 5 4 2 9 8 3 5 8 7 0 - 3 7 1 5 9 1 0 3 0 9 8 1 4 9 1 . 5 1 0 5 2 1
11 2 • 8
1 6 5 4 4 8 4 0 8 7 0 - 3 0 1 1 5 1 0 1 4 9 1 7 9 . 7 o " 9 6 2 ~ - -
M R A N y j 9 8 4 5 8 7 5 - 3 0 5 7 1 0 0 3 9 4 5 5 . 7 3 . 2 9 9 2 C 7 5j
11 . 6
S T A N D A R D
. D R V I A T I 0 X2 0 1 3 9 3 . . 0 0 . 7 3 9 3 4 1 3 . 7 2 . 6 6 3 1
!
i
i .......
r>. 6
*ru-r.iiiso of incomplete information, all data for these three test runs are from the engineer right-side microphone.'onlv major rake application occurred when stopping the train in the yard at the final destination, after the test equipment had '-'eer. c 1 la % ) «-d. Thesevalues arc not included in the mean and standard-deviation calculations.Slai ionar\ tests were not conducted with the windows open, L'indows-closed data are used.

These sound levels are to be measured using A-weighted "slow" meter response,
as specified by OSHA [2], with the microphone positioned approximately
where the engineer's left ear would be located when he is seated. The cab
windows are to be open during the measurements (but all doors are to be
closed) and the locomotive should be positioned in an open area witli no
other large objects nearby. The reasonings for these particular procedures
are as follows:
■ Average Versus Maximum Sound Level. The arithmetic average sound level is chosen for engine notch 8 because it is a relatively steady sound with only minor fluctuations. On the other hand, the horn and brake produce sound levels which are well above the engine noise so that when they are operated there is a sudden increase of sound level. For the horn this sound level can be held relatively steady by continued sounding of the horn, but the horn shouldn't be sounded for long periods of time, especially if the locomotive is in a yard where other people are working. Besides, the maximum sound level for the horn is approximately equivalent to the arithmetic average value over the sounding time (see Figure 10).
For application of the brakes, the sound level can vary widely depending upon the type of brake application, the amount of brake pipe pressure reduction being made, and the total volume of the brake pipe system, i.e., the length of the train or number of cars in the train. As shown in Figure 11 and discussed in Section 5.2.2., the largest percentage of time during an in-service brake application is spent in applying the train brakes. However, after the initial peak, the sound level decreases to a lower value and remains at approximately this value for the remainder of the time the brake pipe is being vented. Since this lower sound level was found in most cases to be below the 90-dB threshold level, the portion of the brake application most likely to contribute to the noise dose occurs near the initial peak. Also, since the locomotive consist may or may not be coupled to the train, it is easier to measure this initial peak (which is not a function of train length) than to attempt to determine some average value.
■ Windows Open Versus Windows Closed. These tests are conducted with the windows open for two reasons. First, it was found that, if the weather permitted, the crew would prefer to have the windows open during in-service operations. Second, as discussed in Section 5.2.2, for sounding of the horn during stationary operations, the reduction of in-cab sound levels ranged from 0.5 to 13.1 dB for windows-closed versus windows-open conditions. Therefore, testing with the windows open removes the variability which can be introduced by differences in window sealing, or changes of sealing with damage or age.
128

■ Microphone Location. The engineer left-side microphone location was chosen primarily for convenience of testing. With the engineer seated, it is more difficult to position the microphone and observe a reading on the engineer's right side than on the left side. Although it is less critical for the stationary tests than it is for in-service operations, the engineer left-side microphone position would be less affected by wind noise (the primary reason for using it for comparison of in-service results) and to some extent extraneous background noise outside the cab.
Also given in Table 41 for engine notch 8, horn, and brake are the sta
tionary and in-service sound levels and the differences between these values.
These differences correspond.to the stationary to in-service sound level cor
rections mentioned previously (Kg, K , Kg). These corrections, when sub
tracted from the measured stationary sound levels, are assumed to yield a
sound level characteristic of in-service operations. For the horn and the
brake, this amounts to reducing the maximum sound level to correspond to a
value more representative of an average in-service sound level with all the
variations in time averaged out. For engine notch 8, this correction
accounts for several factors which differ between the stationary and in-
service cases: wind noise from the open window, wheel-rail interaction
noise, and radio noise. This last factor, namely the radio, can be a primary
contributor to in-cab noise exposure. However, since the volume of the radio
is variable and is normally adjusted to be just audible above the engine
noise, its sound level is usually directly related to the sound level of the
engine. Thus, it can be accounted for by adding (subtracting a minus Kg is
equivalent to adding) a correction to the stationary engine notch 8 sound
level to increase it to approximate the in-service sound level.
As mentioned in the discussion of the hypothetical relationship shown
in Figure 13, cases which fall into Quadrant II should be avoided. One way
to try to ensure this is to shift the relationship as shown in Figure 14.
This shift is accomplished by decreasing the stationary to in-service sound
12.9

level correction factors in Table 41 by 1 dB12. This not only adds to the conservatism of the empirical relationship, but also partially accounts for any measurement error on the low side (up to 1 dB). The three corrections used in the screening test (rounded to the nearest integer value) are
K8 = -3.0 - 1.0 « - 4 dB, (18a)
Kr = 5.7 - 1.0 * + 5 dB, (18b)KB = 11.6 - 1.0 - + 11 dB. (18c)
With these values and the values for the percent on-times given in Equa
tion (17), the crew noise exposure can be calculated from Equation (16). The
results of these calculations, based on the actual effective crew dose time,
T8oSe» f°r ea°h of the 18 test runs, are given in Table 42. The results for the overall trip are plotted in Figure 15. . As shown in this figure, the majority of data fall into Quadrant III, and in fact only the data for the
locomotive on Test Run 2 falls outside this quadrant (in Quadrant I). Thus, for the 18 test runs made in this study there were no cases which fell into
Quadrants II or IV and in fact no cases which were even marginally close.
Although this is encouraging, it must be realized that this is a limited set of runs which, on a statistical basis, does not allow any broad sweeping
conclusions to be made about how well the predicted and actual values are correlated. From a purely statistical viewpoint, more data are needed where the noise dose is approaching 1.0 or is greater than 1.0. The principal problem with this requirement is that it does not appear, at least based on
A shift of 1 dB was found to be adequate for the 18 test runs examined in this study. After additional data are collected, as recommended in Section 6.6, this value should be reevaluated.
1 ?
130
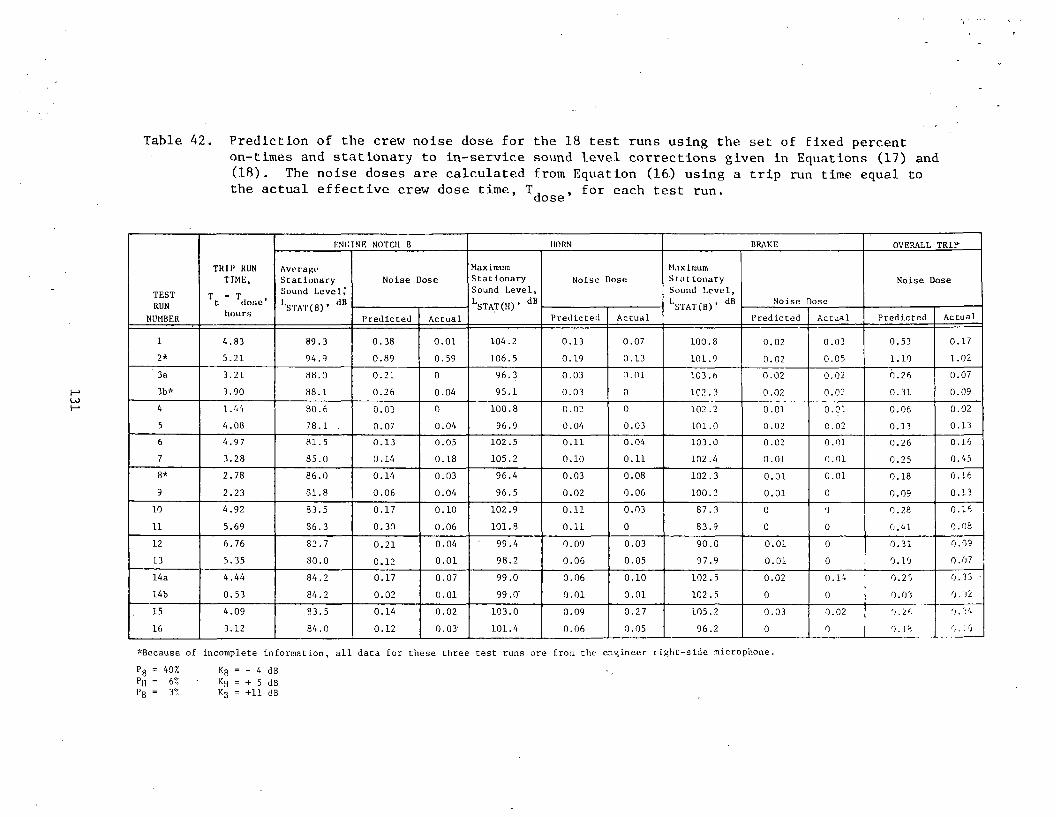
TET
Table 42. Prediction of the crew noise dose for the 18 test runs using the set of fixed percenton-times and stationary to in-service sound level corrections given in Equations (17) and(18). The noise doses are calculated from Equation (16) using a trip run time equal tothe actual effective crew dose time, T, , for each test run.dose
TESTRUN
NUMBER
TRIP RUN TIME,T * T, t dosehours
ENCINE NOTCH 8 HORN BRAKE OVERALL TRIFAverage Stationary Sound LeveL,*‘'STATW dB
Noise DoseMaximum Stationary Sound Level,lstat(h)’ dB
Noise DoseMaximum Scat ionary Sound Level,''STAT(B)’ dB Noise Dose
Noise Dose
Predicted Actual Predicted Actual Predicted Actual Predicted Actuali 4.83 89.3 0.38 0.01 104.2 0.13 0.07 100.8 0.02 0.03 0.53 0.172* 5.21 94.9 0.89 0.59 106.5 0.19 0.13 101.9 0.02 0.05 1.10 1.023a 3.21 88.0 0.21 0 96.3 0.03 n.oi 103.6 0.02 0.02 0.26 0.073b* 3.90 88.1 0.26 0.04 95.1 0.03 0 102.3 0.02 0.02 0.31 0.094 1.44 80.6 0.03 0 100.8 0.02 0 102.2 0.01 0.01 0.06 0.925 4.08 78.1 . 0.07 0.04 96.9 0.04 0.03 ini .o 0.02 0.02 0.13 0.136 4.97 81.5 0.13 0.05 102.5 0.11 0.04 103.0 0.02 0.01 0.26 0.167 3.28 85.0 0.14 0.18 105.2 0.10 0.11 102 .4 0.01 0.01 0.25 0.458* 2.78 86.0 0.14 0.03 96.4 0.03 0.08 102.3 0.01 0.01 0.18 0.169 2.23 81.8 0.06 0.04 96.5 0.02 0.06 100.2 0.01 0 0.09 0.1310 4.92 83.5 0.17 0.10 102.9 0.11 0.03 87.3 0 0 0.28 0.1611 5.69 86.3 0.30 0.06 101. S 0.11 0 83.9 0 0 0.41 0.0812 6.76 82.7 0.21 0.04 99.4 0.09 0.03 90.0 0.01 0 0.31 0.0913 5.35 80.0 0.12 0.01 98.2 0.06 0.05 97.9 0.01 0 0.19 0.0714a 4.44 84.2 0.17 0.07 99.0 0.06 0.10 102.5 0.02 0.14 0.25 0.35 ■14b 0.53 84.2 0.02 0.01 99.0 0.01 0.01 102.5 0 0 0.03 0.9215 4.09 83.5 0.14 0.02 103.0 0.09 0.27 105.2 0.03 0.02 0.26 0.416 3.12 84.0 0.12 0.03 101.4 0.06 0.05 96.2 0 0 0. IH o.; o
Because of incomplete information, all data for these three test runs are from the engineer right-side microphone.p8 ” 40% k 8 = - 4 dBhi = 6% ><h = + 5 dBPB = 3% kb = +11 dB

NOIS
E DOSE B
ASED O
N A
CTUAL M
EASUREMENTS
NOISE DOSE PREDICTED F R O M THE STATIONARY SCREENING TEST EQUATION
Figure 15. Relationship between the actual noise dose and the noise dose predicted from Equation (16) using the set of fixed percent on-times and stationary to in-service sound level corrections given in Equations (17) and (18). These data are listed in Table 42.
132 ....
these 18 test runs, that there arc many cases which fall into these regions.
Thus, the data would be difficult to obtain and, more importantly, would be
of only limited value since the majority of cases would fall down in the low
er left portion of Quadrant III. To support this hypothesis further data are
required.
Given this limitation, it still appears that the stationary screening
test equation gives a reasonable prediction of the crew noise dose. This is
especially true when considering that a single set of fixed percent on-times
was used to represent the wide range of actual in-service duty cycles. For
many of the cases where the predicted and actual noise doses are not the
same, the deviation is due to a difference between the actual and assumed
percent on-times. The locomotive in Test Run 1, for example, has predicted
and actual noise doses of 0.53 and 0.17, respectively. This deviation is due
primarily to a difference between the actual (2.2%) and assumed (40%) percent
on-times for engine notch 8. If the actual percent on-time is used in the
stationary screening test equation, the predicted noise dose is 0.11, which
is a closer estimate of the actual noise dose. Unfortunately, even though
the use of the actual percent on-times improves the agreement between the
predicted and actual noise dose in some cases, in others it degrades the
agreement. Table 43 and Figure 16 show the results when the actual percent
on-tines and actual stationary to in-service sound level corrections for each
of the 18 test runs (from Table 41) are used to predict the noise dose. Com
parison of Figures 15 and Figure 16 shows that the agreement between the pre
dicted and actual noise dose is improved. This indicates that the average
in-service sound level (the stationary sound level minus the actual value of
K is merely the average in-service sound level) and the percent on-times for
133

Table 43. Prediction of the crew noise dose for the 18 test runs using the actual percent on-timesand stationary to in-service sound level corrections listed in Table 41 for each test run.The noise doses are calculated from Equation (16) using a trip run t lino equal to theactual effective crew dose time, T, , for each test run.dose
TESTRUN
NUMBER
TRIP RUN TIME
T = T. t dosehours
ENCINF. NOTCH 8 HORN BRAKE OVERALL TRIP
Average Stationary Sound Level,LSTAT(8)’ dli
N o i s e DoseMaximum Stationary Sound Level,l s t a t (h )’ d
Noise DoseMaximum Slat ionary Sound Level,''STAKB)’ dB
Noise Dose
Noise DosePredicted Actual Predicted Actual Predicted Actual Predicted Actual
i 4.83 89.3 0.01 0.01 104.2 0.09 0.07 100.8 0.01 0.03 0.11 0.17
2* 5.21 94.9 0.59 0.59 106 .'5 0.11 0.13 101.9 0.02 0.05 0.72 1.02
3a 3.21 88.0 0.05 o 96.3 0.01 0.01 103.6 0.02 0.02 0.08 0.07
3b* 3.90 88.1 0.06 0.04 95.1 0.01 0 102.3 0.02 0.02 0.09 0.09
4 1.44 80.6 0.01 0 100.3 0.01 0 102.2 0 0.01 0.02 0.02
5 4.08 78.1 0.13 0.04 96.9 0.02 0.03 101.0 0.01 0.02 0.17 0.13
6 4.97 81.5 0.12 0.05 102.5 0.03 0.04 103.0 0.01 0.01 0.17 0.16
7 3.28 85.0 0.20 0.18 105.2 0.10 0.11 102.4 0.01 0.01 0.31 0.45
8* 2.78 86.0 0.10 0.03 96.4 0.07 0.08 102.3 0.01 0.01 0.18 0.16
9 2.23 81.8 0.08 0.04 96.5 0.05 0.06 100.2 0 0 ____2 2 s____0.13
10 4.92 83.5 0.23 0.10 102.9 0.04 0.03 87.3 0 0 0.27 0.16
11 5.69 86.3 0.24 0.06 101.8 0.01 0 83.9 0 0 0.25 0.08
12 6.76 82.7 0.19 0.04 99.4 0.04 0.03 90.0 0 0 0.23 0.09
13 5.35 80.0 0.11 0.01 98.2 0.04 0.05 97.9 0 0 0.15 0.07
14a 4.44 84.2 0.20 0.07 99.0 0.10 0.10 102.5 0.09 0.14 0.39 0.35
14b 0.53 84.2 0.03 0.01 99.0 0.01 0.01 102.5 0 0 0.04 0.02
15 4.09 83.5 0.15 0.02 103.0 0.25 0.27 105.2 0.01 0.02 0.41 0.34
16 3.12 84.0 0.14 0.03 101.4 0.06 0.05 96.2 0 0 0.20 0.10
^Because of incomplete information, all data
Actual values of Pg, P^, Pg, Kg, K^, and Kg
for these three test runs are from the engineer right-side microphone,
for each test run are used (see Table 41).

NOIS
E DOSE B
ASED O
N A
CTUAL M
EASUREMENTS
NOISE D O S E PREDICTED F R O M THE STATIONARY SCREENING TEST EQUATION
Figure 16. Relationship between the actual noise dose and the noise dose predicted from Equation (16) using the actual percent on-times and stationary to in-service sound level corrections listed in Table 41 for each test run. These data are listed in Table 43.
135
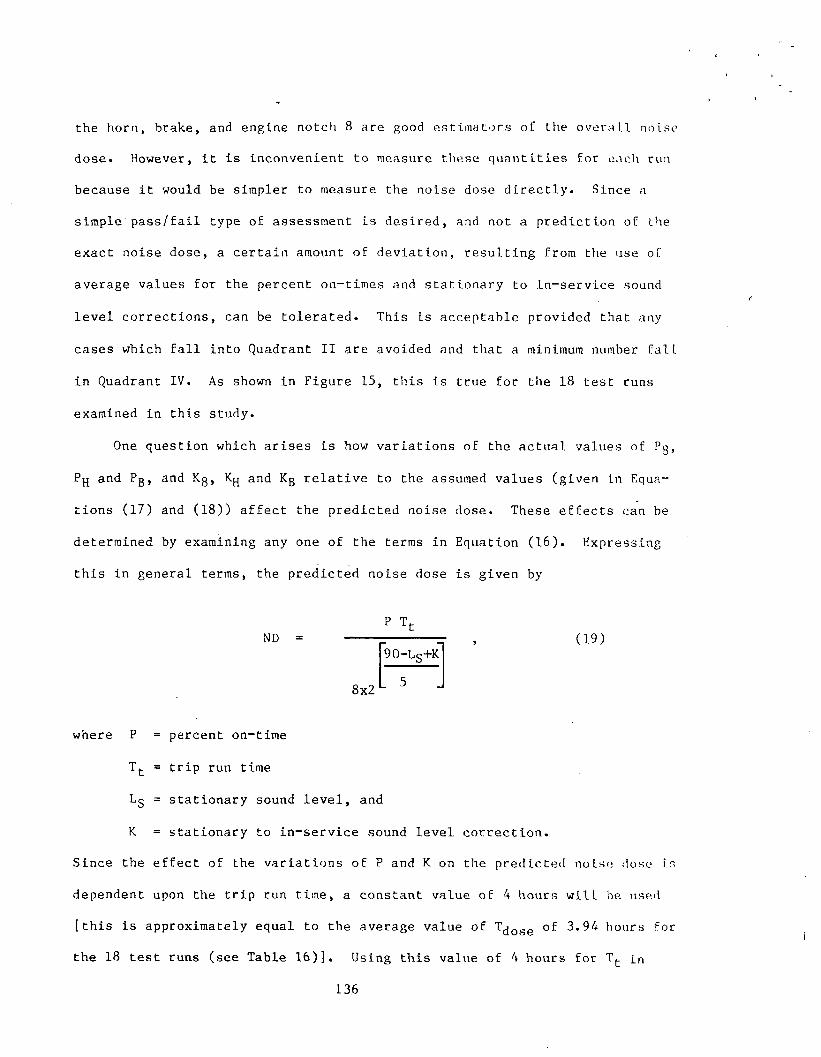
the horn, brake, and engine notch 8 are good estimators of the overall noise
dose. However, it is inconvenient to measure these quantities for each run
because it would be simpler to measure the noise dose directly. Since a
simple pass/fail type of assessment is desired, and not a prediction of the
exact noise dose, a certain amount of deviation, resulting from the use of
average values for the percent on-times and stationary to in-service sound
level corrections, can be tolerated. This is acceptable provided that any
cases which fall into Quadrant II are avoided and that a minimum number fall
in Quadrant IV. As shown in Figure 15, this is true for the 18 test runs
examined in this study.
One question which arises is how variations of the actual values of Pg,
Pg and Pg, and Kg, Kg and Kg relative to the assumed values (given in Equa
tions (17) and (18)) affect the predicted noise dose. These effects can be
determined by examining any one of the terms in Equation (16). Expressing
this in general terms, the predicted noise dose is given by
ND =
where P = percent on-time
Tt = trip run time
Lg = stationary sound level, and
K = stationary to in-service sound level correction.
Since the effect of the variations of P and K on the predicted noise dose is
dependent upon the trip run time, a constant value of 4 hours will be used
[this is approximately equal to the average value of Tgose of 3.94 hours for
the 18 test runs (see Table 16)]. Using this value of 4 hours for Tt in
P T,
8x2
90-Ls+K(19)
136
Equation (19), the relationships between the. noise- dose, NO, percent on-
time, P, ami characteristic sound level, K (sec? Equation (15)), are shown
in Figures 17 and 18. The? same Functional relationship is shown in those
two figures, with the only Hi Florence being that Figure 17 shows contours of
constant percent on-time, and Figure 18 shows contours of constant charact
eristic sound level. In Figure 17 it can he seen that the noise dose in
creases rapidly with increasing sound level and percent on-time, L.e., ex
posure time. The effect of any variation of the actual percent on-tine from
the assumed value is dependent upon the characteristic sound level (and also
the total exposure time). The same trend is shown in Figure 18. Thus, the
effect of variations of the percent on-times or stationary to in-service
sound level corrections on the predicted noise dose depends strongly upon
the magnitude of the characteristic sound level and the total exposure time.
The higher these values are, the more significant the effect of the varia
tions of P and K.
For the 18 test runs examined in this study, the pass/fail, assessment
of the in-cab locomotive noise exposure is not adversely affected by varia
tions of P and K (at least not for the range of values that were found).
This results because, even though the percent on-time for engine notch 8 is
relatively high (40%), the characteristic sound levels are generally below
90 dB. The converse of this is also true for the horn and the brake; the
characteristic sound levels are high but the percent on-times are relatively
low. Another, and perhaps the most important, reason that these variations
are not critical is that a pass/fail type of assessment is being used.
Since most cases fall well below the pass/fail value of 1.0, a little extra
tolerance in the procedure does not cause any harm. On the other hand, if
137

PRED
ICTE
D N
OIS
E DO
SE
C H A R A C T E R IS T IC S O U N D L E V E L dB
Figure 17. Predicted noise dose as a function of the characteristicsound level for constant percent on-time. These values are calculated from Equation (19) with = 4 hours.
138

PRED
ICTE
D N
OIS
E D
OSE
0 2 0 4 0 6 0 8 0 100PERCENT O N -T IM E , % OF T t
Figure 18. Predicted noise dose as a function of percent on-time for constant characteristic sound level. These values are calculated from Equation (19) with Tt = 4 hours.
139

the majority of cases were near the pass/fail cutoff, more accuracy would be required. Although it does not appear that this is the case based on the 18 test runs, increased accuracy would also be required if the noise exposure criterion were reduced to an 85 -dB limit at 8 hours as proposed by NIOSH [7].
6.4. Stationary Screening Test Procedure
As discussed in the beginning of this section, the objective of this study
is to develop a simplified testing prodedure for assessing in-cab noise ex
posure of locomotive crews. One approach for structuring such a procedure
based on a stationary screening test is shown in Figure 19. This procedure
would be used as the result of some need to test, such as certification testing of new locomotives or enforcement of some type of noise regulation. The locomotive would be moved to an open site, free of other large objects,
where stationary sound level measurements would be made (to the nearest 0.5 dB) for engine notch 8, horn, and brake using the procedures described earlier in this section (see pages 125 to 130). Based on these measurements, the noise dose would be predicted and an assessment would be made of
the crew noise exposure. If the noise exposure is within the prescribed limits, the locomotive "passes" and no restrictions are placed on its usage.
If the allowable noise exposure is exceeded, some remedial action is required. Several possible options exist in this latter case. The sound levels in the cab can be lowered either by treatment of the noise sources or by restricting the locomotive to operations where there are fewer horn applications and/or the higher engine notch settings are used infrequently.If the option to treat the noise sources is selected, the locomotive would
be modified and retested, the pass/fail assessment made again, and so on,
140

Figure 19. Procedure for assessing in-cab locomotive noise exposure based on the stationary screening test.
141

until the noise exposure is within acceptable limits. The third option13
involves restricting the other factor which controls the noise dose, namely the exposure time. This can be reduced by limiting the number of hours a crew may be on the locomotive by replacing them with another crew or by restricting the locomotive to operations which have shorter work cycles.
Another possible option, shown by the dashed line in Figure 19, is to
conduct some form of verification test on the locomotive during an in-
service run. Since there is some conservatism in the noise dose predicted by Equation (16), the verification test could be used to show that the noise
exposure was within acceptable limits. This test could be conducted by tape
recording the noise levels during the run (as was done in this study), or by using a noise dosimeter. In either case, the results would apply only to
that particular run and no other. However, if the locomotive was used only
on that one run day after day, verification testing, to show that the noise exposure limits were not exceeded, would be beneficial.
When conducting a stationary screening test, it is undesirable to have
to make any complex or detailed computations to determine if the locomotive passes or fails. To simplify this process, a set of ”look-up" tables was
1 treatment of the noise sources, i.e., the engine, horn or brakes, may or may not be feasible. Little work has been done on examining the techniques for reducing locomotive noise, especially in-cab noise. Some studies have been done on the design of mufflers for the engine, but the primary concern was exterior noise. There is no information about the effect of mufflers on in-cab sound levels. Other than quieting the locomotive diesel engine itself or total redesign of the locomotive cab to isolate it from the main frame, the only way to reduce the effect of engine noise on the crew noise dose is to limit the exposure time or to restrict the locomotive to less noisy operations. There Is also a lack of information about the horn and brakes in terras of reduction of in-cab noise. However, it would seem reasonable that the in-cab sound levels from the horn and brakes could be reduced by physically relocating them or by making design changes such as adding a muffler to the brake pipe vent outlet.
142

developed to provide the information necessary for making the pass/fail assessment. This information, broken down by noise source, is given in Tables 44, 45, and 46 for engine notch 8, the horn, and the brake, respectively. These tables give the estimated noise dose (multiplied by 100) for each source as a function of the stationary sound level and the trip run time. The total predicted noise dose for the locomotive is the arithmetic sum of the three values (divided by 100). If this sum is less than 1.0 the
locomotive passes, and, if it is greater than 1.0 it fails. Thus, the sta
tionary screening test consists of measuring the three stationary sound levels, selecting an appropriate trip run time, looking up and adding the
three values from Tables 44, 45 and 46, dividing by 100, and comparing this with the pass/fail value of 1.0. For example, assume that the stationary sound levels for a particular locomotive were 86.0, 101.5 and 108.0 for en
gine notch 8, the horn and the brake, respectively. Also assume that the locomotive is used on the same run every day and that the trip run time
never exceeds 5 hours. The corresponding stationary screening test values are 25 for the engine notch 8, 9 for the horn and 5 for the brake, or a
total of 39. Dividing this by 100 gives a total predicted noise dose of
0.39. This is below the pass/fail value of 1.0, indicating that the locomo
tive passes.For stationary sound levels less than the lowest values given in Tables
44, 45, and 46, the estimated noise dose contribution can be determined from
the appropriate terra in Equation (16) for that particular source. Also, if the operational duty cycle Is known to be quite different from that used to develop the stationary screening test, these three tables should not be used. Rather, the noise dose should be estimated from Equation (16) by
143

144
Table 44 Stationary screening test values for engine notch 8. These values were calculated from thescreening test equation [Equation (16)] using P8 = 40% and Kg =■ -4 dB.
Trip ENCINE NOTCH 8 STATIONARYTEST--AVERAGE A-WEICHTEDSOUNDLEVEL. dB ("Slow" Meter Reeponoe) [Windowg OpenTime"
80.0 80.5 81.0 81.5 82.0 82.5 83.0 83.5 84.0 84.5 85.0 85.5 86.0 86.5 87.0 87.5 88.0 88.5 89.0 89.5 90.0 90.5 91.0 91.5 92.0 92.5 93.0 93.5 94.0 94.5 95.0 95.50.5 l 1 1 1 1 2 2 2 2 2 2 2 2 3 3 3 3 4 4 4 5 5 5 6 6 7 7 8 8 9 91.0 2 2 2 3 3 3 3 4 4 4 4 5 5 5 6 6 7 7 8 8 9 9 10 11 11 12 13 14 15 16 17 191.5 3 3 4 4 4 5 5 5 6 6 7 7 • 7 8 9 9 10 11 11 12 n 14 15 16 17 18 20 21 23 24 20 282.0 4 5 5 5 6 6 7 7 8 8 9 9 10 11 11 12 13 14 15 16 17 19 20 21 23 25 26 28 30 32 35 372.5 5 6 6 7 7 8 8 9 9 10 11 12 12 13 14 15 16 18 19 20 22 23 25 27 29 31 33 35 38 41 44 473.0 7 7 7 8 9 9 10 11 11 12 13 14 15 16 17 18 20 21 23 24 26 28 30 32 34 37 40 42 45 49 52 563.5 8 8 9 9 10 11 12 12 13 14 15 16 17 19 20 22 23 25 26 28 30 33 35 37 40 43 46 49 53 57 61 654.0 9 9 10 11 11 12 13 14 15 16 17 19 20 21 23 25 26 28 30 32 35 37 40 43 46 49 53 57 61 65 70 754.5 10 10 11 12 13 14 15 16 17 18 20 21 22 24 26 28 30 32 34 37 39 42 45 48 52 55 59 64 63 73 78 845.0 11 12 12 13 14 15 16 18 19 20 22 23 25 27 29 31 33 35 38 41 43 47 50 54 57 62 66 71 76 81 87 935.5 12 13 14 15 16 17 18 19 21 22 24 26 27 29 32 34 36 39 42 45 48 51 55 59 63 68 73 78 83 89 96 |1036.0 13 14 15 16 17 18 20 21 23 24 26 28 30 32 34 37 40 42 45 49 52 56 60 64 69 74 79 85 91 » r1046.5 14 15 16 17 19 20 21 23 25 26 28 30 32 35 37 40 43 46 49 53 57 61 65 .70 75 80 86 Q2 98J 1067.0 15 16 17 19 20 22 23 25 26 28 30 33 35 37 40 43 46 49 53 57 61 65 70 75 80 86 92 99 1067.5 16 17 19 20 22 23 25 26 28 30 33 35 37 40 43 46 49 53 57 61 65 70 75 80 86 92 99 1068.0 17 19 20 21 23 25 26 28 30 32 35 37 40 43 46 49 53 57 61 65 70 75 80 86 92 98 1058.5 18 20 21 23 24 26 28 30 32 34 37 40 42 45 49 52 56 60 64 69 74 79 85 91 98 r1059.0 20 21 22 24 26 28 30 32 34 37 39 42 45 48 52 55 59 64 68 73 78 84 90 96 r1039.5 21 22 24 25 27 29 31 34 36 39 41 44 47 51 55 58 63 67 72 77 83 89 95 102
10.0 22 23 25 27 29 31 33 35 38 41 43 47 50 54 57 61 66 71 76 01 87 93 10010.5 23 24 26 28 30 32 35 37 40 43 46 49 52 56 60 65 69 74 78 05 91 98 105 PAIL- SCREENI:g tzs11.0 24 26 27 29 32 34 36 39 42 45 48 51 55 59 63 68 72 78 83 89 96 10311.5 25 27 29 31 33 35 38 41 44 47 50 54 57 62 66 71 76 81 87 93 10012.0 26 28 30 32 34 37 40 42 45 49 52 56 60 64 69 74 79, 85 91 97 104
Trip"Run ENCINE NOTCH 8 STATIONARY TEST—AVERAGE A-WEIGHTED SOUND LEVEL, dB ("Slow" Meter Response) [Windows Open]Tine'’Tt 96.0 96.5 97.0 97.5 98.0 98.5 99.0 99.5100.0 100.5101.0 101.5102.0 102.5103.0103.5104.0104.5105.0105.5106.0106.5107.0107.5108.0108.5109.0109.5110.0 110.50.5 10 11 11 12 13 14 15 16 17 19 20 21 23 25 26 28 30 32 35 37 40 43 46 49 53 57 61 55 70 751.0 20 21 23 25 26 28 30 32 35 37 40 43 46 49 53 57 61 65 70 75 80 86 92 99J 106 113 121 13'~- 139 1491.5 30 32 34 37 40 42 45 49 52 56 60 64 69 74 79 85 91 97 106 112 120 129 138 1482.0 40 43 46 49 53 57 61 65 70 75 80 86 92 99 1106 113 121 1302.5 50 54 57 62 66 71 76 81 87 93 100 107 115 1233.0 60 64 69 74 79 85 91 97 106 1123.5 70 75 80 86 92 99 1106 1144.0 80 86 92 9B 106 1134.5 90 96 103 1115.0 100 1075.56.57.07.58.08.5 9.09.5
10.010.511.011.512.0
LOCOMOTIVE FAILS STATIONARY SCREENING TEST

145
Table 45 . Stationary screening test values for the horn. Thesescreening test equation [Equation (16)] using PH =» 6%
values were calculated from the and Kjj = 5 dB.
Trip"RunTime"Tt
HORN STATIONARYTEST--MAXIMUM A-WEIGHTED SOUND LEVEL, dB ("Slow" Meter Response) [Windows Open]
90.0 90.5 91.0 91.5 92.0 92.5 93.0 93.5 94.0 94.5 ■95.0 95.5 96.0 96.5 97.0 97.5 9B.0 98.5 99.0 99.5 100.0 100.5 101.0 101.5 102.0 102.5 103.00.5 0 0 0 0 0 0 .0 0 0 0 0 0 0 0 0 1 1 1 1 1 1 1 1 1 1 1 11.0 0 0 0 0 0 1 1 1 1 1 1 1 1 1 1 1 1 1 1 1 1 1 2 2 2 2 21.5 1 1 1 1 1 1 1 1 1 1 1 1 1 1 2 2 2 2 2 2 2 3 3 3 3 32.0 1 1 1 1 1 1 1 1 1 1 1 2 2 2 2 2 2 2 3 3 3 3 3 4 4 4 52.5 1 1 1 1 1 1 1 2 2 2 2 2 2 2 2 3 3 3 3 3 4 4 4 5 5 5 63.0 1 1 1 1 1 2 2 2 2 2 2 2 3 3 3 3 3 4 4 4 4 5 5 6 6 6 73.5 1 1 2 2 2 .2 2 2 2 2 3 3 3 3 3 4 4 4 5 5 5 6 6 6 7 7 84.0 1 2 2 2 2 2 2 2 3 3 3 3 3 4 4 4 5 5 5 6 6 6 7 7 8 8 94.5 2 2 2 2 2 2 3 3 3 3 3 4 4 4 4 5 5 5 6 6 7 7 8 8 9 10 105.0 2 2 2 2 2 3 3 3 3 3 4 4 4 5 5 5 6 6 7 7 7 8 9 9 10 11 115.5 2 2 2 3 3 3 3 3 4 4 4 4 5 5 5 6 6 7 7 8 8 9 9 10 11 12 126.0 2 2 3 3 3 3 3 4 4 4 4 5 5 6 6 6 7 7 8 8 9 10 10 11 12 13 146.5 2 3 3 3 3 3 • 4 4 4 5 5 5 6 6 6 7 7 8 8 9 10 10 11 12 13 14 157.0 3 3 3 3 3 4 4 4 5 5 5 6 , 6 6 7 7 8 9 9 10 10 11 12 13 14 15 167.5 3 3 3 3 4 4 4 5 5 5 6 6 6 7 7 8 9 9 10 10 11 12 13 14 15 16 178.0 3 3 3 4 4 4 5 5 5 6 6 6 7 7 8 8 9 10 10 11 12 13 14 15 16 17 188.5 3 3 4 4 4 5 5 5 6 6 6 7 7 8 8 9 10 10 11 12 13 14 15 16 17 18 199.0 3 4 4 4 4 5 5 5 6 6 7 7 8 8 9 10 10 11 12 13 13 14 15 17 18 19 209.5 4 4 4 4 5 5 5 6 6 7 7 8 8 9 9 10 11 12 12 13 14 15 16 18 19 20 2210.0 4 4 4 5 5 5 6 6 7 7 7 8 9 9 10 11 11 12 13 14 15 16 17 18 20 21 2310.5 4 4 5 5 5 6 6 6 7 7 8 8 9 10 10 11 12 13 14 15 16 17 18 19 21 22 2411.0 4 4 5 5 5 6 6 7 7 8 8 9 9 10 11 12 12 13 14 15 16 18 19 20 22 23 2511.5 4 5 5 5 6 6 7 7 7 8 9 9 10 11 11 12 13 14 15 16 17 18 20 ' 21 23 24 2612.0 4 5 5 6 6 6 7 7 8 8 9 10 10 11 12 13 14 15 16 17 18 19 21 22 24 25 27
Trip"RunTime"HORNSTATIONARY TEST--MAXIMUM A-WEIGHTEDSOUND LEVEL, dB cSlow" Meter Response) [Windows Open]
Tt 103.5 104.0 104.5 105.0 105.5 106.3 106.5 107.0 107.5 108.0 108.5 109.0 109.5 110.3 110.5 111.0 111.5 112.0 112.5 113.0 113.5 114.0 114.5 115.00.5 1 1 1 1 2 2 2 2 2 2 2 3 3 3 3 3 4 4 4 5 5 5 61.0 2 3 3 3 3 3 4 4 4 5 5 5 6 6 6 7 7 8 8 9 10 10 111.5 4 4 4 4 5 5 6 6 6 7 7 8 8 9 10 10 11 12 13 14 15 16 172.0 5 5 6 6 6 7 7 8 8 9 10 10 11 12 13 14 15 16 17 18 19 21 222.5 6 7 7 7 8 9 9 10 11 11 12 13 14 15 16 17 18 20 21 23 24 26 283.0 7 8 8 9 10 10 11 12 13 14 15 16 17 18 19 21 22 24 25 27 29 31 343.5 9 9 10 10 11 12 13 14 15 16 17 18 20 21 23 24 26 28 30 32 34 37 394.0 10 10 11 12 13 14 15 16 17 18 19 21 22 24 26 28 30 32 34 36 39 42 454.5 11 12 13 13 14 16 17 18 19 20 22 24 25 27 29 31 33 36 38 41 44 47 50 s5.0 1? 13 14 15 16 17 18 20 21 23 24 26 28 30 32 34 37 40 42 45 49 52 56 :5.5 13 14 15 16 18 19 20 22 23 25 27 29 31 33 35 38 41 44 47 50 54 57 626.0 15 16 17 18 19 21 22 24 25 27 29 31 34 36 39 41 44 48 51 55 58 63 47 PA IL . t6.5 16 17 18 19 21 22 24 26 28 30 32 34 36 39 42 45 48 51 55 59 63 68 73 > 1 n l L1 ibif.i ! ;7.0 17 18 20 21 22 24 26 28 30 32 34 37 39 42 45 48 52 55 59 64 68 73 787.5 18 20 21 22 24 26 28 30 32 34 37 39 42 45 48 52 55 59 64 68 73 78 848.0 19 21 22 24 26 28 30 32 34 36 39 42 45 48 51 55 59 63 68 73 78 84 90 i8.5 21 22 24 25 27 29 31 34 36 39 41 44 48 51 55 59 63 67 72 77 83 89 959.0 22 23 25 27 29 31 33 36 38 41 44 47 50 54 58 62 66 71 76 82 88 94 101 ’9.5 23 25 27 28 31 33 35 38 40 43 46 50 53 57 61 65 70 75 81 86 93 9910.0 24 26 28 30 32 34 37 40 42 45 49 52 56 60 64 69 74 79 85 91 97 10410.5 26 27 29 31 34 36 39 42 45 48 51 55 59 63 68 72 78 83 89 96 J 10211.0 27 29 31 33 35 38 41 44 47 50 54 57 62 66 71 76 81 87 93 10011.5 28 30 32 34 37 40 42 46 49 52 56 60 64 69 74 79 85 91 98 10547 51 55 58 63 67 72 77 83 89 95 102
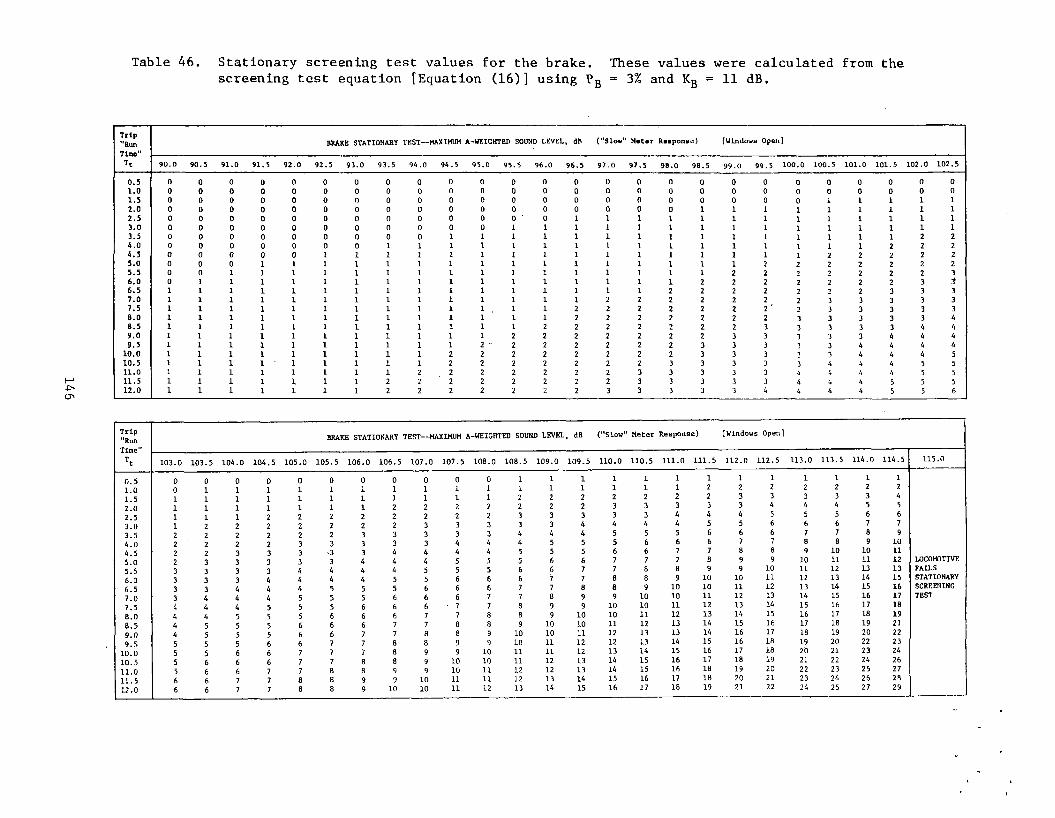
146
Table 46. Stationary screening test values for the brake. These values were calculated from thescreening test equation [Equation (16)] using PB = 3% and Kg = 11 dB,
Trip"RunTime"Tt
BRAKE STATIONARYTEST--MAXIMUMA-WEIGHTED SOUND LEVEL, dB ("SW Meter Reaponeu) (Windows Open]90.0 90.5 91.0 91.5 92.0 92.5 93.0 93.5 94.0 94.5 95.0 95.5 96.0 96.5 97.0 97.5 98.0 98.5 99.0 99.5 LOO.O 100.5 101.0 101.5 102.0 102.5
0.5 0 0 0 0 0 0 0 0 0 0 0 0 0 0 0 0 0 0 0 0 0 0 0 0 0 01.0 0 0 0 0 0 0 0 0 0 0 0 0 0 0 0 0 0 0 0 0 0 0 0 0 0 01.5 0 0 0 0 0 0 0 0 0 0 0 0 0 0 0 0 0 0 0 0 0 1 l 1 1 12.0 0 0 0 0 0 0 0 0 0 0 0 0 0 0 0 0 0 1 1 1 1 1 1 1 12.5 0 0 0 0 0 0 0 0 0 0 0 0 ' 0 1 1 1 1 1 1 1 1 1 1 1 1 13.0 0 0 0 0 0 0 0 0 0 0 0 1 1 1 1 1 1 1 1 1 1 1 1 13.5 0 0 0 0 0 0 0 0 0 1 1 1 1 1 1 1 1 1 1 I 1 l 1 2 24.0 0 0 0 0 0 0 0 1 1 1 1 1 1 1 l 1 1 1 1 1 1 2 2 24.5 0 0 0 0 0 l 1 1 1 1 1 1 1 1 1 1 1 1 1 1 1 2 2 2 2 25.0 0 0 0 1 1 1 1 1 1 1 1 1 1 1 L 1 1 2 2 2 2 2 2 25.5 0 0 1 1 1 1 1 1 1 1 1 1 1 1 1 1 1 2 2 2 2 2 2 2 36.0 0 1 1 1 1 1 1 1 1 1 1 1 1 1 1 1 1 2 2 2 2 2 2 2 3 3f6.5 1 1 1 1 1 1 1 1 1 1 1 1 1 1 1 1 2 2 2 2 2 2 2 3 3 37.0 1 1 1 1 1 1 1 1 1 1 1 1 1 1 2 2 2 2 2 2 2 3 3 3 3 37.5 1 1 1 1 1 1 1 1 1 1 1 1 1 2 2 2 2 2 2 2 ‘ 2 3 3 3 3 38.0 1 1 1 1 1 1 1 1 1 1 1 1 1 2 2 2 2 2 2 2 3 3 3 3 3 48.5 1 1 1 1 1 1 1 1 1 1 1 1 2 2 2 2 2 2 2 3 3 3 3 3 4 49.0 1 1 1 1 1 1 1 1 1 1 1 2 2 2 2 2 2 2 3 3 3 3 3 4 4 49.5 1 1 1 1 1 1 1 1 1 1 2 •' 2 2 2 2 2 2 3 3 3 3 4 4 4 410.0 1 1 1 1 1 1 1 1 1 2 2 2 2 2 2 2 2 3 3 3 3 3 4 4 4 510.5 l 1 1 1 1 1 1 1 1 2 2 2 2 2 2 2 3 3 3 3 3 4 4 4 5 511.0 1 1 1 1 1 1 1 1 2 2 2 2 2 2 2 3 3 3 3 3 4 4 4 4 5 511.5 1 1 1 1 1 1 1 2 2 2 2 2 2 2 2 3 3 3 3 3 4 i, 4 5 5 512.0 1 1 1 1 1 1 1 2 2 2 2 2 2 2 3 3 3 3 3 4 4 4 4 5 5 6
Trip"RunTime"h
BRAKE STATIONARYTEST—MAXIMUM A-WEIGHTED SOUND LEVEL dB ("Slow’ Meter Response) [Windows Open]
103.0 103.5 104.0 104.5 105.0 105.5 106.0 106.5 107.0 107.5 108.0 108.5 109.0 109.5 110.0 110.5 111.0 111.5 112.0 112.5 113.0 113.5 114.0 114.5 115.00.5 0 0 0 0 0 0 0 0 0 0 0 1 1 1 1 1 1 1 1 1 1 1 1 11.0 0 1 1 1 1 1 1 1 1 1 1 1 1 1 1 1 1 2 2 2 2 2 2 21.5 1 1 1 1 1 1 1 1 1 1 1 2 2 2 2 2 2 2 3 3 3 3 3 42.0 1 1 1 1 1 1 1 2 2 2 2 2 2 2 3 3 3 3 3 4 4 4 5 52.5 1 1 1 2 2 2 2 2 2 2 2 3 3 3 3 3 4 4 4 5 5 5 6 63.0 1 2 2 2 2 2 2 2 3 3 3 3 3 4 4 4 4 5 5 6 6 6 7 73.5 2 2 2 2 2 2 3 3 3 3 3 4 4 4 5 5 5 6 6 6 7 7 8 94.0 2 2 2 2 3 3 3 3 3 4 4 4 5 5 5 6 6 6 7 7 8 8 9 104.5 2 2 3 3 3 3 3 4 4 4 4 5 5 5 6 6 7 7 8 8 9 10 10 115.0 2 3 3 3 3 3 4 4 4 5 5 5 6 6 7 7 7 8 9 9 10 11 11 12 LOCOMOTIVE5.5 3 3 3 3 4 4 4 4 5 5 5 6 6 7 7 8 8 9 9 10 11 12 13 13 PAILS6.0 3 3 3 4 4 4 4 5 5 6 6 6 7 7 8 8 9 10 10 11 12 13 14 15 STATIONARY6.5 3 3 4 4 4 5 5 5 6 6 6 7 7 8 8 9 10 10 11 12 13 14 15 16 SCREENING7.0 3 4 4 4 5 5 5 6 6 6 7 7 8 9 9 10 10 11 12 13 14 15 16 17 TEST7.5 4 4 4 5 5 5 6 6 6 • 7 7 8 9 9 10 10 11 12 13 14 15 16 17 188.0 4 4 5 5 5 6 6 6 7 7 8 8 9 10 10 11 12 13 14 15 16 17 18 198.5 4 5 5 5 6 6 6 7 7 8 8 9 10 10 11 12 13 14 15 16 17 18 19 219.0 4 5 5 5 6 6 7 7 8 8 9 10 10 11 12 13 13 14 16 17 18 19 20 229.5 5 5 5 6 6 7 7 8 8 9 9 10 11 12 12 13 14 15 16 18 19 20 22 2310.0 5 5 6 6 7 7 7 8 9 9 10 11 11 12 13 14 15 16 17 18 20 21 23 2410.5 5 6 6 6 7 7 8 8 9 10 10 11 12 13 14 15 16 17 18 19 21 22 24 2611.0 5 6 6 7 7 8 8 9 9 10 11 12 12 13 14 15 16 18 19 20 22 23 25 2711.5 6 6 7 7 8 8 9 9 10 11 11 12 13 14 15 16 17 18 20 21 23 24 26 2812.0 6 6 7 7 8 8 9 10 10 11 12 13 14 15 16 17 18 19 21 22 24 25 27 29

substi t u t i n g the app r o p r i a t e values for Pg, Pg and Pg for the particular
run under consideration.
The most d i f ficult part of this process is det e r m i n i n g what total trip
run time should be used. The most conservative appr o a c h is to use a value
of 12 hours, w h i c h is the legal limit for the number of hours of duty by one
crew. For the previous example, the total predicted noise dose would be
0.94 [(60 + 22 + 12)/100], w hich indicates that this l ocomotive could be
use d w i thout any time restrictions. If however, the total p r e d i c t e d noise
dose for a 12-hour trip routine is greater than 1.0, then restri c t i o n s must
be mad e on the cr e w exposure time, or abatement of the principal noise
s o u r c e s undertaken, as shown in Figure 19.
To get some idea of the impact of using this approach, the noise dose
was r e c a l c u l a t e d for the 13 test runs using a trip run time of 12 hours.
T h e s e results are g i v e n in Table 47. As shown in this table, on l y one ad
diti o n a l locom o t i v e (Number' 1) w o u l d fail. Thus, a total of two out of the
16 l o c o m o t i v e s that were tested would fail and require some type of remedial
a c t i o n to be taken. A l t h o u g h this represents over 10 percent of the locomo
tives tested, no e s t imates can be made regarding the entire locomotive popu
l a t i o n in the U.S. A m o r e substantial data base, relating the stationary
sound levels and i n-service noise dose for all types of l o c o motives of
v arying age, would be required to make these estimates with any degree of
c o n f i d e n c e .
6.5 Det e r m i n i n g the Principal Noise Source
One of the o bjectives of the s tationary screening test is to be able to
pinp o i n t the particular noise sources which are the p r imary c o n tributors to
i n - c a b n o i s e exposure. This is e s p e c i a l l y important for cases where the Lo
comotive fails the screening test and remedial action of some type is
147

Table 47. Comparison of the predicted noise- doses for the 18 test runs based on the actual trip run times and on an assumed value, of 12 hours.
TEST RUN NUMBER
PREDICTED NOISE DOSET1 — T>it "-dose Tt = 12 hours
1 0.51 1.272 1.10 2.533a 0.26 0.973b 0.31 0.954 0.03 0.255 0.06 0.186 0.26 0.637 0.26 0.958 0.18 0.789 0.08 0.3010 0.28 0.6811 0.41 0.8612 0.30 0.5313 0.06 0.1314 a 0.25 0.6814b 0.03 0.6815 0.26 0.7616 0.18 0.69
1 4 8
required. The procedure for determining which source is the primary contri
butor is simply to compare the relative magnitudes of the stationary screen
ing test values. For example, if the values are 82 for engine notch 8, 16
for the horn and 6 for the brake, the engine is the primary source. An}'
strategies for reducing the crew noise exposure should concentrate on engine
noise, which as discussed previously, may be most effectively accomplished
by restricting the crew exposure time or the type of operation for which the
locomotive is used. Of course, the locomotive does not have to fail the
screening test to justify efforts to reduce the crew noise exposure. For
example, if the stationary screening test values are 34 for engine notch 8,
36 for the horn and 8 for the brake, it may be desirable to reduce the con
tribution from the horn (since it is relatively large compared to most
cases) by relocating it or whatever other approach is feasible for reducing
the in-cab sound level.
6.6. Conclusions and Recommendations
The basic conclusion that can be drawn is that the stationary screening
test is a reasonable approach to making a pass/fail assessment of locomotive
crew noise exposure. The primary reason that it is acceptable is that the
majority of cases (at least for those locomotives examined in this study)
are well below the pass/fail cutoff. Although the procedure appears to be
acceptable as discussed here, additional data (particularly data near or
above the pass/fail cutoff, if they exist) are necessary to improve the sta
tistical confidence of the stationary screening test prediction. This might
eliminate the need for verification testing, although this option should al
ways be available. While additional data may not be critical at this time,
if the noise exposure criterion were reduced to 85 dB at 8 hours as proposed
by NIOSH, a serious problem could arise. Not only would the number of
149

locomotives exceeding the pass/fail cutoff increase, but the stationary
screening test procedure would have to be redeveloped. More data would be
needed to improve the accuracy and confidence of the noise dose predictions
because more locomotives would be near the pass/fail cutoff. These data
would not necessarily have to be as extensive as the information obtained in
this study. Measurements of the stationary sound levels with a sound level
meter and the in-service noise dose with a noise dosimeter would be suffi
cient to verify the stationary screening test procedure.
In addition to obtaining more data to verify the stationary screening
test procedure, work should be done on developing noise control techniques
for locomotive cabs. As discussed in footnote 13 on page 142, little infor
mation is available on methods for reducing in-cab locomotive noise. If
more stringent hearing conservation criteria, such as those proposed by
NIOSH [9], are adopted, these techniques may be necessary to reduce the
noise exposure below the allowable limits. Specific areas of possible
research are:
■ investigation of approaches for quieting locomotive noise generated by the diesel engine and auxiliary equipment, such as compressors and cooling fans,
■ design of locomotive cabs to provide better vibration isolation and acoustic absorption characteristics,
■ development of abatement techniques for brake pipe venting (e.g., moving outlet outside of cab or designing muffler for the outlet), and
■ development of techniques for reducing horn noise (e.g., moving the horn location or design of a highly directional horn which has significantly reduced back radiation [39]).
Thus, collection of additional data to verify the stationary screening L^st
procedure and development of feasible noise abatement techniques are
recommended as the next steps for dealing with in-cab locomotive noise.
150
7.0 APPENDIX A. DESCRIPTIONS OF LOCOMOTIVE CHARACTERISTICS AND TRAIN PARAMETERS
This appendix contains descriptions of the locomotives and corresponding train make-ups examined in this study. Also listed here are
summaries of the trip logs for the 18 test runs. This information is
broken-down as follows:
Table A-l - locomotive descriptions Table A-2 - list of bell and horn locationsFigure A-l - illustration of bell locations Figure A-2 - illustration of horn locationsTable A-3 - description of other locomotives used in lead consist and as
helpersTable A-4 - description of the train make-up Table A-5 - description of the 18 test runs Table A-6 - trip log for test runs 1, 2, and 3aTable A-7 - trip log for test runs 3b, 4, 5, and 6Table A-8 - trip log for test runs 7, 8, 9, and 10Table A-9 - trip log for test runs 11, 12, and 13Table A-10 - trip log for test runs 14a, 14b, 15 and 16.
151

Table A-l. Descriptions of the sixteen test locomotives
ENGINE DESCRIPTION
LOCOMOTIVENUMBER
MANUFACTURER * MODELNUMBER
DATE OF MANUFACTURE Type Des (.gn
Number of Cylinders . Horsepower
Numbin’ ol Truel Lnn Mo to rs
1 F.MP GP38 1970 l45 2-stroke,naturally aspirated
16 2000 4
2 EMTJ CP9 1957 567 2-stroke,naturally aspirated
16 1750 4
3 EMD sn4o 19 70 64 5 2-stroke,turbocharged
16 3000 6
4 GE U25B 1982 FDL-16 4-stroke,turbocharged
16 2500 4
5 GE 112 5C 1965 FDT.-16 4-stroke,turbocharged
16 2500 6
6 GE U33C 1968 FDL-1 6 4-stroke,turbocharged
16 3300 6
7 EMD CP40 1970 645 2-stroke,turbocharged
16 3000 4
8 GE t/188 1973 FDL-8 4-stroke,turbocharged
s 1800 4
9 0" 1970 FDL-16 4-stroke,turbocharged
16 3600 -
10 EMD S W 5 . 1974 645 2-stroke,turbocharged
20 3600 0I
u EMD s d40 1966 645 2-stroke,turbocharged
16 3000 6- -._1
12 GE U30C 1968 FDL-16 4-stroke,turbocharged
16 3000 6 !
n GE U33C 1970 FDL-16 4-stroke,turbocharged
16 3300 6
14 EMI) SD24 1959 567 2-stroke,turbocharged
16 2400 61
15 EMD SD35 • 1965 567 2-stroke,turbocharged
16 2500 6!
16 GE U23B 1975 FDL-12 4-stroke,turbocharged
12 2250 4 |
The manufacturer and model number of the 16 locomotives are identified in order to adequately describe the tests conducted in this program* In no case does such Identification Imply recommendation or endorsement by'the National Bureau of Standards.
152

Table A-2. List of bell and horn locations for the sixteen test locomotives. See Figures A-l and A-2 for illustration of theselocations.
LOCOMOTIVE DIRECTION BELL-- 1 “ .... —i
HORNNUMBER OF TRAVEL LOCATION Cluster Location
Number of Forward Directed
Homs—
Number of Rearward Directed
Horns
1 short hood forward
B1 HI—
2 N/A
2 long hood forward
N/A H2 3 0
3 short hood forward
B1 HI 2 1
4 short hood forward
B2 H3 2 1
5 short hood forward
B3 113 3 0
. 6 short hood forward
B3 H3 2 1
7 short hood forward
B1 HI 3 N/A
8 short hood forward
B2 •' H3 3 2
9 short hood forward
B2 H3 N/A N/A
10 short hood forward
B4 H4 . 2 1
11 short hood forward
B5 HI . 2 1
12 short hood forward
B6 H3 2 1
13 short hood forward
B6 H3 2 1
14 short hood forward
B7 H5 3 0
15 short hood forward
B7 H5 3 0
16 long hood forward
B8 H6 3 0
153

Figure A-l. Illustration of various locations where the bells were counted.
SHORT HOOD DIRECTION LONG HOOD DIRECTION — ►
Bl - Brakeman's side, under the bod y of the locomotive, ahead of the fuel tank
B2 - Same as Bl except on engineer's side of locomotive
33 - Brakeman's side of the locomotive, next to the rear w i n d o w of the cab
B4 - Front edge of the locomotive cab roof, to the brakeman's side of the cen t e r of the cab
B5 - Center of the locomotive cab roof
B6 - On top of locomotive body, rearward of the cab
B7 - S u s pended from front hood of locomotive (short hood forward)
B8 - Suspended from front hood of l ocomotive (long hood forward)
154
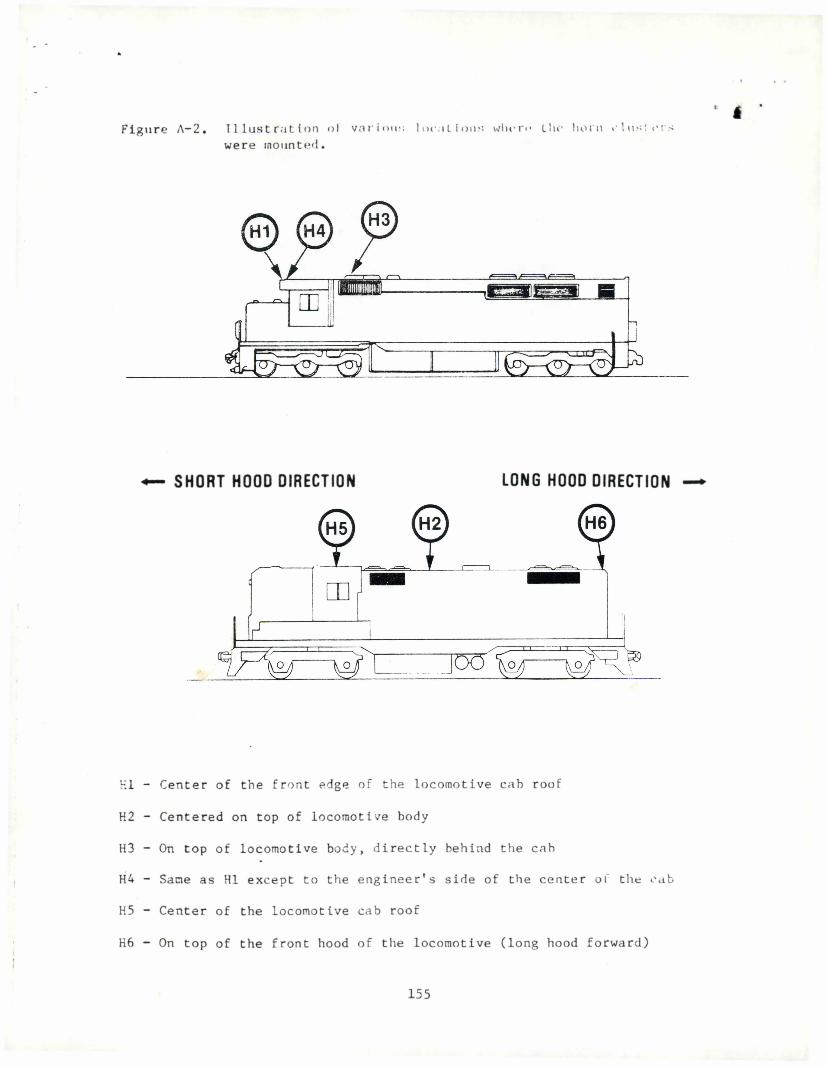
( M Si
Figure A-2. Illustration of various were mounted.
local ions when* lire horn clust
— SHORT HOOD DIRECTION LONG HOOD DIRECTION — ►
HI - Center of the front edge of the locomotive cab roof
H2 - Centered on top of locomotive body
H3 - On top of locomotive body, directly behind the cab
H4 - Same as HI except to the engineers side of the center of the cab
H5 - Center of the locomotive cab roof
H6 - On top of the front hood of the locomotive (long hood forward)
155

"V***
' % 1
Table A-3 General descriptions of the road and helper locomotives used to power each train.
71ST i.rad f.os*; rs'J HELPER UNITS■:rlpf ionr»l Hi*cr ipli.morAUN TIME )F T»AY Trailing On Us H1 per NnIts
"Grew Grew Nn. of Unit Unto of Nn. Of Unit Hate a! l.o- ;u Ion ■ i!' HeLpuiNUMBER On Off Units No. Manwf. IIP l.uinment s iJn r. s No. Mnnuf. III1 Units In Train Comint n t sl 18:47 03:00 3 N/A N/a None•> 08:00 15:52 3 1 1963 22 60 Trailing unit l wan nhut Nopr-
2 1973 2000 down nt 13:45.3a 20:18 01:03 1 1968 3000 None3b 01:03 09:30 2 1968 3f»00
3 1968 30004 16:12 19:00 V 1965 2500 None5 09:00 17:30 l 1965 2500 None
2 1968 33003 1965 2500
6 09: 20 18:00 1 1968 3300 None2 1965 25007 05:12 12:10 l 1966 3000 None8 14: 37 20:30 2 1 1971 3600 None.9 05:00 11:30 2 l 1970 3600 None10 19:51 03:00 4 L 1968 3600 Trailing ur.lt 3 was added 1 1974 3600 39 eftrs ahead of
2 1966 3000 to the consist at ?.’.:70, 2 1966 3600 caboose3 1973 1750
11 12:1* 22:30 3 1 1969 3600 l 1968 3600 24 cars ahead of Helper units werei
2 1972 3600 2 1969 3600 caboose switched Into the train at 14 :16 and were switched out of the train at 18:09.1 5 ii:;; 22:15 3 1 1968 2300 Because of mechanical pro- 1 1977 2500 Units 1-6 — 51 All helper units were; 1970 2300 blems with trailing units 2 1965 2 500 cars ahead of switched out of the] and 2. units 4-7 were caboose. train ac ]6:35.3 1969 3000 added to the consist at 3 1970 23004 3 967 3600 14;s0. Unit 6 was never operational during the 4 1977 1750 caboose.
19 70 3600 test run. 5 1974 1750ft 3 966 2800 Various combinations of 6 19 70 33007 1969 * 3600 these units were used depending upon whether the terrain was upgrade or downgrade.
7 1972 3300
13 10:50 20: V- 5 1 1966 3600 3 1 1975 3600 ”h> cars ahead of Helper units wore2 1962 2000 2 1969 uino eahoose switched Into the train aL 12:37 and were3 1973 3600 3 1-74 741‘f) switched out of the
, 4 1975 3600 train at 15:-0.lia [i 13 20:01 3 l I960 2400 None14h 20:28 22:10 2 1965 2500L5 13:22 20:00 3 l 1967 3600 None
2 1975 300016 L2: 26 19:15 3 ] 1973 2250 None9 1974 27.50
M/A - Data are not available.
i
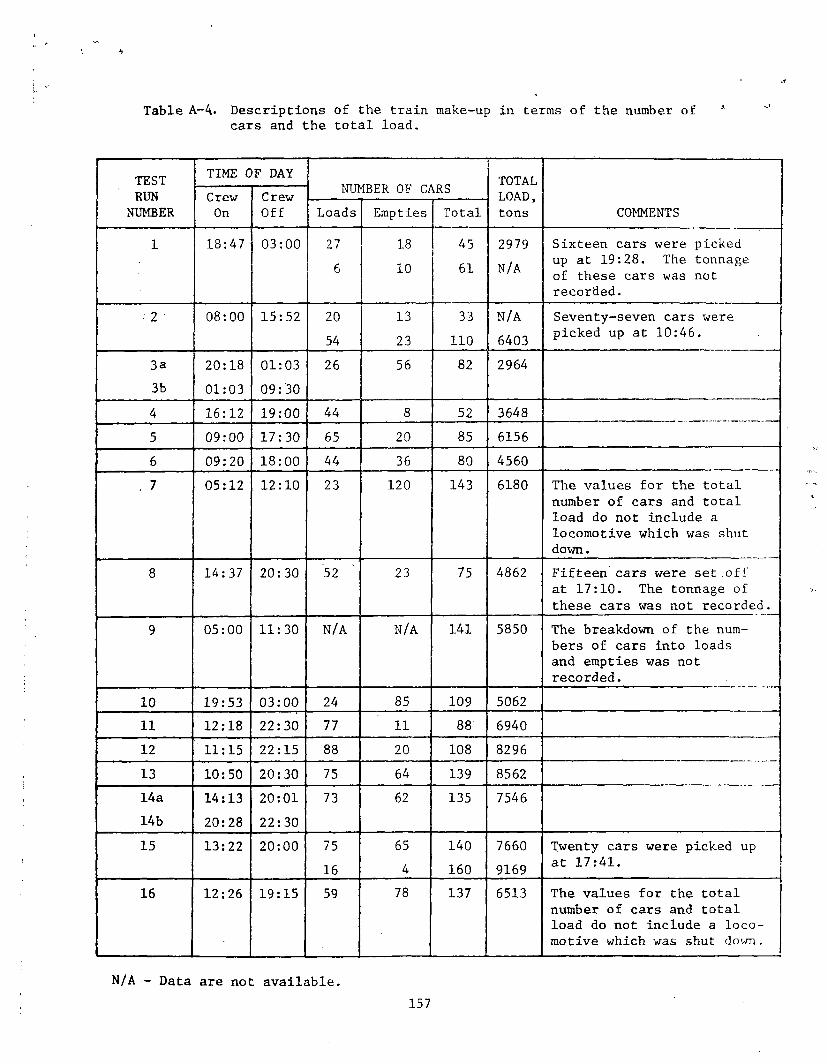
Table A-4. Descriptions of the train make-up in terms of the number ofcars and the total load.
TEST TIME OF DAY TOTALRUN Crew
OnCrewOff
NUPlBtK Ur UnKb LOAD,NUMBER Loads Empties Total tons COMMENTS
1 18:47 03:00 27 18 45 2979 Sixteen cars were picked6 10 61 N/A up at 19:28. The tonnage
of these cars was not recorded.
■ 2 08:00 15:52 20 13 33 N/A Seventy-seven cars were54 23 110 6403 picked up at 10:46.
3a 20:18 01:03 26 56 82 29643b 01:03 09:304 16:12 19:00 44 8 52 36485 09:00 17:30 65 20 85 61566 09:20 18:00 44 36 80 45607 05:12 12:10 23 120 143 6180 The values for the total
number of cars and total load do not include a locomotive which was shut down.
8 14:37 20:30 52 23 75 4862 Fifteen cars were set off at 17:10. The tonnage of these cars was not recorded.
9 05:00 11:30 N/A N/A 141 5850 The breakdown of the numbers of cars into loads and empties was not recorded.
10 19:53 03:00 24 85 109 506211 12:18 22:30 77 11 88 694012 11:15 22:15 88 20 108 829613 10:50 20:30 75 64 139 856214a 14:13 20:01 73 62 135 754614b 20:28 22:3015 13:22 20:00 75 65 140 7660 Twenty cars were picked up
16 4 160 9169 at 17:41.16 12:26 19:15 59 78 137 6513 The values for the total
number of cars and total load do not include a locomotive which was shut down.
N/A - Data are not available.157

Table A-5. General descriptions of the eighteen lesL runs.
TESTRUN
NUMBERTIME OF DAY TOTAL TIME CREW
WAS ON TRAIN, hours
TYPE OF TRATN-
APPROXIMATE LENCTH OF RUN,2/ ::iilcs
CEMIKAI.Cruwon
Crowoff TERRAIN
1 18:47 03:00 8.22 local freight 90 undu laling2 08:00 15:52 7.87 local freight 90 undu lating3a 20:18 01:03 4. 75 through freight 100 mountainous3b 01:03 09:30 8.45 through freight 120 mountainous4 16:12 19:00 2.80 local freight 15 flat5 09:00 17:30 8.50 through freight 80 mountainous6 09:20 18:00 8.67 through freight 80 mountainous7 05: 12 12:10 6.97 local freight 80 flat8 14:37 20:30 5.88 local freight 80 flat9 05:00 11:30 6.50 through freight 80 flat10 19:53 03: 00 7.12 through freight 110 mounta Luous11 12:18 22:30 - ia . 2 0 through freight 160 mountainous12 11: 15
--- 122:15 11.00 through freight 150 moun t ainous
13 10: 50 20:30 9.67 through freight 200 mountainous14a 14:13 20:01 5.80 through freight 65 undulating14b 20:28 22:30 2.03 through freight 30 undulating15 13:22 20:00 6.63 local freight 95 undulating16 12:26__ :____ 19:15 6.82 through freight 110 undulating
— The only distinction intended between types of trains is that local freights involved switching cars into and out of the train at intermediate stops, whereas through freights did not.
— These are only approximate mileages given to help characterize the test runs. Exact mileages were not recorded.
158
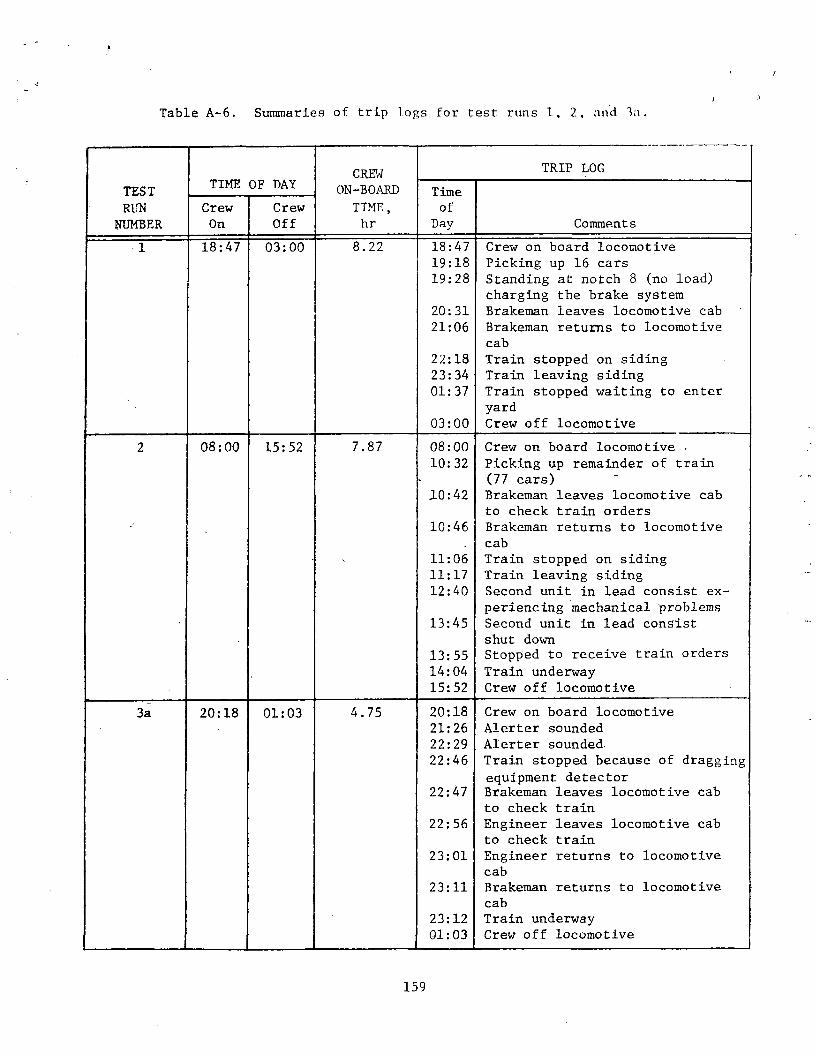
*
Table A-6. Summaries of trip logs for test runs 1, 2 , and la.
TIME OF DAY CREW TRIP LOGTEST ON-BOARD TimeRUN Crew Crew TIME, of
NUMBER On Off hr Day Comment s1 18:47 03:00 8.22 18:47 Crew on board locomotive
19:18 Picking up 16 cars19:28 Standing at notch 8 (no load)
charging the brake system20:31 Brakeman leaves locomotive cab21:06 Brakeman returns to locomotive
cab22:18 Train stopped on siding23:34 Train leaving siding01:37 Train stopped waiting to enter
yard03:00 Crew off locomotive
2 08:00 15:52 7.87 08:00 Crew on board locomotive •10:32 Picking up remainder of train
- (77 cars)10:42 Brakeman leaves locomotive cab
to check train orders10:46 Brakeman returns to locomotive
cab11:06 Train stopped on siding11:17 Train leaving siding12:40 Second unit in lead consist ex
periencing mechanical problems13:45 Second unit in lead consist
shut down13:55 Stopped to receive train orders14:04 Train underway15:52 Crew off locomotive
3a 20:18 01:03 4.75 20:18 Crew on board locomotive21:26 Alerter sounded22:29 Alerter sounded22:46 Train stopped because of dragging22:47
equipment detectorBrakeman leaves locomotive cabto check train
22:56 Engineer leaves locomotive cab to check train
23:01 Engineer returns to locomotive cab
23:11 Brakeman returns to locomotive cab
23:12 Train underway01:03 Crew off locomotive j
159
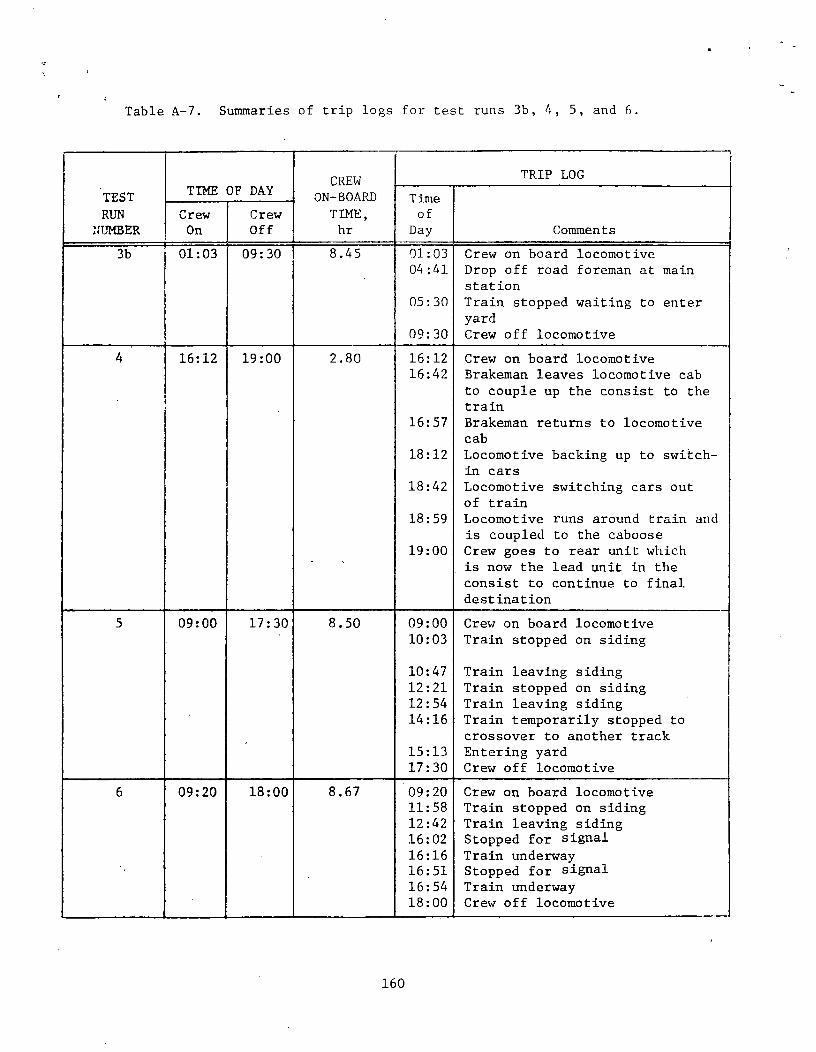
Table A-7. Summaries of trip logs for test runs 3b, 4, 5, and 6.
CREW TRIP LOGTEST TIME OF DAY ON-BOARD T imeRUN Crew Crew TIME, of
NUMBER On Off hr Day Comments3b 01:03 09:30 8.45 01:03 Crew on board locomotive
04:41 Drop off road foreman at main station
05:30 Train stopped waiting to enter yard
09:30 Crew off locomotive4 16:12 19:00 2.80 16:12 Crew on board locomotive
16:42 Brakeman leaves locomotive cab to couple up the consist to the train
16:57 Brakeman returns to locomotive cab
18:12 Locomotive backing up to switch- in cars
18:42 Locomotive switching cars out of train
18:59 Locomotive runs around train and is coupled to the caboose
19:00 Crew goes to rear unit which is now the lead unit in the consist to continue to final destination
5 09:00 17:30 8.50 09:00 Crew on board locomotive10:03 Train stopped on siding10:47 Train leaving siding12:21 Train stopped on siding12:54 Train leaving siding14:16 Train temporarily stopped to
crossover to another track15:13 Entering yard17:30 Crew off locomotive
6 09:20 18:00 8.67 09:20 Crew on board locomotive11:58 Train stopped on siding12:42 Train leaving siding16:02 Stopped for signal16:16 Train underway16:51 Stopped for signal16:54 Train underway18:00 Crew off locomotive
160

Table A-8. Summaries of trip logs for test runs 7, 8, 9, and 10.
TESTRUN
NUMBER
TIME OF DAY CREWON-BOARD TIME, hr
TRIP LOGTimeofDay Comments
CrewOn
CrewOff
7 05:12 12:10 6.97 05:12 Crew on board locomotive06:08 Stopped to set out cars06:48 Train underway06:52 Stopped to pick up cars07:38 Train underway09:00 Train stopped on siding10:03 Train leaving siding11:03 Stopped for signal11:07 Train underway12:10 Crew off locomotive
8 14:37 20:30 5.88 14:37 Crew on board locomotive16:45 Locomotive uncoupled from train
to set out cars17:10 Setting out 15 cars18:39 Train underway19:47 Moving through yard between two
rows of freight cars20:30 Crew off locomotive
9 05:00 11:30 6.50 05:00 Crew on board locomotive08:22 Train stopped on siding08:41 Train leaving siding09:37 Stopped waiting to enter yard11:30 Crew off locomotive
10 19:53 03:00 7.12 19:53 Crew on board locomotive20:48 Stopped waiting to leave yard20:54 Train underway22:20 Stopped to add additional loco-
motive, brakeman leaves locomo-tive cab
22:57 Brakeman returns to locomotive cab23:05 Train underway03:00 Crew off locomotive
161

Table A-9. Summaries of trip logs for test runs 11, 12, and 13.
CREW TRLP UOCTEST TIME OF DAY ON-BOARD T imeRUN Crew Crew TIME, of
NUMBER On Off hr Day Comments11 12:18 22:30 10.20 12:18 Crew on board locomotive
13:41 Train underway with two helper units in front of the test locomotive
14:05 Stopped to switch in all helper units
14:16 Train underway14:21 Stopped for signal14:30 Train underway15:28 Stopped for signal15:42 Train underway17:57 Stopped to cut out all helpers18:09 Train underway19:02 Train stopped on siding19:06 Train leaving siding19:19 Train slowed down while
approaching signal but not stopped because signal
■ - 20:12changedStopped waiting to enter yard
22:30 Crew off locomotive12 11:15 22:15 11.0 11:15 Crew on board locomotive
13:54 Stopped waiting for another train to clear
14:03 Train underway14:04 Stopped to add four locomotives
to lead consist14:40 Train underway16:11 Stopped to cut off helpers16:35 Train underway17:43 Train stopped on siding18:10 Train leaving siding22:15 Crew off locomotive
13 10:50 20:30 9.67 10:50 Crew on board locomotive12:26 Train leaving yard12:46 Stopped to pick up helpers15:30 Switching helpers out of train15:40 Train underway16:20 Train stopped on siding16:24 Train leaving siding17:12 Train stopped on siding17:58 Train leaving siding
, 20:30 Crew off locomotive
162

Table A-10. Summaries of trip logs for test runs i.4a, 14b, L5, and lo.
CREW TRIP LOGTEST TIME OF DAY ON-BOARD TimeRUN Crew Crew TIME, of
NUMBER On Off hr Day Comments14a 14:13 20:01 5.80 14:13 Crew on board locomotive
16:08 Stopped checking train because of sticking brakes
16:57 Train underway18:05 Hit two torpedoes18:07 Stopped checking train because
of sticking brakes18:12 Train underway20:01 Crew off locomotive (this crew
had worked the previous night and had to go off duty before reaching the final destination because of the twelve-hour limitation of service rule)
14b 20:28 22:30 2.03 20:28 Crew on board locomotive21:06 Waiting in yard to get clearance
to go to fueling rack22:30 Crew off locomotive
15 13:22 20:00 6.63 13:22 Crew on board locomotive15:46 Pulling into siding15:57 Train leaving siding (never came
to complete stop)17:12 Stopped to pick up 20 cars17:41 Train underway20:00 Crew off locomotive
16 12:26 19:15 6.82 12:26 Crew on board locomotive15:00 Cannot hear bell even
though engineer is using it. Will not throw the bell switch on the operational keyboard since you cannot tell when it is on.
19:15 Crew off locomotive |
163

8.0 REFERENCES[1] Peterson, A. P. G., and Gross, Jr., E. E., Handbook of Noise Measure
ment (General Radio Company, Concord, MA, 7th ed., 1972).[2] Department of Labor, Occupational Safety and Health Administration,
Occupational Safety and Health Standards, Title 29, Code of Federal Regulations, Part 1910, U. S. Federal Register 36_ (105), 10518 (May 29, 1971).
[3] Federal Railroad Safety Act of 1970, Public Law 91-458, October 16, 1970.
[4] Federal Railroad Administration, Advanced Notice of Proposed R.ule Making, Railroad Occupational Safety Standards, Title (*9, Code of Federal Regulations, Part 219, IJ. S. Federal Register 40 (46), 10693- 10697 (March 7, 1975).
[5] American National Standard SI.4-1971, Specification for Sound LevelMeters (American National Standards Institute, New York, NY, April 1971). ^
[6] Railroad Employees' Hours of Service Restriction, Public Law 91-169, December 26, 1969.
[7] Department of Labor, Occupational Safety and Health Administration, Occupational Noise Exposure — Proposed Requirements and Procedures, Title 29, Code of Federal Regulations, Part 1910, U. S. Federal Register (207), 37773-37778 (October 24, 1974).
[8] Federal Railroad Administration, Notice of Proposed Rulemaking, Locomotive Inspection, Title 49, Code of Federal Regulations, Parts 229 and 230, U. S. Federal Register 44 (99), 29604-29629 (May 21, 1979).
[9] Anon., Criteria for a Recommended Standard....Occupational Exposure to Noise, Report No. HSM 73-11001, U. S. Department of Health, Education, and Welfare, National Institute for Occupational Safety and Health, 1972.
[10] Robinson, D. W., The Relationships between Hearing Loss and Noise Exposure, AERO Report Ac32 (National Physical Laboratory, London, July 1968).
[11] Environmental Protection Agency, Railroad Noise Emission Standards, Title 40, Code of Federal Regulations, Chapter I, Part 201, U. S. Federal Register j41 (9), 2183-2195, January 14, 1976.
[12] Aurelius, J. P., The Sound Environment in Locomotive Cabs, U. S. Department of Transportation Report No. FRA-RP-71-2A (Systems Consultants Inc., New York, NY, July 1971).
[13] Campanella, A. J., Occupational Noise Measurement in Diesel Locomotives (Acculab, Columbus, OH, April. 7 , 1975).
164

>
[14] Campanella, A. J., Occupational Noise Measurement in a Switching Diesel Locomotive (Acculab, Columbus, OH, October 8, 1976).
[15] Rickley, E. J., Quinn, R. W., and Sussan, N. R., Noise Level Measurements of Railroads: Freight Yards and Wayside, II. S. Department of Transportation Report No. DOT-TSC-OST-73-46 (DOT Transportation Systems Center, Cambridge, MA, May 1974).
[16] Remington, P. J., and Rudd, M. J., An Assessment of Railroad Locomotive Noise, U. S. Department of Transportation Report No. DOT-TSC-OST-76-4/FRA-OR&D-76-142 (Bolt Beranek and Newman Inc., Cambridge, MA, August 1976).
[17] Campanella, A. J., Annex to Occupational Noise Measurements in Diesel Locomotives (Acculab, Columbus, OH, June 12, 1975).
[18] Storment, J. 0., Wood, C. D., and Mathis, R. J., A Study of Fuel Economy and Emission Reduction Methods for Marine and Locomotive Diesel Engines, U. S. Department of Transportation Report No. DOT-TSC- OST-75-41 (Southwest Research Institute, San Antonio, TX, September1975).
[19] Bender, E. K., Ely, R. A., Remington, P. J., and Rudd, M. J., RailroadEnvironmental Noise: A State of the Art Assessment, BBN Report No.2709 (Bolt Beranek and Newman Inc., Cambridge, MA, January 11, 1974).
[20] Jacobs, M. E., Fuel Efficiency Improvement in Rail Freight Transportation: Multiple Unit Throttle Control to Conserve Fuel, FRA Report No.FRA/ORD-78/13 (Federal Railroad Administration, U. S. Department of Transportation, Washington, D. C., February 1978).
[21] Blaine, D. G., Grejda, F. J., and Kahr, J. C., Braking Duty in North American Freight Train Service and Effects on Brake Equipment, Brake Shoes and Wheels, ASME Paper No. 78-RT-9 (Westinghouse Air Brake Company, Wilmerding, PA, 1978).
[22] Eck, H. C., The Modern Locomotive Handbook (The Railway Fuel and Operating Officers Association, Chicago, IL, 1976).
[23] Anon., Background Document for Railroad Noise Emission Standards,U. S. Environmental Protection Agency Report No. EPA-550/9-76-005 (EPA Office of Noise Abatement and Control, Washington, D.C.,December 1975).
[24] Peterson, W., Current Major Railroad Stats, Extra 2200 South — The Locomotive Newsmagazine, Issue 63, (10), 6 (January - March,1978).
[25] Manika, J. P., Electro-Motive Division of General Motors Corporation, private correspondence to M. A. Popjoy, American Association of Railroads, August 5, 1977.
165

(
[26] Popjoy, M. A., American Association of Railroads, private correspondence to R. M. Clarke, Office of Rail Safety Research, Federal Railroad Administration, August 10, 1977.
[27] Popjoy, M. A., American Association of Railroads, private correspondence to R. M. Clarke, Office of Rail Safety Research, Federal Railroad Administration, March 9, 1977.
[28] Anon., Information on Levels of environmental Noise Requisite to Protect Public Health and Welfare with an Adequate Margin of Safety, Ll’A Report No. 550/9-74-004 (IJ. S. environmental Protection Agency, Washington, D. C., March 1974).
[29] Close, W. H . , and Clarke, R. M . , Truck Noise-II, Interior and Exterior A-Weighted Sound Levels of Typical Highway Trucks, Report No. OST/TST- 72-2 (U. S. Department of Transportation, Washington, D. C . , July 1972).
[30] Morrison, D. W . , and Clarke, R. M., Regulation of Commercial Motor Vehicle Interior Noise Levels, SAE Paper No. 720697 (U. S. Department of Transportation, Washington, D. C., August 1972).
[31] Sharp, B. H . , and Weiss, W. R . , Correlation of Truck Cab Interior Noise to Existing Regulatory Limits, Report No. WCR 73-2 (Wyle Laboratories, El Segundo, CA, March 1973).
[32] ISO International Standard 3381-1976(E), Acoustics — Measurement of Noise Inside Railbound Vehicles (International Organization for Standardization, Geneva, 1976).
[33] SAE Recommended Practice J336a, Sound Level for Truck Cab Interior (Society of Automotive Engineers, Inc., Warrendale, PA, 1968).
[34] SAE Recommended Practice J919b, Operator Sound Level Measurement Procedure for Powered Mobile Construction Machinery — Singular Type Test (Society of Automotive Engineers, Inc., Warrendale, PA,1976).
[35] SAE Recommended Practice J1160, Operator Ear Sound Level Measurement Procedure for Snow Vehicles (Society of Automotive Engineers, Inc., Warrendale, PA, 1976).
[36] SAE Recommended Practice J1174, Operator Ear Sound Level Measurement Procedure for Small Engine Powered Equipment (Society of Automotive Engineers, Inc., Warrendale, PA, 1977).
[37] SAE Recommended Practice J1166, Operator Station Sound Level Measurement Procedure for Powered Mobile Earthmoving Machinery -~ Wort. Cycle Test (Society of Automotive Engineers, Inc., Warrendale, PA, 1976).
166

[38] Federal Highway Administration, Motor Carrier Safety Regulations, Title 49, Code of Federal Regulations, Part 393.94, U. S. Federal Register 38_ (215), 30881-30882 (November 8, 1973).
[39] Fisher, R. L., Toth, D. I)., Blomquist, D. S., and Forrer, J. S., Th Development and Testing of a Highly Directional Dual-Mode Electron) Siren, NBS Special Publication 480-28 (National Bureau of Standards Washington, D. C . , February 1978).
167

f
9 .0 ACKNOWLEDGMENTS
The author expresses his sincere appreciation to the organ i.z.:it ions wh '
contributed their tine, personnel and equipment to bring about the sure-s*~ V.
completion of this project. The list: of individuals who were involved t -.
this project is too long to give here, but their efforts arc* great lv appreci
ated. The author thanks the staff and personnel of the Federal Railroad Ad
ministration, Association of .American Railroads, Consolidated Rail Corpora
tion, Seaboard Coast Line Railroad Company, and Southern Railway System for
their support during this project. In particular, the advice and suggestions
of Mr. R. M. Clarke and Mr. R. J. McCown of the FRA were extremely useful.
The author also wishes to recognize the contributions made by the MBS
staff: Mr. J. S. Forrer, Mr. D. E. Mathews, Ms. T. M. Savoy, and Mr. C. 0.
Shoemaker, Jr ., for their work in developing the instrumentation system; Or.
D. M. Corley and Mr. R. L. Fisher, for assistance in data reduction and ana
lysis; Mr. D. R. Flynn, for help in evaluating the stationary screening test
model and review and comments on the final report; Ms. D. A. Neal and Ms. C.
Smith, for typing and preparation of the manuscript; and, in particular, Mr.
H rTiiiiiirn i
i
Assessment of Locomotive Crew In-Cab Occupational Noise Exposure04-Locomotives/Propulsion Systems ID:3117