Prediction of Rail Buckling - Federal Railroad Administration
Upload
khangminh22Category
view
1download
0
RailroadSafety Statistics
FINALREPORT
2001
JULY 2003

Railroad Safety Statistics-Annual Report 2001 04/01/2003
FOREWORD
The Federal Railroad Administration (FRA) has established an ultimate goal of “Zero Tolerance” for railroad-related accidents, injuries and fatalities. In pursuit of that goal, significant progress has been made, particularly over the past six years, in reducing the number of train collisions, derailments, highway-rail grade crossing incidents, and injuries to railroad workers. These results have been achieved because of a collaborative effort involving the FRA, railroad management, rail labor, equipment suppliers, and contractors, as well as other federal and state agencies whose mission involves ensuring railroad safety. Central to the success of this rail safety effort is the ability to understand the nature of rail-related accidents and to analyze trends in railroad safety.
The FRA’s Railroad Safety Statistics – Annual Report 2001 is intended as a resource for the FRA’s safety partners. It is also intended as a general reference source for individuals and organizations with an interest in rail safety issues. Statistical data, tables and charts are provided to depict the nature and cause of many rail-related accidents and incidents that occurred in 2001. Furthermore, selected historical data is included to provide a baseline for understanding the railroad industry’s improving safety performance.
It is hoped that the information provided in this publication will provide insight into the most significant safety issues facing the rail industry and, in turn, lead to continued rail safety improvements. Only by continuing our understanding about how and why railroad accidents and incidents occur, can we hope to approach our goal of “Zero Tolerance.” This edition of the Railroad Safety Statistics compiles previous safety bulletins prepared by the Federal Railroad Administration (FRA). These include: the Accident/Incident Bulletin; the Highway-Rail Crossing Accident/Incident And Inventory Bulletin; and the Trespasser Bulletin.The consolidation of accident/incident statistics previously contained in other publications provides the reader with a single source for a comprehensive overview of railroad safety.
The completeness and accuracy of the information presented in this bulletin are primarily dependent upon the data collection and reporting processes of the nation’s railroads. The FRA conducts routine audits of these procedures, but does not have sufficient resources to perform comprehensive reviews of each railroad’s reporting procedures. We extensively review and edit the reports we receive and make inquiry when information is incomplete or inconsistent.
Railroads are required by law to submit accident/incident reports within thirty days after the month to which they pertain. They are also required to update their report if the original information is incomplete or inaccurate. Railroads have until April 15 of the following year to “close out” their records and submit any updates to complete their file.
It is not possible to identify reportable events that were omitted from a railroad’s submission. Likewise, there may be instances where incorrectly reported information passes all reviews and is accepted. Although we attempt to be as vigilant as possible in both the editing and presentation of the accident/incident data reported, errors do occasionally occur.

Railroad Safety Statistics-Annual Report 2001 04/01/2003
Any questions, comments, or suggestions regarding the information contained in this publication should be brought to the attention of:
Federal Railroad Administration Office of Public Affairs (Stop 5) 1120 Vermont Ave., NW Washington, DC 20590
Phone number (202) 493-6024
This report and additional information about the FRA’s various programs are available on our Web site at http://www.fra.dot.gov.

Railroad Safety Statistics-Annual Report 2001 04/01/2003
CHAPTER 1
OVERVIEW OF ACCIDENTS/INCIDENTS AND RATES
Railroads began reporting accidents to the Federal Government following passage of the Reports Act of 1910. The current definitions describing reportable events were adopted in 1975 and have remained largely unchanged since then. A number of modifications to the record-keeping and reporting requirements were put in place for 1997. These modifications did not redefine what was to be reported but did expand the types of information being collected and the forms used for reporting. The changes made in 1997 were implemented for the purpose of collecting additional information necessary for safety analysis and to support the Federal Railroad Administration’s (FRA) overall goal of hazard elimination and risk reduction on the Nation’s railroads.
A railroad is required by Federal Railroad Administration (FRA) regulations at Title 49, Part 225 of the Code of Federal Regulations to use the current FRA Guide for Preparing Accident/Incident Reports (“Guide” or “reporting guide”) when preparing its monthly report. The instructions and interpretations contained in this publication are provided to assist railroads in meeting this obligation
“Accident/Incident” is the term used to describe the entire list of reportable events. These include collisions, derailments, and other events involving the operation of on-track equipment and causing reportable damage above an established threshold; impacts between railroad on-track equipment and highway users at crossings; and all other incidents or exposures that cause a fatality or injury to any person, or an occupational illness to a railroad employee.
Accidents/incidents are divided into three major groups for reporting purposes. These correspond to the following FRA forms:
Train accidents. A safety-related event involving on-track rail equipment (both standing and moving), causing monetary damage to the rail equipment and track above a prescribed amount. Reported on form FRA F 6180.54, RAIL EQUIPMENT ACCIDENT/ INCIDENT REPORT.(The threshold for 1998 was $6,600)
Highway-rail grade crossing incidents. Any impact between a rail and highway user (both motor vehicles and other users of the crossing) at a designated crossing site, including walkways, sidewalks, etc., associated with the crossing. Reported on form FRA F 6180.57, HIGHWAYRAIL GRADE CROSSING ACCIDENT/INCIDENT REPORT.
Other incidents. Any death, injury, or occupational illness of a railroad employee that is not the result of a “train accident” or “highway-rail incident.” Reported on form FRA F 6180.55a, RAILROAD INJURY AND ILLNESS SUMMARY.
A single form is usually sufficient to report most events; however, there are situations when multiple report forms are necessary. An example is a highway-rail crossing incident resulting in

Railroad Safety Statistics-Annual Report 2001 04/01/2003
reportable injuries. An accident of this type would require the completion of both a Form FRA F 6180.57 and a Form FRA F 6180.55a. A Form FRA F 6180.54 must also be prepared if reportable on-track equipment and track damage in this accident exceeds the current monetary threshold for train accidents.
Because of overlap in the reporting requirements, some incidents may fall into multiple categories. The incident described above would be counted as a highway-rail incident, but it would also be included in the train accident total. Another example is a motorist hurt in a highway-rail incident after driving around gates at the crossing site. This individual is reported as a “trespasser” on form FRA F 6180.55a, but the event is classified as a highway-rail incident.
If there is an overlap in the information found in different chapters, when possible, a separate column or row total is provided, or counts are excluded when they are more appropriate to another chapter. In the example of the trespasser injured in a highway-rail incident, this injury appears in the highway-rail chapter, but is excluded from the chapter on trespassing. The train accident counts in Chapter 5 include those highway-rail incidents causing reportable damage above the amount needed for reporting on form FRA F 6180-54. The user of this bulletin can exclude these, if desired, since the number of these are identified in most tables in this chapter.
This bulletin provides overall national totals as well as specific areas of safety concern. For example, Chapter 3 is a summary of all fatal and nonfatal casualties, regardless of the type of event causing them. Subsequent chapters summarizing train accidents, highway-rail incidents, employee and trespassing casualties, provide additional information on the events causing these casualties.
The data is presented in the following general format. First, there is a graphic historical review of the major indicators of railroad safety since 1975. Following this are overall totals for the 6-year period beginning with 1992, including summaries by railroad and states for this time frame. Next are a variety of tables and charts for the current year. The chapter for each major reporting area contains a description of the pertinent requirements and definitions associated with that specific accident/incident category.
Extensive consolidation of railroads has occurred over the years. In order to make a more valid comparison of major railroad systems, it was necessary to combine the information reported by predecessor railroads for the years prior to 1998. For example, data from railroads that made up the Southern Pacific Transportation System were merged into the Union Pacific counts.

Railroad Safety Statistics-Annual Report 2001 04/01/2003
CONTENTS
CHAPTER 1
OVERVIEW OF ACCIDENT/INCIDENTS AND RATES
Tables
1-1 Accidents/incident historical summary, Part I……………………………………………... 1-2 Accident/incident historical summary, Part II……………………………………………... 1-3 Summary by type incident and type person………………………………………………...1-4 Total casualties, by railroad…………………………………………………….……….…. 1-5 Total casualties, by state…………………………………………………………………… 1-6 Total employee on duty cases, by railroad…………………………………………………. 1-7 Train accidents by railroad, excluding highway-rail crossing incidents………………..….. 1-8 Train accidents by state, excluding highway-rail crossing incidents………………………. 1-9 Consists transporting hazardous material, by railroad………………………….………….. 1-10 Consists transporting hazardous material, by state….………………………………….….. 1-11 Total highway-rail crossing incidents, by railroad.………………………………………... 1-12 Total highway-rail crossing incidents, by state….…………………………………………. 1-13 Highway-rail crossing incident casualties, by railroad…………………………………….. 1-14 Highway-rail crossing incident casualties, by state………………………………………... 1-15 Trespasser casualties, by railroad, excluding highway-rail crossing incidents.…………… 1-16 Trespasser casualties, by state, not at highway-rail crossings………………………….…..
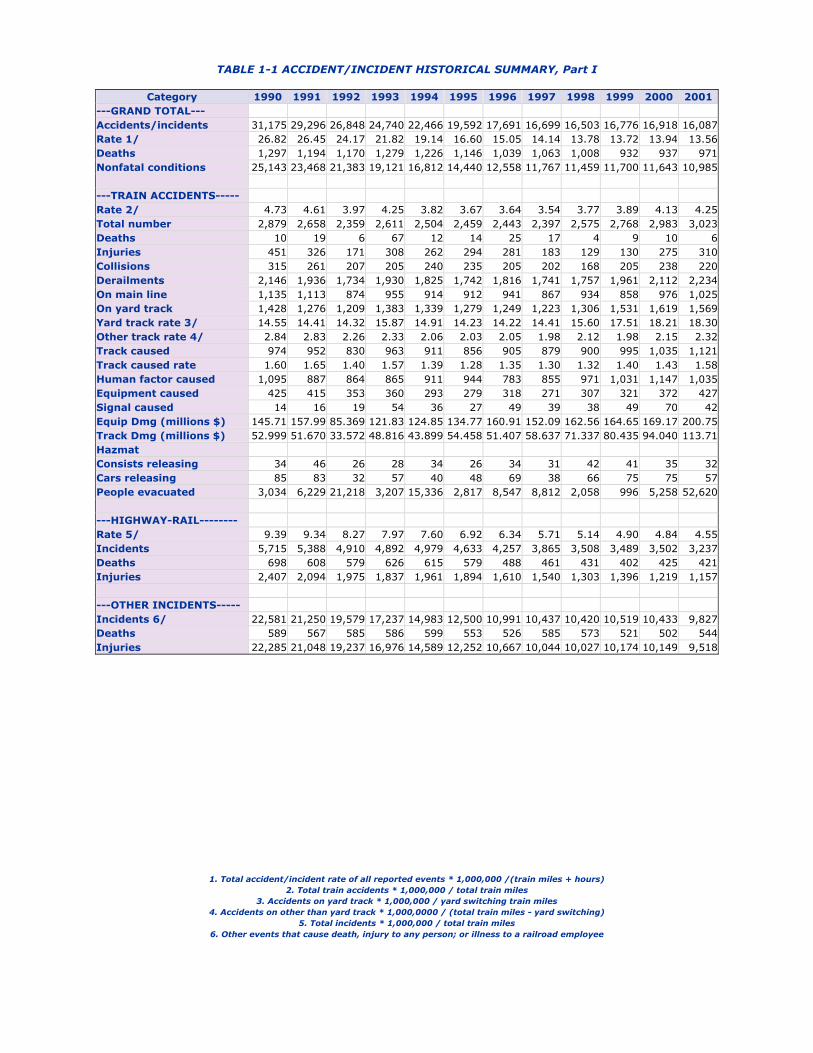
TABLE 1-1 ACCIDENT/INCIDENT HISTORICAL SUMMARY, Part I
1. Total accident/incident rate of all reported events * 1,000,000 /(train miles + hours) 2. Total train accidents * 1,000,000 / total train miles
3. Accidents on yard track * 1,000,000 / yard switching train miles 4. Accidents on other than yard track * 1,000,0000 / (total train miles - yard switching)
5. Total incidents * 1,000,000 / total train miles 6. Other events that cause death, injury to any person; or illness to a railroad employee
Category 1990 1991 1992 1993 1994 1995 1996 1997 1998 1999 2000 2001---GRAND TOTAL--- Accidents/incidents 31,175 29,296 26,848 24,740 22,466 19,592 17,691 16,699 16,503 16,776 16,918 16,087Rate 1/ 26.82 26.45 24.17 21.82 19.14 16.60 15.05 14.14 13.78 13.72 13.94 13.56Deaths 1,297 1,194 1,170 1,279 1,226 1,146 1,039 1,063 1,008 932 937 971Nonfatal conditions 25,143 23,468 21,383 19,121 16,812 14,440 12,558 11,767 11,459 11,700 11,643 10,985
---TRAIN ACCIDENTS----- Rate 2/ 4.73 4.61 3.97 4.25 3.82 3.67 3.64 3.54 3.77 3.89 4.13 4.25Total number 2,879 2,658 2,359 2,611 2,504 2,459 2,443 2,397 2,575 2,768 2,983 3,023Deaths 10 19 6 67 12 14 25 17 4 9 10 6Injuries 451 326 171 308 262 294 281 183 129 130 275 310Collisions 315 261 207 205 240 235 205 202 168 205 238 220Derailments 2,146 1,936 1,734 1,930 1,825 1,742 1,816 1,741 1,757 1,961 2,112 2,234On main line 1,135 1,113 874 955 914 912 941 867 934 858 976 1,025On yard track 1,428 1,276 1,209 1,383 1,339 1,279 1,249 1,223 1,306 1,531 1,619 1,569Yard track rate 3/ 14.55 14.41 14.32 15.87 14.91 14.23 14.22 14.41 15.60 17.51 18.21 18.30Other track rate 4/ 2.84 2.83 2.26 2.33 2.06 2.03 2.05 1.98 2.12 1.98 2.15 2.32Track caused 974 952 830 963 911 856 905 879 900 995 1,035 1,121Track caused rate 1.60 1.65 1.40 1.57 1.39 1.28 1.35 1.30 1.32 1.40 1.43 1.58Human factor caused 1,095 887 864 865 911 944 783 855 971 1,031 1,147 1,035Equipment caused 425 415 353 360 293 279 318 271 307 321 372 427Signal caused 14 16 19 54 36 27 49 39 38 49 70 42Equip Dmg (millions $) 145.71 157.99 85.369 121.83 124.85 134.77 160.91 152.09 162.56 164.65 169.17 200.75Track Dmg (millions $) 52.999 51.670 33.572 48.816 43.899 54.458 51.407 58.637 71.337 80.435 94.040 113.71Hazmat Consists releasing 34 46 26 28 34 26 34 31 42 41 35 32Cars releasing 85 83 32 57 40 48 69 38 66 75 75 57People evacuated 3,034 6,229 21,218 3,207 15,336 2,817 8,547 8,812 2,058 996 5,258 52,620
---HIGHWAY-RAIL--------Rate 5/ 9.39 9.34 8.27 7.97 7.60 6.92 6.34 5.71 5.14 4.90 4.84 4.55Incidents 5,715 5,388 4,910 4,892 4,979 4,633 4,257 3,865 3,508 3,489 3,502 3,237Deaths 698 608 579 626 615 579 488 461 431 402 425 421Injuries 2,407 2,094 1,975 1,837 1,961 1,894 1,610 1,540 1,303 1,396 1,219 1,157
---OTHER INCIDENTS----- Incidents 6/ 22,581 21,250 19,579 17,237 14,983 12,500 10,991 10,437 10,420 10,519 10,433 9,827Deaths 589 567 585 586 599 553 526 585 573 521 502 544Injuries 22,285 21,048 19,237 16,976 14,589 12,252 10,667 10,044 10,027 10,174 10,149 9,518

TABLE 1-2 ACCIDENT/INCIDENT HISTORICAL SUMMARY, Part II
1. Total employee deaths, injuries, illnesses * 200,000 / total hours worked 2. All passenger deaths or injuries in all accidents/incidents * 100,000,000 / passenger
miles. A passenger mile is the movement of a passenger for a distance of one mile 3. All trespasser deaths and injuries * 1,000,000 / total train miles
4. Movement of a train for a distance of one mile 5. Movement of trains doing yard switching for a distance of one mile
6. Total hours worked by employees of the railroads. Excludes contractors. 7. Passengers transported
Category 1990 1991 1992 1993 1994 1995 1996 1997 1998 1999 2000 2001...EMPLOYEE COUNTS..... All accidents/incidents Rate 1/ 7.59 7.41 6.88 5.93 5.06 4.24 3.66 3.31 3.27 3.39 3.44 3.30Deaths 40 35 34 47 31 34 33 37 27 31 24 22Nonfatal conditions 20,970 19,626 17,755 15,363 13,080 10,777 9,199 8,295 8,398 8,622 8,423 7,815Cases with days absent 14,177 13,688 12,157 10,115 8,758 7,055 5,981 5,371 5,359 5,779 5,788 5,409Percent of total 67.48 69.62 68.34 65.64 66.80 65.26 64.79 64.46 63.61 66.79 68.52 69.02Days absent 583,199 743,118 709,297 601,718 492,404 344,035 305,918 244,383 325,127 344,747 367,526 424,301Serious injuries 1,680 1,557 1,433 1,348 1,303 1,129 1,008 929 910 918 832 834Sprains/strains 10,002 9,715 8,674 7,641 6,428 5,203 4,427 3,960 3,945 4,280 4,357 4,025Occupational illnesses 554 663 883 544 285 254 157 128 171 141 129 167
...PASSENGERS ON TRAINS Rate 2/ 3.48 2.78 3.01 4.48 3.57 4.18 3.86 4.29 3.69 3.33 4.10 4.78Deaths 3 8 3 58 5 0 12 6 4 14 4 3Injuries 473 382 411 559 497 573 513 601 535 481 658 746
In Train Accs/Highway-Rail Deaths 0 8 0 49 2 0 9 1 2 11 0 1Rate 0.00 0.06 0.00 0.36 0.01 0.00 0.07 0.01 0.01 0.07 0.00 0.01Injuries 193 54 113 168 154 119 139 94 30 54 95 149
...TRESPASSER COUNTS... Rate 3/ 1.81 1.83 1.81 1.68 1.50 1.43 1.41 1.55 1.54 1.30 1.21 1.29Deaths 543 524 533 523 529 494 471 533 536 479 463 511Injuries 560 534 540 509 452 461 474 516 513 445 414 404
---OPERATIONS(millions)Total train miles 4/ 608.84 576.83 593.70 613.97 655.08 669.82 670.92 676.72 682.89 712.45 722.88 711.55Yard switching miles 5/ 98.151 88.519 84.430 87.122 89.776 89.892 87.823 84.874 83.692 87.459 88.919 85.747Employee hours 6/ 553.60 530.66 517.04 519.67 518.63 510.46 504.60 503.92 514.87 510.00 490.93 475.12Passengers carried 7/ 373.05 369.11 366.90 371.61 393.60 385.83 397.39 408.62 439.96 464.88 501.75 517.25
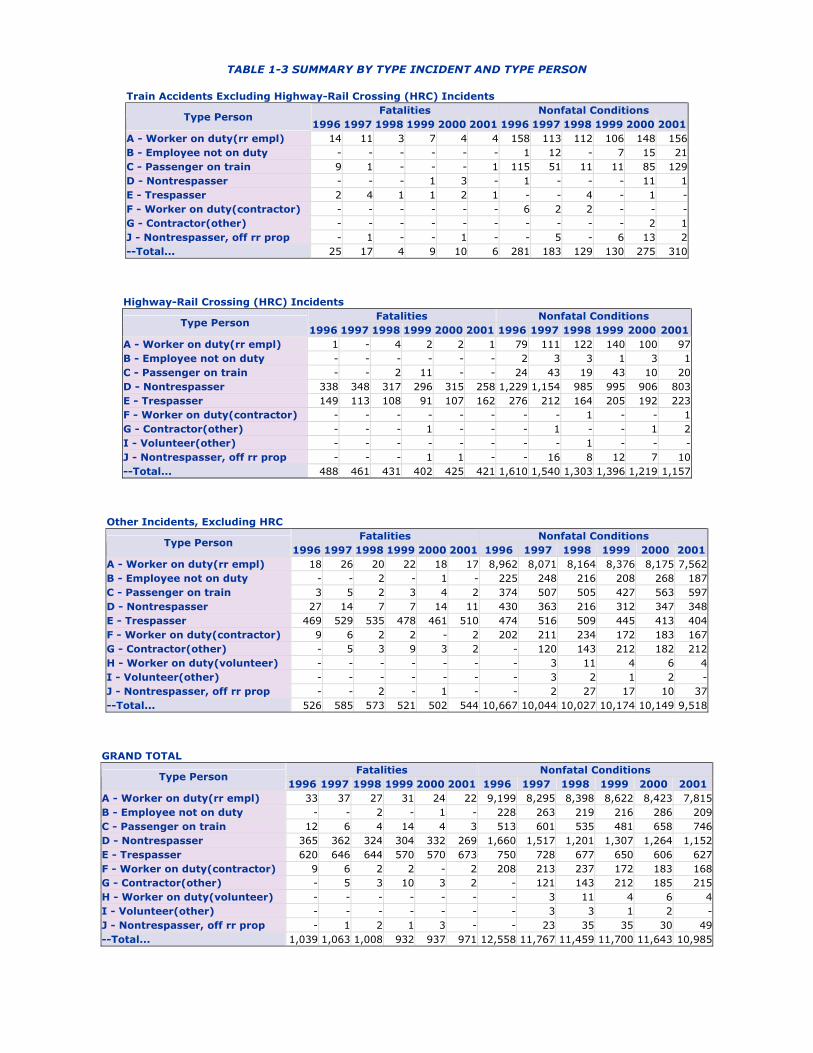
TABLE 1-3 SUMMARY BY TYPE INCIDENT AND TYPE PERSON
Train Accidents Excluding Highway-Rail Crossing (HRC) Incidents Fatalities Nonfatal Conditions
Type Person 1996 1997 1998 1999 2000 2001 1996 1997 1998 1999 2000 2001
A - Worker on duty(rr empl) 14 11 3 7 4 4 158 113 112 106 148 156B - Employee not on duty - - - - - - 1 12 - 7 15 21C - Passenger on train 9 1 - - - 1 115 51 11 11 85 129D - Nontrespasser - - - 1 3 - 1 - - - 11 1E - Trespasser 2 4 1 1 2 1 - - 4 - 1 -F - Worker on duty(contractor) - - - - - - 6 2 2 - - -G - Contractor(other) - - - - - - - - - - 2 1J - Nontrespasser, off rr prop - 1 - - 1 - - 5 - 6 13 2--Total... 25 17 4 9 10 6 281 183 129 130 275 310
Highway-Rail Crossing (HRC) Incidents Fatalities Nonfatal Conditions
Type Person 1996 1997 1998 1999 2000 2001 1996 1997 1998 1999 2000 2001
A - Worker on duty(rr empl) 1 - 4 2 2 1 79 111 122 140 100 97B - Employee not on duty - - - - - - 2 3 3 1 3 1C - Passenger on train - - 2 11 - - 24 43 19 43 10 20D - Nontrespasser 338 348 317 296 315 258 1,229 1,154 985 995 906 803E - Trespasser 149 113 108 91 107 162 276 212 164 205 192 223F - Worker on duty(contractor) - - - - - - - - 1 - - 1G - Contractor(other) - - - 1 - - - 1 - - 1 2I - Volunteer(other) - - - - - - - - 1 - - -J - Nontrespasser, off rr prop - - - 1 1 - - 16 8 12 7 10--Total... 488 461 431 402 425 421 1,610 1,540 1,303 1,396 1,219 1,157
Other Incidents, Excluding HRC Fatalities Nonfatal Conditions
Type Person 1996 1997 1998 1999 2000 2001 1996 1997 1998 1999 2000 2001
A - Worker on duty(rr empl) 18 26 20 22 18 17 8,962 8,071 8,164 8,376 8,175 7,562B - Employee not on duty - - 2 - 1 - 225 248 216 208 268 187C - Passenger on train 3 5 2 3 4 2 374 507 505 427 563 597D - Nontrespasser 27 14 7 7 14 11 430 363 216 312 347 348E - Trespasser 469 529 535 478 461 510 474 516 509 445 413 404F - Worker on duty(contractor) 9 6 2 2 - 2 202 211 234 172 183 167G - Contractor(other) - 5 3 9 3 2 - 120 143 212 182 212H - Worker on duty(volunteer) - - - - - - - 3 11 4 6 4I - Volunteer(other) - - - - - - - 3 2 1 2 -J - Nontrespasser, off rr prop - - 2 - 1 - - 2 27 17 10 37--Total... 526 585 573 521 502 544 10,667 10,044 10,027 10,174 10,149 9,518
GRAND TOTAL Fatalities Nonfatal Conditions
Type Person 1996 1997 1998 1999 2000 2001 1996 1997 1998 1999 2000 2001
A - Worker on duty(rr empl) 33 37 27 31 24 22 9,199 8,295 8,398 8,622 8,423 7,815B - Employee not on duty - - 2 - 1 - 228 263 219 216 286 209C - Passenger on train 12 6 4 14 4 3 513 601 535 481 658 746D - Nontrespasser 365 362 324 304 332 269 1,660 1,517 1,201 1,307 1,264 1,152E - Trespasser 620 646 644 570 570 673 750 728 677 650 606 627F - Worker on duty(contractor) 9 6 2 2 - 2 208 213 237 172 183 168G - Contractor(other) - 5 3 10 3 2 - 121 143 212 185 215H - Worker on duty(volunteer) - - - - - - - 3 11 4 6 4I - Volunteer(other) - - - - - - - 3 3 1 2 -J - Nontrespasser, off rr prop - 1 2 1 3 - - 23 35 35 30 49--Total... 1,039 1,063 1,008 932 937 971 12,558 11,767 11,459 11,700 11,643 10,985

TABLE 1-4 TOTAL CASUALTIES BY RAILROAD
Fatalities Nonfatal Railroads
1996 1997 1998 1999 2000 2001 1996 1997 1998 1999 2000 2001Alton & Southern - - - - - - 14 17 17 15 22 8Alaska RR Corp. 1 2 1 - 1 - 52 72 59 62 50 57Amtrak 101 117 120 105 131 139 1,209 1,328 1,180 1,161 1,412 1,527Bangor & Aroostook - - 1 - - - 37 37 47 28 26 15Bessemer & Lake Erie RR - 1 - - - - 12 15 21 6 7 8Burlington Northern Santa Fe 174 180 209 130 151 126 1,208 1,174 1,412 1,495 1,493 1,485Belt Rwy Of Chicago 1 1 2 - - - 13 16 15 7 5 10Consolidated Rail Corp. 53 59 37 20 - - 813 627 507 225 - -Conrail Shared Assets - - - 2 1 7 - - - 29 56 53CSX Transportation 101 112 125 120 124 143 847 894 953 1,150 1,324 1,119Delaware & Hudson 1 5 - 3 4 5 46 39 30 49 49 52Dakota,Minnesota & Eastern 1 1 - 1 1 - 29 23 25 32 22 17Duluth,Missabe & Iron Range - - - - - - 66 53 43 25 38 32Duluth,Winnipeg & Pacific - 3 2 1 - - 10 8 6 3 3 1Elgin, Joliet & Eastern - - - 2 - - 48 52 48 41 32 39Florida East Coast 23 19 10 16 22 13 73 68 62 52 46 27Guilford Rail System - 4 2 2 3 1 21 19 26 24 29 16Grand Trunk Western RR 11 10 4 5 4 7 183 164 162 131 120 96Gateway Western 3 1 2 1 4 1 21 11 13 20 7 10Illinois Central 19 17 18 16 17 26 208 183 165 186 225 183Indiana Harbor Belt 1 2 - - 2 - 36 64 57 38 43 42I & M Rail Link, LLC - 2 2 6 6 5 - 25 65 49 68 43Kansas City Southern 26 27 29 23 24 21 166 176 198 142 143 126Long Island Rail Road 9 18 10 6 7 10 745 706 569 534 414 382MD Assn. of Rail Comm 11 - - 2 2 - 19 5 3 5 5 7Mass Bay Transit Auth. 6 11 2 5 11 11 119 74 94 93 103 113Metro North Commuter 3 7 4 5 4 3 599 481 389 450 476 466Montana Rail Link 5 5 - 3 3 2 74 49 18 24 22 38Northern IN Comm Trans 1 2 3 1 - - 36 37 34 40 25 16Northeast IL Reg Comm 7 7 6 8 5 17 265 189 206 232 283 388New Jersey Transit Rail 20 23 24 18 21 32 188 118 94 140 174 219Norfolk Southern Corp. 108 108 112 104 118 126 657 534 563 756 778 653Paducah & Louisville 1 - 1 - - 1 22 18 8 10 16 9Port Auth Trans Hudson - - 1 1 1 2 188 188 164 158 199 158Peninsula Comm San Mateo Cnty 3 6 3 3 14 12 14 16 26 11 25 23Port Terminal RR Assn - - 1 1 - - 10 9 8 6 11 11Southern CA Reg Rail Auth. 5 8 6 2 1 1 4 29 16 15 31 24Southeastern PA Trans. 5 7 3 7 3 3 290 376 374 351 279 262Soo Line 11 7 6 7 5 6 411 258 200 203 166 166Texas Mexican - - 1 - 1 - 2 10 14 18 27 16Term RR Assn Of St. Louis - - - - - - 19 10 2 10 8 13Econo Rail Corporation - - - - 1 - - - - 7 9 5Union Pacific 294 258 240 278 204 211 2,207 2,101 2,192 2,356 1,994 1,877Union RR (Pittsburgh) - - - - - - 28 15 30 34 21 25Wisconsin Central Ltd. 4 7 6 6 11 11 169 182 129 132 161 121Wheeling & Lake Erie 1 2 - 1 - - 22 19 8 14 19 15Other Railroads 29 24 15 21 30 29 1,358 1,278 1,207 1,131 1,177 1,012Total 1,039 1,063 1,008 932 937 971 12,558 11,767 11,459 11,700 11,643 10,985

TABLE 1-5 TOTAL CASUALTIES BY STATE
Fatalities Nonfatal 6 Year TotalStates
1996 1997 1998 1999 2000 2001 1996 1997 1998 1999 2000 2001 Kld NonfAlabama 25 30 25 18 20 22 191 176 156 151 143 142 140 959Alaska 2 2 1 - 2 - 72 97 83 84 82 102 7 520Arizona 22 24 19 15 27 15 107 169 121 148 147 173 122 865Arkansas 26 11 36 27 30 16 233 243 261 269 225 231 146 1,462California 96 109 114 114 101 132 731 724 795 770 808 718 666 4,546Colorado 12 9 12 9 10 9 184 159 134 150 112 167 61 906Connecticut 3 8 4 10 6 3 159 136 130 166 159 169 34 919Delaware 1 3 1 2 2 3 62 70 42 53 47 48 12 322Dist Of Columbia - - 1 - - 1 80 82 75 78 90 87 2 492Florida 41 37 30 44 45 43 248 282 276 252 303 299 240 1,660Georgia 27 24 31 20 23 27 189 199 221 216 231 231 152 1,287Hawaii - - - - - - - - - - - 1 - 1Idaho 7 7 9 4 11 3 113 105 83 56 53 60 41 470Illinois 76 73 70 93 69 73 1,059 926 942 1,084 1,109 1,103 454 6,223Indiana 40 36 31 33 36 28 361 378 334 321 317 240 204 1,951Iowa 14 15 6 20 9 20 254 227 198 201 211 220 84 1,311Kansas 19 22 16 13 21 11 205 182 220 214 226 198 102 1,245Kentucky 13 22 11 5 14 15 175 140 173 174 170 136 80 968Louisiana 37 35 33 28 16 35 248 288 267 242 310 252 184 1,607Maine - 1 2 - 2 - 53 71 77 49 58 33 5 341Maryland 18 5 4 12 9 7 176 72 94 105 103 113 55 663Massachusetts 12 19 5 12 17 14 215 153 155 187 183 205 79 1,098Michigan 28 24 16 22 23 22 377 392 317 305 300 246 135 1,937Minnesota 21 15 22 24 11 15 399 307 314 315 303 261 108 1,899Mississippi 17 22 28 26 17 33 132 136 127 145 120 115 143 775Missouri 30 24 34 18 29 16 241 212 236 287 221 233 151 1,430Montana 8 8 7 4 4 3 145 113 79 93 108 109 34 647Nebraska 14 16 15 14 8 7 220 197 263 295 247 241 74 1,463Nevada 4 3 6 4 1 3 32 30 34 47 25 32 21 200New Hampshire 1 - 1 - - - 10 5 14 12 15 6 2 62New Jersey 25 29 31 21 28 38 481 407 325 380 432 438 172 2,463New Mexico 14 17 12 8 4 17 84 67 105 82 106 76 72 520New York 27 41 29 25 32 28 1,621 1,453 1,210 1,237 1,168 1,132 182 7,821North Carolina 27 26 40 24 24 26 180 146 145 123 121 113 167 828North Dakota 5 2 8 3 9 4 101 81 68 72 82 76 31 480Ohio 34 45 30 39 28 34 383 365 368 395 339 247 210 2,097Oklahoma 28 30 19 22 22 17 130 134 135 108 124 109 138 740Oregon 7 18 22 10 9 14 185 136 157 145 152 140 80 915Pennsylvania 19 30 17 20 23 35 756 778 743 663 583 540 144 4,063Rhode Island 1 4 2 1 1 1 14 12 11 17 19 20 10 93South Carolina 18 21 23 16 20 12 99 104 98 80 141 83 110 605South Dakota 2 1 - - 3 1 41 37 43 48 43 31 7 243Tennessee 20 20 25 17 15 24 130 135 141 153 163 173 121 895Texas 124 99 97 84 90 88 731 768 795 853 777 750 582 4,674Utah 14 6 6 7 5 4 92 87 84 87 88 102 42 540Vermont 1 - 1 - 1 1 26 11 25 33 22 19 4 136Virginia 18 12 13 10 13 6 143 139 160 143 169 154 72 908Washington 19 25 21 20 16 23 231 210 211 195 230 229 124 1,306West Virginia 8 12 7 2 9 5 78 64 83 84 93 88 43 490Wisconsin 9 19 11 9 20 15 300 283 237 219 258 202 83 1,499Wyoming 5 2 4 3 2 2 81 79 94 114 107 92 18 567Total 1,039 1,063 1,008 932 937 971 12,558 11,767 11,459 11,700 11,643 10,985 5,950 70,112

TABLE 1-6 TOTAL EMPLOYEE ON DUTY CASES BY RAILROAD
Rate is the frequency of total cases per 200,000 hours worked
1996 1997 1998 1999 2000 2001Railroads
Cnt Rate Cnt Rate Cnt Rate Cnt Rate Cnt Rate Cnt Rate Alton & Southern 13 3.92 17 5.03 16 4.86 15 4.56 22 6.62 8 2.33Alaska RR Corp. 45 8.66 63 11.45 54 9.28 51 7.92 40 6.13 50 7.01Amtrak 987 4.64 901 4.33 842 3.87 914 4.03 920 4.01 881 4.10Bangor & Aroostook 36 11.16 36 11.90 48 14.56 25 7.78 26 8.33 15 5.97Bessemer & Lake Erie RR 12 3.70 8 2.14 16 3.54 5 1.05 5 1.06 7 2.43Burlington Northern Santa Fe 879 2.01 789 1.74 1,014 2.20 1,031 2.39 1,059 2.61 1,067 2.67Belt Rwy Of Chicago 14 2.08 14 2.02 17 2.58 7 1.06 5 0.80 10 1.83Consolidated Rail Corp. 671 3.13 518 2.58 419 2.05 194 2.20 - - - -Conrail Shared Assets - - - - - - 25 1.66 32 1.68 28 1.81CSX Transportation 582 2.05 608 2.15 718 2.45 892 2.70 998 2.89 806 2.44Delaware & Hudson 43 7.14 31 5.27 28 4.29 44 5.19 40 4.57 49 7.37Dakota,Minnesota & Eastern 22 6.17 21 5.83 23 6.93 29 8.54 19 5.22 16 4.10Duluth,Missabe & Iron Range 65 9.32 50 6.93 42 5.88 23 3.34 37 5.56 32 5.77Duluth,Winnipeg & Pacific 8 3.73 8 3.73 5 2.36 3 1.49 3 1.44 1 0.45Elgin, Joliet & Eastern 45 6.04 47 5.97 45 5.83 39 5.14 32 4.24 36 4.98Florida East Coast 45 4.94 39 4.43 29 3.20 30 3.46 26 3.15 15 1.88Guilford Rail System 18 1.86 11 1.16 21 2.25 20 2.02 28 2.91 11 1.20Grand Trunk Western RR 152 6.77 131 6.35 153 7.00 122 5.52 108 5.79 84 4.37Gateway Western 17 6.11 5 2.01 12 4.92 19 7.37 2 0.73 8 2.83Illinois Central 136 3.53 111 2.91 105 2.80 118 3.10 159 3.85 132 3.06Indiana Harbor Belt 27 2.98 53 6.14 53 6.05 34 3.63 37 4.25 39 5.07I & M Rail Link, LLC - - 17 3.15 40 5.40 39 5.62 51 7.78 27 3.54Kansas City Southern 89 3.33 79 3.01 95 3.49 86 3.08 77 2.75 64 2.41Long Island Rail Road 508 8.90 451 7.72 408 6.88 396 6.68 350 5.59 303 5.12MD Assn. of Rail Comm 3 2.87 2 1.98 1 0.76 2 1.05 4 1.65 3 1.10Mass Bay Transit Auth. 96 6.36 69 4.16 85 4.73 83 4.54 80 4.50 91 4.92Metro North Commuter 533 10.19 433 8.27 319 6.03 334 6.26 367 7.00 347 6.50Montana Rail Link 67 5.97 40 3.46 12 1.15 20 2.07 21 2.19 37 3.97Northern IN Comm Trans 30 9.06 29 8.70 28 8.17 40 11.33 25 6.46 13 3.17Northeast IL Reg Comm 134 5.59 110 4.59 127 5.12 93 3.61 132 5.03 180 4.27New Jersey Transit Rail 88 2.29 89 2.44 85 2.33 130 3.37 141 3.61 163 4.17Norfolk Southern Corp. 294 1.26 220 0.94 270 1.07 409 1.27 499 1.46 399 1.33Paducah & Louisville 20 7.11 11 4.07 6 2.07 9 2.87 13 4.29 4 1.40Port Auth Trans Hudson 113 11.04 113 11.45 101 10.45 86 8.98 105 11.32 108 11.22Peninsula Comm San Mateo Cnty 14 3.96 15 4.33 18 5.01 4 1.06 22 5.15 18 4.12Port Terminal RR Assn 6 1.88 5 1.55 6 1.78 4 1.25 8 2.44 9 2.70Southern CA Reg Rail Auth. 3 1.35 12 3.66 8 2.71 8 2.97 14 4.72 8 2.68Southeastern PA Trans. 198 11.30 193 11.68 181 10.27 167 9.82 142 8.30 178 10.01Soo Line 369 9.06 229 6.53 167 4.96 181 5.74 147 5.08 150 4.84Texas Mexican 1 0.58 5 2.10 4 1.35 14 6.09 20 8.60 15 6.44Term RR Assn Of St. Louis 15 5.37 4 1.47 1 0.36 7 2.40 7 2.27 13 4.52Econo Rail Corporation - - - - - - 7 4.76 8 4.13 5 2.44Union Pacific 1,561 2.91 1,545 2.89 1,680 3.16 1,797 3.49 1,532 3.10 1,464 3.01Union RR (Pittsburgh) 28 7.67 15 4.25 28 7.79 34 10.38 21 6.68 25 5.85Wisconsin Central Ltd. 110 5.31 122 5.50 86 3.81 95 4.12 102 4.35 84 3.84Wheeling & Lake Erie 11 2.94 16 4.45 7 1.63 10 2.30 16 3.64 9 2.22Other Railroads 1,124 9.29 1,047 8.52 1,002 8.13 958 7.77 945 7.77 825 6.96

TABLE 1-7 TRAIN ACCIDENTS BY RAILROAD, EXCLUDING HRC
Rate is the frequency of accidents per 1,000,000 train miles
1996 1997 1998 1999 2000 2001Railroads
Cnt Rate Cnt Rate Cnt Rate Cnt Rate Cnt Rate Cnt Rate Alton & Southern 6 8.18 4 5.55 4 5.37 13 17.26 6 7.80 11 13.82Alaska RR Corp. 5 5.80 7 6.47 5 4.58 6 4.68 2 1.49 1 0.70Amtrak 88 2.60 84 2.27 89 2.51 85 2.35 148 4.10 150 3.89Bangor & Aroostook 3 3.51 - - 3 2.48 7 5.75 6 5.41 2 2.44Bessemer & Lake Erie RR 1 4.09 1 4.18 2 6.71 - - 2 8.00 2 8.95Burlington Northern Santa Fe 454 3.11 439 2.84 435 2.67 481 2.96 573 3.57 623 3.82Belt Rwy Of Chicago 59 126.7 39 77.48 29 63.18 44 94.23 20 43.56 15 33.53Consolidated Rail Corp. 175 3.83 187 4.12 236 5.07 104 5.30 - - - -Conrail Shared Assets - - - - - - 17 10.65 40 15.59 33 14.50CSX Transportation 163 1.95 257 3.07 310 3.71 423 4.02 484 4.23 389 3.58Delaware & Hudson 8 4.59 6 2.92 4 1.92 8 3.52 9 3.72 8 3.95Dakota,Minnesota & Eastern 26 36.00 27 38.39 16 23.79 12 14.85 23 28.63 15 19.40Duluth,Missabe & Iron Range 7 9.24 10 11.72 10 12.87 7 9.61 7 9.60 4 5.57Duluth,Winnipeg & Pacific 4 6.12 1 1.38 4 5.77 2 2.92 4 5.70 2 2.62Elgin, Joliet & Eastern 15 24.41 11 18.34 14 20.84 15 22.21 10 15.37 11 17.23Florida East Coast 12 3.64 12 3.55 20 5.87 24 7.64 18 6.27 15 5.89Guilford Rail System 2 1.88 3 2.74 5 4.37 7 6.71 9 9.06 3 1.77Grand Trunk Western RR 32 5.85 25 4.42 21 3.91 21 4.05 20 3.71 15 2.94Gateway Western 6 5.98 4 4.41 11 13.13 13 16.28 9 10.37 12 13.16Illinois Central 82 9.14 58 6.37 73 7.82 60 6.48 71 6.13 66 6.10Indiana Harbor Belt 9 5.87 25 16.01 27 17.27 37 21.90 26 17.00 24 18.15I & M Rail Link, LLC - - 19 13.91 34 16.26 31 15.42 37 18.56 36 18.54Kansas City Southern 75 9.23 71 8.59 66 7.62 79 9.32 94 11.84 92 12.01Long Island Rail Road 39 4.77 22 2.70 19 2.33 15 1.83 18 2.19 19 2.31MD Assn. of Rail Comm 1 1.85 - - 1 1.39 2 1.85 2 1.82 - -Mass Bay Transit Auth. - - 1 0.37 - - 2 0.55 1 0.26 2 0.52Metro North Commuter 23 3.09 20 2.62 33 4.23 28 3.62 38 4.63 55 6.55Montana Rail Link 34 9.05 39 9.59 12 3.12 13 3.93 13 3.75 19 5.40Northern IN Comm Trans - - 2 2.40 6 7.17 3 3.45 1 1.14 1 1.14Northeast IL Reg Comm 6 1.77 6 1.72 1 0.29 4 1.12 5 1.39 7 0.80New Jersey Transit Rail 12 1.54 16 1.99 12 1.47 8 0.98 17 2.02 25 2.95Norfolk Southern Corp. 151 2.37 170 2.64 149 2.19 238 2.91 275 2.87 239 2.66Paducah & Louisville 7 11.68 7 11.60 4 6.48 3 4.77 3 5.07 5 8.78Port Auth Trans Hudson - - - - - - 1 0.50 2 0.99 3 1.48Peninsula Comm San Mateo Cnty - - - - - - - - 2 1.81 1 0.83Port Terminal RR Assn 6 5.31 11 8.84 12 9.61 6 4.82 13 10.51 18 14.40Southern CA Reg Rail Auth. 4 3.20 3 2.21 4 2.72 4 2.32 1 0.57 3 1.65Southeastern PA Trans. 9 1.78 16 3.12 16 3.08 8 1.51 16 2.96 10 1.87Soo Line 106 10.74 54 6.44 42 5.05 46 5.71 23 2.80 31 3.74Texas Mexican 2 7.03 3 5.13 5 4.44 12 10.74 9 10.26 14 53.05Term RR Assn Of St. Louis 14 26.96 18 33.12 10 17.63 18 29.80 7 10.44 9 13.64Econo Rail Corporation - - - - - - 5 8.83 6 7.74 3 3.65Union Pacific 719 4.00 581 3.51 727 4.62 719 4.08 758 4.19 896 5.19Union RR (Pittsburgh) 9 58.90 1 6.71 1 6.01 4 26.96 7 50.96 2 17.71Wisconsin Central Ltd. 50 9.92 36 7.13 23 4.38 35 6.70 48 8.27 34 5.44Wheeling & Lake Erie 1 1.79 7 14.93 - - 1 1.90 8 12.11 10 15.47Other Railroads 227 10.86 268 10.96 294 12.13 316 13.37 326 13.89 346 14.76

TABLE 1-8 TRAIN ACCIDENTS BY STATE, EXCLUDING HRC
1996 1997 1998 1999 2000 2001 6 Year TotalStates
Cnt % Cnt % Cnt % Cnt % Cnt % Cnt % Cnt %Alabama 34 1.4 37 1.5 48 1.9 45 1.6 51 1.7 76 2.5 291 1.8Alaska 5 0.2 7 0.3 5 0.2 6 0.2 2 0.1 1 0.0 26 0.2Arizona 22 0.9 21 0.9 18 0.7 25 0.9 48 1.6 43 1.4 177 1.1Arkansas 56 2.3 50 2.1 61 2.4 65 2.3 72 2.4 62 2.1 366 2.3California 127 5.2 105 4.4 135 5.2 154 5.6 183 6.1 182 6.0 886 5.5Colorado 52 2.1 39 1.6 54 2.1 60 2.2 57 1.9 59 2.0 321 2.0Connecticut 13 0.5 12 0.5 24 0.9 30 1.1 36 1.2 36 1.2 151 0.9Delaware 3 0.1 5 0.2 6 0.2 5 0.2 7 0.2 12 0.4 38 0.2Dist Of Columbia 8 0.3 5 0.2 7 0.3 9 0.3 15 0.5 21 0.7 65 0.4Florida 38 1.6 39 1.6 58 2.3 61 2.2 66 2.2 43 1.4 305 1.9Georgia 43 1.8 64 2.7 64 2.5 80 2.9 66 2.2 58 1.9 375 2.3Idaho 31 1.3 25 1.0 31 1.2 17 0.6 25 0.8 18 0.6 147 0.9Illinois 258 10.6 251 10.5 189 7.3 288 10.4 231 7.7 229 7.6 1,446 8.9Indiana 57 2.3 68 2.8 87 3.4 85 3.1 79 2.6 90 3.0 466 2.9Iowa 79 3.2 89 3.7 94 3.7 86 3.1 82 2.7 91 3.0 521 3.2Kansas 71 2.9 59 2.5 75 2.9 89 3.2 91 3.1 100 3.3 485 3.0Kentucky 39 1.6 56 2.3 58 2.3 54 2.0 44 1.5 32 1.1 283 1.7Louisiana 56 2.3 61 2.5 71 2.8 70 2.5 79 2.6 113 3.7 450 2.8Maine 6 0.2 4 0.2 10 0.4 15 0.5 13 0.4 7 0.2 55 0.3Maryland 12 0.5 30 1.3 17 0.7 30 1.1 51 1.7 29 1.0 169 1.0Massachusetts 10 0.4 11 0.5 12 0.5 18 0.7 23 0.8 24 0.8 98 0.6Michigan 48 2.0 48 2.0 48 1.9 43 1.6 47 1.6 35 1.2 269 1.7Minnesota 92 3.8 65 2.7 60 2.3 85 3.1 80 2.7 70 2.3 452 2.8Mississippi 62 2.5 42 1.8 41 1.6 35 1.3 61 2.0 49 1.6 290 1.8Missouri 77 3.2 46 1.9 57 2.2 73 2.6 83 2.8 90 3.0 426 2.6Montana 52 2.1 54 2.3 39 1.5 27 1.0 30 1.0 29 1.0 231 1.4Nebraska 79 3.2 77 3.2 82 3.2 75 2.7 82 2.7 99 3.3 494 3.1Nevada 10 0.4 8 0.3 10 0.4 8 0.3 12 0.4 14 0.5 62 0.4New Hampshire - - - - 2 0.1 1 0.0 - - 1 0.0 4 0.0New Jersey 18 0.7 28 1.2 27 1.0 36 1.3 56 1.9 52 1.7 217 1.3New Mexico 18 0.7 15 0.6 21 0.8 18 0.7 25 0.8 32 1.1 129 0.8New York 113 4.6 96 4.0 102 4.0 105 3.8 139 4.7 132 4.4 687 4.2North Carolina 19 0.8 21 0.9 27 1.0 36 1.3 28 0.9 29 1.0 160 1.0North Dakota 33 1.4 28 1.2 28 1.1 23 0.8 24 0.8 26 0.9 162 1.0Ohio 76 3.1 71 3.0 88 3.4 98 3.5 120 4.0 97 3.2 550 3.4Oklahoma 37 1.5 32 1.3 52 2.0 47 1.7 61 2.0 68 2.2 297 1.8Oregon 46 1.9 40 1.7 57 2.2 53 1.9 41 1.4 53 1.8 290 1.8Pennsylvania 88 3.6 102 4.3 115 4.5 103 3.7 127 4.3 92 3.0 627 3.9Rhode Island - - - - - - - - 1 0.0 2 0.1 3 0.0South Carolina 17 0.7 22 0.9 24 0.9 30 1.1 28 0.9 24 0.8 145 0.9South Dakota 28 1.1 24 1.0 21 0.8 14 0.5 22 0.7 14 0.5 123 0.8Tennessee 42 1.7 63 2.6 56 2.2 68 2.5 66 2.2 64 2.1 359 2.2Texas 182 7.4 223 9.3 266 10.3 260 9.4 274 9.2 363 12.0 1,568 9.7Utah 35 1.4 21 0.9 38 1.5 33 1.2 38 1.3 36 1.2 201 1.2Vermont 3 0.1 4 0.2 5 0.2 4 0.1 4 0.1 7 0.2 27 0.2Virginia 54 2.2 46 1.9 44 1.7 48 1.7 44 1.5 35 1.2 271 1.7Washington 49 2.0 46 1.9 35 1.4 38 1.4 41 1.4 53 1.8 262 1.6West Virginia 28 1.1 23 1.0 25 1.0 28 1.0 15 0.5 23 0.8 142 0.9Wisconsin 68 2.8 70 2.9 39 1.5 45 1.6 63 2.1 56 1.9 341 2.1Wyoming 49 2.0 44 1.8 42 1.6 42 1.5 50 1.7 52 1.7 279 1.7Total 2,443 100.0 2,397 100.0 2,575 100.0 2,768 100.0 2,983 100.0 3,023 100.0 16,189 100.0

TABLE 1-9 CONSISTS TRANSPORTING HAZMAT, BY RAILROAD
Cnt = Number of Consists; Dmg = Damaged; Rls = Releases
1996 1997 1998 1999 2000 2001Railroads
Cnt Dmg Rls Cnt Dmg Rls Cnt Dmg Rls Cnt Dmg Rls Cnt Dmg Rls Cnt Dmg RlsAlton & Southern 3 2 - 1 1 - - - - - - - 1 1 - 1 1 -Alaska RR Corp. - - - 1 1 - 1 1 - 2 2 2 1 1 1 - - -Amtrak - - - - - - - - - - - - - - - - - -Bangor & Aroostook 2 - - - - - - - - 3 2 1 2 1 - 2 1 -Bessemer & Lake Erie RR - - - - - - - - - - - - - - - - - -Burlington Northern Santa Fe 132 57 5 122 54 3 144 73 6 210 91 10 253 120 7 265 133 9Belt Rwy Of Chicago 12 7 - 10 7 - 2 1 - 13 5 1 3 3 - 1 1 -Consolidated Rail Corp. 25 25 1 32 26 3 37 33 5 22 19 3 - - - - - -Conrail Shared Assets - - - - - - - - - 4 4 - 9 6 - 10 10 -CSX Transportation 47 28 5 62 33 4 99 43 9 110 53 4 116 58 6 94 36 7Delaware & Hudson - - - - - - 1 1 1 6 1 - 4 3 1 4 2 -Dakota,Minnesota & Eastern 1 - - - - - 1 1 - - - - - - - - - -Duluth,Missabe & Iron Range 1 1 - - - - 1 - - - - - - - - - - -Duluth,Winnipeg & Pacific 2 1 - 1 1 - - - - 1 1 - 2 2 - 1 - -Elgin, Joliet & Eastern 4 3 - 2 - - 3 - - 3 1 - 1 1 - 1 1 -Florida East Coast 2 - - 4 1 - 1 - - 3 - - 3 1 - 1 1 -Guilford Rail System - - - 1 1 - 3 1 - 7 5 - 2 - - 2 - -Grand Trunk Western RR 1 - - 2 2 - 7 7 1 6 4 - 2 1 - 6 4 -Gateway Western 5 4 - 1 1 1 4 1 - 2 2 - 3 1 - 7 5 1Illinois Central 44 26 3 24 18 2 34 21 3 26 25 2 21 11 - 28 19 2Indiana Harbor Belt - - - 2 2 - 5 2 1 10 4 - 3 1 - 3 1 -I & M Rail Link, LLC - - - 8 3 - 11 2 1 12 6 2 15 7 1 14 7 -Kansas City Southern 2 1 1 12 4 2 9 3 1 21 10 2 34 18 1 31 19 1Long Island Rail Road - - - - - - - - - - - - - - - - - -MD Assn. of Rail Comm - - - - - - - - - - - - - - - - - -Mass Bay Transit Auth. - - - - - - - - - - - - - - - - - -Metro North Commuter - - - - - - - - - - - - - - - - - -Montana Rail Link 14 5 1 14 8 - 6 2 - 11 7 2 7 5 - 10 5 -Northern IN Comm Trans - - - - - - - - - - - - - - - - - -Northeast IL Reg Comm - - - - - - - - - - - - - - - - - -New Jersey Transit Rail - - - - - - - - - - - - - - - - - -Norfolk Southern Corp. 27 17 4 39 23 4 29 7 2 28 13 - 44 22 5 53 25 2Paducah & Louisville 5 4 - 4 3 1 3 3 - - - - 3 3 - - - -Port Auth Trans Hudson - - - - - - - - - - - - - - - - - -Peninsula Comm San Mateo Cnty - - - - - - - - - - - - - - - - - -Port Terminal RR Assn - - - 2 1 - 7 6 - - - - 2 1 - 10 8 -Southern CA Reg Rail Auth. - - - - - - - - - - - - - - - - - -Southeastern PA Trans. - - - - - - - - - - - - - - - - - -Soo Line 16 10 1 11 4 - 9 5 2 15 4 - 6 3 1 5 - -Texas Mexican 2 - - 2 1 1 2 2 - 4 1 1 6 - - 7 2 -Term RR Assn Of St. Louis - - - - - - - - - 1 1 - 1 1 - 1 - -Econo Rail Corporation - - - - - - - - - - - - - - - 1 1 -Union Pacific 154 67 10 135 59 6 163 70 8 142 71 9 152 79 8 184 90 8Union RR (Pittsburgh) - - - - - - - - - - - - 1 - - - - -Wisconsin Central Ltd. 17 9 1 10 1 - 3 - - 11 1 - 20 5 2 11 2 -Wheeling & Lake Erie - - - - - - - - - - - - 2 1 - 2 1 -Other Railroads 44 25 2 38 22 4 43 32 3 43 23 3 34 25 2 44 26 2Total 562 292 34 540 277 31 628 317 43 716 356 42 753 381 35 799 401 32

TABLE 1-10 CONSISTS TRANSPORTING HAZMAT, BY STATE
1996 1997 1998 1999 2000 2001States
Cnt Dmg Rls Cnt Dmg Rls Cnt Dmg Rls Cnt Dmg Rls Cnt Dmg Rls Cnt Dmg RlsAlabama 14 8 - 15 6 - 18 5 - 15 5 - 19 11 2 23 13 3Alaska - - - 1 1 - 1 1 - 2 2 2 1 1 1 - - -Arizona 14 9 2 10 6 2 10 8 - 11 8 2 20 9 2 16 6 2Arkansas 23 7 - 7 3 1 15 8 1 18 8 - 16 9 1 15 7 -California 35 19 4 24 10 - 35 18 1 43 22 4 46 24 2 46 25 1Colorado 12 4 1 4 2 - 17 7 - 16 3 - 14 7 - 16 6 -Connecticut - - - 1 1 1 - - - 4 1 1 - - - - - -Delaware - - - 1 1 - - - - - - - - - - 2 1 -Dist Of Columbia - - - - - - - - - 1 1 - - - - 2 - -Florida 2 - - 6 2 1 9 3 2 10 3 - 13 9 2 5 3 -Georgia 8 4 1 12 5 - 11 3 - 6 3 1 8 3 1 14 7 3Idaho 8 4 - 10 3 1 8 3 1 6 3 1 9 4 - 10 3 -Illinois 69 35 2 52 31 3 46 28 5 68 33 5 54 32 1 56 25 1Indiana 7 3 - 11 7 - 12 7 - 24 12 - 10 6 1 14 8 -Iowa 14 9 2 23 11 1 15 5 1 23 8 2 17 10 1 21 7 1Kansas 24 14 - 20 8 1 13 4 1 18 6 2 26 14 - 31 19 1Kentucky 16 10 1 18 13 1 15 8 - 17 9 - 9 5 - 8 5 -Louisiana 20 14 1 24 14 2 18 11 1 30 22 2 45 28 3 53 33 3Maine 3 - - 2 2 - 3 2 - 9 6 1 4 1 - 4 2 -Maryland 2 1 1 5 4 1 3 - - 5 2 - 9 3 - 7 5 2Massachusetts - - - 3 1 1 2 - - 4 2 - 2 - - 3 1 -Michigan 4 3 - 7 4 - 14 9 1 7 3 - 14 7 - 11 8 -Minnesota 11 6 1 11 3 - 17 7 - 20 7 - 22 14 1 16 4 -Mississippi 13 5 1 10 4 1 8 3 1 11 6 2 15 8 - 18 11 -Missouri 13 6 - 12 9 - 13 5 1 25 10 1 27 10 - 29 15 1Montana 20 8 1 18 10 - 14 5 - 19 9 4 16 6 - 12 6 -Nebraska 12 3 1 8 1 - 21 10 1 16 7 1 18 4 1 18 7 -Nevada 3 2 - 1 - - 7 3 1 1 1 - 2 1 - 4 1 1New Hampshire 1 - - - - - 1 1 - 1 1 - - - - - - -New Jersey 1 1 - 5 2 - 6 6 2 7 7 - 7 4 - 8 7 -New Mexico 9 5 - 7 3 - 11 3 - 7 3 - 6 2 - 19 9 1New York 7 7 1 5 5 2 7 6 1 17 10 1 21 14 2 19 10 1North Carolina 9 8 2 6 3 1 7 4 - 13 8 1 7 5 2 7 2 -North Dakota 7 2 - 2 1 - 6 3 1 6 5 - 6 2 - 3 1 -Ohio 15 12 - 16 11 1 16 11 2 12 5 - 26 14 2 21 5 1Oklahoma 10 5 - 4 2 1 12 7 - 14 6 - 19 10 - 28 15 1Oregon 10 4 2 11 4 - 12 4 1 16 4 - 12 6 1 15 8 -Pennsylvania 10 8 - 14 11 - 20 14 3 14 9 2 26 14 1 16 7 -Rhode Island - - - - - - - - - - - - - - - - - -South Carolina 6 5 1 4 1 - 9 6 2 11 6 - 8 5 - 4 2 -South Dakota 1 - - 2 1 - 3 1 - - - - - - - 2 1 -Tennessee 18 11 2 23 13 2 32 9 3 26 16 1 25 11 - 18 9 -Texas 58 26 3 83 43 3 91 55 4 86 46 4 92 40 4 140 80 8Utah 5 2 - 6 5 1 10 6 - 5 4 1 4 3 1 1 - -Vermont 2 - - 1 - - - - - 1 - - - - - - - -Virginia 6 5 1 5 3 1 7 3 1 6 1 - 3 2 - 2 1 -Washington 6 2 - 14 2 - 14 7 1 14 6 - 20 7 - 13 4 -West Virginia 3 1 - 2 1 1 4 2 2 3 3 - 1 - - 5 - -Wisconsin 19 10 1 11 2 - 6 3 1 11 2 - 21 7 2 13 4 -Wyoming 12 4 2 3 2 1 9 3 1 17 12 1 13 9 1 11 8 1Total 562 292 34 540 277 31 628 317 43 716 356 42 753 381 35 799 401 32

TABLE 1-11 TOTAL HIGHWAY-RAIL CROSSING INCIDENTS BY RAILROAD
At Public Crossing At Private Crossing Railroads
1996 1997 1998 1999 2000 2001 1996 1997 1998 1999 2000 2001Alton & Southern 1 - 1 - - - - - - - - -Alaska RR Corp. 5 4 3 2 7 4 1 1 1 1 - -Amtrak 132 150 145 158 168 140 18 26 25 23 34 22Bangor & Aroostook 1 2 1 4 1 1 2 1 1 2 - 1Bessemer & Lake Erie RR 2 5 1 - - - - - - - - -Burlington Northern Santa Fe 528 537 462 446 437 410 104 74 79 82 99 63Belt Rwy Of Chicago - 2 1 1 - 3 - - - - - 1Consolidated Rail Corp. 218 173 156 58 - - 24 14 12 6 - -Conrail Shared Assets - - - 11 20 17 - - - 2 2 2CSX Transportation 446 432 378 383 441 471 35 37 43 42 49 50Delaware & Hudson 6 9 2 3 6 2 2 3 - 3 1 2Dakota,Minnesota & Eastern 10 19 14 11 10 9 1 2 - - 1 3Duluth,Missabe & Iron Range 3 2 1 2 1 1 1 - - - - -Duluth,Winnipeg & Pacific 2 4 2 2 2 1 - - - - - -Elgin, Joliet & Eastern 7 3 6 6 4 3 2 2 2 1 1 2Florida East Coast 28 20 17 20 13 21 - - 1 2 1 1Guilford Rail System 9 13 5 4 4 3 - 2 - - 2 1Grand Trunk Western RR 43 38 13 22 24 23 - 2 1 2 2 1Gateway Western 7 6 5 4 5 3 2 - - - 1 1Illinois Central 124 115 114 111 101 82 12 21 12 8 6 8Indiana Harbor Belt 12 10 10 10 6 8 2 4 - 3 3 2I & M Rail Link, LLC - 16 37 30 38 32 - 4 5 4 7 4Kansas City Southern 165 171 176 132 131 113 13 16 14 12 17 7Long Island Rail Road 10 4 6 6 8 5 - - - - - -MD Assn. of Rail Comm 1 - - 4 1 - - - - - - -Mass Bay Transit Auth. 1 4 3 2 6 6 - 1 - - - -Metro North Commuter 7 2 5 2 1 1 2 1 1 1 - -Montana Rail Link 12 15 11 3 9 10 10 8 5 5 4 1Northern IN Comm Trans 10 13 9 6 5 3 - - 3 - - 1Northeast IL Reg Comm 21 15 11 20 18 31 2 1 1 1 1 -New Jersey Transit Rail 12 10 8 7 6 13 - - - - - -Norfolk Southern Corp. 500 446 432 497 513 432 68 62 61 67 73 75Other Railroads 368 318 302 324 277 292 36 44 48 47 55 53Paducah & Louisville 4 9 11 6 9 5 - 2 1 - 1 3Peninsula Comm San Mateo Cnty - - 2 5 4 6 - - - - - -Port Terminal RR Assn 4 4 3 - 3 6 1 1 2 1 5 2Southern CA Reg Rail Auth. 10 8 8 8 8 9 - 1 - 2 - 1Southeastern PA Trans. 1 1 1 1 4 - - - - - - -Soo Line 77 49 45 43 25 27 8 6 4 8 10 6Texas Mexican 4 12 12 7 13 4 - - 1 - 2 2Term RR Assn Of St. Louis 2 - - - 1 1 - - - - - -Econo Rail Corporation - - - - 2 - - - - 4 4 4Union Pacific 871 680 590 656 602 555 115 103 91 69 83 74Union RR (Pittsburgh) - 1 - - - - 2 - - - - -Wisconsin Central Ltd. 105 81 68 66 90 79 5 11 6 1 6 -Wheeling & Lake Erie 19 11 9 7 8 11 1 1 2 - - 1Total 3,788 3,414 3,086 3,090 3,032 2,843 469 451 422 399 470 394

TABLE 1-12 TOTAL HIGHWAY-RAIL CROSSING INCIDENTS BY STATE
At Public Crossing At Private Crossing At Public Crossing
At Private CrossingStates
1996 1997 1998 1999 2000 2001 1996 1997 1998 1999 2000 2001 Cnt Kld Nonf Cnt Kld NonfAlabama 142 121 134 112 84 93 15 14 11 12 11 10 686 76 258 73 3 17Alaska 5 4 3 2 7 4 1 1 1 1 - - 25 1 4 4 - -Arizona 25 25 32 30 26 28 5 2 3 3 3 1 166 27 57 17 1 3Arkansas 131 100 104 95 99 83 14 18 12 10 16 4 612 94 221 74 11 20California 172 133 159 175 141 163 29 26 31 29 33 17 943 157 283 165 26 78Colorado 25 24 25 28 31 28 8 4 7 5 5 6 161 18 51 35 5 14Connecticut 9 4 8 6 4 1 3 2 2 2 4 2 32 3 10 15 - 3Delaware 4 4 4 10 10 6 - - 1 1 - 1 38 3 19 3 - 1Dist Of Columbia 2 - - - - - - - 1 - 2 - 2 - - 3 - -Florida 93 79 68 91 75 99 9 10 7 4 11 15 505 76 226 56 8 23Georgia 136 124 119 125 119 118 19 14 21 11 9 4 741 74 236 78 6 29Hawaii - - - - - 1 - - - - - - 1 - - - - -Idaho 43 27 25 20 26 17 6 3 2 - 7 3 158 27 48 21 3 1Illinois 210 191 177 178 196 187 22 22 22 24 21 25 1,139 201 480 136 11 31Indiana 211 210 176 182 188 153 13 17 18 11 6 12 1,120 140 427 77 4 26Iowa 114 90 90 92 99 100 9 16 14 7 10 10 585 48 199 66 7 18Kansas 101 99 62 74 58 56 12 10 9 3 9 7 450 58 170 50 4 6Kentucky 69 49 59 49 57 60 8 16 14 13 12 19 343 25 120 82 7 27Louisiana 213 179 192 164 162 147 18 24 22 16 19 14 1,057 128 531 113 14 53Maine 6 10 7 5 5 7 2 2 1 2 3 2 40 - 13 12 1 1Maryland 9 16 11 16 12 14 1 2 4 2 7 3 78 3 23 19 - 5Massachusetts 19 14 3 9 11 15 3 4 2 1 1 2 71 6 38 13 - 1Michigan 136 144 96 111 128 92 6 8 8 11 6 4 707 77 336 43 4 19Minnesota 132 110 108 92 84 73 25 6 8 10 7 9 599 57 234 65 6 15Mississippi 120 133 124 126 107 96 12 15 9 8 6 6 706 106 345 56 6 22Missouri 107 89 72 88 67 55 20 23 15 11 21 9 478 68 175 99 10 22Montana 23 18 19 11 14 15 11 11 8 8 10 1 100 9 40 49 5 8Nebraska 54 62 49 55 46 39 9 6 10 9 9 11 305 44 95 54 2 11Nevada 6 - 1 3 1 2 1 1 3 3 1 - 13 2 5 9 - 3New Hampshire 1 2 2 6 3 1 1 - - - - 1 15 - 1 2 1 -New Jersey 27 33 16 21 34 31 4 1 1 3 2 5 162 34 51 16 - 10New Mexico 23 17 14 15 13 20 3 3 3 4 4 4 102 26 52 21 3 5New York 31 27 25 24 33 22 5 10 4 7 8 10 162 22 53 44 8 12North Carolina 112 103 93 77 94 65 11 11 16 22 19 14 544 40 182 93 13 45North Dakota 30 19 20 15 16 15 3 2 3 2 1 2 115 19 33 13 1 7Ohio 174 172 142 127 138 123 12 6 12 19 10 17 876 109 281 76 4 10Oklahoma 75 109 60 77 83 65 5 8 6 7 6 4 469 91 213 36 2 12Oregon 28 25 30 22 21 25 15 10 14 8 9 18 151 16 36 74 2 11Pennsylvania 64 58 58 49 59 59 10 9 5 9 10 9 347 25 102 52 4 21Rhode Island - 1 1 - - - - - - - - - 2 - - - - -South Carolina 83 72 75 61 67 58 4 2 3 3 13 7 416 45 168 32 3 4South Dakota 20 22 14 15 8 16 - 1 1 - 3 4 95 3 36 9 - 2Tennessee 113 78 90 87 80 81 10 10 14 3 10 16 529 52 165 63 5 12Texas 391 368 288 322 327 313 43 53 34 43 61 49 2,009 248 882 283 44 119Utah 31 25 23 18 15 18 4 2 1 1 3 2 130 27 42 13 1 2Vermont 3 1 3 5 2 - 3 - 1 1 - - 14 1 4 5 - 2Virginia 50 37 36 35 34 31 20 19 15 20 20 13 223 7 82 107 7 37Washington 51 57 48 39 24 30 18 7 11 12 21 8 249 23 57 77 5 15West Virginia 17 19 21 19 14 13 5 6 2 12 6 7 103 7 30 38 4 11Wisconsin 144 106 97 104 110 102 6 11 8 5 12 2 663 47 291 44 3 11Wyoming 3 4 3 3 - 3 6 3 2 1 3 5 16 1 9 20 3 6Total 3,788 3,414 3,086 3,090 3,032 2,843 469 451 422 399 470 394 19,253 2371 7414 2,605 257 811

TABLE 1-13 HIGHWAY-RAIL CROSSING INCIDENTS CASUALTIES BYRAILROAD
Fatalities Nonfatal Railroads
1996 1997 1998 1999 2000 2001 1996 1997 1998 1999 2000 2001Alton & Southern - - - - - - 1 - 1 - - -Alaska RR Corp. - 1 - - - - - - 2 1 - 1Amtrak 41 53 50 52 56 69 66 123 125 146 90 84Bangor & Aroostook - - - - - - 1 - - 2 - 1Bessemer & Lake Erie RR - 1 - - - - - 5 1 - - -Burlington Northern Santa Fe 107 85 96 59 65 55 197 209 183 237 202 181Belt Rwy Of Chicago - 1 - - - - - 2 - - - 1Consolidated Rail Corp. 25 23 14 8 - - 97 58 39 19 - -Conrail Shared Assets - - - 1 1 2 - - - 2 10 6CSX Transportation 42 59 55 54 55 63 196 213 161 189 212 206Delaware & Hudson - 2 - 1 1 2 2 6 - 4 4 1Dakota,Minnesota & Eastern 1 - - - - - 6 1 2 3 4 1Duluth,Missabe & Iron Range - - - - - - 1 1 1 2 1 -Duluth,Winnipeg & Pacific - 3 1 1 - - 2 - 1 - - -Elgin, Joliet & Eastern - - - 2 - - 2 2 1 2 - 2Florida East Coast 5 5 1 5 7 3 10 9 8 12 6 3Guilford Rail System - 1 - - - - 3 2 2 2 1 2Grand Trunk Western RR 9 7 4 3 1 1 20 33 9 4 10 9Gateway Western 3 - 1 - 2 - - 4 1 1 3 1Illinois Central 11 13 13 10 14 21 67 66 51 64 55 47Indiana Harbor Belt - - - - 1 - 7 6 2 - 3 2I & M Rail Link, LLC - 2 2 2 5 4 - 8 26 11 15 18Kansas City Southern 24 22 25 15 19 15 69 82 88 57 57 60Long Island Rail Road 3 3 2 1 1 4 6 2 3 2 3 1MD Assn. of Rail Comm - - - - - - 4 - - - - -Mass Bay Transit Auth. - 1 1 - 1 - 22 1 - - 1 1Metro North Commuter 1 - - - - - 3 - - 3 1 -Montana Rail Link 3 1 - 2 3 1 5 8 6 3 - 2Northern IN Comm Trans 1 - 3 1 - - 1 2 2 - - 2Northeast IL Reg Comm 2 2 1 2 3 9 13 9 8 6 - 15New Jersey Transit Rail 2 7 5 4 3 6 2 1 2 1 - 1Norfolk Southern Corp. 49 46 44 51 59 67 192 187 140 187 129 129Paducah & Louisville - - - - - - - 6 1 1 2 4Peninsula Comm San Mateo Cnty - - - 1 2 4 - - 1 6 3 -Port Terminal RR Assn - - 1 1 - - 4 3 2 - 2 3Southern CA Reg Rail Auth. 3 2 4 2 1 1 1 - - 2 2 6Southeastern PA Trans. - 1 - - - - 1 3 - 1 3 -Soo Line 6 2 5 4 2 2 31 26 22 19 19 17Texas Mexican - - 1 - 1 - - 4 9 3 7 -Term RR Assn Of St. Louis - - - - - - 2 - - - - -Econo Rail Corporation - - - - 1 - - - - - 1 -Union Pacific 133 103 89 101 101 72 376 325 262 281 244 227Wisconsin Central Ltd. 3 3 5 6 9 10 45 42 38 36 43 35Wheeling & Lake Erie 1 2 - - - - 10 3 1 4 3 5Other Railroads 13 10 8 13 11 10 145 88 102 83 83 83Total 488 461 431 402 425 421 1,610 1,540 1,303 1,396 1,219 1,157

TABLE 1-14 TOTAL HIGHWAY-RAIL CROSSING INCIDENT CASUALTIES BYSTATE
Fatalities Nonfatal 6 Year TotalStates
1996 1997 1998 1999 2000 2001 1996 1997 1998 1999 2000 2001 Kld NonfAlabama 18 19 11 12 10 9 70 58 46 34 39 28 79 275Alaska - 1 - - - - - - 2 1 - 1 1 4Arizona 4 5 4 1 8 6 5 12 9 11 13 10 28 60Arkansas 20 10 24 15 27 9 39 44 45 37 36 39 105 240California 24 22 32 24 27 54 56 65 64 73 54 49 183 361Colorado 5 2 4 3 6 3 13 6 13 15 8 10 23 65Connecticut - - 1 - 2 - 3 1 4 3 - 2 3 13Delaware - 1 - 1 - 1 2 2 3 6 7 - 3 20Florida 16 12 7 19 15 15 36 42 30 38 67 36 84 249Georgia 19 12 13 7 10 19 44 57 35 41 38 50 80 265Idaho 6 6 4 2 11 1 15 6 14 6 1 7 30 49Illinois 39 27 30 54 31 31 88 85 67 114 68 89 212 511Indiana 28 23 25 26 23 19 81 112 80 63 55 62 144 453Iowa 8 12 3 10 6 16 38 55 30 28 31 35 55 217Kansas 13 16 9 8 11 5 40 28 30 39 18 20 62 175Kentucky 3 5 5 4 5 10 24 26 20 26 20 31 32 147Louisiana 31 30 25 20 14 22 119 111 101 71 88 93 142 583Maine - - - - 1 - 2 2 3 2 1 4 1 14Maryland - - - 1 1 1 7 7 2 1 2 9 3 28Massachusetts - 2 1 2 1 - 27 1 - 3 4 4 6 39Michigan 17 14 11 15 13 11 85 89 46 48 51 36 81 355Minnesota 14 7 14 13 6 9 48 32 47 57 40 25 63 249Mississippi 15 19 24 17 15 22 69 61 63 83 44 47 112 367Missouri 19 15 14 9 17 4 36 33 25 54 27 22 78 197Montana 3 1 4 4 1 1 14 11 11 6 2 4 14 48Nebraska 9 9 11 7 7 3 21 13 19 23 14 17 46 107Nevada 1 - 1 - - - 5 - 2 1 - - 2 8New Hampshire 1 - - - - - - - - 1 - - 1 1New Jersey 2 9 5 5 5 8 15 14 4 7 10 11 34 61New Mexico 7 6 5 3 - 8 19 6 6 7 11 8 29 57New York 4 7 2 4 5 8 14 14 6 12 14 5 30 65North Carolina 9 6 15 3 14 6 53 50 48 30 25 21 53 227North Dakota 4 1 6 1 6 2 13 7 7 3 2 8 20 40Ohio 14 26 15 21 15 22 63 46 45 59 38 40 113 291Oklahoma 22 24 12 14 12 9 38 56 39 26 47 19 93 225Oregon 1 4 5 2 - 6 5 2 9 5 13 13 18 47Pennsylvania 3 5 1 4 8 8 25 26 21 19 17 15 29 123South Carolina 6 14 6 8 10 4 39 27 32 27 24 23 48 172South Dakota 2 - - - - 1 9 8 6 6 5 4 3 38Tennessee 9 12 14 4 8 10 26 24 26 36 26 39 57 177Texas 61 54 45 41 52 39 175 198 158 176 164 132 292 1,003Utah 11 3 5 5 2 2 7 8 6 8 7 8 28 44Vermont 1 - - - - - 5 - - 1 - - 1 6Virginia 4 2 2 2 3 1 22 15 17 26 21 18 14 119Washington 6 7 6 3 1 5 18 23 5 9 10 7 28 72West Virginia 2 4 2 1 1 1 6 4 5 9 8 9 11 41Wisconsin 5 6 7 7 15 10 66 53 48 43 49 43 50 302Wyoming 2 1 1 - - - 5 - 4 2 - 4 4 15Total 488 461 431 402 425 421 1,610 1,540 1,303 1,396 1,219 1,157 2,628 8,225

TABLE 1-15 TRESPASSER CASUALTIES BY RAILROAD, NOT AT HRC
Fatalities Nonfatal 6 Year TotalRailroads
1996 1997 1998 1999 2000 2001 1996 1997 1998 1999 2000 2001 Kld NonfAlaska RR Corp. 1 - 1 - - - 2 - - - - 1 2 3Amtrak 56 57 67 51 70 67 14 32 30 25 18 37 368 156Bessemer & Lake Erie RR - - - - - - - - - - 2 - - 2Burlington Northern Santa Fe 60 85 104 63 77 62 77 68 70 53 57 47 451 372Consolidated Rail Corp. 4 33 23 6 - - 5 38 30 9 - - 66 82Conrail Shared Assets - - - 1 - 5 - - - 1 3 4 6 8CSX Transportation 51 47 64 64 61 78 54 47 55 47 58 84 365 345Delaware & Hudson 1 2 - 2 3 3 1 2 2 2 2 2 11 11Dakota,Minnesota & Eastern - 1 - - - - 1 2 - 1 - - 1 4Duluth,Winnipeg & Pacific - - 1 - - - - - - - - - 1 -Elgin, Joliet & Eastern - - - - - - - - - - - 2 - 2Florida East Coast 17 14 9 10 15 10 9 13 16 7 13 7 75 65Guilford Rail System - 3 2 2 3 1 - 6 3 1 - 3 11 13Grand Trunk Western RR 2 2 - - 3 3 4 1 - 2 2 2 10 11Gateway Western - 1 1 1 2 1 1 1 - - 1 - 6 3Illinois Central 6 4 2 6 3 4 5 7 4 2 10 3 25 31Indiana Harbor Belt 1 2 - - - - 2 2 1 2 2 1 3 10I & M Rail Link, LLC - - - 2 1 1 - - 2 2 1 - 4 5Kansas City Southern 2 4 4 5 5 6 8 6 11 3 9 2 26 39Long Island Rail Road 6 14 6 4 4 6 16 37 10 3 9 5 40 80MD Assn. of Rail Comm - - - 2 2 - 1 - 1 1 - - 4 3Mass Bay Transit Auth. 6 9 1 5 10 10 3 - 1 1 5 1 41 11Metro North Commuter 2 6 4 5 4 2 4 3 2 3 1 2 23 15Montana Rail Link 2 3 - 1 - 1 1 1 - 1 - - 7 3Northern IN Comm Trans - 1 - - - - - 1 - - - - 1 1Northeast IL Reg Comm 5 5 4 5 2 8 4 2 9 10 6 7 29 38New Jersey Transit Rail 14 15 18 13 17 25 3 5 2 3 4 5 102 22Norfolk Southern Corp. 57 54 63 47 56 55 67 56 58 50 41 42 332 314Paducah & Louisville 1 - 1 - - - 1 1 1 - 1 2 2 6Port Auth Trans Hudson - - - - - 1 - 1 2 - - 1 1 4Peninsula Comm San Mateo Cnty 3 6 3 2 12 8 - 1 6 1 - 1 34 9Port Terminal RR Assn - - - - - - - 1 - 1 1 - - 3Southern CA Reg Rail Auth. 2 6 2 - - - - 1 1 - - 1 10 3Southeastern PA Trans. 5 4 3 6 3 1 2 6 12 7 2 2 22 31Soo Line 4 3 1 3 1 3 6 1 6 1 1 2 15 17Texas Mexican - - - - - - 1 1 1 1 1 - - 5Term RR Assn Of St. Louis - - - - - - 1 - - - - - - 1Union Pacific 152 139 146 165 95 132 159 155 151 192 141 127 829 925Wisconsin Central Ltd. 1 3 1 - 2 1 7 7 3 1 6 2 8 26Wheeling & Lake Erie - - - 1 - - 2 - - - - - 1 2Other Railroads 10 10 5 7 12 17 13 11 23 12 17 9 61 85Total 471 533 536 479 463 511 474 516 513 445 414 404 2,993 2,766

TABLE 1-16 TRESPASSER CASUALTIES BY STATE, NOT AT HRC
Fatalities Nonfatal 6 Year TotalStates
1996 1997 1998 1999 2000 2001 1996 1997 1998 1999 2000 2001 Kld NonfAlabama 7 9 13 6 10 12 12 11 5 6 7 3 57 44Alaska 1 - 1 - - - 2 - 1 - - 1 2 4Arizona 16 18 15 14 15 9 9 3 10 15 14 9 87 60Arkansas 5 1 12 10 2 7 6 8 7 7 5 6 37 39California 68 81 79 86 72 76 45 38 56 44 45 39 462 267Colorado 5 7 8 6 4 6 4 11 10 8 4 4 36 41Connecticut 3 7 3 10 4 3 4 2 1 2 - 2 30 11Delaware 1 - 1 1 2 1 1 - 1 1 - 4 6 7Dist Of Columbia - - 1 - - 1 - 1 1 - 1 2 2 5Florida 23 24 23 24 29 28 14 22 35 18 20 26 151 135Georgia 8 11 16 11 11 8 18 9 17 12 5 9 65 70Idaho 1 - 4 2 - 2 1 4 4 1 - 1 9 11Illinois 32 44 34 32 31 39 30 28 24 29 26 27 212 164Indiana 7 11 5 5 11 9 6 4 10 8 5 5 48 38Iowa 4 2 3 6 2 1 6 7 6 4 8 5 18 36Kansas 5 2 7 4 9 5 5 4 9 9 7 12 32 46Kentucky 8 17 5 1 8 4 14 7 12 9 8 8 43 58Louisiana 6 5 7 8 2 10 9 16 11 8 14 8 38 66Maine - 1 1 - 1 - - 6 - - - 2 3 8Maryland 7 4 4 10 7 6 2 2 7 6 5 2 38 24Massachusetts 11 16 4 10 16 13 4 3 8 3 5 8 70 31Michigan 10 7 5 5 9 8 7 14 7 5 11 4 44 48Minnesota 4 6 8 10 5 5 5 3 10 9 5 6 38 38Mississippi 2 3 3 8 2 11 3 1 6 4 - 5 29 19Missouri 10 6 19 7 11 12 9 7 7 13 8 8 65 52Montana 5 6 3 - 2 2 3 2 - 2 1 1 18 9Nebraska 5 4 2 4 1 4 6 4 4 5 4 1 20 24Nevada 2 2 5 4 1 3 1 4 4 3 4 2 17 18New Hampshire - - 1 - - - - - 6 - - - 1 6New Jersey 16 18 23 14 21 29 4 9 3 5 11 8 121 40New Mexico 5 11 7 5 4 8 12 7 8 9 6 3 40 45New York 16 32 25 18 24 18 20 54 23 16 26 25 133 164North Carolina 16 19 24 21 10 19 19 22 14 12 11 13 109 91North Dakota 1 1 1 2 2 2 3 - 2 1 1 3 9 10Ohio 12 15 12 14 12 11 10 14 21 8 9 9 76 71Oklahoma 6 6 7 7 10 5 13 11 5 9 7 9 41 54Oregon 5 12 15 8 9 7 14 8 10 5 14 5 56 56Pennsylvania 14 21 16 15 14 23 8 26 28 15 11 19 103 107Rhode Island 1 4 2 1 1 1 - - 1 - - 1 10 2South Carolina 12 5 17 8 9 8 6 9 6 6 7 4 59 38South Dakota - 1 - - 2 - 1 2 - 1 6 - 3 10Tennessee 11 8 10 12 6 13 9 11 5 4 1 8 60 38Texas 60 38 50 42 34 47 89 78 78 90 56 60 271 451Utah 3 3 1 2 3 2 5 5 1 1 3 1 14 16Vermont - - 1 - 1 1 - - 2 - - - 3 2Virginia 14 9 10 8 8 4 8 8 3 10 4 14 53 47Washington 13 17 13 13 14 18 10 16 7 10 15 4 88 62West Virginia 3 7 5 1 8 4 9 5 6 8 10 4 28 42Wisconsin 4 11 4 2 4 5 8 10 9 4 4 1 30 36Wyoming 3 1 1 2 - 1 - - 2 - - 3 8 5Total 471 533 536 479 463 511 474 516 513 445 414 404 2,993 2,766

Railroad Safety Statistics-Annual Report 2001 04/01/2003
CHAPTER 2
CURRENT YEAR SUMMARY OF ACCIDENTS/INCIDENTS AND RATES
The Federal Railroad Administration’s (FRA) regulations on reporting railroad accidents/ incidents are found primarily in Title 49 of the Code of Federal Regulations (CFR), Part 225 (49 CFR Part 225). The purpose of the regulations in Part 225 is to provide FRA with accurate information concerning the hazards and risks that exist on the Nation's railroads. FRA needs this information to effectively carry out its regulatory and enforcement responsibilities under the Federal railroad safety statutes. FRA also uses this information for determining comparative trends of railroad safety and to develop hazard elimination and risk reduction programs that focus on preventing railroad injuries and accidents. Issuance of these regulations preempts States from prescribing accident/incident reporting requirements. Any State may, however, require railroads to submit to it copies of reports filed with FRA under Part 225 for accidents/incidents that occur in that State.
These FRA accident/incident reporting requirements apply to all railroads except--
1. A railroad that operates freight trains only on track inside an installation which is not part of the general railroad system of transportation or that owns no track except for track that is inside an installation that is not part of the general railroad system of transportation and used for freight operations.
2. Rail mass transit operations in an urban area that are not connected with the general railroad system of transportation.
3. A railroad that exclusively hauls passengers inside an installation that is insular or that owns no track except for track used exclusively for the hauling of passengers inside an installation that is insular. An operation is not considered insular if one or more of the following exists on its line:
a. A public highway-rail grade crossing that is in use;
b. An at-grade rail crossing that is in use; c. A bridge over a public road or waters used for commercial navigation; or
d. A common corridor with a railroad, i.e., its operations are within 30 feet of those of any railroad.
Part 225 covers any and all activities of a railroad related to the performance of its rail transportation business. “Railroad transportation” means any form of non-highway ground transportation that run on rails or electro-magnetic guideways, including (1) commuter or other short-haul railroad passenger service in a metropolitan or suburban area, as well as any commuter railroad service that was operated by the Consolidated Rail Corporation as of January

Railroad Safety Statistics-Annual Report 2001 04/01/2003
1, 1979, and (2) high speed ground transportation systems that connect metropolitan areas, without regard to whether they use new technologies not associated with traditional railroads. Such term does not include rapid transit operations within an urban area that are not connected to the general railroad system of transportation.
Approximately 700 railroads currently submit accident/incident reports. It is not possible to display the safety record of each railroad in this publication. Consequently, the listing of individual railroads has been limited to those defined by the Surface Transportation Board (STB) to be Class 1 railroads, and other railroads reporting annual employees worked in excess of 400,000.
Railroads have been assigned to 1 of 3 groups in this bulletin. Group 1 corresponds to the railroads that have defined as Class 1; Group 2 includes railroads that reported at least 400,000 hours worked; and, Group 3 contains all other railroads.
In order to conserve space, most tables display the reporting code assigned to a railroad. Please see Table 2-8 for a listing of the code and railroad name.

Railroad Safety Statistics-Annual Report 2001 04/01/2003
CONTENTS
CHAPTER 2
CURRENT YEAR SUMMARY OF ACCIDENTS/INCIDENTS AND RATES
Tables
2-1 Accidents/incidents, by month, 2001 .................................................................…………...2-2 Accident/incident rates, by month, 2001............................................................…………... 2-3 Accidents/incidents, by railroad group, 2001.....................................................…………...2-4 Operational data, by railroad group, 2001..........................................................…………... 2-5 Accident/incident rates, by railroad group, 2001 ..............................................……………2-6 Accidents/incidents, by railroad, 2001............................................................……………...2-7 Accident/incident rates, by railroad, 2001..………………………………………………...2-8 Railroad rankings, 2001 ....................................................................................…………… 2-9 Operational data, by railroad, 2001...................................................................……………. 2-10 Operational data, by month, 2001 ....................................................................……………. 2-11 Summary of accidents/incidents, by state, 2001 ..............................................…………….

TABLE 2-1 ACCIDENTS/INCIDENTS, BY MONTH, 2001
Total Train Accidents HRC Incidents Other Incidents Months
Cnt Deaths Nonfatal Cnt Deaths Nonfatal Cnt Deaths Nonfatal Cnt Deaths NonfatalJanuary 1,475 71 1,024 271 - 10 297 40 102 907 31 912February 1,344 77 926 257 1 50 273 36 75 814 40 801March 1,424 73 997 272 1 56 295 39 108 857 33 833April 1,249 73 839 240 - 17 244 28 95 765 45 727May 1,378 90 943 251 - 19 266 38 105 861 52 819June 1,389 83 948 252 - 30 272 34 82 865 49 836July 1,434 91 990 282 - 23 249 38 85 903 53 882August 1,523 97 1,027 289 1 11 290 32 110 944 64 906September 1,263 77 894 238 - 68 267 25 96 758 52 730October 1,348 74 924 227 - 4 273 35 102 848 39 818November 1,132 74 769 212 2 12 237 26 106 683 46 651December 1,128 91 704 232 1 10 274 50 91 622 40 603Total 16,087 971 10,985 3,023 6 310 3,237 421 1,157 9,827 544 9,518

TABLE 2-2 ACCIDENT/INCIDENT RATES, BY MONTH, 2001
1. Total ccident/incident rate of all reported events * 1,000,000 /(train miles + hours) 2. Train accidents * 1,000,000 / total train miles
3. Employee deaths, injuries, illnesses * 200,000 / total hours worked 4. Highway rail incidents * 1,000,000 / total train miles
5. Other events (not train accidents or crossing incidents) * 1,000,000 /(train miles + hours) 6. Trespassing deaths and injuries * 1,000,000 / total train miles
7 Passenger on train deaths and injuries * 100,000,000 / total passenger miles 8. Passenger train accidents * 1,000,000 / passenger train miles
9. Accidents on yard track * 1,000,000 / yard switching train miles 10. Accidents on other than yard track * 1,000,0000 / (total train miles - yard switching)
MonthsTotal
Accident/Incident
TrainAccidents
EmployeeOn Duty
Highway-railCrossing
OtherEvents Trespasser
PassengerOn Trains
PassengerTrain
YardTrack
OtherTrack
January 14.55 4.54 3.36 4.98 8.95 0.82 5.62 1.09 19.56 2.40February 14.60 4.66 3.57 4.95 8.84 1.20 6.80 1.64 19.77 2.52March 13.69 4.35 3.24 4.72 8.24 1.23 6.64 1.64 19.16 2.31April 12.68 4.06 3.06 4.12 7.77 1.37 2.78 0.84 20.38 1.81May 13.50 4.14 3.27 4.39 8.43 1.30 5.00 1.60 16.60 2.41June 14.08 4.28 3.36 4.62 8.77 1.56 5.16 2.32 16.84 2.53July 14.74 4.84 3.70 4.28 9.28 1.70 5.99 1.33 20.08 2.75August 14.86 4.71 3.49 4.73 9.21 1.63 4.92 2.22 19.28 2.71September 13.05 4.03 3.44 4.52 7.83 1.35 4.36 1.97 17.45 2.23October 12.83 3.64 3.19 4.38 8.07 0.95 4.41 0.78 16.31 1.93November 11.73 3.65 2.99 4.08 7.08 1.19 2.71 0.84 16.06 2.01December 12.28 4.11 2.89 4.85 6.77 1.13 3.04 1.37 18.04 2.30Total 13.56 4.25 3.30 4.55 8.28 1.29 4.78 1.47 18.30 2.32

TABLE 2-3 ACCIDENTS/INCIDENTS BY RAILROAD GROUPS, 2001
Total Train Accidents HRC Incidents Other Incidents Groups
Cnt Deaths Nonfatal Cnt Deaths Nonfatal Cnt Deaths Nonfatal Cnt Deaths NonfatalI 11,155 805 7,232 2,322 6 238 2,559 365 960 6,274 434 6,034II 3,336 137 2,741 389 - 68 333 46 114 2,614 91 2,559III 1,596 29 1,012 312 - 4 345 10 83 939 19 925All 16,087 971 10,985 3,023 6 310 3,237 421 1,157 9,827 544 9,518

TABLE 2-4 OPERATIONAL DATA BY RAILROAD GROUPS, 2001
GroupsTrain Miles
FreightTrain Miles
PassengerTrain Miles
YardSwitching Train Miles
OtherTrainMiles
EmployeeHours
PassengersCarried
I 604,662,947 501,820,665 36,679,452 66,146,579 16,251 370,517,390 23,525,230II 83,438,388 22,743,550 47,734,369 12,875,923 84,546 80,912,314 472,175,591III 23,448,571 13,237,439 3,341,415 6,724,715 145,002 23,689,988 21,547,841All 711,549,906 537,801,654 87,755,236 85,747,217 245,799 475,119,692 517,248,662

TABLE 2-5 ACCIDENT/INCIDENT RATES BY RAILROAD GROUPS, 2001
GroupsTotal
Accident/Incident
TrainAccidents
EmployeeOn Duty
Highway-railCrossing
OtherEvents Trespasser
PassengerOn Trains
PassengerTrain
YardTrack
OtherTrack
I 11.44 3.84 2.72 4.23 6.43 1.25 7.50 1.61 19.40 1.93II 20.30 4.66 4.86 3.99 15.91 1.59 3.12 1.45 14.60 2.85III 33.86 13.31 6.96 14.71 19.92 1.11 5.55 0.30 14.57 12.80Tot 13.56 4.25 3.30 4.55 8.28 1.29 4.78 1.47 18.30 2.32

TABLE 2-6 ACCIDENTS/INCIDENTS BY RAILROAD, 2001
Highway-Rail Counts Are Excluded From Other Categories
Total Train Accidents HRC Incidents Other Incidents Group - Railroads
Cnt Deaths Nonfatal Cnt Deaths Nonfatal Cnt Deaths Nonfatal Cnt Deaths NonfatalAmtrak 1,629 139 1,527 150 1 151 162 69 84 1,317 69 1,292Burlington Northern Santa Fe 2,407 126 1,485 623 1 31 473 55 181 1,311 70 1,273CSX Transportation 1,863 143 1,119 389 1 14 521 63 206 953 79 899Grand Trunk Western RR 128 7 96 15 2 2 24 1 9 89 4 85Illinois Central 294 26 183 66 - 3 90 21 47 138 5 133Kansas City Southern 280 21 126 92 - 1 120 15 60 68 6 65Norfolk Southern Corp. 1,308 126 653 239 - 8 507 67 129 562 59 516Soo Line 215 6 166 31 - - 33 2 17 151 4 149
1
Union Pacific 3,210 211 1,877 896 1 28 629 72 227 1,685 138 1,622Alton & Southern 18 - 8 11 - 1 - - - 7 - 7Alaska RR Corp. 59 - 57 1 - - 4 - 1 54 - 56Bangor & Aroostook 18 - 15 2 - - 2 - 1 14 - 14Bessemer & Lake Erie RR 10 - 8 2 - - - - - 8 - 8Belt Rwy Of Chicago 28 - 10 15 - - 4 - 1 9 - 9Conrail Shared Assets 101 7 53 33 - - 19 2 6 49 5 47Delaware & Hudson 64 5 52 8 - 1 4 2 1 52 3 50Dakota,Minnesota & Eastern 43 - 17 15 - - 12 - 1 16 - 16Duluth,Missabe & Iron Range 35 - 32 4 - 2 1 - - 30 - 30Duluth,Winnipeg & Pacific 4 - 1 2 - - 1 - - 1 - 1Elgin, Joliet & Eastern 53 - 39 11 - - 5 - 2 37 - 37Florida East Coast 71 13 27 15 - - 22 3 3 34 10 24Guilford Rail System 22 1 16 3 - - 4 - 2 15 1 14Gateway Western 24 1 10 12 - 2 4 - 1 8 1 7Indiana Harbor Belt 74 - 42 24 - - 10 - 2 40 - 40I & M Rail Link, LLC 98 5 43 36 - - 36 4 18 26 1 25Long Island Rail Road 395 10 382 19 - 16 5 4 1 371 6 365MD Assn. of Rail Comm 7 - 7 - - - - - - 7 - 7Mass Bay Transit Auth. 128 11 113 2 - - 6 - 1 120 11 112Metro North Commuter 518 3 466 55 - 7 1 - - 462 3 459Montana Rail Link 67 2 38 19 - - 11 1 2 37 1 36Northern IN Comm Trans 19 - 16 1 - - 4 - 2 14 - 14Northeast IL Reg Comm 405 17 388 7 - - 31 9 15 367 8 373New Jersey Transit Rail 258 32 219 25 - 22 13 6 1 220 26 196Paducah & Louisville 19 1 9 5 - - 8 - 4 6 1 5Port Auth Trans Hudson 137 2 158 3 - 16 - - - 134 2 142Peninsula Comm San Mateo Cnty 38 12 23 1 - - 6 4 - 31 8 23Port Terminal RR Assn 34 - 11 18 - - 8 - 3 8 - 8Southern CA Reg Rail Auth. 31 1 24 3 - - 10 1 6 18 - 18Southeastern PA Trans. 275 3 262 10 - - - - - 265 3 262Texas Mexican 36 - 16 14 - - 6 - - 16 - 16Term RR Assn Of St. Louis 23 - 13 9 - - 1 - - 13 - 13Econo Rail Corporation 12 - 5 3 - - 4 - - 5 - 5Union RR (Pittsburgh) 27 - 25 2 - - - - - 25 - 25Wisconsin Central Ltd. 198 11 121 34 - 1 79 10 35 85 1 85
2
Wheeling & Lake Erie 32 - 15 10 - - 12 - 5 10 - 103 Other Railroads 1,630 29 1,012 346 - 4 345 10 83 939 19 925

TABLE 2-7 ACCIDENT/INCIDENT RATES BY RAILROAD, 2001
1. Total ccident/incident rate of all reported events * 1,000,000 /(train miles + hours) 2. Train accidents * 1,000,000 / total train miles
3. Employee deaths, injuries, illnesses * 200,000 / total hours worked 4. Highway rail incidents * 1,000,000 / total train miles
5. Other events (not train accidents or crossing incidents) * 1,000,000 /(train miles + hours) 6. Trespassing deaths and injuries * 1,000,000 / total train miles
7 Passenger on train deaths and injuries * 100,000,000 / total passenger miles 8. Passenger train accidents * 1,000,000 / passenger train miles
9. Accidents on yard track * 1,000,000 / yard switching train miles 10. Accidents on other than yard track * 1,000,0000 / (total train miles - yard switching)
Group - Railroads TotalRate 1/
TrainAccRate 2/
EODRate 3/
HRC Rate 4/
OtherEvents
5/
TresRate6/
Psgr Rate 7/
Psgr TrainRate8/
YardRate 9/
OtherTrackRate 10/
Amtrak 19.98 3.89 4.10 4.20 16.15 2.70 7.50 1.56 34.87 2.14Burlington Northern Santa Fe 9.91 3.82 2.67 2.90 5.40 0.67 . . 22.04 2.15CSX Transportation 10.66 3.58 2.44 4.80 5.45 1.49 . . 14.74 1.58Grand Trunk Western RR 14.31 2.94 4.37 4.71 9.95 0.98 . . 7.62 1.53Illinois Central 15.13 6.10 3.06 8.32 7.10 0.65 . . 11.86 4.42Kansas City Southern 21.59 12.01 2.41 15.67 5.24 1.04 . . 41.60 7.27Norfolk Southern Corp. 8.71 2.66 1.33 5.64 3.74 1.08 . . 9.96 1.34Soo Line 14.84 3.74 4.84 3.98 10.42 0.60 . . 8.66 2.21
1
Union Pacific 11.89 5.19 3.01 3.64 6.24 1.50 . . 37.11 2.48Alton & Southern 12.13 13.82 2.33 . 4.72 . . . 11.31 .Alaska RR Corp. 20.70 0.70 7.01 2.81 18.95 0.70 . . . 1.02Bangor & Aroostook 13.63 2.44 5.97 2.44 10.60 . . . . 2.62Bessemer & Lake Erie RR 12.50 8.95 2.43 . 10.00 . . . 102.64 .Belt Rwy Of Chicago 18.19 33.53 1.83 8.94 5.85 . . . 30.40 57.00Conrail Shared Assets 18.78 14.50 1.81 8.35 9.11 3.95 . . 13.20 19.61Delaware & Hudson 19.08 3.95 7.37 1.98 15.50 2.47 . . 15.53 1.76Dakota,Minnesota & Eastern 27.66 19.40 4.10 15.52 10.29 . . . 46.05 16.03Duluth,Missabe & Iron Range 19.16 5.57 5.77 1.39 16.42 . . . 28.27 3.09Duluth,Winnipeg & Pacific 3.30 2.62 0.45 1.31 0.83 . . . . 2.68Elgin, Joliet & Eastern 25.43 17.23 4.98 7.83 17.75 3.13 . . 20.20 15.35Florida East Coast 17.14 5.89 1.88 8.64 8.21 6.68 . . 23.31 1.48Guilford Rail System 6.24 1.77 1.20 2.36 4.25 2.36 . . . 3.01Gateway Western 16.25 13.16 2.83 4.39 5.42 1.10 . . 28.98 7.46Indiana Harbor Belt 25.86 18.15 5.07 7.56 13.98 0.76 . . . 3.78I & M Rail Link, LLC 28.28 18.54 3.54 18.54 7.50 0.52 . . 54.91 11.64Long Island Rail Road 19.69 2.31 5.12 0.61 18.49 1.34 1.28 0.61 . 1.21MD Assn. of Rail Comm 4.32 . 1.10 . 4.32 . 1.69 . . .Mass Bay Transit Auth. 16.95 0.52 4.92 1.56 15.89 2.86 1.86 0.52 . 0.52Metro North Commuter 27.17 6.55 6.50 0.12 24.23 0.48 1.66 4.53 . 5.72Montana Rail Link 12.45 5.40 3.97 3.13 6.88 0.28 . . 19.54 3.27Northern IN Comm Trans 11.18 1.14 3.17 4.56 8.24 . 0.86 1.31 . .Northeast IL Reg Comm 23.60 0.80 4.27 3.55 21.38 1.72 6.91 0.15 2.37 0.54New Jersey Transit Rail 15.85 2.95 4.17 1.54 13.52 3.54 2.47 1.43 208.10 1.43Paducah & Louisville 16.65 8.78 1.40 14.05 5.26 3.51 . . . 11.53Port Auth Trans Hudson 34.70 1.48 11.22 . 33.95 0.99 2.76 . 7.58 0.57Peninsula Comm San Mateo Cnty 18.29 0.83 4.12 4.98 14.92 7.47 . 0.86 27.01 .Port Terminal RR Assn 17.75 14.40 2.70 6.40 4.18 . . . 12.00 .Southern CA Reg Rail Auth. 12.85 1.65 2.68 5.51 7.46 0.55 0.34 . . 0.55Southeastern PA Trans. 30.86 1.87 10.01 . 29.74 0.56 14.37 1.68 . 1.68Texas Mexican 49.34 53.05 6.44 22.74 21.93 . . . 11.37 .Term RR Assn Of St. Louis 18.63 13.64 4.52 1.52 10.53 . . . 7.58 .Econo Rail Corporation 9.75 3.65 2.44 4.87 4.06 . . . . .Union RR (Pittsburgh) 27.89 17.71 5.85 . 25.83 . . . 8.86 .Wisconsin Central Ltd. 18.64 5.44 3.84 12.65 8.00 0.48 . . 12.86 3.45
2
Wheeling & Lake Erie 21.97 15.47 2.22 18.57 6.87 . . . 21.70 12.993 Other Railroads 34.58 14.76 6.96 14.71 19.92 1.11 5.55 0.30 16.21 14.17

TABLE 2-8 RAILROAD RANKINGS, 2001
Railroads TrainMiles Hours
TotalRate
TrainAccRate
EODRate
HRCRate
OtherEvents
TresRate
ATK - Amtrak 5 5 20 4 4 4 16 3BNSF - Burlington Northern Santa Fe 2 2 10 4 3 3 5 1CSX - CSX Transportation 3 3 11 4 2 5 5 1GTW - Grand Trunk Western RR 9 9 14 3 4 5 10 1IC - Illinois Central 6 6 15 6 3 8 7 1KCS - Kansas City Southern 8 8 22 12 2 16 5 1NS - Norfolk Southern Corp. 4 4 9 3 1 6 4 1SOO - Soo Line 7 7 15 4 5 4 10 1
1
UP - Union Pacific 1 1 12 5 3 4 6 1ALS - Alton & Southern 25 25 12 14 2 0 5 0ARR - Alaska RR Corp. 16 16 21 1 7 3 19 1BAR - Bangor & Aroostook 24 33 14 2 6 2 11 0BLE - Bessemer & Lake Erie RR 35 28 13 9 2 0 10 0BRC - Belt Rwy Of Chicago 33 19 18 34 2 9 6 0CRSH - Conrail Shared Assets 10 8 19 14 2 8 9 4DH - Delaware & Hudson 11 17 19 4 7 2 16 2DME - Dakota,Minnesota & Eastern 26 24 28 19 4 16 10 0DMIR - Duluth,Missabe & Iron Range 28 18 19 6 6 1 16 0DWP - Duluth,Winnipeg & Pacific 27 35 3 3 0 1 1 0EJE - Elgin, Joliet & Eastern 31 15 25 17 5 8 18 3FEC - Florida East Coast 9 12 17 6 2 9 8 7GRS - Guilford Rail System 15 11 6 2 1 2 4 2GWWR - Gateway Western 21 31 16 13 3 4 5 1IHB - Indiana Harbor Belt 17 13 26 18 5 8 14 1IMRL - I & M Rail Link, LLC 13 14 28 19 4 19 8 1LI - Long Island Rail Road 4 1 20 2 5 1 18 1MACZ - MD Assn. of Rail Comm 20 32 4 0 1 0 4 0MBTA - Mass Bay Transit Auth. 7 6 17 1 5 2 16 3MNCW - Metro North Commuter 3 2 27 7 7 0 24 0MRL - Montana Rail Link 8 10 12 5 4 3 7 0NICD - Northern IN Comm Trans 22 22 11 1 3 5 8 0NIRC - Northeast IL Reg Comm 1 3 24 1 4 4 21 2NJTR - New Jersey Transit Rail 2 4 16 3 4 2 14 4PAL - Paducah & Louisville 32 30 17 9 1 14 5 4PATH - Port Auth Trans Hudson 12 9 35 1 11 0 34 1PCMZ - Peninsula Comm San Mateo Cnty 19 20 18 1 4 5 15 7PTRA - Port Terminal RR Assn 18 26 18 14 3 6 4 0SCAX - Southern CA Reg Rail Auth. 14 27 13 2 3 6 7 1SEPA - Southeastern PA Trans. 6 7 31 2 10 0 30 1TM - Texas Mexican 34 34 49 53 6 23 22 0TRRA - Term RR Assn Of St. Louis 29 29 19 14 5 2 11 0TXTX - Econo Rail Corporation 23 36 10 4 2 5 4 0URR - Union RR (Pittsburgh) 36 21 28 18 6 0 26 0WC - Wisconsin Central Ltd. 5 5 19 5 4 13 8 0
2
WE - Wheeling & Lake Erie 30 23 22 15 2 19 7 0

TABLE 2-9 OPERATIONAL DATA, BY RAILROAD, 2001
XXXX = all other railoads
Railroads Total Train Miles %
EmployeeHours
Worked %Freight
Train Miles PassengerTrain Miles
YardSwitching
Miles
OtherTrainMiles
Psgrs Carried
Psgr Miles
MillionsALS 795,694 0.11 688,169 0.14 - - 795,694 - - -ARR 1,423,898 0.20 1,426,067 0.30 803,840 180,903 438,844 311 471,431 21ATK 38,575,104 5.42 42,956,762 9.04 - 36,510,000 2,065,104 - 23,525,230 5,571BAR 818,664 0.12 502,177 0.11 763,872 - 54,792 - - -BLE 223,478 0.03 576,236 0.12 203,993 - 19,485 - - -BNSF 162,943,990 22.90 79,952,918 16.83 149,244,443 - 13,699,547 - - -BRC 447,397 0.06 1,092,060 0.23 52,631 - 394,766 - - -CRSH 2,276,601 0.32 3,100,362 0.65 459,009 - 1,817,592 - - -CSX 108,619,574 15.27 66,130,498 13.92 91,966,649 169,452 16,483,473 - - -DH 2,023,667 0.28 1,330,536 0.28 1,701,808 - 321,859 - - -DME 773,214 0.11 781,164 0.16 686,350 - 86,864 - - -DMIR 717,749 0.10 1,108,873 0.23 647,003 - 70,746 - - -DWP 764,209 0.11 447,139 0.09 747,003 - 17,206 - - -EJE 638,313 0.09 1,445,633 0.30 390,815 - 247,498 - - -FEC 2,544,846 0.36 1,597,977 0.34 2,030,093 - 514,753 - - -GRS 1,694,494 0.24 1,833,670 0.39 995,734 - 698,760 - - -GTW 5,097,500 0.72 3,845,154 0.81 3,909,123 - 1,180,848 7,529 - -GWWR 911,887 0.13 564,707 0.12 670,378 - 241,509 - - -IC 10,811,462 1.52 8,614,523 1.81 8,356,621 - 2,446,119 8,722 - -IHB 1,322,436 0.19 1,539,547 0.32 1,322,436 - - - - -IMRL 1,941,530 0.27 1,524,206 0.32 1,631,930 - 309,600 - - -KCS 7,659,908 1.08 5,309,707 1.12 6,602,246 - 1,057,662 - - -LI 8,238,600 1.16 11,827,343 2.49 - 8,238,600 - - 85,602,984 2,345MACZ 1,073,821 0.15 546,258 0.11 - 993,771 5,159 74,891 5,893,932 177MBTA 3,850,775 0.54 3,701,620 0.78 - 3,850,775 - - 37,409,702 484MNCW 8,397,319 1.18 10,669,280 2.25 - 8,397,319 - - 71,427,968 2,048MRL 3,517,235 0.49 1,864,267 0.39 3,048,963 7,676 460,596 - 3,071 1NICD 877,753 0.12 821,049 0.17 115,138 762,615 - - 3,967,777 117NIRC 8,735,525 1.23 8,427,287 1.77 668,114 6,799,803 1,267,608 - 78,575,162 1,707NJTR 8,465,459 1.19 7,811,746 1.64 - 8,402,988 62,471 - 63,963,310 1,294NS 89,950,834 12.64 60,195,279 12.67 76,201,648 - 13,749,186 - - -PAL 569,362 0.08 572,003 0.12 433,780 - 135,582 - - -PATH 2,023,247 0.28 1,924,314 0.41 - 1,759,344 263,903 - 76,941,200 326PCMZ 1,204,842 0.17 873,329 0.18 - 1,167,818 37,024 - 10,257,871 206PTRA 1,249,909 0.18 665,484 0.14 - - 1,249,909 - - -SCAX 1,813,767 0.25 597,907 0.13 - 1,813,767 - - 8,492,551 297SEPA 5,353,919 0.75 3,556,807 0.75 - 5,353,919 - - 29,167,566 397SOO 8,292,477 1.17 6,196,846 1.30 6,328,629 - 1,963,848 - - -TM 263,910 0.04 465,794 0.10 - - 263,910 - - -TRRA 659,669 0.09 574,901 0.12 - - 659,669 - - -TXTX 821,309 0.12 409,750 0.09 - - 821,309 - - -UP 172,712,098 24.27 97,315,703 20.48 159,211,306 - 13,500,792 - - -URR 112,921 0.02 855,101 0.18 - - 112,921 - - -WC 6,244,681 0.88 4,379,218 0.92 4,908,700 5,071 1,321,566 9,344 1,066 0WE 646,288 0.09 810,333 0.17 461,960 - 184,328 - - -XXXX 23,448,571 3.30 23,689,988 4.99 13,237,439 3,341,415 6,724,715 145,002 21,547,841 667Total 711,549,906 100.0 475,119,692 100.0 537,801,654 87,755,236 85,747,217 245,799 517,248,662 15,657

TABLE 2-10 OPERATIONAL DATA, BY MONTH, 2001
Months Total Train Miles %
EmployeeHours
Worked %Freight
Train Miles PassengerTrain Miles
YardSwitching
Miles
OtherTrainMiles
Psgrs Carried
Psgr Miles
MillionsJanuary 59,646,136 8.38 41,694,456 8.78 44,849,434 7,312,532 7,465,938 18,232 42,262,493 1,191February 55,200,153 7.76 36,873,928 7.76 41,664,002 6,688,418 6,830,213 17,520 38,944,645 1,103March 62,482,254 8.78 41,501,612 8.73 47,558,347 7,335,350 7,567,009 21,548 44,179,981 1,279April 59,182,985 8.32 39,295,635 8.27 44,857,881 7,137,371 7,164,556 23,177 42,929,827 1,261May 60,577,545 8.51 41,525,020 8.74 45,617,176 7,523,460 7,411,792 25,117 45,124,983 1,321June 58,927,213 8.28 39,746,988 8.37 44,376,335 7,331,621 7,184,879 34,378 44,584,739 1,396July 58,213,331 8.18 39,056,126 8.22 43,654,818 7,512,075 7,022,081 24,357 44,890,302 1,487August 61,358,431 8.62 41,164,726 8.66 46,251,309 7,664,616 7,417,594 24,912 46,739,161 1,504September 59,108,348 8.31 37,688,782 7.93 44,974,576 7,123,697 6,993,354 16,721 40,360,697 1,240October 62,383,120 8.77 42,663,919 8.98 47,297,467 7,652,835 7,416,935 15,883 45,196,412 1,339November 58,025,106 8.15 38,464,227 8.10 44,039,749 7,185,119 6,786,704 13,534 41,476,490 1,254December 56,445,284 7.93 35,444,273 7.46 42,660,560 7,288,142 6,486,162 10,420 40,558,932 1,282Total 711,549,906 100.0 475,119,692 100.0 537,801,654 87,755,236 85,747,217 245,799 517,248,662 15,657

TABLE 2-11 SUMMARY OF ACCIDENTS/INCIDENTS BY STATE, 2001
Total Train Accidents HRC Incidents Other Incidents States
Cnt Deaths Nonfatal Cnt Deaths Nonfatal Cnt Deaths Nonfatal Cnt Deaths NonfatalAlabama 303 22 142 76 - - 103 9 28 124 13 114Alaska 104 - 102 1 - - 4 - 1 99 0 101Arizona 214 15 173 43 - 1 29 6 10 142 9 162Arkansas 336 16 231 62 - 1 87 9 39 187 7 191California 1,078 132 718 182 - 11 180 54 49 716 78 658Colorado 255 9 167 59 - - 34 3 10 162 6 157Connecticut 201 3 169 36 - 7 3 - 2 162 3 160Delaware 68 3 48 12 - 1 7 1 - 49 2 47Dist Of Columbia 108 1 87 21 - 1 - - - 87 1 86Florida 439 43 299 43 - - 114 15 36 282 28 263Georgia 358 27 231 58 - 7 122 19 50 178 8 174Hawaii 2 - 1 0 - - 1 - - 1 0 1Idaho 90 3 60 18 - 2 20 1 7 52 2 51Illinois 1,455 73 1,103 229 - 8 212 31 89 1,014 42 1,006Indiana 439 28 240 90 - 2 165 19 62 184 9 176Iowa 336 20 220 91 1 52 110 16 35 135 3 133Kansas 338 11 198 100 - - 63 5 20 175 6 178Kentucky 220 15 136 32 - 1 79 10 31 109 5 104Louisiana 435 35 252 113 - 4 161 22 93 161 13 155Maine 45 - 33 7 - - 9 - 4 29 0 29Maryland 153 7 113 29 - 1 17 1 9 107 6 103Massachusetts 249 14 205 24 - 1 17 - 4 208 14 200Michigan 348 22 246 35 2 2 96 11 36 217 9 208Minnesota 390 15 261 70 - 2 82 9 25 238 6 234Mississippi 226 33 115 49 - 4 102 22 47 75 11 64Missouri 351 16 233 90 - 21 64 4 22 197 12 190Montana 152 3 109 29 - - 16 1 4 107 2 105Nebraska 375 7 241 99 - 1 50 3 17 226 4 223Nevada 50 3 32 14 - 1 2 - - 34 3 31New Hampshire 9 - 6 1 - - 2 - - 6 0 6New Jersey 517 38 438 52 - 20 36 8 11 429 30 407New Mexico 121 17 76 32 - 1 24 8 8 65 9 67New York 1,220 28 1,132 132 - 80 32 8 5 1,056 20 1,047North Carolina 219 26 113 29 - - 79 6 21 111 20 92North Dakota 113 4 76 26 - - 17 2 8 70 2 68Ohio 449 34 247 97 1 4 140 22 40 212 11 203Oklahoma 231 17 109 68 - 3 69 9 19 94 8 87Oregon 231 14 140 53 - - 43 6 13 135 8 127Pennsylvania 698 35 540 92 - - 68 8 15 538 27 525Rhode Island 23 1 20 2 - - - - - 21 1 20South Carolina 153 12 83 24 - 2 65 4 23 64 8 58South Dakota 61 1 31 14 - - 20 1 4 27 0 27Tennessee 306 24 173 64 - 2 97 10 39 145 14 132Texas 1,336 88 750 363 1 35 362 39 132 611 48 583Utah 126 4 102 36 - 25 20 2 8 70 2 69Vermont 27 1 19 7 - - - - - 20 1 19Virginia 215 6 154 35 - - 44 1 18 136 5 136Washington 321 23 229 53 - 5 38 5 7 230 18 217West Virginia 125 5 88 23 - - 20 1 9 82 4 79Wisconsin 321 15 202 56 - 1 104 10 43 161 5 158Wyoming 147 2 92 52 1 1 8 - 4 87 1 87Total 16,087 971 10,985 3,023 6 310 3,237 421 1,157 9,827 544 9,518
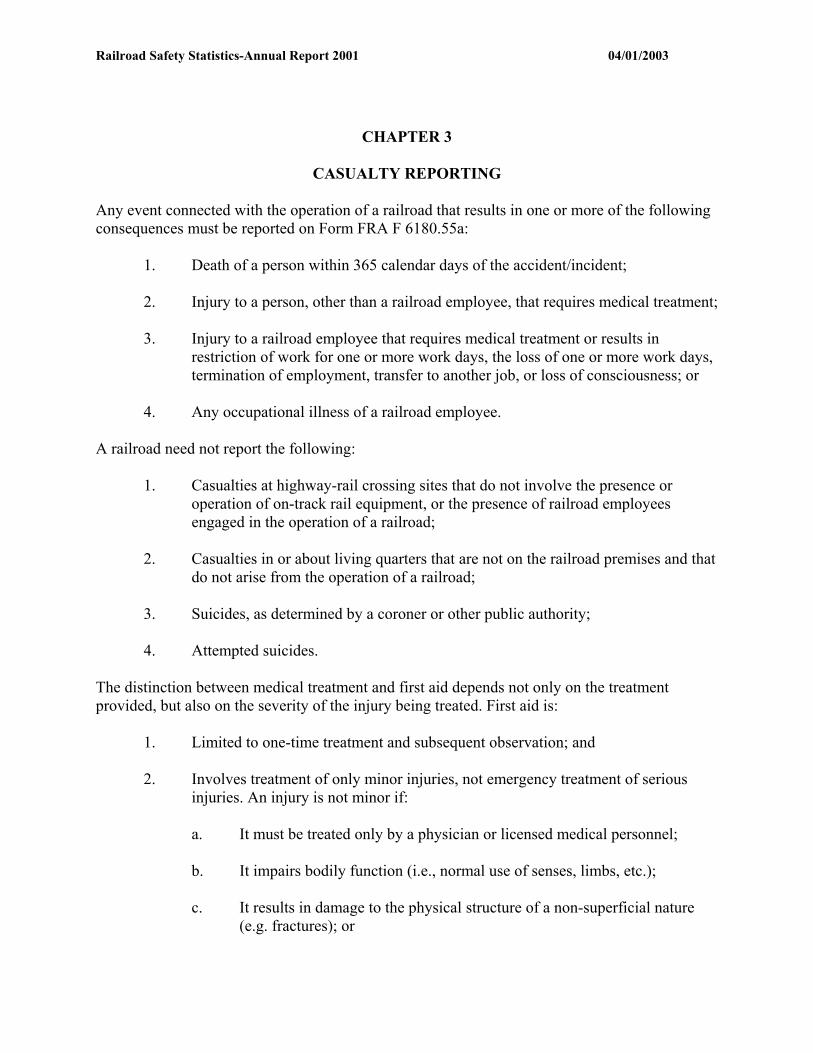
Railroad Safety Statistics-Annual Report 2001 04/01/2003
CHAPTER 3
CASUALTY REPORTING
Any event connected with the operation of a railroad that results in one or more of the following consequences must be reported on Form FRA F 6180.55a:
1. Death of a person within 365 calendar days of the accident/incident;
2. Injury to a person, other than a railroad employee, that requires medical treatment;
3. Injury to a railroad employee that requires medical treatment or results in restriction of work for one or more work days, the loss of one or more work days, termination of employment, transfer to another job, or loss of consciousness; or
4. Any occupational illness of a railroad employee.
A railroad need not report the following:
1. Casualties at highway-rail crossing sites that do not involve the presence or operation of on-track rail equipment, or the presence of railroad employees engaged in the operation of a railroad;
2. Casualties in or about living quarters that are not on the railroad premises and that do not arise from the operation of a railroad;
3. Suicides, as determined by a coroner or other public authority;
4. Attempted suicides.
The distinction between medical treatment and first aid depends not only on the treatment provided, but also on the severity of the injury being treated. First aid is:
1. Limited to one-time treatment and subsequent observation; and
2. Involves treatment of only minor injuries, not emergency treatment of serious injuries. An injury is not minor if:
a. It must be treated only by a physician or licensed medical personnel;
b. It impairs bodily function (i.e., normal use of senses, limbs, etc.);
c. It results in damage to the physical structure of a non-superficial nature (e.g. fractures); or

Railroad Safety Statistics-Annual Report 2001 04/01/2003
d. It involves complications requiring follow-up medical treatment.
One-time treatment of an injury should not be used as the sole basis for classifying a treatment or procedure as first aid. Medical treatment can, and often is, given on a one-time basis, e.g., the suturing of a wound. The procedures used and the skills required to treat an injury, as well as the seriousness of the injury, are all factors that must be considered when determining the type of treatment rendered.
Likewise, medical treatment cannot be determined solely on the basis of who treats a case. First aid treatment can be given by a physician, and medical treatment, by someone other than a physician.
The following are examples of typical medical treatment that are reportable:
Closure of a wound with suture (stitch), staple, Steri-strip, butterfly, or the like.
The application of a cast or other professional means of immobilizing an injured part of the body, regardless of how long the cast, sling, splint, or the like, is actually worn.
Injection. Any application of medication through the use of a syringe, except a tetanus shot.
Bruise. The treatment of a bruise by drainage of blood.
Debridement. Surgical debridement, that is, the removal of dead or damaged skin.
Treatment of a burn. The treatment of a second-or third-degree burn is almost always medical treatment if the size of the affected area cannot be covered with a quarter.
Prescription medication. Any prescription medication prescribed or provided for a condition that is intended for subsequent use. A single dose taken orally or applied externally on the initial visit is considered to be first aid and is not reportable. (See definition of prescription medication.)
Eye injury. Removal of any object embedded in the eye, or the application of a patch or a bandage.
X-Ray. An X-Ray that is positive.
Whirlpool treatment. Any injury that requires more than one whirlpool treatment.
Multiple treatments. Any injury that results in additional treatment by a physician or other medical professional on a second or subsequent visit. This does not include a routine examination of the progress of an injury or instances where bandages or other dressings are replaced.

Railroad Safety Statistics-Annual Report 2001 04/01/2003
CONTENTS
CHAPTER 3
CASUALTY REPORTING
Tables
3-1 Casualties by type person and primary event, 2001 ................................................…………... 3-2 Fatalities by type person killed and railroad, 2001...................................................…………...3-3 Fatalities by type person killed and state, 2001........................................................…………...3-4 Nonfatal conditions by type person and railroad, 2001............................................…………...3-5 Nonfatal conditions by type person and state, 2001................................................……………3-6 Reportable conditions, all type persons, 2001..........................................................…………...3-7 Total casualties by age of individual and type person, 2001....................................…………...3-8 Total casualties by month and type person, 2001.....................................................…………...3-9 Total casualties by time of day and type person, 2001.............................................…………...

TABLE 3-1 CASUALTIES BY TYPE PERSON AND PRIMARY EVENT, 2001
1/ The count of incidents that resulted in a death or nonfatal condition W/O = without, HRC = highway-rail crossing, Incs = incidents
TotalIncidents 1/
TotalCasualties
Train Accs w/o HRC HRC Incs
OtherEventsType Person
Fatal Nonfatal Kld Nonfatal Kld Nonfatal Kld Nonfatal Kld NonfatalA - Worker on duty(rr employee) 20 7,561 22 7,815 4 156 1 97 17 7,562B - Employee not on duty . 175 . 209 . 21 . 1 . 187C - Passenger on train 3 589 3 746 1 129 . 20 2 597D - Nontrespasser 214 919 269 1,152 . 1 258 803 11 348E - Trespasser 652 540 673 627 1 . 162 223 510 404F - Worker on duty(contractor) 2 164 2 168 . . . 1 2 167G - Contractor(other) 2 206 2 215 . 1 . 2 2 212H - Worker on duty(volunteer) . 4 . 4 . . . . . 4J - Nontrespasser, off rr property . 20 . 49 . 2 . 10 . 37Total.. 893 10,178 971 10,985 6 310 421 1,157 544 9,518

TABLE 3-2 FATALITIES BY TYPE PERSON AND RAILROAD, 2001
A - Worker on duty(rr employee), B - Employee not on duty, C - Passenger on train, D - Nontrespasser E - Trespasser, F - Worker on duty(contractor), G - Contractor(other), H - Worker on duty(volunteer), I - Volunteer
J - Nontrespasser, off rr property
Type Person Codes Total % __A__ __C__ __D__ __E__ __F__ __G__
Amtrak 139 14.3 1 2 24 112 - -Burlington Northern Santa Fe 126 13.0 5 - 45 75 - 1Conrail Shared Assets 7 0.7 - - 1 6 - -CSX Transportation 143 14.7 2 - 47 94 - -Delaware & Hudson 5 0.5 - - 2 3 - -Florida East Coast 13 1.3 - - - 13 - -Guilford Rail System 1 0.1 - - - 1 - -Grand Trunk Western RR 7 0.7 2 - 2 3 - -Gateway Western 1 0.1 - - - 1 - -Illinois Central 26 2.7 1 - 20 5 - -I & M Rail Link, LLC 5 0.5 - - 4 1 - -Kansas City Southern 21 2.2 - - 15 6 - -Long Island Rail Road 10 1.0 - - - 10 - -Mass Bay Transit Auth. 11 1.1 - 1 - 10 - -Metro North Commuter 3 0.3 - - 1 2 - -Montana Rail Link 2 0.2 - - 1 1 - -Northeast IL Reg Comm 17 1.8 - - 1 16 - -New Jersey Transit Rail 32 3.3 1 - - 31 - -Norfolk Southern Corp. 126 13.0 4 - 39 82 1 -Paducah & Louisville 1 0.1 1 - - - - -Port Auth Trans Hudson 2 0.2 - - 1 1 - -Peninsula Comm San Mateo Cnty 12 1.2 - - - 12 - -Southern CA Reg Rail Auth. 1 0.1 - - - 1 - -Southeastern PA Trans. 3 0.3 1 - 1 1 - -Soo Line 6 0.6 1 - 1 4 - -Union Pacific 211 21.7 2 - 47 160 1 1Wisconsin Central Ltd. 11 1.1 - - 10 1 - -Other Railroads 29 3.0 1 - 7 21 - -Total 971 100 22 3 269 673 2 2

TABLE 3-3 FATALITIES BY TYPE PERSON KILLED AND STATE, 2001
A - Worker on duty(rr employee), B - Employee not on duty, C - Passenger on train, D - Nontrespasser E - Trespasser, F - Worker on duty(contractor), G - Contractor(other), H - Worker on duty(volunteer), I - Volunteer
J - Nontrespasser, off rr property
Type Person Codes States
Total % __A__ __C__ __D__ __E__ __F__ __G__Alabama 22 2.3 1 - 7 14 - -Arizona 15 1.5 - - 4 11 - -Arkansas 16 1.6 - - 7 9 - -California 132 13.6 - - 20 111 - 1Colorado 9 0.9 - - 2 7 - -Connecticut 3 0.3 - - - 3 - -Delaware 3 0.3 1 - 1 1 - -Dist Of Columbia 1 0.1 - - - 1 - -Florida 43 4.4 - - 4 39 - -Georgia 27 2.8 - - 12 15 - -Idaho 3 0.3 - - 1 2 - -Illinois 73 7.5 3 - 15 55 - -Indiana 28 2.9 - - 8 20 - -Iowa 20 2.1 - 1 15 4 - -Kansas 11 1.1 1 - 4 6 - -Kentucky 15 1.5 1 - 7 7 - -Louisiana 35 3.6 2 - 21 11 - 1Maryland 7 0.7 - - - 7 - -Massachusetts 14 1.4 - 1 - 13 - -Michigan 22 2.3 2 - 5 15 - -Minnesota 15 1.5 1 - 4 10 - -Mississippi 33 3.4 - - 22 11 - -Missouri 16 1.6 - - 4 12 - -Montana 3 0.3 - - 1 2 - -Nebraska 7 0.7 - - 2 5 - -Nevada 3 0.3 - - - 3 - -New Jersey 38 3.9 1 - 1 36 - -New Mexico 17 1.8 1 - 4 12 - -New York 28 2.9 - - 3 25 - -North Carolina 26 2.7 1 - 2 23 - -North Dakota 4 0.4 - - 1 3 - -Ohio 34 3.5 1 - 17 16 - -Oklahoma 17 1.8 1 - 10 6 - -Oregon 14 1.4 1 - 5 8 - -Pennsylvania 35 3.6 2 1 7 25 - -Rhode Island 1 0.1 - - - 1 - -South Carolina 12 1.2 - - 3 9 - -South Dakota 1 0.1 - - 1 - - -Tennessee 24 2.5 - - 6 17 1 -Texas 88 9.1 - - 30 57 1 -Utah 4 0.4 - - 2 2 - -Vermont 1 0.1 - - - 1 - -Virginia 6 0.6 1 - 1 4 - -Washington 23 2.4 - - - 23 - -West Virginia 5 0.5 - - 1 4 - -Wisconsin 15 1.5 - - 9 6 - -Wyoming 2 0.2 1 - - 1 - -Total 971 100.0 22 3 269 673 2 2

TABLE 3-4 NONFATAL CONDITIONS BY TYPE PERSON AND RAILROAD, 2001
A - Worker on duty(rr employee), B - Employee not on duty, C - Passenger on train, D - Nontrespasser E - Trespasser, F - Worker on duty(contractor), G - Contractor(other), H - Worker on duty(volunteer), I - Volunteer
J - Nontrespasser, off rr property
Type Person Codes Total % __A__ __B__ __C__ __D__ __E__ __F__ __G__ __H__ __J__
Alton & Southern 8 0.1 8 - - - - - - - -Alaska RR Corp. 57 0.5 50 2 - - 2 2 1 - -Amtrak 1,527 13.9 880 61 416 85 66 4 14 - 1Bangor & Aroostook 15 0.1 15 - - - - - - - -Bessemer & Lake Erie RR 8 0.1 7 - - - - 1 - - -Burlington Northern Santa Fe 1,485 13.5 1,062 56 - 155 69 23 120 - -Belt Rwy Of Chicago 10 0.1 10 - - - - - - - -Conrail Shared Assets 53 0.5 28 1 - 7 5 10 2 - -CSX Transportation 1,119 10.2 804 26 - 142 139 1 7 - -Delaware & Hudson 52 0.5 49 - - 1 2 - - - -Dakota,Minnesota & Eastern 17 0.2 16 - - 1 - - - - -Duluth,Missabe & Iron Range 32 0.3 32 - - - - - - - -Duluth,Winnipeg & Pacific 1 0.0 1 - - - - - - - -Elgin, Joliet & Eastern 39 0.4 36 - - - 3 - - - -Florida East Coast 27 0.2 15 - - 1 10 - 1 - -Guilford Rail System 16 0.1 11 - - - 5 - - - -Grand Trunk Western RR 96 0.9 82 2 - 4 5 - 3 - -Gateway Western 10 0.1 8 - - 1 - 1 - - -Illinois Central 183 1.7 131 3 - 45 3 - 1 - -Indiana Harbor Belt 42 0.4 39 - - - 3 - - - -I & M Rail Link, LLC 43 0.4 27 - - 16 - - - - -Kansas City Southern 126 1.1 64 - - 54 5 2 1 - -Long Island Rail Road 382 3.5 303 5 30 35 6 3 - - -MD Assn. of Rail Comm 7 0.1 3 - 3 1 - - - - -Mass Bay Transit Auth. 113 1.0 91 6 8 7 1 - - - -Metro North Commuter 466 4.2 347 3 34 69 2 - 9 - 2Montana Rail Link 38 0.3 37 - - 1 - - - - -Northern IN Comm Trans 16 0.1 13 - 1 - - - - - 2Northeast IL Reg Comm 388 3.5 180 6 118 61 17 1 - - 5New Jersey Transit Rail 219 2.0 162 3 32 16 5 1 - - -Norfolk Southern Corp. 653 5.9 395 19 - 88 83 51 16 - 1Paducah & Louisville 9 0.1 3 - - - 6 - - - -Port Auth Trans Hudson 158 1.4 108 - 9 27 1 3 10 - -Peninsula Comm San Mateo Cnty 23 0.2 18 - - 4 1 - - - -Port Terminal RR Assn 11 0.1 9 - - 2 - - - - -Southern CA Reg Rail Auth. 24 0.2 8 - 1 - 5 10 - - -Southeastern PA Trans. 262 2.4 177 1 57 23 2 - - - 2Soo Line 166 1.5 149 2 - 10 5 - - - -Texas Mexican 16 0.1 15 - - - - 1 - - -Term RR Assn Of St. Louis 13 0.1 13 - - - - - - - -Econo Rail Corporation 5 0.0 5 - - - - - - - -Union Pacific 1,877 17.1 1,462 9 - 196 151 14 16 - 29Union RR (Pittsburgh) 25 0.2 25 - - - - - - - -Wisconsin Central Ltd. 121 1.1 84 - - 34 2 - 1 - -Wheeling & Lake Erie 15 0.1 9 - - - 5 1 - - -Other Railroads 1,012 9.2 824 4 37 66 18 39 13 4 7Total 10,985 100 7,815 209 746 1,152 627 168 215 4 49

TABLE 3-5 NONFATAL CONDITIONS BY TYPE PERSON AND STATE, 2001
A - Worker on duty(rr employee), B - Employee not on duty, C - Passenger on train, D - Nontrespasser E - Trespasser, F - Worker on duty(contractor), G - Contractor(other), H - Worker on duty(volunteer), I - Volunteer
J - Nontrespasser, off rr property
Type Person codes Total % __A__ __B__ __C__ __D__ __E__ __F__ __G__ __H__ __J__
Alabama 142 1.3 107 2 - 22 7 - 3 - 1Alaska 102 0.9 85 2 10 - 2 2 1 - -Arizona 173 1.6 111 2 5 15 10 1 3 - 26Arkansas 231 2.1 183 - - 35 7 5 1 - -California 718 6.5 494 17 63 26 61 18 38 - 1Colorado 167 1.5 135 2 16 7 4 2 1 - -Connecticut 169 1.5 141 2 9 10 4 2 1 - -Delaware 48 0.4 38 2 2 2 4 - - - -Dist Of Columbia 87 0.8 67 4 8 3 2 - 3 - -Florida 299 2.7 182 7 44 14 45 3 4 - -Georgia 231 2.1 148 6 5 25 29 11 6 1 -Hawaii 1 0.0 1 - - - - - - - -Idaho 60 0.5 50 - 1 6 2 - 1 - -Illinois 1,103 10.0 669 25 149 135 49 19 52 - 5Indiana 240 2.2 172 3 5 32 26 - - - 2Iowa 220 2.0 133 12 37 33 5 - - - -Kansas 198 1.8 145 5 3 17 15 7 5 1 -Kentucky 136 1.2 94 - - 26 12 3 - 1 -Louisiana 252 2.3 151 - 2 84 9 2 3 - 1Maine 33 0.3 27 - - 2 3 1 - - -Maryland 113 1.0 97 - 4 8 3 - 1 - -Massachusetts 205 1.9 166 9 8 10 11 1 - - -Michigan 246 2.2 185 7 3 28 9 11 3 - -Minnesota 261 2.4 221 6 3 24 7 - - - -Mississippi 115 1.0 56 - 4 43 10 2 - - -Missouri 233 2.1 180 5 12 22 9 2 2 - 1Montana 109 1.0 100 2 2 2 2 - 1 - -Nebraska 241 2.2 211 9 2 14 3 1 1 - -Nevada 32 0.3 26 - 3 - 2 1 - - -New Hampshire 6 0.1 6 - - - - - - - -New Jersey 438 4.0 305 5 41 37 12 23 15 - -New Mexico 76 0.7 48 - 12 6 4 2 4 - -New York 1,132 10.3 831 17 117 116 27 5 17 - 2North Carolina 113 1.0 63 1 13 16 17 1 2 - -North Dakota 76 0.7 65 - 3 4 4 - - - -Ohio 247 2.2 185 6 2 21 28 1 4 - -Oklahoma 109 1.0 77 1 - 20 9 1 1 - -Oregon 140 1.3 100 2 10 15 6 2 5 - -Pennsylvania 540 4.9 395 4 65 35 25 10 4 - 2Rhode Island 20 0.2 18 1 - - 1 - - - -South Carolina 83 0.8 49 - 5 15 13 1 - - -South Dakota 31 0.3 23 3 - 4 - - 1 - -Tennessee 173 1.6 114 1 1 27 19 7 4 - -Texas 750 6.8 505 10 27 99 80 8 17 1 3Utah 102 0.9 70 8 15 7 2 - - - -Vermont 19 0.2 18 - 1 - - - - - -Virginia 154 1.4 84 8 19 19 15 7 1 - 1Washington 229 2.1 183 9 11 13 4 - 9 - -West Virginia 88 0.8 69 1 - 10 5 3 - - -Wisconsin 202 1.8 151 2 4 39 1 - 1 - 4Wyoming 92 0.8 81 1 - 4 3 3 - - -Total 10,985 100.0 7,815 209 746 1,152 627 168 215 4 49

TABLE 3-6 REPORTABLE CONDITIONS, ALL TYPE PERSONS, 2001
A - Worker on duty(rr employee), B - Employee not on duty, C - Passenger on train, D - Nontrespasser E - Trespasser, F - Worker on duty(contractor), G - Contractor(other), H - Worker on duty(volunteer), I - Volunteer
J - Nontrespasser, off rr property
Type of Person * Condition
Cnt % __A__ __B__ __C__ __D__ __E__ __F__ __G__ __H__ __J__Bruise/contusion 1,924 16.1 1,145 44 233 292 131 30 42 - 7Occ. Illness 176 1.5 167 5 - - - 3 - 1 -Sprain/Str.,arm/hand 450 3.8 404 10 16 6 2 4 8 - -Sprain/Str.,leg/foot 1,309 10.9 1,145 35 61 39 - 13 16 - -Sprain/Str.,head/face 374 3.1 279 15 41 26 5 1 6 - 1Sprain/Str.,torso 2,383 19.9 2,154 35 84 52 6 22 29 - 1Sprain/Str., other 76 0.6 43 5 3 17 3 2 2 - 1Cut/abrasion 1,348 11.3 846 17 117 179 92 49 43 1 4Puncture wound 170 1.4 146 5 3 7 5 4 - - -Electric shock/burn 50 0.4 40 - - 1 6 3 - - -Other burn 93 0.8 81 - 3 1 2 3 3 - -Dislocation 95 0.8 71 3 3 7 6 1 4 - -Fracture,arm/hand 403 3.4 286 6 33 27 27 10 14 - -Fracture,leg/foot 390 3.3 194 13 35 68 49 12 18 1 -Fracture,head/face 63 0.5 23 - 5 22 11 1 - - 1Fracture,torso 199 1.7 97 6 19 47 25 - 5 - -Fracture,multiple 39 0.3 4 - - 27 8 - - - -Fracture,other 6 0.1 1 - 3 1 1 - - - -Dental related 44 0.4 32 1 7 4 - - - - -Amputation,arm/hand 56 0.5 35 - - - 18 1 2 - -Amputation,leg/foot 66 0.6 8 - 2 1 55 - - - -Amputation,head/face 1 0.0 - - - 1 - - - - -Amputation,other 2 0.0 - - - - 2 - - - -Fatality 971 8.1 22 - 3 269 673 2 2 - -Object in eye 176 1.5 165 3 4 - - - 4 - -Hernia 67 0.6 66 - - - - - 1 - -Concussion 72 0.6 35 4 1 18 9 1 4 - -Nervous shock 1 0.0 - - 1 - - - - - -Internal injury 60 0.5 14 - 2 30 12 - 2 - -Loss of eye 1 0.0 - - 1 - - - - - -Skin reaction 71 0.6 43 1 1 - - - - - 26One-time exp. to noise 13 0.1 12 - - - - 1 - - -Unspecified injury 696 5.8 173 1 68 277 152 4 12 1 8One-time exp.-fumes 111 0.9 106 - - 2 - 3 - - -Total 11,956 100.0 7,837 209 749 1,421 1,300 170 217 4 49

TABLE 3-7 TOTAL CASUALTIES BY AGE OF INDIVIDUAL, 2001 AND TYPE OF PERSON
A - Worker on duty(rr employee), B - Employee not on duty, C - Passenger on train, D - Nontrespasser E - Trespasser, F - Worker on duty(contractor), G - Contractor(other), H - Worker on duty(volunteer), I - Volunteer
J - Nontrespasser, off rr property
Total Type of Person * Age
Cnt % __A__ __B__ __C__ __D__ __E__ __F__ __G__ __H__ __J__Unk 102 0.9 - - 1 12 89 - - - -> 60 113 0.9 1 - 1 50 61 - - - -1-5 9 0.1 - - - 6 3 - - - -6-10 9 0.1 - - - 9 - - - - -11-15 35 0.3 - - - 10 25 - - - -16-20 74 0.6 - - - 23 51 - - - -21-25 122 1.0 - - - 30 90 - 2 - -26-30 86 0.7 1 - 1 23 61 - - - -31-35 78 0.7 2 - - 19 56 1 - - -36-40 93 0.8 2 - - 20 71 - - - -41-45 92 0.8 2 - - 24 65 1 - - -46-50 75 0.6 6 - - 17 52 - - - -51-55 55 0.5 6 - - 16 33 - - - -56-60 28 0.2 2 - - 10 16 - - - -
Kld
Total 971 8.1 22 - 3 269 673 2 2 - -Unk 392 3.3 3 - 157 146 59 2 23 - 2> 60 586 4.9 215 4 181 138 32 5 6 1 41-5 48 0.4 - - 10 25 10 - - - 36-10 39 0.3 - - 2 20 10 - - - 711-15 81 0.7 - - 11 31 37 - - - 216-20 283 2.4 50 - 17 131 66 8 9 - 221-25 707 5.9 401 5 15 114 107 33 24 1 726-30 1,070 8.9 824 15 25 83 60 28 30 - 531-35 1,210 10.1 922 17 40 104 62 28 32 - 536-40 1,204 10.1 918 32 42 93 68 21 27 - 341-45 1,493 12.5 1,241 29 56 77 45 19 23 - 346-50 1,661 13.9 1,390 45 70 76 42 15 22 - 151-55 1,377 11.5 1,178 34 67 61 20 4 10 2 156-60 834 7.0 673 28 53 53 9 5 9 - 4
Nonfatal
Total 10,985 91.9 7,815 209 746 1,152 627 168 215 4 49Total 11,956 100.0 7,837 209 749 1,421 1,300 170 217 4 49

TABLE 3-8 TOTAL CASUALTIES BY MONTH AND TYPE PERSON, 2001
A - Worker on duty(rr employee), B - Employee not on duty, C - Passenger on train, D - Nontrespasser E - Trespasser, F - Worker on duty(contractor), G - Contractor(other), H - Worker on duty(volunteer), I - Volunteer
J - Nontrespasser, off rr property
Total Type of Person * Month
Cnt __A__ __B__ __C__ __D__ __E__ __F__ __G__ __H__ __J__January 71 2 - - 25 44 - - - -February 77 1 - - 27 49 - - - -March 73 3 - 1 28 41 - - - -April 73 1 - - 14 58 - - - -May 90 - - - 28 62 - - - -June 83 1 - - 24 58 - - - -July 91 2 - - 23 66 - - - -August 97 2 - - 15 80 - - - -September 77 - - 1 17 58 - 1 - -October 74 3 - - 18 52 1 - - -November 74 4 - 1 17 51 1 - - -December 91 3 - - 33 54 - 1 - -
Kld
Total 971 22 - 3 269 673 2 2 - -January 1,024 699 30 67 128 40 17 15 - 28February 926 657 25 75 89 39 22 18 - 1March 997 670 20 84 122 66 14 19 - 2April 839 601 16 35 95 57 11 20 - 4May 943 679 12 66 104 43 17 21 - 1June 948 666 20 72 84 60 25 20 1 -July 990 720 9 89 81 64 7 19 - 1August 1,027 717 20 74 114 59 11 26 1 5September 894 649 20 53 91 50 14 13 1 3October 924 677 18 59 88 46 13 20 1 2November 769 571 6 33 80 57 12 10 - -December 704 509 13 39 76 46 5 14 - 2
Nonfatal
Total 10,985 7,815 209 746 1,152 627 168 215 4 49Total 11,956 7,837 209 749 1,421 1,300 170 217 4 49

TABLE 3-9 TOTAL CASUALTIES BY TIME OF DAY AND TYPE OF PERSON, 2001
A - Worker on duty(rr employee), B - Employee not on duty, C - Passenger on train, D - Nontrespasser E - Trespasser, F - Worker on duty(contractor), G - Contractor(other), H - Worker on duty(volunteer), I - Volunteer
J - Nontrespasser, off rr property
Total Type of Person * Time
Cnt % __A__ __B__ __C__ __D__ __E__ __F__ __G__ __H__ __J__1 387 3.2 248 8 14 29 81 2 5 - -2 306 2.6 210 2 4 25 55 2 8 - -3 286 2.4 227 - 4 10 40 1 4 - -4 255 2.1 173 7 11 11 51 1 1 - -5 266 2.2 171 15 23 15 31 3 8 - -6 304 2.5 174 23 19 45 36 2 5 - -7 522 4.4 315 13 55 81 45 7 6 - -8 781 6.5 547 5 48 90 33 14 15 - 299 843 7.1 626 11 35 83 54 16 18 - -10 919 7.7 712 3 35 75 49 22 21 1 111 838 7.0 580 12 60 96 45 21 19 - 512 290 2.4 179 1 11 18 70 1 8 - 2
AM
Total 5,997 50.2 4,162 100 319 578 590 92 118 1 371 707 5.9 501 7 28 91 52 14 13 1 -2 658 5.5 473 4 26 86 47 9 13 - -3 595 5.0 345 17 43 105 61 9 13 1 14 552 4.6 319 11 55 84 61 12 8 - 25 487 4.1 270 10 34 96 65 3 7 - 26 452 3.8 259 7 31 74 69 4 6 - 27 445 3.7 229 3 40 72 88 6 7 - -8 361 3.0 233 5 19 53 45 2 4 - -9 358 3.0 226 6 14 40 64 3 5 - -10 304 2.5 204 8 7 27 50 5 3 - -11 364 3.0 207 20 41 31 57 2 4 - 212 676 5.7 409 11 92 84 51 9 16 1 3
PM
Total 5,959 49.8 3,675 109 430 843 710 78 99 3 12Total 11,956 100 7,837 209 749 1,421 1,300 170 217 4 49

Railroad Safety Statistics-Annual Report 2001 04/01/2003
CHAPTER 4
EMPLOYEE ON DUTY CASUALTIES
The work environment is the physical location, equipment, materials processed or used, and activities of a railroad employee associated with his or her work, whether on or off the railroad's property. There are no stated exclusions of place or circumstance. All activities of a Worker on Duty--Employee (Class A) while in the work environment are presumed to be work-related for accident/incident reporting purposes.
An employee is in the work environment:
1. While engaged in work activity or apprenticeship/vocational training required by the employer.
2. While on break, in the rest room, or in storage areas when located on the employer's premises.
3. While performing work for pay or compensation at home, pursuant to the employer's instructions, if the injury or illness is directly related to the performance of work rather than the general home environment or setting.
4. While traveling on business, including to and from customer contacts. Employees in travel status (i.e., traveling on company business) should be considered engaged in work-related activities during all of their time spent in the "interest of their company". This includes, but is not limited to, travel to and from customer contacts, conducting job tasks, and entertaining or being entertained for the purpose of transacting, discussing, or promoting business.
5. While employee is engaged in work activity where a vehicle is considered the work environment (e.g., truck, taxi).
6. While at conferences where attendance is expected or required by theemployer.
7. Some workplaces provide living quarters for employees on their premises. In these workplaces, injuries or illnesses are presumed to be work-related if the employee is on-duty or engaged in a work activity. The injury or illness is also considered work-related if the employee was harmed as a result of a serious workplace accident such as a chemical release, fire, explosion, derailment, collision, or building collapse. All other injuries and illnesses occurring during off-duty hours while in living quarters are considered non-work-related. The worker should be classified as an “employee not on duty” in these cases if a reportable condition occurs.

Railroad Safety Statistics-Annual Report 2001 04/01/2003
Employees present in the work environment, but for reasons unconnected with their employment, generally are not reportable as Worker on Duty--Employee (Class A) should they be injured. These individuals are more appropriately classified as employees not on duty, nontrespassers on railroad property, passengers on train, etc., and if hurt should be identified as such. The following are examples:
1. Injuries or illnesses that occur to employees present at their employer's establishment as a member of the general public rather than as a worker.
2. Injuries or illnesses that are solely the result of employees doing personal tasks (unrelated to their employment) at the establishment outside of normal working hours.
3. Injuries or illnesses occurring on company parking lots and access roads while employees are arriving at or leaving work.
4. An injury or illness solely associated with participation in voluntary community or civic projects, e.g., Operation Lifesaver presentations; unless the employee was under pay status.
Injury/Illness Distinction. The distinction between occupational illnesses and injuries is based primarily on the event or exposure that precipitated the employee's condition. Injuries are generally the result of instantaneous events; for example, an employee is struck by an object and sustains a cut or a bruise. Illnesses, on the other hand, are usually the result of an exposure that occurs over time; such as hearing impairment caused by working in a noisy environment. Exceptions to this general rule are muscular sprains, strains, or soreness, occurring after work activity for which no single movement or event can be isolated as the primary causal factor. Physical conditions of this type are to be recorded as injuries when the condition is attributable to activity of limited duration--typically no more than a single work shift.

Railroad Safety Statistics-Annual Report 2001 04/01/2003
CONTENTS
CHAPTER 4
EMPLOYEE ON DUTY CASUALTIES
Tables
4-1 Reportable conditions to employees on duty, 2001..................................................………. 4-2 Reportable conditions to employees on duty, by railroad, 2001 .............................………..4-3 Reportable conditions to employees on duty, by state, 2001.…….………………………...4-4 Reportable conditions to employees on duty, by activity, 2001...............................………. 4-5 Reportable conditions to employees on duty, by event, 2001..................................……….4-6 Reportable conditions to employees on duty, by location, 2001................................……...4-7 Reportable conditions to employees on duty, by job, 2001......................................………. 4-8 Occupational illnesses of employees on duty, 2001.................................................………. 4-9 Occupational illnesses of employees on duty, by railroad, 2001 ............................….…….
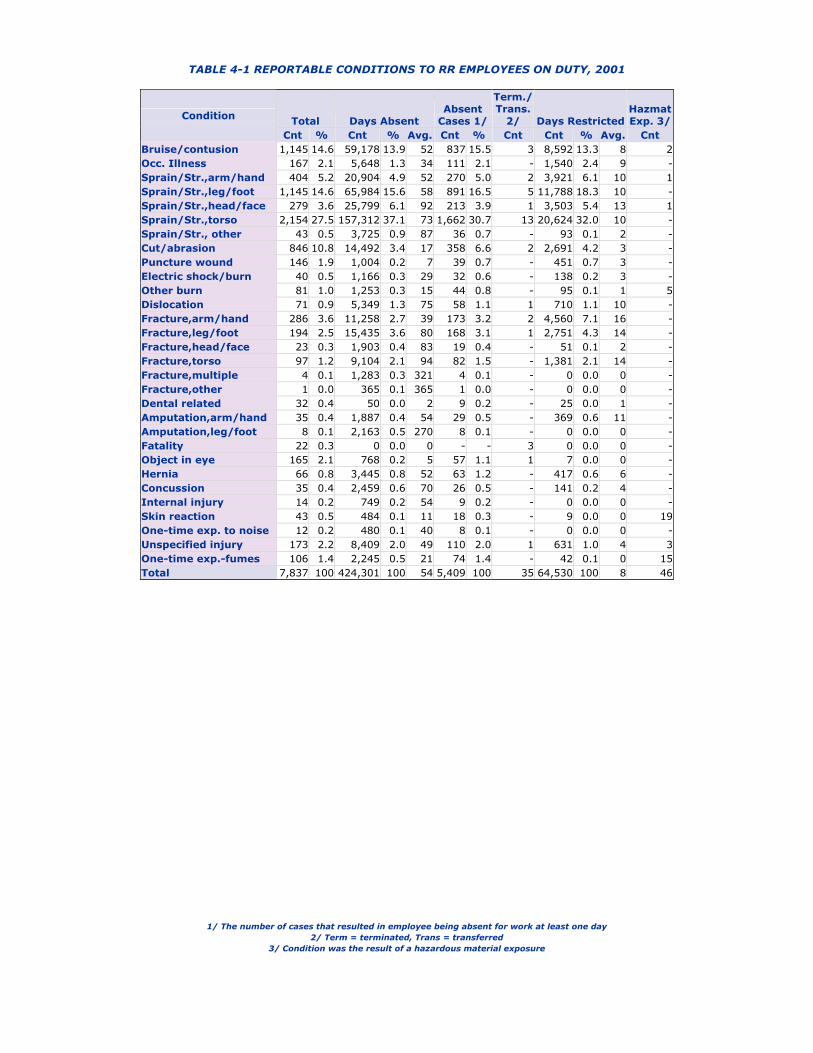
TABLE 4-1 REPORTABLE CONDITIONS TO RR EMPLOYEES ON DUTY, 2001
1/ The number of cases that resulted in employee being absent for work at least one day 2/ Term = terminated, Trans = transferred
3/ Condition was the result of a hazardous material exposure
Total Days Absent Absent
Cases 1/
Term./Trans.
2/ Days RestrictedHazmatExp. 3/Condition
Cnt % Cnt % Avg. Cnt % Cnt Cnt % Avg. CntBruise/contusion 1,145 14.6 59,178 13.9 52 837 15.5 3 8,592 13.3 8 2Occ. Illness 167 2.1 5,648 1.3 34 111 2.1 - 1,540 2.4 9 -Sprain/Str.,arm/hand 404 5.2 20,904 4.9 52 270 5.0 2 3,921 6.1 10 1Sprain/Str.,leg/foot 1,145 14.6 65,984 15.6 58 891 16.5 5 11,788 18.3 10 -Sprain/Str.,head/face 279 3.6 25,799 6.1 92 213 3.9 1 3,503 5.4 13 1Sprain/Str.,torso 2,154 27.5 157,312 37.1 73 1,662 30.7 13 20,624 32.0 10 -Sprain/Str., other 43 0.5 3,725 0.9 87 36 0.7 - 93 0.1 2 -Cut/abrasion 846 10.8 14,492 3.4 17 358 6.6 2 2,691 4.2 3 -Puncture wound 146 1.9 1,004 0.2 7 39 0.7 - 451 0.7 3 -Electric shock/burn 40 0.5 1,166 0.3 29 32 0.6 - 138 0.2 3 -Other burn 81 1.0 1,253 0.3 15 44 0.8 - 95 0.1 1 5Dislocation 71 0.9 5,349 1.3 75 58 1.1 1 710 1.1 10 -Fracture,arm/hand 286 3.6 11,258 2.7 39 173 3.2 2 4,560 7.1 16 -Fracture,leg/foot 194 2.5 15,435 3.6 80 168 3.1 1 2,751 4.3 14 -Fracture,head/face 23 0.3 1,903 0.4 83 19 0.4 - 51 0.1 2 -Fracture,torso 97 1.2 9,104 2.1 94 82 1.5 - 1,381 2.1 14 -Fracture,multiple 4 0.1 1,283 0.3 321 4 0.1 - 0 0.0 0 -Fracture,other 1 0.0 365 0.1 365 1 0.0 - 0 0.0 0 -Dental related 32 0.4 50 0.0 2 9 0.2 - 25 0.0 1 -Amputation,arm/hand 35 0.4 1,887 0.4 54 29 0.5 - 369 0.6 11 -Amputation,leg/foot 8 0.1 2,163 0.5 270 8 0.1 - 0 0.0 0 -Fatality 22 0.3 0 0.0 0 - - 3 0 0.0 0 -Object in eye 165 2.1 768 0.2 5 57 1.1 1 7 0.0 0 -Hernia 66 0.8 3,445 0.8 52 63 1.2 - 417 0.6 6 -Concussion 35 0.4 2,459 0.6 70 26 0.5 - 141 0.2 4 -Internal injury 14 0.2 749 0.2 54 9 0.2 - 0 0.0 0 -Skin reaction 43 0.5 484 0.1 11 18 0.3 - 9 0.0 0 19One-time exp. to noise 12 0.2 480 0.1 40 8 0.1 - 0 0.0 0 -Unspecified injury 173 2.2 8,409 2.0 49 110 2.0 1 631 1.0 4 3One-time exp.-fumes 106 1.4 2,245 0.5 21 74 1.4 - 42 0.1 0 15Total 7,837 100 424,301 100 54 5,409 100 35 64,530 100 8 46

TABLE 4-2 REPORTABLE CONDITIONS TO EMPLOYEE ON DUTY, BY RAILROAD, 2001
XXXX = All other railroads
Total Deaths Nonfatal Days Absent AbsentCases
Term./Trans. Days Restricted
HazmatExp. RR
Cnt % Cnt % Cnt % Cnt % Avg. Cnt % Cnt Cnt % Avg. CntALS 8 0.1 - 0.0 8 0.1 275 0.1 34 8 0.1 - 0 0.0 0 -ARR 50 0.6 - 0.0 50 0.6 487 0.1 10 28 0.5 - 248 0.4 5 1ATK 881 11.2 1 4.5 880 11.3 34,213 8.1 39 651 12.0 - 2,338 3.6 3 -BAR 15 0.2 - 0.0 15 0.2 302 0.1 20 13 0.2 - 47 0.1 3 -BLE 7 0.1 - 0.0 7 0.1 208 0.0 30 4 0.1 - 121 0.2 17 -BNSF 1,067 13.6 5 22.7 1,062 13.6 45,163 10.6 42 594 11.0 - 37,438 58.0 35 7BRC 10 0.1 - 0.0 10 0.1 167 0.0 17 5 0.1 - 22 0.0 2 -CRSH 28 0.4 - 0.0 28 0.4 2,068 0.5 74 20 0.4 - 0 0.0 0 -CSX 806 10.3 2 9.1 804 10.3 77,751 18.3 96 679 12.6 1 165 0.3 0 -DH 49 0.6 - 0.0 49 0.6 701 0.2 14 37 0.7 - 23 0.0 0 -DME 16 0.2 - 0.0 16 0.2 437 0.1 27 8 0.1 - 123 0.2 8 -DMIR 32 0.4 - 0.0 32 0.4 1,105 0.3 35 18 0.3 2 108 0.2 3 -DWP 1 0.0 - 0.0 1 0.0 49 0.0 49 1 0.0 - 0 0.0 0 -EJE 36 0.5 - 0.0 36 0.5 1,833 0.4 51 20 0.4 - 579 0.9 16 -FEC 15 0.2 - 0.0 15 0.2 353 0.1 24 9 0.2 - 13 0.0 1 -GRS 11 0.1 - 0.0 11 0.1 174 0.0 16 9 0.2 - 0 0.0 0 -GTW 84 1.1 2 9.1 82 1.0 5,346 1.3 64 71 1.3 6 97 0.2 1 -GWWR 8 0.1 - 0.0 8 0.1 321 0.1 40 5 0.1 - 119 0.2 15 -IC 132 1.7 1 4.5 131 1.7 6,193 1.5 47 87 1.6 8 111 0.2 1 -IHB 39 0.5 - 0.0 39 0.5 2,927 0.7 75 32 0.6 - 118 0.2 3 -IMRL 27 0.3 - 0.0 27 0.3 417 0.1 15 19 0.4 - 147 0.2 5 1KCS 64 0.8 - 0.0 64 0.8 3,398 0.8 53 39 0.7 - 986 1.5 15 6LI 303 3.9 - 0.0 303 3.9 4,841 1.1 16 299 5.5 - 3,235 5.0 11 -MACZ 3 0.0 - 0.0 3 0.0 6 0.0 2 1 0.0 - 9 0.0 3 -MBTA 91 1.2 - 0.0 91 1.2 2,837 0.7 31 68 1.3 - 35 0.1 0 -MNCW 347 4.4 - 0.0 347 4.4 11,268 2.7 32 195 3.6 - 3,439 5.3 10 -MRL 37 0.5 - 0.0 37 0.5 940 0.2 25 26 0.5 - 458 0.7 12 -NICD 13 0.2 - 0.0 13 0.2 296 0.1 23 10 0.2 - 60 0.1 5 -NIRC 180 2.3 - 0.0 180 2.3 5,708 1.3 32 130 2.4 - 582 0.9 3 -NJTR 163 2.1 1 4.5 162 2.1 4,248 1.0 26 129 2.4 1 49 0.1 0 5NS 399 5.1 4 18.2 395 5.1 49,124 11.6 123 298 5.5 - 326 0.5 1 5PAL 4 0.1 1 4.5 3 0.0 53 0.0 13 2 0.0 - 0 0.0 0 2PATH 108 1.4 - 0.0 108 1.4 2,018 0.5 19 103 1.9 - 317 0.5 3 -PCMZ 18 0.2 - 0.0 18 0.2 1,088 0.3 60 11 0.2 - 210 0.3 12 -PTRA 9 0.1 - 0.0 9 0.1 501 0.1 56 7 0.1 - 1 0.0 0 -SCAX 8 0.1 - 0.0 8 0.1 39 0.0 5 5 0.1 - 19 0.0 2 -SEPA 178 2.3 1 4.5 177 2.3 2,789 0.7 16 124 2.3 - 95 0.1 1 2SOO 150 1.9 1 4.5 149 1.9 6,439 1.5 43 109 2.0 - 382 0.6 3 -TM 15 0.2 - 0.0 15 0.2 619 0.1 41 14 0.3 - 65 0.1 4 -TRRA 13 0.2 - 0.0 13 0.2 591 0.1 45 8 0.1 - 151 0.2 12 -TXTX 5 0.1 - 0.0 5 0.1 41 0.0 8 3 0.1 - 13 0.0 3 -UP 1,464 18.7 2 9.1 1,462 18.7 136,006 32.1 93 1,025 18.9 1 7,415 11.5 5 8URR 25 0.3 - 0.0 25 0.3 496 0.1 20 13 0.2 - 210 0.3 8 1WC 84 1.1 - 0.0 84 1.1 2,312 0.5 28 47 0.9 1 939 1.5 11 -WE 9 0.1 - 0.0 9 0.1 136 0.0 15 6 0.1 1 335 0.5 37 -XXXX 825 10.5 1 4.5 824 10.5 8,017 1.9 10 419 7.7 14 3,382 5.2 4 8Tot. 7,837 100 22 100 7,815 100 424,301 100 54 5,409 100 35 64,530 100 8 46

TABLE 4-3 REPORTABLE CONDITIONS TO EMPLOYEE ON DUTY, BY STATE,2001
Total Deaths Nonfatal Days Absent AbsentCases
Term./Trans. Days Restricted
HazmatExp.
Cnt % Cnt % Cnt % Cnt % Avg. Cnt % Cnt Cnt % Avg. CntAL 108 1.4 1 4.5 107 1.4 8,624 2.0 80 79 1.5 - 389 0.6 4 -AK 85 1.1 - 0.0 85 1.1 791 0.2 9 50 0.9 - 290 0.4 3 1AZ 111 1.4 - 0.0 111 1.4 5,188 1.2 47 61 1.1 1 1,960 3.0 18 -AR 183 2.3 - 0.0 183 2.3 17,965 4.2 98 138 2.6 - 1,031 1.6 6 1CA 494 6.3 - 0.0 494 6.3 31,923 7.5 65 312 5.8 - 6,714 10.4 14 3CO 135 1.7 - 0.0 135 1.7 4,537 1.1 34 76 1.4 3 2,391 3.7 18 -CT 141 1.8 - 0.0 141 1.8 3,320 0.8 24 72 1.3 - 935 1.4 7 -DE 39 0.5 1 4.5 38 0.5 906 0.2 23 18 0.3 - 62 0.1 2 -DC 67 0.9 - 0.0 67 0.9 3,149 0.7 47 52 1.0 - 134 0.2 2 -FL 182 2.3 - 0.0 182 2.3 11,467 2.7 63 137 2.5 - 607 0.9 3 -GA 148 1.9 - 0.0 148 1.9 15,363 3.6 104 111 2.1 - 268 0.4 2 -HI 1 0.0 - 0.0 1 0.0 0 0.0 0 - - - 0 0.0 0 -ID 50 0.6 - 0.0 50 0.6 2,377 0.6 48 30 0.6 1 366 0.6 7 -IL 672 8.6 3 13.6 669 8.6 33,501 7.9 50 474 8.8 4 3,222 5.0 5 -IN 172 2.2 - 0.0 172 2.2 13,398 3.2 78 121 2.2 1 622 1.0 4 -IA 133 1.7 - 0.0 133 1.7 6,330 1.5 48 74 1.4 1 1,615 2.5 12 -KS 146 1.9 1 4.5 145 1.9 5,489 1.3 38 73 1.3 - 1,745 2.7 12 -KY 95 1.2 1 4.5 94 1.2 8,933 2.1 94 77 1.4 - 7 0.0 0 2LA 153 2.0 2 9.1 151 1.9 13,107 3.1 86 101 1.9 2 987 1.5 6 10ME 27 0.3 - 0.0 27 0.3 493 0.1 18 18 0.3 - 52 0.1 2 1MD 97 1.2 - 0.0 97 1.2 4,901 1.2 51 71 1.3 1 312 0.5 3 -MA 166 2.1 - 0.0 166 2.1 6,320 1.5 38 128 2.4 - 117 0.2 1 -MI 187 2.4 2 9.1 185 2.4 10,943 2.6 59 126 2.3 7 363 0.6 2 -MN 222 2.8 1 4.5 221 2.8 8,287 2.0 37 141 2.6 2 2,812 4.4 13 2MS 56 0.7 - 0.0 56 0.7 3,673 0.9 66 42 0.8 1 872 1.4 16 -MO 180 2.3 - 0.0 180 2.3 12,496 2.9 69 108 2.0 - 3,039 4.7 17 2MT 100 1.3 - 0.0 100 1.3 3,798 0.9 38 58 1.1 - 2,379 3.7 24 -NE 211 2.7 - 0.0 211 2.7 10,893 2.6 52 135 2.5 - 3,785 5.9 18 2NV 26 0.3 - 0.0 26 0.3 2,215 0.5 85 20 0.4 - 0 0.0 0 -NH 6 0.1 - 0.0 6 0.1 55 0.0 9 4 0.1 1 65 0.1 11 -NJ 306 3.9 1 4.5 305 3.9 8,568 2.0 28 254 4.7 1 376 0.6 1 5NM 49 0.6 1 4.5 48 0.6 1,759 0.4 36 27 0.5 - 1,151 1.8 23 -NY 831 10.6 - 0.0 831 10.6 24,936 5.9 30 684 12.6 - 5,919 9.2 7 -NC 64 0.8 1 4.5 63 0.8 6,698 1.6 105 52 1.0 1 55 0.1 1 -ND 65 0.8 - 0.0 65 0.8 757 0.2 12 34 0.6 - 879 1.4 14 -OH 186 2.4 1 4.5 185 2.4 17,262 4.1 93 141 2.6 2 581 0.9 3 -OK 78 1.0 1 4.5 77 1.0 3,490 0.8 45 51 0.9 - 1,406 2.2 18 2OR 101 1.3 1 4.5 100 1.3 5,016 1.2 50 60 1.1 - 689 1.1 7 -PA 397 5.1 2 9.1 395 5.1 14,989 3.5 38 263 4.9 - 1,294 2.0 3 7RI 18 0.2 - 0.0 18 0.2 589 0.1 33 17 0.3 - 0 0.0 0 -SC 49 0.6 - 0.0 49 0.6 4,400 1.0 90 42 0.8 - 1 0.0 0 -SD 23 0.3 - 0.0 23 0.3 253 0.1 11 13 0.2 - 563 0.9 24 -TN 114 1.5 - 0.0 114 1.5 8,282 2.0 73 82 1.5 3 716 1.1 6 -TX 505 6.4 - 0.0 505 6.5 44,204 10.4 88 370 6.8 1 5,710 8.8 11 3UT 70 0.9 - 0.0 70 0.9 4,845 1.1 69 43 0.8 - 200 0.3 3 1VT 18 0.2 - 0.0 18 0.2 131 0.0 7 9 0.2 - 52 0.1 3 -VA 85 1.1 1 4.5 84 1.1 7,169 1.7 84 65 1.2 - 82 0.1 1 -WA 183 2.3 - 0.0 183 2.3 5,268 1.2 29 105 1.9 - 4,964 7.7 27 2WV 69 0.9 - 0.0 69 0.9 5,852 1.4 85 54 1.0 - 139 0.2 2 -WI 151 1.9 - 0.0 151 1.9 3,364 0.8 22 80 1.5 2 1,312 2.0 9 -WY 82 1.0 1 4.5 81 1.0 6,027 1.4 74 56 1.0 - 1,300 2.0 16 2Tot. 7,837 100 22 100 7,815 100 424,301 100 54 5,409 100 35 64,530 100 8 46

TABLE 4-4 REPORTABLE CONDITIONS TO EMPLOYEE ON DUTY BY EVENT,2001
1/ The number of cases that resulted in employee being absent for work at least one day 2/ Term = terminated, Trans = transferred
3/ Condition was the result of a hazardous material exposure
Total Days AbsentAbsentCases
Term./Trans.
Days Restricted
HazmatExp. Event
Cnt % Cnt % Cnt % Cnt Cnt % CntAggravated pre-existing condition 121 1.5 6,603 1.6 90 1.7 3 1,974 3.1 -Apprehending/removing from property 11 0.1 695 0.2 8 0.1 - 302 0.5 -Assaulted by other 42 0.5 1,632 0.4 38 0.7 1 56 0.1 1Assaulted by coworker 13 0.2 1,176 0.3 11 0.2 1 19 0.0 -Bitten/stung by bee, spider, other insect 80 1.0 293 0.1 29 0.5 - 83 0.1 -Bitten by animal 7 0.1 325 0.1 2 0.0 - 0 0.0 -Bodily function/sudden movement, e.g.,sneez 169 2.2 7,950 1.9 108 2.0 1 2,860 4.4 -Caught in/compressed by hand tools 34 0.4 300 0.1 8 0.1 - 484 0.8 -Caught in/compressed by other machinery 63 0.8 2,378 0.6 32 0.6 - 452 0.7 -Caught in/crushed by materials 76 1.0 1,791 0.4 34 0.6 - 903 1.4 -Caught in/crushed in excavation, land slide 1 0.0 222 0.1 1 0.0 - 0 0.0 -Caught in/compressed by powered hand tools 12 0.2 277 0.1 3 0.1 - 216 0.3 -Cave in, slide, etc. 6 0.1 533 0.1 5 0.1 - 8 0.0 1Climatic conditions, other (e.g., high wind 35 0.4 353 0.1 14 0.3 - 5 0.0 -Climatic condition, exposure to environment 24 0.3 221 0.1 17 0.3 - 11 0.0 -Collision - between on track equipment 150 1.9 15,271 3.6 114 2.1 3 651 1.0 2Collision/impact - auto, truck, bus, van, e 198 2.5 11,207 2.6 145 2.7 - 1,450 2.2 -Defective/malfunctioning equipment 118 1.5 10,513 2.5 82 1.5 - 1,588 2.5 -Derailment 80 1.0 7,529 1.8 72 1.3 - 957 1.5 -Electrical shock while operating welding e 3 0.0 243 0.1 3 0.1 - 0 0.0 -Electrical shock due to contact with 3rd ra 14 0.2 365 0.1 13 0.2 - 121 0.2 -Electrical shock, other (explain in narrati 16 0.2 393 0.1 10 0.2 - 8 0.0 -Electrical shock from hand tool 7 0.1 20 0.0 3 0.1 - 0 0.0 -Exposure to fumes - inhalation 124 1.6 3,236 0.8 83 1.5 - 43 0.1 25Exposure to chemicals - external 43 0.5 503 0.1 26 0.5 - 34 0.1 15Exposure to poisonous plants 6 0.1 48 0.0 3 0.1 - 0 0.0 -Exposure to noise over time 2 0.0 0 0.0 - - - 0 0.0 -Exposure to noise - single incident 10 0.1 477 0.1 7 0.1 - 292 0.5 -Exposure to welding light 9 0.1 39 0.0 6 0.1 - 0 0.0 -Highway-rail collision/impact 98 1.3 10,108 2.4 76 1.4 - 602 0.9 -Horseplay, practical joke, etc. 4 0.1 10 0.0 2 0.0 1 0 0.0 -Lost balance 263 3.4 15,600 3.7 201 3.7 2 2,447 3.8 -Missed handhold, grabiron, step, etc. 65 0.8 4,635 1.1 52 1.0 - 562 0.9 -Needle puncture/prick/stick 16 0.2 55 0.0 2 0.0 - 17 0.0 -Other impacts - on track equipment 23 0.3 1,085 0.3 15 0.3 - 355 0.6 -Overexertion 1,312 16.7 87,231 20.6 986 18.2 5 9,370 14.5 -Pushed/shoved into/against 53 0.7 1,867 0.4 33 0.6 - 584 0.9 -Pushed/shoved onto 9 0.1 520 0.1 7 0.1 - 58 0.1 -Pushed/shoved from 5 0.1 848 0.2 4 0.1 - 4 0.0 -Ran into on-track equipment 13 0.2 1,203 0.3 9 0.2 2 160 0.2 -Ran into object/equipment 27 0.3 2,062 0.5 14 0.3 - 53 0.1 -Repetitive motion - work processes 122 1.6 4,821 1.1 76 1.4 - 2,606 4.0 -Repetitive motion - typing, keyboard, etc. 9 0.1 145 0.0 4 0.1 - 50 0.1 -Repetitive motion - tools 24 0.3 678 0.2 15 0.3 - 244 0.4 -Repetitive motion - other (describe in narr 16 0.2 146 0.0 9 0.2 - 43 0.1 -Rubbed, abraded, etc. 22 0.3 402 0.1 6 0.1 - 53 0.1 -Slack action, draft, compressive buff/coupl 60 0.8 5,781 1.4 51 0.9 - 625 1.0 -Slipped,fell,stumbled,etc. due to irregular 275 3.5 15,047 3.5 208 3.8 - 3,360 5.2 -Slipped, fell, stumbled, etc. due to climat 296 3.8 18,509 4.4 237 4.4 2 2,931 4.5 -Slipped,fell,stumbled,etc. on oil, grease,e 182 2.3 13,950 3.3 143 2.6 1 2,192 3.4 -Slipped,fell,stumbled,etc. due to object,ba 531 6.8 40,201 9.5 430 7.9 - 5,988 9.3 -Stabbing, knifing, etc. 11 0.1 11 0.0 4 0.1 - 74 0.1 -Stepped on object 108 1.4 5,463 1.3 73 1.3 - 904 1.4 -Struck by thrown or propelled object 121 1.5 3,139 0.7 49 0.9 - 537 0.8 -

TABLE 4-4 REPORTABLE CONDITIONS TO EMPLOYEE ON DUTY BY EVENT,2001
1/ The number of cases that resulted in employee being absent for work at least one day 2/ Term = terminated, Trans = transferred
3/ Condition was the result of a hazardous material exposure
Total Days AbsentAbsentCases
Term./Trans.
Days Restricted
HazmatExp. Event
Cnt % Cnt % Cnt % Cnt Cnt % CntStruck by object 477 6.1 11,702 2.8 248 4.6 1 1,668 2.6 -Struck by on-track equipment 52 0.7 6,467 1.5 36 0.7 1 815 1.3 -Struck by falling object 172 2.2 5,405 1.3 108 2.0 - 1,448 2.2 -Struck against object 334 4.3 8,575 2.0 199 3.7 1 1,939 3.0 -Sudden release of air 17 0.2 290 0.1 7 0.1 - 0 0.0 -Sudden/unexpected movement of material 126 1.6 4,484 1.1 68 1.3 - 974 1.5 -Sudden/unexpected movement of on-track equ 111 1.4 7,918 1.9 96 1.8 - 633 1.0 -Sudden/unexpected movement of vehicle 53 0.7 6,850 1.6 43 0.8 - 447 0.7 -Sustained viewing 3 0.0 37 0.0 2 0.0 - 21 0.0 -Caught, crushed, pinched, other 282 3.6 4,737 1.1 163 3.0 - 2,393 3.7 -On track equipment, other incidents 28 0.4 2,136 0.5 21 0.4 1 647 1.0 -Slipped, fell, stumbled, other 444 5.7 34,277 8.1 366 6.8 3 4,480 6.9 -Sudden, unexpected movement, other 212 2.7 14,010 3.3 145 2.7 - 1,264 2.0 -Other (describe in narrative) 387 4.9 9,303 2.2 234 4.3 6 1,465 2.3 2Total 7,837 100 424,301 100 5,409 100 35 64,530 100 46
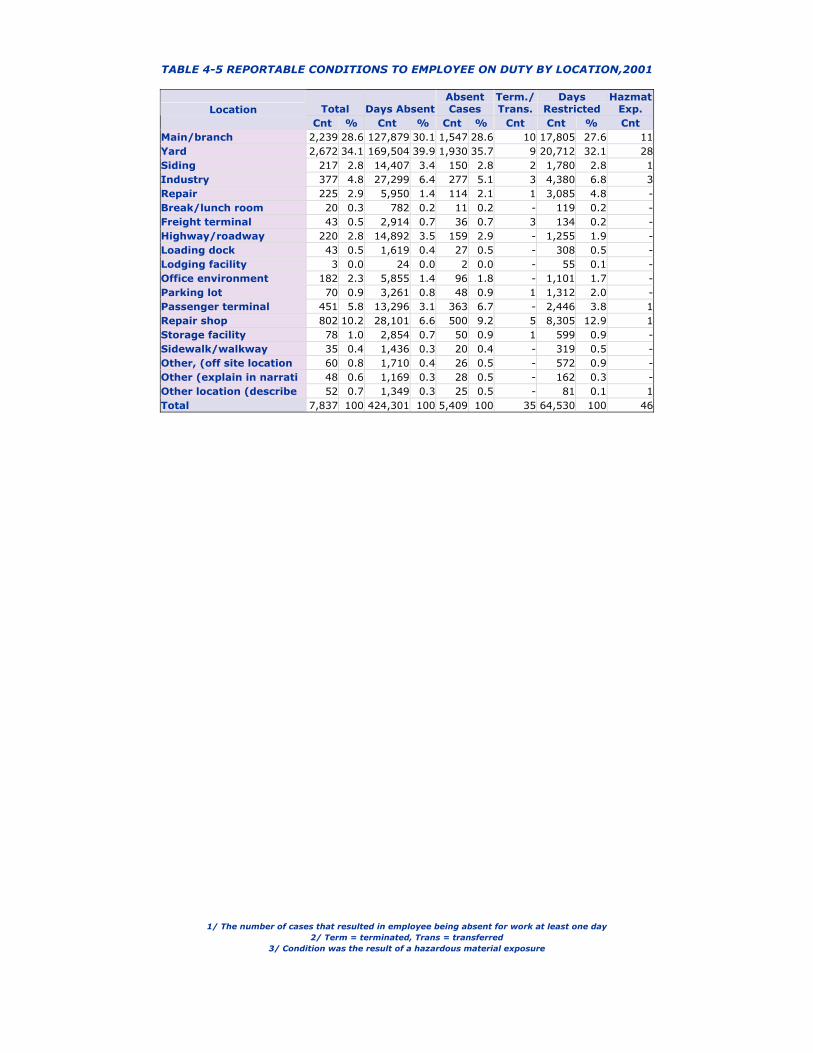
TABLE 4-5 REPORTABLE CONDITIONS TO EMPLOYEE ON DUTY BY LOCATION,2001
1/ The number of cases that resulted in employee being absent for work at least one day 2/ Term = terminated, Trans = transferred
3/ Condition was the result of a hazardous material exposure
Total Days AbsentAbsentCases
Term./Trans.
Days Restricted
HazmatExp. Location
Cnt % Cnt % Cnt % Cnt Cnt % CntMain/branch 2,239 28.6 127,879 30.1 1,547 28.6 10 17,805 27.6 11Yard 2,672 34.1 169,504 39.9 1,930 35.7 9 20,712 32.1 28Siding 217 2.8 14,407 3.4 150 2.8 2 1,780 2.8 1Industry 377 4.8 27,299 6.4 277 5.1 3 4,380 6.8 3Repair 225 2.9 5,950 1.4 114 2.1 1 3,085 4.8 -Break/lunch room 20 0.3 782 0.2 11 0.2 - 119 0.2 -Freight terminal 43 0.5 2,914 0.7 36 0.7 3 134 0.2 -Highway/roadway 220 2.8 14,892 3.5 159 2.9 - 1,255 1.9 -Loading dock 43 0.5 1,619 0.4 27 0.5 - 308 0.5 -Lodging facility 3 0.0 24 0.0 2 0.0 - 55 0.1 -Office environment 182 2.3 5,855 1.4 96 1.8 - 1,101 1.7 -Parking lot 70 0.9 3,261 0.8 48 0.9 1 1,312 2.0 -Passenger terminal 451 5.8 13,296 3.1 363 6.7 - 2,446 3.8 1Repair shop 802 10.2 28,101 6.6 500 9.2 5 8,305 12.9 1Storage facility 78 1.0 2,854 0.7 50 0.9 1 599 0.9 -Sidewalk/walkway 35 0.4 1,436 0.3 20 0.4 - 319 0.5 -Other, (off site location 60 0.8 1,710 0.4 26 0.5 - 572 0.9 -Other (explain in narrati 48 0.6 1,169 0.3 28 0.5 - 162 0.3 -Other location (describe 52 0.7 1,349 0.3 25 0.5 - 81 0.1 1Total 7,837 100 424,301 100 5,409 100 35 64,530 100 46

TABLE 4-6 REPORTABLE CONDITIONS TO EMPLOYEE ON DUTY BY ACTIVITY, 2001
1/ The number of cases that resulted in employee being absent for work at least one day 2/ Term = terminated, Trans = transferred
3/ Condition was the result of a hazardous material exposure
Total Days AbsentAbsentCases
Term./Trans.
Days Restricted
HazmatExp. Activity
Cnt % Cnt % Cnt % Cnt Cnt % CntAdjusting coupler 26 0.3 1,666 0.4 14 0.3 - 454 0.7 -Adjusting drawbar 34 0.4 2,835 0.7 29 0.5 - 70 0.1 -Adjusting, other 87 1.1 4,034 1.0 53 1.0 1 350 0.5 -Applying rail anchor/fastener 8 0.1 276 0.1 4 0.1 - 4 0.0 -Bending, stooping 130 1.7 3,170 0.7 82 1.5 - 1,656 2.6 -Carrying 49 0.6 2,096 0.5 34 0.6 1 378 0.6 -Chaining, cabling car or locomotive 8 0.1 89 0.0 5 0.1 - 54 0.1 -Cleaning 98 1.3 2,989 0.7 52 1.0 - 596 0.9 3Climbing over/on 136 1.7 7,830 1.8 102 1.9 - 914 1.4 -Closing 107 1.4 4,350 1.0 69 1.3 - 628 1.0 -Coupling electric cables 10 0.1 438 0.1 6 0.1 - 8 0.0 -Coupling air hose 61 0.8 3,192 0.8 40 0.7 - 603 0.9 -Crossing over 31 0.4 2,109 0.5 23 0.4 1 427 0.7 -Crossing or crawling under 6 0.1 246 0.1 3 0.1 - 118 0.2 -Crossing between 7 0.1 317 0.1 4 0.1 - 0 0.0 -Cutting rail 17 0.2 696 0.2 9 0.2 1 402 0.6 -Cutting vegetation 24 0.3 117 0.0 11 0.2 - 15 0.0 -Cutting, other 67 0.9 331 0.1 14 0.3 - 243 0.4 -Digging, excavating 31 0.4 1,787 0.4 18 0.3 - 225 0.3 -Driving (motor vehicle, forklift, 150 1.9 8,645 2.0 89 1.6 - 866 1.3 -Flagging 4 0.1 150 0.0 4 0.1 - 100 0.2 -Fueling 8 0.1 14 0.0 2 0.0 - 13 0.0 1Getting on 121 1.5 10,939 2.6 99 1.8 1 486 0.8 -Getting off 311 4.0 21,481 5.1 253 4.7 3 3,339 5.2 -Grinding 23 0.3 493 0.1 7 0.1 - 57 0.1 -Handling baggage 37 0.5 1,391 0.3 27 0.5 - 39 0.1 -Handling car parts 31 0.4 1,140 0.3 18 0.3 - 229 0.4 -Handling material, general 112 1.4 2,233 0.5 86 1.6 - 857 1.3 -Handling locomotive parts 47 0.6 1,856 0.4 34 0.6 1 446 0.7 -Handling wheels/trucks 7 0.1 41 0.0 2 0.0 - 64 0.1 -Handling, other 152 1.9 5,505 1.3 107 2.0 - 940 1.5 1Handling other track material/supp 50 0.6 1,598 0.4 24 0.4 - 686 1.1 -Handling poles 1 0.0 0 0.0 - - - 0 0.0 -Handling tie plates 13 0.2 541 0.1 7 0.1 - 80 0.1 -Handling ties 48 0.6 2,073 0.5 32 0.6 1 276 0.4 -Handling rail 26 0.3 1,025 0.2 14 0.3 - 221 0.3 -Inspecting 82 1.0 4,432 1.0 54 1.0 - 658 1.0 -Installing 95 1.2 3,223 0.8 50 0.9 - 925 1.4 -Jumping from 51 0.7 5,778 1.4 39 0.7 - 557 0.9 -Jumping onto 7 0.1 859 0.2 6 0.1 - 20 0.0 -Laying 10 0.1 549 0.1 6 0.1 - 11 0.0 -Lifting other material 182 2.3 7,939 1.9 118 2.2 1 1,459 2.3 -Lifting equipment (tools, parts, e 171 2.2 8,149 1.9 120 2.2 1 2,450 3.8 -Lining switches 290 3.7 25,769 6.1 229 4.2 4 2,637 4.1 -Lining, other 14 0.2 523 0.1 8 0.1 - 263 0.4 -Loading/unloading 102 1.3 3,135 0.7 69 1.3 2 708 1.1 -Maintaining 31 0.4 358 0.1 16 0.3 - 217 0.3 -Opening 140 1.8 5,015 1.2 105 1.9 - 952 1.5 1Opening/closing angle cock 35 0.4 2,192 0.5 23 0.4 - 584 0.9 -Operating 299 3.8 18,196 4.3 220 4.1 3 1,876 2.9 4Pulling pin lifter/operating uncou 98 1.3 4,845 1.1 76 1.4 - 1,610 2.5 -Pulling 189 2.4 10,775 2.5 126 2.3 - 1,153 1.8 -Pushing 74 0.9 2,805 0.7 43 0.8 - 1,233 1.9 -Reaching 73 0.9 1,341 0.3 44 0.8 - 1,233 1.9 -

TABLE 4-6 REPORTABLE CONDITIONS TO EMPLOYEE ON DUTY BY ACTIVITY, 2001
1/ The number of cases that resulted in employee being absent for work at least one day 2/ Term = terminated, Trans = transferred
3/ Condition was the result of a hazardous material exposure
Total Days AbsentAbsentCases
Term./Trans.
Days Restricted
HazmatExp. Activity
Cnt % Cnt % Cnt % Cnt Cnt % CntRemoving rail anchors/fasteners 28 0.4 906 0.2 13 0.2 - 65 0.1 -Repairing 147 1.9 3,750 0.9 67 1.2 - 514 0.8 -Riding 423 5.4 38,414 9.1 333 6.2 2 2,515 3.9 4Running 38 0.5 1,697 0.4 26 0.5 - 63 0.1 -Sitting 208 2.7 13,577 3.2 145 2.7 - 1,338 2.1 4Spiking (installation/removal) 84 1.1 1,380 0.3 37 0.7 - 438 0.7 1Standing 387 4.9 18,065 4.3 272 5.0 4 2,609 4.0 5Stepping up 81 1.0 4,237 1.0 56 1.0 - 1,191 1.8 -Stepping down 350 4.5 20,968 4.9 272 5.0 - 2,954 4.6 -Stepping over 69 0.9 3,835 0.9 45 0.8 - 1,373 2.1 -Uncoupling air hose 11 0.1 1,177 0.3 8 0.1 - 54 0.1 -Uncoupling electric cables 8 0.1 388 0.1 5 0.1 - 0 0.0 -Using hand signals 1 0.0 0 0.0 - - - 0 0.0 -Using hand tool 269 3.4 7,651 1.8 121 2.2 1 3,219 5.0 -Using, other 34 0.4 1,115 0.3 18 0.3 - 198 0.3 -Walking 1,250 15.9 78,902 18.6 974 18.0 5 11,443 17.7 17Welding (includes field welding) 39 0.5 390 0.1 16 0.3 - 251 0.4 -Handbrakes, applying 109 1.4 11,681 2.8 81 1.5 - 742 1.1 1Handbrakes, releasing 75 1.0 6,681 1.6 62 1.1 - 706 1.1 -Handbrakes, other 5 0.1 762 0.2 5 0.1 - 0 0.0 -Derail, applying 3 0.0 24 0.0 2 0.0 - 24 0.0 -Derail, removing 6 0.1 944 0.2 6 0.1 - 0 0.0 -Derail, other 4 0.1 506 0.1 4 0.1 - 4 0.0 -Other (Narrative must be provided) 187 2.4 3,675 0.9 112 2.1 2 439 0.7 4Total 7,837 100 424,301 100 5,409 100 35 64,530 100 46

TABLE 4-7 REPORTABLE CONDITIONS TO EMPLOYEE ON DUTY, 2001
Executives, Officials, and Staff Assistants ---Total--- ---- Days ----
Job Titles
Killed Injured Illness
AbsentFromWork
RestrictedAt Work
Executives, officials, and staff assistants (miscellaneous) - 2 1 20 0Executives and general officers - 4 - 7 0Corporate staff managers - 4 1 143 32Regional/division officers, assistants and staff assistants - 11 - 179 0Transportation officers/managers - 9 - 480 15Total - 30 2 829 47
Professional and Administrative ---Total--- ---- Days ----
Job Titles
Killed Injured Illness
AbsentFromWork
RestrictedAt Work
Professional and administrative (miscellaneous) - 3 1 9 0Professional - 9 2 8 30Subprofessionals - 9 2 31 9Auditors, traveling auditors or accountants - 2 - 3 0General and administrative supervisors - 20 - 61 26Sales and traffic representatives and agents - 17 - 31 0Freight and other claim agents and investigators - 1 - 5 0Lieutenants and sergeants of police - 7 - 74 79Police officers, watchmen, guards (except crossing & bridge) - 40 - 1,033 477Inspectors, (except MOW & MOE), other investigators, etc - 1 2 0 0Buyers, and sales agents - 2 - 0 241Clerical technicians and clerical specialists - 28 3 176 94Office machine and data equipment operators - 11 - 508 36Secretaries, stenographers, and typists - 7 4 181 40General/other clerks (except yd clerk and crew dispatcher) - 81 5 2,810 466Building and office attendants - 26 2 885 323Messengers and office persons - 2 - 53 0Motor vehicle operators - 55 - 2,686 825Total - 321 21 8,554 2,646
Maintenance of Way and Structures ---Total--- ---- Days ----
Job Titles
Killed Injured Illness
AbsentFromWork
RestrictedAt Work
Maintenance of way and structures (miscellaneous) - 20 - 158 136Supervisors, MOW, structures, communication & signls - 42 - 898 437MOW, structures, comm. & signals, & scale inspectors - 57 - 3,637 476Bridge and building gang foreman - 28 - 1,139 254Bridge and building carpenters - 63 - 2,376 825Bridge and building ironworkers - 23 - 547 168Bridge and building painters - 8 - 227 26Masons, bricklayers, plasterers, and plumbers - 101 3 4,106 399Bridge and building helpers and apprentices - 25 - 278 77Bridge/building gang and bridge/building dept laborers 1 54 4 2,416 1,168Track gang foremen (extra gang work train laborers) - 67 1 3,612 249Gang or section foreman 1 114 - 4,145 1,250Extra gang laborers - 170 6 5,547 1,717Section laborers 2 342 4 9,801 2,730Machine operators 1 317 9 18,035 1,774Gang foremen, communications and signals - 22 1 707 164Signalmen and signal maintainers 1 247 2 10,791 2,382

TABLE 4-7 REPORTABLE CONDITIONS TO EMPLOYEE ON DUTY, 2001
Maintenance of Way and Structures ---Total--- ---- Days ----
Job Titles
Killed Injured Illness
AbsentFromWork
RestrictedAt Work
Linemen and groundmen and communications craftsman 1 73 1 1,918 805Assistant signalmen and assistant signal maintainers - 30 2 633 105Signal helpers and signal maintainer helpers - 16 - 475 52Camp car cooks - 6 - 483 155Total 7 1,825 33 71,929 15,349
Maintenance of Equipment and Stores ---Total--- ---- Days ----
Job Titles
Killed Injured Illness
AbsentFromWork
RestrictedAt Work
Maintenance of equipment and stores (miscellaneous) - 19 - 220 39Supervisors and general foremen, maintenance of equipment - 24 - 1,213 146Supervisors and general foremen, materials and stores - 2 - 262 2Equipment, shop, electrical inspectors - 6 - 288 0Materials and supplies inspectors - 4 - 234 0Storekeeper - 15 1 368 10Gang foremen, maintenance of equipment - 36 - 1,188 293Blacksmiths - 9 - 334 55Boilermakers - 25 - 1,005 73Carmen (freight) 1 315 6 14,690 3,149Carmen (other) - 215 4 6,828 1,911Electrical workers (A) - 283 2 9,790 2,763Electrical workers (B) - 16 - 94 2Electrical workers (C) - 6 - 11 32Machinists - 290 6 10,117 4,369Sheet metal workers - 63 - 4,127 247Skilled trades, helpers, maintenance of equipment and stores - 45 3 1,100 489Apprentices, maintenance of equipment and stores - 11 - 49 14Coach cleaners - 139 2 5,808 418Laborers: shops, enginehouses and power plants - 132 1 5,525 1,112Equipment operators/general laborers, materials and stores - 25 1 453 179Stationary engineers - 4 1 53 149Stationary firemen - 2 - 64 0Total 1 1,686 27 63,821 15,452
Transportation, Other Than Train and Engine ---Total--- ---- Days ----
Job Titles
Killed Injured Illness
AbsentFromWork
RestrictedAt Work
Transportation, other than train and engine (miscellaneous) - 2 1 1 10Transportation supervisor and chief train dispatcher - 4 - 231 2Train dispatchers - 11 1 151 103Station, freight and passenger agents - 11 2 224 46Clerk operators, towerman, train directors - 9 - 408 2Station masters & assts, super bag. agents, bag. agents, etc - 2 - 2 0Baggage, parcel room and station attendents - 39 - 1,372 183Gen/asst gnrl foremen,stations,warehouses,grain elev., docks - 6 - 106 58Gang foreman, stations, warehouses, grain elevators, docks - 1 - 32 0Grain elevator, and dock laborers - 5 - 50 2Station, and warehouse laborers - 10 - 305 45Truckers (station, warehouse and platforms) - 9 - 321 56Food and lodging manager, supervisors - 2 - 0 0

TABLE 4-7 REPORTABLE CONDITIONS TO EMPLOYEE ON DUTY, 2001
Transportation, Other Than Train and Engine ---Total--- ---- Days ----
Job Titles
Killed Injured Illness
AbsentFromWork
RestrictedAt Work
Waiters and kitchen helpers (restaurant and dining car) - 4 - 14 0Chefs and cooks (restaurant and dining car) - 38 - 650 72Train attendants - 122 1 3,167 131Bridge operators and helpers - 3 - 102 156Bridge and crossing flagmen and gatemen - 2 - 30 0Yards clerks - 18 1 1,935 124Crew dispatchers - 5 - 44 0Yardmasters and assistant yardmasters - 14 - 956 46Total - 317 6 10,101 1,036
Transportation, Train and Engine ---Total--- ---- Days ----
Job Titles
Killed Injured Illness
AbsentFromWork
RestrictedAt Work
Transportation, train and engine (miscellaneous) - 14 - 529 78Switchtenders - 24 - 3,062 1Outside hostlers - 18 - 1,099 260Outside hostler helpers - 12 - 573 300Inside hostler - 6 - 163 0Road passenger conductors - 272 14 9,985 396Assistant road passenger conductors and ticket collectors - 125 2 5,638 133Road freight conductors (through freight) 3 539 11 56,253 8,274Road freight conductors (local and way freight) 2 387 3 30,430 3,252Road passenger baggageperson - 2 - 8 8Road Passenger brakemen and flagmen - 27 - 406 662Road freight brakemen and flagmen (through freight) - 71 - 6,870 1,270Road freight brakemen and flagmen (local and way freight) 1 259 1 23,077 2,821Yard conductors and yard foremen 1 413 5 27,765 2,592Yard brakemen and yard helpers 2 436 6 32,821 4,356Road passenger engineers and motormen - 147 22 5,664 466Road freight engineers (through freight) 4 358 8 35,273 3,106Road freight engineers (local and way freight) 1 162 2 14,502 517Yard engineers - 182 4 14,132 1,508Road passenger firemen and helpers - 4 - 44 0Road freight firemen and helpers (through freight) - 5 - 218 0Road freight firemen and helpers (local and way freight) - 4 - 480 0Yard firemen and helpers - 2 - 75 0Total 14 3,469 78 269,067 30,000

TABLE 4-8 OCCUPATONAL ILLNESSES OF EMPLOYEE ON DUTY, 2001
1/ The number of cases that resulted in employee being absent for work at least one day 2/ Term = terminated, Trans = transferred
3/ Condition was the result of a hazardous material exposure
TotalIllness
Cnt % Kld NonfatalDays
AbsentAbsentCases
Term./Trans.
Days Restricted
HazmatExp.
Dermatitis 4 2.4 - 4 0 - - 2 -Rashes 4 2.4 - 4 8 1 - 0 -Pneumoconioses, other 1 0.6 - 1 207 1 - 0 -Misc. respiratory conditions 4 2.4 - 4 10 4 - 1 -Heat/sun stroke 5 3.0 - 5 10 4 - 0 -Heat exhaustion 11 6.6 - 11 15 6 - 3 -Misc. disorders,physical agents 2 1.2 - 2 35 1 - 0 -Noise induced hearing loss 1 0.6 - 1 0 - - 0 -Synovitis 1 0.6 - 1 0 - - 13 -Tenosynovitis 10 6.0 - 10 125 1 - 351 -Bursitis 1 0.6 - 1 321 1 - 44 -Carpal tunnel syndrome 33 19.8 - 33 819 17 - 464 -Misc. repeated trauma condition 23 13.8 - 23 1,817 17 - 525 -Stress related syndromes 19 11.4 - 19 935 18 - 0 -Misc. illnesses, unclassified 12 7.2 - 12 137 5 - 118 -Emotional trauma/nervous shock 36 21.6 - 36 1,209 35 - 19 -Total 167 100 - 167 5,648 111 - 1,540 -

TABLE 4-9 OCCUPATIONAL ILLNESSES OF EMPLOYEE ON DUTY, BY RAILROAD, 2001
1/ The number of cases that resulted in employee being absent for work at least one day 2/ Term = terminated, Trans = transferred
3/ Condition was the result of a hazardous material exposure
Total Days Absent AbsentCases
Term./Trans.
Days Restricted
HazmatExp. RR
Cnt % Kld Nonfatal Cnt % Avg. Cnt % Cnt Cnt % Avg. CntARR 1 0.6 - 1 0 0.0 0 - - - 5 0.3 5 -ATK 18 10.8 - 18 312 5.5 17 17 15.3 - 4 0.3 0 -BNSF 39 23.4 - 39 2,440 43.2 63 24 21.6 - 1,207 78.4 31 -CSX 2 1.2 - 2 0 0.0 0 - - - 0 0.0 0 -DH 2 1.2 - 2 5 0.1 3 1 0.9 - 0 0.0 0 -DMIR 1 0.6 - 1 0 0.0 0 - - - 0 0.0 0 -IC 2 1.2 - 2 0 0.0 0 - - - 3 0.2 2 -IHB 2 1.2 - 2 69 1.2 35 2 1.8 - 0 0.0 0 -LI 4 2.4 - 4 155 2.7 39 4 3.6 - 244 15.8 61 -MBTA 1 0.6 - 1 8 0.1 8 1 0.9 - 0 0.0 0 -MNCW 1 0.6 - 1 47 0.8 47 1 0.9 - 0 0.0 0 -NIRC 19 11.4 - 19 93 1.6 5 7 6.3 - 31 2.0 2 -NJTR 1 0.6 - 1 1 0.0 1 1 0.9 - 0 0.0 0 -NS 1 0.6 - 1 307 5.4 307 1 0.9 - 0 0.0 0 -PATH 26 15.6 - 26 594 10.5 23 26 23.4 - 0 0.0 0 -SCAX 1 0.6 - 1 0 0.0 0 - - - 0 0.0 0 -SEPA 6 3.6 - 6 18 0.3 3 1 0.9 - 0 0.0 0 -SOO 2 1.2 - 2 50 0.9 25 1 0.9 - 2 0.1 1 -UP 15 9.0 - 15 1,308 23.2 87 14 12.6 - 32 2.1 2 -WC 4 2.4 - 4 0 0.0 0 - - - 10 0.6 3 -XXXX 19 11.4 - 19 241 4.3 13 10 9.0 - 2 0.1 0 -Tot. 167 100 - 167 5,648 100 34 111 100 - 1,540 100 9 -

Railroad Safety Statistics-Annual Report 2001 04/01/2003
CHAPTER 5
TRAIN ACCIDENTS
Collisions, derailments, fires, explosions, acts of God, or other events involving the operation of railroad on-track equipment (standing or moving) and causing reportable damages greater than the reporting threshold for the year in which the accident/incident occurred must be reported using Form FRA F 6180.54. The reporting threshold for calendar years 1992-1996 was $6,300. The reporting threshold for calendar year 1997 was $6,500, and in 1998 it was $6,600.
Reportable damage includes labor costs and all other costs to repair or replace in kind damaged on-track equipment, signals, track, track structures, or roadbed. Reportable damage does not include the cost of clearing a wreck; however, additional damage to the above listed items caused while clearing the wreck is to be included in your damage estimate.
Examples of other costs included in reportable damage are: (1) rental and/or operation of machinery such as cranes, bulldozers, including the services of contractors, to replace or repair the track right-of-way and associated structures; and (2) costs associated with the repair or replacement of roller bearings on units that were derailed or submerged in water. (Replacement costs include the labor costs resulting from a wheel set change out.)
If the property of more than one railroad is involved in an accident/incident, the reporting threshold is calculated by including the damages suffered by all of the railroads involved. When total reportable damage to all railroads directly involved in an accident/incident exceeds the reporting threshold, a report is required even though an individual railroad's damages were below the threshold.
The tables displaying train accidents counts by railroad, are the number of events that a railroad was involved in, regardless of whether or not that railroad’s operations were the primary reason the accident occurred. This is done because all railroads are required to report the extent of their involvement in the accident, no matter whether there is agreement on the cause of the accident.
A form must be completed for each consist involved in an accident. The railroad responsible for the on-track equipment at the time of the accident, and only that railroad, will report the consist.
In joint operations, if the railroad having track maintenance responsibility did not also have ontrack rail equipment involved, a report containing the track information must be forwarded.
Track information for accidents occurring on industry track of a non-reporting company is to be reported by the railroad operating the on-track equipment. Damages to industry track and ontrack equipment are included in reportable damage.
A railroad need not report the following:
1. Cars derailed on industry tracks by non-railroad employees or non-railroad employee vandalism, providing there is no involvement of railroad employees;

Railroad Safety Statistics-Annual Report 2001 04/01/2003
2. Damage to out-of-service cars resulting from high water or flooding, e.g., empties placed
on storage or repair track. This exclusion does not apply if such cars are placed into a moving consist and as a result of this damage, a reportable rail equipment accident results.
An equipment consist is a train, locomotive(s), cut of cars, or a single car not coupled to another car or locomotive.
Car. A unit of on-track equipment, either
(1) Equipment designed to be hauled by locomotives, or
(2) Equipment such as a track motorcar, highway-rail vehicle, push car, crane, or ballast tamping machine.
Locomotive. A locomotive is a piece of on-track equipment, other than hi-rail or specialized maintenance equipment,
(1) With one or more propelling motors designed for moving other equipment;
(2) With one or more propelling motors designed to carry freight or passenger traffic, or both; or
(3) Without propelling motors but with one or more control stands.
Motorcar. A self-propelled unit of equipment, designed to carry freight or passenger traffic. (Does not include track motorcars or similar work equipment.)
Train. For purposes of accident/incident reporting, a train is a locomotive or locomotives coupled with or without cars, and with or without markers displayed. This definition includes trains consisting entirely of self-propelled units designed to carry passengers, freight traffic, or both.
Yard switching trains. Those trains operated primarily within yards for the purpose of switching other equipment. Examples include the making up or breaking up of trains, service industrial tracks within yard limits, storing or classifying cars, and other similar operations.
Note: Switching performed by a road crew that is incidental to the road operation is not included.
Work trains are non-revenue trains used for the administration and upkeep service of the railroad. Examples are: official trains; inspection trains; special trains running with company fire apparatus to save the railroad's property from destruction; trains that transport the railroad's employees to and from work when no transportation charge is made; construction and upkeep trains run in connection with maintenance and improvement work; and material and supply trains run in connection with operations.
Railroad Safety Statistics-Annual Report 2001 04/01/2003
CONTENTS
CHAPTER 5
TRAIN ACCIDENTS
Tables
5-1 Train accidents by railroad, type, and major cause, 2001 .......................................……………….. 5-2 Train accidents by state, type, and major cause, 2001 ............................................………………..5-3 Train accidents by month, type and major cause, 2001............................................………………. 5-4 Train accidents by day, type, and major cause, 2001 ..............................................………………. 5-5 Train accidents by time of day, type, and major cause, 2001...................................………………. 5-6 Train accidents by type and major cause, 2001........................................................………………. 5-7 Train accidents by subcause and type, 2001.............................................................………………. 5-8 Train accidents with contributing cause, 2001.........................................................………………. 5-9 Train accidents by specific cause, and type, 2001....................................................……………….5-10 Train accidents by type track and class, 2001 .......................................................…….…………...5-11 Train accidents by type track and consist speed, 2001...........................................………………...5-12 Train accidents by weather condition, 2001...........................................................…….………….. 5-13 Train accidents by consist length, 2001 .................................................................………………... 5-14 Train accidents by type track and consist, 2001.....................................................………………...5-15 Train accidents by consist length and type consist, 2001.......................................………………... 5-16 Involvement in train accidents by type consist, 2001.............................................………………... 5-17 Damage by track type, 2001...................................................................................………………... 5-18 Damage by consist type, 2001................................................................................………………...

TABLE 5-1 TRAIN ACCIDENTS BY RR, TYPE AND MAJOR CAUSE, 2001
Coll =collision,Der = derailment, HRC = higway-rail crossing, Othr = other EQP = equipment(ontrack), HMN = human factor, SIG = signal, TRK = track
Total Type of Accident Casualties CausesRailroad
Cnt % Coll Der HRC OthrReportable
Damage Kld Nonfatal Eqp HRC Hmn Othr Sig TrkAlton & Southern 11 0.3 1 5 - 5 288,077 - 1 - - 5 - 1 5Alaska RR Corp. 1 0.0 - 1 - - 24,300 - - - - 1 - - -Amtrak 192 5.4 8 77 42 65 19,036,559 27 183 26 42 33 25 1 65Bangor & Aroostook 3 0.1 - 1 1 1 483,878 - 1 1 1 - - - 1Bessemer & Lake Erie RR 2 0.1 - 2 - - 10,157 - - 1 - - - - 1Burlington Northern Santa Fe 668 18.8 15 487 45 121 69,020,940 5 47 112 45 221 84 9 197Belt Rwy Of Chicago 15 0.4 - 8 - 7 208,816 - - 2 - 8 2 - 3Conrail Shared Assets 34 1.0 7 25 1 1 1,214,287 - 1 - 1 23 1 1 8CSX Transportation 419 11.8 85 261 30 43 31,674,235 1 22 31 30 175 73 2 108Delaware & Hudson 8 0.2 1 7 - - 1,620,927 - 1 - - 4 1 - 3Dakota,Minnesota & Eastern 15 0.4 - 15 - - 1,443,748 - - - - 1 1 - 13Duluth,Missabe & Iron Range 4 0.1 - 3 - 1 116,355 - 2 1 - 2 - - 1Duluth,Winnipeg & Pacific 2 0.1 - 2 - - 896,000 - - - - 1 - - 1Elgin, Joliet & Eastern 11 0.3 1 8 - 2 202,046 - - - - 4 - - 7Florida East Coast 16 0.5 - 15 1 - 299,101 - - 4 1 5 - - 6Guilford Rail System 4 0.1 - 3 1 - 411,370 - 1 - 1 1 - - 2Grand Trunk Western RR 16 0.5 3 9 1 3 1,163,811 2 2 1 1 6 3 1 4Gateway Western 12 0.3 1 9 - 2 2,173,981 - 2 2 - 5 - - 5Illinois Central 73 2.1 4 42 7 20 6,832,518 2 5 7 7 28 7 1 23Indiana Harbor Belt 24 0.7 3 20 - 1 477,413 - - 1 - 14 1 - 8I & M Rail Link, LLC 36 1.0 2 26 - 8 1,862,097 - - 4 - 15 1 - 16Kansas City Southern 98 2.8 8 63 6 21 6,485,657 1 7 8 6 49 3 - 32Long Island Rail Road 20 0.6 2 10 1 7 4,416,397 2 17 3 1 5 4 - 7Mass Bay Transit Auth. 5 0.1 - - 3 2 27,847 - 1 - 3 1 1 - -Metro North Commuter 56 1.6 3 3 1 49 2,071,721 - 7 31 1 8 9 - 7Montana Rail Link 20 0.6 2 14 1 3 1,713,927 - 1 5 1 10 1 - 3Northern IN Comm Trans 1 0.0 - 1 - - 34,803 - - - - 1 - - -Northeast IL Reg Comm 9 0.3 1 4 2 2 523,222 - - 1 2 6 - - -New Jersey Transit Rail 25 0.7 1 10 - 14 1,258,134 - 22 4 - 8 4 - 9Norfolk Southern Corp. 257 7.2 22 192 18 25 9,591,881 3 13 51 18 69 40 7 72Paducah & Louisville 6 0.2 1 4 1 - 635,550 - - - 1 2 2 - 1Port Auth Trans Hudson 3 0.1 - 1 - 2 16,959,283 - 16 1 - 1 1 - -Peninsula Comm San Mateo Cnty 1 0.0 - - - 1 8,000 - - - - 1 - - -Port Terminal RR Assn 18 0.5 1 2 - 15 470,477 - - - - 17 - - 1Southern CA Reg Rail Auth. 8 0.2 - 2 5 1 236,115 - 2 - 5 1 1 - 1Southeastern PA Trans. 10 0.3 3 - - 7 287,861 - - 3 - 1 6 - -Soo Line 35 1.0 1 18 4 12 797,674 - 6 6 4 11 6 - 8Texas Mexican 14 0.4 - 13 - 1 1,542,060 - - 1 - 3 3 - 7Term RR Assn Of St. Louis 9 0.3 - 8 - 1 450,919 - - 1 - - - - 8Econo Rail Corporation 3 0.1 1 2 - - 88,310 - - 1 - 1 - - 1Union Pacific 977 27.5 48 719 81 129 112,533,107 9 72 112 81 277 115 20 372Union RR (Pittsburgh) 2 0.1 - 1 - 1 23,623 - - - - 1 - - 1Wisconsin Central Ltd. 40 1.1 3 21 6 10 2,591,196 2 2 8 6 13 5 1 7Wheeling & Lake Erie 10 0.3 - 10 - - 253,266 - - 1 - 2 1 - 6Other Railroads 355 10.0 16 302 9 28 20,293,512 2 13 28 9 79 30 - 209

TABLE 5-2 TRAIN ACCIDENTS BY STATE, TYPE AND MAJOR CAUSE, 2001
Total Type of Accident Reportable
Damage Casualties CausesState Accs % Coll Der HRC Othr Amount % Kld Nonfatal Eqp HRC Hmn Othr Sig Trk
Alabama 82 2.5 7 63 6 6 4,059,281 1.3 2 3 7 6 17 7 1 44Alaska 1 0.0 - 1 - - 24,300 0.0 - - - - 1 - - -Arizona 43 1.3 1 37 - 5 5,775,612 1.8 - 1 9 - 16 4 - 14Arkansas 74 2.3 4 48 12 10 4,040,891 1.3 2 12 10 12 19 8 3 22California 205 6.3 4 149 23 29 20,937,326 6.5 14 24 18 23 67 18 3 76Colorado 62 1.9 3 48 3 8 7,851,157 2.4 1 4 15 3 20 6 - 18Connecticut 36 1.1 2 8 - 26 2,429,990 0.8 - 7 15 - 8 4 - 9Delaware 12 0.4 3 4 - 5 175,797 0.1 - 1 4 - 5 - - 3Dist Of Columbi 21 0.6 1 15 - 5 1,055,489 0.3 - 1 4 - 9 1 - 7Florida 54 1.7 3 39 11 1 3,801,111 1.2 3 7 5 11 15 3 - 20Georgia 64 2.0 9 44 6 5 6,479,452 2.0 - 15 8 6 20 12 1 17Idaho 22 0.7 - 17 4 1 3,278,782 1.0 - 3 4 4 6 2 - 6Illinois 243 7.5 24 159 14 46 14,146,591 4.4 - 18 25 14 107 19 2 76Indiana 96 3.0 16 70 6 4 4,608,436 1.4 2 7 15 6 27 17 - 31Iowa 95 2.9 4 76 4 11 12,495,273 3.9 3 54 8 4 28 7 - 48Kansas 107 3.3 1 82 7 17 7,937,558 2.5 2 3 10 7 29 13 1 47Kentucky 35 1.1 4 25 3 3 2,047,896 0.6 - 1 1 3 16 8 - 7Louisiana 122 3.8 13 79 9 21 7,115,853 2.2 1 12 8 9 43 9 2 51Maine 9 0.3 - 6 2 1 701,797 0.2 - 2 2 2 2 1 - 2Maryland 31 1.0 7 12 2 10 3,628,478 1.1 1 1 5 2 12 3 - 9Massachusetts 27 0.8 1 13 3 10 1,046,796 0.3 - 2 3 3 10 4 - 7Michigan 39 1.2 3 26 4 6 2,224,825 0.7 3 2 2 4 14 4 1 14Minnesota 74 2.3 1 54 4 15 7,544,030 2.3 - 4 12 4 20 9 - 29Mississippi 53 1.6 1 34 4 14 4,645,301 1.4 1 6 4 4 23 2 - 20Missouri 93 2.9 6 71 3 13 30,465,492 9.4 - 23 15 3 27 8 1 39Montana 30 0.9 3 22 1 4 4,142,016 1.3 - 1 7 1 10 3 - 9Nebraska 104 3.2 4 77 5 18 13,868,200 4.3 - 5 21 5 19 20 6 33Nevada 14 0.4 3 8 - 3 4,321,401 1.3 - 1 1 - 6 5 - 2New Hampshire 1 0.0 - - - 1 20,480 0.0 - - - - - 1 - -New Jersey 53 1.6 5 29 1 18 2,560,173 0.8 - 21 7 1 25 4 - 16New Mexico 35 1.1 2 20 3 10 3,598,713 1.1 3 2 6 3 16 5 - 5New York 134 4.1 16 62 2 54 27,125,957 8.4 2 81 25 2 48 23 1 35North Carolina 31 1.0 6 22 2 1 1,780,321 0.6 - 1 8 2 9 3 - 9North Dakota 29 0.9 - 24 3 2 2,252,434 0.7 - 5 6 3 3 4 - 13Ohio 100 3.1 13 72 3 12 3,932,215 1.2 1 5 10 3 28 15 3 41Oklahoma 78 2.4 1 56 10 11 7,142,684 2.2 3 4 10 10 19 7 4 28Oregon 53 1.6 3 37 - 13 2,151,041 0.7 - - 8 - 19 2 - 24Pennsylvania 94 2.9 9 66 2 17 3,709,865 1.1 1 - 14 2 23 20 2 33Rhode Island 2 0.1 - - - 2 32,000 0.0 - - - - - 1 - 1South Carolina 29 0.9 4 20 5 - 3,219,378 1.0 1 4 2 5 10 6 - 6South Dakota 15 0.5 - 13 1 1 1,351,494 0.4 - 1 2 1 3 1 - 8Tennessee 65 2.0 1 52 1 11 3,173,114 1.0 - 7 7 1 12 20 3 22Texas 399 12.3 18 275 36 70 44,057,363 13.7 5 57 35 36 136 51 7 134Utah 36 1.1 2 31 - 3 7,909,218 2.5 - 25 7 - 16 3 - 10Vermont 7 0.2 - 7 - - 1,742,046 0.5 - - - - - 2 - 5Virginia 36 1.1 1 30 1 4 2,196,910 0.7 - - 8 1 13 3 - 11Washington 54 1.7 3 39 1 11 3,873,695 1.2 2 5 7 1 20 6 - 20West Virginia 24 0.7 4 18 1 1 3,042,870 0.9 - 1 3 1 5 5 - 10Wisconsin 64 2.0 2 38 8 16 4,513,997 1.4 2 6 12 8 18 8 1 17Wyoming 53 1.6 2 36 1 14 12,520,059 3.9 1 2 12 1 16 11 - 13Total 3,240 100 220 2,234 217 569 322,755,158 100.0 56 447 427 217 1,035 398 42 1,121

TABLE 5-3 TRAIN ACCIDENTS BY MONTH, TYPE AND MAJOR CAUSE,, 2001
Coll =collision,Der = derailment, HRC = higway-rail crossing, Othr = other EQP = equipment(ontrack), HMN = human factor, SIG = signal, TRK = track
Total Type of Accident Reportable
Damage Casualties CausesDay Cnt % Coll Der HRC Othr Amount % Kld Nonfatal Eqp HRC Hmn Othr Sig Trk
January 292 9.0 17 209 21 45 23,606,457 7.3 3 19 33 21 87 36 3 112February 281 8.7 14 201 24 42 25,285,034 7.8 6 59 46 24 72 29 5 105March 287 8.9 21 205 15 46 28,826,835 8.9 2 64 32 15 103 38 5 94April 254 7.8 19 179 14 42 23,513,608 7.3 - 27 33 14 86 35 4 82May 266 8.2 17 183 15 51 22,063,038 6.8 6 32 36 15 86 37 4 88June 266 8.2 21 179 14 52 22,729,632 7.0 3 36 33 14 82 38 2 97July 298 9.2 16 220 16 46 38,818,646 12.0 8 39 44 16 78 33 6 121August 309 9.5 22 215 20 52 28,671,946 8.9 6 24 49 20 97 33 5 105September 256 7.9 16 158 18 64 41,344,869 12.8 2 82 28 18 92 32 3 83October 250 7.7 18 173 23 36 14,283,809 4.4 2 20 34 23 76 34 1 82November 230 7.1 21 146 18 45 17,466,226 5.4 7 26 24 18 93 24 2 69December 251 7.7 18 166 19 48 36,145,058 11.2 11 19 35 19 83 29 2 83Total 3,240 100 220 2,234 217 569 322,755,158 100.0 56 447 427 217 1,035 398 42 1,121

TABLE 5-4 TRAIN ACCIDENTS BY DAY, TYPE AND MAJOR CAUSE, 2001
Coll =collision,Der = derailment, HRC = higway-rail crossing, Othr = other EQP = equipment(ontrack), HMN = human factor, SIG = signal, TRK = track
Total Type of Accident Reportable
Damage Casualties CausesDay Cnt % Coll Der HRC Othr Amount % Kld Nonfatal Eqp HRC Hmn Othr Sig Trk
Sunday 414 12.8 25 303 14 72 56,014,705 17.4 5 34 48 14 145 53 7 147Monday 485 15.0 29 343 39 74 39,629,363 12.3 4 85 54 39 147 51 4 190Tuesday 488 15.1 34 327 32 95 57,922,481 17.9 5 68 65 32 145 61 5 180Wednesday 490 15.1 35 332 35 88 44,727,760 13.9 16 69 60 35 170 59 5 161Thursday 450 13.9 37 315 30 68 46,286,224 14.3 6 76 65 30 132 53 9 161Friday 504 15.6 35 337 38 94 41,809,269 13.0 12 43 67 38 165 76 2 156Saturday 409 12.6 25 277 29 78 36,365,356 11.3 8 72 68 29 131 45 10 126Total 3,240 100 220 2,234 217 569 322,755,158 100.0 56 447 427 217 1,035 398 42 1,121
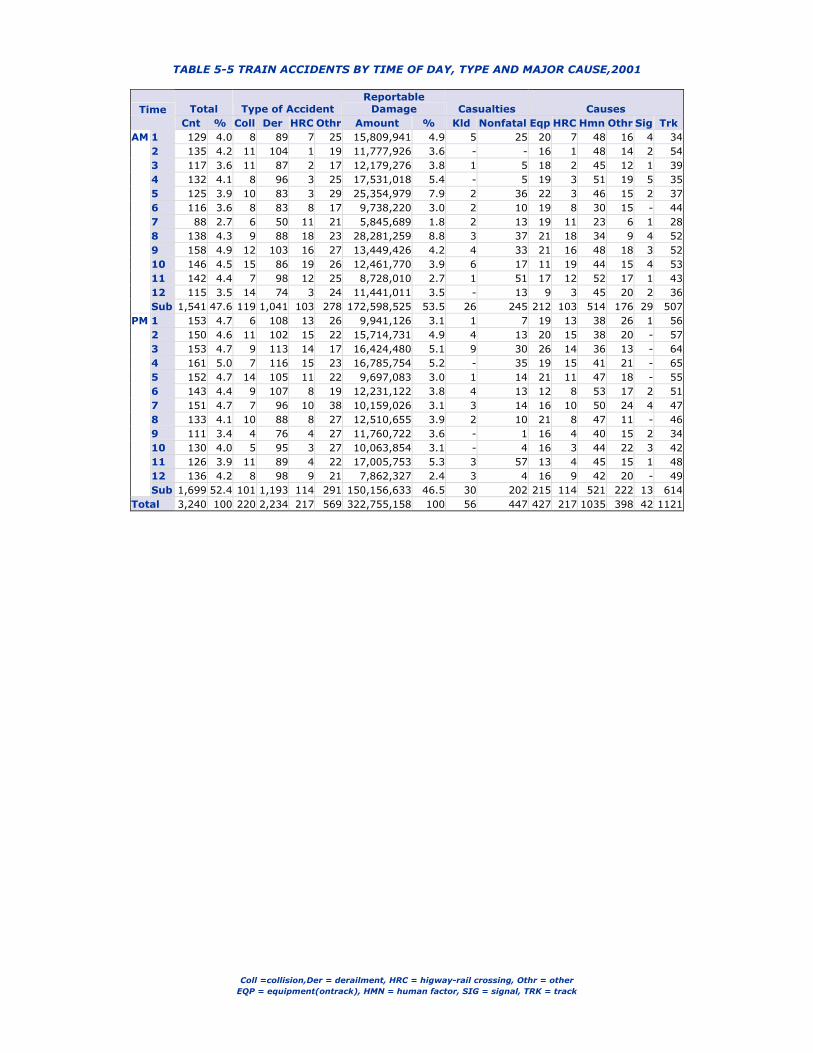
TABLE 5-5 TRAIN ACCIDENTS BY TIME OF DAY, TYPE AND MAJOR CAUSE,2001
Coll =collision,Der = derailment, HRC = higway-rail crossing, Othr = other EQP = equipment(ontrack), HMN = human factor, SIG = signal, TRK = track
Total Type of Accident Reportable
Damage Casualties CausesTimeCnt % Coll Der HRC Othr Amount % Kld Nonfatal Eqp HRC Hmn Othr Sig Trk
1 129 4.0 8 89 7 25 15,809,941 4.9 5 25 20 7 48 16 4 342 135 4.2 11 104 1 19 11,777,926 3.6 - - 16 1 48 14 2 543 117 3.6 11 87 2 17 12,179,276 3.8 1 5 18 2 45 12 1 394 132 4.1 8 96 3 25 17,531,018 5.4 - 5 19 3 51 19 5 355 125 3.9 10 83 3 29 25,354,979 7.9 2 36 22 3 46 15 2 376 116 3.6 8 83 8 17 9,738,220 3.0 2 10 19 8 30 15 - 447 88 2.7 6 50 11 21 5,845,689 1.8 2 13 19 11 23 6 1 288 138 4.3 9 88 18 23 28,281,259 8.8 3 37 21 18 34 9 4 529 158 4.9 12 103 16 27 13,449,426 4.2 4 33 21 16 48 18 3 5210 146 4.5 15 86 19 26 12,461,770 3.9 6 17 11 19 44 15 4 5311 142 4.4 7 98 12 25 8,728,010 2.7 1 51 17 12 52 17 1 4312 115 3.5 14 74 3 24 11,441,011 3.5 - 13 9 3 45 20 2 36
AM
Sub 1,541 47.6 119 1,041 103 278 172,598,525 53.5 26 245 212 103 514 176 29 5071 153 4.7 6 108 13 26 9,941,126 3.1 1 7 19 13 38 26 1 562 150 4.6 11 102 15 22 15,714,731 4.9 4 13 20 15 38 20 - 573 153 4.7 9 113 14 17 16,424,480 5.1 9 30 26 14 36 13 - 644 161 5.0 7 116 15 23 16,785,754 5.2 - 35 19 15 41 21 - 655 152 4.7 14 105 11 22 9,697,083 3.0 1 14 21 11 47 18 - 556 143 4.4 9 107 8 19 12,231,122 3.8 4 13 12 8 53 17 2 517 151 4.7 7 96 10 38 10,159,026 3.1 3 14 16 10 50 24 4 478 133 4.1 10 88 8 27 12,510,655 3.9 2 10 21 8 47 11 - 469 111 3.4 4 76 4 27 11,760,722 3.6 - 1 16 4 40 15 2 3410 130 4.0 5 95 3 27 10,063,854 3.1 - 4 16 3 44 22 3 4211 126 3.9 11 89 4 22 17,005,753 5.3 3 57 13 4 45 15 1 4812 136 4.2 8 98 9 21 7,862,327 2.4 3 4 16 9 42 20 - 49
PM
Sub 1,699 52.4 101 1,193 114 291 150,156,633 46.5 30 202 215 114 521 222 13 614Total 3,240 100 220 2,234 217 569 322,755,158 100 56 447 427 217 1035 398 42 1121

TABLE 5-6 TRAIN ACCIDENTS BY TYPE AND MAJOR CAUSE, 2001
EQP = equipment(ontrack), HMN = human factor, SIG = signal, TRK = track, HRC =higway-rail crossing
TotalReportable
Damage Casualties CausesType Accident Cnt % Amount % Kld Nonfatal Eqp HRC Hmn Othr Sig Trk
Derailments 2,234 69.0 236,572,759 73.3 1 113 316 - 560 252 28 1,078Head on collision 9 0.3 5,710,837 1.8 3 11 - - 7 2 - -Rear end collision 34 1.0 17,079,701 5.3 1 65 1 - 30 2 - 1Side collision 117 3.6 17,945,607 5.6 - 65 1 - 102 12 - 2Raking collision 45 1.4 1,227,418 0.4 - 3 5 - 26 10 2 2Broken train coll. 15 0.5 621,336 0.2 - 1 1 - 9 5 - -Highway-rail Impact 217 6.7 8,289,748 2.6 50 137 - 217 - - - -Obstruction impact 74 2.3 4,125,647 1.3 1 5 9 - 14 47 1 3Explosion/detonation 2 0.1 16,948,000 5.3 - 16 - - - 1 - 1Fire/violent rupture 32 1.0 1,723,456 0.5 - 5 22 - - 10 - -Other impacts 320 9.9 8,415,810 2.6 - 22 18 - 242 40 11 9Other events 141 4.4 4,094,839 1.3 - 4 54 - 45 17 - 25Total 3,240 100 322,755,158 100 56 447 427 217 1,035 398 42 1,121

TABLE 5-7 TRAIN ACCIDENTS BY SUBCAUSE AND TYPE, 2001
EQP = equipment(ontrack), HMN = human factor, SIG = signal, TRK = track, HRC =higway-rail crossing
Total Type of Accident Reportable
Damage Casualties CausesCnt % Coll Der HRC Othr Amount % Kld Nonfatal
Brakes 35 1.1 2 24 - 9 1,395,066 0.4 - -Trailer/Container on Flatcar 1 0.0 - 1 - - 73,600 0.0 - -Body 30 0.9 2 23 - 5 2,521,297 0.8 - 1Coupler & Draft System 53 1.6 2 38 - 13 2,098,636 0.7 - -Truck Components 66 2.0 1 64 - 1 16,479,978 5.1 - 2Axles & Journal Bearings 64 2.0 - 60 - 4 15,639,089 4.8 - -Wheels 85 2.6 - 84 - 1 13,622,883 4.2 - -Locomotives 67 2.1 1 10 - 56 3,860,795 1.2 - 2Doors 10 0.3 - 7 - 3 774,170 0.2 - -Other Mechanical 16 0.5 - 5 - 11 502,957 0.2 - 2Brakes, Use of 127 3.9 20 41 - 66 5,198,425 1.6 - 4Employee Physical Condition 6 0.2 4 - - 2 1,445,481 0.4 - 30Flagging, Fixed, Hand & Radio 44 1.4 18 12 - 14 24,514,191 7.6 1 83General Switching Rules 333 10.3 58 143 - 132 12,774,422 4.0 - 12Main Track Authority 45 1.4 21 6 - 18 2,355,916 0.7 - 18Train Handling/Makeup 146 4.5 5 132 - 9 8,800,039 2.7 - 1Speed 75 2.3 18 31 - 26 5,277,634 1.6 - 12Switches, Use of 225 6.9 23 179 - 23 11,436,335 3.5 1 7Cab Signals 1 0.0 - 1 - - 153,268 0.0 - -Miscellaneous Human Factors 33 1.0 7 15 - 11 2,085,727 0.6 - 3Environmental Conditions 35 1.1 1 26 - 8 2,676,217 0.8 - 18Loading Procedures 51 1.6 4 44 - 3 4,674,601 1.4 - 1Highway-Rail Incidents 217 6.7 - - 217 - 8,289,748 2.6 50 137Unusual Operational Situations 183 5.6 15 102 - 66 13,058,350 4.0 1 8Other Miscellaneous Causes 129 4.0 11 80 - 38 35,015,017 10.8 2 42Signal Defects 42 1.3 2 28 - 12 1,360,955 0.4 - -Roadbed 45 1.4 - 43 - 2 15,023,573 4.7 - 3Track Geometry 445 13.7 2 439 - 4 35,866,007 11.1 - 5Rail, Joint Bar & Anchors 345 10.6 1 343 - 1 64,224,006 19.9 1 56Frogs, Switches, Appliances 251 7.7 2 242 - 7 10,258,579 3.2 - -Other Track Defects 35 1.1 - 11 - 24 1,298,196 0.4 - -Total 3,240 100 220 2,234 217 569 322,755,158 100.0 56 447

TABLE 5-8 TRAIN ACCIDENTS WITH CONTRIBUTING CAUSE, 2001
EQP = equipment(ontrack), HMN = human factor, SIG = signal, TRK = track, HRC =higway-rail crossing
Total Type of Accident Type of Track Contributing Cause
Cnt % Coll Der HRC Othr Main Yard Siding Industry OtherBrakes 2 0.4 1 1 - - 1 - - 1 -Body 2 0.4 - 2 - - 1 1 - - -Coupler & Draft System 2 0.4 - 2 - - 1 1 - - -Truck Components 11 2.4 - 11 - - 8 - 2 - 1Axles & Journal Bearings 4 0.9 - 4 - - 4 - - - -Wheels 19 4.1 - 19 - - 6 9 - 4 -Locomotives 2 0.4 - 1 - 1 1 - 1 - -Doors 3 0.6 - 2 - 1 2 - - 1 -Other Mechanical 2 0.4 - 1 - 1 1 - - 1 -Brakes, Use of 7 1.5 - 2 - 5 - 5 1 1 -Employee Physical Condition 4 0.9 2 2 - - 2 1 - 1 -Flagging, Fixed, Hand & Radio 11 2.4 5 5 - 1 3 2 2 4 -General Switching Rules 56 12.0 10 23 - 23 7 39 4 6 -Main Track Authority 11 2.4 6 1 - 4 3 5 - 3 -Train Handling/Makeup 27 5.8 2 24 - 1 11 12 1 1 2Speed 23 4.9 2 12 1 8 12 7 1 3 -Switches, Use of 31 6.7 - 25 - 6 8 17 1 4 1Miscellaneous Human Factors 8 1.7 3 3 1 1 3 5 - - -Environmental Conditions 17 3.6 1 13 - 3 6 9 1 1 -Loading Procedures 11 2.4 1 10 - - 7 3 - 1 -Highway-Rail Incidents 18 3.9 - - 18 - 18 - - - -Unusual Operational Situations 13 2.8 - 9 1 3 6 5 - 2 -Other Miscellaneous Causes 19 4.1 2 13 - 4 7 3 - 9 -Signal Defects 2 0.4 - 1 - 1 1 1 - - -Roadbed 21 4.5 - 21 - - 5 10 3 3 -Track Geometry 71 15.2 - 69 - 2 36 25 2 8 -Rail, Joint Bar & Anchors 34 7.3 - 33 - 1 15 8 2 8 1Frogs, Switches, Appliances 31 6.7 - 30 - 1 9 19 - 3 -Other Track Defects 4 0.9 - 1 - 3 4 - - - -Total 466 100 35 340 21 70 188 187 21 65 5
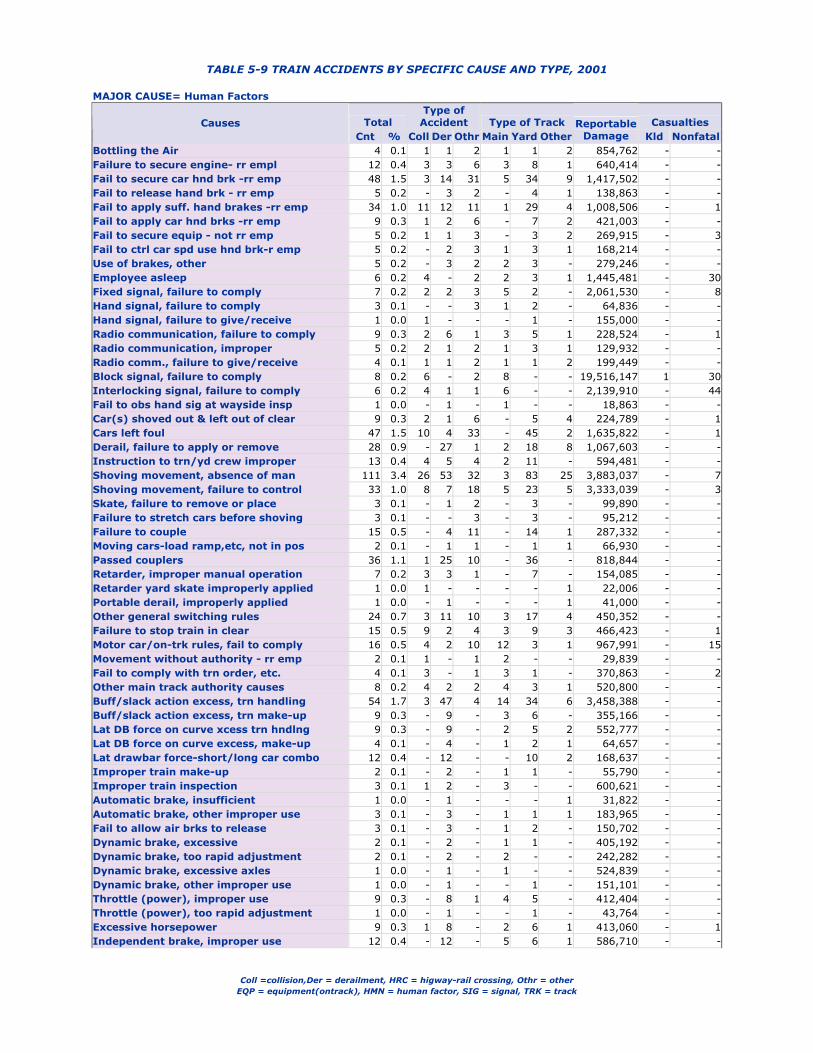
TABLE 5-9 TRAIN ACCIDENTS BY SPECIFIC CAUSE AND TYPE, 2001
Coll =collision,Der = derailment, HRC = higway-rail crossing, Othr = other EQP = equipment(ontrack), HMN = human factor, SIG = signal, TRK = track
MAJOR CAUSE= Human Factors
TotalType of
Accident Type of Track Casualties CausesCnt % Coll Der Othr Main Yard Other
ReportableDamage Kld Nonfatal
Bottling the Air 4 0.1 1 1 2 1 1 2 854,762 - -Failure to secure engine- rr empl 12 0.4 3 3 6 3 8 1 640,414 - -Fail to secure car hnd brk -rr emp 48 1.5 3 14 31 5 34 9 1,417,502 - -Fail to release hand brk - rr emp 5 0.2 - 3 2 - 4 1 138,863 - -Fail to apply suff. hand brakes -rr emp 34 1.0 11 12 11 1 29 4 1,008,506 - 1Fail to apply car hnd brks -rr emp 9 0.3 1 2 6 - 7 2 421,003 - -Fail to secure equip - not rr emp 5 0.2 1 1 3 - 3 2 269,915 - 3Fail to ctrl car spd use hnd brk-r emp 5 0.2 - 2 3 1 3 1 168,214 - -Use of brakes, other 5 0.2 - 3 2 2 3 - 279,246 - -Employee asleep 6 0.2 4 - 2 2 3 1 1,445,481 - 30Fixed signal, failure to comply 7 0.2 2 2 3 5 2 - 2,061,530 - 8Hand signal, failure to comply 3 0.1 - - 3 1 2 - 64,836 - -Hand signal, failure to give/receive 1 0.0 1 - - - 1 - 155,000 - -Radio communication, failure to comply 9 0.3 2 6 1 3 5 1 228,524 - 1Radio communication, improper 5 0.2 2 1 2 1 3 1 129,932 - -Radio comm., failure to give/receive 4 0.1 1 1 2 1 1 2 199,449 - -Block signal, failure to comply 8 0.2 6 - 2 8 - - 19,516,147 1 30Interlocking signal, failure to comply 6 0.2 4 1 1 6 - - 2,139,910 - 44Fail to obs hand sig at wayside insp 1 0.0 - 1 - 1 - - 18,863 - -Car(s) shoved out & left out of clear 9 0.3 2 1 6 - 5 4 224,789 - 1Cars left foul 47 1.5 10 4 33 - 45 2 1,635,822 - 1Derail, failure to apply or remove 28 0.9 - 27 1 2 18 8 1,067,603 - -Instruction to trn/yd crew improper 13 0.4 4 5 4 2 11 - 594,481 - -Shoving movement, absence of man 111 3.4 26 53 32 3 83 25 3,883,037 - 7Shoving movement, failure to control 33 1.0 8 7 18 5 23 5 3,333,039 - 3Skate, failure to remove or place 3 0.1 - 1 2 - 3 - 99,890 - -Failure to stretch cars before shoving 3 0.1 - - 3 - 3 - 95,212 - -Failure to couple 15 0.5 - 4 11 - 14 1 287,332 - -Moving cars-load ramp,etc, not in pos 2 0.1 - 1 1 - 1 1 66,930 - -Passed couplers 36 1.1 1 25 10 - 36 - 818,844 - -Retarder, improper manual operation 7 0.2 3 3 1 - 7 - 154,085 - -Retarder yard skate improperly applied 1 0.0 1 - - - - 1 22,006 - -Portable derail, improperly applied 1 0.0 - 1 - - - 1 41,000 - -Other general switching rules 24 0.7 3 11 10 3 17 4 450,352 - -Failure to stop train in clear 15 0.5 9 2 4 3 9 3 466,423 - 1Motor car/on-trk rules, fail to comply 16 0.5 4 2 10 12 3 1 967,991 - 15Movement without authority - rr emp 2 0.1 1 - 1 2 - - 29,839 - -Fail to comply with trn order, etc. 4 0.1 3 - 1 3 1 - 370,863 - 2Other main track authority causes 8 0.2 4 2 2 4 3 1 520,800 - -Buff/slack action excess, trn handling 54 1.7 3 47 4 14 34 6 3,458,388 - -Buff/slack action excess, trn make-up 9 0.3 - 9 - 3 6 - 355,166 - -Lat DB force on curve xcess trn hndlng 9 0.3 - 9 - 2 5 2 552,777 - -Lat DB force on curve excess, make-up 4 0.1 - 4 - 1 2 1 64,657 - -Lat drawbar force-short/long car combo 12 0.4 - 12 - - 10 2 168,637 - -Improper train make-up 2 0.1 - 2 - 1 1 - 55,790 - -Improper train inspection 3 0.1 1 2 - 3 - - 600,621 - -Automatic brake, insufficient 1 0.0 - 1 - - - 1 31,822 - -Automatic brake, other improper use 3 0.1 - 3 - 1 1 1 183,965 - -Fail to allow air brks to release 3 0.1 - 3 - 1 2 - 150,702 - -Dynamic brake, excessive 2 0.1 - 2 - 1 1 - 405,192 - -Dynamic brake, too rapid adjustment 2 0.1 - 2 - 2 - - 242,282 - -Dynamic brake, excessive axles 1 0.0 - 1 - 1 - - 524,839 - -Dynamic brake, other improper use 1 0.0 - 1 - - 1 - 151,101 - -Throttle (power), improper use 9 0.3 - 8 1 4 5 - 412,404 - -Throttle (power), too rapid adjustment 1 0.0 - 1 - - 1 - 43,764 - -Excessive horsepower 9 0.3 1 8 - 2 6 1 413,060 - 1Independent brake, improper use 12 0.4 - 12 - 5 6 1 586,710 - -

TABLE 5-9 TRAIN ACCIDENTS BY SPECIFIC CAUSE AND TYPE, 2001
Coll =collision,Der = derailment, HRC = higway-rail crossing, Othr = other EQP = equipment(ontrack), HMN = human factor, SIG = signal, TRK = track
MAJOR CAUSE= Human Factors
TotalType of
Accident Type of Track Casualties CausesCnt % Coll Der Othr Main Yard Other
ReportableDamage Kld Nonfatal
Failure to actuate off independent brk 2 0.1 - 2 - 2 - - 263,242 - -Other train handling/makeup 7 0.2 - 3 4 1 5 1 134,920 - -Coupling speed excessive 29 0.9 3 12 14 6 21 2 825,103 - 3Switch movement, excessive speed 6 0.2 1 4 1 2 4 - 227,799 - -Train inside yard limits, excess speed 5 0.2 1 2 2 3 2 - 275,738 - 1Train outside yd limits, excess speed 1 0.0 - 1 - 1 - - 15,345 - -Failure to comply with restricted speed 24 0.7 9 6 9 12 11 1 2,863,541 - 8Train outside yd limits(nonblk),exc spd 2 0.1 - 2 - 2 - - 198,007 - -Speed, other 8 0.2 4 4 - 3 4 1 872,101 - -Spring Swtch not clear before reverse 2 0.1 - 2 - 1 1 - 98,710 - -Switch improperly lined 156 4.8 23 113 20 19 116 21 9,018,500 1 7Switch not latched or locked 25 0.8 - 25 - 3 20 2 863,824 - -Switch previously run through 37 1.1 - 34 3 3 30 4 1,384,087 - -Use of switches, other 5 0.2 - 5 - 1 3 1 71,214 - -Automatic cab signal, fail to comply 1 0.0 - 1 - - 1 - 153,268 - -Tampering - safety/protective device 1 0.0 - - 1 - - 1 27,900 - -Human factors - track 9 0.3 1 7 1 5 2 2 729,061 - -Human factors - signal 1 0.0 - 1 - - 1 - 18,371 - -Human factors -motive power & equipment 6 0.2 3 - 3 3 2 1 220,234 - 3Other train operation/human factors 16 0.5 3 7 6 6 9 1 1,090,161 - -Total 1,035 31.9 174 560 301 194 704 137 74,041,438 2 170
MAJOR CAUSE= Signal Defects
TotalType of
Accident Type of Track Casualties CausesCnt % Coll Der Othr Main Yard Other
ReportableDamage Kld Nonfatal
Block signal displayed false proceed 1 0.0 1 - - - 1 - 10,000 - -Classyard autocontrol sys switch fail 6 0.2 - 5 1 - 6 - 172,386 - -Class yd auto ctrl sys retarder fail 21 0.6 - 12 9 - 21 - 460,269 - -Power device interlocking failure 1 0.0 1 - - - - 1 163,581 - -Power switch failure 5 0.2 - 5 - - 4 1 211,511 - -Other communication equipment failure 1 0.0 - - 1 - 1 - 9,084 - -Other signal failures 7 0.2 - 6 1 - 7 - 334,124 - -Total 42 1.3 2 28 12 - 40 2 1,360,955 - -
MAJOR CAUSE= Track Defects
TotalType of
Accident Type of Track Casualties CausesCnt % Coll Der Othr Main Yard Other
Reportable Damage Kld Nonfatal
Roadbed settled or soft 29 0.9 - 29 - 9 14 6 3,959,780 - -Washout/rain/slide/etc. dmg -track 10 0.3 - 9 1 8 2 - 10,736,038 - 3Other roadbed defects 6 0.2 - 5 1 2 3 1 327,755 - -Cross level of track irregular(joints) 26 0.8 - 26 - 10 10 6 2,909,685 - 2Cross level track irreg.(not at joints) 39 1.2 1 38 - 23 12 4 3,363,506 - -Deviate frm uniform top of rail profile 2 0.1 - 2 - 1 1 - 29,000 - -Superelevation improper, excessive,etc. 4 0.1 - 4 - 2 1 1 1,606,448 - -Superelevation runoff improper 1 0.0 - 1 - 1 - - 468,567 - -Trk alignmnt irreg-not buckled/sunkink 23 0.7 1 20 2 15 7 1 1,627,447 - -Track alignment irreg(buckled/sunkink) 44 1.4 - 44 - 39 3 2 9,392,793 - -Wide gage(defective/missing crossties) 231 7.1 - 231 - 45 125 61 9,080,186 - 1Wide gage(spikes/other rail fasteners) 33 1.0 - 31 2 9 16 8 4,208,209 - 1Wide gage(loose,broke, etc, gage rods) 6 0.2 - 6 - - 4 2 1,015,450 - -Wide gage (due to worn rails) 21 0.6 - 21 - 4 9 8 933,534 - -

TABLE 5-9 TRAIN ACCIDENTS BY SPECIFIC CAUSE AND TYPE, 2001
Coll =collision,Der = derailment, HRC = higway-rail crossing, Othr = other EQP = equipment(ontrack), HMN = human factor, SIG = signal, TRK = track
MAJOR CAUSE= Track Defects
TotalType of
Accident Type of Track Casualties CausesCnt % Coll Der Othr Main Yard Other
Reportable Damage Kld Nonfatal
Other track geometry defects 15 0.5 - 15 - 6 8 1 1,231,182 - 1Bolt hole crack or break 11 0.3 - 11 - 4 6 1 5,877,329 - -Broken base of rail 36 1.1 - 36 - 11 16 9 4,269,293 - -Broken weld (plant) 2 0.1 - 2 - 2 - - 81,650 - -Broken weld (field) 6 0.2 - 6 - 4 1 1 1,076,745 - -Defective or missing crossties 17 0.5 - 17 - 3 13 1 1,177,867 - -Defect/missing spike-oth rail fastener 2 0.1 - 2 - 1 1 - 524,330 - -Detail fracture - shelling/head check 44 1.4 - 44 - 25 15 4 11,033,546 - -Head and web sep(outside jt bar limit) 28 0.9 - 28 - 11 14 3 2,901,133 - -Head & web separation-in jt bar limit 3 0.1 - 3 - 2 1 - 3,790,299 - -Horizontal split head 14 0.4 - 14 - 5 8 1 2,454,670 - 2Joint bar broken (compromise) 2 0.1 - 2 - 2 - - 423,567 - -Joint bar broken (insulated) 2 0.1 - 2 - 2 - - 1,191,664 - 2Joint bar broken (noninsulated) 7 0.2 - 7 - 3 3 1 1,258,523 - -Joint bolts, broken, or missing 3 0.1 - 3 - 1 - 2 21,382 - -Mismatched rail-head contour 9 0.3 - 9 - 1 7 1 747,721 - -Transverse/compound fissure 79 2.4 1 78 - 36 31 12 17,455,483 1 52Vertical split head 56 1.7 - 56 - 23 25 8 6,870,521 - -Worn rail 12 0.4 - 12 - 4 4 4 759,972 - -Other rail and joint bar defects 12 0.4 - 11 1 2 7 3 2,308,311 - -Derail, defective 3 0.1 - 3 - 1 1 1 79,036 - -Guard rail loose/broken or mislocated 4 0.1 - 4 - 2 2 - 103,678 - -Retarder worn, broken, malfunctioning 10 0.3 2 3 5 - 10 - 328,528 - -Spring/power swtch mech. malfunction 5 0.2 - 4 1 2 3 - 296,859 - -Stock rail worn, broken, disconnected 7 0.2 - 7 - 1 6 - 272,711 - -Switch (hand op) stand mechanism defect 10 0.3 - 10 - 1 7 2 332,937 - -Swtch connect/operate rod broke/defect 4 0.1 - 4 - - 2 2 109,169 - -Switch damaged or out of adjustment 33 1.0 - 32 1 5 23 5 1,474,968 - -Switch lug/crank broken 2 0.1 - 2 - 1 - 1 106,750 - -Switch out of adj. insuff. anchoring 3 0.1 - 3 - - 2 1 45,081 - -Switch point worn or broken 101 3.1 - 101 - 17 69 15 4,153,739 - -Switch rod worn, bent, broken, etc. 4 0.1 - 4 - 3 1 - 143,232 - -Turnout frog (rigid) worn, or broken 4 0.1 - 4 - 1 3 - 85,907 - -Turnout frog(self guarded)-worn/broken 1 0.0 - 1 - - 1 - 9,151 - -Turnout frog (spring) worn, or broken 3 0.1 - 3 - 1 1 1 99,445 - -Switch pt gap(btwn swt pt & stock rail) 42 1.3 - 42 - 3 29 10 1,694,150 - -Oth frog, switch, trk appliance defect 15 0.5 - 15 - 2 9 4 923,238 - -Bridge misalignment or failure 3 0.1 - 3 - 3 - - 185,604 - -Flangeway clogged 3 0.1 - 3 - - - 3 47,666 - -Engineering design or construction 2 0.1 - 2 - - 1 1 87,117 - -Other way and structure defect 27 0.8 - 3 24 24 2 1 977,809 - -Total 1,121 34.6 5 1,078 38 383 539 199 126,670,361 1 64
MAJOR CAUSE= Mechanical/Electrical
TotalType of
Accident Type of Track Casualties CausesCnt % Coll Der Othr Main Yard Other
ReportableDamage Kld Nonfatal
Air hose uncoupled or burst 2 0.1 - 2 - 1 1 - 84,396 - -Oth brk component dmg,worn,broke,etc. 3 0.1 - 2 1 1 1 1 83,816 - -Brk valve malf. (undesired emergency) 1 0.0 - - 1 1 - - 7,000 - -Brake valve malf. (stuck brake, etc.) 7 0.2 - 6 1 5 1 1 345,641 - -Brk valve malf.(stuck brk, etc.)-loco 1 0.0 1 - - - 1 - 150,098 - -Rigging down or dragging 10 0.3 - 9 1 5 5 - 452,777 - -Hand brk broken or defective 3 0.1 - 1 2 - 2 1 65,070 - -Other brake defects, cars 5 0.2 1 2 2 2 2 1 136,512 - -
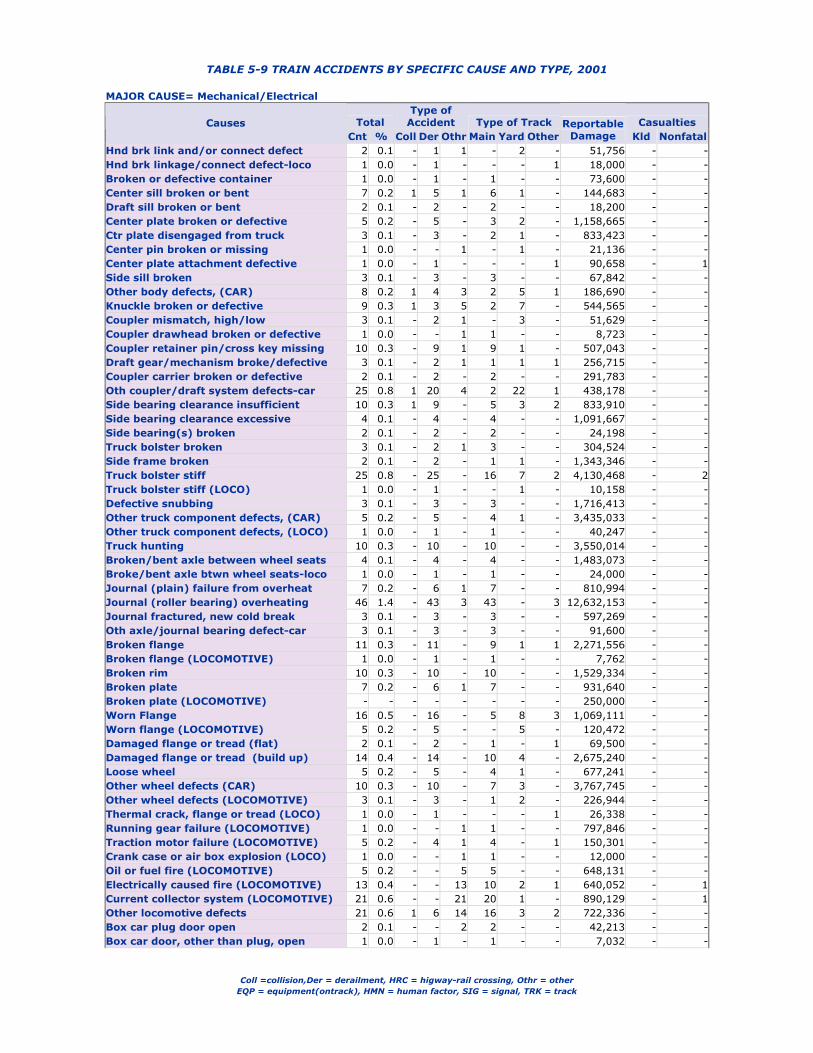
TABLE 5-9 TRAIN ACCIDENTS BY SPECIFIC CAUSE AND TYPE, 2001
Coll =collision,Der = derailment, HRC = higway-rail crossing, Othr = other EQP = equipment(ontrack), HMN = human factor, SIG = signal, TRK = track
MAJOR CAUSE= Mechanical/Electrical
TotalType of
Accident Type of Track Casualties CausesCnt % Coll Der Othr Main Yard Other
ReportableDamage Kld Nonfatal
Hnd brk link and/or connect defect 2 0.1 - 1 1 - 2 - 51,756 - -Hnd brk linkage/connect defect-loco 1 0.0 - 1 - - - 1 18,000 - -Broken or defective container 1 0.0 - 1 - 1 - - 73,600 - -Center sill broken or bent 7 0.2 1 5 1 6 1 - 144,683 - -Draft sill broken or bent 2 0.1 - 2 - 2 - - 18,200 - -Center plate broken or defective 5 0.2 - 5 - 3 2 - 1,158,665 - -Ctr plate disengaged from truck 3 0.1 - 3 - 2 1 - 833,423 - -Center pin broken or missing 1 0.0 - - 1 - 1 - 21,136 - -Center plate attachment defective 1 0.0 - 1 - - - 1 90,658 - 1Side sill broken 3 0.1 - 3 - 3 - - 67,842 - -Other body defects, (CAR) 8 0.2 1 4 3 2 5 1 186,690 - -Knuckle broken or defective 9 0.3 1 3 5 2 7 - 544,565 - -Coupler mismatch, high/low 3 0.1 - 2 1 - 3 - 51,629 - -Coupler drawhead broken or defective 1 0.0 - - 1 1 - - 8,723 - -Coupler retainer pin/cross key missing 10 0.3 - 9 1 9 1 - 507,043 - -Draft gear/mechanism broke/defective 3 0.1 - 2 1 1 1 1 256,715 - -Coupler carrier broken or defective 2 0.1 - 2 - 2 - - 291,783 - -Oth coupler/draft system defects-car 25 0.8 1 20 4 2 22 1 438,178 - -Side bearing clearance insufficient 10 0.3 1 9 - 5 3 2 833,910 - -Side bearing clearance excessive 4 0.1 - 4 - 4 - - 1,091,667 - -Side bearing(s) broken 2 0.1 - 2 - 2 - - 24,198 - -Truck bolster broken 3 0.1 - 2 1 3 - - 304,524 - -Side frame broken 2 0.1 - 2 - 1 1 - 1,343,346 - -Truck bolster stiff 25 0.8 - 25 - 16 7 2 4,130,468 - 2Truck bolster stiff (LOCO) 1 0.0 - 1 - - 1 - 10,158 - -Defective snubbing 3 0.1 - 3 - 3 - - 1,716,413 - -Other truck component defects, (CAR) 5 0.2 - 5 - 4 1 - 3,435,033 - -Other truck component defects, (LOCO) 1 0.0 - 1 - 1 - - 40,247 - -Truck hunting 10 0.3 - 10 - 10 - - 3,550,014 - -Broken/bent axle between wheel seats 4 0.1 - 4 - 4 - - 1,483,073 - -Broke/bent axle btwn wheel seats-loco 1 0.0 - 1 - 1 - - 24,000 - -Journal (plain) failure from overheat 7 0.2 - 6 1 7 - - 810,994 - -Journal (roller bearing) overheating 46 1.4 - 43 3 43 - 3 12,632,153 - -Journal fractured, new cold break 3 0.1 - 3 - 3 - - 597,269 - -Oth axle/journal bearing defect-car 3 0.1 - 3 - 3 - - 91,600 - -Broken flange 11 0.3 - 11 - 9 1 1 2,271,556 - -Broken flange (LOCOMOTIVE) 1 0.0 - 1 - 1 - - 7,762 - -Broken rim 10 0.3 - 10 - 10 - - 1,529,334 - -Broken plate 7 0.2 - 6 1 7 - - 931,640 - -Broken plate (LOCOMOTIVE) - - - - - - - - 250,000 - -Worn Flange 16 0.5 - 16 - 5 8 3 1,069,111 - -Worn flange (LOCOMOTIVE) 5 0.2 - 5 - - 5 - 120,472 - -Damaged flange or tread (flat) 2 0.1 - 2 - 1 - 1 69,500 - -Damaged flange or tread (build up) 14 0.4 - 14 - 10 4 - 2,675,240 - -Loose wheel 5 0.2 - 5 - 4 1 - 677,241 - -Other wheel defects (CAR) 10 0.3 - 10 - 7 3 - 3,767,745 - -Other wheel defects (LOCOMOTIVE) 3 0.1 - 3 - 1 2 - 226,944 - -Thermal crack, flange or tread (LOCO) 1 0.0 - 1 - - - 1 26,338 - -Running gear failure (LOCOMOTIVE) 1 0.0 - - 1 1 - - 797,846 - -Traction motor failure (LOCOMOTIVE) 5 0.2 - 4 1 4 - 1 150,301 - -Crank case or air box explosion (LOCO) 1 0.0 - - 1 1 - - 12,000 - -Oil or fuel fire (LOCOMOTIVE) 5 0.2 - - 5 5 - - 648,131 - -Electrically caused fire (LOCOMOTIVE) 13 0.4 - - 13 10 2 1 640,052 - 1Current collector system (LOCOMOTIVE) 21 0.6 - - 21 20 1 - 890,129 - 1Other locomotive defects 21 0.6 1 6 14 16 3 2 722,336 - -Box car plug door open 2 0.1 - - 2 2 - - 42,213 - -Box car door, other than plug, open 1 0.0 - 1 - 1 - - 7,032 - -

TABLE 5-9 TRAIN ACCIDENTS BY SPECIFIC CAUSE AND TYPE, 2001
Coll =collision,Der = derailment, HRC = higway-rail crossing, Othr = other EQP = equipment(ontrack), HMN = human factor, SIG = signal, TRK = track
MAJOR CAUSE= Mechanical/Electrical
TotalType of
Accident Type of Track Casualties CausesCnt % Coll Der Othr Main Yard Other
ReportableDamage Kld Nonfatal
Bottom outlet car door open 5 0.2 - 4 1 3 1 1 685,702 - -Bottom outlet door attachment defect 2 0.1 - 2 - 1 1 - 39,223 - -Other mechanical/electrical failures 10 0.3 - 3 7 9 1 - 326,667 - 2Other mechanical/electrical fail(LOCO) 6 0.2 - 2 4 6 - - 176,290 - -Total 427 13.2 8 316 103 295 105 27 56,968,471 - 7
MAJOR CAUSE= Miscellaneous Total Type of Accident Type of Track Casualties
CausesCnt % Coll Der HRC Othr Main Yard Other
ReportableDamage Kld Nonfatal
Snow,ice,mud,gravel,coal,etc. on trk 21 0.6 - 19 - 2 9 6 6 828,043 - 2Extreme environmental - TORNADO 4 0.1 - 1 - 3 2 2 - 306,259 - -Extreme environmental - FLOOD 1 0.0 - 1 - - 1 - - 214,131 - 16Extreme wind velocity 5 0.2 - 4 - 1 5 - - 1,228,246 - -Other extreme environmental conditions 4 0.1 1 1 - 2 2 2 - 99,538 - -Load shifted 10 0.3 - 10 - - 4 3 3 1,220,020 - -Load fell from car 1 0.0 - 1 - - 1 - - 47,427 - -Overloaded car 5 0.2 - 5 - - 2 2 1 246,817 - -Improperly loaded car 23 0.7 3 19 - 1 11 4 8 889,649 - -Improperly loaded contain/trail on car 5 0.2 1 4 - - 3 1 1 1,973,610 - -Miscellaneous loading procedures 7 0.2 - 5 - 2 4 1 2 297,078 - 1Hwy user impairment-drug/alcohol use 2 0.1 - - 2 - 2 - - 28,999 - 2Highway user inattentiveness 92 2.8 - - 92 - 90 - 2 4,673,196 28 60Hwy user misjudgement 23 0.7 - - 23 - 23 - - 1,042,550 5 7Highway user cited for violation 19 0.6 - - 19 - 19 - - 537,761 2 16Highway user unable to stop, weather 1 0.0 - - 1 - 1 - - 11,379 - 1Malf.,improper op. of trn act. warning 1 0.0 - - 1 - 1 - - 21,116 2 3Other causes (highway-rail collisions) 79 2.4 - - 79 - 77 1 1 1,974,747 13 48Emergency brke appl. to avoid accident 4 0.1 - 4 - - 3 - 1 405,867 - -Object/equipment (mtr veh) on track 15 0.5 - 1 - 14 13 1 1 270,523 1 -Livestock on track 2 0.1 - - - 2 2 - - 28,571 - -Obj/equip on/fouling track, other 27 0.8 2 7 - 18 15 10 2 2,041,211 - 2Harmonic rock off, etc. 72 2.2 1 69 - 2 21 44 7 7,010,745 - -Fire, other than vandalism 8 0.2 - - - 8 8 - - 388,765 - 1Auto hump retarder failed to slow car 33 1.0 9 10 - 14 - 33 - 792,115 - -Yard skate slid and failed to stop car 18 0.6 3 7 - 8 - 18 - 385,072 - -Lading chains/straps fouling switches 4 0.1 - 4 - - 2 2 - 1,735,481 - 5Interference(not vandals)with RR op. 16 0.5 1 11 - 4 3 3 10 18,856,145 - 36Vandalism of on-track equipment 19 0.6 2 11 - 6 7 9 3 778,443 - -Vandalism of track or track appliances 36 1.1 1 26 - 9 16 18 2 3,268,906 - 1Fail by non-rr empto control spd of car 14 0.4 1 8 - 5 - 1 13 209,008 - 1Cause under investigation 5 0.2 1 3 - 1 3 2 - 7,348,041 2 2Other miscellaneous causes 39 1.2 5 21 - 13 16 19 4 4,554,474 - 2Total 615 19.0 31 252 217 115 366 182 67 63,713,933 53 206

TABLE 5-10 TRAIN ACCIDENTS BY TYPE TRACK AND CLASS, 2001
Coll =collision,Der = derailment, HRC = higway-rail crossing, Othr = other EQP = equipment(ontrack), HMN = human factor, SIG = signal, TRK = track
Total Type of Accident Reportable
Damage Casualties CausesTrack & Class Cnt % Coll Der HRC Othr Amount Kld Nonfatal Eqp HRC Hmn Othr Sig Trk
1 184 5.7 11 148 3 22 14,101,607 1 7 20 3 48 25 - 882 201 6.2 7 169 8 17 27,151,550 2 8 38 8 34 24 - 973 231 7.1 12 147 33 39 57,197,112 3 51 59 33 33 35 - 714 449 13.9 19 208 132 90 96,477,391 31 260 127 132 61 48 - 815 115 3.5 7 52 35 21 48,072,987 19 76 39 35 14 15 - 126 11 0.3 2 - - 9 144,507 - - 5 - - 1 - 5? 16 0.5 - 4 - 12 751,586 - - 7 - 1 2 - 6X 31 1.0 - 29 2 - 2,061,038 - 5 - 2 3 3 - 23
Main
-Sub 1,238 38.2 58 757 213 210 245,957,778 56 407 295 213 194 153 - 3831 1,412 43.6 129 1,017 - 266 49,496,747 - 22 94 - 641 162 34 4812 106 3.3 9 64 - 33 3,509,651 - 7 8 - 43 17 6 323 6 0.2 - 5 - 1 163,654 - - - - 3 - - 34 5 0.2 - 4 1 - 90,059 - - 1 1 2 - - 16 1 0.0 - 1 - - 26,000 - - - - - - - 1? 1 0.0 - 1 - - 27,000 - - - - - - - 1X 39 1.2 4 31 - 4 1,053,379 - - 2 - 15 2 - 20
Yard
-Sub 1,570 48.5 142 1,123 1 304 54,366,490 - 29 105 1 704 181 40 5391 66 2.0 2 57 - 7 3,517,286 - - 2 - 23 3 - 382 20 0.6 1 16 - 3 1,209,153 - 1 4 - 7 5 - 43 13 0.4 1 10 - 2 1,576,015 - - 4 - 5 2 - 24 3 0.1 - 3 - - 1,212,414 - 1 1 - - - 1 15 1 0.0 - 1 - - 126,620 - - 1 - - - - -X 8 0.2 1 7 - - 394,096 - - - - 2 1 - 5
Siding
-Sub 111 3.4 5 94 - 12 8,035,584 - 2 12 - 37 11 1 501 242 7.5 11 195 1 35 8,156,800 - 6 9 1 76 41 1 1142 15 0.5 3 9 1 2 746,968 - - 2 1 4 5 - 33 1 0.0 - 1 - - 23,860 - - - - - - - 1X 35 1.1 1 30 - 4 1,149,562 - 1 1 - 11 7 - 16
Industry
-Sub 293 9.0 15 235 2 41 10,077,190 - 7 12 2 91 53 1 134? 28 0.9 - 25 1 2 4,318,116 - 2 3 1 9 - - 15Other-Sub 28 0.9 - 25 1 2 4,318,116 - 2 3 1 9 - - 15
Total 3,240 100 220 2,234 217 569 322,755,158 56 447 427 217 1,035 398 42 1,121

TABLE 5-11 TRAIN ACCIDENTS BY TYPE TRACK AND CONSIST SPEED, 2001
Coll =collision,Der = derailment, HRC = higway-rail crossing, Othr = other EQP = equipment(ontrack), HMN = human factor, SIG = signal, TRK = track
Total Type of Accident Reportable
Damage Casualties CausesTrack - Spd RngCnt % Coll Der HRC Othr Amount Kld Nonfatal Eqp HRC Hmn Othr Sig Trk
? 29 0.9 - 4 2 23 18,500,631 2 21 13 2 1 10 - 31 - 9 249 7.7 10 209 3 27 14,467,330 - 12 36 3 79 20 - 11110-19 245 7.6 17 188 12 28 27,327,871 - 18 41 12 59 39 - 9420-29 177 5.5 11 129 21 16 35,728,242 3 36 47 21 23 17 - 6930-39 149 4.6 7 85 37 20 37,382,368 3 38 41 37 17 17 - 3740-49 183 5.6 7 82 63 31 59,061,425 13 101 58 63 11 12 - 3950-59 98 3.0 3 48 30 17 32,877,850 10 109 35 30 3 17 - 1360-69 52 1.6 1 11 18 22 11,839,336 3 24 12 18 - 13 - 9>= 70 56 1.7 2 1 27 26 8,772,725 22 48 12 27 1 8 - 8
Main
-Sub 1,238 38.2 58 757 213 210 245,957,778 56 407 295 213 194 153 - 383? 14 0.4 1 2 - 11 639,690 - - 3 - 4 6 - 11 - 9 1,376 42.5 125 996 - 255 44,744,039 - 22 92 - 617 143 35 48910-19 170 5.2 16 118 - 36 8,538,068 - 7 9 - 80 29 5 4720-29 7 0.2 - 5 1 1 128,501 - - 1 1 2 3 - -30-39 3 0.1 - 2 - 1 316,192 - - - - 1 - - 2
Yard
-Sub 1,570 48.5 142 1,123 1 304 54,366,490 - 29 105 1 704 181 40 539? 1 0.0 - - - 1 24,135 - - 1 - - - - -1 - 9 77 2.4 3 65 - 9 3,904,760 - - 3 - 30 5 - 3910-19 20 0.6 1 17 - 2 1,661,827 - 1 1 - 6 5 1 720-29 13 0.4 1 12 - - 2,444,862 - 1 7 - 1 1 - 4
Siding
-Sub 111 3.4 5 94 - 12 8,035,584 - 2 12 - 37 11 1 50? 3 0.1 - 1 - 2 44,192 - - - - 2 1 - -1 - 9 265 8.2 12 217 2 34 7,798,968 - 1 11 2 81 45 1 12510-19 23 0.7 2 16 - 5 946,667 - 4 1 - 6 7 - 930-39 1 0.0 1 - - - 760,413 - 2 - - 1 - - -40-49 1 0.0 - 1 - - 526,950 - - - - 1 - - -
Industry
-Sub 293 9.0 15 235 2 41 10,077,190 - 7 12 2 91 53 1 1341 - 9 23 0.7 - 21 - 2 1,364,209 - - 1 - 9 - - 1310-19 1 0.0 - 1 - - 34,408 - - - - - - - 140-49 3 0.1 - 3 - - 2,906,986 - - 2 - - - - 150-59 1 0.0 - - 1 - 12,513 - 2 - 1 - - - -
Other
-Sub 28 0.9 - 25 1 2 4,318,116 - 2 3 1 9 - - 15Total 3,240 100 220 2,234 217 569 322,755,158 56 447 427 217 1,035 398 42 1,121

TABLE 5-12 TRAIN ACCIDENTS BY WEATHER CONDITION, 2001
Coll =collision,Der = derailment, HRC = higway-rail crossing, Othr = other EQP = equipment(ontrack), HMN = human factor, SIG = signal, TRK = track
Total Type of Accident Reportable
Damage Casualties CausesConditions Cnt % Coll Der HRC Othr Amount Kld Nonfatal Eqp HRC Hmn Othr Sig Trk
Clear 75 2.3 7 49 3 16 5,133,633 - 2 18 3 26 8 - 20Cloudy 34 1.0 1 24 2 7 1,917,004 - 4 8 2 5 4 - 15Rain 6 0.2 - 6 - - 1,148,885 - - 1 - - - - 5Fog 5 0.2 1 3 - 1 2,674,330 - 1 1 - 2 - - 2Snow 1 0.0 - 1 - - 27,100 - - - - 1 - - -
Dawn
-- Sub 121 3.7 9 83 5 24 10,900,952 - 7 28 5 34 12 - 42Clear 1,202 37.1 79 808 122 193 106,055,111 30 196 161 122 335 145 8 431Cloudy 347 10.7 20 248 28 51 30,886,480 6 18 39 28 100 36 7 137Rain 66 2.0 2 47 5 12 9,604,640 2 5 4 5 21 6 - 30Fog 6 0.2 - 4 1 1 140,670 - 1 1 1 1 - - 3Sleet 1 0.0 - 1 - - 9,462 - - - - - - - 1Snow 26 0.8 3 15 4 4 3,430,123 - 42 4 4 8 5 - 5
Day
-- Sub 1,648 50.9 104 1,123 160 261 150,126,486 38 262 209 160 465 192 15 607Clear 88 2.7 8 55 9 16 5,977,064 3 11 10 9 35 8 2 24Cloudy 36 1.1 1 23 - 12 1,600,843 - 3 4 - 13 6 - 13Rain 10 0.3 1 7 - 2 416,854 - - - - 2 2 - 6Fog 3 0.1 - 3 - - 623,300 - - 1 - 1 - - 1Snow 1 0.0 - 1 - - 32,550 - - - - - - - 1
Dusk
-- Sub 138 4.3 10 89 9 30 8,650,611 3 14 15 9 51 16 2 45Clear 817 25.2 66 567 27 157 87,665,565 9 125 119 27 310 102 11 248Cloudy 332 10.2 18 245 8 61 37,219,005 5 13 35 8 113 44 7 125Rain 116 3.6 9 76 4 27 22,212,967 - 22 8 4 40 22 4 38Fog 40 1.2 3 26 4 7 3,745,520 1 4 9 4 13 5 1 8Sleet 1 0.0 - 1 - - 17,078 - - - - - 1 - -Snow 27 0.8 1 24 - 2 2,216,974 - - 4 - 9 4 2 8
Dark
-- Sub 1,333 41.1 97 939 43 254 153,077,109 15 164 175 43 485 178 25 427Total 3,240 100 220 2,234 217 569 322,755,158 56 447 427 217 1,035 398 42 1,121

TABLE 5-13 TRAIN ACCIDENTS BY CONSIST LENGTH, 2001
Coll =collision,Der = derailment, HRC = higway-rail crossing, Othr = other EQP = equipment(ontrack), HMN = human factor, SIG = signal, TRK = track
Counts are higher since multiple consists may be involved.
Consists Type of Accident Equipment
Damage CausesLength Cnt % Coll Der HRC Othr Amount % Eqp HRC Hmn Othr Sig Trk
??? 1 0.0 - 1 - - 3,495 0.0 1 - - - - -1 247 6.7 59 52 6 130 4,387,234 2.1 12 6 152 48 10 192-5 373 10.1 65 159 16 133 7,228,078 3.5 22 16 204 53 13 656-10 346 9.3 37 143 20 146 16,891,719 8.1 57 20 120 45 4 10011-15 211 5.7 25 127 14 45 4,173,034 2.0 17 14 89 19 2 7016-20 191 5.2 27 113 15 36 10,495,571 5.1 18 15 69 21 - 6821-25 154 4.2 19 99 5 31 9,875,242 4.8 6 5 75 18 3 4726-30 151 4.1 10 112 3 26 4,442,653 2.1 13 3 50 19 3 6331-35 133 3.6 11 94 7 21 4,835,623 2.3 12 7 54 16 1 4336-40 137 3.7 7 109 8 13 4,014,305 1.9 11 8 52 12 2 5241-45 119 3.2 14 86 4 15 2,946,231 1.4 8 4 50 14 4 3946-50 107 2.9 10 76 10 11 3,261,942 1.6 7 10 39 12 1 3851-60 195 5.3 13 145 16 21 7,531,917 3.6 17 16 64 20 - 7861-70 215 5.8 12 166 7 30 12,582,113 6.1 30 7 59 32 3 8471-80 190 5.1 19 137 13 21 12,822,550 6.2 25 13 57 30 2 6381-90 171 4.6 14 126 16 15 16,873,552 8.1 31 16 38 17 - 6991-100 183 4.9 24 135 9 15 14,744,298 7.1 38 9 62 20 2 52101-110 184 5.0 14 138 16 16 18,431,628 8.9 45 16 38 18 - 67111-120 177 4.8 12 137 16 12 21,968,416 10.6 32 16 42 17 1 69121-130 113 3.1 10 84 9 10 10,002,913 4.8 24 9 27 16 1 36131-140 67 1.8 6 52 5 4 16,609,430 8.0 13 5 12 6 - 31141-150 16 0.4 1 13 - 2 1,922,129 0.9 3 - 6 1 - 6>= 151 22 0.6 2 16 2 2 1,239,798 0.6 6 2 7 4 - 3Total 3,703 100 411 2,320 217 755 207,283,871 100.0 448 217 1,366 458 52 1,162

TABLE 5-14 TRAIN ACCIDENTS BY TYPE TRACK AND CONSIST, 2001
Coll =collision,Der = derailment, HRC = higway-rail crossing, Othr = other EQP = equipment(ontrack), HMN = human factor, SIG = signal, TRK = track
Counts are higher since multiple consists may be involved.
Consists Type of Accident Primary Cause Track - Equipment
Cnt %AvgLen. Coll Der HRC Othr Eqp HRC Hmn Othr Sig Trk
Freight Train 993 26.8 81 38 656 149 71 224 149 138 97 - 306Psgr Train 153 4.1 10 6 15 16 79 41 16 6 26 - 27Commuter Train 37 1.0 7 - 2 9 16 6 9 - 6 - 6Work Train 6 0.2 19 - 4 1 1 2 1 - 1 - 2Single Car 3 0.1 1 - - - - - - - - - -Cut of Cars 9 0.2 25 1 2 1 3 1 1 2 3 - -Yard/ Switch 49 1.3 43 2 29 1 5 5 1 9 3 - 19Light loco(s) 22 0.6 2 1 7 1 6 - 1 9 1 - 4Maint/ Insp car 51 1.4 1 8 6 5 13 5 5 20 2 - -
Main
-Sub total 1,323 35.7 64 56 721 183 194 284 183 184 139 - 364Freight Train 529 14.3 66 30 386 1 34 23 1 166 42 3 216Psgr Train 26 0.7 13 3 15 - 3 3 - 7 1 1 9Commuter Train 12 0.3 7 1 7 - 3 1 - 7 - - 3Work Train 10 0.3 41 - 7 - 1 - - 1 1 - 6Single Car 125 3.4 1 13 10 - 46 1 - 34 22 8 4Cut of Cars 155 4.2 18 20 30 - 44 5 - 60 20 5 4Yard/ Switch 933 25.2 37 62 570 - 141 61 - 354 86 21 251Light loco(s) 113 3.1 2 12 49 - 22 5 - 47 5 2 24Maint/ Insp car 5 0.1 1 - 1 - 4 1 - 4 - - -
Yard
-Sub total 1,908 51.5 39 141 1,075 1 298 100 1 680 177 40 517Freight Train 88 2.4 56 3 72 - 7 11 - 22 7 1 41Psgr Train 1 0.0 6 - - - 1 - - 1 - - -Work Train 2 0.1 42 - 2 - - - - - - - 2Single Car 1 0.0 1 - - - - - - - - - -Cut of Cars 7 0.2 19 1 3 - 1 - - 2 2 - 1Yard/ Switch 13 0.4 47 - 8 - 3 - - 8 - - 3Light loco(s) 5 0.1 2 - 3 - - - - 1 - - 2Maint/ Insp car 3 0.1 6 1 1 - - 1 - - 1 - -
Siding
-Sub total 120 3.2 48 5 89 - 12 12 - 34 10 1 49Freight Train 145 3.9 57 5 116 1 12 5 1 32 30 - 66Psgr Train 2 0.1 39 - 2 - - - - 1 - - 1Work Train 1 0.0 21 - 1 - - - - - - - 1Single Car 8 0.2 1 2 4 1 - - 1 2 3 - 1Cut of Cars 24 0.6 11 1 6 - 5 - - 7 4 - 1Yard/ Switch 131 3.5 30 6 96 - 21 5 - 40 16 1 61Light loco(s) 7 0.2 3 1 5 - 1 - - 5 - - 2Maint/ Insp car 3 0.1 1 - - - 2 1 - 1 - - -
Industry
-Sub total 321 8.7 39 15 230 2 41 11 2 88 53 1 133Freight Train 18 0.5 89 - 15 1 2 3 1 6 - - 8Cut of Cars 2 0.1 48 - - - - - - - - - -Yard/ Switch 9 0.2 50 - 8 - - - - 2 - - 6Light loco(s) 2 0.1 3 - 2 - - - - 1 - - 1
Other
-Sub total 31 0.8 69 - 25 1 2 3 1 9 - - 15Total 3,703 100 48 217 2,140 187 547 410 187 995 379 42 1,078

TABLE 5-15 TRAIN ACCIDENTS BY CONSIST LENGTH AND TYPE CONSIST,2001
Coll =collision,Der = derailment, HRC = higway-rail crossing, Othr = other EQP = equipment(ontrack), HMN = human factor, SIG = signal, TRK = track
Counts are higher since multiple consists may be involved.
Length FreightTrain
Psgr Train
CommuterTrain
WorkTrain
SingleCar
Cutof
CarsYard/Switch
Light loco(s)
Maint/Inspcar
??? - - - - - - - 1 -1 - 1 - - 137 - - 56 532-5 29 28 12 5 - 88 124 81 66-10 52 95 33 - - 35 118 11 211-15 56 32 4 - - 10 108 - 116-20 65 13 - - - 13 100 - -21-25 47 5 - 2 - 9 91 - -26-30 62 1 - 2 - 8 78 - -31-35 61 4 - 3 - 4 61 - -36-40 77 1 - 1 - 5 53 - -41-45 60 - - - - 3 56 - -46-50 54 - - 1 - 4 48 - -51-60 125 1 - 2 - 5 62 - -61-70 147 - - 2 - 2 64 - -71-80 146 - - 1 - 3 40 - -81-90 133 - - - - 1 37 - -91-100 150 - - - - 2 31 - -101-110 152 1 - - - 2 29 - -111-120 161 - - - - 1 15 - -121-130 98 - - - - 2 13 - -131-140 65 - - - - - 2 - -141-150 14 - - - - - 2 - ->= 151 19 - - - - - 3 - -Total 1,773 182 49 19 137 197 1,135 149 62

TABLE 5-16 INVOLVEMENT IN TRAIN ACCIDENTS BY TYPE CONSIST, 2001
If more than one consist of same type in accident, then only one is counted. For example, a collision between two freight
trains would be counted as one freight train.
Total Type of Accident Type of Track CausesType Equipment
Cnt % Coll Der HRC Othr Main Yard Siding Industry Other Eqp HRC Hmn Othr Sig TrkFreight Train 1,725 48.6 110 1,319 155 141 959 517 87 144 18 278 155 423 189 4 676Psgr Train 180 5.1 13 36 40 91 152 25 1 2 - 45 40 20 33 1 41Commuter Train 48 1.4 1 10 12 25 36 12 - - - 11 12 8 8 - 9Work Train 19 0.5 - 16 1 2 6 10 2 1 - 2 1 2 2 - 12Single Car 123 3.5 26 21 1 75 3 111 1 8 - 1 1 69 34 9 9Cut of Cars 185 5.2 41 57 1 86 9 147 7 20 2 6 1 118 39 8 13Yard/ Switch 1,077 30.4 101 756 1 219 48 877 13 130 9 77 1 495 118 28 358Light loco(s) 142 4.0 26 72 1 43 22 106 5 7 2 5 1 89 7 2 38Maint/ Insp car 49 1.4 12 8 5 24 40 5 2 2 - 8 5 33 3 - -Total 3,548 100 330 2,295 217 706 1,275 1,810 118 314 31 433 217 1,257 433 52 1,156

TABLE 5-17 DAMAGE BY TRACK TYPE, 2001
Total Damage Equip Damage Track Damage Track
Amount Avg Amount Avg Amount AvgMain 245,957,778 167,546 159,482,089 108,639 86,475,689 58,907Yard 54,366,490 27,156 34,102,700 17,034 20,263,790 10,122Siding 8,035,584 62,778 4,293,498 33,543 3,742,086 29,235Industry 10,077,190 30,723 7,321,575 22,322 2,755,615 8,401Other 4,318,116 75,756 2,084,009 36,562 2,234,107 39,195Total 322,755,158 81,033 207,283,871 52,042 115,471,287 28,991

TABLE 5-18 DAMAGE BY CONSIST TYPE, 2001
Total Damage Equip Damage Track Damage Type Equipment
Amount Avg Amount Avg Amount AvgFreight Train 224,164,581 126,432 147,220,751 83,035 76,943,830 43,398Psgr Train 22,176,693 121,850 19,322,565 106,168 2,854,128 15,682Commuter Train 3,192,094 65,145 2,914,382 59,477 277,712 5,668Work Train 1,432,862 75,414 945,559 49,766 487,303 25,648Single Car 2,156,334 15,740 2,041,101 14,899 115,233 841Cut of Cars 20,148,954 102,279 9,930,907 50,411 10,218,047 51,868Yard/ Switch 32,270,628 28,432 20,429,661 18,000 11,840,967 10,433Light loco(s) 3,045,295 20,438 2,728,346 18,311 316,949 2,127Maint/ Insp car 1,937,877 31,256 1,750,599 28,235 187,278 3,021Other 12,229,840 43,678 0 0 12,229,840 43,678Total 322,755,158 81,033 207,283,871 52,042 115,471,287 28,991

Railroad Safety Statistics-Annual Report 2001 04/01/2003
CHAPTER 6
TRAIN ACCIDENTS INVOLVING CONSISTS TRANSPORTING HAZARDOUS MATERIAL
Hazardous Material is any substance or material, including a hazardous substance, which has been determined by the Secretary of Transportation to be capable of posing an unreasonable risk to health, safety, or property when transported in commerce, and which has been so designated.
An incident resulting in damage to cars transporting hazardous material, or causing a release of the hazardous material, is not of and by itself a basis for reporting to FRA under the accident/incident rules. First, the incident must satisfy the criteria for train accident reporting described in the previous chapter. Namely, there must be total reportable damage to the rail equipment and track above the threshold. In 1997 the threshold was $6,500, and in 1998 it was $6,600.
All evacuations, including precautionary ones, in response to a potential release of hazardous material are required to be reported even if an actual release did not occur.
Additional information concerning any unintentional release of hazardous material during transportation by rail or other modes, is available through the Research and Special Programs Administration within the U. S. Department of Transportation.

Railroad Safety Statistics-Annual Report 2001 04/01/2003
CONTENTS
CHAPTER 6
TRAIN ACCIDENTS/INVOLVING CONSISTS TRANSPORTING HAZARDOUS MATERIALS
Tables
6-1 Consists transporting hazardous material, by railroad, 2001..............................…………... 6-2 Consists transporting hazardous material, by state, 2001 ..................................…………... 6-3 Consists transporting hazardous material, by subcause, 2001 ...........................…………... 6-4 Consists transporting hazardous material, by accident type, 2001 ....................…………...

TABLE 6-1 CONSISTS TRANSPORTING HAZMAT, BY RAILROAD, 2001
Hazmat Consists Hazmat Cars Evacuations
Railroad
Cnt Damaged Releasing
TotalCars InConsist Cnt Damaged Releasing Cnt People
Alton & Southern 1 1 - 80 1 1 - - -Bangor & Aroostook 2 1 - 99 23 1 - - -Burlington Northern Santa Fe 265 133 9 15,833 2,395 305 19 6 469Belt Rwy Of Chicago 1 1 - 29 6 3 - - -Conrail Shared Assets 10 10 - 338 60 27 - - -CSX Transportation 94 36 7 5,538 754 73 12 1 50,000Delaware & Hudson 4 2 - 202 10 5 - - -Duluth,Winnipeg & Pacific 1 - - 151 18 - - - -Elgin, Joliet & Eastern 1 1 - 42 2 2 - - -Florida East Coast 1 1 - 8 2 1 - - -Guilford Rail System 2 - - 75 11 - - - -Grand Trunk Western RR 6 4 - 353 21 7 - 2 1,438Gateway Western 7 5 1 239 31 13 1 - -Illinois Central 28 19 2 1,932 332 83 5 1 200Indiana Harbor Belt 3 1 - 132 11 1 - - -I & M Rail Link, LLC 14 7 - 858 68 16 - - -Kansas City Southern 31 19 1 1,784 190 30 1 - -Montana Rail Link 10 5 - 548 98 10 - - -Norfolk Southern Corp. 53 25 2 3,119 365 45 4 - -Port Terminal RR Assn 10 8 - 268 20 15 - - -Soo Line 5 - - 350 29 - - - -Texas Mexican 7 2 - 592 23 3 - - -Term RR Assn Of St. Louis 1 - - 122 6 - - - -Econo Rail Corporation 1 1 - 22 3 3 - - -Union Pacific 184 90 8 13,108 2,129 233 12 1 13Wisconsin Central Ltd. 11 2 - 836 106 3 - - -Wheeling & Lake Erie 2 1 - 98 38 6 - - -Other Railroads 44 26 2 1,379 221 54 3 1 500Total 799 401 32 48,135 6,973 940 57 12 52,620

TABLE 6-2 CONSISTS TRANSPORTING HAZMAT, BY STATE, 2001
Hazmat Consists Hazmat Cars Evacuations
States
Cnt Damaged Releasing
TotalCars InConsist Cnt Damaged Releasing Cnt People
Alabama 23 13 3 1,275 144 32 5 1 500Arizona 16 6 2 1,141 246 26 5 - -Arkansas 15 7 - 791 156 29 - - -California 46 25 1 2,477 436 56 2 - -Colorado 16 6 - 1,056 277 14 - - -Delaware 2 1 - 91 22 2 - - -Dist Of Columb 2 - - 208 9 - - - -Florida 5 3 - 160 11 4 - - -Georgia 14 7 3 677 75 13 3 - -Idaho 10 3 - 994 111 13 - - -Illinois 56 25 1 3,661 396 53 1 - -Indiana 14 8 - 970 93 10 - - -Iowa 21 7 1 1,450 128 19 4 - -Kansas 31 19 1 1,772 160 40 3 1 140Kentucky 8 5 - 401 26 8 - - -Louisiana 53 33 3 3,389 887 124 6 1 200Maine 4 2 - 195 52 2 - - -Maryland 7 5 2 473 61 14 5 1 50,000Massachusetts 3 1 - 146 6 1 - - -Michigan 11 8 - 589 69 14 - 2 1,438Minnesota 16 4 - 1,309 125 5 - - -Mississippi 18 11 - 1,224 116 20 - - -Missouri 29 15 1 1,999 241 38 1 - -Montana 12 6 - 660 129 12 - - -Nebraska 18 7 - 1,358 109 18 - 1 13Nevada 4 1 1 445 29 1 1 - -New Jersey 8 7 - 393 56 22 - - -New Mexico 19 9 1 931 144 21 1 - -New York 19 10 1 799 124 23 2 - -North Carolina 7 2 - 363 59 2 - - -North Dakota 3 1 - 234 40 1 - - -Ohio 21 5 1 1,285 180 14 2 - -Oklahoma 28 15 1 1,674 228 36 2 - -Oregon 15 8 - 581 59 11 - - -Pennsylvania 16 7 - 768 128 17 - - -South Carolina 4 2 - 74 9 3 - - -South Dakota 2 1 - 162 13 7 - - -Tennessee 18 9 - 979 117 14 - - -Texas 140 80 8 8,146 1,290 175 12 5 329Utah 1 - - 75 3 - - - -Virginia 2 1 - 98 16 2 - - -Washington 13 4 - 644 62 4 - - -West Virginia 5 - - 274 92 - - - -Wisconsin 13 4 - 1,019 156 6 - - -Wyoming 11 8 1 725 83 14 2 - -Total 799 401 32 48,135 6,973 940 57 12 52,620

TABLE 6-3 CONSISTS TRANSPORTING HAZMAT, BY SUBCAUSE, 2001
Hazmat Consists Hazmat Cars Evacuations
Causes
Cnt Damaged Releasing
TotalCars InConsist Cnt Damaged Releasing Cnt People
Brakes 9 3 - 658 78 3 - - -Trailer/Container on Flatcar 1 - - 99 3 - - - -Body 13 3 1 960 109 10 1 1 2Coupler & Draft System 13 5 - 838 122 8 - - -Truck Components 27 14 2 1,905 346 59 2 1 200Axles & Journal Bearings 24 8 - 2,100 331 28 - - -Wheels 24 10 - 1,836 343 19 - - -Locomotives 9 1 - 841 120 2 - - -Doors 1 - - 68 5 - - - -Other Mechanical 3 - - 273 20 - - - -Brakes, Use of 36 27 1 929 118 44 2 - -Employee Physical Condition 1 - - 24 1 - - - -Flagging, Fixed, Hand & Radio 18 9 1 1,237 234 18 1 - -General Switching Rules 97 66 - 3,586 595 119 - - -Main Track Authority 9 3 - 552 99 6 - - -Train Handling/Makeup 48 20 - 4,176 530 42 - - -Speed 20 9 1 1,146 105 11 2 1 16Switches, Use of 64 33 1 3,315 500 65 1 - -Miscellaneous Human Factors 7 3 - 538 55 5 - - -Environmental Conditions 9 3 - 631 146 10 - - -Loading Procedures 12 4 1 912 119 7 2 - -Highway-Rail Incidents 35 1 - 2,389 281 9 - - -Unusual Operational Situations 45 23 1 2,580 381 43 1 - -Other Miscellaneous Causes 24 11 4 1,415 221 25 10 4 51,578Signal Defects 7 6 - 183 32 11 - - -Roadbed 10 4 2 707 104 13 4 2 542Track Geometry 99 52 3 5,787 884 171 7 1 38Rail, Joint Bar & Anchors 89 54 14 6,339 700 154 24 2 244Frogs, Switches, Appliances 44 29 - 2,104 390 58 - - -Other Track Defects 1 - - 7 1 - - - -Total 799 401 32 48,135 6,973 940 57 12 52,620

TABLE 6-4 CONSISTS TRANSPORTING HAZMAT, BY ACCIDENT TYPE, 2001
Hazmat Consists Hazmat Cars Evacuations
Type Accident
Cnt Damaged Releasing
TotalCars InConsist Cnt Damaged Releasing Cnt People
Derailments 564 286 28 37,122 5,325 744 51 9 51,042Head on collision 4 3 - 296 54 4 - 2 1,438Rear end collision 11 4 1 815 146 7 1 - -Side collision 38 16 1 2,052 347 28 1 - -Raking collision 13 9 - 525 66 18 - - -Broken train coll. 4 1 - 194 19 1 - - -Highway-rail Impact 35 1 - 2,389 281 9 - - -Obstruction impact 13 3 1 745 192 11 3 1 140Explosion/detonation 1 - - 14 8 - - - -Fire/violent rupture 3 - - 324 34 - - - -Other impacts 96 74 1 2,443 373 114 1 - -Other events 17 4 - 1,216 128 4 - - -Total 799 401 32 48,135 6,973 940 57 12 52,620

Railroad Safety Statistics-Annual Report 2001 04/01/2003
CHAPTER 7
HIGHWAY-RAIL INCIDENTS
Any impact, regardless of severity, between a railroad on-track equipment consist and any user of a public or private crossing site, is to be reported on Form FRA F 6180.57. The crossing site includes sidewalks and pathways at, or associated with, the crossing.
In addition, whenever a highway-rail grade crossing accident/incident results in reportable damages greater than the current reporting threshold used for Rail Equipment Accident/Incident reporting, a Form FRA F 6180.54 must be completed. The reporting threshold for accidents for 1997 was $6,500, and in 1998 it was $6,600.
Highway users include but are not limited to: automobiles, buses, trucks, motorcycles, bicycles, recreational vehicles, farm vehicles, construction vehicles, roadway maintenance vehicles, and pedestrians.
Suicides or attempted suicides, as determined by a coroner or other public authority, at highwayrail crossing sites are not reportable. However, the event may be reportable under other criteria. For example, reportable conditions to others must be recorded on Form FRA F 6180.55a, e.g., the engineer sustained a fractured arm. Likewise, if the event caused reportable damage above the current monetary threshold for Rail Equipment Accidents/Incidents, a Form FRA F 6180.54 must be prepared. In these situations, the type of accident is coded as an "Obstruction".
Incidents involving highway users who have unsuccessfully attempted to avoid striking or being struck by a railroad consist at a crossing site are to be reported, regardless of where the actual impact between the consist and the highway user occurred.
Each reportable casualty resulting from a highway-rail crossing impact must also be reported on Form FRA F 6180.55a.
If the accident/incident satisfies the reporting requirements for rail equipment accidents (e.g., reportable railroad damage exceeds threshold), Form FRA F 6180.54 must also be completed by all railroads involved, including the railroad with track maintenance responsibility.

Railroad Safety Statistics-Annual Report 2001 04/01/2003
CONTENTS
CHAPTER 7
HIGHWAY-RAIL INCIDENTS
Tables
7-1 Total highway-rail incidents, by railroad, 2001 .................................................…………... 7-2 Total highway-rail incidents, by state, 2001.......................................................…………... 7-3 Total highway-rail casualties by state and age group, 2001...............................…………... 7-4 Total highway-rail incidents, by month, 2001....................................................…………... 7-5 Total highway-rail incidents, by day, 2001 .......................................................…………... 7-6 Total highway-rail incidents, by hour of day, 2001............................................…………... 7-7 Total highway-rail incidents, by type highway user, 2001.................................…………...7-8 Total highway-rail incidents, by user, 2001 .......................................................…………... 7-9 Total highway-rail incidents, by warning device, 2001 .....................................…………...7-10 Total highway-rail incidents, by weather, 2001 .................................................…………...

TABLE 7-1 TOTAL HIGHWAY-RAIL INCIDENTS BY RAILROAD, 2001
At Public Crossing At Private Crossing Totals Motor Vehicle Other Motor Vehicle OtherRailroads
Cnt Kld Nonfatal Cnt Kld Nonfatal Cnt Kld Nonfatal Cnt Kld Nonfatal Cnt Kld NonfatalAlaska RR Corp. 4 - 1 4 - 1 - - - - - - - - -Amtrak 162 69 84 114 40 62 26 21 8 21 7 14 1 1 -Bangor & Aroostook 2 - 1 1 - 1 - - - 1 - - - - -Burlington Northern Santa Fe 473 55 181 383 42 150 27 9 10 58 3 19 5 1 2Belt Rwy Of Chicago 4 - 1 3 - - - - - 1 - 1 - - -Conrail Shared Assets 19 2 6 17 2 6 - - - 2 - - - - -CSX Transportation 521 63 206 454 56 183 17 5 6 45 1 17 5 1 -Delaware & Hudson 4 2 1 2 2 - - - - 2 - 1 - - -Dakota,Minnesota & Eastern 12 - 1 9 - 1 - - - 3 - - - - -Duluth,Missabe & Iron Range 1 - - 1 - - - - - - - - - - -Duluth,Winnipeg & Pacific 1 - - 1 - - - - - - - - - - -Elgin, Joliet & Eastern 5 - 2 3 - 1 - - - 2 - 1 - - -Florida East Coast 22 3 3 19 2 2 2 1 1 1 - - - - -Guilford Rail System 4 - 2 3 - 2 - - - 1 - - - - -Grand Trunk Western RR 24 1 9 22 - 9 1 1 - 1 - - - - -Gateway Western 4 - 1 2 - 1 1 - - 1 - - - - -Illinois Central 90 21 47 80 19 44 2 - 1 8 2 2 - - -Indiana Harbor Belt 10 - 2 8 - 2 - - - 2 - - - - -I & M Rail Link, LLC 36 4 18 31 4 17 1 - - 4 - 1 - - -Kansas City Southern 120 15 60 108 15 51 5 - 3 7 - 6 - - -Long Island Rail Road 5 4 1 3 2 1 2 2 - - - - - - -Mass Bay Transit Auth. 6 - 1 6 - 1 - - - - - - - - -Metro North Commuter 1 - - 1 - - - - - - - - - - -Montana Rail Link 11 1 2 9 - 1 1 - 1 1 1 - - - -Northern IN Comm Trans 4 - 2 3 - 2 - - - 1 - - - - -Northeast IL Reg Comm 31 9 15 25 4 14 6 5 1 - - - - - -New Jersey Transit Rail 13 6 1 9 2 1 4 4 - - - - - - -Norfolk Southern Corp. 507 67 129 419 57 104 13 3 4 69 7 19 6 - 2Paducah & Louisville 8 - 4 5 - 1 - - - 3 - 3 - - -Peninsula Comm San Mateo Cnty 6 4 - 2 - - 4 4 - - - - - - -Port Terminal RR Assn 8 - 3 6 - 3 - - - 2 - - - - -Southern CA Reg Rail Auth. 10 1 6 6 - 3 3 1 2 1 - 1 - - -Soo Line 33 2 17 26 - 14 1 1 - 6 1 3 - - -Texas Mexican 6 - - 3 - - 1 - - 1 - - 1 - -Term RR Assn Of St. Louis 1 - - 1 - - - - - - - - - - -Econo Rail Corporation 4 - - - - - - - - 4 - - - - -Union Pacific 629 72 227 534 49 203 21 13 2 69 8 22 5 2 -Wisconsin Central Ltd. 79 10 35 76 9 34 3 1 1 - - - - - -Wheeling & Lake Erie 12 - 5 10 - 5 1 - - 1 - - - - -Other Railroads 345 10 83 286 10 75 6 - 3 51 - 5 2 - -Total 3,237 421 1,157 2,695 315 995 148 71 43 369 30 115 25 5 4

TABLE 7-2 TOTAL HIGHWAY-RAIL INCIDENTS BY STATE, 2001
At Public Crossing At Private Crossing Totals Motor Vehicle Other Motor Vehicle OtherStates
Cnt Kld Nonfatal Cnt Kld Nonfatal Cnt Kld Nonfatal Cnt Kld Nonfatal Cnt Kld NonfatalAlabama 103 9 28 89 8 23 4 - 3 10 1 2 - - -Alaska 4 - 1 4 - 1 - - - - - - - - -Arizona 29 6 10 24 4 8 4 2 2 1 - - - - -Arkansas 87 9 39 80 8 37 3 - 1 4 1 1 - - -California 180 54 49 135 29 37 28 21 7 14 3 5 3 1 -Colorado 34 3 10 28 3 7 - - - 6 - 3 - - -Connecticut 3 - 2 - - - 1 - 1 2 - 1 - - -Delaware 7 1 - 6 1 - - - - 1 - - - - -Florida 114 15 36 94 9 28 5 4 3 14 1 5 1 1 -Georgia 122 19 50 116 16 50 2 2 - 3 1 - 1 - -Hawaii 1 - - 1 - - - - - - - - - - -Idaho 20 1 7 17 1 7 - - - 3 - - - - -Illinois 212 31 89 167 16 79 20 13 4 24 2 6 1 - -Indiana 165 19 62 145 17 55 8 1 3 11 1 4 1 - -Iowa 110 16 35 94 14 34 6 1 1 9 1 - 1 - -Kansas 63 5 20 54 5 19 2 - - 7 - 1 - - -Kentucky 79 10 31 58 8 21 2 - 1 19 2 9 - - -Louisiana 161 22 93 146 20 85 1 - 1 14 2 7 - - -Maine 9 - 4 7 - 4 - - - 2 - - - - -Maryland 17 1 9 13 1 6 1 - - 3 - 3 - - -Massachusetts 17 - 4 15 - 4 - - - 1 - - 1 - -Michigan 96 11 36 87 8 35 5 2 1 3 1 - 1 - -Minnesota 82 9 25 68 5 23 5 3 - 9 1 2 - - -Mississippi 102 22 47 93 21 42 3 - 2 6 1 3 - - -Missouri 64 4 22 53 3 19 2 1 - 7 - 2 2 - 1Montana 16 1 4 13 - 2 2 - 2 1 1 - - - -Nebraska 50 3 17 38 3 11 1 - 1 11 - 5 - - -Nevada 2 - - 2 - - - - - - - - - - -New Hampshire 2 - - 1 - - - - - 1 - - - - -New Jersey 36 8 11 26 4 10 5 4 - 5 - 1 - - -New Mexico 24 8 8 18 4 6 2 2 1 3 1 1 1 1 -New York 32 8 5 20 4 3 2 2 - 8 1 2 2 1 -North Carolina 79 6 21 62 2 17 3 4 1 13 - 3 1 - -North Dakota 17 2 8 14 1 5 1 1 - 2 - 3 - - -Ohio 140 22 40 120 22 39 3 - 1 16 - - 1 - -Oklahoma 69 9 19 63 7 19 2 1 - 3 - - 1 1 -Oregon 43 6 13 23 4 7 2 1 1 18 1 5 - - -Pennsylvania 68 8 15 59 6 8 - - - 7 2 5 2 - 2South Carolina 65 4 23 57 4 21 1 - 1 7 - 1 - - -South Dakota 20 1 4 16 1 3 - - - 3 - - 1 - 1Tennessee 97 10 39 78 10 35 3 - 1 15 - 3 1 - -Texas 362 39 132 301 34 112 12 2 2 48 3 18 1 - -Utah 20 2 8 17 1 7 1 - 1 2 1 - - - -Virginia 44 1 18 30 - 12 1 - - 12 1 6 1 - -Washington 38 5 7 28 2 4 2 2 - 8 1 3 - - -West Virginia 20 1 9 13 1 7 - - - 7 - 2 - - -Wisconsin 104 10 43 99 8 42 3 2 1 2 - - - - -Wyoming 8 - 4 3 - 1 - - - 4 - 3 1 - -Total 3,237 421 1,157 2,695 315 995 148 71 43 369 30 115 25 5 4

TABLE 7-3 TOTAL HRC CASUALTIES BY STATE AND AGE GROUP, 2001
Deaths Nonfatal Cases Age Group Total Age Group TotalStates
Unk<16 16-21
>21 Cnt % Unk
<16 16-21
>21 Cnt %
Alabama - - 1 8 9 2.1 2 1 6 19 28 2.4Alaska - - - - 0 0.0 - - - 1 1 0.1Arizona 1 - - 5 6 1.4 5 1 - 4 10 0.9Arkansas - - - 9 9 2.1 2 4 10 23 39 3.4California 7 3 3 41 54 12.8 6 - 1 42 49 4.2Colorado 1 - - 2 3 0.7 3 - 1 6 10 0.9Connecticut - - - - 0 0.0 - - - 2 2 0.2Delaware - - - 1 1 0.2 - - - - 0 0.0Florida 2 - 3 10 15 3.6 2 2 3 29 36 3.1Georgia - 2 2 15 19 4.5 1 6 15 28 50 4.3Idaho - - - 1 1 0.2 - - 2 5 7 0.6Illinois 3 1 4 23 31 7.4 5 5 9 70 89 7.7Indiana 1 1 1 16 19 4.5 2 7 12 41 62 5.4Iowa - 1 3 12 16 3.8 6 1 11 17 35 3.0Kansas 1 1 - 3 5 1.2 4 1 1 14 20 1.7Kentucky - 1 1 8 10 2.4 1 4 6 20 31 2.7Louisiana - 5 2 15 22 5.2 12 11 19 51 93 8.0Maine - - - - 0 0.0 2 - - 2 4 0.3Maryland - - - 1 1 0.2 - - 4 5 9 0.8Massachusetts - - - - 0 0.0 - - 1 3 4 0.3Michigan 1 - 1 9 11 2.6 - 3 17 16 36 3.1Minnesota 1 - 2 6 9 2.1 4 2 2 17 25 2.2Mississippi 1 2 3 16 22 5.2 6 4 12 25 47 4.1Missouri 1 - - 3 4 1.0 3 2 4 13 22 1.9Montana - - - 1 1 0.2 - 1 1 2 4 0.3Nebraska 1 - 1 1 3 0.7 2 - 3 12 17 1.5New Jersey - - - 8 8 1.9 - - 4 7 11 1.0New Mexico 1 - - 7 8 1.9 4 - - 4 8 0.7New York 2 - 3 3 8 1.9 1 - 1 3 5 0.4North Carolina 3 - - 3 6 1.4 1 - 3 17 21 1.8North Dakota - - - 2 2 0.5 1 1 - 6 8 0.7Ohio - 4 3 15 22 5.2 - 3 13 24 40 3.5Oklahoma - - - 9 9 2.1 6 1 5 7 19 1.6Oregon - 3 - 3 6 1.4 2 2 1 8 13 1.1Pennsylvania 1 - - 7 8 1.9 - 4 2 9 15 1.3South Carolina 1 - 1 2 4 1.0 1 1 4 17 23 2.0South Dakota - - - 1 1 0.2 3 - - 1 4 0.3Tennessee - - - 10 10 2.4 1 2 10 26 39 3.4Texas 1 3 4 31 39 9.3 18 15 7 92 132 11.4Utah - - 2 - 2 0.5 - 2 1 5 8 0.7Virginia - - - 1 1 0.2 - 3 4 11 18 1.6Washington - - 2 3 5 1.2 1 - 1 5 7 0.6West Virginia - - - 1 1 0.2 - - 1 8 9 0.8Wisconsin - - 3 7 10 2.4 - 2 8 33 43 3.7Wyoming - - - - 0 0.0 2 - - 2 4 0.3Total 30 27 45 319 421 100.0 109 91 205 752 1,157 100.0

TABLE 7-4 TOTAL HIGHWAY-RAIL INCIDENTS BY MONTH, 2001
At Public Crossing At Private Crossing Totals Motor Vehicle Other Motor Vehicle OtherRailroads
Cnt Kld Nonfatal Cnt Kld Nonfatal Cnt Kld Nonfatal Cnt Kld Nonfatal Cnt Kld NonfatalJanuary 297 40 102 252 30 91 9 6 2 34 3 9 2 1 -February 273 36 75 227 31 65 8 1 2 37 4 7 1 - 1March 295 39 108 247 27 98 14 8 5 31 3 4 3 1 1April 244 28 95 194 19 77 13 6 4 35 2 14 2 1 -May 266 38 105 221 32 93 13 4 3 29 1 9 3 1 -June 272 34 82 225 25 74 16 6 3 26 3 5 5 - -July 249 38 85 204 28 72 16 9 4 28 1 9 1 - -August 290 32 110 234 18 94 18 10 4 36 4 11 2 - 1September 267 25 96 226 19 81 10 5 4 30 1 11 1 - -October 273 35 102 220 25 79 7 5 1 45 5 22 1 - -November 237 26 106 204 20 90 13 3 5 19 2 11 1 1 -December 274 50 91 241 41 81 11 8 6 19 1 3 3 - 1Total 3,237 421 1,157 2,695 315 995 148 71 43 369 30 115 25 5 4

TABLE 7-5 TOTAL HIGHWAY-RAIL INCIDENTS BY DAY, 2001
Rail Equip Struck Highway User At Public Crossing At Private Crossing
TotalIncidents Total Motor Vehicle Other Motor Vehicle Other
Day
Cnt % Kld Nonfatal Cnt Kld Nonfatal Cnt Kld Nonfatal Cnt Kld Nonfatal Cnt Kld NonfatalSunday 230 7.11 60 76 185 47 65 15 10 4 29 3 7 1 - -Monday 371 11.46 33 149 304 21 128 23 10 6 39 2 15 5 - -Tuesday 390 12.05 51 132 321 40 115 11 6 1 55 4 16 3 1 -Wednesday 390 12.05 53 147 298 39 115 30 10 11 58 3 19 4 1 2Thursday 395 12.20 52 128 317 32 96 21 12 4 52 5 28 5 3 -Friday 428 13.22 55 147 339 38 118 19 9 8 66 8 20 4 - 1Saturday 347 10.72 61 100 288 46 88 20 12 4 37 3 7 2 - 1Total 2,551 78.81 365 879 2,052 263 725 139 69 38 336 28 112 24 5 4
Highway User Struck Rail Equip At Public Crossing At Private Crossing
TotalIncidents Total Motor Vehicle Other Motor Vehicle Other
Day
Cnt % Kld Nonfatal Cnt Kld Nonfatal Cnt Kld Nonfatal Cnt Kld Nonfatal Cnt Kld NonfatalSunday 65 2.01 3 22 64 3 21 1 - 1 - - - - - -Monday 89 2.75 8 44 81 6 41 1 - 1 7 2 2 - - -Tuesday 101 3.12 7 42 94 6 41 1 1 - 6 - 1 - - -Wednesday 106 3.27 11 37 103 11 37 - - - 3 - - - - -Thursday 108 3.34 5 55 103 5 55 - - - 5 - - - - -Friday 118 3.65 9 39 108 9 39 1 - - 8 - - 1 - -Saturday 99 3.06 13 39 90 12 36 5 1 3 4 - - - - -Total 686 21.19 56 278 643 52 270 9 2 5 33 2 3 1 - -
Grand Total At Public Crossing At Private Crossing
TotalIncidents Total Motor Vehicle Other Motor Vehicle Other
Day
Cnt % Kld Nonfatal Cnt Kld Nonfatal Cnt Kld Nonfatal Cnt Kld Nonfatal Cnt Kld NonfatalSunday 295 9.11 63 98 249 50 86 16 10 5 29 3 7 1 - -Monday 460 14.21 41 193 385 27 169 24 10 7 46 4 17 5 - -Tuesday 491 15.17 58 174 415 46 156 12 7 1 61 4 17 3 1 -Wednesday 496 15.32 64 184 401 50 152 30 10 11 61 3 19 4 1 2Thursday 503 15.54 57 183 420 37 151 21 12 4 57 5 28 5 3 -Friday 546 16.87 64 186 447 47 157 20 9 8 74 8 20 5 - 1Saturday 446 13.78 74 139 378 58 124 25 13 7 41 3 7 2 - 1Total 3,237 100.0 421 1,157 2,695 315 995 148 71 43 369 30 115 25 5 4

TABLE 7-6 TOTAL HIGHWAY-RAIL INCIDENTS BY HOUR OF DAY, 2001
At Public Crossing At Private Crossing Total
Incidents Total Motor Vehicle Other Motor Vehicle OtherHour of
Day Cnt % Kld Nonfatal Cnt Kld Nonfatal Cnt Kld Nonfatal Cnt Kld Nonfatal Cnt Kld Nonfatal
1 97 3.00 19 36 80 14 32 9 4 3 7 - 1 1 1 -2 76 2.35 12 19 62 11 16 3 1 2 11 - 1 - - -3 73 2.26 6 10 67 4 9 2 1 1 4 1 - - - -4 52 1.61 2 13 47 2 13 - - - 5 - - - - -5 59 1.82 6 8 53 6 7 1 - 1 5 - - - - -6 82 2.53 7 27 66 3 22 3 1 1 12 3 3 1 - 17 129 3.99 27 51 102 16 44 9 7 1 17 4 6 1 - -8 170 5.25 16 65 138 12 51 5 2 1 24 2 12 3 - 19 186 5.75 14 77 145 11 65 5 1 2 31 1 10 5 1 -10 190 5.87 21 66 160 17 52 5 3 1 25 1 13 - - -11 207 6.39 23 73 165 18 58 9 2 3 30 3 11 3 - 112 78 2.41 7 14 64 4 12 6 3 2 8 - - - - -
AM
Total 1,399 43.22 160 459 1,149 118 381 57 25 18 179 15 57 14 2 31 173 5.34 24 76 139 18 64 4 2 - 27 2 12 3 2 -2 206 6.36 27 71 168 19 64 13 5 3 24 3 4 1 - -3 194 5.99 36 79 163 30 68 9 2 3 20 3 7 2 1 14 179 5.53 30 62 150 22 52 12 7 3 17 1 7 - - -5 190 5.87 28 66 162 21 58 11 7 2 17 - 6 - - -6 152 4.70 22 64 130 15 58 11 7 - 10 - 6 1 - -7 136 4.20 26 58 113 24 51 4 1 3 19 1 4 - - -8 114 3.52 16 47 99 15 41 4 - 2 9 1 4 2 - -9 105 3.24 21 36 90 13 32 7 6 4 8 2 - - - -10 103 3.18 7 24 88 5 23 3 2 1 12 - - - - -11 98 3.03 9 40 85 6 34 5 2 3 7 1 3 1 - -12 188 5.81 15 75 159 9 69 8 5 1 20 1 5 1 - -
PM
Total 1,838 56.78 261 698 1,546 197 614 91 46 25 190 15 58 11 3 1Total 3,237 100.0 421 1157 2,695 315 995 148 71 43 369 30 115 25 5 4

TABLE 7-7 TOTAL HIGHWAY-RAIL INCIDENTS BY TYPE HIGHWAY USER, 2001
Rail Equip Struck Highway User At Public Crossing At Private Crossing
TotalIncidents Total Motor Vehicle Other Motor Vehicle Other
Highway User
Cnt % Kld Nonfatal Cnt Kld Nonfatal Cnt Kld Nonfatal Cnt Kld Nonfatal Cnt Kld NonfatalCar 1,147 35.43 145 399 1,044 134 368 - - - 103 11 31 - - -Truck 276 8.53 35 117 227 34 100 - - - 49 1 17 - - -Trk& Trail 422 13.04 19 117 316 13 82 - - - 106 6 35 - - -Pickup Trk 380 11.74 60 135 326 53 114 - - - 54 7 21 - - -Van 94 2.90 23 43 86 22 37 - - - 8 1 6 - - -Bus 7 0.22 - 6 6 - 6 - - - 1 - - - - -School Bus 3 0.09 - 1 2 - 1 - - - 1 - - - - -Motorcycle 4 0.12 1 2 4 1 2 - - - - - - - - -Oth Mtr V. 55 1.70 8 17 41 6 15 - - - 14 2 2 - - -Pedestrian 91 2.81 66 31 - - - 87 63 30 - - - 4 3 1Other 72 2.22 8 11 - - - 52 6 8 - - - 20 2 3Total 2,551 78.81 365 879 2,052 263 725 139 69 38 336 28 112 24 5 4
Highway User Struck Rail Equip At Public Crossing At Private Crossing
TotalIncidents Total Motor Vehicle Other Motor Vehicle Other
Highway User
Cnt % Kld Nonfatal Cnt Kld Nonfatal Cnt Kld Nonfatal Cnt Kld Nonfatal Cnt Kld NonfatalCar 369 11.40 29 146 358 29 145 - - - 11 - 1 - - -Truck 74 2.29 5 32 66 5 30 - - - 8 - 2 - - -Trk& Trail 43 1.33 1 15 37 1 15 - - - 6 - - - - -Pickup Trk 143 4.42 16 65 138 14 65 - - - 5 2 - - - -Van 35 1.08 3 10 32 3 10 - - - 3 - - - - -Motorcycle 2 0.06 - - 2 - - - - - - - - - - -Oth Mtr V. 10 0.31 - 5 10 - 5 - - - - - - - - -Pedestrian 1 0.03 1 - - - - 1 1 - - - - - - -Other 9 0.28 1 5 - - - 8 1 5 - - - 1 - -Total 686 21.19 56 278 643 52 270 9 2 5 33 2 3 1 - -
Grand Total At Public Crossing At Private Crossing
TotalIncidents Total Motor Vehicle Other Motor Vehicle Other
Highway User
Cnt % Kld Nonfatal Cnt Kld Nonfatal Cnt Kld Nonfatal Cnt Kld Nonfatal Cnt Kld NonfatalCar 1,516 46.83 174 545 1,402 163 513 - - - 114 11 32 - - -Truck 350 10.81 40 149 293 39 130 - - - 57 1 19 - - -Trk& Trail 465 14.37 20 132 353 14 97 - - - 112 6 35 - - -Pickup Trk 523 16.16 76 200 464 67 179 - - - 59 9 21 - - -Van 129 3.99 26 53 118 25 47 - - - 11 1 6 - - -Bus 7 0.22 - 6 6 - 6 - - - 1 - - - - -School Bus 3 0.09 - 1 2 - 1 - - - 1 - - - - -Motorcycle 6 0.19 1 2 6 1 2 - - - - - - - - -Oth Mtr V. 65 2.01 8 22 51 6 20 - - - 14 2 2 - - -Pedestrian 92 2.84 67 31 - - - 88 64 30 - - - 4 3 1Other 81 2.50 9 16 - - - 60 7 13 - - - 21 2 3Total 3,237 100.0 421 1,157 2,695 315 995 148 71 43 369 30 115 25 5 4

TABLE 7-8 HIGHWAY-RAIL INCIDENTS BY USERS, 2001
Rail Equip Struck Highway User Total
Highway User
Cnt %FreightTrain
Psgr Train
CommuterTrain
WorkTrain
SingleCar
Yard/Switch
Light loco(s)
MaintInspcar
Car 1,147 35.4 861 76 31 7 2 73 71 26Truck 276 8.5 215 11 4 3 - 21 19 3Trk& Trail 422 13.0 322 20 4 4 - 41 29 2Pickup Trk 380 11.7 293 27 2 5 1 19 25 8Van 94 2.9 62 8 1 - - 10 12 1Bus 7 0.2 5 - 1 - - 1 - -School Bus 3 0.1 1 - - - - 1 1 -Motorcycle 4 0.1 2 2 - - - - - -Oth Mtr V. 55 1.7 44 2 1 - - 2 6 -Pedestrian 91 2.8 48 29 11 - - 2 - 1Other 72 2.2 62 4 1 2 - 3 - -Total 2,551 78.8 1,915 179 56 21 3 173 163 41
Highway User Struck Rail Equip Total
Highway User
Cnt %FreightTrain
Psgr Train
CommuterTrain
WorkTrain
SingleCar
Cutof
CarsYard/Switch
Light loco(s)
MaintInspcar
Car 369 11.4 255 13 6 1 2 1 49 28 14Truck 74 2.3 51 2 - 1 - 2 11 4 3Trk& Trail 43 1.3 27 1 1 - - - 10 3 1Pickup Trk 143 4.4 108 6 1 - - - 16 9 3Van 35 1.1 24 - - 1 - - 5 3 2Motorcycle 2 0.1 2 - - - - - - - -Oth Mtr V. 10 0.3 8 1 - - - - - 1 -Pedestrian 1 0.0 - 1 - - - - - - -Other 9 0.3 8 - - - - - - - 1Total 686 21.2 483 24 8 3 2 3 91 48 24
Grand Total Total
Highway User
Cnt %FreightTrain
Psgr Train
CommuterTrain
WorkTrain
SingleCar
Cutof
CarsYard/Switch
Light loco(s)
MaintInspcar
Car 1,516 46.8 1,116 89 37 8 4 1 122 99 40Truck 350 10.8 266 13 4 4 - 2 32 23 6Trk& Trail 465 14.4 349 21 5 4 - - 51 32 3Pickup Trk 523 16.2 401 33 3 5 1 - 35 34 11Van 129 4.0 86 8 1 1 - - 15 15 3Bus 7 0.2 5 - 1 - - - 1 - -School Bus 3 0.1 1 - - - - - 1 1 -Motorcycle 6 0.2 4 2 - - - - - - -Oth Mtr V. 65 2.0 52 3 1 - - - 2 7 -Pedestrian 92 2.8 48 30 11 - - - 2 - 1Other 81 2.5 70 4 1 2 - - 3 - 1Total 3,237 100.0 2,398 203 64 24 5 3 264 211 65

TABLE 7-9 TOTAL HIGHWAY-RAIL INCIDENTS BY WARNING DEVICE, 2001
At Public Crossing At Private Crossing Total
Incidents Total Motor Vehicle Other Motor Vehicle OtherWarning
Cnt % Kld Nonfatal Cnt Kld Nonfatal Cnt Kld Nonfatal Cnt Kld Nonfatal Cnt Kld NonfatalGates 914 28.24 161 259 809 96 232 93 64 24 9 - 2 3 1 1Flashing lights 620 19.15 69 251 583 62 237 23 6 12 12 1 2 2 - -HWTS,WW,Bells 43 1.33 1 11 39 1 11 1 - - 3 - - - - -Watchman 36 1.11 - 8 26 - 7 - - - 10 - 1 - - -Stop signs 405 12.51 50 163 279 35 119 1 - - 120 13 44 5 2 -Cross bucks 1,103 34.07 134 439 933 120 387 30 1 7 130 11 43 10 2 2Other 14 0.43 - 2 8 - 1 - - - 6 - 1 - - -None 102 3.15 6 24 18 1 1 - - - 79 5 22 5 - 1Total 3,237 100.0 421 1,157 2,695 315 995 148 71 43 369 30 115 25 5 4

TABLE 7-10 TOTAL HIGHWAY-RAIL INCIDENTS BY WEATHER, 2001
Rail Equip Struck Highway User At Public Crossing At Private Crossing
TotalIncidents Total Motor Vehicle Other Motor Vehicle Other
TypeWeather
Cnt % Kld Nonfatal Cnt Kld Nonfatal Cnt Kld Nonfatal Cnt Kld Nonfatal Cnt Kld NonfatalClear 1,840 56.84 269 689 1,470 198 568 106 46 33 244 20 85 20 5 3Cloudy 469 14.49 58 142 383 38 116 19 14 3 64 6 22 3 - 1Rain 178 5.50 34 38 144 24 32 13 9 1 20 1 5 1 - -Fog 35 1.08 2 7 29 1 6 1 - 1 5 1 - - - -Sleet 5 0.15 1 - 5 1 - - - - - - - - - -Snow 24 0.74 1 3 21 1 3 - - - 3 - - - - -Total 2,551 78.81 365 879 2,052 263 725 139 69 38 336 28 112 24 5 4
Highway User Struck Rail Equip At Public Crossing At Private Crossing
TotalIncidents Total Motor Vehicle Other Motor Vehicle Other
TypeWeather
Cnt % Kld Nonfatal Cnt Kld Nonfatal Cnt Kld Nonfatal Cnt Kld Nonfatal Cnt Kld NonfatalClear 450 13.90 35 175 424 31 170 8 2 4 17 2 1 1 - -Cloudy 128 3.95 14 47 116 14 46 - - - 12 - 1 - - -Rain 66 2.04 6 32 61 6 30 1 - 1 4 - 1 - - -Fog 21 0.65 1 18 21 1 18 - - - - - - - - -Sleet 2 0.06 - - 2 - - - - - - - - - - -Snow 19 0.59 - 6 19 - 6 - - - - - - - - -Total 686 21.19 56 278 643 52 270 9 2 5 33 2 3 1 - -
Grand total At Public Crossing At Private Crossing
TotalIncidents Total Motor Vehicle Other Motor Vehicle Other
TypeWeather
Cnt % Kld Nonfatal Cnt Kld Nonfatal Cnt Kld Nonfatal Cnt Kld Nonfatal Cnt Kld NonfatalClear 2,290 70.74 304 864 1,894 229 738 114 48 37 261 22 86 21 5 3Cloudy 597 18.44 72 189 499 52 162 19 14 3 76 6 23 3 - 1Rain 244 7.54 40 70 205 30 62 14 9 2 24 1 6 1 - -Fog 56 1.73 3 25 50 2 24 1 - 1 5 1 - - - -Sleet 7 0.22 1 - 7 1 - - - - - - - - - -Snow 43 1.33 1 9 40 1 9 - - - 3 - - - - -Total 3,237 100.0 421 1,157 2,695 315 995 148 71 43 369 30 115 25 5 4

Railroad Safety Statistics-Annual Report 2001 04/01/2003
CHAPTER 8
HIGHWAY-RAIL INCIDENTS AT PUBLIC CROSSINGS THAT INVOLVE MOTOR VEHICLES
FRA’s reporting rules define any contact between a rail and highway user at a crossing site as a highway-rail incident. The following are situations that occur at or near crossing locations that do not qualify as highway-rail crossing incidents, but may require reporting under other provisions of the rule, e.g., train accident or casualty reporting.
Q1. A man driving a truck did not see a train occupying a highway-rail crossing and lost control of his vehicle when he slammed on the brakes to avoid a collision. His truck ended up in the ditch with considerable damage, and he broke his arm. What reports are required?
A1. Since an impact did not occur between a highway and a rail user, you do not need to prepare a highway-rail accident/incident report (form 6180.57). The motorist did sustain a reportable injury arising from the operation of a railroad. Therefore, an injury report (form 6180.55a) must be completed. If the motorist had struck the consist, a form 6180.57 would be required even if the impact did not occur on the crossing site.
Q2. A highway user hits a signal stand at a highway crossing and was injured, but there was no on-track equipment present, nor were railroad employees in the vicinity. Is this reportable?
A2. No. The regulation exempts the reporting of motor vehicle accidents at highway-rail crossing sites when they do not involve the presence of on-track equipment or railroad employees.
Q3. A motorist in an off-road vehicle was waiting behind several automobiles at a crossing site where the gates were down and a standing train was occupying the track. He apparently became impatient and drove his vehicle off the highway and parallel to the track to a point where he could cross over the track behind the train. His vehicle stalled on a parallel set of tracks, and he was unable to start it. He exited his truck just before a train on the adjacent track hit it. Should this be reported as a highwayrail accident/incident or any other type?
A3. An event such as this would not qualify as a highway-rail crossing collision since the motor vehicle operator had left the highway of his own choosing and his vehicle was struck at a location other than a designated crossing site. The event would be reportable as an obstruction accident on form 6180.54 if reportable damage was in excess of the threshold. If the motorist or employees were hurt in connection with this event, then an injury report (form 6180.55a) would need to be completed.

Railroad Safety Statistics-Annual Report 2001 04/01/2003
CONTENTS
CHAPTER 8
HIGHWAY-RAIL INCIDENTS AT PUBLIC CROSSINGS THAT INVOLVE MOTOR VEHICLES
Tables
8-1 Rates for motor vehicle incidents at public crossings, by state, 2001…..............…….……8-2 Rates for motor vehicle incidents at public crossings, by warning device, 2001……..……8-3 Motor vehicle incidents at public crossings, by railroad and type warning, 2001………….8-4 Motor vehicle incidents at public crossings, by state and type warning, 2001……….…….8-5 Motor vehicle incidents at public crossings, by type consist and consist speed, 2001…….. 8-6 Motor vehicle incidents at public crossings, by type warning, motorist action and warning location, 2001…………………...……….................................……...8-7 Motor vehicle incidents at public crossings, by type vehicle, vehicle speed
and driver gender, 2001..…..........................................................................….…… 8-8 Motor vehicle incidents at public crossings, by vehicle speed, weather
and condition of driver, 2001 …...................................................................………8-9 Motor vehicle incidents at public crossings, by driver age, gender, and
type vehicle, 2001.......…..............................................................................………8-10 Motor vehicles that struck consist at public crossings, by consist length,
portion of train struck, and warning type, 2001 .…......................................……… 8-11 Motor vehicle incidents at public crossings, by consist length, type consist,
and driver gender, 2001.…...........................................................................……...8-12 Motor vehicle incidents at public crossings, by type consist, number of people on train, and type person hurt, 2001…………………………………………….…… 8-13 Motor vehicle incidents at public crossings, by type vehicle, number of occupants,
and vehicle damage, 2001……………...........................................................…… 8-14 Motor vehicle incidents at public crossings, by type warning, position on crossing
and if hazardous material was released, 2001 ................………………………….. 8-15 Motor vehicle incidents at public crossings, by type vehicle and warning, 2001......……...8-16 Motor vehicle incidents at public crossings, by warning status for incidents occurring at crossings with train activated devices, by type vehicle, 2001………..

TABLE 8-1 RATES FOR MOTOR VEHICLE INCIDENTS AT PUBLIC CROSSINGS,2001
Accidents Deaths Nonfatal
States
Cnt
Per100
Xings
Per100K
Vehicles
Per100KADT Cnt
Per100
Xings
Per100K
Vehicles
Per100KADT Cnt
Per100
Xings
Per100K
Vehicles
Per100KADT
Alabama 89 2.60 2.07 1.29 8 0.23 0.19 0.12 23 0.67 5.36 0.03Alaska 4 1.79 0.65 0.83 . . . . 1 0.45 1.63 0.02Arizona 24 2.55 0.58 0.80 4 0.43 0.10 0.13 8 0.85 1.92 0.03Arkansas 80 2.53 4.23 2.08 8 0.25 0.42 0.21 37 1.17 19.54 0.10California 135 1.72 0.46 0.33 29 0.37 0.10 0.07 37 0.47 1.26 0.01Colorado 28 1.44 0.58 0.70 3 0.15 0.06 0.07 7 0.36 1.45 0.02Connecticut . . . . . . . . . . . .Delaware 6 1.96 0.90 0.56 1 0.33 0.15 0.09 . . . .Dist Of Columbia . . . . . . . . . . . .Florida 94 2.37 0.64 0.49 9 0.23 0.06 0.05 28 0.71 1.91 0.01Georgia 116 1.97 1.57 1.27 16 0.27 0.22 0.18 50 0.85 6.76 0.05Hawaii 1 12.50 . 3.70 . . . . . . . .Idaho 17 1.27 1.25 0.99 1 0.07 0.07 0.06 7 0.52 5.14 0.04Illinois 167 2.02 1.65 0.94 16 0.19 0.16 0.09 79 0.96 7.81 0.04Indiana 145 2.28 2.52 1.09 17 0.27 0.30 0.13 55 0.87 9.56 0.04Iowa 94 1.84 2.72 1.77 14 0.27 0.41 0.26 34 0.66 9.84 0.06Kansas 54 0.82 2.27 1.13 5 0.08 0.21 0.10 19 0.29 7.97 0.04Kentucky 58 2.31 1.58 1.45 8 0.32 0.22 0.20 21 0.84 5.72 0.05Louisiana 146 4.15 3.99 2.05 20 0.57 0.55 0.28 85 2.41 23.23 0.12Maine 7 0.83 0.67 0.35 . . . . 4 0.48 3.81 0.02Maryland 13 1.87 0.33 0.53 1 0.14 0.03 0.04 6 0.86 1.50 0.02Massachusetts 15 1.33 0.28 0.36 . . . . 4 0.35 0.75 0.01Michigan 87 1.61 1.01 0.57 8 0.15 0.09 0.05 35 0.65 4.04 0.02Minnesota 68 1.34 0.15 1.02 5 0.10 0.01 0.07 23 0.45 0.50 0.03Mississippi 93 3.39 4.70 1.91 21 0.76 1.06 0.43 42 1.53 21.21 0.09Missouri 53 1.12 1.24 1.08 3 0.06 0.07 0.06 19 0.40 4.45 0.04Montana 13 0.87 1.23 0.99 . . . . 2 0.13 1.89 0.02Nebraska 38 1.00 2.29 1.55 3 0.08 0.18 0.12 11 0.29 6.64 0.04Nevada 2 0.66 0.15 0.22 . . . . . . . .New Hampshire 1 0.25 0.09 0.10 . . . . . . . .New Jersey 26 1.40 0.39 0.24 4 0.22 0.06 0.04 10 0.54 1.49 0.01New Mexico 18 2.33 1.24 2.02 4 0.52 0.27 0.45 6 0.78 4.12 0.07New York 20 0.67 0.19 0.27 4 0.13 0.04 0.05 3 0.10 0.29 0.00North Carolina 62 1.37 0.99 0.67 2 0.04 0.03 0.02 17 0.38 2.71 0.02North Dakota 14 0.32 1.93 1.11 1 0.02 0.14 0.08 5 0.12 6.89 0.04Ohio 120 1.86 1.11 0.84 22 0.34 0.20 0.15 39 0.60 3.60 0.03Oklahoma 63 1.47 1.88 1.35 7 0.16 0.21 0.15 19 0.44 5.66 0.04Oregon 23 0.99 0.74 0.51 4 0.17 0.13 0.09 7 0.30 2.25 0.02Pennsylvania 59 1.09 0.60 0.36 6 0.11 0.06 0.04 8 0.15 0.81 0.00Rhode Island . . . . . . . . . . . .South Carolina 57 1.92 1.78 0.97 4 0.13 0.13 0.07 21 0.71 6.56 0.04South Dakota 16 0.75 1.92 1.26 1 0.05 0.12 0.08 3 0.14 3.59 0.02Tennessee 78 2.42 1.49 1.16 10 0.31 0.19 0.15 35 1.08 6.70 0.05Texas 301 2.53 2.07 1.06 34 0.29 0.23 0.12 112 0.94 7.69 0.04Utah 17 1.77 0.95 0.92 1 0.10 0.06 0.05 7 0.73 3.91 0.04Vermont . . . . . . . . . . . .Virginia 30 1.46 0.48 0.51 . . . . 12 0.59 1.92 0.02Washington 28 1.01 0.53 0.54 2 0.07 0.04 0.04 4 0.14 0.75 0.01West Virginia 13 0.82 0.88 0.73 1 0.06 0.07 0.06 7 0.44 4.73 0.04Wisconsin 99 2.34 2.11 1.05 8 0.19 0.17 0.08 42 0.99 8.97 0.04Wyoming 3 0.70 0.51 0.92 . . . . 1 0.23 1.68 0.03Total... 2,695 1.75 0.98 0.82 315 0.20 0.11 0.10 995 0.65 3.61 0.03

TABLE 8-2 RATES FOR MOTOR VEHICLE INCIDENTS AT PUBLIC CROSSINGS BYWARNING DEVICE, 2001
Accidents Deaths Nonfatal
Type Warning
Cnt
Per100
Xings
Per100KADT Cnt
Per100
Xings
Per100KADT Cnt
Per100
Xings
Per100KADT
Numberof
CrossingsUnknown 18 0.01 0.01 1 0.00 0.00 1 0.00 0.00 154,202Other 8 . . . . . 1 . . .Cross bucks 933 . . 120 . . 387 . . .Stop signs 279 . . 35 . . 119 . . .Special warning 26 . . . . . 7 . . .HWTS,WW,Bells 39 . . 1 . . 11 . . .Flashing lights 583 . . 62 . . 237 . . .Gates 809 . . 96 . . 232 . . .Total 2,695 1.75 0.82 315 0.20 0.10 995 0.65 0.30 154,202

TABLES 8-3 MOTOR VEHICLE HRC INCIDENTS AT PUBLIC CROSSINGS, 2001 BY RAILROAD AND TYPE WARNING
Types of Warning Type Incident
Railroads
GatesFlashing
lights
HWTS,WW,Bells Watchman
Stopsigns
Crossbucks Other None
Rail Equip Struck
HighwayUser
HighwayUser
StruckRail
Equip Alaska RR Corp. - 3 - - - 1 - - 1 3Amtrak 75 17 - - 7 15 - - 98 16Bangor & Aroostook - 1 - - - - - - 1 -Burlington Northern Santa Fe 138 55 2 5 19 162 - 2 295 88Belt Rwy Of Chicago 2 1 - - - - - - 1 2Conrail Shared Assets 3 6 - 1 1 3 - 3 9 8CSX Transportation 141 120 11 2 53 119 4 4 370 84Delaware & Hudson 1 - - - - 1 - - 1 1Dakota,Minnesota & Eastern 1 3 - - - 5 - - 3 6Duluth,Missabe & Iron Range - - - - - 1 - - - 1Duluth,Winnipeg & Pacific - 1 - - - - - - - 1Elgin, Joliet & Eastern 2 - - - - 1 - - - 3Florida East Coast 18 1 - - - - - - 17 2Guilford Rail System 1 1 - - - 1 - - 2 1Grand Trunk Western RR 10 6 - - 5 1 - - 13 9Gateway Western - - - - - 2 - - 2 -Illinois Central 8 23 - - 11 38 - - 60 20Indiana Harbor Belt 4 2 - - 1 1 - - 5 3I & M Rail Link, LLC 5 4 - - 8 13 - 1 28 3Kansas City Southern 12 25 4 - 8 59 - - 80 28Long Island Rail Road 3 - - - - - - - 2 1Mass Bay Transit Auth. 6 - - - - - - - 6 -Metro North Commuter 1 - - - - - - - 1 -Montana Rail Link - 1 1 1 1 5 - - 6 3Northern IN Comm Trans - 2 - - 1 - - - 2 1Northeast IL Reg Comm 23 2 - - - - - - 21 4New Jersey Transit Rail 9 - - - - - - - 8 1Norfolk Southern Corp. 121 104 3 6 41 140 1 3 336 83Paducah & Louisville - 4 - - - 1 - - 5 -Peninsula Comm San Mateo Cnty 2 - - - - - - - 2 -Port Terminal RR Assn 2 1 - - 1 2 - - 4 2Southern CA Reg Rail Auth. 6 - - - - - - - 5 1Soo Line 6 8 - - 8 4 - - 18 8Texas Mexican 1 1 - - - 1 - - 2 1Term RR Assn Of St. Louis - 1 - - - - - - 1 -Union Pacific 168 102 6 4 61 187 2 4 422 112Wisconsin Central Ltd. 11 24 - 1 18 22 - - 50 26Wheeling & Lake Erie - 2 - - - 8 - - 3 7Other Railroads 29 62 12 6 35 140 1 1 172 114Total 809 583 39 26 279 933 8 18 2,052 643
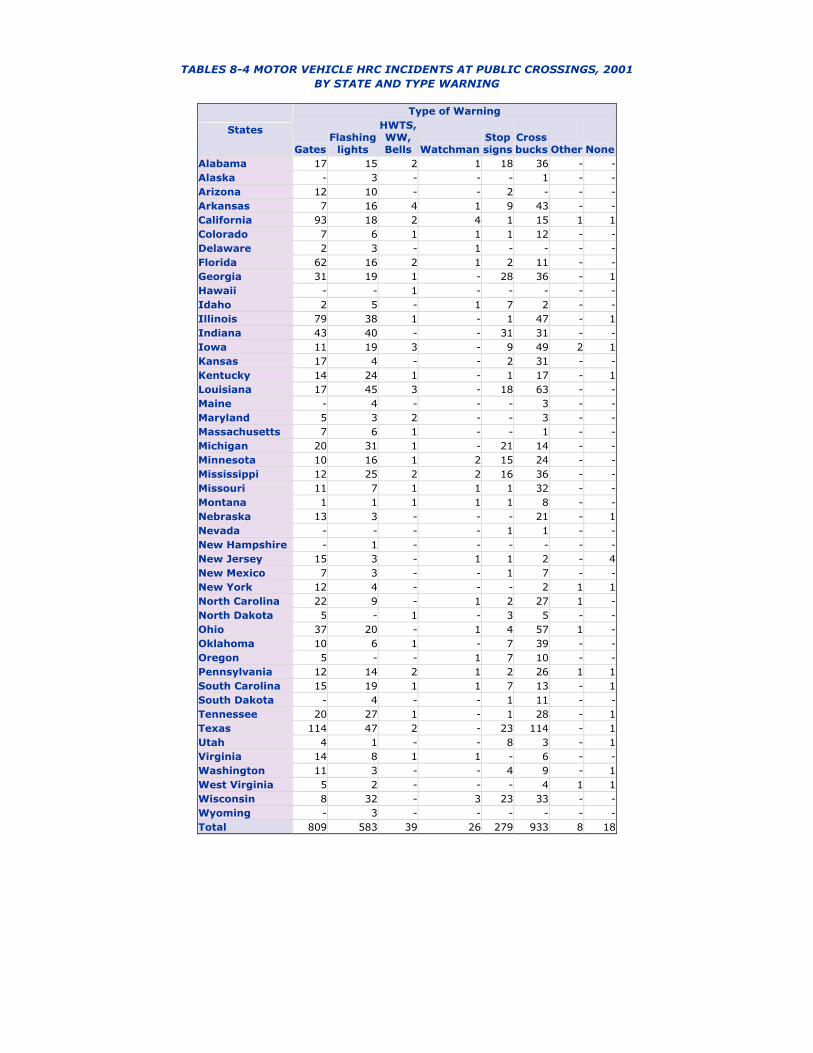
TABLES 8-4 MOTOR VEHICLE HRC INCIDENTS AT PUBLIC CROSSINGS, 2001 BY STATE AND TYPE WARNING
Type of Warning
States
GatesFlashing
lights
HWTS,WW,Bells Watchman
Stopsigns
Crossbucks Other None
Alabama 17 15 2 1 18 36 - -Alaska - 3 - - - 1 - -Arizona 12 10 - - 2 - - -Arkansas 7 16 4 1 9 43 - -California 93 18 2 4 1 15 1 1Colorado 7 6 1 1 1 12 - -Delaware 2 3 - 1 - - - -Florida 62 16 2 1 2 11 - -Georgia 31 19 1 - 28 36 - 1Hawaii - - 1 - - - - -Idaho 2 5 - 1 7 2 - -Illinois 79 38 1 - 1 47 - 1Indiana 43 40 - - 31 31 - -Iowa 11 19 3 - 9 49 2 1Kansas 17 4 - - 2 31 - -Kentucky 14 24 1 - 1 17 - 1Louisiana 17 45 3 - 18 63 - -Maine - 4 - - - 3 - -Maryland 5 3 2 - - 3 - -Massachusetts 7 6 1 - - 1 - -Michigan 20 31 1 - 21 14 - -Minnesota 10 16 1 2 15 24 - -Mississippi 12 25 2 2 16 36 - -Missouri 11 7 1 1 1 32 - -Montana 1 1 1 1 1 8 - -Nebraska 13 3 - - - 21 - 1Nevada - - - - 1 1 - -New Hampshire - 1 - - - - - -New Jersey 15 3 - 1 1 2 - 4New Mexico 7 3 - - 1 7 - -New York 12 4 - - - 2 1 1North Carolina 22 9 - 1 2 27 1 -North Dakota 5 - 1 - 3 5 - -Ohio 37 20 - 1 4 57 1 -Oklahoma 10 6 1 - 7 39 - -Oregon 5 - - 1 7 10 - -Pennsylvania 12 14 2 1 2 26 1 1South Carolina 15 19 1 1 7 13 - 1South Dakota - 4 - - 1 11 - -Tennessee 20 27 1 - 1 28 - 1Texas 114 47 2 - 23 114 - 1Utah 4 1 - - 8 3 - 1Virginia 14 8 1 1 - 6 - -Washington 11 3 - - 4 9 - 1West Virginia 5 2 - - - 4 1 1Wisconsin 8 32 - 3 23 33 - -Wyoming - 3 - - - - - -Total 809 583 39 26 279 933 8 18

TABLE 8-5 MOTOR VEHICLE HRC INCIDENTS AT PUBLIC CROSSING, 2001 BY TYPE CONSIST AND CONSIST SPEED
Rail Equip Struck Highway User Whistle Ban?
Consist Speed
TotalFreightTrain
Psgr Comm
TrnWorkTrain Car(s)
YardSwitch
Light loco(s) Yes No Unk
Unknown 1 1 - - - - - - - 11-9 348 172 11 2 16 93 54 16 311 2110-19 246 152 10 3 15 27 39 26 217 320-29 344 289 14 7 7 5 22 20 317 730-39 369 342 13 4 - 3 7 9 352 840-49 401 376 16 - 2 1 6 6 386 950-59 214 187 22 1 - - 4 10 201 3>= 60 129 53 76 - - - - 6 119 4Total 2,052 1,572 162 17 40 129 132 93 1,903 56
Highway User Struck Rail Equip Whistle
Ban?Consist Speed
TotalFreightTrain
Psgr Comm
TrnWorkTrain Car(s)
YardSwitch
Light loco(s) Yes No Unk
Unknown 72 44 - 1 7 16 4 3 64 51-9 169 86 1 - 11 50 21 7 158 410-19 119 80 4 1 7 13 14 5 112 220-29 93 81 3 1 1 3 4 2 90 130-39 67 62 3 - - 1 1 1 64 240-49 65 61 2 - - 1 1 1 63 150-59 35 30 4 - - - 1 - 35 ->= 60 23 10 13 - - - - 1 21 1Total 643 454 30 3 26 84 46 20 607 16
Grand Total Whistle Ban?
Consist Speed
TotalFreightTrain
Psgr Comm
TrnWorkTrain Car(s)
YardSwitch
Light loco(s) Yes No Unk
Unknown 73 45 - 1 7 16 4 3 64 61-9 517 258 12 2 27 143 75 23 469 2510-19 365 232 14 4 22 40 53 31 329 520-29 437 370 17 8 8 8 26 22 407 830-39 436 404 16 4 - 4 8 10 416 1040-49 466 437 18 - 2 2 7 7 449 1050-59 249 217 26 1 - - 5 10 236 3>= 60 152 63 89 - - - - 7 140 5Total 2,695 2,026 192 20 66 213 178 113 2,510 72

TABLE 8-6 MOTOR VEHICLE HRC INCIDENTS AT PUBLIC CROSSINGS, 2001 BY TYPE WARNING, MOTORIST ACTION, AND WARNING LOCATION
Rail Equip Struck Highway User Total Motorist Warning Location
Type Warning
Cnt %
Drovearound
thrugate
Stoppedthen
proceed
Did notstop Other Unknown
Notreported
Bothsides
VehApr
Opp.VehApr
Gates 663 24.6 195 23 60 279 106 - 652 10 1Flashing lights 397 14.7 - 36 238 112 11 - 382 14 1HWTS, WW, Bells 23 0.9 - 1 11 10 1 - 22 1 -Watchman 14 0.5 - 2 11 1 - - 12 1 1Stop signs 232 8.6 - 33 140 57 2 - 224 8 -Cross bucks 701 26.0 - 49 453 186 13 - 678 17 6Other 8 0.3 - 1 4 3 - - 7 1 -None 14 0.5 - 2 9 2 1 13 - 1 -Total 2,052 76.1 195 147 926 650 134 13 1,977 53 9
Highway User Struck Rail Equip Total Motorist Warning Location
Type Warning
Cnt %
Drovearound
thrugate
Stoppedthen
proceed
Did notstop Other Unknown
Notreported
Bothsides
VehApr
Opp.VehApr
Gates 146 5.4 86 6 44 1 9 - 143 3 -Flashing lights 186 6.9 - 11 169 1 5 - 174 12 -HWTS, WW, Bells 16 0.6 - 2 14 - - - 15 - 1Watchman 12 0.4 - 3 9 - - - 10 2 -Stop signs 47 1.7 - 2 45 - - - 46 1 -Cross bucks 232 8.6 - 6 218 2 6 - 218 14 -None 4 0.1 - - 4 - - 2 2 - -Total 643 23.9 86 30 503 4 20 2 608 32 1
Grand Total Total Motorist Warning Location
Type Warning
Cnt %
Drovearound
thrugate
Stoppedthen
proceed
Did notstop Other Unknown
Notreported
Bothsides
VehApr
Opp.VehApr
Gates 809 30.0 281 29 104 280 115 - 795 13 1Flashing lights 583 21.6 - 47 407 113 16 - 556 26 1HWTS, WW, Bells 39 1.4 - 3 25 10 1 - 37 1 1Watchman 26 1.0 - 5 20 1 - - 22 3 1Stop signs 279 10.4 - 35 185 57 2 - 270 9 -Cross bucks 933 34.6 - 55 671 188 19 - 896 31 6Other 8 0.3 - 1 4 3 - - 7 1 -None 18 0.7 - 2 13 2 1 15 2 1 -Total 2,695 100.0 281 177 1,429 654 154 15 2,585 85 10

TABLE 8-7 MOTOR VEHICLE HRC INCIDENTS AT PUBLIC CROSSINGS, 2001 BY TYPE VEHICLE, VEHICLE SPEED AND DRIVER GENDER
Rail Equip Struck Highway User DriverGender
Vehicle Speed
Total Car TrucksTrk&Trail Van Buses
OthMtrV. ? M F
Unknown 64 41 6 11 4 - 2 2 34 28Stopped 741 412 175 100 30 4 20 30 530 1811-9 505 226 141 108 15 3 12 8 380 11710-19 350 163 112 55 15 - 5 16 249 8520-29 214 102 72 22 13 1 4 3 158 5330-39 102 56 28 12 5 - 1 3 72 2740-49 46 30 12 2 2 - - 1 33 1250-59 22 10 7 3 2 - - 1 16 5>= 60 8 4 - 3 - - 1 - 7 1Total 2,052 1,044 553 316 86 8 45 64 1,479 509
Highway User Struck Rail Equip DriverGender
Vehicle Speed
Total Car TrucksTrk&Trail Van
OthMtrV. ? M F
Unknown 35 15 12 4 3 1 2 24 9Stopped 5 4 - 1 - - - 3 21-9 163 92 51 12 6 2 6 110 4710-19 148 91 41 7 6 3 5 113 3020-29 105 55 36 6 5 3 2 80 2330-39 67 35 24 1 5 2 - 51 1640-49 68 40 22 2 3 1 - 51 1750-59 40 19 13 4 4 - - 31 9>= 60 12 7 5 - - - - 10 2Total 643 358 204 37 32 12 15 473 155
Grand Total DriverGender
Vehicle Speed
Total Car TrucksTrk&Trail Van Buses
OthMtrV. ? M F
Unknown 99 56 18 15 7 - 3 4 58 37Stopped 746 416 175 101 30 4 20 30 533 1831-9 668 318 192 120 21 3 14 14 490 16410-19 498 254 153 62 21 - 8 21 362 11520-29 319 157 108 28 18 1 7 5 238 7630-39 169 91 52 13 10 - 3 3 123 4340-49 114 70 34 4 5 - 1 1 84 2950-59 62 29 20 7 6 - - 1 47 14>= 60 20 11 5 3 - - 1 - 17 3Total 2,695 1,402 757 353 118 8 57 79 1,952 664

TABLE 8-8 MOTOR VEHICLE HRC INCIDENTS AT PUBLIC CROSSINGS, 2001 BY VEHICLE SPEED, WEATHER AND CONDITION OF DRIVER
Rail Equip Struck Highway User DriverVehicle
Speed Total Clear Cloudy Rain Fog Sleet Snow ? Kld Nonfatal UnhurtUnknown 64 38 15 9 2 - - - 4 11 49Stopped 741 535 131 47 16 4 8 1 29 87 6241-9 505 360 93 38 6 - 8 - 53 126 32610-19 350 264 66 13 4 - 3 - 48 95 20720-29 214 146 43 24 - 1 - - 30 65 11930-39 102 74 18 8 - - 2 - 13 32 5740-49 46 36 7 3 - - - - 7 19 2050-59 22 12 7 2 1 - - - 3 9 10>= 60 8 5 3 - - - - - 1 1 6Total 2,052 1,470 383 144 29 5 21 1 188 445 1,418
Highway User Struck Rail Equip DriverVehicle
Speed Total Clear Cloudy Rain Fog Sleet Snow ? Kld Nonfatal UnhurtUnknown 35 26 2 4 2 - 1 1 3 15 16Stopped 5 5 - - - - - - - - 51-9 163 101 36 16 3 1 6 - 7 34 12210-19 148 100 25 10 7 1 5 - 4 32 11220-29 105 69 23 10 1 - 2 - 2 31 7230-39 67 44 9 7 4 - 3 - 5 22 4040-49 68 45 15 6 1 - 1 - 6 31 3150-59 40 27 4 5 3 - 1 - 7 16 17>= 60 12 7 2 3 - - - - 4 5 3Total 643 424 116 61 21 2 19 1 38 186 418
Grand Total DriverVehicle
Speed Total Clear Cloudy Rain Fog Sleet Snow ? Kld Nonfatal UnhurtUnknown 99 64 17 13 4 - 1 1 7 26 65Stopped 746 540 131 47 16 4 8 1 29 87 6291-9 668 461 129 54 9 1 14 - 60 160 44810-19 498 364 91 23 11 1 8 - 52 127 31920-29 319 215 66 34 1 1 2 - 32 96 19130-39 169 118 27 15 4 - 5 - 18 54 9740-49 114 81 22 9 1 - 1 - 13 50 5150-59 62 39 11 7 4 - 1 - 10 25 27>= 60 20 12 5 3 - - - - 5 6 9Total 2,695 1,894 499 205 50 7 40 2 226 631 1,836

TABLE 8-9 MOTOR VEHICLE HRC INCIDENTS AT PUBLIC CROSSINGS, 2001 BY DRIVER AGE, GENDER, AND TYPE VEHICLE
Total Type Vehicle DriverGender
Age
Cnt % Car TruckTrk&Trail
PickupTrk Van Bus
SchoolBus Motorcycle
OthMtrV. ? M F
Unknown 353 13.1 197 31 48 51 20 - - 1 5 75 231 4711-15 9 0.3 6 - - 1 - - - - 2 - 6 316-20 263 9.8 170 19 5 51 9 - - 1 8 1 169 9321-25 393 14.6 233 40 38 67 11 - - - 4 - 305 8826-30 274 10.2 138 31 33 57 11 2 - - 2 1 205 6831-35 243 9.0 101 46 34 46 8 - 1 - 7 - 182 6136-40 246 9.1 112 28 41 38 19 - - 2 6 - 187 5941-45 198 7.3 82 18 44 40 9 - - 1 4 - 150 4846-50 184 6.8 79 27 41 25 7 1 - 1 3 2 139 4351-55 150 5.6 57 22 25 26 15 1 - - 4 - 115 3556-60 91 3.4 38 10 15 23 4 1 - - - - 69 2261-65 76 2.8 35 7 19 10 3 - - - 2 - 54 2266-70 63 2.3 42 2 7 9 1 1 1 - - - 42 21Other 152 5.6 112 12 3 20 1 - - - 4 - 98 54Total 2,695 100.0 1,402 293 353 464 118 6 2 6 51 79 1,952 664

TABLE 8-10 MOTOR VEHICLES THAT STRUCK CONSIST AT PUBLIC CROSSINGS,2001 BY CONSIST LENGTH, PORTION OF TRAIN STRUCK AND WARNING TYPE
Position of Consist Struck Type of Warning
ConsistLength
Total
1stcar/loco
1stQtr
2ndQtr
3rdQtr
4thQtr Gates
Flashinglights
HWTS,WW,Bells Watchman
Stopsigns
Crossbucks None
1 45 44 1 - - - 15 9 3 1 3 13 12-5 96 78 1 5 4 8 18 32 3 4 8 29 26-10 56 37 4 10 4 1 8 19 1 1 3 24 -11-15 36 28 4 2 1 1 8 14 1 2 1 10 -16-20 25 16 3 2 1 3 6 5 - - 2 12 -21-25 26 14 4 2 4 2 4 7 - 2 3 10 -26-30 20 8 5 - 4 3 3 6 3 - 1 6 131-35 28 12 5 5 3 3 5 8 2 - 1 12 -36-40 12 3 3 - 2 4 3 3 - - - 6 -41-45 23 11 4 4 1 3 3 5 - - 3 12 -46-50 22 11 3 3 2 3 6 9 - - 1 6 -51-60 32 21 3 4 2 2 6 10 - - 1 15 -61-70 32 18 4 3 2 5 8 10 - 2 2 10 -71-80 32 16 6 4 3 3 8 8 - - 5 11 -81-90 26 13 9 - 2 2 8 9 - - 3 6 -91-100 25 13 9 1 1 1 5 9 2 - 1 8 -> 100 107 43 18 14 19 13 32 23 1 - 9 42 --Total 643 386 86 59 55 57 146 186 16 12 47 232 4

TABLE 8-11 MOTOR VEHICLE HRC INCIDENTS AT PUBLIC CROSSINGS, 2001 BY CONSIST LENGTH, TYPE CONSIST, AND DRIVER GENDER
Rail Equip Struck Highway User DriverGender
ConsistLength
TotalFreightTrain
Psgr Comm
TrnWorkTrain Car(s)
YardSwitch
Light loco(s) ? M F
1 109 - - - 36 - 73 1 77 312-5 216 66 41 9 3 41 56 9 147 606-10 183 79 65 - 1 35 3 3 127 5311-15 107 56 27 2 - 22 - 4 76 2716-20 97 62 18 2 - 15 - 3 68 2621-25 73 70 1 1 - 1 - 3 57 1326-30 74 66 4 - - 4 - 1 52 2131-35 67 59 5 - - 3 - 4 46 1736-40 68 65 1 1 - 1 - 2 52 1441-45 53 52 - - - 1 - - 45 846-50 67 66 - - - 1 - 2 48 1751-60 142 139 - 1 - 2 - 6 103 3361-70 121 120 - - - 1 - 5 86 3071-80 117 117 - - - - - 5 83 2981-90 107 107 - - - - - 3 82 2291-100 119 118 - 1 - - - 2 92 25> 100 332 330 - - - 2 - 11 238 83Total 2,052 1,572 162 17 40 129 132 64 1,479 509
Highway User Struck Rail Equip DriverGender
ConsistLength
TotalFreightTrain
Psgr Comm
TrnWorkTrain Car(s)
YardSwitch
Light loco(s) ? M F
1 45 - - - 23 - 22 1 25 192-5 96 36 9 1 - 26 24 1 71 246-10 56 31 9 1 - 15 - 1 34 2111-15 36 18 7 1 - 10 - 2 27 716-20 25 14 1 - - 10 - 1 21 321-25 26 18 3 - 1 4 - - 22 426-30 20 17 1 - - 2 - - 16 431-35 28 26 - - - 2 - - 23 536-40 12 10 - - - 2 - - 7 541-45 23 22 - - - 1 - - 19 446-50 22 21 - - - 1 - - 16 651-60 32 29 - - - 3 - 1 26 561-70 32 29 - - 1 2 - - 22 1071-80 32 29 - - - 3 - 1 22 981-90 26 26 - - - - - 4 20 291-100 25 23 - - 1 1 - - 23 2> 100 107 105 - - - 2 - 3 79 25Total 643 454 30 3 26 84 46 15 473 155

TABLE 8-12 MOTOR VEHICLE HRC INCIDENTS AT PUBLIC CROSSINGS, 2001 BY TYPE CONSIST, NUMBER OF PEOPLE ON TRAIN, AND TYPE PERSON HURT
People on Train Total Hwy User RR Employees OthersConsist
Total Avg Kld Nonfatal Kld Nonfatal Kld Nonfatal Kld NonfatalFreight Train 4,546 2 245 758 245 718 0 40 0 0Psgr Train 19,407 136 45 74 45 52 0 12 0 10Commuter Train 7,769 159 5 18 5 10 0 2 0 6Work Train 44 2 - 9 0 6 0 3 0 0Single Car 3 1 - 1 0 1 0 0 0 0Cut of Cars 5 2 3 2 3 2 0 0 0 0Yard/ Switch 577 3 5 59 5 56 0 3 0 0Light loco(s) 442 2 10 48 10 44 0 4 0 0Maint Insp car 76 1 2 26 2 20 0 6 0 0Total 32,869 12 315 995 315 909 0 70 0 16
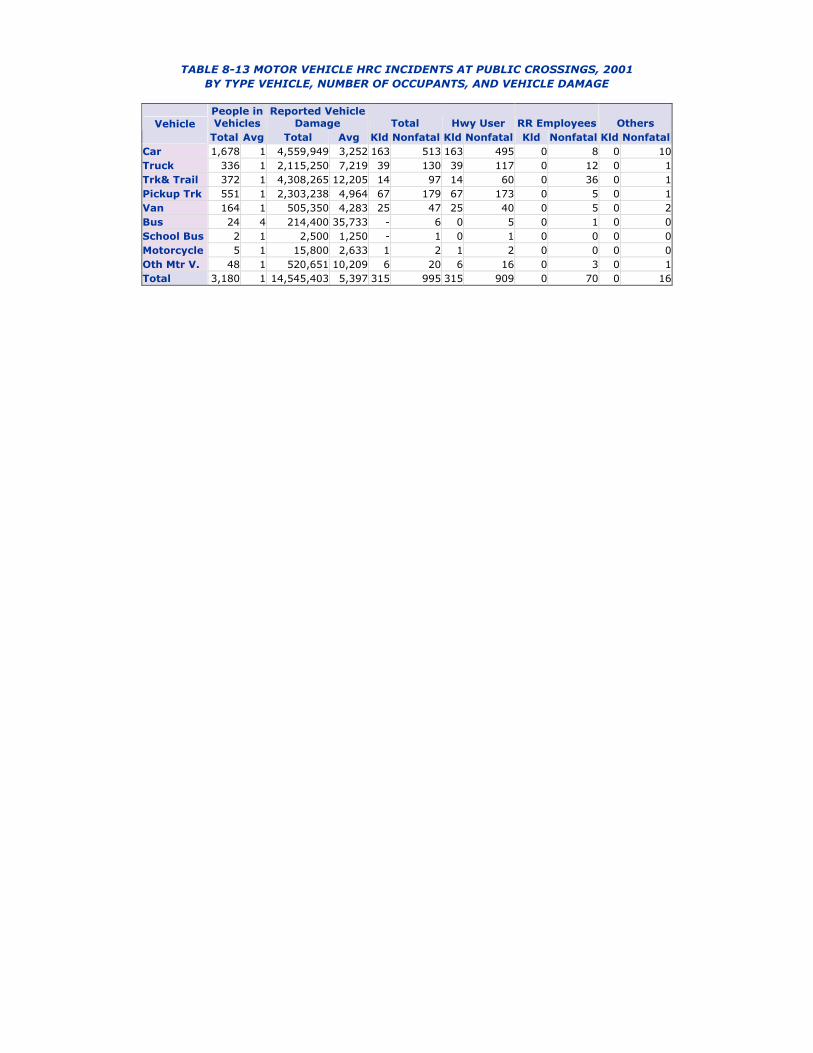
TABLE 8-13 MOTOR VEHICLE HRC INCIDENTS AT PUBLIC CROSSINGS, 2001 BY TYPE VEHICLE, NUMBER OF OCCUPANTS, AND VEHICLE DAMAGE
People in Vehicles
Reported VehicleDamage Total Hwy User RR Employees OthersVehicle
Total Avg Total Avg Kld Nonfatal Kld Nonfatal Kld Nonfatal Kld NonfatalCar 1,678 1 4,559,949 3,252 163 513 163 495 0 8 0 10Truck 336 1 2,115,250 7,219 39 130 39 117 0 12 0 1Trk& Trail 372 1 4,308,265 12,205 14 97 14 60 0 36 0 1Pickup Trk 551 1 2,303,238 4,964 67 179 67 173 0 5 0 1Van 164 1 505,350 4,283 25 47 25 40 0 5 0 2Bus 24 4 214,400 35,733 - 6 0 5 0 1 0 0School Bus 2 1 2,500 1,250 - 1 0 1 0 0 0 0Motorcycle 5 1 15,800 2,633 1 2 1 2 0 0 0 0Oth Mtr V. 48 1 520,651 10,209 6 20 6 16 0 3 0 1Total 3,180 1 14,545,403 5,397 315 995 315 909 0 70 0 16

TABLE 8-14 MOTOR VEHICLE HRC INCIDENTS AT PUBLIC CROSSINGS, 2001 BY TYPE WARNING, POSITION ON CROSSING AND IF HAZMAT WASRELEASED
Rail Equip Struck Highway User Total Position on Crossing Hazmat Released By
Type Warning Cnt % Stalled Stopped Moving Trapped
HwyUser
Rail User Both Neither
Gates 663 24.6 110 246 275 32 3 138 4 518Flashing lights 397 14.7 22 98 274 3 3 70 2 322HWTS, WW, Bells 23 0.9 3 7 13 - - 5 - 18Watchman 14 0.5 - 1 13 - - 1 - 13Stop signs 232 8.6 12 46 173 1 1 51 3 177Cross bucks 701 26.0 39 151 505 6 3 159 3 536Other 8 0.3 2 1 5 - - 1 - 7None 14 0.5 1 2 11 - - 1 - 13Total 2,052 76.1 189 552 1,269 42 10 426 12 1,604
Highway User Struck Rail Equip
Total Position on Crossing Hazmat Released
ByType Warning
Cnt % Stalled Stopped Moving TrappedHwyUser
Rail User Neither
Gates 146 5.4 - 1 144 1 3 29 114Flashing lights 186 6.9 - 1 184 1 - 34 152HWTS, WW, Bells 16 0.6 - 1 15 - - 1 15Watchman 12 0.4 - - 12 - - - 12Stop signs 47 1.7 - - 47 - - 6 41Cross bucks 232 8.6 1 2 229 - 1 46 185None 4 0.1 - - 4 - - - 4Total 643 23.9 1 5 635 2 4 116 523
Grand Total Total Position on Crossing Hazmat Released By
Type Warning Cnt % Stalled Stopped Moving Trapped
HwyUser
Rail User Both Neither
Gates 809 30.0 110 247 419 33 6 167 4 632Flashing lights 583 21.6 22 99 458 4 3 104 2 474HWTS, WW, Bells 39 1.4 3 8 28 - - 6 - 33Watchman 26 1.0 - 1 25 - - 1 - 25Stop signs 279 10.4 12 46 220 1 1 57 3 218Cross bucks 933 34.6 40 153 734 6 4 205 3 721Other 8 0.3 2 1 5 - - 1 - 7None 18 0.7 1 2 15 - - 1 - 17Total 2,695 100.0 190 557 1,904 44 14 542 12 2,127

TABLE 8-15 MOTOR VEHICLE HRC INCIDENTS AT PUBLIC CROSSINGS, 2001 BY TYPE VEHICLE AND WARNING
Rail Equip Struck Highway User Total
TypeVehicle
Cnt % GatesFlashing
lights
HWTS,WW,Bells Watchman
Stopsigns
Crossbucks Other None
Car 1,044 38.7 392 210 12 6 101 312 6 5Truck 227 8.4 57 47 5 2 35 78 1 2Trk& Trail 316 11.7 85 59 5 4 47 111 1 4Pickup Trk 326 12.1 75 57 1 - 39 153 - 1Van 86 3.2 33 21 - 1 5 24 - 2Bus 6 0.2 4 - - - - 2 - -School Bus 2 0.1 1 - - - - 1 - -Motorcycle 4 0.1 4 - - - - - - -Oth Mtr V. 41 1.5 12 3 - 1 5 20 - -Total 2,052 76.1 663 397 23 14 232 701 8 14
Highway User Struck Rail Equip Total
TypeVehicle
Cnt % GatesFlashing
lights
HWTS,WW,Bells Watchman
Stopsigns
Crossbucks None
Car 358 13.3 94 102 11 9 23 116 3Truck 66 2.4 11 19 2 2 6 26 -Trk& Trail 37 1.4 10 15 1 1 1 9 -Pickup Trk 138 5.1 19 42 2 - 14 61 -Van 32 1.2 11 7 - - 1 12 1Motorcycle 2 0.1 - - - - - 2 -Oth Mtr V. 10 0.4 1 1 - - 2 6 -Total 643 23.9 146 186 16 12 47 232 4
Grand Total Total
TypeVehicle
Cnt % GatesFlashing
lights
HWTS,WW,Bells Watchman
Stopsigns
Crossbucks Other None
Car 1,402 52.0 486 312 23 15 124 428 6 8Truck 293 10.9 68 66 7 4 41 104 1 2Trk& Trail 353 13.1 95 74 6 5 48 120 1 4Pickup Trk 464 17.2 94 99 3 - 53 214 - 1Van 118 4.4 44 28 - 1 6 36 - 3Bus 6 0.2 4 - - - - 2 - -School Bus 2 0.1 1 - - - - 1 - -Motorcycle 6 0.2 4 - - - - 2 - -Oth Mtr V. 51 1.9 13 4 - 1 7 26 - -Total 2,695 100.0 809 583 39 26 279 933 8 18

TABLE 8-16 MOTOR VEHICLE HRC INCIDENTS AT PUBLIC CROSSING, 2001 BY WARNING STATUS FOR ACCIDENTS OCCURING AT CROSSINGS
WITH TRAIN ACTIVATED DEVICES BY TYPE VEHICLE
Rail Equip Struck Highway User Status of Warning System
TypeVehicle
Total Unknown
ProvidedMinimum20 Secs.
Alleged > 60Secs.
Alleged < 20Secs.
Alleged No
WarningConfirm > 60
Secs.Confirm < 20
Secs.
Confirm No
WarningCar 614 3 575 14 8 8 1 2 3Truck 109 - 104 1 3 1 - - -Trk& Trail 149 - 142 6 1 - - - -Pickup Trk 133 - 126 3 1 - - - 3Van 54 1 51 1 - - - - 1Bus 4 - 2 2 - - - - -School Bus 1 - 1 - - - - - -Motorcycle 4 - 4 - - - - - -Oth Mtr V. 15 - 15 - - - - - -Total 1,083 4 1,020 27 13 9 1 2 7
Highway User Struck Rail Equip Status of Warning System
TypeVehicle
Total Unknown
ProvidedMinimum20 Secs.
Alleged > 60Secs.
Alleged < 20Secs.
Alleged No
WarningConfirm > 60
Secs.
Confirm No
WarningCar 207 3 197 - 2 1 1 3Truck 32 - 30 1 - 1 - -Trk& Trail 26 - 25 1 - - - -Pickup Trk 63 - 61 - - - - 2Van 18 - 17 - - - - 1Oth Mtr V. 2 - 2 - - - - -Total 348 3 332 2 2 2 1 6
Grand Total Status of Warning System
TypeVehicle
Total Unknown
ProvidedMinimum20 Secs.
Alleged > 60Secs.
Alleged < 20Secs.
Alleged No
WarningConfirm > 60
Secs.Confirm < 20
Secs.
Confirm No
WarningCar 821 6 772 14 10 9 2 2 6Truck 141 - 134 2 3 2 - - -Trk& Trail 175 - 167 7 1 - - - -Pickup Trk 196 - 187 3 1 - - - 5Van 72 1 68 1 - - - - 2Bus 4 - 2 2 - - - - -School Bus 1 - 1 - - - - - -Motorcycle 4 - 4 - - - - - -Oth Mtr V. 17 - 17 - - - - - -Total 1,431 7 1,352 29 15 11 2 2 13

Railroad Safety Statistics-Annual Report 2001 04/01/2003
CHAPTER 9
HIGHWAY-RAIL CROSSING INVENTORY
The Federal-Aid Highway Act of 1973 (Section 203) required that each State highway agency maintain an inventory of all crossings. According to the implementing instructions contained in the Federal-Aid Policy Guide, maintaining the National Inventory will satisfy the legislative requirement for a State Inventory. A primary purpose of the National Inventory is to provide for the existence of a uniform inventory database, which can be merged with accident/incident files and used to analyze information for planning and implementation of crossing improvement programs.
Railroads, with direction and guidance from the Association of American Railroads and the American Short Line Association, were assigned the responsibility for making a site-specific inventory of each highway-rail crossing and for installing a unique identifying number at each location. The railroads were also identified as being responsible for periodic updating of certain inventory information and maintenance of the crossing number.
The State highway-departments assisted in the project by providing site-specific highway location and use data. State public utility commissions and other State and local governmental agencies also participated in the project. The responsibility for the updating of certain highway information data items was determined to be the responsibility of the State and/or local governmental agencies.
The Inventory Data File is a record of grade crossing location, physical, and operational characteristics to provide information for the administration and statistical analysis of crossings. This information is reported on a voluntary basis to the FRA on the U.S. DOT-AAR Crossing Inventory Form.
The information contained on highway-rail incident reports is routinely merged with inventory data and the consolidated file is used for the development of Federal programs, funding alternatives for crossing improvement, studies related to railroad safety programs, effectiveness of warning devise, and for other safety programs and issues.
Although the inventory contains information on grade separated crossings, the counts appearing in this section are only for at-grade crossings, i.e., the locations where the potential exists for an impact between a rail and a highway user.

Railroad Safety Statistics-Annual Report 2001 04/01/2003
CONTENTS
CHAPTER 9
HIGHWAY-RAIL CROSSING INVENTORY
Tables
9-1 At-grade highway-rail crossings, by railroad, 2001 .........................................……………. 9-2 At-grade highway-rail crossings, by state, 2001 ..............................................…………….9-3 Public at-grade crossings, by warning device and railroad, 2001 ....................…………….9-4 Public at grade crossings, by warning device and state, 2001..........................……….……9-5 Private/pedestrian at-grade crossings, by type development and railroad, 2001…………... 9-6 Private/pedestrian at-grade crossings, by type development and state, 2001….....………...

TABLE 9-1 AT-GRADE HIGHWAY-RAIL CROSSINGS BY RAILROAD, 2001
Total PedestrianPrivate Vehicle
Public Vehicle Railroads
Cnt % Cnt % Cnt % Cnt %Alton & Southern 42 0.0 - - 26 0.0 16 0.0Alaska RR Corp. 337 0.1 8 0.0 109 0.0 220 0.1Amtrak 297 0.1 13 0.0 61 0.0 223 0.1Bangor & Aroostook 504 0.2 5 0.0 341 0.1 158 0.1Bessemer & Lake Erie RR 238 0.1 2 0.0 96 0.0 140 0.1Burlington Northern Santa Fe 34,774 13.7 253 0.1 13,471 5.3 21,050 8.3Belt Rwy Of Chicago 120 0.0 - - 76 0.0 44 0.0Consolidated Rail Corp. 5,019 2.0 58 0.0 1,607 0.6 3,354 1.3Conrail Shared Assets 89 0.0 - - 27 0.0 62 0.0CSX Transportation 30,362 11.9 324 0.1 10,334 4.1 19,704 7.7Delaware & Hudson 710 0.3 16 0.0 411 0.2 283 0.1Dakota,Minnesota & Eastern 1,368 0.5 2 0.0 554 0.2 812 0.3Duluth,Missabe & Iron Range 270 0.1 1 0.0 129 0.1 140 0.1Duluth,Winnipeg & Pacific 101 0.0 - - 20 0.0 81 0.0Elgin, Joliet & Eastern 286 0.1 8 0.0 93 0.0 185 0.1Florida East Coast 851 0.3 11 0.0 110 0.0 730 0.3Guilford Rail System 1,713 0.7 13 0.0 609 0.2 1,091 0.4Grand Trunk Western RR 1,224 0.5 9 0.0 380 0.1 835 0.3Gateway Western 572 0.2 4 0.0 246 0.1 322 0.1Illinois Central 5,610 2.2 65 0.0 2,132 0.8 3,413 1.3Indiana Harbor Belt 123 0.0 2 0.0 46 0.0 75 0.0I & M Rail Link, LLC 927 0.4 6 0.0 441 0.2 480 0.2Kansas City Southern 4,271 1.7 11 0.0 1,644 0.6 2,616 1.0Long Island Rail Road 395 0.2 9 0.0 83 0.0 303 0.1Mass Bay Transit Auth. 163 0.1 3 0.0 48 0.0 112 0.0Metro North Commuter 128 0.1 1 0.0 64 0.0 63 0.0Montana Rail Link 1,160 0.5 3 0.0 707 0.3 450 0.2Northern IN Comm Trans 153 0.1 7 0.0 24 0.0 122 0.0Northeast IL Reg Comm 229 0.1 22 0.0 36 0.0 171 0.1New Jersey Transit Rail 458 0.2 26 0.0 89 0.0 343 0.1Norfolk Southern Corp. 33,321 13.1 139 0.1 12,887 5.1 20,295 8.0Paducah & Louisville 451 0.2 3 0.0 186 0.1 262 0.1Port Auth Trans Hudson 2 0.0 - - 2 0.0 - -Port Terminal RR Assn 163 0.1 1 0.0 97 0.0 65 0.0Southern CA Reg Rail Auth. 393 0.2 17 0.0 46 0.0 330 0.1Southeastern PA Trans. 289 0.1 8 0.0 48 0.0 233 0.1Soo Line 2,608 1.0 15 0.0 1,336 0.5 1,257 0.5Texas Mexican 427 0.2 - - 196 0.1 231 0.1Term RR Assn Of St. Louis 126 0.0 - - 11 0.0 115 0.0Union Pacific 50,514 19.9 321 0.1 19,898 7.8 30,295 11.9Union RR (Pittsburgh) 59 0.0 6 0.0 39 0.0 14 0.0Wisconsin Central Ltd. 3,974 1.6 48 0.0 1,474 0.6 2,452 1.0Wheeling & Lake Erie 972 0.4 9 0.0 402 0.2 561 0.2Other Railroads 68,662 27.0 515 0.2 27,653 10.9 40,494 15.9Total 254,455 100.0 1,964 0.8 98,289 38.6 154,202 60.6

TABLE 9-2 AT-GRADE HIGHWAY-RAIL CROSSINGS BY STATE, 2001
Total PedestrianPrivate Vehicle
Public Vehicle States
Cnt % Cnt % Cnt % Cnt %Alabama 5,327 2.1 20 0.0 1,879 0.7 3,428 1.3Alaska 341 0.1 8 0.0 109 0.0 224 0.1Arizona 1,643 0.6 7 0.0 695 0.3 941 0.4Arkansas 4,688 1.8 9 0.0 1,516 0.6 3,163 1.2California 12,776 5.0 160 0.1 4,773 1.9 7,843 3.1Colorado 3,305 1.3 22 0.0 1,338 0.5 1,945 0.8Connecticut 649 0.3 8 0.0 277 0.1 364 0.1Delaware 456 0.2 2 0.0 148 0.1 306 0.1Dist Of Columbia 42 0.0 11 0.0 8 0.0 23 0.0Florida 5,326 2.1 59 0.0 1,302 0.5 3,965 1.6Georgia 8,433 3.3 39 0.0 2,510 1.0 5,884 2.3Hawaii 8 0.0 - - - - 8 0.0Idaho 2,558 1.0 12 0.0 1,210 0.5 1,336 0.5Illinois 13,409 5.3 278 0.1 4,880 1.9 8,251 3.2Indiana 8,832 3.5 68 0.0 2,407 0.9 6,357 2.5Iowa 9,239 3.6 44 0.0 4,076 1.6 5,119 2.0Kansas 10,761 4.2 32 0.0 4,124 1.6 6,605 2.6Kentucky 5,065 2.0 39 0.0 2,516 1.0 2,510 1.0Louisiana 6,742 2.6 36 0.0 3,186 1.3 3,520 1.4Maine 1,684 0.7 9 0.0 835 0.3 840 0.3Maryland 1,394 0.5 7 0.0 692 0.3 695 0.3Massachusetts 1,663 0.7 18 0.0 514 0.2 1,131 0.4Michigan 8,024 3.2 66 0.0 2,557 1.0 5,401 2.1Minnesota 8,200 3.2 50 0.0 3,059 1.2 5,091 2.0Mississippi 4,731 1.9 16 0.0 1,968 0.8 2,747 1.1Missouri 8,031 3.2 70 0.0 3,248 1.3 4,713 1.9Montana 3,514 1.4 16 0.0 2,007 0.8 1,491 0.6Nebraska 6,581 2.6 16 0.0 2,749 1.1 3,816 1.5Nevada 571 0.2 3 0.0 267 0.1 301 0.1New Hampshire 637 0.3 10 0.0 224 0.1 403 0.2New Jersey 2,494 1.0 50 0.0 586 0.2 1,858 0.7New Mexico 1,353 0.5 1 0.0 578 0.2 774 0.3New York 6,029 2.4 69 0.0 2,970 1.2 2,990 1.2North Carolina 7,831 3.1 55 0.0 3,255 1.3 4,521 1.8North Dakota 6,353 2.5 19 0.0 2,003 0.8 4,331 1.7Ohio 9,700 3.8 30 0.0 3,222 1.3 6,448 2.5Oklahoma 5,908 2.3 15 0.0 1,611 0.6 4,282 1.7Oregon 5,240 2.1 91 0.0 2,836 1.1 2,313 0.9Pennsylvania 8,717 3.4 119 0.0 3,191 1.3 5,407 2.1Rhode Island 190 0.1 1 0.0 71 0.0 118 0.0South Carolina 4,282 1.7 11 0.0 1,297 0.5 2,974 1.2South Dakota 3,495 1.4 6 0.0 1,349 0.5 2,140 0.8Tennessee 5,091 2.0 25 0.0 1,837 0.7 3,229 1.3Texas 18,017 7.1 35 0.0 6,108 2.4 11,874 4.7Utah 1,682 0.7 3 0.0 721 0.3 958 0.4Vermont 1,176 0.5 44 0.0 636 0.2 496 0.2Virginia 4,841 1.9 44 0.0 2,746 1.1 2,051 0.8Washington 5,757 2.3 59 0.0 2,919 1.1 2,779 1.1West Virginia 3,595 1.4 57 0.0 1,953 0.8 1,585 0.6Wisconsin 6,887 2.7 93 0.0 2,568 1.0 4,226 1.7Wyoming 1,187 0.5 2 0.0 758 0.3 427 0.2Total 254,455 100.0 1,964 0.8 98,289 38.6 154,202 60.6

TABLE 9-3 PUBLIC AT GRADE BY WARNING DEVICE AND RAILROAD, 2001
Total
Railroads
Cnt % Unknown OtherCrossbucks
Stopsigns
Special warning
HWTS,WW,Bells
Flashinglights Gates
Alton & Southern 16 0.01 - - 3 - - - 7 6Alaska RR Corp. 220 0.14 8 2 95 27 7 - 30 51Amtrak 223 0.14 4 3 4 4 5 - 4 199Bangor & Aroostook 158 0.10 - - 57 4 5 - 87 5Bessemer & Lake Erie RR 140 0.09 2 - 70 - 2 - 29 37Burlington Northern Santa Fe 21,050 13.65 428 29 11,362 915 178 118 2,591 5,429Belt Rwy Of Chicago 44 0.03 5 - 14 - 1 - 8 16Consolidated Rail Corp. 3,354 2.18 394 133 920 58 602 66 885 296Conrail Shared Assets 62 0.04 15 - 8 - 23 - 12 4CSX Transportation 19,704 12.78 480 9 5,859 1,626 410 97 4,292 6,931Delaware & Hudson 283 0.18 2 - 46 4 1 3 40 187Dakota,Minnesota & Eastern 812 0.53 31 - 602 47 - 3 101 28Duluth,Missabe & Iron Range 140 0.09 1 3 73 32 2 - 16 13Duluth,Winnipeg & Pacific 81 0.05 - - 42 14 1 - 9 15Elgin, Joliet & Eastern 185 0.12 - - 23 2 7 2 53 98Florida East Coast 730 0.47 9 - 46 3 27 - 31 614Guilford Rail System 1,091 0.71 46 2 258 33 174 24 321 233Grand Trunk Western RR 835 0.54 6 - 39 200 26 3 165 396Gateway Western 322 0.21 - - 181 9 - 15 89 28Illinois Central 3,413 2.21 150 51 1,427 294 48 19 811 613Indiana Harbor Belt 75 0.05 2 - 5 - 15 - 20 33I & M Rail Link, LLC 480 0.31 3 - 276 41 12 4 104 40Kansas City Southern 2,616 1.70 111 11 1,476 166 2 7 461 382Long Island Rail Road 303 0.20 - 1 8 - - - - 294Mass Bay Transit Auth. 112 0.07 1 - 2 - 26 1 18 64Metro North Commuter 63 0.04 2 - 3 - 1 1 36 20Montana Rail Link 450 0.29 6 - 267 45 - 1 64 67Northern IN Comm Trans 122 0.08 1 - 5 27 - 7 42 40Northeast IL Reg Comm 171 0.11 1 - 4 1 - 1 14 150New Jersey Transit Rail 343 0.22 7 - 28 1 10 1 79 217Norfolk Southern Corp. 20,295 13.16 654 98 7,286 1,756 454 105 3,830 6,112Paducah & Louisville 262 0.17 3 1 121 9 1 3 104 20Port Terminal RR Assn 65 0.04 5 - 25 1 - - 11 23Southern CA Reg Rail Auth. 330 0.21 - - 31 4 - - 20 275Southeastern PA Trans. 233 0.15 45 10 27 9 17 21 63 41Soo Line 1,257 0.82 56 - 659 173 9 2 158 200Texas Mexican 231 0.15 7 - 137 6 10 - 53 18Term RR Assn Of St. Louis 115 0.07 1 - 11 2 41 - 17 43Union Pacific 30,295 19.65 1,202 48 14,438 1,808 276 377 4,290 7,856Union RR (Pittsburgh) 14 0.01 - - - - - 10 1 3Wisconsin Central Ltd. 2,452 1.59 17 - 1,090 359 18 14 661 293Wheeling & Lake Erie 561 0.36 10 - 275 22 1 3 140 110Other Railroads 40,494 26.26 1,470 238 22,658 3,803 1,178 434 6,791 3,922Total 154,202 100.0 5,185 639 69,961 11,505 3,590 1,342 26,558 35,422

TABLE 9-4 PUBLIC AT GRADE BY WARNING DEVICE AND STATE, 2001
Total
States
Cnt % Unknown OtherCrossbucks
Stopsigns
Special warning
HWTS,WW,Bells
Flashinglights Gates AADT
Alabama 3,428 2.22 108 10 1,458 684 24 14 610 520 6,887,780Alaska 224 0.15 9 2 98 27 7 - 30 51 479,358Arizona 941 0.61 24 - 349 101 11 5 66 385 2,994,009Arkansas 3,163 2.05 123 1 1,932 206 68 29 430 374 3,848,487California 7,843 5.09 174 19 2,855 325 42 274 998 3,156 40,996,053Colorado 1,945 1.26 66 3 930 231 34 37 246 398 4,009,344Connecticut 364 0.24 13 - 29 45 26 5 142 104 1,275,237Delaware 306 0.20 15 - 48 4 21 1 168 49 1,071,492Dist Of Columbia 23 0.01 8 - 1 3 9 - 2 - 179,150Florida 3,965 2.57 55 5 826 155 90 10 557 2,267 19,134,870Georgia 5,884 3.82 169 7 2,444 1,099 111 14 307 1,733 9,139,826Hawaii 8 0.01 - 1 6 1 - - - - 27,000Idaho 1,336 0.87 14 - 452 555 2 4 174 135 1,711,986Illinois 8,251 5.35 198 1 3,247 57 118 79 2,236 2,315 17,719,136Indiana 6,357 4.12 121 7 2,135 944 74 88 1,484 1,504 13,294,447Iowa 5,119 3.32 78 1 2,922 373 38 28 985 694 5,319,794Kansas 6,605 4.28 115 12 4,533 254 69 45 600 977 4,791,848Kentucky 2,510 1.63 118 1 1,072 53 51 15 790 410 4,003,416Louisiana 3,520 2.28 216 15 1,740 256 36 26 653 578 7,110,360Maine 840 0.54 4 - 273 12 70 5 401 75 1,991,034Maryland 695 0.45 28 1 257 38 27 23 213 108 2,471,228Massachusetts 1,131 0.73 50 2 193 9 175 29 408 265 4,163,931Michigan 5,401 3.50 151 5 1,173 1,624 96 30 1,378 944 15,132,591Minnesota 5,091 3.30 99 3 2,956 698 17 12 570 736 6,674,280Mississippi 2,747 1.78 176 124 1,079 539 47 8 526 248 4,858,481Missouri 4,713 3.06 217 4 2,658 121 93 53 913 654 4,927,454Montana 1,491 0.97 52 - 984 88 10 3 164 190 1,311,516Nebraska 3,816 2.47 111 11 2,570 202 4 9 260 649 2,446,133Nevada 301 0.20 5 - 132 10 1 1 23 129 895,881New Hampshire 403 0.26 2 2 110 39 80 10 125 35 1,039,669New Jersey 1,858 1.20 121 2 398 19 234 17 659 408 10,995,200New Mexico 774 0.50 8 4 415 21 1 6 104 215 890,336New York 2,990 1.94 78 20 623 21 171 48 490 1,539 7,527,882North Carolina 4,521 2.93 191 7 1,962 63 148 17 704 1,429 9,192,266North Dakota 4,331 2.81 148 - 3,563 68 1 - 65 486 1,265,746Ohio 6,448 4.18 91 10 2,658 170 72 31 1,123 2,293 14,214,092Oklahoma 4,282 2.78 65 7 2,778 123 64 23 616 606 4,671,620Oregon 2,313 1.50 123 43 863 437 90 44 136 577 4,537,462Pennsylvania 5,407 3.51 440 282 1,801 118 612 104 1,304 746 16,318,702Rhode Island 118 0.08 22 1 7 4 22 22 24 16 547,375South Carolina 2,974 1.93 21 - 1,127 385 117 2 467 855 5,853,383South Dakota 2,140 1.39 75 - 1,819 29 - 1 197 19 1,271,486Tennessee 3,229 2.09 197 2 1,533 165 174 16 700 442 6,748,271Texas 11,874 7.70 499 10 5,906 322 99 67 1,569 3,402 28,281,432Utah 958 0.62 68 5 402 49 82 5 159 188 1,852,480Vermont 496 0.32 6 - 196 25 42 3 193 31 736,535Virginia 2,051 1.33 47 1 504 10 56 9 472 952 5,839,437Washington 2,779 1.80 275 2 1,387 102 45 27 382 559 5,200,273West Virginia 1,585 1.03 129 6 713 25 17 5 464 226 1,772,977Wisconsin 4,226 2.74 46 - 1,698 579 91 37 1,197 578 9,422,141Wyoming 427 0.28 16 - 146 17 1 1 74 172 326,459Total 154,202 100.0 5,185 639 69,961 11,505 3,590 1,342 26,558 35,422 327,371,346

TABLE 9-5 PRIVATE/PEDESTRIAN AT GRADE BY DEVELOPMENT AND RAILROAD,2001
TotalRailroads
Cnt %Not
reported Farm Residential Recreational IndustrialAlton & Southern 26 0.03 - 8 5 - 13Alaska RR Corp. 109 0.11 - 4 15 5 85Amtrak 61 0.06 - 32 13 2 14Bangor & Aroostook 341 0.35 - 148 33 45 115Bessemer & Lake Erie RR 96 0.10 - 38 12 2 44Burlington Northern Santa Fe 13,471 13.70 2 9,393 932 151 2,993Belt Rwy Of Chicago 76 0.08 - - - - 76Consolidated Rail Corp. 1,607 1.63 - 666 155 51 735Conrail Shared Assets 27 0.03 - - 1 1 25CSX Transportation 10,335 10.51 394 5,533 1,863 189 2,356Delaware & Hudson 411 0.42 - 275 48 36 52Dakota,Minnesota & Eastern 554 0.56 - 477 8 1 68Duluth,Missabe & Iron Range 129 0.13 - 24 17 1 87Duluth,Winnipeg & Pacific 20 0.02 - 4 4 7 5Elgin, Joliet & Eastern 93 0.09 - 38 1 - 54Florida East Coast 112 0.11 85 4 3 - 20Guilford Rail System 610 0.62 - 207 64 21 318Grand Trunk Western RR 380 0.39 - 277 26 6 71Gateway Western 246 0.25 - 216 2 1 27Illinois Central 2,132 2.17 - 1,441 224 14 453Indiana Harbor Belt 46 0.05 1 - 2 - 43I & M Rail Link, LLC 441 0.45 - 294 81 15 51Kansas City Southern 1,644 1.67 - 1,086 199 10 349Long Island Rail Road 83 0.08 1 67 4 3 8Mass Bay Transit Auth. 48 0.05 - 15 8 6 19Metro North Commuter 64 0.07 - 14 9 7 34Montana Rail Link 707 0.72 - 488 64 16 139Northern IN Comm Trans 24 0.02 - 8 1 - 15Northeast IL Reg Comm 36 0.04 - 12 8 1 15New Jersey Transit Rail 89 0.09 - 35 16 4 34Norfolk Southern Corp. 12,887 13.11 902 7,097 2,334 200 2,354Paducah & Louisville 186 0.19 - 118 30 1 37Port Auth Trans Hudson 2 0.00 - 1 - - 1Port Terminal RR Assn 97 0.10 - 1 - - 96Southern CA Reg Rail Auth. 46 0.05 - 13 6 3 24Southeastern PA Trans. 48 0.05 - 20 12 2 14Soo Line 1,336 1.36 - 1,084 60 12 180Texas Mexican 196 0.20 1 118 18 2 57Term RR Assn Of St. Louis 11 0.01 - 3 - - 8Union Pacific 19,899 20.24 190 12,936 1,588 215 4,970Union RR (Pittsburgh) 39 0.04 - - - - 39Wisconsin Central Ltd. 1,474 1.50 - 853 152 45 424Wheeling & Lake Erie 402 0.41 - 216 36 6 144Other Railroads 27,659 28.14 171 16,983 3,532 541 6,432Total 98,300 100.0 1,747 60,247 11,586 1,622 23,098

TABLE 9-6 PRIVATE/PEDESTRIAN AT GRADE BY TYPE DEVELOPMENT ANDSTATE, 2001
TotalStates
Cnt %Not
reported Farm Residential Recreational IndustrialAlabama 1,879 1.91 5 1,080 322 31 441Alaska 109 0.11 - 4 15 5 85Arizona 695 0.71 1 400 24 12 258Arkansas 1,516 1.54 - 998 225 20 273California 4,774 4.86 9 2,101 339 122 2,203Colorado 1,338 1.36 2 812 242 16 266Connecticut 277 0.28 1 54 39 35 148Delaware 148 0.15 - 82 37 4 25Dist Of Columbia 8 0.01 - - - - 8Florida 1,311 1.33 215 423 185 25 463Georgia 2,510 2.55 - 1,376 601 32 501Idaho 1,210 1.23 1 769 51 9 380Illinois 4,880 4.96 1 3,192 425 70 1,192Indiana 2,406 2.45 5 1,584 291 28 498Iowa 4,076 4.15 - 3,042 330 50 654Kansas 4,124 4.20 - 3,508 197 7 412Kentucky 2,516 2.56 - 1,464 681 16 355Louisiana 3,186 3.24 - 1,738 490 21 937Maine 835 0.85 - 348 113 73 301Maryland 692 0.70 - 394 72 16 210Massachusetts 514 0.52 - 168 63 38 245Michigan 2,557 2.60 - 1,319 374 123 741Minnesota 3,059 3.11 1 2,191 242 52 573Mississippi 1,968 2.00 2 1,302 391 7 266Missouri 3,248 3.30 1 2,310 338 25 574Montana 2,007 2.04 - 1,573 106 25 303Nebraska 2,749 2.80 - 2,426 83 13 227Nevada 267 0.27 191 28 3 8 37New Hampshire 225 0.23 2 112 32 23 56New Jersey 586 0.60 1 195 63 11 316New Mexico 578 0.59 - 427 28 2 121New York 2,970 3.02 5 2,007 330 96 532North Carolina 3,255 3.31 1 1,608 829 30 787North Dakota 2,003 2.04 - 1,786 25 10 182Ohio 3,222 3.28 - 2,110 286 37 789Oklahoma 1,611 1.64 - 1,206 149 10 246Oregon 2,837 2.89 - 1,352 335 41 1,109Pennsylvania 3,191 3.25 4 1,376 470 148 1,193Rhode Island 71 0.07 - 7 18 9 37South Carolina 1,297 1.32 - 655 303 20 319South Dakota 1,349 1.37 - 1,126 81 4 138Tennessee 1,837 1.87 - 1,071 386 25 355Texas 6,108 6.21 3 4,050 517 34 1,504Utah 721 0.73 - 473 35 16 197Vermont 636 0.65 - 441 63 27 105Virginia 2,746 2.79 1,293 965 192 18 278Washington 2,919 2.97 - 1,411 373 54 1,081West Virginia 1,953 1.99 1 854 596 42 460Wisconsin 2,568 2.61 1 1,677 184 81 625Wyoming 758 0.77 1 652 12 1 92Total 98,300 100.0 1,747 60,247 11,586 1,622 23,098

Railroad Safety Statistics-Annual Report 2001 04/01/2003
CHAPTER 10
TRESPASSERS, NOT AT HIGHWAY-RAIL CROSSINGS
A “trespasser” is defined as any person who is on that part of railroad property used in railroad operation and whose presence is prohibited, forbidden, or unlawful. Employees who are trespassing on railroad property are to be reported as “Trespassers” (Class E).
A person on a highway-rail crossing should not be classified as a trespasser unless the crossing is protected by gates, or other similar barriers that were closed when the person went on the crossing, or unless the person attempted to pass over, under, or between cars or locomotives of a consist occupying the crossing. Although these individuals are identified as “trespassers” on form FRA F 6180.55a, they are excluded from this chapter because the incident is defined as a highway-rail incident. These casualties can be found in Chapters 7 and 8 that summarize highway-rail crossing incidents.

Railroad Safety Statistics-Annual Report 2001 04/01/2003
CONTENTS
CHAPTER 10
TRESPASSERS, NOT AT HIGHWAY-RAIL CROSSINGS
Tables
10-1 Reportable conditions to trespassers, 2001 .....................................................…………….. 10-2 Trespassers killed, by railroad and age, 2001.................................................……………... 10-3 Trespassers killed, by state and age, 2001.............................................................………… 10-4 Trespassers injured, by railroad and age, 2001......................................................………… 10-5 Trespassers injured, by state and age, 2001 ......................................................…………… 10-6 Trespasser casualties, by state and age group, 2001..............................................………… 10-7 Trespasser casualties, by month and day, 2001.....................................................………… 10-8 Trespasser casualties, by time and day, 2001........................................................………… 10-9 Trespasser casualties, by location, 2001................................................................………… 10-10 Trespasser casualties, by event, 2001....................................................................…………
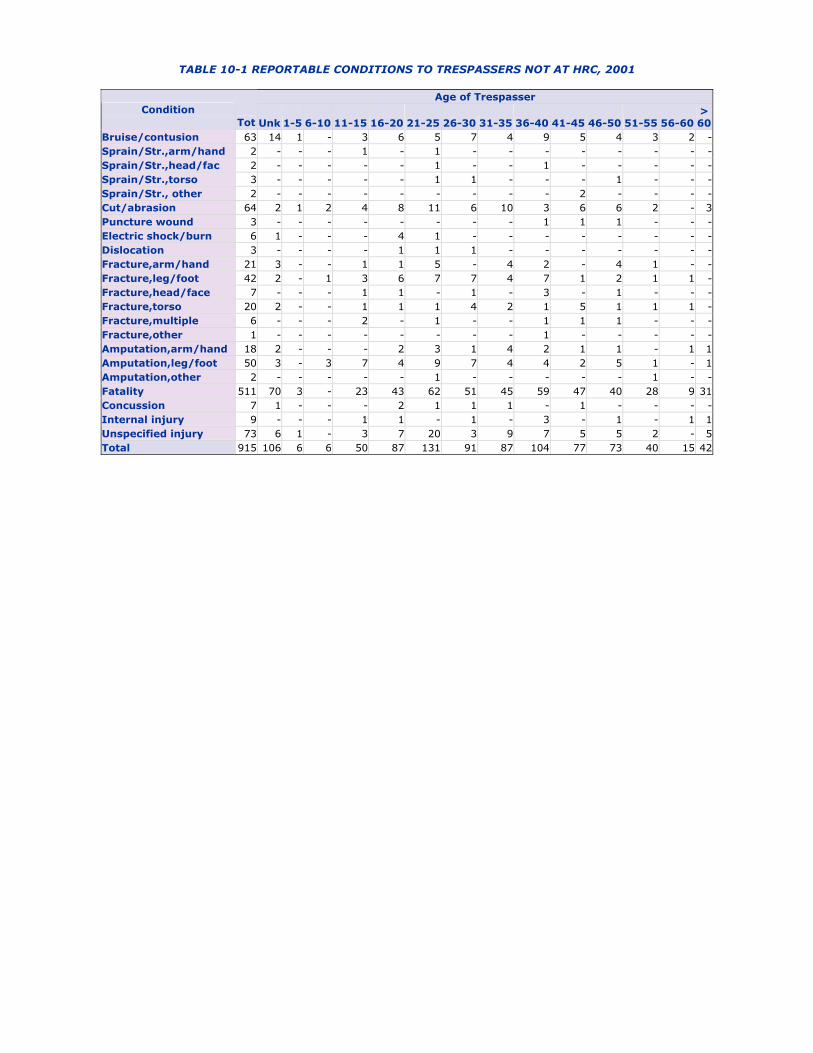
TABLE 10-1 REPORTABLE CONDITIONS TO TRESPASSERS NOT AT HRC, 2001
Age of Trespasser Condition
Tot Unk 1-5 6-10 11-15 16-20 21-25 26-30 31-35 36-40 41-45 46-50 51-55 56-60>60
Bruise/contusion 63 14 1 - 3 6 5 7 4 9 5 4 3 2 -Sprain/Str.,arm/hand 2 - - - 1 - 1 - - - - - - - -Sprain/Str.,head/fac 2 - - - - - 1 - - 1 - - - - -Sprain/Str.,torso 3 - - - - - 1 1 - - - 1 - - -Sprain/Str., other 2 - - - - - - - - - 2 - - - -Cut/abrasion 64 2 1 2 4 8 11 6 10 3 6 6 2 - 3Puncture wound 3 - - - - - - - - 1 1 1 - - -Electric shock/burn 6 1 - - - 4 1 - - - - - - - -Dislocation 3 - - - - 1 1 1 - - - - - - -Fracture,arm/hand 21 3 - - 1 1 5 - 4 2 - 4 1 - -Fracture,leg/foot 42 2 - 1 3 6 7 7 4 7 1 2 1 1 -Fracture,head/face 7 - - - 1 1 - 1 - 3 - 1 - - -Fracture,torso 20 2 - - 1 1 1 4 2 1 5 1 1 1 -Fracture,multiple 6 - - - 2 - 1 - - 1 1 1 - - -Fracture,other 1 - - - - - - - - 1 - - - - -Amputation,arm/hand 18 2 - - - 2 3 1 4 2 1 1 - 1 1Amputation,leg/foot 50 3 - 3 7 4 9 7 4 4 2 5 1 - 1Amputation,other 2 - - - - - 1 - - - - - 1 - -Fatality 511 70 3 - 23 43 62 51 45 59 47 40 28 9 31Concussion 7 1 - - - 2 1 1 1 - 1 - - - -Internal injury 9 - - - 1 1 - 1 - 3 - 1 - 1 1Unspecified injury 73 6 1 - 3 7 20 3 9 7 5 5 2 - 5Total 915 106 6 6 50 87 131 91 87 104 77 73 40 15 42

TABLE 10-2 TRESPASSERS KILLED, BY RAILROAD AND AGE, NOT AT HRC,2001
Age of Trespasser Railroads
Tot Unk 1-5 11-15 16-20 21-25 26-30 31-35 36-40 41-45 46-50 51-55 56-60>60
Amtrak 67 29 1 3 7 2 2 4 6 4 1 - 1 7Burlington Northern Santa Fe 62 15 - 1 1 11 4 5 9 5 4 4 - 3Conrail Shared Assets 5 - - - - - - - 2 2 1 - - -CSX Transportation 78 - - 2 6 21 4 7 8 12 4 6 2 6Delaware & Hudson 3 - - - - - - 1 1 - 1 - - -Florida East Coast 10 5 - - - 1 1 - 1 1 1 - - -Guilford Rail System 1 - - - 1 - - - - - - - - -Grand Trunk Western RR 3 1 - 1 - - - - - - - - - 1Gateway Western 1 - - - - - 1 - - - - - - -Illinois Central 4 - - - 1 - - - - 1 1 - - 1I & M Rail Link, LLC 1 - - - 1 - - - - - - - - -Kansas City Southern 6 1 - - 3 - - - - - 1 - 1 -Long Island Rail Road 6 4 - - 1 - - 1 - - - - - -Mass Bay Transit Auth. 10 2 - - 1 - - - 2 2 1 2 - -Metro North Commuter 2 - - - - - 1 - - - 1 - - -Montana Rail Link 1 - - - - - - - - - - - 1 -Northeast IL Reg Comm 8 2 - - - 1 2 - - - - - 1 2New Jersey Transit Rail 25 2 - 2 2 2 2 2 6 2 2 1 1 1Norfolk Southern Corp. 55 - - 9 7 3 7 6 3 5 10 2 - 3Port Auth Trans Hudson 1 - - - 1 - - - - - - - - -Peninsula Comm San Mateo Cnty 8 3 - - - - - - 1 2 1 - 1 -Southeastern PA Trans. 1 - - - 1 - - - - - - - - -Soo Line 3 - 1 - - - - - 1 - - 1 - -Union Pacific 132 - 1 4 9 20 26 17 19 9 9 11 1 6Wisconsin Central Ltd. 1 - - - - - - - - - 1 - - -Other Railroads 17 6 - 1 1 1 1 2 - 2 1 1 - 1Total 511 70 3 23 43 62 51 45 59 47 40 28 9 31

TABLE 10-3 TRESPASSERS KILLED, BY STATE AND AGE, NOT AT HRC, 2001
Age of Trespasser States
Tot Unk 1-5 11-15 16-20 21-25 26-30 31-35 36-40 41-45 46-50 51-55 56-60>60
Alabama 12 - - 2 1 1 1 - 1 1 2 1 - 2Arizona 9 2 - - 1 3 1 1 - - 1 - - -Arkansas 7 - - - 1 - - - - 1 1 3 - 1California 76 21 1 1 3 6 10 6 10 5 5 2 1 5Colorado 6 1 - - - - 1 1 1 1 1 - - -Connecticut 3 1 - - - 1 - - - - 1 - - -Delaware 1 1 - - - - - - - - - - - -Dist Of Columbia 1 - - - - - - - - - - - - 1Florida 28 7 1 1 2 4 1 1 3 5 2 - 1 -Georgia 8 - - - - 4 - 1 1 - 2 - - -Idaho 2 - - - 1 - 1 - - - - - - -Illinois 39 6 - 3 3 5 6 1 3 3 3 1 1 4Indiana 9 - - 1 - 2 - 1 1 - 1 2 - 1Iowa 1 - - - 1 - - - - - - - - -Kansas 5 1 - - - - 2 - 1 1 - - - -Kentucky 4 - - 1 - 1 1 - - - - 1 - -Louisiana 10 - - 2 2 2 - - 1 - - 1 1 1Maryland 6 - - - 2 - - - 1 - - - - 3Massachusetts 13 2 - - 3 - - - 2 2 1 2 - 1Michigan 8 1 - 1 - - 2 - 1 2 1 - - -Minnesota 5 1 - - - 1 - - 2 - - 1 - -Mississippi 11 1 - 1 1 1 1 3 1 - - - 1 1Missouri 12 1 - - 1 - 2 2 1 2 1 2 - -Montana 2 - - - - - - - - - 1 - 1 -Nebraska 4 - - - 1 - 1 1 - - - 1 - -Nevada 3 - - - - 1 1 - - - - 1 - -New Jersey 29 2 - 2 3 2 1 2 8 2 4 1 1 1New Mexico 8 2 - 1 1 - - 1 1 1 - - - 1New York 18 5 - - 3 2 3 3 1 1 - - - -North Carolina 19 2 - 1 3 1 4 3 - 2 2 - - 1North Dakota 2 1 - - - - - - - - 1 - - -Ohio 11 1 - 1 - 1 - 3 - 4 1 - - -Oklahoma 5 - - - - 1 - - 1 1 1 - - 1Oregon 7 1 - - - 1 2 1 - - - 1 1 -Pennsylvania 23 2 - 3 4 3 - 1 2 3 3 1 - 1Rhode Island 1 - - - - - - - - - - - - 1South Carolina 8 - - - 2 1 - 2 1 - - 1 - 1Tennessee 13 - - - 2 3 1 1 - 2 1 2 - 1Texas 47 2 - 1 1 6 8 8 11 4 2 3 1 -Utah 2 - - - - 1 - 1 - - - - - -Vermont 1 - - - - - - - - - 1 - - -Virginia 4 - - - 1 1 - - 1 - - - - 1Washington 18 5 - 1 - 5 1 1 2 2 - 1 - -West Virginia 4 - - - - 1 - - 1 2 - - - -Wisconsin 5 - 1 - - 1 - - - - 1 - - 2Wyoming 1 1 - - - - - - - - - - - -Total 511 70 3 23 43 62 51 45 59 47 40 28 9 31

TABLE 10-4 TRESPASSERS INJURED, BY RAILROAD AND AGE, NOT AT HRC,2001
Age of Trespasser Railroads
Cnt % Unk 1-5 6-10 11-15 16-20 21-25 26-30 31-35 36-40 41-45 46-50 51-55 56-60>60
Alaska RR Corp. 1 0.2 1 - - - - - - - - - - - - -Amtrak 37 9.2 12 - - 2 6 3 1 - 3 4 2 3 - 1Burlington Northern Santa Fe 47 11.6 14 - - 2 4 7 1 3 5 3 3 3 2 -Conrail Shared Assets 4 1.0 - - - - - - 1 1 - - 1 - 1 -CSX Transportation 84 20.8 - - 1 7 8 19 11 11 8 6 6 2 1 4Delaware & Hudson 2 0.5 1 - - - - 1 - - - - - - - -Elgin, Joliet & Eastern 2 0.5 - - - - - - - - - 1 - 1 - -Florida East Coast 7 1.7 - - - 1 1 - 1 1 1 - 2 - - -Guilford Rail System 3 0.7 - - - - - - 1 - - - - 1 - 1Grand Trunk Western RR 2 0.5 - - - - 1 - - - 1 - - - - -Illinois Central 3 0.7 - - - 1 1 - - - - - 1 - - -Indiana Harbor Belt 1 0.2 - - - - - - - - - - - - - 1Kansas City Southern 2 0.5 - - - - - - - - 1 1 - - - -Long Island Rail Road 5 1.2 1 - - - - - 1 - - 1 2 - - -Mass Bay Transit Auth. 1 0.2 - - - - - - - - - - 1 - - -Metro North Commuter 2 0.5 1 - - - 1 - - - - - - - - -Northeast IL Reg Comm 7 1.7 1 - - - - 2 1 1 1 - - 1 - -New Jersey Transit Rail 5 1.2 - - - - 1 - - 1 1 1 1 - - -Norfolk Southern Corp. 42 10.4 1 - 2 3 5 6 3 4 11 4 2 - - 1Paducah & Louisville 2 0.5 - - - - - - - - - 2 - - - -Port Auth Trans Hudson 1 0.2 - - - - - 1 - - - - - - - -Peninsula Comm San Mateo Cnty 1 0.2 1 - - - - - - - - - - - - -Southern CA Reg Rail Auth. 1 0.2 1 - - - - - - - - - - - - -Southeastern PA Trans. 2 0.5 - - - - - 2 - - - - - - - -Soo Line 2 0.5 - 1 - - 1 - - - - - - - - -Union Pacific 127 31.4 - 2 3 10 13 27 18 20 12 6 11 1 1 3Wisconsin Central Ltd. 2 0.5 - - - - - - - - - 1 1 - - -Other Railroads 9 2.2 2 - - 1 2 1 1 - 1 - - - 1 -Total 404 100 36 3 6 27 44 69 40 42 45 30 33 12 6 11

TABLE 10-5 TRESPASSERS INJURED, BY STATE AND AGE, NOT AT HRC, 2001
Age of Trespasser States
Cnt % Unk 1-5 6-10 11-15 16-20 21-25 26-30 31-35 36-40 41-45 46-50 51-55 56-60>60
Alabama 3 0.7 1 - - - - - - 1 - - 1 - - -Alaska 1 0.2 1 - - - - - - - - - - - - -Arizona 9 2.2 - - - - 1 3 3 - - 1 1 - - -Arkansas 6 1.5 1 - - 1 1 1 1 1 - - - - - -California 39 9.7 9 - - 2 5 3 - 6 5 2 4 1 1 1Colorado 4 1.0 - - 1 1 - 1 1 - - - - - - -Connecticut 2 0.5 - - - - 2 - - - - - - - - -Delaware 4 1.0 - - - - 2 - - - - 1 - - - 1Dist Of Columbia 2 0.5 - - - - - 1 - - - - - 1 - -Florida 26 6.4 2 - - 3 3 5 2 2 2 1 2 2 - 2Georgia 9 2.2 - - - 1 - 4 - 1 2 - 1 - - -Idaho 1 0.2 - - - 1 - - - - - - - - - -Illinois 27 6.7 3 - - 3 2 4 1 2 5 4 - 2 1 -Indiana 5 1.2 - - - - - - 1 - 2 - 1 - - 1Iowa 5 1.2 - - 1 1 1 1 - - - - - - 1 -Kansas 12 3.0 - - - - 2 6 1 1 1 - - 1 - -Kentucky 8 2.0 - - - 1 - - 3 1 1 2 - - - -Louisiana 8 2.0 1 - - - 1 5 - 1 - - - - - -Maine 2 0.5 - - - - - - 1 - - - - 1 - -Maryland 2 0.5 - - - - 1 - - 1 - - - - - -Massachusetts 8 2.0 - - - 2 - 1 1 1 1 - 1 - - 1Michigan 4 1.0 - - - 1 1 - - 1 1 - - - - -Minnesota 6 1.5 - - - 1 - - - 2 1 1 1 - - -Mississippi 5 1.2 - - - - 1 1 - - 1 1 1 - - -Missouri 8 2.0 3 - - 1 1 - - - 1 - - 1 - 1Montana 1 0.2 - - - - - 1 - - - - - - - -Nebraska 1 0.2 - - - 1 - - - - - - - - - -Nevada 2 0.5 - - - - - - - 1 1 - - - - -New Jersey 8 2.0 - - - - 1 1 1 2 1 1 1 - - -New Mexico 3 0.7 2 - - - - - - - 1 - - - - -New York 25 6.2 3 - - - 3 5 2 1 3 2 3 - 1 2North Carolina 13 3.2 1 - - 1 1 - 4 1 3 2 - - - -North Dakota 3 0.7 - 1 - - 1 - - - 1 - - - - -Ohio 9 2.2 - - 1 1 3 1 1 1 - - 1 - - -Oklahoma 9 2.2 1 - - - 1 2 1 - 1 - 3 - - -Oregon 5 1.2 - - - - - 1 - 1 - 1 2 - - -Pennsylvania 19 4.7 2 - 1 - 1 5 1 - 3 2 2 - 1 1Rhode Island 1 0.2 - - - - - 1 - - - - - - - -South Carolina 4 1.0 - - 1 - - - - 1 2 - - - - -Tennessee 8 2.0 - - - 1 1 2 - 1 2 1 - - - -Texas 60 14.9 3 1 1 2 7 9 11 9 4 7 4 1 1 -Utah 1 0.2 - - - - - - - - - - - - - 1Virginia 14 3.5 1 - - 1 1 5 1 2 - 1 2 - - -Washington 4 1.0 1 - - - - - - - - - 1 2 - -West Virginia 4 1.0 - - - 1 - - 2 1 - - - - - -Wisconsin 1 0.2 - - - - - - - - - - 1 - - -Wyoming 3 0.7 1 1 - - - - 1 - - - - - - -Total 404 100 36 3 6 27 44 69 40 42 45 30 33 12 6 11

TABLE 10-6 TRESPASSERS CASUALTIES NOT AT HRC BY STATE AND AGE GROUP, 2001
Deaths Nonfatal Cases Age Group
TotalKilled Age Group
TotalInjured
States
Unk<16 16-21
>21 Cnt % Unk
<16 16-21
>21 Cnt %
Alabama - 2 2 8 12 2.3 1 - - 2 3 0.7Alaska - - - - 0 0.0 1 - - - 1 0.2Arizona 2 - 2 5 9 1.8 - - 1 8 9 2.2Arkansas - - 1 6 7 1.4 1 1 1 3 6 1.5California 21 2 5 48 76 14.9 9 2 6 22 39 9.7Colorado 1 - - 5 6 1.2 - 2 - 2 4 1.0Connecticut 1 - - 2 3 0.6 - - 2 - 2 0.5Delaware 1 - - - 1 0.2 - - 2 2 4 1.0Dist Of Columbia - - - 1 1 0.2 - - 1 1 2 0.5Florida 7 2 5 14 28 5.5 2 3 6 15 26 6.4Georgia - - 2 6 8 1.6 - 1 3 5 9 2.2Idaho - - 1 1 2 0.4 - 1 - - 1 0.2Illinois 6 3 4 26 39 7.6 3 3 3 18 27 6.7Indiana - 1 1 7 9 1.8 - - - 5 5 1.2Iowa - - 1 - 1 0.2 - 2 1 2 5 1.2Kansas 1 - - 4 5 1.0 - - 3 9 12 3.0Kentucky - 1 - 3 4 0.8 - 1 - 7 8 2.0Louisiana - 2 2 6 10 2.0 1 - 1 6 8 2.0Maine - - - - 0 0.0 - - - 2 2 0.5Maryland - - 2 4 6 1.2 - - 1 1 2 0.5Massachusetts 2 - 3 8 13 2.5 - 2 1 5 8 2.0Michigan 1 1 - 6 8 1.6 - 1 1 2 4 1.0Minnesota 1 - - 4 5 1.0 - 1 - 5 6 1.5Mississippi 1 1 2 7 11 2.2 - - 2 3 5 1.2Missouri 1 - 1 10 12 2.3 3 1 1 3 8 2.0Montana - - - 2 2 0.4 - - - 1 1 0.2Nebraska - - 1 3 4 0.8 - 1 - - 1 0.2Nevada - - - 3 3 0.6 - - - 2 2 0.5New Jersey 2 2 4 21 29 5.7 - - 1 7 8 2.0New Mexico 2 1 1 4 8 1.6 2 - - 1 3 0.7New York 5 - 3 10 18 3.5 3 - 4 18 25 6.2North Carolina 2 1 3 13 19 3.7 1 1 1 10 13 3.2North Dakota 1 - - 1 2 0.4 - 1 1 1 3 0.7Ohio 1 1 - 9 11 2.2 - 2 4 3 9 2.2Oklahoma - - - 5 5 1.0 1 - 1 7 9 2.2Oregon 1 - - 6 7 1.4 - - - 5 5 1.2Pennsylvania 2 3 5 13 23 4.5 2 1 2 14 19 4.7Rhode Island - - - 1 1 0.2 - - - 1 1 0.2South Carolina - - 3 5 8 1.6 - 1 - 3 4 1.0Tennessee - - 4 9 13 2.5 - 1 2 5 8 2.0Texas 2 1 1 43 47 9.2 3 4 8 45 60 14.9Utah - - - 2 2 0.4 - - - 1 1 0.2Vermont - - - 1 1 0.2 - - - - 0 0.0Virginia - - 1 3 4 0.8 1 1 2 10 14 3.5Washington 5 1 1 11 18 3.5 1 - - 3 4 1.0West Virginia - - - 4 4 0.8 - 1 - 3 4 1.0Wisconsin - 1 - 4 5 1.0 - - - 1 1 0.2Wyoming 1 - - - 1 0.2 1 1 - 1 3 0.7Total 70 26 61 354 511 100.0 36 36 62 270 404 100.0

TABLE 10-7 TRESPASSERS CASUALTIES, BY MONTH AND DAY, NOT AT HRC,2001
Total Day Of The Week Age of Person Cond | Month
Cnt % Sun Mon Tue Wed Thu Fri Sat Unk<16 16-21
>21
January 29 3.2 5 3 6 1 1 5 8 5 1 4 19February 38 4.2 10 1 8 6 5 6 2 5 1 5 27March 29 3.2 5 - 7 4 4 3 6 5 1 2 21April 44 4.8 8 7 7 6 7 6 3 9 3 10 22May 51 5.6 6 7 5 8 6 6 13 8 4 5 34June 48 5.2 9 5 3 3 4 12 12 5 4 4 35July 50 5.5 7 9 5 10 3 5 11 7 - 7 36August 59 6.4 6 12 4 11 7 7 12 6 1 3 49September 49 5.4 8 5 3 5 5 6 17 7 4 6 32October 34 3.7 10 4 7 1 5 5 2 3 1 2 28November 42 4.6 8 1 3 7 3 11 9 5 2 6 29December 38 4.2 9 3 4 7 - 8 7 5 4 7 22
Kld
Total 511 55.8 91 57 62 69 50 80 102 70 26 61 354January 20 2.2 4 6 3 3 - 2 2 1 1 5 13February 28 3.1 9 3 2 3 1 5 5 1 2 3 22March 48 5.2 7 7 9 4 7 7 7 7 6 11 24April 37 4.0 5 11 1 4 5 4 7 3 7 2 25May 28 3.1 2 10 5 3 1 5 2 1 3 3 21June 44 4.8 8 6 4 3 8 6 9 3 3 6 32July 49 5.4 11 4 8 9 5 7 5 8 2 6 33August 41 4.5 3 7 3 6 8 10 4 4 1 5 31September 31 3.4 7 - 1 2 7 2 12 - 4 4 23October 25 2.7 3 7 3 4 1 3 4 1 2 4 18November 27 3.0 4 6 5 3 5 3 1 6 - 4 17December 26 2.8 4 4 1 1 1 6 9 1 5 9 11
Nonfatal
Total 404 44.2 67 71 45 45 49 60 67 36 36 62 270Total 915 100 158 128 107 114 99 140 169 106 62 123 624
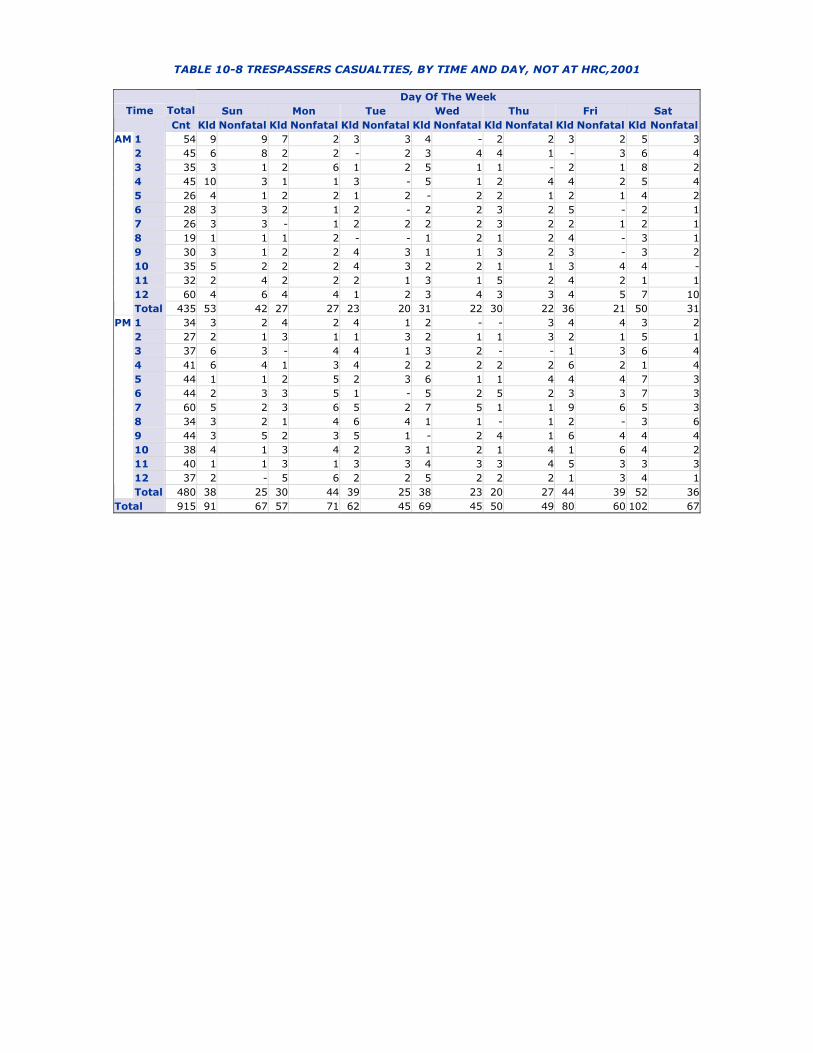
TABLE 10-8 TRESPASSERS CASUALTIES, BY TIME AND DAY, NOT AT HRC,2001
Day Of The Week Total Sun Mon Tue Wed Thu Fri Sat TimeCnt Kld Nonfatal Kld Nonfatal Kld Nonfatal Kld Nonfatal Kld Nonfatal Kld Nonfatal Kld Nonfatal
1 54 9 9 7 2 3 3 4 - 2 2 3 2 5 32 45 6 8 2 2 - 2 3 4 4 1 - 3 6 43 35 3 1 2 6 1 2 5 1 1 - 2 1 8 24 45 10 3 1 1 3 - 5 1 2 4 4 2 5 45 26 4 1 2 2 1 2 - 2 2 1 2 1 4 26 28 3 3 2 1 2 - 2 2 3 2 5 - 2 17 26 3 3 - 1 2 2 2 2 3 2 2 1 2 18 19 1 1 1 2 - - 1 2 1 2 4 - 3 19 30 3 1 2 2 4 3 1 1 3 2 3 - 3 210 35 5 2 2 2 4 3 2 2 1 1 3 4 4 -11 32 2 4 2 2 2 1 3 1 5 2 4 2 1 112 60 4 6 4 4 1 2 3 4 3 3 4 5 7 10
AM
Total 435 53 42 27 27 23 20 31 22 30 22 36 21 50 311 34 3 2 4 2 4 1 2 - - 3 4 4 3 22 27 2 1 3 1 1 3 2 1 1 3 2 1 5 13 37 6 3 - 4 4 1 3 2 - - 1 3 6 44 41 6 4 1 3 4 2 2 2 2 2 6 2 1 45 44 1 1 2 5 2 3 6 1 1 4 4 4 7 36 44 2 3 3 5 1 - 5 2 5 2 3 3 7 37 60 5 2 3 6 5 2 7 5 1 1 9 6 5 38 34 3 2 1 4 6 4 1 1 - 1 2 - 3 69 44 3 5 2 3 5 1 - 2 4 1 6 4 4 410 38 4 1 3 4 2 3 1 2 1 4 1 6 4 211 40 1 1 3 1 3 3 4 3 3 4 5 3 3 312 37 2 - 5 6 2 2 5 2 2 2 1 3 4 1
PM
Total 480 38 25 30 44 39 25 38 23 20 27 44 39 52 36Total 915 91 67 57 71 62 45 69 45 50 49 80 60 102 67

TABLE 10-9 TRESPASSERS CASUALTIES, BY LOCATION, NOT AT HRC, 2001
Total Fatal Nonfatal Age of Person Location
Cnt % Cnt % Cnt % Unk<16 16-21
>21
Alongside of on-track equipmen 53 5.8 15 2.9 38 9.4 2 7 3 41At work station 1 0.1 - 0.0 1 0.2 - - 1 -Beside track 136 14.9 51 10.0 85 21.0 14 13 17 92Between tracks 153 16.7 112 21.9 41 10.1 15 6 15 117Between cars/locomotives 33 3.6 7 1.4 26 6.4 1 2 7 23In cab or on walkways of locom 2 0.2 - 0.0 2 0.5 1 - - 1In car 10 1.1 1 0.2 9 2.2 - - 2 8In/operating vehicle 9 1.0 1 0.2 8 2.0 1 1 3 4In tunnel 2 0.2 - 0.0 2 0.5 - - 1 1On bridge/trestle 31 3.4 22 4.3 9 2.2 2 6 10 13On highway-rail crossing 9 1.0 4 0.8 5 1.2 - - - 9On side of car 23 2.5 3 0.6 20 5.0 1 3 5 14On track 417 45.6 282 55.2 135 33.4 67 19 51 280On end of car 5 0.5 1 0.2 4 1.0 - - 2 3On pole/signal mast 3 0.3 1 0.2 2 0.5 1 - 1 1On platform 4 0.4 2 0.4 2 0.5 1 - 1 2Other location on locomotive 1 0.1 - 0.0 1 0.2 - - - 1Under car 11 1.2 4 0.8 7 1.7 - 3 1 7Under locomotive 2 0.2 1 0.2 1 0.2 - - - 2Other location 10 1.1 4 0.8 6 1.5 - 2 3 5Total 915 100 511 100 404 100 106 62 123 624

TABLE 10-10 TRESPASSERS CASUALTIES, BY EVENT, NOT AT HRC, 2001
Total Fatal Nonfatal Age of Person Location
Cnt % Cnt % Cnt % Unk<16 16-21
>21
Assaulted by other 2 0.2 2 0.4 - 0.0 - - - 2Bodily function/sudden movement, e.g.,sneezing,t 1 0.1 1 0.2 - 0.0 1 - - -Caught in/compressed by other machinery 1 0.1 1 0.2 - 0.0 - - - 1Climatic conditions, other (e.g., high winds) 1 0.1 1 0.2 - 0.0 - - - 1Climatic condition, exposure to environmental co 1 0.1 1 0.2 - 0.0 - - - 1Collision/impact - auto, truck, bus, van, etc. 12 1.3 2 0.4 10 2.5 - - 3 9Electrical shock due to contact with 3rd rail, c 9 1.0 4 0.8 5 1.2 3 - 4 2Electrical shock, other (explain in narrative) 1 0.1 - 0.0 1 0.2 - - - 1Horseplay, practical joke, etc. 1 0.1 1 0.2 - 0.0 - 1 - -Lost balance 24 2.6 6 1.2 18 4.5 - 3 6 15Missed handhold, grabiron, step, etc. 4 0.4 1 0.2 3 0.7 - - - 4Other impacts - on track equipment 6 0.7 3 0.6 3 0.7 1 - - 5Pushed/shoved from 2 0.2 - 0.0 2 0.5 - - - 2Ran into on-track equipment 6 0.7 - 0.0 6 1.5 - - 1 5Ran into object/equipment 3 0.3 1 0.2 2 0.5 - 2 - 1Shot 2 0.2 1 0.2 1 0.2 - - - 2Slack action, draft, compressive buff/coupling 1 0.1 - 0.0 1 0.2 - - - 1Slipped,fell,stumbled,etc. due to irregular surf 3 0.3 - 0.0 3 0.7 2 - - 1Slipped,fell,stumbled,etc. due to object,ballast 3 0.3 - 0.0 3 0.7 - - 2 1Stabbing, knifing, etc. 2 0.2 2 0.4 - 0.0 - - - 2Struck by thrown or propelled object 3 0.3 - 0.0 3 0.7 2 - - 1Struck by object 6 0.7 3 0.6 3 0.7 2 - - 4Struck by on-track equipment 719 78.6 451 88.3 268 66.3 88 44 87 500Struck against object 11 1.2 5 1.0 6 1.5 - - 2 9Sudden/unexpected movement of material 1 0.1 - 0.0 1 0.2 - - - 1Sudden/unexpected movement of on-track equipmen 5 0.5 1 0.2 4 1.0 - - 1 4Thrill seeking 12 1.3 5 1.0 7 1.7 - 4 2 6Caught, crushed, pinched, other 7 0.8 - 0.0 7 1.7 - - 1 6On track equipment, other incidents 2 0.2 - 0.0 2 0.5 - 1 - 1Slipped, fell, stumbled, other 37 4.0 6 1.2 31 7.7 4 6 6 21Sudden, unexpected movement, other 1 0.1 - 0.0 1 0.2 - - - 1Other (describe in narrative) 26 2.8 13 2.5 13 3.2 3 1 8 14Total 915 100 511 100 404 100 106 62 123 624
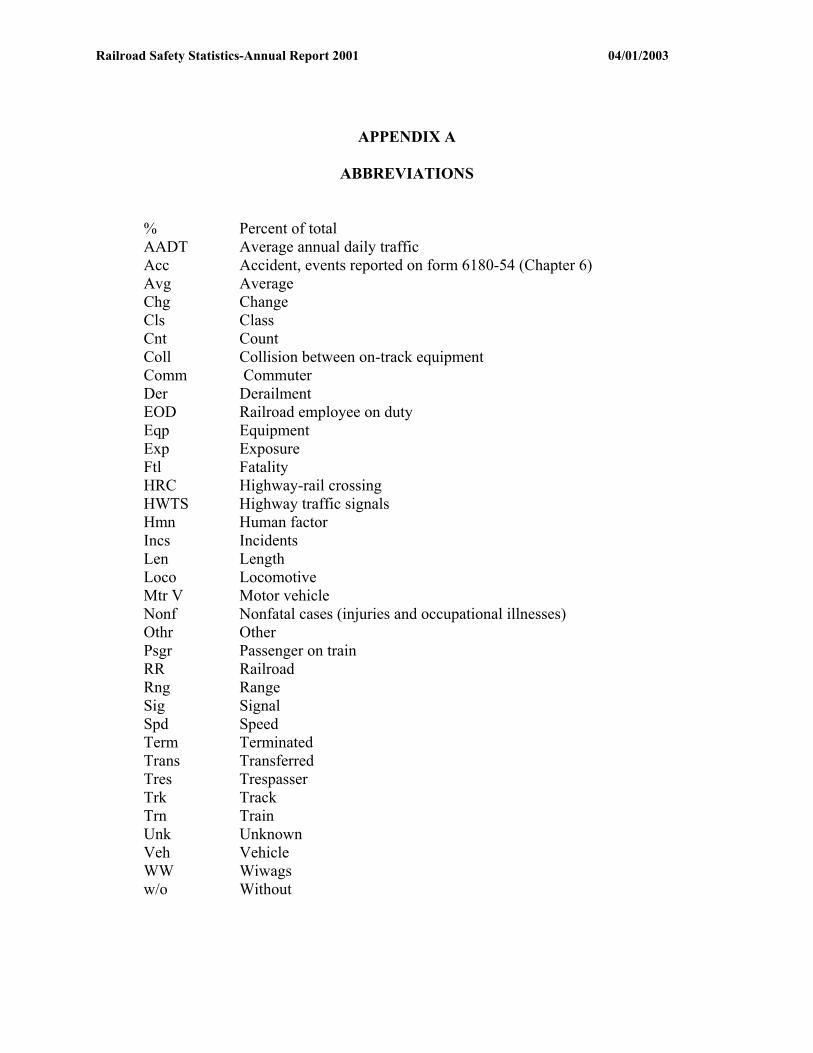
Railroad Safety Statistics-Annual Report 2001 04/01/2003
APPENDIX A
ABBREVIATIONS
% Percent of total AADT Average annual daily traffic Acc Accident, events reported on form 6180-54 (Chapter 6) Avg Average Chg Change Cls Class Cnt Count Coll Collision between on-track equipment Comm Commuter Der Derailment EOD Railroad employee on duty Eqp Equipment Exp Exposure Ftl Fatality HRC Highway-rail crossing HWTS Highway traffic signals Hmn Human factor Incs Incidents Len Length Loco Locomotive Mtr V Motor vehicle Nonf Nonfatal cases (injuries and occupational illnesses) Othr Other Psgr Passenger on train RR Railroad Rng Range Sig Signal Spd Speed Term Terminated Trans Transferred Tres Trespasser Trk Track Trn Train Unk Unknown Veh Vehicle WW Wiwags w/o Without

ACCIDENTS/INCIDENTS REPORTED BY GROUP III RAILROADS, 2001
Highway-Rail Counts Are Excluded From Other Categories
Railroads whose employees worked < 400,000 hours
TotalTrain
Accidents HRC
Incidents Other
Incidents Cnt Kld Inj Cnt Kld Inj Cnt Kld Inj Cnt Kld Inj
AN Rwy LLC [AN ] 3 - 1 2 - - - - - 1 - 1Aberdeen & Rockfish RR Co. [AR ] 4 - 3 - - - 2 - 1 2 - 2Aberdeen, Carolina & Western RR [ACWR] 3 - 1 - - - 2 - - 1 - 1Abilene & Smokey Valley RR [AVSX] 1 - 1 - - - - - - 1 - 1Acadiana Rwy Co. [AKDN] 2 - 1 - - - 1 - - 1 - 1Adirondack Scenic RR [ADCX] - - - - - - - - - - - -Adrian & Blissfield RR [ADBF] - - - - - - - - - - - -Akron Barberton Cluster Rwy Co. [AB ] 3 - 2 1 - - - - - 2 - 2Alabama & Florida Rwy Co. [AF ] - - - - - - - - - - - -Alabama & Gulf Coast Rwy LLC [AGR ] 8 - 6 1 - - 5 - 4 2 - 2Alabama RR Co., Inc. [ALAB] 2 - 1 1 - - - - - 1 - 1Alameda Belt Line [ABL ] - - - - - - - - - - - -Alamo Gulf Coast RR Co. [AGCR] 1 - - 1 - - - - - - - -Albany & Eastern RR Co. [AERC] 2 - 2 - - - - - - 2 - 2Albany Port RR [APRR] - - - - - - - - - - - -Alexander RR Co. [ARC ] - - - - - - - - - - - -Algers, Winslow & Western Rwy Co. [AWW ] - - - - - - - - - - - -Aliquippa & Southern RR Co. [ALQS] - - - - - - - - - - - -Allegheny And Eastern RR [ALY ] 3 - - - - - 3 - - - - -Allegheny Valley RR Co. [AVR ] 5 - - 4 - - 1 - - - - -Almanor RR Co. [AL ] - - - - - - - - - - - -Altamont Commuter Express Authority [ACEX] 4 1 2 1 - - 1 - 1 2 1 1Amador Foothills RR [AFR ] - - - - - - - - - - - -Amicor Switching Operation [AMIX] - - - - - - - - - - - -Angelina & Neches River RR Co. [ANR ] 1 - 1 - - - - - - 1 - 1Ann Arbor RR [AA ] - - - - - - - - - - - -Apache Rwy Co. [APA ] - - - - - - - - - - - -Appanoose County Community RR Co. [APNC] - - - - - - - - - - - -Arcade & Attica RR Corp. [ARA ] - - - - - - - - - - - -Arizona & California RR Co. [ARZC] 4 3 - 1 - - 1 1 - 2 2 -Arizona Central RR, Inc. [AZCR] 1 - - 1 - - - - - - - -Arizona Eastern RR [AZER] 2 - 1 1 - - - - - 1 - 1Arkansas & Missouri RR Co. [AM ] 22 - 12 - - - 12 - 1 10 - 11Arkansas Louisiana & Mississippi RR Co. [ALM 1 - - - - - 1 - - - - -Arkansas Midland RR Co., Inc. [AKMD] 9 1 4 1 - - 4 1 - 4 - 4Arkansas-Oklahoma RR Inc. [AOK ] - - - - - - - - - - - -Ashland Rwy Inc. [ASRY] 1 - 1 - - - - - - 1 - 1Ashtubula, Carson & Jefferson RR [ACJR] - - - - - - - - - - - -Athens Line LLC, The [ABR ] - - - - - - - - - - - -Atlantic & Western Rwy, L.P. [ATW ] 1 - - 1 - - - - - - - -Austin & Texas Central RR [ATCX] 1 - 1 - - - - - - 1 - 1Austin Area Term. RR [AUAR] 4 - 2 - - - 2 - - 2 - 2Austin, Todd & Ladd RR Co. [ATLT] - - - - - - - - - - - -B&H Rail Corp [BHX ] - - - - - - - - - - - -Ballard Term. RR Co LLC [BDTL] - - - - - - - - - - - -Batten Kill RR [BKRR] 3 - 1 - - - 2 - - 1 - 1Battleground, Yacolt & Chelatchie Prarie RR [ - - - - - - - - - - - -Bauxite & Northern Rwy Co. [BXN ] - - - - - - - - - - - -Bay Colony RR [BCLR] 4 - 3 - - - 2 - 1 2 - 2Bay Line RR, L.L.C., The [BAYL] 4 - 2 - - - 4 - 2 - - -Beaufort & Morehead Rwy Inc. [BMH ] - - - - - - - - - - - -Belfast & Moosehead Lake RR Co. [BML ] 3 - 3 - - - - - - 3 - 3Bellefonte Historical RR Society [BHRX] - - - - - - - - - - - -Big South Fork Scenic Rwy [BSFX] 1 - 1 - - - - - - 1 - 1

ACCIDENTS/INCIDENTS REPORTED BY GROUP III RAILROADS, 2001
Highway-Rail Counts Are Excluded From Other Categories
Railroads whose employees worked < 400,000 hours
TotalTrain
Accidents HRC
Incidents Other
Incidents Cnt Kld Inj Cnt Kld Inj Cnt Kld Inj Cnt Kld Inj
Bighorn Divide & Wyoming RR, Inc. [BDW ] - - - - - - - - - - - -Birmingham Southern RR Co. [BS ] 12 - 9 1 - - 2 - - 9 - 9Black Hills Central RR [BHC ] - - - - - - - - - - - -Black River & Western RR [BRW ] - - - - - - - - - - - -Blacklands RR, The [BLR ] - - - - - - - - - - - -Bloomer Shippers Connecting RR Co. [BLOL] - - - - - - - - - - - -Blue Rock Transportation Co. [BRTR] - - - - - - - - - - - -Bluegrass RR Museum, Inc. [BRMI] - - - - - - - - - - - -Boone Scenic Valley [BSV ] - - - - - - - - - - - -Border Pacific RR [BOP ] - - - - - - - - - - - -Brandon Corp. [BRAN] - - - - - - - - - - - -Brandywine Valley RR Co. [BVRY] 1 - 1 - - - - - - 1 - 1Brownsville & Rio Grande International RR [BR 6 - 4 - - - 2 - - 4 - 4Buckeye Central Scenic RR [BCRR] - - - - - - - - - - - -Buckingham Branch RR Co. [BB ] - - - - - - - - - - - -Buffalo & Pittsburgh RR, Inc. [BPRR] 9 - 3 4 - - 2 - - 3 - 3Buffalo Southern RR, Inc. [BSOR] - - - - - - - - - - - -Burlington Junction Rwy [BJRY] - - - - - - - - - - - -C & NC RR Corp. [CNUR] 3 - - 1 - - 2 - - - - -C&S RR Corp. [CSKR] - - - - - - - - - - - -CMC RR Inc. [CMC ] 1 - 1 - - - - - - 1 - 1Caddo Valley RR Co. [CVYR] 2 - 2 - - - - - - 2 - 2Caldwell County RR Co. [CWCY] - - - - - - - - - - - -California Northern RR Co. [CFNR] 3 - - 2 - - 1 - - - - -California State RR Museum [CSRM] - - - - - - - - - - - -California Western RR [CWR ] 15 - 14 - - - 1 - - 14 - 14Camas Prairie Railnet Inc [CSP ] 1 - - - - - 1 - - - - -Camp Chase Industrial RR Corp [CCRA] 5 - 3 2 - - - - - 3 - 3Canadian American RR Co. [CDAC] 7 - 5 2 - - - - - 5 - 5Caney Fork & Western RR [CFWR] - - - - - - - - - - - -Canon City And Royal Gorge RR, LLC [CRRX] 3 - 3 - - - - - - 3 - 3Canton RR Co. [CTN ] - - - - - - - - - - - -Cape Cod Central [CCCX] - - - - - - - - - - - -Cape Fear Rwys, Inc. [CF ] 1 - 1 - - - - - - 1 - 1Cape May Seashore Lines, Inc. [CMSX] - - - - - - - - - - - -Carolina Coastal Rwy, Inc. [CLNA] - - - - - - - - - - - -Carolina Rail Services Co. [CRIJ] - - - - - - - - - - - -Carolina Southern RR Co., The [CALA] - - - - - - - - - - - -Carrizo Gorge Rwy Inc. [CZRY] - - - - - - - - - - - -Carthage, Knightstown & Shirley RR [CKSI] - - - - - - - - - - - -Cascade & Columbia River RR [CSCD] - - - - - - - - - - - -Cass Scenic [CASS] 8 - 8 - - - - - - 8 - 8Catskill Mountain RR [CMRR] - - - - - - - - - - - -Cedar Rapids & Iowa City Rwy Co. [CIC ] 13 1 8 2 - - 3 1 - 8 - 8Central Calfornia Traction Co. [CCT ] 4 - 1 3 - - - - - 1 - 1Central Columbiana & Pensylvania Rwy Inc. [CQ - - - - - - - - - - - -Central Indiana & Western RR Co. [CEIW] 1 - 1 - - - - - - 1 - 1Central Kansas Rwy, Inc. [CKRY] 9 - 9 5 - - - - - 4 - 9Central Michigan Rwy Co. [CMGN] 15 - 9 5 - - 1 - - 9 - 9Central Montana RR [CM ] 1 - 1 - - - - - - 1 - 1Central Oregon & Pacific RR, Inc. [CORP] 8 - - 3 - - 5 - - - - -Central RR Co. Of Indiana [CIND] 1 - 1 - - - 1 - 1 - - -Central RR Co. Of Indianapolis [CERA] - - - - - - - - - - - -Chattahoochee Industrial RR [CIRR] 2 - 2 - - - - - - 2 - 2

ACCIDENTS/INCIDENTS REPORTED BY GROUP III RAILROADS, 2001
Highway-Rail Counts Are Excluded From Other Categories
Railroads whose employees worked < 400,000 hours
TotalTrain
Accidents HRC
Incidents Other
Incidents Cnt Kld Inj Cnt Kld Inj Cnt Kld Inj Cnt Kld Inj
Chattooga & Chickamauga RR [CCKY] 1 - 1 - - - - - - 1 - 1Chehalis & Centralia RR Association [CHCX] - - - - - - - - - - - -Chesapeake & Albemarle RR Co. [CA ] - - - - - - - - - - - -Chestnut Ridge Rwy Co. [CHR ] - - - - - - - - - - - -Chicago Rail Link [CRL ] 4 - 2 2 - - - - - 2 - 2Chicago Short Line Rwy Co. [CSL ] 1 - 1 - - - - - - 1 - 1Chicago-Chemung RR Corp. [CCUO] - - - - - - - - - - - -Chillicothe-Brunswick Rail Maintenance Author - - - - - - - - - - - -Cimarron Valley RR L C [CVR ] 14 - 9 3 - - 3 - 1 8 - 8City Of Prineville Rwy [COP ] 3 - 3 - - - - - - 3 - 3Claremont Concord RR Corp. [CCRR] 1 - 2 - - - - - - 1 - 2Clarendon & Pittsford RR Co. [CLP ] 1 - 1 - - - - - - 1 - 1Clinton Term. RR Co. [CTR ] - - - - - - - - - - - -Coe Rail Inc. [CRLE] - - - - - - - - - - - -Colorado & Wyoming Rwy Co. [CW ] 11 - 9 2 - - - - - 9 - 9Colorado Central RR [CCEX] - - - - - - - - - - - -Colorado Kansas and Pacific [CKP ] - - - - - - - - - - - -Columbia & Cowlitz Rwy Co. [CLC ] 4 - 4 - - - - - - 4 - 4Columbia Basin RR Co. Inc. [CBRW] 12 - 11 1 - - 1 - 1 10 - 10Columbia Business Center [CBCX] - - - - - - - - - - - -Columbia Term. RR Co. [CT ] 1 - 1 - - - 1 - 1 - - -Columbus & Greenville Rwy Co. [CAGY] 18 - 7 6 - - 6 - 1 6 - 6Columbus & Ohio River RR [CUOH] - - - - - - - - - - - -Commonwealth Rwy, Inc. [CWRY] - - - - - - - - - - - -Conecuh Valley RR [COEH] - - - - - - - - - - - -Conemaugh & Black Lick RR Co. [CBL ] - - - - - - - - - - - -Connecticut Department Of Transportation [CDO 8 1 7 1 - 2 1 - - 6 1 5Connecticut Southern RR Inc. [CSO ] 3 - 1 2 - - - - - 1 - 1Consolidated Grain & Barge Co. [CGBX] - - - - - - - - - - - -Conway Scenic RR [CONW] 2 - 2 - - - - - - 2 - 2Coopersville & Marne RR [CMRX] - - - - - - - - - - - -Copper Basin Rwy, Inc. [CBRY] 3 - - 3 - - - - - - - -Cornhusker Rail Car Services, Inc. [CRCX] - - - - - - - - - - - -Corpus Christi Term. RR Inc. [CCPN] 1 - - 1 - - - - - - - -Corydon 1883 Scenic RR [CSRX] - - - - - - - - - - - -Council Bluffs Rwy Co. [CBGR] - - - - - - - - - - - -Crab Orchard & Egyptian RR [COER] 1 - 1 - - - - - - 1 - 1Cumbres & Toltec Scenic RR [CTSR] 7 - 7 - - - - - - 7 - 7Cuyahoga Valley Rwy Co. [CUVA] 9 - 7 2 - - - - - 7 - 7Cuyahoga Valley Scenic Rwy [CVSX] 1 - 1 - - - - - - 1 - 1D & I RR Co. [DAIR] 3 - - 2 - - 1 - - - - -Dakota Southern Rwy Co. [DSRC] - - - - - - - - - - - -Dakota, Missouri Valley & Western RR, Inc. [D 9 - 7 2 - - - - - 7 - 7Dallas, Garland & Northeastern RR [DGNO] 19 - 1 6 - - 12 - - 1 - 1Dardanelle & Russellville RR [DR ] - - - - - - - - - - - -DeQueen & Eastern RR Co. [DQE ] 7 - 5 1 - - 1 - - 5 - 5Decatur Junction Rwy Co. [DT ] 1 - - 1 - - - - - - - -Delaware & Ulster Rail Ride [DURR] - - - - - - - - - - - -Delaware Lackawanna RR [DL ] - - - - - - - - - - - -Delray Connecting RR Co. [DC ] 10 - 10 - - - - - - 10 - 10Delta Southern RR Co. [DSRR] 3 - 3 - - - - - - 3 - 3Delta Valley & Southern Rwy Co. [DVS ] - - - - - - - - - - - -Denver Rock Island RR [DRIR] - - - - - - - - - - - -Denver Union Term. Rwy [DUT ] - - - - - - - - - - - -

ACCIDENTS/INCIDENTS REPORTED BY GROUP III RAILROADS, 2001
Highway-Rail Counts Are Excluded From Other Categories
Railroads whose employees worked < 400,000 hours
TotalTrain
Accidents HRC
Incidents Other
Incidents Cnt Kld Inj Cnt Kld Inj Cnt Kld Inj Cnt Kld Inj
Depew, Lancaster & Western RR Co., Inc. [DLWR - - - - - - - - - - - -Dubois County RR [DCRR] - - - - - - - - - - - -Duluth & Northeastern RR Co. [DNE ] 5 - 5 - - - - - - 5 - 5Durango & Silverton Narrow Guage RR Co. [DSNG 21 1 20 - - - 1 - - 20 1 20East Camden & Highland RR Co. [EACH] 2 - 2 - - - - - - 2 - 2East Cooper & Berkeley RR [ECBR] - - - - - - - - - - - -East Erie Commercial RR [EEC ] 1 - 1 - - - - - - 1 - 1East Jersey RR & Term. Co. [EJR ] 2 - 2 - - - - - - 2 - 2East Tennessee Rwy, L.P. [ETRY] - - - - - - - - - - - -Eastern Alabama Rwy Co. [EARY] 5 - 4 1 - - - - - 4 - 4Eastern Idaho RR [EIRR] 7 - 4 2 - - 3 - 2 2 - 2Eastern Illinois RR Co. [EIRC] 2 - 2 - - - 2 - 2 - - -Eastern Maine RR Co. [EMRY] 2 - 2 - - - - - - 2 - 2Eastern Shore RR Inc. [ESHR] 8 - 6 1 - - 1 - - 6 - 6Effingham RR Co. [EFRR] 1 - - 1 - - - - - - - -El Dorado & Wesson Rwy Co. [EDW ] 1 - - 1 - - - - - - - -Elk River RR, Inc. [ELKR] - - - - - - - - - - - -Ellis & Eastern Co. [EERZ] - - - - - - - - - - - -Erie Western Rwy [EWR ] - - - - - - - - - - - -Escanaba & Lake Superior RR Co. [ELS ] 25 - 19 1 - - 7 - 2 17 - 17Eureka Springs & North Arkansas RR [EKNA] - - - - - - - - - - - -Everett RR Co. [EV ] 3 - 3 - - - - - - 3 - 3Falls Road RR Co. Inc. [FRR ] - - - - - - - - - - - -Farmrail Corp. [FMRC] 2 - 2 - - - - - - 2 - 2Fillmore And Western [FMWX] - - - - - - - - - - - -Finger Lakes Rwy Corp. [FGLK] - - - - - - - - - - - -Flats Industrial RR [FIR ] - - - - - - - - - - - -Florida Central RR Co. [FCEN] 7 - 4 - - - 3 - - 4 - 4Florida Midland RR Co., Inc. [FMID] - - - - - - - - - - - -Florida Northern RR Co., Inc. [FNOR] - - - - - - - - - - - -Florida West Coast Rwy [FWCR] - - - - - - - - - - - -Fordyce & Princeton RR Co. [FP ] 1 - - 1 - - - - - - - -Fore River Transportation Corp. [FRVT] - - - - - - - - - - - -Fort Smith RR Co. [FSR ] 3 1 - - - - 2 - - 1 1 -Fort Worth & Western RR [FWWR] 10 1 4 3 - - 3 1 - 4 - 4Fremont & Elkhorn Valley RR [FEVR] - - - - - - - - - - - -Fremont, West Point & Pacific Rwy [FWPP] - - - - - - - - - - - -Galveston RR, L.P. [GVSR] 5 - 4 1 - - - - - 4 - 4Garden City Western Rwy Co. [GCW ] 1 - - - - - 1 - - - - -Gateway Eastern RR Co. [GWWE] 1 - - 1 - - - - - - - -Georgetown RR Co. [GRR ] - - - - - - - - - - - -Georgia & Florida Railnet [GFRR] 8 - 3 1 - - 4 - - 3 - 3Georgia Central Rwy, L.P. [GC ] 6 - - 3 - - 3 - - - - -Georgia Northeastern RR Co. [GNRR] 1 - 1 - - - - - - 1 - 1Georgia Southwestern RR Division [GSWR] 2 - - 1 - - 1 - - - - -Georgia Woodlands RR [GWRC] 1 - 1 - - - - - - 1 - 1Gettysburg RR Co. [GBRY] - - - - - - - - - - - -Gettysburg Scenic Rail Tour [GSRX] - - - - - - - - - - - -Gettysburg and Northern RR [GET ] 1 - 1 - - - - - - 1 - 1Gloster Southern RR [GLSR] - - - - - - - - - - - -Golden Isles Term. RR, Inc. [GITM] 1 - - 1 - - - - - - - -Golden Triangle RR Co. [GTRA] - - - - - - - - - - - -Grafton & Upton RR Co. [GU ] - - - - - - - - - - - -Grainbelt Corp. [GNBC] 3 - 2 - - - 1 - - 2 - 2
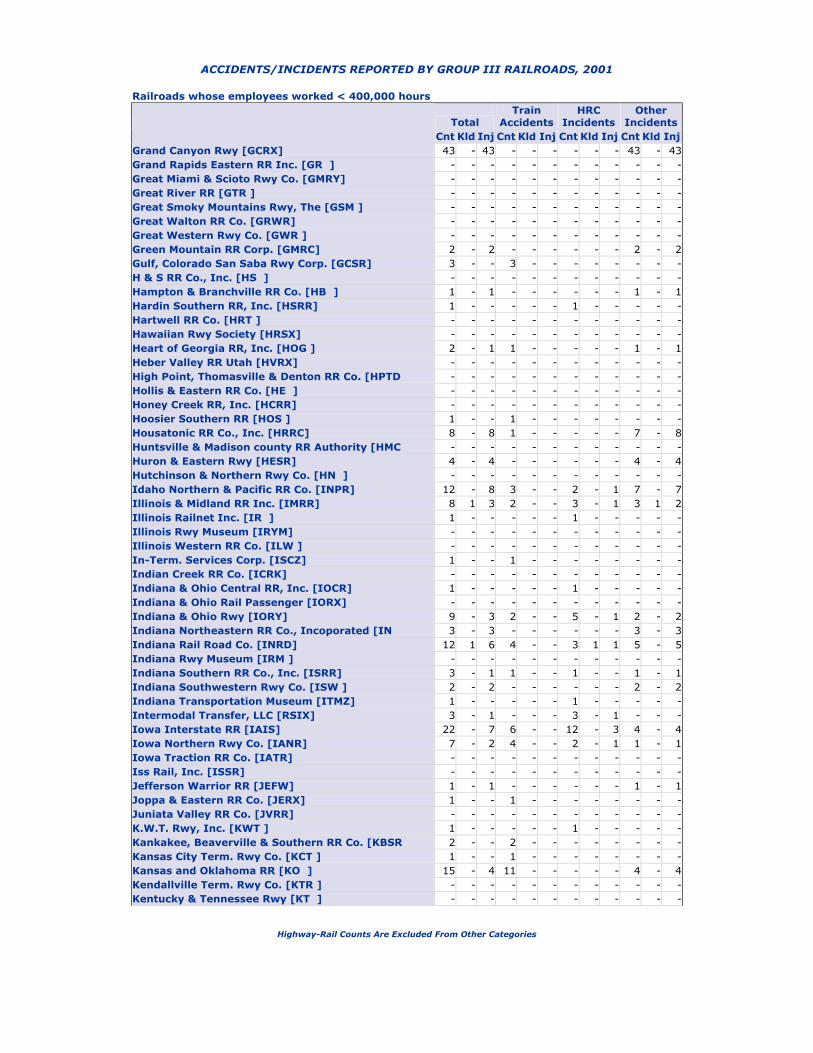
ACCIDENTS/INCIDENTS REPORTED BY GROUP III RAILROADS, 2001
Highway-Rail Counts Are Excluded From Other Categories
Railroads whose employees worked < 400,000 hours
TotalTrain
Accidents HRC
Incidents Other
Incidents Cnt Kld Inj Cnt Kld Inj Cnt Kld Inj Cnt Kld Inj
Grand Canyon Rwy [GCRX] 43 - 43 - - - - - - 43 - 43Grand Rapids Eastern RR Inc. [GR ] - - - - - - - - - - - -Great Miami & Scioto Rwy Co. [GMRY] - - - - - - - - - - - -Great River RR [GTR ] - - - - - - - - - - - -Great Smoky Mountains Rwy, The [GSM ] - - - - - - - - - - - -Great Walton RR Co. [GRWR] - - - - - - - - - - - -Great Western Rwy Co. [GWR ] - - - - - - - - - - - -Green Mountain RR Corp. [GMRC] 2 - 2 - - - - - - 2 - 2Gulf, Colorado San Saba Rwy Corp. [GCSR] 3 - - 3 - - - - - - - -H & S RR Co., Inc. [HS ] - - - - - - - - - - - -Hampton & Branchville RR Co. [HB ] 1 - 1 - - - - - - 1 - 1Hardin Southern RR, Inc. [HSRR] 1 - - - - - 1 - - - - -Hartwell RR Co. [HRT ] - - - - - - - - - - - -Hawaiian Rwy Society [HRSX] - - - - - - - - - - - -Heart of Georgia RR, Inc. [HOG ] 2 - 1 1 - - - - - 1 - 1Heber Valley RR Utah [HVRX] - - - - - - - - - - - -High Point, Thomasville & Denton RR Co. [HPTD - - - - - - - - - - - -Hollis & Eastern RR Co. [HE ] - - - - - - - - - - - -Honey Creek RR, Inc. [HCRR] - - - - - - - - - - - -Hoosier Southern RR [HOS ] 1 - - 1 - - - - - - - -Housatonic RR Co., Inc. [HRRC] 8 - 8 1 - - - - - 7 - 8Huntsville & Madison county RR Authority [HMC - - - - - - - - - - - -Huron & Eastern Rwy [HESR] 4 - 4 - - - - - - 4 - 4Hutchinson & Northern Rwy Co. [HN ] - - - - - - - - - - - -Idaho Northern & Pacific RR Co. [INPR] 12 - 8 3 - - 2 - 1 7 - 7Illinois & Midland RR Inc. [IMRR] 8 1 3 2 - - 3 - 1 3 1 2Illinois Railnet Inc. [IR ] 1 - - - - - 1 - - - - -Illinois Rwy Museum [IRYM] - - - - - - - - - - - -Illinois Western RR Co. [ILW ] - - - - - - - - - - - -In-Term. Services Corp. [ISCZ] 1 - - 1 - - - - - - - -Indian Creek RR Co. [ICRK] - - - - - - - - - - - -Indiana & Ohio Central RR, Inc. [IOCR] 1 - - - - - 1 - - - - -Indiana & Ohio Rail Passenger [IORX] - - - - - - - - - - - -Indiana & Ohio Rwy [IORY] 9 - 3 2 - - 5 - 1 2 - 2Indiana Northeastern RR Co., Incoporated [IN 3 - 3 - - - - - - 3 - 3Indiana Rail Road Co. [INRD] 12 1 6 4 - - 3 1 1 5 - 5Indiana Rwy Museum [IRM ] - - - - - - - - - - - -Indiana Southern RR Co., Inc. [ISRR] 3 - 1 1 - - 1 - - 1 - 1Indiana Southwestern Rwy Co. [ISW ] 2 - 2 - - - - - - 2 - 2Indiana Transportation Museum [ITMZ] 1 - - - - - 1 - - - - -Intermodal Transfer, LLC [RSIX] 3 - 1 - - - 3 - 1 - - -Iowa Interstate RR [IAIS] 22 - 7 6 - - 12 - 3 4 - 4Iowa Northern Rwy Co. [IANR] 7 - 2 4 - - 2 - 1 1 - 1Iowa Traction RR Co. [IATR] - - - - - - - - - - - -Iss Rail, Inc. [ISSR] - - - - - - - - - - - -Jefferson Warrior RR [JEFW] 1 - 1 - - - - - - 1 - 1Joppa & Eastern RR Co. [JERX] 1 - - 1 - - - - - - - -Juniata Valley RR Co. [JVRR] - - - - - - - - - - - -K.W.T. Rwy, Inc. [KWT ] 1 - - - - - 1 - - - - -Kankakee, Beaverville & Southern RR Co. [KBSR 2 - - 2 - - - - - - - -Kansas City Term. Rwy Co. [KCT ] 1 - - 1 - - - - - - - -Kansas and Oklahoma RR [KO ] 15 - 4 11 - - - - - 4 - 4Kendallville Term. Rwy Co. [KTR ] - - - - - - - - - - - -Kentucky & Tennessee Rwy [KT ] - - - - - - - - - - - -

ACCIDENTS/INCIDENTS REPORTED BY GROUP III RAILROADS, 2001
Highway-Rail Counts Are Excluded From Other Categories
Railroads whose employees worked < 400,000 hours
TotalTrain
Accidents HRC
Incidents Other
Incidents Cnt Kld Inj Cnt Kld Inj Cnt Kld Inj Cnt Kld Inj
Kentucky Rwy Museum [KRM ] 1 - 1 - - - - - - 1 - 1Keokuk Junction Rwy [KJRY] 2 - 2 - - - - - - 2 - 2Kettle Moraine Rwy [KMRY] - - - - - - - - - - - -Kiamichi RR Co. LLC [KRR ] 6 - 1 3 - - 2 - - 1 - 1Kiski Junction RR [KJR ] - - - - - - - - - - - -Klamath Northern Rwy Co. [KNOR] - - - - - - - - - - - -Knox & Kane RR Co. [KKRR] - - - - - - - - - - - -Knoxville & Holston River RR Co., Inc. [KXHR] 4 - 1 - - - 4 - 1 - - -Kyle RR Co. [KYLE] 12 - 5 6 - - 1 - - 5 - 5Lahaina Kaanapoli And Pacific [LKP ] 2 - 1 - - - 1 - - 1 - 1Lake County RR [LCR ] - - - - - - - - - - - -Lake Shore Rwy [LSRX] - - - - - - - - - - - -Lake State Rwy Co. [LSRC] 16 - 16 1 - - 1 - 2 14 - 14Lake Superior & Ishpeming RR Co. [LSI ] 12 - 11 1 - - - - - 11 - 11Lake Superior & Mississippi RR [LSMR] 1 - - - - - 1 - - - - -Lake Superior RR Museum [LSMT] - - - - - - - - - - - -Lake Term. RR Co. [LT ] 1 - - 1 - - - - - - - -Lancaster & Chester Rwy Co. [LC ] 3 - 1 2 - - - - - 1 - 1Landisville Term. & Transfer Co. [LNVT] - - - - - - - - - - - -Laona & Northern Rwy [LNO ] - - - - - - - - - - - -Laurinburg & Southern RR Co. [LRS ] - - - - - - - - - - - -Leadville, Colorado & Southern RR, Co. [LCSR] - - - - - - - - - - - -Lewis & Clark RR Co. [LINC] - - - - - - - - - - - -Lexington & Ohio RR Co. Inc. [LXOH] - - - - - - - - - - - -Litchfield Industrial RR [LFIZ] 1 - 1 - - - - - - 1 - 1Little Kanawha River Rail [LKRR] - - - - - - - - - - - -Little River RR [LRR ] - - - - - - - - - - - -Little Rock & Western Rwy, L.P. [LRWN] 1 - - - - - 1 - - - - -Little Rock Port RR Co. [LRPA] - - - - - - - - - - - -Livonia, Avon & Lakeville RR Corp. [LAL ] 1 - 1 - - - - - - 1 - 1Logansport & Eel River Short Line Co., Inc. [ - - - - - - - - - - - -Longview Switching [LS ] 2 - 1 1 - - - - - 1 - 1Los Angeles Junction Rwy Co. [LAJ ] 5 - 4 1 - - - - - 4 - 4Louisiana & Delta RR [LDRR] 5 - 1 - - - 4 - - 1 - 1Louisiana & North West RR Co. [LNW ] 5 - 3 2 - 1 1 - - 2 - 2Louisville & Indiana RR Co. [LIRC] 10 - 5 2 - - 3 - - 5 - 5Louisville & Wadley Rwy Co. [LW ] - - - - - - - - - - - -Louisville, New Albany & Corydon RR [LNAL] - - - - - - - - - - - -Lowville & Beaver River RR Co. [LBR ] - - - - - - - - - - - -Luxapalila Valley RR Inc. [LXVR] - - - - - - - - - - - -Luzerene & Susquehanna Rwy Co. [LSX ] - - - - - - - - - - - -Lycoming Valley RR Co. [LVRR] 4 - 3 - - - 1 - - 3 - 3M & B RR LLC [MNBR] 1 - - - - - 1 - - - - -Madison RR Division [CMPA] - - - - - - - - - - - -Magma Arizona RR Co. [MAA ] - - - - - - - - - - - -Mahoning Valley RR Co. [MVRY] - - - - - - - - - - - -Manitou & Pike's Peak RR Co. [MPP ] 3 - 3 - - - - - - 3 - 3Manufacturers' Junction Rwy Co. [MJ ] - - - - - - - - - - - -Manufacturers' Rwy Co. [MRS ] 4 - 4 - - - - - - 4 - 4Maryland & Delaware RR Co. [MDDE] 4 - 3 - - - 1 - - 3 - 3Maryland Midland Rwy, Inc. [MMID] 1 - - - - - 1 - - - - -Massachusetts Central RR Corp. [MCER] 2 - 2 - - - - - - 2 - 2Massena Term. RR Co. [MSTR] - - - - - - - - - - - -Maumee & Western RR Corp. [MAW ] 1 - 1 - - - - - - 1 - 1

ACCIDENTS/INCIDENTS REPORTED BY GROUP III RAILROADS, 2001
Highway-Rail Counts Are Excluded From Other Categories
Railroads whose employees worked < 400,000 hours
TotalTrain
Accidents HRC
Incidents Other
Incidents Cnt Kld Inj Cnt Kld Inj Cnt Kld Inj Cnt Kld Inj
Mccloud Rwy Co. [MCR ] 3 - 3 - - - - - - 3 - 3Mckeesport Connecting RR Co. [MKC ] 1 - - 1 - - - - - - - -Meeker Southern RR [MSN ] - - - - - - - - - - - -Meridian Southern Rwy LLC [MDS ] - - - - - - - - - - - -Michigan Shore RR [MS ] - - - - - - - - - - - -Michigan Southern RR Co., Inc. [MSO ] 1 - 1 - - - - - - 1 - 1Michigan State Trust For Rwy Preservation [MS - - - - - - - - - - - -Mid-Continent Rwy [MCRY] - - - - - - - - - - - -Mid-Michigan RR Co. [MMRR] 2 - 2 - - - - - - 2 - 2Middletown & Hummelstown RR Co. [MIDH] 1 - 1 - - - - - - 1 - 1Middletown & New Jersey Rwy Co., Inc. [MNJ ] - - - - - - - - - - - -Midland Term. Co. [MDLR] 4 - 4 - - - - - - 4 - 4Midlands Rwy [MDRY] - - - - - - - - - - - -Minnesota & Manitoba RR [MMR ] - - - - - - - - - - - -Minnesota Commercial Rwy [MNNR] 30 - 20 2 - - 8 - - 20 - 20Minnesota Northern RR Inc. [MNN ] - - - - - - - - - - - -Minnesota Southern Rwy, Inc. [MSWY] - - - - - - - - - - - -Minnesota Transportation Museum [MNTM] - - - - - - - - - - - -Minnesota Zephyr, Limited [MZL ] - - - - - - - - - - - -Minnesota, Dakota & Western Rwy Co. [MDW ] 1 - 1 - - - - - - 1 - 1Mississippi & Skuna Valley RR Co. [MSV ] - - - - - - - - - - - -Mississippi & Tennessee Railnet RR [MT ] 2 - - - - - 2 - - - - -Mississippi Central RR Co. [MSCI] 1 - - - - - 1 - - - - -Mississippi Delta RR [MSDR] - - - - - - - - - - - -Mississippi Export RR Co. [MSE ] 5 - 4 - - - 1 - - 4 - 4Mississippian Rwy Cooperative, Inc. [MSRW] - - - - - - - - - - - -Missouri & Northern Arkansas RR Co., Inc. [MN 13 1 11 1 - - 6 1 5 6 - 6Missouri Central RR [MOC ] - - - - - - - - - - - -Modesto & Empire Traction Co. [MET ] 9 - 8 1 - - - - - 8 - 8Mohawk, Adirondack & Northern RR Corp. [MHWA] - - - - - - - - - - - -Monongahela Connecting RR Co. [MCRR] - - - - - - - - - - - -Montana Western Rwy Co. [MWRR] - - - - - - - - - - - -Monticello Rwy Museum [MRMZ] - - - - - - - - - - - -Morristown & Erie Rwy, Inc. [ME ] - - - - - - - - - - - -Moscow, Camden & San Augustine RR [MCSA] - - - - - - - - - - - -Mount Dora, Tavares, Eustis RR [MDTX] 1 - - - - - 1 - - - - -Mount Hood Rwy Co. [MH ] 1 - 1 - - - - - - 1 - 1Mount Rainier Scenic RR [MRSR] 1 - 1 - - - - - - 1 - 1Mount Vernon Term. Rwy, Inc. [MVT ] - - - - - - - - - - - -Municipality Of East Troy [METW] - - - - - - - - - - - -N C Transportation Museum Foundation [NCMX] - - - - - - - - - - - -NWPY 1 - 1 - - - - - - 1 - 1Napa Valley RR [NVRR] 10 - 8 - - - 2 - - 8 - 8Nash County RR [NCYR] - - - - - - - - - - - -Nashville & Eastern RR [NERR] 3 - 3 - - - - - - 3 - 3Nashville & Western RR Corp. [NWR ] 1 - 1 - - - - - - 1 - 1Nebkota Rwy, Inc. [NRI ] 1 - 1 - - - - - - 1 - 1Nebraska Central RR [NCRC] 4 1 3 - - - 1 1 - 3 - 3Nebraska Northeastern Rwy Co. [NENE] 3 - - 3 - - - - - - - -Nebraska, Kansas, Colorado Railnet [NKCR] 6 - 1 5 - - - - - 1 - 1Nevada Northern Rwy [NNRX] - - - - - - - - - - - -New England Central RR [NECR] 9 - 3 5 - - 1 - - 3 - 3New England Southern RR Co., Inc. [NEGS] - - - - - - - - - - - -New Hampshire Central RR, Inc. [NHCR] - - - - - - - - - - - -

ACCIDENTS/INCIDENTS REPORTED BY GROUP III RAILROADS, 2001
Highway-Rail Counts Are Excluded From Other Categories
Railroads whose employees worked < 400,000 hours
TotalTrain
Accidents HRC
Incidents Other
Incidents Cnt Kld Inj Cnt Kld Inj Cnt Kld Inj Cnt Kld Inj
New Hampshire North Coast RR [NHN ] - - - - - - - - - - - -New Hope & Ivyland Rail Road [NHRR] - - - - - - - - - - - -New Orleans & Gulf Coast Rwy Co. Inc. [NOGC] 4 - - - - - 4 - - - - -New Orleans Public Belt RR [NOPB] 15 - 12 3 - 1 1 - - 11 - 11New York & Atlantic Rwy Co. [NYA ] 6 - 2 3 - - 1 - - 2 - 2New York & Lake Erie [NYLE] 1 - 1 - - - - - - 1 - 1New York & Ogdensburg Rwy Co. Inc. [NYOG] - - - - - - - - - - - -New York Cross Harbor RR Term. Corp. [NYCH] - - - - - - - - - - - -New York, Susquehanna & Western RR Co. [NYSW] 22 - 19 4 - - 2 - 3 16 - 16Newburgh & South Shore RR [NSR ] - - - - - - - - - - - -Niles Canyon Rwy [NICX] - - - - - - - - - - - -Nimishillen & Tuscarawas, LLC [NTRY] 4 - 4 - - - - - - 4 - 4Nittany & Bald Eagle [NBER] 3 - 1 - - - 2 - - 1 - 1Norfolk & Portsmouth Belt Line RR Co. [NPB ] 5 - 4 - - - 1 - - 4 - 4North Carolina & Virginia RR Co. [NCVA] 1 - - 1 - - - - - - - -North Shore RR [NSHR] - - - - - - - - - - - -North Shore Scenic RR [NSSR] - - - - - - - - - - - -Northern Central Rwy Inc. [NCRY] - - - - - - - - - - - -Northern Ohio & Western Rwy, LTD. [NOW ] 2 - - 1 - - 1 - - - - -Northern Plains RR, Inc. [NPR ] 7 - 7 - - - 3 - 3 4 - 4Northwestern Oklahoma RR Co. [NOKL] - - - - - - - - - - - -Oakland Term. Rwy [OTR ] 1 - 1 - - - - - - 1 - 1Ogeechee Rwy Co. [OGEE] - - - - - - - - - - - -Ohi Rail Corp. [OHIC] - - - - - - - - - - - -Ohio & Pennsylvania RR Co. [OHPA] - - - - - - - - - - - -Ohio Central RR Co. [OHCR] - - - - - - - - - - - -Ohio Rwy Museum [ORY ] - - - - - - - - - - - -Ohio Southern RR Co. [OSRR] - - - - - - - - - - - -Oil Creek & Titusville Lines [OCTL] 3 - 3 - - - - - - 3 - 3Old Augusta RR Co. [OAR ] - - - - - - - - - - - -Omaha, Lincoln & Beatrice Rwy Co. [OLB ] - - - - - - - - - - - -OmniTrax Switching Services [OMTX] 3 - 2 1 - - - - - 2 - 2Ontario Central RR Corp. [ONCT] - - - - - - - - - - - -Ontario Midland RR Corp. [OMID] - - - - - - - - - - - -Oregon Eastern RR [OERR] - - - - - - - - - - - -Oregon Pacific RR Co. [OPR ] - - - - - - - - - - - -Orlando & Mount Dora Rwy Co. [OMDX] - - - - - - - - - - - -Otter Tail Valley RR Co., Inc. [OTVR] 1 - - 1 - - - - - - - -Ouachita RR [OUCH] - - - - - - - - - - - -Owego & Harford Rwy, Inc. [OHRY] - - - - - - - - - - - -Pacific & Arctic RR & Navigation Co. [PARN] 45 - 45 - - - - - - 45 - 45Pacific Harbor Line Inc. [PHL ] 13 - 5 6 - - 2 - - 5 - 5Pacific SW Rwy Museum [PSRM] - - - - - - - - - - - -Paducah & Illinois RR Co. [PI ] - - - - - - - - - - - -Palouse River & Coulee City RR Inc. [PCC ] 5 - - 5 - - - - - - - -Panhandle Northern RR Co. [PNR ] 3 - - 2 - - 1 - - - - -Patapsco & Back Rivers RR Co. [PBR ] 13 - 12 1 - - - - - 12 - 12Pearl River Valley RR Co. [PRV ] - - - - - - - - - - - -Pecos Valley Southern Rwy Co. [PVS ] - - - - - - - - - - - -Pend Oreille Valley RR, Inc. [POVA] 2 - 2 - - - - - - 2 - 2Peninsula Term. Co. [PT ] 1 - 1 - - - - - - 1 - 1Penn Eastern Rail Lines Inc. [PRL ] - - - - - - - - - - - -Penn Jersey Rail Lines Inc. [PJRL] - - - - - - - - - - - -Peoria & Pekin Union Rwy Co. [PPU ] 14 - 11 3 - - - - - 11 - 11

ACCIDENTS/INCIDENTS REPORTED BY GROUP III RAILROADS, 2001
Highway-Rail Counts Are Excluded From Other Categories
Railroads whose employees worked < 400,000 hours
TotalTrain
Accidents HRC
Incidents Other
Incidents Cnt Kld Inj Cnt Kld Inj Cnt Kld Inj Cnt Kld Inj
Peoria, Peoria Heights & Western RR [PPHW] - - - - - - - - - - - -Philadelphia, Bethlehem & New England RR [PBN 1 - - 1 - - - - - - - -Pickens Rwy Co. [PICK] 1 - 1 - - - - - - 1 - 1Pine Belt Southern RR [PBRR] - - - - - - - - - - - -Pioneer Industrial Rwy Co. [PRY ] - - - - - - - - - - - -Pioneer Valley RR Co., Inc. [PVRR] - - - - - - - - - - - -Pittsburg & Shawmut RR Co. [PS ] 4 - 2 1 - - 1 - - 2 - 2Pittsburgh & Conneaut Dock Co., The [PCDX] 1 - 1 - - - - - - 1 - 1Pittsburgh & Ohio Central RR Co., The [POHC] - - - - - - - - - - - -Pittsburgh, Allegheny & Mckees Rocks RR [PAM - - - - - - - - - - - -Plymouth & Lincoln [PLL ] - - - - - - - - - - - -Point Comfort & Northern Rwy Co. [PCN ] 2 - 2 - - - - - - 2 - 2Port Bienville RR [PBVR] - - - - - - - - - - - -Port Of Catoosa Term. RR [POCA] - - - - - - - - - - - -Port Of Manatee [MAUP] 2 - - - - - 2 - - - - -Port Of Palm Beach Term. [PPBD] - - - - - - - - - - - -Port Of Tillamook Bay RR [POTB] 2 1 1 - - - - - - 2 1 1Port Royal RR [PRYL] - - - - - - - - - - - -Port Term. RR Of South Carolina [PTR ] - - - - - - - - - - - -Port Utilities Commission Of Charleston, S.C. - - - - - - - - - - - -Portland & Western RR, Inc. [PNWR] 15 1 3 1 - - 12 - 2 2 1 1Portland Term. [PTO ] 2 - 1 1 - - - - - 1 - 1Potomac Eagle Scenic Rail Excursion [PEX ] - - - - - - - - - - - -Prescott & Northwestern RR Co. [PNW ] - - - - - - - - - - - -Progressive Rail Inc [PGR ] 1 - - - - - 1 - - - - -Providence & Worcester RR Co. [PW ] 11 - 6 4 - - 1 - - 6 - 6Puget Sound & Pacific RR Co. [PSAP] 1 - 1 - - - - - - 1 - 1Quincy RR Co. [QRR ] - - - - - - - - - - - -R. J. Corman RR Co./Pennsylvania Lines, Inc. - - - - - - - - - - - -R. J. Corman RR Corp./Bardstown Line [RJCR] 1 - - - - - 1 - - - - -R. J. Corman, Western Ohio Line [RJCW] 3 - - - - - 3 - - - - -Rail Link Inc. [RLIX] 1 - - 1 - - - - - - - -Rail Serve [RASX] 2 - 1 - - - 1 - - 1 - 1Rail Tours, Inc. [RTI ] - - - - - - - - - - - -Railroad Switching Service Of Missouri, Inc. - - - - - - - - - - - -Railtown 1897 RR [RTRX] - - - - - - - - - - - -Raritan Central Rwy LLC [RCRY] - - - - - - - - - - - -Rarus Rwy Co. [RARW] - - - - - - - - - - - -Reading Blue Mountain & Northern RR Commision 5 - 3 1 - - 1 - - 3 - 3Red River Valley & Western RR [RRVW] 19 - 12 7 - - - - - 12 - 12Redmont Rwy Co., Inc. [RRC ] - - - - - - - - - - - -Richmond Pacific RR Corp. [RPRC] 1 - 1 - - - - - - 1 - 1Rio Valley Switching Co. [RVSC] 7 - 4 1 - - 2 - - 4 - 4River Term. Rwy Co. [RT ] 16 - 6 7 - - 3 - - 6 - 6Rochester Southern RR, Inc. [RSR ] 3 - 1 2 - - - - - 1 - 1Rock & Rail Inc [RRRR] 1 1 - - - - - - - 1 1 -Rockdale, Sandow & Southern RR Co. [RSS ] 1 - 1 - - - - - - 1 - 1SCTRR, LLC [SCTR] 2 - 1 - - - 1 - - 1 - 1SF&L Rwy, Inc. [SFLR] - - - - - - - - - - - -SMS Rail Service, Inc. [SLRS] 2 - 1 1 - - - - - 1 - 1Sabine River & Northern RR Co. [SRN ] - - - - - - - - - - - -Safe Handling Rail Inc. [SRP ] 3 - 1 1 - - 1 - - 1 - 1Saginaw Valley Rwy Co., Inc. [SGVY] - - - - - - - - - - - -Salt Lake City Southern RR Co., Inc. [SL ] 1 - 1 - - - - - - 1 - 1

ACCIDENTS/INCIDENTS REPORTED BY GROUP III RAILROADS, 2001
Highway-Rail Counts Are Excluded From Other Categories
Railroads whose employees worked < 400,000 hours
TotalTrain
Accidents HRC
Incidents Other
Incidents Cnt Kld Inj Cnt Kld Inj Cnt Kld Inj Cnt Kld Inj
Salt Lake, Garfield & Western Rwy Co. [SLGW] - - - - - - - - - - - -San Diego & Imperial Valley [SDIY] - - - - - - - - - - - -San Diego Northern Rwy [SDNX] 5 4 1 - - - - - - 5 4 1San Francisco Belt RR [SFBR] - - - - - - - - - - - -San Joaquin Valley RR Co. [SJVR] 14 - 11 2 - - 4 - 3 8 - 8San Luis Central RR Co. [SLC ] 1 - 1 - - - - - - 1 - 1San Manuel Arizona RR Co. [SMA ] - - - - - - - - - - - -San Pedro & Southwestern Rwy Co. [SWKR] - - - - - - - - - - - -Sand Springs Rwy Co. [SS ] 1 - - - - - 1 - - - - -Sandersville RR Co. [SAN ] 2 - 2 - - - 1 - 1 1 - 1Santa Cruz, Big Tree & Pacific RR [SCBG] 2 - 3 - - - - - - 2 - 3Santa Fe Southern Rwy, Inc. [SFS ] 4 - 3 - - - 2 - 1 2 - 2Santa Maria Valley RR Co. [SMV ] - - - - - - - - - - - -Saracuse Binghampton And New York RR [SBNX] - - - - - - - - - - - -Savannah Port Term. RR, Inc. [SAPT] - - - - - - - - - - - -Seminole Gulf RR [SGLR] 10 - 3 4 - - 3 - - 3 - 3Semo Port RR, Inc. [SE ] - - - - - - - - - - - -Sequatchie Valley RR [SQVR] - - - - - - - - - - - -Shamokin Valley RR Co. [SVRR] - - - - - - - - - - - -Shawnee Term. Rwy Co. [STR ] - - - - - - - - - - - -Shelbyville Industrial RR [SVIZ] 1 - - - - - 1 - - - - -Sidney & Lowe RR Inc. [SLGG] - - - - - - - - - - - -Sierra RR Co. [SERA] 1 - 1 - - - - - - 1 - 1Sisseton Milbank RR [SMRR] 3 - 3 - - - - - - 3 - 3Smokey Hill Rwy [SHRX] - - - - - - - - - - - -Snoqualmie Valley RR [SNVX] - - - - - - - - - - - -Somerset RR Co. [SOM ] - - - - - - - - - - - -Sounder Commuter Rail [SCR ] 1 - 1 - - - - - - 1 - 1South Branch Valley RR [SBVR] 1 - 1 - - - - - - 1 - 1South Buffalo Rwy Co. [SB ] 11 - 2 8 - - 1 - - 2 - 2South Carolina Central RR Co., Inc. [SCRF] 3 - - - - - 3 - - - - -South Central Florida Express, Inc. [SCXF] 12 - 9 2 - - 1 - - 9 - 9South Kansas & Oklahoma RR Co. [SKOL] 12 - 3 7 - - 3 - 1 2 - 2South Orient RR Co., Ltd. [SO ] - - - - - - - - - - - -South Plains Lamesa RR, Ltd. [SLAL] - - - - - - - - - - - -Southern Alabama RR Co., Inc. [SUAB] - - - - - - - - - - - -Southern Electric RR [SERX] - - - - - - - - - - - -Southern Freight Logistics, Inc. [SFLX] - - - - - - - - - - - -Southern Indiana Rwy, Inc. [SIND] 1 - 1 - - - 1 - 1 - - -Southern Michigan RR Society [SMRS] 1 - - - - - 1 - - - - -Southern New Jersey Lite Rail System [SNJX] 16 - 16 - - - - - - 16 - 16Southern RR Co. Of New Jersey [SRNJ] - - - - - - - - - - - -Southern Switching Co. [SSC ] - - - - - - - - - - - -Southwest Pennsylvania RR Co. [SWP ] 5 - - 4 - - 1 - - - - -Southwestern RR Co., Inc. [SW ] 2 - - 2 - - - - - - - -St. Croix Valley RR Co. [SCXY] 1 - 1 - - - - - - 1 - 1St. Lawrence & Atlantic RR Co. [SLR ] 12 - 7 2 - - 5 - 2 5 - 5St. Louis Steam Train Association [SLST] - - - - - - - - - - - -St. Louis, Iron Mountain, & Southern [SLOI] - - - - - - - - - - - -St. Maries River RR Co. [STMA] 1 - 1 - - - - - - 1 - 1St. Marys RR Co. [SM ] 2 - 2 - - - - - - 2 - 2Steamtown National Historic Site [SNCX] - - - - - - - - - - - -Steelton & Highspire RR [SH ] 1 - 1 - - - - - - 1 - 1Stillwater Central RR Co., Inc. [SLWC] 1 - - - - - 1 - - - - -

ACCIDENTS/INCIDENTS REPORTED BY GROUP III RAILROADS, 2001
Highway-Rail Counts Are Excluded From Other Categories
Railroads whose employees worked < 400,000 hours
TotalTrain
Accidents HRC
Incidents Other
Incidents Cnt Kld Inj Cnt Kld Inj Cnt Kld Inj Cnt Kld Inj
Stockton Term. & Eastern RR [STE ] 1 - - - - - 1 - - - - -Stone Mountain Park [SMPX] 2 - 2 - - - - - - 2 - 2Stourbridge RR Co. [SBRR] - - - - - - - - - - - -Strasburg RR Co. [SRC ] 1 - 1 - - - - - - 1 - 1Sumpter Valley RR [SUVX] - - - - - - - - - - - -Sunflour RR, Inc. [SNR ] - - - - - - - - - - - -Sweetwater Central RR [SWCX] 1 - 1 - - - - - - 1 - 1Tacoma Municipal Belt Line Rwy [TMBL] 11 - 6 2 - - 3 - - 6 - 6Tacoma Rail Mountain Division [TRMW] 1 - - 1 - - - - - - - -Talley Rand Term. RR [TTR ] 1 - 1 - - - - - - 1 - 1Tennessee Southern RR Co., Inc. [TSRR] 4 - 2 1 - - 1 - - 2 - 2Tennessee Valley RR [TVRM] - - - - - - - - - - - -Tennken RR Co. Inc. [TKEN] 5 - 8 1 - - 1 - 5 3 - 3Terminal Rwy Alabama State Docks [TASD] 42 - 16 25 - - 2 - 1 15 - 15Texas & New Mexico RR Co. [TNMR] - - - - - - - - - - - -Texas & Northern Rwy Co. [TN ] 1 - 1 - - - - - - 1 - 1Texas City Term. Rwy Co. [TCT ] 1 - - 1 - - - - - - - -Texas Northwestern Rwy Co. [TXNW] 2 - 2 - - - - - - 2 - 2Texas Pacifico Transportation Limited [TXPF] 1 - 1 - - - - - - 1 - 1Texas Rock Crusher Rwy Co. [TXR ] - - - - - - - - - - - -Texas South-Eastern RR Co. [TSE ] - - - - - - - - - - - -Texas State RR [TSR ] 3 - 3 - - - - - - 3 - 3Texas, Gonzales & Northern Rwy Co. [TXGN] 5 - 2 2 - - 1 - - 2 - 2Texas, Oklahoma & Eastern RR Co [TOE ] 4 - 3 1 - - - - - 3 - 3The Youngstown Belt RR Co. [YB ] - - - - - - - - - - - -Thermal Belt Rwy [TBRY] - - - - - - - - - - - -Three Notch RR [TNHR] - - - - - - - - - - - -Timberrock RR Co., Inc. [TIBR] 1 - 1 - - - - - - 1 - 1Tioga Central RR [TIOC] - - - - - - - - - - - -Tishomingo RR Co., Inc. [TISH] - - - - - - - - - - - -Toledo Lake Erie & Western RR [TLEW] - - - - - - - - - - - -Toledo, Peoria & Western Rwy Corp. [TPW ] 13 - 6 4 - - 3 - - 6 - 6Tomahawk Rwy, L.P. [TR ] - - - - - - - - - - - -Toppenish Simcoe & Western [TSWR] - - - - - - - - - - - -Towanda Monroeton Shippers Lifeline, Inc. [TM - - - - - - - - - - - -Transkentucky Transportation RR, Inc. [TTIS] 2 - 1 - - - 1 - - 1 - 1Tri-City RR Co. [TCRY] - - - - - - - - - - - -Tri-county Commuter Rail Authority [TCCX] 21 3 14 - - - 10 1 4 11 2 10Trinity Industries, Inc./Trinity Rail Svcs [T - - - - - - - - - - - -Trinity Rwy Express [TRE ] 4 1 3 1 - - 2 1 2 1 - 1Trona Rwy Co. [TRC ] - - - - - - - - - - - -Tulsa-Sapulpa Union Rwy Co. LLC [TSU ] 2 - - 2 - - - - - - - -Turtle Creek Industrial RR, Inc. [TCKR] - - - - - - - - - - - -Tuscola & Saginaw Bay RR Co., Inc. [TSBY] 7 - 7 1 - - 2 - 3 4 - 4Twin City & Western RR [TCWR] 7 - 4 2 - - 1 - - 4 - 4Union County Industrial RR Co. [UCIR] - - - - - - - - - - - -Upper Merion & Plymouth RR Co. [UMP ] - - - - - - - - - - - -Utah Central Rwy Co. [UCRY] 1 - - 1 - - - - - - - -Utah Rwy Co. [UTAH] 16 - 13 2 - - 2 - 1 12 - 12Utah Transit Authority [UTAX] - - - - - - - - - - - -V and S Rwy, Inc. [VSR ] 1 - - 1 - - - - - - - -Valdosta Rwy, L.P. [VR ] - - - - - - - - - - - -Valley RR Co. [VALE] - - - - - - - - - - - -Vandalia RR Co. [VRRC] - - - - - - - - - - - -
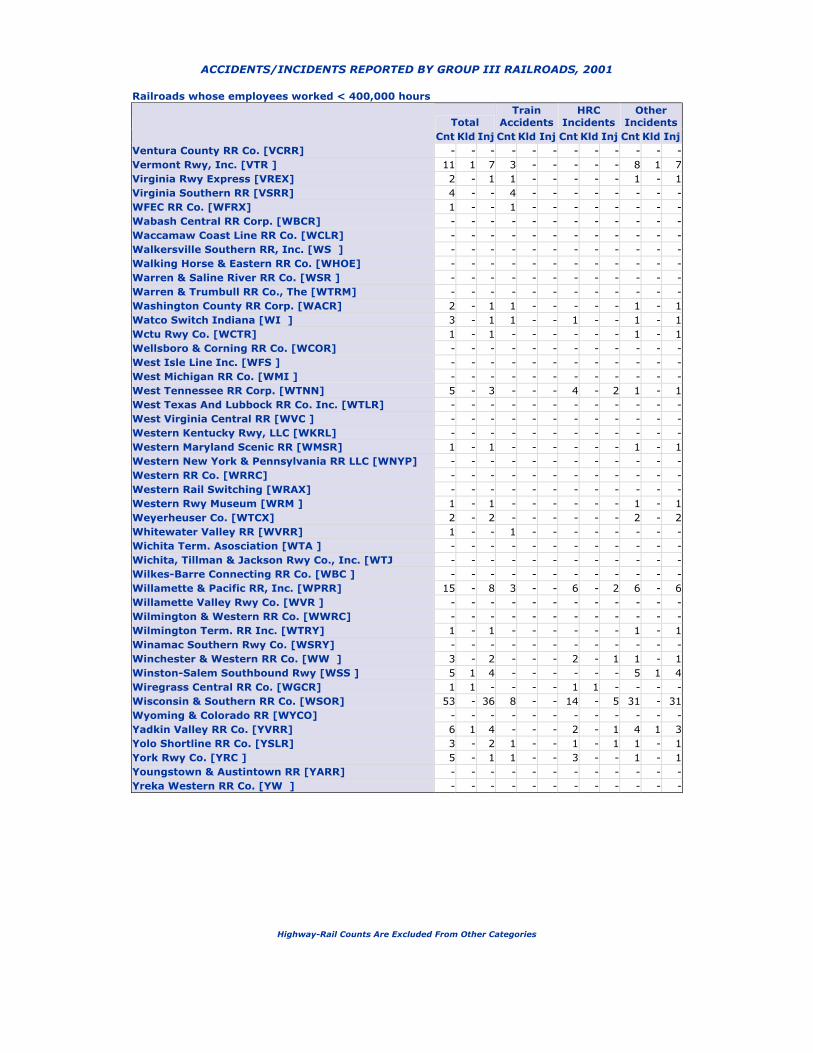
ACCIDENTS/INCIDENTS REPORTED BY GROUP III RAILROADS, 2001
Highway-Rail Counts Are Excluded From Other Categories
Railroads whose employees worked < 400,000 hours
TotalTrain
Accidents HRC
Incidents Other
Incidents Cnt Kld Inj Cnt Kld Inj Cnt Kld Inj Cnt Kld Inj
Ventura County RR Co. [VCRR] - - - - - - - - - - - -Vermont Rwy, Inc. [VTR ] 11 1 7 3 - - - - - 8 1 7Virginia Rwy Express [VREX] 2 - 1 1 - - - - - 1 - 1Virginia Southern RR [VSRR] 4 - - 4 - - - - - - - -WFEC RR Co. [WFRX] 1 - - 1 - - - - - - - -Wabash Central RR Corp. [WBCR] - - - - - - - - - - - -Waccamaw Coast Line RR Co. [WCLR] - - - - - - - - - - - -Walkersville Southern RR, Inc. [WS ] - - - - - - - - - - - -Walking Horse & Eastern RR Co. [WHOE] - - - - - - - - - - - -Warren & Saline River RR Co. [WSR ] - - - - - - - - - - - -Warren & Trumbull RR Co., The [WTRM] - - - - - - - - - - - -Washington County RR Corp. [WACR] 2 - 1 1 - - - - - 1 - 1Watco Switch Indiana [WI ] 3 - 1 1 - - 1 - - 1 - 1Wctu Rwy Co. [WCTR] 1 - 1 - - - - - - 1 - 1Wellsboro & Corning RR Co. [WCOR] - - - - - - - - - - - -West Isle Line Inc. [WFS ] - - - - - - - - - - - -West Michigan RR Co. [WMI ] - - - - - - - - - - - -West Tennessee RR Corp. [WTNN] 5 - 3 - - - 4 - 2 1 - 1West Texas And Lubbock RR Co. Inc. [WTLR] - - - - - - - - - - - -West Virginia Central RR [WVC ] - - - - - - - - - - - -Western Kentucky Rwy, LLC [WKRL] - - - - - - - - - - - -Western Maryland Scenic RR [WMSR] 1 - 1 - - - - - - 1 - 1Western New York & Pennsylvania RR LLC [WNYP] - - - - - - - - - - - -Western RR Co. [WRRC] - - - - - - - - - - - -Western Rail Switching [WRAX] - - - - - - - - - - - -Western Rwy Museum [WRM ] 1 - 1 - - - - - - 1 - 1Weyerheuser Co. [WTCX] 2 - 2 - - - - - - 2 - 2Whitewater Valley RR [WVRR] 1 - - 1 - - - - - - - -Wichita Term. Asosciation [WTA ] - - - - - - - - - - - -Wichita, Tillman & Jackson Rwy Co., Inc. [WTJ - - - - - - - - - - - -Wilkes-Barre Connecting RR Co. [WBC ] - - - - - - - - - - - -Willamette & Pacific RR, Inc. [WPRR] 15 - 8 3 - - 6 - 2 6 - 6Willamette Valley Rwy Co. [WVR ] - - - - - - - - - - - -Wilmington & Western RR Co. [WWRC] - - - - - - - - - - - -Wilmington Term. RR Inc. [WTRY] 1 - 1 - - - - - - 1 - 1Winamac Southern Rwy Co. [WSRY] - - - - - - - - - - - -Winchester & Western RR Co. [WW ] 3 - 2 - - - 2 - 1 1 - 1Winston-Salem Southbound Rwy [WSS ] 5 1 4 - - - - - - 5 1 4Wiregrass Central RR Co. [WGCR] 1 1 - - - - 1 1 - - - -Wisconsin & Southern RR Co. [WSOR] 53 - 36 8 - - 14 - 5 31 - 31Wyoming & Colorado RR [WYCO] - - - - - - - - - - - -Yadkin Valley RR Co. [YVRR] 6 1 4 - - - 2 - 1 4 1 3Yolo Shortline RR Co. [YSLR] 3 - 2 1 - - 1 - 1 1 - 1York Rwy Co. [YRC ] 5 - 1 1 - - 3 - - 1 - 1Youngstown & Austintown RR [YARR] - - - - - - - - - - - -Yreka Western RR Co. [YW ] - - - - - - - - - - - -
Copyright © 2022 FDOKUMEN