The Notorious Swepson-Littlefield Fraud: Railroad Financing ...
Upload
khangminh22Category
view
2download
0
DOT/FRA/ORD-01-20
Federal RailroadAdministration
An Examination of Railroad YardWorker Safety
Final ReportJuly 2001
Office of Researchand DevelopmentWashington, DC 20590
U.S. Departmentof Transportation
This document is available to the U.S.public through the National TechnicalInformation Service, Springfield, VA 22161

NOTICE
This document is disseminated under the sponsorship ofthe Department of Transportation in the interest of infor-
mation exchange. The United States Government assumesno liability for its contents or use thereof.
NOTICE
The United States Government does not endorse productsor manufacturers. Trade or manufacturers' names appearherein solely because they are considered essential to the
objective of this report.
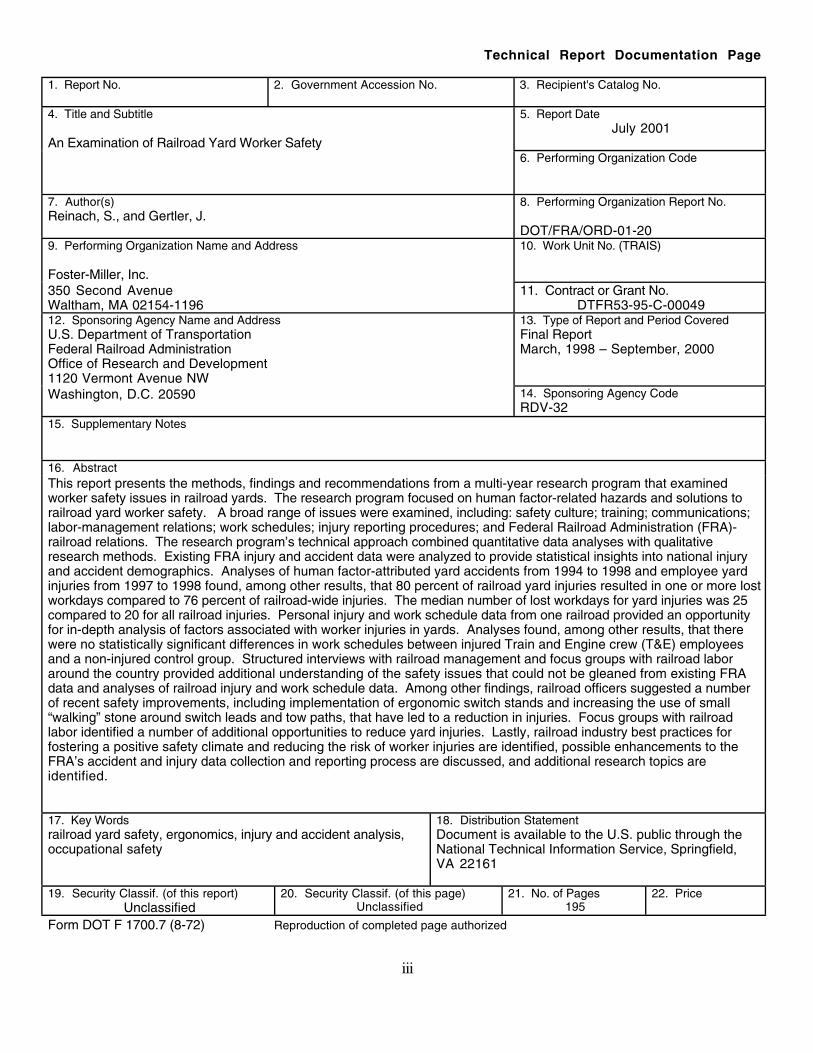
Technical Report Documentation Page
1. Report No. 2. Government Accession No. 3. Recipient's Catalog No.
4. Title and Subtitle
An Examination of Railroad Yard Worker Safety
5. Report DateJuly 2001
6. Performing Organization Code
7. Author(s)Reinach, S., and Gertler, J.
8. Performing Organization Report No.
DOT/FRA/ORD-01-209. Performing Organization Name and Address
Foster-Miller, Inc.
10. Work Unit No. (TRAIS)
350 Second AvenueWaltham, MA 02154-1196
11. Contract or Grant No.DTFR53-95-C-00049
12. Sponsoring Agency Name and AddressU.S. Department of TransportationFederal Railroad AdministrationOffice of Research and Development1120 Vermont Avenue NW
13. Type of Report and Period CoveredFinal ReportMarch, 1998 – September, 2000
Washington, D.C. 20590 14. Sponsoring Agency CodeRDV-32
15. Supplementary Notes
16. AbstractThis report presents the methods, findings and recommendations from a multi-year research program that examinedworker safety issues in railroad yards. The research program focused on human factor-related hazards and solutions torailroad yard worker safety. A broad range of issues were examined, including: safety culture; training; communications;labor-management relations; work schedules; injury reporting procedures; and Federal Railroad Administration (FRA)-railroad relations. The research program’s technical approach combined quantitative data analyses with qualitativeresearch methods. Existing FRA injury and accident data were analyzed to provide statistical insights into national injuryand accident demographics. Analyses of human factor-attributed yard accidents from 1994 to 1998 and employee yardinjuries from 1997 to 1998 found, among other results, that 80 percent of railroad yard injuries resulted in one or more lostworkdays compared to 76 percent of railroad-wide injuries. The median number of lost workdays for yard injuries was 25compared to 20 for all railroad injuries. Personal injury and work schedule data from one railroad provided an opportunityfor in-depth analysis of factors associated with worker injuries in yards. Analyses found, among other results, that therewere no statistically significant differences in work schedules between injured Train and Engine crew (T&E) employeesand a non-injured control group. Structured interviews with railroad management and focus groups with railroad laboraround the country provided additional understanding of the safety issues that could not be gleaned from existing FRAdata and analyses of railroad injury and work schedule data. Among other findings, railroad officers suggested a numberof recent safety improvements, including implementation of ergonomic switch stands and increasing the use of small“walking” stone around switch leads and tow paths, that have led to a reduction in injuries. Focus groups with railroadlabor identified a number of additional opportunities to reduce yard injuries. Lastly, railroad industry best practices forfostering a positive safety climate and reducing the risk of worker injuries are identified, possible enhancements to theFRA’s accident and injury data collection and reporting process are discussed, and additional research topics areidentified.
17. Key Wordsrailroad yard safety, ergonomics, injury and accident analysis,occupational safety
18. Distribution StatementDocument is available to the U.S. public through theNational Technical Information Service, Springfield,VA 22161
19. Security Classif. (of this report)Unclassified
20. Security Classif. (of this page)Unclassified
21. No. of Pages195
22. Price
Form DOT F 1700.7 (8-72) Reproduction of completed page authorized
iii

v
PREFACE
This report presents the findings of a research study to examine worker safety in railroad yards.The work was performed under Contract DTFR53-95-C00049 with guidance from Dr. ThomasRaslear of the Office of Research and Development, Federal Railroad Administration. Theauthors wish to express their gratitude to Mr. Stan Ellis and Mr. Robert Finkelstein, Office ofSafety, Federal Railroad Administration, for providing assistance in understanding and utilizingthe Federal Railroad Administration's accident and injury databases.
Thanks are also due to the four railroads for arranging and allowing the authors to visit theirfacilities and meet with yard management. The information learned from these site visits wasinvaluable. The authors also wish to thank the participating railroad for allowing us to collectpersonal injury and work schedule data from their records.
The focus group research would not have been possible without the generous cooperation ofnumerous officers, including general and local chairmen, from the Brotherhood of LocomotiveEngineers, United Transportation Union, and Brotherhood Railway Carmen Division,Transportation Communications Union. The authors wish to thank all of the focus groupparticipants for being open and sharing their experiences, ideas, and opinions regarding yardworker safety.
The authors also wish to acknowledge and thank Mr. Tom Griego, Mr. Kurt Walecki, and Mr.Robert McCulloch from Booz, Allen & Hamilton for their valuable contributions in theformative stages of this research. The authors also wish to thank several individuals from Foster-Miller for their support in this project. Ms. Sally Pham assisted in collecting and coding thepersonal injury and work schedule data from the participating railroad and assisted in recruitingparticipants for the focus groups. Mr. Jeff Crane also participated in coding the personal injurydata. Lastly, a special thanks to Ms. Susan McDonough for assisting in preparing the figures andtables for this report.
vi

vii
CONTENTS
Section Page
EXECUTIVE SUMMARY .......................................................................................................... 1
1. INTRODUCTION ......................................................................................................... 7
1.1 Background ...................................................................................................................... 71.2 Purpose ............................................................................................................................ 81.3 Scope ............................................................................................................................... 81.4 Overall Approach............................................................................................................. 91.5 Organization of the Report .............................................................................................. 9
2. OVERVIEW OF RAILROAD YARD OPERATIONS ............................................ 11
2.1 Railroad Yard Functions ................................................................................................ 112.2 Typical Railroad Yard Layout and Operation ................................................................ 122.2.1 Receiving Yard .............................................................................................................. 132.2.2 Classification Yard ......................................................................................................... 132.2.3 Departure Yard ............................................................................................................... 132.2.4 Other Areas within the Railroad Yard ............................................................................ 142.3 Railroad Departments and Their Functions ................................................................... 142.3.1 Transportation Department ............................................................................................ 142.3.2 Mechanical Department ................................................................................................. 152.3.3 Engineering Department ................................................................................................ 152.3.4 Distribution of Work Force ............................................................................................ 152.4 Typical Hazards within a Railroad Yard ........................................................................ 162.5 The Injury Reporting Process ........................................................................................ 16
3. FEDERAL EMPLOYERS’ LIABILITY ACT (FELA) ........................................... 18
3.1 Historical Background ................................................................................................... 183.2 Provisions of FELA ....................................................................................................... 203.3 Impact of FELA on Railroad Worker Safety ................................................................. 21
4. ANALYSIS OF FRA ACCIDENT AND INJURY DATA ......................................... 22
4.1 Description of FRA Accident and Injury Databases ...................................................... 234.1.1 FRA Accident Database ................................................................................................. 23

viii
Section Page
4.1.2 FRA Injury Database ..................................................................................................... 254.2 Analysis of 1994-1998 Railroad Yard Accidents .......................................................... 264.2.1 Season ............................................................................................................................ 274.2.2 Time-of-Day .................................................................................................................. 284.2.3 Hours on Duty ............................................................................................................... 294.2.4 Visibility ........................................................................................................................ 304.2.5 Weather and Temperature .............................................................................................. 314.2.6 Accident Severity .......................................................................................................... 334.2.7 Drug and Alcohol Involvement ..................................................................................... 354.2.8 Hazmat Accidents .......................................................................................................... 364.3 Analysis of 1997-1998 Railroad Yard Injuries .............................................................. 364.3.1 Season ............................................................................................................................ 384.3.2 Time-of-Day .................................................................................................................. 394.3.3 Age ................................................................................................................................ 414.3.4 Job Category .................................................................................................................. 434.3.5 Type of Injury ................................................................................................................ 434.3.6 Body Part ....................................................................................................................... 434.3.7 Triggering Event ............................................................................................................ 454.3.8 Physical Act ................................................................................................................... 494.3.9 Involvement of On-Track Equipment ............................................................................ 524.3.10 Involvement of Roadbed Materials ............................................................................... 534.3.11 Involvement of Drugs and Alcohol ............................................................................... 534.3.12 Involvement of Hazardous Materials ............................................................................ 604.3.13 Injury “Cause” ............................................................................................................... 604.4 Comparison of Railroad Yard Injuries to Private Industry Injuries ............................... 604.5 Discussion ...................................................................................................................... 704.5.1 Key Findings ................................................................................................................. 704.5.2 Limitations of the FRA Accident and Injury Data Analyses ......................................... 71
5. SUPPLEMENTAL INJURY DATA COLLECTION AND ANALYSIS ................. 73
5.1 Supplemental Data Collection and Analysis Methods .................................................. 735.1.1 Personal Injury Data ...................................................................................................... 735.1.2 Work Schedule Data ...................................................................................................... 765.2 Results ........................................................................................................................... 775.2.1 Personal Injury Data Analyses ....................................................................................... 785.2.2 Work Schedule Data Analyses ....................................................................................... 885.3 Discussion ...................................................................................................................... 925.3.1 Key Findings ................................................................................................................. 925.3.2 Limitations of the Study Methods and Data .................................................................. 95

ix
Section Page
6. STRUCTURED INTERVIEWS WITH RAILROAD OFFICIALS ....................... 97
6.1 Procedure ....................................................................................................................... 976.2 Training.......................................................................................................................... 986.3 Communication ............................................................................................................. 996.3.1 Promoting Safety Awareness ......................................................................................... 996.3.2 Reporting Unsafe Conditions ...................................................................................... 1006.4 Safety Programs, Incentives and Awards..................................................................... 1026.5 Problem Identification and Resolution ........................................................................ 1046.6 Regulatory Issues ......................................................................................................... 1076.6.1 FRA’s Role in Promoting Safety in Railroad Yards .................................................... 1076.6.2 FELA and the Railroad Yard Work Environment ........................................................ 1086.7 Discussion .................................................................................................................... 108
7. FOCUS GROUP INTERVIEWS WITH RAILROAD LABOR ........................... 110
7.1 Procedures ................................................................................................................... 1107.2 Participant Profile ........................................................................................................ 1117.3 Focus Group Findings ................................................................................................. 1117.3.1 Factors Contributing to Yard Injuries .......................................................................... 1137.3.2 Overall Safety Climate ................................................................................................ 1157.3.3 Safety Incentives and Initiatives .................................................................................. 1177.3.4 Injury Reporting and Follow-up Process ..................................................................... 1187.3.5 Reporting Unsafe Conditions ...................................................................................... 1207.3.6 Safety Rules and Procedures ....................................................................................... 1217.3.7 Initial Training ............................................................................................................. 1227.3.8 Training on New Rules, Procedures and Equipment ................................................... 1277.3.9 Work Schedules and Overtime .................................................................................... 1277.3.10 Supplemental Anonymous Injury Survey .................................................................... 1307.3.11 Third-Party Safety Reporting System.......................................................................... 1317.3.12 FRA Role in Railroad Yard Safety .............................................................................. 1327.4 Discussion .................................................................................................................... 132
8. CONCLUSIONS AND RECOMMENDATIONS ................................................... 135
8.1 Key Findings ............................................................................................................... 1358.2 Best Practices for Fostering a Positive Safety Climate and Reducing Injuries ........... 1378.3 Recommendations for Improved Analysis of Worker Safety ...................................... 1398.3.1 Improved Data Collection and Reporting Procedures ................................................. 1398.3.2 Future Research ........................................................................................................... 142
9. REFERENCES .......................................................................................................... 145
x
Section Page
APPENDIX A - FRA AND OSHA JURISDICTION OVER RAILROADEMPLOYEE OCCUPATIONAL SAFETY AND HEALTH .................... 147
APPENDIX B - FRA AND MSHA ACCIDENT/INJURY REPORT FORMS .................. 151
APPENDIX C - DATA COLLECTION FORMS.................................................................. 161
APPENDIX D - STRUCTURED INTERVIEW QUESTIONS ........................................... 165
APPENDIX E - SITE DESCRIPTIONS................................................................................ 169
APPENDIX F - FOCUS GROUP QUESTIONS................................................................... 176

xi
ILLUSTRATIONS
Figure Page
1. Overall research approach .................................................................................................. 92. Example of a railroad yard layout .................................................................................... 123. Example of debris on the ground of a railroad yard ......................................................... 164. Human factor-attributed train accidents in yards per million train switching miles
by month, 1994 to 1998 .................................................................................................... 285. Human factor-attributed train accidents in railroad yards by time-of-day,
1994 to 1998 ..................................................................................................................... 296. Human factor-attributed train accidents in railroad yards by hours on duty,
1994 to 1998 ..................................................................................................................... 307. Human factor-attributed train accidents in railroad yards by temperature,
1994 to 1998 ..................................................................................................................... 328. Human factor-attributed train accidents in railroad yards as a function of ambient
temperature, 1994 to 1998 ................................................................................................ 339. LWD yard injuries per million switching miles by month, 1997 to 1998 ........................ 3910. LWD yard injuries by time-of-day, 1997 to 1998............................................................. 4011. LWD yard injuries by age, 1997 to 1998.......................................................................... 4112. Weighted frequency of LWD injuries relative to age distribution .................................... 4313. LWD yard injuries by job category, 1997 to 1998............................................................ 4414. LWD yard injuries by body part, 1997 to 1998 ................................................................ 4615. LWD yard injuries by physical act, 1997 to 1998 ............................................................ 5816. LWD yard injuries by involvement of on-track equipment, 1997 to 1998....................... 5917. Participating railroad yard injuries by type, 1996 to 1998 ............................................... 7918. Participating railroad yard injuries by body part, 1996 to 1998 ....................................... 8019. Participating railroad yard injuries by physical act, 1996 to 1998 ................................... 8120. Participating railroad yard injuries by triggering event, 1996 to 1998 ............................. 8221. Participating railroad yard injuries by injury severity, 1996 to 1998 ............................... 8322. Participating railroad yard injuries by age, 1996 to 1998................................................. 8423. Participating railroad yard injuries per 1,000,000 cars switched per month,
1996 to 1998 ..................................................................................................................... 8524. Participating railroad yard injuries per 100 employees per month, 1996 to 1998............ 8625. Participating railroad yard injuries by time-of-day, 1996 to 1998 ................................... 8726. Participating railroad yard injuries by hours on duty, 1996 to 1998 ................................ 8827. Participating railroad yard injuries by railroad experience, 1996 to 1998 ....................... 8928. Interaction between participating railroad yard injury severity and age, 1996 to 1998 ... 9029. Interaction between participating railroad yard injury severity and time-of-day,
1996 to 1998 ..................................................................................................................... 91

xii
Figure Page
30. Interaction between participating railroad yard injury severity and hours on duty,1996 to 1998 ..................................................................................................................... 92
31. Interaction between participating railroad yard injury severity and experience, ]1996 to 1998 ..................................................................................................................... 93
32. Heinrich’s triangle ............................................................................................................ 9433. Railroad yard C job briefing guidelines ......................................................................... 10134. Example of an ergonomic switch stand .......................................................................... 10636. Focus group participant experience in present craft ....................................................... 11235. Distribution of focus group participants by craft............................................................ 11237. Example of close clearance between railroad tracks in a railroad yard.......................... 114B-1. Form FRA F 6180.55 railroad injury and illness summary ............................................ 152B-2. Form FRA F 6180.55a railroad injury and illness summary (continuation sheet) ......... 153B-3. Form FRA F 6180.98 railroad employee injury and/or illness record............................ 154B-4. Form FRA F 6180.54 rail equipment accident/incident report ....................................... 156B-5. Form FRA F 6180.78 notice to railroad employee involved in rail equipment
accident/incident attributed to employee human factor .................................................. 157B-6. Form FRA F 6180.81 employee human factor attachment ............................................ 158B-7. MSHA Form 7000-1 mine accident, injury and illness report ....................................... 160C-1. Personal injury data collection form............................................................................... 162C-2. Work schedule data collection form ............................................................................... 164

xiii
TABLES
Table Page
1. Human factor-attributed train accidents in railroad yards, 1994 to 1998 ......................... 272. Human factor-attributed train accidents in railroad yards, 1994 to 1998 ......................... 273. Human factor-attributed train accidents in railroad yards by visibility, 1994 to 1998 ..... 314. Human factor-attributed train accidents in railroad yards by weather condition,
1994 to 1998 ..................................................................................................................... 315. Human factor-attributed train accidents in railroad yards by temperature,
1994 to 1998 ..................................................................................................................... 326. Train accident severity by track type, 1994 to 1998 ......................................................... 347. Railroad yard train accident severity by cause, 1994 to 1998 .......................................... 348. Railroad yard injuries resulting from human factor-attributed train accidents,
1994 to 1998 ..................................................................................................................... 359. Hazmat accidents, 1994 to 1998 ....................................................................................... 3610. Railroad injuries, 1997 to 1998 ........................................................................................ 3711. LWD yard injuries by month, 1997 to 1998 ..................................................................... 3812. LWD yard injuries by time-of-day, 1997 to 1998............................................................. 4013. LWD yard injuries by age, 1997 to 1998.......................................................................... 4114. Weighted frequency of LWD yard injuries by age, 1997 to 1998 .................................... 4215. LWD yard injuries by job category, 1997 to 1998............................................................ 4416. LWD yard injuries by type of injury, 1997 to 1998 .......................................................... 4517. LWD yard injuries by body part, 1997 to 1998 ................................................................ 4618. LWD yard injuries by triggering event, 1997 to 1998 ...................................................... 4719. LWD yard injuries by triggering event and sorted by the number of injuries,
1997 to 1998 ..................................................................................................................... 5020. LWD yard injuries by higher-level triggering event, 1997 to 1998 ................................. 5321. LWD yard injuries by physical act, 1997 to 1998 ............................................................ 5422. LWD yard injuries by physical act and sorted by the number of injuries,
1997 to 1998 ..................................................................................................................... 5623. LWD yard injuries by higher-level physical act, 1997 to 1998 ........................................ 5824. LWD yard injuries by involvement of on-track equipment, 1997 to 1998....................... 5925. LWD yard injuries by involvement of roadbed materials, 1997 to 1998 ......................... 6026. Comparison of 1997 nonfatal occupational injuries and illnesses for selected
industries and classifications of injury ............................................................................. 6227. Percent distributions for 1997 nonfatal occupational days-away-from-work
injuries and illnesses for selected industries and age groups............................................ 6328. Percent distributions for 1997 nonfatal occupational days-away-from-work injuries
and illnesses for selected industries and injury types ....................................................... 64

xiv
Table Page
29. Percent distributions for 1997 nonfatal occupational days-away-from-work injuriesand illnesses for selected industries and body parts affected ........................................... 66
30. Percent distributions for 1997 nonfatal occupational days-away-from-work injuriesand illnesses for selected industries and triggering events ............................................... 67
31. Percent distributions for 1997 nonfatal occupational days-away-from-work injuriesand illnesses for selected categories of DAFW and age groups ....................................... 68
32. Percent distributions for 1997 nonfatal occupational days-away-from-work injuriesand illnesses for selected categories of DAFW and industries ......................................... 69
33. Participating railroad distribution of injuries by location, 1996 to 1998.......................... 7834. Variables that lacked sufficient data to report .................................................................. 7835. Participating railroad yard injuries involving track and train equipment,
1996 to 1998 ..................................................................................................................... 8236. Age distribution weighted frequencies for participating railroad yard injuries,
1996 to 1998 ..................................................................................................................... 8437. Railroad experience-weighted frequencies for participating railroad yard injuries,
1996 to 1998 ..................................................................................................................... 8938. Total and expected number of shifts worked .................................................................... 9339. Total and expected number of shift start times between 8 p.m. and 4 a.m. ...................... 9340. Total and expected number of shifts greater than 8 hr ..................................................... 9441. Structured interview railroad sites .................................................................................... 9842. Factors contributing to injuries in railroad yards............................................................ 10443. Factors that might help reduce railroad yard injuries ..................................................... 10544. Focus group location, worker experience and topics discussed ..................................... 11145. Suggestions to improve initial training ........................................................................... 125

xv
ABBREVIATIONS
BLE Brotherhood of Locomotive EngineersBLS Bureau of Labor StatisticsCBT Computer-Based TrainingDAFW Days Away From WorkDOT Department of TransportationFELA Federal Employers’ Liability ActFRA Federal Railroad AdministrationGAO General Accounting OfficeHOS Hours of ServiceICC Interstate Commerce CommissionLWD Lost WorkdayMOE Maintenance of EquipmentMOW Maintenance of WayMSHA Mine Safety and Health AdministrationMSM Million Yard Switching MilesOJT On-the-Job TrainingOSHA Occupational Safety and Health AdministrationPPE Personal Protective EquipmentRIP Track Repair, Inspect and Paint TrackRNT Random Number TableRRB Railroad Retirement BoardRSI Repetitive Stress InjurySME Subject Matter ExpertSOFA Switching Operations Fatality AnalysisT&E Train and Engine (Crew)TCU Transportation Communications Union (Brotherhood Railway Carmen Division)UTU United Transportation Union

1
EXECUTIVE SUMMARY
Safety in the railroad industry has improved markedly over the last two decades. Both accidentsand injures have declined substantially. In 1990, almost 21,000 railroad employees were injuredwhile on duty and an additional 40 were killed. By 1998 the number of injuries declined to8,398, less than half of the 1990 level, and fatalities totaled 27. The injury rate for railroademployees has fallen from a high of 12.1 casualties per 200,000 employee-hours in 1979 to3.27 in 1998. While this rate is relatively low in comparison to other modes of transportation,several job categories within the railroad industry experience injury rates and severities far inexcess of the industry average. Many of these jobs are located in railroad yards. In fact, almosthalf of all train accidents (48 percent) and almost a third of all railroad employee injuries(31 percent) occurred in railroad yards in 1998. Understanding the circumstances andcharacteristics of these accidents and injuries is a necessary prerequisite to reducing workplacehazards and dangerous work practices in railroad yards.
To assist the railroad industry in its efforts to improve safety in the workplace, the FederalRailroad Administration (FRA) initiated this research to examine worker safety issues in yards.The research program focused on human factor-related hazards and solutions. The specificobjectives of this program were to:
1. Identify injury and accident trends using the FRA accident/injury database.
2. Examine the effect of work schedule on yard injuries.
3. Solicit and evaluate railroad labor and management opinions and experiences regardingsafety strategies.
4. Explore methods for collecting additional injury causal factor data.
The research was limited to train accidents and employee injuries that occur in railroad yards inthe United States. Analyses of train accidents were limited to human factor-attributed yardaccidents, since the overall program effort centered on human factor-related hazards andsolutions. Train accident data from 1994 to 1998 were analyzed. Analyses of personal injuriesfocused on those injuries that were sustained in a yard, by employees-on-duty, and that resultedin one or more lost workdays (LWD). A LWD injury is one that results in at least one day awayfrom work (i.e., absent) and/or one day of restricted, or “light” duty. This subset represents themost serious injuries and those with potentially the largest economic impact to both the railroadand the worker. Injury data from 1997 to 1998 were analyzed.

2
This study examined a broad range of issues that affect yard worker safety, including:
• Safety culture.• Training.• Communications.• Labor-management relations.• Work schedules.• Injury reporting procedures.• FRA-railroad relations.
The technical approach of this research program combined quantitative data analyses withqualitative research methods. Existing FRA injury and accident data were analyzed to providestatistical insights into national injury and accident demographics, while personal injury andwork schedule data from a participating railroad provided an opportunity for in-depth analysis offactors associated with worker injuries in yards. Structured interviews with railroad managementand focus groups with railroad labor provided a further understanding of the safety issues thatcould not be gleaned from existing FRA data and analyses of railroad injury and work scheduledata.
The FRA’s Office of Safety maintains databases with reports of all U.S. railroad accidents andall railroad-related injuries and occupational illnesses that meet the FRA’s reporting criteria.These databases contain information on a variety of factors that describe the circumstances andevents associated with train accidents and personal injuries.
Analyses of the FRA accident and injury data revealed the following:
• Eighty percent of railroad yard injuries resulted in one or more LWDs compared to77 percent of railroad-wide injuries and 47 percent of private industry injuries. Of all privateindustries, mining was the most similar to the yard and railroad environments.
• Sprains and strains accounted for more than half of the LWD injuries in railroad yards; thetrunk/torso was the most affected body part; slips, trips and falls were the most commontriggering event; and the acts of walking, running, or stepping over were the leading physicalacts associated with LWD yard injuries.
• The rate of human factor-attributed yard train accidents and LWD yard injuries per millionswitching miles were among the highest in July.
• Human factor-attributed train accidents in railroad yards appear to be a function of ambienttemperature. Specifically, more train accidents occur during colder and hotter temperaturesthan during the milder temperatures.
• The hours between 10 a.m. to 12 p.m. are associated with the greatest number of LWD yardinjuries and a relatively large number of human factor-attributed train accidents. The hours

3
between 2 a.m. and 4 a.m. are also associated with a large number of human factor-attributedtrain accidents, but relatively few LWD yard injuries.
• Employees younger than 35 appear to suffer a greater percentage of LWD yard injuries thantheir proportion within the workforce.
There were several limitations to the FRA accident and injury data and the analytical methods ofthe study. These limitations centered on the types of data and reporting definitions. Ofparticular note was that there were minimal exposure measures available for the accident andinjury data.
Three years (1996 to 1998) of employee injury data were also collected from a participatingrailroad. These data included FRA reportable injuries as well as non-reportable injuries.Information was collected on the circumstances of the injury, personal factors (e.g., age, railroadexperience), and environmental factors (e.g., location of the injury, weather).
Analysis of work schedule data centered on Train and Engine (T&E) employees injured in theyard, since work schedule data was only available for these crafts. Thirty days of work scheduledata prior to the injury were collected for each injured employee. Similar data were alsocollected for a craft, experience, and age-matched sample of non-injured T&E employees toallow a statistical comparison to be performed between the two groups.
Key findings from the data analyses of the participating railroad include:
• The greatest number of injuries occurred during the injured employees’ 4th through 6th houron duty.
• Although the most injuries in any 2 hour time period occurred between 10 a.m. and 12 p.m.,the second-most injuries occurred between 8 p.m. and 10 p.m.
• May, July and August were associated with the highest injury rates.
• The most affected body parts were the arms and hands; sprains and strains were the mostfrequent type of injury; the physical acts of walking, running or stepping over wereassociated with the most number of injuries; and being struck by or against an object was themost common triggering event.
• There were no statistically significant differences between the injured T&E employees andthe non-injured T&E employees with respect to the work schedule variables analyzed. Alack of statistically significant differences does not necessarily mean that operator fatigue isnot an issue in yard operations, however.
Structured interviews were conducted at four different railroad yards across the country.Interviews were conducted with railroad officials responsible for the development,implementation, and/or oversight of safety programs at their respective railroad yards. The

4
interviews focused on issues that were specific to railroad yards, such as contributors to injuriesin yards; however, many of these issues are not limited to railroad yards.
The structured interviews identified a number of strategies that foster worker safety in yards.These strategies centered around training, communications, equipment and facilities, andemployee performance. Some examples include:
• The most effective on-the-job training (OJT) mentors are those who are selected because oftheir desire to train others and their skill in teaching others.
• Railroads offer a variety of ways for employees to report unsafe conditions; the moreoptions, the more likely unsafe conditions will be reported.
• Ergonomic and push button switch stands, use of radio communication in place of handsignals, use of “walking” stone on switch leads, and a clean work environment can all help toreduce injuries in railroad yards. Many of these, in fact, have already been implemented atthe railroads that were visited.
• Employees must feel ownership of safety in the yard and must take responsibility for safework practices. Improved training, emphasis on behavioral observation, and daily jobbriefings are methods used by the four sites to help keep employees focused on safe workpractices.
Focus group interviews with railroad yard workers provided a forum to gather information aboutworker experiences in the yard environment and to solicit ideas, from the worker’s perspective,as to how safety can be improved in railroad yards. These structured group meetings alsoprovided a forum to obtain feedback on two concepts for future data collection–a supplementalanonymous injury survey and a third-party anonymous safety reporting system.
St. Louis, Houston, and Chicago were selected as focus group interview sites due to the largenumber of railroad yard workers available in each location. Participants were recruited from thethree general crafts that make up the majority of yard workers: trainmen (switchmen andconductors/foremen), engineers, and carmen. A total of 11 focus groups were conducted, and atotal of 11 topics were addressed. The information from the focus group interviews provided arich source of information about yard worker safety from the worker’s perspective. Some of thefindings include:
• Participants felt that employees in some yards experience harassment and intimidation.According to participants, harassment and intimidation result in: 1) less effective training;2) underreporting of injuries and unsafe conditions; 3) under-maintained equipment andfacilities; 4) fatigued employees; and 5) unsafe work practices (e.g., pressure to rush to get ajob done). According to participants, this animosity hinders sharing information and workingcollaboratively with management to solve problems.

5
• Participants felt that incentive programs with material rewards have little or nothing to dowith worker motivation to work safely.
• Participants were of the opinion that initial training for novice trainmen did not adequatelyprepare them to do the job. Experienced workers expressed a concern that new trainmenwith whom they work were not adequately trained.
• Several aspects of current T&E crew management practices were a source of dissatisfactionto participants. These included difficulty in taking a personal or sick day, scheduleuncertainty for the extra board, and pressure to work overtime.
The negative organizational climate that appears to exist in the yard environment likely will limitthe effectiveness of new data collection initiatives that focus on obtaining supplementalinformation on injuries. Specifically, based on focus group participants’ concerns aboutretribution from the railroads, a supplemental anonymous injury survey is not recommended as ameans to collect additional data regarding the circumstances of an injury. Further, the success ofa third-party anonymous safety reporting system will depend on the cooperation and involvementof the railroad industry and labor organizations.
Based on discussions with railroad officials during the site visits and focus group interviews withrepresentatives of yard crafts, a set of best practices for fostering a positive safety climate andreducing the risk of worker injuries was identified. Best practices are organized around majorthemes. Some best practices that were identified include:
• Remove trash, debris, and other slip and trip hazards from the yard on a regular and frequentbasis.
• Select OJT mentors who are interested in training new hires and are effective trainers.Compensate mentors appropriately.
• Offer several methods for reporting an unsafe condition. Some individuals will take the timeto fill out a written report, some prefer to have their union representative do the reporting forthem while others may find a telephone message suitable.
• Spend money on capital safety improvements rather than on material incentives.
• Create a more supportive work environment.
The findings and experiences from this study also suggest several ways in which the FRA canimprove the analysis of worker safety. These are organized into 1) enhancements to the FRA’saccident and injury data collection and reporting process, and 2) additional research.
Recommendations to enhance the FRA’s accident and injury data collection and reportingprocess include the following:

6
• Develop better exposure measures.
• Develop better or more complete instructions, definitions and guidelines to assist railroadpersonnel in completing FRA accident and injury forms.
• Collect additional injury-related data.
• Report data on injury severity.
• Encourage and facilitate industry adoption of computer-based data collection and reporting.
• Continue to work collaboratively with railroad management and labor.
Areas for future research on issues related to worker safety in yards that are identified anddiscussed in the report include:
• Examine the relationship of work schedules to yard injuries.
• Examine the impact of the Federal Employers' Liability Act (FELA) on injury reporting anddata collection.
• Examine the feasibility of developing a third-party anonymous safety reporting system.
• Conduct a root cause and error analysis of railroad yard injuries.
• Conduct an information exchange workshop to gain knowledge about injury reportingmethods and procedures used in other modes of transportation and in other industries.
• Explore the feasibility and effectiveness of behavior-based safety programs in the railroadenvironment.

7
1. INTRODUCTION
1.1 Background
Safety in the railroad industry has improved markedly over the last two decades. Both accidentsand injures have declined substantially. In 1990, almost 21,000 railroad employees were injuredwhile on duty and an additional 40 were killed. By 1998 the number of injuries declined to8,398, less than half of the 1990 level, and fatalities totaled 27. The injury rate for railroademployees has fallen from a high of 12.1 casualties per 200,000 employee-hours in 1979 to 3.27in 1998 (FRA, 1995; FRA, 1999). While this rate is relatively low in comparison to other modesof transportation, several job categories within the railroad industry experience injury rates andseverities far in excess of the industry average. Many of these jobs are located in railroad yards.In fact, almost half of all train accidents (48 percent) and almost a third of all railroad employeeinjuries (31 percent) occurred in railroad yards in 1998. Understanding the circumstances andcharacteristics of these accidents and injuries is a prerequisite to reducing workplace hazards anddangerous work practices in railroad yards.
An issue that has received particular attention in recent years is human operator fatigue and itscontribution to injuries and accidents. Transportation system safety is compromised by fatiguedue to innate circadian factors, as well as overwork. The railroad industry operates around theclock, and this continuous type of activity requires worker flexibility in terms of shift start times,on-call work arrangements, and extended work hours. The circadian desynchronization resultingfrom interference with natural biological rhythms has a significant potential to negatively impactrailroad personnel. Although the majority of the work-rest research in the railroad industry hasconcentrated on locomotive engineers, yard employees may also suffer the effects of workingnights and rotating shifts, leading to fatigue and an increased likelihood of injury. Industryrepresentatives report that, in some yards, up to 30 percent of the work force may change shiftsat least once per week.
Job-related injuries cost American railroads over $1 billion annually (TRB, 1994). Americanrailroads do not operate under workers’ compensation statutes, as do most other industries in theUnited States. Instead, railroads operate under FELA which, despite its name, applies only torailroads. Unlike workers’ compensation statutes, FELA, does not automatically hold therailroads liable for on-the-job injuries. When a railroad employee is injured, depending on thecircumstances, he or she may submit a claim to the railroad, which in turn chooses either to payor to litigate the case. Though only a small number of claims are resolved in court, the litigationcosts to the railroads are high, and settlements to injured employees are often delayed due to thelegal process. Continued improvements in railroad worker safety, therefore, will not only reducethe number and severity of worker injuries, but also will result in significant savings forrailroads.

8
To assist the railroad industry in its efforts to improve safety in the workplace, the FRA initiatedan evaluation of worker safety issues in yards, where a large number of employee injuries occur.The evaluation effort involved analyses of FRA-maintained railroad injury and accident data,data collection and analysis of site-specific injury and work schedule data from a participatingrailroad, and the collection of qualitative data in the form of structured interviews with railroadmanagement and focus groups with railroad labor. The research program focused on humanfactor-related hazards and solutions. This report describes the methods and results of this entireresearch program.
1.2 Purpose
The purpose of this research was to understand the mechanisms underlying injuries and accidentsthat occur in railroad yards throughout the United States. The specific objectives of this programwere to:
• Identify injury and accident trends using the FRA accident/injury database.
• Examine the effect of work schedule on yard injuries.
• Solicit and evaluate railroad labor and management opinions and experiences regardingsafety strategies.
• Explore methods for collecting additional injury causal factor data.
1.3 Scope
The scope of the research was limited to train accidents and employee injuries that occur inrailroad yards in the United States. Analyses of train accidents were limited to human factor-attributed yard accidents, since the overall program effort centered on human factor-relatedhazards and solutions. Train accident data from 1994 to 1998 were analyzed. Analyses ofpersonal injuries focused on those injuries that were sustained in a yard, by employees-on-duty,and that resulted in one or more LWD. A LWD injury is one that results in at least one day awayfrom work (i.e., absent) and/or one day of restricted, or “light” duty. This subset represents themost serious injuries and those with potentially the largest economic impact to both the railroadand the worker. Injury data from 1997 to 1998 were analyzed. 1997 was the first year in whichthe specific location (on the railroad property) where the injury occurred was reported to theFRA, thus analyses of yard-specific injuries could only be conducted starting in 1997.
This study examined a broad range of data and issues which are likely to affect yard workersafety, including:
• Injury reporting procedures.• Work schedules.• Training.• Safety culture.

9
• Communications.• Labor-management relations.• FRA-railroad relations.
1.4 Overall Approach
The overall technical approach combined quantitative data analyses with qualitative researchmethods. (See Figure 1.) Quantitative data analyses of existing FRA injury and accidentdatabases provided valuable statistical insights into national injury and accident demographics,while analysis of personal injury and work schedule data from a participating railroad providedan opportunity for in-depth analysis of factors associated with worker injuries in yards.Qualitative methods, specifically structured interviews with railroad management and focusgroups with railroad labor, provided a further understanding of the safety issues that could not begleaned from existing FRA databases and analyses of personal injury and work schedule datafrom the participating railroad. The anonymity of all of the employees and railroads thatparticipated in this research was maintained due to the sensitive legal issues that are associatedwith injuries and accidents that occur in the workplace.
1.5 Organization of the Report
This report is divided into several major sections. Section 2 presents an overview of railroadyard operations. Section 3 discusses FELA and its relevance to railroad yard safety. Section 4
Figure 1. Overall research approach
537-FRA-00175-1
Quantitative Data Qualitative Data
FRA Accident and Injury
Data Analyses
Railroad Yard
Safety
Recommendations
Structured Interviews
with Railroad Management
Participating Railroad
Data Analyses
Focus Groups with
Railroad Labor

10
presents the analyses of the FRA accident and injury data, while Section 5 presents the methodsand results of analyses of injury and work schedule data from a participating railroad. Section 6presents the methods and findings from the structured interviews with management, and Section7 presents the methods and findings from the focus groups with labor. Section 8 presents keyfindings from the research, suggestions regarding best practices for fostering a positive safetyclimate and reducing injuries, and recommendations for improvements in the injury datacollection process and future research. Section 9 includes the references used in conducting thisresearch.
A set of Appendices are included at the end of the report. Each appendix either providessupplemental information that is germane to the research or contains supporting materials.Appendix A discusses the FRA and Occupational Safety and Health Administration (OSHA)jurisdictions over railroad employee occupational safety and health. Appendix B provides copiesof several relevant FRA accident and injury report forms. Appendix C contains copies of thedata collection forms used to collect personal injury and work schedule data from theparticipating railroad. Appendix D contains the structured interview questions used with railroadmanagement. Appendix E contains descriptions of the sites that were visited as part of theproject. Lastly, Appendix F contains the focus group questions used with railroad labor.

11
2. OVERVIEW OF RAILROAD YARD OPERATIONS
Railroad yards are not analogous to any other transportation or industrial facility. Railroad yardscan be very large, may be dark at night, contain stones and possibly debris on the ground, andinclude large, sometimes silent, moving equipment. An understanding of the activities that areperformed in railroad yards is a prerequisite to analyzing the train accidents and personal injuriesthat occur in this environment. This section presents a brief overview of a typical railroad yardlayout and describes the functions that are carried out in each area of the yard. The specificrailroad crafts or job categories that work in the yard are also identified along with theirfunctions. Lastly, typical job hazards associated with a yard are discussed.
2.1 Railroad Yard Functions
A railroad yard is a system of railroad tracks with defined limits that is used for classifyingstrings of cars into "blocks" going to common destinations, assembling blocks of cars into trains,and storing cars for later use. Trains arrive and are inspected, disassembled, and reassembled.Newly assembled trains are then inspected before departing for another destination. Many yardsalso have facilities to inspect and service locomotives and some yards have facilities to conductmajor car repairs. Yards come in all sizes and shapes; no two yards are identical, since each isgenerally built to fit a particular geographical area or a particular logistical need. Many yardshave areas for transferring intermodal freight to and from the rail system. Some yards handleprimarily through freight while others service local industries.
Historically, railroad yards were built close to traffic origins and destinations so that they couldbetter serve major traffic sources, and receive and build trains for main line movement. As thecountry grew, operating divisions were formed and smaller yards were frequently built betweendivisions in order to switch trains for further movement and to change locomotives and crews.These “divisional yards” were typically 100 to 125 miles apart. This was the distance that anaverage crew (four to six employees) could achieve in a 16 hour workday, and the distance steamlocomotives could travel before needing to be serviced. At one time, the number of divisionalyards was in the thousands.
Although the functions of railroad yards remain the same today as they were 100 years ago, thenumber of present day yards has been greatly reduced to reflect the operational changes that haveoccurred in the railroad industry. As diesel locomotives replaced steam locomotives, it was nolonger necessary to service locomotives every 100 to 125 miles. Railroad traffic patternschanged as well. Large volume shippers replaced numerous small customers and consequentlyrailroads removed many branch lines and local delivery tracks. Much of the short haul portion ofthe business went to trucks, and the railroads developed the intermodal market. As a result of
12
these changes, many of the smaller yards have disappeared, and the remaining yards have feweremployees. Locomotives and trains can now go hundreds of miles between servicing. Crewagreements have also changed. Today there are fewer employees on each crew; two to threeinstead of four to six employees previously assigned to each freight train. Many crews run onmore than one crew district of 100 plus miles and work on longer inter-divisional runs of 200 to300 mi.
Although the remaining classification yards may look different than they did 100 years ago, theystill perform the same basic functions: receive trains, classify the cars according to destination,and assemble new trains in preparation for travel to their next destination.
2.2 Typical Railroad Yard Layout and Operation
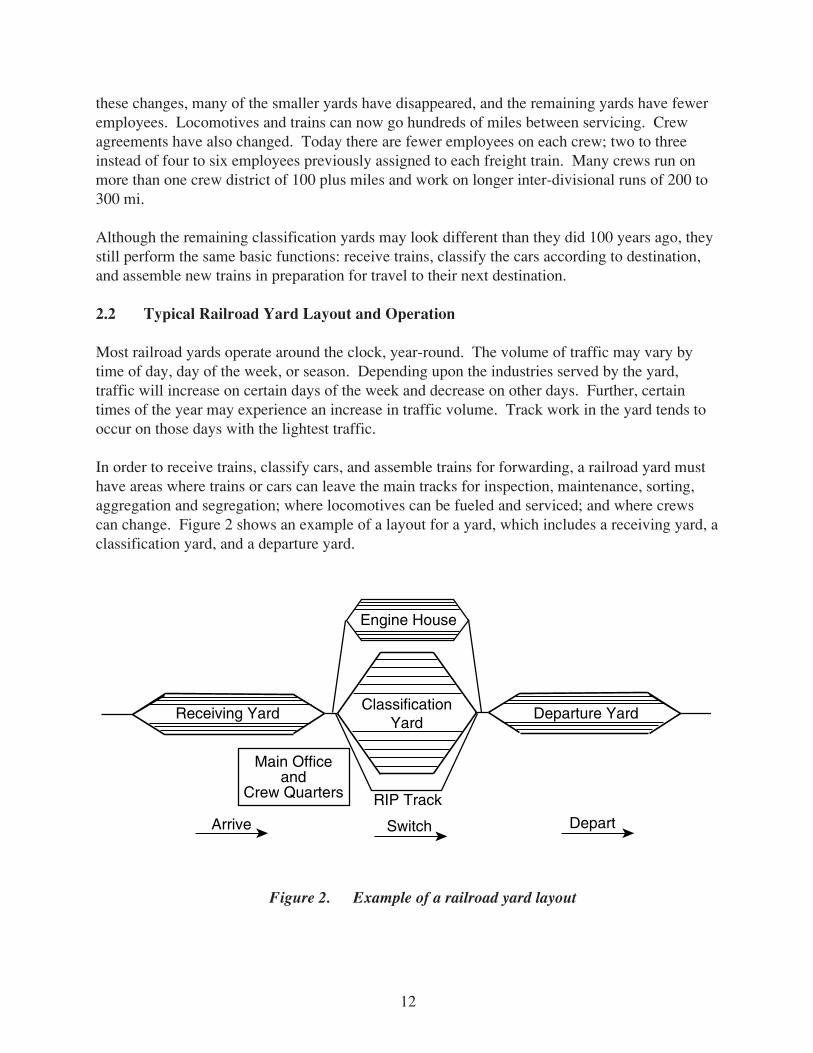
Most railroad yards operate around the clock, year-round. The volume of traffic may vary bytime of day, day of the week, or season. Depending upon the industries served by the yard,traffic will increase on certain days of the week and decrease on other days. Further, certaintimes of the year may experience an increase in traffic volume. Track work in the yard tends tooccur on those days with the lightest traffic.
In order to receive trains, classify cars, and assemble trains for forwarding, a railroad yard musthave areas where trains or cars can leave the main tracks for inspection, maintenance, sorting,aggregation and segregation; where locomotives can be fueled and serviced; and where crewscan change. Figure 2 shows an example of a layout for a yard, which includes a receiving yard, aclassification yard, and a departure yard.
Figure 2. Example of a railroad yard layout
ClassificationYard
Departure YardReceiving Yard
Arrive Switch
RIP Track
Depart
555-FRA-00175-1
Engine House
Main Officeand
Crew Quarters

13
2.2.1 Receiving Yard
Trains enter the yard through the receiving yard. This is the area where railroad personnelthoroughly inspect the physical condition of the incoming cars, and if necessary, crawl undercars to inspect running gear and brakes. This area must be isolated and secured to preventequipment movement during these inspections. When trains are received and are beinginspected, locomotives are uncoupled and sent to a locomotive servicing area, where they areinspected and fueled.
Employees who usually work in the receiving yard include road crews (two to three people percrew); inspection crews (two to five people per crew); and yard crews (two to three people percrew). Some yards may employ switch tenders who assign trains to the proper tracks.
To prepare for the next step in the process (classification), the inspection crew (carmen) bleeds-off the brakes and identifies cars that need further repair. Cars in need of repair are moved to acar repair location such as a Repair, Inspect and Paint (RIP) track. Meanwhile, clericalemployees prepare and forward a switch list to the yardmaster. The yardmaster is usuallylocated in an area where activities at key locations in the yard can be observed, such as betweenthe receiving and classification yards, and/or between the classification and departure yards.Larger yards may employ more than one yardmaster. The yardmaster uses the switch list todetermine how to best utilize the classification yard. This may require modifications to theswitch list, such as classifications requiring more than one track, or cars in need of repairs.
2.2.2 Classification Yard
There are many tracks of different lengths in classification yards, but they are typically shorter inlength than either receiving or departure yard tracks. In the classification yard, the switch list isused to identify cars going to the same destination. These cars are then placed together on thesame track. Cars are “humped” or “kicked” into the classification yard. Humping is a method ofclassifying cars whereby cars to be classified are pushed up a hill (or hump). At the top of thehill, cars are uncoupled, usually in sets of one, two, or three, and roll down the other side of thehill and into a designated classification track using their own momentum and automatic carretarders. Kicking is another method of classifying cars whereby uncoupled cars are pushed bylocomotive with sufficient speed to allow free forward movement into the selected classificationtrack. Employees in the classification yard typically include a yard engineer, a conductor (calleda foreman in a yard), and a switchman.
2.2.3 Departure Yard
The departure yard resembles a receiving yard. Each track is typically one train length long andtrack centers are ideally wide enough to accommodate mechanized car inspection vehicles. Yardengines are used to couple and pull the cars in the proper order from the classification tracks tothe departure tracks. Once a train is assembled (or “built”), with cars in proper blocks, the cardepartment inspection crews are notified and car inspection begins. During the inspection, theair hose at one end of the car is coupled to the air hose of the adjacent car. Running gear and
14
loads are also inspected. When these inspections have been completed, the brakes are thencharged and tested. When the brake tests are completed, the locomotives are attached and finalbrake tests are performed. After final brake tests the train is dispatched from the departure yard.
In the departure yard, typically yard crews, car inspection personnel, and road crews operate toprepare the newly assembled trains for departure.
2.2.4 Other Areas within the Railroad Yard
Within the railroad yard there may be other areas, such as a locomotive servicing area, car repairshops, RIP tracks, industrial yard, cleaning tracks, intermodal facilities, office areas, crewreporting areas, bunk house and track maintenance facilities. The type of facilities at each yarddepends on the yard’s function within the railroad network, its location, and its size, among otherfactors.
2.3 Railroad Departments and Their Functions
To perform the basic functions of receiving trains, classifying the cars, and assembling trains forforwarding, yards primarily require the services of three different railroad departments: thetransportation department, the mechanical department, and the engineering department. Thesethree departments are described briefly in the following sections.
2.3.1 Transportation Department
Transportation department personnel are responsible for operating the trains. They come fromthe ranks of trainmen (mostly conductors) and engineers. Often, a conductor who worksprimarily in the yard is called a foreman. The current minimum crew size for a train crew istwo–a conductor and a locomotive engineer. Such a two-person crew typically operates trainsthat run from one terminal to another, often called “through” trains. Trains that service localindustries, often called “local” trains, frequently have a third person, a switchman, on the crew toassist with the additional switching and picking up and setting out of cars. Yard and local freightcrews often also contain three-person crews because of the large amount of switching that theydo in the yard. The job of these employees requires being on and around moving railroadequipment. Locomotive engineers are responsible for the operation of the train and never leavethe cab of the locomotive while it is in operation, unless the engineer is remotely controlling thelocomotive, in which case he or she may be on the ground operating the locomotive. Theconductor, or foreman, is responsible for operating the switches and coupling/uncoupling cars,and is often aided by a switchman on the ground. In the yard, a hostler, instead of a locomotiveengineer, occasionally will be responsible for the limited movement of the train, typically from atrack to the engine house for inspection, refueling or repairs.
The clerical personnel in the transportation department generally work in an office environment,where they serve as the interface between the communications systems and the groundpersonnel. Their primary responsibility is the preparation of switch lists to guide theclassification of trains according to each car’s destination. They prepare instructions for the

15
crews and check and update computer databases. They ensure that the crews are aware of eachcar’s destination and any particular instructions that are needed such as the presence of excessivecar dimensions or hazardous cargo in their trains.
2.3.2 Mechanical Department
There are two different groups of mechanical personnel; those involved with locomotiveservicing and maintenance, and those involved with car maintenance. Both are considered“maintenance of equipment,” or MOE, jobs. The locomotive personnel generally perform theirwork in an indoor engine house. The car department personnel normally work in three areas of alarge yard: the receiving yard where they inspect and bleed the cars in preparation forclassification, the departure yard area where they prepare the cars for movement on the mainline;and the repair yard and/or shop area.
2.3.3 Engineering Department
Also referred to as the Maintenance of Way (MOW) department, the engineering department isresponsible for inspecting, repairing, and maintaining the roadbed and track structures; allswitches and retarders; all buildings; and all communication and signaling devices.
2.3.4 Distribution of Work Force
A typical railroad yard has the following work forces, all of whom are directly or indirectlyinvolved with the movement of trains inside a yard:
• Trainmaster - The individual responsible for all crews working in the yard.
• Yardmaster - The individual in charge of all movements within yard limits.
• Yard Crews - Yard conductors, yard foremen, switchmen, yard engineers, yard brakemen,and car retarder operators.
• Road Crews - Locomotive engineers, firemen, conductors and brakemen.
• Car Mechanical Work force - Foremen, car inspectors and repairmen.
• Locomotive Mechanical Work force - Foremen, laborers, hostlers and electricians.
• Maintenance of Way Work Forces - Track and gang foremen, supervisors, laborers,inspectors, and communication and signal maintainers.
• Clerical Work Force - Arrival clerks, classification clerks, bill rack personnel, equipmentdispatchers and chief clerk.

16
2.4 Typical Hazards within a Railroad Yard
There are numerous hazards associated with railroad yards due to the high traffic volume, thephysical layout of the yard, and the labor-intensive nature of switching cars. These job hazardsinclude a high volume of large, heavy, moving equipment; uneven surfaces; manual switches;equipment and debris on the ground (see Figure 3); noise and visual distractions; inclementweather; and greasy and slippery work areas and surfaces (e.g., a switching step or verticalhandhole of a locomotive). These and other hazards will be discussed later in the report.
2.5 The Injury Reporting Process
In general, all railroads have a similar procedure for reporting personal injuries, though there issome variation across railroads, and even across yards within a railroad. Although every railroadprovides the same information to the FRA via monthly injury and illness summaries (Form FRAF 6180.55a), each railroad has its own specific forms, investigation procedures and resolutionprocedures that are used in collecting information about a personal injury.
Typically, the injured employee or another crew member notifies the yardmaster, who in turnnotifies the trainmaster. The injured employee receives appropriate first aid or medicaltreatment, as necessary. The trainmaster, director of safety, and possibly a claim agent theninvestigate the injury. In many railroads a formal hearing is held after the investigation, at whichtime discipline may be imposed on the employee. The injured employee may appeal the decisionthrough a contractually established mediation process, though this depends on the railroad and
Figure 3. Example of debris on the ground of a railroad yard

17
the contract that was negotiated between the injured employee’s representative union and therailroad. The injured employee may also make a legal claim against the railroad to obtainmonetary compensation for additional medical expenses and other costs. The railroad may thenchoose to settle the claim or litigate. Section 3 further discusses the background and context inwhich railroads and employees settle or litigate injury-related claims in the U.S.

18
3. FEDERAL EMPLOYERS’ LIABILITY ACT (FELA)
Provisions of FELA govern employee injury settlements in the railroad industry. The provisionsof this law and its effect on both workers and railroad management are an important element ofthe overall safety environment in the railroad industry. Section 3 discusses FELA’s historicalbackground, provisions, and impact on railroad worker safety.
3.1 Historical Background
Many procedures and requirements governing the employment and compensation of railroadworkers date to the late 19th century when railroads were the premier U.S. industry employingthe largest work force in the nation and facing little competition from other transportation modes.Railroad work at the turn of the century was extremely dangerous. One out of eight workers wasinjured on the job and one in every 125 was killed every year. Compare this with one in31 workers injured in 1998 and 27 deaths out of 257,000 railroad workers. At that time theaverage life expectancy of switchmen after starting work was seven years.
Lacking any systematic procedure for recovering for injuries, railroad workers could seek torecover damages through the court system. However, the concept of guaranteeing compensationto injured employees, which had already been adopted in Europe, had not yet gained acceptancein the U.S. If the injured worker were to attempt a legal remedy, the burden of proof was on theemployee to prove that the employer was negligent in providing a safe work place.
Injured workers found it difficult to recover for their injuries under this system because railroadscould offer one of three defenses. “Through the use of the principle of contributory negligence,employers were able to avoid liability if they could demonstrate that any negligence lay with theemployee. Under the fellow-servant doctrine, the injured employee could not establish employernegligence solely based on the negligence of a fellow employee. Employers could also use adefense based on the assumption-of-risk doctrine, which held that the employee in continuing towork after knowing of a particular danger assumed the risks of injury or death entailed by thatparticular danger” (TRB, 1994, p. 16).
Around the turn of the century states began considering and adopting limited no-fault approachesto compensating injured workers. Because of the difficulty experienced by injured workers inrecovering through the courts, a number of states passed employer liability laws which sought tolimit or eliminate the defenses to liability that allowed employers to avoid being found negligent.Between 1855 and 1911, 25 states passed some form of employment liability law which limitedthe defense which employers could offer. By 1921 all but six states had instituted some form ofworkers’ compensation coverage.

19
Amidst a period of reform of labor liability law, Congress enacted FELA in 1908. FELA keptthe fault-based system that already existed but the process for recovering damages becamesubstantially easier because FELA eliminated or restricted the defenses that a railroad employercould use to avoid responsibility for injuries. More specifically, FELA eliminated the fellow-servant defense and restricted the assumption-of-risk doctrine. The act also eliminated thecontributory negligence defense and replaced it with the concept of comparative negligence.Comparative negligence allows the employee to recover proportionate damages when part of theresponsibility for the injury is due to the employee’s own negligence.
Within two years of the passage of FELA, Congress appointed a commission to study thefeasibility of abandoning FELA and replacing it with a no-fault system of the type being adoptedby many states for workers’ compensation in all other industries. The commission recommendedthat FELA be repealed and replaced by a no-fault system. Bills to rescind FELA passed both theHouse and Senate but minor differences could not be reconciled in conference and the billsexpired before being passed into law. Subsequent efforts to repeal FELA were opposed by therailroad unions. Through the 1930s Congress made incremental changes to FELA rather thanreplacing it. The last changes, in 1939, eliminated the assumption-of-risk defense and addedprovisions to prevent interference with any person attempting to provide information on a FELAclaim (Schwartz and Mahshigian, 1986). Today the railroad industry’s injury compensationsystem remains the fault-based one created by FELA. However, many aspects of it have becomemore like the no-fault system that applies to most of the U.S. work force.
Recognizing that FELA has been a long-time source of controversy in the railroad industry, theHouse Appropriations Committee in 1991 requested that the Transportation Research Board(TRB) undertake a comprehensive analysis of FELA. TRB’s report, issued in 1994, presents adescription of the provisions and costs of FELA along with a thorough comparison of FELAwith workers’ compensation systems. The objective of the TRB study was to analyze the FELAsystem and compare it with other approaches to compensating injured workers; Congress did notask TRB to recommend specific changes in federal policy. However, the TRB study team didsuggest that “... it would be wise if all changes to FELA were developed through negotiation”(TRB, 1994, p. 167).
The TRB study estimated that the level of benefits under FELA is two to four times higher thanunder workers’ compensation for comparable injuries but benefits can be delayed by asignificant period if litigation is involved. The AAR reports that in 1991 Class I railroads spent$911 million in FELA damage claims and another $288 million for administrative costs and legalfees. In cases where the employee had legal representation, the lawyer’s fee claimed 25 to30 percent of the settlement (TRB, 1994, p. 14).
In 1995 the Subcommittee on Railroads, House Committee on Transportation and Infrastructure,asked the U.S. General Accounting Office (GAO) to examine the implications for railroad costsand railroad workers of 1) replacing FELA with a no-fault compensation system or 2) modifyingFELA. At the same time the GAO was also asked to assess the affect of FELA on railroads withannual revenues of less than $250 million. Since the TRB study compared FELA with stateworkers’ compensation systems, the GAO considered two types of no-fault compensation

20
systems: one covering civilian federal workers and one covering maritime workers (GAO,1996).
The GAO concluded that replacing FELA with a no-fault compensation system could reducerailroad costs if less than two-thirds of the workers receiving settlements were permanently andtotally disabled. Railroad’s compensation costs would be less under a no-fault system forworkers able to return to work because a no-fault system does not provide compensation for non-economic losses. The GAO also found that placing limits on awards for non-economic damagesmight reduce injury compensation costs, depending on the proportion of FELA awardsrepresenting non-economic damages. Similarly, the effect of a limit on attorneys’ fees woulddepend upon how the fees relate to settlement amounts. The FELA experiences of smallrailroads differed somewhat from their larger counterparts. Using 1994 data from a survey of560 small railroads, The GAO found that FELA costs per employee-hour worked were less thanthose of larger railroads ($0.96 versus $2.26 per employee-hour worked). This is due to the factthat the small railroads had, on average, fewer lost workdays per injury and lower averagewages. The GAO also found that nearly all of the respondents to its survey are covered byinsurance for FELA claims.
The debate over FELA continues. For at least the near term, the FELA system will be the meansfor compensating railroad workers for workplace injuries.
3.2 Provisions of FELA
The process for compensating injured railroad workers is based on both the FELA statute andprovisions of collective bargaining agreements between railroad labor and management. Sincepassage of FELA in 1908 the injury compensation process employed by the railroads hasevolved from one that is totally fault-based to one that now incorporates many features of theno-fault workers’ compensation system that covers workers in most other industries. Someprocedures, designed to streamline and expedite the compensation process, have been institutedby the railroads unilaterally.
Railroad health insurance plans provide coverage for medical expenses. An employee need nottake action under FELA to recover medical bills. However, unlike workers’ compensation plans,payment for pain and suffering or loss of future earning potential is not guaranteed to a railroademployee.
The right to sue guaranteed by FELA does not mean that an employee must resort to litigation toreceive compensation for his/her work-related injury. After being injured, the worker is requiredto file an accident and injury report that describes the circumstances of the accident and thenature of the injury. In most cases this report initiates the claim process.
For most claims, the employee and the railroad’s representative negotiate directly and reach asettlement on the employee’s compensation. Approximately 70 percent of claims are settled inthis manner. Another 10 percent are settled after the employee retains legal counsel but before a

21
suit is filed and the remaining 20 percent are litigated. Of the 20 percent of claims that arelitigated each year, only 5 percent (1 percent of all claims) reach the point of a jury verdict.
For minor injuries and little lost work time, FELA functions administratively in much the sameway as a workers’ compensation system. However, compensation to the employee tends to behigher under FELA. For more serious claims, negotiation may fail, especially if the railroadbelieves that the employee should bear a substantial portion of the negligence burden.
3.3 Impact of FELA on Railroad Worker Safety
Proponents and opponents of FELA have different views regarding the impact of the law onworker safety. Railroad labor contends that FELA is an incentive to railroad management tohold railroads accountable for the safety of their operations. The cost of potential FELA awards,they claim, is an incentive to eliminate unsafe conditions.
Railroad management, on the other hand, points out that railroad work is not any more dangerousthan work in comparable industries and that railroad workers no longer need special provisionsto compensate them for injuries. Management also points out that the cost of damagedequipment and freight shipments is a strong inducement to avoid accidents.
Most railroads have safety and accident prevention committees made up of employee andmanagement representatives. These committees are responsible for monitoring compliance withsafety rules and regulations and investigating accidents. However, the economic motivationscreated by FELA may limit the effectiveness of these committees in promoting a safe workplace.
“Because the employee’s right to be compensated for injuries is conditioned on showing therailroad was at fault, and because conversely, the railroad can eliminate or reduce its liability byshowing that the employee’s negligence contributed to the injury, both parties have an economicincentive to place the blame for accidents on the other. This provides motivation to obscure thetrue causes of workplace accidents, and thus hinder their objective investigation. As a result,effective modifications of workplace procedures and equipment may be delayed or prevented”(Saphire, 1991, p. 411).
The fault-based nature of FELA has the potential to foster an adversarial relationship betweenrailroad management and labor and may inhibit working cooperatively to correct unsafe workingconditions. Full and complete investigation of an accident or injury might not occur because theincentives for both the employee and railroad management are to avoid revealing any facts orcircumstances that would indicate their responsibility for the accident or injury. This systemdiscourages a cooperative working relationship between labor and management and may hinderefforts to improve safety in the workplace.
22
4. ANALYSIS OF FRA ACCIDENT AND INJURY DATA
Unlike most industries in the U.S. that report injuries to OSHA, the railroad industry reportsaccidents and injuries to the FRA. Dating back to the late nineteenth century, the InterstateCommerce Commission (ICC) had long standing statutory authority regarding railroad safety.Upon FRA's establishment in 1967, the ICC's safety regulatory responsibilities were transferredto the FRA. These responsibilities pre-date the creation of OSHA in 1970. The FRA, therefore,continues to be responsible for collecting injury and accident data from U.S. railroads.
Since OSHA's creation in 1970, the FRA and OSHA have worked together to define the areaswhere the FRA has jurisdiction over occupational safety, and where OSHA has jurisdiction. TheFRA chose to oversee five specific areas: 1) track, roadbed, and associated devices andstructures; 2) equipment; 3) operating practices; 4) signalling and train control; and 5) hazardousmaterials transportation by rail. With respect to railroad yard worker safety, OSHA’sregulations, then, apply to such issues as noise exposure in shops, personal protective equipment(PPE), hand and power tools and surfaces in repair facilities (except for equipment inspectionpits). Appendix A contains additional background on the FRA and OSHA jurisdictions, anddiscusses the specific areas within the railroad industry over which the FRA and OSHA havejurisdiction over railroad employee safety and health.
The FRA’s Office of Safety maintains databases with reports of all railroad accidents and allrailroad-related injuries and occupational illnesses that meet the FRA’s reporting criteria.Railroad accidents and injuries were analyzed to gain insight into the nature and causes ofemployee injuries and accidents that occurred in yards. The results from the analyses arepresented and discussed below. The injury analyses also include a comparison of injuries withother modes of transportation as well as other industries to provide an indication of the relativefrequency and severity of the injuries occurring in railroad yards.
Since the FRA train accident and injury databases contain a large number of cases, the power ofany statistical tests that are performed on the data will be great. In other words, a very largesample size increases the chances of finding a small, albeit non-meaningful, statisticallysignificant difference among values. Essentially, the larger the sample size (n) the easier it is tofind a statistically significant difference (or effect), although the difference may be minimal. Tocombat this problem, the significance value of the statistical tests, alpha (α), was reduced fromthe standard criterion of 0.05 to 0.01. Lowering α reduces the probability of identifying asignificant difference when one does not exist (Type I error). Thus, a lower α results in a morestringent test, and serves to balance the problem that is caused by such a large sample size. Inaddition to setting α to 0.01, results will be discussed so that the reader has enough informationto decide whether the difference is meaningful for his/her own purposes.

23
4.1 Description of FRA Accident and Injury Databases
The following two subsections describe the accident and injury databases that the FRAmaintains, and on which the accident and injury analyses are based. The reporting proceduresthat railroads must follow when reporting train accidents or injuries are also discussed.
4.1.1 FRA Accident Database
All railroads under the jurisdiction of the FRA are required to report to the FRA any trainaccident or incident (e.g., collisions, derailments) involving on-track equipment and/or thatoccurred on railroad property and that resulted in property damage to on-track equipment, track,roadbed or signal system that exceeds a monetary threshold determined by the FRA. Theamount was $6300 for accidents occurring between 1994 and 1996; $6500 in 1997; and $6600 in1998.
Each railroad whose on-track equipment or property was involved in the accident (including theowner of the track on which the accident occurred, even if there was no damage to the track)must complete form FRA F 6180.54 and submit it to the FRA. Information that is reported to theFRA includes the location of the accident, date of the accident, time of day the accidentoccurred, weather and visibility conditions, temperature, the number of consists involved,property damage, involvement of hazardous materials, and the primary and contributing causesof the train accident. For a complete listing of the information that is reported, see the FRAGuide for Preparing Accident/Incident Reports (FRA, 1997). Copies of relevant accident andinjury forms that railroads are required to complete are provided in Appendix B.
Typically each railroad has a reporting officer who is responsible for completing and submittingaccident reports (as well as many other mandated FRA forms) to the FRA. One of the morechallenging aspects of reporting train accidents is to identify the primary and contributing (ifany) cause(s) of the train accident. Reporting officers are given minimal information andtraining on how to identify the most likely cause(s) of a given train accident. Rather, they areprincipally guided by accident cause codes provided by the FRA in the FRA Guide for PreparingAccident/Incident Reports. The accident cause codes are divided into five broad categories:
1. Mechanical/electrical.2. Train operation - human factor.3. Signal and communication.4. Track, roadbed and structure.5. Miscellaneous.
Although some causes might be apparent, such as broken rail, others are not, particularly causesrelated to the employee human factor. The Code of Federal Regulations (49 CFR 225.5) definesan employee human factor simply as, “...any of the accident causes signified by the train accidentcause codes listed under ‘Train Operation - Human Factors’ in the current ‘FRA Guide forPreparing Accident/Incident Reports’ except for those train accident cause codes pertaining to

24
non-railroad workers” (49 CFR 225.5, p. 228). These “Train Operation - Human Factors” codesare divided into the following 10 broad categories:
1. Use of brakes.2. Employee physical condition.3. Flagging, fixed, hand, and radio signals.4. General switching rules.5. Main track authority.6. Train handling/train make-up.7. Speed.8. Use of switches.9. Cab signals.10. Miscellaneous.
If an employee’s physical condition, act, or omission is identified as having caused orcontributed to the train accident (i.e., any of the above 10 categories of employee human factorcause), the railroad is also required to formally notify the employee(s) and explain what specificaction(s) the railroad has identified as having caused or contributed to the train accident andwhether or not the railroad is going to investigate the employee. The employee is also given anopportunity to explain their perspective and submit it to the FRA; however, they are not requiredto do so. If the employee chooses to complete an employee statement (Form FRA F6180.78),the employee must also submit a copy of the statement to the railroad. The information that theemployee provides cannot be used against him or her by the railroad in any “...suit or action fordamages growing out of any matter mentioned in said report...” (U.S. Code 20903. See 49 CFR225.7). However, the law does not protect the employee from being fired by the railroad if theemployee has violated any of the railroad’s operating rules.
Since the scope of this report is limited to the human factor-related causes of railroad yardaccidents and injuries, only those accidents that resulted in a primary human-factor cause codewere analyzed1. Due to the inherent complications and difficulties of inferring the true cause ofan accident or injury, especially human factor causes, those accidents in which the primary causecode was human factor-related according to FRA’s cause codes will be referred to as humanfactor-attributed train accidents. The use of human factor-attributed train accidents rather thanhuman factor-caused accidents is preferable because it better describes the situation since thetrue causes are not always clear, while it is accurate to say that the accident was attributed to ahuman factor cause. The following analyses, therefore, focused on human factor-attributed trainaccidents in railroad yards from 1994 to 1998.
The FRA collects a variety of different information pertaining to the circumstances around atrain accident. Data that are collected include, but are not limited to, the time of the accident;month, day, and year of the accident; the location on the railroad where the accident occurred;the railroads involved; the type of accident (e.g., derailment, head on collision, etc.); consist
_____________
1Form FRA F 6180.54 allows railroads to report up to two “causes” for each train accident, a primary cause and a contributing orsecondary cause.
25
information (e.g., involvement of hazardous material cars); train operational information (e.g.,direction of travel, speed); the number of injuries and fatalities involved; the cause(s) of the trainaccident; damage associated with the accident; and information on the train crews (e.g., totaltime on duty at time of the accident; number of positive alcohol and drug tests). Appendix Bcontains copies of the accident report forms that the FRA requires railroads to submit when atrain accident has occurred on railroad property or involves railroad property.
The FRA Guide for Preparing Accident/Incident Reports (FRA, 1997) is published by the FRAand is made available to railroads to assist them in completing accident reports, as well as othermandatory reports. This Guide provides instructions for completing all FRA accident/incidentand injury forms, and provides definitions and reporting criteria. The FRA Office of Safetycollects, collates and maintains the train accident data and makes it publicly available by postingthe data to its website, www.fra.dot.gov, and by publishing annual reports of statistical data andtables.
4.1.2 FRA Injury Database
Each month, railroads must submit a Form FRA F6180.55 to the FRA. This form contains asummary of the reportable injuries and illnesses that occurred on the railroad’s property, as wellas railroad operational data (e.g., yard switching miles operated). Railroads are required tosubmit this form regardless of whether any injuries or illnesses occurred during the month. Foreach reportable injury or illness, the railroad must also submit a Form FRA F6180.55a (seeAppendix B for a copy of this form). An injury is “reportable” if “Any event connected with theoperation of a railroad …results in one or more of the following consequences…:
1. Death of a person within 365 calendar days of the accident/incident;
2. Injury to a person, other than a railroad employee, that requires medical treatment;
3. Injury to a railroad employee that requires medical treatment or results in restrictions of workfor one or more work days, the loss of one ore more work days, termination of employment(as interpreted by FRA), transfer to another job, or loss of consciousness; or
4. Any occupational illness of a railroad employee” (FRA Guide for Preparing Accident/Incident Reports, 1997, Ch. 6, p. 1).
Medical treatment is considered treatment beyond first aid (see the FRA Guide for PreparingAccident/Incident Reports for more specific reporting criteria).
Form FRA F 6180.55a contains the following information about each reported injury or illness:
1. Name of reporting railroad.2. Alphabetic code.3. Report month.4. Report year.

26
5. Accident/injury number.6. Day.7. Time of day.8. County.9. State.10. Type person/job code.11. Age.12. Drug/alcohol test.13. Injury/illness code.14. Physical act.15. Location.16. Event.17. Result.18. Cause.19. Number of days away from work.20. Number of days restricted.21. Exposure to hazmat.22. Termination or permanent transfer.23. Narrative.
The FRA Guide for Preparing Accident/Incident Reports also provides instructions forcompleting the relevant injury forms, and provides definitions and criteria for reportable injuriesand illnesses. Similar to the accident/incident data, the FRA Office of Safety collects, collatesand maintains this data and makes it publicly available by posting the data to its website,www.fra.dot.gov, and by publishing annual reports of statistical data and tables.
4.2 Analysis of 1994-1998 Railroad Yard Accidents
Railroad yard accident data were downloaded from the FRA’s website and analyzed2.According to the data maintained by the FRA, a total of 13,169 train accidents were reported tothe FRA between 1994 and 1998. Almost half of these train accidents (6400, or 49 percent of alltrain accidents) occurred in railroad yards. And of the 6400 train accidents that occurred inrailroad yards over the last five years, 47 percent (3026 train accidents) were attributed to humanfactors causes. Thus, human factor-attributed train accidents in railroad yards accounted foralmost a quarter (23 percent) of all train accidents occurring between 1994 and 1998.
Table 1 provides train accident figures for the last five years. After several years of decreasingfigures, the number and rate (per million yard switching miles, or MSM) of human factor-attributed train accidents in yards increased in 1997 and 1998, while the number of yardswitching miles has steadily decreased over the last five years.
In the last five years 60 percent of all human factor-attributed yard accidents have beenassociated with problems with switches and switching. These accidents include cars shoved outand left out of the clear, cars left foul, failure to couple, improperly applied portable derail,____________2Analyses were conducted using SPSS v8.0 and Microsoft Excel.

27
improperly lined switch, and spring switch not cleared before reversing. Specific cause codescan be found in the FRA Guide for Preparing Accident/Incident Reports. The second largestproportion of human factor-attributed yard accidents over the last five years (14 percent) was dueto brake-related problems. Table 2 shows the number and percentage of yard accidentsattributable to each general category of human factors cause over the last five years.
4.2.1 Season
To determine if there were seasonal (i.e., monthly) differences, the rate of human factor-attributed train accidents per million switching miles was analyzed. The FRA collects monthlydata on the number of yard switching train-miles from each railroad under its jurisdiction. Arailroad may report the specific number of yard train-miles operated, or they may use aconvention provided to them by the FRA, as specified in the FRA Guide for CompletingAccident/Incident Reports (Ch. 2, p. 11): “[A yard switching train-mile] May be computed at therate of 6 mph for the time actually engaged in yard switching service (or any other method thatwill yield a more accurate count) if actual mileage is not known.” A chi-square test conductedon the accident rate did not show a significant monthly difference over the last five years (χ2 =0.19 df = 11, p = 1.0000) (see Figure 4).
Table 1. Human factor-attributed train accidents in railroad yards, 1994 to 1998
Year
Human Factor-Attributed Train
Accidents1
% Changefrom Previous
Year
Yard SwitchingMiles
(MSM)2
Accidentsper
MSM
% Changefrom Previous
Year
1994 653 N/A 89,776,044 7.27 N/A1995 629 -4 89,891,866 7.00 -41996 513 -18 87,823,254 5.84 -171997 581 13 84,873,799 6.85 171998 650 12 83,692,064 7.77 15___________
1Source: www.fra.dot.gov.2Source: FRA Accident/Incident Bulletin (1994-96) and Safety Statistics (1997-98).
Table 2. Human factor-attributed train accidents in railroad yards, 1994 to 1998
Human Factor-Attributed CauseHuman Factor-Attributed
Train Accidents% of Total Train
Accidents
Switching 1,810 59.8Use of Brakes 434 14.3Train Handling/Make-Up 386 12.8Speed 173 5.7Flag, Fixed, Hand and Radio Signals 84 2.8Other 82 2.7Main Track Authority 53 1.8Employee Physical Condition 4 0.1Cab Signals 0 0.0

28
4.2.2 Time-of-Day
Next, time-of-day was examined to determine if it had an effect on the number of human factor-attributed train accidents in railroad yards over the last five years. Analysis of the data showedtwo peaks in accidents (See Figure 5). A slight, but possible, circadian effect may explain thesetwo peaks: one in the early morning hours (2 to 4 a.m.) and one in late afternoon (4 to 6 p.m.).These peaks correspond with the natural troughs in human circadian rhythms.
While it is possible that these results may be a function of a circadian pattern, it is also possiblethat the differences in time-of-day are a function of the amount of traffic volume or number ofpersonnel on duty. For example, the increase in train accidents between 4 and 6 p.m. could bedue to the overlap of first and second shift assignments. It is also possible that trains arescheduled to depart yards around this time, resulting in an increase in train movements.Exposure data could clarify the role of traffic volume or personnel volume in the number ofaccidents per two hour time period; however, no exposure data were available.
A chi-square test comparing the number of accidents every two hours indicated that there is alsoa significant difference among two hour time periods (χ2 = 80.969, df = 11, p<0.001). However,a chi-square test does not indicate where the significant difference lies. Visual inspection of the
Figure 4. Human factor-attributed train accidents in yards per million train switchingmiles by month, 1994 to 1998
5.00
5.50
6.00
6.50
7.00
7.50
8.00
Jan Feb Mar Apr May Jun Jul Aug Sep Oct Nov Dec
Month
533-FRA-00175-5

29
data reveals that the greatest difference in the number of train accidents between any twotwo-hour time periods occurs between consecutive time periods: 2 to 4 p.m. (178 trainaccidents) and 4 to 6 p.m. (304 train accidents).
4.2.3 Hours on Duty
Analyses were next conducted to determine if there were differences in the number of humanfactor-attributed train accidents in railroad yards based on the amount of time that a crew hadbeen on duty at the time of the train accident. Since crew members usually begin and end theshift at the same time3, it was necessary to only look at the hours on duty for one of the crewmembers. The engineer’s time on duty was used since there were more cases in which theengineer’s time on duty was reported. Two cases where the engineer’s hours on duty exceeded24 hours were eliminated from the analysis since these figures were more likely the result ofcoding error than a reflection of true time on duty.
A chi-square test indicated that there was a significant difference in the number of human factor-attributed train accidents occurring in railroad yards based on the number of hours on duty
Figure 5. Human factor-attributed train accidents in railroad yards by time-of-day,1994 to 1998
____________3A Pearson product-moment correlation analysis between engineer’s hours on duty and conductor’s yielded a significantcorrelation of 0.91, p<0.01.
0
50
100
150
200
250
300
350
12-2 AM 2-4 AM 4-6 AM 6-8 AM 8-10 AM 10 AM-12PM
12-2 PM 2-4 PM 4-6 PM 6-8 PM 8-10 PM 10 PM-12AM
Time-of-Day
533-FRA-00175-6

30
(χ2 = 751.1, df = 11, p<0.001). The second through fifth hours on duty are associated with thegreatest number of accidents (per hour), while the sixth through eighth hour on duty areassociated with the next most accidents (per hour). Then there is a substantial drop in thenumber of accidents after the eighth hour (see Figure 6). However, the reduction in the numberof train accidents after the eighth hour may be a function of exposure. That is, there may befewer crews that work longer than 8 hours per shift.
4.2.4 Visibility
Most human factor-attributed train accidents occurring in railroad yards occurred either duringdaylight or darkness - almost 45 percent of the accidents occurred during the “day,” while almost48 percent occurred during “dark.” Together, “day” and “dark” combine to account for92 percent of all human factor-attributed train accidents occurring in railroad yards between1994 to 1998. Table 3 presents visibility data at the time of the accidents. Dawn and dusk eachaccount for about 4 percent of the train accidents. If it is assumed that dawn and dusk each lastone hour per day, the percentage of accidents occurring in one hour is expected to be 4 percent.The proportion of accidents in each of the four visibility categories, then, appears to represent the
Figure 6. Human factor-attributed train accidents in railroad yards by hours on duty,1994 to 1998
0
50
100
150
200
250
300
350
400
0-1 1-2 2-3 3-4 4-5 5-6 6-7 7-8 8-9 9-10 10-11 11+
Hours on Duty
533-FRA-00175-7

31
proportion of time in each of the fourvisibility categories and thus visibility doesnot appear to be related to the likelihood ofan accident.
4.2.5 Weather and Temperature
Weather-related data for the train accidentsare shown in Table 4. It does not appear thatinclement weather conditions play a majorfactor in human factor-attributed trainaccidents in railroad yards. Sixty-five percent of the train accidents were reported to haveoccurred during clear conditions. The high percentage of train accidents occurring during cleardays may be similar to the actual proportion of clear days over the five year period for whichdata are analyzed.
Analysis of temperature data for human factor-attributed train accidents in railroad yardsindicates that accidents are relatively normally distributed across temperature. Table 5 andFigure 7 present temperature-related data. The normal distribution seen in the number of trainaccidents may simply correspond to the number of days within each temperature range; that is,the number of accidents may simply be a function of the number of days at a given temperaturerange. To adjust for exposure to specific temperatures, and to better determine whethertemperature may have an effect on the number of human factor-attributed train accidentsoccurring in railroad yards, the national mean ambient daily temperature (and standarddeviation), excluding Hawaii and U.S. territories, was calculated from historical NationalWeather Service data from 1961 to 1990 (http://nndc.noaa.gov/?http://ols.nndc.noaa.gov:7777/plolstore/plsql/olstore.prodspecific?prodnum +C00095-PUB-A0001). Once the mean andstandard deviation were known, and assuming that temperature is normally distributed, it waspossible to calculate the expected number of days at a given mean ambient temperature. Thenumber of accidents per day within various temperature ranges was then computed.
First, a normal cumulative distribution of temperatures was calculated based on Z-scores, giventhat the mean daily temperature across thecontinental United States between 1961 to1990 was 53°F and the standard deviation was10.9. The number of expected days per yearat each mean daily temperature (one degreeFahrenheit increments) was then computed,and then values were combined into 10 degreetemperature brackets. Since so few days wereexpected when the temperature was less than10°F, this bracket was combined with the nextwarmer temperature range to become ‘lessthan 20°F’. This served as the lower boundfor the temperature range. The upper bound
Table 3. Human factor-attributed trainaccidents in railroad yards byvisibility, 1994 to 1998
WeatherCondition Accidents % of Total
Clear 1,967 65Cloudy 734 24Rain 226 7Fog 39 1Sleet 7 0Snow 53 2Total 3,026 100
Table 4. Human factor-attributed trainaccidents in railroad yards byweather condition, 1994 to 1998
Visibility Accidents % of Total
Day 1,348 44.5Dark 1,442 47.7Dusk 118 3.9Dawn 118 3.9Total 3,026 100

32
for the temperature range was set at ‘90°F orgreater’ since so few days were expected whenthe mean daily temperature was greater than100°F. The number of accidents that tookplace within each temperature bracket wasthen divided by the expected number of dayswithin the temperature bracket (multiplied byfive since five years of accident data wereused).
The result, shown in, Figure 8 indicates thathuman factor-attributed train accidents inrailroad yards are a function of ambienttemperature. Specifically, more train accidentsoccurred during the extremes - colder andhotter temperatures - than during the mildertemperatures. However, since other variables
Temperature(°F) Accidents % of Total
<10 49 210 to 19 67 220 to 29 145 530 to 39 344 1140 to 49 430 1450 to 59 470 1660 to 69 519 1770 to 79 509 1780 to 89 343 1190 to 99 137 5100+ 13 0Total 3,026 100
Table 5. Human factor-attributed trainaccidents in railroad yards bytemperature, 1994 to 1998
Figure 7. Human factor-attributed train accidents in railroad yards bytemperature, 1994 to 1998
0
100
200
300
400
500
600
<10 10-19 20-29 30-39 40-49 50-59 60-69 70-79 80-89 90-99 100+
Temperature (¡F)
Train Accidents
534-FRA-00175-16

33
are closely related to temperature, such as time-of-day, weather, and visibility, it is difficult tosay just how much of an effect temperature has on these train accidents. However, the quadraticequation, y = 8.0244x2 - 73.822x + 148.37, where x represents temperature and y represents thenumber of train accidents, may serve as an adequate predictor of train accidents in the absence ofother information. This equation accounts for almost 80 percent of the variance in the trainaccidents.
4.2.6 Accident Severity
There are several ways in which to measure the severity of a train accident. One way is tomeasure the total amount of property damage associated with the accident. A second method isto count the casualties (i.e., those injured and killed) that resulted from the train accident.
Analyses of train accident data for 1994 to 1998 revealed that although train accidents occurringin railroad yards make up almost half of all train accidents (49 percent), they result in only one-third of the total property damage ($185,784,372 out of a total of $559,474,693 between 1994and 1998), and only three percent of those killed and nine percent of those injured as a result oftrain accidents (see Table 6). Mainline train accidents, in comparison, made up 40 percent of thetotal number of train accidents between 1994 and 1998; however, they accounted for 56 percentof all costs associated with the train accidents, 96 percent of those killed and 88 percent of thoseinjured as a result of train accidents during the five year period. The higher costs associated withmainline train accidents are probably due to the higher speeds associated with mainline travel.Train speeds in railroad yards are typically less than 20 mph and often less than 10 mph, while
Figure 8. Human factor-attributed train accidents in railroad yards as a functionof ambient temperature, 1994 to 1998
y = 8.0244x2 - 73.822x + 148.37R2 = 0.7943
-50
0
50
100
150
200
<20 20-29 30-39 40-49 50-59 60-69 70-79 80-89 90+
Temperature (¡F)
Train Accidents
per Day
534-FRA-00175-17
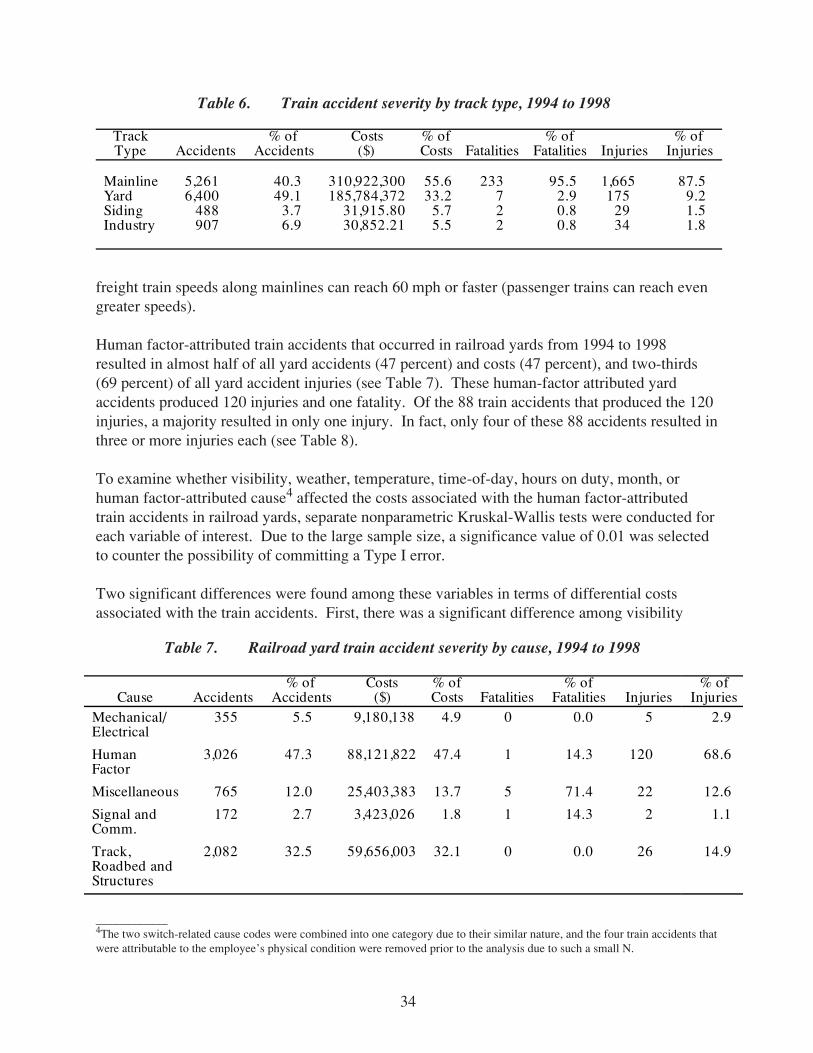
34
freight train speeds along mainlines can reach 60 mph or faster (passenger trains can reach evengreater speeds).
Human factor-attributed train accidents that occurred in railroad yards from 1994 to 1998resulted in almost half of all yard accidents (47 percent) and costs (47 percent), and two-thirds(69 percent) of all yard accident injuries (see Table 7). These human-factor attributed yardaccidents produced 120 injuries and one fatality. Of the 88 train accidents that produced the 120injuries, a majority resulted in only one injury. In fact, only four of these 88 accidents resulted inthree or more injuries each (see Table 8).
To examine whether visibility, weather, temperature, time-of-day, hours on duty, month, orhuman factor-attributed cause4 affected the costs associated with the human factor-attributedtrain accidents in railroad yards, separate nonparametric Kruskal-Wallis tests were conducted foreach variable of interest. Due to the large sample size, a significance value of 0.01 was selectedto counter the possibility of committing a Type I error.
Two significant differences were found among these variables in terms of differential costsassociated with the train accidents. First, there was a significant difference among visibility
Table 6. Train accident severity by track type, 1994 to 1998
TrackType Accidents
% ofAccidents
Costs($)
% ofCosts Fatalities
% ofFatalities Injuries
% ofInjuries
Mainline 5,261 40.3 310,922,300 55.6 233 95.5 1,665 87.5Yard 6,400 49.1 185,784,372 33.2 7 2.9 175 9.2Siding 488 3.7 31,915.80 5.7 2 0.8 29 1.5Industry 907 6.9 30,852.21 5.5 2 0.8 34 1.8
____________4The two switch-related cause codes were combined into one category due to their similar nature, and the four train accidents thatwere attributable to the employee’s physical condition were removed prior to the analysis due to such a small N.
Table 7. Railroad yard train accident severity by cause, 1994 to 1998
Cause Accidents% of
AccidentsCosts
($)% ofCosts Fatalities
% ofFatalities Injuries
% ofInjuries
Mechanical/Electrical
355 5.5 9,180,138 4.9 0 0.0 5 2.9
HumanFactor
3,026 47.3 88,121,822 47.4 1 14.3 120 68.6
Miscellaneous 765 12.0 25,403,383 13.7 5 71.4 22 12.6
Signal andComm.
172 2.7 3,423,026 1.8 1 14.3 2 1.1
Track,Roadbed andStructures
2,082 32.5 59,656,003 32.1 0 0.0 26 14.9

35
conditions, (χ2 = 20.0, df = 3, p<0.001). A visual inspection of the data indicates that the likelydifference is between dawn (the least costly accidents) and darkness (the most costly accidents).The second significant difference was among the different human factor-attributed causecategories (χ2 = 25.2, df = 6, p<0.001). Visual inspection of the data suggests that accidents dueto “main track authority”5 were the most costly, even though there were only 54 of this type ofaccident between 1994 and 1998 in railroad yards, while those accidents classified simply as“miscellaneous” were the least costly.
4.2.7 Drug and Alcohol Involvement
The FRA requires railroads to conduct post-accident toxicological testing under certainsituations. These situations generally include the following:
1. A train accident where there was a) a fatality; b) a public evacuation or a reportable injurydue to the release of hazardous material; or c) $1,000,000 or more in railroad propertydamage.
2. An impact accident (see 49 CFR 219.5; e.g., head on collision, side collision) that resulted ina reportable injury or $150,000 or more in property damage.
3. A train incident that resulted in an on-duty railroad employee fatality.
4. A passenger train accident involving a reportable injury to any person.
See 49 CFR 219.201 for the specific toxicological reporting requirements and exceptions.
Very few human factor-attributed train accidents occurring in railroad yards were associated withpositive drug or alcohol tests. Approximately one-third of the reported train accidents (n=960)contained data on alcohol and drug tests (the remaining two-thirds contained no information on
Table 8. Railroad yard injuries resulting from human factor-attributedtrain accidents, 1994 to 1998
No. of Injuries per Accident No. of Accidents No. of Injuries
0 2,938 01 64 642 20 403 1 34 2 85 1 5
Total 3,026 120
____________5The “Main track authority” category is a misnomer since data that are reported here are for yard accidents. However, thespecific codes that make up “main track authority” include “failure to stop train in (the) clear” and “movement of engine withoutauthority,” both of which can and do occur in railroad yards.

36
drug or alcohol tests). Of those cases in which data were reported, there was only one humanfactor-attributed train accident that was associated with a positive alcohol test and 17 trainaccidents that were associated with positive drug tests. Thus, altogether, positive drug or alcoholtests made up less than 2 percent of all human factor-attributed train accidents occurring inrailroad yards between 1994 and 1998.
4.2.8 Hazmat Accidents
Less than one-fifth (544, or 18 percent) of the human factor-attributed train accidents occurringin railroad yards between 1994 and 1998 involved cars that contained hazardous materials (seeTable 9). Furthermore, only 10 percent of all train accidents involved damage to the carscontaining the hazardous materials. Yet, only 16 accidents involved the release of hazardousmaterials (0.5 percent of all human factor-attributed train accidents occurring in railroad yardsbetween 1994 and 1998). Fourteen of the 16 train accidents involved the release of hazardousmaterial from one car only, while the other two train accidents each involved two cars thatreleased hazmat. No injuries or fatalities resulted from these 16 train accidents.
4.3 Analysis of 1997-1998 Railroad Yard Injuries
1997 was the first year that railroads were required to report to the FRA the railroad location(e.g., yard) where the injury occurred. Injury analyses are therefore based on 1997 and 1998FRA injury data since 1998 was the most recent year for which complete injury data wereavailable at the time of the analyses. Injury data were downloaded from the FRA’s website andanalyzed.6 The following selection criteria were used to select the data to be analyzed:
• The injury occurred in a railroad yard or on repair track7.
• The injury occurred to an employee-on-duty.
___________6Analyses wre conducted using SPSS v8.0 and Microsoft Excel.7Repair tracks share many of the same characteristics as yard tracks, including large, slow-moving equipment and inclementweather. Although repair tracks have a different function than other parts of the yard, those who work along the repair tracksmust move in and out of, as well as in between and on top of, equipment, similar to yard crews switching cars.
Table 9. Hazmat accidents, 1994 to 1998
TotalAccidents
AccidentsInvolvingConsistsCarryingHazmat
CarsContaining
Hazmat
AccidentsInvolvingDamaged
or DerailedHazmat
Cars
Damagedor
DerailedHazmat
Cars
AccidentsInvolvingRelease
ofHazmat
CarsReleasingHazmat
All Accidents 13,169 2494 20,946 1296 3,477 162 256
Yard Accidents 6,400 1123 7,687 649 1,363 43 52
Human Factor-Attributed YardAccidents
3,026 544 3,110 316 586 16 18

37
• The injury was nonfatal.
• The injury resulted in one or more lost workdays. A lost workday can result from either aday absent or a day of restricted (a.k.a. “light”) duty. Lost workdays were used in theselection criteria because lost workday injuries are the most severe and have the greatesteconomic impact to both the injured employee and the railroad.
• The injury did not occur as a result of a grade-crossing collision.
Filters were used on the FRA injury data to select those injuries that fit the selection criteria.Both the frequency of injuries and the severity of the injuries were examined. Severity wasmeasured in two ways: the median number of lost workdays and the total number of lostworkdays that resulted from the injuries. Although the FRA collects data on the number of daysabsent and days of restricted duty, it does not report this information in its annual RailroadSafety Statistics report.
Tables and figures containing mostly descriptive information are used to present the results ofthe data analyses. Chi-square tests were used to analyze frequency counts for some of thevariables, while the Kruskal-Wallis nonparametric test was used to analyze the lost workday datafor other variables. In addition, proportions of injuries (i.e., percentages) were examined withinsome categories (e.g., age), since these proportions are not sensitive to differences in frequencycounts between categories. Proportions enable pseudo-normalized comparisons to be made inthe absence of exposure data. Separately, since some of the injury cases are missing certain data(e.g., no ‘event’ code was provided), data in some of the tables presented in this section will notadd up to 100 percent of the total number of injury cases.
Table 10 presents overall statistics to provide a frame of reference with respect to yard injuries.Specifically, there were 5722 nonfatal employee-on-duty yard injuries between 1997 to 1998,about 35 percent of all railroad injuries. Of the 5722 yard injuries, 80 percent (n=4575) resultedin one or more lost workdays (LWDs). This proportion is slightly higher than the proportion ofLWD injuries in the railroad industry as a whole (76 percent). The median number of lostworkdays from yard injuries is 25, 25 percent greater than the industry-wide median number oflost workdays (20). Further, the total number of lost workdays that resulted from yard injuries(n=276,282) accounted for over 41 percent of all lost workdays in the railroad industry for 1997to 1998 (668,984).
Table 10. Railroad injuries, 1997 to 1998
RailroadLocation
Total RailroadInjuries
Lost WorkdayInjuries
% of TotalInjuries
Median LostWorkdays
Total No. ofLWDs
All 16,457 12,564 76 20 668,984
Mainline/Branch
4,743 3,621 76 19 191,960
Yard 5,722 4,575 80 25 276,282

38
4.3.1 Season
Table 11 presents monthly injury data for 1997 and 1998. The first column contains the month.The second column contains data on the number of injuries per month. The third columncontains data on the percentage of injuries for the particular month relative to the total number ofinjuries. For example, in January, there were 423 injuries that occurred between 1997 and 1998,resulting in 9.2 percent of all injuries for these two years. The fourth column contains data onthe injury rate, and is based on the number of yard switching miles reported to the FRA byrailroads each month. The fifth column contains data on the median number of lost workdays,the sixth column contains data on the total number of lost workdays, and the seventh columncontains data on the percentage of total lost workdays for each month. The format of Table 11 issimilar to other tables in this section, except for the column that contains the injury rate. This isunique to the monthly data, since exposure data is available for monthly comparisons, and is notavailable for most other variables of interest.
A chi-square determined that there was not a significant difference among months with respect tothe injury rate8 (χ2=1.9, df=11, p=0.99).
As can be seen in Figure 9, there are minimal differences among months with respect to theinjury rate (range: 23.1-29.6). However, there do appear to be greater differences in terms of themedian number of lost workdays each month. In fact, a Kruskal-Wallis test indicated asignificant difference exists (Hcalc=28.4, df=11, p=0.003). Visual examination of the datasuggests that, at a minimum, December (median of 20 LWDs) and February (median of31 LWDs) are likely significantly different from each other.
Table 11. LWD yard injuries by month, 1997 to 1998
MonthNo. ofInjuries
% ofInjuries
Injury /MSM
MedianLWDs
TotalLWDs
% of TotalLWDs
Jan 423 9.2 29.1 22.0 24,831 9.0Feb 316 6.9 23.1 31.0 23,098 8.4Mar 423 9.2 28.6 28.0 30,788 11.1Apr 336 7.3 23.1 24.0 25,718 9.3May 365 8.0 26.5 25.0 23,095 8.4Jun 392 8.6 28.3 23.0 23,956 8.7Jul 400 8.7 29.2 24.0 24,222 8.8Aug 380 8.3 27.1 21.5 21,197 7.7Sep 385 8.4 27.7 30.0 22,775 8.2Oct 438 9.6 29.6 29.5 25,164 9.1Nov 352 7.7 26.2 24.0 16,170 5.9Dec 365 8.0 27.0 20.0 15,268 5.5Total 4,575 100 27.1 25.0 276,282 100
____________8The injury rate was used in the analysis since it has been “normalized” to account for differences in exposure across months.This was preferable to using the raw number of injury cases.

39
4.3.2 Time-of-Day
Analysis of the data in 2 hour periods is presented in Table 12 and illustrated in Figure 10. Overa quarter of the injuries occur between 8 a.m. and 12 p.m. A chi-square test yielded a significantdifference among 2 hour time periods (χ2=536.8, df=11, p<0.001). However, exposure datawere not available, and without this data, it is very difficult to conclude that the differences arestrictly due to the time-of-day. In particular, it is possible that there are more crews workingbetween 8 a.m. and 12 p.m., accounting for the increase in injuries at this time. Interestingly, the2 a.m. to 4 a.m. time period, associated with a natural trough in humans’ circadian rhythms, isassociated with a relatively low number of injuries. However, it is also possible that there arefewer crews working in railroad yards at this time of the day, accounting for the relatively lownumber.
A significant difference was also found with respect to the median number of lost workdaysacross 2 hour time periods (Hcalc=29.3, df=11, p=0.002). Whereas the time between 8 a.m. and12 p.m. experiences the most number of injuries, these injuries are the least severe. In fact, the“daylight” hours of 6 a.m. to 6 p.m. experience the least severe injuries while the 6 p.m. to 6 a.m.time period experiences the most severe injuries.
Figure 9. LWD yard injuries per million switching miles by month, 1997 to 1998
0.0
5.0
10.0
15.0
20.0
25.0
30.0
35.0
Jan Feb Mar Apr May Jun Jul Aug Sep Oct Nov Dec
Month
Injuries per
Million Switching
Miles (MSM)
0
5
10
15
20
25
30
35
Median Lost
Workdays
Inj/MSMMedian LWDs
534-FRA-00175-18

40
Table 12. LWD yard injuries by time-of-day, 1997 to 1998
Time Injuries% of
InjuriesMedianLWDs
TotalLWDs
% of TotalLWDs
12 to 2 a.m. 351 7.7 30.0 23,099 8.42 to 4 a.m. 315 6.9 25.0 18,894 6.84 to 6 a.m. 249 5.4 28.0 16,175 5.96 to 8 a.m. 245 5.4 21.0 13,872 5.08 to 10 a.m. 566 12.4 21.0 28,608 10.410 a.m. to 12 p.m. 707 15.5 21.0 40,304 14.612 to 2 p.m. 427 9.3 21.0 22,373 8.12 to 4 p.m. 425 9.3 25.0 24,266 8.84 to 6 p.m. 378 8.3 23.5 24,026 8.76 to 8 p.m. 309 6.8 31.0 20,610 7.58 to 10 p.m. 325 7.1 30.0 22,294 8.110 p.m. to 12 a.m. 278 6.1 36.0 21,761 7.9Total 4,575 100 25.0 276,282 100
Figure 10. LWD yard injuries by time-of-day, 1997 to 1998
534-FRA-00175-19
0
100
200
300
400
500
600
700
800
12-2AM
2-4 AM 4-6 AM 6-8 AM 8-10AM
10 AM-12 PM
12-2PM
2-4 PM 4-6 PM 6-8 PM 8-10PM
10 PM-12 AM
Time-of-Day
Injuries
0
5
10
15
20
25
30
35
40
Median Lost
Workdays
Injuries
Median LWDs

41
4.3.3 Age
Table 13 and Figure 11 present injury data by age for 1997 to 1998. A positive linearrelationship appears to exist for the number of injuries per age category. To assist inunderstanding the possible relationship of age to injuries, it was desirable to control for ageexposure; that is, the number of injuries in an age category may be a function of the number ofrailroad yard employees in that age category rather than a function of age, per se. The only age-related data that were available were the age distribution across the entire railroad industry, asreported by the Railroad Retirement Board (RRB). The RRB publishes various annual statisticson railroad demographics, including the distribution of ages. These data were used as a
Table 13. LWD yard injuries by age, 1997 to 1998
AgeBracket Injuries
% ofInjuries
MedianLWDs
TotalLWDs
% of TotalLWDs
<25 220 4.8 10 6,599 2.425 to 34 789 17.3 18 37,226 13.535 to 44 1,292 28.3 24 77,145 27.945 to 54 1,651 36.1 29 108,104 39.155+ 621 13.6 33 47,173 17.1Total 4,573 100 25 276,247 100
Figure 11. LWD yard injuries by age, 1997 to 1998
534-FRA-00175-20
0
200
400
600
800
1000
1200
1400
1600
1800
<25 25-34 35-44 45-54 55+
Age
Injuries
0
5
10
15
20
25
30
35
Median Lost
Workdays
Injuries
Median LWDs

42
surrogate exposure measure for age, since these data were not available for railroad yards,specifically. The use of surrogate measures, or proxies, of exposure may be used when specificexposure measures are not available (BTS, 1998, p. 88).
An assumption was made that the age distribution of the yard workforce is the same as the agedistribution of the railroad industry as a whole. Based on this assumption, the RRB age datawere used to calculate the relative proportions (i.e., percentages) for each age category, and arepresented in Table 14, along with the injury data. A weighted frequency was then computed foreach age bracket. A weighted frequency is simply the proportion of injuries for a particular agebracket divided by the proportion of employees (in the industry as a whole) in the same agebracket. For example, the weighted frequency for the 25 to 34 age category = 1.3, or 17.3/13.4.A weighted frequency greater than one for a given age group indicates an overrepresentation ofinjuries relative to their proportion of the workforce. As shown in Figure 12, where the dottedline indicates an equal proportion of LWD injuries relative to the percentage of individuals in anage group, weighted frequencies provide a different picture of the age data. Specifically, it is theyounger employees who suffer more injuries relative to their proportion in the workforce. Ofcourse, the assumption that the railroad industry-wide age distribution data is comparable to thatof the yard workforce must be satisfied for this data to be valid.
A Kruskal-Wallis test was then performed to determine if there were differences in age withrespect to injury severity. In fact, a significant difference was found (Hcalc=104.1, df=4,p<0.001). Based on Figure 11, it appears that the older the injured employee is, the greater theseverity of the injury. There are several possible explanations for these data. It is possible that ittakes longer for an older employee to recover from an injury than a younger employee. Agecertainly affects the ability to heal, slowing down the process as age increases. It may also bepossible that older employees censor their own reporting so that they report only the more severeinjuries, while younger employees may report most of their injuries, regardless of the severity.This would explain the higher number of injuries and lower severity of the injuries sustained byyounger employees as compared to the older employees.
Table 14. Weighted frequency of LWD yard injuries by age, 1997 to 1998
AgeBracket Injuries
% of TotalInjuries
Age Distribution(%)*
WeightedFrequency
<25 220 4.8 3.5 1.425 to 34 789 17.3 13.4 1.335 to 44 1,292 28.3 27.6 1.045 to 54 1,651 36.1 38.7 0.955+ 621 13.6 16.9 0.8Total 4,573___________*Source: Railroad Retirement Board Statistical Table D-10, 1997 to 1998.

43
4.3.4 Job Category
Train and Engine (T&E) crews suffered the majority of the yard injuries (61 percent), whileMOE and MOW suffered smaller percentages of the injuries (22 percent and 14 percent,respectively) (see Table 15 and Figure 13). This is most likely due to the fact that the majority ofthe yard workforce is made up of T&E crews. T&E crews also suffer the most severe injuries(median of 30 lost workdays, and 69 percent of all lost workdays due to yard injuries).
4.3.5 Type of Injury
Table 16 presents the data for the type of injury that occurred. Sprains and strains made up thelargest category of injuries, accounting for 58 percent of all yard LWD injuries. These injuriesalso resulted in 63 percent of all lost workdays (a measure of severity). Thus, although not themost severe injury type, the moderate severity combined with the high incidence makes sprainsand strains a serious issue among railroad yard LWD injuries.
4.3.6 Body Part
Results of the analyses of the affected body part are presented in Table 17 and Figure 14. Thetorso was the most affected body part, accounting for 42 percent of the injuries and 47 percent ofthe total number of LWDs. The lower extremities were the next most affected body part,accounting for 29 percent of injuries and 30 percent of the lost workdays, while the upper
Figure 12. Weighted frequency of LWD injuries relative to age distribution

44
Figure 13. LWD yard injuries by job category, 1997 to 1998
0
500
1000
1500
2000
2500
3000
Executive P&A MOW MOE Transp.,Non T&E
Transp.,T&E
Job
Injuries
0
5
10
15
20
25
30
35
Median Lost
Workdays
Injuries
Median LWDs
534-FRA-00175-21
Table 15. LWD yard injuries by job category, 1997 to 1998
Job Category Injuries% of Total
InjuriesMedianLWDs
TotalLWDs
% of TotalLWDs
Transportation, T&E 2,795 61.1 30.0 190,934 69.1MOE 1,009 22.1 20.0 48,147 17.4MOW 622 13.6 19.0 28,828 10.4P&A 72 1.6 30.5 5,880 2.1Transportation, Non T&E 68 1.5 10.0 2,263 0.8Executive 9 0.2 14.0 230 0.1Total 4,575 100 25.0 276,282 100

45
Table 16. LWD yard injuries by type of injury, 1997 to 1998
Type of Injury Injuries% of Total
InjuriesMedianLWDs
TotalLWDs
% of TotalLWDs
Sprain or Strain 2,643 58.3 27 173,355 63.0
Bruise or Contusion 655 14.4 15 29,533 10.7
Fracture 396 8.7 41 26,477 9.6
Cut/Laceration or Abrasion 296 6.5 10 11,170 4.1
All other Injuries 158 3.5 28 11,166 4.1
Dislocation 60 1.3 85 6,336 2.3
Foreign Object in Eye 59 1.3 2 165 0.1
Hernia 56 1.2 46.5 3,635 1.3
Amputation 46 1.0 91 6,450 2.3
Puncture Wound 35 0.8 9 989 0.4
Other burns 28 0.6 10.5 455 0.2
Occupational Illness 25 0.6 20 1,900 0.7
Concussion 22 0.5 27 1,472 0.5
Electrical Shock or Burn 19 0.4 9 621 0.2
Reaction from One-Time ExternalExposure to Chemicals
19 0.4 7 271 0.1
Internal Injury 7 0.2 91 905 0.3
One-Time Exposure to LoudNoise
7 0.2 27 267 0.1
Dental Related 2 0.0 24 48 0.0
Nervous Shock (Injury Related) 1 0.0 N/A 167 0.1
Total 4,534 100 25 275,382 100
extremities — the arm and hand — were the third-most affected body part, accounting for17 percent of injuries and 13 percent of lost workdays. The head and face region was the fourth-most affected body part, accounting for 10 percent of the injuries and 9 percent of the lostworkdays.
4.3.7 Triggering Event
Table 18 presents data alphabetically on the triggering events that caused the railroad yardinjuries. The FRA provides railroads with over 65 codes from which to choose and categorizethe triggering event. Consequently, no single event category is associated with a significantnumber of injuries. Table 19 presents the same data sorted by the number of injuries. As can beseen, the event associated with the greatest number of injuries is overexertion, accounting for16 percent of all yard LWD injuries in 1997 to 1998.

46
Figure 14. LWD yard injuries by body part, 1997 to 1998
0
200
400
600
800
1000
1200
1400
1600
1800
2000
Arm/hand Occ.illness
Leg/foot Head/face Torso MultipleBodyParts
OtherBodyParts
Body Part
Injuries
0
5
10
15
20
25
30
35
40
Median Lost
Workdays
Injuries
Median LWDs
Table 17. LWD yard injuries by body part, 1997 to 1998
Body Part Injuries% of Total
InjuriesMedianLWDs
TotalLWDs
% of TotalLWDs
Torso 1,889 41.8 30 128,930 46.9Leg/Foot 1,318 29.2 29 82,381 30.0Arm/Hand 787 17.4 20 34,488 12.6Head/Face 454 10.1 13 24,125 8.8Multiple Body Parts 34 0.8 35 2,906 1.1Other Body Parts 28 0.6 18 1,919 0.7Occ. Illness 7 0.2 4 29 0.0Total 4,517 100 25 274,778 100
534-FRA-00175-22
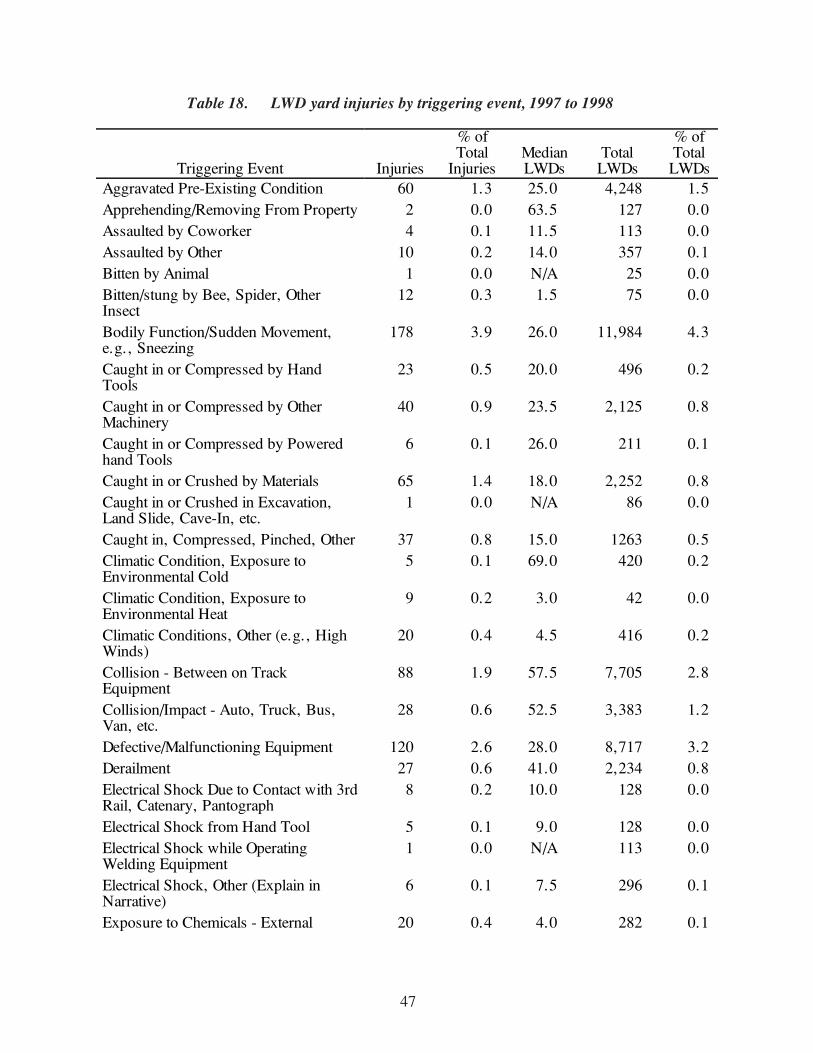
47
Table 18. LWD yard injuries by triggering event, 1997 to 1998
Triggering Event Injuries
% ofTotal
InjuriesMedianLWDs
TotalLWDs
% ofTotalLWDs
Aggravated Pre-Existing Condition 60 1.3 25.0 4,248 1.5Apprehending/Removing From Property 2 0.0 63.5 127 0.0Assaulted by Coworker 4 0.1 11.5 113 0.0Assaulted by Other 10 0.2 14.0 357 0.1Bitten by Animal 1 0.0 N/A 25 0.0Bitten/stung by Bee, Spider, OtherInsect
12 0.3 1.5 75 0.0
Bodily Function/Sudden Movement,e.g., Sneezing
178 3.9 26.0 11,984 4.3
Caught in or Compressed by HandTools
23 0.5 20.0 496 0.2
Caught in or Compressed by OtherMachinery
40 0.9 23.5 2,125 0.8
Caught in or Compressed by Poweredhand Tools
6 0.1 26.0 211 0.1
Caught in or Crushed by Materials 65 1.4 18.0 2,252 0.8Caught in or Crushed in Excavation,Land Slide, Cave-In, etc.
1 0.0 N/A 86 0.0
Caught in, Compressed, Pinched, Other 37 0.8 15.0 1263 0.5Climatic Condition, Exposure toEnvironmental Cold
5 0.1 69.0 420 0.2
Climatic Condition, Exposure toEnvironmental Heat
9 0.2 3.0 42 0.0
Climatic Conditions, Other (e.g., HighWinds)
20 0.4 4.5 416 0.2
Collision - Between on TrackEquipment
88 1.9 57.5 7,705 2.8
Collision/Impact - Auto, Truck, Bus,Van, etc.
28 0.6 52.5 3,383 1.2
Defective/Malfunctioning Equipment 120 2.6 28.0 8,717 3.2Derailment 27 0.6 41.0 2,234 0.8Electrical Shock Due to Contact with 3rdRail, Catenary, Pantograph
8 0.2 10.0 128 0.0
Electrical Shock from Hand Tool 5 0.1 9.0 128 0.0Electrical Shock while OperatingWelding Equipment
1 0.0 N/A 113 0.0
Electrical Shock, Other (Explain inNarrative)
6 0.1 7.5 296 0.1
Exposure to Chemicals - External 20 0.4 4.0 282 0.1

48
Table 18. LWD yard injuries by triggering event, 1997 to 1998 (continued)
Triggering Event Injuries
% ofTotal
InjuriesMedianLWDs
TotalLWDs
% ofTotalLWDs
Exposure to Fumes - Inhalation 49 1.1 8.0 1,038 0.4Exposure to Noise - Single Incident 10 0.2 22.5 528 0.2Exposure to Noise Over Time 1 0.0 N/A 28 0.0Exposure to Poisonous Plants 1 0.0 N/A 4 0.0Exposure to Welding Light 4 0.1 1.0 5 0.0Horseplay, Practical Joke, etc. 2 0.0 5.0 10 0.0Lost Balance 274 6.0 30.0 18,351 6.6Missed Handhold, Grabiron, Step, etc. 92 2.0 26.5 5,744 2.1Needle Puncture/Prick/Stick 4 0.1 4.5 25 0.0On-Track Equipment, Other Incident 8 0.2 69.0 630 0.2Other Impacts - on Track Equipment 35 0.8 45.0 2,826 1.0Overexertion 726 15.9 30.0 49,089 17.8Pushed/Shoved from 16 0.3 35.5 911 0.3Pushed/Shoved Into/Against 39 0.9 29.0 2,445 0.9Pushed/Shoved Onto 8 0.2 48.5 617 0.2Ran into Object/Equipment 20 0.4 42.0 1,310 0.5Ran into On-Track Equipment 12 0.3 30.0 432 0.2Repetitive Motion - Other 8 0.2 31.5 298 0.1Repetitive Motion - Tools 23 0.5 14.0 1,546 0.6Repetitive Motion - Typing, Keyboard,etc.
3 0.1 6.0 14 0.0
Repetitive Motion - Work Processes 91 2.0 24.0 4,750 1.7Rubbed, Abraded, etc. 18 0.4 9.0 414 0.1Shot 1 0.0 N/A 8 0.0Slack Action, Draft, CompressiveBuff/Coupling
64 1.4 38.0 4,251 1.5
Slip, Fall, Stumble, Other 48 1.0 33.0 3,230 1.2Slipped, Fell, Stumbled, etc. Due toClimatic Condition (Rain, Snow, Ice,etc.)
224 4.9 27.0 12,716 4.6
Slipped, Fell, Stumbled, etc. Due toIrregular Surface, e.g., Depression,Slope, etc.
297 6.5 28.0 17,606 6.4
Slipped, Fell, Stumbled, etc. Due toObject, e.g., Ballast, Spike, Material,etc.
449 9.8 35.0 31,849 11.5
Slipped, Fell, Stumbled, etc. on Oil,Grease, Other Slippery Substance
108 2.4 27.5 9,346 3.4
Stabbing, Knifing, etc. 3 0.1 9.0 25 0.0

49
Table 18. LWD yard injuries by triggering event, 1997 to 1998 (continued)
To obtain a better understanding of the triggering events, a set of higher-level triggering eventsthat were specifically relevant to yard work were created. Each higher-level category wascomprised of several related triggering event codes. These data are presented in Table 20. Ascan be seen, slips, trips and falls account for the largest number of injuries (42 percent) as well asthe largest proportion of lost workdays (44 percent). The most severe types of triggering event,as measured by the median number of LWDs, though, are collisions and impacts with equipmentand sudden or unexpected movement of equipment (medians of 45 and 40 lost workdays,respectively).
4.3.8 Physical Act
The physical act engaged in at the time of the injury was examined next. Similar to the eventcodes, there are over 70 physical act codes from which to choose and categorize an injury.Table 21 presents the injury data alphabetically for each of the physical act codes provided bythe FRA, while Table 22 presents the data sorted by the number of injuries in each category.
To obtain a better understanding of the physical acts, a set of higher-level acts that were relevantto yard work was created. Each higher-level physical act was comprised of several related FRAphysical act codes. These data are presented in Table 23 as well as in Figure 15. As can be seen,
Triggering Event Injuries
% ofTotal
InjuriesMedianLWDs
TotalLWDs
% ofTotalLWDs
Stepped on Object 116 2.5 17.0 5,645 2.0Struck Against Object 158 3.5 18.0 6,914 2.5Struck by Falling Object 73 1.6 14.0 3,199 1.2Struck by Object 176 3.8 17.5 7,174 2.6Struck by On-Track Equipment 80 1.7 42.5 7,872 2.8Struck by Thrown or Propelled Object 57 1.2 6.0 1,809 0.7Sudden Release of Air 12 0.3 15.0 657 0.2Sudden/Unexpected Movement ofMaterial
68 1.5 26.0 3,809 1.4
Sudden/Unexpected Movement of On-Track Equipment
103 2.3 73.0 9,908 3.6
Sudden/Unexpected Movement ofVehicle
25 0.5 27.0 1,630 0.6
Sudden/Unexpected Movement, Other 21 0.5 17.0 625 0.2Sustained Viewing 1 0.0 N/A 2 0.0Thrill Seeking 1 0.0 N/A 1 0.0Other (Describe in Narrative) 270 5.9 13.0 9,765 3.5Total 4,575 100 25.0 276,282 100

50
Table 19. LWD yard injuries by triggering event and sorted by the number of injuries,1997 to 1998
Triggering Event Injuries
% ofTotal
InjuriesMedianLWDs
TotalLWDs
% ofTotal
LWDsOverexertion 726 15.9 30.0 49,089 17.8Slipped, Fell, Stumbled, etc. Due toObject, e.g., Ballast, Spike, Material,etc.
449 9.8 35.0 31,849 11.5
Slipped, Fell, Stumbled, etc. due toIrregular Surface, e.g., Depression,Slope, etc.
297 6.5 28.0 17,606 6.4
Lost Balance 274 6.0 30.0 18,351 6.6Other (Describe in Narrative) 270 5.9 13.0 9,765 3.5Slipped, Fell, Stumbled, etc. due toClimatic Condition (Rain, Snow, Ice,etc.)
224 4.9 27.0 12,716 4.6
Bodily Function/Sudden Movement,e.g., Sneezing
178 3.9 26.0 11,984 4.3
Struck by Object 176 3.8 17.5 7,174 2.6Struck against Object 158 3.5 18.0 6,914 2.5Defective/Malfunctioning Equipment 120 2.6 28.0 8,717 3.2Stepped on Object 116 2.5 17.0 5,645 2.0Slipped, Fell, Stumbled, etc. on Oil,Grease, Other Slippery Substance
108 2.4 27.5 9,346 3.4
Sudden/Unexpected Movement of On-Track Equipment
103 2.3 73.0 9,908 3.6
Missed Handhold, Grabiron, Step, etc. 92 2.0 26.5 5,744 2.1Repetitive Motion - Work Processes 91 2.0 24.0 4,750 1.7Collision - Between On TrackEquipment
88 1.9 57.5 7,705 2.8
Struck by On-Track Equipment 80 1.7 42.5 7,872 2.8Struck by Falling Object 73 1.6 14.0 3,199 1.2Sudden/Unexpected Movement ofMaterial
68 1.5 26.0 3,809 1.4
Caught in or Crushed by Materials 65 1.4 18.0 2,252 0.8Slack Action, Draft, CompressiveBuff/Coupling
64 1.4 38.0 4,251 1.5
Aggravated Pre-Existing Condition 60 1.3 25.0 4,248 1.5Struck by Thrown or Propelled Object 57 1.2 6.0 1,809 0.7Exposure to Fumes - Inhalation 49 1.1 8.0 1,038 0.4Slip, Fall, Stumble, Other 48 1.0 33.0 3,230 1.2

51
Table 19. LWD yard injuries by triggering event and sorted by the number of injuries,1997 to 1998 (continued)
Triggering Event Injuries
% ofTotal
InjuriesMedianLWDs
TotalLWDs
% ofTotal
LWDsCaught in or Compressed by OtherMachinery
40 0.9 23.5 2,125 0.8
Pushed/Shoved Into/Against 39 0.9 29.0 2,445 0.9Caught in, Compressed, Pinched, Other 37 0.8 15.0 1,263 0.5Other impacts - On Track Equipment 35 0.8 45.0 2,826 1.0Collision/Impact - Auto, Truck, Bus,Van, etc.
28 0.6 52.5 3,383 1.2
Derailment 27 0.6 41.0 2,234 0.8Sudden/Unexpected Movement ofVehicle
25 0.5 27.0 1,630 0.6
Caught in or Compressed by HandTools
23 0.5 20.0 496 0.2
Repetitive Motion - Tools 23 0.5 14.0 1,546 0.6Sudden/Unexpected Movement, Other 21 0.5 17.0 625 0.2Climatic Conditions, Other (e.g., HighWinds)
20 0.4 4.5 416 0.2
Exposure to Chemicals - External 20 0.4 4.0 282 0.1Ran into Object/Equipment 20 0.4 42.0 1,310 0.5Rubbed, Abraded, etc. 18 0.4 9.0 414 0.1Pushed/Shoved From 16 0.3 35.5 911 0.3Bitten/stung by Bee, Spider, OtherInsect
12 0.3 1.5 75 0.0
Ran into On-Track Equipment 12 0.3 30.0 432 0.2Sudden Release of Air 12 0.3 15.0 657 0.2Assaulted by Other 10 0.2 14.0 357 0.1Exposure to Noise - Single Incident 10 0.2 22.5 528 0.2Climatic Condition, Exposure toEnvironmental Heat
9 0.2 3.0 42 0.0
Electrical Shock Due to Contact with 3rdRail, Catenary, Pantograph
8 0.2 10.0 128 0.0
Pushed/Shoved Onto 8 0.2 48.5 617 0.2Repetitive Motion - Other 8 0.2 31.5 298 0.1On-Track Equipment, Other Incident 8 0.2 69.0 630 0.2Caught in or Compressed by PoweredHand Tools
6 0.1 26.0 211 0.1
Electrical Shock, Other (Explain inNarrative)
6 0.1 7.5 296 0.1

52
the act of walking, running, or stepping over accounted for the largest number of injuries(25 percent) and the greatest number of total lost workdays. The second largest number ofinjuries occurred while getting on, off, up or down (22 percent). Lining switches accounted for11 percent of the injuries, while sitting or riding accounted for another 10 percent. The mostsevere types of physical acts as measured by the median number of LWDs were sitting or riding,and coupling and uncoupling (each had a median of 36 lost workdays).
4.3.9 Involvement of On-Track Equipment
The involvement of on-track equipment was then examined, in particular, the involvement ofmoving versus standing on-track equipment. Data are presented in Table 24 and Figure 16.Interestingly, half of all 1997 and 1998 yard LWD injuries (50 percent) involved standing on-track equipment, while less than one-fifth of the injuries (18 percent) involved moving on-trackequipment. Although injuries that involved moving on-track equipment were the most severe as
Table 19. LWD yard injuries by triggering event and sorted by the number of injuries,1997 to 1998 (continued)
Triggering Event Injuries
% ofTotal
InjuriesMedianLWDs
TotalLWDs
% ofTotal
LWDsClimatic Condition, Exposure toEnvironmental Cold
5 0.1 69.0 420 0.2
Electrical Shock from Hand Tool 5 0.1 9.0 128 0.0Assaulted by Coworker 4 0.1 11.5 113 0.0Exposure to Welding Light 4 0.1 1.0 5 0.0Needle Puncture/Prick/Stick 4 0.1 4.5 25 0.0Repetitive Motion - Typing, Keyboard,etc.
3 0.1 6.0 14 0.0
Stabbing, Knifing, etc. 3 0.1 9.0 25 0.0Apprehending/Removing from Property 2 0.0 63.5 127 0.0Horseplay, Practical Joke, etc. 2 0.0 5.0 10 0.0Bitten by Animal 1 0.0 N/A 25 0.0Caught in or Crushed In Excavation,Land Slide, Cave-In, etc.
1 0.0 N/A 86 0.0
Electrical Shock While OperatingWelding Equipment
1 0.0 N/A 113 0.0
Exposure to Poisonous Plants 1 0.0 N/A 4 0.0Exposure to Noise Over Time 1 0.0 N/A 28 0.0Shot 1 0.0 N/A 8 0.0Sustained Viewing 1 0.0 N/A 2 0.0Thrill Seeking 1 0.0 N/A 1 0.0Total 4,575 100 25.0 276,282 100

53
indicated by the median number of lost workdays, injuries involving standing equipment resultedin over half (52 percent) of all lost workdays.
4.3.10 Involvement of Roadbed Materials
Roadbed materials such as ballast, ties, and switches can play a role in yard injuries, and thuswere examined. Data are presented in Table 25. Switches were involved in 354 injuries, or7.7 percent of the injuries, while ballast was involved in 304 injuries, or 6.6 percent. Ties wereinvolved in 98 injuries, or 2.1 percent of the injuries. With respect to the severity of the injuries,ballast-related injuries resulted in the most severe injuries (median of 30 lost workdays). Thetotal percentage of lost workdays due to roadbed materials, less than 18 percent, is notsignificant, however. Thus, it appears that roadbed materials were not heavily involved in yardinjuries. Interestingly, there was no “rail” circumstance code from which to select.
4.3.11 Involvement of Drugs and Alcohol
Drugs and alcohol played a very minor part in railroad yard injuries in 1997 and 1998. Noinjuries were associated with positive alcohol tests while eight injuries (0.2 percent) wereassociated with positive drug use (median of 15.5 lost workdays and a total of 246 lostworkdays).
Table 20. LWD yard injuries by higher-level triggering event, 1997 to 1998
Triggering Event Injuries
% ofTotal
InjuriesMedianLWDs
TotalLWDs
% ofTotal
LWDsSlips, Trips, Falls and Lost Balance 1,516 41.6 30.0 98,743 44.1Overexertion 726 19.9 30.0 49,089 21.9Struck by or Against Object 562 15.4 18.0 27,382 12.2Sudden/Unexpected Movement ofEquipment
217 6.0 40.0 15,972 7.1
Collision/Impact (Includes Derailment) 186 5.1 45.0 16,778 7.5Caught in/Compressed/Crushed 172 4.7 19.5 6,433 2.9RSI 125 3.4 22.0 6,608 3.0Exp. to Harmful Substances(Fumes/Chemical)
69 1.9 7.0 1,320 0.6
Climate/Natural Environment 48 1.3 4.0 982 0.4Security Issues 20 0.5 9.5 630 0.3Horseplay/Thrillseeking/SustainedViewing
3 0.1 4.0 11 0.0
Total 3,644 100 25.0 223,948 100

54
Table 21. LWD yard injuries by physical act, 1997 to 1998
Physical Act Injuries
% ofTotal
InjuriesMedianLWDs
TotalLWDs
% ofTotalLWDs
Adjusting Coupler 52 1.1 21.0 2,660 1.0Adjusting Drawbar 41 0.9 60.0 3,701 1.3Adjusting, Other 74 1.6 25.0 5,607 2.0Applying Rail Anchor/Fastener 9 0.2 8.0 344 0.1Bending, Stooping 69 1.5 13.0 3,681 1.3Carrying 38 0.8 19.5 1,717 0.6Chaining, Cabling Car or Locomotive 4 0.1 17.5 68 0.0Cleaning 51 1.1 18.0 1,963 0.7Climbing Over/On 99 2.2 21.0 5,061 1.8Closing 61 1.3 20.0 3,331 1.2Coupling Air Hose 68 1.5 32.5 5,121 1.9Coupling Electric Cables 6 0.1 12.0 255 0.1Coupling Steam Hose 1 0.0 N/A 4 0.0Crossing Between 6 0.1 41.0 709 0.3Crossing or Crawling Under 2 0.0 14.0 28 0.0Crossing Over 25 0.5 9.0 1,781 0.6Cutting Rail 11 0.2 11.0 206 0.1Cutting Vegetation 2 0.0 3.0 6 0.0Cutting, Other 9 0.2 9.0 279 0.1Derail, Applying 5 0.1 22.0 340 0.1Derail, Removing 4 0.1 19.5 156 0.1Digging, Excavating 9 0.2 42.0 802 0.3Driving (Motor Vehicle, Forklift, etc.) 33 0.7 21.0 2,304 0.8Flagging 5 0.1 8.0 165 0.1Fueling 8 0.2 22.0 352 0.1Getting Off 283 6.2 28.0 17,413 6.3Getting On 111 2.4 28.0 6,887 2.5Grinding 12 0.3 2.0 306 0.1Handbrake, Applying 37 0.8 48.0 3,454 1.3Handbrake, Other 4 0.1 21.0 163 0.1Handbrake, Releasing 25 0.5 86.0 3,230 1.2Handling Baggage 4 0.1 12.5 70 0.0Handling Car Parts 25 0.5 30.0 1,907 0.7Handling Locomotive Parts 17 0.4 17.0 393 0.1Handling Material, General 31 0.7 9.0 910 0.3Handling Other Track Material/Supplies 21 0.5 18.0 791 0.3Handling Rail 19 0.4 19.0 632 0.2Handling Tie Plates 6 0.1 19.5 217 0.1Handling Ties 20 0.4 15.5 933 0.3Handling Wheels/Trucks 6 0.1 61.0 440 0.2

55
Table 21. LWD yard injuries by physical act, 1997 to 1998 (continued)
Physical Act Injuries
% ofTotal
InjuriesMedianLWDs
TotalLWDs
% ofTotalLWDs
Handling, Other 49 1.1 22.0 3,138 1.1Inspecting 60 1.3 23.0 2,789 1.0Installing 50 1.1 20.5 2,767 1.0Jumping From 35 0.8 53.0 2,899 1.0Jumping Onto 5 0.1 6.0 106 0.0Laying 3 0.1 55.0 152 0.1Lifting Equipment (Tools, Parts, etc.) 78 1.7 19.5 4,663 1.7Lifting Other Material 84 1.8 17.5 3,445 1.2Lining Switches 334 7.3 29.0 23,801 8.6Lining, Other 23 0.5 19.0 1,433 0.5Loading/Unloading 57 1.2 18.0 2,444 0.9Maintaining 31 0.7 26.0 1,773 0.6Opening 64 1.4 20.5 3,183 1.2Opening/Closing Angle Cock 24 0.5 16.0 750 0.3Operating 135 3.0 30.0 8,987 3.3Pulling Pin 164 3.6 24.0 8,676 3.1Pulling Pin Lifter/Operating UncouplingLever
101 2.2 43.0 7,294 2.6
Pushing 43 0.9 33.0 2,660 1.0Reaching 46 1.0 17.0 1,830 0.7Removing Rail Anchors/Fasteners 9 0.2 11.0 148 0.1Repairing 56 1.2 20.0 2,973 1.1Riding 239 5.2 33.0 16,699 6.0Running 14 0.3 46.5 1,529 0.6Sitting 103 2.3 41.0 7,505 2.7Spiking (Installation/Removal 42 0.9 28.5 2,788 1.0Standing 109 2.4 34.0 7,946 2.9Stepping Down 233 5.1 22.0 12,158 4.4Stepping Over 40 0.9 24.5 2,517 0.9Stepping Up 64 1.4 28.0 4,378 1.6Uncoupling Air Hose 17 0.4 63.0 1,687 0.6Uncoupling Electric Cables 5 0.1 11.0 180 0.1Using Hand Tool 72 1.6 18.0 2,780 1.0Using, Other 20 0.4 30.5 1,039 0.4Walking 762 16.7 27.5 47,994 17.4Welding (Includes Field Welding) 14 0.3 8.5 339 0.198* 1 0.0 N/A 267 0.1Other (Narrative Must be Provided) 76 1.7 8.5 2,178 0.8Total 4,575 100 25.0 276,282 100____________*- No variable name associated with this code.

56
Table 22. LWD yard injuries by physical act and sorted by the number of injuries,1997 to 1998
Physical Act Injuries
% ofTotal
InjuriesMedianLWDs
TotalLWDs
% ofTotalLWDs
Walking 762 16.7 27.5 47,994 17.4Lining Switches 334 7.3 29.0 23,801 8.6Getting Off 283 6.2 28.0 17,413 6.3Riding 239 5.2 33.0 16,699 6.0Stepping Down 233 5.1 22.0 12,158 4.4Pulling Pin 164 3.6 24.0 8,676 3.1Operating 135 3.0 30.0 8,987 3.3Getting On 111 2.4 28.0 6,887 2.5Standing 109 2.4 34.0 7,946 2.9Sitting 103 2.3 41.0 7,505 2.7Pulling Pin Lifter/Operating UncouplingLever
101 2.2 43.0 7,294 2.6
Climbing Over/On 99 2.2 21.0 5,061 1.8Lifting Other Material 84 1.8 17.5 3,445 1.2Lifting Equipment (Tools, Parts, etc.) 78 1.7 19.5 4,663 1.7Other (Narrative Must be Provided) 76 1.7 8.5 2,178 0.8Adjusting, Other 74 1.6 25.0 5,607 2.0Using Hand Tool 72 1.6 18.0 2,780 1.0Bending, Stooping 69 1.5 13.0 3,681 1.3Coupling Air Hose 68 1.5 32.5 5,121 1.9Opening 64 1.4 20.5 3,183 1.2Stepping Up 64 1.4 28.0 4,378 1.6Closing 61 1.3 20.0 3,331 1.2Inspecting 60 1.3 23.0 2,789 1.0Loading/Unloading 57 1.2 18.0 2,444 0.9Repairing 56 1.2 20.0 2,973 1.1Adjusting Coupler 52 1.1 21.0 2,660 1.0Cleaning 51 1.1 18.0 1,963 0.7Installing 50 1.1 20.5 2,767 1.0Handling, Other 49 1.1 22.0 3,138 1.1Reaching 46 1.0 17.0 1,830 0.7Pushing 43 0.9 33.0 2,660 1.0Spiking (Installation/Removal 42 0.9 28.5 2,788 1.0Adjusting Drawbar 41 0.9 60.0 3,701 1.3Stepping Over 40 0.9 24.5 2,517 0.9Carrying 38 0.8 19.5 1,717 0.6Handbrake, Applying 37 0.8 48.0 3,454 1.3Jumping From 35 0.8 53.0 2,899 1.0Driving (Motor Vehicle, Forklift, etc.) 33 0.7 21.0 2,304 0.8Handling Material, General 31 0.7 9.0 910 0.3Maintaining 31 0.7 26.0 1,773 0.6

57
Table 22. LWD yard injuries by physical act and sorted by the number of injuries,1997 to 1998 (continued)
Physical Act Injuries
% ofTotal
InjuriesMedianLWDs
TotalLWDs
% ofTotalLWDs
Crossing Over 25 0.5 9.0 1,781 0.6Handling Car Parts 25 0.5 30.0 1,907 0.7Handbrake, Releasing 25 0.5 86.0 3,230 1.2Opening/Closing Angle Cock 24 0.5 16.0 750 0.3Lining, Other 23 0.5 19.0 1,433 0.5Handling Other Track Material/Supplies 21 0.5 18.0 791 0.3Handling Ties 20 0.4 15.5 933 0.3Using, Other 20 0.4 30.5 1,039 0.4Handling Rail 19 0.4 19.0 632 0.2Handling Locomotive Parts 17 0.4 17.0 393 0.1Uncoupling Air Hose 17 0.4 63.0 1,687 0.6Running 14 0.3 46.5 1,529 0.6Welding (Includes Field Welding) 14 0.3 8.5 339 0.1Grinding 12 0.3 2.0 306 0.1Cutting Rail 11 0.2 11.0 206 0.1Applying Rail Anchor/Fastener 9 0.2 8.0 344 0.1Cutting, Other 9 0.2 9.0 279 0.1Digging, Excavating 9 0.2 42.0 802 0.3Removing Rail Anchors/Fasteners 9 0.2 11.0 148 0.1Fueling 8 0.2 22.0 352 0.1Coupling Electric Cables 6 0.1 12.0 255 0.1Crossing Between 6 0.1 41.0 709 0.3Handling Wheels/Trucks 6 0.1 61.0 440 0.2Handling Tie Plates 6 0.1 19.5 217 0.1Flagging 5 0.1 8.0 165 0.1Jumping Onto 5 0.1 6.0 106 0.0Uncoupling Electric Cables 5 0.1 11.0 180 0.1Derail, Applying 5 0.1 22.0 340 0.1Chaining, Cabling Car or Locomotive 4 0.1 17.5 68 0.0Handling Baggage 4 0.1 12.5 70 0.0Handbrake, Other 4 0.1 21.0 163 0.1Derail, Removing 4 0.1 19.5 156 0.1Laying 3 0.1 55.0 152 0.1Crossing or Crawling Under 2 0.0 14.0 28 0.0Cutting Vegetation 2 0.0 3.0 6 0.0Coupling Steam Hose 1 0.0 N/A 4 0.098* 1 0.0 N/A 267 0.1Total 4,575 100 25.0 276,282 100____________*No variable name associated with this code.

58
Table 23. LWD yard injuries by higher-level physical act, 1997 to 1998
Figure 15. LWD yard injuries by physical act, 1997 to 1998
Physical Act Injuries
% ofTotal
InjuriesMedianLWDs
TotalLWDs
% ofTotalLWDs
Walking/Running/Stepping Over 816 25.0 28.0 52,040 25.3On/Off/Up/Down 731 22.4 26.0 43,841 21.3Lining Switches/Other 357 10.9 29.0 25,234 12.3Sitting/Riding 342 10.5 36.0 24,204 11.8Pull/Push 308 9.4 29.5 18,630 9.1Lift/Load 219 6.7 18.0 10,552 5.1Handling (Materials) 198 6.1 19.0 9,431 4.6Coupling/Uncoupling 190 5.8 36.0 13,608 6.6Standing 109 3.3 34.0 7,946 3.9Total 3,270 100 27.0 205,486 100

59
Table 24. LWD yard injuries by involvement of on-track equipment, 1997 to 1998
Figure 16. LWD yard injuries by involvement of on-track equipment, 1997 to 1998
0
500
1000
1500
2000
2500
Standing Moving Other None
On-Track Equipment
Injuries
0
5
10
15
20
25
30
35
Median Lost
Workdays
Injuries
Median LWDs
534-FRA-00175-23
On-TrackEquipment Injuries
% of TotalInjuries
MedianLWDs
TotalLWDs
% of TotalLWDs
Standing 2,297 50.2 26 145,068 52.5None 1,170 25.6 20 57,564 20.8Moving 823 18.0 30 57,690 20.9Other 285 6.2 24 15,960 5.8Total 4,575 100 25 276,282 100

60
4.3.12 Involvement of Hazardous Materials
Thirteen injuries (0.3 percent) involved hazmat exposure, resulting in a total of 278 lostworkdays (a median of four lost workdays). Thus, hazmat exposure also played a minimal rolein yard lost workday injuries.
4.3.13 Injury “Cause”
The FRA provides railroads with an opportunity to provide the probable reason for each injury orillness (i.e., attribute causality). According to the data, almost one-third of all yard lost workdayinjuries is attributable to a “human factor” (n=1467 injuries, or 32 percent). These injuriesresulted in a median of 30 lost workdays and a total of 99,614 lost workdays (36 percent of alllost workdays). Several of the other "cause" codes may also be considered “human factor” suchas “safety equipment not worn or in place,” “procedures for operating/using equipment notfollowed,” “impairment, substance abuse,” and “impairment, physical condition, e.g., fatigue.”In fact, “human factor” is a broad category, and the FRA does not provide railroads with a cleardefinition, nor examples, of what is a “human factor” cause or injury.
4.4 Comparison of Railroad Yard Injuries to Private Industry Injuries
To gain an appreciation of the relative frequency and severity of the injuries occurring in railroadyards, data on the number, type, and severity of railroad-wide injuries and yard-specific injurieswere compared to injury data from private industries based on data from the Department ofLabor’s Bureau of Labor Statistics (BLS). Since 1997 was the most recent year that thesestatistics were available from the BLS at the time of the analyses, only 1997 railroad injury datawere used in the comparative analyses. The focus of this comparison is on private industry andrailroad yard injuries that result in one or more days away from work (DAFW). A DAFW injuryresults when the injured employee misses at least one day of work, regardless of the length ofrestricted duty. The number of DAFW includes both days absent and days of restricted duty,however. The BLS collects data on a variety of injury characteristics on private industry DAFWinjuries, including the type of injury, affected body part, triggering event, age, and mediannumber of DAFW. DAFW injuries are essentially a large subset of LWD injuries, since a LWDinjury occurs if it results in at least one day of absence or one day of restricted duty. Resultsfrom the comparisons between the railroad yard DAFW injuries and private industry DAFWinjuries are discussed below.
Table 25. LWD yard injuries by involvement of roadbed materials, 1997 to 1998
Material Injuries% of Total
InjuriesMedianLWDs
TotalLWDs
% of TotalLWDs
Switches 354 7.7 25.0 24,305 8.8Ballast 304 6.6 30.0 19,583 7.1Ties 98 2.1 14.5 4,743 1.7

61
Table 26 presents a comparison of 1997 occupational injuries and illnesses for selectedindustries, including the railroad industry and railroad yard environment. Injuries occurring inthe railroad industry, including railroad yards, are more severe than those occurring in privateindustry as a whole, as measured by the percentage of total injuries that resulted in one or moredays away from work (i.e., days absent), or DAFW. Sixty-five percent (65 percent) of railroadinjuries, and 68 percent of railroad yard injuries, resulted in one or more DAFW, compared to30 percent for private industry overall. The mining industry appears closest to the railroad yardenvironment, with roughly 50 percent of injuries resulting in at least one DAFW. Oneexplanation for the discrepancy between the railroad industry and other industries is that it ispossible that railroad employees are underreporting the less severe injuries, thus inflating theproportion of total injuries that resulted in one or more DAFW.
Table 27 presents the percent distributions of nonfatal occupational injuries for selectedindustries and age groups for days-away-from-work injuries. In private industry, the greatestpercentage of DAFW injuries occurred in the 25 to 34 year old category (the 35 to 44 year oldcategory had a similar percentage, 28.2 percent), while for the railroad industry, and yardenvironment in particular, the greatest percentage of DAFW injuries occurred in the 45 to54 year old category. The discrepancy between the railroad industry and other industries may bedue to the difference in proportions of employees in each age group. Unfortunately, data are notavailable to discern the percentages or proportions of employees in each age group for mostindustries.9 However, these data are collected by the Railroad Retirement Board (RRB) and thusare available for the railroad industry. Based on RRB data for 1997, the largest percentage ofrailroad employees fell into the 45 to 54 year old age category (38.4 percent) and the largestpercentage of DAFW yard injuries also fell into the 45 to 54 year old age category(37.7 percent). Though data is not available specifically for the ages of those working in andaround railroad yards, it is assumed that the proportions of employees in each age bracket aresimilar to those industry-wide. Without knowing the age distributions of employees for otherindustries, it is difficult to compare the effects of age on DAFW injuries in the railroad industrywith injuries suffered by employees in other industries.
Table 28 presents the percent distributions of nonfatal occupational injuries for selectedindustries and types of injury for DAFW injuries. The railroad industry, and the yardenvironment specifically, compare similarly to private industry as a whole. The greatestpercentage of DAFW injuries in private industry as a whole, and the railroad industry, includingyard injuries, resulted in sprains and strains: 55 percent for the railroad industry, 59 percent forthe yard environment specifically, and 44 percent for private industry as a whole. In general, therailroad industry and yard environment result in greater percentages of sprains and strains,fractures, cuts and lacerations, and bruises and contusions, than private industry as a whole,though the differences are small. In all, these four types of injuries made up 86 to 88 percent ofrailroad DAFW injuries compared to only 66 percent of DAFW injuries in private industry as awhole.
____________9Neither the BLS nor MSHA, the Mining Safety and Health Administration, routinely collect age-specific data on activeemployees for any industries.

62
Tab
le26
.C
ompa
riso
n of
199
7 no
nfat
al o
ccup
atio
nal i
njur
ies
and
illne
sses
for
sel
ecte
din
dust
ries
and
cla
ssif
icat
ions
of
inju
ry

63
Tab
le27
.P
erce
nt d
istr
ibut
ions
for
199
7 no
nfat
al o
ccup
atio
nal d
ays-
away
-fro
m-w
ork
inju
ries
and
illn
esse
s fo
r se
lect
edin
dust
ries
and
age
gro
ups
Rai
lroa
d In
dust
ryPr
ivat
eIn
dust
ry1
Goo
ds P
rodu
cing
Serv
ice
Prod
ucin
g
Age
Rai
lroa
dE
mpl
oyee
Age
Dis
trib
utio
n(%
)5
All
Rai
lroa
dL
ocat
ions
2R
ailr
oad
Yar
dE
nvir
onm
ent2
,3
Agr
icul
ture
,Fo
rest
ry a
ndFi
shin
g1M
inin
g1C
onst
ruct
ion1
Man
ufac
turi
ng1
Tra
nspo
rtat
ion
and
Publ
icU
tiliti
es1
Who
lesa
leT
rade
1R
etai
lT
rade
1
Fina
nce,
Insu
ranc
ea n
d R
e al
Est
ate1
16-2
43.
13.
74.
414
.620
.213
.114
.612
.910
.913
.423
.78.
7
25-3
412
.618
.517
.129
.132
.027
.533
.728
.529
.232
.227
.124
.9
35-4
428
.631
.527
.828
.224
.626
.930
.829
.329
.929
.523
.429
.6
45-5
438
.433
.637
.717
.114
.223
.012
.618
.619
.915
.914
.121
.3
55+
16.5
12.8
13.0
8.5
5.5
6.1
5.9
8.9
7.8
7.4
8.4
12.1
Tot
a l4
99.2
100.
110
0.0
97.5
96.5
96.6
97.6
98.2
97.7
98.4
96.7
96.6
__
__
__
__
__
__
1So
urce
: BL
S Pr
ess
Rel
ease
USD
L 9
9-10
2, T
able
2, 4
/99.
Pri
vate
indu
stry
incl
udes
all
good
s pr
oduc
ing
and
serv
ice
prod
ucin
g in
dust
ries
.2So
urc e
: w
ww
.fra
.dot
.gov
3Y
ard
envi
ronm
ent:
yard
trac
k an
d re
pair
trac
k.4T
otal
doe
s no
t equ
al 1
00 b
e ca u
se R
RB
tota
l inc
lude
s em
ploy
ees
who
se a
ge w
as n
ot r
epor
ted.
5So
urce
: RR
B I
ndex
of
Stat
isitc
al I
nfor
mat
i on,
ww
w.r
r b.g
ov/s
tats
inde
x.ht
ml

64
Tab
le28
.P
erce
nt d
istr
ibut
ions
for
199
7 no
nfat
al o
ccup
atio
nal d
ays-
away
-fro
m-w
ork
inju
ries
and
illn
esse
s fo
r se
lect
edin
dust
ries
and
inju
ry ty
pes
Rai
lroa
d In
dust
ryPr
ivat
eIn
dust
ry1
Goo
ds P
rodu
cing
Serv
ice
Prod
ucin
g
Type
of
Inju
ry
All
Ra i
lroa
dLo
c ati
ons2
Ra i
lroa
d Y
a rd
Envi
ronm
ent2
,3
Agr
icul
ture
,Fo
rest
ry a
ndFi
shin
g1M
inin
g1C
onst
ruc t
ion1
Man
ufac
turi
ng1
Tra n
spor
tati
onan
d Pu
blic
Uti
liti
e s1
Who
lesa
leTr
ade1
Re t
a il
Trad
e1
Fina
nce ,
Insu
ranc
ean
d R
eal
Esta
te1
Serv
ices
1
Spra
ins,
Str
a ins
54.8
59.2
43.6
32.5
36.3
36.9
38.2
52.2
46.6
41.4
38.0
50.3
Bru
ise s
, Con
tusi
ons
15.2
13.4
9.0
8.7
12.2
8.0
9.0
10.5
8.1
10.1
6.3
8.4
Cut
s, L
acer
atio
ns7.
05.
87.
312
.06.
39.
68.
44.
06.
610
.96.
14.
1
Fra c
ture
s9.
59.
76.
58.
017
.110
.36.
65.
47.
15.
87.
05.
0
Tota
l486
.588
.166
.461
.271
.964
.862
.272
.168
.468
.257
.467
.8__
____
____
__
1 Sour
c e: B
LS P
ress
Re l
e ase
USD
L 99
-102
, Ta b
le 5
, 4/9
9. P
riva
te in
dust
ry in
c lud
e s a
ll g
oods
pro
duc i
ng a
nd s
e rvi
c e p
rodu
c ing
indu
stri
e s.
2So
urce
: w
ww
.fra
.dot
.gov
3 Yar
d en
viro
nmen
t: y
ard
trac
k an
d re
pair
trac
k.4 To
tals
do
not e
qual
bec
ause
ther
e ar
e ot
her i
njur
y ty
pes
that
acc
ount
for r
emai
nder
of i
njur
ies
for e
ach
indu
stry
.

65
Table 29 presents the percent distributions of nonfatal DAFW occupational injuries for selectedindustries and body parts affected. The trunk (or torso) is the most frequently affected body partin all industries. Interestingly, in private industry, there are equal proportions of upper and lowerextremity injuries, while in the railroad industry and yard environment specifically, there aretwice as many lower extremity injuries than upper extremity injuries. This difference may bedue to the fact that railroad employees, particularly the T&E crews, do a lot of walking in andaround yards and tracks, where there are many lower extremity hazards.
Table 30 presents the percent distributions of nonfatal DAFW occupational injuries for selectedindustries and events that resulted in the injury. Slips, trips and falls accounted for the singlegreatest percentage of DAFW injuries in the railroad industry as a whole (29 percent) and in theyard (34 percent), while overexertion and being crushed by or struck by equipment or objectsaccounted for the two greatest percentages of DAFW injuries in private industry as a whole(28 percent and 27 percent respectively). In fact, there were fewer percentages of DAFWinjuries resulting from overexertion, being crushed by or struck by equipment or objects,repetitive stress injuries (RSIs) and exposure to harmful substances, in the railroad industry andyard environment, than in private industry as a whole.
Table 31 presents the percent distributions of nonfatal DAFW occupational injuries for selectedcategories of DAFW and age groups. The DAFW categories (e.g., 1,2,3 to 5,6 to 10, etc.) matchthose that are used by the BLS. A majority of private industry DAFW injuries resulted in 10 orfewer days away from work, regardless of the age group, while a majority of railroad industryand yard specific injuries resulted in 31 or more days away from work. However, the proportionof injuries resulting in 31 or more days away from work increases with age for both the railroadindustry (including the yard environment) and private industry as a whole.
Table 32 presents the percent distributions of nonfatal DAFW occupational injuries for selectedcategories of DAFW and industries. The railroad industry, and yard environment specifically,are associated with twice the percentage of injuries resulting in 31 or more days away from workas compared to private industry as a whole. However, the mining industry mirrors very closelythe railroad industry and yard environment with respect to the percentage of injuries in eachDAFW category. For example, 34 percent of mining injuries in 1997 resulted in 31 or more daysaway from work, compared to 38 percent and 43 percent of railroad industry and yardenvironment injuries, respectively (this compared to only 18 percent of private industry injuries).
The median number of days away from work for private industry was five, while for the railroadindustry it was 18 (and injuries in the yard resulted in a median of 22 days away from work). Ofthe specific industries reported by the BLS, again mining most closely matches the railroadindustry, with mining injuries resulting in a median of 18 days away from work.
Thus, overall, the types and severities of injuries sustained in the railroad industry overall and therailroad yard environment specifically appear to be different than those injuries sustained inprivate industry as a whole. The specific industry that most closely matches the type andseverity of injuries occurring in the railroad industry and railroad yard environments is the

66
Tab
le29
.P
erce
nt d
istr
ibut
ions
for
199
7 no
nfat
al o
ccup
atio
nal d
ays-
away
-fro
m-w
ork
inju
ries
and
illn
esse
s fo
r se
lect
edin
dust
ries
and
bod
y pa
rts
affe
cted
Rai
lroa
d In
dust
ryPr
ivat
eIn
dust
ry1
Goo
ds P
rodu
cing
Serv
ice
Prod
ucin
g
Bod
y Pa
rt
All
Ra i
lroa
dLo
c ati
ons2
Ra i
lroa
d Y
a rd
Envi
ronm
ent2,
3
Agr
icul
ture
,Fo
rest
ry a
ndFi
shin
g1M
inin
g1C
onst
ruc t
ion1
Man
ufac
turi
ng1
Tra n
spor
tati
onan
d Pu
blic
Uti
liti
e s1
Who
lesa
leTr
ade1
Re t
a il
Trad
e1
Fina
nce,
Insu
ranc
ean
d R
eal
Esta
te1
Serv
ices
1
He a
d/N
e ck
12.4
10.0
8.4
12.9
10.2
9.7
9.4
7.6
8.2
7.2
7.0
8.1
Trun
k39
.242
.737
.531
.231
.234
.934
.541
.041
.335
.232
.041
.9
Upp
e r E
xtre
mit
ies
17.0
15.2
22.9
25.4
25.1
21.0
30.8
15.5
19.8
26.6
23.0
17.1
Low
e r E
xtre
mit
ies
27.5
30.3
20.5
21.9
26.4
24.8
17.1
23.6
21.1
21.2
20.9
19.2
Mul
tipl
e Pa
rts
2.0
1.0
8.2
6.2
5.6
7.5
6.1
10.2
7.3
7.7
11.8
10.4
Tota
l498
.199
.297
.597
.698
.597
.997
.997
.997
.797
.994
.796
.7__
____
____
__
1 Sour
c e: B
LS P
ress
Re l
e ase
USD
L 99
-102
, Ta b
le 5
, 4/9
9. P
riva
te in
dust
ry in
c lud
e s a
ll g
oods
pro
duc i
ng a
nd s
e rvi
c e p
rodu
c ing
indu
stri
e s.
2 Sour
ce:
ww
w.f
ra.d
ot.g
ov3 Y
ard
envi
ronm
ent:
yar
d tr
ack
and
repa
ir tr
ack.
4 Tota
ls d
o no
t equ
al b
ecau
se th
ere
are
othe
r bod
ypar
t loc
atio
ns th
at a
ccou
nt fo
r rem
aind
er o
f inj
urie
s fo
r eac
h in
dust
ry.

67
Tab
le30
.P
erce
nt d
istr
ibut
ions
for
199
7 no
nfat
al o
ccup
atio
nal d
ays-
away
-fro
m-w
ork
inju
ries
and
illn
esse
s fo
r se
lect
edin
dust
ries
and
trig
geri
ng e
vent
s
Rai
lroa
d In
dust
ryPr
ivat
eIn
dust
ry1
Goo
ds P
rodu
cing
Serv
ice
Prod
ucin
g
Trig
geri
ng E
vent
All
Rai
lroa
dLo
cati
ons2
Rai
lroa
d Y
ard
Envi
ronm
ent2,
3
Agr
icul
ture
,Fo
rest
ry a
ndFi
shin
g1M
inin
g1C
onst
ruct
ion1
Man
ufac
turi
ng1
Tran
spor
tati
onan
d Pu
blic
Uti
liti
es1
Who
lesa
leTr
ade1
Ret
ail
Trad
e1
Fina
nce,
Insu
ranc
ean
d R
eal
Esta
te1
Serv
ices
1
Con
tact
w/,
Stru
ckby
/aga
inst
, or
Cru
shed
/Cau
ght
by O
bje c
ts o
rEq
uipm
ent
25.1
19.6
27.0
34.4
47.2
34.8
33.8
20.9
27.0
28.2
17.9
17.8
Slip
s, T
rips
,Fa
lls
29.3
34.1
19.3
19.4
18.2
21.6
13.3
19.8
17.1
23.2
27.2
21.7
Ove
rexe
rtio
n14
.114
.927
.717
.021
.823
.326
.330
.331
.424
.822
.232
.5
Rep
e tit
ive
Mot
ion
2.4
2.8
4.1
1.8
0.6
1.5
8.0
2.3
3.2
2.9
10.2
3.0
Exp.
Har
mfu
lSu
bsta
nce s
-C
hem
ical
/Fum
e
2.3
2.1
4.6
6.2
3.7
3.7
5.45
3.0
2.9
5.6
4.1
4.5
Tota
l473
.273
.582
.778
.891
.584
.986
.85
76.3
81.6
84.7
81.6
79.5
____
____
____
1 Sour
c e: B
LS P
ress
Re l
e ase
USD
L 99
-102
, Ta b
le 5
, 4/9
9. P
riva
te in
dust
ry in
c lud
e s a
ll g
oods
pro
duc i
ng a
nd s
e rvi
c e p
rodu
c ing
indu
stri
e s.
2 Sour
ce:
ww
w.f
ra.d
ot.g
ov3 Y
ard
envi
ronm
ent:
yar
d tr
ack
and
repa
ir tr
ack.
4 Tota
ls d
o no
t equ
al b
ecau
se th
ere
are
othe
r bod
ypar
t loc
atio
ns th
at a
ccou
nt fo
r rem
aind
er o
f inj
urie
s fo
r eac
h in
dust
ry.

68
Tab
le31
.P
erce
nt d
istr
ibut
ions
for
199
7 no
nfat
al o
ccup
atio
nal d
ays-
away
-fro
m-w
ork
inju
ries
and
illn
esse
s fo
r se
lect
edca
tego
ries
of
DA
FW
and
age
gro
ups

69
Tab
le32
.P
erce
nt d
istr
ibut
ions
for
199
7 no
nfat
al o
ccup
atio
nal d
ays-
away
-fro
m-w
ork
inju
ries
and
illn
esse
s fo
rse
lect
ed c
ateg
orie
s of
DA
FW
and
indu
stri
es

70
mining industry. Both mining and railroading involve substantial manual labor and both involveworking around heavy equipment.
4.5 Discussion
Subsection 4.5 presents some of the key findings from the analyses of the FRA accident andinjury data and discusses some of the limitations of both the accident and injury data and theanalytical methods that were used.
4.5.1 Key Findings
There are several key findings based on the analyses of the human factor-attributed yard trainaccidents and yard LWD injuries. They are discussed below.
Comparison of Yard Injuries To Railroad and Other Industries
The railroad yard environment appears to pose more risk of a serious injury than either therailroad industry as a whole or private industry. Specifically, 80 percent of railroad yard injuriesresulted in at least one or more LWDs, compared to 77 percent of railroad-wide injuries and47 percent of private industry injuries. When examining DAFW injuries (the standard BLSmetric used to measure injury severity in private industry), 68 percent of railroad yard injuriesresulted in at least one or more DAFW compared to 65 percent railroad-wide and only 30 percentof private industry injuries. Private industry injuries in 1997 resulted in a median of five DAFWcompared to 22 DAFW for yard injuries and 18 for injuries railroad-wide. Of all privateindustries, the most similar to the yard and railroad environment is mining. Sixty-four percent ofmining injuries resulted in one or more LWDs, 50 percent of mining injuries resulted in one ormore DAFW, and the median number of DAFW in the mining industry in 1997 was 18.
Characteristics of Yard Injuries
Sprains and strains accounted for more than half (58 percent) of the LWD yard injuries; thetrunk/torso was the most affected body part (42 percent of LWD yard injuries); slips, trips andfalls were the most common triggering event (42 percent of LWD yard injuries); and the acts ofwalking, running, or stepping over were the leading physical acts associated with LWD yardinjuries (25 percent of LWD yard injuries).
Monthly Differences
The month of July was associated with a high number of both human factor-attributed yard trainaccidents per million switching miles and LWD yard injuries per million switching miles. Theheat associated with the month of July may play a factor in the accident and injury rate, however,the fact that June and August were associated with substantially fewer accidents and injuriesargues against this explanation.

71
Diurnal Differences
The hours of 10 a.m. to 12 p.m. were associated with the greatest number of LWD yard injuriesand a relatively large number of human factor-attributed train accidents. This may be a functionof exposure (e.g., traffic volume, increased crews working). Interestingly, the hours between2 a.m. and 4 a.m. are associated with a large number of human factor-attributed train accidentsbut relatively few LWD yard injuries. One would expect to find an increase during this time inboth human factor-attributed train accidents and LWD yard injuries due to circadian factors.However, this is not the case. Exposure data would help to interpret both the accident and injuryresults.
Age Differences
Employees younger than 35 suffer a disproportionate percentage of the LWD yard injuriesrelative to their proportion within the workforce. This assumes that the age distribution of theyard workforce is the same as the age distribution industry-wide.
Temperature and Human Factor-Attributed Train Accidents
Human factor-attributed train accidents in railroad yards appear to be, at least in part, a functionof ambient temperature. Specifically, it was found that more train accidents occurred duringcolder and hotter temperatures than during the milder temperatures. The quadratic equation,y = 8.0244x2 - 73.822x + 148.37, where x represents temperature and y represents the number oftrain accidents, may serve as an adequate predictor of human factor-attributed train accidents inyards.
4.5.2 Limitations of the FRA Accident and Injury Data Analyses
There are several limitations to the FRA accident and injury databases and the analyticalmethods that were used. These limitations are organized around three main themes: Data,definitions, and comparisons to other industries. Each is discussed below.
• Limitations to the Current FRA Accident and Injury Data
- Missing variables of interest. There are several injury and accident-related variables thatare missing from the accident and injury databases, but that may be important tounderstanding the accident and injury process. These variables include, but are notlimited to, the amount of railroad experience of the injured employee, the number ofhours the employee was on duty (time-on-task) at the time of the injury (this data iscollected for accidents but not injuries), and pre-injury or pre-accident work scheduledata for the injured employee and any crew members who are associated with a humanfactor-attributed train accident.
- Minimal exposure data. The only exposure data that were available were the number ofswitching miles per month. A surrogate age exposure measure, RRB industry-wide age

72
distribution data, was used as an exposure measure for railroad yard injuries, but theadequacy of this exposure measure depends on how well the industry-wide agedistribution matches the age distribution of railroad yard work forces. No other exposuremeasures, or surrogate exposure measures, were available.
• Shortcomings of FRA Accident and Injury Variable Definitions
- Definition of “days absent.” The number of days absent that are reported to the FRAdepends on the regularity or irregularity of the injured employee’s work schedule, notstrictly the amount of time the injury incapacitates the injured person. Specifically,according to the FRA Guide for Preparing Accident/Incident Reports, “For an employeeon an irregular assignment, all days away from work or days of restriction are to becounted from the time the employee marked off until the time he or she marked up”(FRA, 1997, Ch. 6, p. 14). This differs from an individual who is scheduled to work fiveout of every seven days. For example, assume an injury causes two individuals to beincapacitated for 14 consecutive days each. If one of the employees worked a regularschedule with two days off per week, the number of days absent for this employee wouldbe 10. If the second employee worked an irregular schedule, then the number of daysabsent that would be reported would be 14. Thus, the number of reported days absent is afunction of both the true severity of the injury and the injured employee’s work schedule.
- No “rail” circumstance code. When reporting information on FRA Form F 6180.55aabout what materials were associated with an injury (see field 5m, “Result”), there is nooption for a railroad officer to include the involvement of rail. Other roadbed-relatedcodes are available to describe the circumstances or involvement of other materials in theinjury, including “tie,” “switch,” and “ballast.”
- No clear definition of a “human factor” injury cause. As part of the injury reportingprocess, railroad officers responsible for completing this information on Form FRA F6180.55a (field 5n, “Cause”) must determine and report the probable cause of the injury.The term “human factor” has many different definitions, associations and connotations,and often depends on who is using the term as to how it gets used. Whereas it is clear ifan injury is caused by an “environmental” factor, it is not always clear when an injury isdue to a “human factor.”
• Limitations to the Current Study’s Comparison of Yard Injuries to Other Industries
- Differences in the injury severity metric used. The FRA injury analyses focused on LWDinjuries while the comparison to the BLS data was limited to DAFW injuries (a subset ofLWD injuries). The primary reason for using LWD injuries is that injuries that result inrestricted duty most likely do not permit the employee to work his or her regular yard job,and therefore impact both the railroad and the individual in a similar fashion as a dayabsent. However, when describing injury characteristics, the BLS reports DAFW cases.The use of a different severity metric limits the degree to which “apple-to-apple”comparisons can be made between the railroad yard LWD injuries and the BLS DAFWinjuries for private industry.

73
5. SUPPLEMENTAL INJURY DATA COLLECTION AND ANALYSIS
To provide additional information about contributors to personal injuries in railroad yards, injuryand work schedule data were collected from one participating railroad’s yard operation andanalyzed. Section 5 discusses the methods used to select the personal injury records and collectthe data from the participating railroad, and presents the results of two sets of analyses: one onfactors surrounding personal injuries that occurred in the yard (e.g., nature of the injury, thephysical act that led to the injury, etc.), and a second on the potential influence of work scheduleson yard injuries.
Data were collected from a participating railroad for two primary reasons: to look at the factorssurrounding yard injuries in more detail than is currently possible with the FRA injury database,and to examine the role of operator fatigue, or more specifically, work schedules, in yardinjuries. Currently the FRA does not collect work schedule data related to nonfatal injuries.Operator fatigue and alertness are major issues in all modes of transportation, including railroadoperations along mainlines and in yards. Analysis of work schedule information can providenew insight regarding the contribution of work schedule-related factors to personal injuries thatoccur in railroad yards.
This section is divided into three major subsections: subsection 5.1 presents the approach thatwas used to collect and analyze the personal injury and work schedule data; subsection 5.2presents the results of the analyses; and subsection 5.3 discusses the main findings andlimitations to the data and study methods used.
5.1 Supplemental Data Collection and Analysis Methods
The supplemental data collection approach involved examination of multiple years of personalinjury and work schedule data from a participating railroad. The methods that were used tocollect the personal injury and work schedule data are discussed in the following twosubsections.
5.1.1 Personal Injury Data
Three years (1996 to 1998) of personal injury data were collected from the participating railroad.This data included FRA reportable injuries as well as non-reportable injuries (i.e., injuries forwhich the participating railroad collects data but does not report to the FRA since the injuries donot meet FRA’s reporting requirements. These include minor injuries that do not require first aidand do not result in time away from work). Information was collected on the circumstances ofthe injury, certain personal factors (e.g., age, railroad experience), and environmental factors(e.g., location of the injury, weather).

74
The participating railroad maintained a file for each injury. Each file contained a variety ofinformation sources, though the specific sources depended on the particular case. Some filescontained only a completed FRA injury/illness Form FRA F 6180.9810, while other filescontained transcripts, photos, medical records, etc. Potential sources of information about thepersonal injuries included:
• Handwritten transcripts of testimony from the injured employee and/or witness(es) toincident.
• Risk management officer’s personal notes about the injury/case.
• Official correspondence between the risk management officer and other railroad personnel(e.g., counsel, payroll).
• Official correspondence between the risk management officer and injured employee and/orhis/her counsel.
• Official correspondence between the risk management officer and the Railroad RetirementBoard.
• Official correspondence between the risk management officer and injured party’s doctor.
• Copies of doctors’ notes, prescriptions, medical bills, invoices, case histories, etc.
• Completed FRA injury/illness forms.
• Injured employee’s personnel records, including disciplinary actions, past work histories,resumes, original medical history (at time of hiring).
• Risk management officer’s notes to the file.
• Photographs, diagrams, drawings.
• Copies of release forms (for settled cases).
• Transcripts and correspondence related to commissioned surveillance of the injuredemployee.
• Formal investigation transcripts.
_____________10Railroads are required to complete and keep on file a Form FRA F 6180.98 Railroad Employee Injury and/or Illness Record, ora comparable form that includes the same information, for each reportable injury. This differs from Form FRA F 6180.55aRailroad Injury and Illness Summary, which railroads are required to submit to the FRA on a monthly basis.

75
• Company monthly “FRA log.” This contained a list of injuries per month, including whetherthe injury was reportable to the FRA. It generally served as a starting point for selectingcandidate injury cases.
Only injuries that occurred to employees as a result of performing their usual responsibilities onthe railroad property were of interest. Therefore, the following selection criteria wereestablished:
• The injured employee must have sought medical attention (if the injured employee had notsought medical attention, there would be no record of the injury).
• The injury was not fatal.
• The injured party was an employee of the participating railroad.
• The injury occurred on railroad property.
• The injury occurred in the yard (including the RIP track or intermodal facility), on themainline or on industry track, or in a shop.
• The injury resulted from performing work-related activity.
• The employee was not under the influence of alcohol or drugs at the time of injury.
• Only one injury per person would be included.11 When there were multiple injuries, arandom numbers table (RNT) was used to select one of the injuries from among the multipleinjuries for an employee.
• The injury did not involve a grade-crossing.
Each injury that occurred on the railroad property from 1996 to 1998 was reviewed to determineits eligibility for inclusion in the study. After eligible injuries had been identified, all of theinformation sources included in each injury file were reviewed and relevant information abouteach injury was recorded on a form that was developed (see Appendix C) to aid in the datacollection process. When personal injury data from a file were inconsistent between two datasources (e.g., the date of birth was listed as 7/1/56 on one data source and 7/1/60 on a seconddata source), verification was sought from a third source of information. When this was notavailable, information from the most recent record source was used. When an individualsustained multiple eligible injuries, a RNT was used to select one of the injuries for inclusion inthe analyses to ensure independence of the data.
Injury data were collected for a total of 69 individuals. A RNT was used to select a subset ofdata to spot check. Approximately 15 percent of the cases were selected for spot-checking.
____________11The purpose for eliminating multiple injuries is to allow the assumption of independence to be true.

76
Errors were found in less than 5 percent of all of the data cells, therefore the coding wasconsidered reliable.
Separately, monthly exposure data were collected for the number of cars switched between 1996and 1998, and the number of hours worked by employees between 1996 and 1998. Since onlythose injuries that occurred in the yard environment were of interest, crafts that do not work inthe yard operating environment were removed from the employee work hour exposure data.These crafts included building maintenance personnel, freight car repair facility personnel,dispatchers, clerks, crew callers, police department personnel, and General and Administrative(G&A) personnel. Both the number of cars switched per month and the number of employeehours per month were used to calculate injury rates per month between 1996 and 1998. No otherexposure data were available.
5.1.2 Work Schedule Data
The analysis of work schedule data centered on trainmen (i.e., conductors/foremen andswitchmen) and locomotive engineers injured in the yard, since work schedule data wereavailable only for these crafts (railroads are required by law to maintain this information). Atotal of 27 yard injuries involved T&E employees between 1996 and 1998. Data were alsocollected for a craft, experience, age-matched sample of 27 non-injured T&E employees. Thecontrol group was matched using T&E age and seniority rosters provided by the participatingrailroad. The purpose of collecting work schedule data for a sample of non-injured T&Eemployees was to be able to determine the possible contribution(s) of work schedules to personalinjuries in yards by enabling a statistical comparison between the two groups that controlled foras many factors (i.e., age, craft and experience) as possible.
To select the control group, first each craft (trainmen and engineers) was matched. Then, withineach craft, all individuals whose experience was within 12 months of that of the injuredemployee were identified. For each eligible control, the difference between their seniority dateand the injured employee’s seniority date was computed. Then the difference in months betweenthe injured’s date of birth and all eligible controls was calculated. Next the differences inseniority and age were combined. For each injured employee, the individual in the control groupwho most closely matched the injured employee (i.e., had the fewest combined months’difference) was selected as the match. In case of ties, the individual with the closest senioritydate (i.e., fewest months difference in seniority) was chosen, since experience was considered tobe more important to match than age.
Once a non-injured match had been identified for each of the 27 injured T&E employees, workschedule data were collected for 30 days of work prior to the date of the injury (i.e., notincluding the shift in which the injury occurred) for each insured T&E employee and each non-insured T&E employee. For each non-injured employee, the dates of the work schedule data thatwere collected matched the dates of the work schedule data that were collected for the injuredemployee. When a non-injured employee worked non-yard jobs more than two-thirds of the30 days over which data was collected, a replacement was selected based on the next closestmatch to the injured employee in terms of the fewest number of months’ difference (seniority

77
and age, combined). Work schedule data was then collected for that individual. The railroad’shand-written crew caller logs were used to provide the work schedule data. The crew caller’slogs were manually reviewed and the relevant start and stop times for each injured and non-injured match employee were recorded on a record form that was developed especially for thisdata collection (see Appendix C).
To verify that the two populations were not significantly different from one another, t-tests wereconducted. Overall, the average difference in seniority was seven months (tobt =0.04, df=52,p=0.97), and the average difference in age was 14 months (tobt=0.25, df=52, p=0.81). Similarresults were found within each craft. The average difference in seniority for the trainmen wasseven (tobt=0.05, df=42, p=0.96) and the average difference in age was 14 months (tobt t=0.22,df=8, p=0.82). The average difference in seniority for the engineers was five (tobt=0.005, df=8,p=0.99) and the average difference in age was 15 months (tobt=0.12, df=52, p =0.91). Thus,t-tests indicate that the injured and the non-injured groups are not significantly different fromeach other, suggesting that it is likely that any differences that are found between the injured andnon-injured groups are not attributable to differences in craft, seniority or age.
Several caveats regarding the work schedule data merit explanation. Since the study design wasretrospective, data on individuals’ time away from work was not collected. Therefore, it was notpossible to analyze individuals’ time and activity away from work since it was not possible todetermine what the person was doing during this time (e.g., whether the individual was sleeping/resting or actively doing something else). Analyses, therefore, were limited to work periodactivity. Related to this issue, it was not possible to determine when and if employees took anyvacation or sick time during the 30 days for which work schedule data was collected. Third, itwas not possible to determine whether the employee was working a regular job, relief job, orextra board job. Lastly, employees could work different “jobs” each day, therefore, it was notpossible to control for exposure to the yard environment. In fact, it was quite possible that anindividual worked in the yard one day and worked an “industry” job the next day. Whereindividuals from the control (match) group worked a substantial amount of time outside of theyard (i.e., greater than 2/3 of the month), they were excluded from the analysis and anothermatch was selected and their work schedule data used. When either an injured or non-injuredemployee worked a non-yard job, their data for that work period were recorded as missing, since,even though the employee was working, they were not working in the yard environment.
5.2 Results
This section presents the results of the personal injury and work schedule analyses. Descriptivestatistics were used to analyze and present the personal injury data, while parametric andnonparametric tests were used to compare the work schedule data for the injured T&E employeesto the work schedule data for the non-injured T&E matched control group.12
____________12Analyses were conducted using SPSS v8.0 and Microsoft Excel.

78
5.2.1 Personal Injury Data Analyses
A total of 69 injuries between 1996 and 1998 satisfied the selection criteria. These injuriesranged in degree of severity and railroad location. As shown in Table 33, 52 injuries(75 percent) occurred in the yard environment, which includes Repair, Inspect and Paint (RIP)tracks and an intermodal facility. Eight injuries occurred in a shop or repair facility and nineoccurred along the mainline or industry track. All 69 injured employees were male. Since thefocus of the analysis was on the yard operational environment, analyses centered on the52 injuries that occurred in the yard of the participating railroad.
When reporting data, some totals may not add up to 52 since occasionally there were one ormore cases in which data were missing, such as the age of the employee or his railroadexperience. Separately, some variables lacked sufficient data to report. Variables that were ofinterest, but lacked sufficient data, are listed in Table 34, along with the number of missingcases.
The type of injury was examined for the injuries that occurred in the yard (see Figure 17).Similar to the national injury data, the greatest number of injuries resulted in a sprain or strain(n=20). Bruises and contusions (n=9); cuts, lacerations and abrasions (n=9) and fractures (n=5)also mirrored national trends.
Next, the bodily location where the injury occurred was examined. Whereas the torso is, by far,the most affected body part based on national data, interestingly, this was not the case at this
Table 33. Participating railroad distribution of injuries bylocation, 1996 to 1998
Location No. of Injuries Percentage of Injuries
Yard 52 75Shop 8 12Mainline/Industry Track 9 13Total 69 100
Table 34. Variables that lacked sufficient data to report
VariableNo. of
Missing CasesPercentage ofTotal Cases
Marital status 23 44Height 47 90Weight 46 88Was injured employee alone at the time of the injury? 28 54Visibility 45 87Weather 36 69Temperature 36 69

79
railroad. The upper extremities (arms and hands) were the most affected (n=13 injuries) bodyparts, while the lower extremities (legs and feet) and the torso were tied for the second mostaffected body part (n=11 each). Figure 18 presents the data for the number of injuries thataffected each body part.
The FRA provides railroads with over 70 different physical act codes from which to categorizean injury. Since data were available for only 52 injuries, physical act codes were collapsed into asmaller number of higher level categories. The higher level physical act categories used for thenational injury data analysis in subsection 4.3 were used. The results indicate that the act ofwalking/running/stepping over accounted for the most injuries (n=12). In fact, the single act ofwalking accounted for 10 of the 12 injuries. The act of getting on, off, up or down accounted forthe second-largest number of injuries (n=6). Figure 19 presents the complete data set for thephysical act associated with each injury.
Similar to the physical act codes, there are dozens of FRA triggering event codes from which toselect when describing the circumstances of the injury. Therefore, the higher level categoriesemployed in the national injury data analysis (see subsection 4.3) were used. Being struck by oragainst an object resulted in the greatest number of injuries (n=16) while slips, trips and fallsresulted in the second-most number of injuries (n=14) (see Figure 20).
Figure 17. Participating railroad yard injuries by type, 1996 to 1998

80
The involvement of track and train equipment in the injuries was also of interest. Specifically,the involvement of three track-related items (ballast, ties, and switches), and three train-relateditems (couplers, air hoses, and hand brakes), were analyzed. As shown in Table 35, two injuriesinvolved road ballast, five involved cross-ties, and four involved switches. With respect to trainequipment, three injuries involved couplers, one involved a handbrake, and two involved airhoses.
The overall involvement of on-track equipment was also examined. Involvement of on-trackequipment meant either the injured employee was physically located on or in the on-trackequipment at the time of the injury, or the injury resulted from direct contact with the on-trackequipment. For example, on-track equipment would be involved if an injury occurred while theindividual was coupling two cars; on-track equipment would not be involved if a carman wasinspecting a train when he or she tripped on a tie. Results indicate that 20 injuries (38 percent)involved on-track equipment. The data was insufficient, however, to conclusively determine, atthe time of the injury, whether the on-track equipment was moving or not.
The crafts that were involved in the yard injuries were also examined. While T&E crewssuffered the most injuries in the yard (n=27, or 52 percent), interestingly, almost half of the yardinjuries occurred to maintenance personnel (n=23, or 44 percent).
Figure 18. Participating railroad yard injuries by body part, 1996 to 1998
0
2
4
6
8
10
12
14
Arm or Hand Leg or Foot Head or Face Torso Multiple Injuriesof Equal Severity
Body Part
Injuries
534-FRA-00175-24

81
Next, the severity of the injury was divided into three levels or degrees: 1) the injured employeereceived medical attention only, i.e., the injured employee sought medical attention, but the“treatment” was not beyond first-aid13; 2) the injured employee received first-aid as a result ofthe injury, but did not miss any work; and 3) the injury resulted in one or more lost workdays(either days absent or restricted/light duty). Interestingly, almost half (n=23, or 44 percent) ofthe injuries involved medical attention only. Five injuries required first-aid, and an additional 19injuries resulted in at least one lost workday (see Figure 21).
Examination of the yard injuries by age indicates that most injuries occurred to those 25 to 34(n=14) and 35 to 44 (n=13) while fewer injuries occurred to those younger and older. Figure 22illustrates the distribution of injuries by age group.
Railroad-specific exposure data were not available. However, industry-wide age distributiondata were available from the RRB. These data were used as a surrogate exposure measure todetermine if the percentage of injuries associated with each age group at the participatingrailroad was proportional to the percentage of employees (industry-wide) in each age group. Anassumption was made that the age distribution of the yard workforce at the participating railroadwas similar to the age distribution of the railroad industry as a whole (i.e., the RRB data). The
Figure 19. Participating railroad yard injuries by physical act, 1996 to 1998
____________13Injuries in this category would not result in an FRA-reportable injury since treatment was not beyond first-aid.

82
RRB age data was used to calculate therelative proportions (i.e., percentages) for eachage category. The proportions by age arepresented in Table 36. A weighted frequencywas then computed for each age bracket.Based on the weighted frequencies, theyounger employees at this railroad,particularly those under 35, sufferdisproportionately more injuries compared toemployees 35 and older. This age-relatedfinding is similar to that found in the nationalinjury data maintained by the FRA (seeTable 14).
Next the monthly injury rate was analyzed. Since two railroad-specific exposure data variableswere available—the number of cars switched and the number of employee work hours permonth—both were used. The number of injuries per 1,000,000 cars switched per month and thenumber of injuries per 100 employees (200,000 hours) per month were computed. Figure 23 andFigure 24 present the injury rate data per month at the participating railroad. The general pattern
Figure 20. Participating railroad yard injuries by triggering event, 1996 to 1998
Type of Equipment No. of Injuries
Ballast 2Cross-Ties 5Switches 4Couplers 3Handbrakes 1Air Hoses 2
Table 35. Participating railroad yardinjuries involving track andtrain equipment, 1996 to 1998

83
is the same between the injury rate per 100 employees and the injury rate per 1,000,000 carsswitched. A chi-square test was performed on the number of injuries per million carsswitched,14 and a significant difference among months was found (χ2= 59.08, df=11, p<0.001).As shown in Figure 23, the injury rates in July (more than 35 injuries/1,000,000 cars switched),May (more than 28 injuries/1,000,000 cars switched) and August (more than 25 injuries/1,000,000 cars switched) are the highest. Interestingly, no injuries occurred in the month ofApril across three consecutive years.
Data were next grouped into 2 hour periods (e.g., midnight to 2 a.m.). Figure 25 presents theresults of the analysis. The greatest number of injuries in any 2 hour period occurred between10 a.m. and 12 p.m. (n=9), though it is not clear whether this is an effect of the time-of-day orexposure (i.e., it may be that more crews are working during this 2 hour time period than duringother 2 hour time periods). Interestingly, the second-highest number of injuries occurredbetween 8 p.m. and 10 p.m. (n=7). A chi-square test was not performed since the frequency ofexpected values (Fe) was 4.3 for each 2 hour time period, violating one of the rules of thumb forusing the chi-square test that stipulates that the Fe for each cell should be no less than five
Figure 21. Participating railroad yard injuries by injury severity, 1996 to 1998
0
5
10
15
20
25
Medical Attention Only Beyond First Aid, But No LostWorkdays
One or More Lost Workdays
Injury Severity
Injuries
534-FRA-00175-25
____________14A chi-square test was performed on the injury rate per million cars switched since these data satisfied the assumptions of a chi-square test.

84
(Harnett, 1982). If one can assume that more crews work a day shift rather than an evening ornight shift, the fact that the most injuries in any 2 hour period occur between 10 a.m. and 12 p.m.would be expected. However, the fact that the second-highest number of injuries occurredbetween 8 p.m. and 10 p.m. would not be expected, given that fewer crews probably work duringthis time (if this assumption is true). Conversely, if one assumes equal exposure across 2 hourtime periods, one would expect 8.3 percent of the injuries to occur between 10 a.m. and 12 p.m.and another 8.3 percent to occur between 8 p.m. and 10 p.m. Yet, 17.3 percent of the injuresoccurred between 10 a.m. and 12 p.m. and 13.5 percent of the injures occurred between 8 p.m.and 10 p.m. Since exposure data are unavailable, however, it is difficult to determine whether
Figure 22. Participating railroad yard injuries by age, 1996 to 1998
0
2
4
6
8
10
12
14
16
16-24 25-34 35-44 45-54 55+
Age
Injuries
Table 36. Age distribution weighted frequencies for participating railroad yardinjuries, 1996 to 1998
Age Bracket Injuries% of Total
InjuriesAge Distribution
(%) *WeightedFrequency
<25 8 15.4 3.3 4.725 to 34 14 26.9 12.9 2.135 to 44 13 25.0 28.8 0.945 to 54 10 19.2 38.4 0.555+ 6 11.5 16.6 0.7Total 4573 100 100 1.0____________*Source: Railroad Retirement Board Statistical Table D-10, 1996 to 1998.
534-FRA-00175-26

85
these numbers are a result of exposure or time-of-day. Examination of the national injury dataalso indicates that the most yard LWD injuries occur between 10 a.m. and 12 p.m.
Time-on-task (i.e., hours on duty) was also examined to determine when, during employees’work shifts, injuries occurred. Interestingly, as illustrated in Figure 26, 16 injuries occurredduring the fourth to sixth hours of an employee’s shift. This figure is twice the next closest2 hour period (the first 2 hour of the shift). However, data were only available for 37 of the52 yard injuries. A chi-square test was not performed since it was not possible to determine theexpected frequencies for each of the six 2 hour time periods (some employees worked 8 hourshifts, while others worked 10 hour shifts and still others worked 12 hour shifts). Though nostatistical test was performed, the difference in the number of injuries occurring during the 4th to6th hour on duty compared to all other 2 hour time periods is meaningful.
Next, railroad experience was examined. The national FRA injury database does not include anydata on injured employees’ railroad experience. However, these data were available for most ofthe injury cases using either the date-of-hire or seniority date information from the participatingrailroad. When available, date-of-hire information was used to calculate railroad experience.This information was available for 27 cases. When hire date information was unavailable,seniority date information was used. This information was available for 17 additional cases.
Figure 23. Participating railroad yard injuries per 1,000,000 cars switchedper month, 1996 to 1998
534-FRA-00175-27
0.0
5.0
10.0
15.0
20.0
25.0
30.0
35.0
40.0
Jan Feb Mar Apr May Jun Jul Aug Sep Oct Nov Dec
Month
Injuries per
Million Cars
Switched
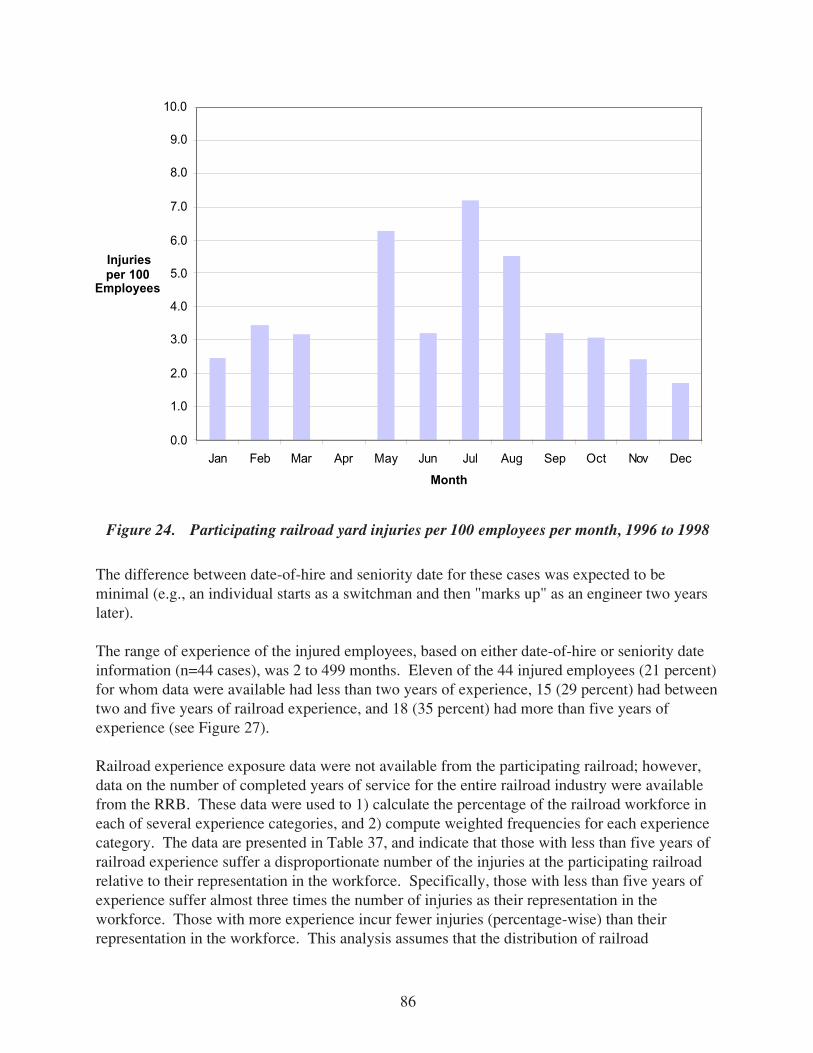
86
The difference between date-of-hire and seniority date for these cases was expected to beminimal (e.g., an individual starts as a switchman and then "marks up" as an engineer two yearslater).
The range of experience of the injured employees, based on either date-of-hire or seniority dateinformation (n=44 cases), was 2 to 499 months. Eleven of the 44 injured employees (21 percent)for whom data were available had less than two years of experience, 15 (29 percent) had betweentwo and five years of railroad experience, and 18 (35 percent) had more than five years ofexperience (see Figure 27).
Railroad experience exposure data were not available from the participating railroad; however,data on the number of completed years of service for the entire railroad industry were availablefrom the RRB. These data were used to 1) calculate the percentage of the railroad workforce ineach of several experience categories, and 2) compute weighted frequencies for each experiencecategory. The data are presented in Table 37, and indicate that those with less than five years ofrailroad experience suffer a disproportionate number of the injuries at the participating railroadrelative to their representation in the workforce. Specifically, those with less than five years ofexperience suffer almost three times the number of injuries as their representation in theworkforce. Those with more experience incur fewer injuries (percentage-wise) than theirrepresentation in the workforce. This analysis assumes that the distribution of railroad
Figure 24. Participating railroad yard injuries per 100 employees per month, 1996 to 1998
534-FRA-00175-28
0.0
1.0
2.0
3.0
4.0
5.0
6.0
7.0
8.0
9.0
10.0
Jan Feb Mar Apr May Jun Jul Aug Sep Oct Nov Dec
Month
Injuries per 100
Employees

87
experience at the participating railroad is similar to the distribution of railroad experienceindustry-wide.
The severity of the injury relative to four different factors — age, time-of-day, hours on duty,and railroad experience — was examined next. The interaction between the severity of theinjury and these four factors are presented separately in Figure 28, Figure 29, Figure 30, andFigure 31.
As illustrated in Figure 28, there are a greater number of injuries that resulted in one or more lostworkdays in the 25 to 34 and 45 to 54 year old age brackets compared to other age groups, wherethe greatest number of injuries resulted in medical attention only. However, since the samplesize is small, results should be viewed cautiously.
Figure 29 shows that the two 2 hour time periods with the greatest number of injuries also resultin the greatest number of severe injuries. Ten of the 19 cases that resulted in one or more lostworkdays occurred in these two time periods.
In Figure 30, the three injuries that occurred to individuals on or after their 8th hour on duty wereall injuries of the least severe type. There is no clear explanation for this finding.
Figure 25. Participating railroad yard injuries by time-of-day, 1996 to 1998
534-FRA-00175-29
0
1
2
3
4
5
6
7
8
9
10
12-2 AM 2-4 AM 4-6 AM 6-8 AM 8-10 AM 10 AM-12 PM
12-2 PM 2-4 PM 4-6 PM 6-8 PM 8-10 PM 10 PM -12 AM
Time-of-Day
Injuries

88
Based on Figure 31, the proportion of least severe, moderately severe, and most severe injuriesare distributed proportionately across each level of experience.
Lastly, hazardous materials (hazmat) data were available for 48 of the 52 injury cases. None ofthe injuries involved hazardous materials.
5.2.2 Work Schedule Data Analyses
Data analyses focused on the comparison of the work schedules of the 27 injured T&Eemployees to the work schedules of a craft, age and seniority-matched group of non-injured T&Eemployees. For each injured T&E employee and his match, work schedule data were collectedfor the 30 days preceding the day of the start of the shift during which the injury occurred. Thus,for example, if a locomotive engineer was injured on August 31st, work schedule data werecollected for both the injured locomotive engineer and his match between August 1 andAugust 30 of the year of the injury. Shift start and stop times, along with the date that the shiftstarted, were collected for all 54 employees (27 injured and 27 control). In several instances(n=7), an employee started two shifts in one 24 hour (midnight to midnight) period.
The following questions were addressed:
1. Is there a difference between the two groups with respect to the average shift length worked?
Figure 26. Participating railroad yard injuries by hours on duty, 1996 to 1998
534-FRA-00175-30
0
2
4
6
8
10
12
14
16
18
20
Up to 4 Hours 4-8 Hours More than 8 Hours
Hours on Duty
Injuries

89
2. Is there a difference between the two groups with respect to the total amount of time workedover the 30 day period?
3. Is there a difference between the two groups with respect to the total number of shiftsworked?
4. Is there a difference between the two groups with respect to the total number of startsbetween 8 p.m. and 4 a.m. (i.e., a night or “graveyard” shift)?
Figure 27. Participating railroad yard injuries by railroad experience, 1996 to 1998
Table 37. Railroad experience-weighted frequencies for participatingrailroad yard injuries, 1996 to 1998
534-FRA-00175-31
0
2
4
6
8
10
12
14
16
18
20
Up to 2 Years 2 to 5 Years 5 Or More Years
Railroad Experience
Injuries
Experience(Years) Cases
% of Cases
Railroad ExperienceDistribution
(%)WeightedFrequency
<5 26 50.0 19.2 2.65 to 9 2 3.8 9.4 0.410 to 19 3 5.8 21.7 0.320 to 29 8 15.4 36.5 0.430+ 5 9.6 13.2 0.7

90
5. Is there a difference between the two groups with respect to the number of shifts worked over8 hours (i.e., an extended work period)?
First the average shift lengths for the two groups were compared to one another. The averageshift length for injured employees was 9 hours and 14 minutes (9.24 hours) while the averageshift length for the matched control group employees was 9 hours and 10 minutes (9.17 hours).Since the distributions of average shift length for each group were asymptotic (i.e., negativelyskewed), a Mann-Whitney15 nonparametric test was performed. As would be expected, therewas not a significant difference between the two groups (Mann-Whitney U = 330, p=0.551).
The total amount of time worked by the two groups was examined. Review of the data indicatedthat the distributions were normally distributed, therefore a t-test was performed. The analysisindicated that there was not a significant difference between the two groups with respect to thetotal amount of time worked over the 30 day period (tobt= -1.335, df=52, p=0.188).
Figure 28. Interaction between participating railroad yard injuryseverity and age, 1996 to 1998
534-FRA-00175-32
0
1
2
3
4
5
6
7
16-24 25-34 35-44 45-54 55+
Age
Injuries
Medical Attention Only
Beyond First Aid, No Lost Wkdys
One or More Lost Workdays
____________15According to Minium, King and Bear (1993), the Mann-Whitney test is a frequently used nonparametric substitute for the t-testand is used primarily when the assumptions of a t-test cannot be met. In this instance, the distributions were not symmetricallyand normally distributed.

91
Next, the total number of shifts worked were compared. A chi-square test indicated nodifference (χ2= 2.74, df=1, p=0.10). In fact, as shown in Table 38, the non-injured control groupworked more shifts than the injured group over the 30 day period.
Finally, the two groups were compared with respect to the total number of shift start timesbetween 8 p.m. and 4 a.m., and the total number of shifts greater than 8 hours. Since both thenumber of shift start times between 8 p.m. and 4 a.m. and the number of shifts longer than8 hours depend on the total number of shifts worked by each group, expected frequencies wereweighted to reflect the fact that the injured group worked 47 percent of the total shifts and thecontrol group worked the remaining 53 percent. (See Table 39 and Table 40.) Chi-square testswere then performed. There was not a significant difference in either the number of shift startsbetween 8 p.m. and 4 a.m. (χ2= 2.33, df=1, p=0.13) or the number of shifts greater than 8 hours(χ2= 0.17, df=1, p=0.68). In fact, the injured group started fewer shifts between 8 p.m. and4 a.m. than expected, though they worked slightly more extended work periods (i.e., greater than8 hours) than expected.
Figure 29. Interaction between participating railroad yard injuryseverity and time-of-day, 1996 to 1998
534-FRA-00175-33
0
1
2
3
4
5
6
7
12-2 AM 2-4 AM 4-6 AM 6-8 AM 8-10 AM 10 AM-12 PM
12-2 PM 2-4 PM 4-6 PM 6-8 PM 8-10 PM 10 PM -12 AM
Time-of-Day
Injuries
Medical Attention Only
Beyond First Aid, No Lost Wkdys
One or More Lost Workdays

92
5.3 Discussion
Subsection 5.3 is divided into two subsections. First, the key findings from the personal injuryand work schedule analyses are discussed. Then the limitations to both the data and the studymethods are discussed. These limitations form the basis for recommendations for future researchand data collection with respect to worker injuries that occur in railroad yards. Theserecommendations are presented in Section 8.
5.3.1 Key Findings
Major findings from the collection and analysis of personal injury and work schedule data fromthe participating railroad are presented below. Where possible, comparisons are drawn to thenational injury data.
Key findings include:
• Twenty-three of the 52 yard injuries resulted in medical attention only. These cases are not“reportable” incidents and therefore represent a new type of injury that is not currently beingcollected by the FRA. If the data from the participating railroad could be considered
Figure 30. Interaction between participating railroad yard injury severityand hours on duty, 1996 to 1998
534-FRA-00175-34
0
1
2
3
4
5
6
7
8
9
Up to 4 Hours 4-8 Hours More than 8 Hours
Hours on Duty
Injuries
Medical Attention Only
Beyond First Aid, No Lost Wkdys
One or More Lost Workdays

93
Figure 31. Interaction between participating railroad yard injury severityand experience, 1996 to 1998
0
1
2
3
4
5
6
7
8
9
Up to 2 Years 2 to 5 Years 5 Or More Years
Railroad Experience
Injuries
Medical Attention Only
Beyond First Aid, No Lost Wkdys
One or More Lost Workdays
534-FRA-00175-35
Table 38. Total and expected number of shifts worked
No. of ShiftsWorked
% of ShiftsWorked
Expected No. of Shifts Worked(% of Total)
Injured 468 47 494 (50 percent)Control 520 53 494 (50 percent)Total 988 100 988 (100 percent)
Table 39. Total and expected number of shift start times between 8 p.m. and 4 a.m.
Total No. of Shift Start TimesBetween 8 p.m. and 4 a.m.
Expected No. of Shift Start TimesBetween 8 p.m. and 4 a.m.
Injured 126 139Control 170 157Total 296 296

94
representative, then only 56 percent of all yard injuries are reportable, while 44 percent of theinjuries are non-reportable and therefore not reported to, nor collected by, the FRA.Collection and analysis of these currently unreported injuries may prove useful, since theyprovide another “layer” of safety analysis. Heinrich (1950) proposed that there is arelationship between major injuries, minor injuries, and unsafe acts. Now known as“Heinrich’s Triangle,” Figure 32 illustrates this estimated relationship between seriousinjuries, minor injuries and unsafe acts. For every one major (i.e., lost work time) injury,Heinrich estimated there are 29 minor injuries, and 300 unsafe acts. The unreported injuriesidentified in the analysis of the personal injury data from the participating railroad may beconsidered minor injuries, while most of the reportable injuries (those that resulted in one ormore lost workdays) may be viewed as major injuries. Based on the theory illustrated byHeinrich’s Triangle, therefore, the minor unreported injuries may be important tounderstanding and preventing more serious injuries. In fact, based on Heinrich’s theory,collection and analysis of near misses or unsafe acts is also important in understanding andpreventing minor and major injuries in railroad yards.
Total No. of ShiftsGreater Than 8 hr
Expected No. of ShiftsGreater Than 8 hr
Injured 175 171Control 189 193Total 364 364
Table 40. Total and expected number of shifts greater than 8 hr
Figure 32. Heinrich’s triangle
533-FRA-00175-2
Major (i.e., Lost worktime) Injuries
Minor Injuries
Non-Injuring Accidents
(i.e., Unsafe Acts)

95
• The greatest number of injuries occurred during the injured employees’ 4th through 6th houron duty.
• Although the most injuries in any 2 hour time period occurred between 10 a.m. and 12 p.m.,interestingly, the second-most injuries occurred between 8 p.m. and 10 p.m. Exposure data(e.g., the number of employee work hours or cars switched per 2 hour time period) wouldassist in interpreting these results. Given the difficulty and resources necessary to collect thistype of exposure data (i.e., every 2 hours), however, it is unlikely that this data canreasonably be collected.
• There was a statistically significant monthly difference among injuries at the participatingrailroad. Though the exact differences among months cannot be determined, May, July andAugust have the highest injury rates. July was also associated with the greatest number ofLWD yard injuries in the national FRA injury data.
• The most affected body parts among the participating railroad injuries were the arms andhands (i.e., the upper extremities). This differs from the FRA injury data, in which the torsowas the most affected body part.
• Sprains and strains were the most frequent type of injury, and the physical acts of walking,running or stepping over were associated with the largest number of injuries at theparticipating railroad and in the national FRA injury data. However, while being struck by oragainst an object accounted for the single-most injuries at the participating railroad yard,slips, trips and falls accounted for the most injuries among the national injury data.
• The work schedule data that was collected represents a type of information that the FRA doesnot currently collect with respect to reportable nonfatal injuries. There were no statisticallysignificant differences between the injured T&E employees and the non-injured T&Eemployees with respect to the work schedule variables analyzed. A lack of statisticallysignificant differences does not necessarily mean that operator fatigue is not an issue in yardoperations, however. There are a number of checks-and-balances in railroad yard operations,such as constant communication among crew members and watching out for each other.These checks-and-balances may help to prevent operator fatigue from contributing to aninjury. However, if there are breakdowns in the checks-and-balances system, then operatorfatigue may play a role in injuries. Thus, though no significant differences were found, theissue of operator fatigue in yard operations still merits further study.
5.3.2 Limitations of the Study Methods and Data
There are several limitations of both the study methods that were used and the personal injuryand work schedule data that were collected. They are presented below.
96
• Data limitations
- Limited exposure data available. The only railroad-specific exposure data that wereavailable were the number of cars switched per month and the number of employee workhours per month. These were used to calculate monthly injury rates.
- Partial data. There were a number of injury variables that the FRA does not requirerailroads to report, but that were of interest to this study. For example, it was desirable todetermine if weather or temperature contributed to personal injuries. Some filescontained these data, while others did not contain these data. Consequently, thesevariables were not analyzed.
• Study methodological limitations
- Differences in data that were analyzed. Injury analysis based on the FRA databasefocused on LWD injuries. Analysis of data from the participating railroad included notonly LWD injuries, but also non-LWD injuries and injuries not meeting the FRA’sreporting criteria. Comparisons between these analyses must take these differences intoaccount.
- Lack of time-away-from-work data. Given the retrospective nature of the study, data onemployees’ non-work time were not collected. As a result, what the employee was doingduring his time away from work (e.g., whether the employee was sleeping/resting oractively doing something else) was not determined. The absence of this type ofinformation limited the study’s ability to explore many of the issues related to workschedules and operator fatigue.

97
6. STRUCTURED INTERVIEWS WITH RAILROAD OFFICIALS
This section presents the results from a series of structured interviews that were conducted withrailroad officials responsible for the development, implementation, and/or oversight of safetyprograms in railroad yards. The interviews focused on issues that were specific to railroad yards,such as contributors to injuries in yards; however, many of these issues are not limited to railroadyards. In fact, many of the issues discussed are relevant across the entire railroad industry.
A structured interview guide was developed to elicit uniform information from each of the sitevisits (see Appendix D for a copy of the structured interview questions). Interviews wereconducted at four different railroad yards across the country. Subsection 6.1 describes theprocedures used in selecting the railroad sites and conducting the structured interviews, whilesubsections 6.2 through 6.6 summarize the information from the interviews along several mainthemes.
6.1 Procedure
Criteria for selecting sites to visit were first developed. Three different dimensions of a railroadyard were identified: size, switching method and yard type. Each dimension was furtherseparated into two categories. The three dimensions, and their categories, are:
• Railroad size: Class I versus a regional, shortline, or switching operation.• Switching method: Hump versus flat.• Yard type: Intermediate versus terminal.
Most railroad yards can be characterized by combining categories from each of the threedimensions. It was desirable to identify railroad yards that represented each of the six categoriesso that the information gleaned from the structured interviews would be most representative ofrailroad yards across the country. Four candidate railroad yards were consequently identified ascase studies. Table 41 provides some basic demographic information for each railroad yard thatwas visited. Appendix E contains more detail on each yard, its training program and its injuryreporting procedure.
Site visits and structured interviews with officials from the four railroads took place fromJanuary 1999 to January 2000, and each typically lasted one full day. Interviews were conductedwith some combination of trainmaster, yardmaster, claim agent, safety official, and/or humanresources official. At one railroad, local union members who were part of a management-laborsafety committee participated in the interview. Anywhere from two to seven individuals wereinterviewed at each of the four sites; a total of 15 individuals were interviewed.

98
The purposes of the site visits and structured interviews were to:
• Gain an appreciation of the various types of railroad yard environments.• Identify factors that might contribute to injuries in railroad yards.• Learn more about railroad yard safety programs.• Document railroad officials’ positive and negative experiences with safety programs.• Identify industry best practices.
Structured interview questions focused on five major themes. They were:
1. Training.2. Communications.3. Safety programs, incentives, and awards.4. Problem identification and resolution.5. Regulatory and legal issues.
In addition, information was collected on general yard operations and employee demographics.Results from the structured interviews with railroad officials from the four yards are discussed bytopic and are presented below.
6.2 Training
Training for yard switchmen at the four sites was similar in many respects. Three of the foursites have an active 6 to 7 week training program for new hires16. For these three programs,there is a week of classroom training followed by 5 to 6 weeks of on-the-job training (OJT). Theclassroom portion of the training covers safety, operating practices and operating rules and mayinclude videotapes as well as lectures and demonstrations. One of the three training programsfollows the OJT portion of the training with a day of classroom discussion to share experiences.
The fourth railroad requires new hires to attend a six-week training program offered at a local orcommunity college. Upon completion of this program, the railroad exposes the trainee to a nine-week company training program that combines classroom lectures, discussion and OJT. In thisprogram, the classroom lectures are followed by OJT, and group discussions follow the OJT toallow trainees to share experiences.
Table 41. Structured interview railroad sites
RailroadYard
YardLocation
RailroadSize
Type of CarSwitching
Type ofYard
Average No. of CarsSwitched per Day
A Midwest Switching Hump Terminal 2100 to 2700B New England Regional Flat Intermediate 300 to 350C New England Class I Flat Intermediate 50 to 70D Midwest Class I Flat Intermediate 1000
____________16The fourth railroad was not currently training any new hires.

99
At the three yards that have active training programs, mentors are used in the OJT portion of thetraining. Railroad management, usually the trainmaster, tries to select experienced mentors whowant to train new hires. Depending upon the union agreement for the facility, mentors and thecrew working with the trainee may be compensated for this extra responsibility. This in fact wasthe case at two facilities.
Following successful completion of the training period, trainees complete a 60 to 90 dayprobationary period in which they work in the yard. During this time the trainee can bedismissed without cause. At the end of the probationary period the trainee becomes a permanentemployee, must join the union and receives the benefits of the working contract, includingrepresentation in the event of a disciplinary action. At two of the yards visited, yard conductorjobs are filled primarily by experienced workers so new hires must work as a road conductoruntil a position becomes available in the yard.
In all of the yards that were visited, conductors who go on to become yard engineers mustcomplete standard locomotive engineer training followed by six months of OJT riding with anexperienced engineer. In the old days, trainmen and engineers were completely separate anddistinct crafts. Firemen served as engineer apprentices, aiding engineers on old steamlocomotives. Firemen would eventually be promoted to engineers. However, this craft has allbut become defunct due to reduced crew sizes and the use of non-steam locomotives. As aresult, nowadays, locomotive engineers generally come from the ranks of conductor.
Two railroads use computer-based training (CBT) for rules training. One railroad uses CBTrules training for all crafts and has found that given the small number of people that must betrained, this method is an efficient and effective way to carry out the training. Another railroadrecently implemented a new CBT program for system-wide rules instruction. Officials at thisrailroad shared several concerns over this CBT system. Specifically, officials felt that CBTeliminates the dialogue and sharing of information and experiences among students, whichofficials felt was valuable to rules-learning, since not every rule can be applied in every situation.Yard officials also expressed concern that some of the rules that were being taught did not applyto their particular environment, and their students were having trouble with these rules. Theirrecommendation was to have specialized rules training that would address issues, methods ofoperation, and hazards that are associated with their specific operating environment.
6.3 Communication
Railroads employ a variety of mechanisms to promote safety awareness and report unsafeconditions in the yard. The following two sections discuss the communication methods that thefour railroads use for these two purposes.
6.3.1 Promoting Safety Awareness
To increase safety awareness, T&E crews at all four sites conduct daily job safety briefingsbefore they begin their work. As part of the daily briefing, they may read and discuss the “ruleof the day.” They may also discuss the day’s job, how it is going to be performed, and any

100
unusual hazards associated with the job as well as strategies to avoid these hazards. Figure 33presents an example of job briefing guidelines that crews use when conducting job briefings atone of the yards that was visited.
One of the yards has a behavior-based safety improvement program. Management at this site feltthat this type of program fosters employee awareness of safe work practices. A second railroaduses observation-based efficiency testing to promote safety awareness. These programs arediscussed more fully in subsection 6.4.
One railroad reviews past injuries with each employee every three years. As part of the review,the supervisor and the employee discuss what happened to cause each injury, why the injuryoccurred, and how a re-occurrence can be prevented. Management at this railroad feels thisprocess makes the employee responsible for his/her own safety behaviors.
Bulletin boards are also used at all four sites to post a variety of safety-related informationincluding procedures for reporting unsafe conditions, illustration of safe work practices andsafety program highlights. Minutes of the local Safety Committee meetings may also be postedon bulletin boards or included in a periodic newsletter distributed to employees.
6.3.2 Reporting Unsafe Conditions
Every railroad has procedures for reporting unsafe conditions in the yard. The most frequentlyused method is to report the situation directly to a supervisor, trainmaster or dispatcher.Management at two of the railroads also encourage employees to talk with a member of the localsafety committee or the employee’s union representative. Two railroads have a corporate ordivision safety hotline that employees can use 24 hours a day to report an unsafe condition.However, yard managers prefer that employees talk with their supervisor or the trainmasterrather than using the hotline. The four railroads also offer a number of other means forcommunicating the existence of an unsafe condition, including a company or union-designedunsafe condition report that an employee can fill out and submit to the railroad, and havingrailroad officials periodically walk around the yard to talk informally with crews.
At one railroad employees who encounter unsafe work conditions are encouraged to report thecondition using a number of possible resources, all of which are directed to the safety committee.The safety committee is composed of representatives from all of the major crafts (who areelected by their craft constituents) and management officials, including the trainmaster. Oncethe safety committee has received an unsafe condition report or notification by someone that anunsafe condition exists, an attempt is made by the committee to address the issue by either fixingit within 24 hours of the condition being reported, or at least putting the process in motion so thatthe problem can be fixed as soon as possible. In addition to trying to fix the problem within24 hours, the safety committee also provides immediate feedback to the individual regarding theaction to be taken to correct the unsafe condition. Both the railroad officials and a labor safetycommittee member feel that the system for identifying and responding to problems in this yard isworking effectively.

101
Figure 33. Railroad yard C job briefing guidelines

102
In addition, if an employee feels uncomfortable reporting an unsafe condition directly to acompany official, they may go through a formalized structure set up by the BLE. Any employeecan complete an unsafe condition report and turn it in to a “captain” who then reports it to thesafety committee. The report also gets moved up the chain of command within the BLE so thatif, at the local level, the unsafe condition report is not addressed, BLE officials notify thosehigher up within the company. In a worst case scenario, a BLE General Chairman will notify thecompany’s Chief Operating Officer. The UTU has a similar procedure for its members.According to a local union representative who is a safety committee member, it does not matterhow the unsafe condition is reported, as long as it is reported, so that they can correct thesituation. Reporting unsafe conditions was described as “open door” since everyone talks toeveryone else. During the training period, employees at this facility are instructed on the variousvenues for reporting an unsafe condition.
Another railroad is currently evaluating a process for reporting equipment problems. Thissystem is operational at two yards. Under this system problems are recorded on a log, along withthe date and time. Everyday someone from the engineering department reviews the log, correctsthe problem, and signs off when the problem has been fixed. Management feels that this systemhas been successful.
One yard manager reported that even though the railroad makes numerous communicationchannels available to employees, occasionally an employee might choose to call the FRA ratherthan work with railroad management to resolve an unsafe condition.
There is also a system in place at some of the railroads that were visited that offers leniency to anemployee who reports unfit-for-duty. The system, called Operation Redblock, is a union-developed, company-adopted program in which an employee who reports to work under theinfluence of drugs or alcohol can take a leave of absence without discipline from the railroad forthe first incident. The individual must then participate in a rehabilitation program beforereturning to work.
6.4 Safety Programs, Incentives and Awards
Railroad managers in each of the four yards all expressed the opinion that “safety is an attitude”that must be promoted, but each facility or railroad has implemented different programs to elicitsafe work behaviors. Every yard has a daily safety briefing. Beyond this, the programs differ.One railroad established an efficiency testing procedure called, STOP, “Safety, Training, andObservation Program.” Under the STOP program, if a railroad official observes someoneperforming an unsafe act, s/he intervenes immediately to stop the unsafe act, and instructs theemployee on the proper procedure. If a person is observed committing multiple errors over time,that individual is called in for additional focused coaching.
Another yard implemented a behaviorally-based safety program to reduce the number ofpersonal injuries in the yard. The idea behind the program, as well as that of behaviorally-basedsafety programs in general, is that an injury or incident is the result of an individual carrying outunsafe behaviors. Thus, behavioral-based programs emphasize and encourage positive

103
behaviors. The goal of the program is to make safe behaviors a habit through the use of1) positive feedback to reinforce safe behaviors and 2) immediate intervention to correct unsafebehaviors. The program is peer-based. Labor and management convene to identify safebehaviors that they want to increase and then identify a target number of the safe behaviors thatwill indicate when their goals have been met. Then, through peer-based observation,reinforcement and correction, the program is enacted. The number of safe behaviors is recordedover time and compared to baseline figures. When the number of safe behaviors reaches thetarget, they are successful. Small incentives such as coffee and donuts, coffee mugs, and freelunches were used to reward safe behaviors. The behaviorally-based safety program at this yardwas designed for the railroad by an outside consulting company and has been implementedsystem-wide. Railroad officials felt that the program had been successful so far, probably due toits novelty, but felt that the challenge would be in maintaining the high number of safe behaviorsafter the program had been in operation a year or two.
Two of the four railroad yards currently have safety incentive programs. One railroad has anindividually-based, quarterly and annual safety recognition program designed to recognize thosewho did not have a reportable injury. Such items as engraved cups and specially made miniaturemodel railroad cars have been used in the past as quarterly tokens of appreciation to those whowere injury-free. At the end of the year, those who remained injury-free would receive a pitcherto go with the cups, or a track set to go with the miniature model railroad cars. Officials felt thatthese awards were very successful. Recently this railroad supplanted the gifts in the incentiveprogram with a cash system based on safe behavior and discipline experience of the individual.Award is based on long term individual performance, to link individual effort with individualreward.
A second railroad has a similar program with quarterly individual-based and district-basedmonetary incentives. To receive the individual incentive, an employee has to have no reportableinjuries in the last quarter (a “zero hero”). To receive the district incentive, the number ofreported injuries within the district had to be below a certain number. The target number ofinjuries each year is based on a 50 percent reduction in the number of injuries from the yearbefore. Thus, if there were 10 injuries in 1999, the target for 2000 would be five injuries.Railroad management has a similar incentive program.
The remaining two railroads do not have safety incentive programs. Management at one facilityfelt that some incentive program might be effective in reducing injuries while at the other sitemanagement did not feel that such a program would be effective.
One railroad reported conducting a raffle for all employees who had been injury-free. However,railroad officials said that the raffle was not particularly popular with the employees since thosewho did not win the prize resented not receiving an award, and the program was not repeated.

104
6.5 Problem Identification and Resolution
Railroad managers at each site were asked to identify the factors that they felt contributed toinjuries. The responses fell into three categories—railroad facilities, employee behavior andweather—and are presented in Table 42.
There was not a consistent opinion among managers at the four facilities as to whether or notgetting on and off moving equipment is a contributor to yard injuries. Management at one yardthat permits the practice felt it can be done safely while the others supported their railroad’spolicy prohibiting the practice.
When asked to identify factors that might help to reduce yard injuries, yard managers mentioneda number of changes that either reduced injuries to their present levels or show promise forfuture decreases. These factors centered around railroad facilities and equipment, and employeeactivities and procedures, and are presented in Table 43.
Table 42. Factors contributing to injuries in railroad yards
Railroad Facilities andEquipment • Close clearances between tracks
• Debris in the yard• Holes in the yard• Improper ballast• Inadequate lighting
Employee Behavior• Complacency/lack of awareness of crews• Complacency of first-line supervisors• Poor work habits/improperly executed job steps• Lack of coordination between crew members• Fatigue• Overconfidence of inexperienced workers• Lack of self-discipline to maintain mental awareness• Noncompliance with rules• Distractions in the workplace• Lack of a “sixth” sense to notice when something is not right, and
then to stop, evaluate and proceed• Physical dexterity
Weather• Inclement weather

105
Managers at one yard felt that the condition of their yard, characterized by a lack of conditionsthat pose safety risks, undoubtedly contributed to their low level of both injuries and claims.They also felt that self-policing by the employees, a feeling of employee ownership of safety anda follow-up program with injured workers to get them back to work all played a role inpreventing injuries.
Separately, management at all four facilities expressed the opinion that implementing restricted,or light, duty for yard crafts is difficult for several reasons. First, the job itself is not conducive
Table 43. Factors that might help reduce railroad yard injuries
Railroad Facilities andEquipment
• Cleaning up the yard. Officials at one facility noted that theirrailroad recently made a substantial investment to clean up theentire property and make capital improvements
• Use of ergonomic (see Figure 34 for an example) and push buttonswitch stands
• Use of radio communications in lieu of hand signals• Use of radio chest packs to facilitate radio use among crew
members• Use of vehicles to haul and support heavy materials that
employees formerly had to haul or support themselves. This wasan especially noteworthy improvement in the Engineeringdepartment
• Distribution of smaller “walking” stone on switch leads instead ofthe larger ballast rock
• Re-design of an air hose component to incorporate a valve thatemployees can use to determine if the hose is still “live” beforemanipulating or adjusting it
Employee Activities andProcedures
• Improved training, including increased structure and more timededicated to instruction and learning
• Increased use of personal protective equipment (PPE) such aseyeglasses, ear plugs, and boots
• Increased proficiency testing and added emphasis on behavioralobservation
• Daily job briefings to increase employees’ attention to jobresponsibilities and thus reduce complacency
• Three-step protection to prevent the accidental movement of a trainanytime a person is fouling equipment
• Executive management’s decision to come out to the yard and ridethe rails during non-ideal times (e.g., winter), ask safety-relatedquestions, and provide direct answers to employees
• Peer outreach through Operation Redblock• Introduction of a physical conditioning program prior to the start
of daily work

106
to restricted duty due to its labor-intensive nature. It is difficult for an injured conductor orlocomotive engineer to work their regular job unless they are completely healthy. An option isto have the injured employee perform other, less labor-intense duties, such as administrativeduties. However, often these types of work cut across craft lines and in fact, may violate laboragreements. This option, therefore, may be unacceptable to employees.
When asked about their views on the use of remote control locomotives, railroad officials feltthat there were too many unanswered questions with respect to liability, user acceptance, andFRA acceptance to make remote controlled locomotives a realistic candidate improvement toyard safety.
Figure 34. Example of an ergonomic switch stand

107
One safety officer felt that two of the most successful methods of reducing injuries at theirrailroad have been 1) the prohibition on getting on and off of moving equipment, and 2) the useof three-point protection when working around trains.
There was unanimous agreement among managers at all four facilities that the primary challengeto further reducing injuries in the yard is keeping the employee focused on the job andcontinuously alert to safety risks. According to these managers, the employee’s attitude is key.With young workers this means discouraging overconfidence, and with older experiencedworkers this means combating complacency.
Railroad yard managers identified a number of additional challenges to further reducing injuriesin yards. These include:
• Compliance with the operating and safety rules.
• Getting that small remaining percentage of employees to buy in on safety practices andprocedures.
• Increasing communication between employees and front-line managers and supervisors.
• Increased use of personal protective equipment (PPE).
6.6 Regulatory Issues
Railroad officials were asked for their opinions with respect to the FRA’s role in promotingsafety and the relationship of FELA to the work environment. A variety of opinions was offeredon each topic, and each is presented below.
6.6.1 FRA’s Role in Promoting Safety in Railroad Yards
Officials at one yard meet monthly with senior FRA regional officials as part of a casualtyreduction effort. This regular meeting has been helpful in keeping both groups abreast of rapidchanges in regulation, operating practices and technology. Generally, during the joint FRA/railroad meeting, outcome ratios or metrics are avoided, focusing instead on process and follow-up. FRA participation in these meetings has also encouraged the sharing of best practices.
At another facility, management noted that FRA on-property safety audits were helpful.Railroad officials reported that sometimes FRA inspectors find problems that railroad personnelhave overlooked. It was also felt that FRA inspectors make valuable suggestions on methods toresolve specific problems. However, management at this railroad pointed out that routine“paper” audits, which require railroad personnel to prepare extensive documentation for FRAinspectors rather than perform their normal job duties, were not seen as beneficial to the railroad.
Officials at another location felt that the FRA sometimes overreacts to situations, typically inresponse to big events such as a train collision. As a result, officials felt, often a regulation is

108
changed or added before the need for the new regulation, or its impact, is fully assessed. Twoexamples were offered: communication between dispatcher and crew when conveying verbalmovement authorities, and the requirement to use End-of-Train (EOT) devices (viewed asunnecessary). The feeling of officials at this yard was that, in general, the railroads are beingover-regulated.
Officials noted that many of the FRA inspectors come from the ranks of labor, and thus areperhaps overly sympathetic to labor’s concerns. Officials also noted that the FRA enforces rules,but holds the railroad, not the employees, accountable. According to one official, employeesshould also be held accountable.
6.6.2 FELA and the Railroad Yard Work Environment
Railroad officials expressed a variety of opinions regarding FELA’s relationship to a safe workenvironment. Some felt that FELA is an economic, not a safety, issue and if FELA werereplaced with a no-fault workers’ compensation system, the only change would be in how claimsare handled and compensated. In other words, it would not affect the number of reported injuriesin yards. Other railroad officials felt that FELA has implications for a safe and harmonious workenvironment. One individual felt that changing from FELA to a no-fault system would changethe employee’s motivation and result in less time off following an injury. Others felt that FELAleads to adversarial relationships between labor and management and that without FELA, bothworkers and management would be more likely to openly discuss safety-related issues and workcooperatively.
6.7 Discussion
Based on the four site visits, a number of strategies were identified that appear to foster workersafety in yards. These strategies are summarized and presented below by category.
• Training
- CBT can be an effective method for rules training. However, a forum for employees toshare information and experiences should be provided.
- Local community colleges can be a training resource for initial training for yard train andengine crews. However, if this training is primarily classroom-based, the railroad mustprovide complementary field trips and hands-on training.
- The most effective OJT mentors are those who are selected because of their desire totrain others and their skill in teaching others.
• Communications
- Railroads offer a variety of ways for employees to report unsafe conditions. Individualpreferences determine which method an employee will exercise.

109
- Behavior-based safety programs may have potential to foster employee awareness of safework practices. However, based on the limited number of sites examined, and railroad-specific issues such as labor contracts, it is premature to endorse this concept withoutfurther study.
• Equipment and Facilities
- Ergonomic and push button switch stands, use of radio communication in place of handsignals, use of “walking” stone on switch leads, and a clean work environment can allhelp to reduce injuries in railroad yards.
• Employee Performance
- Each employee must feel ownership of safety in the yard and must take responsibility forhis or her safe work practices. Improved training, emphasis on behavioral observation,and daily job briefings are methods used by the four sites to keep employees focused onsafe work practices. Assessing the efficacy of these programs was not a part of thisstudy.
110
7. FOCUS GROUP INTERVIEWS WITH RAILROAD LABOR
Focus group interviews with railroad yard workers provided a forum to gather information aboutworker perceptions of the yard environment and to solicit ideas, from the worker’s perspective,as to how safety can be improved in railroad yards. These structured group meetings alsoprovided a forum to obtain feedback on two concepts for future data collection–a supplementalanonymous injury survey and a third-party safety reporting system. The following sectionsdescribe the procedures used to conduct the focus group interviews, a profile of the participants,and the information gathered.
7.1 Procedures
St. Louis, MO, Houston, TX, and Chicago, IL were selected as focus group interview sites dueto the large number of railroad yard workers available in each location. St. Louis is a major railhub connecting trains headed in all points of direction; Chicago is the country’s most active railhub; and Houston is a major intermodal port terminal serving the Gulf of Mexico as well as amajor interchange point for east-west rail traffic.
Participants were recruited from the three general crafts that make up the majority of yardworkers: trainmen (switchmen and conductors/foremen), engineers, and carmen. An attemptwas made to have the make up of each group be representative of the mix of crafts working in ayard at any time. That is, trainmen were most represented, followed by engineers, and thencarmen. The unions representing these crafts, the United Transportation Union (UTU), theBrotherhood of Locomotive Engineers (BLE) and the Brotherhood Railway Carmen Division ofthe Transportation Communication Union (TCU), assisted in identifying candidate participants.
The following criteria were used to identify candidate participants:
1. The candidate must be a trainman, engineer or carman.
2. The candidate must currently work in a yard.
3. The candidate must be interested in sharing his or her perceptions and opinions regardingworking in and around the yard environment.
A total of 11 focus groups were conducted. Three to four topics were discussed in each location,and 11 topics were addressed (Table 44 lists the topics addressed at each location.) Each focusgroup interview lasted 1 1/2 hours and participants were compensated for their participation.Eight focus groups were held with experienced yard workers, and three focus groups were held

111
exclusively with novice workers, that is, individuals who had been working in their present craftless than three years. The reason for conducting three focus groups exclusively with noviceworkers was twofold. The initial training experience of new hires was expected to differ fromthat of the veteran workers, and, in addition, less experienced workers were more likely to beaffected by irregular work schedules.
7.2 Participant Profile
A total of 80 people participated in the 11 focus group interviews. Each group session includedrepresentatives from the three crafts. Figure 35 presents the distribution of participants by craft.
Over half of the participants (n=48) were members of the UTU. The remainder were splitbetween the BLE (n=17) and TCU (n=15).
Participants’ experience in their present craft ranged from a median of 1.1 years for novicecarmen to 27 years for experienced trainmen. (See Figure 36).
7.3 Focus Group Findings
The following sections summarize the information gathered from the 11 focus groups, and areorganized and presented by topic. Appendix F contains the original set of focus group questions.Where responses from the experienced and novice workers were similar or overlapped, they arereported together; where there are differences in perception and/or opinion between theexperienced and novice workers, responses are reported separately.
Table 44. Focus group location, worker experience and topics discussed
LocationNo. of Focus
GroupsWorker
Experience Topics Discussed
St. Louis 2 Experienced • Factors contributing to yard injuries• Overall safety climate• Supplemental anonymous injury survey
Houston 3 Experienced • Injury reporting and follow-up process• Safety incentives and initiatives
Chicago 3 Experienced • Reporting unsafe conditions• Third-party safety reporting system• Safety rules and procedures• Training on new rules, procedures and
equipment• Work schedules and overtime
Houston 3 Novice • Initial training• Overall safety climate• Injury reporting and follow-up process• Work schedules and overtime
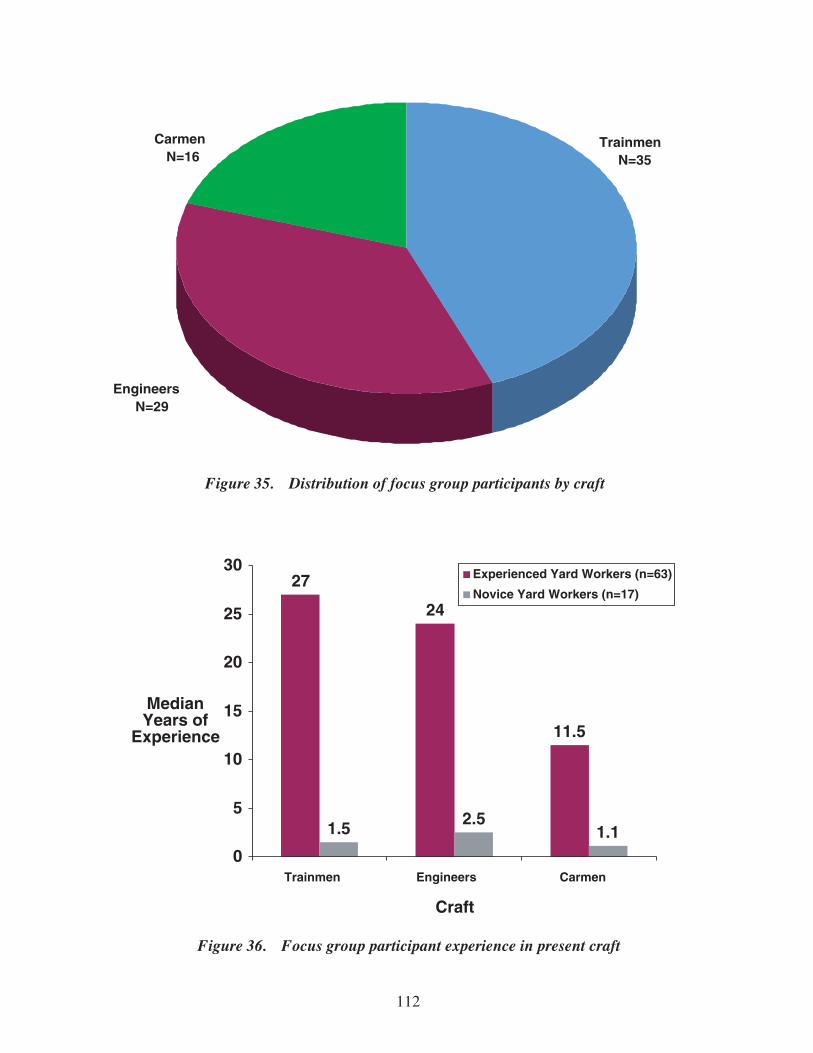
112
Figure 35. Distribution of focus group participants by craft
Figure 36. Focus group participant experience in present craft
EngineersN=29
CarmenN=16
TrainmenN=35
534-FRA-00175-40
27
24
11.5
1.5 2.51.1
0
5
10
15
20
25
30
Trainmen Engineers Carmen
Craft
MedianYears of
Experience
Experienced Yard Workers (n=63)
Novice Yard Workers (n=17)
534-FRA-00175-39

113
7.3.1 Factors Contributing to Yard Injuries
Participants identified and discussed a number of factors that they felt contributed to personalinjuries in railroad yards. The factors centered around two main themes: 1) railroad facilities,such as poorly maintained equipment, debris in the yard, and inadequate radio channels; and2) railroad policies and procedures, such as training, operating rules, and work schedules. Eachof the factors is briefly discussed below.
• Railroad Facilities
- Poorly maintained equipment, such as locomotive seats, locomotive windows that do notopen, sticky switches, problematic pin lifters, defective hand brake handles, and engineoil on the steps, catwalk, and windows of locomotives. Participants felt that aninadequate number of maintenance personnel and budgetary pressure not to repair theequipment may have contributed to this problem.
- Inadequate lighting. Participants noted that some yards did not have overhead lights fornighttime work, while lighting systems in other yards were either inadequate or producedglare. In general, however, any overhead yard lighting was welcome.
- Debris in the yard. Debris around the yard, such as scrap or piping that fell out of agondola car, was perceived as a problem, particularly at night when it was more difficultto see the debris.
- Inadequate radio channels/poor radio quality. Participants felt that there were too fewradio channels in use for the number of people using radios in the yards, and the qualityof the radios was also extremely poor. Participants felt that use of the same radio channelby multiple crews resulted in interference, disrupted and repeated broadcasts, confusion,and miscommunication. Participants complained of getting “cut out” because there is somuch “flak” on the radio, or having to repeat instructions to a fellow crew member.
- Use of mainline ballast in the yard. Some participants found walking on mainline, 3 in.ballast rock placed along the tow paths in some yards to be difficult and uncomfortable.Use of smaller, 3/4 in. rock around the tow path was suggested because the smaller rockis easier and more comfortable to walk on.
- Inadequate clearance between tracks. In some yards, tracks were perceived to be placedso close together that an individual had to turn sideways to walk between the two tracks.Figure 37 provides an example of a track configuration with close clearance.
• Railroad Policies and Procedures
- Rules related to getting off moving equipment. Some participants felt strongly that theirrailroads’ prohibition on getting off moving equipment has resulted in a more dangeroussituation because the energy resulting from the slack action of the cars is transferred to

114
the trainman. In addition, participants felt that it is important to know how to get offmoving equipment in case of an imminent derailment. Participants felt that railroads aredoing a disservice to new employees if they do not teach employees how to get off ofmoving equipment.
Some railroads’ rules permit dismounting moving equipment by setting down the trailingleg first. Several participants found this practice more difficult and awkward than usingthe leading leg. Participants noted that they had been setting down their leading leg firstwhen getting off moving equipment for their entire career.
Figure 37. Example of close clearance between railroad tracksin a railroad yard

115
- Inadequately prepared new co-workers. The prevalent feeling was that new trainmenand engineers are given work responsibilities before they have mastered the skills towork safely. According to one participant, “You’re throwing these new people in here sofast...(that) they don’t have their feet on the ground”. Several participants also expressedconcern that trainmen are promoted too quickly. Participants felt that this resulted in anincrease in inexperienced trainmen and engineers, a situation that participants feltjeopardizes the safety of everyone working around them.
- Inadequate training procedures. Some of the training methods used by railroads to trainemployees on new procedures were perceived by participants as inadequate and aimed atprotecting the railroad from litigation rather than on training employees. For example,one participant reported that his railroad mailed an instructional videotape to eachemployee along with directions to view the videotape and sign and return a formacknowledging that he had viewed the tape. The employee felt that this approach wasdesigned to protect the railroad from future litigation rather than train the employee.
- Harassment. Participants reported that frequent harassment by supervisors wasproblematic and distracting.
- Irregular work schedules and fatigue. Participants were concerned that irregular workschedules and long hours create the potential for a person to make a mistake because heor she is tired. Participants felt that this was an issue especially for people on the extraboard, typically the less experienced and least senior employees, and carmen who are notsubject to Hours of Service regulations. In addition, participants felt that inadequatestaffing results in pressure to accept overtime. Subsection 7.3.9 provides an in-depthdiscussion about the issues related to work schedules and fatigue, and their impact onworking in railroad yards.
7.3.2 Overall Safety Climate
Focus group participants painted a negative picture of the safety climate in railroad yards. Theyfelt that railroads do not care about their employees, do not look out for their employees, andtreat them as expendable. The result, according to focus group participants, is that employeestrust neither management nor its policies and procedures. Participants felt that harassment andintimidation are commonplace, and are used to pressure employees to do their jobs faster, to cutcorners, to not report injuries, and to not repair or report malfunctioning equipment. Theprevalent feeling was that the railroads say one thing, but do another. For example, severalparticipants referred to their railroad’s policy of empowerment, which empowers an employee toturn down an assignment if they feel it is unsafe; however, participants said that if the employeeturns the assignment down, then he or she may be written up for insubordination because he orshe did not follow the supervisor’s order to perform the assignment. However, one participantfelt that his railroad’s empowerment policy was particularly effective at protecting him fromtaking an action that he deemed unsafe.

116
Participants felt that railroads use the operating rules against employees, especially if theemployee gets injured, in order to protect the financial interest of the railroad. Participants feltthat safety incentives, including the Harriman Award, are ineffective and in fact weaken theoverall safety climate. One participant described safety incentives as “subtle intimidation”because incentives encourage underreporting of injuries. Participants said that they do not worksafely because they will earn a free meal, hat or some other material incentive. Instead,participants reported that their motivation is internal and is based on personal safety and well-being.
One group of participants characterized management as having a double standard with respect tosafety. Participants perceived pressure to work quickly and to ignore the need for equipmentrepairs. However, if an employee was injured, it was felt the railroad would place the blame onthe employee for not working safely and that he or she could expect to be fired.
Participants felt that there was an adversarial relationship between workers and management,which caused participants to look out for each other in the yard. Participants said that this self-reliance results in informal teamwork, where co-workers will watch out for other co-workers andcorrect one another if they see someone doing something unsafe. Most participants said that theywould correct a co-worker if s/he were doing something in an unsafe manner. However, a fewparticipants said that, although they might correct a new hire, they would be reluctant to correctan “old head” unless there was a significant safety risk. A few of the participants believed thatmanagement is trying to undermine this spirit of teamwork by training new employees to notlisten to the “old heads,” and to tell management when they see an “old head” doing somethingimproperly.
Participants noted several other contributors to a negative safety climate. These included beingcalled into work on day(s) off; poor equipment and track conditions; the lack of response by therailroad in fixing unsafe conditions after they have been reported; lack of counseling afterwitnessing a traumatic workplace event such as a fatality; complacency of co-workers, poorweather conditions, problems with radio transmissions, excessive speed by carmen on motorizedscooters, and working with someone who is not familiar with the particular area of the yardwhere work must be performed.
While the majority of the participants felt that an overall negative safety climate existed in somerailroad yards, many also noted significant improvements in some safety-related areas in the last15 years. Examples cited included implementation of daily safety meetings and proceduresdesigned to encourage working safely, such as requiring communication among all individualsworking in a particular area.
Some typical comments were:
• “The intimidation is incredible. As long as you do everything and get their cars done, theneverything’s cool, but if you get hurt or break a rule, then it’s not.”

117
• “Empowerment, if it’s used properly, is the greatest tool out there in the work force. But theway they write this empowerment is ‘Okay, you empower yourself not to throw that switch,’but if you refuse to do a job because you feel it’s unsafe, you can be gone forinsubordination.”
• In reference to being told not to “bad order” a car: It “detracts from your attitude towardssafety because not only are you personally being criticized for the work that you think you’redoing that may help out an engineer...but on top of that, you’re being told by a supervisorthat you’re not performing your function in a professional way.”
• “When it suits, the rule book...is what we go by...[unless] it’s more expedient to cut acorner.”
• “The only time safety comes up is when it costs them [railroads] something.”
• “If you go by the rules all the time every single day, they’ll watch you and wait for you tostep out of line and get one rule even halfway sideways, that’s it. It’s over.”
7.3.3 Safety Incentives and Initiatives
Participants were unanimous in feeling that safety incentives, such as gift certificates to thecompany store, free meals, clothing, and coffee mugs play little if any role in encouraging safework practices. Material incentives were seen as a subtle form of intimidation not to reportinjuries; if an employee reports an injury, then he just cost his co-workers their free meal. Mostparticipants preferred to see the money spent on cleaning the yard and making other safetyimprovements. Participants felt that the real incentives are given to managers in the form ofmonetary bonuses, and that this was “upside-down.” It was suggested that railroads share thesebonuses with their employees. Additional suggestions that were made included repairing theyard, separating tracks that are too close together, and spending the money to hire more people.
According to participants, the Harriman Award also plays little, if any, role in motivatingemployees to work safely. The award was seen as a political trophy for the railroads, and theaward’s beneficiaries were the managers whose bonuses are tied to winning the award.
Participants described a number of railroad safety initiatives, including safety days, “switchblitzes,” and yard walk-throughs. All efforts by a railroad to fix equipment were welcome, butobservation and violation-based programs such as safety days, for example, where a trainmastergoes out to the yard and records safety violations, were unwelcome and seen as unproductive.
Participants were also asked their opinions on behaviorally-based safety programs. Participantsfelt that there was no need for such an observation-based program since they already look out foreach other and correct one another out in the yard. They did not see a need to formalize thisapproach, and were concerned that any type of formalized, management-sponsored observationalprogram would turn into a “big snitch” program with those who were observed becoming thefocus of safety investigations.

118
Some typical comments were:
• “They don’t have to pay nobody to work safe.”
• “The best incentive is to be able to go home with everything we came to work with.”
• “The best incentive is to have a safe place to work and know that the people you’re workingwith, they’re not worn out, not worked to death.”
• “Coming home to my family every night or every day after a day’s work. That’s my mainincentive [to work safely].”
• “I’d trade it all [the incentives] for legitimate safety concerns. Come out here and oil someswitches. Put out small rock to walk on.”
• “Any incentive program I’ve seen is upside down. Why should that guy sitting up there inthe office be rewarded while we’re out there doing the work moving the freight?”
• “If we meet out safety goals as far as safety goes, then everybody gets a bonus every threemonths. Well, if a guy smashes his thumb, he’s thinking, I don’t want to turn this in becausewe’re gonna lose our incentive and everybody...is gonna hate my guts. [So he] puts histhumb back in his glove and he goes back to work.”
• With respect to a behaviorally-based observation program: “We [already] look out for eachother.”
• “Work goes better if they leave us alone.”
7.3.4 Injury Reporting and Follow-up Process
Two themes emerged from discussions on injury reporting and follow-up process. Focus groupsparticipants felt that:
1. Employees are discouraged from reporting minor injuries.2. The process is designed to place blame on the employee.
Participants reported experiencing harassment and intimidation not to report an injury or whenfilling out an injury report, and thus were reluctant to report minor injuries. Several participantsreported being discouraged by their supervisor from reporting an injury. Some participantsexpressed concern that, if they reported an injury, they would be labeled by their railroad as“accident-prone” and eventually fired. Engineers feared losing their Engineer certification.Novice employees felt that new employees in the derail period would be even less likely to
119
report an injury because they can be fired without cause and without recourse17. Participants feltthat the result of this reluctance to report minor injuries is that frequently employees simply gohome with minor injuries and tend to them on their own time.
Participants also reported that some railroad officials pressured injured employees to make astatement to the railroad immediately after an injury, before receiving medical attention. Theimmediate pressure to make a statement to railroad officials was seen as another form ofharassment, particularly since at the time, the injured employee is not in a clear mental state torecount the facts of the injury. The prevalent feeling among participants was that railroadscollect information on the circumstances of the injury to protect their legal position, not todetermine the cause of the injury and fix the problem. Participants felt that railroad managementwas more concerned about determining that the employee was at fault than about the severity ofthe injury and the employee’s well being. Several participants were not comfortable going to acompany doctor because they felt that the doctor favored the railroad, and consequently themedical attention that they would receive would reflect the railroad’s interest rather than their(i.e., the patient’s) interest.
Participants suggested that employees were also reluctant to report an injury for which they werepartly to blame, out of fear that the railroad would try to place all of the blame on the employee.They felt that in such cases, the employee is likely to treat the injury on his or her own time.Participants were dissatisfied with the current system that requires an injured employee to reportan injury within 24 hours. Participants explained that there are some situations when it is notimmediately clear whether the injury will go away (e.g., a strained back). By the time theemployee realizes that the injury is more severe than expected, it is too late to report it. If theemployee tries to report it, participants felt that the railroad will try to fire the employee becausehe or she did not adhere to the railroad’s 24 hours time limit, and thus violated a rule.
Most union contracts require railroads to conduct a formal investigation or hearing beforedisciplining an employee. Participants felt that these investigations or hearings were neitherformal nor impartial. According to participants, the railroad has already made a decision aboutthe injured employee’s discipline before the investigation or hearing begins, regardless of whatthe employee or witnesses say. According to participants, typically railroads cite a host of ruleviolations that are used to blame the employee for the injury. Employees use the investigation orhearing to document their side of the story for later arbitration by a third party. The consensuswas that investigations or hearings do not in any way attempt to identify root causes of theinjury. Separately, a few participants felt that employees who serve on a safety committeereceive preferential treatment with respect to these investigations and disciplinary actionsfollowing an injury or equipment mishap involving that individual, and that this was unfair.
Some railroads offer an injured employee the option of light duty after an injury. Mostparticipants felt that light duty did not benefit the injured employee, but rather was used by the
____________17The “derail” period is a probationary period that lasts for 60 to 90 days following formal training. During this time the traineeworks in the yard, but he or she cannot belong to a union, and consequently has no recourse if he or she is disciplined ordismissed.

120
railroad as a way to show that the employee was not severely injured in the event that theemployee files a claim against the railroad. Some participants felt that light duty jeopardizes anypotential legal settlement for the injured employee by reducing the perceived severity of theinjury.
Some typical comments were:
• “Some of them actually discipline you, fire you, pull you out of service as soon as you’reinjured.”
• “From the beginning of the initial notification of the injury, all attempts are to try tosafeguard the carrier’s legal position and exactly putting the employee at fault, therebyeliminating any possible claims against the carrier.”
• “The attitude is, if you get injured, it’s your fault. You’re guilty until proven innocent.”
• “They don’t harass you. They fire you!”
• “When you get injured, you get more harassment than you can shake a stick at.”
• “In investigations, they’re their own judge and jury.
• “There’s a no-win situation here. They encourage you, if you get injured, to report it. Butthey’re also discouraging you from reporting it. They intimidate you.”
• “I’ve seen people get fired for tripping and getting stitches.”
• “It’s all intimidation...I feel like I am being made an example of [because I suffered an injuryon-the-job and have not been allowed to return to work] in order to intimidate and scare otherswitchmen [from reporting an injury].”
7.3.5 Reporting Unsafe Conditions
Most participants agreed that today, in contrast to earlier times, railroads make greater efforts toidentify and fix unsafe conditions, though the extent of the effort appears to vary by carrier.According to participants, there are a number of ways in which yard workers can report anunsafe working condition. A yard worker may talk to the yardmaster directly; s/he may file anunsafe condition report; or s/he may use the company’s safety hotline to report a problem.
Many participants reported that their railroad also had a labor-management safety committee thatserved in an oversight role to review and follow up on unsafe condition reports to ensure that therepairs are made. Although most participants felt that these safety committees were effective, afew participants expressed concerns. Two specific issues raised were that 1) some individualsused these safety committees as “downtime,” and 2) the individual taking the minutes for the

121
committee could adjust the results to favor the railroad (e.g., to report fewer unsafe conditions ormore unsafe conditions that had been fixed).
Most participants felt it was also important to create a paper trail to hold the railroadsaccountable for the repair. Separately, some participants notified a union official whenever anunsafe condition was reported to the railroad.
Participants were of the opinion that repair of an unsafe condition typically depended on 1) thecost of the repair; 2) the ease of the repair; 3) the severity of the unsafe condition; and 4) whetherthe condition delayed trains. Participants expressed frustration with the railroads’ decisions notto make certain repairs because the costs of the repairs were not in the budget. Separately, oneparticipant explained that some employees may be reluctant to fill out an unsafe condition reportbecause if the employee suffers an injury while working in the area where the problem exists,they fear that the railroad will say, “It’s your fault because you knew the problem was there.”
Some typical comments were:
• “[It] Depends on the cost factor whether it gets fixed or not.”• “It always comes down to the carrier’s budget.”
7.3.6 Safety Rules and Procedures
Most participants felt that some safety rules did create a safer work place, while others madethings worse (e.g., prohibition on getting off moving equipment), or were there to protect thecarrier rather than the employee. Participants reported experiencing pressure to cut corners tocomplete a job. At the same time they noted a double standard where railroad managementtypically looks the other way or encourages an employee to cut a corner unless the employeesuffers an injury, and then all of the rules are used against the employee in a formal investigationto place blame for the injury on the employee. Participants in the experienced worker groupssaid that the pressure to cut corners was especially prevalent with the younger employees.However, comments and experiences reported by the novice workers did not indicate that adifference existed in the way they are treated compared to the more experienced workers.
Participants expressed concerns over several specific safety procedures. One concern was thatthere is no protection for a trainman working in a track while there is switching taking place onboth ends of the track, yet a carman working under a similar situation would be protected by blueflag rules. Another concern was the lack of hazmat protection and training. Participants noted,on one railroad, that when servicing local industries that ship hazardous chemicals, railroademployees are not provided with the same personal protective equipment as chemical companyemployees who load and unload the product. Some participants also wanted more informationon the risks that the hazardous materials pose.
Another criticism that participants shared was that, while railroads provide some equipment toassist in doing a job (e.g., use of a “knuckle mate” to assist in coupling cars), they discourage theemployee from using the equipment when it is perceived as slowing down the operation.

122
Several participants also noted that some safety rules were inconsistently applied. For example,some crafts are required to wear hard hats, while other crafts that work in the same area of theyard are not required to wear hard hats.
Some typical comments were:
• “The book of rules is to protect the carrier in all instances.”
• “[Referring to the rules] They’re not written to protect me.”
• “If it’s costing them money or delays, they don’t care whether you live up to the rule or notunless you do something wrong and get in trouble.”
• “If you do everything that the rulebook says, you will shut the place down.”
• “At some point safety gets to be such a hot topic that you lose focus on what you aresupposed to be doing out there.”
• “If you break a couple of rules to get it done, as long as you don’t get hurt that’s cool [tomanagement].”
7.3.7 Initial Training
Initial training was discussed with both novice and experienced workers. Novice workersdiscussed their own training experiences, all of which occurred within the last three years, whilethe experienced workers discussed their perceptions of the effectiveness of current trainingprograms. As a result of the difference in perspectives and experiences, comments from thenovice and experienced workers are presented separately.
7.3.7.1 Novice Workers’ Training Experiences
All novice focus group participants reported receiving some formal training prior to working inthe yard. Training experiences vary by craft and railroad, and sometimes even within therailroad. Based on participant-reported information, descriptions of carman, switchman,conductor, and locomotive engineer training programs are provided below. These are the craftsthat make up a majority of a yard workforce.
Carmen receive one week of classroom-based company safety training and then they go througha three year on-the-job training period under the supervision of an experienced carman, called ajourneyman. During this three-year OJT period, trainees learn all of the different tasks that theymust perform. Depending on the railroad, trainees may work at different facilities to be exposedto the different operating environments and equipment. Trainees always work with anexperienced journeyman during this OJT period. At the end of the three-year period, traineesqualify as carmen. The focus group participants who were carmen reported feeling that thisprogram has adequately prepared them to do their job.

123
Switchmen (also known as brakemen) receive 1 to 3 weeks of formal classroom trainingfollowed by 2 to 4 weeks of OJT. The OJT includes time in the yard and/or road trips. Uponcompletion of the OJT, switchmen work with full responsibilities during a 60 to 90 dayprobationary or “derail” period in which the employee can be terminated without cause at anytime. The trainee’s salary during this probationary period is typically less than the rate that willtake effect at the end of the derail period. After the probationary period, switchmen receive allrights and privileges accorded to the craft, including full pay. In yards, switchmen responsiblefor a train are called foremen. Foremen do not receive any additional training.
Promotion from a switchman or yard foreman to a road conductor entails an additional 2 to5 days of formal classroom training followed by two weeks of familiarization trips. Classroomtraining includes instruction on how to read track bulletins, train movement authorities, and othertrain authority information. Road conductors are qualified to work road jobs (as a roadconductor) and yard jobs (as foremen and switchmen). That is, conductors are not required towork road jobs; in fact, many qualified road conductors continue to work as yard foremen untilthey gain enough seniority to hold a road conductor’s job.
Promotion to locomotive engineer typically follows experience as a road conductor, and can beas soon as six months after being promoted to a conductor. Sometimes the promotion toengineer is mandatory. Engineer trainees, sometimes called firemen, receive 2 to 3 weeks ofclassroom training followed by 4 to 6 months of OJT riding with qualified engineers. Somerailroads also provide their engineers with several weeks of training at a locomotive simulatorfacility. After an individual qualifies as an engineer, s/he may work as an engineer or s/he mayreturn to work as a conductor or foremen. Job placement following qualification depends uponthe workload and staffing levels at the particular railroad.
Carmen were generally satisfied with their initial training experience. In contrast, the majority ofthe T&E participants (switchmen, foremen, conductors, and locomotive engineers) feltoverwhelmed by the volume of material covered during initial classroom training, especiallythose who had no prior knowledge of railroading. They felt that they did not really understandthe nature of the work, and the inherent risks, until they actually worked in the yard. Severalparticipants, both carmen and T&E craftsmen, noted that their railroads effectively used a videoof railroad accidents to convey the risks of the job. Participants indicated that this made a lastingimpression on them, and it also served to effectively weed out several classmates who were notcomfortable with the yard operating environment before they started the job.
All of the participants from the T&E crafts agreed that the OJT portion of their training wascritical to learning their job, but the effectiveness of the OJT experience depended upon the OJTmentor. Aspects of the OJT that participants reported as particularly effective included:
• Being able to ask a lot of questions of the mentor.
• The use of a checklist by the OJT mentor to structure the training.
• Having the opportunity to work with a variety of individuals, each sharing differentknowledge.

124
Problems arise when a mentor does not allow the trainee to carry out tasks or discouragesquestions. In addition, participants reported that many times what is taught in class and what isdone on-the-job differ, for example the use of various hand signals to communicate informationbetween an engineer and a conductor or switchman. Participants also noted regional differencesworking in different yards, e.g., a method used in one yard may not be used in another yard inthe same railroad. In addition, due to staff shortages, in some cases inexperienced (i.e., newlyqualified) employees are mentoring new trainees. Participants felt that this was not onlyineffective but also dangerous. Another problem that was noted was that engineer OJTparticularly focused on how to run a train over the road rather than in the yard, even though thereare differences in braking and train handling between running a train over the road and in theyard. For example, a locomotive engineer operating a train in the yard may have to rely on theuse of the locomotive engineer’s independent brake to slow and stop the train rather than use thetrain’s air brakes. Another problem was that many times trainees are not instructed on thespecific characteristics of a yard (e.g., flat spots along the rail, narrow clearance between tracks,etc.) before working there. Some participants are given a “Zone, Track and Spot” book, whichdescribes some of the physical characteristics of a yard; however, the information may beoutdated. Lastly, several participants complained that they were assigned to work in a locationwhere they had never taken a student trip or had not been trained, and therefore were not at allfamiliar with the location when they started their job.
Participants made several suggestions to improve initial training. They are organized by the typeof training and are presented in Table 45.
Typical comments included:
• “Your training is basically up to you. The railroad is not taking responsibility for yourtraining.”
• “I think they should lengthen the class time, the book work, because that’s where a lot ofguys make a mistake.”
• “Just because that person works for the railroad doesn’t mean that person can train.”
• “They tell you ‘when you get your engineer’s license, you are qualified to train.’”
• “I’ve been here a year and I still don’t know all the paperwork.”
7.3.7.2 Experienced Workers’ Perspectives
The experienced workers comments tended to reflect the experiences reported by the noviceworkers. Participants strongly felt that the current trainman training is inadequate in preparingnew hires to become conductors (or foremen) and switchmen. Participants cited both inadequatepreparation and inadequate apprenticeship as the primary problems.

125
Participants felt that new hires do not receive enough classroom training prior to working in theyard. Participants felt that community college-based conductor training programs were a goodidea in principle, but that the programs need to be more intensive. Participants’ chief criticismwas that the programs do not teach practical skills, and thus, trainees are not adequately preparedto perform work in the yard. Other limitations of the community college programs that wereidentified are their failure to teach railroad vernacular and their limited exposure to a workingyard.
Table 45. Suggestions to improve initial training
Type of training SuggestionSwitchmen Training • Combine classroom training with visits to the yard to gain a
better understanding of what employees are learning in theclassroom. It is easier to understand the nature of a pieceof equipment or a particular train move by actually seeingand experiencing it.
• Incorporate more time in the field while still doing classwork.
• Demonstrate to trainees what NOT to do in the yard.
• Include training on relevant paperwork, e.g., how to read aswitch list.
• Include training on the railroad’s computer systems.Access to paperwork and timecards are through computersystems at some railroads, yet participants reported thatthey were not trained on how to use these systems.
Locomotive Engineer Training • Increase classroom time.
• Teach engineers how to identify defects in locomotives andcars.
• Familiarize engineers with all locomotives that comethrough the yard, not just those used by the railroad.
• If possible, use simulator training.
General Suggestions • Select OJT mentors who want to train new employees; trainthose mentors, and compensate them accordingly. Asuggestion was made to survey recent trainees to identifymentors who were particularly effective during their OJTperiod.
• Use a checklist or other training aid to structure the OJT sothat both the trainee and the mentor can follow the trainee’sperformance and assess his or her abilities.
• Require employees to work in each craft at least two yearsbefore being promoted. This minimum time on job willprovide the employee time to gain sufficient knowledge andexperience that will be used in the job to which they arebeing promoted.

126
A concern that all participants shared was that new switchmen must learn on-the-jobconcurrently with having job responsibilities. Participants noted that in the past, new switchmenworked with larger crews who could watch out for them and help them learn. At the same time,the switchmen had few responsibilities, so they were able to focus on learning the tasks withoutthe burden that comes with job responsibilities. The current practice is for switchmen to qualifyafter a brief training period, sometimes as little as two weeks. These switchmen often work witha smaller crew who are also inexperienced, and they have more responsibilities than in the past.
Participants made several suggestions on ways to improve training. These were to:
• Give trainees more classroom preparation.
• Increase crew sizes and ensure that new hires train with experienced crew members tominimize the trainee’s responsibilities, so that trainees could learn by watching other crewmembers, and without responsibilities for the train.
• Certify trainmen. According to participants, this would require railroads to train switchmenand conductors more thoroughly.
• Require a minimum apprenticeship period of nine months to one year before qualifying as aswitchman.
• Require a conductor to have at least three years of experience before being promoted to anengineer. Participants noted that railroads are promoting conductors to engineers tooquickly, resulting in an inexperienced crew that is responsible for training a new switchmanor conductor.
Some typical comments from these experienced yard workers were:
• “...[Y]ou have a conductor who has eight months on the railroad with a brand new brakemanwho has three weeks on the railroad. We’re just waiting for something to happen.”
• “When I hired on you had five people watching what you were doing. Now you have maybeone and he might be an engineer with two years experience and you have a conductor withfour months experience and you’re going to have a big wreck because they don’t know therules, they don’t know anything yet.”
• “They’re just pushing them out the door too quick.”
• “New people are teaching new people.”
• “They can pass the test but they can’t do the job.”
127
7.3.8 Training on New Rules, Procedures and Equipment
Participants felt that the railroads provide only minimal training on new procedures, rules, andequipment, and that this training was designed more to protect the railroad from potential futurelitigation than to properly inform and instruct the employees.
In addition, modified or new rules are introduced in bulletin orders and special instructions, andthe burden is on the employee to make sure that s/he is cognizant of the latest rules. Participantsalso said that they receive little if any training on new safety procedures such as proper liftingtechniques, and that the railroads do not train enough people on how to use, inspect, and repairall of the equipment used in the yard.
Participants noted several particularly problematic training methods. One method was to sendemployees training material on a new procedure (e.g., using a proper lifting technique), and thento require the employee to sign a form indicating that they have received and reviewed thetraining material. Participants felt that this was insufficient, and said that safety programs thatrequired employees to sign off that they had received training served as a paper trail to protectthe railroad later if an employee suffered an injury. Participants said that the railroad would usethe signed piece of paper as “proof” that the employee had been properly trained, therebyabsolving the railroad from responsibility for the employee’s injury. Participants also felt thatsimply watching a training video was inadequate if the instruction does not have clearapplication to working in a yard, or if there is no question-and-answer period following the videoto allow for clarification.
Separately, participants noted that information on new or proposed changes to procedures, rulesor equipment may be posted on a railroad-run bulletin board in the crew facility, but theinformation often comes indirectly from the union or informal discussion among employees.
One suggestion to improve training was to implement periodic refresher “training days” tomaintain procedural skills for all yard workers.
A typical comment was: “If you watch the movie and you get hurt, then you’re at fault” becauseyou supposedly have been trained.
7.3.9 Work Schedules and Overtime
Seniority gives the employee control over his or her work schedule. Because of their seniority,most participants who were experienced workers were able to choose a schedule they wanted.Some participants worked steady shifts while others rotated to accommodate their personalneeds. Because the more experienced workers had a significant amount of seniority, they wereable to choose their own schedules and therefore fatigue was not much of an issue for them. Themore experienced participants felt that fatigue was a problem with the younger employees,however, particularly those working the extra board. Participants felt that understaffingcontributed to the fatigue of these less senior workers.

128
Work schedule choices for novice T&E workers were more limited. As with the experiencedworkers, both seniority and personal choice play a role in choosing a work schedule. However,the less seniority an individual had, the fewer options that were available. Some participants hadenough seniority to hold a regular schedule but chose to remain on the extra board for a numberof reasons. Their reasons included the opportunity to earn more money, to work a variety ofjobs, and the flexibility to take off days when they wanted. However, working the extra boardwas not easy. Specifically, participants noted that it was hard to manage time away from workand it was difficult to know when to sleep when working on the extra board. Those who preferto work a regular schedule do so because it allows them to plan time with their families.
A technique used by participants on the extra board to aid in determining whether they weregoing to work within the next 24 hours was to call the crew caller ahead of time to find out howmany positions were left to fill and how many employees were ahead of, and behind, them, interms of seniority. Given this information, participants could make an educated guess as towhether they would be working that day or evening and therefore could plan their free timeaccordingly.
The experiences of the carmen differ somewhat from the T&E crafts with regard to workschedules. Carmen reported typically working a regular work schedule, five days per week,40 hours. A concern shared by the carmen was that they are not covered by Hours of Service.Consequently, at times they have been required to work many hours without rest, especiallywhen working on a “wreck crew” where carmen are called to the scene of a derailment orincident to repair cars at the scene.
The number of hours worked by the novice employees is governed primarily by the amount ofwork in the yard and the current staffing levels. Many described work as a “feast or famine”situation: either there was too much work and too few people to do the work, or there was notenough work and too many people to fill the positions (i.e., too many people on the extra board,and the extra board was not guaranteed, resulting in less than five days of work in a week).However, when there was a lot of work, participants reported difficulty in being able to take aday off. In fact, a majority of participants reported feeling pressure from their railroads at onetime or another to work on their day(s) off, particularly when traffic was heavy in the yard.
Some participants liked working overtime, while other participants, primarily the moreexperienced workers, were interested only in working their regular hours. Most novice workerparticipants wanted to work at least some overtime because of the money. Some preferred toextend a regular 8 hour shift to 12 hours.18 Others preferred to work an additional shift on a daynot normally worked. Doing overtime by “doubling out,” that is, working 8 hours, having thenext 8 hours off, and then working another 8 hour shift within the same 24 hour period, was notdesirable, although some were willing to do it occasionally for the extra money.19 Participantsnoted being particularly fatigued when working this schedule; however, participants noted that if
____________18Some labor contracts stipulate that daily overtime will be paid for any work over 8 hr.19This schedule is permitted under current Hours of Service laws, 49 CFR 228.
129
they turned down the second 8 hour shift, it was possible that the crew caller would pass themover for preferred overtime positions later. In general participants resented being coerced towork excessive hours when there is a lot of work in the yard but not enough staff.
Most participants indicated that taking a personal or sick day was extremely difficult. Severalparticipants reported being harassed at one time or another when they tried to take a day off forpersonal reasons or because they were sick. However, participants noted that union officialscould take a day off for union business with no problem.
While most participants understood the nature of working on a railroad, and have learned how towork with the scheduling and crew calling system, they see room for improvements in crewmanagement. One participant expressed concern that it is only after a string of fatalities thatrailroads improve a work scheduling situation, and usually because a regulatory agency hasintervened. Participants offered the following suggestions to alleviate the current workscheduling problems:
• Give employees the choice to not “double out” (i.e., after working 8 hours and having 8 off,have the right to turn down the next 8 hours) without repercussions such as being passed overfor assignment at a later date.
• Have the option to work four or five 10 to 12 hour days per work week.
• Limit the weekly maximum number of work hours to 60.
• Convert some 8 hour jobs to 12 hours, thus enabling those who want the overtime to take it,and alleviating the need for people to work on their assigned days off.
• Have a minimum lead call time of 2 hours for all crafts.
• Offer an optional additional rest period for those on the extra board.
• For work schedules that involve working both days and nights, work the nights first, then thedays.
• Have a guaranteed extra board for all crafts. (Some railroads only have a guaranteed boardfor engineers.)
• Hire more people.
• Enable employees to take a personal or sick day without being questioned, challenged, orharassed by the crew caller.
• Reduce the number of extra board jobs in favor of more regular jobs.

130
Some typical comments were:
• “Seniority prevails.”
• “They’d rather take the chance that you’ll kill somebody than let you off.”
• In reference to a crew caller’s attitude toward an individual who wants to take a sick day: “Ifyou can make it to the phone, you can make it to work.”
• “Nothing gets done until something [bad] happens.”
• “You gotta get it [OT] when you can.”
7.3.10 Supplemental Anonymous Injury Survey
Participants were asked for their opinions regarding an anonymous system in which an injuredemployee could complete a survey that contained information about their injury and send it toeither the FRA or a third party. All of the information would be anonymous. Such a systemwould provide the FRA with additional insight into the cause of yard injuries. Currently, if aninjury meets certain reporting criteria established by the FRA, a railroad is required to report tothe FRA, on a monthly basis, certain information about the injury (e.g., location of the injury,type of injury, number of days away, etc.). All injury information that the FRA receives, thus,currently comes from railroad officials20.
Participants felt there is a need for employees to report the circumstances involved with aninjury, but they had some reservations about the anonymous survey. Participants did not feel itwould be possible to make the reporting completely anonymous, and thus, feared retributionfrom the railroads. This fear permeated participants’ responses. One participant suggested thatan injured individual might be motivated to skew the information s/he reports if s/he thinks it isat all possible that the report will be used against the employee. One participant suggested that ifan employee contributed at all to the injury, they would be unlikely to say what they were doingbecause they would be concerned that this information would be used against them later in aninvestigation.
Because the survey is not a prescribed form to complete as part of a railroad’s injury reportingprocess, and because only those with a vested interest in the injury are supposed to be privy toinformation about an injury if it is litigated, participants noted that injured employees would bereluctant to complete the survey out of fear that the railroad would seek retribution on theemployee for sharing injury-related information with an uninvolved third-party.
____________20This is different than if an employee is cited as having contributed to a train accident, in which case that individual must benotified by the employing railroad that he or she has been cited in the accident and allowed to provide his or her own account ofthe accident to the FRA via Form FRA F 6180.78.

131
Participant responses suggested that the only feasible way to distribute the forms is through theunions. Further, confidentiality is absolutely necessary to obtain a high response rate. However,some participants doubted that the system could be truly anonymous and protect the identity ofthe individual. Participants anticipated that railroads would somehow obtain a copy of thecompleted injury survey and the employee would be harassed as a consequence. Overall,participants expressed reservations, even if legal protection from use in litigation were provided.
Some comments included:
• “I think it might be received well because it gives the employee a chance to get his side ofthe story down, which may not necessarily be reflected in the paperwork filled out bywhoever fills out the paperwork.”
• “It’s better than hearing half the story.”
• “I’d be scared to death of writing anything down.”
• “No way! If the railroads ever got hold of it, they’d use it against you every way they can!”
• “You can say anonymous, but no one believes in anonymous these days.”
7.3.11 Third-Party Safety Reporting System
Participants were asked their opinions on a system for anonymously reporting unsafe workingconditions, near misses and other safety-related problems to a third party for the purpose ofcollecting, collating and disseminating information to increase safety in the railroad industry.The FRA, individual railroads, and manufacturers and suppliers could use this data to identifysafety issues requiring attention. Such a system–the Aviation Safety Reporting System–hasexisted in the aviation world for over 20 years, and the U.S. Coast Guard and the MaritimeAdministration are currently jointly developing a similar system to address marine safety issues.
A few participants felt that such a system would be beneficial since it might allow those who fearfilling out an unsafe condition report and submitting it to their own railroad, to report a problemto a third party. However, the majority of participants felt that the system was unnecessary for anumber of reasons. Participants felt that:
• The FRA and the railroads already know about the problems.• The railroads will not correct the problems even if problems are identified.• The system only encourages one “brother” to rat on another.• The railroads would seek retribution on the person who filed the report.
A few participants noted that some railroads already have a similar type of system in place wherenear-miss information is collected, while a few other participants felt that the current in-housesystem of reporting unsafe conditions was sufficient.

132
7.3.12 FRA Role in Railroad Yard Safety
Although the questions that were the basis for the focus group interviews did not specificallyaddress the FRA, in the course of the discussions participants made a number of noteworthyobservations regarding the FRA’s activities and responsibilities with respect to railroad yardsafety.
Many participants expressed their thanks to the FRA for providing the opportunity to share theirexperiences and suggestions. While all participants hoped that the results of this effort wouldlead to improved safety in the yard, many also expressed skepticism about that occurring.
Participants offered a number of observations and suggestions regarding FRA safety inspections.They acknowledged that there are many conscientious FRA inspectors who make the railroadsadhere to federal safety standards, but there is concern in some locations that the FRA is moreconcerned with railroad management’s interests than those of labor. Based on the experiencesrelated by participants, the FRA’s response to an employee’s complaint of a safety violationappears to vary by location. Sometimes an inspector shows up and in other cases the railroadjust gets a call. Participants questioned the FRA’s practice of giving a railroad advance notice ofa routine safety inspection. They felt this gave the railroad time to cleanup the yard and warneveryone to “do everything according to the rules.” Participants also felt that the FRA needsmore inspectors to effectively conduct inspections and enforce safety standards.
Several participants favored the FRA setting training standards for new trainmen. They felt thatfederal regulation was the best way to correct the current practice in which inadequately preparedindividuals are allowed to work in the yard.
As described earlier, harassment and intimidation are major concerns of all crafts represented inthe focus group interviews. Participants felt that the threat of fines from the FRA does not deterrailroads from harassing and intimidating employees due to the small monetary fine. Participantswere of the opinion that a $1,000 fine is not significant to a multi-billion dollar industry. Inaddition, participants believed that railroads are able to negotiate the amount of the fines with theFRA.
7.4 Discussion
The information gathered from the focus group interviews suggests the following major findingswith regard to worker safety in yards:
• Punitive work environment. Participants felt that some yard environments are characterizedby harassment and intimidation. According to participants, harassment and intimidationresult in: 1) less effective training; 2) underreporting of injuries and unsafe conditions;3) under-maintained equipment and facilities; 4) fatigued employees; and 5) unsafe workpractices (e.g., pressure to rush to get a job done). This animosity appears to hinder sharinginformation and working collaboratively with management to solve problems.

133
• Crew Teamwork. Based on participants’ responses, railroads appear to have a built-inteamwork structure within T&E crews. That is, yard workers, principally switchmen,conductors and engineers, on their own initiative, have developed a strong teamwork ethic.Co-worker cooperation and communication characterize this yard worker teamwork.
• Incentive Programs. Focus group participants were unanimous in their feeling that incentiveprograms with material rewards have little or nothing to do with worker motivation to worksafely.
• Initial Trainman Training. The consensus of focus group participants who had been trainedwithin the past three years was that their training did not adequately prepare them to do thejob. Similarly, experienced workers expressed concerns that new trainmen with whom theywork were not adequately trained.
• Crew Management. Several aspects of current T&E crew management practices were asource of dissatisfaction to participants. These included difficulty in taking a personal or sickday, schedule uncertainty for the extra board, and pressure to work overtime. With respect tothe carmen, because they do not fall under the Hours of Service Act, there was some concernabout working a regular shift after being called during the night to work on a wreck crew.
• FRA’s Role. Participants offered a range of opinions with regard to the FRA’s effectivenessin promoting worker safety.
In addition to these areas, information gleaned from the focus groups have implications forrailroad-based and FRA-based data collection efforts designed to better understand the causes ofinjuries. The major themes in this regard are the following:
• Obstacles to injury data collection. Based on participants’ responses, the currentorganizational climate (e.g., feelings of animosity, intimidation and harassment) appears toinhibit efforts to collect much data regarding the circumstances around an injury. Each sideappears to be motivated to protect itself against possible litigation claims rather than toidentify the root causes of injuries. There is no incentive to share information and cooperatein identifying the root causes of injuries. Based on participant responses, less severe injuriesare going unreported and consequently the statistics maintained by the FRA likely understatethe true frequency and types of injuries occurring in railroads.
• Supplemental anonymous injury survey. A supplemental anonymous injury survey(completed by the injured employee) does not appear to be a solution to collecting additionaldata regarding the circumstances of an injury. This appears to be due in large part to labor’smistrust of management.
• Third-party safety reporting system. A third-party safety reporting system will work only ifall of the stakeholders–the FRA, the railroads and the unions–believe that the safety reportingsystem can provide useful information and each party wants the system to be established.Successful implementation of this type of system requires that all three parties cooperate and

134
participate in its development. Participants noted that 1) at some railroads there are alreadychannels to communicate this information within the railroad, 2) they did not feel that theiranonymity could be assured, and 3) they felt that the FRA and railroads already know whichproblems exist.

135
8. CONCLUSIONS AND RECOMMENDATIONS
This section presents the conclusions from this research and offers recommendations to both therailroad industry and the FRA on options for enhancing and improving railroad yard workersafety.
8.1 Key Findings
This study had four objectives as described in subsection 1.2. The conclusions are describedbelow based on each of the objectives.
Injury and Accident Trends in Railroad Yards
• Railroad yards are the site for half of all railroad accidents. Of these, half are attributed tohuman factor causes. In terms of injuries, roughly a third of all railroad worker injuries thatresulted in one or more lost workdays (days that the employee was not at work or was notable to perform his/her regular job) occur in the yard. Injuries in the yard are also moreserious (as measured by the median number of lost workdays) than those in both the railroadindustry and private industry as a whole.
• Sprains and strains were the most common type of injury; the trunk/torso was the mostfrequently affected body part; and slips, trips and falls were the most common triggeringevent.
• Younger employees (up to 34) suffered a greater percentage of injuries than theirrepresentation in the railroad industry, but the median number of lost workdays that resultedincreased with age.
• Monthly differences in the human factor-attributed train accident and lost workday injuryrates exist, but the reason for these differences remains undetermined. Similarly, diurnaldifferences exist in the number of injuries that occur over the course of a day, but withoutexposure data these differences cannot be adequately explained.
• Ambient temperature also appears to contribute to the likelihood of a human factor-attributedtrain accident, specifically, more accidents occur during extreme temperatures than in mildertemperatures. (Temperature data is not available for injuries, therefore it was not possible toexamine the role of weather in the occurrence of injuries.)

136
• The analysis of personal injury data from a participating railroad revealed some differencesbetween this site and the national industry data. These differences illustrate the variabilitywithin the industry and underscore the importance of each railroad examining the uniqueconditions and injury experiences in each of its yards.
Effect of Work Schedule on Yard Injuries
• This study examined the effect of work schedules on yard injuries through focus groupinterviews and statistical analysis of work schedule data from the participating railroad.According to focus group participants, certain work schedules, such as working two 8 hourshifts within a 24 hour period, are very fatiguing. Limited statistical analysis of workschedule data from the participating railroad did not reveal any statistically significantdifferences between the injured T&E employees and a matched sample of non-injured T&Eemployees. However, this analysis was conducted with a limited sample of data and alimited number of variables. Before fatigue is dismissed as a safety risk factor in railroadyards, the issue of fatigue and work schedules should be studied in more depth and detailthan was possible in this study.
Methods for Collecting Additional Causal Factor Data
• This study examined two methods for collecting additional types of injury and unsafecondition information. One was an anonymous survey to collect information from an injuredemployee and the second method was a third party safety reporting system to report nearmisses and unsafe conditions or acts. Based on feedback from the focus group participants,the anonymous survey most likely will not work because of concerns about privacy. Thethird party safety reporting system may work if the FRA, the railroad industry, and railroadlabor are all committed to developing and implementing it.
Labor and Management Opinions and Experiences Regarding Safety
• Focus groups representing the various yard crafts and structured interviews with railroad yardmanagement provided insight into opinions and experiences regarding yard safety. Bothlabor and management agreed that improvements in facilities and equipment have paid off interms of reduced injuries. According to both labor and management, a variety ofcommunication channels exists for reporting unsafe conditions and labor feels that theseoptions are providing adequate means to report their concerns. However, labor felt that someyard environments still contain harassment and intimidation, a situation they felt limitscollaborative problem solving and meaningful dialog between labor and management.Management at all four sites that were visited were unanimous in their feeling that theemployee must take ownership of safety in the yard and be responsible for his or her ownsafe work practices. This feeling appears to be shared by labor, as evidenced by thecomments of focus group participants with regard to their internal motivation to work safely.
137
8.2 Best Practices for Fostering a Positive Safety Climate and Reducing Injuries
Discussions with railroad officials during the site visits and focus group interviews withrepresentatives of yard crafts highlighted aspects of individual railroad practices that fostered apositive safety climate and reduced the risk of worker injuries. The experiences of both groupsalso suggested additional practices that would be enhancements to the safety climate and wouldlikely prevent injuries. The following suggested best practices, based on the informationgathered during the present study, are organized around major themes.
Equipment and Property
• Provide adequate lighting for night work. A train’s headlamp and a handheld lantern orflashlight are insufficient.
• Remove trash, debris, and other slip and trip hazards from the yard on a regular and frequentbasis.
• Keep equipment such as locomotives well-maintained.
• Install ergonomic switch stands when replacing older manual switches. Railroads that haveinstalled them reported reduced back injuries.
• Use “walking” (i.e., 3/4 in.) stone on switch leads and tow paths.
Training
• Select OJT mentors who are interested in training new hires and are effective trainers.Compensate mentors appropriately.
• Combine classroom and hands-on practice during initial training. For procedural training itis easier to learn the procedure if demonstration and supervised practice immediately followthe classroom session on the topic.
• Formally structure OJT using a checklist or other training aid.
• If using CBT for rules training, provide a forum for employees to share information andexperiences.
• If in-house training resources are limited, explore training programs offered by localcommunity colleges.
Problem Identification and Resolution
• Offer several methods for reporting an unsafe condition. Some individuals will take the timeto fill out a written report, some prefer to have their union representative do the reporting forthem while others may find a telephone message suitable.

138
• One railroad that was visited had recently eliminated routine alcohol and drug testingfollowing an injury. Unless there is a compelling reason to believe that the employee wasunder the influence of drugs or alcohol, this procedure may be unnecessary and mayintimidate an employee. Elimination of the mandatory nature of alcohol and drug testingmay increase or enhance employees' trust.
• An employee-empowered, voluntary, safety committee, with elected representatives fromeach yard craft, can be effective in identifying and resolving safety-related problems.Among other responsibilities, the committee should be sure to track the status of unsafecondition reports that are filed.
Incentives and Awards
• Money is better spent on capital safety improvements (e.g., removing debris from the yard,oiling switches frequently) than on material incentives such as hats and coffee mugs.
Safety Programs
• Job briefings appear to be effective in reinforcing safe work procedures.
• A behavior-based safety program may be effective in re-enforcing safety behaviors, but anysuch program must be accepted by employees.
Interaction with Employees
• Create a supportive work environment. Based on the focus groups, it appears thatharassment and intimidation are present in some railroad yard environments, and may lead tounsafe conditions and situations. According to focus group participants, harassment andintimidation result in: 1) less effective training; 2) underreporting of injuries and unsafeconditions; 3) under-maintained equipment and facilities; 4) fatigued employees; and5) unsafe work practices (e.g., pressure to rush to get a job done). Railroads may want toexamine the extent to which these feelings exist among their workers and take steps to createa more supportive work environment.
• Foster crew teamwork. Based on participants’ responses, railroads appear to have a built-inteamwork structure within T&E crews. That is, yard workers, principally switchmen,conductors and engineers, on their own initiative, have developed a strong teamwork ethic.Co-worker cooperation and communication characterize this yard worker teamwork.Railroads have the opportunity to foster safety and productivity goals through this existingteamwork. Examples of areas where teamwork might foster safety and productivity includeteam training, enhanced communications, and coordination of switching activity.
• Improve crew management. Several aspects of current T&E crew calling practices were asource of dissatisfaction to focus group participants, and could result in potentially unsafe

139
conditions where employees are overworked and fatigued. The practices of other industriescharacterized by shift work and irregular schedules, both within the U.S. and abroad, mightoffer some examples for railroad management to consider. For some specific participantsuggestions for improving crew management, see subsection 7.3.9.
8.3 Recommendations for Improved Analysis of Worker Safety
Enhancements to the FRA’s accident and injury data collection and reporting process andadditional research offer the potential to provide additional insight into strategies and methodsfor improving worker safety in yards. They are discussed in the following two subsections.
8.3.1 Improved Data Collection and Reporting Procedures
The conduct of this research project identified the following potential improvements to the FRAinjury and accident data collection and reporting process:
Develop Better Exposure Measures
• More in-depth analysis of yard injury and accident data requires additional injury andaccident exposure measures. Number of cars switched per month is a candidate exposuremeasure for both injuries and accidents. This metric, in contrast to the currently reported“yard switching miles,” would be a measure of actual operations rather than an estimatedmeasure, which may be the case for number of switching miles.
Develop Better or More Complete Instructions, Definitions and Guidelines
• Provide an option for “rail” as a type of material associated with an injury (see field 5m,“Result,” on FRA Form F 6180.55a). Currently there is no option for reporting theinvolvement of rail. Other roadbed-related codes are available for describing thecircumstances or involvement of other materials in the injury, including “tie,” “switch,” and“ballast.”
• Definition, criteria and guidelines for when and how to properly use the “human factor”injury cause code are lacking. To this end, the FRA might consider including a list of humanfactor codes from which to select if an injury is attributed to a “human factor.” Theavailability of this data will provide a clearer picture of the nature of human factor attributedinjuries, information that is of interest to both the FRA and the industry. Representativesfrom the FRA as well as railroad labor and management could work with experts in humanfactors, human performance and/or ergonomics to develop an appropriate set of codes.
Collect Additional Injury-Related Data
The negative organizational climate that appears to exist in the yard environment likely will limitthe effectiveness of new data collection initiatives that focus on obtaining supplemental

140
information on injuries. Specifically, based on focus group participants’ comments, asupplemental anonymous injury survey is not recommended as a means to collect additional dataregarding the circumstances of an injury. Instead, the FRA could request that railroads provideadditional data in their monthly injury reports (Form FRA F 6180.55a). Railroads already recordsome of this data, but there is no requirement to report it. Other data could be collected andreported by the railroads relatively easily. The FRA can incorporate these additional variablesthrough its four “dummy” blank data expansion fields that exist in the current injury databasestructure. The additional injury-related data include:
• Data on the time the injured employee began his or her shift is a candidate for inclusion inthe injury database. The availability of this information will enable the FRA and others todetermine the role of time-on-task with respect to injuries. Railroads already record the shiftstart time, as required by FRA Form FRA F 6180.98, and therefore reporting this informationshould require minimal effort by the railroads.
• Work experience of the injured employee would prove useful to future safety studies. TheU.S. Department of Labor Mine Safety and Health Administration (MSHA), using itsMSHA Form 7000-1 (see Appendix B for a copy), collects data on an injured employee’s1) experience in his or her current job, 2) experience at his or her current location (mine), and3) total mining experience (see www.msha.gov/FORMS/70001INB.HTM for moreinformation). The FRA may want to consider collecting similar data for injured railroademployees. Specifically, the FRA could collect data on the injured employee’s 1) experienceat his or her current job, 2) experience at his or her current location (e.g., yard) and 3) totalrailroading experience. The availability of this information will enable the FRA and othersto determine the relationship of work experience to incidence of injuries.
• The FRA data collection procedure might incorporate a feature for reporting steps taken bythe railroad to prevent the recurrence of the injury or accident. The MSHA requires mines toprovide this data as part of its routine accident and injury reporting process (see MSHA Form7000-1 in Appendix B). The availability of this information may assist the railroad industryin focusing countermeasure efforts and may provide valuable insight into the industry’s useof various approaches to prevent railroad accidents and injuries.
• Expand injury data collection to include all railroad injuries that require any type of medicalattention. This might provide enhanced insight into the causes of injuries. This researchproject pointed out that it is likely that there are a number of minor injuries that do not meetthe FRA reporting criteria but that could provide additional and meaningful informationregarding injuries in the railroad industry. Further, it is possible that injuries that onlyrequire first aid (which are currently not being reported to the FRA) are very similar to thosethat require medical treatment beyond first aid (which are reported to the FRA). This mayincrease the reliability of the data that is collected on minor injuries, i.e., reportable injuriesthat do not result in any lost or restricted time.

141
• Another option is to revise the reporting criteria to include only injuries that result in lostwork time or restricted duty, thereby focusing analytical efforts on the severe injuries.Currently, the FRA requires that some minor injuries (for example, injuries that requiremedical treatment beyond first aid) be reported. In fact, a majority of the reportable injuriesare LWD injuries. However, it is possible that these non-LWD reported injuries may bemore similar to unreported non-LWD injuries than to the (reported) LWD injuries. If this istrue, the portion of reportable injuries that are non-LWD injuries may be considered part of alarger number of less serious unreported non-LWD injuries. According to Macaskill andDriscoll (1998), in fact, in Australia some states have injury reporting thresholds of five oreven 10 days of lost worktime for some industries. They suggest that such thresholdsemphasize the “more reliable and interpretable data” (p. 10). The trade-off is that data onthe less severe injuries, i.e., the non-LWD injuries, are not collected.
Report Data on Injury Severity
• The FRA should consider reporting data on the severity of railroad injuries in its annualRailroad Safety Statistics report. This data is currently already being collected by the FRA.Several possible severity measures that might be reported include the median number of daysabsent from work (DAFW), which the BLS currently reports; the median number of lostworkdays (LWD; includes both days absent and/or restricted duty); and/or the total numberof DAFWs or LWDs. Injury severity data would complement the injury frequency data thatthe FRA currently reports in its annual Railroad Safety Statistics report, thus providing amore complete picture of railroad safety.
Encourage and Facilitate Industry Adoption of Computer-Based Data Collection and Reporting
• The FRA should consider facilitating railroads’ use of computer-based injury data collection,storage, and reporting systems. Computer-based systems may increase the consistency of thedata across injuries, and may make the reporting process easier for railroads. For example, arailroad claims agent could record information into a ready-made data collection form in ahand-held Personal Digital Assistant (PDA) at the site of the injury or in the field. TheSOFA committee made a similar recommendation that data collection be supported bycomputer systems and suggested that this may reduce the effort required to report an incidentand may increase the accuracy of the data reporting (SOFA, 1999).
Continue to Work Collaboratively with Railroad Management and Labor
• FRA inspectors should continue to work with both railroad labor and management aspartners to foster safe work practices in railroad yards. This can occur through the FRA’s1) continued participation on railroad safety committees, 2) sharing of suggestions for “bestpractices” and “lessons learned,” and 3) sharing of positive experiences from other railroadsthat inspectors have visited.

142
8.3.2 Future Research
The results of this study suggest areas for future research on issues related to worker safety inyards. They are discussed below.
Examine the Relationship of Work Schedules to Injuries
• Although the analyses of work schedule data indicated that there were no significantdifferences between the injured group and a non-injured matched group, fatigue maynevertheless play a role in railroad yard injuries. Existing data sources are not adequate toexplore this issue. Ideally, 30 days of work schedule data for the period prior to the date ofthe injury should be examined. It is therefore recommended that the FRA work with alimited number of railroads21 and, on a trial basis, have them record the work schedules foreach employee injured in a yard and an age, craft and experience-matched control group. Atthe end of an appropriate period, the injury and schedule data can be analyzed to determine ifthere is a relationship between work schedules and injuries in yards. The decision to collectthis type of data on a permanent basis would depend on the results of this evaluation. In fact,the Switching Operations Fatality Analysis (SOFA) committee recently recommended thatone month of work schedule data be routinely collected as part of the investigation processfor each railroad fatality (SOFA, 1999).
Examine the Impact of FELA on Injury Reporting and Data Collection
• FELA’s effect on injury reporting is unclear. Based on the tenets of the at-fault system, it islogical for railroad management and labor to not want to openly exchange injury-relatedinformation, particularly if either party believes that they are partly culpable. To examine therole of FELA on injury reporting in the railroad industry, it is proposed that the FRAcompare the railroad yard environment to a similar heavy equipment/manufacturingenvironment that is unionized (e.g., an auto assembly plant) and that is covered by no-faultworkers compensation. A study can be designed and implemented to compare injuries andthe injury reporting process between the at-fault and no-fault environments.
Examine the Feasibility of Developing a Third-Party Anonymous Safety Reporting System
• The FAA and the Coast Guard/Maritime Administration have established third-party safetyreporting systems to collect and collate data on near misses and other unsafe acts in theirrespective industries. The purpose of these systems is to better understand the precursors andcircumstances surrounding these dangerous incidents and disseminate this information to theindustry and others. The feasibility of developing and implementing a similar third-partynear-miss data collection system for the railroad industry merits serious consideration.
Based on information collected from the focus groups and structured interviews, such asystem will work only if all of the parties involved–the FRA, the railroads and the unions–
____________21Railroads that use electronic record-keeping of T&E employees’ work schedules are recommended.

143
believe that it can provide useful information and each party wants the system to beestablished. The feasibility study should explore under what circumstances the safetyreporting system can be successful, stakeholder expectations from such a system, andprotections/assurances that each party needs. The study should also concentrate onidentifying barriers to the development of such a system and effective strategies to overcomebarriers to implementation of the safety system. The feasibility study should be as inclusiveas possible, and should involve Class I and shortline and regional railroads, all representativeunions, as well as FRA staff members.
Conduct Root Cause and Error Analysis of Railroad Yard Injuries
• Analyses of existing FRA accident and injury data are limited due to the type of data that arecollected and the retrospective nature of the data collection. Several industries are beginningto conduct human factor root cause analyses to identify the chain-of-events that led to theaccident or injury. In fact, in the railroad industry both Railtex and Canadian PacificRailway have adopted this process. The rationale behind this approach is that the immediateact that preceded the accident or injury is simply the last step in a series of events that trulyled to the incident. Root cause analyses focus on “unwinding the tape” to explore what led tothe incident. To do this, individual, environmental, and managerial factors are examined.Each of these factors can be, and often is, at least partly responsible for providing a situationconducive to the incident’s occurrence. Thus, root cause analysis can be viewed as a holisticor systemic evaluation of the circumstances associated with an accident or injury. Rootcause analyses yield complex and rich information regarding the likely causes of an accidentand injury, and therefore may be very useful in formulating countermeasures to prevent therecurrence of similar injuries or accidents in the future.
The first step would be to design a data collection methodology and instruments to collectroot cause information. The methodology would be based on Reason’s (1990) GenericError-Modeling System (GEMS) or a similar error taxonomy. Railroad officers fromparticipating railroads would then be trained on how to conduct a root cause analysis, andgiven the tools to collect root cause information. The process would likely involveinterviewing injured employees, or those involved in a train accident, as the injuries oraccidents occur, using formal structured interviews to probe for root causes and chain-of-event factors. After the participating railroads collect the root cause data, they would submitit to the FRA or a third party to have the data analyzed to identify root causes of the injury oraccident. Root causes will include factors such as what the injured person was doing at thetime of the injury as well as circumstances and environmental issues that set up the situationthat led to the injury or accident. A byproduct of this study will be the development of toolsand methods that railroad industry officials could incorporate with their corporate injury andaccident investigation procedures in the future to help them determine the likely causes ofinjuries and accidents on their respective properties.

144
Conduct an Information Exchange Workshop
• Currently the FRA accident and injury data that are collected provide an answer to thequestion, What types of accidents and injuries occur in the railroad industry? To furtherreduce accidents and injuries in the railroad industry, it is necessary to move beyond askingWhat? to Why do train accidents and injuries occur in the railroad industry? A workshopon the state-of-the-art in injury data collection, analysis and reporting in the railroad industry,as well as other industries and modes of transportation, would provide an ideal forum for theexchange of ideas on collecting data that would lead to a better understanding of accident andinjury causation. Both private industries and governing agencies responsible for injury andaccident data collection should be invited. An emphasis should be placed on lessons learned,both positive and negative. The workshop could include presentations from railroad industryofficials as well as representatives from other modes of transportation who could explaintheir reporting process, their accident and injury investigation procedures, the types of datathat are collected, and how the data are used. A workshop such as this would have an addedbenefit of promoting partnerships among the FRA and railroads, as well as among thevarious DOT administrations.
Explore the Feasibility and Effectiveness of Behavior-Based Safety Programs in the RailroadEnvironment
• Behavior-based safety programs have gained popularity and success in many industriestrying to reduce the number of injuries in the workplace. These types of programs may havepotential to foster employee awareness of safe work practices in railroad yards and therebyreduce injuries; however, feedback from labor representatives and some of the railroad-specific issues, including labor contracts, suggest that the feasibility and potentialeffectiveness of behavior-based safety programs in the railroad industry requires furtherstudy. The FRA should explore the feasibility of a behavior-based safety program, including1) the development of a behavioral model to guide any such safety program, 2) thewillingness of employees to participate, 3) under what circumstances employees wouldparticipate, and 4) the expected benefits and risks.

145
9. REFERENCES
Bureau of Transportation Statistics. (1998). Transportation Statistics Annual Report 1998.(Report No. BTS98-S-01). Washington, DC: U.S. Department of Transportation.
Federal Railroad Administration. (1995). Accident/Incident Bulletin No. 163. Calendar Year1994. Washington, DC: U.S. Department of Transportation.
Federal Railroad Administration. (1997). FRA Guide for Preparing Accident/Incident Reports.(Report No. DOT/FRA/RRS-22). Washington, DC: U.S. Department of Transportation.
Federal Railroad Administration. (1999). Railroad Safety Statistics Annual Report 1998.Washington, DC: U.S. Department of Transportation.
Harnett, D. L. (1982). Statistical Methods, 3rd Edition. Philippines: Addison-Wesley PublishingCompany, Inc.
Heinrich, H. W. (1950). Industrial Accident Prevention (3rd Edition ed.). New York: McGraw-Hill.
Macaskill, P., and Driscoll, T. (1998). National occupational injury statistics: what can the datatell us? Occupational Injury: Risk, Prevention and Intervention. London, UK: Taylor andFrancis.
Minium, E., King, B., and Bear, G. (1993). Statistical Reasoning in Psychology and Education,3rd Edition. New York: John Wiley and Sons, Inc.
Reason, J. (1990). Human Error. Cambridge, UK: Cambridge University Press.
Saphire, D. (1991). FELA and Rail Safety: A Response to Babcock and Oldfather, The Role ofthe Federal Employers’ Liability Act in Railroad Safety. Transportation Law Journal, 19(2),401-413.
Schwartz, V. E., and Mahshigian, L. (1986). The Federal Employers’ Liability Act, a Bane forWorkers, a Bust for Railroads, a Boon for Lawyers. San Diego Law Review, 23:1, 1-15.
Transportation Research Board. (1994). Compensating Injured Railroad Workers Under theFederal Employers’ Liability Act. Washington DC: National Academy Press.

146
U.S. General Accounting Office. (1996). Federal Employers’ Liability Act: Issues Associatedwith Changing How Railroad Work-Related Injuries are Compensated. (Report No. GAO/RCED-96-199). Washington, DC: Author.

147
APPENDIX A
FRA AND OSHA JURISDICTION OVER RAILROAD EMPLOYEE OCCUPATIONALSAFETY AND HEALTH
The FRA has had a longstanding role in assuring that railroads provide safe transportation byrail. This involvement dates back to the late 19th century when the U.S. Congress directed theInterstate Commerce Commission (ICC) to enforce statutory provisions requiring the use ofvarious safety appliances on railroad cars and engines for the protection of employees andtravelers. Since enactment of that legislation, specific statutory authority has been created withrespect to several other aspects of railroad employee safety including locomotive inspectionstandards, reporting and investigation of railroad accidents, the maximum permissible hours ofservice of railroad employees and the transportation of hazardous cargoes. In 1970, Congresspassed the Federal Railroad Safety Act. This legislation extended the ICC authority to the DOTby giving the Secretary of Transportation the ability to exercise broad and general regulatorypowers as deemed necessary in all areas of railroad safety. The Secretary of Transportationdelegated this responsibility to the FRA.
Another piece of landmark legislation, the Occupational Safety and Health (OSH) Act of 1970,created the situation where railroad workers were subject to potential dual regulation by both theSecretary of Labor and the Secretary of Transportation. The OSH Act requires most employersengaged in a business affecting commerce22 to furnish each of their employees with a place ofemployment free from recognized hazards causing or likely to cause death or serious injury.Since passage of this legislation, the Department of Labor, through the Occupational Safety andHealth Administration (OSHA), has developed and promulgated an extensive set of occupationalsafety and health standards. Some standards apply to all employees while others apply only toemployees engaged in certain types of work.
Recognizing that oversight authority for worker safety already existed in other agencies,Congress included a provision (Section 4 (b)(1)) in the OSH Act stating that the provisions of theOSH Act shall not apply to working conditions where another Federal agency exercises statutoryauthority to prescribe or enforce standards or regulations affecting occupational safety or health.In keeping with the policy stated in Section 4(b)(1), and to avoid duplication of efforts in the areaof railroad occupational safety and health, in March 1975 the FRA issued an advance notice ofproposed rulemaking proposing standards in three areas of railroad employee occupationalsafety: 1) means of egress from buildings and structures, 2) general environmental controls and3) fire protection. Subsequently, the FRA issued a notice of proposed rulemaking in July 1975.
____________22There are some exceptions, including public employees, miners and the self-employed, as well as very small businesses.

148
After conducting hearings on the proposed rules and reviewing written comments, the FRAannounced that it was terminating the rulemaking process and did not intend to issue any otheroccupational safety and health standards concerning problems outside of the general area ofrailroad operations.
In March 1975 the FRA Administrator issued a policy statement published in the FederalRegister which stated that “...we believe that the proper role for FRA in the area of occupationalsafety in the immediate future is one that will concentrate our limited resources in addressinghazardous working conditions in those traditional areas of railroad operations in which we havespecial competence.” (CFR Part 221, published in Federal Register, Vol. 43, No. 50, March 14,1978.)
The policy statement continued:
“...FRA has decided to focus its resources and energies for theimmediate future on the safety of railroad operations. As usedherein, ‘railroad operations’ refers to the movement of equipmentover the rails. The term ‘safety’ includes health-related aspects ofrailroad safety to the extent such considerations are integrallyrelated to operational safety hazards or measures taken to abatesuch hazards. The term ‘safety of railroad operations’ then relatesto the conditions and procedures necessary to achieve the safemovement of equipment over the rails.”
The FRA identified three areas where it intends to exercise its expertise: 1) track, roadbed, andassociated devices and structures; 2) equipment, and 3) human factors. These are areas wherethe FRA has specific statutory authority. In addition to the areas mentioned above, the FRAenforces the Department of Transportation’s comprehensive Hazardous Materials Regulationswith respect to the carriage or shipment of hazardous materials by rail.
Since passage of the OSH Act the FRA and OSHA have worked cooperatively to define theareas of railroad occupational safety that are best handled by each agency. Areas where there isjoint but not overlapping responsibility are presented in Table A-1.
In terms of railroad yards, OSHA regulations apply in the following areas:
• Walking-working surfaces in repair facilities, except for inspection pits.
• Means of egress from fixed repair facilities.
• Design of work platforms such as cranes which are mounted on moving equipment.
• Noise exposure in shops.

149
Table A-1. FRA and OSHA jurisdictions for worker safety in railroad operations
Occupational Area FRA Jurisdiction OSHA JurisdictionWalking-WorkingSurfaces
• Design of locomotives and otherrolling stock.
• Movement of rolling stockthrough repair shops; inspectionpits.
• Ladders, platforms and othersurfaces on signal masts, catenarysystems, railroad bridges,turntables, and walkways besidetracks in yards or along rights-of-way.
• Railroad offices, shops andother fixed work places.
Means of Egress • Rolling stock. • Fixed facilities other thanemployee sleeping quarterscovered by the Hours of ServiceAct.
Powered Platforms,Manlifts, and Vehicle-Mounted WorkPlatforms
• Vehicle on which work platform ismounted.
• All work platforms.
Occupational HealthAnd EnvironmentalControl
• Ventilation standards as they applyto locomotive cab or cabooseenvironments, passengerequipment or to operationalsituations in yards or along theright-of-way.
• Noise exposure levels relative tolocomotive cabs and cabooses,retarder noise and other noiseemanating primarily from railroadoperations.
• Noise levels in sleeping quartersfor employees covered by Hoursof Service Act.
• Noise exposure levels in shopareas, office areas and othersettings in which “ industrial”noise emissions predominate orwhere exposure may be limitedwithout the potential disruptionof safe transportation activities.
Hazardous Materials • Transportation of hazardousmaterials by rail.
• Instances where both shipmentand storage or use of hazardousmaterials prior to transport.
Personal ProtectiveEquipment
• Activities unique to rail operations,e.g., coupling/ uncoupling cars.
• In general, OSHA regulationsapply.
Materials Handlingand Storage Storage
• Any equipment used in operatinga railroad.
• Locomotive cranes and other on-track vehicles used formaintenance.
• None. OSHA providesconsultation to FRA as needed.
Machinery and Tools • None • OSHA regulations apply inrailroad shops and other workplaces.

150
• Personal protective equipment that is not unique to the railroad environment (e.g., steel-toedshoes, work gloves, hard hats).
• Hand and power tools, welding, cutting and brazing equipment, electrical equipment.
FRA’s policy closes with the following:
“We believe the policy set forth in this document will assure thateach of the principal Federal agencies charged with theresponsibility for carrying out this program, that is, FRA andOSHA, will concentrate its efforts in those areas in which itpossesses the greatest experience and expertise. In those cases inwhich there may be some question as to which is the primaryregulatory agency, cooperative efforts between the two agenciesshould avoid the creation of regulatory gaps on the one hand, orunnecessary duplication on the other. At any time that a hazardousworking condition impacts upon the overall safety of railroadoperations, FRA will take the initiative in developing a properregulatory response.”
Over the years since passage of the OSH Act, the FRA and OSHA have worked cooperatively toassure the occupational safety and health of railroad workers in accordance with the stated FRApolicy. In addition, since railroads are required to report occupational injuries and illnesses tothe FRA and not OSHA, the FRA provides this data to OSHA.

151
APPENDIX B
FRA AND MSHA ACCIDENT/INJURY REPORT FORMS
Appendix B contains several relevant FRA accident and injury forms that railroads are requiredto complete on a periodic basis. Form FRA F 6180.55 (see Figure B-1) is used by railroads toreport monthly summaries of injuries and illnesses. Form FRA F 6180.55a (see Figure B-2) isused to provide specific information about each injury and illness that occurred in the month thatis being reported, and accompanies Form FRA F 6180.55. In addition to reporting certaininformation about each injury or illness, a railroad must maintain certain information about theinjury or illness on file. Form FRA F 6180.98 (see Figure B-3) can be used for this purpose,though the FRA does not require that railroads maintain this specific form, just the informationcontained therein.
If there is a train accident, a railroad must complete a Form FRA 6180.54 (see Figure B-4). Ifan employee is implicated as the cause of a train accident, then the railroad must complete aForm FRA F 6180.78 (see Figure B-5) to notify the employee that he or she has been implicated.The implicated employee then has the option of completing a Form FRA F 6180.81 (seeFigure B-6) and submitting it to both the employee’s railroad and the FRA. For moreinformation about how to fill out each form, see the FRA Guide for Preparing Accident/IncidentReports (FRA, 1997).
Lastly, a copy of MSHA’s Form 7000-1 Mine Accident, Injury and Illness Report (seeFigure B-7) is included for purposes of comparing a railroad injury report form to one used in asimilar industry.

152
Figure B-1. Form FRA F 6180.55 railroad injury and illness summary

153
Figure B-2. Form FRA F 6180.55a railroad injury and illness summary (continuation sheet)

154
Figure B-3. Form FRA F 6180.98 railroad employee injury and/or illness record

155
Figure B-3. Form FRA F 6180.98 railroad employee injury and/or illness record (continued)

156
Figure B-4. Form FRA F 6180.54 rail equipment accident/incident report

157
Figure B-5. Form FRA F 6180.78 notice to railroad employee involved in rail equipmentaccident/incident attributed to employee human factor

158
Figure B-6. Form FRA F 6180.81 employee human factor attachment

159
Figure B-6. Form FRA F 6180.81 employee human factor attachment (continued)

160
Figure B-7. MSHA Form 7000-1 mine accident, injury and illness report

161
APPENDIX C
DATA COLLECTION FORMS
Two forms were developed to aid in the collection of personal injury and work schedule data atthe participating railroad. They are presented in Figure C-1 and Figure C-2.

162
Figure C-1. Personal injury data collection form

163
Figure C-1. Personal injury data collection form (continued)

164
Figure C-2. Work schedule data collection form

165
APPENDIX D
STRUCTURED INTERVIEW QUESTIONS
A series of questions was developed to assist in guiding the structured interviews of railroadmanagers at participating railroad yards. The questions are organized around seven main themesand are presented below.
1. Yard operation
1.1 How many employees work in the yard per shift?
1.2 How many miles of track are there in the yard? Roughly how many tracks are there inthe arrival, classification and departure yards? Is there a container facility?
1.3 How many trains/cars are classified or handled in the yard each day?
1.4 Is there a repair shop on-site?
1.5 Who does the car inspections at this facility?
2. Scheduling and hours of service
2.1 What are the hours of operation at this particular yard?
2.2 How long are the shifts?
2.3 How many scheduled days off do employees have per week? Are the days off typicallyback-to-back, or are they separated in the week? How frequently do employees workone of the two days off? Both days off? How many hours do employees work perweek, on average?
2.4 How is the scheduling done here? What types of schedules do yard employees haveavailable? Are schedules/jobs based on seniority within the yard environment, or doesseniority cover an entire division or district?

166
3. Employee characteristics
3.1 What is the typical job tenure for employees working in yards? Are new hiresinexperienced on the railroad, or do they come from other railroad trades/crafts? Whatjobs do most new hires come from? How long do yard employees remain at their jobs?What jobs do they typically take when they do decide to leave the yard?
3.2 What is the range of education for yard employees?
3.3 What percent of yard employees are male/female?
3.4 What is the typical starting age of employees working in the yard? What is the averageage of employees working in the yard?
4. Reporting procedures
4.1 Who fills out the injury/illness reports at your railroad? Does your railroad trainpersonnel how to complete the injury/illness reports? What does the training involve?Is the training standardized across the entire railroad?
4.2 What defines a “Human Factor” as the probable reason for an injury/illness (question5n- “cause”)?
4.3 Are there any problems with the current method of reporting injuries and illnesses tothe FRA? What are they? Why are they a problem? How can they be fixed?
4.4 What safety-related information do you collect for injuries and illnesses in addition tothat required by the FRA?
4.5 What additional information would you like to have about an injury or illness in orderto help prevent this type of injury or illness from occurring in the future? Put anotherway, if you could learn anything about the circumstances that contributed to an injuryor illness in order to help prevent them from happening again, what would you like toknow?
5. Working environment and safety culture
5.1 What job conditions (e.g., fatigue, weather, misuse of equipment, shipper negligence)and other factors do you believe contribute to employee injuries at this facility?
5.2 What impact do FRA regulatory activities (e.g., rules, reporting requirements, audits)have in promoting safety at your railroad? Which have the greatest impact onpromoting safety at your railroad? Which have no impact or a negative impact onsafety?
167
5.3 What technological changes do you foresee that may reduce or increase the number ofinjuries to yard employees? Is your railroad likely to implement these newtechnologies?
5.4 What is your railroad’s policy regarding restricted/light duty during recuperation from awork-related injury?
6. Railroad safety programs
6.1 How are yard employees trained with respect to safety? Are they required to attendsafety training classes, view safety related videos, or read any written safety materials?Do you offer any voluntary training of this nature? If so, what has employee responsebeen?
6.2 How does your railroad encourage and reward safe work practices? Do you believethat such recognition or rewards have contributed to a reduction in the injury rate foryard employees?
6.3 How do you solicit suggestions from your employees regarding yard safety issues?How do you encourage employees to make suggestions?
6.4 Do you have safety committees that review accidents and injuries (both reportable andnon-reportable), and recommend solutions to workplace hazards? Who are themembers of these committees? Have the committees been successful in identifyinghazards and suggesting improvements?
6.5 Have there been any particularly successful safety programs or procedures used at yourrailroad? How/why were they successful?
6.6 Have there been any particularly unsuccessful safety programs or procedures used atyour railroad? How/why were they unsuccessful?
6.7 Is there any system in place at your railroad for reporting unsafe working conditions?
6.8 Is there any system in place at your railroad to enable or allow an employee to reportunfit-for-duty?
7. Additional questions
7.1 What do you see as the top challenges to reducing the number of injuries and illnessesto zero at your railroad?
7.2 Are there any unique circumstances in the yard that make reducing the number ofinjuries and illnesses particularly difficult or challenging?

168
7.3 What railroad, government, or employee actions, activities, or programs do you thinkhave most contributed to the decrease in injuries and illnesses?
7.4 What suggestions do you have for reducing the number of injuries and illnesses inyards?
7.5 What changes in the working environment might occur if FELA were repealed and ano-fault type of compensation were instituted?
7.6 What do you see as impediments to an anonymous reporting system (either by phone ormail-in form) whereby all employees, including supervisors and managers, can reportsafety violations and safety near-violations to an independent (non-government, non-industry) facility without fear of any form of retribution or litigation? The purpose ofthe system would be to identify hazards in the workplace so that they can be corrected.

169
APPENDIX E
SITE DESCRIPTIONS
Appendix E contains descriptions of the four yards that were visited. Each site is described interms of its functions and size. Then its approach to training is explained. Finally the railroad’sinjury reporting procedures are described.
E.1 Railroad Yard A
E.1.1 Description
Railroad Yard A is a large terminal railroad located in the Midwest. Due to its nature as aterminal railroad (a switching railroad with very little mainline), Yard A serves many differentrailroads. In addition to a hump classification yard, it also contains a diesel shop and enginehouse, as well as a car repair facility.
Yard A is an around-the-clock operation, and generally 50 to 60 jobs work per day. Most jobsinvolve three people—an engineer, conductor and switchman—though some jobs consist of twoor four people. More jobs work first shift than second or third. Railroad Yard A requires that itsemployees have a minimum of a high school degree or equivalent; few yard employees havecollege degrees.
There are several types of jobs due to the large size of this yard operation:
• Industry jobs, where crews pick-up and set-off cars at local industries
• Transfer jobs, in which assembled trains are dropped off at other railroads
• Hump jobs, in which cars are sorted to their next destination
• “Pull down” jobs, in which crews connect strings of cars from multiple classification tracks,ultimately forming an assembled train.
Yard A does not have regularly assigned jobs like other railroads. Rather, it utilizes a “24 hour”assignment board where jobs can be reserved no earlier than 24 hours before the job is scheduledto begin. Further, an individual can take or change an assignment as little as 2 hours before thejob is scheduled to begin. This enables the more senior trainmen and engineers to effectively

170
hold down regular jobs (similar to a regularly scheduled job), but the job is not guaranteed. Onany given day, a more senior employee may “bump” a person off of that job. Yard A also has anextra board, which is used to fill in the gaps in the assignment board each day. Scheduledemployees are guaranteed two consecutive days off per week, and extra board employees areguaranteed two days off, though they are not guaranteed to be consecutive. New employees areusually on the extra board for three to six months before moving to regular status.
E.1.2 Training
New hire switchman training lasts seven weeks and includes both classroom training and OJT. Itstarts with one week of classroom training, which includes a strong emphasis on safety rules.Besides safety rules the trainee is exposed to basic operating rules and operating practices.Videos illustrating the proper operating practices required of the switchman enhance theclassroom instruction. After the first week of classroom instruction the trainee is given sixweeks of OJT.
During this six weeks the training is overseen by a “peer mentor” who not only assigns the day today schedule, which includes varied shifts, but also observes and evaluates the trainee on aweekly basis. The mentor chooses the crews that the trainee is assigned to based on the crews’experience and willingness to work with students. The mentors are experienced switchmen whoare compensated for this extra responsibility of work with the new switchman. The crewmembers who work with the trainee also receive extra “training” compensation.
At the conclusion of the six-week OJT period the trainees return for an additional day in theclassroom. This last day is a review of the shared experiences of the OJT, some additional rulesinstruction and finally a rules test. If successful in completing the seven week training period,the employee is placed on the extra board for a 60 day probationary period, during which he orshe may be dismissed without cause. After the probationary period, the employee becomes aUnion member and receives the benefits of the working contract.
E.1.3 Injury Reporting Procedures
On Railroad A, employees are required to report all injuries, regardless of severity, to theirsupervisor. Injuries requiring medical attention are treated at a local medical clinic. In all cases,the safety manager and claim agent are called as part of the response effort.
Injury inquiries are led by the department head for the employee(s) involved. Safety, claims andother departments are involved as needed and depending on the complexity of the given case. Areport, verbal or written, is given to senior management within hours of the occurrence, withfollow up as appropriate. Countermeasures found in this process are implemented by theappropriate department and followed up during the monthly FRA/management safety meeting.

171
E.2 Railroad Yard B
E.2.1 Description
Railroad Yard B is a medium-sized, regional flat switching yard located in New England. YardB is approximately one mile long, has 33 tracks for switching, and one mainline runs through theyard. Currently the engine house at this yard is not in use and equipment is sent elsewhere formajor repairs. A shop truck visits the yard daily to make minor repairs.
This yard operates around-the-clock, seven days a week. On an average day, 300 to 350 cars areswitched at Yard B. Two crews work in the yard performing switching operations, and duringthe day shift on weekdays a third crew picks up and sets off cars at local industries. Most crewsconsist of a conductor or brakeman and an engineer, but some crews have three people. A totalof 32 employees staff this yard on 13 jobs over the course of the week. The jobs are either“switching” or “local” jobs. A switching job involves making up trains while a local jobinvolves delivering cars to, or picking up cars from, local customers. Typically, the shift lengthfor yard jobs is 8 hours and for local jobs it is 10 hours.
Railroad B tries to hire people with a GED or high school degree although it is not a requirementfor the yard positions. The trainmaster at this yard reported that nearly half of the new hiretrainmen leave within six months of their hire date because of the work schedule.
E.2.2 Training
Conductor training lasts six weeks, and is composed of both classroom training and OJT. Rulesare taught using computer-based training. To begin, a new hire must have at least a high schooldegree. As part of new conductor training, instructors review hazards associated with yard workwith the trainee, both in the classroom and in the field. During OJT, railroad officials try tomatch trainees with a conductor who wants to be a mentor. During the first 15 days of the OJT,the trainee only works day shifts as a safety precaution. After the first 15 days, trainees arerotated into evening and night shifts. As another safety precaution, trainees only work 8 hours,even though some jobs may last longer. During OJT, trainees wear bright orange vests toindicate that they are students and to suggest extra attention be paid to the students foreveryone’s safety. After the six weeks of conductor training, trainees take a series of tests,including a rules test. Railroad B has adopted a policy that offers trainees two opportunities topass the final rules exam.
Upon successful completion of training, new hires work a probationary period of 90 days, anytime during which they may be released without cause. During this probationary period, railroadofficials try to expose trainees to the worst conditions they will face in order to prepare andfamiliarize them with the working environment of the railroad yard.

172
E.2.3 Injury Reporting Procedures
After an injury occurs, it is reported to the yardmaster, who reports the injury to the trainmaster.Depending on the circumstances and severity of the injury, the injured employee may be drugtested. The injured individual also files the initial injury report. Then there is an investigationinto the facts and circumstances underlying the injury. The investigation is led by thetrainmaster or yardmaster, and directed by the Director of Safety. Among other areas, officialsin the investigation look for procedural failures and human error/failures. After the investigationis completed, there is a hearing, in which a decision is made regarding culpability. A hearing isconducted for any injury, regardless of the severity and regardless of whether the injury isreportable to the FRA. If discipline against the injured employee is warranted, it is also imposedat this time. According to officials at Yard B, the hearings have reduced the number of injuriesreported at Railroad B due to the hearing process’s fact-finding nature, its focus onaccountability on both the railroad’s side and the individual’s side, and its financial impact.Their experience has been that since the hearing process was instituted, fewer minor injuries withquestionable relation to workplace activity are reported.
E.3 Railroad Yard C
E.3.1 Description
Railroad Yard C is a medium-size Class I, intermediate, flat switching, classification yardlocated in the Northeast. Yard C also serves as an interchange point for some road crews andseveral regional railroads. Yard C is about one mile long, and contains two main lines that runthrough the middle of the yard. An intermodal facility is operated on one side of the yard, whilelocal freight is switched on the other side. In addition to the intermodal and freight traffic fromlocal industries, several road and passenger trains pass through daily. Yard C contains a smallengine house, and runs a ballast operation where empty cars are inspected on-site and sent to anearby quarry for ballast.
This yard is primarily a Monday to Friday operation with a fairly constant workload. No jobswork on Saturdays and only one switcher works on Sundays. As a consequence, there is littleovertime, and few of the T&E crews work extra days. On weekdays, approximately 60 percentof the crews work during the day shift; 25 percent work the evening shift; and the remainderwork the night shift. Most T&E crews that work in Yard C have regularly scheduled jobs.Because of the number of local industries serviced by this yard, there are three yard switcher jobsand four industry jobs daily. Crews may alternate between working local jobs and switching inthe yard. The switcher jobs are scheduled for 8 hours but occasionally work 2 hours of overtime.Industry jobs typically work slightly longer shifts of 9 to 11 hours. A limited spare boardprovides relief as needed. Turnover at this yard is low, reflecting the desirability of workinghere. There is a large number of qualified individuals to fill few vacancies so it takes 20 to 25years of seniority to hold a regular job here.

173
A total of 75 people work in Yard C per day. This figure covers all shifts and all jobs (i.e.,Transportation, MOW and MOE), and includes both yard jobs and local industry jobs.Approximately 35 employees are from the T&E crafts.
E.3.2 Training
Employees working in this yard tend to be experienced railroaders so training is not an issue.However, if new trainmen/conductors are hired, they are sent to a six week off-site school fortraining.
E.3.3 Injury Reporting Procedures
If an employee is injured while working in the yard, first the trainmaster is notified. Thetrainmaster, in turn, contacts an outside company that records the injury. This company thennotifies the risk manager from the railroad. The risk manager is responsible for investigating theinjury (along with a yard manager, such as the trainmaster), obtaining a statement from theinjured employee and filing the paperwork with a central office. The risk manager focuses onlost time and reportable injuries. As part of the investigation, railroad officials conduct a rootcause analysis, where they look for “pinpoints” that indicate the underlying cause(s) of theinjury.
E.4 Railroad Yard D
E.4.1 Description
Railroad Yard D is a large Class I, intermediate, flat switching and classification yard located inthe Midwest. Like other intermediate yards, Yard D also serves as an interchange for roadcrews. Yard D is about one mile long, and includes two yard tracks that serve as main linethrough the yard, several arrival and departure tracks on each side of the yard (east and west),and about 40 classification tracks in the middle. In addition, Yard D contains a diesel shop andengine house, where locomotives are serviced and repaired; several RIP tracks, where lightrepairs are performed on rolling stock; and an equipment repair facility, where rolling stockundergo major repairs, including replacement of ends.
An average of 10 crews switch 16 trains per day (about 1000 cars). Typically, five crews workan 8 hour day shift; three crews work an 8 hour evening shift; and two crews work an 8 hournight shift. In addition to these 10 crews, there is one utility man who works a 24 hour shift, andcan be used to assist in all aspects of yard operation, including hostling. An average of twocrews per day work some overtime. Yard crews usually consist of a locomotive engineer, aconductor (or foreman) and a helper. Yard crews are assigned two consecutive days off.
T&E crews qualify to work both road and yard jobs at one time at this particular railroad.However, due to the desirability of working in the yard (no travel involved, work hours are moreregular than road jobs, two consecutive assigned days off), T&E crews that work in Yard D havea minimum of 20 to 25 years of experience as conductors and engineers. There are both a

174
regular yard board and a spare yard board for each craft. Currently, about 30 conductors/switchmen and 12 locomotive engineers work in Yard D.
E.4.2 Training
Candidates first go through a 5 to 6 week course designed by the railroad but taught throughseveral local and community colleges. After successfully completing the course, candidatesundergo 9 weeks of railroad company training. Classroom and OJT are combined andinterspersed. During this time, the railroad employs a special training facility where trainees canlearn to use equipment and practice procedures without the distraction or danger of other trainsor operational activity. Only the trainees’ equipment is present.
During the OJT portion of the training, the trainee is periodically matched with a conductor. Therailroad makes an effort to match trainees with conductors who want to train others and therailroad compensates those who serve as trainee mentors. Whereas on some railroads anindividual is trained to become a switchman first, and then receives two additional weeks toqualify as a conductor, at this railroad, individuals are trained immediately to becomeconductors. Typically, after becoming qualified, conductors will hold road jobs until they haveenough seniority to hold a yard job. When moving to the yard environment, the conductor isgiven up to 14 days of on-the-job yard familiarization training to prepare him/her for thespecifics of operating in the yard.
Locomotive engineer trainees receive 26 weeks of formal, engineer-specific training.
E.4.3 Injury Reporting Procedures
If an employee is injured, s/he first notifies the yardmaster. If an ambulance is required, one iscalled. Next, the trainmaster is notified. After the injury is attended to, the facts andcircumstances surrounding the injury are documented. Both the supervisor and the injuredemployee complete forms that describe the injury and the circumstances that surrounded theinjury. The incident report that the employee completes after an injury includes several valuablesubjective questions, such as whether the employee had “a safe place in which to work” andwhether the workplace was “adequately lighted.” Information is collected on any injury that isreported, regardless of its severity. This information includes the number of hours off prior tothe injury and the number of consecutive days worked. The paperwork is sent to a division ordistrict office and a claim agent responds. Eventually the paperwork is sent to the centralizedcorporate office where, if the injury meets reporting criteria, administrators prepare theinformation for transmission to the FRA.
The injury reporting and investigative process that this railroad uses deviates from most otherrailroads in a number of ways. First, they do not routinely administer drug and alcohol testsimmediately following an injury. They also no longer hold formal investigations. Rather, localofficials conduct a root cause analysis to determine the root cause(s) of the injury with the goalof rectifying the situation. There are three steps that are involved in the root cause analysis.They are:

175
1. Gather the facts of the incident. This step involves examination of the immediate area, andanswering the following questions with respect to the injury: What happened? When did ithappen? Where did it happen? How did it happen?
2. Identify the immediate cause. This step involves tracing the sequence of events leading up tothe injury, and focusing on unsafe acts and conditions. The act or condition that immediatelycaused the injury is the “immediate cause.”
3. Identify the root cause. In this step, the individual investigating the injury is encouraged torepeatedly ask “Why” the injury occurred, until whatever occurred to lead to the immediatecause is identified.
Once the root cause(s) has been identified, the analysis requires that the inquiring individualdocument the action taken to prevent its reoccurrence.
The elimination of routine formal investigations and drug and alcohol testing following an injuryis an attempt by the railroad to improve the relationship between labor and management, and tofoster employees’ trust. As a result of these new policies, there has been an increase in thenumber of injuries reported. However, it is felt that the injuries that are being reported now aresimply those that were not being reported before. In fact, the increase in the number of reportedinjuries is viewed as a step toward greater trust between labor and management rather than anindication of a more hazardous work environment.

176
APPENDIX F
FOCUS GROUP QUESTIONS
Appendix F contains the list of questions used to guide the focus group discussions held withrailroad labor. They are presented below, and are organized by the city in which they were used.
St. Louis Focus Group Questions
1. Factors contributing to yard injuries
1.1 Tell us about an injury that you or a co-worker had and what you think contributed to it.
1.2 Off all the factors that you mentioned, which do you think is the biggest contributor toinjuries in your yard?
1.3 How can these factors be corrected?
1.4 Are there any other factors that you feel we have left out that contribute to injuries inyards?
2. Overall safety climate
2.1 What motivates you to work safely?
2.2 What detracts from your motivation to work safely?
2.3 What pressures have you experienced to cut corners or compromise safety?
2.4 What discrepancies have you seen between your railroad’s safety policies and actualday-to-day practices?
2.5 How much responsibility do you yourself feel you have for maintaining a safe workplace?
2.6 What barriers to safety have you experienced, or are aware you of, in your yard?
2.7 Anything we left out?

177
2.8 Of all the barriers you have mentioned, which one is the most common?
2.9 Which one is the most difficult to overcome?
3. Supplemental injury survey
3.1 Under what circumstances would you be willing to take the time to fill out asupplemental injury report after being injured on-the-job?
4. Concluding
4.1 Is there anything else that you would like to add to what we have discussed tonight/today?
Houston Focus Group Questions
1. Injury reporting procedures
1.1 Tell us about an injury that you or a co-worker had and how you went about reportingit.
1.2 What factors would cause an employee to be reluctant to report an injury?
1.3 What role does fear of harassment or intimidation play in your decision to report aninjury?
1.4 How effective are formal hearings or investigations in identifying the root causes ofinjuries?
2. Supplemental injury survey
2.1 Under what conditions would you be willing to fill out a supplemental injury reportafter being injured on-the-job?
3. Railroad safety initiatives, incentives and awards
3.1 Tell us about any safety initiatives or programs that you have been a part of andwhether or not you believe they have contributed to reducing injuries in yards.
3.2 What other safety initiatives can you suggest that might reduce the risk of injury?
3.3 How effective are safety incentives, such as individual or group awards orcompensation, in maintaining a safe working environment?
3.4 What effect do safety incentives have on underreporting of injuries?

178
3.5 Of all of the safety initiatives we have discussed, which one do you feel has the greatestpositive impact on maintaining a safe work environment?
3.6 What relationship does the Harriman Award have to a safe environment and safeoperating practices?
3.7 [What do you think about participating in a behaviorally-based approach to safety(explain here)? Would you feel comfortable participating as an observer? As theobserved?]
4. Concluding
4.1 Is there anything else that you would like to add to what we have discussed tonight/today?
Chicago Focus Group Questions
1. Channels of communication
1.1 In your experience, if you encountered an unsafe working condition in the yard, whatdid you do?
1.2 What procedures are in place at your railroad to report an unsafe working condition or asafety violation? How effective are these procedures?
1.3 What is the best (or most effective) way to get an unsafe working condition corrected inyour yard?
1.4 How effective was your training in preparing you to work safely in the yard? Whatwould you have done differently?
1.5 When new procedures or rules are introduced, how are you informed or trained? Howtimely is the training or information? How effective is it?
1.6 The Federal Aviation, Coast Guard, and Federal Highway Administrations all have aformal procedure for anonymously reporting unsafe working conditions and safetyviolations. The goals of these reporting systems are to (1) identify and (2) remedyunsafe working conditions and actions, NOT to punish an individual for violating asafety rule or a railroad for not properly maintaining their yard. Is there a need for thistype of system for the railroad industry? Would you use it?
2. Safety rules and procedures
2.1 How effective are your railroad’s safety rules in creating a safe workplace andpreventing injuries?

179
2.2 Can you think of any rules that are particularly effective at preventing injuries/maintaining a safe workplace?
2.3 Can you think of any rules that are particularly ineffective at preventing injuries/maintaining a safe workplace?
2.4 Can you think of any rules, practices or procedures that are not currently in place butthat would prevent injuries if followed?
2.5 What pressures have you experienced to shortcut procedures or bend rules?
3. Work schedules and overtime
3.1 How much control do you have in determining your work schedule?
3.2 How much does your work schedule affect your ability to manage your time away fromwork?
3.3 What is your favorite work schedule? What aspects of the schedule make it yourfavorite? (poll the group)
3.4 How could work scheduling practices or work schedules be improved?
3.5 What reasons are there to work overtime?
Houston (Novice Worker) Focus Group Questions
1. Training
1.1 How were you trained for your present craft? (Have everyone respond. Order by craft.)
1.2 How effective was your training in preparing you to work safely in the yard?
1.3 In what areas could your training have better prepared you for performing your job?
1.4 What changes do you recommend in the training program?
2. Overall Safety Climate
2.1 What motivates you to work safely? (Have everyone respond.)
2.2 What detracts from your motivation to work safely? (Try to get a response fromeveryone)

180
2.3 What pressures have you experienced to cut corners or shortcut procedures?
2.4 What discrepancies have you seen between your railroad’s safety policies and actualday-to-day practices?
3. Injury Reporting Procedures
3.1 What factors would cause an employee to be reluctant to report an injury?
3.2 What role does fear of harassment or intimidation play in your decision to report aninjury?
4. Work Schedules and Overtime
4.1 Tell us what your current work schedule is. (Ask everyone.)
4.2 How much control do you have in determining your work schedule?
4.3 How much does your work schedule affect your ability to manage your time away fromwork?
4.4 What reasons are there to work overtime?
4.5 What is your favorite work schedule? What aspects of the schedule make it yourfavorite? (poll the group)
4.6 How could work scheduling practices or work schedules be improved?
5. Supplemental Injury Survey (if time permits)
5.1 Under what conditions would you be willing to fill out a supplemental injury reportafter being injured on-the-job?
Copyright © 2022 FDOKUMEN