GIS-grid-based and multi-criteria analysis for identifying and mapping peat swamp forest fire hazard...
8
GIS-grid-based and multi-criteria analysis for identifying and mapping peat swamp forest fire hazard in Pahang, Malaysia Iwan Setiawan A.R. Mahmud S. Mansor A.R. Mohamed Shariff and A.A. Nuruddin The authors For author details, please see end of article. Keywords Forests, Fire, Geographic information systems, Malaysia Abstract Peat swamp forest fire hazard areas were identified and mapped by integrating GIS-grid-based and multi-criteria analysis to provide valuable information about the areas most likely to be affected by fire in the Pekan District, south of Pahang, Malaysia. A spatially weighted index model was implemented to develop the fire hazard assessment model used in this study. Fire-causing factors such as land use, road network, slope, aspect and elevation data were used in this application. A two-mosaic Landsat TM scene was used to extract land use parameters of the study area. A triangle irregular network was generated from the digitized topographic map to produce a slope risk map, an aspect risk map and an elevation risk map. Spatial analysis was applied to reclassify and overlay all grid hazard maps to produce a final peat swamp forest fire hazard map. To validate the model, the actual fire occurrence map was compared with the fire hazard zone area derived from the model. The model can be used only for specific areas, and other criteria should be considered if the model is used for other areas. The results show that most of the actual fire spots are located in very high and high fire risk zones identified by the model. Electronic access The Emerald Research Register for this journal is available at www.emeraldinsight.com/researchregister The current issue and full text archive of this journal is available at www.emeraldinsight.com/0965-3562.htm Introduction Forest fires and their resulting smoke haze are a relatively new phenomenon in Malaysia. However, the problem of forest fires seems to be increasing and recurring periodically. In terms of the numbers of hectares affected by fire, the figure for 1997 was the worst since 1992. Most of the forest fires reported in Malaysia occur in degraded or logged-over peat swamp forests, on both the east and west coasts of peninsular Malaysia and on the coasts of Sabah and Sarawak. Fire has been identified as one of the major causes of the loss of peat swamp forests in several states in Malaysia (Wan Ahmad, 2002). A study modeling fire hazard assessment is essential in establishing an effective forest fire management system, especially in controlling and preventing forest fires. Forest fire management is an important part of overall national forest policy. Geographic information systems (GIS), in combination with other forms of technology such as remote sensing and computer modeling, are being used increasingly in all aspects of wildland fire management. GIS technology has become a more common tool in the management of natural resources. Many research projects have developed wildfire hazard models for a specific region based on the physiographic or environmental factors that influence wildfire (Salas and Chuvieco, 1994). Identifying areas that have a high probability of burning is an important component of fire management planning. The development of spatially explicit GIS models has greatly facilitated this process by allowing managers to map and analyze the variables that contribute to the occurrence of fire across large, unique geographic units. The purpose of this study is to develop a forest fire hazard model and map in order to identify, classify and map fire hazard areas by integrating GIS with multi-criteria analysis (MCA) for a specific region in southern Pahang, Malaysia. The result of the study is a contribution towards implementing a fully operational GIS for forest fire management, especially fire prevention. Material and method Pekan District in southern Pahang, Malaysia (see Figure 1), was selected for this study because it faces an annual forest fire problem. The total area is about 183,992 ha, most which is covered by peat swamp forest (85,218.41 ha or 46.21 percent), with the rest being wetland (50,519.54 ha or 27.39 percent), arable land (22,395.58 ha or 12.14 percent), lowland forest (20,467.96 ha or 11.10 Disaster Prevention and Management Volume 13 · Number 5 · 2004 · pp. 379-386 q Emerald Group Publishing Limited · ISSN 0965-3562 DOI 10.1108/09653560410568507 379
-
Upload
independent -
Category
Documents
-
view
1 -
download
0
Transcript of GIS-grid-based and multi-criteria analysis for identifying and mapping peat swamp forest fire hazard...
GIS-grid-based andmulti-criteria analysisfor identifying andmapping peat swampforest fire hazard inPahang, Malaysia
Iwan SetiawanA.R. MahmudS. MansorA.R. Mohamed Shariff andA.A. Nuruddin
The authors
For author details, please see end of article.
Keywords
Forests, Fire, Geographic information systems, Malaysia
Abstract
Peat swamp forest fire hazard areas were identified and mappedby integrating GIS-grid-based and multi-criteria analysis to providevaluable information about the areas most likely to be affected byfire in the Pekan District, south of Pahang, Malaysia. A spatiallyweighted index model was implemented to develop the fire hazardassessment model used in this study. Fire-causing factors such asland use, road network, slope, aspect and elevation data were usedin this application. A two-mosaic Landsat TM scene was used toextract land use parameters of the study area. A triangle irregularnetwork was generated from the digitized topographic map toproduce a slope risk map, an aspect risk map and an elevation riskmap. Spatial analysis was applied to reclassify and overlay all gridhazard maps to produce a final peat swamp forest fire hazard map.To validate the model, the actual fire occurrence map wascompared with the fire hazard zone area derived from the model.The model can be used only for specific areas, and other criteriashould be considered if the model is used for other areas. Theresults show that most of the actual fire spots are located in veryhigh and high fire risk zones identified by the model.
Electronic access
The Emerald Research Register for this journal is
available at
www.emeraldinsight.com/researchregister
The current issue and full text archive of this journal is
available at
www.emeraldinsight.com/0965-3562.htm
Introduction
Forest fires and their resulting smoke haze are a
relatively new phenomenon in Malaysia. However,
the problem of forest fires seems to be increasing
and recurring periodically. In terms of the
numbers of hectares affected by fire, the figure for
1997 was the worst since 1992. Most of the forest
fires reported in Malaysia occur in degraded or
logged-over peat swamp forests, on both the east
and west coasts of peninsular Malaysia and on the
coasts of Sabah and Sarawak. Fire has been
identified as one of the major causes of the loss of
peat swamp forests in several states in Malaysia
(Wan Ahmad, 2002).
A study modeling fire hazard assessment is
essential in establishing an effective forest fire
management system, especially in controlling and
preventing forest fires. Forest fire management is
an important part of overall national forest policy.
Geographic information systems (GIS), in
combination with other forms of technology such
as remote sensing and computer modeling, are
being used increasingly in all aspects of wildland
fire management. GIS technology has become a
more common tool in the management of natural
resources. Many research projects have developed
wildfire hazard models for a specific region based
on the physiographic or environmental factors that
influence wildfire (Salas and Chuvieco, 1994).
Identifying areas that have a high probability of
burning is an important component of fire
management planning. The development of
spatially explicit GIS models has greatly facilitated
this process by allowing managers to map and
analyze the variables that contribute to the
occurrence of fire across large, unique geographic
units.
The purpose of this study is to develop a forest
fire hazard model and map in order to identify,
classify and map fire hazard areas by integrating
GIS with multi-criteria analysis (MCA) for a
specific region in southern Pahang, Malaysia. The
result of the study is a contribution towards
implementing a fully operational GIS for forest fire
management, especially fire prevention.
Material and method
Pekan District in southern Pahang, Malaysia (see
Figure 1), was selected for this study because it
faces an annual forest fire problem. The total area
is about 183,992 ha, most which is covered by peat
swamp forest (85,218.41 ha or 46.21 percent),
with the rest being wetland (50,519.54 ha or 27.39
percent), arable land (22,395.58 ha or 12.14
percent), lowland forest (20,467.96 ha or 11.10
Disaster Prevention and Management
Volume 13 · Number 5 · 2004 · pp. 379-386
q Emerald Group Publishing Limited · ISSN 0965-3562
DOI 10.1108/09653560410568507
379
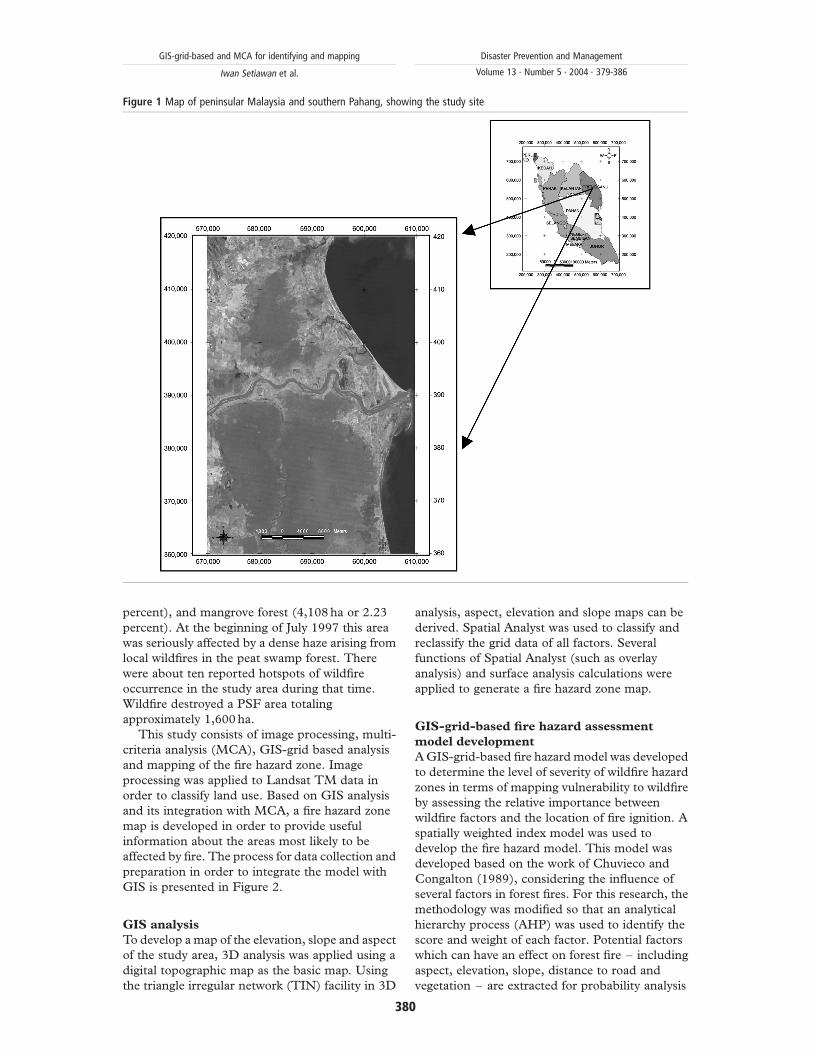
percent), and mangrove forest (4,108 ha or 2.23
percent). At the beginning of July 1997 this area
was seriously affected by a dense haze arising from
local wildfires in the peat swamp forest. There
were about ten reported hotspots of wildfire
occurrence in the study area during that time.
Wildfire destroyed a PSF area totaling
approximately 1,600 ha.
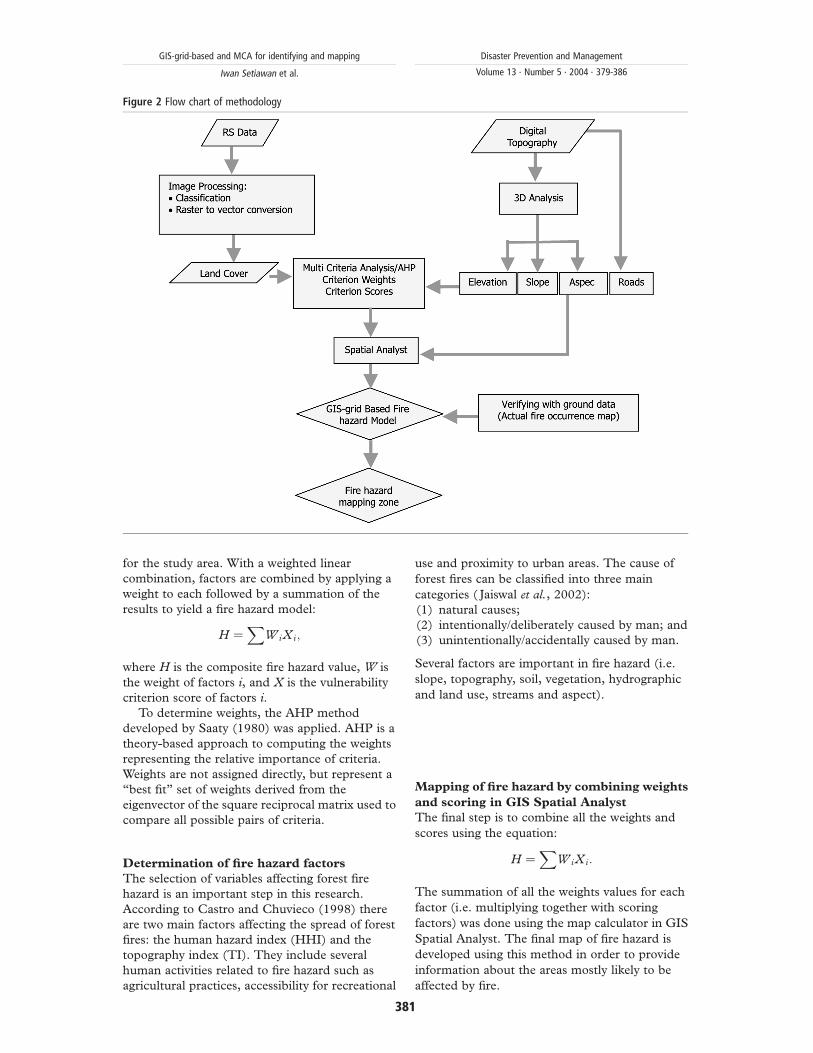
This study consists of image processing, multi-
criteria analysis (MCA), GIS-grid based analysis
and mapping of the fire hazard zone. Image
processing was applied to Landsat TM data in
order to classify land use. Based on GIS analysis
and its integration with MCA, a fire hazard zone
map is developed in order to provide useful
information about the areas most likely to be
affected by fire. The process for data collection and
preparation in order to integrate the model with
GIS is presented in Figure 2.
GIS analysis
To develop a map of the elevation, slope and aspect
of the study area, 3D analysis was applied using a
digital topographic map as the basic map. Using
the triangle irregular network (TIN) facility in 3D
analysis, aspect, elevation and slope maps can be
derived. Spatial Analyst was used to classify and
reclassify the grid data of all factors. Several
functions of Spatial Analyst (such as overlay
analysis) and surface analysis calculations were
applied to generate a fire hazard zone map.
GIS-grid-based fire hazard assessment
model development
AGIS-grid-based fire hazard model was developed
to determine the level of severity of wildfire hazard
zones in terms of mapping vulnerability to wildfire
by assessing the relative importance between
wildfire factors and the location of fire ignition. A
spatially weighted index model was used to
develop the fire hazard model. This model was
developed based on the work of Chuvieco and
Congalton (1989), considering the influence of
several factors in forest fires. For this research, the
methodology was modified so that an analytical
hierarchy process (AHP) was used to identify the
score and weight of each factor. Potential factors
which can have an effect on forest fire – including
aspect, elevation, slope, distance to road and
vegetation – are extracted for probability analysis
Figure 1 Map of peninsular Malaysia and southern Pahang, showing the study site
GIS-grid-based and MCA for identifying and mapping
Iwan Setiawan et al.
Disaster Prevention and Management
Volume 13 · Number 5 · 2004 · 379-386
380
for the study area. With a weighted linear
combination, factors are combined by applying a
weight to each followed by a summation of the
results to yield a fire hazard model:
H ¼X
WiXi;
where H is the composite fire hazard value, W is
the weight of factors i, and X is the vulnerability
criterion score of factors i.
To determine weights, the AHP method
developed by Saaty (1980) was applied. AHP is a
theory-based approach to computing the weights
representing the relative importance of criteria.
Weights are not assigned directly, but represent a
“best fit” set of weights derived from the
eigenvector of the square reciprocal matrix used to
compare all possible pairs of criteria.
Determination of fire hazard factors
The selection of variables affecting forest fire
hazard is an important step in this research.
According to Castro and Chuvieco (1998) there
are two main factors affecting the spread of forest
fires: the human hazard index (HHI) and the
topography index (TI). They include several
human activities related to fire hazard such as
agricultural practices, accessibility for recreational
use and proximity to urban areas. The cause of
forest fires can be classified into three main
categories ( Jaiswal et al., 2002):
(1) natural causes;
(2) intentionally/deliberately caused by man; and
(3) unintentionally/accidentally caused by man.
Several factors are important in fire hazard (i.e.
slope, topography, soil, vegetation, hydrographic
and land use, streams and aspect).
Mapping of fire hazard by combining weights
and scoring in GIS Spatial Analyst
The final step is to combine all the weights and
scores using the equation:
H ¼X
WiXi:
The summation of all the weights values for each
factor (i.e. multiplying together with scoring
factors) was done using the map calculator in GIS
Spatial Analyst. The final map of fire hazard is
developed using this method in order to provide
information about the areas mostly likely to be
affected by fire.
Figure 2 Flow chart of methodology
GIS-grid-based and MCA for identifying and mapping
Iwan Setiawan et al.
Disaster Prevention and Management
Volume 13 · Number 5 · 2004 · 379-386
381
Results and discussion
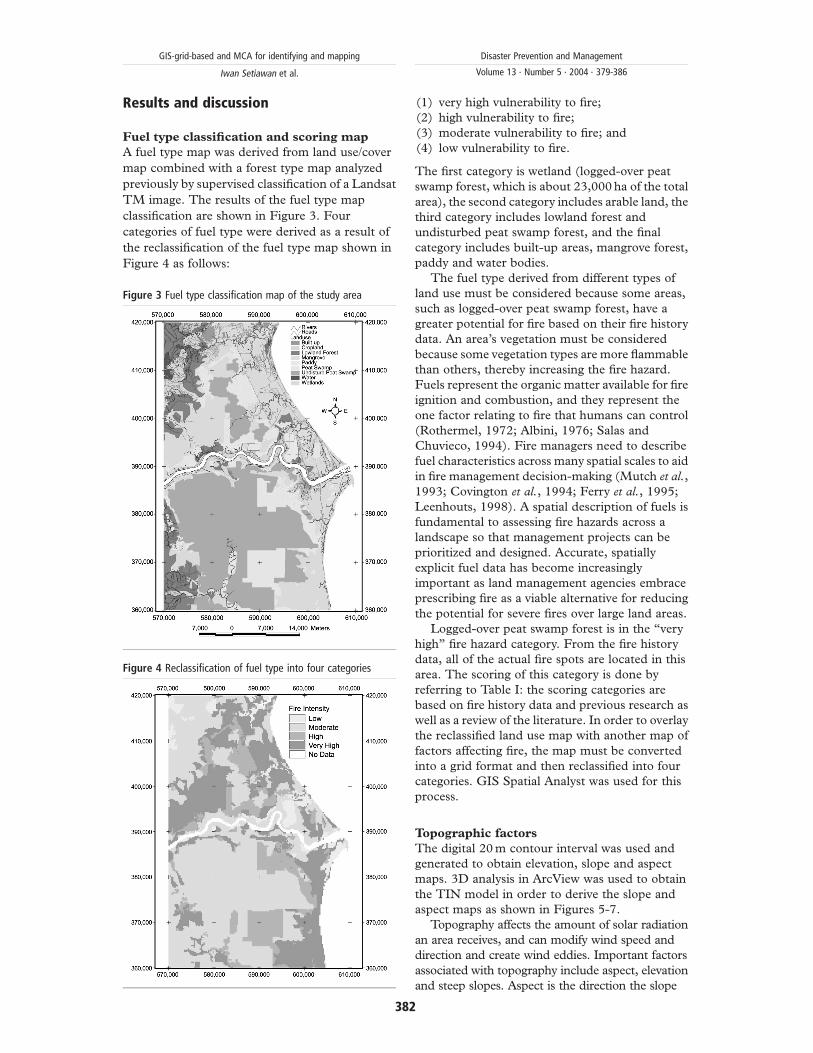
Fuel type classification and scoring map
A fuel type map was derived from land use/cover
map combined with a forest type map analyzed
previously by supervised classification of a Landsat
TM image. The results of the fuel type map
classification are shown in Figure 3. Four
categories of fuel type were derived as a result of
the reclassification of the fuel type map shown in
Figure 4 as follows:
(1) very high vulnerability to fire;
(2) high vulnerability to fire;
(3) moderate vulnerability to fire; and
(4) low vulnerability to fire.
The first category is wetland (logged-over peat
swamp forest, which is about 23,000 ha of the total
area), the second category includes arable land, the
third category includes lowland forest and
undisturbed peat swamp forest, and the final
category includes built-up areas, mangrove forest,
paddy and water bodies.
The fuel type derived from different types of
land use must be considered because some areas,
such as logged-over peat swamp forest, have a
greater potential for fire based on their fire history
data. An area’s vegetation must be considered
because some vegetation types are more flammable
than others, thereby increasing the fire hazard.
Fuels represent the organic matter available for fire
ignition and combustion, and they represent the
one factor relating to fire that humans can control
(Rothermel, 1972; Albini, 1976; Salas and
Chuvieco, 1994). Fire managers need to describe
fuel characteristics across many spatial scales to aid
in fire management decision-making (Mutch et al.,
1993; Covington et al., 1994; Ferry et al., 1995;
Leenhouts, 1998). A spatial description of fuels is
fundamental to assessing fire hazards across a
landscape so that management projects can be
prioritized and designed. Accurate, spatially
explicit fuel data has become increasingly
important as land management agencies embrace
prescribing fire as a viable alternative for reducing
the potential for severe fires over large land areas.
Logged-over peat swamp forest is in the “very
high” fire hazard category. From the fire history
data, all of the actual fire spots are located in this
area. The scoring of this category is done by
referring to Table I: the scoring categories are
based on fire history data and previous research as
well as a review of the literature. In order to overlay
the reclassified land use map with another map of
factors affecting fire, the map must be converted
into a grid format and then reclassified into four
categories. GIS Spatial Analyst was used for this
process.
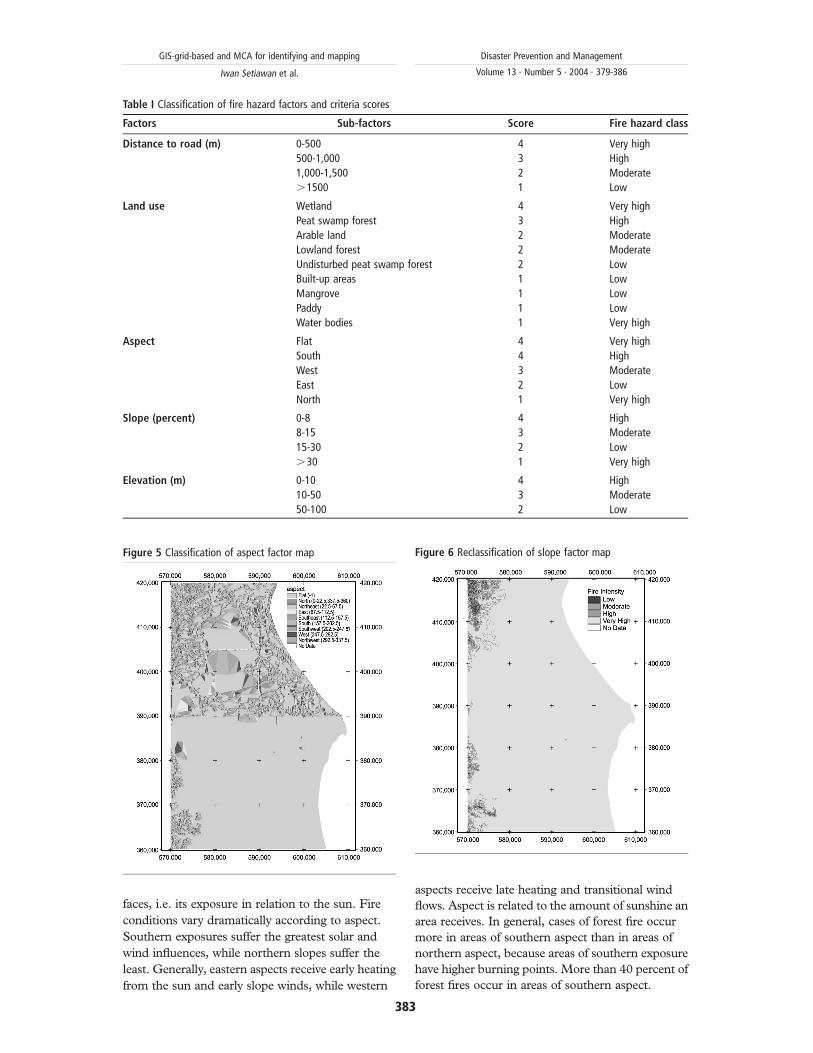
Topographic factors
The digital 20m contour interval was used and
generated to obtain elevation, slope and aspect
maps. 3D analysis in ArcView was used to obtain
the TIN model in order to derive the slope and
aspect maps as shown in Figures 5-7.
Topography affects the amount of solar radiation
an area receives, and can modify wind speed and
direction and create wind eddies. Important factors
associated with topography include aspect, elevation
and steep slopes. Aspect is the direction the slope
Figure 3 Fuel type classification map of the study area
Figure 4 Reclassification of fuel type into four categories
GIS-grid-based and MCA for identifying and mapping
Iwan Setiawan et al.
Disaster Prevention and Management
Volume 13 · Number 5 · 2004 · 379-386
382
faces, i.e. its exposure in relation to the sun. Fire
conditions vary dramatically according to aspect.
Southern exposures suffer the greatest solar and
wind influences, while northern slopes suffer the
least. Generally, eastern aspects receive early heating
from the sun and early slope winds, while western
aspects receive late heating and transitional wind
flows. Aspect is related to the amount of sunshine an
area receives. In general, cases of forest fire occur
more in areas of southern aspect than in areas of
northern aspect, because areas of southern exposure
have higher burning points. More than 40 percent of
forest fires occur in areas of southern aspect.
Table I Classification of fire hazard factors and criteria scores
Factors Sub-factors Score Fire hazard class
Distance to road (m) 0-500 4 Very high
500-1,000 3 High
1,000-1,500 2 Moderate
.1500 1 Low
Land use Wetland 4 Very high
Peat swamp forest 3 High
Arable land 2 Moderate
Lowland forest 2 Moderate
Undisturbed peat swamp forest 2 Low
Built-up areas 1 Low
Mangrove 1 Low
Paddy 1 Low
Water bodies 1 Very high
Aspect Flat 4 Very high
South 4 High
West 3 Moderate
East 2 Low
North 1 Very high
Slope (percent) 0-8 4 High
8-15 3 Moderate
15-30 2 Low
.30 1 Very high
Elevation (m) 0-10 4 High
10-50 3 Moderate
50-100 2 Low
Figure 6 Reclassification of slope factor mapFigure 5 Classification of aspect factor map
GIS-grid-based and MCA for identifying and mapping
Iwan Setiawan et al.
Disaster Prevention and Management
Volume 13 · Number 5 · 2004 · 379-386
383
Slope is a critical factor in fire behavior, and aspect
is clearly related to insulation and air humidity.
Typically, in the temperate zones of the northern
hemisphere, south-facing slopes receive more solar
radiation than north-facing slopes. Therefore,
south-facing slope are hotter, drier and pose
greater fire hazards. More than 60 percent of forest
fires happen on slopes of between zero and 20
degrees and in areas of southern and south western
aspect ( Jo et al., 2000). Sixty-five percent of all
forest fires occur on slopes of between zero and 20
degrees. The rate of forest fires decreases
remarkably as slope increases ( Jo et al., 2000).
Slope increases fire hazard: as a surface’s slope
increases, so does fire hazard.
Elevation influences vegetation composition,
fuel moisture and air humidity. More than 90
percent of cases of forest fire occur at 100m
above sea level. Most of these disasters take place
in areas which are lower above sea level. Fires are
less severe at higher elevations due to higher
rainfall. Two factors to consider are elevation
above sea level and elevation changes in relation
to the surrounding topography. It has been
reported that fire behavior trends to be less severe
at higher elevation due to higher rainfall. Step
gradient increases the rate of fire spread because
of more efficient convective preheating and
ignition, and gradients facing east receive more
ultraviolet during the day. As a consequence,
eastern aspects dry faster (Chuvieco and
Congalton, 1989).
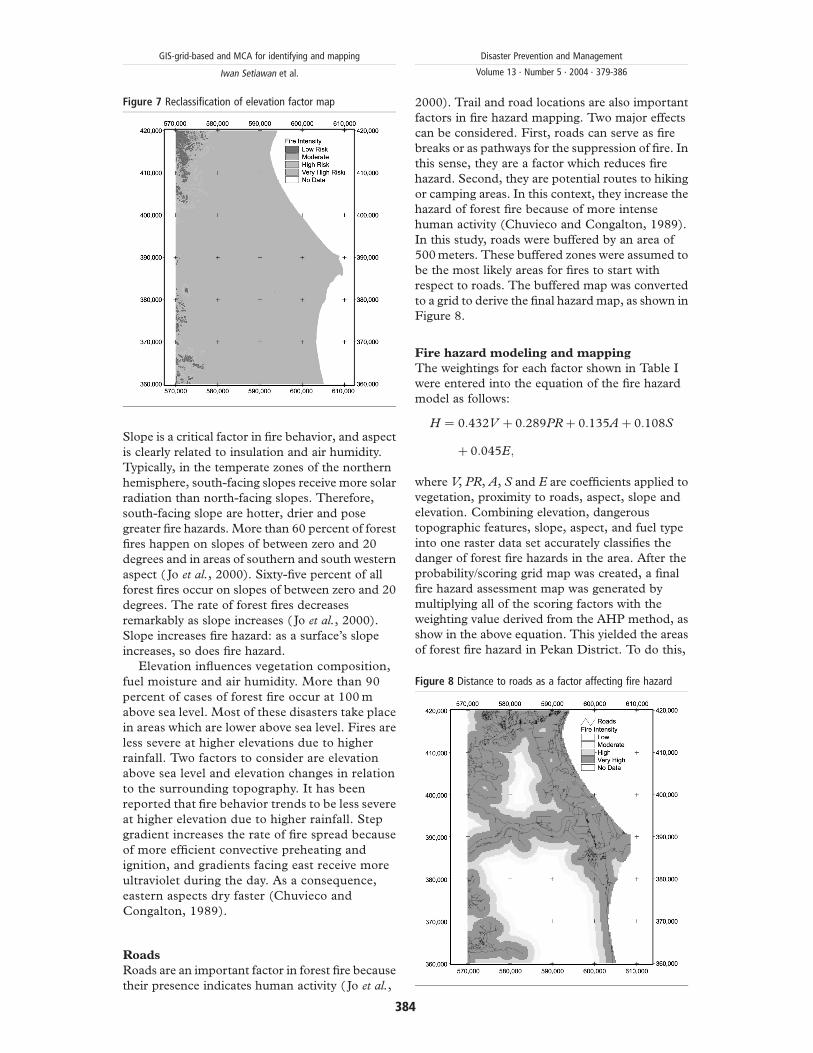
Roads
Roads are an important factor in forest fire because
their presence indicates human activity ( Jo et al.,
2000). Trail and road locations are also important
factors in fire hazard mapping. Two major effects
can be considered. First, roads can serve as fire
breaks or as pathways for the suppression of fire. In
this sense, they are a factor which reduces fire
hazard. Second, they are potential routes to hiking
or camping areas. In this context, they increase the
hazard of forest fire because of more intense
human activity (Chuvieco and Congalton, 1989).
In this study, roads were buffered by an area of
500meters. These buffered zones were assumed to
be the most likely areas for fires to start with
respect to roads. The buffered map was converted
to a grid to derive the final hazard map, as shown in
Figure 8.
Fire hazard modeling and mapping
The weightings for each factor shown in Table I
were entered into the equation of the fire hazard
model as follows:
H ¼ 0:432V þ 0:289PRþ 0:135Aþ 0:108S
þ 0:045E;
where V, PR, A, S and E are coefficients applied to
vegetation, proximity to roads, aspect, slope and
elevation. Combining elevation, dangerous
topographic features, slope, aspect, and fuel type
into one raster data set accurately classifies the
danger of forest fire hazards in the area. After the
probability/scoring grid map was created, a final
fire hazard assessment map was generated by
multiplying all of the scoring factors with the
weighting value derived from the AHP method, as
show in the above equation. This yielded the areas
of forest fire hazard in Pekan District. To do this,
Figure 8 Distance to roads as a factor affecting fire hazard
Figure 7 Reclassification of elevation factor map
GIS-grid-based and MCA for identifying and mapping
Iwan Setiawan et al.
Disaster Prevention and Management
Volume 13 · Number 5 · 2004 · 379-386
384
the raster calculator/map calculator in ArcView
Spatial Analyst was used to combine these grids.
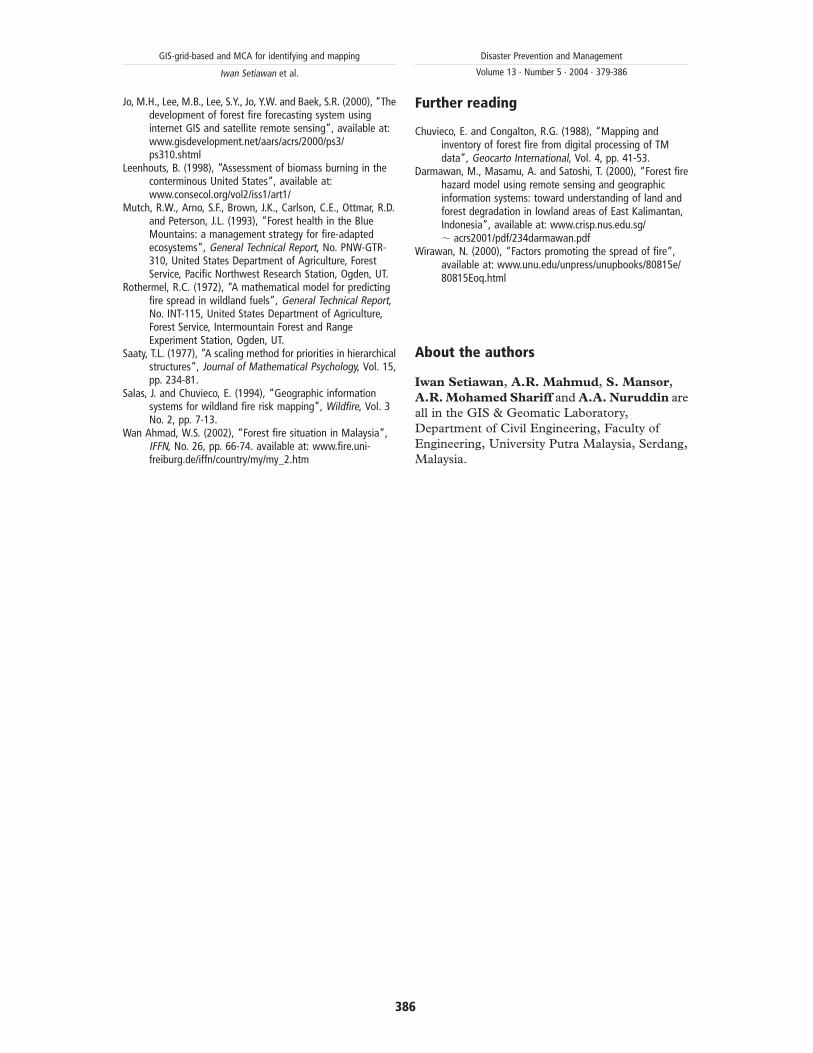
The final fire hazard map is displayed in Figure 9.
The final map of the fire hazard zone showed
that about 49,678 ha or 27 percent of the total area
is categorized as being very high fire risk, with
10.76, 41.73 and 20.51 percent, respectively,
being in the categories of high, moderate and low
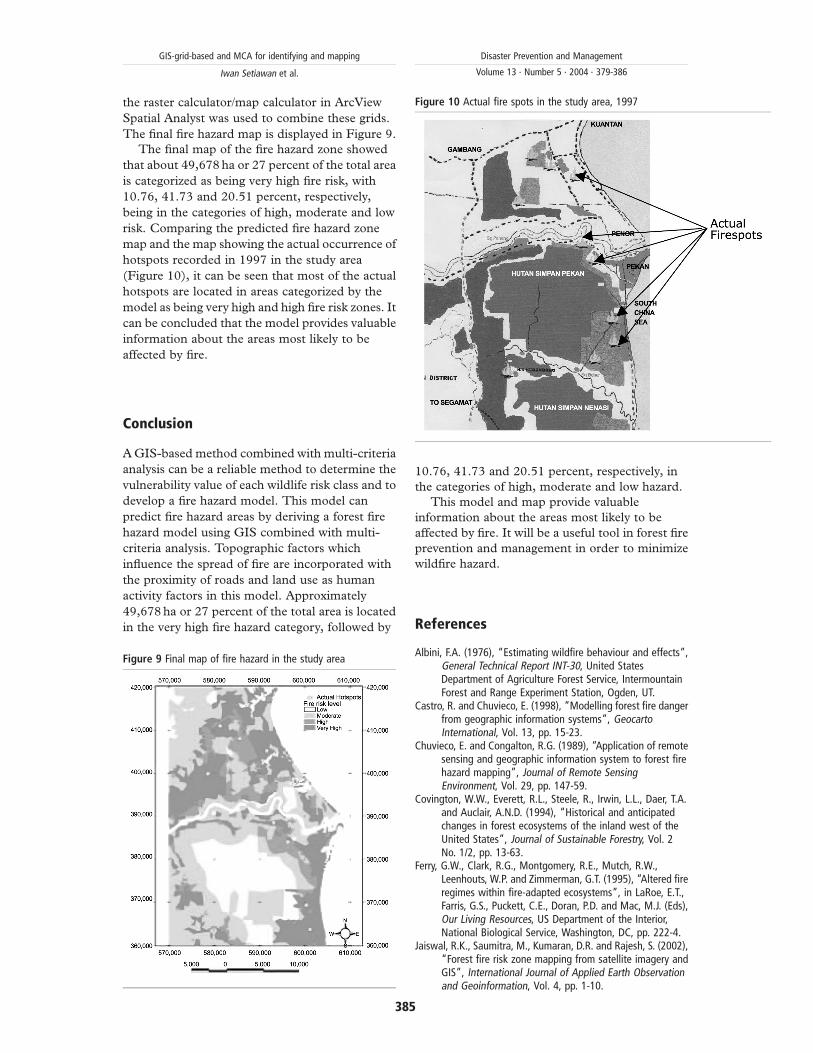
risk. Comparing the predicted fire hazard zone
map and the map showing the actual occurrence of
hotspots recorded in 1997 in the study area
(Figure 10), it can be seen that most of the actual
hotspots are located in areas categorized by the
model as being very high and high fire risk zones. It
can be concluded that the model provides valuable
information about the areas most likely to be
affected by fire.
Conclusion
AGIS-based method combined with multi-criteria
analysis can be a reliable method to determine the
vulnerability value of each wildlife risk class and to
develop a fire hazard model. This model can
predict fire hazard areas by deriving a forest fire
hazard model using GIS combined with multi-
criteria analysis. Topographic factors which
influence the spread of fire are incorporated with
the proximity of roads and land use as human
activity factors in this model. Approximately
49,678 ha or 27 percent of the total area is located
in the very high fire hazard category, followed by
10.76, 41.73 and 20.51 percent, respectively, in
the categories of high, moderate and low hazard.
This model and map provide valuable
information about the areas most likely to be
affected by fire. It will be a useful tool in forest fire
prevention and management in order to minimize
wildfire hazard.
References
Albini, F.A. (1976), “Estimating wildfire behaviour and effects”,General Technical Report INT-30, United StatesDepartment of Agriculture Forest Service, IntermountainForest and Range Experiment Station, Ogden, UT.
Castro, R. and Chuvieco, E. (1998), “Modelling forest fire dangerfrom geographic information systems”, GeocartoInternational, Vol. 13, pp. 15-23.
Chuvieco, E. and Congalton, R.G. (1989), “Application of remotesensing and geographic information system to forest firehazard mapping”, Journal of Remote SensingEnvironment, Vol. 29, pp. 147-59.
Covington, W.W., Everett, R.L., Steele, R., Irwin, L.L., Daer, T.A.and Auclair, A.N.D. (1994), “Historical and anticipatedchanges in forest ecosystems of the inland west of theUnited States”, Journal of Sustainable Forestry, Vol. 2No. 1/2, pp. 13-63.
Ferry, G.W., Clark, R.G., Montgomery, R.E., Mutch, R.W.,Leenhouts, W.P. and Zimmerman, G.T. (1995), “Altered fireregimes within fire-adapted ecosystems”, in LaRoe, E.T.,Farris, G.S., Puckett, C.E., Doran, P.D. and Mac, M.J. (Eds),Our Living Resources, US Department of the Interior,National Biological Service, Washington, DC, pp. 222-4.
Jaiswal, R.K., Saumitra, M., Kumaran, D.R. and Rajesh, S. (2002),“Forest fire risk zone mapping from satellite imagery andGIS”, International Journal of Applied Earth Observationand Geoinformation, Vol. 4, pp. 1-10.
Figure 9 Final map of fire hazard in the study area
Figure 10 Actual fire spots in the study area, 1997
GIS-grid-based and MCA for identifying and mapping
Iwan Setiawan et al.
Disaster Prevention and Management
Volume 13 · Number 5 · 2004 · 379-386
385
Jo, M.H., Lee, M.B., Lee, S.Y., Jo, Y.W. and Baek, S.R. (2000), “Thedevelopment of forest fire forecasting system usinginternet GIS and satellite remote sensing”, available at:www.gisdevelopment.net/aars/acrs/2000/ps3/ps310.shtml
Leenhouts, B. (1998), “Assessment of biomass burning in theconterminous United States”, available at:www.consecol.org/vol2/iss1/art1/
Mutch, R.W., Arno, S.F., Brown, J.K., Carlson, C.E., Ottmar, R.D.and Peterson, J.L. (1993), “Forest health in the BlueMountains: a management strategy for fire-adaptedecosystems”, General Technical Report, No. PNW-GTR-310, United States Department of Agriculture, ForestService, Pacific Northwest Research Station, Ogden, UT.
Rothermel, R.C. (1972), “A mathematical model for predictingfire spread in wildland fuels”, General Technical Report,No. INT-115, United States Department of Agriculture,Forest Service, Intermountain Forest and RangeExperiment Station, Ogden, UT.
Saaty, T.L. (1977), “A scaling method for priorities in hierarchicalstructures”, Journal of Mathematical Psychology, Vol. 15,pp. 234-81.
Salas, J. and Chuvieco, E. (1994), “Geographic informationsystems for wildland fire risk mapping”, Wildfire, Vol. 3No. 2, pp. 7-13.
Wan Ahmad, W.S. (2002), “Forest fire situation in Malaysia”,IFFN, No. 26, pp. 66-74. available at: www.fire.uni-freiburg.de/iffn/country/my/my_2.htm
Further reading
Chuvieco, E. and Congalton, R.G. (1988), “Mapping andinventory of forest fire from digital processing of TMdata”, Geocarto International, Vol. 4, pp. 41-53.
Darmawan, M., Masamu, A. and Satoshi, T. (2000), “Forest firehazard model using remote sensing and geographicinformation systems: toward understanding of land andforest degradation in lowland areas of East Kalimantan,Indonesia”, available at: www.crisp.nus.edu.sg/, acrs2001/pdf/234darmawan.pdf
Wirawan, N. (2000), “Factors promoting the spread of fire”,available at: www.unu.edu/unpress/unupbooks/80815e/80815Eoq.html
About the authors
Iwan Setiawan, A.R. Mahmud, S. Mansor,
A.R.Mohamed Shariff andA.A. Nuruddin are
all in the GIS & Geomatic Laboratory,
Department of Civil Engineering, Faculty of
Engineering, University Putra Malaysia, Serdang,
Malaysia.
GIS-grid-based and MCA for identifying and mapping
Iwan Setiawan et al.
Disaster Prevention and Management
Volume 13 · Number 5 · 2004 · 379-386
386