Integrated Management Plan for North Selangor Peat Swamp ...
Upload
khangminh22Category
view
4download
0
JAMK UNIVERSITY OF APPLIED SCIENCES | JAMK.FI
FUEL PEAT PRODUCTION TECHNOLOGYEija Alakangas | Pekka Hölttä | Mari Juntunen | Tero Vesisenaho
TRAINING MATERIAL

Fuel peat production technology

Jyväskylän ammattikorkeakoulun JulkaisuJa 120
eiJa alakanGasPekka HÖlttä
mari Juntunentero vesisenaHo
energiaturpeen tuotantotekniikkakoulutusaineisto
PUBLICATIONS OF JAMK UNIVERSITY OF APPLIED SCIENCES 140
Fuel peat production technologyTRAININg MATERIAL
EIJA ALAKANgASPEKKA HöLTTä
MARI JUNTUNENTERO VESISENAHO

PUBLICATIONS OF JAMK UNIVERSITY OF APPLIED SCIENCES -SERIESEditor • Teemu Makkonen
© 2012Authors & JAMK University of Applied Sciences
FUEL PEAT PRODUCTION TECHNOLOgYTraining Material
Coverphotos • Tuomo Vilkkila, Tero Vesisenaho, Mari Juntunen & Plugi OyOutlook • Pekka Salminen
Layout & printing • Juvenes Print – Suomen Yliopistopaino Oy, Tampere 2012
ISBN 978-951-830-245-5 (BOUND)ISSN 1456-2332
SALES & DISTRIBUTIONJAMK University of Applied Sciences Library
P.O. Box 207, FI-40101 JyväskyläRajakatu 35, FI-40200 Jyväskylä
Tel. +358 40 552 6541E-mail [email protected]
www.jamk.fi/julkaisut
ISBN 978-951-830-458-9 (PDF)ISSN-L 1456-2332
DISTRIBUTION

Contents
FOREwORD ..................................................................................................................... 7
UNITS............................................................................................................................... 8
1 FINNISH PEAT RESOURCES ...................................................................................... 9
2 PREPARATION OF PEAT PRODUCTION ................................................................12
2.1 Investigating the pre-conditions for peat production ...................................12
2.2 Environmental legislation concerning peat production ..................................14
2.3 Planning the production area .............................................................................18
2.4 Water treatment in peat production area ........................................................19
2.5 Preparation of a production area ......................................................................23
2.6 Maintaining the production area ......................................................................27
3 PRODUCTION TECHNIqUES FOR MILLED PEAT ..................................................29
3.1 Production methods generally ............................................................................29
3.2 HAKU-method .......................................................................................................30
3.3 Milled peat drying ................................................................................................31
3.4 Milled peat production work phases .................................................................34
3.4.1 Milling ..........................................................................................................34
3.4.2 Harrowing ....................................................................................................36
3.4.3 Ridging .........................................................................................................38
3.4.4 Loading milled peat ....................................................................................40
4. SOD PEAT PRODUCTION TECHNIqUES ...............................................................44
4.1 The principle of sod peat production ................................................................44
4.2 Sod peat production ............................................................................................45
4.2.1 Cutting the peat .........................................................................................45
4.2.2 Preparation and shaping peat to sod peat ............................................46
4.3 Effectiveness in sod peat production ...............................................................49
4.3.1 Production/metre and loading of the field ............................................49
4.3.2 The settings, adjustments and condition of the production
equipment ..............................................................................................................50
4.4 Sod peat drying and structure formation .........................................................50
4.4.1 Principles of drying ....................................................................................50
4.4.2 Wave-like sod peat drying ........................................................................53

4.4.3 Harrowing cylindrical sod peat .......................................................................54
4.4.4 Loading sod peat ...............................................................................................55
5 STOCKPILINg PEAT ..................................................................................................57
5.1 Stockpiling milled peat ........................................................................................57
5.2 Stockpiling sod peat ............................................................................................59
5.3 Factors affecting storability of the peat stockpile .........................................61
6 PEAT AS A FUEL .......................................................................................................64
6.1 general ...................................................................................................................64
6.2 Peat quality standards, sampling and determination of properties ............65
6.3 The most important characteristics of peat ....................................................68
6.4 Peat in a fuel blend ..............................................................................................81
REFERENCES .................................................................................................................84

7jamk
Foreword
This fuel peat training manual is a newly translated and updated edition of work undertaken by Eija Alakangas and Pekka Hölttä originally pub-lished by VTT (VTT Technical Research Centre of Finland). The work was based on the results from the publicly financed Optimiturve and Bioenergy programmes. This new edition presents the latest developments in fuel peat production methods, including: preparing the peatland, peat production machines usage and fuel peat characteristics.
The material is intended as a practical reference guide for teach-ers and educators, it is also suitable as a manual for bioenergy sector experts, peat producers and as a self-study material for students. The original edition has been updated as a part of the project of “Securing Skilled Labour for the Central Finnish Bioenergy Cluster “, which was managed by Western and Central Finland’s Regional State Administra-tive Agency and JAMK University of Applied Sciences and supported by The Association of Finnish Peat Industry. Since June 2012 the activities of The Association of Finnish Peat Industry has been supported by The Bioenergy Association of Finland.
Writing and editing in the original edition has been the responsibility of Mari Juntunen from JAMK, under the supervision of Pekka Hölttä from K-S Ekoturve Oy and Tero Vesisenaho from JAMK. Eija Alakangas from VTT has written chapter 6. Final translation was undertaken by Anthony Pickén from Rootzone Projects and edited by Liisa Vesterinen from JAMK. Photos of the different phases of the production process are from Suokone Oy, Turveruukki Oy, Vapo Oy, VTT, Laura Vertainen from JAMK and the writers.
In October 2012
Eija Alakangas, VTT Technical Research Centre of FinlandPekka Hölttä, K-S Ekoturve OyMari Juntunen, JAMK University of Applied SciencesTero Vesisenaho, JAMK University of Applied SciencesLiisa Vesterinen, JAMK University of Applied Sciences

8 jamk
Units
1 m3 milled peat equals to approximately 0.91 MWh1 m3 sod peat equals to approximately 1.27 MWh
1 MWh = megawatt hour = 1000 kWh1 GWh = gigawatt hour = 1000 MWh1 TWh = terawatt hour = 1000 GWh = 1 mill. MWh1 MJ = megajoule = 0.278 kWh1 GJ = gigajoule = 0.278 MWh
dm = dry matter
Glossary of terms used can be found in the Appendix 6.

9jamk
1 Finnish Peat Resources
Finland’s peat resources inventory/mapping is done by the Geological Survey of Finland and the Finnish Forest Research Institute (Metla). Data from different sources has some differences depending on classifications and limitations used. Total surface area of mires and peatlands are ap-proximately 9.3 million hectares, of which 300,000 ha is agricultural peatland and peat production areas (FIGURE 1). More than half of Finland’s peatland area, ca 5.1 million hectares is drained (Proposal for national strategy for sustainable and responsible use of peatlands 2011, 18). In forestry statistics mire/peatland area is defined as an area with more than 75 percent of mire vegetation. Due to this definition land area classified as peatland is not constant, but mires are moving to the category of boreal forest for example mire vegetation decreasing due to drainage.
FIgURE 1. Use of peatlands (TTL Turveinfo)
Peatland defined in a biological way covered in the 1920’s in Finland 12 million hectares and in an inventory carried out in 1950’s 10.4 mil-lion hectares. Part of the peatlands have changed and classified under most recent investigations to other land area types. There are 5.1 million hectares of peatland areas with over 20 hectares unit size. Industrially usable peatland of this is 0.62 million ha and in protection programs 1.1 million ha. There are a little over 33,000, over 20 hectares peatlands and their average surface area is 153 ha and average depth ca 1.5 m.

10 jamk
The quantity of peat in Finnish peatlands is 69.3 billion m3, with a dry material content of 6.3 billion tonnes. The amount of peat types suitable for fuel peat is 23.7 billion m3. In a m3 of bog there is on aver-age 0.54 MWh of energy. This means that in peatlands suitable for peat production there are 12,800 TWh (46,080 PJ, 1,100 Mtoe) of energy (Virtanen et al. 2003). Currently there are 63,000 hectares of peatland in peat production, 4.7 million hectares drained for forestry and the area of agricultural peatland is estimated to be 134,000–240,000 hectares. (Turveteollisuusliitto Ry/ Association of Finnish Peat Industries.)
Peat utilisation has long traditions in Finland. Well decomposed peat types are used in energy production and the less decomposed peat in the surface layers of the peatlands have suitable characteristics for agricul-tural and horticultural purposes and for environmental uses. Finland is dependent on imported fuels and the share of imported energy is ap-proximately 70%. Wood and peat are the most important domestic fuels and their share of energy consumption is approximately 25%. The share of peat in district heat production and combined production of electric-ity and district heat (CHP) is 20 percent. (Energianhankinta, kulutus ja hinnat 2011/Energy purchasing, consumption and prices 2011.) At the moment approximately 1 million Finnish people’s home are heated by burning peat. The use of peat continues within the limits regulated by environmental targets. Long term climate and energy strategy lines the target of peat energy use to be 20 TWh (72 PJ, 1.72 Mtoe) year 2020. According to the update of Energia- ja ympäristöturpeen kysyntä ja tar-jonta vuoteen 2020/The supply and demand of the energy and environ-mental peat by year 2020 (Flyktman, M. 2012) the use of peat for energy will rise up to 23–25 TWh/y (83–90 PJ/y, 1.98–2.15 Mtoe/y). In 2000’s annual peat consumption has been used for energy production 20–29 TWh (72 -104 PJ, 1.72–2.49 Mtoe) and the annual peat extraction has been 11–35 TWh (40–126 PJ, 0.95–3.01 Mtoe) (FIGURE 2). The factors affecting peat use are for example the price of peat condensate energy, development of energy taxation, emission trade and utilisation of wood in energy production (Proposal for national strategy for sustainable and responsible use of peatlands 2011, 59).

11jamk
FIgURE 2. Production and use of fuel peat (Pöyry PLC).

12 jamk
2 Preparation of peat production
2.1 Investigating the pre-conditions for peat production
Geological Survey of Finland (GTK) carries out inventories of Finland’s peat resources, their quality and quantity, by making general estimations both in municipality and by region based reports. Reports of these inves-tigations are used also by the companies in the peat industry, in planning peatland purchasing. Purchasing an area large enough for production means usually a large quantity of work and demands a long time period for the peat producer. Buying or renting an area is usually negotiated with several land owners. Before the purchase decision the pre-conditions of the production possibilities have to be investigated. Peat producers have approximately 140,000 hectares of peatland under their management, while at the moment 62,000 hectares are in fuel peat production and 9,400 hectares are under preparation (Proposal for a national strategy for sustainable and responsible use of peatlands 2011, 67). Annually 2,000–3,000 hectares are released from production and 1,500–2,000 hectares are taken to production (Turveteollisuusliitto Ry/ Association of Finnish Peat Industries).
Peatland suitability for peat production is affected by many factors related to location, hydrology and peat characteristics. These can be defined by map and field investigations. During the planning stage map-ping is done with 100x50 m study point intervals. For example ground penetrating radar can be used in mapping to create a profile of the peat layer (FIGURE 3).
Peatland suitability to peat production is defined by these factors:
• Peat layer thickness• Peat type• Mineral subsoil• Topography/height of peat layer surface and base

13jamk
• Peat characteristics – Density – Net calorific value – Ash content – Sulphur content – Heavy metals content
• Technical and economical factors – Peatlands location in relation to user – Road connections – Tree stand quality on the peatland, wood material in peat – Environmental factors (watercourses, housing, protected areas
and flora/fauna values)
FIGURE 3. Mire development (Geological Survey of Finland).

14 jamk
In purchasing peatland the critical criteria are peat layer thickness and other quality factors like the composition of the peat, degree of decompo-sition and ash content (see chapter 6). The composition of the peat means sedge (Carex), sphagnum (Sphagnum) or a peat type that is a mixture of sedge and sphagnum. The decomposition degree is determined according to von Post (1922) method. The method is based on compressing peat in the hand and estimating the peat quantity pressing through the fingers and the quality of peat remaining in hand. The decomposition scale is described with the scale H1–H10. Peat is suitable for fuel, if the degree of decomposition is higher than H4, but sedge peat can be used at lower degrees of decomposition. The ash content increases when the degree of decomposition increases. Also mineral material brought by flooding to the peatlands increases ash content. Ash decreases the net calorific value and causes problems in combustion.
Regional planning steers land use and area reservations for peat pro-duction. Regional plans do not though guarantee or obligate taking an area to use in peat production. Land use planning will in future take into consideration the natural state classification of peatlands, which classi-fies peatlands based on the natural state of their hydrology. This natural status classification includes six classifications that divide peatland areas by different degrees of natural state or degree of loss of natural state (Proposal for national strategy for sustainable and responsible use of peatlands 2011, 117).
2.2 Environmental legislation concerning peat production
Environmental impacts of peat production are taken into consideration already in the land purchasing phase. The aims are preventing negative environmental impacts. The peat producer must be adequately aware of the environmental impacts of peat production and the relevant legisla-tion, to be able to act according to the legal requirements (Myllyntaus 2009, Väyrynen et al. 2008):
• Environmental Decree and Act (86/2000 and 169/2000)• Environmental Impact Assessment Decree and Act (468/1994 and
713/2006)• Nature Protection Decree and Act (1096/1996and 160/1997)• Water Decree and Act (264/1961 and 282/1962)

15jamk
• Decree and the Act on Water Resources Management (1299/2004 and 1040/2006)
• Waste Decree and Act (1072/1993 and 1390/1993)• Law for Certain Neighbour Relations (26/1920)• Land use and Building Decree and Act (132/1999 and 895/1999)• Environmental Indemnity Insurance Decree (81/1998)• Antiquities Decree (295/1963)• Cabinet of the State Decision on Noise Level Guidance Values
(993/1992)• Cabinet of the State Decision on Air Quality Guidance Values and
Target Values for Sulphur Fallout and Cabinet of the State Act on air quality (480/1996 and711/2001)
• The Ministry of Trade Decision on flammable liquids (313/1985)• Hazardous Chemicals and Explosives Handling Safety Decree
(390/2005) and Act (59/1999)• Instruction for fire safety of peat production areas 2006• Mining Waste Directive (2006/21/EY)
The environmental Decree defines the needs for permits, and the objective of the decree is preventing pollution. An environmental permit is needed for an area, that is drained and over 10 ha. With areas that require an environmental permit, best available technology (BAT) must be used also the best environmental practice (BEP). Environmental permit authorities are (AVI) Regional State Administrative Agency and (ELY) The Centre for Economic Development, Transport and the Environment. ELY cen-tres control decisions (environmental and water permits) issued by the Regional State Administrative Agencies.
Environmental Impact Assessment Decree and Act concerns produc-tion areas with surface area over 150 hectares. Environmental impacts assessment (EIA, Finnish YVA) considers environmental impacts of the peat production and compares the impacts of different practical measures. Different alternative measures are compared to the situation without peat production, where there are no negative impacts from production. Dif-ferent alternative measures are different surface-areas, water purification methods and alternatives for storage areas and road arrangements. EIA gives the general public the possibility to comment and it can be applied also to areas smaller than 10 hectares, if there is an estimated significant negative impact on the environment. More information about the EIA is available for example in the peat production environmental production

16 jamk
guidelines, published by Northern Ostrobothnia Environmental Agency (Pohjois-Pohjanmaan Ympäristökeskus 2008, Väyrynen et al. 2008).
By referring to the Nature Protection Decree in the early stages of planning the natural protection areas, protection programs and special protected species or habitats are taken into consideration. The law also protects animal species, bird nesting trees and plant species.
The Water Decree requires permit for actions, if this causes changes to the watercourse, like flood risk, decrease of water quantity or difficul-ties in water usage. Generally peat production does not require a permit according to the Water Decree. Water Decree 10 chapter 6 § defines, that drains, ditches, to where peat production drainage water will be steered, must be covered by an agreement with the land owner. Otherwise if no agreement has been reached then a water release permit must be applied for according to the Water Decree.
Decree and Act for Water Resources Management sets objectives for water status. Any measures taken must not damage or harm the water-course, this will threaten the status of surface water or ground water. The legislation also aims at improving the status and reclamation of watercourses.
Waste Decree orders that the waste producer is responsible for correct treatment of waste and that it is carried out in a suitable way. The waste producer must be able to present proof of correct handling of waste. Waste production must also be minimized, there must be records of the waste quantity and disposal of waste into the environment is prohibited.
When the effects on nearby buildings and housing areas from peat production are estimated, Law for Certain Neighbour Relations is used. Loading to watercourses or the local environment from the peat produc-tion can be for example noise or dust.
Land Use and Building Decree and Act include the regulations about national land use objectives. Regional plans are one of the tasks of the Regional Councils. Peat production areas are established according to regional plan to ensure that production and nature protections needs are taken into consideration: both the biodiversity and economy of the operations. Peat production reservation include only already ditched peat-lands. According to the Proposal for National Strategy for sustainable and responsible use of peatlands, proposals classification method for peatlands should become part of the evaluation of natural status. More information of the regional plans is available in the home page of the Regional Councils, www.reg.fi . As stated in the Building Decree and Act a building on a peat production area requires a building permit.

17jamk
Insurance according to Environmental Indemnity Insurance Decree must always be valid for a peat production area, when the operations require permit according to Environmental Decree or permit according to Water Decree.
The Antiquities Decree protects any ancient or historical remains that can be discovered also in peat production areas. If there is a reason to suspect that a discovery is likely to be ancient or historical remains, working must be interrupted and an announcement to the National Board of Antiquities must be made.
Cabinet of the State Decision on Noise Level Guidance Values defines the guidance values for different areas for daytime and night time. These values must be observed.
Guidance levels for air quality have been defined by a Cabinet of the State Decision in an Act. The objective is to prevent health or nature hindrance or discomfort.
The fire safety of the peat production areas is considered in the han-dling of flammable liquids and chemicals. There is also a special fire safety instruction for peat production areas. Fuel oil and other chemicals, like waste oil, storage must also be taken into consideration. Establishing a peat production area must be announced to the emergency authorities latest when the environmental permit is being applied for. In the an-nouncement all information needed for rescue, like driving instructions, contact information and site map are necessary and must be made avail-able. The plan is complemented always according to needs. Employees of the production area must get an introduction in their annual training. When risks are recognized, can fires be better prevented. Fires in peat production areas are caused by self-ignition of stock piles, sparks from machinery and lack of care in work methods.
According to the Mining Waste Directive the surface soil, wood mate-rial and sedimentation pond sludge must be covered by a waste manage-ment plan that includes waste quantities, utilization and final deposit/disposal.

18 jamk
2.3 Planning the production area
Preparing a peatland for peat production status.
• PLANNING THE PRODUCTION AREA• Dividing the area into different sections/ strips (within the
sections)• Drainage and water treatment plan• Fire protection plan• Road network• Planning the buildings and their bases, for example waste
collection point
• FIELDWORK• Mapping, measuring the site and marking it out ready
• FINAL PRODUCTION PLAN
• ANNOUNCEMENT OF THE PRODUCTION PLAN TO ELY -CENTRE (The Centre for Economic Development, Transport and the Environment)
• PREPARATION MEASURES FOR THE PRODUCTION AREA• Removing trees• Building the water treatment system• Drainage• Uprooting stumps and removing other subsurface wood• Preparing the fields• Building roads, base and storage areas
Preparing the area for peat production is started by making a prelimi-nary production plan. The preliminary plan is the basis for preparation measures. The measurement group carefully marks out areas correctly. During this planning/survey phase also the detailed location of fire and sedimentation pools are planned. Using the correct working order helps to decrease the loading on watercourses and passing this on to any recipient. Water treatment systems are placed and prepared before draining the site.
Usually main drainage ditch, collection ditches and side ditches are marked with posts, so that gradient relations and excavation work can

19jamk
be carried out. Separation/ perimeter ditches stop external water from entering into the production area. After checking alignment and marking, the final production plan is made. The field area is divided with ditches into sections and even down into more detail into 20 m wide field strips between parallel ditches. With these ditches part of the peatland water is removed. Mire includes 80–95% of water (FIGURE 4). Ditching will reduce the moisture content of the peatland by approximately 5%. Dur-ing the whole pre-production stage 30% of the total drying takes place (Leinonen 1991).
FIgURE 4. Peatland water balance in the different stages of production (Turveteollisuusliitto Ry /Association of Finnish Peat Industries)
2.4 Water treatment in peat production area
Peat production causes nutrient and solids loading to the watercourses (water loading). Though peat productions share of the total nitrogen and phosphorus loading to watercourses in Finland is small, it has lo-cal significance, when peat production is a large share of the catchment area. Solids loading is round-the-year and at its highest when the flow rate is high, in the spring during the snow melting and during the heavier rains of the summer. Besides the weather conditions peat composition, decomposition degree and production phase have an impact on the water loading. Water treatment methods for the peat production area are the key to preventing the water load. During recent decades methods have been continuously developed.
Areas over 10 ha of peatland require an environmental permit, and these must have water treatment. The proposal for the national strategy

20 jamk
for sustainable and responsible use of mires and peatlands (2011) recom-mend removing the 10 ha limit from the Environmental Protection Act. This would also mean water treatment requirement for production areas smaller than 10 hectares.
While selecting the water treatment methods, case specific conditions and utilisation interval should be taken to consideration. The impact of the water loading to any recipient must be recognized in the watercourses affected. Best available technology (BAT) and Best environmental practice (BEP) must always be used. At the moment, best available water treat-ment technology for peat production is overland flow field or chemical treatment (Väyrynen et al. 2008, 34.)
Water treatment methods in peat production can be divided into three classes according to their principle (Turvetuotannon vesienkäsittelyme-netelmien kuvaukset / Water treatment methods in peat harvesting 2009):
• Mechanical adjustment of flow – Filtration methods – Using vegetation
• Soil filtering • Chemical methods
Field ditch structures have been in use in peat production since 1970’s. Parallel ditches segment the production area into field strips. Water drain-ing from the production field travels through these ditches to the col-lection ditch and further to the final treatment. The sludge sumps and sludge filters at the end of field ditches remove solids. Solids start settling down to the bottom of the ditch and to the special sludge sump due to the slowing in the water flow. Sludge filters and sludge sumps (headland drain traps) are located at the lower end of the ditch. In longer ditches similar structures can also be located at a point along its length; there the traps are called field ditch traps. A sludge filter is usually made of vertical strainer or sieve pipe.
From the field ditch, water gets to a collection ditch via a headland drain pipe, this construction also acts as a dam. Headland drains are 18 m long plastic pipes that allow machinery to use the headland and move from one filed strip to another. Field ditches and sludge sumps are cleaned from sludge at least once a year, at the end of the production season.
Subsurface drainage can be done using pipe drainage or by mole drainage. Pipe subsurface drainage suites well to old production areas that

21jamk
are getting shallow. Mole drainage is mainly used as a complementary measure for open ditches. Subsurface drainage can lower the starting moisture of the milled peat on the surface and in that way shorten the drying period and also decrease the water loading.
Peak runoff control dam is commonly in use in peat production areas as a water treatment and for cutting peak flows. The functional principle is to limit the flow rate and to prevent flushing away of solids. Runoff control dams can in principle be installed to any ditch, but they function best in collection ditches and especially in connection with a sedimenta-tion pond. Readymade weir/dam modules are available for peak runoff control.
Overland flow field is based on infiltration of drainage waters to the surface layer of a peatland. Vegetation and soil filter out solids and sludge and also restrain dissolved nutrients. This method has been used since 1985 and it is aimed at round the year water treatment. Water is directed to the overland flow field via sedimentation ponds and then distributed along the field. Pumping stations are built in connection to overland flow fields when the natural gradient is not large enough to take the water to the field via a ditch. In these cases water is lifted to the overland flow field with a pump from a special pump pool.
Pump drainage. Usually the peat production area is drained naturally with ditches, using the natural slope. Generally this has been successful, but with some lower lying areas seasonal and floods following rainy periods have become challenging. Problems increase when the surface of the field is lowered by harvesting. In some areas the natural drainage is limited by natural features, for example large rocks in the bottom of ditches. Lowering these can be very expensive. The most common rea-son lies with the origin of the peatland/mire. The majority to the mire development has taken place in areas where the surface of the draining watercourse is high and prevents fast drainage. A large share of the peat-land areas reserved by peat producers have the basal peat at the same drainage level as the river or lake flood level. In these areas the spring start of the production is delayed by flooding for a longer period than in average peatlands. When a pumping station is in use around the year, or if the power source is near the pump, it makes sense to arrange pumping with electricity, considering the maintenance and monitoring. In the long run this is a better solution than a fuel-demanding combustion engine (Klemetti & Sänkiaho 1992).

22 jamk
FIGURE 5. Principle drawing of a pumping station (Vapo Oy).
Sedimentation ponds receive drainage water around the year. It is constructed at the edge of the peat production area in connection to the main drain out from the peatland. The sedimentation pond retains solids and nutrients tied to the solids. Solids settle to the bottom of the pond and this sludge is removed a minimum of once a year to the sludge disposal area nearby. In case of overloading the sedimentation pond can be accompanied with an overflow field, where excess water infiltrates to the soil.
Vegetation filtration field or pools function is based on natural vegeta-tion restraining solids and nutrients. Water flows through the vegetation and leaf litter where solids then settle out and the plants can use the nutrients. Vegetation fields only function during the bare land period. Method is best suitable to melting water and flood water final treatment.
Chemical treatment is used in the summer period. It is based on the same treatments as for drinking water purification. Drainage water is collected in a ditch, from where the water is pumped for blending. From here it flows to the clarification pool, where coagulated nutrients and solids settle out on the bottom. The pool is cleaned regularly. This method is new and is used in the largest production areas.
Water treatment systems are constructed according to regulations. There are instructions for the measures of structures. These are related to the production catchment areas size, water stay over time in the pool, surface load in the sedimentation pool and the volume of the sludge space in the pool. Waters from outside are prevented from entering the production area, using perimeter ditches. Additional information of the water treatment methods can be found in the guide “Turvetuotannon vesienkäsittelymenetelmien kuvaukset” (Water treatment methods in

23jamk
peat harvesting) by Turveteollisuusliitto Ry (Association of Finnish Peat Industries) from the year 2009.
2.5 Preparation of a production area
Preparing peatland for peat production is usually started by removing the tree stand. Removing the tree stand is carried out in the winter, when the peatland can carry the needed machinery.
Drying the surface of the peatland and lowering the ground water table are the requirements for production. The aim for drainage is getting the water table so low that capillary lift of the water to the surface of the fields stops or at least decreases and the fields can carry machinery. In Finland open parallel ditches 20 m apart is established as a suitable drainage method. Drainage is carried out in several stages during the whole operating life of a peat production area. Peat production involves several different types of ditches with different purposes (FIGURE 6).
FIGURE 6. Principle drawing of peat production areas drainage and water treatment system (Pohjois-Pohjanmaan ELY-keskus).

24 jamk
Excavation work is usually done with excavators with tracks or a tractor-digger that can move on relatively soft surfaces. In the basic drain-ing phase work must be carried out during as dry and low water condi-tions as possible. During the thawing of ground frost excavating work must be avoided. Digging the ditches is done upwards against the flow direction to make it possible for water to flow away. Many ditches are also made with screw-type ditch millers, which are also used for clearing the ditches during the actual production stage (FIGURE 7). In wet areas digging is done in winter during the ground frost. This way ditch edges will freeze to the shape and stay better unbroken. The wettest areas are ditched for pre-draining with a tractor-pulled pre-ditch-miller.
FIGURE 7. Ditch miller (Mari Juntunen).
Removing stumps and subsurface wood material. Large individual stumps are removed usually with a hook attached to an excavator or deep milling. Small surface wood material and small stumps can be re-moved with a deep plough or maintenance miller. Deep milling breaks up wood mixing it with the peat into relatively even quality blend to about 0.5 m depth. Clearing the surface can be done also with main-tenance miller, which breaks up stumps to approximately a depth of 10 cm (FIGURE 8). Large stumps and stump pieces are collected and removed from the production fields to a separate storage area, to be used also in energy production.

25jamk
FIGURE 8. Maintenance miller (Suokone Oy).
Profiling the fields and evening up. Production area´s fields are shaped so that they have a camber with the centre being 20–30 cm higher than the edges. This ensures that the surface in the middle of a field is further from the ground water table, which due to capillarity action is higher in the middle of the field than near the ditches. The field surface should become as smooth as possible along its length. Profiling the fields is done with a grading auger (FIGURE 9). After any auger work fields are then finished off with a profiling grader (FIGURE 10). Field ditches are still made deeper and cleaned before peat production can start.
FIgURE 9. grading auger (Vapo Oy)

26 jamk
FIGURE 10. Profiling/grading blade finishes the field surfaces to an even shape in both preparation and production stages of the peat production area´s life cycle (Vapo Oy).
Building the roads and storage places. During the preparation stage for a peat production area also the roads, harvested peat storage also known as stock pile areas and possible operating base are built. The quantity of roads is dependent on the production method choice (FIG-URE 11). Storage areas are located by the road sides and there must be enough of them to keep the transportation distance within production to a maximum of 500 meters. Storage areas must be well drained or built on dry land. This is to avoid the dry peat sinking into the material beneath and to assure that customers can get peat deliveries also during seasons/periods without ground-frost. The final equipment level of a production area depends on the size of the peat production area.
Besides roads and storage areas also the operating base is built for large production sites. Here also are located the weather observation equipment, social spaces for employees and storages for fuel and for solid and oil waste. Weather observation equipment is a minimum of a wind sock and meters for wind speed, direction and rainfall. All waste must be separated. Handling of problem waste requires care.

27jamk
FIGURE 11. Peat production area overall plan (Turveteollisuusliitto Ry/ Associaton of Finnish Peat Industries).
2.6 Maintaining the production area
Peat production areas profile, smoothness and the condition of ditches are important features for peat drying and keeping the load on the wa-tercourses low. If production areas maintenance is not good enough then this decreases both peat harvest quantity and quality: grain size in milling becomes uneven, left over in ridging grows and in harrowing the position of scoops won´t hold according to adjustments.
Maintenance work on the production area is carried out weekly. Weekly maintenance activities include inspections and actions according to the observations. Condition of ditches and the fields has an impact on the production, and any needed repairs must be done during the pro-duction season. These kinds of activities can be cleaning sludge filters or opening a ditch due to collapse of ditch side or other blockage.
Production area evenness secures field drying, because in a smooth field water does not form small pools on the surface. Profiling directs water into the ditches. In milled peat production the milling equipment also mill to the very edge of the field (FIGURE 12), this keeps the field in good enough condition so that just grading with a blade is often enough at the end of the production season. The most worn out milled peat production areas and sod peat production areas require almost without exception auger grading at the end of the season. Field ditches are cleaned of sludge when the production season is over.

28 jamk
FIgURE 12. Ditch edge grader (Suokone Oy).

29jamk
3 Production techniques for milled peat
3.1 Production methods generally
Over 90% of fuel peat is produced as milled peat. The main work phases are milling, harrowing, ridging and collecting. The different production methods differ from each other in the collection stage (FIGURE 13). Col-lection methods are loading with a loader to the trailers, ridge transfer method, mechanical collection wagon and vacuum harvesters. Method for collecting with a special loader “Haku” was developed in Finland and approximately 80% of milled peat is produced with this method. Vacuum harvester and mechanical harvester methods are used in smaller areas and in areas where the peat layer is getting shallow. These methods cover approximately 20% of milled peat production.
Peat production has got wind speed limits for high wind or gusty wind because of fire safety and production is completely interrupted when the wind speed exceeds 10 m/s (SM-2006-03459/Tu-312). Monitoring in case of fires must be arranged for periods of breaks in production. Environ-mental factors are taken to consideration case-specifically.
FIGURE 13. Work phases of milled peat production.

30 jamk
3.2 HAKU -method
Haku is the main peat production method in Finland (FIGURE 14). It suites best for large or medium -size production areas (over 100 ha). The main work phases are milling, harrowing, ridging and harvesting. The dry ridge of peat is collected with a conveyor belt loader into peat trailers, which take the peat to be added to a stock pile. If collection takes place after every harvest round, the method is the traditional Haku -method. When the Haku -method is used in larger production areas, it can be called the multiharvest method, because it is based on collecting multiple harvests at the same time. This method takes advantage of sunny and dry periods for drying as effectively as possible and 3–5 harvests are formed to a ridge before final collection.
FIGURE 14. Haku -method´s machinery. Milled peat loading, transport and adding to a stock pile. (Turveruukki Oy).
The principle of the multiharvest method is to produce milled peat so, that • milling has uniform quality, not a too thick layer and it has got
large grain size• harrowing and ridging is possible to carry out in case of multi-
harvest• leftover in ridging is small• loading multiharvest is carried out effectively • driving peat to a stock pile is carried out effectively

31jamk
Multiharvest method is suitable for relatively large production areas. It is an advanced variant of Haku -method and special production ma-chines have been developed for it, like
• levelling harrow• fire-safe multiharvest harrow• 9-meter ridge maker with brushes, flexible head, ridge profiler and
scaled surfaced• multiharvest loader• peat wagon and peat train for transporting peat on the fields
The principle idea is to divide production to drying and loading-transporting activities. Drying unit produces milled material to ridges when the conditions are right for drying. At these times millers, harrows and ridgers must be able to work in a situation, where there already is possibly quite a large ridge in the middle of the field strip. Also the load-ers must be able to handle a ridge that is larger than in the past. Even the transport trailers are for larger quantities.
The loading unit is easy to transfer and can be moved between dif-ferent production fields if needed. It can use either its own tractor or drying unit tractors according to the needs. The machinery is set up so that harvest cycle, in average evaporation conditions is 2 days. Effective use of machinery focuses on the time of effective evaporation to drying and during night time to transport and stockpile making. Usually the best evaporation period, from beginning of June to mid-July, minimum 20 hours of working per day takes place. Separating the drying and loading-transport to separate work periods is an effective and economical way of organizing work.
3.3 Milled peat drying
The energy for drying peat comes from the sun. When the suns radiation meets the peat surface to be dried, part of it is reflected back to the sur-rounding air. Part of the radiation converts to heat and the temperature of the peat surface starts to raise.
The temperature difference between the surface and deeper layers causes a heat transfer that causes the water evaporation from the milled peat and the field surface below the milled layer. In the beginning of drying, evaporation has the characteristics of evaporation from an open

32 jamk
water surface, but evaporation slows down as drying proceeds due to the dry insulating layer forming on the field surface. Harrowing aims to lift a moist layer to the surface and so speed up the drying process.
Also the field itself and the ground water table have an impact on drying. Peat drying is most effective when ground water table is lowest and water rise in the peat is minimal (FIGURE15).
FIgURE 15. Milled peat drying (Leinonen 1991).
In the milling the characteristics of the milled material are formed and these characteristics also have an impact on the drying. The most important factors are described below.
Average particle size. Drying is faster when particle size is larger. The im-pact of particle size is also dependent on the thickness of the milled layer, or in other words: load. The impact of particle size is most significant in case of H5-humified sedge peat. Also for highly decomposed sphagnum peat (H7) the impact of particle size on the drying time is significant: larger particle size decreases the drying time 30 percent. Impact is smallest in case of sphagnum-H5 and sedge-H7 peat. In these cases the decrease of drying time is only 10%.
The particle size of new milling is affected by the leftover from the last harvest round, the ridging leftover. Leftover is a combined impact of ridging and uneven field.

33jamk
Milling depth uniformity in the drying field, the connection between milled material and field and milling depth impacts on the drying process are dependent on the peat type and decomposition degree.
Drying after milling is also affected by the following factors:
Solar radiation. On a good sunny day the sun total radiation is approxi-mately 700 W/ m2 and in poor conditions 300 W/ m2. The majority of the received energy is consumed by water evaporating from the peat layer. While the peat layer dries a larger and larger share of the solar energy is lost as radiation, reflected back from the surface layer and as heat transferring from the layer to the air.
The solar radiation impact on the drying time is largest for sedge-H7- and sphagnum-H5-peats, for which double radiation almost halves the drying time. The smallest impact that solar radiation has is on sphagnum-sedge-H5-peat, for which the equivalent drying time decreases approxi-mately 40 percent. The quantity of the energy entering in the peat layer being dried, can be affected by compacting the layer. This increases the heat transfer and moves heat further down into the layer. The layer then dries faster.
Start and end moisture of the layer. The impact of rain on milled peat production is dependent on rain intensity and length in time. How eas-ily the milled material gets wet is also dependent on the peat type itself, decomposition degree and the start moisture.
In the Optimiturve -reserch programme the results show, that small 1–2 mm of rain increase the drying time only a little. In the case of rain quantities of 2.5–4 mm, the milled materials drying time increases sig-nificantly.
Height of ground water table. The drying of the peat layer is affected by the capillary rise of water, which is dependent on the distance to the ground water table. Water rise has an impact on the surface moisture. When the milled material dries on a moist field, evaporation is on-going in both the milled material and from the surface of the field below it. From the perspective of the effective drying, the water table should be at least 50 cm below the surface of the field, in sedge peat sites.
Climate conditions, like air temperature, relative humidity and wind speed have an impact on the milled material drying. In unstable weather conditions a thinner milled layer is needed to ensure drying.
34 jamk
Quantity of harrowtimes. Harrowing increases the proportion of air and adds to the drying effectiveness of milled material. Harrowing is carried out 1–3 times during one harvest cycle.
3.4 Milled peat production work phases
3.4.1 Milling
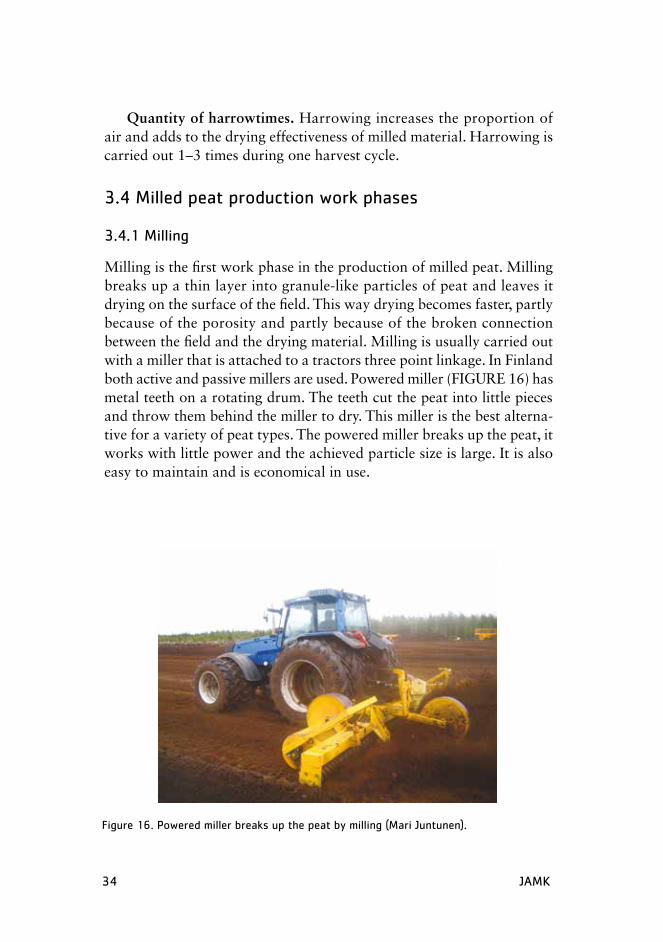
Milling is the first work phase in the production of milled peat. Milling breaks up a thin layer into granule-like particles of peat and leaves it drying on the surface of the field. This way drying becomes faster, partly because of the porosity and partly because of the broken connection between the field and the drying material. Milling is usually carried out with a miller that is attached to a tractors three point linkage. In Finland both active and passive millers are used. Powered miller (FIGURE 16) has metal teeth on a rotating drum. The teeth cut the peat into little pieces and throw them behind the miller to dry. This miller is the best alterna-tive for a variety of peat types. The powered miller breaks up the peat, it works with little power and the achieved particle size is large. It is also easy to maintain and is economical in use.
Figure 16. Powered miller breaks up the peat by milling (Mari Juntunen).

35jamk
The knife-miller (FIGURE 17) is a knife-like cutter, which is dragged to remove a granule-like layer from the surface of the field. The knife-miller maintains the profile of the field strip and makes a good milling even from highly decomposed peat. It is economical to maintain, but is not suitable for fields with peat including wood.
FIGURE 17. Knife-miller is suitable for fields where the peat layer getting shallow, also for highly decomposed peat. (Tero Vesisenaho).
Milling is a work phase that is very significant from the effectiveness point of view. Characteristics of the milling have a large impact on the drying of the peat. According to research the optimal particle size for drying is 10–20 mm. Average particle size is also affected by speed and milling-parameters. Average particle size becomes larger when
• milling depth increases• milling moisture is higher• driving speed of the miller is higher• leftover harvest quantity decreases • miller-drum rotating speed is lower
Milling depth and left over harvest have the largest effect on average particle size. The next most important factor is the rotating speed of the

36 jamk
milling drum. The least significant factors are driving speed and milling moisture.
Depending on the production conditions different operating settings must be selected. If the miller does not break the peat up correctly, must the driving speed be decreased and/or rotating speed increased. Milling depth is depending on the circumstances 10–30 mm. Milling depth has an impact on particle size, harvest rate and costs. In practice the harvest rate is 2–3 kg dm/m2. Milling depth is selected according to weather conditions and it must be increased to maximize the particle size. In practice lower than 20 mm milling depth is not used. This is because most production machinery is designed for a 2 day harvest cycle.
In good weather conditions milling depth can be increased up to 40 mm, which still keeps the harvest cycle within 2 days. For example when particle size grows from 5 mm to 15 mm, other factors being constant, drying period becomes 20–30% shorter. If harvest per hectare grows as much, cost will decrease 13–17 percent. The share of the costs for milling is approximately 10%. According to studies the particle size distribution (the presence of particles of different sizes) is relatively large. It would be important to produce uniform milling. The smaller the leftover share is, the larger is the particle size. This way the milling depth is greater while producing the same thickness layer of millings on the field surface.
3.4.2 Harrowing
Harrowing the milled material aim is for aiding drying and making it faster. Harrowing breaks the thin insulation layer formed in drying and increases the drying impact of radiation. On the other hand, harrowing increases the quantity of air in milled material and decreases heat con-duction. Harrowing also makes particle size smaller and removes more moist peat from the surface of the field.
Harrowing is done between 1 to 5 times in each harvest cycle. The impact of repeated harrowing to the length of drying period is highest with sedge-H5-peat, for which the drying period becomes 30% shorter, when the number of times harrowing is done changes from one to two. A third harrowing did not seem to have major impact on the drying period length in the conditions of the study period. The number of times har-rowing is done has the smallest impact on the length of drying period of sedge-sphagnum peat. In poor weather conditions harrowing speeds up drying 20–30% compared to milling that has not been harrowed. The first harrowing is carried out when approximately half of the initial water

37jamk
of the milled peat has evaporated (FIGURE 18). The success of the first harrowing is secured by doing it slowly. Driving speed for harrowing is 6–15 km/h. In good weather conditions the first and second harrowing are usually enough. The third and following harrowing are not as signifi-cant, but needed in varying weather conditions. Harrowing is successful, when the whole milled layer is harrowed and the harrowing has not cut new moist material from below.
FIGURE 18. Timing the harrowing. The optimal harrowing moistures (water-content) for the millings w1,opt and w2,opt, as a function of starting moisture, when the millings are harrowed two times per harvest cycle. If the start moisture of the millings are 75 w-% should the first harrowing be carried out in 64%: moisture and the next one in 56%: moisture (Hillebrand & Frilander 1997).
The harrow has got a working setup, so it can be lifted up for mov-ing the machine on wheels with rubber tyres (FIGURE 19). Harrows have been developed to cover the width of the field strip, so the working width is 19 meters. The qualities of the harrow have been improved for example by replacing the metal scoops with plastic ones. Plastic scoops are equipped with weights and adjusted so that the lowest points of the scoop meet the profile of the field. The benefits of plastic scoops are fire safety and that a plastic scoop is unlikely to mill new moist peat from the peat layer below during harrowing. Especially with the highly decomposed peat the plastic scoop is better than metal scoop. When working with white peat types with long fibres scoops then require a heavier weight.

38 jamk
FIgURE 19. Harrow with plastic scoops (Vapo Oy).
3.4.3 Ridging
When peat has dried to a suitable moisture level it is gathered from the field strip into a long narrow ridge in the middle of the field. From the ridge peat can be loaded and transported to a stock pile after every harvest cycle (Haku -method) or several harvest cycles can be combined by loading and transporting at once larger layered ridges (Multiharvest -method). Ridging is needed also for the mechanical collecting wagon method, which usually works with four separate ridges on the field per single harvest cycle. In the vacuum method milling is not ridged, but collected after harrowing with a vacuum harvester.
The objective of ridging is to gather well dried millings into a ridge. Ridging is usually carried out with a line ridger, which is operated in front of the tractor, while the milling machine is behind the tractor. This way ridging and the next milling can be done simultaneously. The last harvest cycle is driven without a milling machine (FIGURE 20).
The dry and usually fine leftover millings on the field slow down the drying of the next harvest. In practice the leftover with the traditional light metal ruler-ridgers has been 40–50 percent. Other possible problems have been inflexibility when the ridger has met a stump or a rock and the fire risk when ridger hits a rock. Both ridger and the tractor can also move sideways when the ridger meets a rock or a stump. When adjusted correctly, on smooth fields the ridger usually works well.

39jamk
FIGURE 20. Milled peat ridger, also known as ruler-ridger (Turveruukki Oy).
While milled peat ridgers makes the ridge to the right hand side, where also the controls are located, can the driver´s eye-focus be on the ridge. When the surface of the ridger is scaled plate, the dry millings move better along it towards the ridge. Simultaneously the millings are gathered better from the uneven surface of the field to the ridge. With a ridge profiler the ridge is finished to the desired form. For steering the ridge profiler a horizontal cylinder is installed to the tractor.
By adjusting the ridge profiler also the tractor can be controlled better to stay in a straight line. With a lifting head both stumps and rocks can be avoided, which decreases the fire hazard risk. Also the tractor can keep in a straight line and does not have to stop when meeting rocks and stumps. Flexibility spares both tractor and ridger. Because of the reduced drag the tractors performance also allows simultaneous milling and ridging.
Ridger equipped with a scaled-surfaced plate results a 10% smaller leftover than the traditional milled peat ridger and the average moisture- % of the ridges decreases by 5%.
While driving the ridger, it is important to take to consideration that adjustments must always be made according to the field being operated, not just at the beginning of the season. Driving speed must be kept reason-able, 7–8 km/h with a milling machine. Any broken parts must be fixed as soon as possible, because damaged parts result in less complete ridging.

40 jamk
3.4.4 Loading milled peat
3.4.4.1 Loading of milled peat in the Haku -method
In the Haku -method peat is loaded from a ridge with a slatted conveyor belt loader pulled by a tractor (FIGURE 21). A feeder device lifts peat onto the conveyor belt which lifts the peat up and transfers it into a trailer pulled by another tractor which is usually in the next field strip. The new loaders are easy to move from one peat production area to another. Loaders have rubber tyres and have better fire safety because of that. Also dust emission problems are reduced, because loading rounds are fewer.
FIGURE 21. Loading peat in Haku -method (Suokone Oy).
Transporting peat to the stock pile is the most expensive individual work phase in milled peat production and its share of stock pile m3 price is 30 percent. An increase in transport efficiency is often limited by lack of tractors to pull trailers.
The size for trailers in the Haku -method is traditionally 25–30 m3 and loading capacity 1,000–1,500 m3/h (FIGURE 22).

41jamk
FIGURE 22. Transporting peat to the stock pile in the Haku -method (Tero Vesisenaho).
3.4.4.2. Loading with mechanical harvester
A mechanical harvester is used on small and scattered peat production areas. It is suitable for wood free and smooth fields, for loading milled peat. This method is used mainly in southern and central parts of Finland. The mechanical collection wagon is more suitable for highly decomposed dark peat than a vacuum harvester which can include the risk of prob-lems with dust.
The mechanical harvester collects peat from a ridge. The ridge is made either simultaneously with the loading using a front mounted ridger (FIGURE 23) or separately before loading.
Usually there are 1–4 ridges made to a 20 m wide field strip and each one is collected separately. Depending on the size of the ridge and driv-ing distance the capacity of the wagon is over 45 m3/h working speed on 7–10 km/h.
The collection device moves the ridge onto an elevator, which takes the peat into the transport wagon. Emptying the wagon is done by dis-charging from the bottom of the wagon onto the side of the stock pile, or especially in the small production areas by driving over the stock pile. Stock piles are generally located at both ends of the field strips.

42 jamk
FIgURE 23. Mechanical harvester (Vapo Oy).
3.4.4.3 Collecting peat with vacuum harvester
Vacuum harvesters collect the peat directly from the field surface with a help of a vacuum air stream, (FIGURE 24). Vacuum harvester method produces high quality milled peat. There are very few impurities like wood or stones, in peat gathered with a vacuum harvester. Vacuum harvesting suites well to small production areas. Harvesting cycle is 1–2 days.
Vacuum harvester consists of collection head (width 1.5–1.8 m), and transfer ducts, separation cyclone or gravity separation chamber, con-tainer and blower. The air-peat mixture is vacuumed via mouth piece to the cyclonic separator, which is located above the container that is ap-proximately 40 m3. Vacuum harvesters collect the peat in their containers and transport it to the side or to the top of a stock pile, like mechanical harvesters. The power demanded from the tractor is approximately 85 kW. The capacity of one wagon is approximately 80–120 m3/h. The most suitable driving speed is 6–8 km/h and the air stream in the collection head should be in the region of 30 m/s.
To make vacuum harvesting as effective as possible, the proportion of time spent collecting should be as large as possible. This can be achieved if the peat production area is planned for vacuum harvesting originally. The field strip length has to be dimensioned to meet the wagons container size and stock pile locations. This is achieved when field strip length has the correct relation to the wagons load and collection capacity.

43jamk
The down side of the method has been dust emissions to the envi-ronment. In most modern machines an outgoing air cleaner decreases dust emissions so much, that using this method is possible even in those areas, where peat dust is not allowed to spread to the environment even in small quantities.
The benefit of vacuum harvester method is that even short sunny peri-ods in varying weather patterns can be utilized. Nevertheless the security storages of peat it is important to be able to achieve reasonable harvest rates also in varying weather conditions. With a vacuum harvester any dry millings can be gathered.
FIGURE 24. Vacuum harvester (Vapo Oy).
44 jamk
4. Sod peat production techniques
4.1 The principle of sod peat production
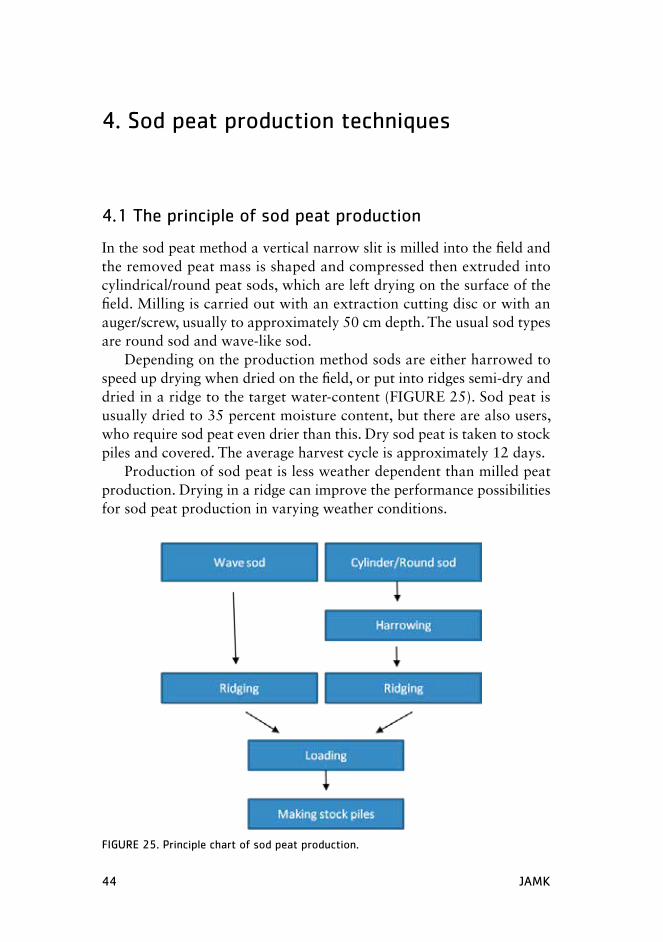
In the sod peat method a vertical narrow slit is milled into the field and the removed peat mass is shaped and compressed then extruded into cylindrical/round peat sods, which are left drying on the surface of the field. Milling is carried out with an extraction cutting disc or with an auger/screw, usually to approximately 50 cm depth. The usual sod types are round sod and wave-like sod.
Depending on the production method sods are either harrowed to speed up drying when dried on the field, or put into ridges semi-dry and dried in a ridge to the target water-content (FIGURE 25). Sod peat is usually dried to 35 percent moisture content, but there are also users, who require sod peat even drier than this. Dry sod peat is taken to stock piles and covered. The average harvest cycle is approximately 12 days.
Production of sod peat is less weather dependent than milled peat production. Drying in a ridge can improve the performance possibilities for sod peat production in varying weather conditions.
FIgURE 25. Principle chart of sod peat production.

45jamk
Sod peat production usually has 1–3 harvest cycles in a summer. The quantity of harvest cycles is also affected by the sod size used. A large sod size leads to the largest field loading and largest production rate per harvest cycle. Small sod size has the benefit of fast drying. Production rate is also affected by the loss rate. There is loss related to every work phase of handling the sods. The loss rate in sod peat production is usually 20–50%. Production rate per harvest cycle is 150–300 m3/ha.
Field requirements for sod peat productionThe most suitable peat type for sod peat production is within decomposi-tion degrees H5–H7 von Post (1922) scale. A lower degree of decomposi-tion causes problems in the mechanical functions. The power requirement for the machine grows because the only slightly decomposed peat is hard to remove from the field and shaping it is also difficult. Sods made of less decomposed peat also have a lower quality; these sods have higher porosity, break in handling and absorb rainwater. These problems result in lower energy content.
Wood content of the field also creates difficulties for sod peat pro-duction, but if there is only a reasonable quantity of wood, sod peat production is still possible. Disc-harvesting machine is not as sensitive to wood as the screw/auger machine. When there is a lot of wood in peat material, blockages appear in the extrusion part, disturbing wave forming in wave-like sod production. Both disc-harvesting machine and screw/auger machine require more depth from the peat layer than their own operating depth, which means minimum 0.8 meters depth requirement to the field. This causes under-capacity use in many shallow fields. In shal-low fields rocks cause damage to machinery and breaks in production.
4.2 Sod peat production
4.2.1 Cutting the peat
In sod peat production sod cutting and spreading onto the field is the most important work phase in the whole production cycle. It creates the conditions for drying.
These factors have an impact on drying:• field drying load• evenness of the drying load spread• sod contact to the field• smoothness of the field surface below sods

46 jamk
Besides these factors the cutting method and shaping have an impact on the sod density and hardness and this way also on the sod´s handling tolerance.
All these factors in sod peat production have a critical impact on the harvest. In sod peat production the cutting stage costs are approximately half of operating costs and approximately quarter of the total production costs. Sod peat cutting is relatively slow process and mostly requires a tractor with over 100 kW capacity.
The most usual sod peat production machines in Finland are disc-cutting machines. They remove peat from the field with a cutting disc that mills to approximately 0.5 m deep and 5–10 cm wide slit into the field. The disc throws the removed peat from the slit to the peat shaping screw. The screw mixes and shapes the peat mass and moves it to the extrusion nozzle where it becomes more compact and gets the shape of sod. The most common machine types are PK-1 and PK-1S-machines made by Suokone Oy (FIGURE 26).
FIGURE 26. Suokone Oy’s sod peat production machine Meri PK-1S (Turveruukki Oy).
4.2.2 Preparation and shaping peat to sod peat
Preparation has an impact on the characteristics of sod peat. Preparing means reducing the particle size of the milled material, crushing fibres and making a homogenous mix where water, air, different sized fibres and

47jamk
particles in peat are blended. Preparation has been studied in laboratories and it has been observed that lengthened preparation and suitable shap-ing can add to sod peat´s firmness and density.
The largest change to the particle size distribution takes place, when the screw/auger or disc removes peat from the field. The screw/auger has turned out to be better from the preparation point of view, compared to the disc. As a result of using the screw the share of small particles in the blend is larger and mixing is better. This creates a good basis for good quality sod peat.
In cylindrical/round sod peat production peat is extruded through a nozzle into cylinder shaped sods that break off due to gravity when coming out, and fall to the field quite disorganised and at least partly on top of each other (FIGURE 27). Because of this the distribution on the field becomes uneven.
Especially in the case of level end nozzles in the middle of the strip of sods, the sods are on top of each other in 2–3 layers. Using nozzles with different lengths, the spread is more effective and more even distribution is achieved across the whole strip of sods.
Cylindrical sods must be harrowed to assure even and fast drying. Some loss of material takes place in harrowing, because sods are still half-dry and partly totally wet. In this stage the handling tolerance is still
Figure 27. Sod peat shaping with cylinder extrusion nozzles (Laura Vertainen).

48 jamk
poor. Some of the sods can break into such small pieces that they cannot be ridged and remain on the surface of the field instead.
Making wave-like sod peat requires a bit more experience than mak-ing cylindrical sods. The distance of nozzle from the field surface must be 7–10 cm. This way peat mass bends easily to the wavy shape and the wave becomes high enough and airy (FIGURE 28). If the nozzle is too high off the ground then the “peat carpet” breaks and the pieces fall to vertical positions. If the nozzle is too low down, the wave becomes low. Though even sods in a low wave dries better than cylindrical sods, but the high more raised wave does give a faster drying. Moving the peat mass as an unbroken carpet takes less power than dividing it to separate nozzles. Box-like nozzles do not get blockages even in slightly wood rich fields that easily. Of course also wave-like sod peat production suffers from a large quantity of wood in peat. Wood may get stuck in the nozzle blades and must be cleaned out during the drive by opening the lid of the box nozzle with the hydraulic cylinder built for the lid opening in order to avoid production break. Therefore this kind of production is more efficient than cylindrical sod peat production.
FIGURE 28. Sod peat shaping with wave-like sod peat nozzles (Mari Juntunen).

49jamk
4.3 Effectiveness in sod peat production
4.3.1 Production/metre and loading of the field
Production/metre describes the machines extraction capacity. Production/metre is the quantity of peat extracted per one meter driving distance in harvesting and it is expressed either as kilograms of wet peat per meter (kg/m) or kilograms of dry peat per meter (kgdm/m). Production/metre is in certain limits independent of the driving speed and nozzle, if peat feeding is constant. When using disc machines production usually becomes less when driving speed is faster than 1.6 km/h. Production/metre is used when technical studies of machines are carried out. Regu-lar follow up of Production/metre gives a good picture of the machines condition and possible maintenance requirements. Production/metre is easy to determine by weighing sods from one meter length of working strip for example in a tub.
Harvested loading on the sod peat field is determined by how much peat is cut from the field and how it is spread on the field. Loading is expressed as peat dry material kilograms per square meter (kgdm/m2). Peat type and starting moisture have an impact on the loading. Loading on the field is measured by weighing the production/metre and determining the dry matter content. For this the moisture of the sod has to be determined carefully immediately after the cutting of the sods. The production/metre dry matter quantity is divided by the width of the working strip, which usually is 0.5–0.7 m. When the loading is calculated, the effectiveness is known for utilization of the field for sod peat drying. Total loading and harvest rate from a whole field strip are also affected by the number of working strips per field strip and percentage losses.
In case of cylindrical sod the loading is smaller than in case of wave-like sods, because of more uneven spreading. In cylindrical sod peat production the loading is effected by sod size and the diameter of the nozzle. Small sod size usually means small loading. In wave-like sod peat production the nozzle openings diameter and the shape of the sod are having the main impact. The nozzle width does not play as big role, because the work strips can be made very near to each other. A small gap of couple cm between strips is recommended to achieve aeration.

50 jamk
4.3.2 The settings, adjustments and condition of the production equipment
The dimensions of the cutting disc or the dimensions of the screw/auger regulate the peat quantity. If too little peat is taken from the field in rela-tion to the spreading width, not enough loading is achieved. This is most clear to see in case of wave-like sod peat production, because the form of the wave does not become right. In this case it is possible to decrease the size of the nozzle so the volume of peat is enough for the formation of the wave. On the other hand this situation can also be a symptom of worn out, maintenance-demanding cutting tool. In the cylindrical sod machine the wearing out is harder to notice and there is a risk, that fields are left with too little loading.
Besides the cutting disc or screw/auger the condition of preparation screw´s pipe and cone and the tightness of the cone are in critical posi-tion in effectiveness of the sod peat machine. Especially in the spring while peat is frosty and in the middle of the summer while peat is dry, preparing of peat is demanding and disruptions also have an impact on the cutting from the field.
For the work to go fluently and achieving right loading require the whole sod peat machine to be in good condition. The machine must be maintained regularly and maintenance is beneficial to be done carefully for the cutting tool and preparation tool parts, often also during the production season. Cup or gutter discs are best checked daily during fuelling stops, because heads become loose in production. Taking care prevents significant failure of the heads/blades. Larger maintenance can be timed for rainy days, when sod peat production is on hold. The larger general maintenance of the equipment must be done well in time, before the beginning the peat production season.
4.4 Sod peat drying and structure formation
4.4.1 Principles of drying
Drying aims for lowering the water content as quickly as possible to the desired level, usually to less than 35 percent. The idea is also to create firmness, so that the sod will keep its form and tolerate handling in the different phases of the production chain.
The right shape and arrangement of sods on the field is a key func-tion considering the optimal drying. After the cutting, peat has got a lot

51jamk
of easily removable water in it and drying is fast. When drying proceeds, drying slows down. This change takes place while the sod moisture is approximately 1.5 kg water/kgdm (FIGURE 29). At this stage the surface of the sod is already dry and sod tolerates handling. Now moisture must move from inside the sod to nearer the surface of the sod to the evapora-tion zone.
FIgURE 29. Drying of sod peat (VTT).
The structure of sod peat is formed in connection to drying. The sod shrinks when water leaves or gets replaced by air. The more the sod shrinks, the more compact and firm it becomes.
The more there are small particles in the sods, the more the sods shrink. When the decomposition degree of peat is high and peat prepara-tion done by the machine is good, the sod shrinks a lot while drying. If peat is highly decomposed (over H7) and there are no fibres left, the sod shrinks a lot, but becomes more fragile and breaks easily. The fibrous structure of less decomposed peat prevents shrinking of the sod and the sod remains with less density and is lighter.
Sod peat is dense, prepared and with larger particle size and higher initial moisture content than milled peat. The loading on the field is five-fold compared to milled peat, which makes the drying period longer than in case of milled peat.

52 jamk
Drying of sod peat has been studied at VTT in Jyväskylä. According to the studies drying is most strongly affected by
• initial water content (initial moisture)• preparation• distribution of the sods on the field• drying base
The significance of the drying base to the drying process has been ob-served in investigations. The smoothness of the base surface is not always taken into consideration in field conditions. Especially in soft fields the tractor tyre track can be quite deep. If the field is not made smooth for the cylindrical sod, then the lowest sods are in the bottom of the tyre tracks. This makes drying slow and uneven. The sods in the track bottom are also difficult to harrow and break easily as they are wet and cause a lot of loss. Sod peat machines use a drum or smoothing board for smooth-ing the surface of the field (FIGURE 30). After the production season and sometimes even in the middle of it the field must be smoothed with a levelling plate. In the middle of the production season this is an extra work phase but it often is necessary to smooth the field strips before the next sod harvest cycle, to achieve drying.
FIGURE 30. Smoothing board smoothes the field surface to function as drying platform (VTT).

53jamk
4.4.2 Wave-like sod peat drying
Smoothing the field is important also for drying of wave-like sod peat. The box nozzle puts the sods on the field to a well aerated position and then the best result is achieved, if the field is smooth and compacted. The contact between the field and sods remains small, because sods are touching the field only from the lowest point of the wave. This way air gets also below the wave, and this speeds up drying.
The sides of the box nozzle smear the surfaces of the sod smooth. The surface hardens in few hours to protect the peat from the rain. When fresh, the sods are attached to each other from the sides and from the ends. When drying proceeds, the sods shrink and the sod carpet first breaks into 2–4 smaller sod parts, which improve the aeration (FIGURE 31).
FIGURE 31. While the drying proceeds, the wave-like sods shrink and break apart from each other (Pekka Hölttä).
Wave-like sod peat field dries evenly and in good weather conditions it does not need to be harrowed at all. All the sods are at the same dry-ing stage as each other. Working strips can be made near each other and this way an even field with even loading is achieved. An even loading on the field and one-layer only speeds up drying and creates a basis for the uniform quality of the sod peat.

54 jamk
4.4.3 Harrowing cylindrical sod peat
Because harrowing (FIGURE 32) has a large impact on the drying of cylindrical sod peat, it must be done well. This means that the moisture and the handling tolerance depending on the moisture must be consid-ered. Too hard handling causes loss. The most usual harrows are rake and spike harrows, which operate the whole width of a field strip at once. Harrowing too hard lifts fine material from the surface of the field. This should be avoided, because sods will sink into this fine material and then dry more slowly. During the rain, fine material absorbs water and can cause sods to become part of a sludgy layer.
The first harrowing can be done carefully at approximately 65% moisture content, so that the lowest sods won´t break. Harrowing can be done even earlier, if it is done with the necessary care. The main pur-pose of this harrowing is to break up and spread the pile-like centre of the working strip to a more even spreading. Simultaneously the contact between lowest sods and moist field surface is broken. This harrowing of the material is necessary for the drying of the lowest sods.
FIGURE 32. Harrowing disconnects the lowest sods from the field and speeds up drying (Suokone Oy).
The second harrowing is carried out, when the sod moisture is ap-proximately 55%. This can be done faster than the first harrowing, be-cause the sods are already dry enough to take the handling. To really achieve faster drying also this harrowing should be still done carefully,

55jamk
so that as large a portion of the sods as possible would really become moved, especially after rain. After a heavy rain even an extra harrowing is recommended to remove the sods from possible sludgy status.
4.4.4 Loading sod peat
Transporting away the sod peat takes place after putting the sods into ridges, when they have reached the target moisture. Loading is carried out the same way as loading milled peat. A conveyor belt loader is often equipped with a screen, so that no fine material would go to the stock pile (FIGURE 33).
FIGURE 33. Sod peat loading with a conveyor belt loader (Suokone Oy).
In the traditional sod peat field drying, the harvest is dried to the collection moisture (35%). In the drying in a ridge method, the sods are ridged when reaching 55–60 percent moisture and the released field is used for drying the next harvest. For the drying in the ridge the harrow structure has to be changed so, that edges of the ridge are not damaged in the turning of the new harvest.
Production can be made more effective by producing milled peat form the field surfaces between sod peat harvests. Milled peat produc-tion before or between the sod peat harvests is also useful maintenance of the field, because it cleans away the fine material coming from sod peat production.

56 jamk
Because wave-like sod peat does not need harrowing, they are first moved during ridging. This gives the sods possibility to become well firm in drying. Even though sods have already been separating from each other in the field drying, the actual breaking to smaller sods takes place as late as in ridging. Because of its shape, wave-like sod peat suites well to drying in the ridge and forms a well aerated ridge.

57jamk
5 Stockpiling peat
5.1 Stockpiling milled peat
The quality of fuel peat in production has to be such that, drilling samples from the stockpile in the autumn shows 38–40% moisture content. How storable the milled peat is depends on two factors: the quality of the peat at the time of making the stockpile and the way the stockpile is made. The stockpile size, shape and compactness are important factors affecting on the storage life of peat. These factors must be taken to consideration while making a stockpile.
The stockpiling techniques have an impact on the storage qualities. Milled peat is stockpiled in mainly two different ways: with a bulldozer or with a snowcat (low footprint weight track laying vehicle), by driv-ing and pushing up the peat from the edge of the stockpile (FIGURE 34) or by driving over the stockpile and releasing the load on the top of the pile while driving (so called drive-over stockpiling, FIGURE 35). A separate stockpiling machine is not needed, when the stockpile is made by driving over.
When a stockpile is ready, it can be shaped and finished with an ex-cavator. The target is a compact stockpile, minimizing the air transport within it. When making the stockpile by pushing the peat up, this usually means that the surface of the ready stockpile is compacted completely. The shape of the stockpile must be suitable for driving on all parts of the pile. This usually leaves the angle of the sides at 20 degrees. A careful stockpiling process secures good quality deliveries from the stockpile to customers even a long time after stockpile was made. Poorly completed stockpiles lead to the peat getting wet and self-ignition in a stockpile. The temperature of the stockpile should be observed during the storage period until the peat is delivered to the customer.
Principles of stockpile making (Paappanen & Erkkilä 2007):
• The stockpile making machine has to be maintained so that oil or fuel do not leak.
• The exhaust manifold or exhaust pipe must not leak. Stockpile making machine must be cleaned free from peat dust often enough.

58 jamk
• Stockpiling is started by the loading and transport work phase in peat production and all the material coming from the field is stockpiled immediately.
• Stockpile making is started in the storage area so, that there will be 10 m wide area of free space around the stockpile. A drive-over stockpile is started with its full width and the length can be added according to the need.
• The peat transported to the side of the stockpile is pushed by ma-chines in 10 cm thick layers, all the way to the top of the stockpile, without pushing over the peak. This way the stockpile becomes compact and the resistance for water entering the stockpile is larger.
• Drive-over stockpiles are compacted by the tractor and the sur-face is smoothed with a blade miller, harrow or levelling plate. The stockpile surface must be kept smooth through the whole production season.
• When the stockpile has been compacted thoroughly and the sur-face has been smoothed, movement on the top of the stockpile is avoided with either machines or on foot.
• The stockpile area is also profiled and it must slope away from the stockpile, so that rain water does not stay in the storage area causing storage losses or making activities related to deliveries to customer more difficult.
• Milled peat stockpile can be covered with plastic. Covering decrea-ses oxygen transport to the stockpile. Covering the stockpile is a good alternative when the stockpile is expected to be stored over a year or if the self-ignition risk of the stockpile has become higher.

59jamk
FIGURE 34. Stockpile making by pushing up can be also carried out with a snowcat (Vapo Oy).
FIGURE 35. Drive-over stockpile is made by driving the peat transport vehicle over the stockpile and then emptying the load on the top of the stockpile (Turveteollisuusliitto Ry).
5.2 Stockpiling sod peat
Sod peat is usually stockpiled with an excavator (FIGURE 36). Because of this technique stockpiles are long, level tall and triangular by cross section. Stockpile height should be generally minimum 5 meters, which makes on stockpile meter length volume 35–45 m3 of sod peat, depend-ing the exact shape of the pile.

60 jamk
Because of the shape and small quantity of peat per meter length sod peat stockpiles are covered. This aims at minimizing the risk caused by winter freezing. Autumn rains, slush and melting snow water the surface of the stockpile, which forms a frozen peat layer, which cannot be deliv-ered to the customer. In a stockpile with these dimensions the frozen layer includes a too large percentage of the total volume. The material frozen in the stockpile is too expensive to be left to the edge of the production area as the whole production chain´s work has been invested to it. So freezing must be minimized.
FIGURE 36. Stockpiling unscreened sod peat with an excavator (Mari Juntunen).
Covering sod peat stockpileSod peat stockpiles are covered with weather-proof polythene plastic (PE-LD). Not covering can be motivated by early delivery, different stockpile forms and weather conditions. Also for example saw dust and wood chips have been trialled as a stockpile cover, but at the moment plastic has performed best considering peat quality, storage ability and environment. Plastic stops oxygen input to the stockpile and decreases the self-ignition risk (Viitanen 2003, 7.) Handling the plastic in the production area must be paid attention to. Used plastic is stored in a place reserved for the purpose and handled correctly based on waste legislation.
Besides covering sod peat stockpile storability is affected strongly by the quantity of fine material in the stockpile. The base for a clean

61jamk
stockpile is created already on the field strip while loading peat for trans-port. If the loader takes fine material from the base or from inside the ridge and does not screen the fine particles out, the fines travel to the stockpile. Also fine particles can be released and end up in the stockpile also while an excavator is lifting sods form the surface of the storage area. Fine particles are moister than the sod peat and will raise the mois-ture content of the stock pile. More worrying is though the self-heating properties of the moist fines. This is caused by microbial activity, that needs oxygen and oxygen is well available in a porous sod peat stockpile. Temperature in this type of hot spot can become so high, that in cases of suitable air stream reaching the spot, material starts burning. If the stockpile starts smouldering then a large quantity of sod peat can be destroyed before this development is noticed. It is essential therefore to take care that no fines are taken to the stockpile.
The storability of sod peat in a stockpile can also be affected by screening sod peat while stockpiling with a specially developed stockpile screening device. The undersized material can be used for energy in the same way as milled peat. Screening helps to add height of the stockpile, which also decreases the surface layers proportion of the total volume of the stockpile. Freezing becomes a problem for a smaller portion of the stockpile. A device can also be used for screening material when loading deliveries to the customers, who need clean and screened quality.
5.3 Factors affecting storability of the peat stockpile
Self-heating risk of peat stockpiles is an issue to be considered when storing peat. Known quality factors contributing to heating are mois-ture, temperature during stockpiling, strength of microbial communities, particle size distribution, concentrations of reactive substances and the factors affecting on air permeability and compressibility of peat. All these factors are affected by the measures required in production.
MoisturePeat moisture has multiple impacts on the heating in stockpiles. It on one hand contributes to heating and on the other hand slows it. In the big picture it is likely to be beneficial if peat is not too dry. Dry peat warms up more as milled material on the surface of the field and does not compress properly in the stock pile. It has not got either the freezing potential moist peat has. In other words dry peat heats faster in a stock pile than moist peat.

62 jamk
Temperature while stockpilingPeat temperature at stock piling is dependent on how high its tempera-ture raises in the milled state on the field and how well the temperature keeps through the collection process all the way to the stock pile. Peat harvested with different production methods and in different radiation conditions is different. Ridging is the quickest way to interrupt unneces-sary drying and warming of the peat. On the ridge just a small part of the peat is exposed to the radiation. On the other hand in the ridge moisture still keeps evaporating which cools the peat down. When solar radiation level is low, warming is minor. Postponing peat collection to this type of time of the day can be beneficial, but if it leads to too much drying, the benefit can be lost.
Strength of the microbial communitiesStrength of the microbial communities in peat is dependent on conditions, exposure time to bacteria and other microbes and how peat is handled during this time. Peat surfaces that have been open for long times can even in cool conditions develop a strong microbial community. This de-velopment can take place for example on the surface of an old stock pile. Same development is characteristic also on the surface of a peat produc-tion field, where peat has not been collected away for a while. The first harvest in the spring always includes more microbes than the following ones. Also leftovers from earlier harvest cycles can present a self-heating risk. If the waiting time of leftovers on the surface of a field is long, so it has time to over dry. Leftovers are also likely to have a strong microbial presence in it, which will contaminate also the next harvest cycle.
Particle size distributionThe average particle size and distribution in peat has an impact on the surface area of the peat volume unit. Peat heating in a stockpile is a com-plicated biological process, where reactions take place on the surfaces of solid material while the gas material is a reactant. The larger the surface area in a volume unit is, the faster are reactions and heat production. Heating risk increases when particles size is smaller, if other circumstances are the same. On the other hand fine peat has an impact on the air per-meability and decreases oxygen availability and slows down heating.

63jamk
Concentrations of reactive substances The concentrations of easily reactive substances (nutrients) on the particle surfaces vary according to peat quality. Easily available nutrient have a large significance to the microbial activity. These types of nutrients are for example simple sugars and amino acids that are poorly available in raw peat, but are formed due to heat and enzyme hydrolysis from the carbohydrates and proteins in peat. Sugar is most rapidly produced from hemicelluloses.
Compressibility of peatIn milled peat the portion of air is large, 60–90 percent of the volume. Air volume decreases effectively in compression. In stockpiling peat is compressed with machines pushing or driving over it. Compression de-creases air permeability very quickly. Most compressible are light slightly decomposed peat types. The final compression rate does not though reach as low air volume status as the well decomposed peats final status.
While peat is compressed, also other heating contributing factors are changed, if they are calculated per volume unit: surface area, concentra-tors and microbial strength in m3 increase. In other words in compression heating risk factors are on the other hand increasing while the oxygen availably decreases. When a good compression status cannot be reached with less decomposed peat, there is a risk, that heating speeds up. It does look like that different compression statuses have specific stabilising tem-peratures, where the heat production is in balance with heat loss, which is related to the heat production being limited by oxygen availability.
In the case of milled fuel peat this temperature is 40–60°C, but with white peat types higher. High temperature in the stockpile tells about biological activity in the stock pile, which causes material loss about 0.5% per storage month. Stock pile temperatures are monitored by measuring them with a thermometer that is inserted into the stock pile.

64 jamk
6 Peat as a fuel
6.1 general
Peat is a material that is formed from dead plant parts by decomposition in very moist conditions. The lack of oxygen and high quantity of water have caused the situation, where decomposition has not been complete and continuously growing peat layer has been able to form. Peat includes a varying quantity of non-decomposed or poorly decomposed coarse plant particles (wood, shrubs etc.)
When peat is used as an energy source, it is important to know the physical and chemical properties of peat. The most important properties are net calorific value, moisture and the features affecting on handling the material, like density and particle size distribution.
When fuel trades are done on a large scale, the most important proper-ties are measured in a laboratory. In small scale trades can typical value tables be used, with the average properties of fuel and the relationships of different properties. Suitable transport, handling and storage methods have a large significance to the quality at the time of delivery. Methods are there to assure that fuel is stored in correct conditions. Everyone involved in the production and delivery chain must avoid actions that compromise the quality (considering the final storage also the buyer is included to the ones involved). Actions that compromise the quality introduce impurities, adding oversized particles or fines. Impurities can be stones, soil, metal, plastic, ice and snow. Quality of sod peat, briquettes and pellets can also be affected by absorption of moisture.
The fuel peat particle size and traded form varies in the market. Par-ticle size and traded forms have an impact on the handling and combus-tion properties. Fuel can be delivered for example under traded forms presented in TABLE 1.

65jamk
TABLE 1. Most important traded forms for fuel peat (NT ENVIR 009:).
Fuel name Typical size and form Production methodBriquette Smallest diameter
> 25 mmMechanical compression
Pellet Ø < 25 mm Mechanical compression
Sod peat Ø < 80 mmCylinder shaped (round)-, cubic or wave-like sod
Cutting, preparation, harrowing, ridging, collection, stockpiling
Milled peat Ø < 25 mm Milling, harrowing, ridging, collection, stockpiling
6.2 Peat quality standards, sampling and determination of properties
Turveteollisuusliitto ry (Association of Finnish Peat Industries) created the first quality instructions for milled and sod peat in 1989 and 1991. Quality instructions were updated in a Scandinavian Biostandards -pro-ject lead by VTT in 2005 and the instructions were published in English, Swedish and Finnish as Nordtest -method NT ENVIR 009.
Quality classifications were created for milled peat, sod peat, peat briquettes and peat pellets. This classification follows the same structure as the European solid biofuel fuel specification and classes standard EN 14961-1:2010. The standard includes quality classes for different traded forms of fuel peat, sampling and quality control. Quality classes are pre-sented in appendix 1–4. For all the characteristics in appendix 1–4 there are different quality classes presented. Fuel peat is determined by stating the relevant quality class for each property separately.
Fuel delivery lot (for example one batch or one truck load) belongs in a context of one studied property to a certain quality class, when the average value representing the property fits between the minimum and maximum defined for the class. For example in the appendix 3 moisture quality class M30.0 (≤ 30%) means that average moisture content must be less than 30 percent, so that peat can belong to this quality class.
A batch or a delivery lot is a peat entity that is the object for the relevant regularly monitored quality requirements to refer to. A delivery can be agreed as an individual batch of fuel peat (package or truck load) or a continuous delivery, that includes for example several truck loads within an agreed time period (usually a day or a week). In continuous deliveries the concept of one batch is usually 24 hour period of deliveries,

66 jamk
if the supplier and end user do not agree something else. If a delivery lot in continuous deliveries is 2,000 m3 a day, it is recommended to divide it into two or more batches. In continuous deliveries it is recommended that moisture content values are monitored for all daily or weekly batches. Monitoring net calorific value, sulphur, ash and nitrogen content values can be agreed to be done minimum once a month and maximum once a week. In appendix 5 there is the milled peat quality control chart, where the relationships of moisture, calorific value, bulk density and energy density are described.
If fuel peat is delivered from the same peat production area, the rates measured from the peatland itself can be used for net calorific value, sulphur content, ash content and nitrogen content.
The sampling procedure is of the utmost importance for obtaining a representative sample and for a reliable determination of properties.
The transportation, handling, and storage of the sample shall be car-ried out in such a way that its properties are unaffected as far as possible.
All lots shall be sampled, or the lots shall be selected at random for sampling, at a frequency that ensures the fulfilment of the quality require-ments. Relevant parties may agree on the sampling frequencies needed as a normative annex of the delivery agreement. Examples of sampling and sample treatment for milled and sod peat are presented in the quality guidelines for fuel peat NT ENVIR 009.
The primary sampling point for bulk material is at the point of de-livery. If representative sampling is technically difficult at this point, a point should be chosen where appropriate and representative samples can be taken.
In the case of continuous deliveries samples representing the agreed delivery period shall be collected and the tests to verify the fuel quality shall be performed during an agreed time period. In the case of individual deliveries the results of the tests should be available before the fuel is delivered or used, if not otherwise agreed.
When sampling from a conveyor system, the minimum number of increments should be 1 for each 6–8 tonnes or 20–25m3 of peat.

67jamk
If sampling is performed for peat loads, increments should be taken in continuous peat deliveries as follows:
Load size (m3) Number of increments/load (explanation) < 50 2 (represents traction truck) 50 – 100 4 (represents trailer) > 100 6 (represents whole truck load)
If fuel peat is delivered from the same peatland, then grades for net calorific value as well as grades for sulphur, ash and nitrogen content can be agreed on the basis of the properties measured for this peatland.
The weight of the fuel is mainly measured at the power plant on a truck weighing scale and moisture content from fuel samples. In peat production the fuel quantity is measured as m3 in the stock pile. In TABLE 2, some methods used for peat physical and chemical characteristics are listed.
TABLE 2. List of standards considering quality characteristics for fuels
quality Standard
Moisture content (Mar) EN 14774-1 Solid biofuels. Determination of moisture content. Oven drying method. Part 1: Total moisture content. Reference method. EN 14774-2 Solid biofuels. Determination of moisture content. Oven drying method. Part 2: Total moisture content. Simplified method.EN 14774-3 .Solid biofuels. Determination of moisture content. Oven drying method. Part 3: Common moisture of laboratory sample.
Ash content (A) EN 14775: Solid biofuels. Determination of ash content.(550 ºC)
Calorific value (qp,net,d) EN 14918 Solid Biofuels - Method for the determination of calorific value
Particle size distribution (P) and fine material content (F)
EN 15149-1 Solid biofuels. Determination of particle size distribution. Part 1. Sieving, oscillating, < 1mm screen. EN 15149-2 Solid fuels – particle size distribution. Part 2: Sieving, vibrating, < 3.15mm screen.
Density (DE) EN 15150 - Solid Biofuels - Methods for the determination of the particle density, (briquettes)

68 jamk
Bulk density (BD) EN 15103 Solid Biofuels - Methods for the determination of bulk density (pellets and milled peat), laboratory scaleDetermination form a transport vehicle ISO 1013 tai SS 187178 (for trade)
Mechanical durability of bri-quettes and pellet (DU)
EN 15210-1 Solid biofuels. Determination of mechanical durability of briquettes and pellets. Part 1: Pellets. EN 15210-2 Solid biofuels. Determination of mechanical durability of briquettes and pellets. Part 1: Briquettes
Carbon (C), hydrogen (H) and nitrogen (N) content
EN 15104 Solid Biofuels - Determination of total content of carbon, hydrogen and nitro-gen –Instrument methods Solid mineral fuels - Determination of total carbon, hydrogen and nitrogen content – Instrument methods (ISO/TS 12902:2001)
Sulphur (S) and chlorine (Cl)content
Solid Biofuels - Determination of total content of sulphur and chlorine (EN 15289) –or ASTM D 4239 Standard test methods for sulphur in the analysis sample of coal and coke using high temperature tube furnace combustion methods
Ash melting behaviour CEN/TS 15270-1 Solid Biofuels - Method for the determination of ash melting behaviour(SST, DT, HT, FT) – ISO 540 Solid Mineral fuels - Determination of fusibility of ash – High temperature tube method DIN 51730 Determi-nation of fusibility of fuel ash (DIN51730)
Major elements (Al, Si, K, Na,Ca, Mg, Fe, P and Ti)
EN 15290 Solid Biofuels - Determination of major elements
Trace elements (As, Ba, Be, Cd,Co, Cr, Cu, Hg, Mo, Mn, Ni,Pb, Se, Te, V and Zn)
EN 15297 Solid Biofuels - Determination of minor elements,
Calculation of analysis results to different basis
EN 15296 Solid biofuels. Calculation of analysis results to different basis
6.3 The most important characteristics of peat
In FIGURE 37 there is the average composition for fuel peat according to proximate analysis. Proximate analysis is determination of moisture, volatiles, fixed carbon and ash content according to specified methods.
Proximate analysis is used for estimating the fuel quality and together with net calorific value determination it provides a ground for the fuel trade. Other determinations carried out for fuels are chemical compounds, which are important for combustion and the formation of emissions.
quality Standard

69jamk
Peat composition and structure vary a lot for example according to the botanical composition and decomposition degree. Peat is classified in Finland to main peat types sphagnum peat (S), sedge peat (C) and brown moss (leaf moss peat) (B). These plant groups can also form a peat type. Often peat type consists of two main groups. One important characteristic is decomposition degree. Decomposition degree is expressed as H-value (H1–H10). H1 is slightly decomposed plant matter and H10 completely decomposed peat. FIGURE 37. Peat composition according to proximate analysis (* share of dry matter) (Alakangas 2000).
The major component of peat is carbon. Total carbon content includ-ing also volatile carbon is 53–56%. Carbon content varies according to peat type and decomposition degree (TABLE 3). While peat decomposes, carbon content increases usually. In medium decomposed peat there is usually 53.7% carbon. Sphagnum peat has a lot of cellulose and hemicel-luloses (TABLE 4). Sedge peat has more lignin than sphagnum peat. High decomposition degree means higher lignin content and lower cellulose and hemicelluloses content. There is 5–6 percent of hydrogen, 30–40% of oxygen, less than 0.3% of sulphur and 0.6–3% of nitrogen in peat. An usual sulphur content for peat is 0.1–0.2% (TABLE 5). In some areas, especially in eastern Finland the sulphur content can be over 0.3%. High carbon content causes a “slower burning” compared to wood.
In FIGURE 38 the peat properties compared to wood and other fos-sil fuels are presented. Peat is positioned based on the most significant characteristics between wood and different types of coal. The emission factor is in Statistics Finland’s classification for fuels (2011) for milled peat 105.9 gCO2/MJ, for sod peat 102 gCO2/MJ and for wood pellets 97-99 gCO2/MJ.

70 jamk
This classification is used in emission trade. The emission factor is affected by carbon content, net calorific value and moisture content. Vapo Oy reports emission factor 97–99 gCO2/MJ for peat pellets (TABLE 10).
FIGURE 38. Net calorific value, carbon- and hydrogen content and quantity of volatiles dependant on each other in solid fuels on dry basis (Alakangas 2000).
TABLE 3. Impact of peat decomposition degree on peat carbon, hydrogen, nitrogen and oxygen contents (on dry basis) (Seppälä et al. 1982, Taipale 1996).
Decomposition degree Carbon (C) Hydrogen (H)
Nitrogen (N)
Oxygen (O
2)
Slightly decomposed H1-2 48–50 5.5–6.5 0.5–1 38–42
Medium decomposition H5-6 53–54 5.0–6.0 1–2 35–40
Well decomposed H9-H10 58–60 5.0–5.5 1–3 30–35

71jamk
TABLE 4. Impact of decomposition degree on peat composition (Arpiainen et al.1986).
Substance Slightly decomposed H1-2% of dry matter
Medium decomposition H5-6% of dry matter
well decomposed H9-H10% of dry matter
Cellulose 15–20 5–15 -
Hemicelluloses 15–30 10–25 0–2
Lignin and ”related” substances
5–40 5–30 5–20
Humic substances 0–5 20–30 50–60
Bitumic substances (waxes, resins)
1–10 5–15 5–20
Substances with high nitrogen content (calc. as protein)
3–14 5–20 5–25
TABLE 5. Element concentration in milled peat and sod peat (Taipale 1996).
Fuel Carbon (C) Hydrogen (H2) Nitrogen (N) Oxygen (O
2) Sulphur (S)
Milled peat 54.5 5.58 2.01 32.6 0.19
Sod peat 55.7 5.69 1.97 32.7 0.17
There are less volatiles in peat compared to wood, approximately 65–70% (in peat). This leads to higher net calorific value of peat dry matter compared to wood. The net calorific value is affected also by decomposition degree, peat type and ash content.
Net calorific value is higher in more decomposed peat. On the other hand ash content is generally higher in well decomposed peat, which at least theoretically lowers net calorific value. The net calorific value for peat on dry basis is approximately 20–23 MJ/kg.
The moisture content of milled peat has been approximately 47% on average and the rate for sod peat of less than 40%.
Net calorific value as received (in delivery at the plant) for milled peat is on average 9.9 MJ/kg (0.91 MWh/loose-m3) and for sod peat 12.5 MJ/kg (1.27 MWh/ loose m3). The density of milled peat (volume weight as received) is 321 kg/loose m3 and the density of sod peat 350 kg/loose m3. The average ash content of milled peat on dry basis is approximately 5% and less than 5% for sod peat. (TABLES 6, 11–12).

72 jamk
TABLE 6. Some average characteristics of milled and sod peat (Taipale 1996, Electrowatt-Ekono 2005).
Source Mois-ture w-%
Ash con-tent on dry basis w-%
Vola-tiles on dry basis w-%
gross calo-rific value on dry basis MJ/kg
Net calo-rific value on dry basis MJ/kg
Net calo-rific value as re-ceived MJ/kg
Bulk density as re-ceived kg/m3
Den-sity on dry basis kg/m3
Energy con-tent MWh/loose m3
Milled peat
VTT 48.5 5,1 68.6 22.1 20.9 9.6
Ekono* 4.1 5.8 20.8 9.9 330 175 0.91
Vapo 5.1 68.9 21
Sod peat
VTT 38.9 4.5 68.9 22.5 21.3 11.9
Ekono* 39.5 4.8 21.2 11.9 385 233 1.27
Vapo 3.9 21.7 * Energia-Ekono collected data from peat users (weighed averages from years 1985–2005).
Ash content in peat varies from two to ten percent. Soil in peat has usually drifted to peatland in water and/or by wind or accidently mixed to peat during handling and transport. Quantity and quality are affected by the environments acidity, type of mire development, mire type and plant community and the fall out (air transported impurities). Soil includes 70–90% quartz (SiO2), which is very hard and has a high melting tem-perature. The remainder are minerals typical for the most common rock types, for example albite. Iron content in peat is related to the mineral soil weathering caused by the humic and carboxylic acid in mire waters. The ash content of sphagnum peat is on average smallest and sedge peat ash content is in general larger. Ash consists mainly of silicates, iron and aluminium (each having approximately a 10% share). Also the share of potassium rich compounds can occasionally be over 10%. Some fuel peats heavy metal contents are presented in TABLE 7.

73jamk
TABLE 7. Heavy metal concentrations on fuel peat dry basis (mg/kg) (Taipale 1996).
Arsenic As
Cadmium, Cd
Cobalt, Co
Chrome, Cr
Copper, Cu
Nickel, Ni
Lead, Pb
Zink, Zn
Average concentration
2.2 0.12 1.4 5.9 6 3.9 4.6 9
Standard deviation
1.2 0.025 0.61 2.78 2.61 1.66 1.48 3.54
Minimum 0.2 0.03 0.1 0.9 1.4 0.8 0.6 2.8
Maximum 9.3 0.2 3.7 24.9 16.5 16.7 9.9 36.5
While the use of multi fuelled boilers has been becoming more com-mon the ashes are blended ashes – usually peat and wood ash. Ashes are used in land fill structures, road constructions and other ground constructions and as a fertilizer. Pure wood, peat and agro biomass ash that meets the quality specifications given by Ministry of Agriculture and Forestry (in Act MMMa 12/07), can be used as a fertilizer (TABLE 8). The Fertilizer Act is already being updated, so the latest information can be found from the web site of the Ministry of Agriculture and Forestry or from a law data base (www.finlex.fi ).
The quality of ashes can vary a lot between plants. The physical and chemical characteristics are affected by the fuel composition and qual-ity, but also the boiler type, combustion technology and combustion parameters and the collection system for ashes. In TABLE 8 there are typical metal concentrations for peat and wood ashes. The use of peat as a fertilizer is commonly limited by low nutrient content and arsenic concentration that is higher that the limit in the fertilizer act. The most suitable ashes for forest fertilization are wood and wood-peat ashes that are a result of over 50% wood in the fuel blend. Peat ash has lower po-tassium content compared to wood ash.

74 jamk
TABLE 8. Metal concentration in peat and wood fly ash (Leinonen 2010).
quality Peat and wood blend ash, mg/kg
Wood ash, mg/kg MMMa 12/07Maximum concen-trations for forest ash, mg/kg
Arsenic, As 30–120 1–60 30
Barium, B 150–2,200 200–300 -
Cadmium, Cd 0.5–5.0 6–40 17.5
Cobalt, Co 10–50 3–200 -
Chrome, Cr 43–130 40–250 300
Copper, Cu 60–200 50–300 700
Quick silver, Hg 0.3–2.0 0.02–1.00 1.0
Molybdenum, Mo
10–50 15 -
Nickel, Ni 30–700 20–100 150
Lead, Pb 85–1,000 3–1,100 150
Selenium, Se < 10–26 -
Vanadium, V 20–500 20–30 -
Zink, Zn 50–2,200 200–2,000 4,500
TABLE 9. Ash melting behaviour of peat ash in oxidizing conditions (Taipale1996).
Fuel type
Ash melting behaviour (VTT), °C
Melting behaviour of ash (Vapo), °C
Softening tempera-ture A
Hemi-spherical tempera-ture B
Fluid tempera-ture °C
Point IT initial deforma-tion
Point ST softening tempera-ture
Point HT hemi-spherical tempera-ture
Point FT fluid tempera-ture
Milled peataverage
1 130 1 253 1 290
minimum 1 100 1 200 1 205
maxi-mum
1 190 1 375 1 430
Sod peataverage
1 136 1 273 1 308 1 158 1 218 1 252 1 292
minimum 1 040 1 145 1 175 1 100 1 130 1 160 1 180
maxi-mum
1 335 1 415 1 490 1 250 1 340 1 380 1 470

75jamk
Peat is very chemically reactive. This feature of peat can be utilized for example in gasification of peat and production of peat ammonia. Also peat coal coming from coke-making is very reactive and it can be used for reduction of metals and ores. On the other hand due to its reactivity peat burns easily and may be flammable and may explode when dry and fine. Because of this using peat includes fire and dust explosion risks. Peat is also acidic (pH of Finnish peat is 5–6) and causes therefore corrosion.
TABLE 10. Properties of peat pellets and analysis methods (Vapo Oy).
quality NT ENVIR 9 method
Typical value Variation
Dimensions D12 Diameter (D), mmLength, mm
<12 mm + 1 mm5 X D
D 15 Diameter (D), mm Length, mm
< 15 mm + 1 mm 5 X D
Moisture, M, w-% M20 15w-% 13–20w-%
Mechanical durability, DU, w-%
DU95 > 95% > 95%
Bulk density, BD, kg/m3
BD700 700 kg/loose-m3 + 50 kg/loose-m3
Net calorific value as received, Q, MJ/kg
q16.2 4.7 kWh/kg > 16.9 MJ/kg
4.4–5.0 kWh/kg 15.1–18.0 MJ/kg
Energy content, E (MWh/m3)
> 3.3 MWh/loose m3
2.05–3.60 MWh/loose m3
Volatiles, Vd 69% 67–73 %
Ash content (550 °C ) on dry basis
A6.0 3% 1.1–6.0 %
Ash melting behaviour
Hemispheric temperature
HT 1 160 °C 1130–1390 °C
Sulphur, S, on dry basis
S0.15 0.12 % 0.04–0.30 %
Nitrogen, N, on dry basis
N1.5 1.20 % 0.7–1.7 %
Chorine, Cl, on dry basis
Cl 0.03 < 0.03 % 0.0235–0.027 %
Cadmium, Cd, on dry basis
Cd 0.01 < 0,01 %
Carbon, C, on dry basis
54 % 49–56 %
Emission factor as received
97–99 g CO2/MJ 97–99 g CO
2/MJ
Caesium, Cs-137 Bq/kg on dry basis
< 80 10–340

76 jamk
Electrowatt-Ekono (current Pöyry PLC) has kept records annually also about delivered peat quality by collecting use and quality data from peat buyers during years 1985–2005. For the year 1993 there are no statistics. Generating these statistics was stopped in 2005, when energy markets became open. In TABLES 11 and 12 there are peat user’s aver-age data for milled and sod peat quality from this time interval. In the TABLES 13–14 peat qualities are compared to other fuels.

77jamk 77
TABLE
11
. Ave
rage
qua
litie
s of
mill
ed p
eat
from
yea
rs 1
98
5-1
99
2 a
nd 1
99
4-2
00
5 (
ther
e ar
e no
sta
tist
ics
from
yea
rs 1
99
3).
(Ele
ctro
wat
t-Ek
ono
20
05
)
19
85
19
86
19
87
19
88
19
89
19
90
19
91
19
92
19
94
19
95
19
96
19
97
19
98
19
99
20
00
20
01
20
02
20
03
20
04
20
05
Ave
rage
Qua
ntit
y,
gw
h7
65
08
82
08
59
38
36
48
06
11
0 1
65
11
70
21
1 3
12
13
98
61
5 6
45
19
53
81
9 2
76
15
83
11
3 8
87
10
61
91
6 4
92
18
91
4 2
2 2
10
15
18
61
1 9
86
25
4 4
00
Net
ca
lori
fic
valu
e on
dr
y ba
sis
MJ/
kg
21
.02
0.9
20
.92
0.9
20
,92
0.8
21
.02
0.9
20
.92
0.8
20
.82
0.7
21
.02
0.7
20
.62
0.7
20
.72
0.7
20
.92
1.0
20
.8
Ave
rage
m
oist
ure,
w
-%
49
.849
.55
0.2
51
.248
.447
.148
.149
.347
.146
.346
.046
.346
.546
.946
.146
.544.9
45
.047
.048
.547
.1
Net
ca
lori
fic
valu
e as
re
ceiv
ed
MJ/
k
9.4
9.3
9.2
8,9
9,6
9.8
9.7
9.4
9.9
10
.11
0.1
10
.01
0.1
10
.01
0.0
9.9
10
.31
0.3
9.9
9.6
9.9
0
Den
sity
of
dry
mat
-te
r, k
g/m
3
17
31
70
17
11
69
17
61
73
17
61
71
17
61
78
17
81
79
17
81
75
17
51
73
17
71
77
17
01
65
17
5
Bul
k de
nsit
y as
re
ceiv
ed
kg/m
3
345
33
73
44
346
342
32
83
40
33
73
32
33
13
30
33
33
33
33
03
25
32
33
21
32
13
21
32
03
30
Ener
gy
cont
ent
MW
h/m
3
0.9
0.8
70
.88
0.8
60
.91
0.8
90
.92
0.8
80
.91
0.9
20
.93
0.9
30
.93
0.9
00
.90
0.8
90
.92
0,9
20
.89
0.8
60
.91
Ash
con
-te
nt o
n dr
y ba
sis
(81
5 º
C)
4.7
5.1
5.1
5.3
5.5
5.6
5.5
5.5
5.6
5.5
5.7
5.5
5.8
6.4
5.9
6.8
6.3
5.8
5.9
5.7
5.8
Sulp
hur
cont
ent
on
dry
basi
s w
-%
--
--
--
--
0.2
10
.20
0.2
20
.21
0.2
10
.22
0.3
10
.22
0.2
10
.22
0.2
10
.21
0.2
2
*The
re a
re n
o st
atis
tics
fro
m y
ear
19
93
and
the
use
d qu
anti
ty f
rom
May
to
Dec
embe
r 2
00
5 is
bas
ed o
n an
est
imat
e an
d ot
her
qual
ity
info
rmat
ion
is b
ased
on
info
r-m
atio
n fr
om J
anua
ry-A
pril.

78 jamk78
TABLE
12
. Ave
rage
qua
litie
s of
sod
pea
t fr
om y
ears
19
85
-19
92
and
19
94-2
00
5 (
ther
e ar
e no
sta
tist
ics
from
yea
rs 1
99
3).
(Ele
ctro
wat
t-Ek
ono
20
05
)
19
85
19
86
19
87
19
88
19
89
19
90
19
91
19
92
19
94
19
95
19
96
19
97
19
98
19
99
20
00
20
01
20
02
20
03
20
04
20
05
Ave
rage
Qua
ntit
y,
gw
h9
94
1 0
11
96
16
11
645
86
37
18
83
82
17
52
21
71
50
51
57
03
60
48
91
92
19
11
39
38
99
52
71
5 7
30
Net
cal
o-ri
fic
valu
e on
dry
ba
sis
MJ/
kg
21
.72
1.2
20
.72
1.0
20
.32
1.2
21
.22
1.8
21
.32
0.7
21
.22
1.1
21
.42
1.9
21
.92
1.5
21
.32
2.1
20
.72
0.7
21
.2
Ave
rage
m
oist
ure,
w
-%
39
.940
.942
.441
.13
7.5
37
.83
9.4
40
,640
.53
8.1
38
.43
7.7
39
.441
.83
9.0
37
.03
5.3
34.5
35
.43
5.2
39
.5
Net
cal
o-ri
fic
valu
e as
re-
ceiv
ed M
J/kg
12
.01
1.5
10
.91
1.4
11
.71
2.3
11
.91
1.9
11
.71
1.9
12
.11
2.3
12
.01
1.7
12
.41
2.6
12
.91
3.6
12
.51
3.6
11
.9
Den
sity
of
dry
mat
-te
r, k
g/m
3
23
82
30
22
72
30
242
23
72
31
23
32
31
23
92
39
242
23
42
18
22
32
26
22
52
28
22
62
33
23
3
Bul
k de
nsit
y as
re
ceiv
ed
kg/m
3
39
73
90
39
43
91
38
73
82
38
13
92
38
93
86
38
73
89
38
73
74
36
63
58
348
348
35
03
60
38
5
Ener
gy
cont
ent
MW
h/m
3
1.3
31
.25
1.1
91
.23
1,2
61
.30
1.2
61
.30
1.2
61
.27
1.3
01
.32
1.2
91
.21
1.2
61
.26
1.2
51
.31
1.2
21
.36
1.2
7
Ash
con
-te
nt o
n dr
y ba
sis
(81
5 º
C)
5.6
5.3
5.1
5.2
5.0
4.9
4.5
4.6
4.9
4.9
4.5
5.1
3.7
4.2
3.6
3.4
2.9
2.8
2.9
2.7
4.8
Sulp
hur
cont
ent
on
dry
basi
s w
-%
--
--
--
--
0.2
00
.20
0.2
00
.20
0.2
10
.20
0.2
10
.21
0.2
00
.20
0.2
30
.23
0.2
0
* Th
ere
are
no s
tati
stic
s fr
om y
ear
19
93
and
the
use
d qu
anti
ty f
rom
May
to
Dec
embe
r 2
00
5 is
bas
ed o
n an
est
imat
e an
d ot
her
qual
ity
info
rmat
ion
is b
ased
on
info
r-m
atio
n fr
om J
anua
ry-A
pril.

79jamk
TABLE
12
. Ave
rage
qua
litie
s of
sod
pea
t fr
om y
ears
19
85
-19
92
and
19
94-2
00
5 (
ther
e ar
e no
sta
tist
ics
from
yea
rs 1
99
3).
(Ele
ctro
wat
t-Ek
ono
20
05
)
19
85
19
86
19
87
19
88
19
89
19
90
19
91
19
92
19
94
19
95
19
96
19
97
19
98
19
99
20
00
20
01
20
02
20
03
20
04
20
05
Ave
rage
Qua
ntit
y,
gw
h9
94
1 0
11
96
16
11
645
86
37
18
83
82
17
52
21
71
50
51
57
03
60
48
91
92
19
11
39
38
99
52
71
5 7
30
Net
cal
o-ri
fic
valu
e on
dry
ba
sis
MJ/
kg
21
.72
1.2
20
.72
1.0
20
.32
1.2
21
.22
1.8
21
.32
0.7
21
.22
1.1
21
.42
1.9
21
.92
1.5
21
.32
2.1
20
.72
0.7
21
.2
Ave
rage
m
oist
ure,
w
-%
39
.940
.942
.441
.13
7.5
37
.83
9.4
40
,640
.53
8.1
38
.43
7.7
39
.441
.83
9.0
37
.03
5.3
34.5
35
.43
5.2
39
.5
Net
cal
o-ri
fic
valu
e as
re-
ceiv
ed M
J/kg
12
.01
1.5
10
.91
1.4
11
.71
2.3
11
.91
1.9
11
.71
1.9
12
.11
2.3
12
.01
1.7
12
.41
2.6
12
.91
3.6
12
.51
3.6
11
.9
Den
sity
of
dry
mat
-te
r, k
g/m
3
23
82
30
22
72
30
242
23
72
31
23
32
31
23
92
39
242
23
42
18
22
32
26
22
52
28
22
62
33
23
3
Bul
k de
nsit
y as
re
ceiv
ed
kg/m
3
39
73
90
39
43
91
38
73
82
38
13
92
38
93
86
38
73
89
38
73
74
36
63
58
348
348
35
03
60
38
5
Ener
gy
cont
ent
MW
h/m
3
1.3
31
.25
1.1
91
.23
1,2
61
.30
1.2
61
.30
1.2
61
.27
1.3
01
.32
1.2
91
.21
1.2
61
.26
1.2
51
.31
1.2
21
.36
1.2
7
Ash
con
-te
nt o
n dr
y ba
sis
(81
5 º
C)
5.6
5.3
5.1
5.2
5.0
4.9
4.5
4.6
4.9
4.9
4.5
5.1
3.7
4.2
3.6
3.4
2.9
2.8
2.9
2.7
4.8
Sulp
hur
cont
ent
on
dry
basi
s w
-%
--
--
--
--
0.2
00
.20
0.2
00
.20
0.2
10
.20
0.2
10
.21
0.2
00
.20
0.2
30
.23
0.2
0
* Th
ere
are
no s
tati
stic
s fr
om y
ear
19
93
and
the
use
d qu
anti
ty f
rom
May
to
Dec
embe
r 2
00
5 is
bas
ed o
n an
est
imat
e an
d ot
her
qual
ity
info
rmat
ion
is b
ased
on
info
r-m
atio
n fr
om J
anua
ry-A
pril.
TABLE
13
. Com
pari
son
of t
he m
ost
impo
rtan
t pr
oper
ties
of
diff
eren
t fu
els
(VTT
& V
apo
Oy)
.
Fuel
Net
cal
orifi
c va
lue
on d
ry b
asis
kW
h/kg
(m
oist
ure
0%
) q p,
net,
d
Moi
stur
e co
nten
t as
rec
eive
d (
Mar)
Net
cal
orifi
c va
lue
as r
ecei
ved
(use
moi
stur
e)
kWh/
kg
q p,ne
t,ar
Bul
k de
nsit
y (B
D)
kg/l
oose
m3
Ener
gy c
onte
nt
as r
ecei
ved
Ear
(MW
h/lo
ose
m3)
Ash
con
tent
, (A
) on
dry
bas
is, %
Coal
7.7
51
06
.89
--
14.0
Hea
vy f
uel o
il1
1.3
9–1
1.4
70
.3–0
.51
1.3
6–1
1.4
49
20
–1 0
20
-0
.4
Ligh
t fu
el o
il1
0.2
kW
h/lit
re0
.01
–0.0
21
1.7
88
70
-0
.01
Mill
ed p
eat
5.7
846
.52
.78
33
00
.91
5.9
Sod
peat
5.9
03
9.0
3.3
33
80
1.3
04.5
Peat
pel
let
5.4
8–5
.83
14–1
84.2
0–5
.20
68
0–7
50
3.0
0–3
.70
2.0
–6.0
Saw
dus
t5
.28
–5.3
345
–60
0.6
0–2
.77
25
0–3
50
0.4
5–0
.70
0.4
–0.5
Bir
ch b
ark
5.8
3–6
.39
45
–55
2.2
2–3
.06
30
0–4
00
0.6
0–0
.90
1.0
–3.0
Coni
fero
us t
ree
bark
5.1
4–5
.56
50
–65
1.3
8–2
.50
25
0–3
50
0.5
0–0
.70
1.0
–3.0
Crus
hed
plyw
ood
5.2
8–5
.33
5–1
54.4
4–5
.00
20
0–3
00
0.9
0–1
.10
0.4
–0.8
woo
d pe
llets
5.2
4–5
.42
6–9
4.7
0–5
.05
60
0–6
50
2.8
0–3
.30
0.1
–0.5
Smal
l-si
zed
roun
d w
ood
chip
s5
.14–5
.56
40
–55
1.9
4–3
.06
25
0–3
50
0.7
0–0
.90
0.5
–2.0
Fire
woo
d (r
eady
to
burn
)5
.14–5
.28
20
–25
3.7
2–4
.03
240
–32
01
.35
–1.7
0
MW
h/pi
led-
m3
0.5
–1.2
Fore
st r
esid
ue
chip
s5
.14–5
.56
50
–60
1.6
7–2
.50
25
0–4
00
0.7
0–0
.90
1.0
–3.0
who
le-t
ree
chip
s5
.14–5
.56
45
–55
1.9
4–2
.78
25
0–3
50
0.7
0–0
.90
1.0
–2.0
Ree
d ca
nary
gra
ss
(spr
ing
harv
este
d)4.8
–5.2
10
–25
3.5
0–4
.60
60
–80
0.3
01
.0–8
.0
Ener
gy g
rain
4.8
11
4.3
06
00
2.6
02
.0
Stra
w c
hopp
ed
4.8
31
7–2
53
.44–3
.89
80
0.3
0–0
.40
5.0
Solid
rec
ycle
d fu
el
(SR
F)4.7
2–1
0.2
81
5–3
53
.61
–9.7
21
50
–25
00
.70
–1.0
03
.0–7
.0
Dry
dom
esti
c w
aste
5.1
4–6
.50
25
–36
3.2
5–4
.69
15
0–2
00
0.7
0–1
.00
5.3
–16
.1
1 k
Wh/
kg =
1 M
Wh/
t =
3.6
MJ/
kg

80 jamk
TABLE
14. C
hem
ical
com
posi
tion
of
diff
eren
t fu
els
(VTT
& V
apo
Oy)
.
Fuel
Carb
on, C
(w
-% o
n dr
y ba
sis)
Hyd
roge
n, H
2
(w-%
on
dry
basi
s)
Sulp
hur,
S
(w-%
on
dry
basi
s)
Nit
roge
n, N
(w
-% o
n dr
y ba
sis)
Chlo
rine
, Cl
(w-%
on
dry
basi
s)
Sodi
um, N
a (w
-% o
n dr
y ba
sis)
Pota
ssiu
m, K
(w
-% o
n dr
y ba
sis)
Coal
68
–78
(on
aver
age
71
.5)
3.5
–5.0
(on
aver
age
4.5
)
< 0
.50
.8–1
.5(o
n av
erag
e 1
.3)
0.1
00
.01
20
.00
3
Hea
vy f
uel o
il8
8.4
10
.10
.8–0
.95
0.3
–0.4
-<
0.0
00
4-
Ligh
t fu
el o
il8
6.2
13
.70
.10
.01
–0.0
3-
- -
Fuel
pea
t5
2–5
65
.0–6
.50
.05
–0.3
1.0
–3.0
0.0
2–0
.06
0.0
07
0.0
2Sa
w d
ust
48
–52
6.2
–6.4
<0
.05
0.3
–0.4
0.0
1–0
.03
0.0
01
–0.0
05
0.0
2–0
.15
Bar
k48
–52
6.2
–6.8
<0
.05
0.3
–0.5
0.0
1–0
.05
0.0
07
–0.0
20
0.1
0–0
.50
Crus
hed
plyw
ood
48
–52
6.2
–6.4
<0
.05
0.1
–0.5
< 0
.05
0.2
50
–0.5
00
0.7
0w
ood
pelle
ts49
–50
6.0
–6.1
<0
.00
7<
0.1
60
.01
–0.0
30
.00
1–0
.00
20
.02
–0.1
5Fi
re w
ood
48
–52
6.0
–6.5
< 0
.05
0.3
–0.5
0.0
1–0
.03
0.0
01
–0.0
02
0.0
2–0
.15
Smal
l-si
zed
roun
d w
ood
chip
s48
–52
5.4
–6.0
<0
.06
0.3
–0.5
0.0
1–0
.03
0.0
01
–0.0
02
0.0
2–0
.15
Fore
st r
esid
ues
chip
s48
–52
6.0
–6.2
<0
.05
0.3
–0.5
0.0
1–0
.04
0.0
75
–0.0
30
0.1
0–0
.40
who
le-t
ree
chip
s48
–52
5.4
–6.0
<0
.05
0.3
–0.5
0.0
1–0
.03
0.0
01
–0.0
02
0.0
2–0
.15
Ree
d ca
nary
gra
ss
(spr
ing
harv
este
d)45
–50
5.4
–6.2
0.0
4–0
.17
0.3
–2.0
0.0
1–0
.09
<0
.00
2–0
.04
<0
.08
–0.6
0
Ener
gy g
rain
45
6.5
0.1
42
.00
.04
0.0
02
–0.0
05
0.4
0–1
.00
Stra
w c
hopp
ed45
–47
5.8
–6.0
0.0
1–0
.13
0.4
–0.6
0.1
4–0
.97
0.0
10
–0.6
00
0.6
9–0
.30
Solid
rec
ycle
d fu
el
(SR
F)45
–56
5–9
0.0
5–0
.20
0.2
–0.9
0.1
0–0
.90
0.0
01
–0.0
05
0.0
01
–0.0
02
Dry
dom
esti
c w
aste
47
.1–
53
.56
.1–7
.20
.08
–0.2
20
.67
–1.0
70
.20
–1.5
00
.00
1–0
.00
50
.00
1–0
.00
4

81
6.4 Peat in a fuel blend
In Finland peat and wood are most commonly burned together in flu-idised bed boilers. Fuel analysis gives information of the fuels risk of deposit formation that can cause damage or agglomerate on heat transfer surfaces. The sand of the fluidised bed can also fuse together and cause shutting down or driving down of the boiler. Elementary analysis shows for example risk element quantities like chlorine (Cl), sodium (Na), po-tassium (K) and protective element quantities like aluminium (Al), silica (Si) and sulphur (S). Alarm limit is when chlorine quantity is over 0.02 w-% in fuels that have low concentrations of protective elements. Protec-tive elements are typically present in peat and coal. Wood, reed canary grass and straw have very little of these. If there is a lot of calcium (Ca) in fuel, it may stop the protective impact of sulphur. The chemical study of the fuels can clarify the binding of elements and this way also their likelihood to vaporize and reactivity (Aho et al. 2001).
Determining potassium-, sodium- and chlorine concentrations is im-portant. Biomass fuel boiler manufactures announce usually the highest allowed reactive (soluble) quantity for potassium and sodium (K+Na sum) concentration on dry basis of fuel. When the biomass fuel´s K+Na–sum concentration is over 0.3 w-% (> 3 000 mg/kg), and there is chlorine over 0.02 w-%, there usually are problems if these concentrations have not been taken into consideration in planning the boiler (see TABLE 14).
The protective elements in peat prevent chlorine deposits. In FIGURE 39 there is a description of, how chlorine succeeds to form deposits on the heat transfer surfaces, if there are not enough protective elements. This may be the situation in combustion of bark and forest residue chips. The FIGURE also explains how the protective elements from peat release chlorine from alkali chlorides to HCl, in which form it leaves the boiler.
TABLE
14. C
hem
ical
com
posi
tion
of
diff
eren
t fu
els
(VTT
& V
apo
Oy)
.
Fuel
Carb
on, C
(w
-% o
n dr
y ba
sis)
Hyd
roge
n, H
2
(w-%
on
dry
basi
s)
Sulp
hur,
S
(w-%
on
dry
basi
s)
Nit
roge
n, N
(w
-% o
n dr
y ba
sis)
Chlo
rine
, Cl
(w-%
on
dry
basi
s)
Sodi
um, N
a (w
-% o
n dr
y ba
sis)
Pota
ssiu
m, K
(w
-% o
n dr
y ba
sis)
Coal
68
–78
(on
aver
age
71
.5)
3.5
–5.0
(on
aver
age
4.5
)
< 0
.50
.8–1
.5(o
n av
erag
e 1
.3)
0.1
00
.01
20
.00
3
Hea
vy f
uel o
il8
8.4
10
.10
.8–0
.95
0.3
–0.4
-<
0.0
00
4-
Ligh
t fu
el o
il8
6.2
13
.70
.10
.01
–0.0
3-
- -
Fuel
pea
t5
2–5
65
.0–6
.50
.05
–0.3
1.0
–3.0
0.0
2–0
.06
0.0
07
0.0
2Sa
w d
ust
48
–52
6.2
–6.4
<0
.05
0.3
–0.4
0.0
1–0
.03
0.0
01
–0.0
05
0.0
2–0
.15
Bar
k48
–52
6.2
–6.8
<0
.05
0.3
–0.5
0.0
1–0
.05
0.0
07
–0.0
20
0.1
0–0
.50
Crus
hed
plyw
ood
48
–52
6.2
–6.4
<0
.05
0.1
–0.5
< 0
.05
0.2
50
–0.5
00
0.7
0w
ood
pelle
ts49
–50
6.0
–6.1
<0
.00
7<
0.1
60
.01
–0.0
30
.00
1–0
.00
20
.02
–0.1
5Fi
re w
ood
48
–52
6.0
–6.5
< 0
.05
0.3
–0.5
0.0
1–0
.03
0.0
01
–0.0
02
0.0
2–0
.15
Smal
l-si
zed
roun
d w
ood
chip
s48
–52
5.4
–6.0
<0
.06
0.3
–0.5
0.0
1–0
.03
0.0
01
–0.0
02
0.0
2–0
.15
Fore
st r
esid
ues
chip
s48
–52
6.0
–6.2
<0
.05
0.3
–0.5
0.0
1–0
.04
0.0
75
–0.0
30
0.1
0–0
.40
who
le-t
ree
chip
s48
–52
5.4
–6.0
<0
.05
0.3
–0.5
0.0
1–0
.03
0.0
01
–0.0
02
0.0
2–0
.15
Ree
d ca
nary
gra
ss
(spr
ing
harv
este
d)45
–50
5.4
–6.2
0.0
4–0
.17
0.3
–2.0
0.0
1–0
.09
<0
.00
2–0
.04
<0
.08
–0.6
0
Ener
gy g
rain
45
6.5
0.1
42
.00
.04
0.0
02
–0.0
05
0.4
0–1
.00
Stra
w c
hopp
ed45
–47
5.8
–6.0
0.0
1–0
.13
0.4
–0.6
0.1
4–0
.97
0.0
10
–0.6
00
0.6
9–0
.30
Solid
rec
ycle
d fu
el
(SR
F)45
–56
5–9
0.0
5–0
.20
0.2
–0.9
0.1
0–0
.90
0.0
01
–0.0
05
0.0
01
–0.0
02
Dry
dom
esti
c w
aste
47
.1–
53
.56
.1–7
.20
.08
–0.2
20
.67
–1.0
70
.20
–1.5
00
.00
1–0
.00
50
.00
1–0
.00
4

82 jamk
FIGURE 39. On the left there is a simplified presentation of cases in the boiler, if fuel blend does not include enough protective elements to prevent chlorine deposition. If another fuel in the cofiring donated these protective elements, the situation is presented on the right (Aho et al. 2001).
1
Effect of chlorine-sulphur chemistry to deposit formation in boilers
Source: Martti Aho, VTT
Heat transfersurface
Condensation and fixing
Lack of protecting
compounds
Low ash content
RI
SKY COMPOUNDSALKALICHLORIDES
Cl releases corrosionä
BARK/FOREST RESIDUE
FOREST RESIDUE COAL
Cocombustion
PR
OTECTING REACTIONSALKALISILICATES,
SULPHATES
RISKY COMPOUNS
SULPHUR DIOXIDE, Al-SILICATES
PROTECTIVES

REFERENCES

84 jamk
References
Aho, M., Taipale, R., Lybeck, E., Veijonen, K., Paakkinen, K., Lauren, T., Skrifvars,B.-J., Zevenhoven, M., Hupa, M., Janka, K., Eteläaho, R., Silvennoinen, J., Häyrinen,V., Hernberg, R., Kouki, J. & Saari, K. 2001. Uuden ennustusmenetelmän kehit-täminen kerrostumanmuodostukselle. VTT reports 28/2001.
Alakangas, E. & Hölttä, P. 1997. Energiaturpeen tuotantotekniikka. Koulutusai-neisto/Production of fuelpeat - Training material. VTT Energia. Tutkimusselostus ENE39/T0081/97. Jyväskylä.
Alakangas, E. 2000. Suomessa käytettyjen polttoaineiden ominaisuuksia. VTTTiedotteita 2045. Fuels used in Finland, VTT Research Notes 2045.
Arpiainen, V., Kyllönen, H. & Nissilä, M. 1986. Turpeen, puun, kuoren ja ligniinin flash-pyrolyysi. Osa 1. Tutkimusten nykytila ja arvio teollisista sovellusmahdol-lisuuksista. VTT. Researchs 455. Espoo.
Ehdotus soiden ja turvemaiden kestävän ja vastuullisen käytön ja suojelun kansal-liseksi strategiaksi. 2011. Maa- ja metsätalousministeriö. Työryhmämuistio MMM 2011:1. Helsinki.
Electrowatt-Ekono. 2005. Biopolttoaineiden käyttövaliokunta. Turpeen ja puun käyttö vuonna 2004 ja käyttöarviot vuodelle 2005. Raportti 60K04782.01- q060-018.
Energian hankinta, kulutus ja hinnat. 2011. Tilastokeskus. Reference 10.5.2011.http://tilastokeskus.fi.
Flyktman, M. 2009: Energia- ja ympäristöturpeen kysyntä ja tarjonta vuoteen 2020 mennessä – Third update. VTT, Research report. http://www.turveteol-lisuusliitto.fi/user_files2/VTT,%20Flyktman,%20turpeen%20kysynta%202020.pdf
Hillebrand, K. & Frilander, P. 1997. Suon ja turpeen kuivaus. VTT Energia. Tutki-musselostus ENE32/T0002/97. Jyväskylä.

85jamk
Klemetti, V. & Sänkiaho, K. 1992. Myyräsalaojituksen ja pumppukuivatuksen soveltuvuus turvetuotantosuon kuivatukseen. Optimiturve-tutkimusohjelma, Ra-portteja 47.
Leinonen, A. 1991. OPTIMITURVE - Auringon energiaan perustuva turvetuotanto, Väliraportti 1988–1990. KTM Katsauksia B:26. Helsinki.
Leinonen, A. (toim.) 2010. Turpeen tuotanto ja käyttö. Yhteenveto selvityksistä. VTT Tiedotteita 2550.
Myllyntaus, M. 2009. Vapo Oy:n turvetuotantoalueiden ympäristönsuojelun tilaja sen parantaminen Saarijärven reitillä. Opinnäytetyö. JAMK University of Ap-plied Sciences.
NT ENVIR 009: Quality guidelines for fuel peat: Fuel classification and quality assurance, sampling and analysis of properties.
Paappanen, T. & Erkkilä, A. 2007. Jyrsinturpeen aumaus- ja varastointiohje. VTT. Tutkimusraportti VTT-R-10801-07.
Polttoaineiden luokitus. 2011. Tilastokeskus. Reference 31.3.2011. http://tilastokeskus.fi /tup/khkinv/khkaasut_polttoaineluokitus.html
Seppälä, R., Äijälä, M. & Asplund, D. 1982. Jyrsinturpeen käsittely- ja polttotek-niikka Suomessa, Irlannissa ja Neuvostoliitossa. VTT Tiedotteita 63. Espoo.
EN 14961-1:2010: Solid biofuels – Fuel specifications and classes. Part 1: Gen-eral requirements.
SM-2006-03459/Tu-312. Ohje turvetuotantoalueiden paloturvallisuudesta. Taipale, R. 1996. Kiinteiden polttoaineiden ominaisuudet. Pro gradu -thesis. Jyväskylän yliopisto.
Turveteollisuusliitto ry. Association of Finnish Peat Industries webpages. Refer-ence 20.05.2011.Hhttp://www.turveteollisuusliitto.fi , yleistietoa soista ja turpeesta, soiden käyttöSuomessa.

86 jamk
Turvetuotannon vesienkäsittelymenetelmäkuvaukset. 2009. Association of Finnish Peat Industries webpages. Reference 13.3.2011. Http://www.turveteollisuusliitto.fi , ohjeita.
Vapo Oy machinery photos. Vapo Oy Webpages. Reference 17.9.2012. www.vapo.fi/en/peatmachines
Viitanen, R. 2003. Käytetyn aumanpeittomuovin käsittely turvetuotantoalueella.Thesis. JAMK University of Applied Sciences
Virtanen, K., Hänninen, P. Kallinen, R-L. Vartiainen, S. Herranen, T. & Jokisaari, R.2003. Suomen turvevarat 2000. Geological Survey of Finland. Research report 156.
Von Post, L. 1922. Sveriges Geologiska Undersökningstorv inventering och några av dess hittills vunna resultat. Svenska MosskulturföreningensTidsskrift 1, 1–27.
Väyrynen, T. Aaltonen, R. Haavikko, H. Juntunen, M. Kalliokoski, K. Niskala, A. & Tukiainen, O. 2008. Turvetuotannon ympäristönsuojeluopas. Pohjois-Pohjanmaan Ympäristökeskus.

Appendices

88 jamk
APPENDIX 1. Specification of properties for briquettes
Master tableOrigin: Fuel peat alone or blend of the following:
Woody biomass or herbaceous biomass specified according the TABLE 1 in CEN/TS 14961. Proportion of each fraction shall be stated
Traded Form (see TABLE 2) Briquette
Nor
mat
ive Dimensions (mm) Diameter (D) or equivalent (diagonal or cross cut), mm
D40 25 ≤ D ≤ 40
Examples of briquettes
D50 40 < D ≤ 50D60 50 < D ≤ 60D80 60 < D ≤ 80D100 80 < D ≤ 100D125 100 ≤ D ≤ 125D125+ ≤ 125, actual value to be
statedLength (L)
L50 ≤ 50L100 ≤ 100L200 ≤ 200L300 ≤ 300Moisture (w-% as received) M10 ≤ 10 %M15 ≤ 15 %M20 ≤ 20 %TAsh (w-% of dry basis) A2.0 ≤ 2.0 %A4.0 ≤ 4.0 %A6.0 ≤ 6.0 %A8.0 ≤ 8.0 %A10.0 ≤ 10 %A10.0+ > 10.0 %, (actual value to be stated)Sulphur (w-% of dry basis S0.15 ≤ 0.15 %S0.20 ≤ 0.20 %S0.25 ≤ 0.25 %S0.30 ≤ 0.30 %S0.35 ≤ 0.35 %S0.40 ≤ 0.40 %S0.45 ≤ 0.45 %S0.50 ≤ 0.50 %S0.50+ > 0.50 %, (actual value to be
stated)Net calorific value as received (MJ/kg (=MWh/t) a
q18.0 ≥ 18.0 (≥ 5.0 MWh/t) complies with moisture content of M10 q16.2 ≥ 16.2 (≥ 4.5 MWh/t) complies with moisture content of M15 q14.4 ≥ 14.4 (≥ 4.0 MWh/t) complies with moisture content of M20Additives (w-% of pressing mass)Type and content of pressing aids, slagging inhibitors or any other additives e.g. dust prevention agent have to be stated

89jamk
Info
rmat
ive Nitrogen, N (w-% of dry basis)
N1.0 ≤ 1.0 %N1.5 ≤ 1.5 %N2.0 ≤ 2.0 %N2.5 ≤ 2.5 %N3.0 ≤ 3.0 %N3.0+ > 3.0 %, (actual value to be stated)Particle density (kg/dm3)DE0.8 0.80–0.99 kg/dm3
DE1.0 1.00–1.09 kg/dm3
DE1.1 1.10–1.19 kg/dm3
DE1.2 ≤ 1,20 kg/dm3
Bulk density as received (kg/loose m3) Recommended to be stated if traded by volume basis
Ash melting behaviour (oxidating condi-tions), deformation temperature (DT) oC
It is recommended to state DT if temperature is <1100 oCNOTE: It is recommended to report all char-acteristic temperatures together with the test method used (ISO or CEN).
Chlorine, Cl (w-% dry matter) It is recommended to state chlorine content as one of the following categoriesCl 0.03, Cl 0.05, Cl 0.07, Cl 0.10 and Cl 0.10+ (if Cl > 0,10 % the actual value to be stated)
a Minimum requirement for net calorific value in dry basis ≥ 18 MJ/kg.If peat is milled before pressing it has to be specified.

90 jamk90
APPENDIX 2. SPECIFICATION OF PROPERTIES FOR PELLETS
Master tableOrigin: Fuel peat alone or blend of the following:
Woody biomass or herbaceous biomass specified according the TABLE 1 in CEN/TS 14961. Portion of each fraction shall be stated
Traded Form (see TABLE 2) Pellets
Nor
mat
ive Dimensions (mm)
Diameter (D) and Length (L)a
D06 6 mm ± 0,5 mm ja L ≤≤ 5 x DiameterD08 8 mm ± 0,5 mm ja L ≤ 5 x DiameterD10 10 mm ± 0,5 mm ja L ≤ 5 x DiameterD12 12 mm ± 1,0 mm ja L ≤ 5 x DiameterD14 14 mm ± 1,0 mm ja L ≤ 5 x DiameterD25 25 mm ± 1,0 mm ja L ≤ 4 x DiameterMoisture (w-% as received)M10 ≤ 10 %M15 ≤ 15 %M20 ≤ 20 %Ash (w-% of dry basis)A2.0 ≤ 2.0 %A4.0 ≤ 4.0 %A6.0 ≤ 6.0 %A8.0 ≤ 8.0 %A10.0 ≤ 10 %A10.0+ > 10.0 %, (actual value to be stated)Sulphur (w-% of dry basis) S0.15 ≤ 0.15 %S0.20 ≤ 0.20 %S0.25 ≤ 0.25 %S0.30 ≤ 0.30 %S0.35 ≤ 0.35 %S0.40 ≤ 0.40 %S0.45 ≤ 0.45 %S0.50 ≤ 0.50 %S0.50+ > 0.50 %, (actual value to be stated)Net calorific value as received (MJ/kg (=MWh/t))b
q18.0 ≥ 18.0 (≥ 5,0 MWh/t) complies with moisture content of M10 q16.2 ≥ 16.2 (≥ 4,5 MWh/t) complies with moisture content of M15 q14.4 ≥ 14.4 (≥ 4,0 MWh/t) complies with moisture content of M20 Mechanical durability (w-% of pellets after testing )DU95.0 ≤ 95.0 %
DU90.0 ≤ 90.0 %DU90.0- ≤ 90.0 %,(actual value to be stated)Amount of fines (w-%, < 3,15 mm) after production at factory gateb
F2.0 ≤ 2.0 % b At the last point where it is practical to take samples
F4.0 ≤ 4.0 %F4.0+ > 4.0 %, (actual value to be stated)Additives (w-% of pressing mass)Type and content of pressing aids, slagging inhibitors or any other additives e.g. dust control agent have to be stated at factory or any other place where it is added before receiving station

91jamk
Info
rmat
ive Nitrogen, N (w-% of dry basis)
N1.0 ≤ 1.0 %N1.5 ≤ 1.5 %N2.0 ≤ 2.0 %N2.5 ≤ 2.5 %N3.0 ≤ 3.0 %N3.0+ > 3.0 %, (actual value to be stated)Ash melting behaviour (oxidizing ass-mosphere), deformation temperature, DT, oC
It is recommended to state DT if temperature is <1100 oCNOTE: It is recommended to report all char-acteristic temperatures together with the test method used (ISO or CEN).
Chlorine, Cl (w-% of dry basis, %) It is recommended to state chlorine content as one of the following categoriesCl 0.03, Cl 0.05 or Cl 0.07, Cl 0.10 and Cl 0.10+ (if Cl > 0,10 % the actual value to be stated)
Bulk density as received (kg/m3 loose) Recommended to be stated if traded by volume basis BD 500, BD 600, BD 700
a Maximum 20 w-% of the pellets may have a length of 7,5 x Diameter.b Minimum requirement for net calorific value in dry basis ≥ 18 MJ/kg.If peat is milled before pressing it has to be specified.

92 jamk
APPENDIX 3. SPECIFICATION OF PROPERTIES FOR SOD PEAT
Master tableOrigin: PeatTraded Form sod peat
Nor
mat
ive Dimensions (mm)a
Shape Diameter (D)/length (L) cylindrical P40 ≤ 40 mm ja L ≤ 5 x Diameter
P60 ≤ 60 mm ja L ≤ 5 x DiameterP80 ≤ 80 mm ja L ≤ 5 x Diameter
cubic P30 L1 ≤ 30 mm, L2 ≤ 40 mm L3 ≤ 200 mm
arched (wave-like sod peat) P70 L1 ≤ 250 mm, L2 ≤ 70 mm L3 ≤ 250 mm
Oversized particles (% of weight), maximum weight of oversized particles of a single loadOP0.5 ≤ 0.5 %OP1.0 ≤ 1.0 %Oversized particle, maximum dimension of a single particle and sum of maximum dimen-sions (mm)MD300 300 mm and sum of the maximum dimensions 450 mmMD500 500 mm and sum of the maximum dimensions 700 mmMD700 700 mm and sum of the maximum dimensions 900 mmMoisture (w-% as received)M30 20 ≤ M ≤ 30 %M38 25 ≤ M ≤ 38 %M47 30 ≤ M ≤ 47 %M55 40 ≤ M ≤ 55 %Ash (w-% of dry basis) A2.0 ≤ 2.0 %A4.0 ≤ 4.0 %A6.0 ≤ 6.0 %A8.0 ≤ 8.0 %A10.0 ≤ 10 %A10.0+ > 10.0 %, (actual value to be stated)Net calorific value as received (MJ/kg (=MWh/t ))b, c
q14.0 ≥ 14.0 (≥ 3,9 MWh/t) complies with moisture content of M30 q12.0 ≥ 12.0 (≥ 3,3 MWh/t) complies with moisture content of M38 q10.0 ≥ 10.0 (≥ 2,8 MWh/t) complies with moisture content of M47 q8.0 ≥ 8.0 (≥ 2,2 MWh/t) complies with moisture content of M55 or Energy density as received (E) (MWh/loose m3)E1.30 ≥ 1.30 MWh/loose-m3 complies with moisture content of M30E1.15 ≥ 1.15 MWh/loose-m3 complies with moisture content of M38E1.00 ≥ 1.00 MWh/loose-m3 complies with moisture content of M47E0.80 ≥ 0.80 MWh/loose-m3 complies with moisture content of M55Amount of fines (w-%, < 20 mm for P40 – P80 and < 5 mm for P30) after production at receiving stationF5.0 ≤ 5.0 %F10.0 ≤ 10.0 %F15.0 ≤ 15.0 %F15.0+ > 15.0 %, (actual value to be stated)

93jamk
Nor
mat
ive Sulphur, S (w-% of dry basis
S0.15 ≤ 0.15 %S0.20 ≤ 0.20 %S0.25 ≤ 0.25 %S0.30 ≤ 0.30 %S0.35 ≤ 0.35 %S0.40 ≤ 0.40 %S0.45 ≤ 0.45 %S0.50 ≤ 0.50 %S0.50+ > 0.50 %, (actual value to be stated)
Info
rmat
ive Nitrogen, N (w-% of dry basis)
N1.0 ≤ 1.0 %N1.5 ≤ 1.5 %N2.0 ≤ 2.0 %N2.5 ≤ 2.5 %N3.0 ≤ 3.0 %N3.0+ > 3.0 %, (actual value to be stated)Bulk density as received (kg/m3 loose) Recommended to be stated if traded by vol-
ume basis as one of the following categories (BD280, BD300), maximum BD550
Chlorine, Cl (w-% of dry basis, %) It is recommended to state chlorine content as one of the following categoriesCl 0.03, Cl 0.05 or Cl 0.07, Cl 0.10 and Cl 0.10+ (if Cl > 0,10 % the actual value to be stated)
Ash melting behaviour (oxidizing atmos-phere), deformation temperature, DT, oC.
It is recommended to state DT if temperature is <1100 oCNOTE: It is recommended to report all char-acteristic temperatures together with the test method used (ISO or CEN).
a In the wave-like sod peat drawing describes the sod peat in production phase. In delivery arched sod is broken in 2-4 pieces.b Select either net calorific value as received or energy density.c Minimum requirement for net calorific value in dry basis ≥ 18 MJ/kg.

94 jamk
APPENDIX 4. SPECIFICATION OF PROPERTIES FOR MILLED PEAT
Master tableOrigin: PeatTraded Form milled peat
Nor
mat
ive Oversized particles a
Oversized particles (OP), weight (w-%) of oversized particles of a single loadOP0.5 ≤ 0.5 %OP1.0 ≤ 1.0 %Oversized particles, maximum dimension of a single particle and sum of maximum dimen-sions (mm)MD400 400 mm and sum of the maximum dimensions 600 mmMD750 750 mm and sum of the maximum dimensions 1000 mmMD1000 1000 mm and sum of the maximum dimensions 1500 mmMoisture (w-% as received), (annex E)M45 40 ≤ M ≤ 45 % single load maximum 50%, minimum 38%M50 40 ≤ M ≤ 50 % single load maximum 55%, minimum 38%M55 45 ≤ M ≤ 55 % single load maximum 60%, minimum 38%M60 50 ≤ M ≤ 60 % single load maximum 65%, minimum 38%Ash (w-% of dry basis) A2.0 ≤ 2.0 %A4.0 ≤ 4.0 %A6.0 ≤ 6.0 %A8.0 ≤ 8.0 %A10.0 ≤ 10.0%A10.0+ > 10.0 %,(actual value to be stated)Net calorific value as received (MJ/kg b = MWh/t)q10.0 ≥ 10 MJ/kg (≥ 2,8 MWh/t) complies with moisture content of M45q8.0 ≥ 8 MJ/kg (≥ 2,2 MWh/t) complies with moisture content of M50 q6.0 ≥ 6 MJ/kg (≥ 1,7 MWh/t) complies with moisture content of M55 q5.0 ≥ 5 MJ/kg (≥ 1,4 MWh/t) complies with moisture content of M60 q5.0- < 5.0 MJ/kg (< 1,4 MWh/t) Moisture content is ≥ 60 w-%or Energy density (E) (MWh/loose m3)c
E0.8 ≥ 0.8 MWh/loose-m3 complies with moisture content of M45E0.7 ≥ 0.7 MWh/loose-m3 complies with moisture content of M50E0.5 ≥ 0.5 MWh/loose-m3 complies with moisture content of M55E0.4 ≥ 0.4 MWh/loose-m3 complies with moisture content of M60Sulphur, S (w-% of dry basis)S0.15 ≤ 0.15 %S0.20 ≤ 0.20 %S0.25 ≤ 0.25 %S0.30 ≤ 0.30 %S0.35 ≤ 0.35 %S0.40 ≤ 0.40 %S0.45 ≤ 0.45 %S0.50 ≤ 0.50 %S0.50+ > 0.50 %, (actual value to be stated)Ash melting behaviour (oxidizing atmosphere), deformation temperature, DT, oC)It is recommended to state DT if temperature is <1100 oCNOTE: It is recommended to report all characteristic temperatures together with the test method used (ISO or CEN).

95jamk
Info
rmat
ive Nitrogen, N (w-% of dry basis)
N1.0 ≤ 1.0 %N1.5 ≤ 1.5 %N2.0 ≤ 2.0 %N2.5 ≤ 2.5 %N3.0 ≤ 3.0 %N3.0+ > 3.0 %, (actual value to be stated)Chlorine, Cl (w-% of dry basis, %) It is recommended to state chlorine content
as one of the following categoriesCl 0.03, Cl 0.05 or Cl 0.07, Cl 0.10 and Cl 0.10+ (if Cl > 0,10 % the actual value to be stated)
Bulk density as received (kg/m3 loose) Recommended to be stated if traded by volume basis in categories: minimum BD200, BD220, BD240, BD 350, maximum BD470
a The numerical values for dimension refer to the particle sizes passing through the round hole sieve size (ISO dimensions). Dimensions of actual particles may differ from those values especially the length of the particle.b See also Annex D for quality scheme of milled peat.c It is recommended to use net calorific value rather than energy density. d Minimum requirement for net calorific value in dry basis ≥ 18 MJ/kg

96 jamk
APPENDIX 5. Quality selection chart for milled peat.
95
APPENDIX 5. Quality selection chart for milled peat.
Minimum net calorific value as received
5.0 6.0 7.0 8.0 9.0 10.0 11.0 Q, MJ/kg
65,064,0
63,0
62,0
61,0
60,0Maximum 59,0
moisture 58,0
content 57,0
as received 56,0
55,0Mar, w-% 54,0
53,0
52,0
51,0
50,049,0
48,0
47,0 q,p,net,d MJ/kg46,0
45,0 24,0044,0
43,0 23,0042,0
41,0
40,0 22,0039,0
38,0 21,0017,00
18.00 20.0019.00
BD = 470 kg/m3
Minimum 1,10energy 1,00density 0,90
as received 0,80 BD = 240 kg/m3
0,70
Ear, MWh/m3 0,600,500,40

97jamk
APPENDIX 6. Terminology
BULK DENSITYBulk density of peat means the volume weight that includes both the peat parti-cles and the air space between the particles. Dry bulk density is determined so, that dry matter content per volume unit is calculated. Apparent density means the mass of peat volume with pores.
CHIPChip means the cross surface area in peat formed by rotation milling machines blade movement track, field surface and previous blades track. Average thickness of a chip means the chip cross surface area´s and the blade movement tract´s length´s elation.
COLLECTION DITCHCollection ditches lead water from field ditches towards main drainage ditch.
COLLECTION RELATIONRelation of leftover millings and depth of millings.
d50
-VALUEd
50-means that 50% of the sample particles are smaller and 50% larger than this
value. d25
-ja d75
-values follow similar logic as d50
-value.
DECOMPOSITION DEgREESame as humification degree. Decomposition degree describes the status of the decomposition process in peat. Decomposition degree is announced usually with Von Post scale. H1 is un decomposed material and H10 is completely decom-posed peat.
DEPTH OF MILLINgSThickness of the millings layer.
DITCH MILLERAuger-like milling machine for making ditches.
DRYINg PERIODPeriod from the milling to the ridging.

98 jamk
ELEMENTAR ANALYSIS (%)Elementar analysis is determination of fuel carbon (C), hydrogen (H), oxygen (O), nitrogen (N), and sulphur (S) with complete combustion (oxygen can also be determined as a difference).
EXTRA DRAINAgE DITCHDitch planned for removing water from the deepest parts of the peatland. This ditch usually goes across the lower end of field strips or following their direction and leads water to the sedimentation pond.
FIELD DITCH, PARALLEL FIELD DITCHESField ditches are parallel and 20 m apart from each other. At the ends of the ditches headland pipes are installed, so that peat machines can turn and enter from one field strip to another. Parallel field ditches are made with a ditch mak-ing auger. Ditches must be cleaned and deepened while the production proceeds over the years.
FIELD EDgE DITCHThis can be the ditch between the road and the production field, but is the edge ditch for draining the production area and can require piping under the field entrance.
FIELD DRYINg OF SOD PEATIn field drying of sod peat one harvest is extracted and lifted drying on the pro-duction field until reaching target moisture (35%). To speed up drying usually harrowing is carried out.
FUEL CONSUMPTONFuel consumption depends on extraction machine and the effect of the tractor unit and its condition. Due to his the results of fuel consumption with different extraction machines are not completely comparable. Fuel consumption is pre-sented as l/ton of dry matter (product) (l/tn
dm) or l per produced m3 (l/m3). Most
reliable way is to present l/tndm
, but more descriptive or easy to understand is l/m3.
HAKU -METHODPeat production method, where harrows, ridgers, belt loader and tractor pulled trailers are used. Peat is transported to the stock pile with trailers.

99jamk
HARROwINgHarrowing aims for disturbing the moist lower layer of milling to surface on the top of already dried layer.
HARVEST CYCLESee drying cycle.
HECTARE HARVESTPeat quantity produced per hectare during one production season.
LEFTOVER MILLINgSDry millings left on the field after ridging.
LOADINgWeight of the peat product on the field per surface area unit. Loading is measured as dry matter (kg
dm/m2). Loading tells how much peat there is drying on the field.
It also largely affects on the final hectare harvest. Loading is calculated from one meter production and divided by the width of the production strip.
LOSSIn sod peat production loss means the quantity difference between material extracted and lifted to the field drying and material taken to the stock pile. Loss is result of sods breaking to fines in different stages of handling. Some quantity of sod material remains on the field from ridging and loading. Loss used to be determined by measuring the dry material quantity in each work phase (extraction, ridge, stock pile). Measuring the material from a ridge turned out quite unreliable so currently only total loss from extraction to stockpile is calculated.
MAIN DRAINAgE DITCHMain drainage ditch takes the water from peat production areas water treat-ment structures and external waters from perimeter ditch the watercourse or to a wetland. Depending on the type of the area one or more main drainage ditches is planned for one peat production area
MILLINgSThin layer of peat loosened from the surface of the field.

100 jamk
MOISTUREPeat moisture means the water quantity in peat sample that leaves peat when dried in 105 oC temperature. Moisture is presented as % on dry matter (U, kg/kg), or on wet basis M
ar (w-%) . Peat user usually defines moisture on wet basis
Mar = (m1- m
2)/m
1 x 100% (moisture at delivery calculated as % on wet basis
m1 is mass of wet sample (g) and m2 is mass of dry sample(g)
MOLE SUBSURFACE DRAINAgE Mole subsurface drainage is made by using a mole subsurface drainage attach-ment behind the tractor which makes a 16 x 19 cm large mole drainage channel through the peat.
NET CALORIFIC VALUE (EN 14961-1)Net calorific value is heat quantity that is created while burning one mass unit of fuel, when the water formed in context of combustion turns to vapour and cools back to initial temperature. Net calorific value is announced on dry basis. Net calorific value of moist peat is calculated from the net calorific value of dry matter in constant pressure. Net calorific value is calculated from the gross calorific value (same as higher calorific value) Q
ar,d (MJ/kg)
q gr,d
= Q ar,d
x (100/(100–Mad
))q
ar,ad = Net calorific value as on dry basis air dried sample (MJ/kg)
Mad
= moisture content of the sample (moisture of air dry sample), %Net calorific value of dry matter (same as lower calorific value) (Q
net,d)
q net,d
= Q gr,d
- 0,02443 x MM= moisture that is formed when hydrogen from dry peat burns, w-%.If moisture content determination is not carried out, is the constant hydrogen concentration 5.6%, is used, which makes M value 50.0.In this situation the net calorific value(same as lower calorific value) is calculated the following way:q
net,d = Q
gr,d– 1.22
Net calorific value for peat as received (Q net,ar
)q
net,ar = Q
net,d x (100 - M
ar )/100 - 0,02443 x M
ar
Mar= total moisture of peat as received (w-%)
0.02443 (MJ/kg) = correction factor related to water vaporization (+25 oC)

101jamk
OVERLAND FLOwOverland flow means spreading peat production areas pre-treated waters to a mire/peatland area and water flowing across the area. Method can be an alter-native for vegetation filtration pools. This method commonly requires pumping water to the treatment area. Overland flow method removes solids, nutrients and organic compounds.
PARTICLE SIZE DISTRIBUTIONMillings particle size classes distribution as a percentage. It is presented with d25- and d75-values.
PERIMETER DITCHSame as separator ditch. This is a ditch that leads waters coming from outside of the peat production area past the production area. The perimeter ditch is planned so that it takes external water either round the peat production area or straight through it directly to the main drainage ditch.
PRE-DITCH MILLER Miller pulled by a tractor, that makes vertical side ditch. This device is used for making pre-drainage ditches that are needed on the most wet areas. RIDgINgCollecting dry millings or sods to a ridge.
RIDgE DRYINgRidge drying of sod peat means ridging the sods in 55–60% moisture to the edge of the field strip, where the sods dry to the final collection moisture. The released field area serves for drying the next harvest cycle. This method makes it possible to have two harvest cycles drying simultaneously on the same field strip.
SCREENINg LEFTOVERSFine material coming from screening sod peat.
SEDIMENTATION PONDPool for stopping the peat material or solids that is transported in water. Particle settle to the base of the pool. Sedimentation pond is usually located near the edge of the production field in connection to the main drainage ditch.

102 jamk
SLUDgE POOLExternal waters taken to perimeter ditches are treated by passing through sludge pools at least during the ditch making period. Pool is made in the ditches as a deeper section. Also drainage ditches in mineral soil can have additional sludge pools.
SOD PEAT METHODIn the sod peat method a cut is milled to the peat and the extracted material is prepared and compressed via nozzles into sod peat and put drying on the produc-tion field. Milling is carried out with a disc or an auger/screw, to approximately 50 cm depth. The most common sod types are round (cylinder-shaped) sod and wave-like sod.
SOD PEAT METER PRODUCE AND HOUR PRODUCEMeter produce describes machines extraction on one meter length (peat made by a harvesting machine driving 1 metre). Hour produce describes machines extrac-tion in a time unit. The larger hour produce, the faster the field is filled and the smaller is extraction- and tractor machine´s cost/ peat stockpile m3. Hour produce is calculated from meter produce by multiplying it with the driving speed of the extraction machine. It is expressed as wet or dry peat mass per time unit, kg/h and kg
dw/h.
Extraction machines hour produce can be compared to each other in different peat production areas when studying the production of wet peat, because using the same density for peat (1 kg/dm3), though moisture varies a bit. In driving speed and hour produce are separated, momentarily and effective hour produce. Momentarily hour produce and driving speed means produce measured for 50 m distance. Effective hour produce is calculated from several hectares area includ-ing also stops for different reasons.
VOLATILESVolatiles are components and decomposition results of organic compounds in the fuel that leave in a gas form while material is heated to 900 oC in an oxygen free atmosphere. Volatiles concentration is calculated from the mass reduction observed during the heating. Small volatiles quantity is beneficial, because vola-tiles add to the quantity of flue gas and cause a bad combustion result. Volatiles are given as weight-% of dry matter.
JAMK UNIVERSITY OF APPLIED SCIENCES
SALES AND DISTRIBUTIONJAMK University of Applied Sciences
Library and Information ServicesP.O. Box 207, FI-40101 JyväskyläRajakatu 35, FI-40200 Jyväskylä
Tel. +358 40 552 [email protected]
www.jamk.fi/julkaisut
ONLINE SHOPwww.tahtijulkaisut.net
Publications

JAMK UNIVERSITY OF APPLIED SCIENCES
SALES AND DISTRIBUTIONJAMK University of Applied Sciences
Library and Information ServicesP.O. Box 207, FI-40101 JyväskyläRajakatu 35, FI-40200 Jyväskylä
Tel. +358 40 552 [email protected]
www.jamk.fi/julkaisut
ONLINE SHOPwww.tahtijulkaisut.net
Publications

P.O. Box 207, FI-40101 JyväskyläRajakatu 35, FI-40200 Jyväskylä
Tel. 020 743 8100www.jamk.fi
SCHOOL OF BUSINESS AND SERVICES MANAgEMENT
SCHOOL OF HEALTH AND SOCIAL STUDIES
SCHOOL OF TECHNOLOgY
TEACHER EDUCATION COLLEgE
Copyright © 2022 FDOKUMEN