The Changuinola peat deposit of northwestern Panama: a tropical, back-barrier, peat(coal)-forming...
36
International Journal of Coal Geology, 12 (1989) 157-192 157 Elsevier Science Publishers B.V., Amsterdam -- Printed in The Netherlands The Changuinola peat deposit of northwestern Panama: a tropical, back-barrier, peat(coal)- forming environment ARTHUR D. COHEN 1, ROBERT RAYMOND, Jr. 2, ARTURO RAMIREZ 3, ZOREL MORALES 3 and FRANCISCO PONCE 3 1Department of Geological Sciences, University of South Carolina, Columbia, SC 29208, U.S.A. 2Los Alamos National Laboratory, Los Alamos, NM, U.S.A. 3Instituto de Recursos Hidraulicos y Electrificacion, Panama (Received April 1, 1988; revised and accepted October 28, 1988) ABSTRACT Cohen, A.D., Raymond, R. Jr., Ramirez, A., Morales, Z. and Ponce, F., 1989. The Changuinola peat deposit of northwestern Panama: A tropical, back-barrier, peat(coal)-forming environ- ment. In: P.C. Lyons and B. Alpern (Editors), Peat and Coal: Origin, Facies, and Depositional Models. Int. J. Coal Geol., 12: 157-192. A large ( > 82 km 2), thick ( > 8 m), low-ash, low-sulfur peat deposit has formed on the north- western coast of Panama. Its low ash and low sulfur contents can be attributed partly to: (1) doming; (2) the occurrence of a relatively continuous, marine-blocking, beach-barrier shoreline feature; and (3) leaching of the mineral matter. This deposit is roughly rectangular in shape and oriented with its longest axis parallel to the beach-barrier shoreline. It would produce an economic coal bed that is bright and finely banded in its thickest central region and more coarsely banded at its margins. Its northwestern margin would be characterized by interfingering of coal with sandstone and siltstone of the Changuinola River flood plain, whereas its southeastern boundary would be characterized by truncation of the upper part of the seam by marine to brackish shales, siltstones, and carbonates that were derived from Almirante Bay. Total sulfur was found to be very low (less than 0.2% dry wt.) except in a few places. In these rare cases, nearly all of the sulfur was pyritic and the total sulfur content was anomalously high ( > 14% ). Although the general tendency was for total sulfur to increase wherever the deposit was influenced by marine conditions, one case was found where sulfur was high at the base of an inland freshwater peat core, which suggests either a "hidden" marine influence or the need for some new mechanism to explain sulfur enrichment in such an anomalous case. Differences in inherent fixed carbon contents and calorific values due to changes in peat type and analytical uncertainties tended to mask seamwide trends in these parameters. However, fixed carbon contents and calorific values showed a slight tendency to increase with depth (especially if plotted for single peat types). Vitrinite reflectance within the hypothetical Changuinola coal bed would be expected to in- crease as follows: (1) toward the margins of the deposit; (2) toward the bottom and top of the bed; and (3) toward stream channels or tidal inlets. 0166-5162/89/$03.50 © 1989 Elsevier Science Publishers B.V.
-
Upload
independent -
Category
Documents
-
view
3 -
download
0
Transcript of The Changuinola peat deposit of northwestern Panama: a tropical, back-barrier, peat(coal)-forming...

International Journal of Coal Geology, 12 (1989) 157-192 157 Elsevier Science Publishers B.V., Amsterdam - - Printed in The Netherlands
The Changuinola peat deposit of northwestern Panama: a tropical, back-barrier, peat(coal)- forming environment
ARTHUR D. COHEN 1, ROBERT RAYMOND, Jr. 2, ARTURO RAMIREZ 3, ZOREL MORALES 3 and FRANCISCO PONCE 3
1Department of Geological Sciences, University of South Carolina, Columbia, SC 29208, U.S.A. 2Los Alamos National Laboratory, Los Alamos, NM, U.S.A. 3Instituto de Recursos Hidraulicos y Electrificacion, Panama
(Received April 1, 1988; revised and accepted October 28, 1988)
ABSTRACT
Cohen, A.D., Raymond, R. Jr., Ramirez, A., Morales, Z. and Ponce, F., 1989. The Changuinola peat deposit of northwestern Panama: A tropical, back-barrier, peat(coal)-forming environ- ment. In: P.C. Lyons and B. Alpern (Editors), Peat and Coal: Origin, Facies, and Depositional Models. Int. J. Coal Geol., 12: 157-192.
A large ( > 82 km 2), thick ( > 8 m), low-ash, low-sulfur peat deposit has formed on the north- western coast of Panama. Its low ash and low sulfur contents can be attributed partly to: (1) doming; (2) the occurrence of a relatively continuous, marine-blocking, beach-barrier shoreline feature; and (3) leaching of the mineral matter. This deposit is roughly rectangular in shape and oriented with its longest axis parallel to the beach-barrier shoreline. It would produce an economic coal bed that is bright and finely banded in its thickest central region and more coarsely banded at its margins. Its northwestern margin would be characterized by interfingering of coal with sandstone and siltstone of the Changuinola River flood plain, whereas its southeastern boundary would be characterized by truncation of the upper part of the seam by marine to brackish shales, siltstones, and carbonates that were derived from Almirante Bay.
Total sulfur was found to be very low (less than 0.2% dry wt.) except in a few places. In these rare cases, nearly all of the sulfur was pyritic and the total sulfur content was anomalously high ( > 14% ). Although the general tendency was for total sulfur to increase wherever the deposit was influenced by marine conditions, one case was found where sulfur was high at the base of an inland freshwater peat core, which suggests either a "hidden" marine influence or the need for some new mechanism to explain sulfur enrichment in such an anomalous case.
Differences in inherent fixed carbon contents and calorific values due to changes in peat type and analytical uncertainties tended to mask seamwide trends in these parameters. However, fixed carbon contents and calorific values showed a slight tendency to increase with depth (especially if plotted for single peat types).
Vitrinite reflectance within the hypothetical Changuinola coal bed would be expected to in- crease as follows: (1) toward the margins of the deposit; (2) toward the bottom and top of the bed; and (3) toward stream channels or tidal inlets.
0166-5162/89/$03.50 © 1989 Elsevier Science Publishers B.V.

158
INTRODUCTION
Objectives and scope
The primary objective of this research was to assess the potential for the Changuinola peat deposit of Panama to be used as a fuel for an electrical power plant. This assessment was completed in 1987 (see Cohen et al., in press, a). A secondary objective of this research was to gather information that would be useful in developing a model to predict the characteristics of coal seams that formed in tropical, back-barrier settings similar to that of the Changuinola deposit. The results of this secondary objective are reported in this paper.
Previous work and its relevance to this study
Coal beds interpreted as having been formed behind barrier-beach deposits have been reported frequently in the literature (e.g., Hobday, 1974; Horne et al., 1978; Englund et al., 1987). These are often referred to as back-barrier coal beds. Modern back-barrier peat-forming environments are extremely common today on coastal plains in many parts of the world. Staub and Cohen (1978, 1979), Corvinus and Cohen (1984), Cohen (1984), and Cohen et al. (1987a) have described in detail the characteristics of some warm-temperate, back- barrier peat deposits on the Atlantic Coastal Plain of the United States (the Snuggedy Swamp of South Carolina and the Okefenokee Swamp of Georgia). These modern peat deposits have been used as analogs for certain back-barrier coals (e.g., McCabe, 1987) but they probably would not be analogous to coals that are believed to have formed in tropical settings, such as the Pocahontas coal beds of the Appalachian Basin (Englund et al., 1987).
Unfortunately, not enough detailed information on the geometry and com- position of peats formed in modern, wet-tropical, back-barrier settings has been published to allow the construction of good models. Some important in- formation is provided by Coleman et al. (1970), who studied Malaysian peat deposits (some of which are probably of the back-barrier type ); Anderson ( 1964, 1973 ), who investigated the geometry and botany of peat deposits of Indonesia, and numerous reports on the composition of peats of Jamaica (e.g., Robinson, 1980; Bjork, 1984 ). Additionally, preliminary reports of compositional studies on Indonesian peats being conducted by several researchers (e.g., Esterle, 1987; Cecil et al., 1987; Cameron et al., 1989, this volume) have recently been pub- lished, as have preliminary studies on the petrography and chemical compo- sition of peats in Costa Rica (Cohen et al., 1985, in press, b).
The Changuinola peat deposit described in this paper is of special signifi- cance with regard to our understanding of economic coal beds because it is not only formed in a back-barrier setting but is also large (greater than 82 km 2 in area), thick (averaging more than 8 m), very low in ash (averaging less than
159
4% on a dry weight basis over the entire deposit and less than 2.5% ash through its central region), and very low in sulfur (less than 0.2% over most of the deposit except for its seaward edges).
Geomorphologic and geologic setting
The Changuinola peat deposit is located on the northwestern coast of Pan- ama near its border with Costa Rica and is just southeast of the Rio Changui-
".'L
~:-: : - ~ B A R R I E R B E A C H
~ ' / " i .,~-, .x~ A' L
s f " ~ . " : i : ' ~ . -~,
: :::.. : -
:~,w~',i. - - : - : : "-.,'--~L:.t ~
M A R C A R I B E
A S D E L T O R O
B A H I A A L M I R A N T E
. - . - , p A , e
-*,--~c • . 4 A-, " ,px z ~ . ~
• ~MPLE LOCALITIES - :~~
Fig. 1. Location of sampling sites and sectional profiles, Changuinola Peat Deposit, Changuinola, Panama.

82
04
5
,
90
30
:
9°1
0
82
01
5 ,
.j' -~
,._
.~
CO
STA
R,C
A ~
. .
..
..
..
..
..
..
..
~
nEC
Em
k" T.,
'~I ,
~ ~
~ M
IOC
ENE
--~
' "~
-/
/"
\ "-
'i--
t \-
~'~
-'~
~
UN
DIF
TER
TIAR
Y ../..~,f.~'/
~ "
. ~
! .... -2.~
~ MID-UPTERTIARY
-~,\
~\
~ ~
.q~,
) j\
_.
'
.-.
;- -
.~)~
M
AH
(..;
AHII~
I- ~
U C
RET
ACEO
US
~',T
,,s
~-
'~
c" ~
.
"-'4
: °.
/~
cO
"'x
/ .
" )
' "
~ ~
[ ~'~
BA
HIA
ALMIRANTE "~
~ ~
..
..
)
, T,
o -~
--4
'~
".
"~,
" -
~ "~
-"--
. \
\---
-
T
" x
. --
v :
rEO
k
" "
~
~-
{,~
C
•
'
- .-
~
'\
[7
'\
/ ,,
-,.
"~.
~.~
T
=
~ ~
~-., ---
~-~-
~ ,
.
Fig
. 2.
Geo
log
ic m
ap
of
no
rth
we
ste
rn P
an
am
a s
ho
win
g t
he
loca
tio
n o
f th
e C
han
gu
ino
la p
ea
t d
epo
sit
an
d t
he
mo
un
tain
ran
ge
t:o t
he
s~u
thw
est.

161
nola (Fig. 1 ). The peat has formed on top of recent unconsolidated sediments behind (and roughly parallel to) a beach-barrier that extends continuously to the southeast for about 10 km (Fig. 1 ). Bordering the deposit on the southwest are the foothills of a mountain range composed of Upper Cretaceous to Eocene sandstone, shale, and volcanic rocks (Fig. 2 ). Miocene rocks of the Gatun For- mation outcrop in the low hills closest to the peat deposit and may extend beneath the unconsolidated Quaternary clastics on which the peat deposit has developed. These Miocene rocks consist of shale, mudstone, sandstone, coals, conglomerate, and pyroclastic rocks (Fig. 2 ).
Bahia Almirante (Almirante Bay) borders the deposit to the southeast. Pre- liminary sampling in the bay near the deposit suggests that remnants of the peat deposit may have been buried in places beneath the bay sediments by a transgression of the sea after the peat had formed.
The vegetational and drainage patterns displayed on the aerial photographs suggest that this deposit is domed in the center. However, the precise surface geometry has not yet been determined by surveying.
METHODS
Field methods
Core samples were collected at each site using a hand-operated Macaulay Peat Sampler. This device allowed collection of core samples in 30- or 50-cm increments (depending on sampler head size) from the top to the bottom of the deposit at each site. Each core increment was described in the field, in- serted in a labeled, double plastic bag, and placed in back packs (out of direct sunlight) for later transportation back to our laboratory. All samples were packed in rigid cardboard boxes to prevent damage or compaction.
Laboratory methods
The following tests or analyses were conducted: (1) petrographic/botanical analysis; (2) proximate analysis (moisture, ash, fixed carbon, and volatile matter ); (3) calorific value (Btu); (4) total sulfur content; (5) mineralogical analysis of the ash; and (6) pH.
The petrographic/botanical analysis is a microscopic analysis of the peat using microtome thin sections. These sections were prepared from paraffin- embedded peat by the methods described in Cohen (1982). The parameters measured by this method include: (1) anatomically identifiable plant types; (2) relative degree of decomposition (fiber content ); (3) relative amour~t of oxidation (darkening of tissues); and (4) various microscopically significant compositional characteristics (such as presence or types of fecal pellets, plant phytoliths, fungal remains, and minerals).
For proximate analysis, calorific value, sulfur content, and mineralogical

162
analysis, we used subsamples that had previously been dried at 50 ° C in an oven and crushed in a mill to minus 60 mesh (less than 250/~m ). Proximate analysis was performed with an automated Fisher Coal Analyzer, with residual mois- ture being determined at 107 C, volatile matter at 950°C in a covered quartz crucible, ash content at 750 ~C for 3.5 hours, and fixed carbon by difference. Calorific values were determined on a Digital Data Systems CP-500 automatic calorimeter, which uses a waterless isothermal system of analysis. Total sulfur was determined with a Leco SC-132 Sulfur Analyzer. The Leco SC-132 com- busts the sample under an oxygen jet at 1370 °F (743 °C) and uses an infrared detector to measure ensuing sulfate production. For mineralogical analysis, peat ash was obtained using a low-temperature asher (LTA). The LTA utilizes an RF generator to excite oxygen within closed vessels containing the peat samples. All carbon is oxidized to CO2 and thereby removed, while sample temperature remains under 150°C (Russell and Rimmer, 1979). Most of the mineral matter within the sample is preserved in an organic-free and unaltered state, ready for analysis. The LTA splits of the samples were analyzed for their mineralogic content using a Siemens X-ray powder diffractometer (XRD).
RESULTS AND DISCUSSION
Peat deposit geometry and surface vegetation
Figure 3 is an isopachous map of the Changuinola deposit. Because no to- pographic map of the peat surface has yet been made, it was difficult for us to know for certain whether the underlying rock surface was flat or whether the peat formed in a depression. As of this writing, a topographic survey is being conducted; our next report will contain this information. However, from visual inspection of the surface, we propose the hypothetical cross section illustrated by Figure 4 to explain the peat thicknesses. Note that a flattened dome would account best for the vegetational pattern observed (Fig. 5). Dense tropical forest vegetation occurs around the edges, where the peat is relatively thin. On the other hand, the central area supports primarily low herbaceous plants such as sedges, grasses, peat moss, ferns, and other plants that can exist in wet (but not pond-like ), nutrient-poor conditions. Scattered wetland shrubs and shrub hammocks are also present in this central area, as are floating aquatic plants in scattered small shallow ponds.
Figure 6 is a schematic longitudinal section (B-B') of the Changuinola peat deposit oriented roughly parallel to the Caribbean shoreline. Note that the peat interfingers at its northwestern boundary with freshwater sands and clays from the Rio Changuinola. The nonpeat island shown between BDT-14 and BDT- 13 is predicted to be present by surface vegetation but has not yet been verified by coring. Sediments from Bahia Almirante, a brackish-water bay, cover an

163
A
NTE
Fig. 3. Isopachous map of the peat deposit at Changuinola, Panama. Peat thickness (cm).
(SW) (NE)
Tropical Sedges, Grasses, Sugi//mia, Ferns, Sphagnum Hardwood Fo res t scattered shrubs & shrub hammocks
.iiii, iiii...~.. ~ Raphia Palms : . £ . . ~ 0 . . ~ & Tropical Swamp
~_ ~ ~ r , . . . t . , ~ v e g e t a t i o n
o" :.; ".; :'.~V,:::" o'.-.;.. : 7 - ~ . ".~-~.. , , . . .~.-~: . . . . . . . . . . . . . . . . . . .. "..,: .~BARR ER, ..., o',,'," ,,
A A'
Fig. 4. Schematic diagram illustrating cross sectional geometry and surface vegetation, Changui- nola peat deposit, Panama.
undetermined portion of the peat deposit to the southeast. Contrary to most of the soils and vegetation maps of Panama, the only mangrove vegetation

(A) iii
Fig.
5.
Sur
face
veg
etat
ion
cove
ring
the
Cha
ngui
nola
pea
t de
posi
t. A
. Aer
ial v
iew
loo
king
inla
nd
(S
W)
from
the
Car
ibbe
an s
ea t
o th
e m
ou
nta
ins
(coi
ncid
ent w
ith
A-A
' in
Fig
. 1
). N
ote
that
the
tre
eles
s ce
ntra
l re
gion
coi
ncid
es w
ith
the
area
of t
hick
est
peat
. B
. C
lose
r ae
rial
vie
w o
f th
e su
rfac
e ve
geta
tion
in th
e ce
ntra
l reg
ion
show
ing
the
dom
inan
ce o
f he
rbac
eous
~ eg
etat
ion
and
the
pre
senc
e of
occ
asio
nal s
hrub
ham
moc
ks.
C. C
lose
r vi
e~
of th
e su
rfac
e. N
ote
the
scat
tere
d cl
umps
of
sedg
es,
gras
ses,
an
d f
erns
an
d o
ccas
iona
l bar
e pa
tche
s w
here
the
pea
t su
rfac
e is
exp
osed
. D
. C
lose
-up
of ty
pica
l sur
face
veg
etat
ion
in th
e ce
ntra
l re
gion
. Do
min
ant p
lan
ts h
ere
are
sedg
es,
gras
ses,
fer
ns, S
agitt
aria
(ar
row
hea
d p
lan
t ). a
nd S
pha~
mu~
i (p
eat
mos
s).
Inse
ct-e
atin
g pl
ants
, suc
h as
stm
dew
s (D
rose
ra)
and
bla
dder
wor
ts (
Utr
icu
tari
a), a
re a
~so
pres
ent.
B (NW)
165
B' (SE)
RIO ;HANGUINOLA
BAHIA ALMIRANTE
BDT-5 BDT-20 BDT-14 ~ BDT-3 I
Fig. 6. Schematic longitudinal section (B-B') of the Changuinola peat deposit (not to scale).
covering this wetland region occurs where this primarily freshwater wetland contacts Bahia Almirante (Fig. 6).
History of development of the Changuinola peat deposit
One hypothetical explanation for the development of the Changuinola peat deposit and its associated inorganic sediments is shown in Figure 7. The un- consolidated clastic sediments directly beneath the peat deposit probably formed when the Caribbean shoreline was as shown in Figure 7A. The Chan- guinola Delta would have developed during a time of relative sea-level stability or regression. Later, marine transgression might have eroded the delta and begun formation of the spit (Fig. 7B ). Continued development of the spit (Fig. 7C) and eventual restriction of the opening into Bahia Almirante (Fig. 7D) would result in freshwater peat formation as shown in Figure 7E. More rapid marine transgression would reopen (or widen) the inlet between the mainland and Isla Colon, erode some of the previously formed peat, and widen the bay (Fig. 7F).
Petrographic~botanical composition and fiber content
Figure 8 shows the microscopically defined peat types determined from cores representing a cross section (A-A') of the deposit from the southwest to the northeast and a longitudinal section (B-B') from the northwest to the south- east. More detailed petrographic descriptions are given in Cohen et al. (in press, a). The peat samples are grouped into six types based on their botanical composition: (1) freshwater swamp-forest peat; (2) sedge-grass-fern peat; (3) Sagittaria et al. peat; (4) Nymphaea-Sagittaria peat; (5) marine Rhizophora (mangrove) peat; and (6) transitional brackish-water peat. The Rhizophora (mangrove) and brackish transitional peats were found only at the base of core

166
M A R i t . . . . . ~ M A R ~ A R I B E l ~ " ~ C A R I B E
¢ / /8.., . ~<o.! I+?-/-AL,A t ,s. rJ'.f '''~ f CHANGUINOLA L. j ! ( C~'I,~NGUINOLA ~.COLON
/ (A) (B)
M A R C A R I B E
+.o~ CQ~<C,','OLA 0 ~ \ . \
~® T SA.,A , ALMIRANTE I'
M A R , CARIBE
~¢'b.Oel:
~'4~uO " ~ A L M I R A N T E
- H , )othetical "~"" \ f~-~ ', YP ~ ",.7" • Areas of f reshwater i, / i
Peat Format ion
(c) (o)
E ~ . . . . . . . . . . . . . . . . . . . . . . .
~ - - ~ OF FRESHWATER PEAT (E) • CORE LOCATIONS
Fig. 7. Hypothetical development of the Changuinola peat deposit. A. Formation of Rio Chan- guinola Delta and Bahia Changuinola. B. Transgressing sea erodes delta and forms Changuinola split. C. Restriction of entrance to Bahia Almirante by spit extension. D. Further restriction of entrance to Bahia Almirante and beginning of freshwater peat formation. E. Most recent marine transgression begins reopening of entrance to Bahia Almirante and widening of the bay. F. Present geomorphology of Changuinola area and occurrence of peat.

167
DEPTH (cm)
A (SW)
BDT-22 0.
60'
120,
180, 240
3OO
36O 420
480
S40
6OO
66O
720
78O 840
A s
(NE)
BDT-20
t t / i /
/
/ / , ~ "
/ /
BDT-1 BDT-12
JY .,: . / / / /
• ~,2,'~ // : / /
RIO CHANGUINOLA
DEPTH (cm)
B (NW)
BDT-5
420- \ \ ~\
480- \ \ \ \
540" ', \
600- \ " \ \ 660. \~ \, 720.
780. 84C
BDT-20
a F
(SE)
BDT- 14 BDT-3
s ~ / BAHIA ~ / / ~ ALMIRANTE
i i i / i / 1 1 ~ / /
/ / / I /
/ I /
/ /
FRESH SEDGE- SAGITTARIA NYMPHAEA WATER GRASS & ET AL SAGrl-rARIA SWAMP- FERN PEAT PEAT PEAT FOREST PEAT B B
R.,ZOPHORA TRANS,.,O.A SA.D MANGROVE BRACKISH OR
PEAT PEAT CLAY
Fig. 8. Sectional profiles A-A' and B-B' through Changuinola peat deposit showing peat types.
BDT-3, which occurs near the edge of the deposit at its boundary with Bahia Almirante.
The freshwater swamp-forest peat was found in all areas and was especially persistent in mineral-rich places such as the base of most cores and toward the
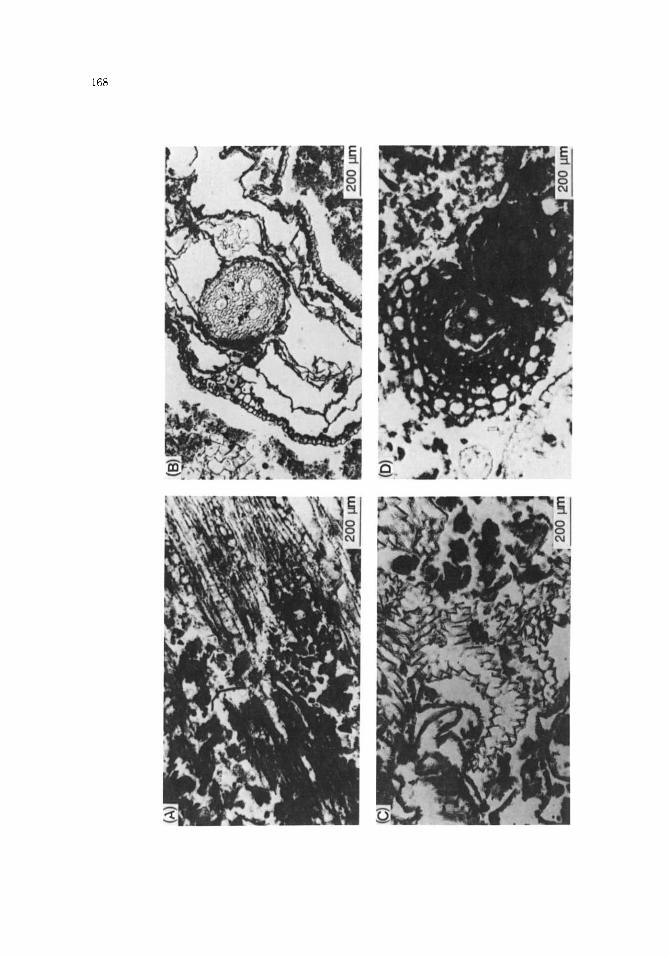

Fig.
9. P
etro
grap
hic/
bota
nica
l cha
ract
eris
tics
of p
eats
fro
m th
e C
hang
uino
la p
eat
depo
sit,
Pan
ama.
Sca
le--
200
#m
. A
. Typ
ical
sw
amp-
fore
st p
eat s
how
ing
woo
dy fr
agm
ents
and
dar
kene
d de
bris
. B
. Typ
ical
sed
ge-g
rass
-fer
n pe
at s
how
ing
sedg
e ro
ots.
C
. Sag
itta
ria-
dom
inat
ed p
eat s
how
ing
char
acte
rist
ic r
oot a
nato
my
(BD
T-1
8, 2
50-3
00 c
m).
D
. Fer
n-do
min
ated
pea
t sho
win
g fe
rn r
oot a
nd d
arke
ned
debr
is (
BD
T-1
3,50
0-55
0 cm
).
E. N
ymph
aea-
dom
inat
ed p
eat s
how
ing
larg
e co
ncen
trat
ion
of fi
ber a
nd li
ght c
olor
(B
DT
- 13,
945
-950
cm
).
F. T
ypic
al R
hizo
phor
a (m
angr
ove)
pea
t sho
win
g do
min
ance
of r
oots
.
~D
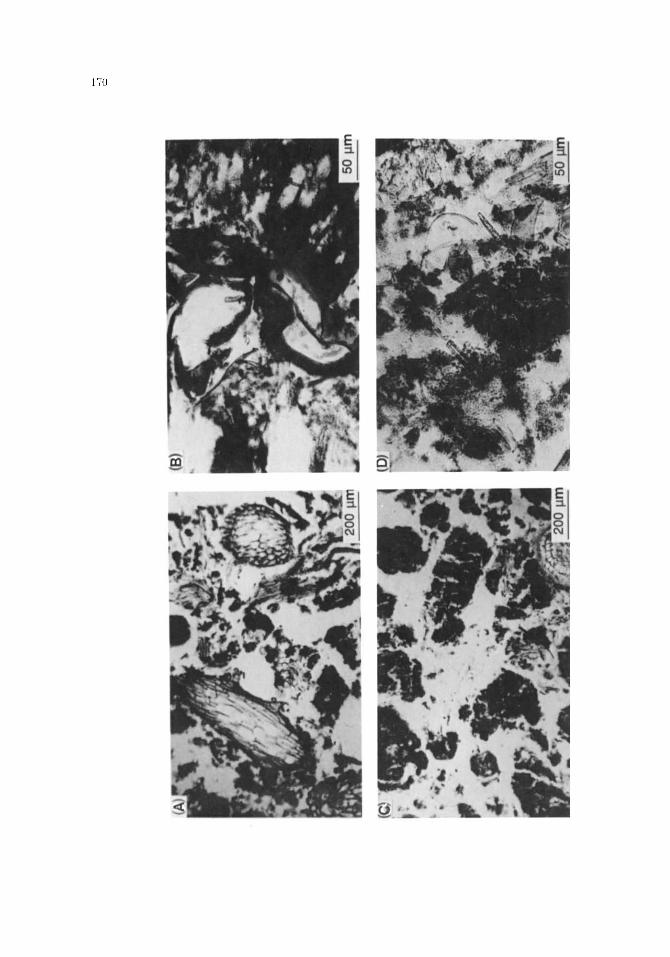

Fig. !0. Petrographic/botanical characteristics of pea
ts fro
m th
e Ch
angu
inol
a deposit, Pan
ama.
A.
Sph
agnu
m-do
mina
ted
peat
(BD
T-13
,500
-550
cm)
. B.
Ins
ect (m
ite)
exo
skel
eton
(BD
T-14
, 0-
50 cm)
. C. Fec
al pe
llets among sed
ge roo
ts (BD
T-18
, 0-
50 cm)
. D.
Fre
shwa
ter sp
onge
spicules s
howi
ng silica dissolution (BD
T-12
, 78
0-80
5 cm
).
E. Cha
rcoa
l an
d mi
nera
l-ri
ch zon
e ne
ar the
bas
e of
cor
e BDT-22 (7
80-8
05 cm)
. F
. M
iner
al-r
ich
zone
at
base
of
core
BD
T-1
3, (
945-
950
cm)
show
ing
sili
ceou
s m
iner
al m
atte
r an
d p
yrit
e (F
eS2)
cry
stal
s.
~=~

172
edges of the deposit (Fig. 8). Note the interfingering of this peat type with the Rio Changuinola flood-plain sediments at the northwestern edge of the deposit and also its presence as a surface layer at the northeastern and southeastern edges of the Changuinola peat deposit. This peat type is a diverse mixture of freshwater swamp trees, shrubs, and vines with ferns and tropical broadleaf herbaceous plants as common associates. Palm debris (probably Raphia) was also encountered occasionally in this peat (but only near the surface ).
The most commonly occurring peat types (sedge-grass-fern and Sagittaria et al. ) represent freshwater, open-marsh settings characterized by very shallow water and ephemeral dry periods (see Fig. 5C ). The Sagittaria-dominated peat type represents slightly wetter conditions than does the sedge-grass-fern type.
Even wetter conditions (i.e., areas of ponded water) are represented by the presence of a Nymphaea-dominated peat type. Note that this peat type never occurs near the tops of any cores (within less than 1.5 m of the surface), which suggests that persistent deep water conditions (ponds) have been rare in this region in recent times. Because we have no radiocarbon dates from this area at present, we do not know the length of time represented by 1.5 m of peat. However, radiocarbon dates from a peat deposit in Costa Rica (Cohen et al., 1985) indicate an approximate rate of peat sedimentation of 1 m per 800 yr., which suggests that persistent ponds have probably not existed within the Changuinola peat-forming area for the last 1200 years. Radiocarbon dates for the Changuinola peats will be obtained in future years.
Note that, except for the layer of sedge-grass-fern peat at the top of cores 22, 20, 12, and 14 (central region) and the persistent (but often thin) layer of freshwater swamp-forest peat at the base of most all cores, correlation of peat types between cores is virtually impossible at this core spacing (roughly 2-2.5 km apart). However, the variability of these sequences within each core indi- cates that the vegetational community that produced each peat layer did not cover a very large area nor did it last for very long in any one area.
Typical microscopic characteristics of each peat type are shown in Figures 9 and 10. Additional petrographic characteristics are illustrated graphically in Figures 11 to 13. Figure 11 shows the frequency at which samples of each peat type fall into one of the three fiber categories of the ASTM classification sys- tem (i.e., "fibric", "hemic", or "sapric", ASTM, 1987). These fiber categories generally represent the degree of decomposition of plant tissues composing a peat (that is, the more fibers, the less decomposition ). Because too few samples of mangrove or transitional peat were encountered, these types were not in- cluded on the graphs.
The three peat types are shown from left to right in order of increasing per- sistence of standing water (Fig. 11 ). Note that fibric peat increases from left to right and sapric peat decreases from left to right. Thus, swamp-forest peat samples (which form under drier conditions) usually are more decomposed than Nymphaea-Sagittaria peats (which form under wetter conditions).

173
AREA %
OF
SAMPLES
100-
90-
8 0 -
70-
6 0 -
5 0 -
4 0 -
30 -
20 -
10-
Increasing persistence of standing water
SEDGE- GRASS-FERN PEAT
SWAMP- FOREST PEAT
I¢'1 ~
%',•
[]
SAGITTARIA ET AL PEAT
,,,- ?:S~
[- g..~
NYMPHAEA ET AL PEAT
. . .
F H S F H S F H S F H S Fig. 11. Fiber frequency of peat samples from Changuinola, Panama. Fiber determined micro- scopically as area %. F = Fibric (greater than 67% ); H = Heroic (34-67%); S = Sapric (less than 34% ).
Increasing persistence of standing water
100- SWAMP- GRASS-SEDGEI SAGITTARIA NYMPHAEA- 90- FOREST FERN PEAT ET AL PEAT ET AL
A R E A 8o- PEAT PEAT % 7o-
SAMPLES 5o- j 40- - ~ 30- 20- 10-
LMD LMD LMD _MD Fig. 12. Degree of darkness (opaqueness) of tissues (---oxidation). L =light; M = medium; D = dark.
Figure 12 illustrates the relative degree of darkness (representing oxidation ) of tissues as viewed in transmitted light through the microscope. Tissues in swamp-forest peats (as might be expected because of drier conditions) were dark more often than those in Nymphaea-Sagittaria peats. The trends shown in Figure 13 probably also reflect the relative wetness of the depositional en- vironments. In this case, the abundance of fecal pellets (produced by vario6s surface-dwelling animals from ingested plants) was highest in peat samples from the driest environment (swamp-forest) and lowest in samples from the wettest environment (Nymphaea-Sagittaria).

174
AREA %
OF SAMPLES
Increasing persistence of standing water
100-. 1 SWAMP- 90-~ FOREST )FERN PEAT 80-q PEAT
i
70-,
i m
2o-4 IH~lllmm i I I I I1~
SEDGE-GRASS- SAGITTARIA NYMPHAEA ET AL PEAT PEAT
RCA RCA RCA RCA Fig. 13. Abundance of fecal pellets. R = Rare- Occasional; C -- common; A = Abundan t .
Proximate analysis
Averages and ranges for all peat samples Proximate analyses (fixed carbon, volatile matter, and ash), sulfur, and ca-
lorific value analyses for 246 samples taken within and around the Changui- nola area are given in Cohen et al. (in press, a). Total moisture content is not shown in this table because it was determined on only a few samples, and the range (92-95% moisture) was not felt to be representative of the entire de- posit. Based on previous experience with other tropical peats, we predict a more likely range of 85-98% moisture.
Average values (dry weight) for ash, fixed carbon, and volatile matter con- tents for all peat samples are 4% ash, 34% fixed carbon, and 62% volatile mat- ter. Ranges for these parameters are: 1-25% ash, 25-39% fixed carbon, and 52-70% volatile matter.
Ash content distribution Figure 14 shows the ash content of cores taken along transects A-A' and B-B' (Fig. 1 ). Cores BDT-14, -20, and -22 were all taken from the treeless central portions of the deposit. The ash content of the peat in these areas is very low (generally less than 2.5% ). Note that ash content increases toward the edges of the deposit.
The two small ash peaks in core BDT-22 are exactly the same distance apart as the two ash peaks in core BDT-20. Thus, it is very likely that these peaks are synchronous. However, the peaks in core BDT-22 are approximately 120 cm higher than are the peaks in core BDT-20, probably because we do not currently have a topographic map of the deposit surface and have consequently made the surface a horizontal line. However, either a difference in the peat surface topography or in the topography of the underlying substrate (or both)

175
A (SW}
BDT-22
120 180
DEPTH 36O
( cm) 4201J
480- 540, 600 660 720 780 S40
BDT-20 BDT-12 BDT-1
pso~
, , , , , , ,
10 20 3O
~ 7%
10 2O 3O
93~
, , , , i , i
10 20 30
°,'b ASH (DRY WT.)
, , , , , , ,
10 20 30
A' (NE)
MTS OCEAN
DEPTH (cm)
B (NW)
BDT-5
0 6O
120 180 240 300 360 • 420 480 540 6OO
660 72O 780 840
BDT-20
S' (SE)
BDT-3 BDT-14
?
>
10 2O 3O 10 2O 3O
% ASH (DRY WT.)
, , , , , , , ,
10 20 3O 10 20 3O
RIO CHANGUINOLA BAHIA ALMIRANTE 4
Fig. 14. Sectional profiles A-A' and B-B' showing ash content of cores with depth, Changuinola, Panama.
might explain this offset. Furthermore, the sources of the inorganic materials that produced these peaks are still unknown. If, for example, the source is windblown inorganics (e.g., volcanic ash), then this material could have been deposited at all elevations on a domed (i.e., curved) surface at the same time. On the other hand, note that ash percentage increases slightly in both peaks from core BDT-22 to core BDT-20. This would indicate that these inorganics might have come from the northeast (ocean side), suggesting (but not prov- ing) a marine origin for these inorganics. It is also possible that a tributary of

1 7 6
the Rio Changuinola once existed to the north of core BDT-12. This river would have flowed roughly parallel to the beach-barrier shoreline feature that now bounds the swamp on its north side. In addition to being a source of in- organics, any existing streams would have been natural conduits allowing brackish water to penetrate this area as the sea level rose. Nearness to one of these streams could also explain the marine (mangrove) high-ash, high-sulfur peat that occurs at the base of core BDT-3, because this peat does not exist a short distance away (at BDT-24).
Figure 15 shows ash content plotted against peat type for the Changuinola peat deposit. As might be expected, the mangrove peat has the highest ash content because it probably formed at the edges of a brackish stream channel or next to the bay. Of the freshwater types, the swamp-forest (woody) peat type has the highest ash content because the vegetation that produces it tends to be more competitive in mineral-rich environments.
The very low total ash content of the peat in the central portions of this deposit (e.g., BDT-20 ) is especially significant with regard to the origin of low- ash coals. Note that, although the petrographic analyses indicate the presence of peat types that should contain significant amounts of authigenic silica (e.g.,
ASH CONTENT v. PEAT TYPE CHANGUINOLA, PANAMA
12.
9
ASH CONTENT
(% DRY WT.) 6
(1-25)
SWAMP- FOREST (WOODY)
(1-13)
SEOGE- GRASS-
FERN
(1-17)
SAGITTARIA ET AL
(10-12)
12-12)
,': - - ' 2 . ' :
, , i L , - !
.-,.:) :.,
NYMPHAEA RHIZOPHORA ET AL (MANGROVE)
NO. OF SAMPLES (35) (43) (37) (20) (3)
Fig. 15. Averages and ranges of ash content for each peat type, Changuinola, Panama.

177
grass-sedge phytoliths and sponge spicules), only a rare, degraded and pitted siliceous fragment was encountered. This evidence would seem to suggest that this mineral matter was leached from these low-ash zones, because the living plants that produced these peats are the same types as those that we had ashed previously from other areas and were found to contain more than 10% ash. For a more detailed description of the potential for leaching of mineral matter from peats to produce a low-ash coal, see Kosters and Bailey {1986) and Cohen et al. (1987a).
Fixed carbon and volatile matter contents As expected, fixed carbon and volatile matter contents generally exhibited
an inverse relationship. Therefore, diagrams of fixed carbon content were suf- ficient to depict the distribution of both parameters. Also, because of low ash content, fixed carbon determined on a dry, ash-free basis (daf) was very sim- ilar to that determined on a dry but not ash-free basis. Thus, a diagram showing fixed carbon on either basis was sufficient to depict either case.
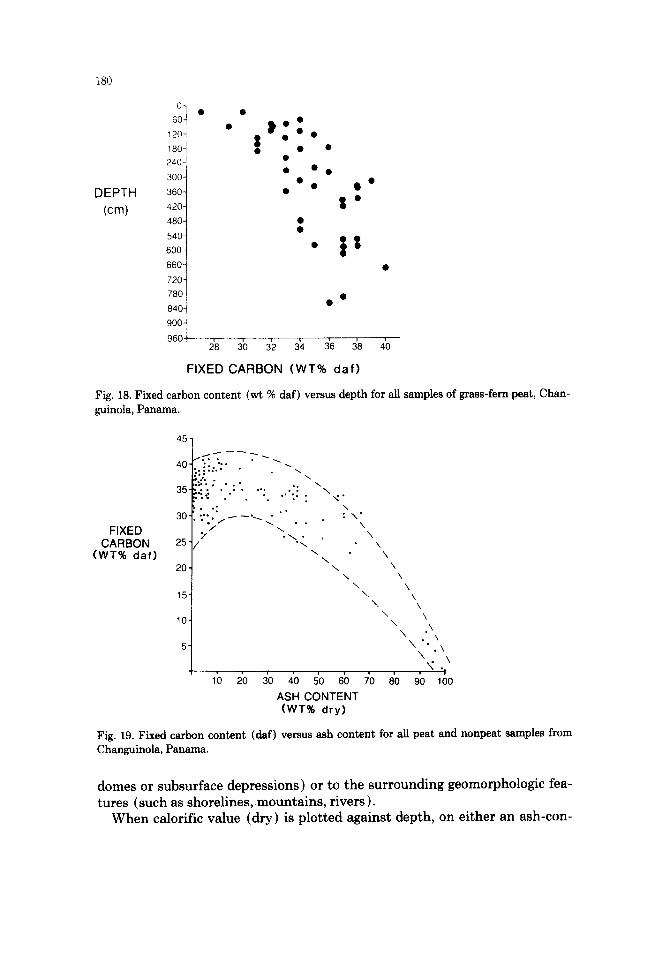
Figure 16 shows fixed carbon (daf) with depth along transects A-A' and B- B'. With the exception of minor fluctuations, fixed carbon generally increases with depth. These minor fluctuations could be caused by analytical error or by the variability of peat types with depth (i.e., inherent differences in chemical composition and environments of deposition). When fixed carbon (daf) is plotted against peat type (Fig. 17), large differences in fixed carbon can be observed. However, in this figure, each bar represents samples from many dif- ferent depths, making it difficult to separate the effects of depth from inherent differences in peat composition. Figure 18, for example, shows fixed carbon (daf) for all samples of a single peat type plotted against depth regardless of core location. Note the tendency toward increasing fixed carbon with depth. However, geographic location of the core from which the samples were taken also seems to affect fixed carbon content. Referring to Figure 16, one can ob- serve that the average fixed carbon content of all peat samples within any core tended to decrease from southwest to northeast along transect A-A' and to increase from northwest to southeast along transect B-B'.
When fixed carbon (daf) is plotted against ash content for a suite of carbon- containing samples {peat as well as nonpeat) from the Changuinola deposit (Fig. 19 ), fixed carbon initially increases with increasing ash content, possibly as a result of either loss of volatile organics by decomposition or changes in plant communities (or both). However, when the ash content goes above about 20%, this tendency reverses (i.e., fixed carbon tends to decrease as ash content increases). This pattern suggests several hypotheses: (1) the composition of the source organics might be changing toward more volatile-rich ingredients (such as algae or pollen grains) as the ash content increases; (2) the increasing inorganics may be trapping the volatile matter; or (3) the inorganics may be releasing volatiles that effect the accuracy of the analytical procedure.

178
DEPTH (cm)
A (SW)
BDT-22 BOT-20 0
120
1 8 0
2 4 0
36O
4 2 0
5 4 0
6 0 0
66O " ~
720 K 78o ~ 840 . . . . . . .
25 29 33 37
BDT-12
< 2"
, , , , , , ,
25 29 33 37
BDT-1
- - - - f_ . . . . . .
B a s a l S a n d
, . . . . , , , i , , i , • ,
25 29 33 37 25 29 33 37
A' (NE)
Avg. = 353 Avg. = 35.4 Avg. = 33.0 Avg. = 32.7
MTS OCEAN
B (NW)
BDT-5 BDT-20 BDT-14 BDT-3
1 2 0
DEPTH 300360 ~ % ~ " ' - - - - - - - - - - - - - - - -
( c m ) 420
8 4 0 I . . . . . . . . . ~ , I . . . . , . . . . . . . . . 25 29 33 37 25 29 33 37 25 29 33 37 25 29 33 37
Avg. = 28 Avg. = 35 Avg. = 35 Avg. = 37
BAHIA ALMIRANTE RIO CHANGUINOLA
g'
(SE)
~41 40
Fig. 16. Sectional profiles A-A' and B-B' showing fixed carbon (daf) with depth, Changuinola, Panama.
Calorific value
The average calorific value for 62 samples of peat from the Changuinola deposit was 10,000 Btu/ lb (dry) with a range of 8,824-11,310. Calculated on an ash-free basis, these values exhibited an average of 10,375 and a range of 9,456-11,541 Btu. Figure 20 shows Btu/ lb (dry), for sectional profiles A-A' and B-B'. For these profiles, no significant differences in vertical or lateral

FIXED CARBON
(WT% daf)
39.
3 8
37.
36
35"
3 4
33.
32.
31
30
(28-41 )
(31-38)
J ~ (27-40) . "
, '~,-. ' ,.,-~ : , . , ~,;,; < ~ .,~ . . . . . . .
S W A M P - S E D G E - S A G I T T A R I A F O R E S T G R A S S - E T A L
( W O O D Y ) F E R N
(32-39)
, , , ; , . , , , : o, . . . . .
,o : . ° - • • : . , '.o. -.,
":. . : . : . . o ° : .
. ° .
, ° . , °
: ° . = .
, • ° ° . . . . , . , l : o
° • • • ° •
_ o . o : o , : o
• _ o o .
. ° • , -
• • ° • , ; . * * * ;
. . . . ,
N Y M P H A E A ET A L
(39-41 )
>~'j'-,
, - J , / . _
/ / , i 7 "
- 5 - - . ,
L ,21 ~/I
" " - I , , I
R H I Z O P H O R A
( M A N G R O V E )
179
NO. OF SAMPLES (35) (43) (37) (20) (3)
Fig. 17. Averages and ranges of fixed carbon (daf) for each peat type, Changuinola, Panama.
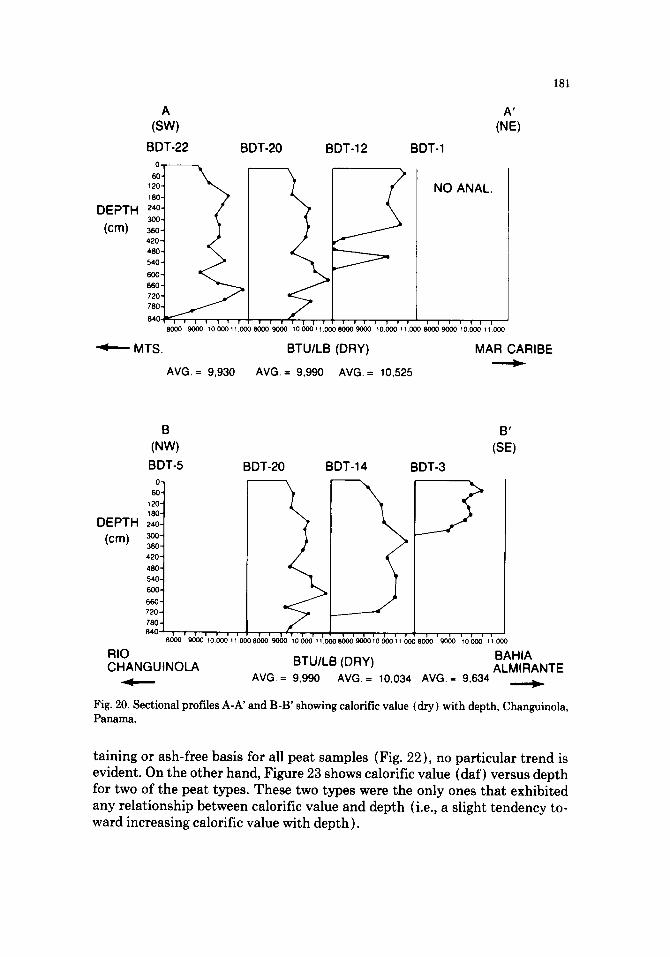
trends were revealed by plotting calorific value on either a dry basis or a dry, ash-free basis so that Figure 20 is sufficient to represent either case.
Note that in the thicker central portion of the Changuinola deposit (BDT- 22, -20, and -14), the calorific value: (1) tends to be slightly lower at the top of the core; (2) increases gradually with depth (but with numerous fluctua- tions ); and (3) decreases abruptly at the base of the cores, where the ash con- tent goes up. On the other hand, cores BDT-12 and -3, which are closer to the deposit edge and thus thinner, look similar to the lower portions of cores BDT- 22, -20, and -14, (i.e., they have relatively high calorific values throughout their length, and they tend to decrease abruptly at the base or where ash content increases). As previously noted, these trends cannot be accounted for entirely by increasing or decreasing mineral matter content, even though a general trend toward decreasing calorific value with increasing ash exists for all the samples {Fig. 21 ). It is more likely that these trends reflect variations in peat types (i.e., chemical differences in original plant source ingredients) as well as differences in ash content. These differences may also be affected by the geo- graphic positions of the core sites relative to the geometry of the deposit (e.g.,
180
DEPTH (cm)
120~
1804 240.
300-
360"
420"
480"
540
600-
6604
720" 7 8 0 -
i 840:
900 j
96O
$ ~ 0 O O
S °
• i s
FIXED CARBON (WT% daf)
Fig. 18. Fixed carbon content (wt % daf) versus depth for all samples of grass-fern peat, Chan- guinola, Panama.
FIXED CARBON
(WT% daf)
45-
40-
35-
30"
25"
20
15
10
5'
/%" ;,, "~-
° . , :.-.~ . . . . . : . . ' : ! . \ \
• .." . . \ * \
* * ' . = f ~ ~ . • •
V ° - ~ . \ "~.
\ \
\
\ \
\ \
\ \
x \ \ \ \ \
\ ,\ \ \
", \ "X
\
8'0 9"0 100 I'02'03'04'05'06'07'0
ASH CONTENT ( W T % d r y )
Fig. 19. Fixed carbon content (daf) versus ash content for all peat and nonpeat samples from Changuinola, Panama.
domes or subsurface depressions) or to the surrounding geomorphologic fea- tures (such as shorelines, mountains, rivers).
When calorific value (dry) is plotted against depth, on either an ash-con-
0 -
60-
120-
180-
DEPTH 24o- : 3 0 0 -
(cm) ~0- 420 -
4 8 0 -
540 -
6 0 0 -
6 6 0 -
720 -
780-
840
A (SW)
BDT-22
i i i i i ! t
BDT-20
i i !
BDT-12
! ! ; i ! i ,
BDT-1
NO ANAL.
i I ; , i i , }000 9000 10000110008000 9000 100001100080009000 100(X~ 11000 80009000 10000 11000
A t
(NE)
MTS. BTU/LB (DRY) MAR CARIBE
AVG. = 9,930 AVG. = 9,990 AVG. = 10,525
181
B B' (NW) (SE)
BDT-5 BDT-20 BDT-14 BDT-3 o .
6 0 o
120-
18o-
DEPTH 24o- (cm) 3oo-
3 6 0 "
420 ~
480"
540.
800.
720 o
780.
840 8~'~o'1o~oo',,'ooogoo' 11' 8o~ ' ~o 'Io~' :lOOO
RIO BAHIA CHANGUINOLA BTU/LB (DRY) ALMIRANTE
AVG. = 9,990 AVG. = 10,034 AVG. = 9,634 ,~
Fig. 20. Sectional profiles A-A' and B-B' showing calorific value (dry) with depth, Changuinola, Panama.
taining or ash-free basis for all peat samples (Fig. 22), no particular t rend is evident. On the other hand, Figure 23 shows calorific value (daf) versus depth for two of the peat types. These two types were the only ones that exhibited any relationship between calorific value and depth (i.e., a slight tendency to- ward increasing calorific value with depth) .

182
BTU/LB (DRY)
~1 500~ o
oooi t.
10000. • •
9500. ~De°O• oo
9000~ • • • eDo
8500~
8000! l
7500 I • 6 I0 14 18 22 26 30
ASH CONTENT (W T % d r y)
BTU/LB (DRY, ASH-FREE)
11500-
1100~
10,500-
10,000-
~e:dL 5~ ° Oi I •
iloo ° °o • | • O o
9500- % 8
9ooo-~
85004
80001
7500 f
ASH CONTENT (W T % d r y) Fig. 21. Average calorific value versus ash content for Changuinola peat samples.
Calorific value (dry) plotted against fixed carbon (dry) (Fig. 24A) illus- trates no particular relationship between these two parameters, even if plotted for individual peat types. Even on an ash-free basis for both parameters (Fig. 24B ), no obvious trends are evident. Figures 25A and 25B show calorific value (daf) versus fixed carbon (daf) for individual peat types. The unusual circum- stance is that (except for a few data points) swamp-forest peats show a slight trend toward increasing Btu with decreasing fixed carbon, whereas all other peat types tend toward increasing Btu with increasing fixed carbon content.

DEPTH
(cm)
0-
0
7~.
~ 0
• • 0
o
0 * • O
¢ , 0 •
I t * , 0
• 0
O
1o.~x~o ~o.~ .,5oo STUILB. (DRY)
• SWAMP-FOREST PEAT o SEDGE-GRASS-FERN PEAT • SAGITTARIA ET AL PEAT
* NYMPHAEA ET AL PEAT
11.'soo
183
o
lOO
DEPTH "~ 4oo,
(cm) 500,
600
7oo
800.
9oo
• o
0 • o ° ~
• ,o• 0
• 0
, ~
D . D • 0
D
00
s~oo ~ o ~oo , o.'soo 115oo 1 1 ~
BTU/LB. (DRY, ASH-FREE)
Fig. 22. Average calorific value versus depth for Changuinola peat samples.
Sulfur content
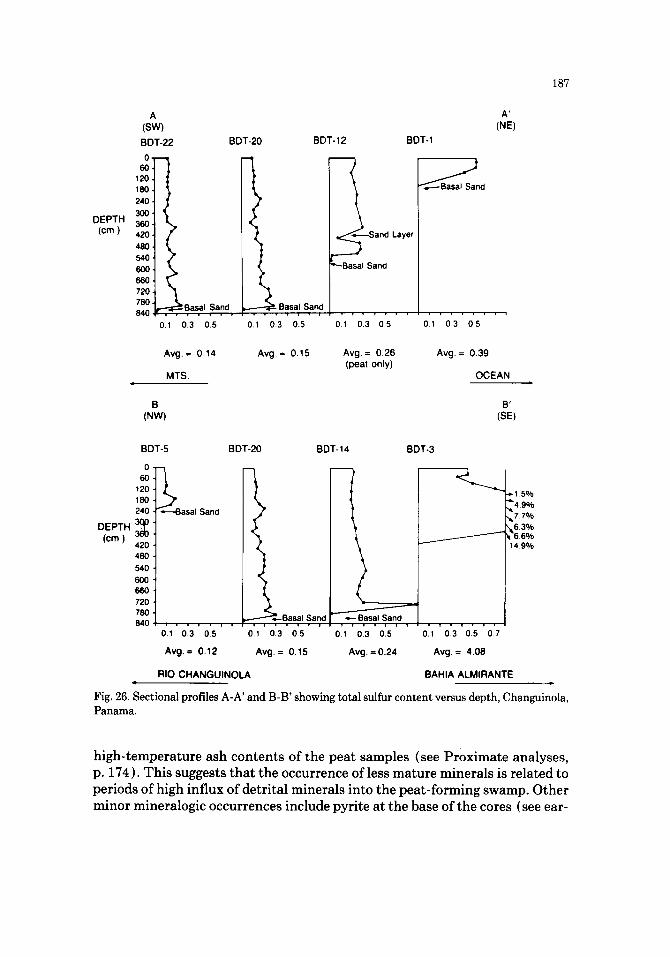
Figure 26 shows total sulfur contents of the Changuinola peats along sec- tional profiles A-A' and B-B'. Total sulfur contents in the central, thicker por- tions of the deposit (BDT-22 and -20) are very low, averaging about 0.15%

184
DEPTH (cm)
CJ !
!0C,-
200-
300-
400-
500-
600~
700~
i 8004
900 j
&
&
A,
95(30 10.()00 10,500 11,000 11.500 BTU/LB. (DRY, ASH-FREE)
• SAGITTARIA ET AL PEAT
* NYMPHAEA ET AL PEAT
Fig. 23. Average calorific value (daf) versus depth for two of the Changuinola peat types.
(dry weight). Note that average sulfur contents tend to increase toward the Caribbean Sea (SW-NE) and toward Almirante Bay (NW-SE) , with the highest values being near the brackish bay rather than near the more saline sea. These relationships of sulfur to marine conditions are consistent with those observed in many other coastal peat deposits of the world, for example, in southern Florida (Cohen et al., 1984).
The dramatically higher total sulfur values encountered below about 180 cm in core BDT-3 reflect the presence of brackish and marine mangrove peats (see previous petrographic/botanical descriptions and Fig. 7 ). Mangrove peat has the highest average sulfur and ash content of any peat type (compare Figs. 27 and 15), with swamp-forest peat having the next highest (but significantly lower) average concentrations of both sulfur and ash.
Because freshwater peat can be secondarily enriched in sulfur by either over- lying marine peats or by intrusion of marine water from either above or below (Cohen, 1968; Altschuler et al., 1983; Cohen et al., 1984 ), the somewhat higher total sulfur contents of certain freshwater peat samples (e.g., BDT-14,750 cm ) may have resulted from one of these secondary enrichment phenomena. On the other hand, sulfur isotope and petrographic analyses for the basal, high- sulfur peat from one of the inland freshwater cores (Raymond et al., 1987) indicate the lack of any marine influence at that site.
Abundant pyrite was observed petrographically within the basal mangrove peat of core BDT-3 and within the freshwater, swamp-forest peat of core PB-

(A)
FIXED CARBON
W T . % DRY
37
36
30
29
28 27
26
25 85OO
0
0
0
~o
eJ:3 • o
o o ~ oa~m•
• 0 0 O
9~00 ,06o0 ,o~00 BTU/LB. ( D R Y )
C:m
0
11600 1,~oo
185
(B) ,4.1,
40.
39.
38-
37.
FIXED 35. CARBON 34-
WT.O/o DRY,ASH-FREE 3 3
32- 31-
30-
29-
28- 27-
26-
25 8500
O O ap
O
• O
OO O4c • O
• • ~ o • * o •
• :# ~ 0
O • r-1
i , i , ,
90 0 9500 10000 10500 11000 11500
BTU/LB. (DRY, ASH-FREE)
Fig. 24. Average calorific value versus fixed carbon content for Changuinola peats, Panama. ( • = swamp-forest, ~ sedge-grass-fern, • = Sagittaria et al., ~ = N y m p h a e a et al. ).
4 (on the Caribbean edge of the deposit). Abundant pyrite was also observed by scanning electron microscope in the basal samples of core BDT-23 and to a lesser extent at the base of core BDT-14. This suggests that most, if not all, of these peaks in total sulfur content probably are due to the presence of the mineral pyrite. The rest of the total sulfur (occurring in relatively low quan- tities throughout this deposit) is probably organic sulfur.
Mineralogic analysis of low-temperature ashes
Mineralogic results are very preliminary, given that we have analyzed only two cores (BDT-14 and -23) from the Changuinola deposit. However, a few

186
(A}
FIXED CARBON % DRY,
ASH-FREE
4 t 4O 39 38! 37~
S6~
ss~ 34 ~
33q
32~
30 ~
28~
28~ 274
26 '
8500
• SWAMP-FOREST PEAT
0 0
@0
90'00 9;00 , o ~ ~ o5oo' ,~ ~ ' 1 ~500
BTU/LB (DRY, ASH-FREE)
(B) 41 l •SEDGE-GRASS-FERN O
39 1 PEAT &SAGITTARIA ET AL O • O 37 PEAT (~ O O
35 O E~ •
FIXED "] • • CARBON 33 t I~ % DRY O O
ASH-FREE 31 ,~ O 4 o
27 []
25 8500 9()00 95100 10000 10,~'00 11000 11500
BTUILB. (DRY, ASH-FREE)
Fig. 25. Average calorific value versus fixed carbon content for Changuinola peats, Panama.
comments can be made concerning the relative abundance of inorganic phases in low-temperature ashes of the peat samples. First, amorphous material is one of the most abundant inorganic phases in the ashes analyzed to date, except in one sample from the base of core BDT-23 (depth 930-950 cm).
Quartz is present in all samples, being more abundant in the top 2 m of core BDT-23 and the bottom 0.5 m of core BDT-14. Kaolinite and smectite clays are present only in the upper 3 m of the two cores. Hornblende, albite, and chlorite, representing what would be the least weathered species of minerals present within the cores, can be very closely associated with increases in the
187
DEPTH (cm)
A (sw) BDT-22 BDT-20 BDT-12
:26(~] ~ and Layer
"ot ~.
~(~t ~: > ~-BasalSand
~2o t :2 0 .as= .Sand s... s.o . . . . . . .
O1 03 0.5 0,1 0.3 0.5 0.1 03 05
BDT-1
j J ~ a s a l Sand
o.1 0,3 05
A t
(NE)
Avg. = 0.14 Avg. = 0.15 Avg. = 0.26 Avg. = 0.39 (peat only)
MTS. OCEAN
B (NW)
B '
(SE)
DEPTH (cm)
BDT-5
o
120 180 240 Casal Sand
48O
540 6OO
720 7 8 0 84O
BDT-20
Basal Sand
0.1 0.3 0.5 0.1 0.3 0.5
Avg.= 0.12 Avg.= 0.15
RIO CHANGUINOLA
BDT-14 BDT-3
* - Basal Sand
0.1 O3 0.5
Avg. = 0 .24
, , • i , , ,
0.1 03 0.5 07
Avg. = 4.08
-,-1 5% ~ 4 . 9 % x,J.7%
~ 6.3% 6 . 6 %
14 .9%
BAHIA ALMIRANTE
Fig. 26. Sectional profiles A-A' and B-B' showing total sulfur content versus depth, Changuinola, Panama.
high-temperature ash contents of the peat samples (see Proximate analyses, p. 174). This suggests that the occurrence of less mature minerals is related to periods of high influx of detrital minerals into the peat-forming swamp. Other minor mineralogic occurrences include pyrite at the base of the cores (see ear-

188
AVERAGE TOTAL
SULFUR
( W T % d r y )
0 . 4 *
0.3-
0.2-
0.1
(0.2-1.7)
c
S W A M P
F O R E S T
{ W O O D Y !
( 3 5 )
(0.1-0.3)
:;'92;'~? ,,',~ ] ~,~..v..'.4:,,
S E D G E - G R A S S -
F E R N
( 4 2 )
(o. i -0.6)
| 4
• (0.1-0.3) : . : . - . -
,, 4 ,o -o ! :::..:::,
, , : oo ,i . . . . . . : : ' , :" - . : -
.~ ' , ::_::: . . . . .
• . . : , . o o . , i o - ° ° - o
. 1 :2. : : . ' . ,, i ':." ":.'i
! :: :-: i . I . . . . . .
SAGITTARIA N Y M P H A E A E T A L E T At_
( 6 . 3 - 7 . 7 )
7 . 0
t
, ( ! •
,2'2(';~
0 ,;, p-
'72:,'~ ,'..,.,%
RHIZOPHORA ( M A N G R O V E )
No. of S a m p l e s ( 3 9 ) ( 2 0 ) ( 3 )
Fig. 27. Averages and ranges of total sulfur contents for each peat type from Changuinola, Panama.
lier discussion of sulfur) and a very small amount of cristobalite within various horizons of core BDT-23.
Acidity (pH)
Measurement of the pH of the Changuinola peat samples is at a very prelim- inary stage. Analyses with depth of selected samples from two cores are shown in Table 1. In general, all peat samples were acidic, with a pH ranging from 1.8 to 4.8.
Core BDT-21 was taken in the central, thicker region of the peat deposit. Although petrographic/botanical and proximate analyses have not yet been done for this core, its megascopic appearance and location would indicate a stratigraphy and composition similar to cores BDT-20 and -22 {i.e., freshwater peat with low ash and low sulfur, from top to bottom). The sample taken in core BDT-21 at 830-840 cm represehts the contact of the peat and the inor- ganic substrate. Note that the pH is significantly higher in this sample than it is in the lower-ash peats above it.
Core BDT-3 was taken where the peat deposit is in contact with the brackish water of Almirante Bay. This core contains freshwater peat at the top (which

TABLE 1
pH Values (in water) for Cores BDT-21 and BDT-3
189
BDT-21
Depth (cm) Peat type pH
BDT-3
Depth (cm) Peat type pH
60- 90 Undetermined 3.5 0- 30 freshwater peat
270-300 Undetermined 3.9 150-180 freshwater peat
570-600 Undetermined 3.9 285-300 freshwater peat
830-840 Undetermined 4.8 freshwater peat
Swamp-forest 3.2
Transitional 2.9
Mangrove 1.8
has probably had some brackish water intrusion) and brackish to marine man- grove peat (with very high sulfur and ash) toward the base. The pH is lower throughout this core than in BDT-21 and is especially low in the basal man- grove peat, where most of the sulfur is in the form of the mineral pyrite. The low pH values may not represent conditions during peat formation but may be an artifact of later pyrite oxidation. This would perhaps be a phenomenon similar to that which produces "acid mine water" from pyrite-rich coal beds.
Hypothetical trends in reflectance of pre-vitrinite macerals
A study by Cohen et al. (1987b) on the reflectance of huminite macerals in a suite of surface samples of peat from 12 different depositional environments revealed that peats that formed under drier conditions generally contained higher reflecting huminite (pre-vitrinite) macerals than those formed in wet- ter settings. Thus, based on the distribution of peat types (lithotypes) in the Changuinola deposit, it would be expected that the hypothetical Changuinola coal bed would exhibit slightly increasing vitrinite reflectance toward all of its edges and toward its base and top. Vitrinite reflectance might also be expected to increase locally wherever better drainage (i.e., more oxidation ) had occurred (i.e., approaching freshwater stream channels, marine inlets, bays, or tidal channels).
Such trends in vitrinite reflectance due to changes in depositional setting and plant types would probably be masked in high-rank coals but should still be evident in lignites or subbituminous coals. This might, for example, explain the variations in vitrinite reflectance exhibited within individual seams and groups of closely spaced beds in the Cretaceous, shoreline-related, subbitumi- nous coals of the San Juan Basin of New Mexico (Cohen, 1987).

190
CONCLUSIONS
The following conclusions are drawn from this study: ( 1 ) The coal bed formed by the Changuinola deposit would be a rectangular-
shaped feature elongated approximately parallel to and behind a beach-barrier shoreline feature.
(2) Due to doming of the peat and to the presence of a marine-blocking, beach-barrier, shoreline feature, a thick, low-ash, low-sulfur coal bed can form, even between an active shoreline and a mountain range.
(3) Leaching of mineral matter due to doming and high rainfall is suggested by the amounts and types of inorganics found in the central portion of this deposit.
(4) The hypothetical Changuinola coal bed would generally be bright and finely banded in its thickest, central portion and coarsely banded at its edges. The thickest vitrain and durain bands would tend to occur in the thinnest parts of the seam and at its base.
(5) The hypothetical Changuinola coal bed would interfinger with the Changuinola River floodplain sediments at its northwestern end and be trun- cated by marine to brackish bay sediments at its southeastern end.
(6) Most all of this deposit is very low in sulfur [less than 0.2% (dry wt.) ]. However, in the rare cases where it is high, it is extraordinarily high [greater than 14% (dry wt.)]. In these cases almost all of the total sulfur is pyritic sulfur.
(7) Although the total sulfur content of this deposit tends to increase slightly toward the ocean, it has a greater tendency to increase toward the brackish- water bay ( i.e., toward the southeast and parallel to the trend of the shoreline ). These results are similar to those previously reported for the back-barrier Snuggedy Swamp of South Carolina (Cohen et al., 1983).
(8) Fixed-carbon content (dry, ash-free) generally increases (and volatile matter decreases) with depth in the Changuinola deposit. This is more evident if plotted for a single peat type.
(9) Hypothetical vitrinite reflectance within the hypothetical Changuinola coal bed would be expected to increase wherever coal lithotypes representing more oxygenated environments are present (e.g., toward the margins of the deposit, toward the bottom and top of the seam, and toward stream channels or tidal inlets).
ACKNOWLEDGEMENTS
This work was funded by a grant from the U.S. Agency for International Development, by a grant from the U.S. Department of Energy (Office of Basic Energy Sciences), by the National Science Foundation (EAR 82-01088), and

191
by the Country of Panama through the Instituto de Recursos Hidraulicos y Electrificacion. The paper was reviewed by R.M. Flores and Miao Fen.
REFERENCES
Altschuler, Z.S., Schnepfe, M.M., Silber, C.C. and Simon, F.O., 1983. Sulfur diagenesis in Ever- glades peat and origin of pyrite in coal. Science, 221 (4607): 221-227.
American Society for Testing and Materials (ASTM), 1987. Standard classification of peat sam- ples by laboratory testing (D4427-84). In: Annual Book of ASTM Standards, 4.08: 879-880.
Anderson, J.A.R., 1964. Structure and development of the peat swamps of Sarawak and Brunei. J. Trop. Geogr., 18: 7-16.
Anderson, J.A.R., 1973. An introduction to the ecology of the peat swamps of Sarawak and Brunei. Proc. Int. Peat Society Symposiums: Classification of Peat and Peatlands, pp. 44-51.
Bjork, S., 1984. Optimum utilization study of the Negril and Black River Morasses, Jamaica: Summary report prepared for Petroleum Corp. of Jamaica, 62 pp.
Cameron, C.C., Esterle, J.S. and Palmer, C.A., 1989. The geology, botany, and chemistry of se- lected peat-forming environments from temperate and tropical latitudes. In: P.C. Lyons and B. Alpern (Editors), Peat and Coal: Origin, Facies, and Depositional Models. Int. J. Coal Geol., 12: 105-156.
Cecil, C.B., Supardi and Neuzil, S.G., 1987. Domed peat deposits in Indonesia: a modern analog of coal formation. Geol. Soc. Am., Abstr., 19 (7): 615.
Cohen, A.D., 1968. The petrology of some peats of southern Florida. Ph.D. thesis, Penn. State University, University Park, 352 pp.
Cohen, A.D., 1982. Obtaining more precise descriptions of peats by use of oriented microtome sections. In: P. Jarrett (Editor), Testing of Peats and Organic Soils. Am. Soc. for Testing and Materials, STP-820, pp. 21-36.
Cohen, A.D., 1984. The Okefenokee Swamp: a low-sulphur end-member of a shoreline-related depositional model for coastal plain coals. In: R.A. Rahmani and R.M. Flores (Editors), Se- dimentology of Coals and Coal-bearing Strata. Int. Assoc. Sedimentol., Spec. Publ., 7: 231- 240.
Cohen, A.D., 1987. Preliminary trends in reflectance and maceral analysis of Menefee and Cre- vasse Canyon coals in the San Juan Basin. In: Quality Assessment of Strippable Coals in New Mexico. N. M. Res. a Dev. Inst., pp. 91-99.
Cohen, A.D., Bardin, S.W. and Raymond, R., Jr., 1983. Distribution of sulfur in Snuggedy Swamp peats. Geol. Soc. Am., Abstr., 15(6): 546.
Cohen, A.D., Raymond, R., Jr., Mora, S., Alverado, A. and Malavassi, L., 1985. Economic char- acterization of the peat deposits of Costa Rica, preliminary study. In: B. Wade (Editor), Trop- ical Peat Resources Prospects and Potential. Int. Peat Society, Helsinki, Finland, pp. 146-169.
Cohen, A.D., Spackman, W. and Dolsen, P., 1984. Occurrence and distribution of sulfur in peat- forming environments of southern Florida. Int. J. Coal Geol., 4: 73-96.
Cohen, A.D., Spackman, W. and Raymond, R., Jr., 1987a. Interpreting the characteristics of coal seams from chemical, physical, and petrographic studies of peat deposits. In: A.C. Scott (Ed- itor), Coal and Coal-Bearing Strata: Recent Advances. Geol. Soc. (London) Spec. Publ., 32" 107-125.
Cohen, A.D., Raymond, R., Jr., Archuleta, L.M. and Mann, D.A., 1987b. Preliminary study of the reflectance of huminitic macerals in recent surface peats. Organ. Geochem., 11 (5): 429-430.
Cohen, A.D., Raymond, R., Jr., Ramirez, A. Morales, Z. and Ponce, F., in press, a. The Changuin- ola Peat Deposit of Northwestern Panama, Vol. I: Resource Assessment. Los Alamos National Laboratory Report, Los Alamos, NM, 60 pp.
Cohen, A.D., Ramirez, 0., Raymond, R., Malavassi, L., Obando, L., in press, b. Peat Deposits of

192
Costa Rica: Resource Assessment. Los Alamos National Laboratory Report, I,os Alamos. NM, 50 pp.
Coleman, J.M., Gagliano, S.M. and Smith, W.G., 1970. Sedimentation in Malaysian high tide tropical delta. Soc. Econ. Paleontol. Mineral., Spec. Publ., 15: 185-197.
Corvinus, D. and Cohen, A.D., 1984. Petrographic characteristics of carbonaceous sediments from the Snuggedy Swamp of South Carolina. Neuvieme Congr. Stratigr. Geol. Carbonifere, C. R., 4: 171-182.
Englund, K.J., Windolph, J.F. Jr. and Thomas, R.E., 1986. Origin of thick, low-sulphur coal in the Lower Pennsylvanian Pocahontas Formation, Virginia and W. Virginia. In: P.C. Lyons and C.L. Rice (Editors), Paleoenvironmental and Tectonic Controls in Coal-Forming Basins of the United States. Geol. Soc. Am., Spec. Pap., 210: 49-61.
Esterle, J.S., 1987. Micropetrographic examination of tropical woody peat from Indonesia and Malaysia. Soc. Org. Petrol., Abstr. and Programs, pp. 47-49.
Hobday, D.K., 1974. Beach and barrier island facies in the Upper Carboniferous of northern Al- abama. Geol. Soc. Am., Spec. Pap., 148: 209-223.
Horne, J.C., Ferm, J.C., Caruccio, F.T. and Baganz, B.P., 1978. Depositional models in coal ex- ploration and mine planning. Bull., Am. Assoc. Pet. Geol., 62: 2379-2411.
Kosters, E.C. and Bailey, A., 1986. A reassessment of Louisiana peat resources based on leaching experiments. La. Geol. Surv., Tech. Rep. 2, 108 pp.
McCabe, P.J., 1987. Facies studies of coal and coal-bearing strata. In: A.C. Scott (Editor), Coal and Coal-Bearing Strata: Recent Advances. Geol. Soc. (London), Spec. Pub., 32: 51-66.
Raymond, R., Jr., Cohen, A.D. and Bish, D.L., 1987. Occurrence of local restricted, high sulfur peat in a recent, freshwater peat deposit of Panama. Geol. Soc. Am., Abstr., 19(7): 813-814.
Robinson, E., 1980. Peat as a fuel resource in Jamaica. Sixth Int. Peat Congress, Proc., pp. 88-91. Russell, S.J. and Rimmer, S.M., 1979. Analysis of mineral matter in coal gasification ash, and coal
liquifacation residues by scanning electron microscopy and X-ray diffraction. In: C. Karr (Ed- itor), Analytical Methods for Coal and Coal Products III. Academic Press, New York, NY, pp. 113-162.
Staub, J.R. and Cohen, A.D., 1978. Kaolinite enrichment beneath coals: modern analog, Snuggedy Swamp, South Carolina. J. Sediment. Petrol., 48: 203-210.
Staub, J.R. and Cohen, A.D., 1979. The Snuggedy Swamp of South Carolina: back-barrier estuar- ine coal-forming environment. J. Sediment. Petrol., 49: 133-144.